Embed Size (px)
Citation preview
Controlling High Blood Pressure:A Public Health ImperativeA Public Health Imperative
1212thth National Forum National ForumNovember 22, 2014November 22, 2014
Eduardo Sanchez, MD,MPH,FAAFP
Deputy Chief Medical Officer
American Heart Association
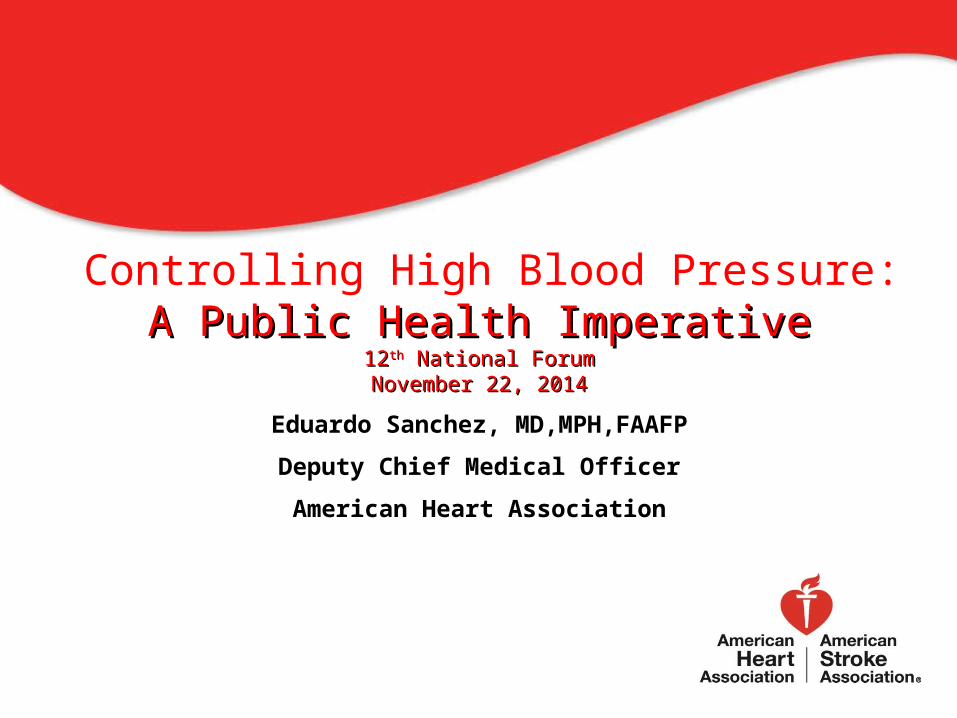
Top 10 risk factors for health loss in 2010 and the number of deaths attributable to each
1. Dietary risks 678,282 2. Smoking 465,651 3. High blood pressure 442,656 4. High body mass index 363,991 5. Physical inactivity 234,022 6. High blood sugar 213,669 7. High total cholesterol 158,431 8. Ambient air pollution 103,027 9. Alcohol use 88,587 10. Drug use 25,430
Institute for Health Metrics and Evaluation (IHME),2013
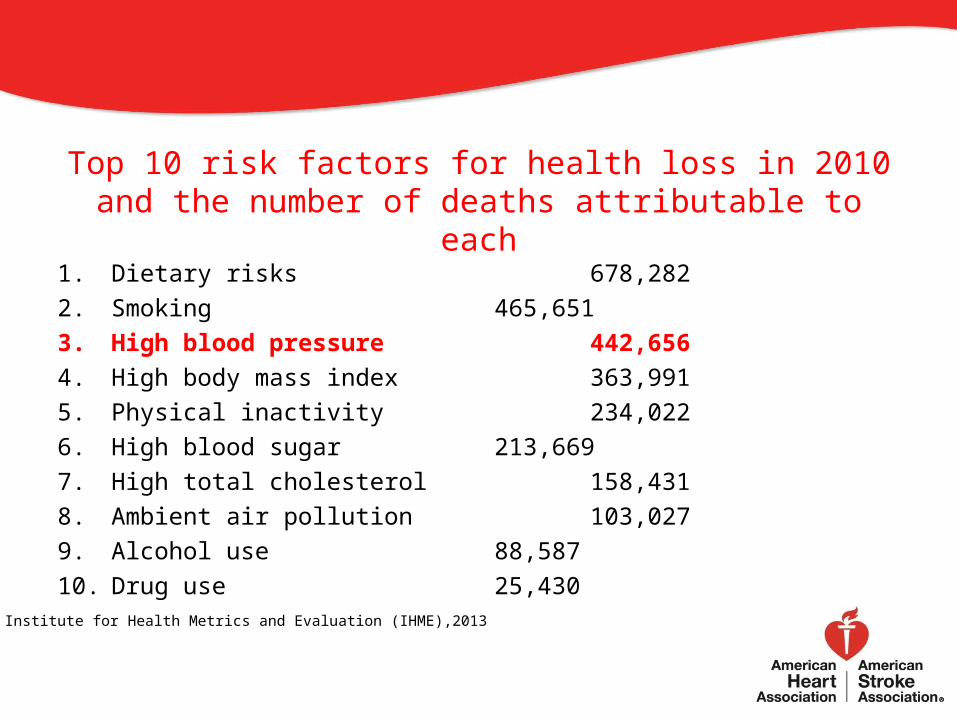
Controlling High Blood Pressure
• High blood pressure is a public health issue• Blood pressure greater than or equal to 140/90 should be evaluated in
a primary care setting. • Systems approaches may be the best way to improve blood pressure
control in the clinical setting.• Blood pressure control might be accelerated by linking clinical care and
community-integrated or home-based disease management including blood pressure monitoring.
• Public health should be engaged in addressing other population-based approaches to reduce blood pressure – sodium reduction in processed or restaurant foods; reducing the presence of food deserts, activity deserts, and primary care deserts.
NRC and IOM, January, 2013NRC and IOM, January, 2013
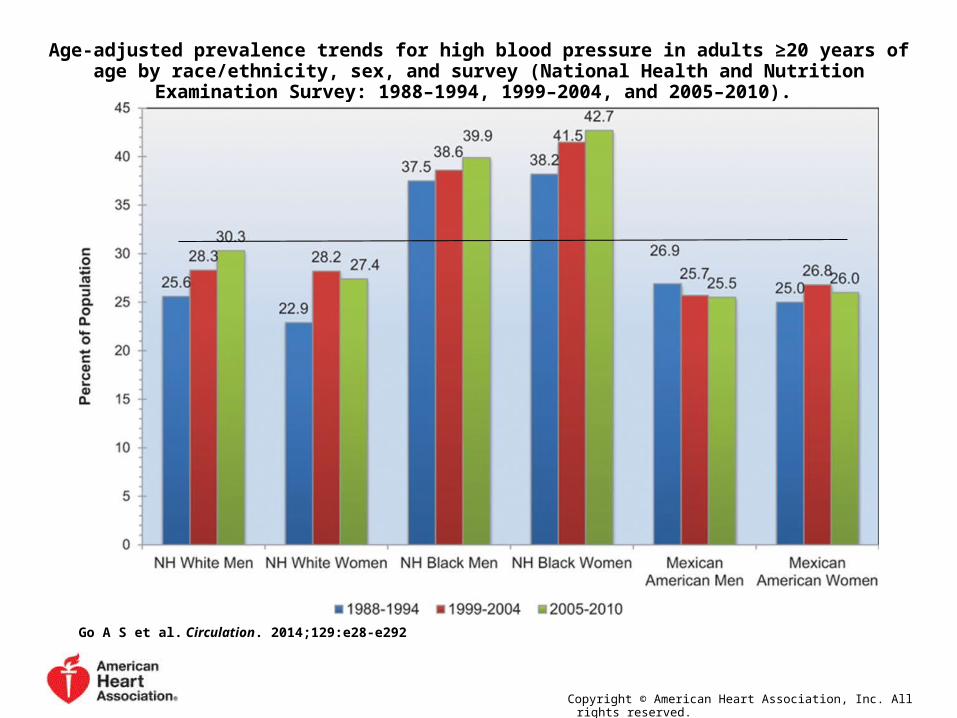
Age-adjusted prevalence trends for high blood pressure in adults ≥20 years of age by race/ethnicity, sex, and survey (National Health and Nutrition Examination Survey: 1988–1994, 1999–2004, and
2005–2010).
Go A S et al. Circulation. 2014;129:e28-e292
Copyright © American Heart Association, Inc. All rights reserved.
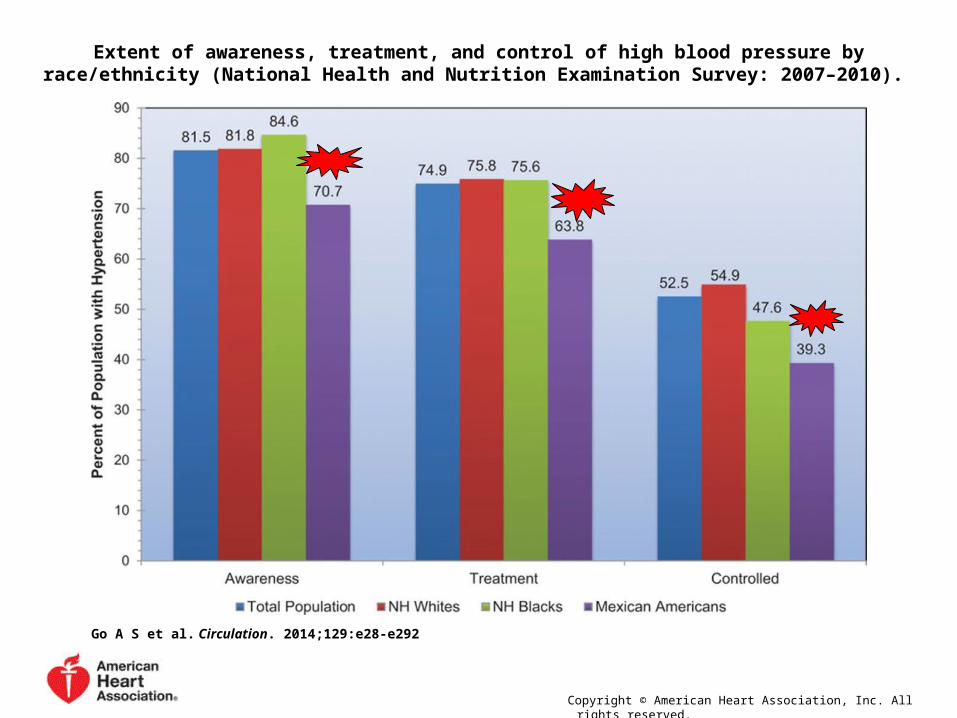
Extent of awareness, treatment, and control of high blood pressure by race/ethnicity (National Health and Nutrition Examination Survey: 2007–2010).
Go A S et al. Circulation. 2014;129:e28-e292
Copyright © American Heart Association, Inc. All rights reserved.
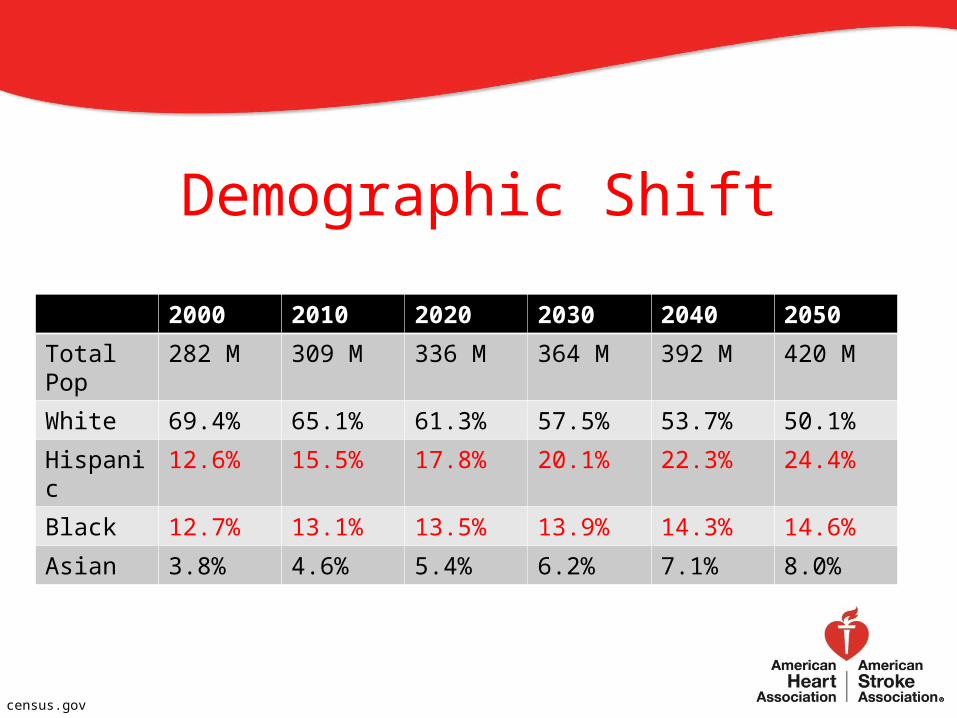
Demographic Shift
2000 2010 2020 2030 2040 2050
Total Pop 282 M 309 M 336 M 364 M 392 M 420 M
White 69.4% 65.1% 61.3% 57.5% 53.7% 50.1%
Hispanic 12.6% 15.5% 17.8% 20.1% 22.3% 24.4%
Black 12.7% 13.1% 13.5% 13.9% 14.3% 14.6%
Asian 3.8% 4.6% 5.4% 6.2% 7.1% 8.0%
census.gov
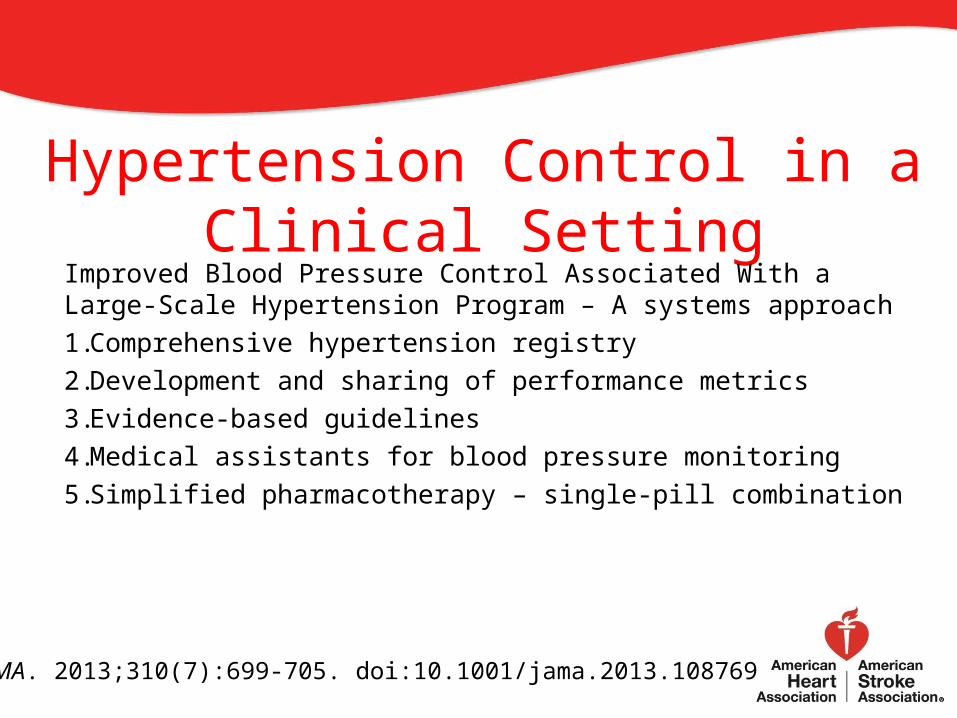
Hypertension Control in a Clinical Setting
Improved Blood Pressure Control Associated With a Large-Scale Hypertension Program – A systems approach1.Comprehensive hypertension registry2.Development and sharing of performance metrics3.Evidence-based guidelines4.Medical assistants for blood pressure monitoring5.Simplified pharmacotherapy – single-pill combination
JAMA. 2013;310(7):699-705. doi:10.1001/jama.2013.108769
Blood Pressure Control AdvisoryAn Effective Approach to High Blood Pressure Control: A Science
Advisory From the American Heart Association, the American College of Cardiology, and the Centers for Disease Control and Prevention
– Alan S. Go, MaryAnn Bauman, Sallyann M. Coleman King, Gregg C. Fonarow, Willie Lawrence, Kim A. Williams and Eduardo Sanchez
Hypertension. published online November 15, 2013;
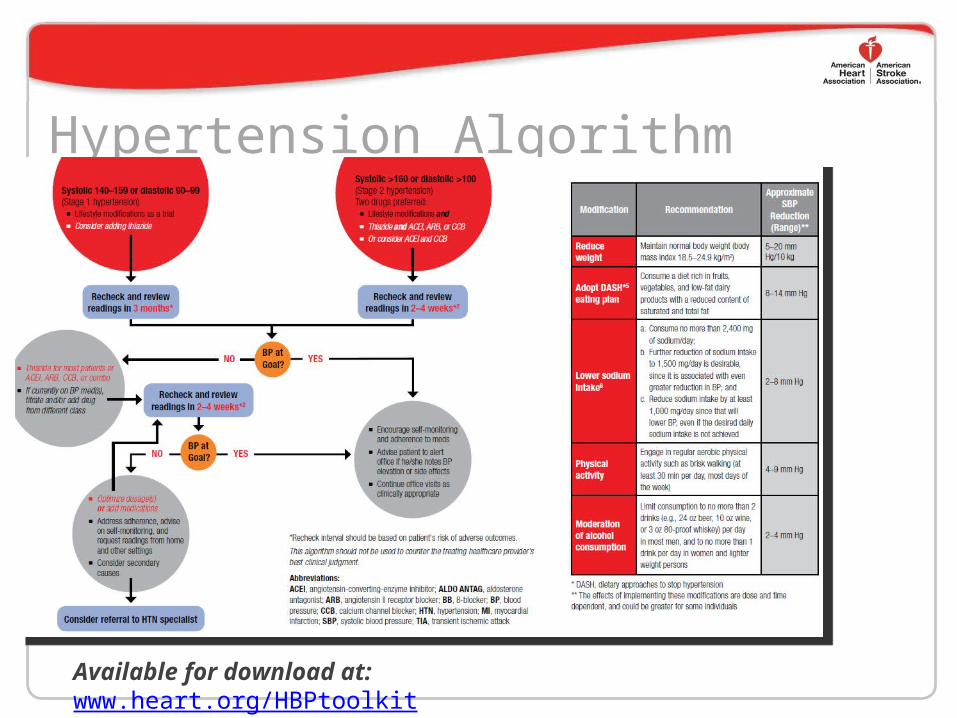
Hypertension Algorithm
Available for download at: www.heart.org/HBPtoolkit
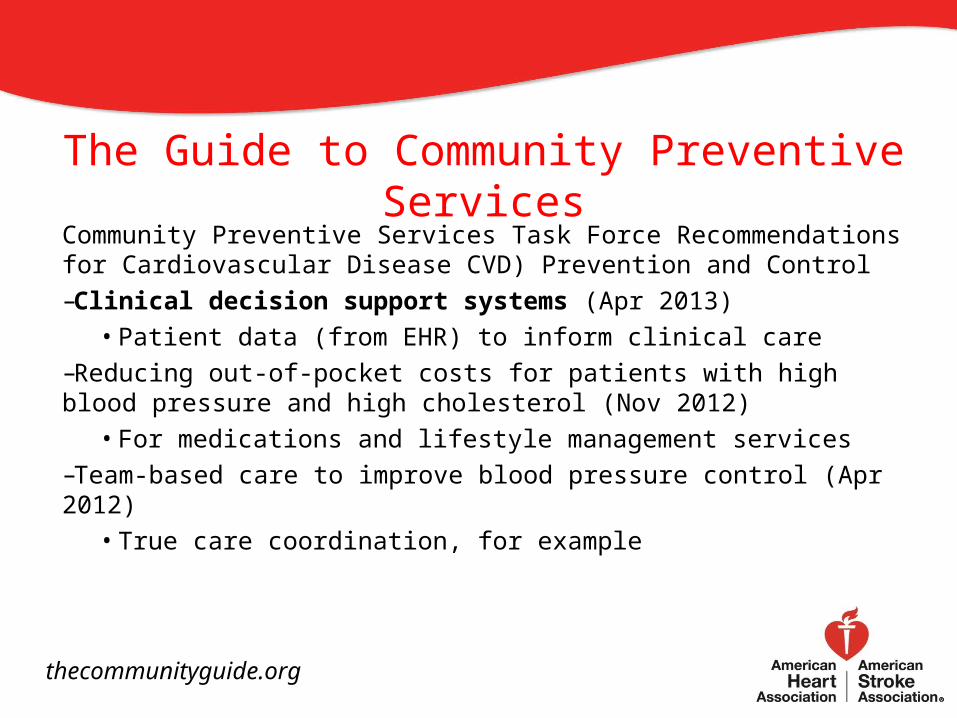
The Guide to Community Preventive Services
Community Preventive Services Task Force Recommendations for Cardiovascular Disease CVD) Prevention and Control –Clinical decision support systems (Apr 2013)
• Patient data (from EHR) to inform clinical care–Reducing out-of-pocket costs for patients with high blood pressure and high cholesterol (Nov 2012)
• For medications and lifestyle management services–Team-based care to improve blood pressure control (Apr 2012)
• True care coordination, for example
thecommunityguide.org
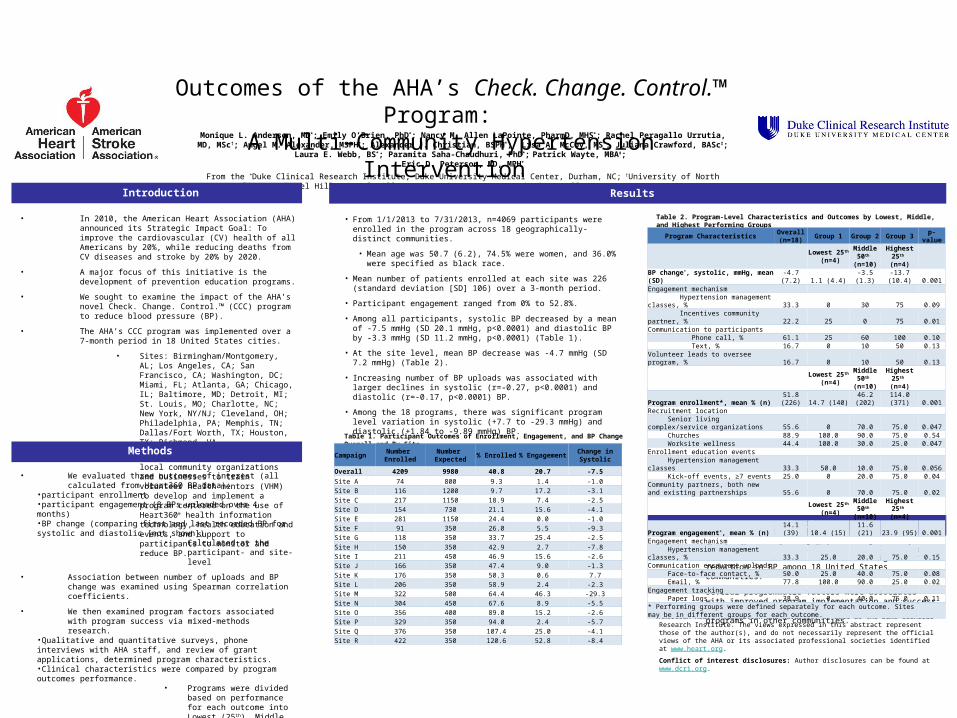
Outcomes of the AHA’s Check. Change. Control.™ Program:
A Multi-Community Hypertension Intervention Monique L. Anderson, MD*; Emily O’Brien, PhD*; Nancy M. Allen LaPointe, PharmD, MHS*; Rachel Peragallo Urrutia, MD, MSc†; Angel M. Alexander, MSPH*; Alexander J. Christian, BSPH*; Lisa A. McCoy, MS*; Juliana Crawford, BASc‡; Laura E.
Webb, BS*; Paramita Saha-Chaudhuri, PhD*; Patrick Wayte, MBA‡; Eric D. Peterson, MD, MPH*
From the *Duke Clinical Research Institute, Duke University Medical Center, Durham, NC; †University of North Carolina at Chapel Hill, Chapel Hill, NC; ‡American Heart Association, Dallas, TX
Results
• We evaluated three outcomes of interest (all calculated from Heart360 BP data):
•participant enrollment•participant engagement (8 BPs uploaded over 4 months)•BP change (comparing first and last recorded BP for systolic and diastolic [not shown])
• Calculated at the participant- and site-level
• Association between number of uploads and BP change was examined using Spearman correlation coefficients.
• We then examined program factors associated with program success via mixed-methods research.
•Qualitative and quantitative surveys, phone interviews with AHA staff, and review of grant applications, determined program characteristics.•Clinical characteristics were compared by program outcomes performance.
• Programs were divided based on performance for each outcome into Lowest (25th), Middle (50th), and Highest (25th) percentiles.
• In 2010, the American Heart Association (AHA) announced its Strategic Impact Goal: To improve the cardiovascular (CV) health of all Americans by 20%, while reducing deaths from CV diseases and stroke by 20% by 2020.
• A major focus of this initiative is the development of prevention education programs.
• We sought to examine the impact of the AHA’s novel Check. Change. Control.™ (CCC) program to reduce blood pressure (BP).
• The AHA’s CCC program was implemented over a 7-month period in 18 United States cities.
• Sites: Birmingham/Montgomery, AL; Los Angeles, CA; San Francisco, CA; Washington, DC; Miami, FL; Atlanta, GA; Chicago, IL; Baltimore, MD; Detroit, MI; St. Louis, MO; Charlotte, NC; New York, NY/NJ; Cleveland, OH; Philadelphia, PA; Memphis, TN; Dallas/Fort Worth, TX; Houston, TX; Richmond, VA
• Local AHA staff partnered with local community organizations and businesses to train volunteer health mentors (VHM) to develop and implement a program centered on the use of Heart360® health information technology, health education and events, and support to participants to monitor and reduce BP.
• From 1/1/2013 to 7/31/2013, n=4069 participants were enrolled in the program across 18 geographically-distinct communities.
• Mean age was 50.7 (6.2), 74.5% were women, and 36.0% were specified as black race.
• Mean number of patients enrolled at each site was 226 (standard deviation [SD] 106) over a 3-month period.
• Participant engagement ranged from 0% to 52.8%.
• Among all participants, systolic BP decreased by a mean of -7.5 mmHg (SD 20.1 mmHg, p<0.0001) and diastolic BP by -3.3 mmHg (SD 11.2 mmHg, p<0.0001) (Table 1).
• At the site level, mean BP decrease was -4.7 mmHg (SD 7.2 mmHg) (Table 2).
• Increasing number of BP uploads was associated with larger declines in systolic (r=-0.27, p<0.0001) and diastolic (r=-0.17, p<0.0001) BP.
• Among the 18 programs, there was significant program level variation in systolic (+7.7 to -29.3 mmHg) and diastolic (+1.84 to -9.89 mmHg) BP.
• Check. Change. Control.™ is a novel community-based initiative that demonstrated significant reduction in BP among 18 United States communities.
• Several programmatic factors were associated with improved program implementation and success that may guide future implementation of programs in other communities. Funding statement: This research was supported in part by the American Heart
Association and Novartis, as well as the Duke Clinical Research Institute. The views expressed in this abstract represent those of the author(s), and do not necessarily represent the official views of the AHA or its associated professional societies identified at www.heart.org.
Conflict of interest disclosures: Author disclosures can be found at www.dcri.org.
Table 1. Participant Outcomes of Enrollment, Engagement, and BP Change Overall and By Site
Table 2. Program-Level Characteristics and Outcomes by Lowest, Middle, and Highest Performing Groups
Methods
Introduction
Conclusions
Program CharacteristicsOverall (n=18)
Group 1 Group 2 Group 3p-
value
Lowest 25th (n=4)
Middle 50th
(n=10)
Highest 25th
(n=4)BP change*, systolic, mmHg, mean (SD) -4.7 (7.2) 1.1 (4.4) -3.5 (1.3)
-13.7 (10.4) 0.001
Engagement mechanism Hypertension management classes, % 33.3 0 30 75 0.09 Incentives community partner, % 22.2 25 0 75 0.01Communication to participants Phone call, % 61.1 25 60 100 0.10 Text, % 16.7 0 10 50 0.13Volunteer leads to oversee program, % 16.7 0 10 50 0.13
Lowest 25th (n=4)
Middle 50th
(n=10)
Highest 25th
(n=4)Program enrollment*, mean % (n)
51.8 (226) 14.7 (140)
46.2 (202)
114.0 (371) 0.001
Recruitment location Senior living complex/service organizations 55.6 0 70.0 75.0 0.047 Churches 88.9 100.0 90.0 75.0 0.54 Worksite wellness 44.4 100.0 30.0 25.0 0.047Enrollment education events Hypertension management classes 33.3 50.0 10.0 75.0 0.056 Kick-off events, ≥7 events 25.0 0 20.0 75.0 0.04Community partners, both new and existing partnerships 55.6 0 70.0 75.0 0.02
Lowest 25th (n=4)
Middle 50th
(n=10)
Highest 25th
(n=4)Program engagement*, mean % (n) 14.1 (39) 10.4 (15) 11.6 (21) 23.9 (95) 0.001Engagement mechanism Hypertension management classes, % 33.3 25.0 20.0 75.0 0.15Communication encourage uploads Face-to-face contact, % 50.0 25.0 40.0 75.0 0.08 Email, % 77.8 100.0 90.0 25.0 0.02Engagement tracking Paper logs 38.9 0 40.0 75.0 0.11* Performing groups were defined separately for each outcome. Sites may be in different groups for each outcome.
CampaignNumber Enrolled
Number Expected
% Enrolled%
EngagementChange in Systolic
Overall 4209 9980 40.8 20.7 -7.5
Site A 74 800 9.3 1.4 -1.0Site B 116 1200 9.7 17.2 -3.1Site C 217 1150 18.9 7.4 -2.5Site D 154 730 21.1 15.6 -4.1Site E 281 1150 24.4 0.0 -1.0Site F 91 350 26.0 5.5 -9.3Site G 118 350 33.7 25.4 -2.5Site H 150 350 42.9 2.7 -7.8Site I 211 450 46.9 15.6 -2.6Site J 166 350 47.4 9.0 -1.3Site K 176 350 50.3 0.6 7.7Site L 206 350 58.9 2.4 -2.3Site M 322 500 64.4 46.3 -29.3Site N 304 450 67.6 8.9 -5.5Site O 356 400 89.0 15.2 -2.6Site P 329 350 94.0 2.4 -5.7Site Q 376 350 107.4 25.0 -4.1Site R 422 350 120.6 52.8 -8.4
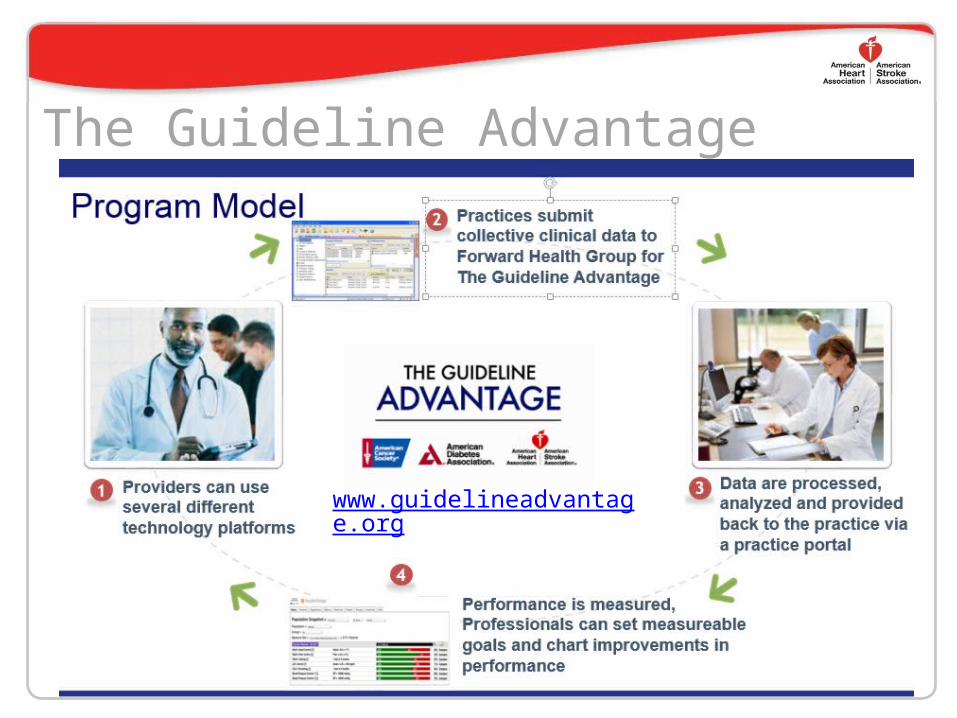
The Guideline Advantage• The Guideline Advantage interactive platform gives you a powerful new data advantage. Now, you can not only
meet• your reporting requirements but also• transition your practice into advanced• population health management—an• important new technology that offers you• exciting potential to improve your patients’• health. Couple this powerful solution with• the robust resources of the American• Cancer Society, American Diabetes• Association, and the American Heart• Association to support quality improvement• efforts, your new data advantage provides• everything your practice needs to move• forward— with The Guideline Advantage.
www.guidelineadvantage.org
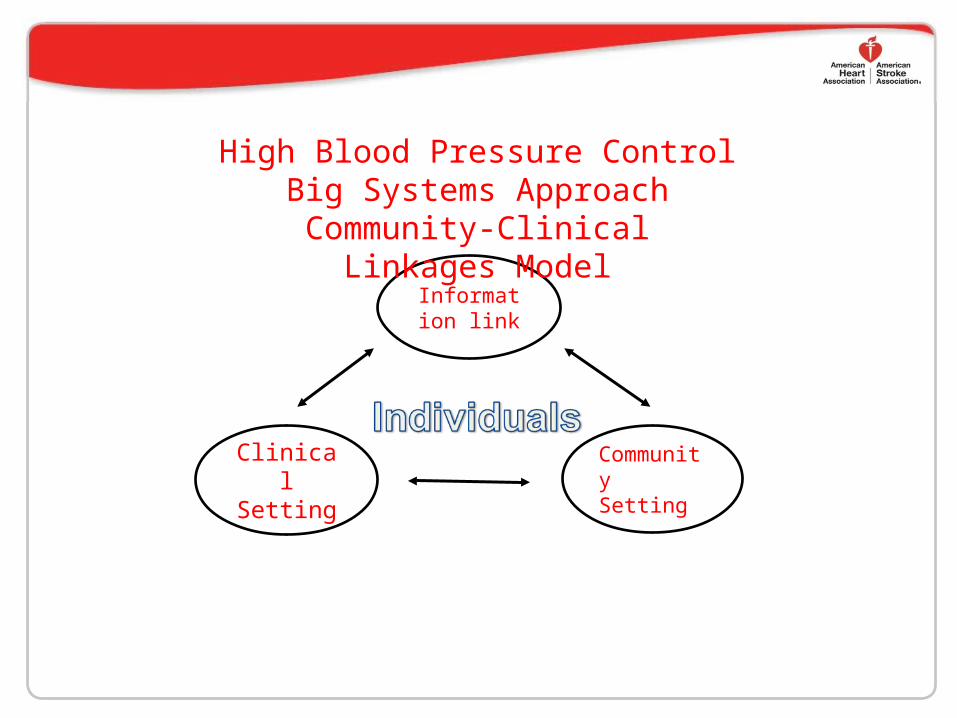
Information link
Clinical Setting
Community Setting
High Blood Pressure ControlBig Systems Approach
Community-Clinical Linkages Model