Embed Size (px)
Citation preview
Andrew Olley
National Agronomy Services Manager
Controlled Release Fertiliser in Horticulture
AusVeg May 2013
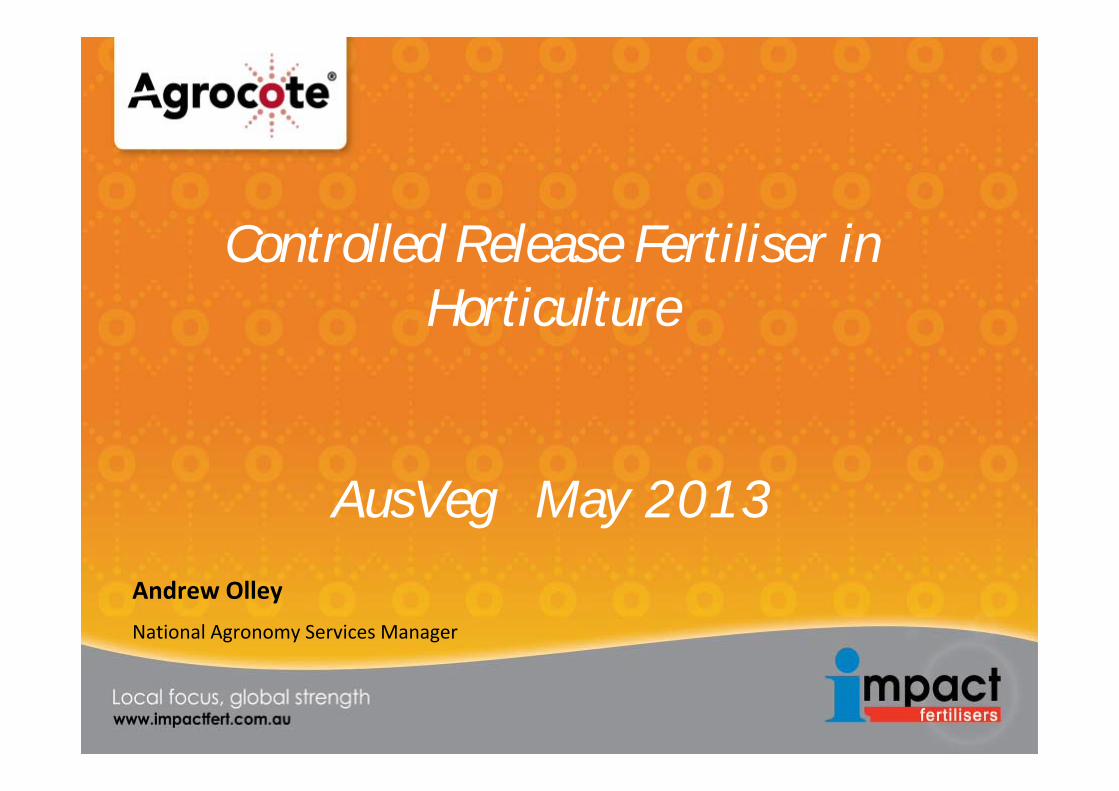
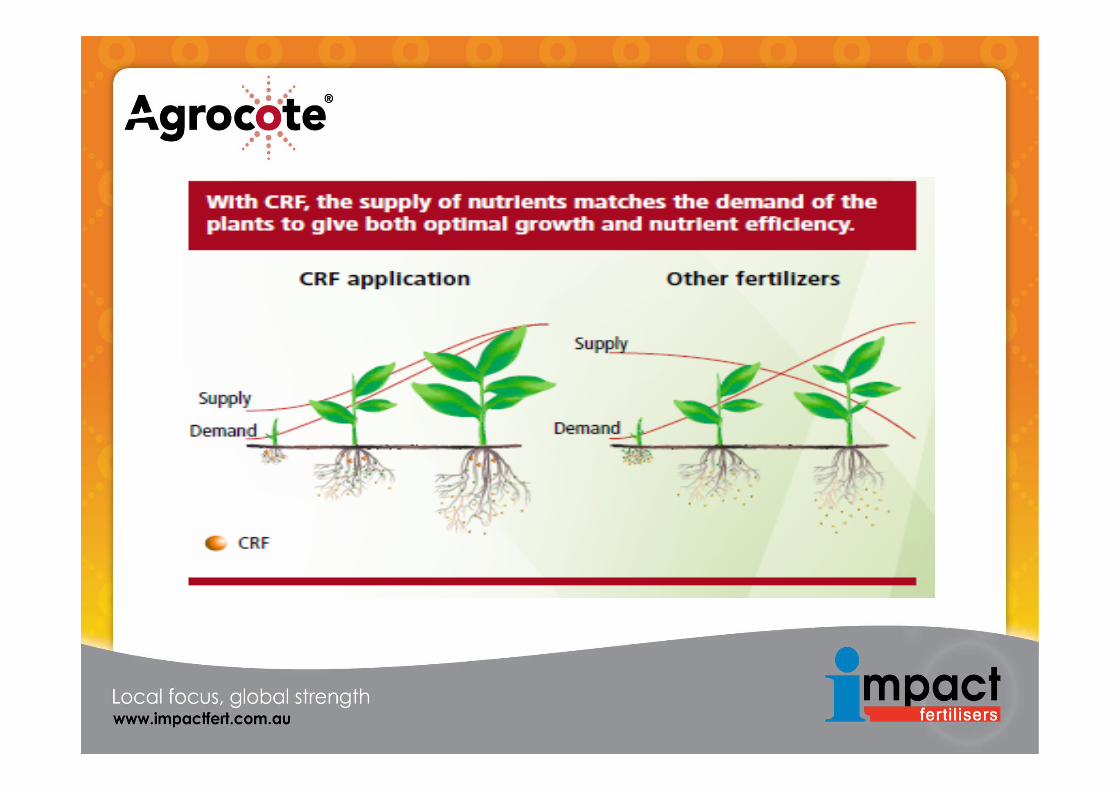
Nutrient delivery via fertilisers into Horticultural crops is often poorly converted through to crop yield and quality
A number of factors have influence over nutrient efficiency such as
-Loss Mechanisms after application
-Timing applications
-Labour and capital constraints for delivery
-Weather events
-Antagonism between competing nutrients
-Choice of nutrient form
Science and field experience of growers / advisors have developed fertiliser strategies to supply crops with their nutrient needs with improved efficiencies.
Such practices include:
-Spilt applications of granular products
-Nutrient delivered through irrigation “Fertigation”
-Foliar and liquid soil applications
-Nutrient formulation changes
-Monitoring nutrient status SAP, Leaf, Solute testing
These advances have greatly improved the supply of nutrient to crops.
However this is most often achieved by excess nutrient supply to try ensure the crop is not yield limited by nutrient.
In many instances 100 % or greater of key nutrients over the actual crop requirements are applied with the following effects
-Increased spend on fertiliser
-Capital intensive delivery systems
-Labour intensive management systems
-High cost nutrient formulations
Field crop production operation at tighter margins and high risk has not allowed the uptake of technologies in nutrient delivery used in higher value plant production systems.
Amenity Horticulture “Nursery & Turf Industries” with higher margins have been able to develop sophisticated nutrient products
-Slow Release chemistry
Protected Cropping industry reliance on high density production which comes at a higher capital costs developed exact nutrient delivery systems
- Hydroponic nutrient formulation

Slow Release fertiliser products offer the potential to field producers however limitations to commercial adoption have been:
-High manufacturing cost per kg nutrient supplied
-Freight costs to import from overseas
-Fixed N:P:K analysis not suited to local conditions
-Nutrient release rate dominated by soil temperature hence complex process to select right product and release rate through the year
-Low availability in the market from supply companies
Impact fertilisers were contacted by Everris BV in early 2012 to distribute a commercially available nutrient delivery technology that has been extensively used commercial agriculture.
Investigation of the technology on offer and its use in overseas fertiliser markets revealed a solution to increase fertiliser use efficiency for crop production in Australia was available.
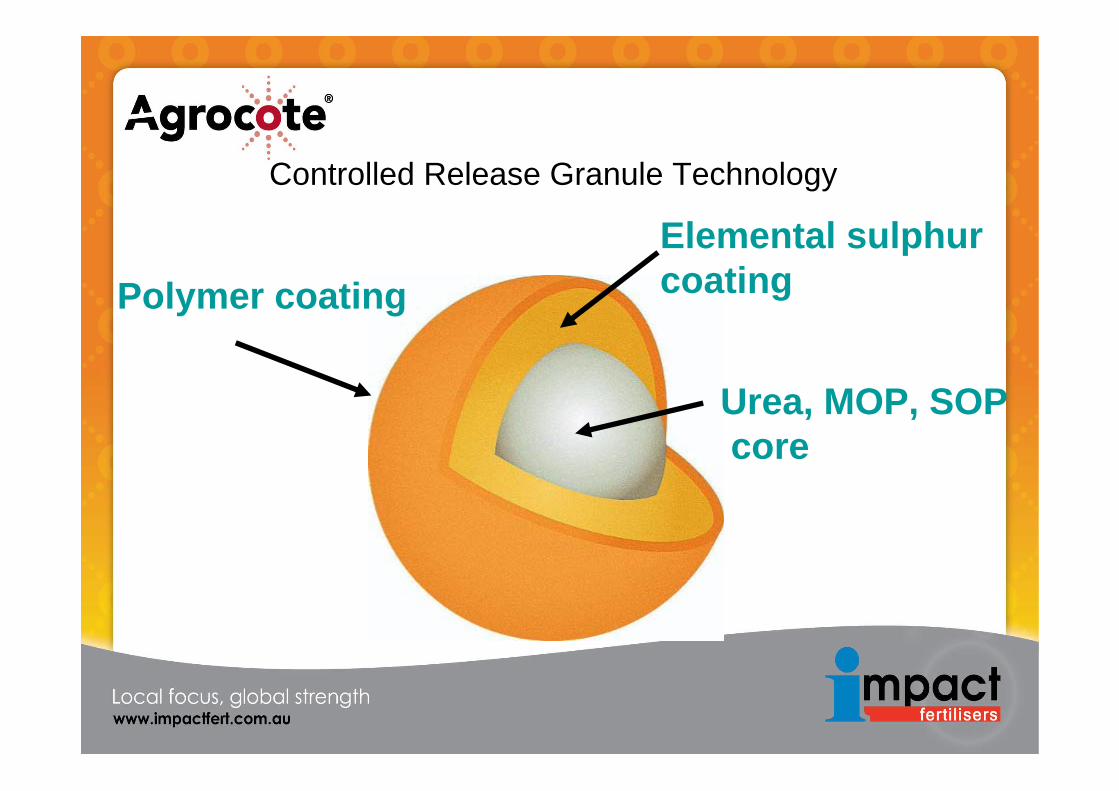
Polymer coatingElemental sulphur coating
Urea, MOP, SOPcore
Controlled Release Granule Technology
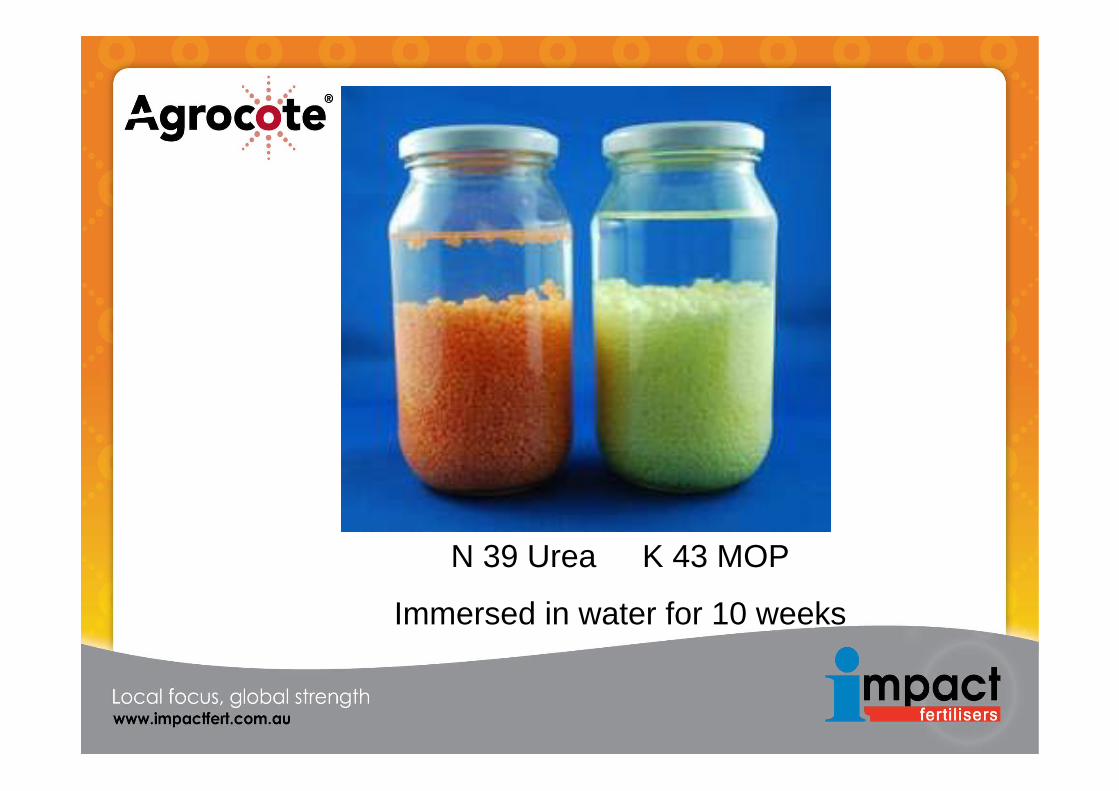
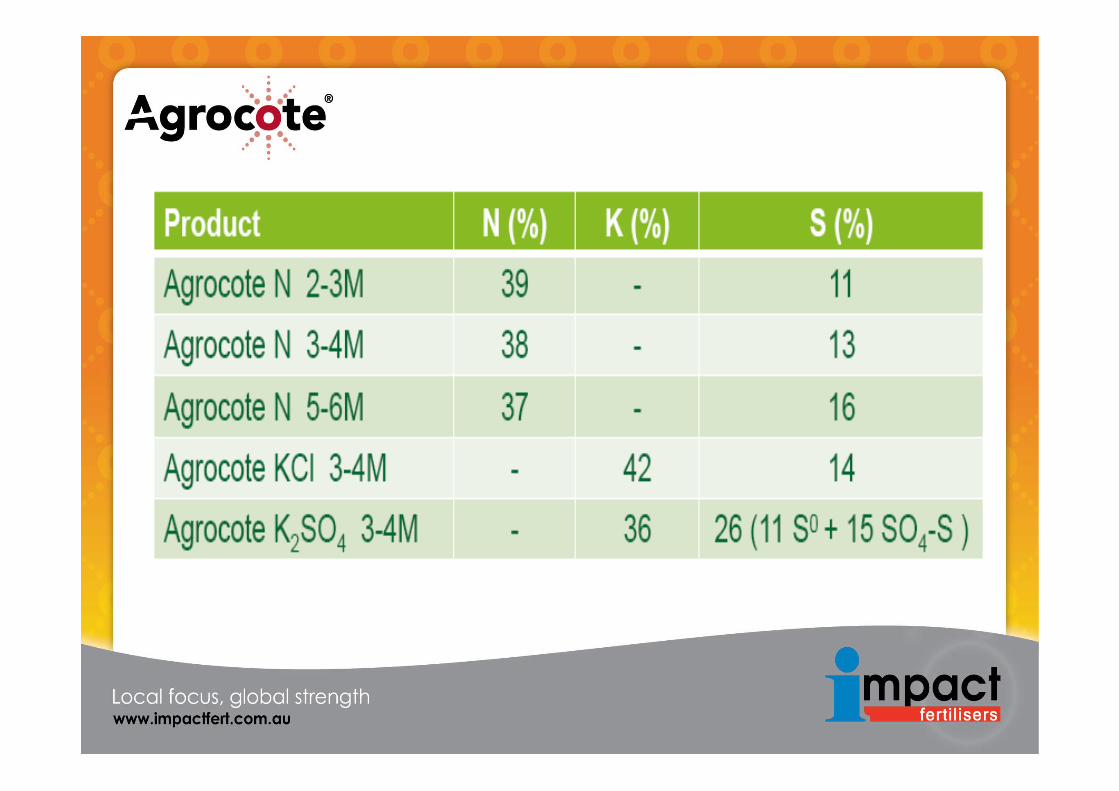
N 39 Urea K 43 MOP
Immersed in water for 10 weeks
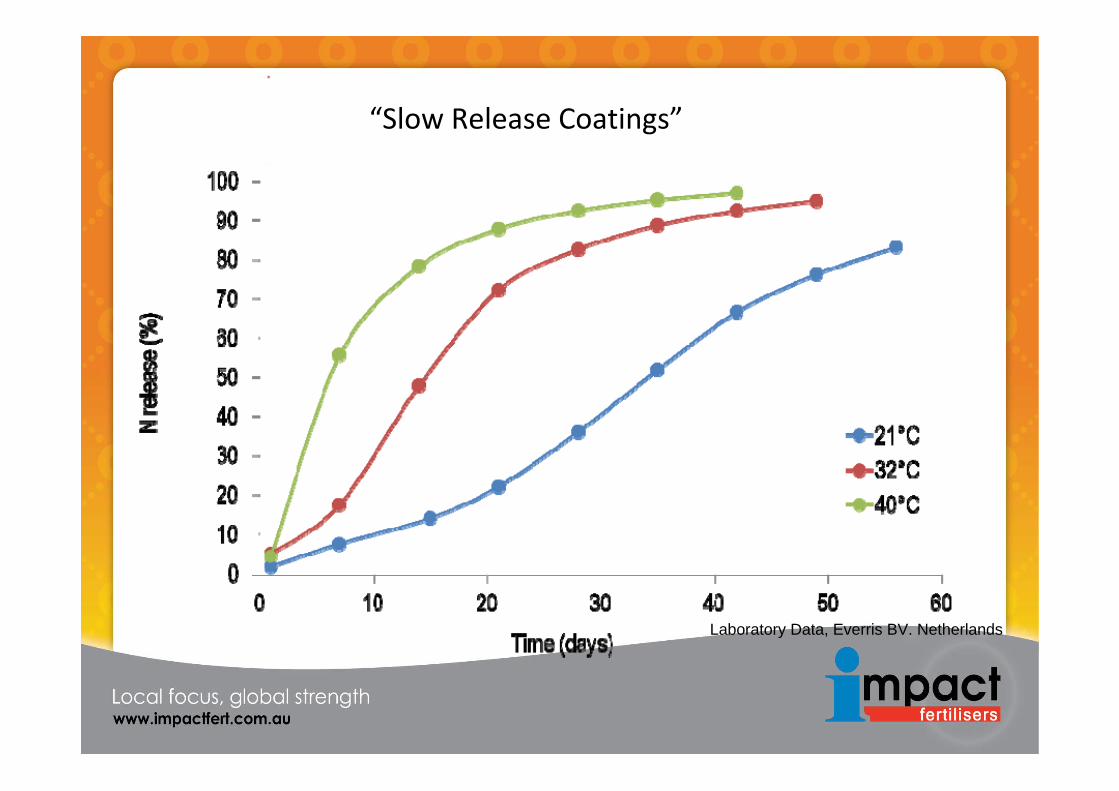
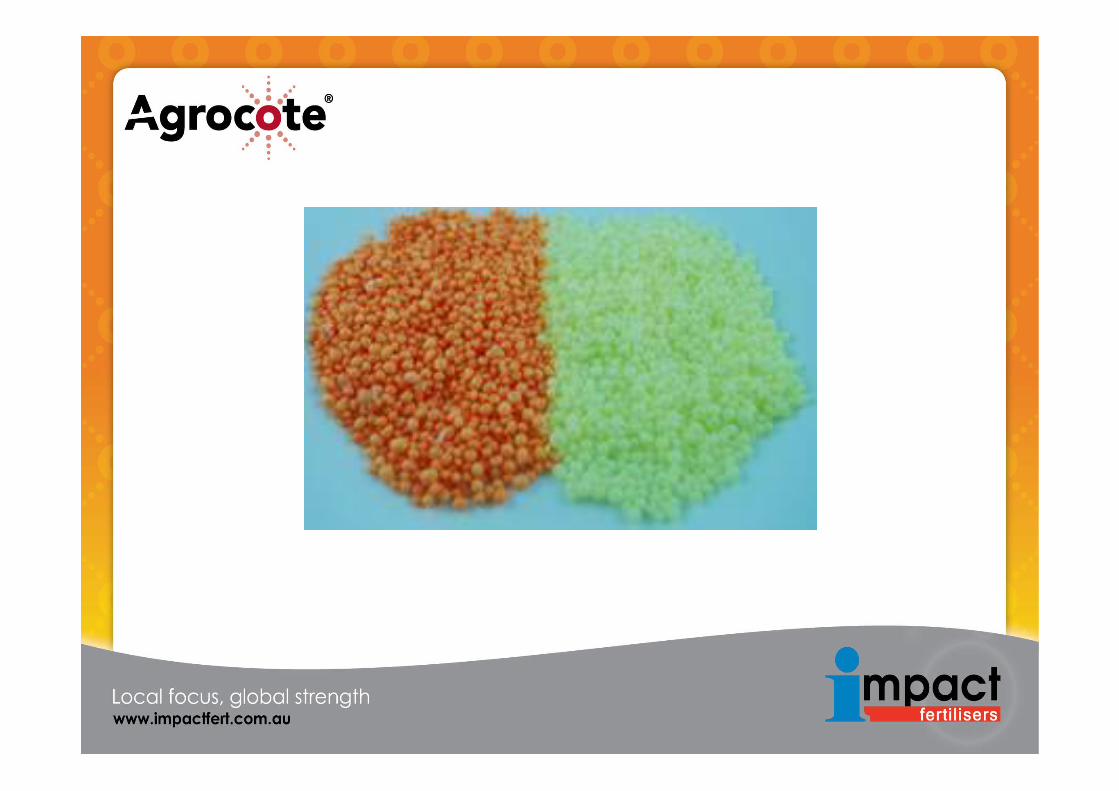
“Slow Release Coatings”
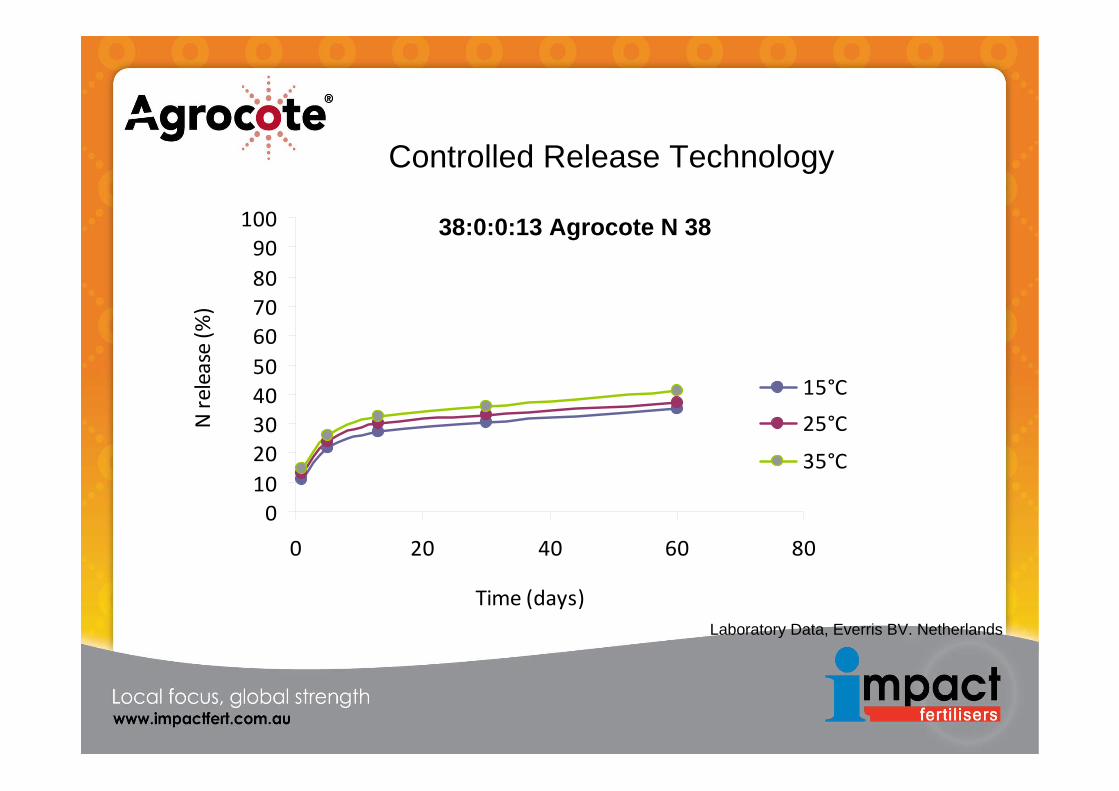
Laboratory Data, Everris BV. Netherlands
Laboratory Data, Everris BV. Netherlands
0102030405060708090
100
0 20 40 60 80
Time (days)
N release (%
)
15°C
25°C
35°C
38:0:0:13 Agrocote N 38
Controlled Release Technology
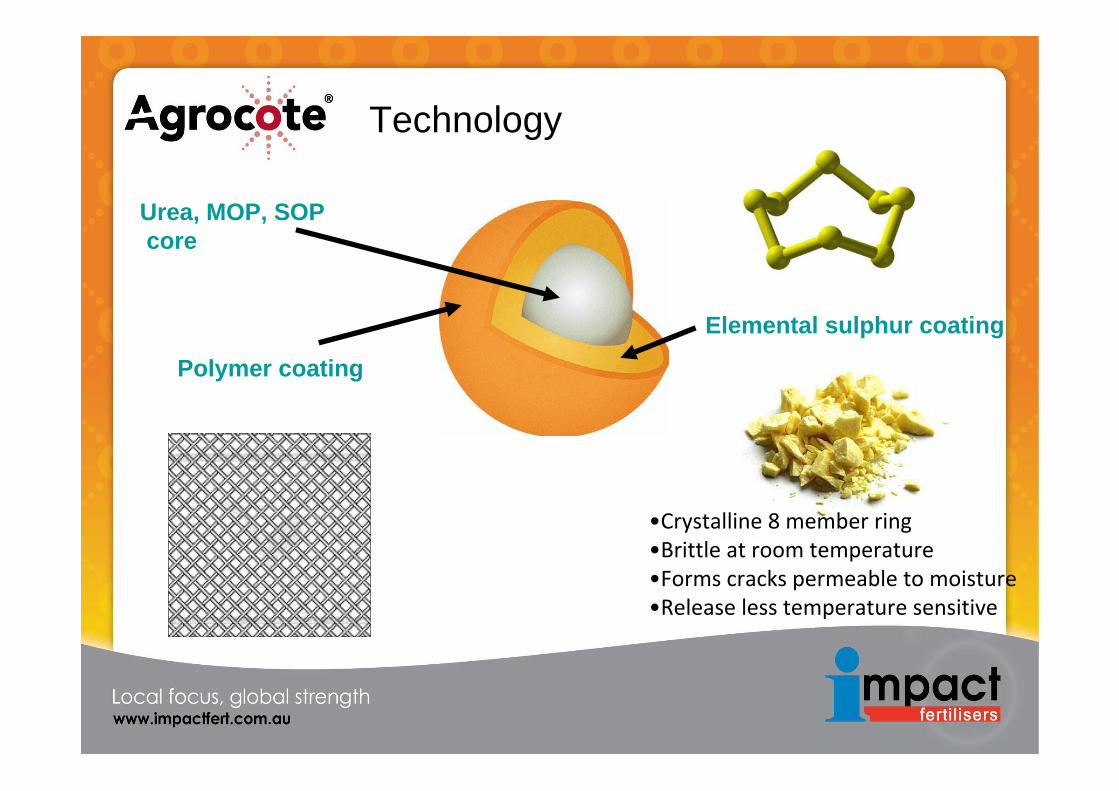
Polymer coating
Elemental sulphur coating
Urea, MOP, SOPcore
Technology
•Crystalline 8 member ring •Brittle at room temperature •Forms cracks permeable to moisture •Release less temperature sensitive
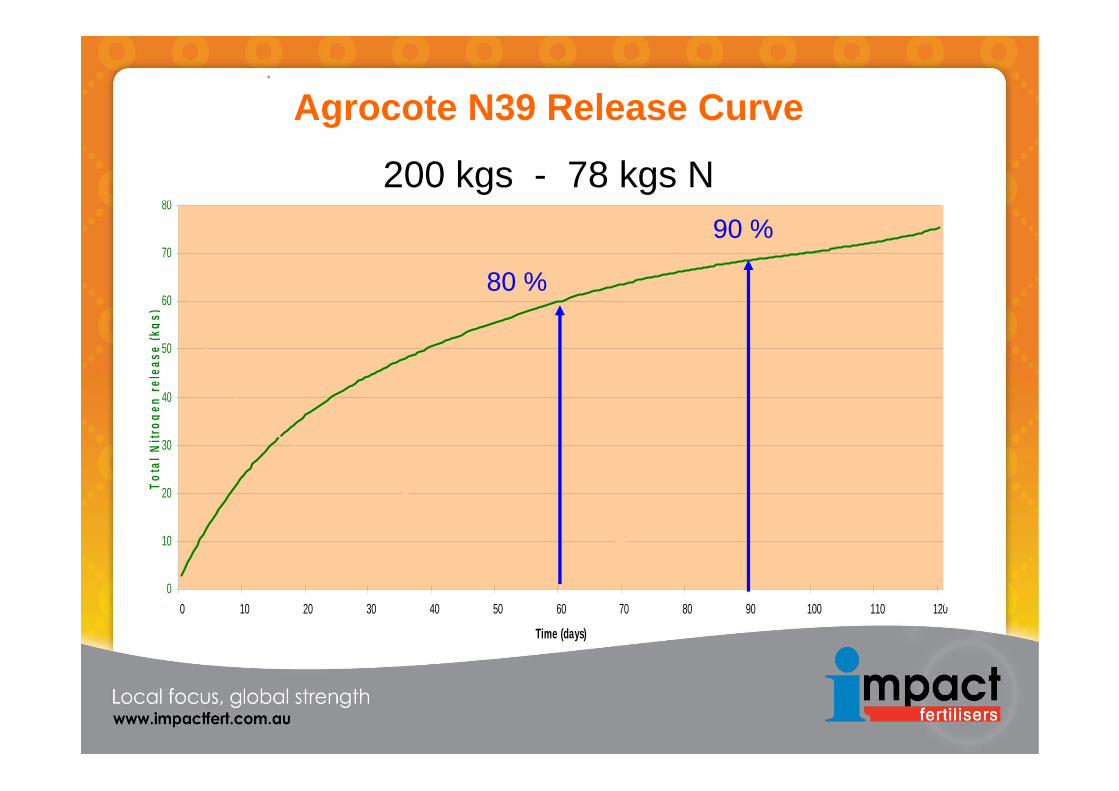
Agrocote N39 Release Curve
0
10
20
30
40
50
60
70
80
0 10 20 30 40 50 60 70 80 90 100 110 120
Time (days)
Tota
l Nitr
ogen
rele
ase
(kgs
)
0.0
0.5
1.0
1.5
2.0
2.5
3.0
Daily
Nitr
ogen
rele
ase
(kgs
)
. . Total N release kgs N release kgs per day
Return HomeAgrocote N39 Release Curve
200 kgs - 78 kgs N
80 %
90 %
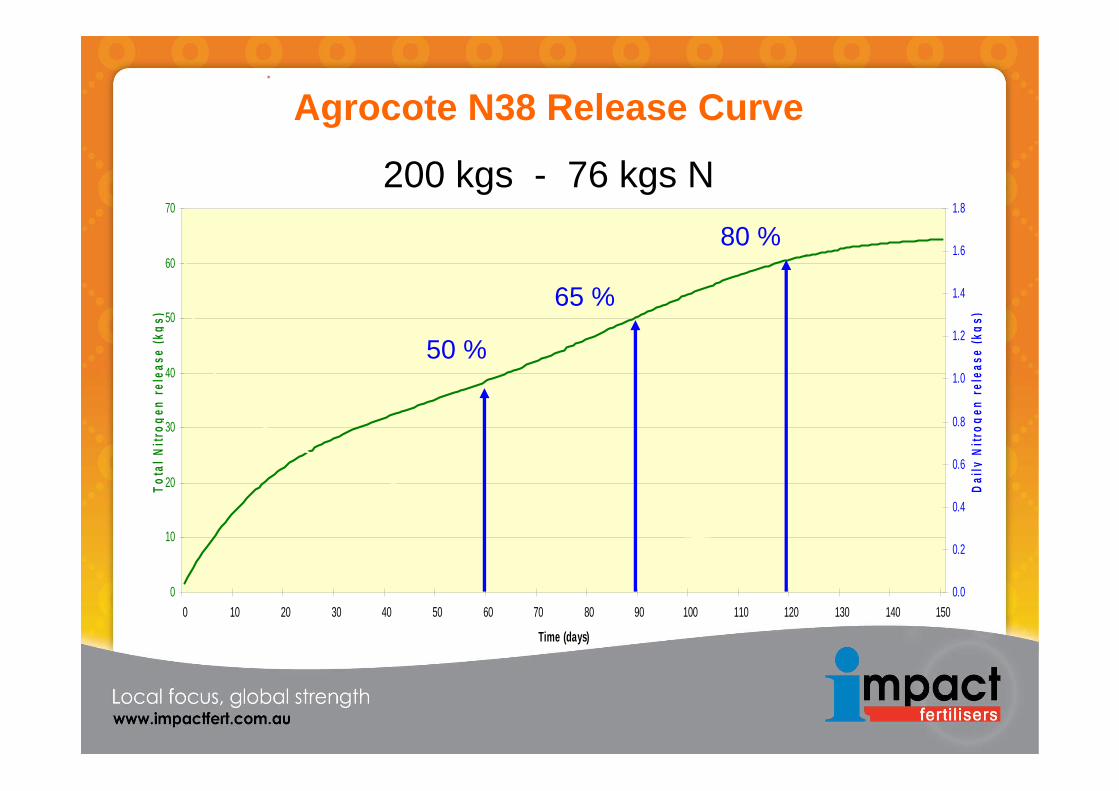
Agrocote N38 Release Curve
0
10
20
30
40
50
60
70
0 10 20 30 40 50 60 70 80 90 100 110 120 130 140 150
Time (days)
Tota
l Nitr
ogen
rele
ase
(kgs
)
0.0
0.2
0.4
0.6
0.8
1.0
1.2
1.4
1.6
1.8
Daily
Nitr
ogen
rele
ase
(kgs
)
. . Total N Release kgs kgs N per day
Return HomeAgrocote N38 Release Curve
200 kgs - 76 kgs N
50 %
65 %
80 %
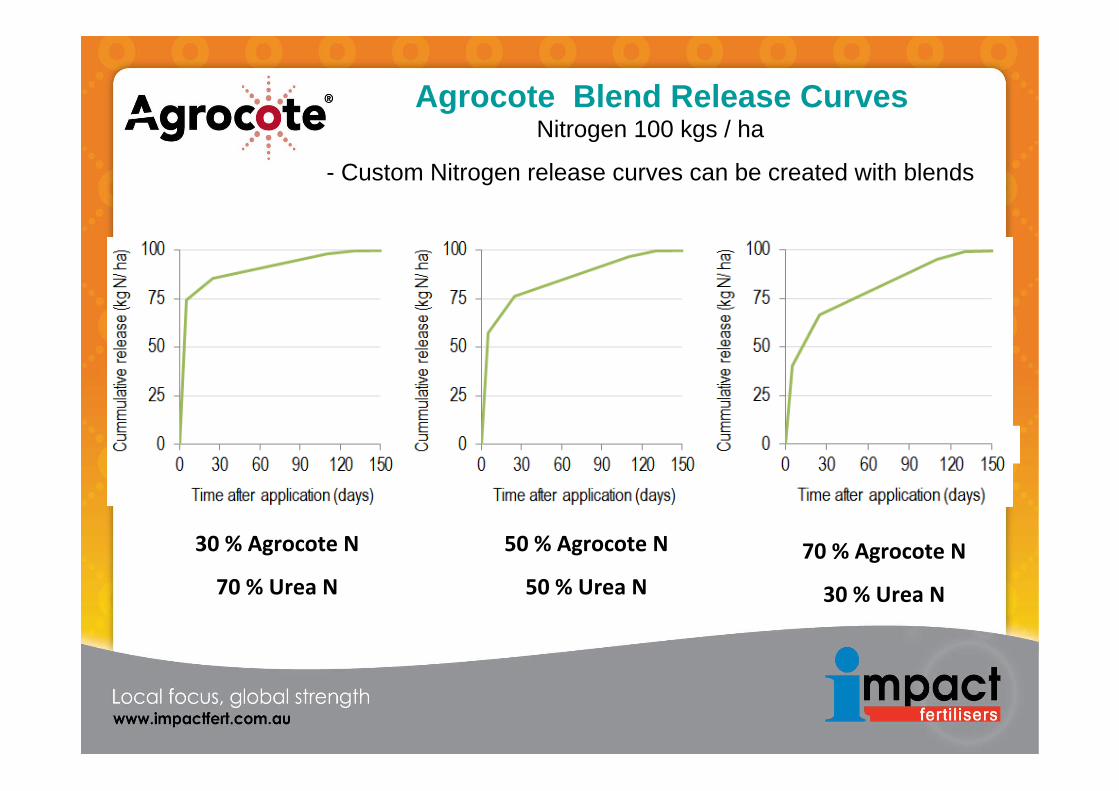
Agrocote Blend Release CurvesNitrogen 100 kgs / ha
- Custom Nitrogen release curves can be created with blends
30 % Agrocote N
70 % Urea N
50 % Agrocote N
50 % Urea N
70 % Agrocote N
30 % Urea N
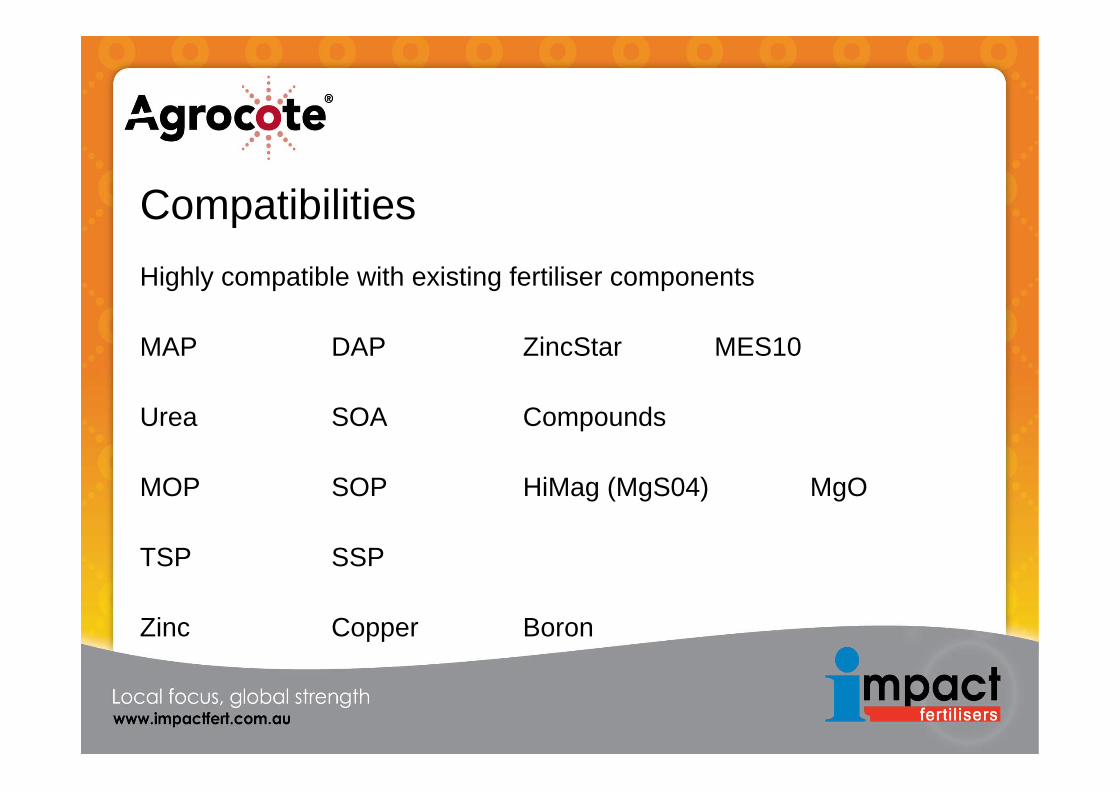
CompatibilitiesHighly compatible with existing fertiliser components
MAP DAP ZincStar MES10
Urea SOA Compounds
MOP SOP HiMag (MgS04) MgO
TSP SSP
Zinc Copper Boron
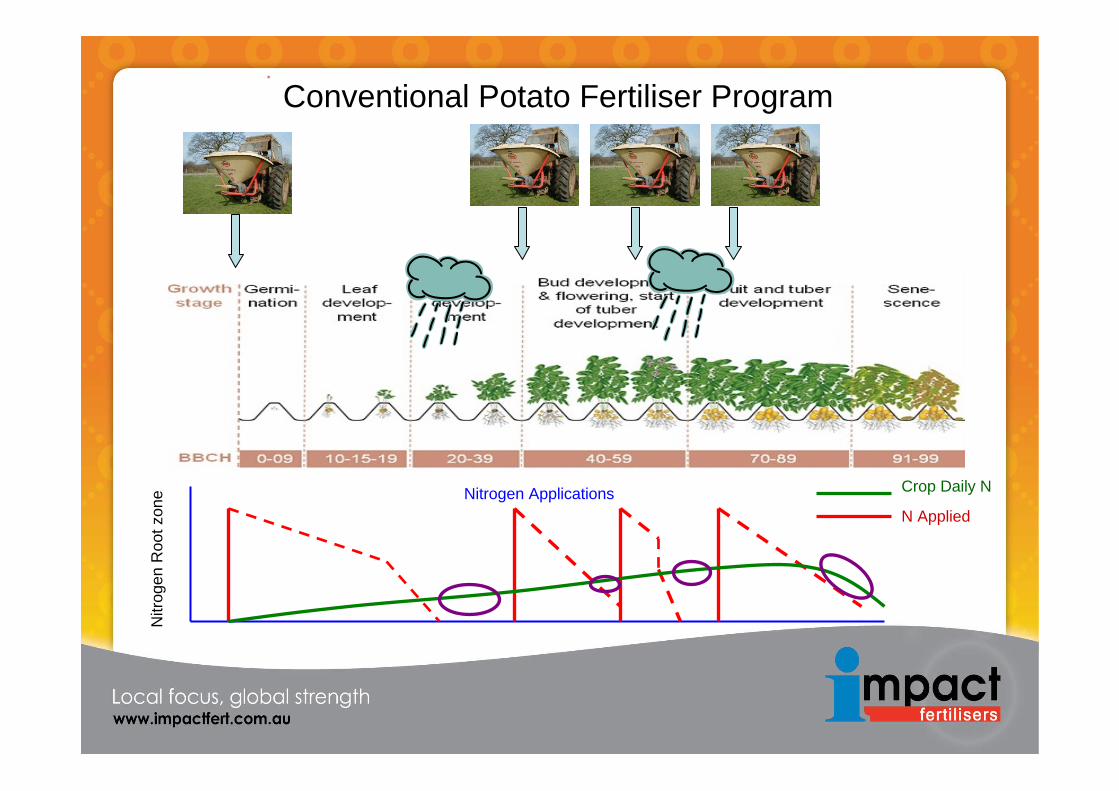
Conventional Potato Fertiliser Program
Nitr
ogen
Roo
t zon
e Nitrogen Applications Crop Daily N
N Applied
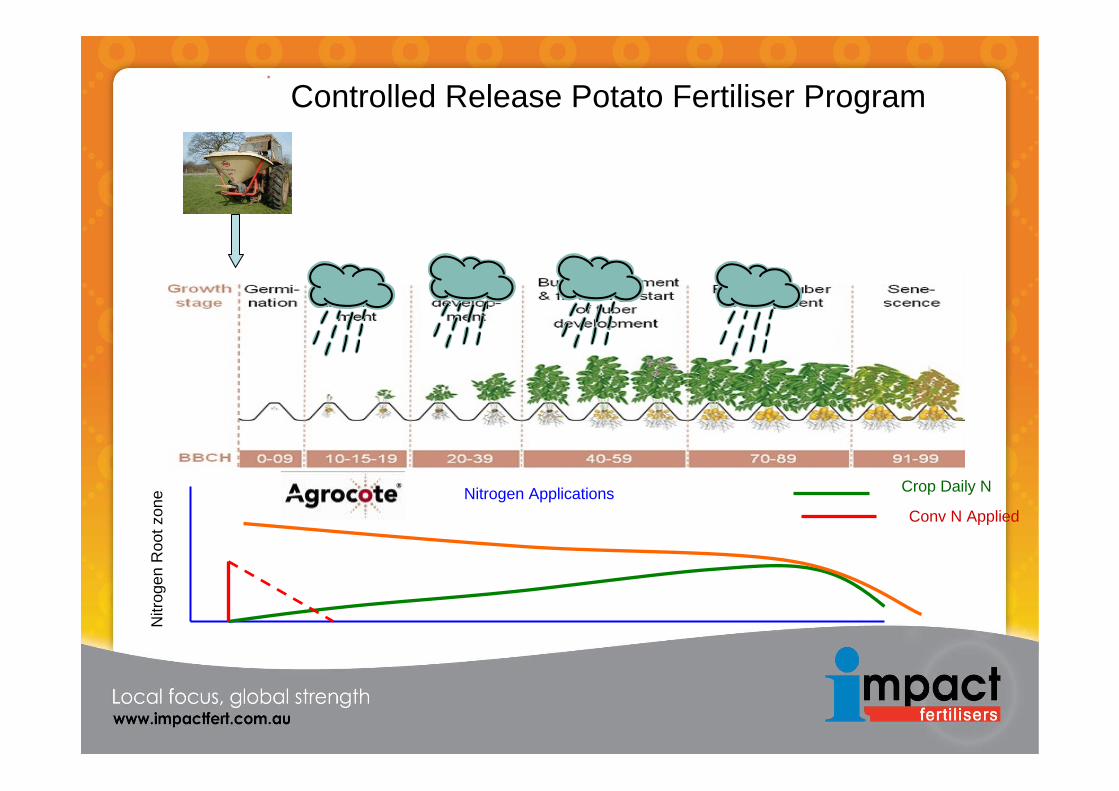
Controlled Release Potato Fertiliser Program
Nitr
ogen
Roo
t zon
e Nitrogen Applications Crop Daily N
Conv N Applied
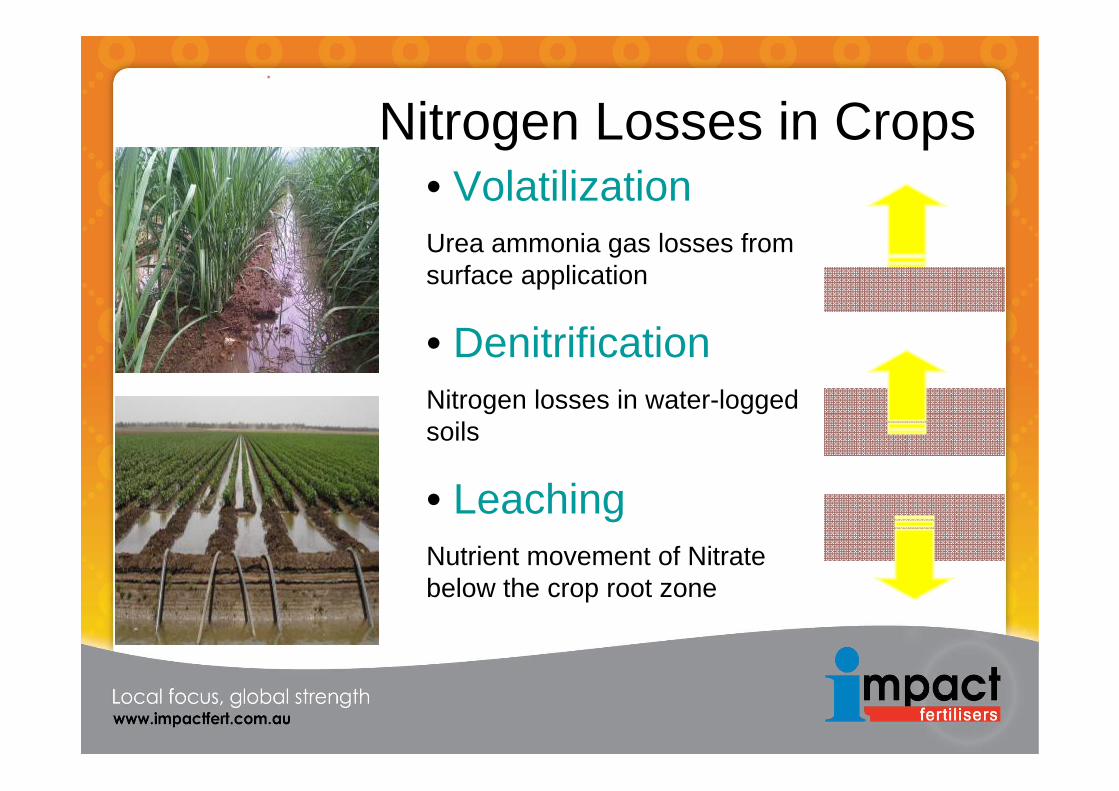
Nitrogen Losses in Crops• VolatilizationUrea ammonia gas losses from surface application
• DenitrificationNitrogen losses in water-logged soils
• LeachingNutrient movement of Nitrate below the crop root zone
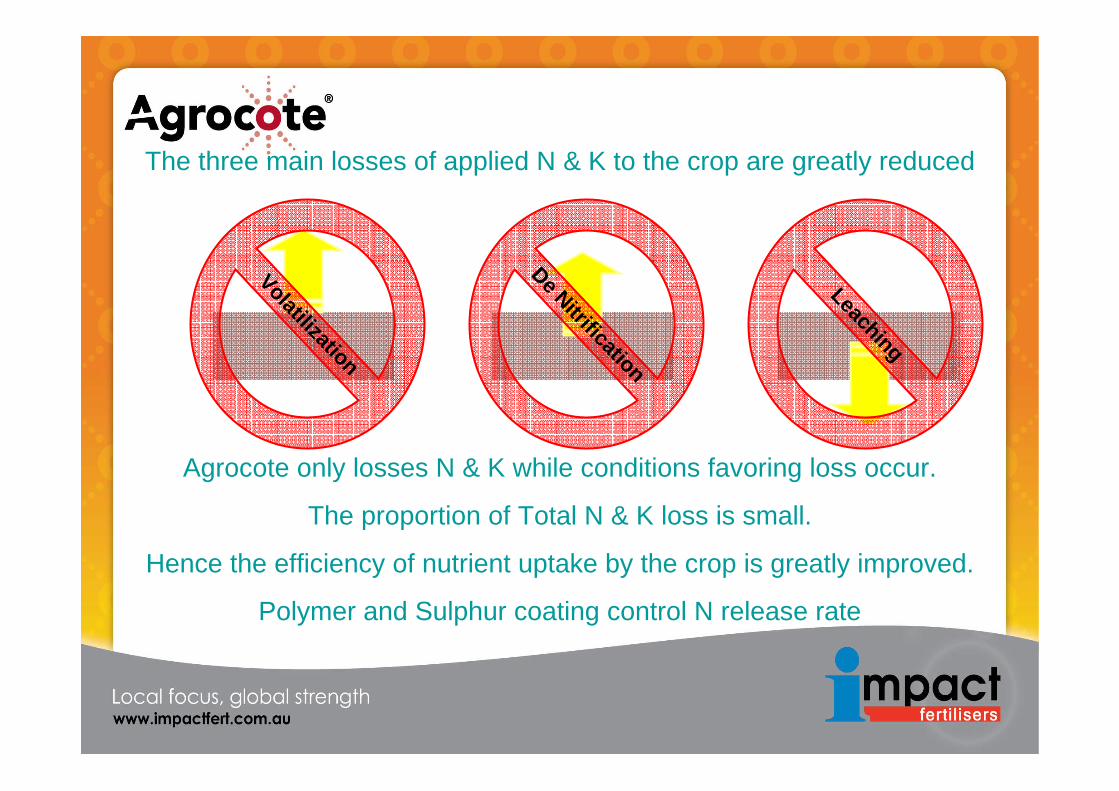
The three main losses of applied N & K to the crop are greatly reduced
Agrocote only losses N & K while conditions favoring loss occur.
The proportion of Total N & K loss is small.
Hence the efficiency of nutrient uptake by the crop is greatly improved.
Polymer and Sulphur coating control N release rate
Volatilization
Leaching
De Nitrification
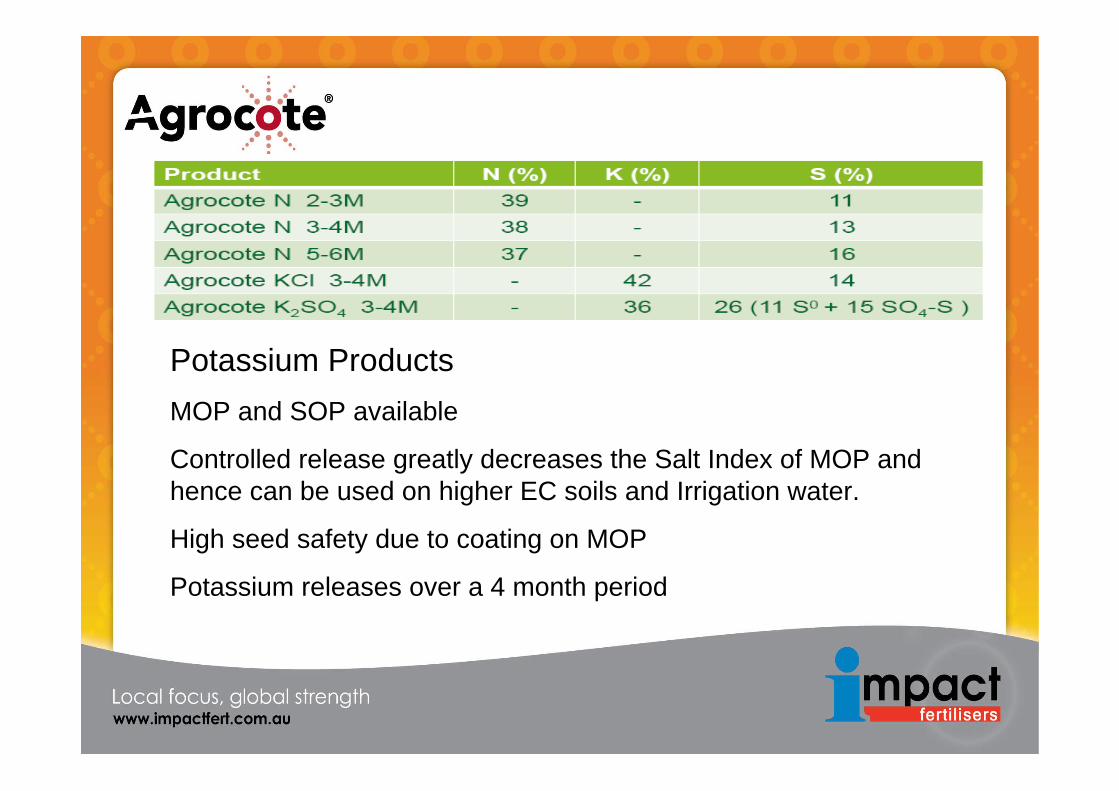
Potassium ProductsMOP and SOP available
Controlled release greatly decreases the Salt Index of MOP and hence can be used on higher EC soils and Irrigation water.
High seed safety due to coating on MOP
Potassium releases over a 4 month period
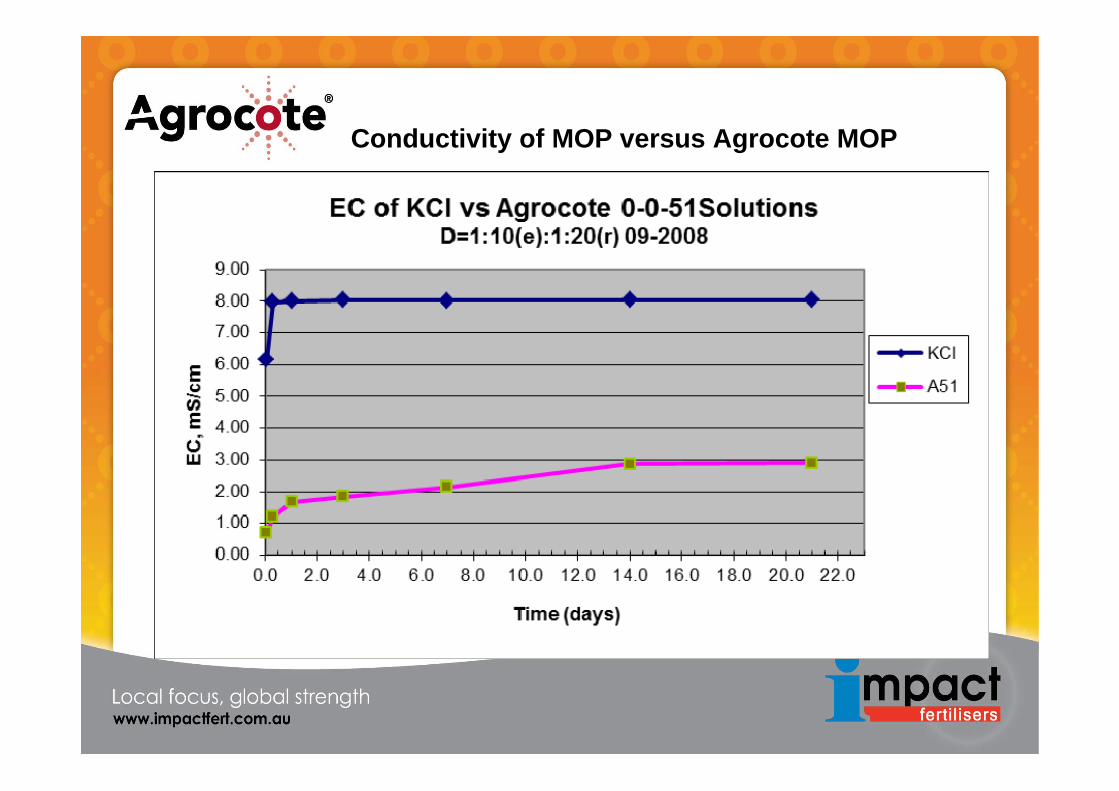
Conductivity of MOP versus Agrocote MOP
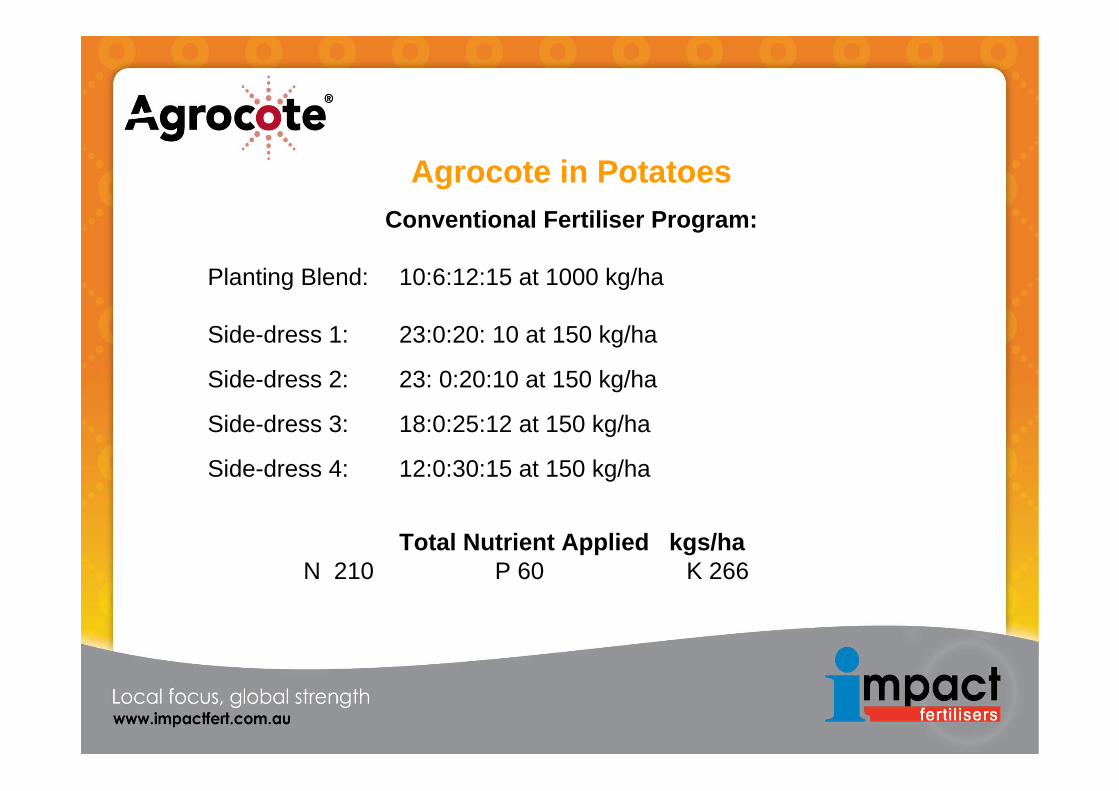
Agrocote in PotatoesConventional Fertiliser Program:
Planting Blend: 10:6:12:15 at 1000 kg/ha
Side-dress 1: 23:0:20: 10 at 150 kg/ha
Side-dress 2: 23: 0:20:10 at 150 kg/ha
Side-dress 3: 18:0:25:12 at 150 kg/ha
Side-dress 4: 12:0:30:15 at 150 kg/ha
Total Nutrient Applied kgs/haN 210 P 60 K 266
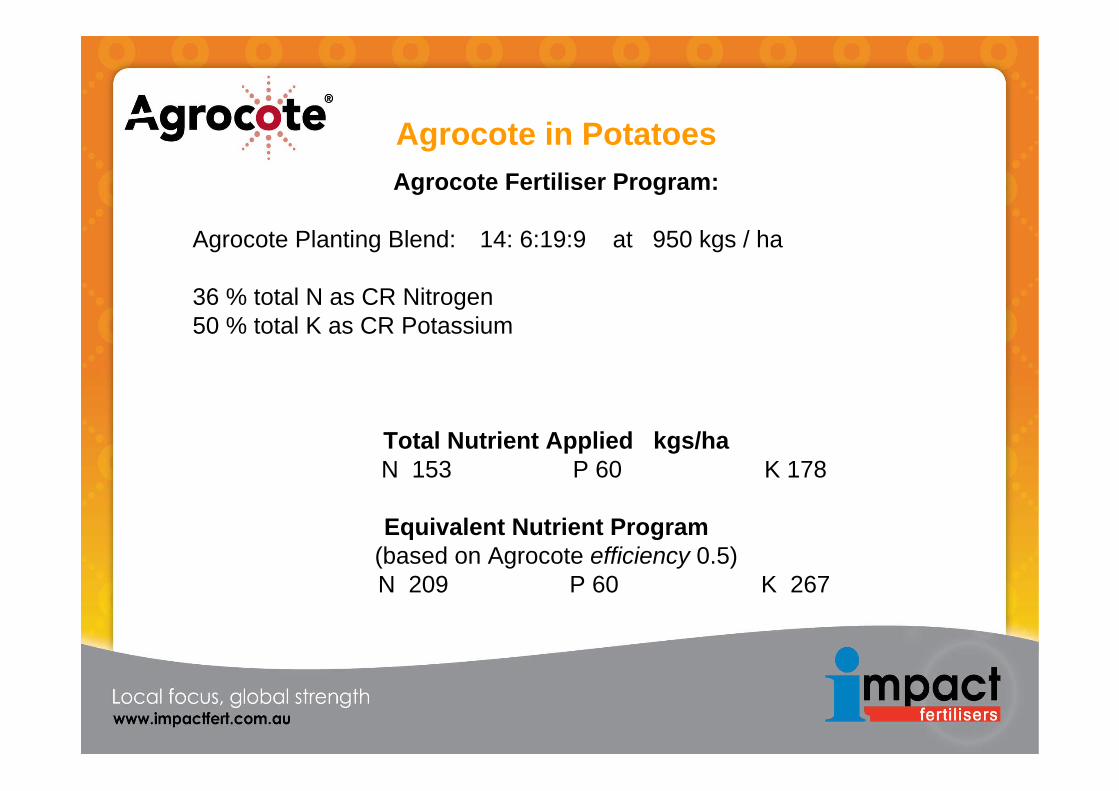
Agrocote in PotatoesAgrocote Fertiliser Program:
Agrocote Planting Blend: 14: 6:19:9 at 950 kgs / ha
36 % total N as CR Nitrogen50 % total K as CR Potassium
Total Nutrient Applied kgs/haN 153 P 60 K 178
Equivalent Nutrient Program(based on Agrocote efficiency 0.5)N 209 P 60 K 267
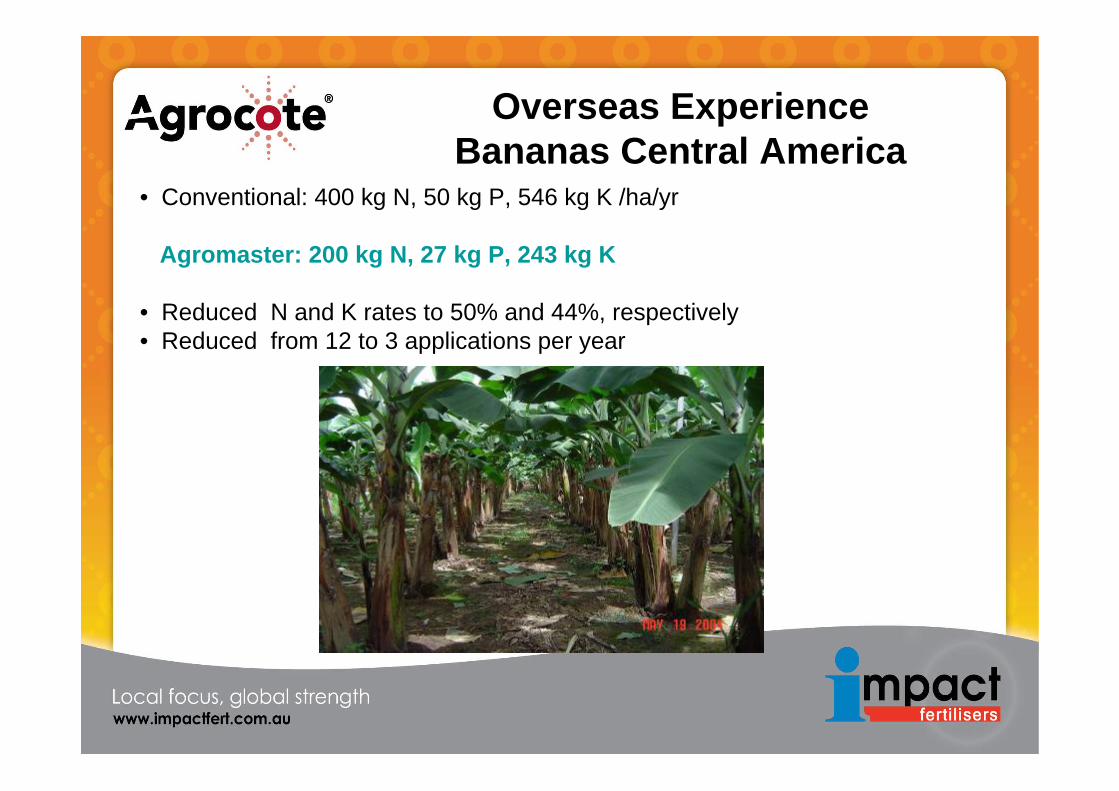
• Conventional: 400 kg N, 50 kg P, 546 kg K /ha/yr
Agromaster: 200 kg N, 27 kg P, 243 kg K
• Reduced N and K rates to 50% and 44%, respectively • Reduced from 12 to 3 applications per year
Overseas ExperienceBananas Central America
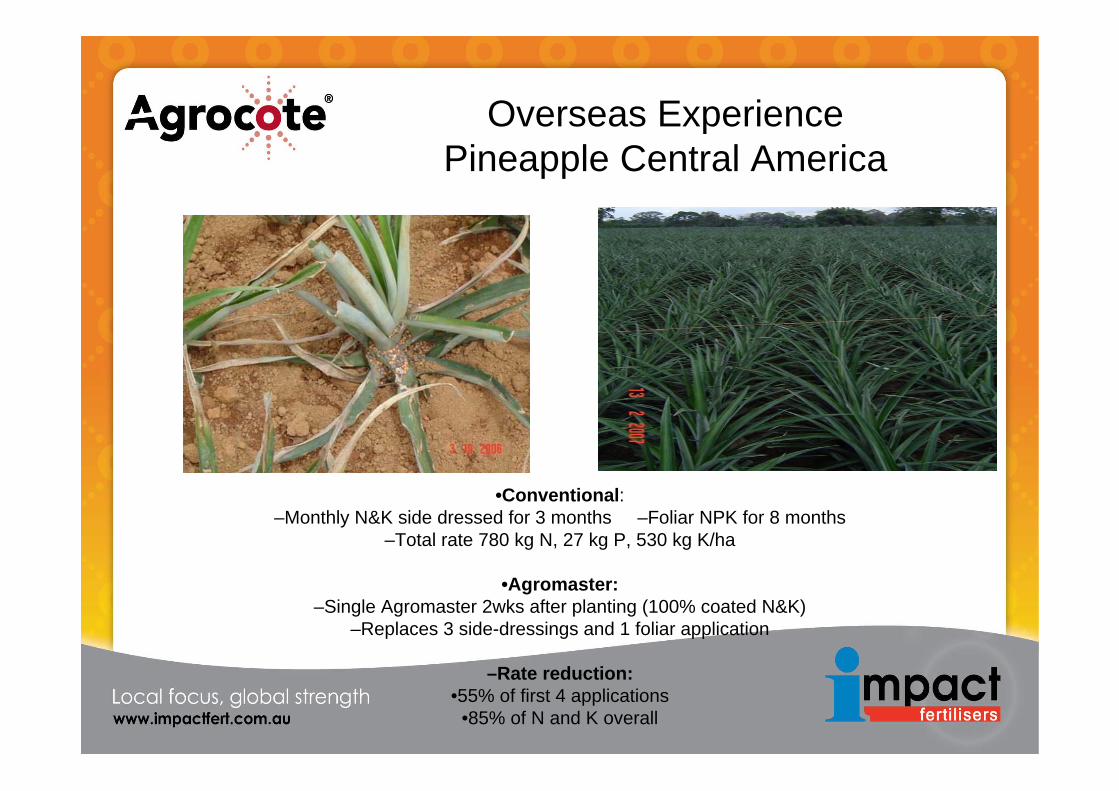
Overseas ExperiencePineapple Central America
•Conventional: –Monthly N&K side dressed for 3 months –Foliar NPK for 8 months
–Total rate 780 kg N, 27 kg P, 530 kg K/ha
•Agromaster: –Single Agromaster 2wks after planting (100% coated N&K)
–Replaces 3 side-dressings and 1 foliar application
–Rate reduction:•55% of first 4 applications
•85% of N and K overall
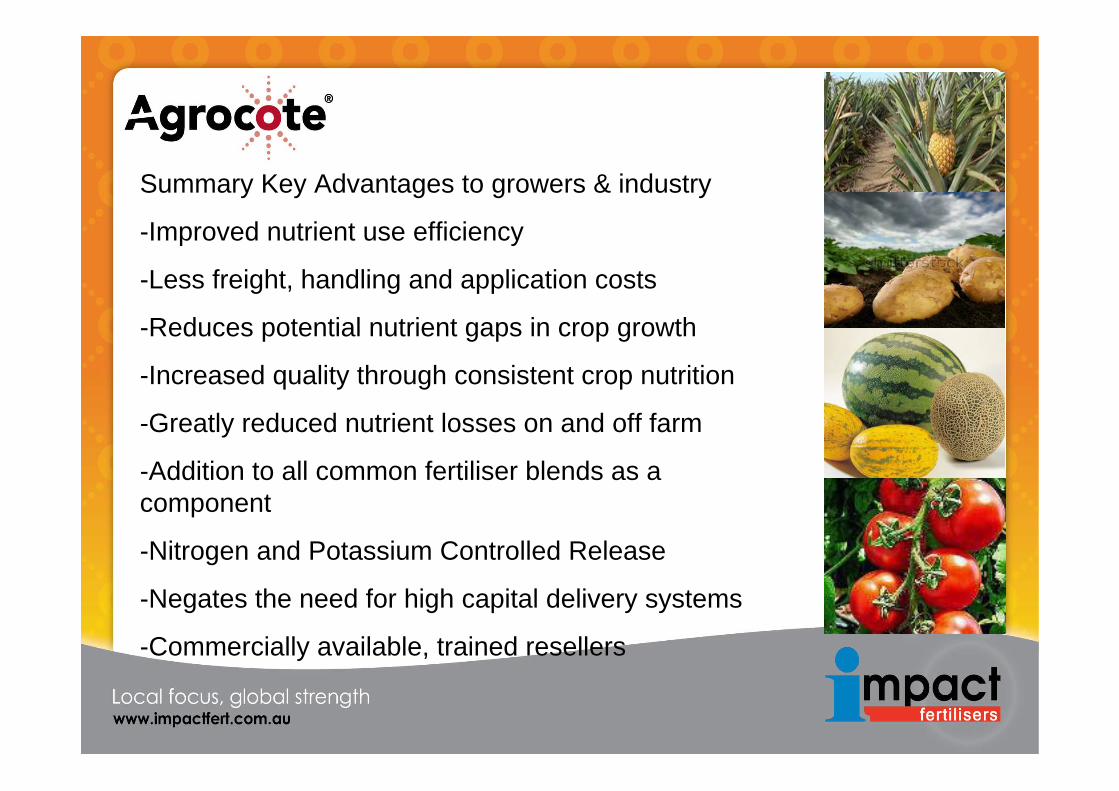
Summary Key Advantages to growers & industry
-Improved nutrient use efficiency
-Less freight, handling and application costs
-Reduces potential nutrient gaps in crop growth
-Increased quality through consistent crop nutrition
-Greatly reduced nutrient losses on and off farm
-Addition to all common fertiliser blends as a component
-Nitrogen and Potassium Controlled Release
-Negates the need for high capital delivery systems
-Commercially available, trained resellers