Embed Size (px)
Citation preview

Controlled environment for livestockPrinciples, systems and technologies – air, temperature and light
2
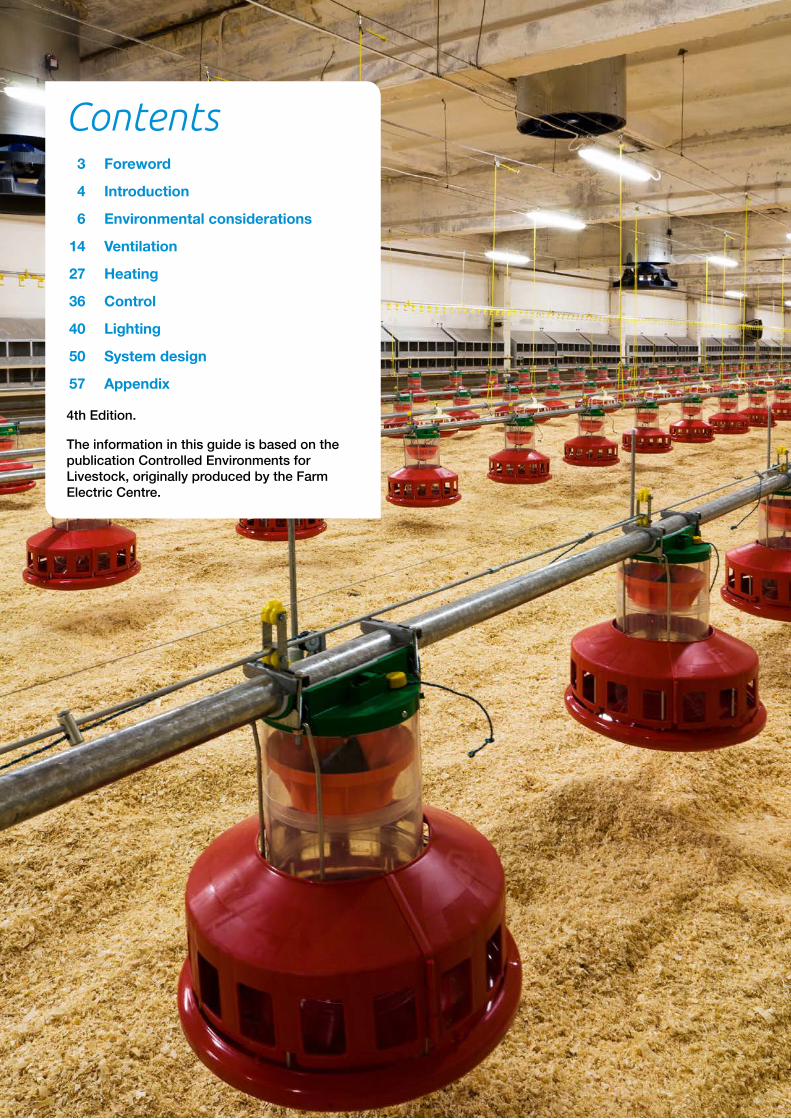
Contents 3 Foreword
4 Introduction
6 Environmental considerations
14 Ventilation
27 Heating
36 Control
40 Lighting
50 System design
57 Appendix
4th Edition.
The information in this guide is based on the publication Controlled Environments for Livestock, originally produced by the Farm Electric Centre.
3
The concept of this book has a somewhat strange origin that goes back more than 50 years. It was originally introduced by the Electricity Council (the overseeing body of the nationalised electricity industry) as an educational and promotional reference, mainly covering the use of energy in controlled livestock buildings.In those days, the use of heating, ventilation and control for housed animals was very much 'work in progress'; however, the book included quite a few fundamental design concepts, many of which are still relevant today. The text has been re-written a couple of times over the years, with the last major update produced in the 1990s.The electricity industry has since been privatised and now has little concern for the details of environmental systems for livestock. As such, the book fell out of print. Nonetheless, it has remained relevant and can be found on the bookshelves of many farmers and designers as a practical reference on how to put together a controlled environment system. Over the years, it has gained a reputation for providing concise, no-nonsense guidance.Now, AHDB has picked up the baton to produce this fourth edition, updating it, including new and emerging technologies and making it relevant and useful for the present generation of farmers and designers.
Foreword
Nigel PenlingtonHead of Environment and
Buildings, AHDB
4
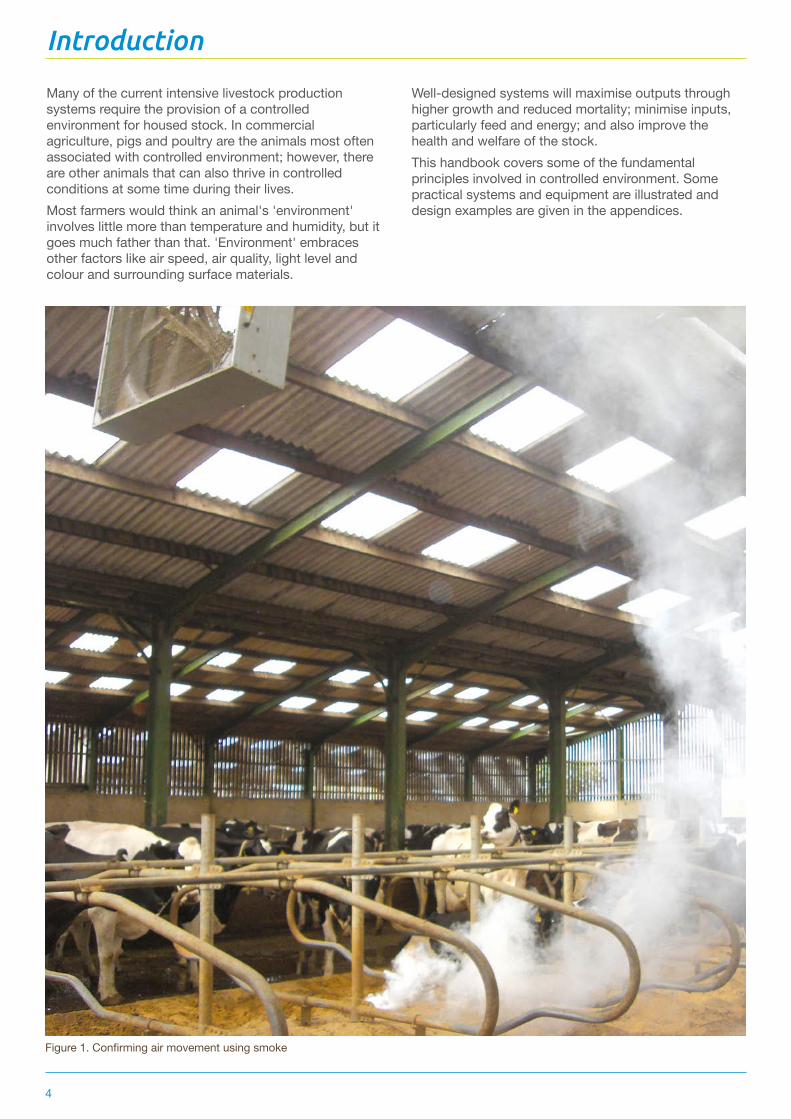
Many of the current intensive livestock production systems require the provision of a controlled environment for housed stock. In commercial agriculture, pigs and poultry are the animals most often associated with controlled environment; however, there are other animals that can also thrive in controlled conditions at some time during their lives.Most farmers would think an animal's 'environment' involves little more than temperature and humidity, but it goes much father than that. 'Environment' embraces other factors like air speed, air quality, light level and colour and surrounding surface materials.
Well-designed systems will maximise outputs through higher growth and reduced mortality; minimise inputs, particularly feed and energy; and also improve the health and welfare of the stock. This handbook covers some of the fundamental principles involved in controlled environment. Some practical systems and equipment are illustrated and design examples are given in the appendices.
Figure 1. Confirming air movement using smoke
Introduction
5
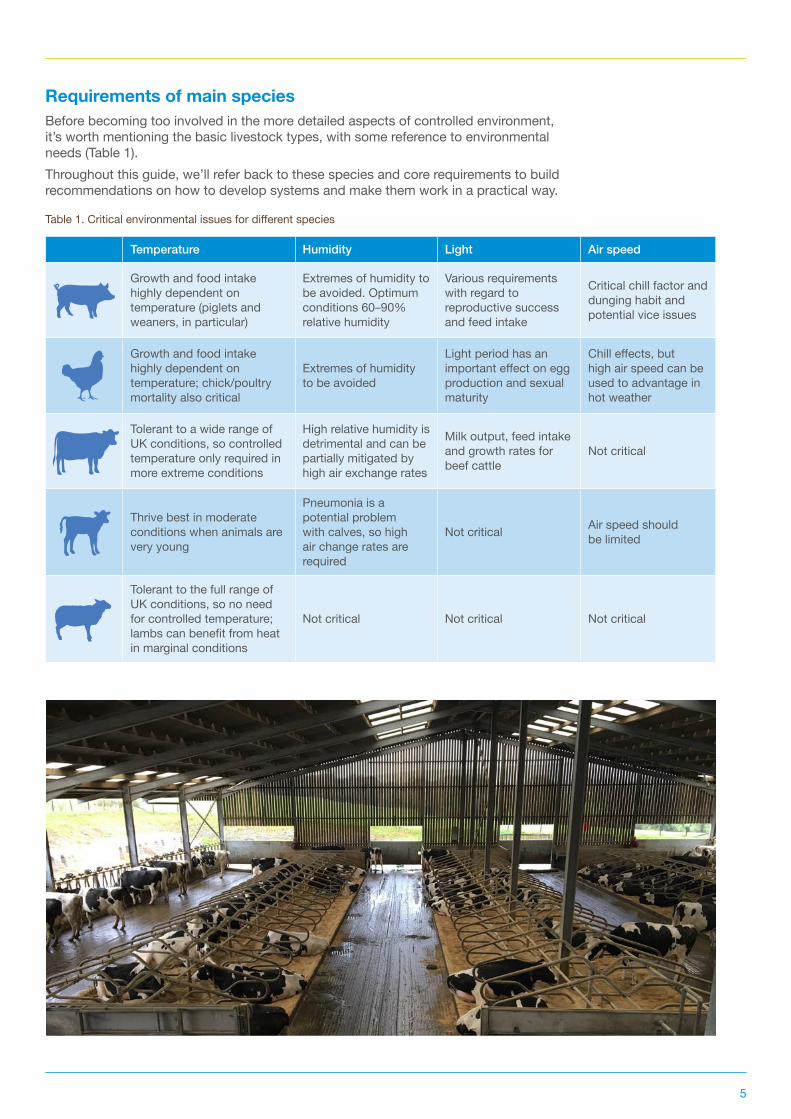
Requirements of main speciesBefore becoming too involved in the more detailed aspects of controlled environment, it’s worth mentioning the basic livestock types, with some reference to environmental needs (Table 1). Throughout this guide, we’ll refer back to these species and core requirements to build recommendations on how to develop systems and make them work in a practical way.
Table 1. Critical environmental issues for different species
Temperature Humidity Light Air speed
Growth and food intake highly dependent on temperature (piglets and weaners, in particular)
Extremes of humidity to be avoided. Optimum conditions 60–90% relative humidity
Various requirements with regard to reproductive success and feed intake
Critical chill factor and dunging habit and potential vice issues
Growth and food intake highly dependent on temperature; chick/poultry mortality also critical
Extremes of humidity to be avoided
Light period has an important effect on egg production and sexual maturity
Chill effects, but high air speed can be used to advantage in hot weather
Tolerant to a wide range of UK conditions, so controlled temperature only required in more extreme conditions
High relative humidity is detrimental and can be partially mitigated by high air exchange rates
Milk output, feed intake and growth rates for beef cattle
Not critical
Thrive best in moderate conditions when animals are very young
Pneumonia is a potential problem with calves, so high air change rates are required
Not critical Air speed should be limited
Tolerant to the full range of UK conditions, so no need for controlled temperature; lambs can benefit from heat in marginal conditions
Not critical Not critical Not critical
6
Environmental considerations for livestock can be grouped into three main areas. Physiological factors, behavioural factors and their interaction with the physical environment.Physiological issues are the underlying fundamental drivers that determine how we choose temperatures, ventilation and heating systems. They are modified by the constraints imposed by:
• Physical environment – for instance, flooring, air speed, light, etc and how the animal modifies its environment through:
• Behaviour – eg panting, huddling and wallowing
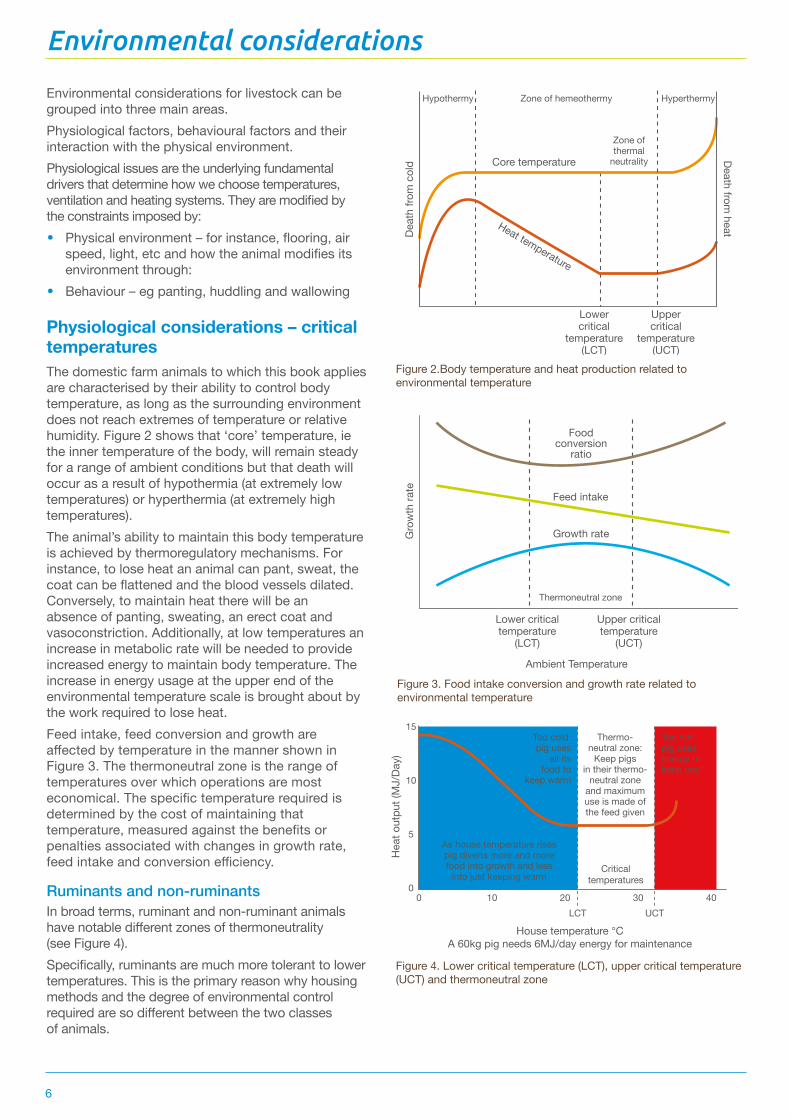
Physiological considerations – critical temperaturesThe domestic farm animals to which this book applies are characterised by their ability to control body temperature, as long as the surrounding environment does not reach extremes of temperature or relative humidity. Figure 2 shows that ‘core’ temperature, ie the inner temperature of the body, will remain steady for a range of ambient conditions but that death will occur as a result of hypothermia (at extremely low temperatures) or hyperthermia (at extremely high temperatures).The animal’s ability to maintain this body temperature is achieved by thermoregulatory mechanisms. For instance, to lose heat an animal can pant, sweat, the coat can be flattened and the blood vessels dilated. Conversely, to maintain heat there will be an absence of panting, sweating, an erect coat and vasoconstriction. Additionally, at low temperatures an increase in metabolic rate will be needed to provide increased energy to maintain body temperature. The increase in energy usage at the upper end of the environmental temperature scale is brought about by the work required to lose heat.Feed intake, feed conversion and growth are affected by temperature in the manner shown in Figure 3. The thermoneutral zone is the range of temperatures over which operations are most economical. The specific temperature required is determined by the cost of maintaining that temperature, measured against the benefits or penalties associated with changes in growth rate, feed intake and conversion efficiency.
Ruminants and non-ruminantsIn broad terms, ruminant and non-ruminant animals have notable different zones of thermoneutrality (see Figure 4). Specifically, ruminants are much more tolerant to lower temperatures. This is the primary reason why housing methods and the degree of environmental control required are so different between the two classes of animals.
Figure 2.Body temperature and heat production related to environmental temperature
Figure 3. Food intake conversion and growth rate related to environmental temperature
Figure 4. Lower critical temperature (LCT), upper critical temperature (UCT) and thermoneutral zone
Environmental considerations
Hypothermy HyperthermyZone of hemeothermy
Zone of thermal
neutralityCore temperature
Lower critical
temperature(LCT)
Upper critical
temperature(UCT)
Deat
h fro
m c
old Death from
heatHeat temperature
Foodconversion
ratio
Feed intake
Growth rate
Thermoneutral zone
Ambient Temperature
Gro
wth
rate
Lower critical temperature
(LCT)
Upper critical temperature
(UCT)
Too hot:pig uses energy to keep cool
Thermo-neutral zone:
Keep pigs in their thermo-
neutral zone and maximum use is made of the feed given
Too cold:pig uses
all its food to
keep warm
LCT UCT
As house temperature rises pig diverts more and more food into growth and less
into just keeping warmCritical
temperatures
House temperature °CA 60kg pig needs 6MJ/day energy for maintenance
0 10 20 30 40
Hea
t out
put (
MJ/
Day)
0
5
10
15
7
It’s important to note that the optimum temperature curve is not fixed. It can be shaped dramatically by other environmental factors. These include bedding, flooring, air speed, proximity to other animals and shelter. This is the primary reason temperature-sensitive animals like pigs can, under the right conditions, thrive quite well in outdoor rearing systems where temperatures are more extreme. However, take away the ability of the animal to regulate this temperature curve (by nesting, huddling, wallowing, etc), then it is necessary to provide the animal with a ‘tighter’, more controlled environment for good performance.
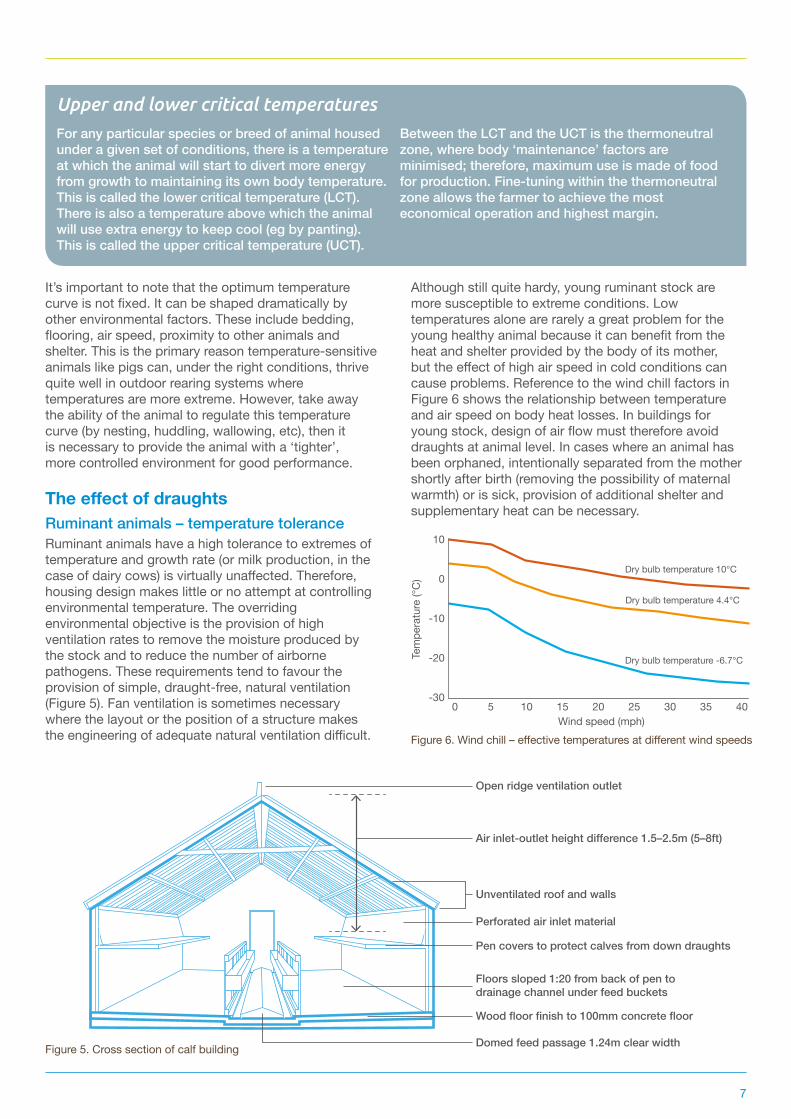
The effect of draughtsRuminant animals – temperature toleranceRuminant animals have a high tolerance to extremes of temperature and growth rate (or milk production, in the case of dairy cows) is virtually unaffected. Therefore, housing design makes little or no attempt at controlling environmental temperature. The overriding environmental objective is the provision of high ventilation rates to remove the moisture produced by the stock and to reduce the number of airborne pathogens. These requirements tend to favour the provision of simple, draught-free, natural ventilation (Figure 5). Fan ventilation is sometimes necessary where the layout or the position of a structure makes the engineering of adequate natural ventilation difficult.
Although still quite hardy, young ruminant stock are more susceptible to extreme conditions. Low temperatures alone are rarely a great problem for the young healthy animal because it can benefit from the heat and shelter provided by the body of its mother, but the effect of high air speed in cold conditions can cause problems. Reference to the wind chill factors in Figure 6 shows the relationship between temperature and air speed on body heat losses. In buildings for young stock, design of air flow must therefore avoid draughts at animal level. In cases where an animal has been orphaned, intentionally separated from the mother shortly after birth (removing the possibility of maternal warmth) or is sick, provision of additional shelter and supplementary heat can be necessary.
Upper and lower critical temperaturesFor any particular species or breed of animal housed under a given set of conditions, there is a temperature at which the animal will start to divert more energy from growth to maintaining its own body temperature. This is called the lower critical temperature (LCT). There is also a temperature above which the animal will use extra energy to keep cool (eg by panting). This is called the upper critical temperature (UCT).
Between the LCT and the UCT is the thermoneutral zone, where body ‘maintenance’ factors are minimised; therefore, maximum use is made of food for production. Fine-tuning within the thermoneutral zone allows the farmer to achieve the most economical operation and highest margin.
Figure 6. Wind chill – effective temperatures at different wind speeds
Figure 5. Cross section of calf building
Dry bulb temperature 10°C
Dry bulb temperature 4.4°C
Dry bulb temperature -6.7°C
Wind speed (mph)0
Tem
pera
ture
(°C
)
-30
-20
-10
10
0
105 15 20 25 30 35 40
Open ridge ventilation outlet
Air inlet-outlet height difference 1.5–2.5m (5–8ft)
Unventilated roof and walls
Perforated air inlet material
Pen covers to protect calves from down draughts
Floors sloped 1:20 from back of pen to drainage channel under feed buckets
Wood floor finish to 100mm concrete floor
Domed feed passage 1.24m clear width
8
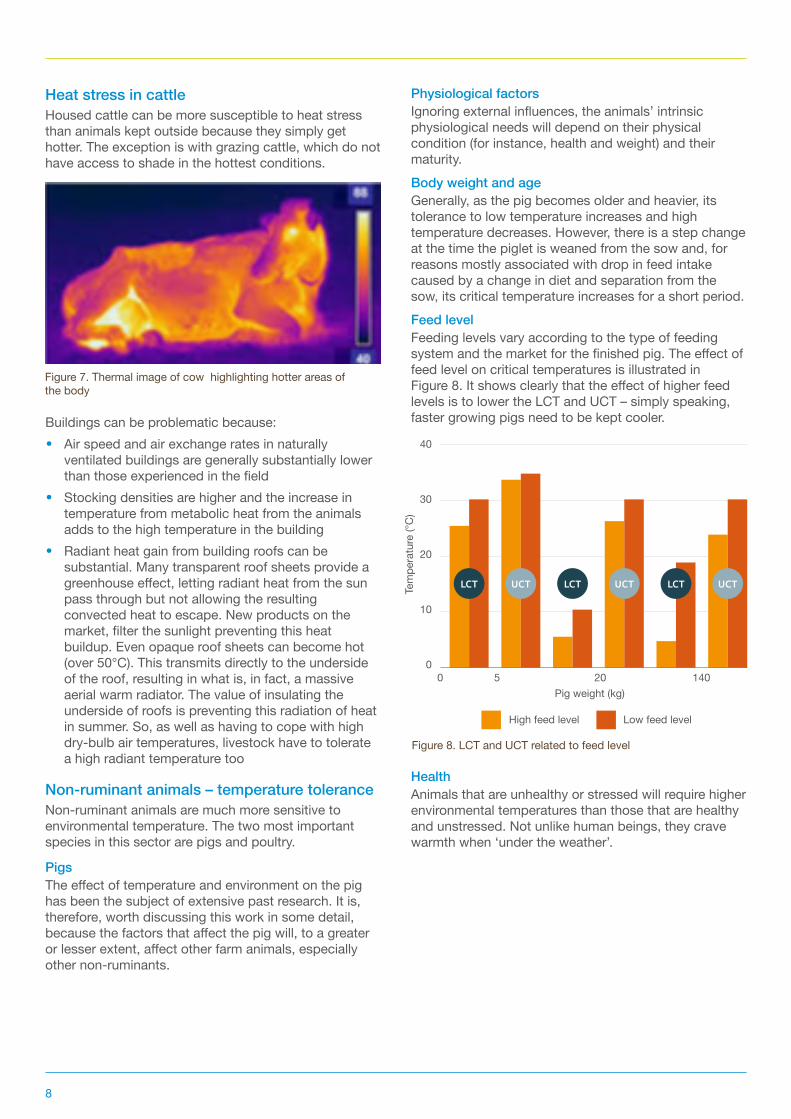
Heat stress in cattleHoused cattle can be more susceptible to heat stress than animals kept outside because they simply get hotter. The exception is with grazing cattle, which do not have access to shade in the hottest conditions.
Buildings can be problematic because:
• Air speed and air exchange rates in naturally ventilated buildings are generally substantially lower than those experienced in the field
• Stocking densities are higher and the increase in temperature from metabolic heat from the animals adds to the high temperature in the building
• Radiant heat gain from building roofs can be substantial. Many transparent roof sheets provide a greenhouse effect, letting radiant heat from the sun pass through but not allowing the resulting convected heat to escape. New products on the market, filter the sunlight preventing this heat buildup. Even opaque roof sheets can become hot (over 50°C). This transmits directly to the underside of the roof, resulting in what is, in fact, a massive aerial warm radiator. The value of insulating the underside of roofs is preventing this radiation of heat in summer. So, as well as having to cope with high dry-bulb air temperatures, livestock have to tolerate a high radiant temperature too
Non-ruminant animals – temperature tolerance Non-ruminant animals are much more sensitive to environmental temperature. The two most important species in this sector are pigs and poultry.
PigsThe effect of temperature and environment on the pig has been the subject of extensive past research. It is, therefore, worth discussing this work in some detail, because the factors that affect the pig will, to a greater or lesser extent, affect other farm animals, especially other non-ruminants.
Physiological factorsIgnoring external influences, the animals’ intrinsic physiological needs will depend on their physical condition (for instance, health and weight) and their maturity.Body weight and ageGenerally, as the pig becomes older and heavier, its tolerance to low temperature increases and high temperature decreases. However, there is a step change at the time the piglet is weaned from the sow and, for reasons mostly associated with drop in feed intake caused by a change in diet and separation from the sow, its critical temperature increases for a short period.Feed levelFeeding levels vary according to the type of feeding system and the market for the finished pig. The effect of feed level on critical temperatures is illustrated in Figure 8. It shows clearly that the effect of higher feed levels is to lower the LCT and UCT – simply speaking, faster growing pigs need to be kept cooler.
HealthAnimals that are unhealthy or stressed will require higher environmental temperatures than those that are healthy and unstressed. Not unlike human beings, they crave warmth when ‘under the weather’.
Figure 7. Thermal image of cow highlighting hotter areas of the body
Figure 8. LCT and UCT related to feed level
Pig weight (kg)0
Tem
pera
ture
(°C
)
0
10
20
40
30
5 20 140
UCT UCT UCTLCTLCTLCT
High feed level Low feed level
9
Physical environmentWhen we talk about the physical environment, we refer to external influences on the pig – like flooring, air speed, radiant effects and other animals. Air temperature requirements are modified by these environmental factors. Here are a few examples with reference to pigs:
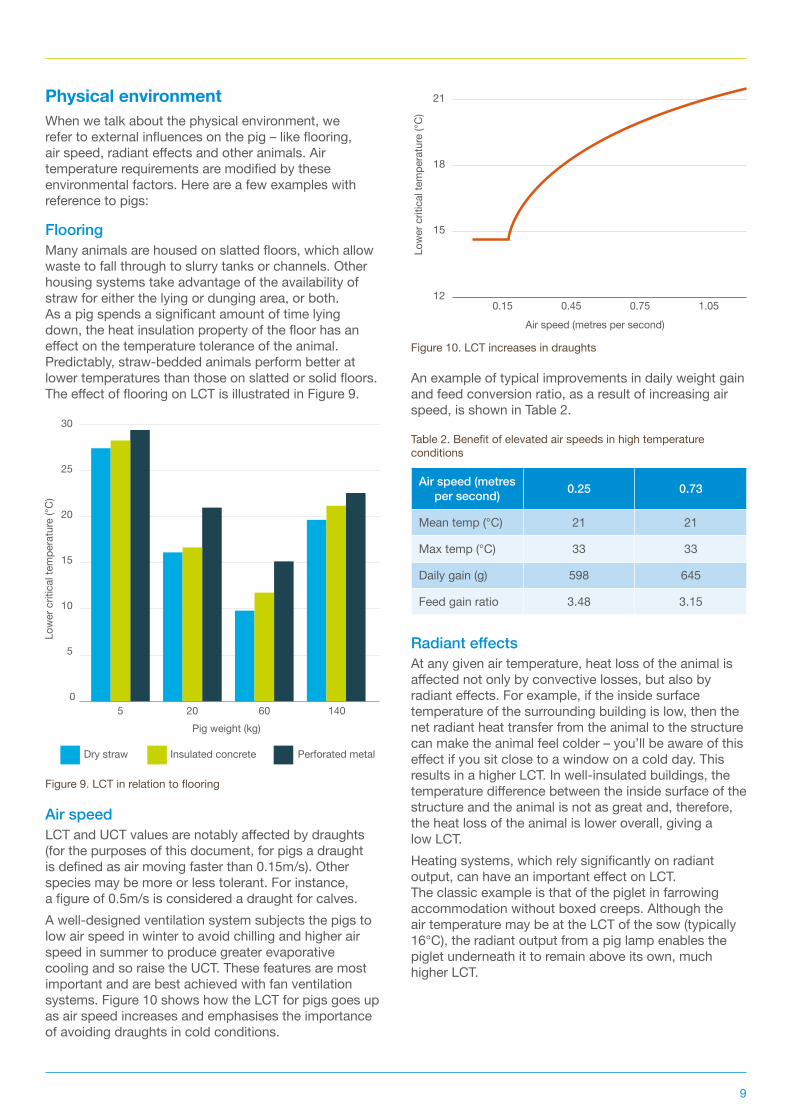
FlooringMany animals are housed on slatted floors, which allow waste to fall through to slurry tanks or channels. Other housing systems take advantage of the availability of straw for either the lying or dunging area, or both. As a pig spends a significant amount of time lying down, the heat insulation property of the floor has an effect on the temperature tolerance of the animal. Predictably, straw-bedded animals perform better at lower temperatures than those on slatted or solid floors. The effect of flooring on LCT is illustrated in Figure 9.
Figure 9. LCT in relation to flooring
Air speedLCT and UCT values are notably affected by draughts (for the purposes of this document, for pigs a draught is defined as air moving faster than 0.15m/s). Other species may be more or less tolerant. For instance, a figure of 0.5m/s is considered a draught for calves. A well-designed ventilation system subjects the pigs to low air speed in winter to avoid chilling and higher air speed in summer to produce greater evaporative cooling and so raise the UCT. These features are most important and are best achieved with fan ventilation systems. Figure 10 shows how the LCT for pigs goes up as air speed increases and emphasises the importance of avoiding draughts in cold conditions.
Figure 10. LCT increases in draughts
An example of typical improvements in daily weight gain and feed conversion ratio, as a result of increasing air speed, is shown in Table 2.
Table 2. Benefit of elevated air speeds in high temperature conditions
Air speed (metres per second) 0.25 0.73
Mean temp (°C) 21 21
Max temp (°C) 33 33
Daily gain (g) 598 645
Feed gain ratio 3.48 3.15
Radiant effectsAt any given air temperature, heat loss of the animal is affected not only by convective losses, but also by radiant effects. For example, if the inside surface temperature of the surrounding building is low, then the net radiant heat transfer from the animal to the structure can make the animal feel colder – you’ll be aware of this effect if you sit close to a window on a cold day. This results in a higher LCT. In well-insulated buildings, the temperature difference between the inside surface of the structure and the animal is not as great and, therefore, the heat loss of the animal is lower overall, giving a low LCT.Heating systems, which rely significantly on radiant output, can have an important effect on LCT. The classic example is that of the piglet in farrowing accommodation without boxed creeps. Although the air temperature may be at the LCT of the sow (typically 16°C), the radiant output from a pig lamp enables the piglet underneath it to remain above its own, much higher LCT.
Pig weight (kg)
Low
er c
ritic
al te
mpe
ratu
re (°
C)
0
5
10
30
25
20
15
5 20 60 140
Dry straw Insulated concrete Perforated metal
Air speed (metres per second)
Low
er c
ritic
al te
mpe
ratu
re (°
C)
12
15
18
21
0.450.15 0.75 1.05
10
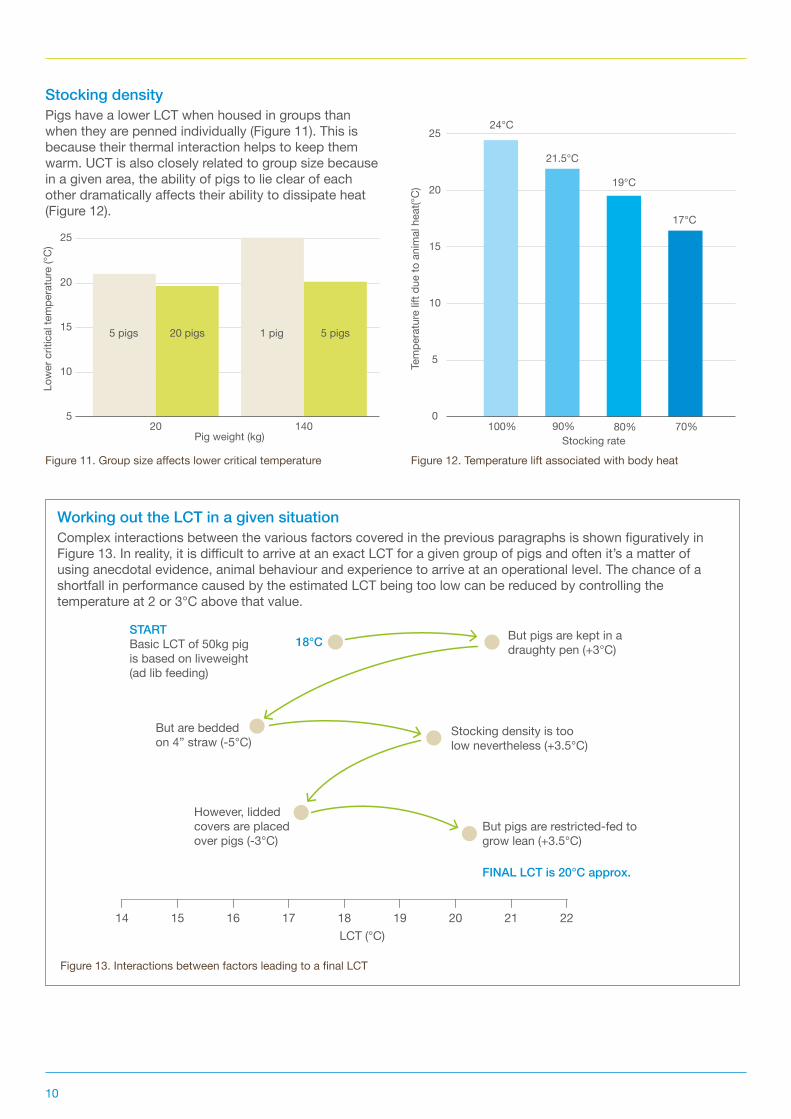
Stocking densityPigs have a lower LCT when housed in groups than when they are penned individually (Figure 11). This is because their thermal interaction helps to keep them warm. UCT is also closely related to group size because in a given area, the ability of pigs to lie clear of each other dramatically affects their ability to dissipate heat (Figure 12).
Figure 12. Temperature lift associated with body heat
Figure 13. Interactions between factors leading to a final LCT
Stocking rate
17°C
19°C
21.5°C
24°C
70%80%90%100%Te
mpe
ratu
re li
ft du
e to
ani
mal
hea
t(°C
)0
5
10
25
20
15
Figure 11. Group size affects lower critical temperature
Working out the LCT in a given situationComplex interactions between the various factors covered in the previous paragraphs is shown figuratively in Figure 13. In reality, it is difficult to arrive at an exact LCT for a given group of pigs and often it’s a matter of using anecdotal evidence, animal behaviour and experience to arrive at an operational level. The chance of a shortfall in performance caused by the estimated LCT being too low can be reduced by controlling the temperature at 2 or 3°C above that value.
Pig weight (kg)
5 pigs 20 pigs 1 pig 5 pigs
Low
er c
ritic
al te
mpe
ratu
re (°
C)
20 1405
10
25
20
15
STARTBasic LCT of 50kg pigis based on liveweight (ad lib feeding)
But pigs are kept in a draughty pen (+3°C)18°C
But are beddedon 4” straw (-5°C)
LCT (°C)
Stocking density is too low nevertheless (+3.5°C)
However, lidded covers are placed over pigs (-3°C)
But pigs are restricted-fed to grow lean (+3.5°C)
FINAL LCT is 20°C approx.
14 15 16 17 18 19 20 21 22
11
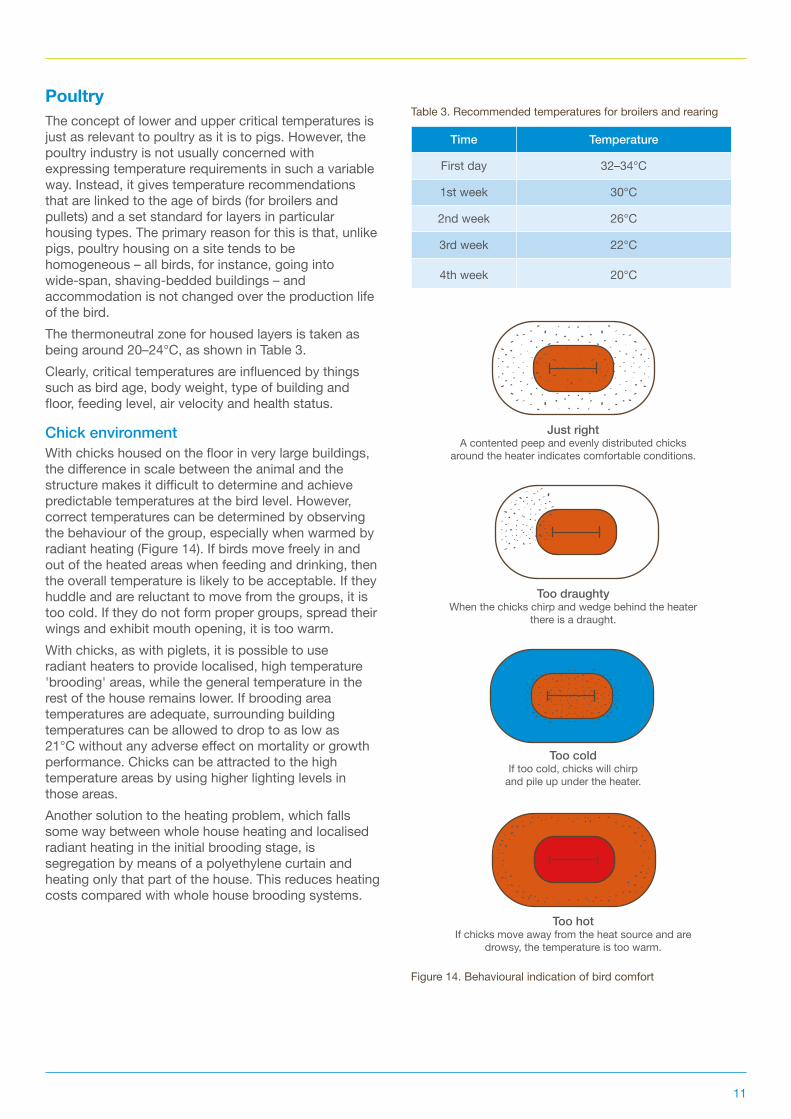
PoultryThe concept of lower and upper critical temperatures is just as relevant to poultry as it is to pigs. However, the poultry industry is not usually concerned with expressing temperature requirements in such a variable way. Instead, it gives temperature recommendations that are linked to the age of birds (for broilers and pullets) and a set standard for layers in particular housing types. The primary reason for this is that, unlike pigs, poultry housing on a site tends to be homogeneous – all birds, for instance, going into wide-span, shaving-bedded buildings – and accommodation is not changed over the production life of the bird.The thermoneutral zone for housed layers is taken as being around 20–24°C, as shown in Table 3.Clearly, critical temperatures are influenced by things such as bird age, body weight, type of building and floor, feeding level, air velocity and health status.
Chick environmentWith chicks housed on the floor in very large buildings, the difference in scale between the animal and the structure makes it difficult to determine and achieve predictable temperatures at the bird level. However, correct temperatures can be determined by observing the behaviour of the group, especially when warmed by radiant heating (Figure 14). If birds move freely in and out of the heated areas when feeding and drinking, then the overall temperature is likely to be acceptable. If they huddle and are reluctant to move from the groups, it is too cold. If they do not form proper groups, spread their wings and exhibit mouth opening, it is too warm.With chicks, as with piglets, it is possible to use radiant heaters to provide localised, high temperature 'brooding' areas, while the general temperature in the rest of the house remains lower. If brooding area temperatures are adequate, surrounding building temperatures can be allowed to drop to as low as 21°C without any adverse effect on mortality or growth performance. Chicks can be attracted to the high temperature areas by using higher lighting levels in those areas.Another solution to the heating problem, which falls some way between whole house heating and localised radiant heating in the initial brooding stage, is segregation by means of a polyethylene curtain and heating only that part of the house. This reduces heating costs compared with whole house brooding systems.
Time Temperature
First day 32–34°C
1st week 30°C
2nd week 26°C
3rd week 22°C
4th week 20°C
Table 3. Recommended temperatures for broilers and rearing
Figure 14. Behavioural indication of bird comfort
Just rightA contented peep and evenly distributed chicks
around the heater indicates comfortable conditions.
Too draughtyWhen the chicks chirp and wedge behind the heater
there is a draught.
Too coldIf too cold, chicks will chirp
and pile up under the heater.
Too hotIf chicks move away from the heat source and are
drowsy, the temperature is too warm.
12
Gaseous pollutantsIn all livestock buildings, a base level of ‘fresh air’ ventilation is required to limit the build-up of gaseous pollutants and to maintain animal and stockperson health and performance. The major pollutants, which must be limited, are:
Carbon dioxideFarm animals, in common with human beings, expel CO2 from their lungs and high concentrations are known to affect performance. CO2 levels are often cited as being the factor which limits how low ventilation rates can be taken and a value of 0.3 per cent has been used to determine the minimum ventilation rate recommended for pigs.Ammonia (NH3)Ammonia is given off by the excreta of animals and can be a problem, especially with poultry or in systems based on slurry non-straw bedded. The concentrations of ammonia are generally higher in deep-pit slurry systems with slats and mechanical ventilation than in other types of pig housing.
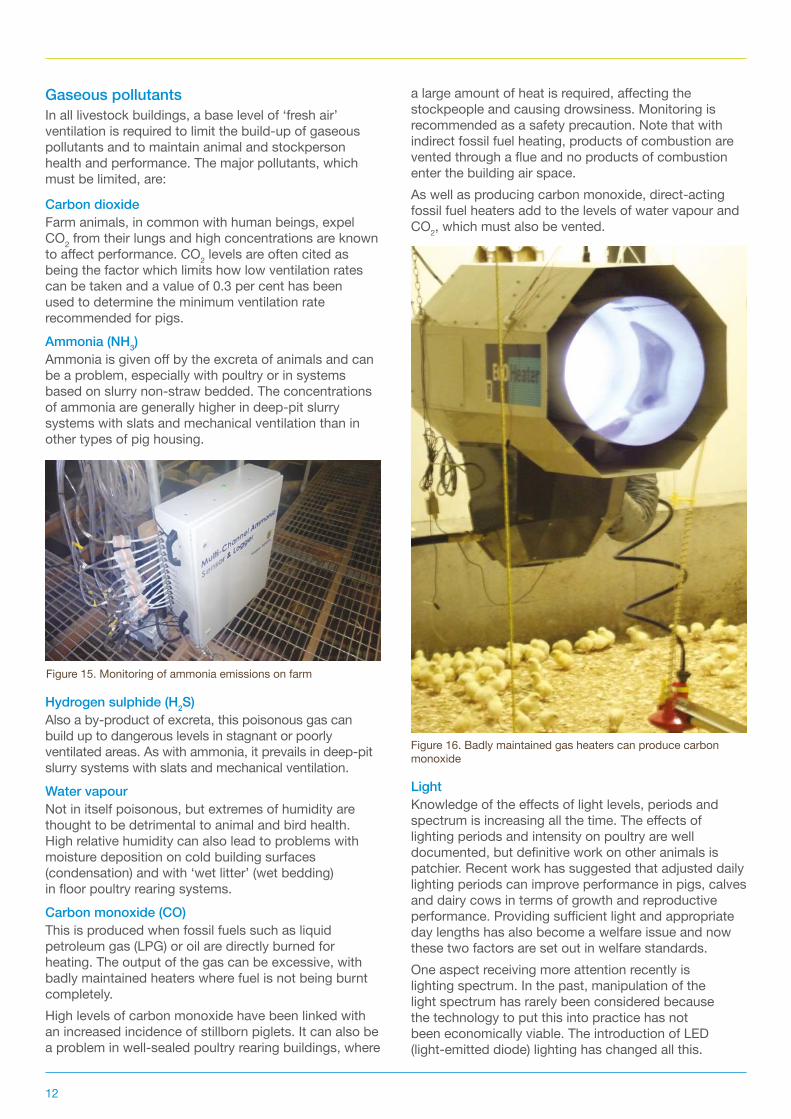
Hydrogen sulphide (H2S)Also a by-product of excreta, this poisonous gas can build up to dangerous levels in stagnant or poorly ventilated areas. As with ammonia, it prevails in deep-pit slurry systems with slats and mechanical ventilation.Water vapourNot in itself poisonous, but extremes of humidity are thought to be detrimental to animal and bird health. High relative humidity can also lead to problems with moisture deposition on cold building surfaces (condensation) and with ‘wet litter’ (wet bedding) in floor poultry rearing systems.Carbon monoxide (CO)This is produced when fossil fuels such as liquid petroleum gas (LPG) or oil are directly burned for heating. The output of the gas can be excessive, with badly maintained heaters where fuel is not being burnt completely. High levels of carbon monoxide have been linked with an increased incidence of stillborn piglets. It can also be a problem in well-sealed poultry rearing buildings, where
a large amount of heat is required, affecting the stockpeople and causing drowsiness. Monitoring is recommended as a safety precaution. Note that with indirect fossil fuel heating, products of combustion are vented through a flue and no products of combustion enter the building air space.As well as producing carbon monoxide, direct-acting fossil fuel heaters add to the levels of water vapour and CO2, which must also be vented.
LightKnowledge of the effects of light levels, periods and spectrum is increasing all the time. The effects of lighting periods and intensity on poultry are well documented, but definitive work on other animals is patchier. Recent work has suggested that adjusted daily lighting periods can improve performance in pigs, calves and dairy cows in terms of growth and reproductive performance. Providing sufficient light and appropriate day lengths has also become a welfare issue and now these two factors are set out in welfare standards.One aspect receiving more attention recently is lighting spectrum. In the past, manipulation of the light spectrum has rarely been considered because the technology to put this into practice has not been economically viable. The introduction of LED (light-emitted diode) lighting has changed all this.
Figure 15. Monitoring of ammonia emissions on farm
Figure 16. Badly maintained gas heaters can produce carbon monoxide
13
Much research is still needed to determine its most useful properties, but the technological potential now exists to allow lighting spectrum to be used in much more sophisticated way.
Behavioural issues and environmentEnvironmental and behavioural interactions are important and can lead to a number of desirable or undesirable outcomes, depending on how they are manipulated. This is best illustrated by several examples:
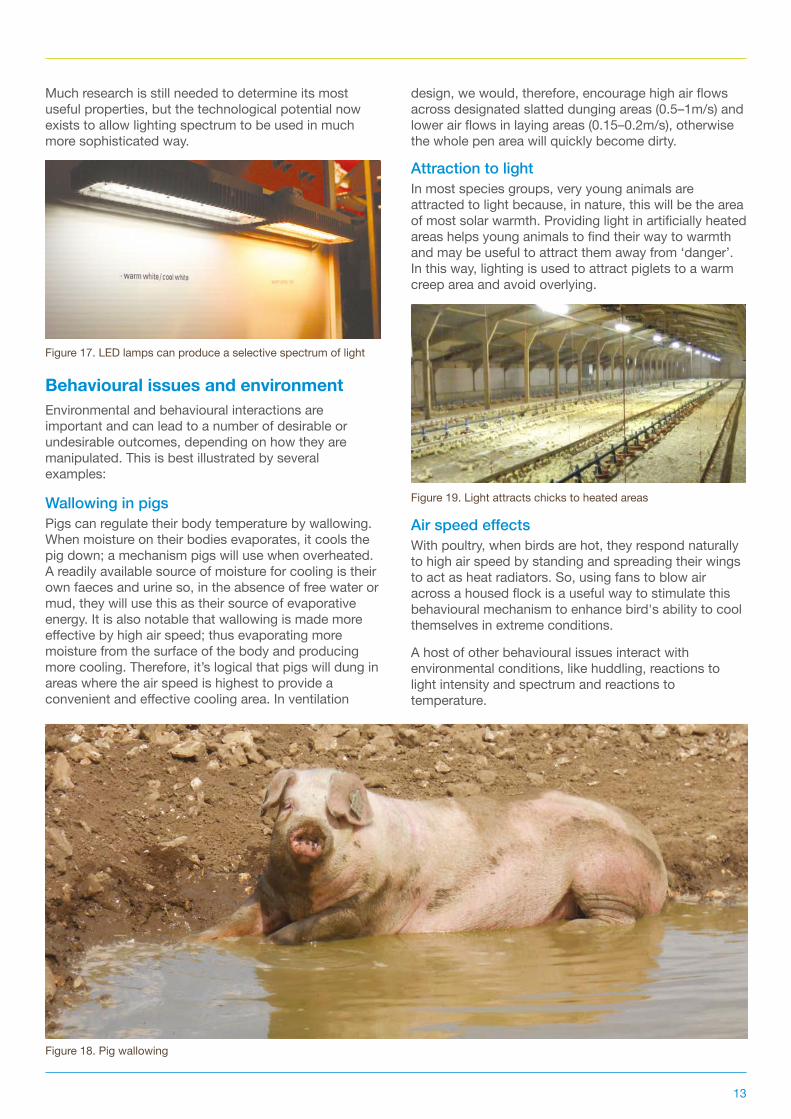
Wallowing in pigsPigs can regulate their body temperature by wallowing. When moisture on their bodies evaporates, it cools the pig down; a mechanism pigs will use when overheated. A readily available source of moisture for cooling is their own faeces and urine so, in the absence of free water or mud, they will use this as their source of evaporative energy. It is also notable that wallowing is made more effective by high air speed; thus evaporating more moisture from the surface of the body and producing more cooling. Therefore, it’s logical that pigs will dung in areas where the air speed is highest to provide a convenient and effective cooling area. In ventilation
design, we would, therefore, encourage high air flows across designated slatted dunging areas (0.5–1m/s) and lower air flows in laying areas (0.15–0.2m/s), otherwise the whole pen area will quickly become dirty.
Attraction to lightIn most species groups, very young animals are attracted to light because, in nature, this will be the area of most solar warmth. Providing light in artificially heated areas helps young animals to find their way to warmth and may be useful to attract them away from ‘danger’. In this way, lighting is used to attract piglets to a warm creep area and avoid overlying.
Air speed effectsWith poultry, when birds are hot, they respond naturally to high air speed by standing and spreading their wings to act as heat radiators. So, using fans to blow air across a housed flock is a useful way to stimulate this behavioural mechanism to enhance bird's ability to cool themselves in extreme conditions.
A host of other behavioural issues interact with environmental conditions, like huddling, reactions to light intensity and spectrum and reactions to temperature.
Figure 19. Light attracts chicks to heated areas
Figure 18. Pig wallowing
Figure 17. LED lamps can produce a selective spectrum of light
14
Primary purposes of ventilation airVentilation systems for non-ruminant livestock houses should be able to satisfy the following major objectives:
• Temperature control – In temperate conditions, provide variable air throughput to control the house temperature to a prescribed level
• Temperature limitation – In summer conditions, provide adequate air throughput to limit the building temperature to between 3°C and 4°C above the outside temperature
• Increase upper critical temperature – In very hot conditions, provide high air speeds over the stock to increase animals' upper threshold of temperature tolerance (UCT)
• Limit air pollutants and build-up of high humidity – In cold conditions, provide enough ventilation to suppress the build-up of polluted, stale or humid air, while maintaining desirable air flow without draughts on the animals and at a rate that minimises the use of heat
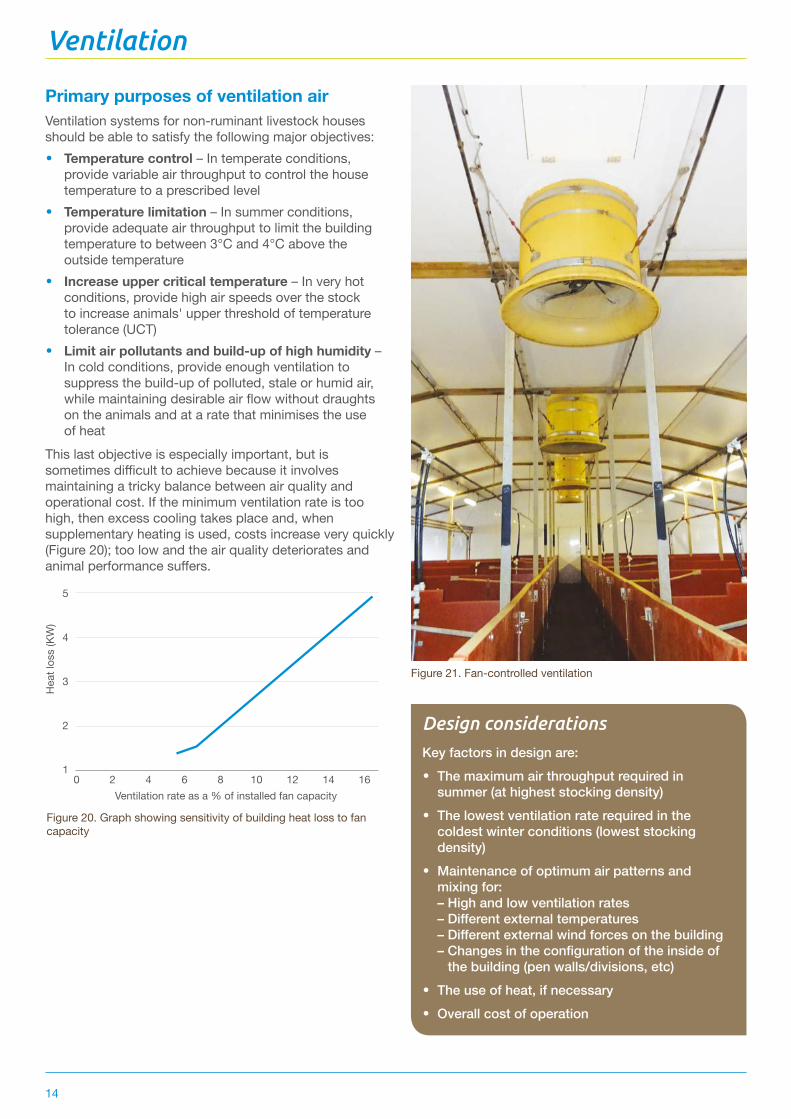
This last objective is especially important, but is sometimes difficult to achieve because it involves maintaining a tricky balance between air quality and operational cost. If the minimum ventilation rate is too high, then excess cooling takes place and, when supplementary heating is used, costs increase very quickly (Figure 20); too low and the air quality deteriorates and animal performance suffers.
Figure 20. Graph showing sensitivity of building heat loss to fan capacity
Figure 21. Fan-controlled ventilation
Ventilation
Design considerationsKey factors in design are:
•The maximum air throughput required in summer (at highest stocking density)
•The lowest ventilation rate required in the coldest winter conditions (lowest stocking density)
• Maintenance of optimum air patterns and mixing for: – High and low ventilation rates – Different external temperatures – Different external wind forces on the building – Changes in the configuration of the inside of
the building (pen walls/divisions, etc)
•The use of heat, if necessary
•Overall cost of operation
Ventilation rate as a % of installed fan capacity
Hea
t los
s (K
W)
01
2
3
6
5
4
42 6 8 10 12 14 16
15
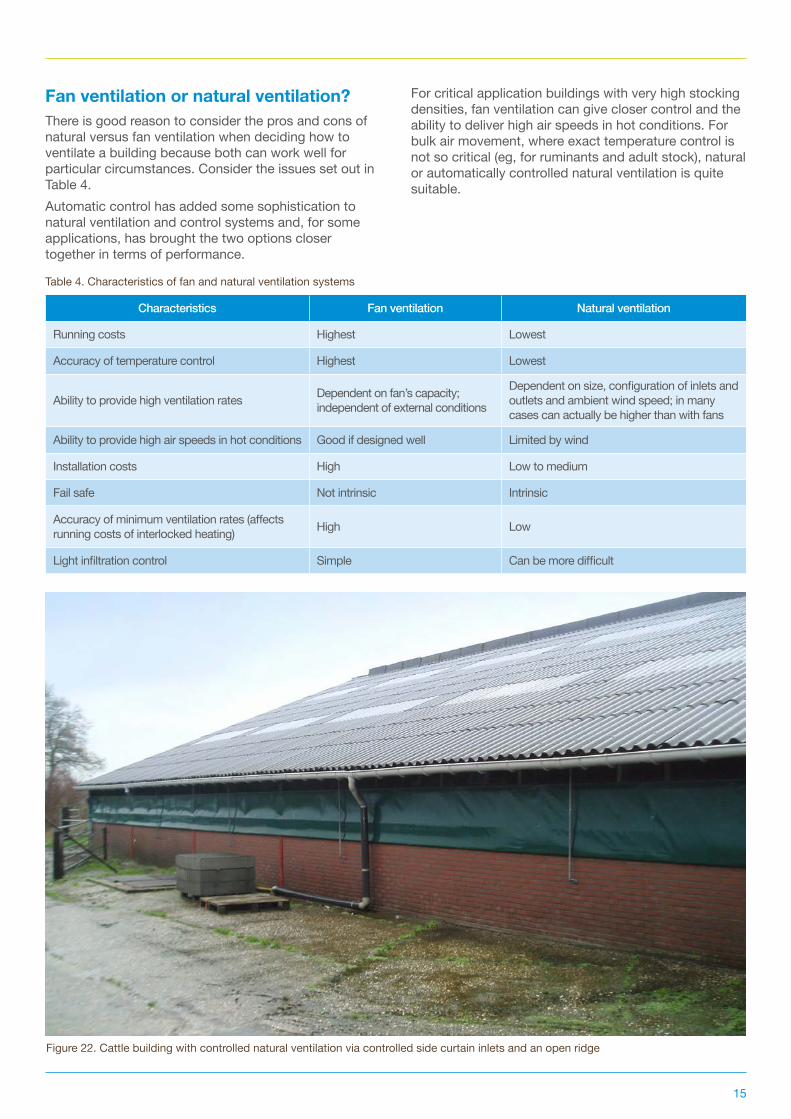
Fan ventilation or natural ventilation?There is good reason to consider the pros and cons of natural versus fan ventilation when deciding how to ventilate a building because both can work well for particular circumstances. Consider the issues set out in Table 4.Automatic control has added some sophistication to natural ventilation and control systems and, for some applications, has brought the two options closer together in terms of performance.
Table 4. Characteristics of fan and natural ventilation systems
Characteristics Fan ventilation Natural ventilation
Running costs Highest Lowest
Accuracy of temperature control Highest Lowest
Ability to provide high ventilation rates Dependent on fan’s capacity; independent of external conditions
Dependent on size, configuration of inlets and outlets and ambient wind speed; in many cases can actually be higher than with fans
Ability to provide high air speeds in hot conditions Good if designed well Limited by wind
Installation costs High Low to medium
Fail safe Not intrinsic Intrinsic
Accuracy of minimum ventilation rates (affects running costs of interlocked heating) High Low
Light infiltration control Simple Can be more difficult
For critical application buildings with very high stocking densities, fan ventilation can give closer control and the ability to deliver high air speeds in hot conditions. For bulk air movement, where exact temperature control is not so critical (eg, for ruminants and adult stock), natural or automatically controlled natural ventilation is quite suitable.
Figure 22. Cattle building with controlled natural ventilation via controlled side curtain inlets and an open ridge
16
Components of ventilation
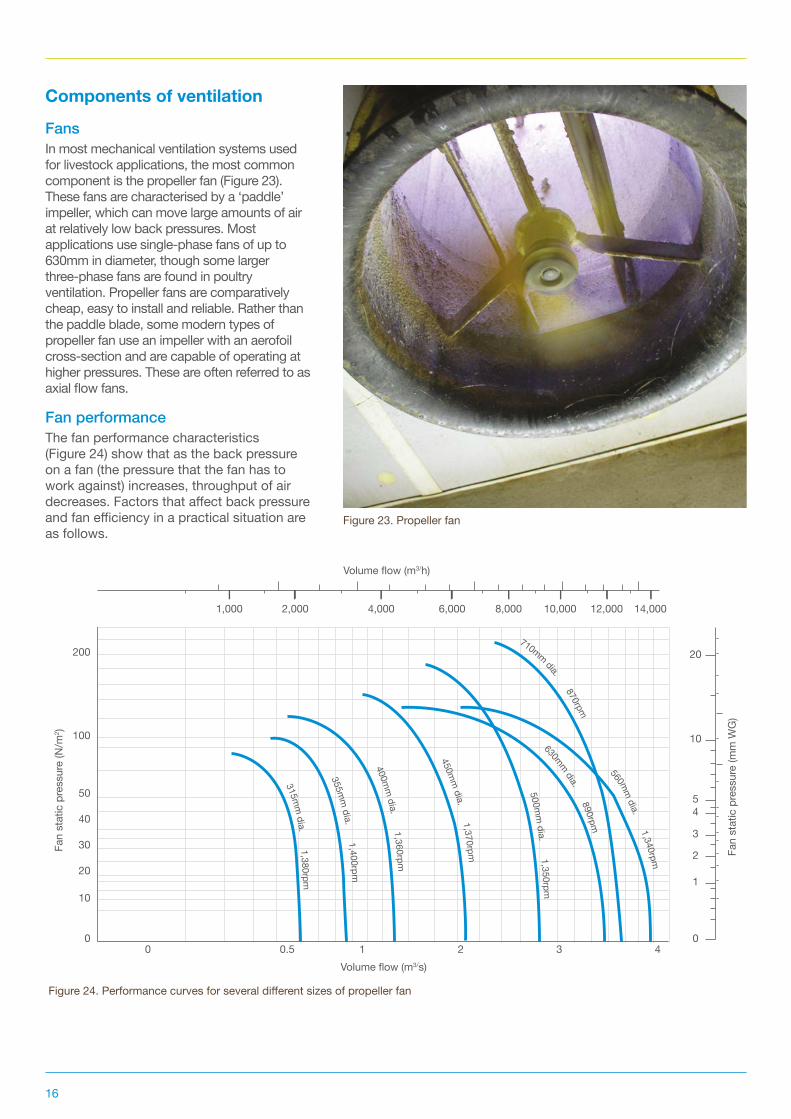
FansIn most mechanical ventilation systems used for livestock applications, the most common component is the propeller fan (Figure 23). These fans are characterised by a ‘paddle’ impeller, which can move large amounts of air at relatively low back pressures. Most applications use single-phase fans of up to 630mm in diameter, though some larger three-phase fans are found in poultry ventilation. Propeller fans are comparatively cheap, easy to install and reliable. Rather than the paddle blade, some modern types of propeller fan use an impeller with an aerofoil cross-section and are capable of operating at higher pressures. These are often referred to as axial flow fans.
Fan performanceThe fan performance characteristics (Figure 24) show that as the back pressure on a fan (the pressure that the fan has to work against) increases, throughput of air decreases. Factors that affect back pressure and fan efficiency in a practical situation are as follows.
Figure 23. Propeller fan
Figure 24. Performance curves for several different sizes of propeller fan
Volume flow (m3/s)
Volume flow (m3/h)
Fan
stat
ic p
ress
ure
(N/m
2 )
Fan
stat
ic p
ress
ure
(mm
WG
)
0 0
1
2
3
45
10
20
10
20
30
40
50
100
200
0 0.5 1 2 3
1,000 2,000 4,000 6,000 8,000 10,000 12,000 14,000
4
315mm
dia. 1,380rpm
355mm
dia. 1,400rp m
400mm
dia. 1,360rpm
450mm
dia. 1,370rpm
500mm
dia. 1,350rpm
630mm dia. 890rpm
560mm
dia. 1,340rpm
710mm dia. 870rpm
17
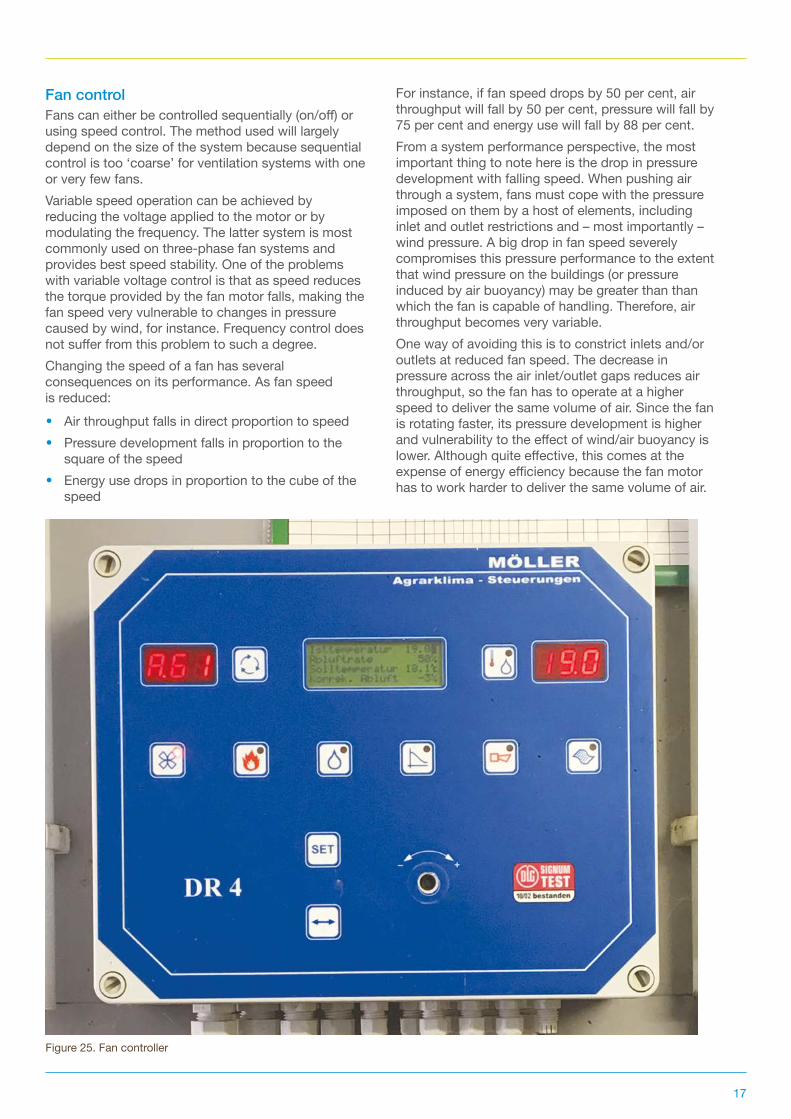
Fan controlFans can either be controlled sequentially (on/off) or using speed control. The method used will largely depend on the size of the system because sequential control is too ‘coarse’ for ventilation systems with one or very few fans. Variable speed operation can be achieved by reducing the voltage applied to the motor or by modulating the frequency. The latter system is most commonly used on three-phase fan systems and provides best speed stability. One of the problems with variable voltage control is that as speed reduces the torque provided by the fan motor falls, making the fan speed very vulnerable to changes in pressure caused by wind, for instance. Frequency control does not suffer from this problem to such a degree.Changing the speed of a fan has several consequences on its performance. As fan speed is reduced:
• Air throughput falls in direct proportion to speed
• Pressure development falls in proportion to the square of the speed
• Energy use drops in proportion to the cube of the speed
For instance, if fan speed drops by 50 per cent, air throughput will fall by 50 per cent, pressure will fall by 75 per cent and energy use will fall by 88 per cent. From a system performance perspective, the most important thing to note here is the drop in pressure development with falling speed. When pushing air through a system, fans must cope with the pressure imposed on them by a host of elements, including inlet and outlet restrictions and – most importantly – wind pressure. A big drop in fan speed severely compromises this pressure performance to the extent that wind pressure on the buildings (or pressure induced by air buoyancy) may be greater than than which the fan is capable of handling. Therefore, air throughput becomes very variable. One way of avoiding this is to constrict inlets and/or outlets at reduced fan speed. The decrease in pressure across the air inlet/outlet gaps reduces air throughput, so the fan has to operate at a higher speed to deliver the same volume of air. Since the fan is rotating faster, its pressure development is higher and vulnerability to the effect of wind/air buoyancy is lower. Although quite effective, this comes at the expense of energy efficiency because the fan motor has to work harder to deliver the same volume of air.
Figure 25. Fan controller
18
Inlets and outletsThe relative position and design of air inlets and outlets is crucial to the success of any ventilation system. What constitutes the air inlet or outlet for a building is determined by the position of the fans in the system. If the fans are blowing air into the building (pressurising), the fan aperture acts as the air inlet. If the fan is pulling air out of the building (or depressurising), the fan aperture is then the air outlet to the building.Whatever the position of the fan, the following two principles, which apply to air inlets and outlets, are fundamental.
OutletsThe designer does not need to be too concerned about draughts when choosing the position or aspect of an air outlet. In a building, air speeds around an outlet reduce in proportion to the cube of the distance from that outlet (Figure 27). Therefore, high air speeds only manifest very near to the outlet aperture. A few feet away, the air speed drops.
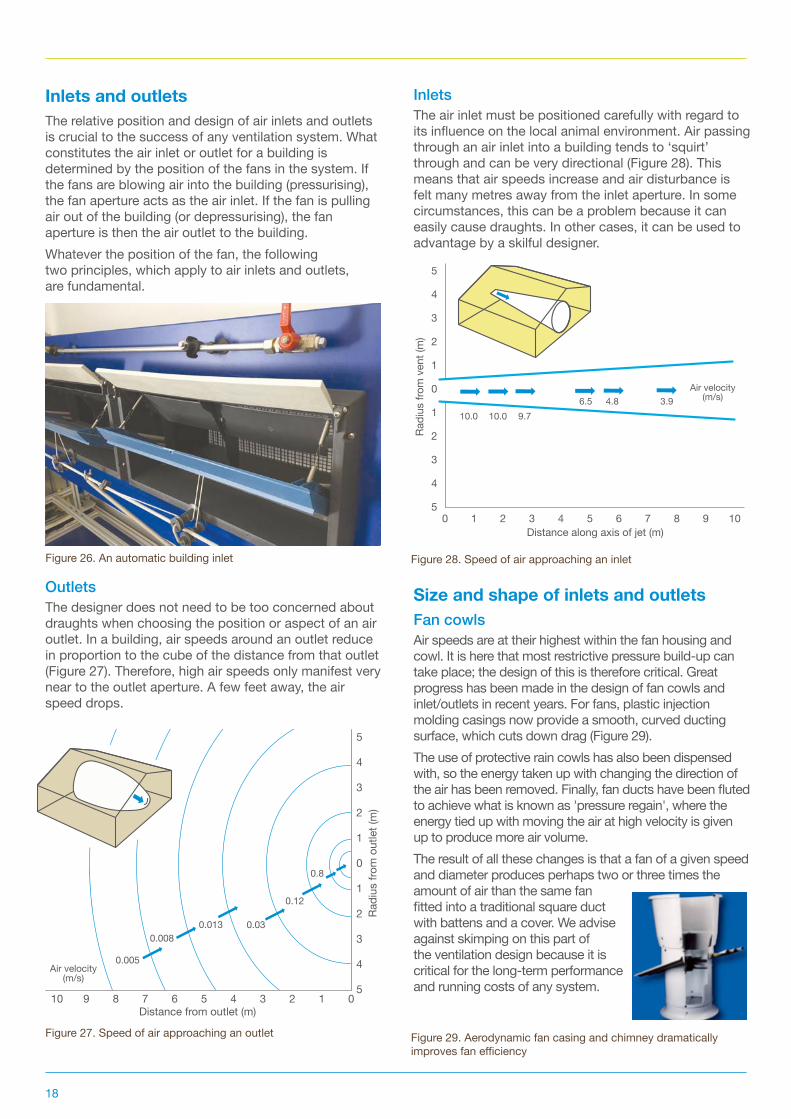
InletsThe air inlet must be positioned carefully with regard to its influence on the local animal environment. Air passing through an air inlet into a building tends to ‘squirt’ through and can be very directional (Figure 28). This means that air speeds increase and air disturbance is felt many metres away from the inlet aperture. In some circumstances, this can be a problem because it can easily cause draughts. In other cases, it can be used to advantage by a skilful designer.
Size and shape of inlets and outletsFan cowlsAir speeds are at their highest within the fan housing and cowl. It is here that most restrictive pressure build-up can take place; the design of this is therefore critical. Great progress has been made in the design of fan cowls and inlet/outlets in recent years. For fans, plastic injection molding casings now provide a smooth, curved ducting surface, which cuts down drag (Figure 29).The use of protective rain cowls has also been dispensed with, so the energy taken up with changing the direction of the air has been removed. Finally, fan ducts have been fluted to achieve what is known as 'pressure regain', where the energy tied up with moving the air at high velocity is given up to produce more air volume. The result of all these changes is that a fan of a given speed and diameter produces perhaps two or three times the amount of air than the same fan fitted into a traditional square duct with battens and a cover. We advise against skimping on this part of the ventilation design because it is critical for the long-term performance and running costs of any system.
Figure 28. Speed of air approaching an inletFigure 26. An automatic building inlet
Figure 29. Aerodynamic fan casing and chimney dramatically improves fan efficiency
Figure 27. Speed of air approaching an outlet
Distance from outlet (m)
Air velocity (m/s)
0.005
0.0080.013 0.03
0.12
0.8
Radi
us fr
om o
utle
t (m
)
0123456789105
4
3
2
1
0
1
2
3
4
5
Air velocity (m/s)
10.0 10.0 9.76.5 4.8 3.9
Distance along axis of jet (m)
Radi
us fr
om v
ent (
m)
0 1 2 3 4 5 6 7 8 9 105
4
3
2
1
0
1
2
3
4
5
19
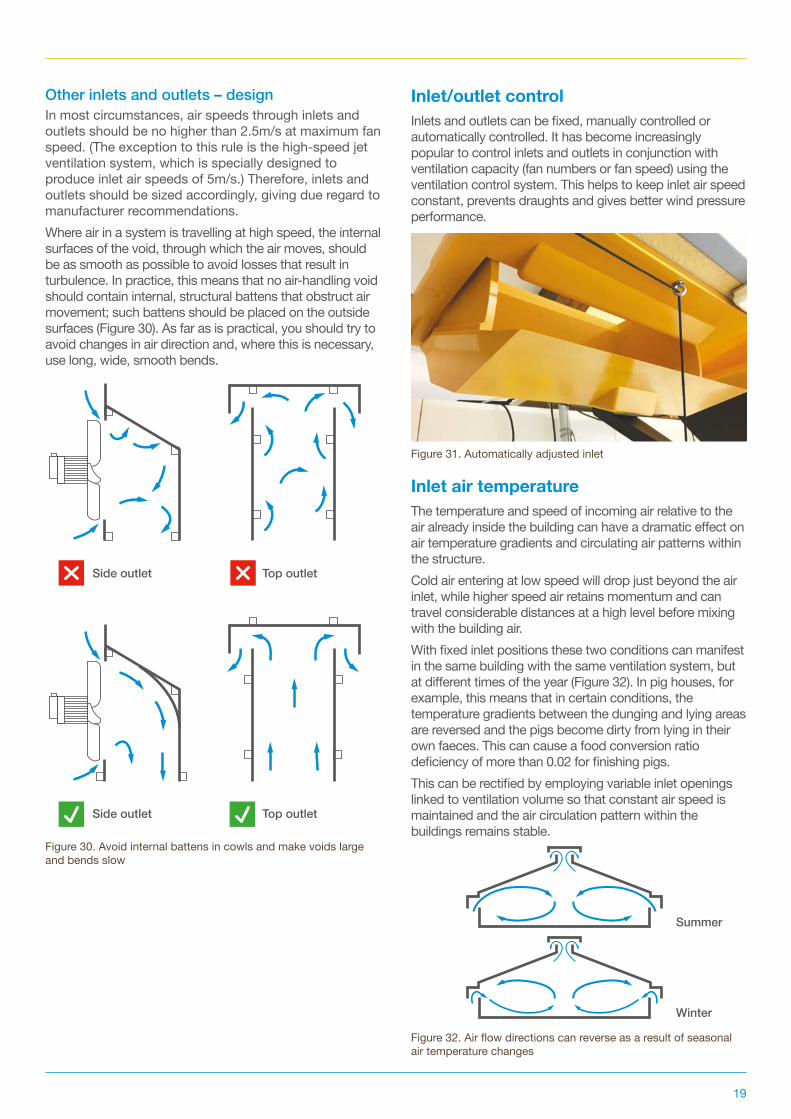
Other inlets and outlets – designIn most circumstances, air speeds through inlets and outlets should be no higher than 2.5m/s at maximum fan speed. (The exception to this rule is the high-speed jet ventilation system, which is specially designed to produce inlet air speeds of 5m/s.) Therefore, inlets and outlets should be sized accordingly, giving due regard to manufacturer recommendations. Where air in a system is travelling at high speed, the internal surfaces of the void, through which the air moves, should be as smooth as possible to avoid losses that result in turbulence. In practice, this means that no air-handling void should contain internal, structural battens that obstruct air movement; such battens should be placed on the outside surfaces (Figure 30). As far as is practical, you should try to avoid changes in air direction and, where this is necessary, use long, wide, smooth bends.
Inlet/outlet controlInlets and outlets can be fixed, manually controlled or automatically controlled. It has become increasingly popular to control inlets and outlets in conjunction with ventilation capacity (fan numbers or fan speed) using the ventilation control system. This helps to keep inlet air speed constant, prevents draughts and gives better wind pressure performance.
Inlet air temperatureThe temperature and speed of incoming air relative to the air already inside the building can have a dramatic effect on air temperature gradients and circulating air patterns within the structure. Cold air entering at low speed will drop just beyond the air inlet, while higher speed air retains momentum and can travel considerable distances at a high level before mixing with the building air. With fixed inlet positions these two conditions can manifest in the same building with the same ventilation system, but at different times of the year (Figure 32). In pig houses, for example, this means that in certain conditions, the temperature gradients between the dunging and lying areas are reversed and the pigs become dirty from lying in their own faeces. This can cause a food conversion ratio deficiency of more than 0.02 for finishing pigs. This can be rectified by employing variable inlet openings linked to ventilation volume so that constant air speed is maintained and the air circulation pattern within the buildings remains stable.
Figure 30. Avoid internal battens in cowls and make voids large and bends slow
Figure 31. Automatically adjusted inlet
Side outlet Top outlet
Side outlet Top outlet
Figure 32. Air flow directions can reverse as a result of seasonal air temperature changes
Summer
Winter
20
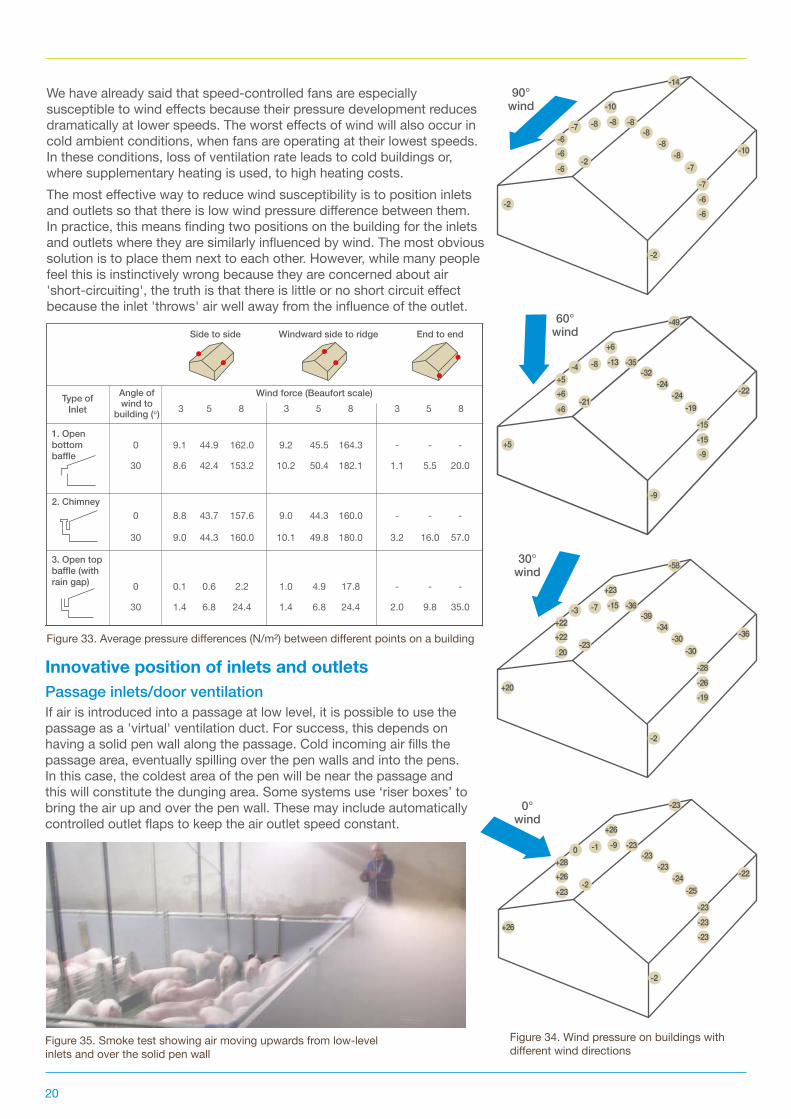
We have already said that speed-controlled fans are especially susceptible to wind effects because their pressure development reduces dramatically at lower speeds. The worst effects of wind will also occur in cold ambient conditions, when fans are operating at their lowest speeds. In these conditions, loss of ventilation rate leads to cold buildings or, where supplementary heating is used, to high heating costs.The most effective way to reduce wind susceptibility is to position inlets and outlets so that there is low wind pressure difference between them. In practice, this means finding two positions on the building for the inlets and outlets where they are similarly influenced by wind. The most obvious solution is to place them next to each other. However, while many people feel this is instinctively wrong because they are concerned about air 'short-circuiting', the truth is that there is little or no short circuit effect because the inlet 'throws' air well away from the influence of the outlet.
Wind force (Beaufort scale)Angle of wind to
building (°) Type of
Inlet
1. Open bottom baffle
2. Chimney
3. Open top baffle (with rain gap)
Side to side Windward side to ridge End to end
0 9.1 44.9 162.0 9.2 45.5 164.3 - - -
3 5 8 3 5 8 3 5 8
30 8.6 42.4 153.2 10.2 50.4 182.1 1.1 5.5 20.0
0 8.8 43.7 157.6 9.0 44.3 160.0 - - -
30 9.0 44.3 160.0 10.1 49.8 180.0 3.2 16.0 57.0
0 0.1 0.6 2.2 1.0 4.9 17.8 - - -
30 1.4 6.8 24.4 1.4 6.8 24.4 2.0 9.8 35.0
Figure 33. Average pressure differences (N/m²) between different points on a building
Figure 34. Wind pressure on buildings with different wind directions
Innovative position of inlets and outletsPassage inlets/door ventilationIf air is introduced into a passage at low level, it is possible to use the passage as a 'virtual' ventilation duct. For success, this depends on having a solid pen wall along the passage. Cold incoming air fills the passage area, eventually spilling over the pen walls and into the pens. In this case, the coldest area of the pen will be near the passage and this will constitute the dunging area. Some systems use ‘riser boxes’ to bring the air up and over the pen wall. These may include automatically controlled outlet flaps to keep the air outlet speed constant.
Figure 35. Smoke test showing air moving upwards from low-level inlets and over the solid pen wall
90° wind -10
-8-8-7-6-6-6
-2
-2
-8
-14
-8-8
-8-7
-7-6-6
-2
-10
60° wind
+6-13-8-4
+5+6+6
+5
-21
-35
-49
-32-24
-24-19
-15-15-9
-9
-22
+23-15-7-3
+22+22_20
+20
-23
-36
-58
-39-34
-30-30
-28-26-19
-2
-36
+26-9-10
+28+26+23
+26
-2
-23
-23
-23-23
-24-25
-23-23-23
-2
-22
30° wind
0° wind
21
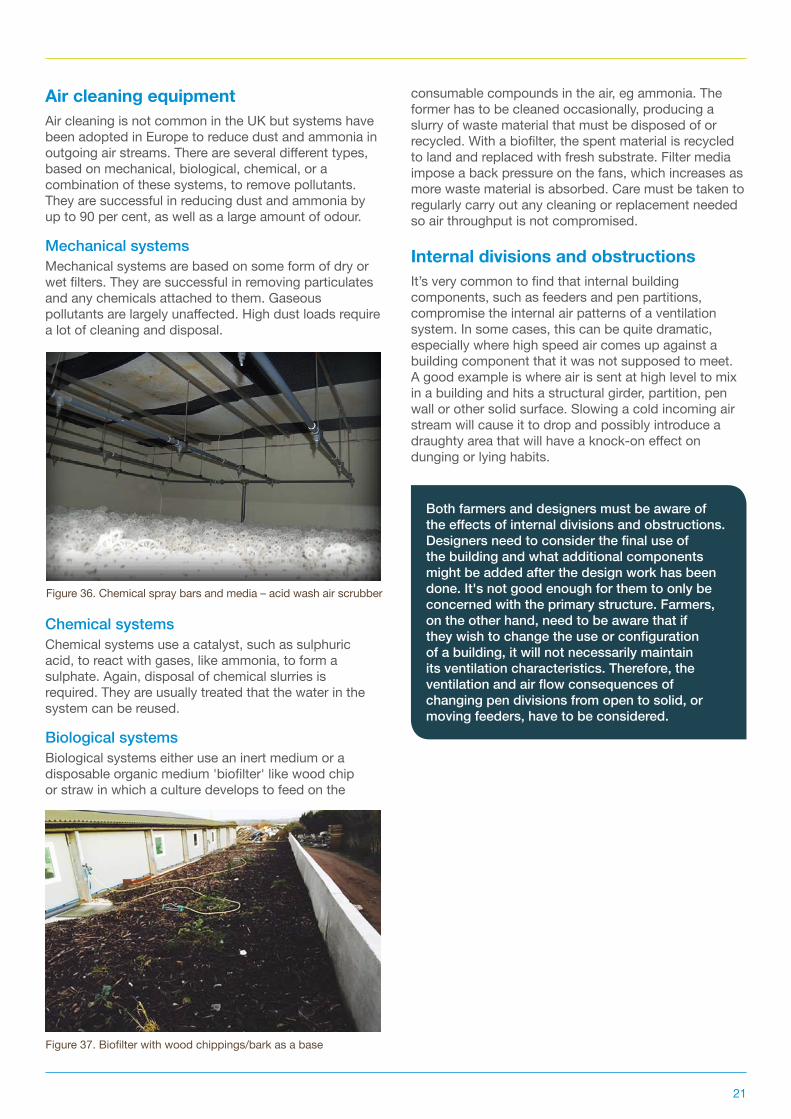
Air cleaning equipmentAir cleaning is not common in the UK but systems have been adopted in Europe to reduce dust and ammonia in outgoing air streams. There are several different types, based on mechanical, biological, chemical, or a combination of these systems, to remove pollutants. They are successful in reducing dust and ammonia by up to 90 per cent, as well as a large amount of odour.
Mechanical systems Mechanical systems are based on some form of dry or wet filters. They are successful in removing particulates and any chemicals attached to them. Gaseous pollutants are largely unaffected. High dust loads require a lot of cleaning and disposal.
Chemical systems Chemical systems use a catalyst, such as sulphuric acid, to react with gases, like ammonia, to form a sulphate. Again, disposal of chemical slurries is required. They are usually treated that the water in the system can be reused.
Biological systems Biological systems either use an inert medium or a disposable organic medium 'biofilter' like wood chip or straw in which a culture develops to feed on the
consumable compounds in the air, eg ammonia. The former has to be cleaned occasionally, producing a slurry of waste material that must be disposed of or recycled. With a biofilter, the spent material is recycled to land and replaced with fresh substrate. Filter media impose a back pressure on the fans, which increases as more waste material is absorbed. Care must be taken to regularly carry out any cleaning or replacement needed so air throughput is not compromised.
Internal divisions and obstructionsIt’s very common to find that internal building components, such as feeders and pen partitions, compromise the internal air patterns of a ventilation system. In some cases, this can be quite dramatic, especially where high speed air comes up against a building component that it was not supposed to meet. A good example is where air is sent at high level to mix in a building and hits a structural girder, partition, pen wall or other solid surface. Slowing a cold incoming air stream will cause it to drop and possibly introduce a draughty area that will have a knock-on effect on dunging or lying habits.
Figure 37. Biofilter with wood chippings/bark as a base
Figure 36. Chemical spray bars and media – acid wash air scrubber
Both farmers and designers must be aware of the effects of internal divisions and obstructions. Designers need to consider the final use of the building and what additional components might be added after the design work has been done. It's not good enough for them to only be concerned with the primary structure. Farmers, on the other hand, need to be aware that if they wish to change the use or configuration of a building, it will not necessarily maintain its ventilation characteristics. Therefore, the ventilation and air flow consequences of changing pen divisions from open to solid, or moving feeders, have to be considered.
22
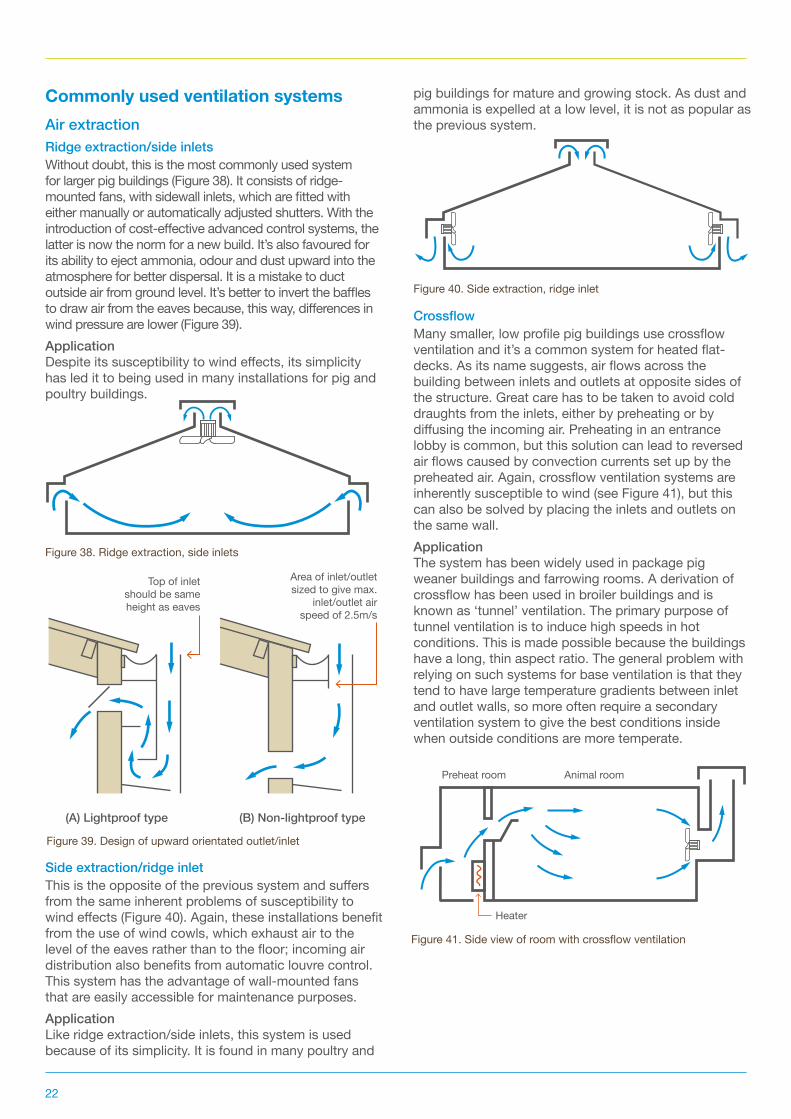
Commonly used ventilation systemsAir extraction Ridge extraction/side inletsWithout doubt, this is the most commonly used system for larger pig buildings (Figure 38). It consists of ridge-mounted fans, with sidewall inlets, which are fitted with either manually or automatically adjusted shutters. With the introduction of cost-effective advanced control systems, the latter is now the norm for a new build. It’s also favoured for its ability to eject ammonia, odour and dust upward into the atmosphere for better dispersal. It is a mistake to duct outside air from ground level. It’s better to invert the baffles to draw air from the eaves because, this way, differences in wind pressure are lower (Figure 39).Application Despite its susceptibility to wind effects, its simplicity has led it to being used in many installations for pig and poultry buildings.
Side extraction/ridge inletThis is the opposite of the previous system and suffers from the same inherent problems of susceptibility to wind effects (Figure 40). Again, these installations benefit from the use of wind cowls, which exhaust air to the level of the eaves rather than to the floor; incoming air distribution also benefits from automatic louvre control. This system has the advantage of wall-mounted fans that are easily accessible for maintenance purposes. ApplicationLike ridge extraction/side inlets, this system is used because of its simplicity. It is found in many poultry and
pig buildings for mature and growing stock. As dust and ammonia is expelled at a low level, it is not as popular as the previous system.
CrossflowMany smaller, low profile pig buildings use crossflow ventilation and it’s a common system for heated flat-decks. As its name suggests, air flows across the building between inlets and outlets at opposite sides of the structure. Great care has to be taken to avoid cold draughts from the inlets, either by preheating or by diffusing the incoming air. Preheating in an entrance lobby is common, but this solution can lead to reversed air flows caused by convection currents set up by the pre heated air. Again, crossflow ventilation systems are inherently susceptible to wind (see Figure 41), but this can also be solved by placing the inlets and outlets on the same wall. ApplicationThe system has been widely used in package pig weaner buildings and farrowing rooms. A derivation of crossflow has been used in broiler buildings and is known as ‘tunnel’ ventilation. The primary purpose of tunnel ventilation is to induce high speeds in hot conditions. This is made possible because the buildings have a long, thin aspect ratio. The general problem with relying on such systems for base ventilation is that they tend to have large temperature gradients between inlet and outlet walls, so more often require a secondary ventilation system to give the best conditions inside when outside conditions are more temperate.
Figure 38. Ridge extraction, side inlets
Figure 40. Side extraction, ridge inlet
Figure 41. Side view of room with crossflow ventilation
Figure 39. Design of upward orientated outlet/inlet
(B) Non-lightproof type(A) Lightproof type
Area of inlet/outletsized to give max.
inlet/outlet airspeed of 2.5m/s
Top of inletshould be same height as eaves
Heater
Preheat room Animal room
23
Figure 41. Side view of room with crossflow ventilationFigure 43. High speed jet outlet
Figure 42. High-speed jet side inlet
Motorised inlet flaps
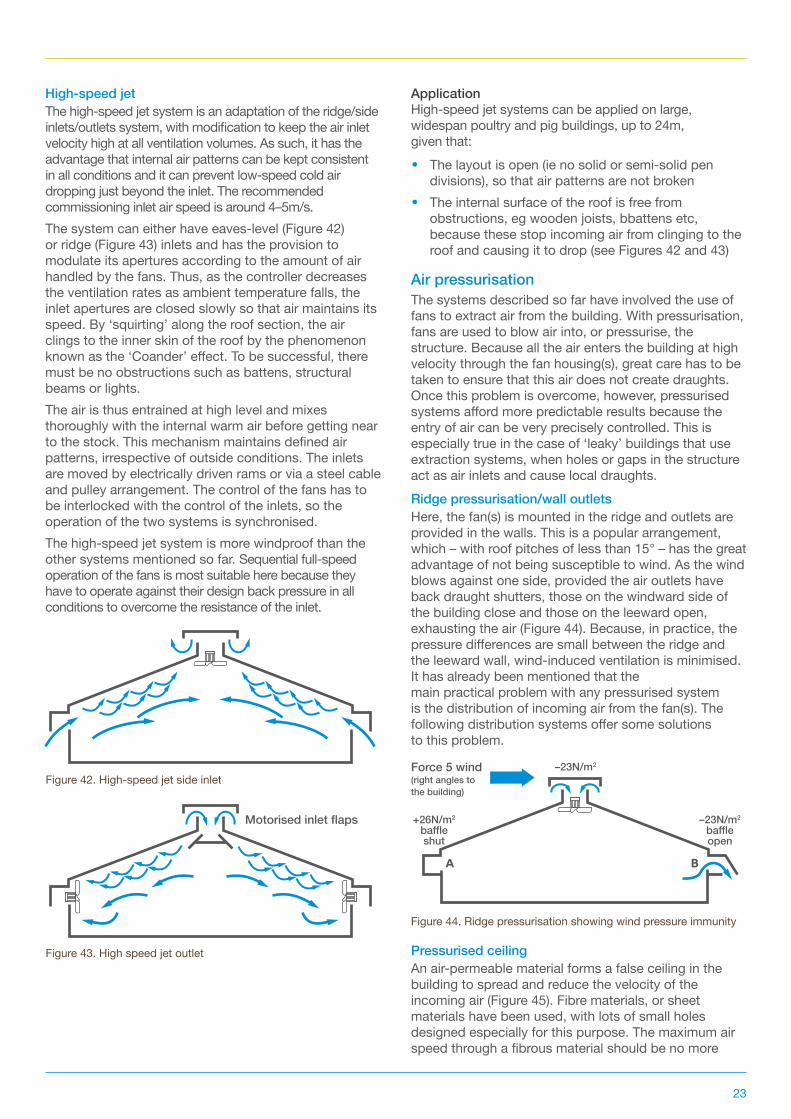
High-speed jetThe high-speed jet system is an adaptation of the ridge/side inlets/outlets system, with modification to keep the air inlet velocity high at all ventilation volumes. As such, it has the advantage that internal air patterns can be kept consistent in all conditions and it can prevent low-speed cold air dropping just beyond the inlet. The recommended commissioning inlet air speed is around 4–5m/s.The system can either have eaves-level (Figure 42) or ridge (Figure 43) inlets and has the provision to modulate its apertures according to the amount of air handled by the fans. Thus, as the controller decreases the ventilation rates as ambient temperature falls, the inlet apertures are closed slowly so that air maintains its speed. By ‘squirting’ along the roof section, the air clings to the inner skin of the roof by the phenomenon known as the ‘Coander’ effect. To be successful, there must be no obstructions such as battens, structural beams or lights. The air is thus entrained at high level and mixes thoroughly with the internal warm air before getting near to the stock. This mechanism maintains defined air patterns, irrespective of outside conditions. The inlets are moved by electrically driven rams or via a steel cable and pulley arrangement. The control of the fans has to be interlocked with the control of the inlets, so the operation of the two systems is synchronised. The high-speed jet system is more windproof than the other systems mentioned so far. Sequential full-speed operation of the fans is most suitable here because they have to operate against their design back pressure in all conditions to overcome the resistance of the inlet.
ApplicationHigh-speed jet systems can be applied on large, widespan poultry and pig buildings, up to 24m, given that:
• The layout is open (ie no solid or semi-solid pen divisions), so that air patterns are not broken
• The internal surface of the roof is free from obstructions, eg wooden joists, bbattens etc, because these stop incoming air from clinging to the roof and causing it to drop (see Figures 42 and 43)
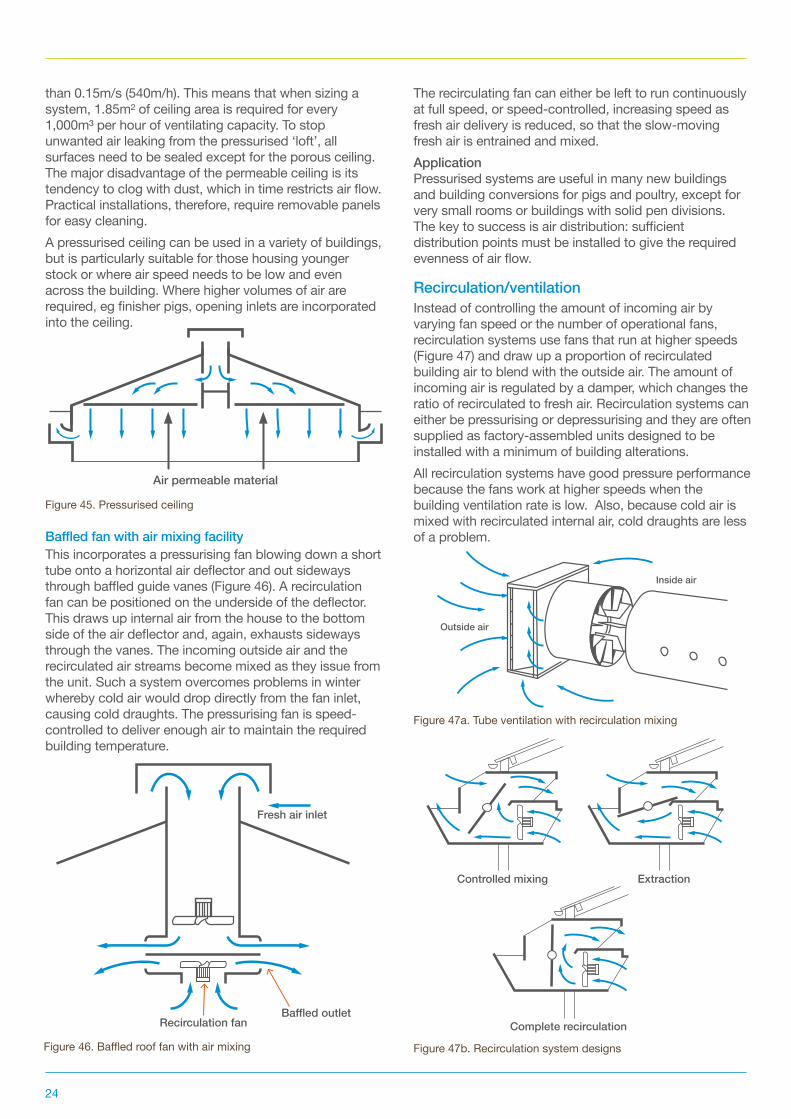
Air pressurisationThe systems described so far have involved the use of fans to extract air from the building. With pressurisation, fans are used to blow air into, or pressurise, the structure. Because all the air enters the building at high velocity through the fan housing(s), great care has to be taken to ensure that this air does not create draughts. Once this problem is overcome, however, pressurised systems afford more predictable results because the entry of air can be very precisely controlled. This is especially true in the case of ‘leaky’ buildings that use extraction systems, when holes or gaps in the structure act as air inlets and cause local draughts.Ridge pressurisation/wall outletsHere, the fan(s) is mounted in the ridge and outlets are provided in the walls. This is a popular arrangement, which – with roof pitches of less than 15° – has the great advantage of not being susceptible to wind. As the wind blows against one side, provided the air outlets have back draught shutters, those on the windward side of the building close and those on the leeward open, exhausting the air (Figure 44). Because, in practice, the pressure differences are small between the ridge and the leeward wall, wind-induced ventilation is minimised. It has already been mentioned that the main practical problem with any pressurised system is the distribution of incoming air from the fan(s). The following distribution systems offer some solutions to this problem.
Pressurised ceilingAn air-permeable material forms a false ceiling in the building to spread and reduce the velocity of the incoming air (Figure 45). Fibre materials, or sheet materials have been used, with lots of small holes designed especially for this purpose. The maximum air speed through a fibrous material should be no more
Figure 44. Ridge pressurisation showing wind pressure immunity
+26N/m2
baffle shut
A B
–23N/m2
baffle open
–23N/m2Force 5 wind(right angles to the building)
24
than 0.15m/s (540m/h). This means that when sizing a system, 1.85m² of ceiling area is required for every 1,000m³ per hour of ventilating capacity. To stop unwanted air leaking from the pressurised ‘loft’, all surfaces need to be sealed except for the porous ceiling. The major disadvantage of the permeable ceiling is its tendency to clog with dust, which in time restricts air flow. Practical installations, therefore, require removable panels for easy cleaning.A pressurised ceiling can be used in a variety of buildings, but is particularly suitable for those housing younger stock or where air speed needs to be low and even across the building. Where higher volumes of air are required, eg finisher pigs, opening inlets are incorporated into the ceiling.
Baffled fan with air mixing facilityThis incorporates a pressurising fan blowing down a short tube onto a horizontal air deflector and out sideways through baffled guide vanes (Figure 46). A recirculation fan can be positioned on the underside of the deflector. This draws up internal air from the house to the bottom side of the air deflector and, again, exhausts sideways through the vanes. The incoming outside air and the recirculated air streams become mixed as they issue from the unit. Such a system overcomes problems in winter whereby cold air would drop directly from the fan inlet, causing cold draughts. The pressurising fan is speed-controlled to deliver enough air to maintain the required building temperature.
The recirculating fan can either be left to run continuously at full speed, or speed-controlled, increasing speed as fresh air delivery is reduced, so that the slow-moving fresh air is entrained and mixed.ApplicationPressurised systems are useful in many new buildings and building conversions for pigs and poultry, except for very small rooms or buildings with solid pen divisions. The key to success is air distribution: sufficient distribution points must be installed to give the required evenness of air flow.
Recirculation/ventilationInstead of controlling the amount of incoming air by varying fan speed or the number of operational fans, recirculation systems use fans that run at higher speeds (Figure 47) and draw up a proportion of recirculated building air to blend with the outside air. The amount of incoming air is regulated by a damper, which changes the ratio of recirculated to fresh air. Recirculation systems can either be pressurising or depressurising and they are often supplied as factory-assembled units designed to be installed with a minimum of building alterations.All recirculation systems have good pressure performance because the fans work at higher speeds when the building ventilation rate is low. Also, because cold air is mixed with recirculated internal air, cold draughts are less of a problem.
Air permeable material
Figure 45. Pressurised ceiling
Figure 46. Baffled roof fan with air mixing
Fresh air inlet
Baffled outletRecirculation fan
Figure 47a. Tube ventilation with recirculation mixing
Figure 47b. Recirculation system designs
Outside air
Inside air
Controlled mixing Extraction
Complete recirculation
25
Lying area Passage
Inlet
Lying area Passage
Unit ventilation recirculation and heat recoveryRecirculation units must handle both cold air from outside and warm inside air for recirculation. Therefore, some proprietary systems are designed to draw in and exhaust air at the same point. Such systems are inherently windproof because there is no wind pressure difference between inlets and outlets; ie, the system is perfectly balanced. They also offer the possibility of using exiting warm air to preheat the incoming cold air stream. Also, they can contain heat exchange coils for supplementary heating systems. This means that proprietary ventilation and heating systems can simply be 'plugged in' to the side of a building.
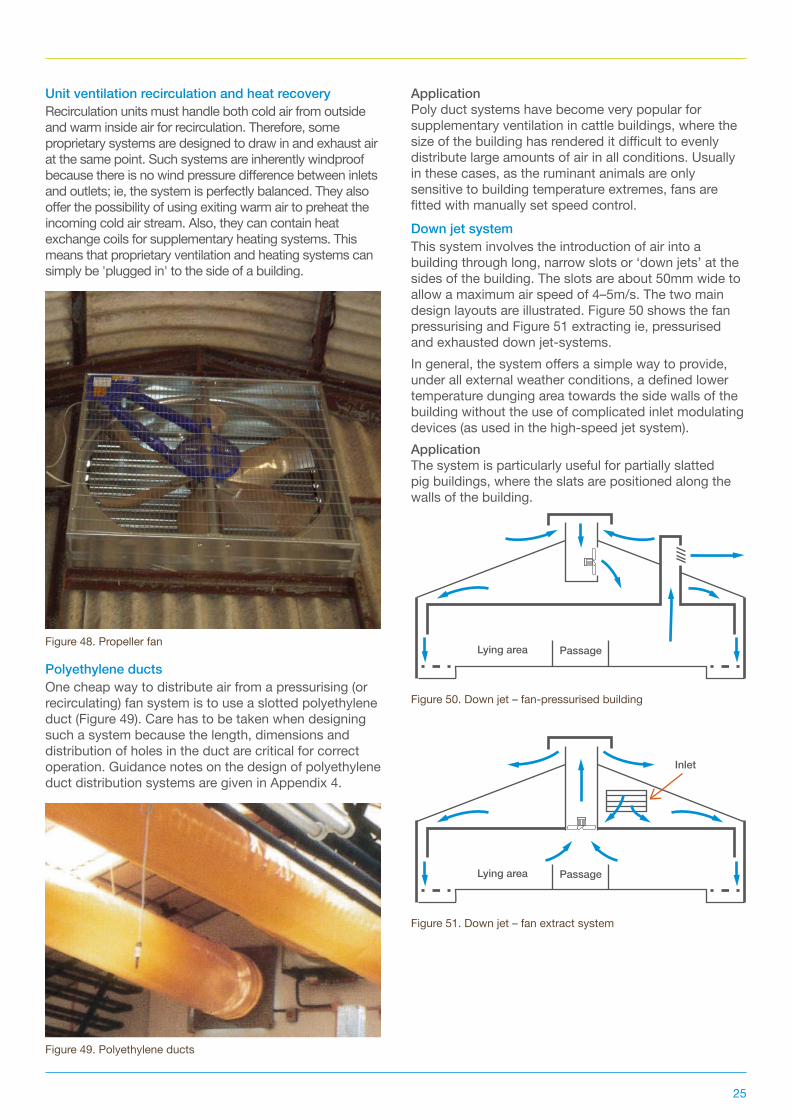
Polyethylene ductsOne cheap way to distribute air from a pressurising (or recirculating) fan system is to use a slotted polyethylene duct (Figure 49). Care has to be taken when designing such a system because the length, dimensions and distribution of holes in the duct are critical for correct operation. Guidance notes on the design of polyethylene duct distribution systems are given in Appendix 4.
ApplicationPoly duct systems have become very popular for supplementary ventilation in cattle buildings, where the size of the building has rendered it difficult to evenly distribute large amounts of air in all conditions. Usually in these cases, as the ruminant animals are only sensitive to building temperature extremes, fans are fitted with manually set speed control.Down jet systemThis system involves the introduction of air into a building through long, narrow slots or ‘down jets’ at the sides of the building. The slots are about 50mm wide to allow a maximum air speed of 4–5m/s. The two main design layouts are illustrated. Figure 50 shows the fan pressurising and Figure 51 extracting ie, pressurised and exhausted down jet-systems. In general, the system offers a simple way to provide, under all external weather conditions, a defined lower temperature dunging area towards the side walls of the building without the use of complicated inlet modulating devices (as used in the high-speed jet system).ApplicationThe system is particularly useful for partially slatted pig buildings, where the slats are positioned along the walls of the building.
Figure 48. Propeller fan
Figure 49. Polyethylene ducts
Figure 51. Down jet – fan extract system
Figure 50. Down jet – fan-pressurised building
26
Natural ventilationNatural ventilation is a cheap, popular way of providing cooling and fresh air for everyday operations. Its major snag is that it is largely driven by wind and external influences and as such can be unpredictable.There are two mechanisms by which natural ventilation works.Wind effectsWind applies different pressure to various parts of a building, depending on its strength and direction. If inlets and outlets are placed in these different pressure regions, this will drive ventilation.Stack effect Uses the natural buoyancy of warm air to drive air movement. So, if outlets are positioned high in a building, warm, lighter air will exit at this point and draw outside air in to displace it a low level. This is exactly how a chimney works.On balance, wind effects can be a much more powerful driver to ventilation than the stack effect, but it is completely dependent on wind pressure so is massively variable.The design trick to achieving good natural ventilation is to have a system that can deliver minimum ventilation rates through the stack effect, but can deliver higher ventilation rates from wind effects.
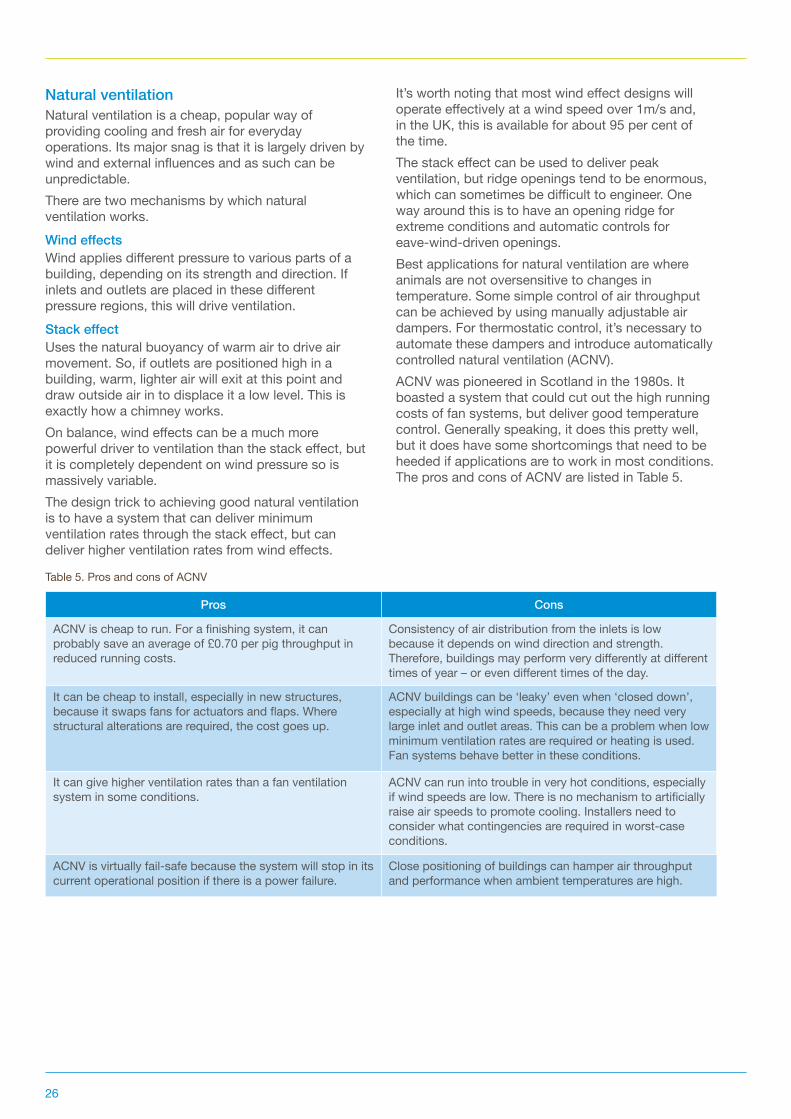
It’s worth noting that most wind effect designs will operate effectively at a wind speed over 1m/s and, in the UK, this is available for about 95 per cent of the time. The stack effect can be used to deliver peak ventilation, but ridge openings tend to be enormous, which can sometimes be difficult to engineer. One way around this is to have an opening ridge for extreme conditions and automatic controls for eave-wind-driven openings.Best applications for natural ventilation are where animals are not oversensitive to changes in temperature. Some simple control of air throughput can be achieved by using manually adjustable air dampers. For thermostatic control, it’s necessary to automate these dampers and introduce automatically controlled natural ventilation (ACNV).ACNV was pioneered in Scotland in the 1980s. It boasted a system that could cut out the high running costs of fan systems, but deliver good temperature control. Generally speaking, it does this pretty well, but it does have some shortcomings that need to be heeded if applications are to work in most conditions. The pros and cons of ACNV are listed in Table 5.
Pros Cons
ACNV is cheap to run. For a finishing system, it can probably save an average of £0.70 per pig throughput in reduced running costs.
Consistency of air distribution from the inlets is low because it depends on wind direction and strength. Therefore, buildings may perform very differently at different times of year – or even different times of the day.
It can be cheap to install, especially in new structures, because it swaps fans for actuators and flaps. Where structural alterations are required, the cost goes up.
ACNV buildings can be ‘leaky’ even when ‘closed down’, especially at high wind speeds, because they need very large inlet and outlet areas. This can be a problem when low minimum ventilation rates are required or heating is used. Fan systems behave better in these conditions.
It can give higher ventilation rates than a fan ventilation system in some conditions.
ACNV can run into trouble in very hot conditions, especially if wind speeds are low. There is no mechanism to artificially raise air speeds to promote cooling. Installers need to consider what contingencies are required in worst-case conditions.
ACNV is virtually fail-safe because the system will stop in its current operational position if there is a power failure.
Close positioning of buildings can hamper air throughput and performance when ambient temperatures are high.
Table 5. Pros and cons of ACNV
27
Heating
Primary purposes of heatingSupplementary heating is used to maintain temperature when there is a deficit of heat in a building or an area of a building. If this happens, the temperature may fall below the lower critical temperature of the animals and feed energy will be diverted from growth to maintenance. In extremes, especially for younger stock, low temperatures will have an effect on mortality rates.In British climatic conditions, heating is normally only considered for young, non-ruminant stock. With older non-ruminants, the use of carefully controlled minimum ventilation rates and insulation in adequately stocked buildings will ensure that recommended temperatures are achieved. Occasionally, in very cold conditions, heating may be used to advantage with young ruminant or sick animals.
Efficient operationFor the most part, maintaining temperature is about ‘containment’ of heat; that is to say, stopping heat loss from ventilation or through the structure (with insulation, for example). Using heat should always be regarded as a last resort as it’s comparatively expensive; conservation of heat is a much more cost-effective strategy.
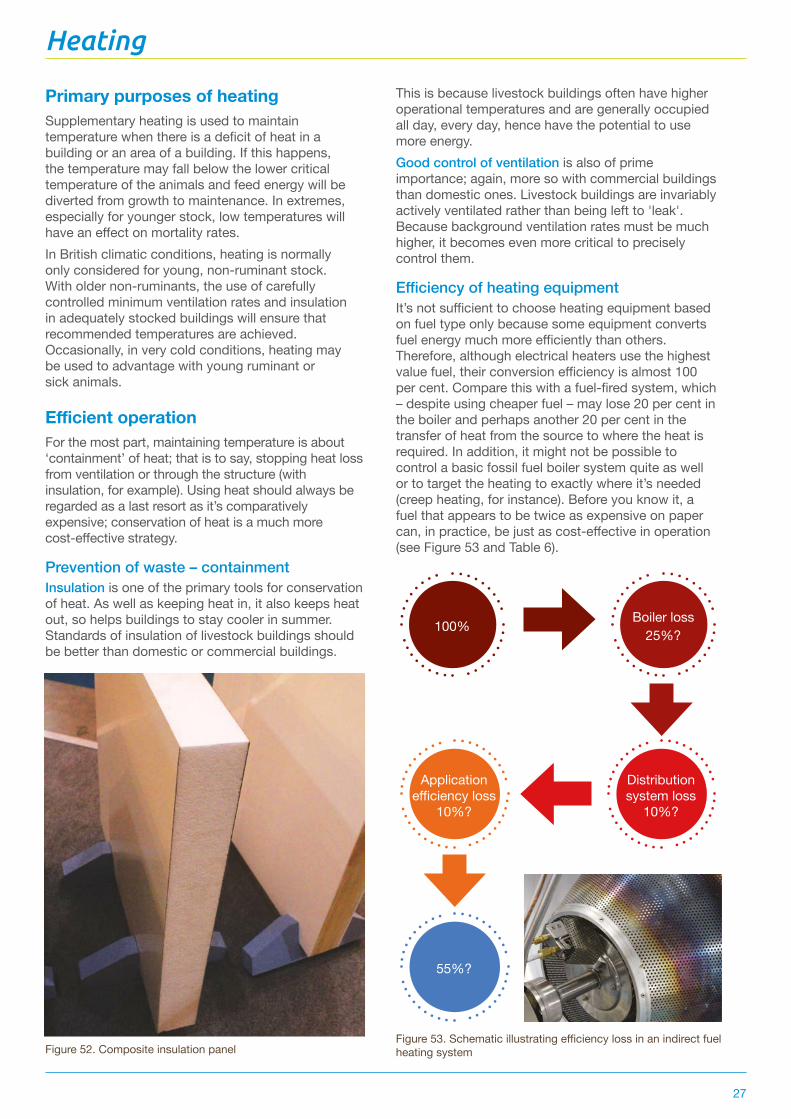
Prevention of waste – containmentInsulation is one of the primary tools for conservation of heat. As well as keeping heat in, it also keeps heat out, so helps buildings to stay cooler in summer. Standards of insulation of livestock buildings should be better than domestic or commercial buildings.
This is because livestock buildings often have higher operational temperatures and are generally occupied all day, every day, hence have the potential to use more energy.Good control of ventilation is also of prime importance; again, more so with commercial buildings than domestic ones. Livestock buildings are invariably actively ventilated rather than being left to 'leak'. Because background ventilation rates must be much higher, it becomes even more critical to precisely control them.
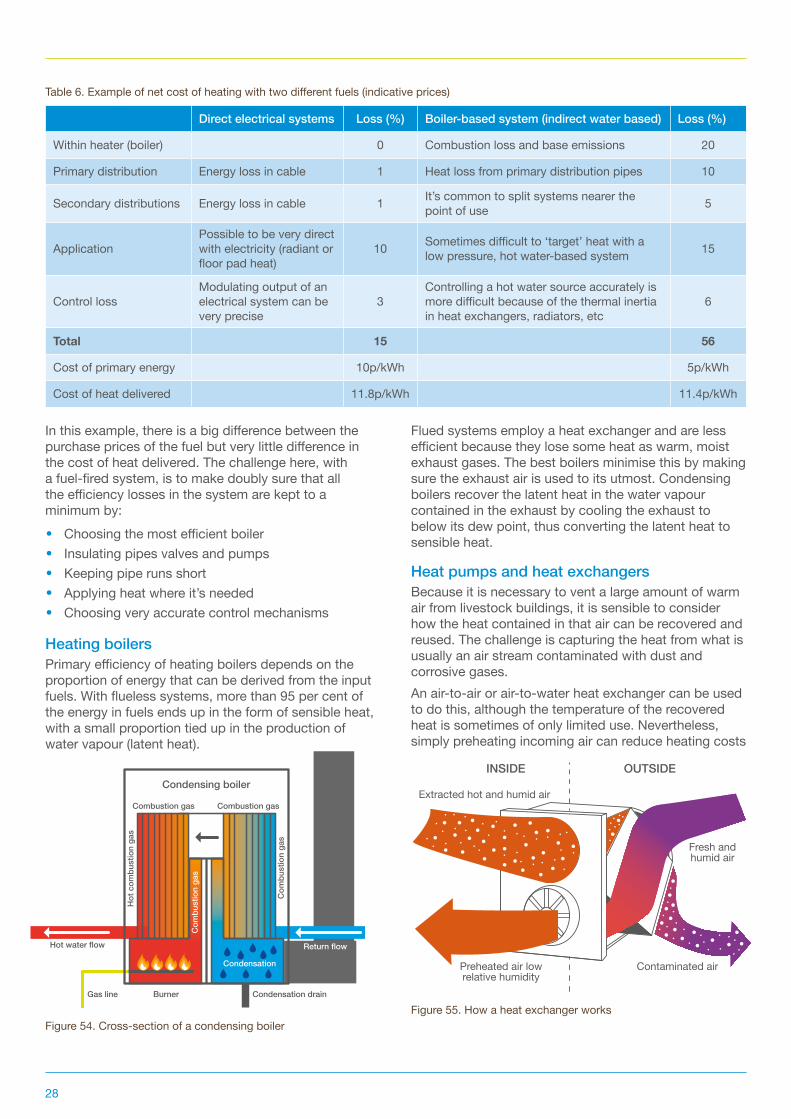
Efficiency of heating equipmentIt’s not sufficient to choose heating equipment based on fuel type only because some equipment converts fuel energy much more efficiently than others. Therefore, although electrical heaters use the highest value fuel, their conversion efficiency is almost 100 per cent. Compare this with a fuel-fired system, which – despite using cheaper fuel – may lose 20 per cent in the boiler and perhaps another 20 per cent in the transfer of heat from the source to where the heat is required. In addition, it might not be possible to control a basic fossil fuel boiler system quite as well or to target the heating to exactly where it’s needed (creep heating, for instance). Before you know it, a fuel that appears to be twice as expensive on paper can, in practice, be just as cost-effective in operation (see Figure 53 and Table 6).
Figure 52. Composite insulation panelFigure 53. Schematic illustrating efficiency loss in an indirect fuel heating system
100% Boiler loss 25%?
Distribution system loss
10%?
Application efficiency loss
10%?
55%?
28
Direct electrical systems Loss (%) Boiler-based system (indirect water based) Loss (%)
Within heater (boiler) 0 Combustion loss and base emissions 20
Primary distribution Energy loss in cable 1 Heat loss from primary distribution pipes 10
Secondary distributions Energy loss in cable 1 It’s common to split systems nearer the point of use 5
ApplicationPossible to be very direct with electricity (radiant or floor pad heat)
10 Sometimes difficult to ‘target’ heat with a low pressure, hot water-based system 15
Control lossModulating output of an electrical system can be very precise
3Controlling a hot water source accurately is more difficult because of the thermal inertia in heat exchangers, radiators, etc
6
Total 15 56
Cost of primary energy 10p/kWh 5p/kWh
Cost of heat delivered 11.8p/kWh 11.4p/kWh
Table 6. Example of net cost of heating with two different fuels (indicative prices)
In this example, there is a big difference between the purchase prices of the fuel but very little difference in the cost of heat delivered. The challenge here, with a fuel-fired system, is to make doubly sure that all the efficiency losses in the system are kept to a minimum by:
• Choosing the most efficient boiler• Insulating pipes valves and pumps• Keeping pipe runs short• Applying heat where it’s needed• Choosing very accurate control mechanisms
Heating boilersPrimary efficiency of heating boilers depends on the proportion of energy that can be derived from the input fuels. With flueless systems, more than 95 per cent of the energy in fuels ends up in the form of sensible heat, with a small proportion tied up in the production of water vapour (latent heat).
Flued systems employ a heat exchanger and are less efficient because they lose some heat as warm, moist exhaust gases. The best boilers minimise this by making sure the exhaust air is used to its utmost. Condensing boilers recover the latent heat in the water vapour contained in the exhaust by cooling the exhaust to below its dew point, thus converting the latent heat to sensible heat.
Heat pumps and heat exchangersBecause it is necessary to vent a large amount of warm air from livestock buildings, it is sensible to consider how the heat contained in that air can be recovered and reused. The challenge is capturing the heat from what is usually an air stream contaminated with dust and corrosive gases.An air-to-air or air-to-water heat exchanger can be used to do this, although the temperature of the recovered heat is sometimes of only limited use. Nevertheless, simply preheating incoming air can reduce heating costs
Figure 54. Cross-section of a condensing boiler
Combustion gas
Condensing boiler
Combustion gas
Gas line
Hot water flow Return flow
Condensation drainBurner
Condensation
Com
bust
ion
gas
Hot
com
bust
ion
gas
Com
bust
ion
gas
Extracted hot and humid air
INSIDE OUTSIDE
Fresh and humid air
Preheated air low relative humidity
Contaminated air
Figure 55. How a heat exchanger works
29
by around 25 per cent – higher figures are sometimes claimed. The challenges for heat recovery are:
• The capital cost of the recovery system and air-handling unit
• The practicality of having both inlet and outlet air streams going through the building at the same point
• Cleaning the heat exchange coilsA heat pump is a device that transfers heat from a colder area to a hotter area using mechanical energy. When a heat pump is used for heating, it employs the same basic refrigeration-type cycle as in a refrigerator, but in the opposite direction – releasing heat into the building space rather than the surrounding environment. The heat source for a heat pump can be ambient air, the ground (ground source heat pump) or a stream of waste heat, such as the exhaust air of a building or the base of a slurry pit. The higher the temperature of the waste stream source, the higher the efficiency of the heat pump; heat pumps are three to six times more efficient in their use of electric power than simple electrical resistance heaters.
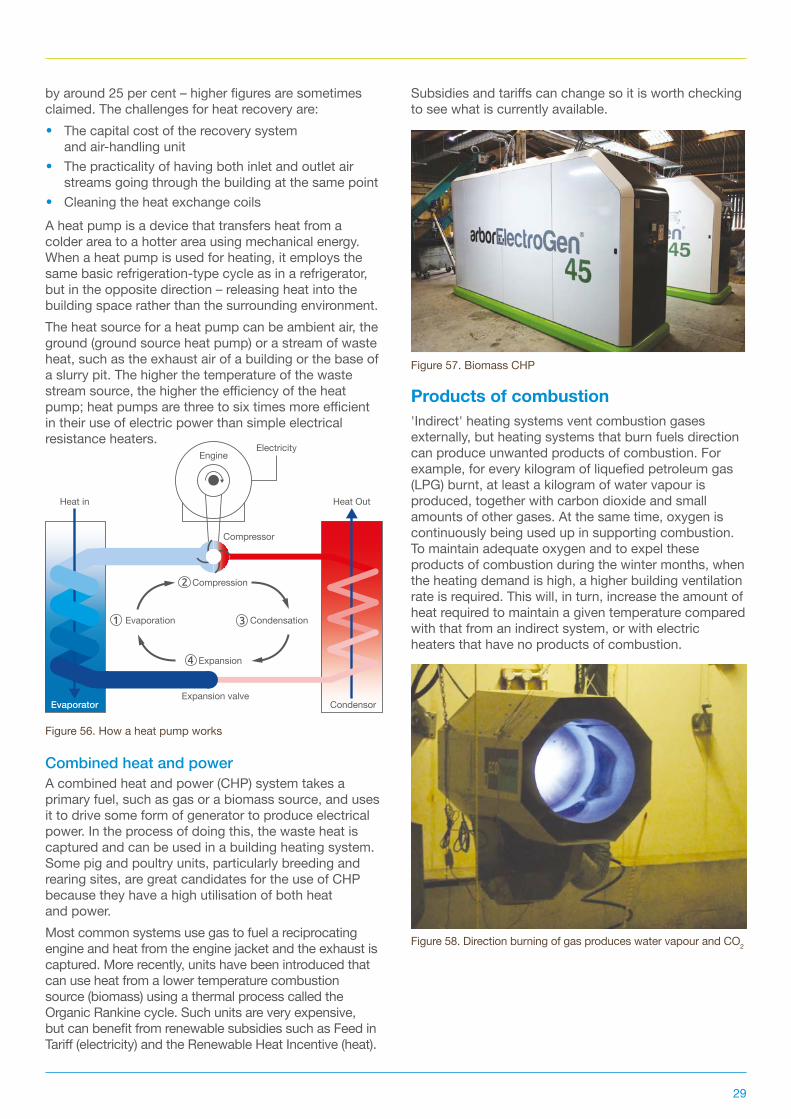
Combined heat and powerA combined heat and power (CHP) system takes a primary fuel, such as gas or a biomass source, and uses it to drive some form of generator to produce electrical power. In the process of doing this, the waste heat is captured and can be used in a building heating system. Some pig and poultry units, particularly breeding and rearing sites, are great candidates for the use of CHP because they have a high utilisation of both heat and power. Most common systems use gas to fuel a reciprocating engine and heat from the engine jacket and the exhaust is captured. More recently, units have been introduced that can use heat from a lower temperature combustion source (biomass) using a thermal process called the Organic Rankine cycle. Such units are very expensive, but can benefit from renewable subsidies such as Feed in Tariff (electricity) and the Renewable Heat Incentive (heat).
Subsidies and tariffs can change so it is worth checking to see what is currently available.
Products of combustion'Indirect' heating systems vent combustion gases externally, but heating systems that burn fuels direction can produce unwanted products of combustion. For example, for every kilogram of liquefied petroleum gas (LPG) burnt, at least a kilogram of water vapour is produced, together with carbon dioxide and small amounts of other gases. At the same time, oxygen is continuously being used up in supporting combustion. To maintain adequate oxygen and to expel these products of combustion during the winter months, when the heating demand is high, a higher building ventilation rate is required. This will, in turn, increase the amount of heat required to maintain a given temperature compared with that from an indirect system, or with electric heaters that have no products of combustion.
Heat in
Evaporator Condensor
Heat Out
ElectricityEngine
Compressor
Compression2
Expansion
Expansion valve
CondensationEvaporation 3
4
1
Figure 56. How a heat pump works
Figure 57. Biomass CHP
Figure 58. Direction burning of gas produces water vapour and CO2
30
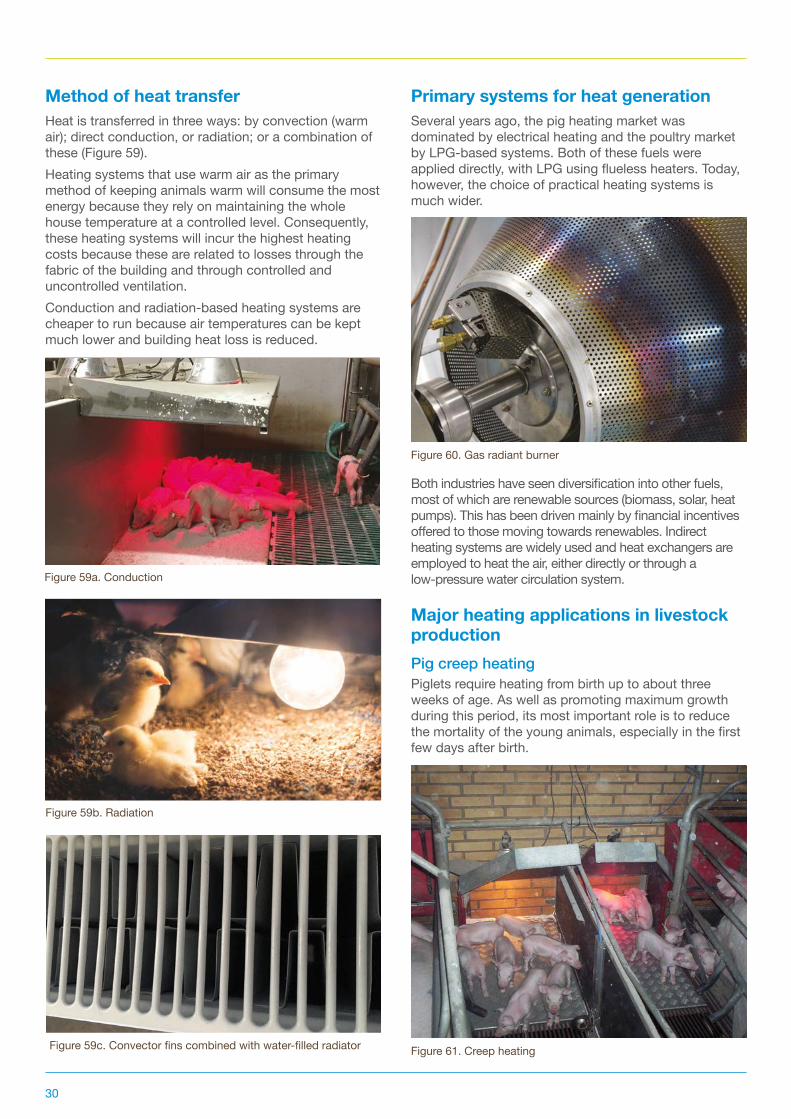
Method of heat transferHeat is transferred in three ways: by convection (warm air); direct conduction, or radiation; or a combination of these (Figure 59). Heating systems that use warm air as the primary method of keeping animals warm will consume the most energy because they rely on maintaining the whole house temperature at a controlled level. Consequently, these heating systems will incur the highest heating costs because these are related to losses through the fabric of the building and through controlled and uncontrolled ventilation. Conduction and radiation-based heating systems are cheaper to run because air temperatures can be kept much lower and building heat loss is reduced.
Primary systems for heat generationSeveral years ago, the pig heating market was dominated by electrical heating and the poultry market by LPG-based systems. Both of these fuels were applied directly, with LPG using flueless heaters. Today, however, the choice of practical heating systems is much wider.
Both industries have seen diversification into other fuels, most of which are renewable sources (biomass, solar, heat pumps). This has been driven mainly by financial incentives offered to those moving towards renewables. Indirect heating systems are widely used and heat exchangers are employed to heat the air, either directly or through a low-pressure water circulation system.
Major heating applications in livestock productionPig creep heatingPiglets require heating from birth up to about three weeks of age. As well as promoting maximum growth during this period, its most important role is to reduce the mortality of the young animals, especially in the first few days after birth.
Figure 59a. Conduction
Figure 59b. Radiation
Figure 59c. Convector fins combined with water-filled radiator
Figure 60. Gas radiant burner
Figure 61. Creep heating
31
This is done in two ways:• Heating helps to conserve the piglet's precious
energy at a time when marginal changes in its own energy reserves can be the difference between life and death
• The incidence of overlying is reduced by the provision of a separate, safe, heated area away from the sow, which is an effective alternative to the warmth of her body
Work has been undertaken to determine the value of providing extra heat at the tail and at the sides of the sow for the first few days after parturition. In both scientific and commercial trials, such heating has been shown to have a significant effect on piglet mortality because it overcomes the disadvantage of the less-than-optimum piglet environment in the areas away from the creep. The difference in energy cost between a basic heating system and a more extensive one might be a couple of pounds per farrowing, but this can be quickly recovered through only minor improvements in mortality.
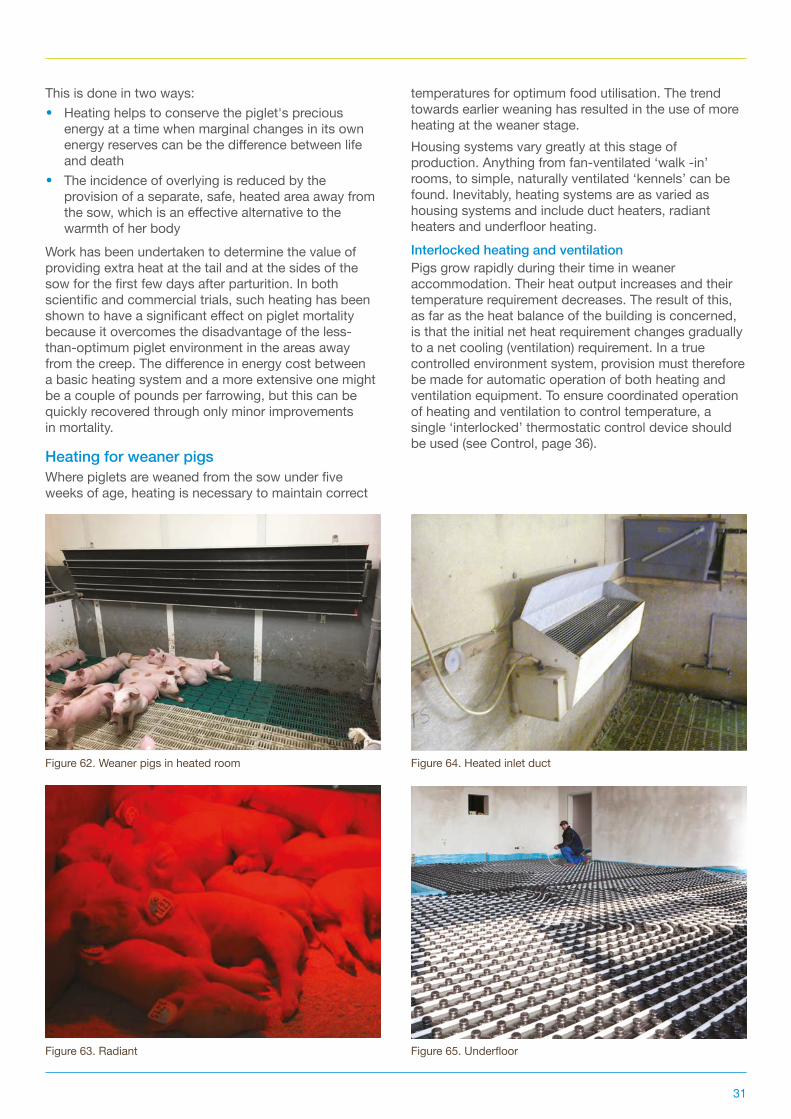
Heating for weaner pigsWhere piglets are weaned from the sow under five weeks of age, heating is necessary to maintain correct
temperatures for optimum food utilisation. The trend towards earlier weaning has resulted in the use of more heating at the weaner stage.Housing systems vary greatly at this stage of production. Anything from fan-ventilated ‘walk -in’ rooms, to simple, naturally ventilated ‘kennels’ can be found. Inevitably, heating systems are as varied as housing systems and include duct heaters, radiant heaters and underfloor heating. Interlocked heating and ventilationPigs grow rapidly during their time in weaner accommodation. Their heat output increases and their temperature requirement decreases. The result of this, as far as the heat balance of the building is concerned, is that the initial net heat requirement changes gradually to a net cooling (ventilation) requirement. In a true controlled environment system, provision must therefore be made for automatic operation of both heating and ventilation equipment. To ensure coordinated operation of heating and ventilation to control temperature, a single ‘interlocked’ thermostatic control device should be used (see Control, page 36).
Figure 64. Heated inlet duct
Figure 65. Underfloor
Figure 62. Weaner pigs in heated room
Figure 63. Radiant
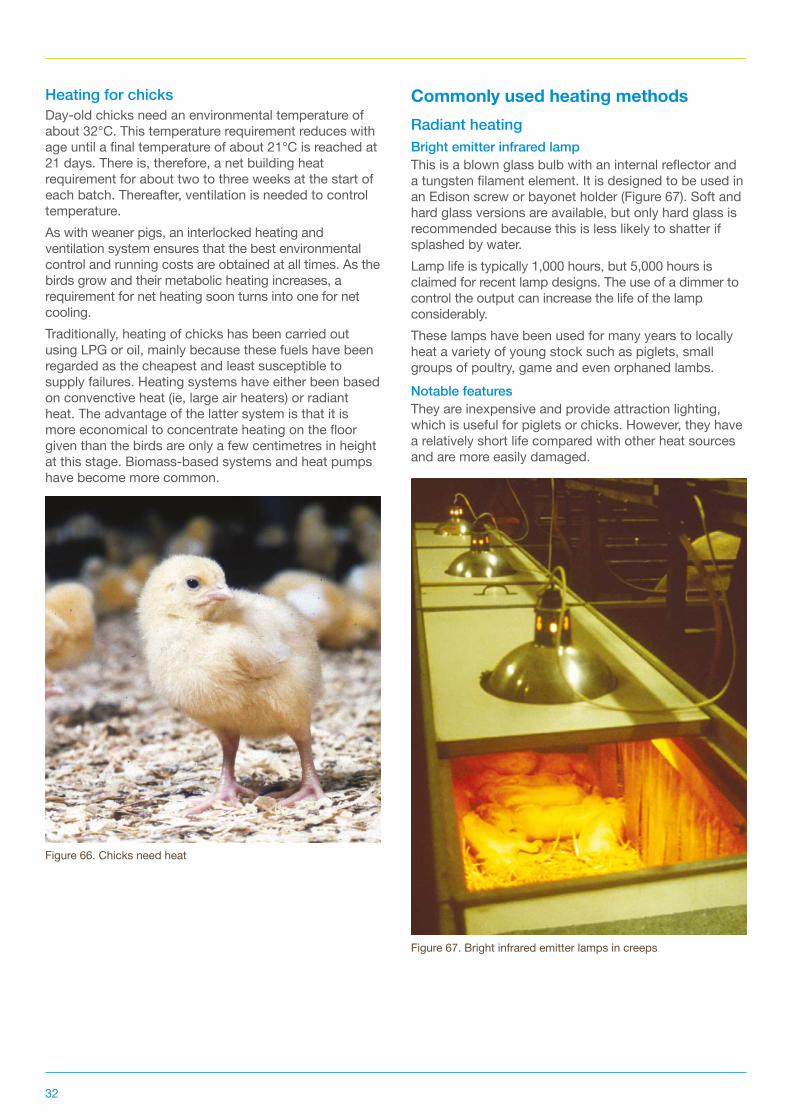
32
Heating for chicksDay-old chicks need an environmental temperature of about 32°C. This temperature requirement reduces with age until a final temperature of about 21°C is reached at 21 days. There is, therefore, a net building heat requirement for about two to three weeks at the start of each batch. Thereafter, ventilation is needed to control temperature.As with weaner pigs, an interlocked heating and ventilation system ensures that the best environmental control and running costs are obtained at all times. As the birds grow and their metabolic heating increases, a requirement for net heating soon turns into one for net cooling. Traditionally, heating of chicks has been carried out using LPG or oil, mainly because these fuels have been regarded as the cheapest and least susceptible to supply failures. Heating systems have either been based on convenctive heat (ie, large air heaters) or radiant heat. The advantage of the latter system is that it is more economical to concentrate heating on the floor given than the birds are only a few centimetres in height at this stage. Biomass-based systems and heat pumps have become more common.
Commonly used heating methodsRadiant heatingBright emitter infrared lampThis is a blown glass bulb with an internal reflector and a tungsten filament element. It is designed to be used in an Edison screw or bayonet holder (Figure 67). Soft and hard glass versions are available, but only hard glass is recommended because this is less likely to shatter if splashed by water. Lamp life is typically 1,000 hours, but 5,000 hours is claimed for recent lamp designs. The use of a dimmer to control the output can increase the life of the lamp considerably.These lamps have been used for many years to locally heat a variety of young stock such as piglets, small groups of poultry, game and even orphaned lambs.Notable featuresThey are inexpensive and provide attraction lighting, which is useful for piglets or chicks. However, they have a relatively short life compared with other heat sources and are more easily damaged.
Figure 66. Chicks need heat
Figure 67. Bright infrared emitter lamps in creeps
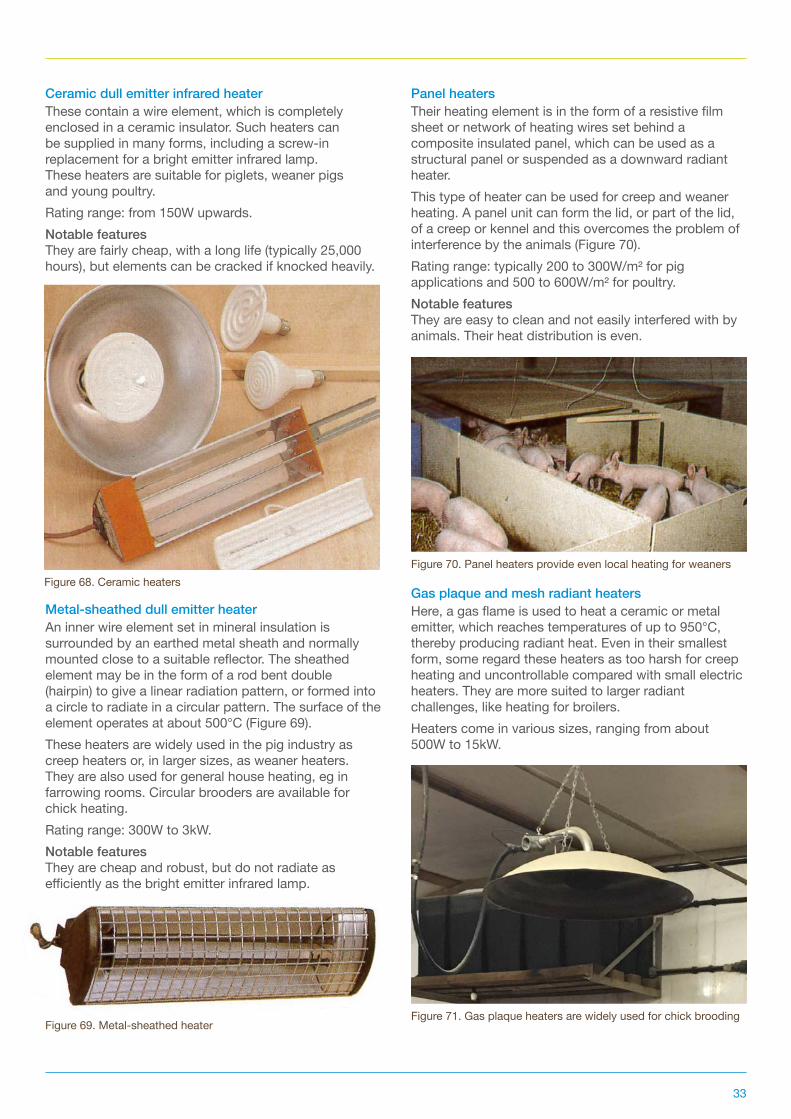
33
Ceramic dull emitter infrared heaterThese contain a wire element, which is completely enclosed in a ceramic insulator. Such heaters can be supplied in many forms, including a screw-in replacement for a bright emitter infrared lamp. These heaters are suitable for piglets, weaner pigs and young poultry.Rating range: from 150W upwards.Notable featuresThey are fairly cheap, with a long life (typically 25,000 hours), but elements can be cracked if knocked heavily.
Metal-sheathed dull emitter heaterAn inner wire element set in mineral insulation is surrounded by an earthed metal sheath and normally mounted close to a suitable reflector. The sheathed element may be in the form of a rod bent double (hairpin) to give a linear radiation pattern, or formed into a circle to radiate in a circular pattern. The surface of the element operates at about 500°C (Figure 69). These heaters are widely used in the pig industry as creep heaters or, in larger sizes, as weaner heaters. They are also used for general house heating, eg in farrowing rooms. Circular brooders are available for chick heating.Rating range: 300W to 3kW.Notable featuresThey are cheap and robust, but do not radiate as efficiently as the bright emitter infrared lamp.
Panel heatersTheir heating element is in the form of a resistive film sheet or network of heating wires set behind a composite insulated panel, which can be used as a structural panel or suspended as a downward radiant heater.This type of heater can be used for creep and weaner heating. A panel unit can form the lid, or part of the lid, of a creep or kennel and this overcomes the problem of interference by the animals (Figure 70).Rating range: typically 200 to 300W/m² for pig applications and 500 to 600W/m² for poultry. Notable featuresThey are easy to clean and not easily interfered with by animals. Their heat distribution is even.
Gas plaque and mesh radiant heatersHere, a gas flame is used to heat a ceramic or metal emitter, which reaches temperatures of up to 950°C, thereby producing radiant heat. Even in their smallest form, some regard these heaters as too harsh for creep heating and uncontrollable compared with small electric heaters. They are more suited to larger radiant challenges, like heating for broilers.Heaters come in various sizes, ranging from about 500W to 15kW.
Figure 68. Ceramic heaters
Figure 69. Metal-sheathed heater
Figure 70. Panel heaters provide even local heating for weaners
Figure 71. Gas plaque heaters are widely used for chick brooding
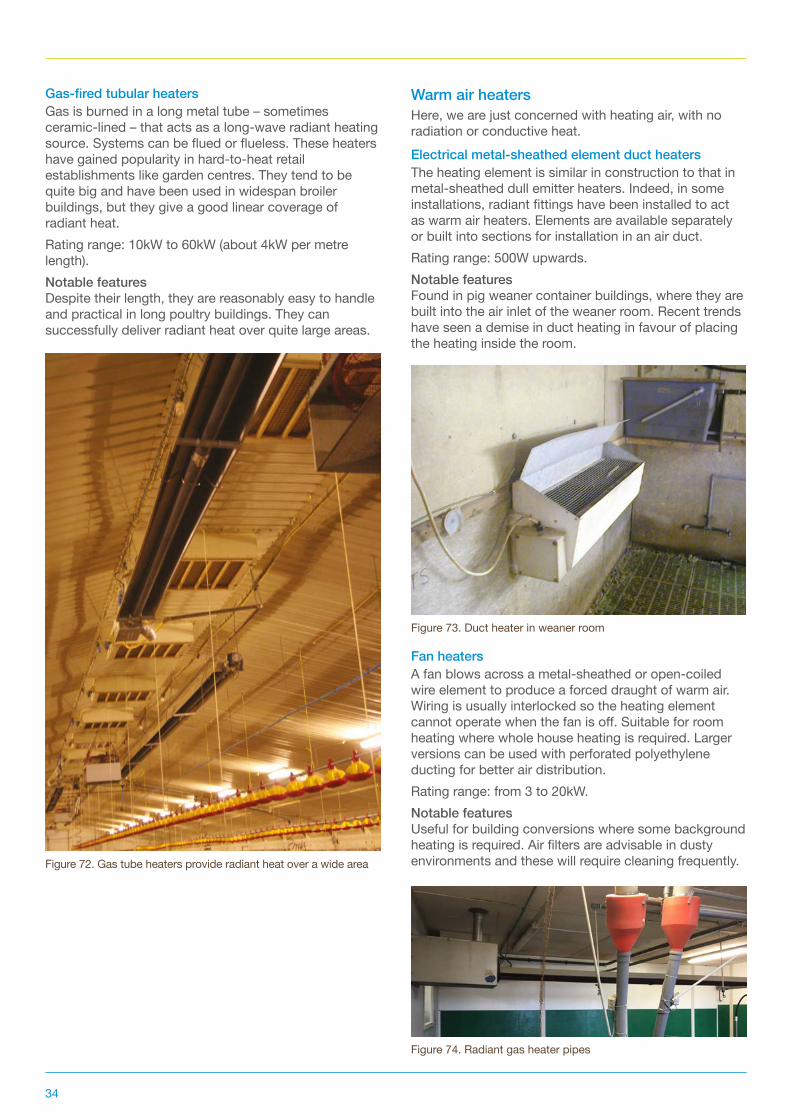
34
Gas-fired tubular heatersGas is burned in a long metal tube – sometimes ceramic-lined – that acts as a long-wave radiant heating source. Systems can be flued or flueless. These heaters have gained popularity in hard-to-heat retail establishments like garden centres. They tend to be quite big and have been used in widespan broiler buildings, but they give a good linear coverage of radiant heat.Rating range: 10kW to 60kW (about 4kW per metre length).Notable featuresDespite their length, they are reasonably easy to handle and practical in long poultry buildings. They can successfully deliver radiant heat over quite large areas.
Warm air heatersHere, we are just concerned with heating air, with no radiation or conductive heat.Electrical metal-sheathed element duct heatersThe heating element is similar in construction to that in metal-sheathed dull emitter heaters. Indeed, in some installations, radiant fittings have been installed to act as warm air heaters. Elements are available separately or built into sections for installation in an air duct. Rating range: 500W upwards.Notable featuresFound in pig weaner container buildings, where they are built into the air inlet of the weaner room. Recent trends have seen a demise in duct heating in favour of placing the heating inside the room.
Fan heatersA fan blows across a metal-sheathed or open-coiled wire element to produce a forced draught of warm air. Wiring is usually interlocked so the heating element cannot operate when the fan is off. Suitable for room heating where whole house heating is required. Larger versions can be used with perforated polyethylene ducting for better air distribution. Rating range: from 3 to 20kW.Notable featuresUseful for building conversions where some background heating is required. Air filters are advisable in dusty environments and these will require cleaning frequently.Figure 72. Gas tube heaters provide radiant heat over a wide area
Figure 73. Duct heater in weaner room
Figure 74. Radiant gas heater pipes
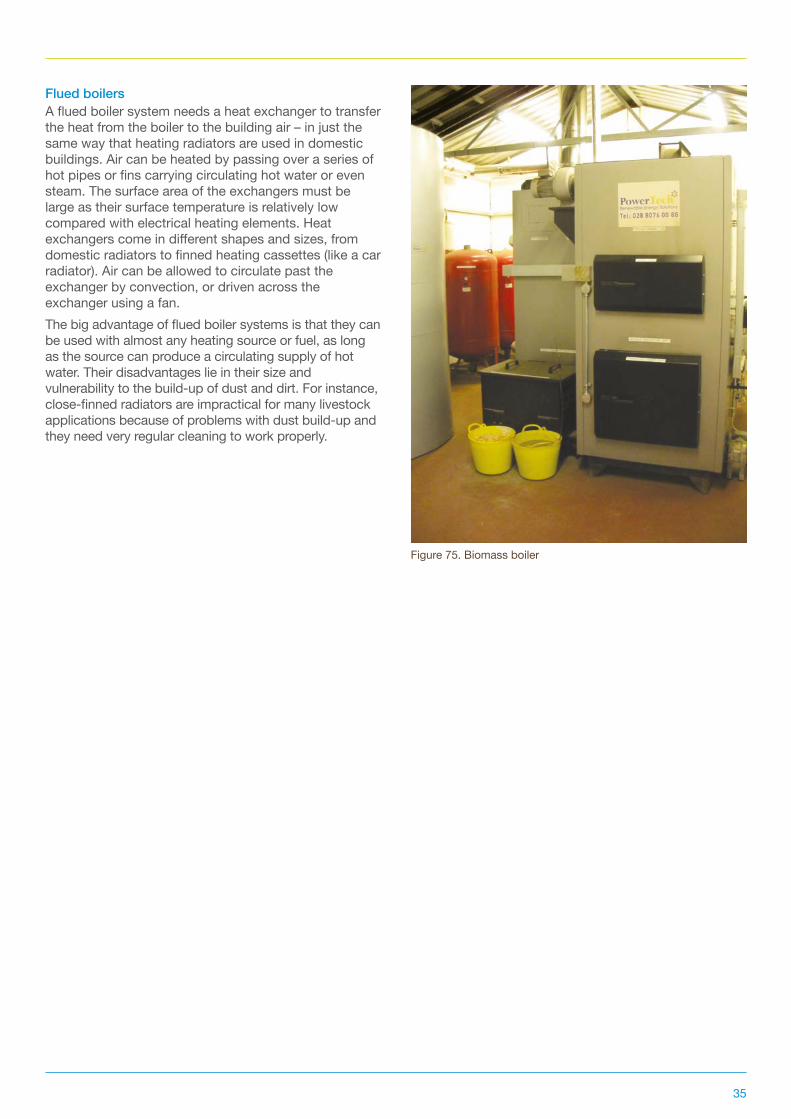
35
Flued boilersA flued boiler system needs a heat exchanger to transfer the heat from the boiler to the building air – in just the same way that heating radiators are used in domestic buildings. Air can be heated by passing over a series of hot pipes or fins carrying circulating hot water or even steam. The surface area of the exchangers must be large as their surface temperature is relatively low compared with electrical heating elements. Heat exchangers come in different shapes and sizes, from domestic radiators to finned heating cassettes (like a car radiator). Air can be allowed to circulate past the exchanger by convection, or driven across the exchanger using a fan.The big advantage of flued boiler systems is that they can be used with almost any heating source or fuel, as long as the source can produce a circulating supply of hot water. Their disadvantages lie in their size and vulnerability to the build-up of dust and dirt. For instance, close-finned radiators are impractical for many livestock applications because of problems with dust build-up and they need very regular cleaning to work properly.
Figure 75. Biomass boiler
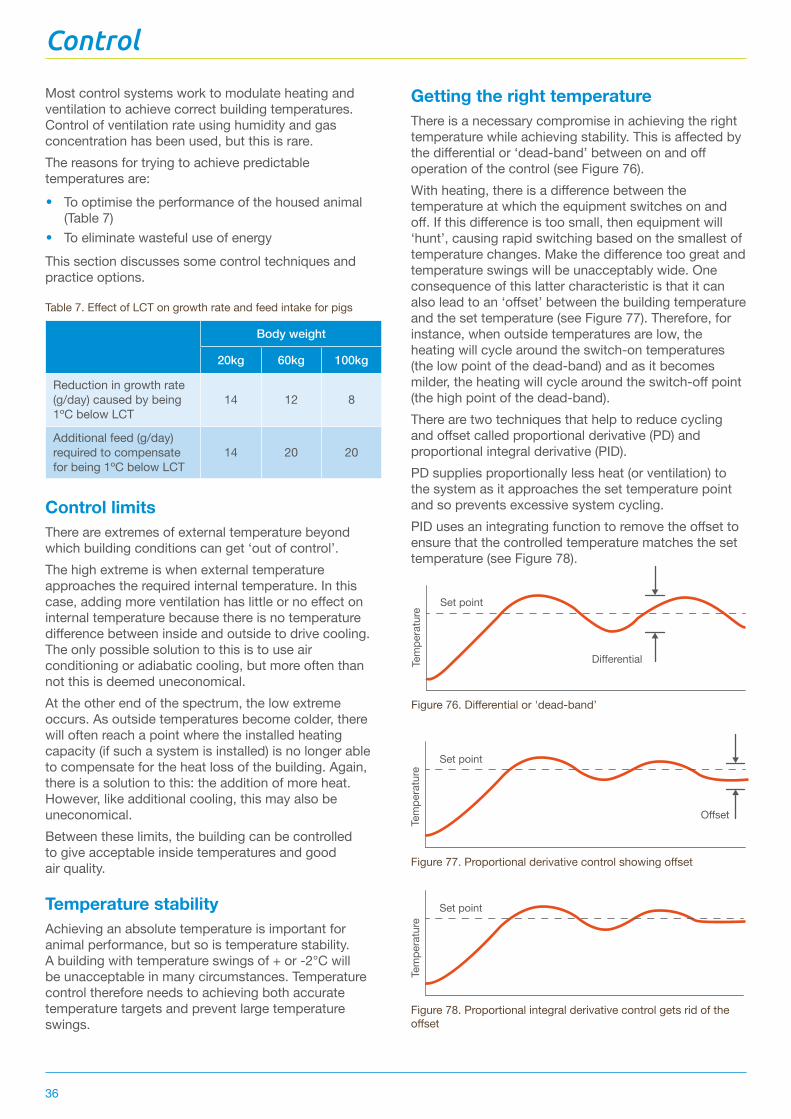
36
Most control systems work to modulate heating and ventilation to achieve correct building temperatures. Control of ventilation rate using humidity and gas concentration has been used, but this is rare. The reasons for trying to achieve predictable temperatures are:
• To optimise the performance of the housed animal (Table 7)
• To eliminate wasteful use of energyThis section discusses some control techniques and practice options.
Control limitsThere are extremes of external temperature beyond which building conditions can get ‘out of control’. The high extreme is when external temperature approaches the required internal temperature. In this case, adding more ventilation has little or no effect on internal temperature because there is no temperature difference between inside and outside to drive cooling. The only possible solution to this is to use air conditioning or adiabatic cooling, but more often than not this is deemed uneconomical.At the other end of the spectrum, the low extreme occurs. As outside temperatures become colder, there will often reach a point where the installed heating capacity (if such a system is installed) is no longer able to compensate for the heat loss of the building. Again, there is a solution to this: the addition of more heat. However, like additional cooling, this may also be uneconomical. Between these limits, the building can be controlled to give acceptable inside temperatures and good air quality.
Temperature stabilityAchieving an absolute temperature is important for animal performance, but so is temperature stability. A building with temperature swings of + or -2°C will be unacceptable in many circumstances. Temperature control therefore needs to achieving both accurate temperature targets and prevent large temperature swings.
Getting the right temperatureThere is a necessary compromise in achieving the right temperature while achieving stability. This is affected by the differential or ‘dead-band’ between on and off operation of the control (see Figure 76). With heating, there is a difference between the temperature at which the equipment switches on and off. If this difference is too small, then equipment will ‘hunt’, causing rapid switching based on the smallest of temperature changes. Make the difference too great and temperature swings will be unacceptably wide. One consequence of this latter characteristic is that it can also lead to an ‘offset’ between the building temperature and the set temperature (see Figure 77). Therefore, for instance, when outside temperatures are low, the heating will cycle around the switch-on temperatures (the low point of the dead-band) and as it becomes milder, the heating will cycle around the switch-off point (the high point of the dead-band). There are two techniques that help to reduce cycling and offset called proportional derivative (PD) and proportional integral derivative (PID). PD supplies proportionally less heat (or ventilation) to the system as it approaches the set temperature point and so prevents excessive system cycling.PID uses an integrating function to remove the offset to ensure that the controlled temperature matches the set temperature (see Figure 78).
Table 7. Effect of LCT on growth rate and feed intake for pigs
Figure 76. Differential or 'dead-band’
Figure 77. Proportional derivative control showing offset
Figure 78. Proportional integral derivative control gets rid of the offset
Control
Body weight
20kg 60kg 100kg
Reduction in growth rate (g/day) caused by being 1ºC below LCT
14 12 8
Additional feed (g/day) required to compensate for being 1ºC below LCT
14 20 20
Differential
Set point
Tem
pera
ture
Offset
Set point
Tem
pera
ture
Set point
Tem
pera
ture
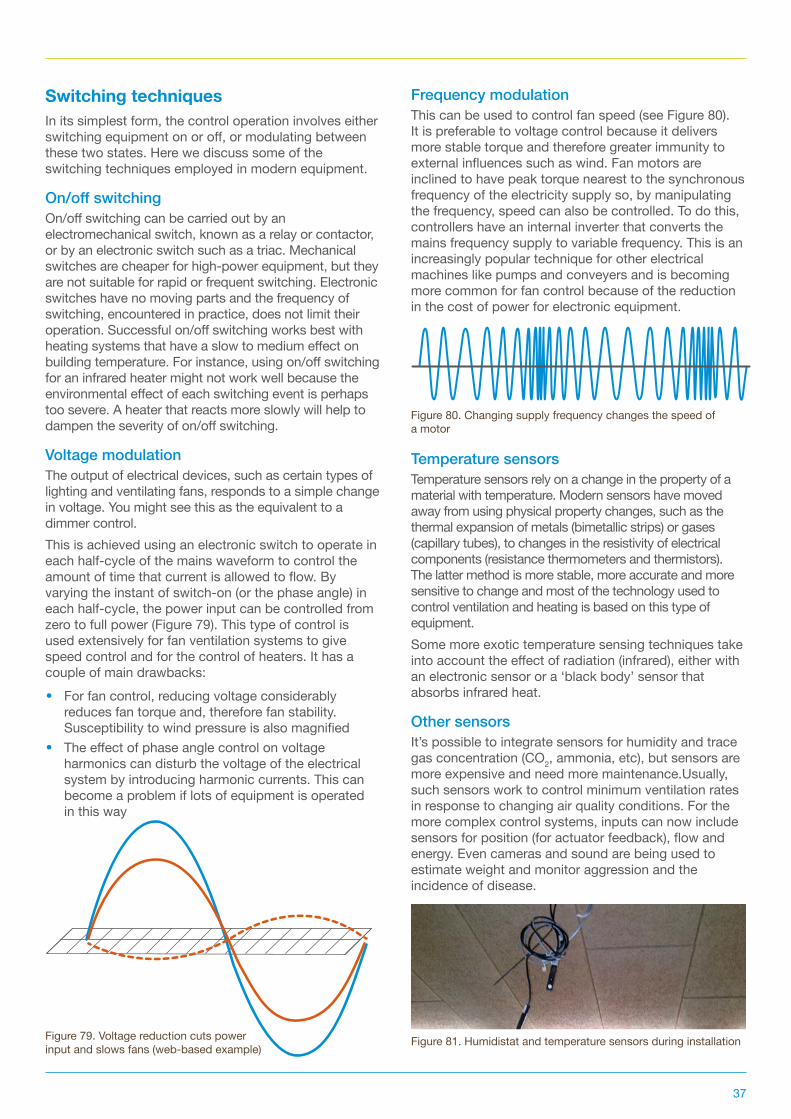
37
Switching techniquesIn its simplest form, the control operation involves either switching equipment on or off, or modulating between these two states. Here we discuss some of the switching techniques employed in modern equipment.
On/off switchingOn/off switching can be carried out by an electromechanical switch, known as a relay or contactor, or by an electronic switch such as a triac. Mechanical switches are cheaper for high-power equipment, but they are not suitable for rapid or frequent switching. Electronic switches have no moving parts and the frequency of switching, encountered in practice, does not limit their operation. Successful on/off switching works best with heating systems that have a slow to medium effect on building temperature. For instance, using on/off switching for an infrared heater might not work well because the environmental effect of each switching event is perhaps too severe. A heater that reacts more slowly will help to dampen the severity of on/off switching.
Voltage modulationThe output of electrical devices, such as certain types of lighting and ventilating fans, responds to a simple change in voltage. You might see this as the equivalent to a dimmer control. This is achieved using an electronic switch to operate in each half-cycle of the mains waveform to control the amount of time that current is allowed to flow. By varying the instant of switch-on (or the phase angle) in each half-cycle, the power input can be controlled from zero to full power (Figure 79). This type of control is used extensively for fan ventilation systems to give speed control and for the control of heaters. It has a couple of main drawbacks:
• For fan control, reducing voltage considerably reduces fan torque and, therefore fan stability. Susceptibility to wind pressure is also magnified
• The effect of phase angle control on voltage harmonics can disturb the voltage of the electrical system by introducing harmonic currents. This can become a problem if lots of equipment is operated in this way
Frequency modulationThis can be used to control fan speed (see Figure 80). It is preferable to voltage control because it delivers more stable torque and therefore greater immunity to external influences such as wind. Fan motors are inclined to have peak torque nearest to the synchronous frequency of the electricity supply so, by manipulating the frequency, speed can also be controlled. To do this, controllers have an internal inverter that converts the mains frequency supply to variable frequency. This is an increasingly popular technique for other electrical machines like pumps and conveyers and is becoming more common for fan control because of the reduction in the cost of power for electronic equipment.
Temperature sensorsTemperature sensors rely on a change in the property of a material with temperature. Modern sensors have moved away from using physical property changes, such as the thermal expansion of metals (bimetallic strips) or gases (capillary tubes), to changes in the resistivity of electrical components (resistance thermometers and thermistors). The latter method is more stable, more accurate and more sensitive to change and most of the technology used to control ventilation and heating is based on this type of equipment.Some more exotic temperature sensing techniques take into account the effect of radiation (infrared), either with an electronic sensor or a ‘black body’ sensor that absorbs infrared heat.
Other sensorsIt’s possible to integrate sensors for humidity and trace gas concentration (CO2, ammonia, etc), but sensors are more expensive and need more maintenance.Usually, such sensors work to control minimum ventilation rates in response to changing air quality conditions. For the more complex control systems, inputs can now include sensors for position (for actuator feedback), flow and energy. Even cameras and sound are being used to estimate weight and monitor aggression and the incidence of disease.
Figure 79. Voltage reduction cuts power input and slows fans (web-based example)
Figure 80. Changing supply frequency changes the speed of a motor
Figure 81. Humidistat and temperature sensors during installation
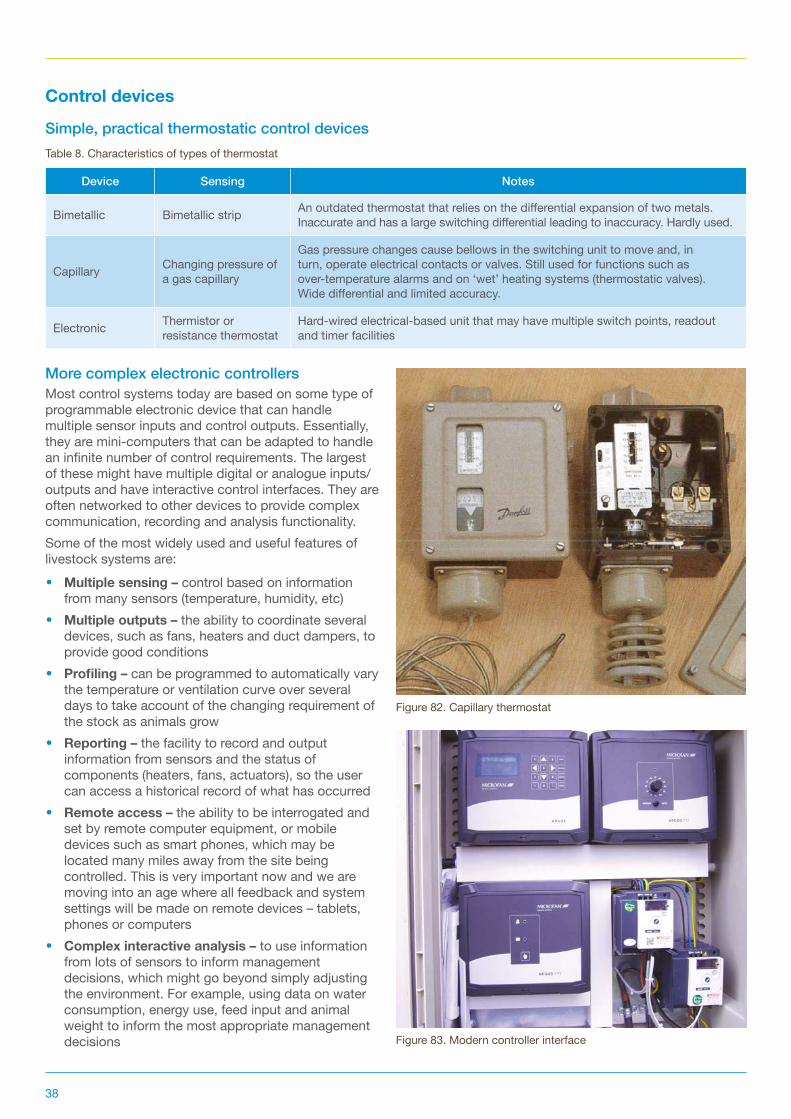
38
Control devices
Simple, practical thermostatic control devices
More complex electronic controllersMost control systems today are based on some type of programmable electronic device that can handle multiple sensor inputs and control outputs. Essentially, they are mini-computers that can be adapted to handle an infinite number of control requirements. The largest of these might have multiple digital or analogue inputs/outputs and have interactive control interfaces. They are often networked to other devices to provide complex communication, recording and analysis functionality.Some of the most widely used and useful features of livestock systems are:
• Multiple sensing – control based on information from many sensors (temperature, humidity, etc)
• Multiple outputs – the ability to coordinate several devices, such as fans, heaters and duct dampers, to provide good conditions
• Profiling – can be programmed to automatically vary the temperature or ventilation curve over several days to take account of the changing requirement of the stock as animals grow
• Reporting – the facility to record and output information from sensors and the status of components (heaters, fans, actuators), so the user can access a historical record of what has occurred
• Remote access – the ability to be interrogated and set by remote computer equipment, or mobile devices such as smart phones, which may be located many miles away from the site being controlled. This is very important now and we are moving into an age where all feedback and system settings will be made on remote devices – tablets, phones or computers
• Complex interactive analysis – to use information from lots of sensors to inform management decisions, which might go beyond simply adjusting the environment. For example, using data on water consumption, energy use, feed input and animal weight to inform the most appropriate management decisions
Device Sensing Notes
Bimetallic Bimetallic strip An outdated thermostat that relies on the differential expansion of two metals. Inaccurate and has a large switching differential leading to inaccuracy. Hardly used.
Capillary Changing pressure of a gas capillary
Gas pressure changes cause bellows in the switching unit to move and, in turn, operate electrical contacts or valves. Still used for functions such as over-temperature alarms and on ‘wet’ heating systems (thermostatic valves). Wide differential and limited accuracy.
Electronic Thermistor or resistance thermostat
Hard-wired electrical-based unit that may have multiple switch points, readout and timer facilities
Table 8. Characteristics of types of thermostat
Figure 82. Capillary thermostat
Figure 83. Modern controller interface
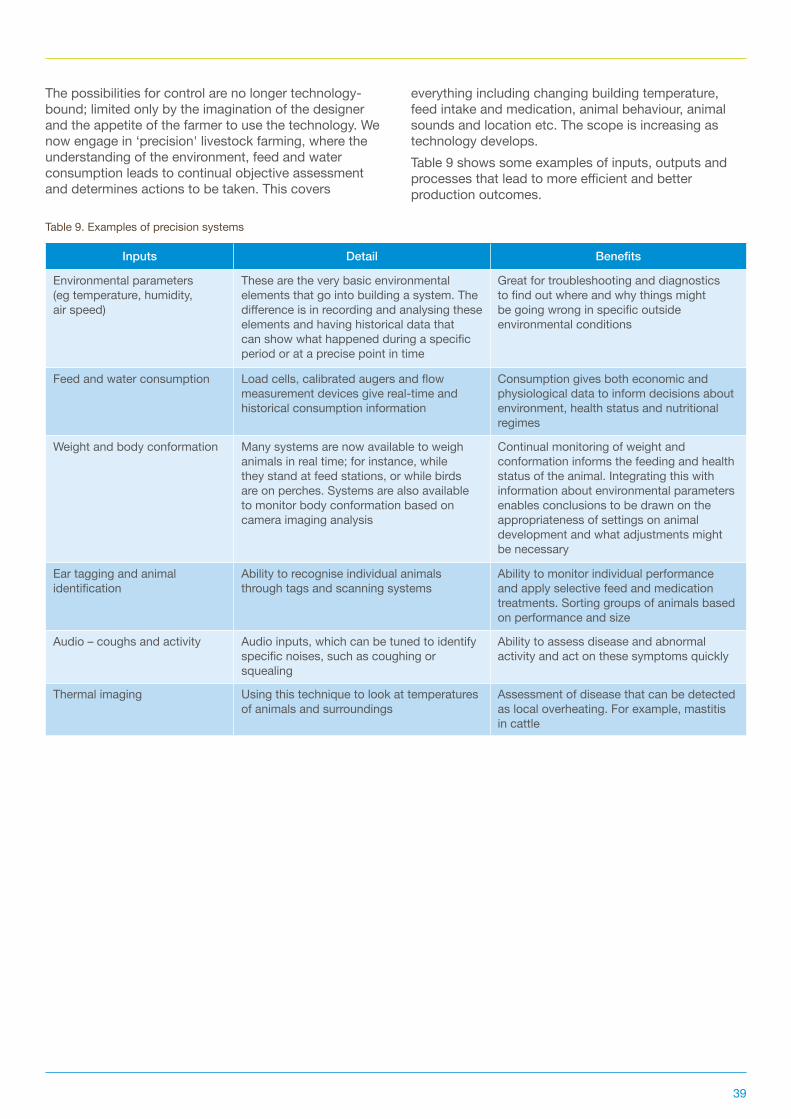
39
The possibilities for control are no longer technology-bound; limited only by the imagination of the designer and the appetite of the farmer to use the technology. We now engage in ‘precision' livestock farming, where the understanding of the environment, feed and water consumption leads to continual objective assessment and determines actions to be taken. This covers
everything including changing building temperature, feed intake and medication, animal behaviour, animal sounds and location etc. The scope is increasing as technology develops.Table 9 shows some examples of inputs, outputs and processes that lead to more efficient and better production outcomes.
Inputs Detail Benefits
Environmental parameters (eg temperature, humidity, air speed)
These are the very basic environmental elements that go into building a system. The difference is in recording and analysing these elements and having historical data that can show what happened during a specific period or at a precise point in time
Great for troubleshooting and diagnostics to find out where and why things might be going wrong in specific outside environmental conditions
Feed and water consumption Load cells, calibrated augers and flow measurement devices give real-time and historical consumption information
Consumption gives both economic and physiological data to inform decisions about environment, health status and nutritional regimes
Weight and body conformation Many systems are now available to weigh animals in real time; for instance, while they stand at feed stations, or while birds are on perches. Systems are also available to monitor body conformation based on camera imaging analysis
Continual monitoring of weight and conformation informs the feeding and health status of the animal. Integrating this with information about environmental parameters enables conclusions to be drawn on the appropriateness of settings on animal development and what adjustments might be necessary
Ear tagging and animal identification
Ability to recognise individual animals through tags and scanning systems
Ability to monitor individual performance and apply selective feed and medication treatments. Sorting groups of animals based on performance and size
Audio – coughs and activity Audio inputs, which can be tuned to identify specific noises, such as coughing or squealing
Ability to assess disease and abnormal activity and act on these symptoms quickly
Thermal imaging Using this technique to look at temperatures of animals and surroundings
Assessment of disease that can be detected as local overheating. For example, mastitis in cattle
Table 9. Examples of precision systems
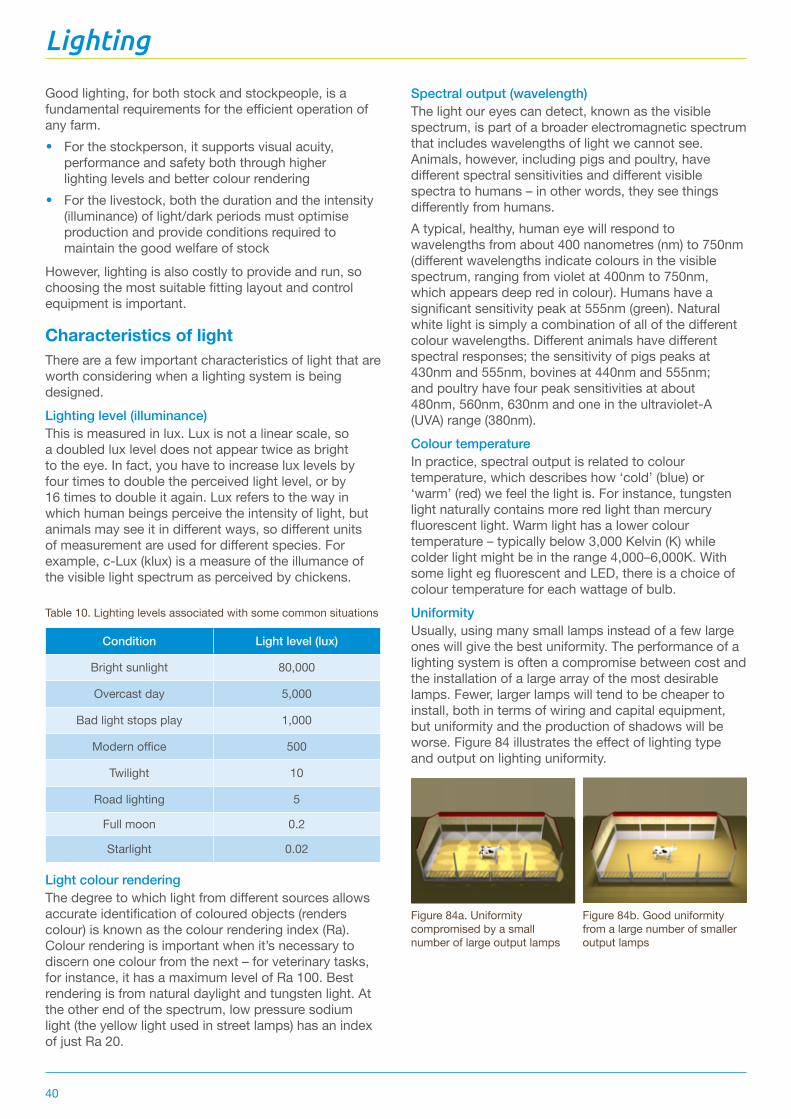
40
Good lighting, for both stock and stockpeople, is a fundamental requirements for the efficient operation of any farm.
• For the stockperson, it supports visual acuity, performance and safety both through higher lighting levels and better colour rendering
• For the livestock, both the duration and the intensity (illuminance) of light/dark periods must optimise production and provide conditions required to maintain the good welfare of stock
However, lighting is also costly to provide and run, so choosing the most suitable fitting layout and control equipment is important.
Characteristics of lightThere are a few important characteristics of light that are worth considering when a lighting system is being designed. Lighting level (illuminance)This is measured in lux. Lux is not a linear scale, so a doubled lux level does not appear twice as bright to the eye. In fact, you have to increase lux levels by four times to double the perceived light level, or by 16 times to double it again. Lux refers to the way in which human beings perceive the intensity of light, but animals may see it in different ways, so different units of measurement are used for different species. For example, c-Lux (klux) is a measure of the illumance of the visible light spectrum as perceived by chickens.
Light colour renderingThe degree to which light from different sources allows accurate identification of coloured objects (renders colour) is known as the colour rendering index (Ra). Colour rendering is important when it’s necessary to discern one colour from the next – for veterinary tasks, for instance, it has a maximum level of Ra 100. Best rendering is from natural daylight and tungsten light. At the other end of the spectrum, low pressure sodium light (the yellow light used in street lamps) has an index of just Ra 20.
Spectral output (wavelength)The light our eyes can detect, known as the visible spectrum, is part of a broader electromagnetic spectrum that includes wavelengths of light we cannot see. Animals, however, including pigs and poultry, have different spectral sensitivities and different visible spectra to humans – in other words, they see things differently from humans.A typical, healthy, human eye will respond to wavelengths from about 400 nanometres (nm) to 750nm (different wavelengths indicate colours in the visible spectrum, ranging from violet at 400nm to 750nm, which appears deep red in colour). Humans have a significant sensitivity peak at 555nm (green). Natural white light is simply a combination of all of the different colour wavelengths. Different animals have different spectral responses; the sensitivity of pigs peaks at 430nm and 555nm, bovines at 440nm and 555nm; and poultry have four peak sensitivities at about 480nm, 560nm, 630nm and one in the ultraviolet-A (UVA) range (380nm).Colour temperatureIn practice, spectral output is related to colour temperature, which describes how ‘cold’ (blue) or ‘warm’ (red) we feel the light is. For instance, tungsten light naturally contains more red light than mercury fluorescent light. Warm light has a lower colour temperature – typically below 3,000 Kelvin (K) while colder light might be in the range 4,000–6,000K. With some light eg fluorescent and LED, there is a choice of colour temperature for each wattage of bulb. UniformityUsually, using many small lamps instead of a few large ones will give the best uniformity. The performance of a lighting system is often a compromise between cost and the installation of a large array of the most desirable lamps. Fewer, larger lamps will tend to be cheaper to install, both in terms of wiring and capital equipment, but uniformity and the production of shadows will be worse. Figure 84 illustrates the effect of lighting type and output on lighting uniformity.
Condition Light level (lux)
Bright sunlight 80,000
Overcast day 5,000
Bad light stops play 1,000
Modern office 500
Twilight 10
Road lighting 5
Full moon 0.2
Starlight 0.02
Table 10. Lighting levels associated with some common situations
Lighting
Figure 84b. Good uniformity from a large number of smaller output lamps
Figure 84a. Uniformity compromised by a small number of large output lamps
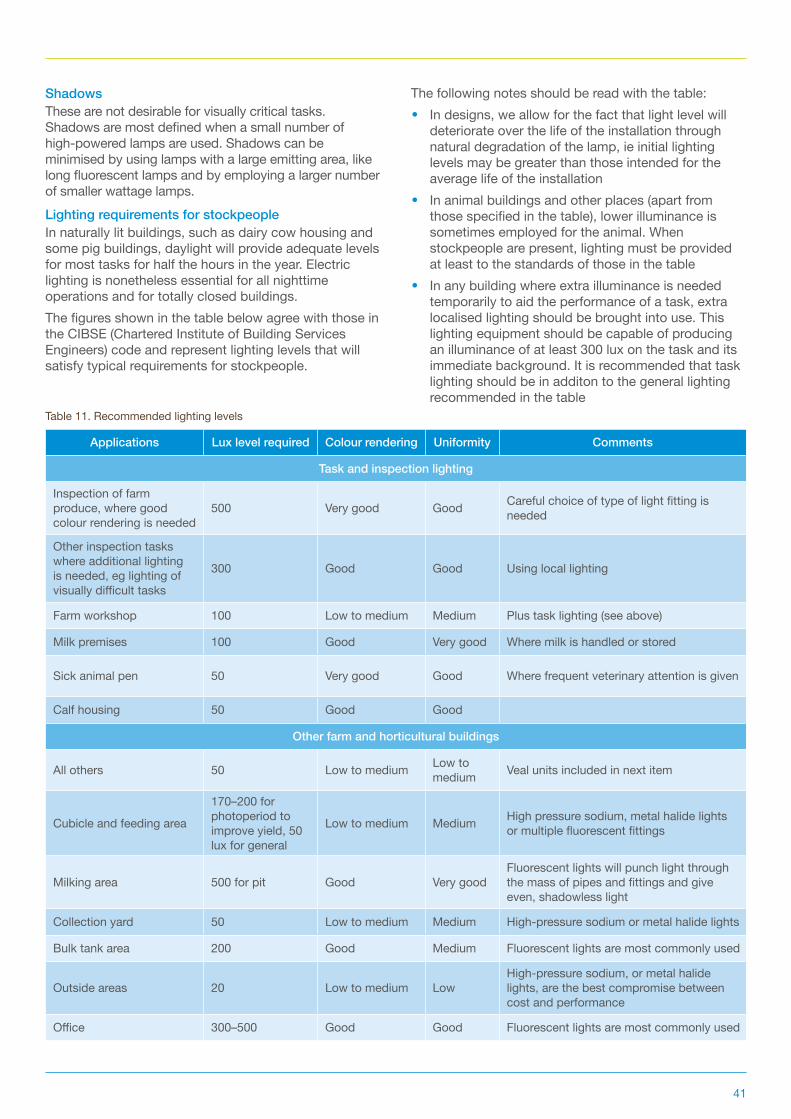
41
ShadowsThese are not desirable for visually critical tasks. Shadows are most defined when a small number of high-powered lamps are used. Shadows can be minimised by using lamps with a large emitting area, like long fluorescent lamps and by employing a larger number of smaller wattage lamps.Lighting requirements for stockpeopleIn naturally lit buildings, such as dairy cow housing and some pig buildings, daylight will provide adequate levels for most tasks for half the hours in the year. Electric lighting is nonetheless essential for all nighttime operations and for totally closed buildings. The figures shown in the table below agree with those in the CIBSE (Chartered Institute of Building Services Engineers) code and represent lighting levels that will satisfy typical requirements for stockpeople.
The following notes should be read with the table:
• In designs, we allow for the fact that light level will deteriorate over the life of the installation through natural degradation of the lamp, ie initial lighting levels may be greater than those intended for the average life of the installation
• In animal buildings and other places (apart from those specified in the table), lower illuminance is sometimes employed for the animal. When stockpeople are present, lighting must be provided at least to the standards of those in the table
• In any building where extra illuminance is needed temporarily to aid the performance of a task, extra localised lighting should be brought into use. This lighting equipment should be capable of producing an illuminance of at least 300 lux on the task and its immediate background. It is recommended that task lighting should be in additon to the general lighting recommended in the table
Applications Lux level required Colour rendering Uniformity Comments
Task and inspection lighting
Inspection of farm produce, where good colour rendering is needed
500 Very good Good Careful choice of type of light fitting is needed
Other inspection tasks where additional lighting is needed, eg lighting of visually difficult tasks
300 Good Good Using local lighting
Farm workshop 100 Low to medium Medium Plus task lighting (see above)
Milk premises 100 Good Very good Where milk is handled or stored
Sick animal pen 50 Very good Good Where frequent veterinary attention is given
Calf housing 50 Good Good
Other farm and horticultural buildings
All others 50 Low to medium Low to medium Veal units included in next item
Cubicle and feeding area
170–200 for photoperiod to improve yield, 50 lux for general
Low to medium Medium High pressure sodium, metal halide lights or multiple fluorescent fittings
Milking area 500 for pit Good Very goodFluorescent lights will punch light through the mass of pipes and fittings and give even, shadowless light
Collection yard 50 Low to medium Medium High-pressure sodium or metal halide lights
Bulk tank area 200 Good Medium Fluorescent lights are most commonly used
Outside areas 20 Low to medium LowHigh-pressure sodium, or metal halide lights, are the best compromise between cost and performance
Office 300–500 Good Good Fluorescent lights are most commonly used
Table 11. Recommended lighting levels
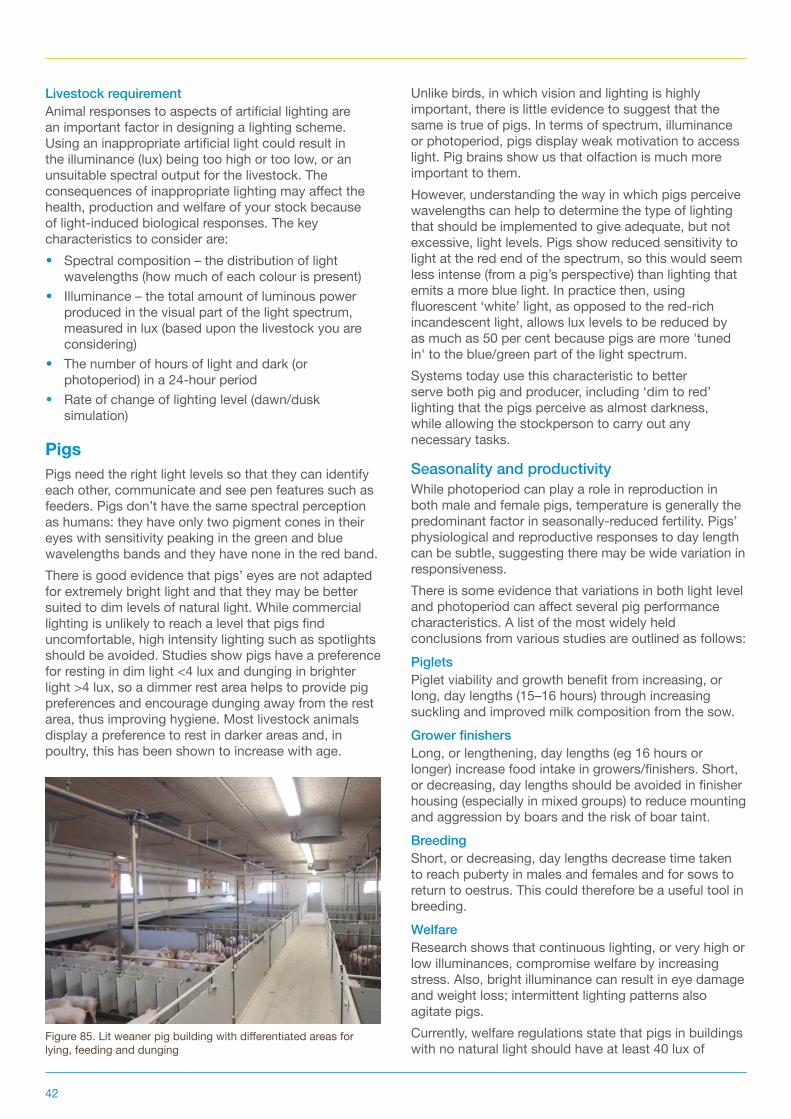
42
Livestock requirementAnimal responses to aspects of artificial lighting are an important factor in designing a lighting scheme. Using an inappropriate artificial light could result in the illuminance (lux) being too high or too low, or an unsuitable spectral output for the livestock. The consequences of inappropriate lighting may affect the health, production and welfare of your stock because of light-induced biological responses. The key characteristics to consider are:
• Spectral composition – the distribution of light wavelengths (how much of each colour is present)
• Illuminance – the total amount of luminous power produced in the visual part of the light spectrum, measured in lux (based upon the livestock you are considering)
• The number of hours of light and dark (or photoperiod) in a 24-hour period
• Rate of change of lighting level (dawn/dusk simulation)
PigsPigs need the right light levels so that they can identify each other, communicate and see pen features such as feeders. Pigs don’t have the same spectral perception as humans: they have only two pigment cones in their eyes with sensitivity peaking in the green and blue wavelengths bands and they have none in the red band. There is good evidence that pigs’ eyes are not adapted for extremely bright light and that they may be better suited to dim levels of natural light. While commercial lighting is unlikely to reach a level that pigs find uncomfortable, high intensity lighting such as spotlights should be avoided. Studies show pigs have a preference for resting in dim light <4 lux and dunging in brighter light >4 lux, so a dimmer rest area helps to provide pig preferences and encourage dunging away from the rest area, thus improving hygiene. Most livestock animals display a preference to rest in darker areas and, in poultry, this has been shown to increase with age.
Unlike birds, in which vision and lighting is highly important, there is little evidence to suggest that the same is true of pigs. In terms of spectrum, illuminance or photoperiod, pigs display weak motivation to access light. Pig brains show us that olfaction is much more important to them.However, understanding the way in which pigs perceive wavelengths can help to determine the type of lighting that should be implemented to give adequate, but not excessive, light levels. Pigs show reduced sensitivity to light at the red end of the spectrum, so this would seem less intense (from a pig’s perspective) than lighting that emits a more blue light. In practice then, using fluorescent ‘white’ light, as opposed to the red-rich incandescent light, allows lux levels to be reduced by as much as 50 per cent because pigs are more 'tuned in' to the blue/green part of the light spectrum.Systems today use this characteristic to better serve both pig and producer, including ‘dim to red’ lighting that the pigs perceive as almost darkness, while allowing the stockperson to carry out any necessary tasks.
Seasonality and productivityWhile photoperiod can play a role in reproduction in both male and female pigs, temperature is generally the predominant factor in seasonally-reduced fertility. Pigs’ physiological and reproductive responses to day length can be subtle, suggesting there may be wide variation in responsiveness. There is some evidence that variations in both light level and photoperiod can affect several pig performance characteristics. A list of the most widely held conclusions from various studies are outlined as follows:PigletsPiglet viability and growth benefit from increasing, or long, day lengths (15–16 hours) through increasing suckling and improved milk composition from the sow.Grower finishersLong, or lengthening, day lengths (eg 16 hours or longer) increase food intake in growers/finishers. Short, or decreasing, day lengths should be avoided in finisher housing (especially in mixed groups) to reduce mounting and aggression by boars and the risk of boar taint. BreedingShort, or decreasing, day lengths decrease time taken to reach puberty in males and females and for sows to return to oestrus. This could therefore be a useful tool in breeding.WelfareResearch shows that continuous lighting, or very high or low illuminances, compromise welfare by increasing stress. Also, bright illuminance can result in eye damage and weight loss; intermittent lighting patterns also agitate pigs. Currently, welfare regulations state that pigs in buildings with no natural light should have at least 40 lux of
Figure 85. Lit weaner pig building with differentiated areas for lying, feeding and dunging
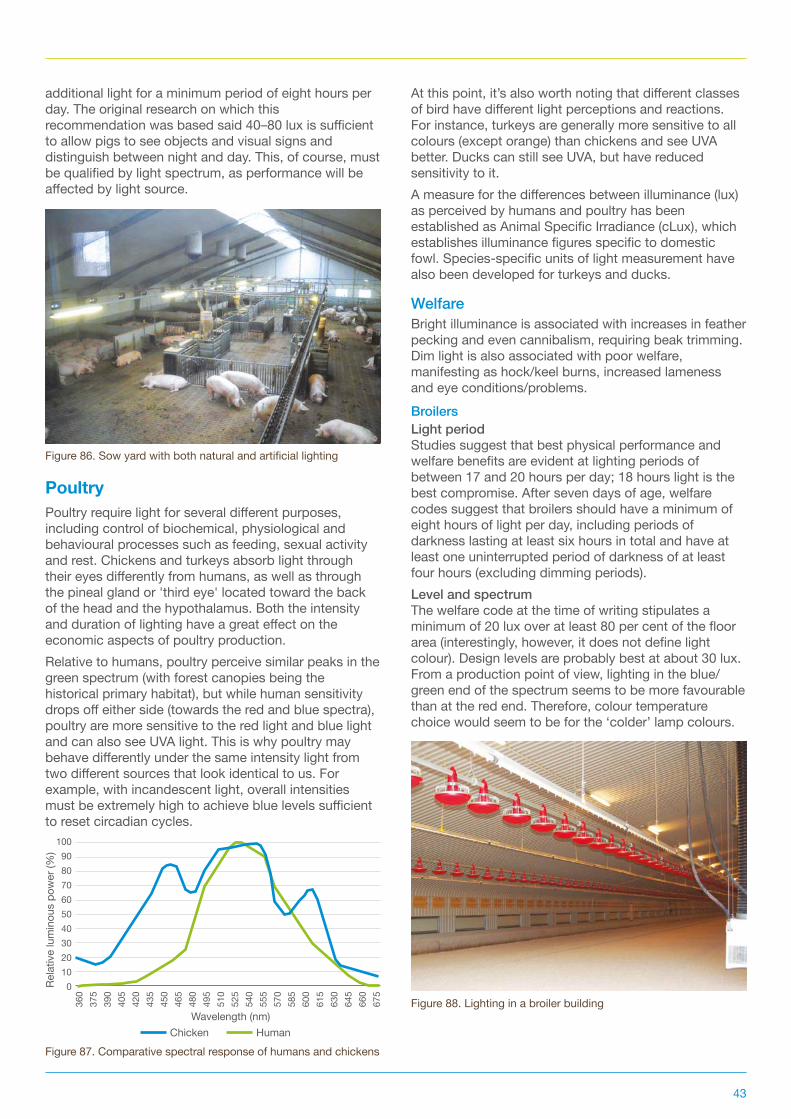
43
additional light for a minimum period of eight hours per day. The original research on which this recommendation was based said 40–80 lux is sufficient to allow pigs to see objects and visual signs and distinguish between night and day. This, of course, must be qualified by light spectrum, as performance will be affected by light source.
PoultryPoultry require light for several different purposes, including control of biochemical, physiological and behavioural processes such as feeding, sexual activity and rest. Chickens and turkeys absorb light through their eyes differently from humans, as well as through the pineal gland or 'third eye' located toward the back of the head and the hypothalamus. Both the intensity and duration of lighting have a great effect on the economic aspects of poultry production.Relative to humans, poultry perceive similar peaks in the green spectrum (with forest canopies being the historical primary habitat), but while human sensitivity drops off either side (towards the red and blue spectra), poultry are more sensitive to the red light and blue light and can also see UVA light. This is why poultry may behave differently under the same intensity light from two different sources that look identical to us. For example, with incandescent light, overall intensities must be extremely high to achieve blue levels sufficient to reset circadian cycles.
At this point, it’s also worth noting that different classes of bird have different light perceptions and reactions. For instance, turkeys are generally more sensitive to all colours (except orange) than chickens and see UVA better. Ducks can still see UVA, but have reduced sensitivity to it.A measure for the differences between illuminance (lux) as perceived by humans and poultry has been established as Animal Specific Irradiance (cLux), which establishes illuminance figures specific to domestic fowl. Species-specific units of light measurement have also been developed for turkeys and ducks.
WelfareBright illuminance is associated with increases in feather pecking and even cannibalism, requiring beak trimming. Dim light is also associated with poor welfare, manifesting as hock/keel burns, increased lameness and eye conditions/problems. BroilersLight periodStudies suggest that best physical performance and welfare benefits are evident at lighting periods of between 17 and 20 hours per day; 18 hours light is the best compromise. After seven days of age, welfare codes suggest that broilers should have a minimum of eight hours of light per day, including periods of darkness lasting at least six hours in total and have at least one uninterrupted period of darkness of at least four hours (excluding dimming periods).Level and spectrumThe welfare code at the time of writing stipulates a minimum of 20 lux over at least 80 per cent of the floor area (interestingly, however, it does not define light colour). Design levels are probably best at about 30 lux. From a production point of view, lighting in the blue/green end of the spectrum seems to be more favourable than at the red end. Therefore, colour temperature choice would seem to be for the ‘colder’ lamp colours.
Figure 86. Sow yard with both natural and artificial lighting
Figure 87. Comparative spectral response of humans and chickens
100908070605040302010
0Rela
tive
lum
inou
s po
wer
(%)
Wavelength (nm)Chicken Human
360
375
390
405
420
435
450
465
480
495
510
525
540
555
570
585
600
615
630
645
660
675
Figure 88. Lighting in a broiler building
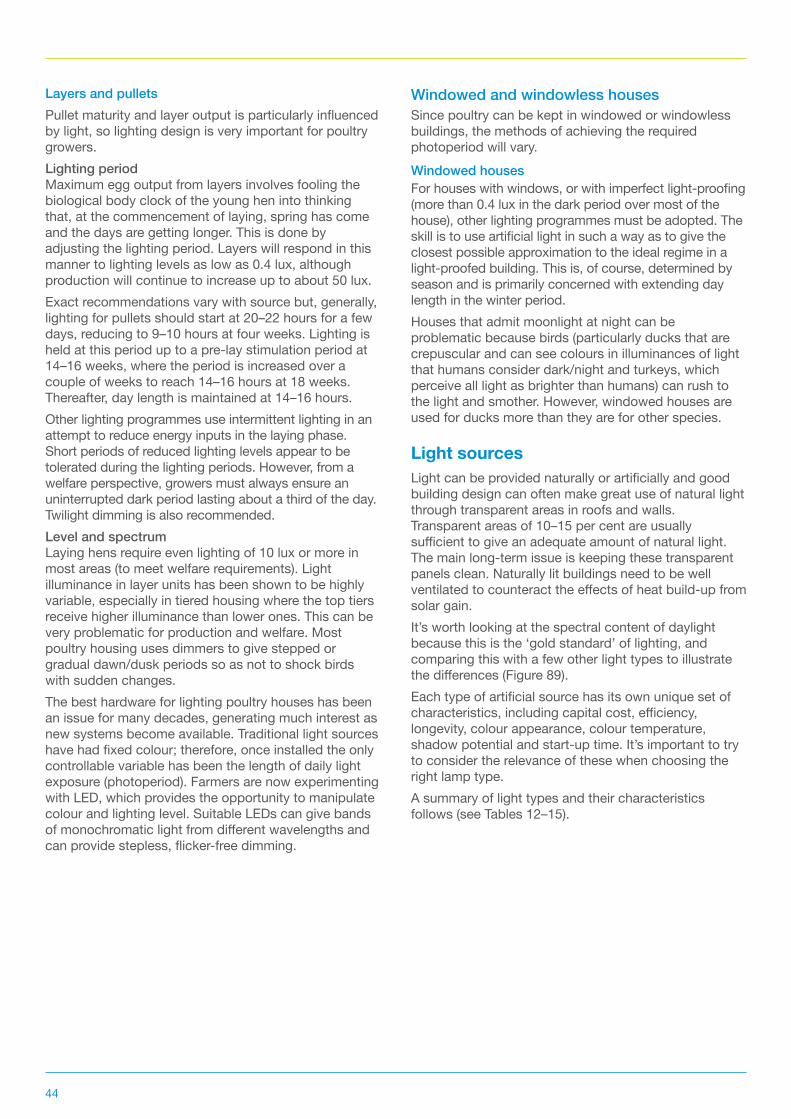
44
Layers and pulletsPullet maturity and layer output is particularly influenced by light, so lighting design is very important for poultry growers. Lighting periodMaximum egg output from layers involves fooling the biological body clock of the young hen into thinking that, at the commencement of laying, spring has come and the days are getting longer. This is done by adjusting the lighting period. Layers will respond in this manner to lighting levels as low as 0.4 lux, although production will continue to increase up to about 50 lux.Exact recommendations vary with source but, generally, lighting for pullets should start at 20–22 hours for a few days, reducing to 9–10 hours at four weeks. Lighting is held at this period up to a pre-lay stimulation period at 14–16 weeks, where the period is increased over a couple of weeks to reach 14–16 hours at 18 weeks. Thereafter, day length is maintained at 14–16 hours.Other lighting programmes use intermittent lighting in an attempt to reduce energy inputs in the laying phase. Short periods of reduced lighting levels appear to be tolerated during the lighting periods. However, from a welfare perspective, growers must always ensure an uninterrupted dark period lasting about a third of the day. Twilight dimming is also recommended.Level and spectrumLaying hens require even lighting of 10 lux or more in most areas (to meet welfare requirements). Light illuminance in layer units has been shown to be highly variable, especially in tiered housing where the top tiers receive higher illuminance than lower ones. This can be very problematic for production and welfare. Most poultry housing uses dimmers to give stepped or gradual dawn/dusk periods so as not to shock birds with sudden changes.The best hardware for lighting poultry houses has been an issue for many decades, generating much interest as new systems become available. Traditional light sources have had fixed colour; therefore, once installed the only controllable variable has been the length of daily light exposure (photoperiod). Farmers are now experimenting with LED, which provides the opportunity to manipulate colour and lighting level. Suitable LEDs can give bands of monochromatic light from different wavelengths and can provide stepless, flicker-free dimming.
Windowed and windowless housesSince poultry can be kept in windowed or windowless buildings, the methods of achieving the required photoperiod will vary. Windowed housesFor houses with windows, or with imperfect light-proofing (more than 0.4 lux in the dark period over most of the house), other lighting programmes must be adopted. The skill is to use artificial light in such a way as to give the closest possible approximation to the ideal regime in a light-proofed building. This is, of course, determined by season and is primarily concerned with extending day length in the winter period.Houses that admit moonlight at night can be problematic because birds (particularly ducks that are crepuscular and can see colours in illuminances of light that humans consider dark/night and turkeys, which perceive all light as brighter than humans) can rush to the light and smother. However, windowed houses are used for ducks more than they are for other species.
Light sourcesLight can be provided naturally or artificially and good building design can often make great use of natural light through transparent areas in roofs and walls. Transparent areas of 10–15 per cent are usually sufficient to give an adequate amount of natural light. The main long-term issue is keeping these transparent panels clean. Naturally lit buildings need to be well ventilated to counteract the effects of heat build-up from solar gain.It’s worth looking at the spectral content of daylight because this is the ‘gold standard’ of lighting, and comparing this with a few other light types to illustrate the differences (Figure 89).Each type of artificial source has its own unique set of characteristics, including capital cost, efficiency, longevity, colour appearance, colour temperature, shadow potential and start-up time. It’s important to try to consider the relevance of these when choosing the right lamp type.A summary of light types and their characteristics follows (see Tables 12–15).
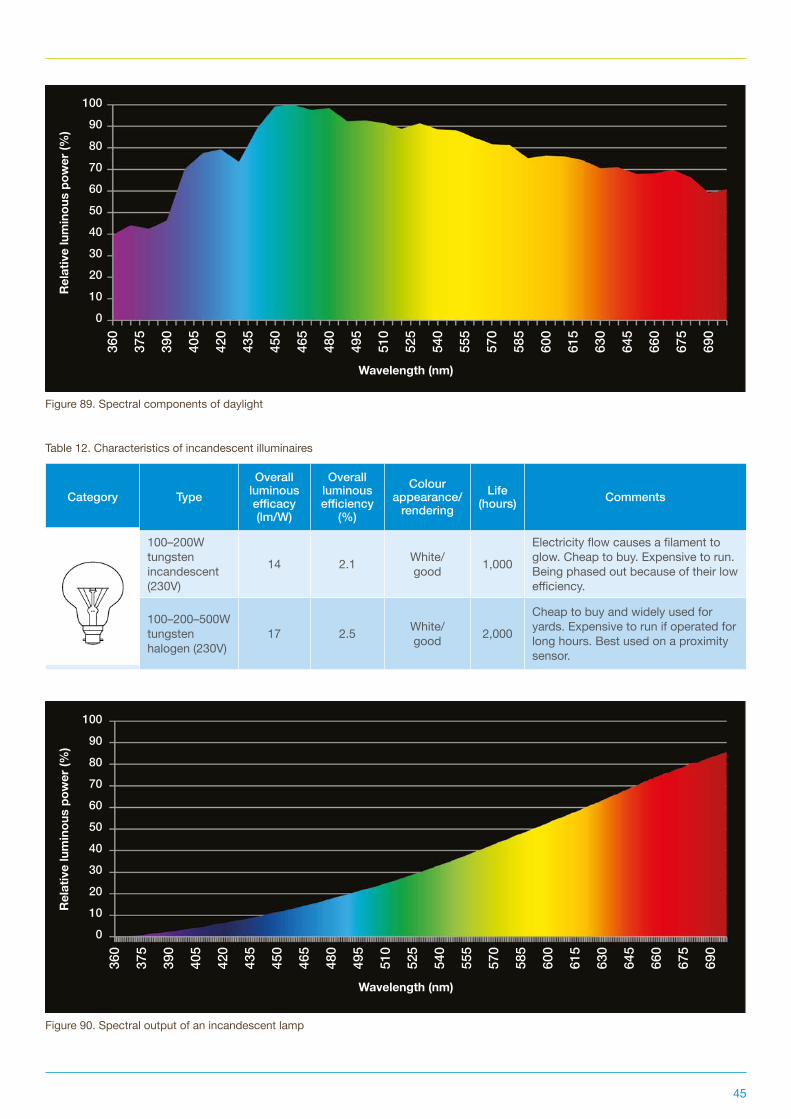
45
Figure 89. Spectral components of daylight
Wavelength (nm)
Rel
ativ
e lu
min
ous
pow
er (%
)
100
90
80
70
60
50
40
30
20
10
0
360
375
390
405
420
435
450
465
480
495
510
525
540
555
570
585
600
615
630
645
660
675
690
Category TypeOverall
luminous efficacy (lm/W)
Overall luminous efficiency
(%)
Colour appearance/
renderingLife
(hours) Comments
Incandescent 100–200W tungsten incandescent (230V)
14 2.1 White/ good 1,000
Electricity flow causes a filament to glow. Cheap to buy. Expensive to run. Being phased out because of their low efficiency.
100–200–500W tungsten halogen (230V)
17 2.5 White/ good 2,000
Cheap to buy and widely used for yards. Expensive to run if operated for long hours. Best used on a proximity sensor.
Table 12. Characteristics of incandescent illuminaires
Figure 90. Spectral output of an incandescent lamp
Rel
ativ
e lu
min
ous
pow
er (%
)
100
90
80
70
60
50
40
30
20
10
0
Wavelength (nm)
360
375
390
405
420
435
450
465
480
495
510
525
540
555
570
585
600
615
630
645
660
675
690
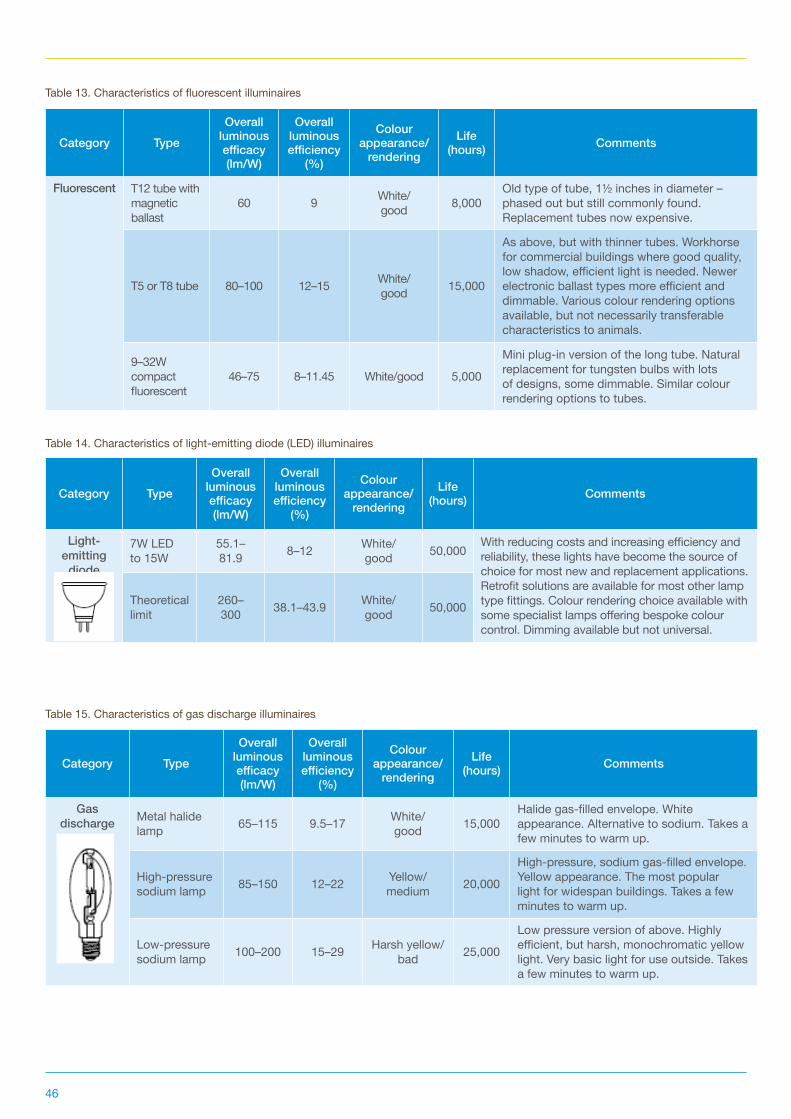
46
Table 13. Characteristics of fluorescent illuminaires
Category TypeOverall
luminous efficacy (lm/W)
Overall luminous efficiency
(%)
Colour appearance/
renderingLife
(hours) Comments
Fluorescent T12 tube with magnetic ballast
60 9 White/ good 8,000
Old type of tube, 1½ inches in diameter – phased out but still commonly found. Replacement tubes now expensive.
T5 or T8 tube 80–100 12–15 White/ good 15,000
As above, but with thinner tubes. Workhorse for commercial buildings where good quality, low shadow, efficient light is needed. Newer electronic ballast types more efficient and dimmable. Various colour rendering options available, but not necessarily transferable characteristics to animals.
9–32W compact fluorescent
46–75 8–11.45 White/good 5,000
Mini plug-in version of the long tube. Natural replacement for tungsten bulbs with lots of designs, some dimmable. Similar colour rendering options to tubes.
Category TypeOverall
luminous efficacy (lm/W)
Overall luminous efficiency
(%)
Colour appearance/
renderingLife
(hours) Comments
Light-emitting
diode
7W LED to 15W
55.1– 81.9 8–12 White/
good 50,000With reducing costs and increasing efficiency and reliability, these lights have become the source of choice for most new and replacement applications. Retrofit solutions are available for most other lamp type fittings. Colour rendering choice available with some specialist lamps offering bespoke colour control. Dimming available but not universal.
Theoretical limit
260– 300 38.1–43.9 White/
good 50,000
Table 14. Characteristics of light-emitting diode (LED) illuminaires
Category TypeOverall
luminous efficacy (lm/W)
Overall luminous efficiency
(%)
Colour appearance/
renderingLife
(hours) Comments
Gas discharge Metal halide
lamp 65–115 9.5–17 White/ good 15,000
Halide gas-filled envelope. White appearance. Alternative to sodium. Takes a few minutes to warm up.
High-pressure sodium lamp 85–150 12–22 Yellow/
medium 20,000
High-pressure, sodium gas-filled envelope. Yellow appearance. The most popular light for widespan buildings. Takes a few minutes to warm up.
Low-pressure sodium lamp 100–200 15–29 Harsh yellow/
bad 25,000
Low pressure version of above. Highly efficient, but harsh, monochromatic yellow light. Very basic light for use outside. Takes a few minutes to warm up.
Table 15. Characteristics of gas discharge illuminaires
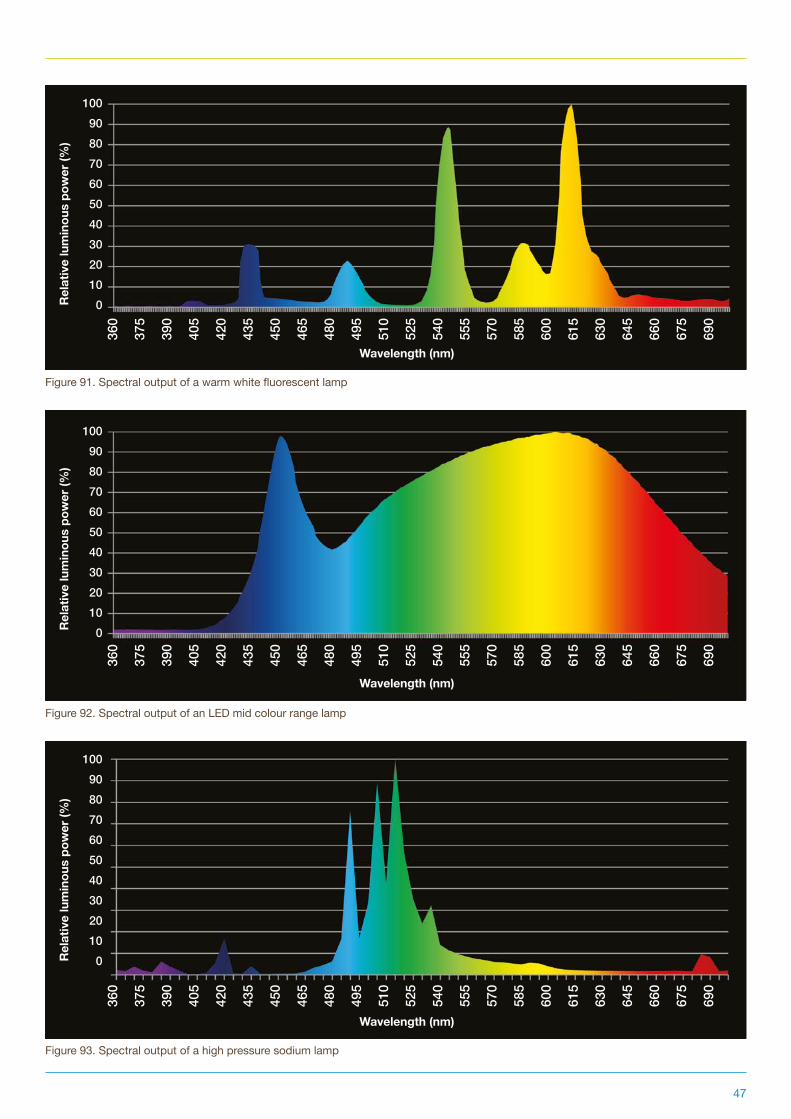
47
Figure 91. Spectral output of a warm white fluorescent lamp
Rel
ativ
e lu
min
ous
pow
er (%
)
Wavelength (nm)
Rel
ativ
e lu
min
ous
pow
er (%
)
1009080706050403020100
360
375
390
405
420
435
450
465
480
495
510
525
540
555
570
585
600
615
630
645
660
675
690
Figure 93. Spectral output of a high pressure sodium lamp
Wavelength (nm)
Rel
ativ
e lu
min
ous
pow
er (%
)
1009080706050403020100
360
375
390
405
420
435
450
465
480
495
510
525
540
555
570
585
600
615
630
645
660
675
690
Figure 92. Spectral output of an LED mid colour range lamp
Wavelength (nm)
Rel
ativ
e lu
min
ous
pow
er (%
)
1009080706050403020100
360
375
390
405
420
435
450
465
480
495
510
525
540
555
570
585
600
615
630
645
660
675
690
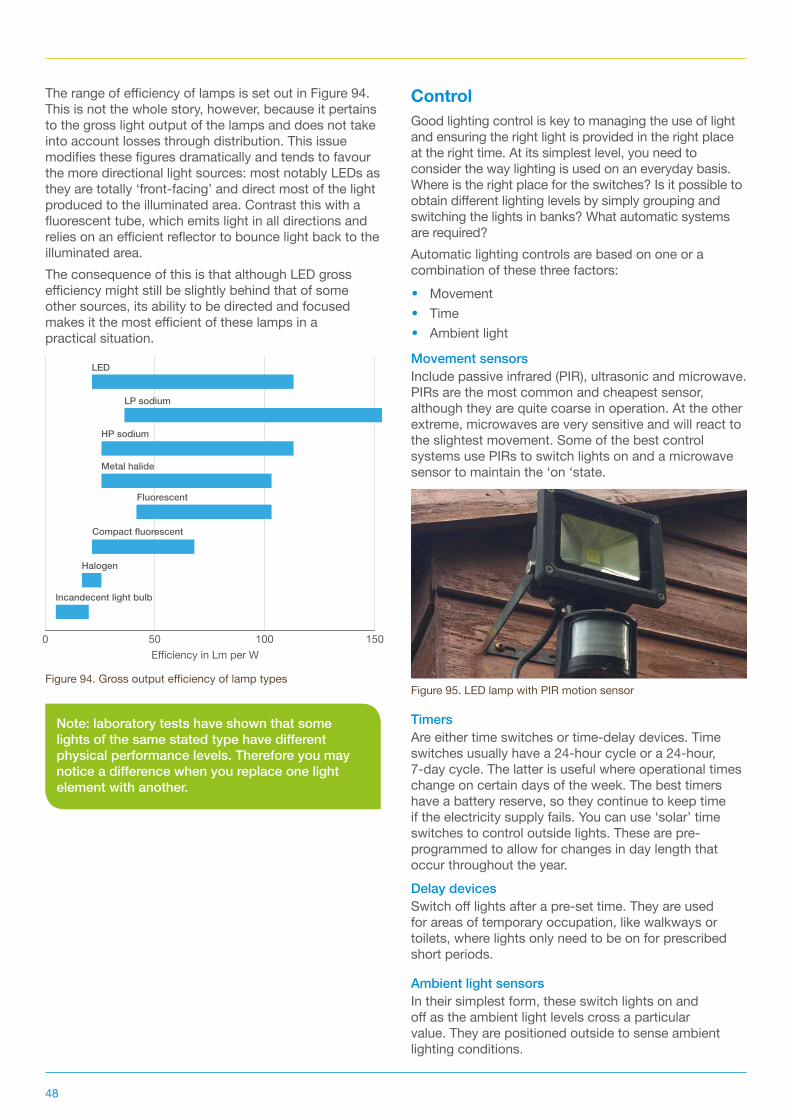
48
The range of efficiency of lamps is set out in Figure 94. This is not the whole story, however, because it pertains to the gross light output of the lamps and does not take into account losses through distribution. This issue modifies these figures dramatically and tends to favour the more directional light sources: most notably LEDs as they are totally ‘front-facing’ and direct most of the light produced to the illuminated area. Contrast this with a fluorescent tube, which emits light in all directions and relies on an efficient reflector to bounce light back to the illuminated area.The consequence of this is that although LED gross efficiency might still be slightly behind that of some other sources, its ability to be directed and focused makes it the most efficient of these lamps in a practical situation.
Control Good lighting control is key to managing the use of light and ensuring the right light is provided in the right place at the right time. At its simplest level, you need to consider the way lighting is used on an everyday basis. Where is the right place for the switches? Is it possible to obtain different lighting levels by simply grouping and switching the lights in banks? What automatic systems are required?Automatic lighting controls are based on one or a combination of these three factors:
• Movement• Time• Ambient light
Movement sensorsInclude passive infrared (PIR), ultrasonic and microwave. PIRs are the most common and cheapest sensor, although they are quite coarse in operation. At the other extreme, microwaves are very sensitive and will react to the slightest movement. Some of the best control systems use PIRs to switch lights on and a microwave sensor to maintain the ‘on ‘state.
TimersAre either time switches or time-delay devices. Time switches usually have a 24-hour cycle or a 24-hour, 7-day cycle. The latter is useful where operational times change on certain days of the week. The best timers have a battery reserve, so they continue to keep time if the electricity supply fails. You can use ‘solar’ time switches to control outside lights. These are pre-programmed to allow for changes in day length that occur throughout the year.Delay devicesSwitch off lights after a pre-set time. They are used for areas of temporary occupation, like walkways or toilets, where lights only need to be on for prescribed short periods.
Ambient light sensorsIn their simplest form, these switch lights on and off as the ambient light levels cross a particular value. They are positioned outside to sense ambient lighting conditions.
Note: laboratory tests have shown that some lights of the same stated type have different physical performance levels. Therefore you may notice a difference when you replace one light element with another.
LED
LP sodium
HP sodium
Metal halide
Fluorescent
Compact fluorescent
Halogen
Incandecent light bulb
Efficiency in Lm per W0 50 100 150
Figure 94. Gross output efficiency of lamp typesFigure 95. LED lamp with PIR motion sensor
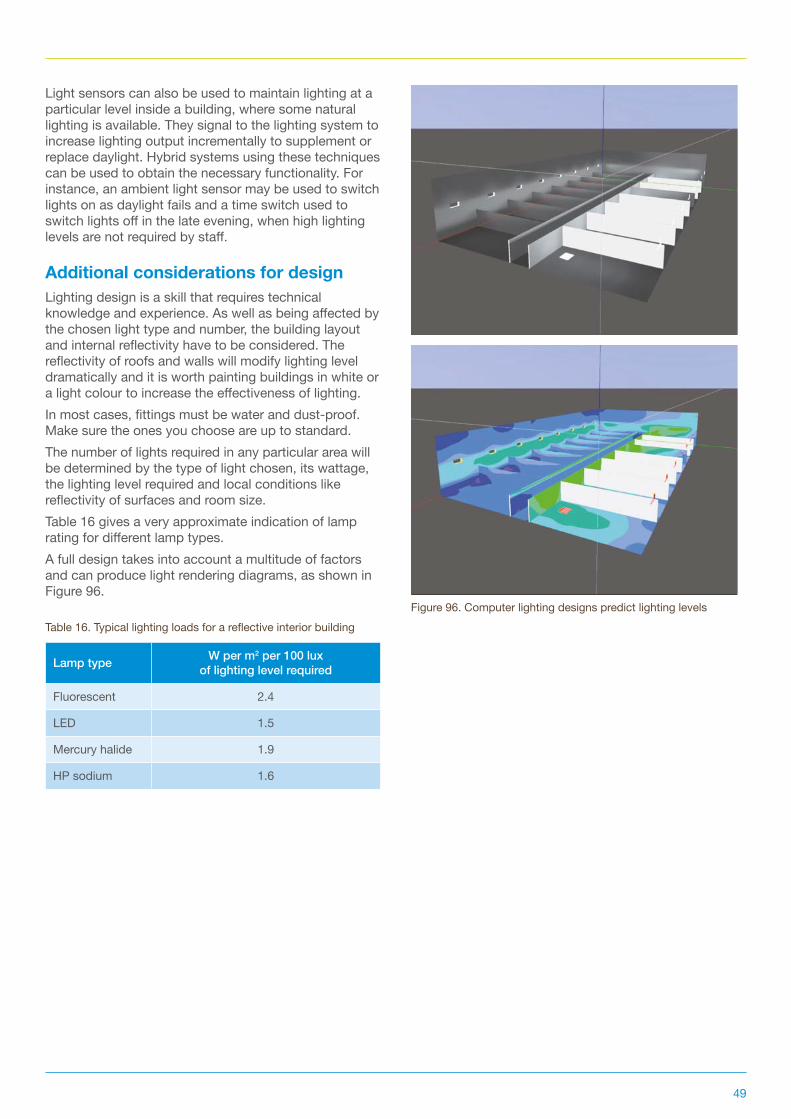
49
Light sensors can also be used to maintain lighting at a particular level inside a building, where some natural lighting is available. They signal to the lighting system to increase lighting output incrementally to supplement or replace daylight. Hybrid systems using these techniques can be used to obtain the necessary functionality. For instance, an ambient light sensor may be used to switch lights on as daylight fails and a time switch used to switch lights off in the late evening, when high lighting levels are not required by staff.
Additional considerations for designLighting design is a skill that requires technical knowledge and experience. As well as being affected by the chosen light type and number, the building layout and internal reflectivity have to be considered. The reflectivity of roofs and walls will modify lighting level dramatically and it is worth painting buildings in white or a light colour to increase the effectiveness of lighting.In most cases, fittings must be water and dust-proof. Make sure the ones you choose are up to standard.The number of lights required in any particular area will be determined by the type of light chosen, its wattage, the lighting level required and local conditions like reflectivity of surfaces and room size.Table 16 gives a very approximate indication of lamp rating for different lamp types.A full design takes into account a multitude of factors and can produce light rendering diagrams, as shown in Figure 96.
Lamp type W per m2 per 100 lux of lighting level required
Fluorescent 2.4
LED 1.5
Mercury halide 1.9
HP sodium 1.6
Table 16. Typical lighting loads for a reflective interior buildingFigure 96. Computer lighting designs predict lighting levels
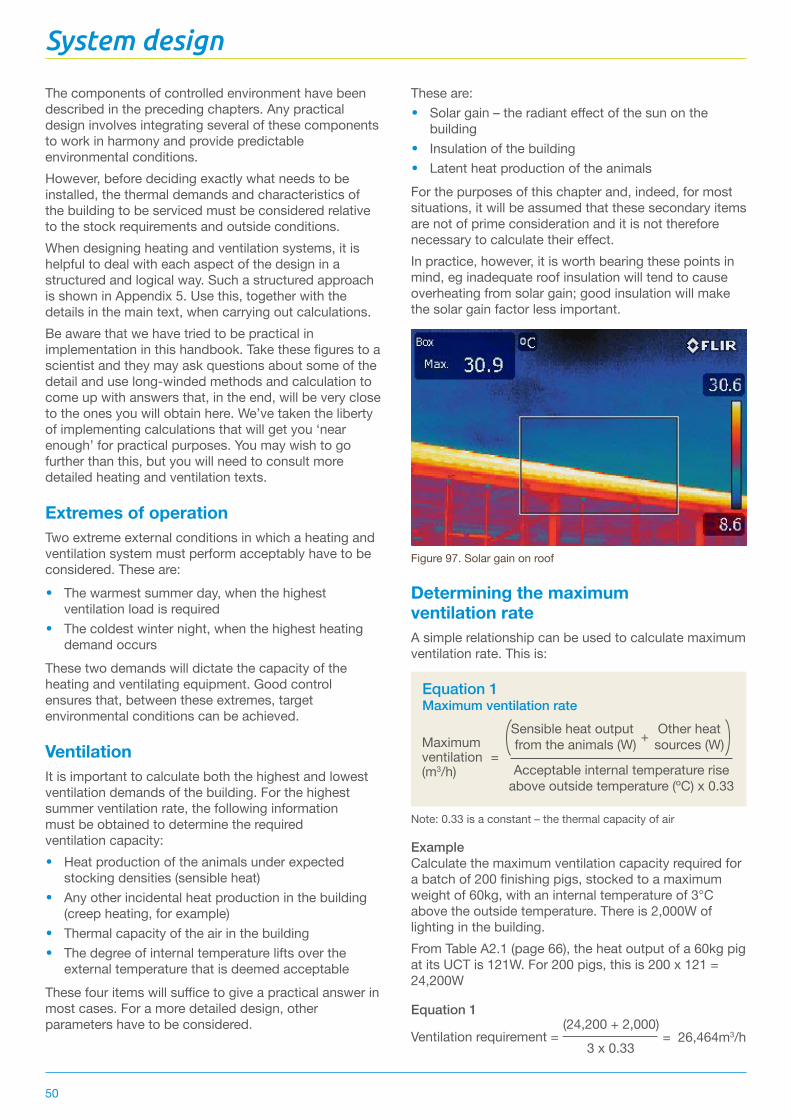
50
The components of controlled environment have been described in the preceding chapters. Any practical design involves integrating several of these components to work in harmony and provide predictable environmental conditions. However, before deciding exactly what needs to be installed, the thermal demands and characteristics of the building to be serviced must be considered relative to the stock requirements and outside conditions.When designing heating and ventilation systems, it is helpful to deal with each aspect of the design in a structured and logical way. Such a structured approach is shown in Appendix 5. Use this, together with the details in the main text, when carrying out calculations. Be aware that we have tried to be practical in implementation in this handbook. Take these figures to a scientist and they may ask questions about some of the detail and use long-winded methods and calculation to come up with answers that, in the end, will be very close to the ones you will obtain here. We’ve taken the liberty of implementing calculations that will get you ‘near enough’ for practical purposes. You may wish to go further than this, but you will need to consult more detailed heating and ventilation texts.
Extremes of operationTwo extreme external conditions in which a heating and ventilation system must perform acceptably have to be considered. These are:
• The warmest summer day, when the highest ventilation load is required
• The coldest winter night, when the highest heating demand occurs
These two demands will dictate the capacity of the heating and ventilating equipment. Good control ensures that, between these extremes, target environmental conditions can be achieved.
VentilationIt is important to calculate both the highest and lowest ventilation demands of the building. For the highest summer ventilation rate, the following information must be obtained to determine the required ventilation capacity:
• Heat production of the animals under expected stocking densities (sensible heat)
• Any other incidental heat production in the building (creep heating, for example)
• Thermal capacity of the air in the building• The degree of internal temperature lifts over the
external temperature that is deemed acceptableThese four items will suffice to give a practical answer in most cases. For a more detailed design, other parameters have to be considered.
These are:• Solar gain – the radiant effect of the sun on the
building• Insulation of the building• Latent heat production of the animalsFor the purposes of this chapter and, indeed, for most situations, it will be assumed that these secondary items are not of prime consideration and it is not therefore necessary to calculate their effect. In practice, however, it is worth bearing these points in mind, eg inadequate roof insulation will tend to cause overheating from solar gain; good insulation will make the solar gain factor less important.
Determining the maximum ventilation rateA simple relationship can be used to calculate maximum ventilation rate. This is:
–
ExampleCalculate the maximum ventilation capacity required for a batch of 200 finishing pigs, stocked to a maximum weight of 60kg, with an internal temperature of 3°C above the outside temperature. There is 2,000W of lighting in the building.From Table A2.1 (page 66), the heat output of a 60kg pig at its UCT is 121W. For 200 pigs, this is 200 x 121 = 24,200W
Equation 1
System design
Figure 97. Solar gain on roof
Note: 0.33 is a constant – the thermal capacity of air
Ventilation requirement = = 26,464m3/h(24,200 + 2,000)
3 x 0.33
Equation 1 Maximum ventilation rate
Maximum ventilation (m3/h)
Sensible heat output from the animals (W) +
Acceptable internal temperature rise above outside temperature (ºC) x 0.33
=
Other heat sources (W)
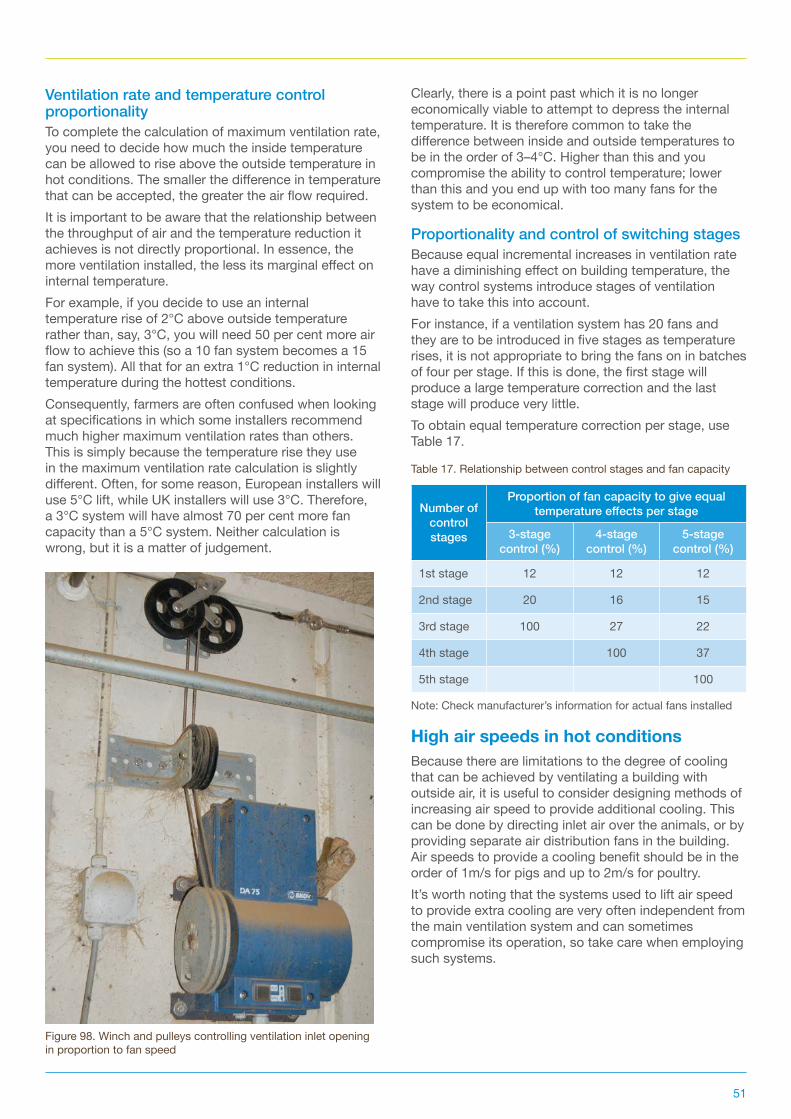
51
Ventilation rate and temperature control proportionalityTo complete the calculation of maximum ventilation rate, you need to decide how much the inside temperature can be allowed to rise above the outside temperature in hot conditions. The smaller the difference in temperature that can be accepted, the greater the air flow required. It is important to be aware that the relationship between the throughput of air and the temperature reduction it achieves is not directly proportional. In essence, the more ventilation installed, the less its marginal effect on internal temperature.For example, if you decide to use an internal temperature rise of 2°C above outside temperature rather than, say, 3°C, you will need 50 per cent more air flow to achieve this (so a 10 fan system becomes a 15 fan system). All that for an extra 1°C reduction in internal temperature during the hottest conditions. Consequently, farmers are often confused when looking at specifications in which some installers recommend much higher maximum ventilation rates than others. This is simply because the temperature rise they use in the maximum ventilation rate calculation is slightly different. Often, for some reason, European installers will use 5°C lift, while UK installers will use 3°C. Therefore, a 3°C system will have almost 70 per cent more fan capacity than a 5°C system. Neither calculation is wrong, but it is a matter of judgement.
Clearly, there is a point past which it is no longer economically viable to attempt to depress the internal temperature. It is therefore common to take the difference between inside and outside temperatures to be in the order of 3–4°C. Higher than this and you compromise the ability to control temperature; lower than this and you end up with too many fans for the system to be economical.
Proportionality and control of switching stagesBecause equal incremental increases in ventilation rate have a diminishing effect on building temperature, the way control systems introduce stages of ventilation have to take this into account.For instance, if a ventilation system has 20 fans and they are to be introduced in five stages as temperature rises, it is not appropriate to bring the fans on in batches of four per stage. If this is done, the first stage will produce a large temperature correction and the last stage will produce very little.To obtain equal temperature correction per stage, use Table 17.
High air speeds in hot conditionsBecause there are limitations to the degree of cooling that can be achieved by ventilating a building with outside air, it is useful to consider designing methods of increasing air speed to provide additional cooling. This can be done by directing inlet air over the animals, or by providing separate air distribution fans in the building. Air speeds to provide a cooling benefit should be in the order of 1m/s for pigs and up to 2m/s for poultry.It’s worth noting that the systems used to lift air speed to provide extra cooling are very often independent from the main ventilation system and can sometimes compromise its operation, so take care when employing such systems.
Table 17. Relationship between control stages and fan capacity
Note: Check manufacturer’s information for actual fans installed
Number of control stages
Proportion of fan capacity to give equal temperature effects per stage
3-stage control (%)
4-stage control (%)
5-stage control (%)
1st stage 12 12 12
2nd stage 20 16 15
3rd stage 100 27 22
4th stage 100 37
5th stage 100
Figure 98. Winch and pulleys controlling ventilation inlet opening in proportion to fan speed
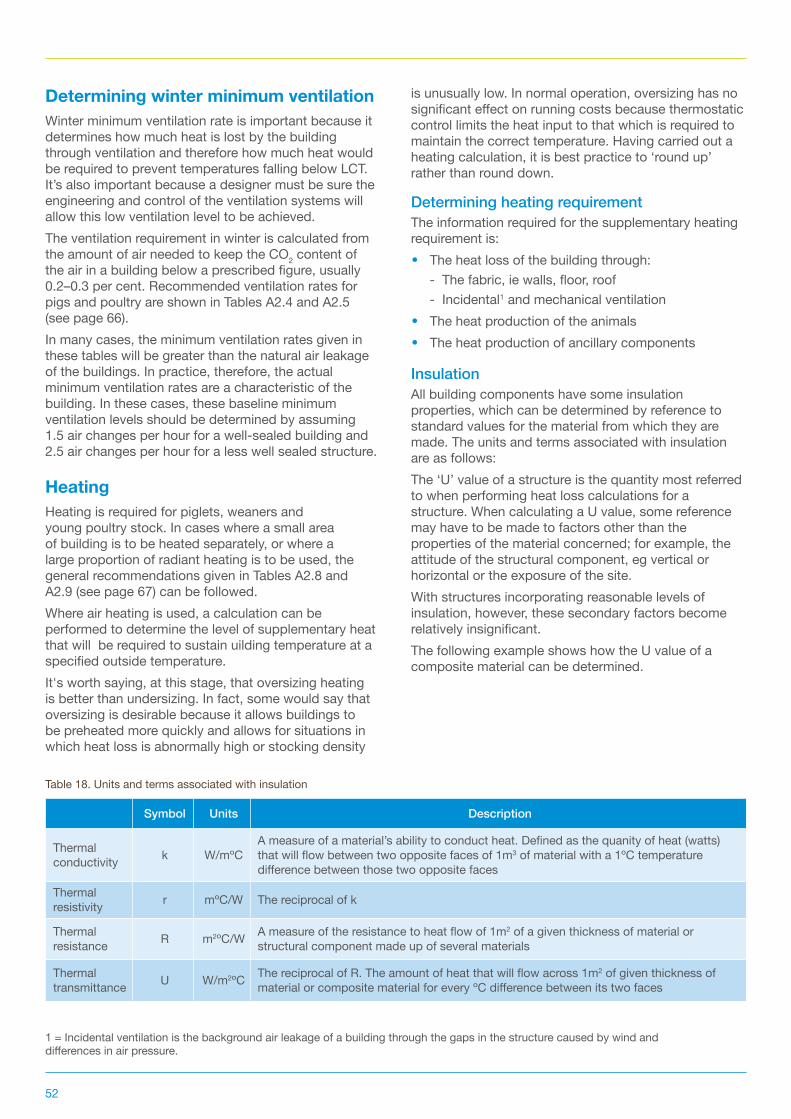
52
Determining winter minimum ventilationWinter minimum ventilation rate is important because it determines how much heat is lost by the building through ventilation and therefore how much heat would be required to prevent temperatures falling below LCT. It’s also important because a designer must be sure the engineering and control of the ventilation systems will allow this low ventilation level to be achieved.The ventilation requirement in winter is calculated from the amount of air needed to keep the CO2 content of the air in a building below a prescribed figure, usually 0.2–0.3 per cent. Recommended ventilation rates for pigs and poultry are shown in Tables A2.4 and A2.5 (see page 66). In many cases, the minimum ventilation rates given in these tables will be greater than the natural air leakage of the buildings. In practice, therefore, the actual minimum ventilation rates are a characteristic of the building. In these cases, these baseline minimum ventilation levels should be determined by assuming 1.5 air changes per hour for a well-sealed building and 2.5 air changes per hour for a less well sealed structure.
HeatingHeating is required for piglets, weaners and young poultry stock. In cases where a small area of building is to be heated separately, or where a large proportion of radiant heating is to be used, the general recommendations given in Tables A2.8 and A2.9 (see page 67) can be followed. Where air heating is used, a calculation can be performed to determine the level of supplementary heat that will be required to sustain uilding temperature at a specified outside temperature.It's worth saying, at this stage, that oversizing heating is better than undersizing. In fact, some would say that oversizing is desirable because it allows buildings to be preheated more quickly and allows for situations in which heat loss is abnormally high or stocking density
is unusually low. In normal operation, oversizing has no significant effect on running costs because thermostatic control limits the heat input to that which is required to maintain the correct temperature. Having carried out a heating calculation, it is best practice to ‘round up’ rather than round down.
Determining heating requirementThe information required for the supplementary heating requirement is:
• The heat loss of the building through: - The fabric, ie walls, floor, roof - Incidental1 and mechanical ventilation
• The heat production of the animals
• The heat production of ancillary components
InsulationAll building components have some insulation properties, which can be determined by reference to standard values for the material from which they are made. The units and terms associated with insulation are as follows:The ‘U’ value of a structure is the quantity most referred to when performing heat loss calculations for a structure. When calculating a U value, some reference may have to be made to factors other than the properties of the material concerned; for example, the attitude of the structural component, eg vertical or horizontal or the exposure of the site. With structures incorporating reasonable levels of insulation, however, these secondary factors become relatively insignificant.The following example shows how the U value of a composite material can be determined.
1 = Incidental ventilation is the background air leakage of a building through the gaps in the structure caused by wind and differences in air pressure.
Table 18. Units and terms associated with insulation
Symbol Units Description
Thermal conductivity k W/mºC
A measure of a material’s ability to conduct heat. Defined as the quanity of heat (watts) that will flow between two opposite faces of 1m3 of material with a 1ºC temperature difference between those two opposite faces
Thermal resistivity r mºC/W The reciprocal of k
Thermal resistance R m2ºC/W A measure of the resistance to heat flow of 1m2 of a given thickness of material or
structural component made up of several materials
Thermal transmittance U W/m2ºC The reciprocal of R. The amount of heat that will flow across 1m2 of given thickness of
material or composite material for every ºC difference between its two faces
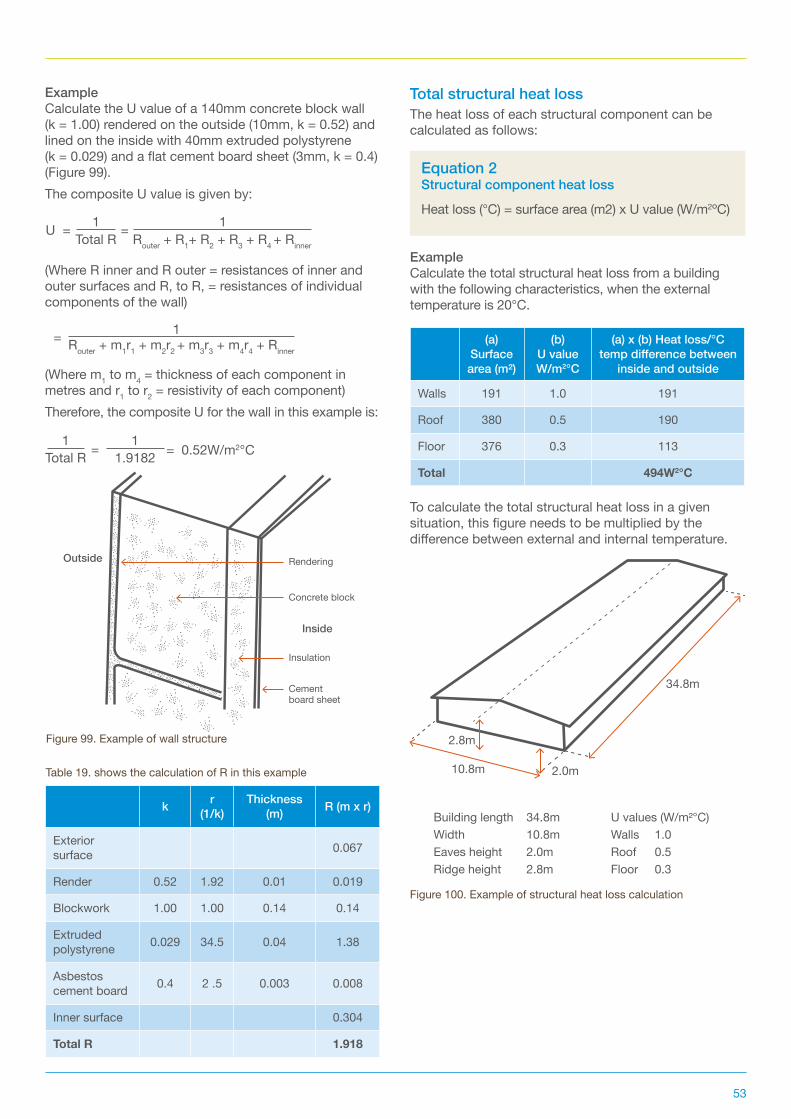
53
ExampleCalculate the U value of a 140mm concrete block wall (k = 1.00) rendered on the outside (10mm, k = 0.52) and lined on the inside with 40mm extruded polystyrene (k = 0.029) and a flat cement board sheet (3mm, k = 0.4) (Figure 99).The composite U value is given by:
(Where R inner and R outer = resistances of inner and outer surfaces and R, to R, = resistances of individual components of the wall)
(Where m1 to m4 = thickness of each component in metres and r1 to r2 = resistivity of each component)Therefore, the composite U for the wall in this example is:
Total structural heat lossThe heat loss of each structural component can be calculated as follows:
ExampleCalculate the total structural heat loss from a building with the following characteristics, when the external temperature is 20°C.
To calculate the total structural heat loss in a given situation, this figure needs to be multiplied by the difference between external and internal temperature.
= 1Router + m1r1 + m2r2 + m3r3 + m4r4 + Rinner
Figure 99. Example of wall structure
k r (1/k)
Thickness (m) R (m x r)
Exterior surface 0.067
Render 0.52 1.92 0.01 0.019
Blockwork 1.00 1.00 0.14 0.14
Extruded polystyrene 0.029 34.5 0.04 1.38
Asbestos cement board 0.4 2 .5 0.003 0.008
Inner surface 0.304
Total R 1.918
=1 1Total R 1.9182 = 0.52W/m2°C
U = = 11Router + R1+ R2 + R3 + R4 + RinnerTotal R
Rendering
Concrete block
Insulation
Cement board sheet
Inside
Outside
(a) Surface area (m²)
(b) U value W/m2°C
(a) x (b) Heat loss/°C temp difference between
inside and outside
Walls 191 1.0 191
Roof 380 0.5 190
Floor 376 0.3 113
Total 494W2°C
Equation 2 Structural component heat loss
Heat loss (°C) = surface area (m2) x U value (W/m2ºC)
Figure 100. Example of structural heat loss calculation
10.8m
Building lengthWidthEaves heightRidge height
34.8m10.8m2.0m2.8m
1.00.50.3
U values (W/m²°C)WallsRoofFloor
2.8m
2.0m
34.8m
Table 19. shows the calculation of R in this example
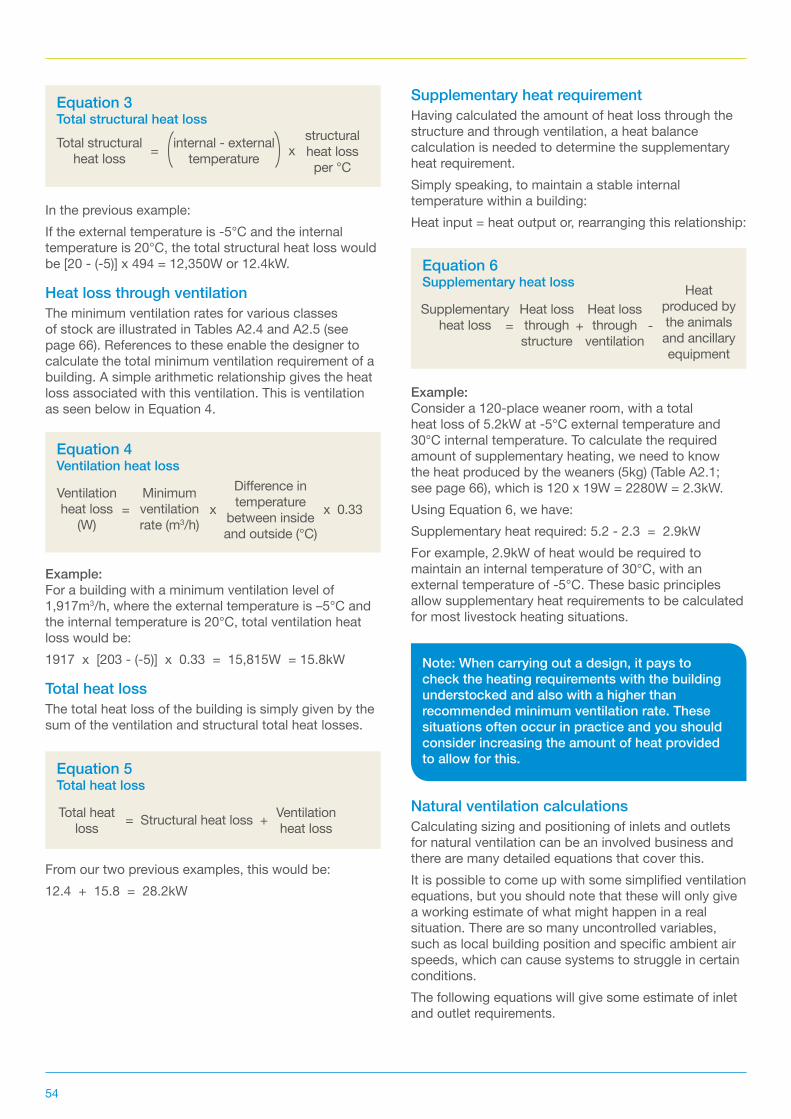
54
Supplementary heat requirementHaving calculated the amount of heat loss through the structure and through ventilation, a heat balance calculation is needed to determine the supplementary heat requirement.Simply speaking, to maintain a stable internal temperature within a building:Heat input = heat output or, rearranging this relationship:
Natural ventilation calculationsCalculating sizing and positioning of inlets and outlets for natural ventilation can be an involved business and there are many detailed equations that cover this.It is possible to come up with some simplified ventilation equations, but you should note that these will only give a working estimate of what might happen in a real situation. There are so many uncontrolled variables, such as local building position and specific ambient air speeds, which can cause systems to struggle in certain conditions.The following equations will give some estimate of inlet and outlet requirements.
In the previous example:If the external temperature is -5°C and the internal temperature is 20°C, the total structural heat loss would be [20 - (-5)] x 494 = 12,350W or 12.4kW.
Heat loss through ventilationThe minimum ventilation rates for various classes of stock are illustrated in Tables A2.4 and A2.5 (see page 66). References to these enable the designer to calculate the total minimum ventilation requirement of a building. A simple arithmetic relationship gives the heat loss associated with this ventilation. This is ventilation as seen below in Equation 4.
Equation 3 Total structural heat lossTotal structural
heat loss = internal - external temperature
structural heat loss
per °Cx
Equation 4 Ventilation heat loss
Ventilation heat loss
(W) =
Minimum ventilation rate (m3/h)
x Difference in temperature
between inside and outside (°C)
x 0.33
Equation 5 Total heat loss
Total heat loss = Structural heat loss + Ventilation
heat loss
Example:For a building with a minimum ventilation level of 1,917m3/h, where the external temperature is –5°C and the internal temperature is 20°C, total ventilation heat loss would be:1917 x [203 - (-5)] x 0.33 = 15,815W = 15.8kW
Total heat lossThe total heat loss of the building is simply given by the sum of the ventilation and structural total heat losses.
From our two previous examples, this would be:12.4 + 15.8 = 28.2kW
Example:Consider a 120-place weaner room, with a total heat loss of 5.2kW at -5°C external temperature and 30°C internal temperature. To calculate the required amount of supplementary heating, we need to know the heat produced by the weaners (5kg) (Table A2.1; see page 66), which is 120 x 19W = 2280W = 2.3kW.Using Equation 6, we have:Supplementary heat required: 5.2 - 2.3 = 2.9kWFor example, 2.9kW of heat would be required to maintain an internal temperature of 30°C, with an external temperature of -5°C. These basic principles allow supplementary heat requirements to be calculated for most livestock heating situations.
Equation 6 Supplementary heat loss
Supplementary heat loss =
Heat loss through structure
+ Heat loss through
ventilation -
Heat produced by the animals and ancillary equipment
Note: When carrying out a design, it pays to check the heating requirements with the building understocked and also with a higher than recommended minimum ventilation rate. These situations often occur in practice and you should consider increasing the amount of heat provided to allow for this.
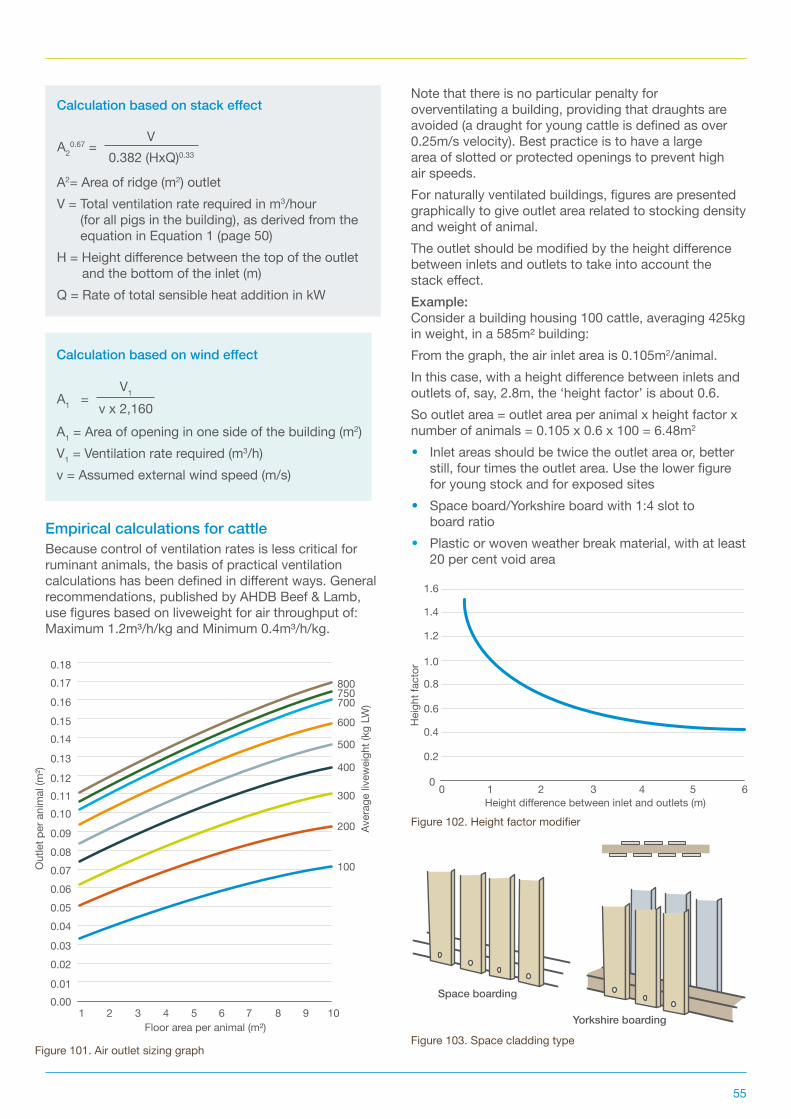
55
Empirical calculations for cattleBecause control of ventilation rates is less critical for ruminant animals, the basis of practical ventilation calculations has been defined in different ways. General recommendations, published by AHDB Beef & Lamb, use figures based on liveweight for air throughput of: Maximum 1.2m³/h/kg and Minimum 0.4m³/h/kg.
Note that there is no particular penalty for overventilating a building, providing that draughts are avoided (a draught for young cattle is defined as over 0.25m/s velocity). Best practice is to have a large area of slotted or protected openings to prevent high air speeds. For naturally ventilated buildings, figures are presented graphically to give outlet area related to stocking density and weight of animal. The outlet should be modified by the height difference between inlets and outlets to take into account the stack effect.Example:Consider a building housing 100 cattle, averaging 425kg in weight, in a 585m² building:From the graph, the air inlet area is 0.105m2/animal.In this case, with a height difference between inlets and outlets of, say, 2.8m, the ‘height factor’ is about 0.6.So outlet area = outlet area per animal x height factor x number of animals = 0.105 x 0.6 x 100 = 6.48m2
• Inlet areas should be twice the outlet area or, better still, four times the outlet area. Use the lower figure for young stock and for exposed sites
• Space board/Yorkshire board with 1:4 slot to board ratio
• Plastic or woven weather break material, with at least 20 per cent void area
Calculation based on stack effect
A2= Area of ridge (m2) outletV = Total ventilation rate required in m3/hour
(for all pigs in the building), as derived from the equation in Equation 1 (page 50)
H = Height difference between the top of the outlet and the bottom of the inlet (m)Q = Rate of total sensible heat addition in kW
V0.382 (HxQ)0.33
A20.67 =
Calculation based on wind effect
A1 = Area of opening in one side of the building (m2)V1 = Ventilation rate required (m3/h)v = Assumed external wind speed (m/s)
V1
v x 2,160A1 =
Figure 102. Height factor modifier
Figure 101. Air outlet sizing graph
10.000.01
0.020.03
0.040.050.060.07 100
200
300
400
500
600
700750800
0.080.09
Out
let p
er a
nim
al (m
²)
Floor area per animal (m²)
Aver
age
livew
eigh
t (kg
LW
)
0.100.110.12
0.13
0.140.15
0.16
0.170.18
2 3 4 5 6 7 8 9 10
00
0.2
0.4
0.6
0.8
1.0
1.2
1.4
1 2Height difference between inlet and outlets (m)
Hei
ght f
acto
r
3 4 5 6
1.6
Figure 103. Space cladding type
Space boarding
Yorkshire boarding
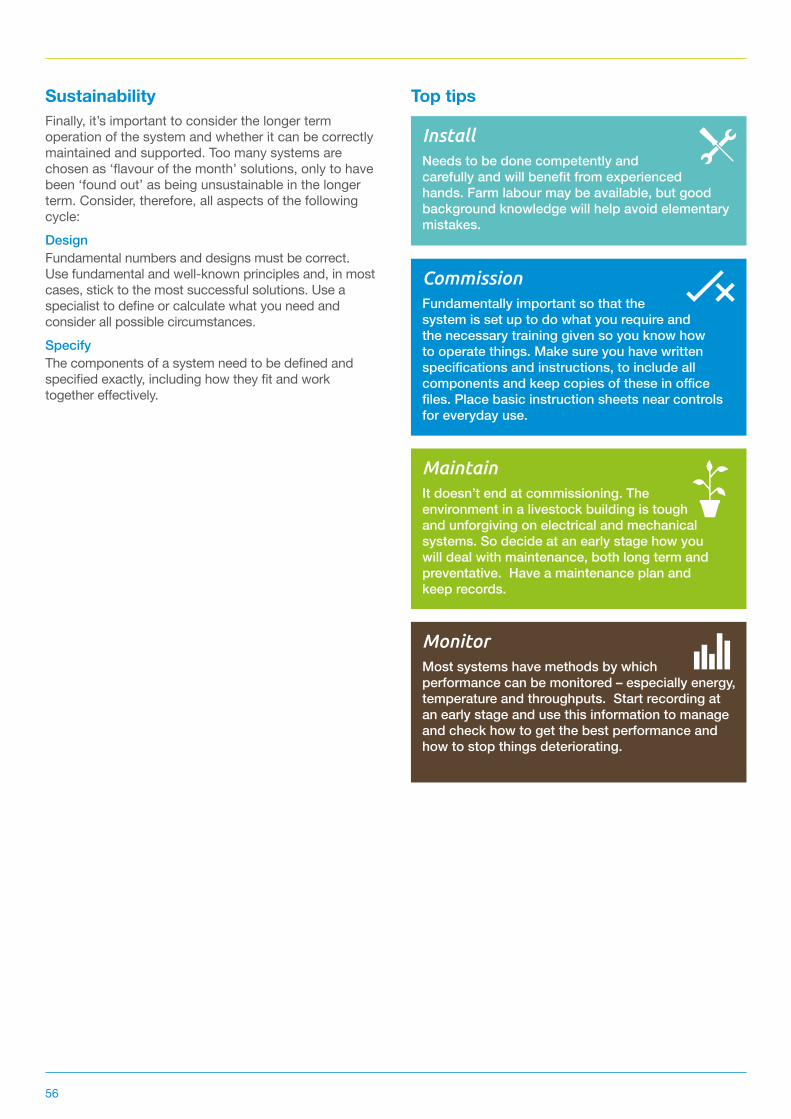
56
SustainabilityFinally, it’s important to consider the longer term operation of the system and whether it can be correctly maintained and supported. Too many systems are chosen as ‘flavour of the month’ solutions, only to have been ‘found out’ as being unsustainable in the longer term. Consider, therefore, all aspects of the following cycle:DesignFundamental numbers and designs must be correct. Use fundamental and well-known principles and, in most cases, stick to the most successful solutions. Use a specialist to define or calculate what you need and consider all possible circumstances.SpecifyThe components of a system need to be defined and specified exactly, including how they fit and work together effectively.
Top tips
InstallNeeds to be done competently and carefully and will benefit from experienced hands. Farm labour may be available, but good background knowledge will help avoid elementary mistakes.
CommissionFundamentally important so that the system is set up to do what you require and the necessary training given so you know how to operate things. Make sure you have written specifications and instructions, to include all components and keep copies of these in office files. Place basic instruction sheets near controls for everyday use.
MaintainIt doesn’t end at commissioning. The environment in a livestock building is tough and unforgiving on electrical and mechanical systems. So decide at an early stage how you will deal with maintenance, both long term and preventative. Have a maintenance plan and keep records.
MonitorMost systems have methods by which performance can be monitored – especially energy, temperature and throughputs. Start recording at an early stage and use this information to manage and check how to get the best performance and how to stop things deteriorating.
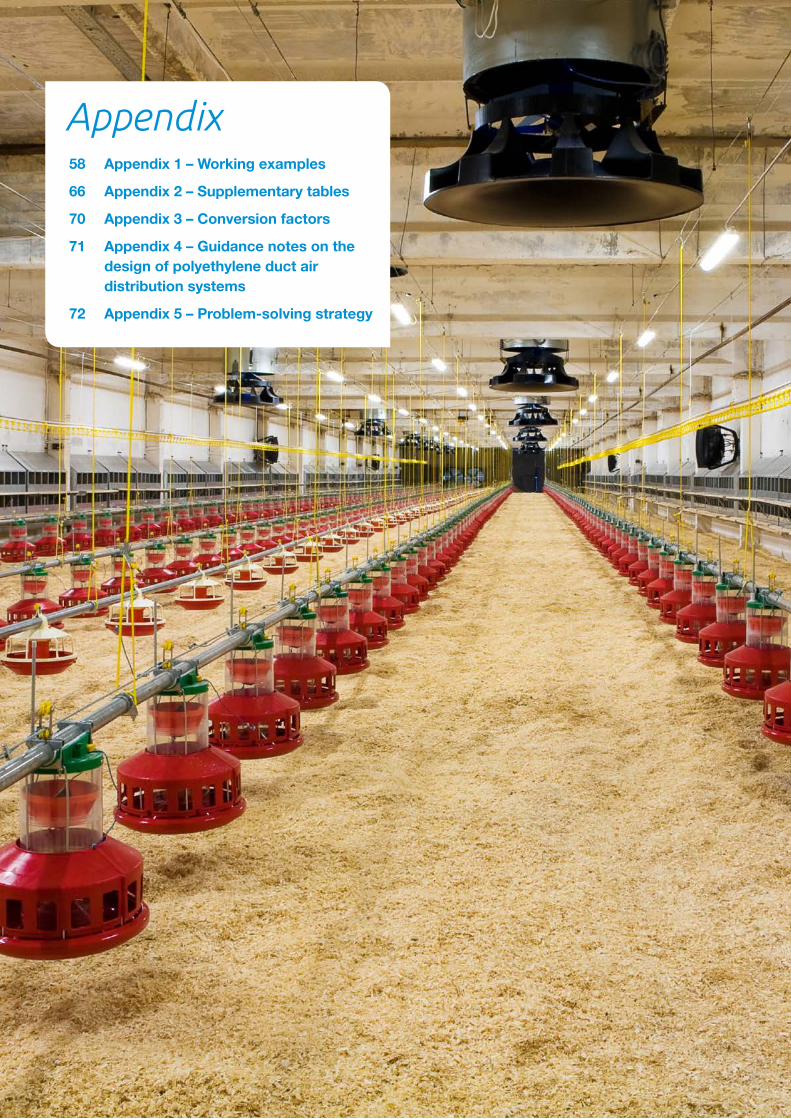
57
Appendix 58 Appendix 1 – Working examples
66 Appendix 2 – Supplementary tables
70 Appendix 3 – Conversion factors
71 Appendix 4 – Guidance notes on the design of polyethylene duct air distribution systems
72 Appendix 5 – Problem-solving strategy
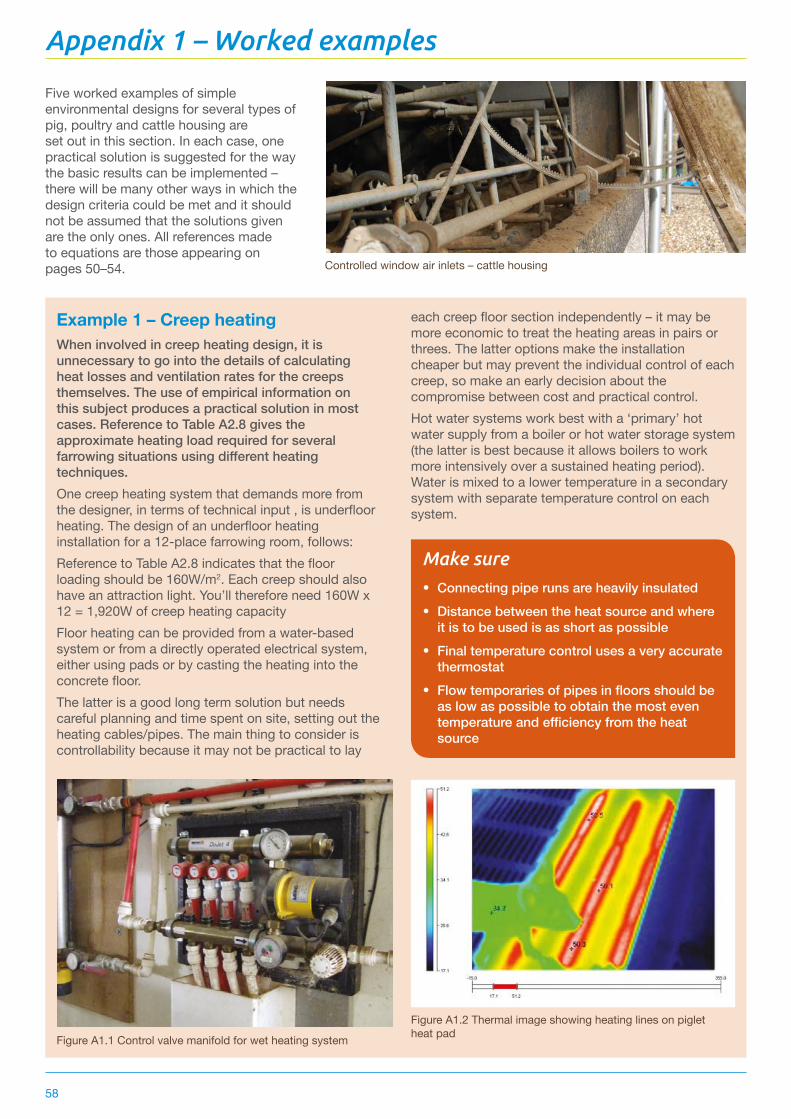
58
Appendix 1 – Worked examples
Example 1 – Creep heatingWhen involved in creep heating design, it is unnecessary to go into the details of calculating heat losses and ventilation rates for the creeps themselves. The use of empirical information on this subject produces a practical solution in most cases. Reference to Table A2.8 gives the approximate heating load required for several farrowing situations using different heating techniques.One creep heating system that demands more from the designer, in terms of technical input , is underfloor heating. The design of an underfloor heating installation for a 12-place farrowing room, follows:Reference to Table A2.8 indicates that the floor loading should be 160W/m2. Each creep should also have an attraction light. You’ll therefore need 160W x 12 = 1,920W of creep heating capacityFloor heating can be provided from a water-based system or from a directly operated electrical system, either using pads or by casting the heating into the concrete floor.The latter is a good long term solution but needs careful planning and time spent on site, setting out the heating cables/pipes. The main thing to consider is controllability because it may not be practical to lay
each creep floor section independently – it may be more economic to treat the heating areas in pairs or threes. The latter options make the installation cheaper but may prevent the individual control of each creep, so make an early decision about the compromise between cost and practical control.Hot water systems work best with a ‘primary’ hot water supply from a boiler or hot water storage system (the latter is best because it allows boilers to work more intensively over a sustained heating period). Water is mixed to a lower temperature in a secondary system with separate temperature control on each system.
Figure A1.1 Control valve manifold for wet heating system
Figure A1.2 Thermal image showing heating lines on piglet heat pad
Make sure
•Connecting pipe runs are heavily insulated
•Distance between the heat source and where it is to be used is as short as possible
•Final temperature control uses a very accurate thermostat
•Flow temporaries of pipes in floors should be as low as possible to obtain the most even temperature and efficiency from the heat source
Five worked examples of simple environmental designs for several types of pig, poultry and cattle housing are set out in this section. In each case, one practical solution is suggested for the way the basic results can be implemented – there will be many other ways in which the design criteria could be met and it should not be assumed that the solutions given are the only ones. All references made to equations are those appearing on pages 50–54. Controlled window air inlets – cattle housing
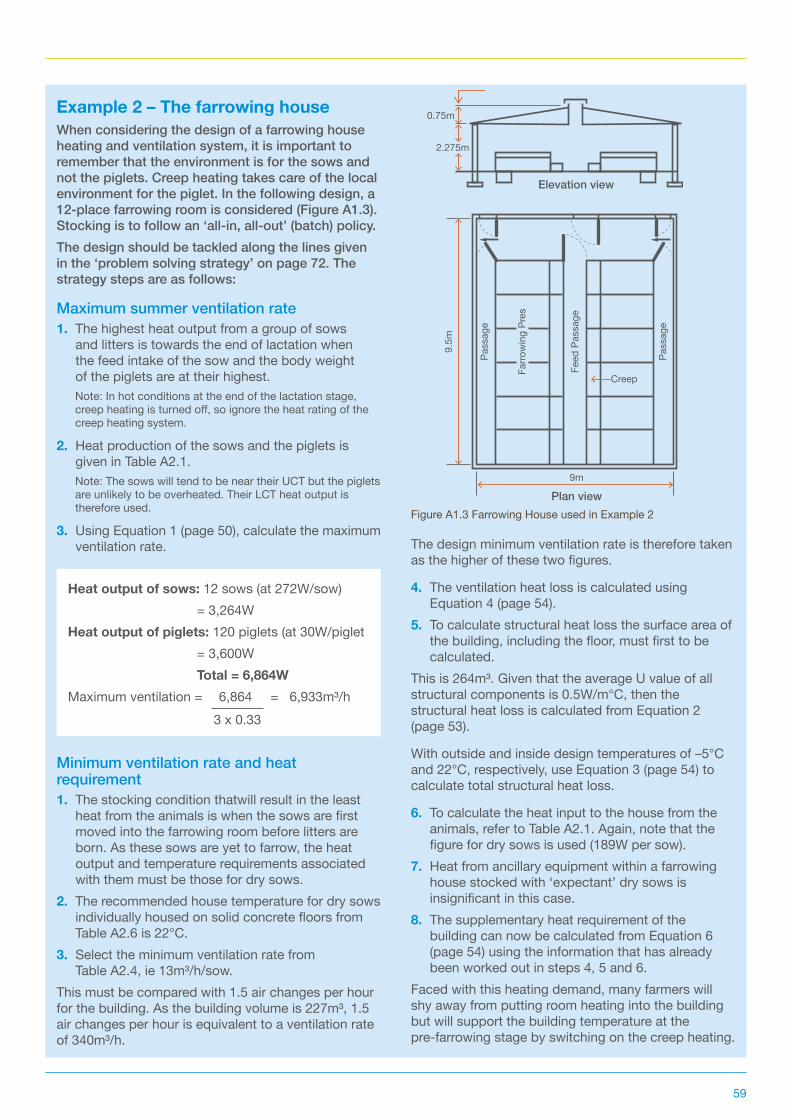
59
Example 2 – The farrowing houseWhen considering the design of a farrowing house heating and ventilation system, it is important to remember that the environment is for the sows and not the piglets. Creep heating takes care of the local environment for the piglet. In the following design, a 12-place farrowing room is considered (Figure A1.3). Stocking is to follow an ‘all-in, all-out’ (batch) policy.The design should be tackled along the lines given in the ‘problem solving strategy’ on page 72. The strategy steps are as follows:
Maximum summer ventilation rate1. The highest heat output from a group of sows
and litters is towards the end of lactation when the feed intake of the sow and the body weight of the piglets are at their highest.Note: In hot conditions at the end of the lactation stage, creep heating is turned off, so ignore the heat rating of the creep heating system.
2. Heat production of the sows and the piglets is given in Table A2.1.
Note: The sows will tend to be near their UCT but the piglets are unlikely to be overheated. Their LCT heat output is therefore used.
3. Using Equation 1 (page 50), calculate the maximum ventilation rate.
Heat output of sows: 12 sows (at 272W/sow) = 3,264WHeat output of piglets: 120 piglets (at 30W/piglet = 3,600W Total = 6,864WMaximum ventilation = 6,864 = 6,933m³/h
Minimum ventilation rate and heat requirement1. The stocking condition thatwill result in the least
heat from the animals is when the sows are first moved into the farrowing room before litters are born. As these sows are yet to farrow, the heat output and temperature requirements associated with them must be those for dry sows.
2. The recommended house temperature for dry sows individually housed on solid concrete floors from Table A2.6 is 22°C.
3. Select the minimum ventilation rate from Table A2.4, ie 13m³/h/sow.
This must be compared with 1.5 air changes per hour for the building. As the building volume is 227m³, 1.5 air changes per hour is equivalent to a ventilation rate of 340m³/h.
The design minimum ventilation rate is therefore taken as the higher of these two figures.
4. The ventilation heat loss is calculated using Equation 4 (page 54).
5. To calculate structural heat loss the surface area of the building, including the floor, must first to be calculated.
This is 264m³. Given that the average U value of all structural components is 0.5W/m°C, then the structural heat loss is calculated from Equation 2 (page 53).
With outside and inside design temperatures of –5°C and 22°C, respectively, use Equation 3 (page 54) to calculate total structural heat loss.
6. To calculate the heat input to the house from the animals, refer to Table A2.1. Again, note that the figure for dry sows is used (189W per sow).
7. Heat from ancillary equipment within a farrowing house stocked with ‘expectant’ dry sows is insignificant in this case.
8. The supplementary heat requirement of the building can now be calculated from Equation 6 (page 54) using the information that has already been worked out in steps 4, 5 and 6.
Faced with this heating demand, many farmers will shy away from putting room heating into the building but will support the building temperature at the pre -farrowing stage by switching on the creep heating.
3 x 0.33
9m
Plan view
Elevation view
2.275m
0.75m
Creep
9.5m
Pass
age
Feed
Pas
sage
Pass
age
Farro
win
g Pr
esFigure A1.3 Farrowing House used in Example 2
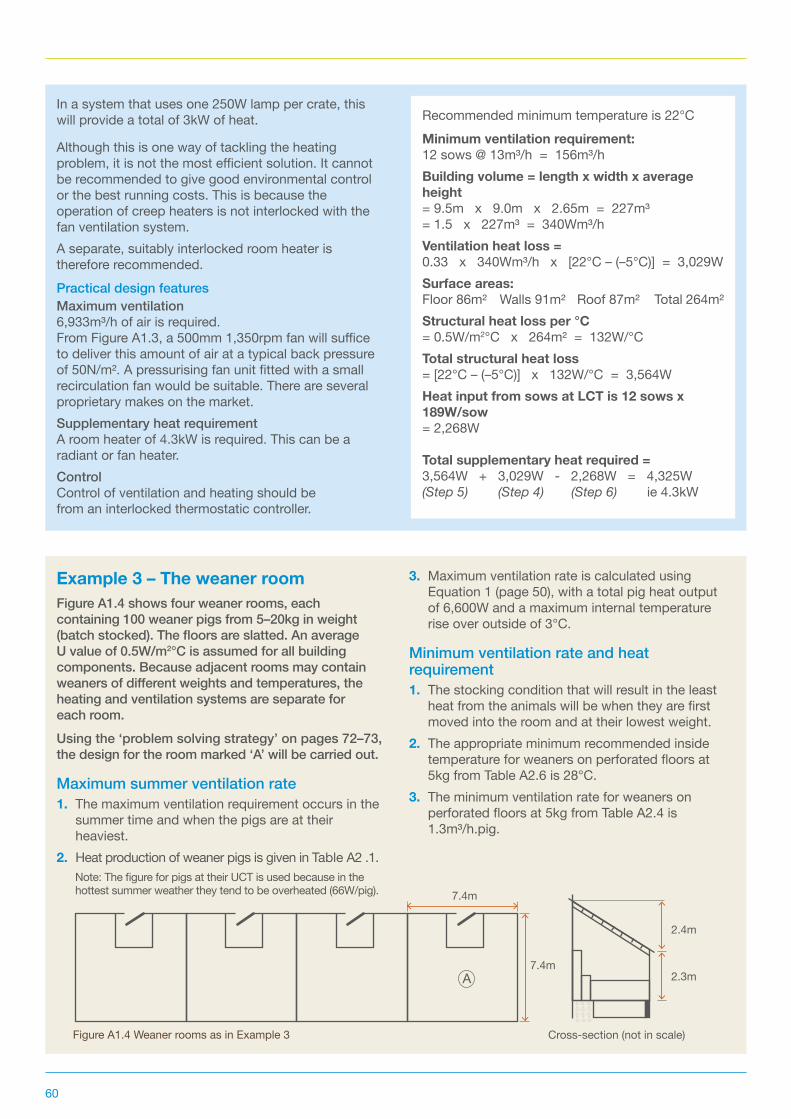
60
In a system that uses one 250W lamp per crate, this will provide a total of 3kW of heat.
Although this is one way of tackling the heating problem, it is not the most efficient solution. It cannot be recommended to give good environmental control or the best running costs. This is because the operation of creep heaters is not interlocked with the fan ventilation system.A separate, suitably interlocked room heater is therefore recommended.Practical design featuresMaximum ventilation6,933m³/h of air is required. From Figure A1.3, a 500mm 1,350rpm fan will suffice to deliver this amount of air at a typical back pressure of 50N/m². A pressurising fan unit fitted with a small recirculation fan would be suitable. There are several proprietary makes on the market.Supplementary heat requirement A room heater of 4.3kW is required. This can be a radiant or fan heater.ControlControl of ventilation and heating should be from an inter locked thermostatic controller.
Recommended minimum temperature is 22°CMinimum ventilation requirement: 12 sows @ 13m³/h = 156m³/hBuilding volume = length x width x average height = 9.5m x 9.0m x 2.65m = 227m³ = 1.5 x 227m³ = 340Wm³/hVentilation heat loss = 0.33 x 340Wm³/h x [22°C – (–5°C)] = 3,029WSurface areas:Floor 86m² Walls 91m² Roof 87m² Total 264m² Structural heat loss per °C= 0.5W/m2°C x 264m² = 132W/°CTotal structural heat loss= [22°C – (–5°C)] x 132W/°C = 3,564WHeat input from sows at LCT is 12 sows x 189W/sow= 2,268W
Total supplementary heat required =3,564W + 3,029W - 2,268W = 4,325W (Step 5) (Step 4) (Step 6) ie 4.3kW
Example 3 – The weaner roomFigure A1.4 shows four weaner rooms, each containing 100 weaner pigs from 5–20kg in weight (batch stocked). The floors are slatted. An average U value of 0.5W/m2°C is assumed for all building components. Because adjacent rooms may contain weaners of different weights and temperatures, the heating and ventilation systems are separate for each room.Using the ‘problem solving strategy’ on pages 72–73, the design for the room marked ‘A’ will be carried out.
Maximum summer ventilation rate1. The maximum ventilation requirement occurs in the
summer time and when the pigs are at their heaviest.
2. Heat production of weaner pigs is given in Table A2 .1. Note: The figure for pigs at their UCT is used because in the hottest summer weather they tend to be overheated (66W/pig).
3. Maximum ventilation rate is calculated using Equation 1 (page 50), with a total pig heat output of 6,600W and a maximum internal temperature rise over outside of 3°C.
Minimum ventilation rate and heat requirement1. The stocking condition that will result in the least
heat from the animals will be when they are first moved into the room and at their lowest weight.
2. The appropriate minimum recommended inside temperature for weaners on perforated floors at 5kg from Table A2.6 is 28°C.
3. The minimum ventilation rate for weaners on perforated floors at 5kg from Table A2.4 is 1.3m³/h.pig.
7.4m
2.3m
2.4m
Cross-section (not in scale)
7.4m
Figure A1.4 Weaner rooms as in Example 3
A
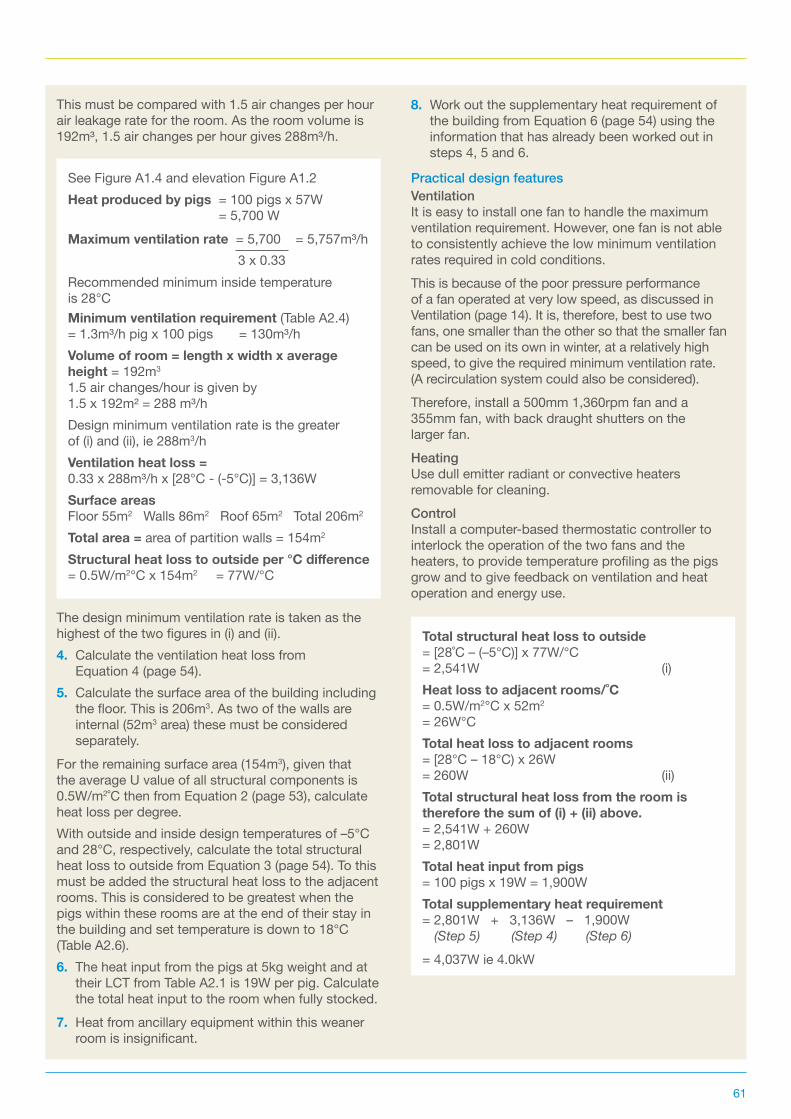
61
This must be compared with 1.5 air changes per hour air leakage rate for the room. As the room volume is 192m³, 1.5 air changes per hour gives 288m³/h.
The design minimum ventilation rate is taken as the highest of the two figures in (i) and (ii).4. Calculate the ventilation heat loss from
Equation 4 (page 54).5. Calculate the surface area of the building including
the floor. This is 206m3. As two of the walls are internal (52m3 area) these must be considered separately.
For the remaining surface area (154m3), given that the average U value of all structural components is 0.5W/m2˚C then from Equation 2 (page 53), calculate heat loss per degree. With outside and inside design temperatures of –5°C and 28°C, respectively, calculate the total structural heat loss to outside from Equation 3 (page 54). To this must be added the structural heat loss to the adjacent rooms. This is considered to be greatest when the pigs within these rooms are at the end of their stay in the building and set temperature is down to 18°C (Table A2.6).6. The heat input from the pigs at 5kg weight and at
their LCT from Table A2.1 is 19W per pig. Calculate the total heat input to the room when fully stocked.
7. Heat from ancillary equipment within this weaner room is insignificant.
8. Work out the supplementary heat requirement of the building from Equation 6 (page 54) using the information that has already been worked out in steps 4, 5 and 6.
Practical design featuresVentilationIt is easy to install one fan to handle the maximum ventilation requirement. However, one fan is not able to consistently achieve the low minimum ventilation rates required in cold conditions.This is because of the poor pressure performance of a fan operated at very low speed, as discussed in Ventilation (page 14). It is, therefore, best to use two fans, one smaller than the other so that the smaller fan can be used on its own in winter, at a relatively high speed, to give the required minimum ventilation rate. (A recirculation system could also be considered).Therefore, install a 500mm 1,360rpm fan and a 355mm fan, with back draught shutters on the larger fan.HeatingUse dull emitter radiant or convective heaters removable for cleaning.ControlInstall a computer-based thermostatic controller to interlock the operation of the two fans and the heaters, to provide temperature profiling as the pigs grow and to give feedback on ventilation and heat operation and energy use.
See Figure A1.4 and elevation Figure A1.2Heat produced by pigs = 100 pigs x 57W
= 5,700 WMaximum ventilation rate = 5,700 = 5,757m³/h
Recommended minimum inside temperature is 28°C Minimum ventilation requirement (Table A2.4)= 1.3m³/h pig x 100 pigs = 130m³/hVolume of room = length x width x average height = 192m3 1.5 air changes/hour is given by 1.5 x 192m² = 288 m³/hDesign minimum ventilation rate is the greater of (i) and (ii), ie 288m3/hVentilation heat loss = 0.33 x 288m³/h x [28°C - (-5°C)] = 3,136WSurface areasFloor 55m2 Walls 86m2 Roof 65m2 Total 206m2 Total area = area of partition walls = 154m2
Structuralheatlosstooutsideper°Cdifference= 0.5W/m2°C x 154m2 = 77W/°C
3 x 0.33
Total structural heat loss to outside= [28˚C – (–5°C)] x 77W/°C= 2,541W (i)Heat loss to adjacent rooms/˚C= 0.5W/m2°C x 52m2
= 26W°CTotal heat loss to adjacent rooms= [28°C – 18°C) x 26W= 260W (ii)Total structural heat loss from the room is therefore the sum of (i) + (ii) above.= 2,541W + 260W= 2,801WTotal heat input from pigs= 100 pigs x 19W = 1,900WTotal supplementary heat requirement = 2,801W + 3,136W – 1,900W (Step 5) (Step 4) (Step 6)= 4,037W ie 4.0kW
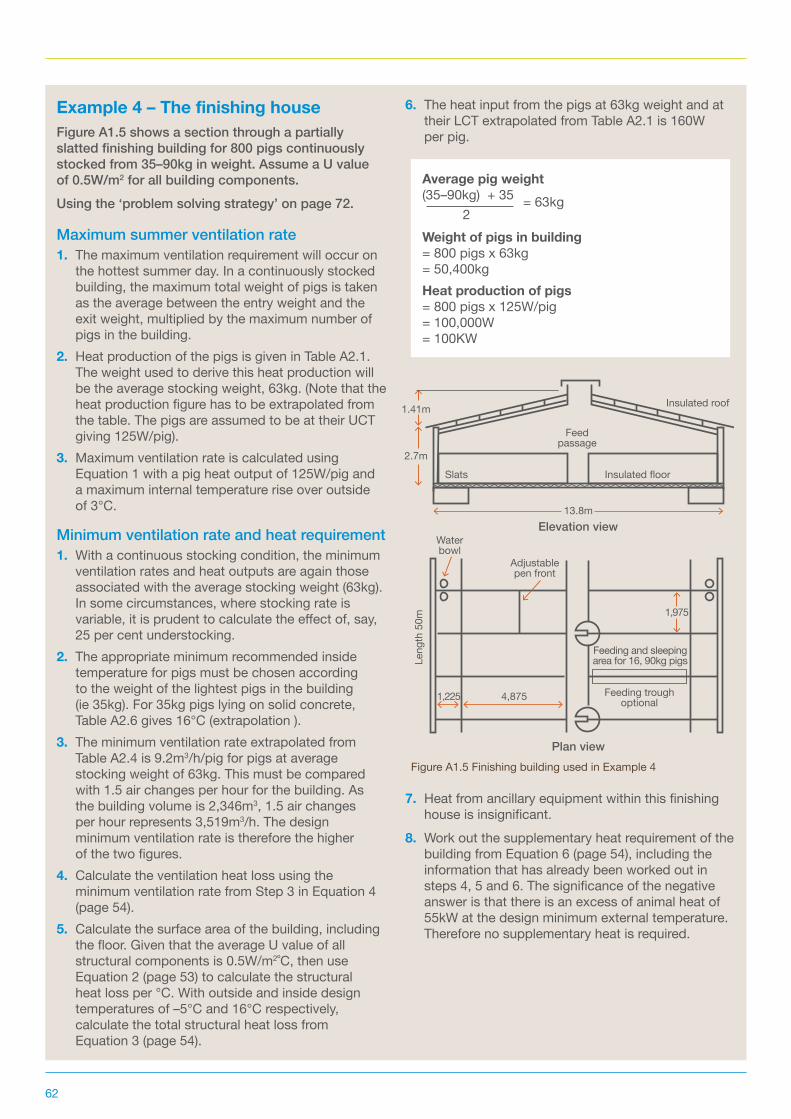
62
Example 4 – The finishing houseFigure A1.5 shows a section through a partially slatted finishing building for 800 pigs continuously stocked from 35–90kg in weight. Assume a U value of 0.5W/m2 for all building components.Using the ‘problem solving strategy’ on page 72.
Maximum summer ventilation rate1. The maximum ventilation requirement will occur on
the hottest summer day. In a continuously stocked building, the maximum total weight of pigs is taken as the average between the entry weight and the exit weight, multiplied by the maximum number of pigs in the building.
2. Heat production of the pigs is given in Table A2.1. The weight used to derive this heat production will be the average stocking weight, 63kg. (Note that the heat production figure has to be extrapolated from the table. The pigs are assumed to be at their UCT giving 125W/pig).
3. Maximum ventilation rate is calculated using Equation 1 with a pig heat output of 125W/pig and a maximum internal temperature rise over outside of 3°C.
Minimum ventilation rate and heat requirement1. With a continuous stocking condition, the minimum
ventilation rates and heat outputs are again those associated with the average stocking weight (63kg). In some circumstances, where stocking rate is variable, it is prudent to calculate the effect of, say, 25 per cent understocking.
2. The appropriate minimum recommended inside temperature for pigs must be chosen according to the weight of the lightest pigs in the building (ie 35kg). For 35kg pigs lying on solid concrete, Table A2.6 gives 16°C (extrapolation ).
3. The minimum ventilation rate extrapolated from Table A2.4 is 9.2m3/h/pig for pigs at average stocking weight of 63kg. This must be compared with 1.5 air changes per hour for the building. As the building volume is 2,346m3, 1.5 air changes per hour represents 3,519m3/h. The design minimum ventilation rate is therefore the higher of the two figures.
4. Calculate the ventilation heat loss using the minimum ventilation rate from Step 3 in Equation 4 (page 54).
5. Calculate the surface area of the building, including the floor. Given that the average U value of all structural components is 0.5W/m2˚C, then use Equation 2 (page 53) to calculate the structural heat loss per °C. With outside and inside design temperatures of –5°C and 16°C respectively, calculate the total structural heat loss from Equation 3 (page 54).
6. The heat input from the pigs at 63kg weight and at their LCT extrapolated from Table A2.1 is 160W per pig.
7. Heat from ancillary equipment within this finishing house is insignificant.
8. Work out the supplementary heat requirement of the building from Equation 6 (page 54), including the information that has already been worked out in steps 4, 5 and 6. The significance of the negative answer is that there is an excess of animal heat of 55kW at the design minimum external temperature. Therefore no supplementary heat is required.
Average pig weight (35–90kg) + 35
Weight of pigs in building = 800 pigs x 63kg = 50,400kgHeat production of pigs = 800 pigs x 125W/pig = 100,000W = 100KW
= 63kg2
Figure A1.5 Finishing building used in Example 4
Insulated roof1.41m
2.7m
13.8m
1,975
4,875
Water bowl
Leng
th 5
0m
Adjustable pen front
Feeding and sleeping area for 16, 90kg pigs
Feeding trough optional1,225
Elevation view
Plan view
Insulated floor
Feed passage
Slats
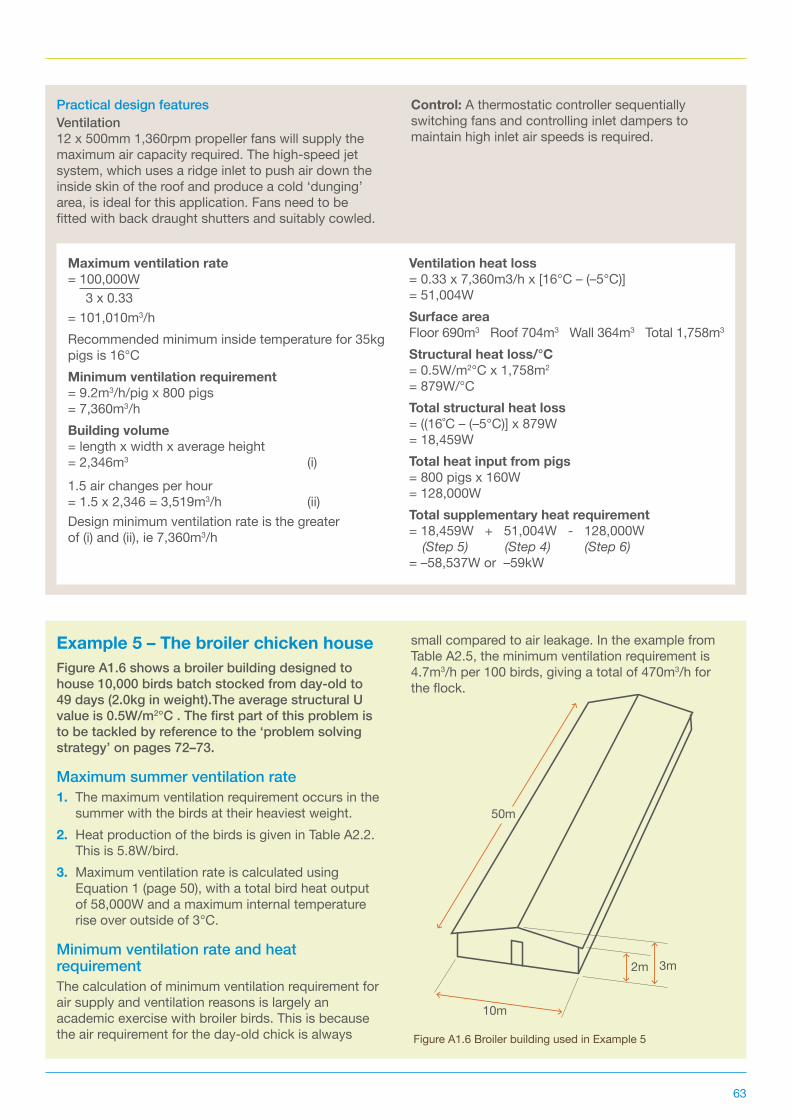
63
Practical design featuresVentilation12 x 500mm 1,360rpm propeller fans will supply the maximum air capacity required. The high-speed jet system, which uses a ridge inlet to push air down the inside skin of the roof and produce a cold ‘dunging’ area, is ideal for this application. Fans need to be fitted with back draught shutters and suitably cowled.
Control: A thermostatic controller sequentially switching fans and controlling inlet dampers to maintain high inlet air speeds is required.
Maximum ventilation rate = 100,000W
= 101,010m3/hRecommended minimum inside temperature for 35kg pigs is 16°CMinimum ventilation requirement = 9.2m3/h/pig x 800 pigs = 7,360m3/h Building volume = length x width x average height = 2,346m3 (i)1.5 air changes per hour = 1.5 x 2,346 = 3,519m3/h (ii)Design minimum ventilation rate is the greater of (i) and (ii), ie 7,360m3/h
Ventilation heat loss = 0.33 x 7,360m3/h x [16°C – (–5°C)] = 51,004W Surface areaFloor 690m3 Roof 704m3 Wall 364m3 Total 1,758m3
Structural heat loss/°C= 0.5W/m2°C x 1,758m2 = 879W/°CTotal structural heat loss= ((16˚C – (–5°C)] x 879W = 18,459WTotal heat input from pigs= 800 pigs x 160W = 128,000WTotal supplementary heat requirement= 18,459W + 51,004W - 128,000W (Step 5) (Step 4) (Step 6)= –58,537W or –59kW
3 x 0.33
Example 5 – The broiler chicken houseFigure A1.6 shows a broiler building designed to house 10,000 birds batch stocked from day-old to 49 days (2.0kg in weight).The average structural U value is 0.5W/m2°C . The first part of this problem is to be tackled by reference to the ‘problem solving strategy’ on pages 72–73.
Maximum summer ventilation rate1. The maximum ventilation requirement occurs in the
summer with the birds at their heaviest weight.2. Heat production of the birds is given in Table A2.2.
This is 5.8W/bird.3. Maximum ventilation rate is calculated using
Equation 1 (page 50), with a total bird heat output of 58,000W and a maximum internal temperature rise over outside of 3°C.
Minimum ventilation rate and heat requirementThe calculation of minimum ventilation requirement for air supply and ventilation reasons is largely an academic exercise with broiler birds. This is because the air requirement for the day -old chick is always
small compared to air leakage. In the example from Table A2.5, the minimum ventilation requirement is 4.7m3/h per 100 birds, giving a total of 470m3/h for the flock.
Figure A1.6 Broiler building used in Example 5
10m
50m
2m 3m
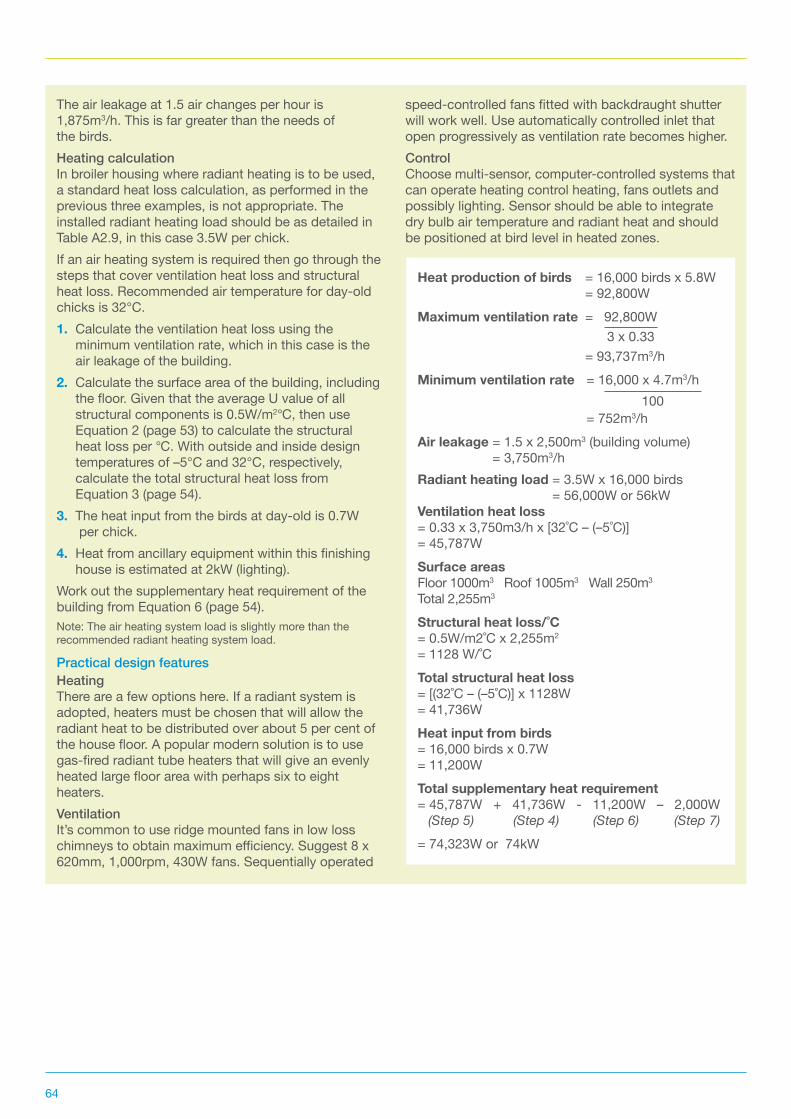
64
The air leakage at 1.5 air changes per hour is 1,875m3/h. This is far greater than the needs of the birds.Heating calculationIn broiler housing where radiant heating is to be used, a standard heat loss calculation, as performed in the previous three examples, is not appropriate. The installed radiant heating load should be as detailed in Table A2.9, in this case 3.5W per chick.If an air heating system is required then go through the steps that cover ventilation heat loss and structural heat loss. Recommended air temperature for day-old chicks is 32°C.1. Calculate the ventilation heat loss using the
minimum ventilation rate, which in this case is the air leakage of the building.
2. Calculate the surface area of the building, including the floor. Given that the average U value of all structural components is 0.5W/m2°C, then use Equation 2 (page 53) to calculate the structural heat loss per °C. With outside and inside design temperatures of –5°C and 32°C, respectively, calculate the total structural heat loss from Equation 3 (page 54).
3. The heat input from the birds at day-old is 0.7W per chick.
4. Heat from ancillary equipment within this finishing house is estimated at 2kW (lighting).
Work out the supplementary heat requirement of the building from Equation 6 (page 54).Note: The air heating system load is slightly more than the recommended radiant heating system load.
Practical design featuresHeatingThere are a few options here. If a radiant system is adopted, heaters must be chosen that will allow the radiant heat to be distributed over about 5 per cent of the house floor. A popular modern solution is to use gas-fired radiant tube heaters that will give an evenly heated large floor area with perhaps six to eight heaters.VentilationIt’s common to use ridge mounted fans in low loss chimneys to obtain maximum efficiency. Suggest 8 x 620mm, 1,000rpm, 430W fans. Sequentially operated
speed-controlled fans fitted with backdraught shutter will work well. Use automatically controlled inlet that open progressively as ventilation rate becomes higher.ControlChoose multi-sensor, computer-controlled systems that can operate heating control heating, fans outlets and possibly lighting. Sensor should be able to integrate dry bulb air temperature and radiant heat and should be positioned at bird level in heated zones.
Heat production of birds = 16,000 birds x 5.8W = 92,800WMaximum ventilation rate = 92,800W = 93,737m3/hMinimum ventilation rate = 16,000 x 4.7m3/h
= 752m3/hAir leakage = 1.5 x 2,500m3 (building volume)
= 3,750m3/hRadiant heating load = 3.5W x 16,000 birds
= 56,000W or 56kWVentilation heat loss= 0.33 x 3,750m3/h x [32˚C – (–5˚C)] = 45,787WSurface areasFloor 1000m3 Roof 1005m3 Wall 250m3 Total 2,255m3
Structuralheatloss/˚C= 0.5W/m2˚C x 2,255m2 = 1128 W/˚CTotal structural heat loss= [(32˚C – (–5˚C)] x 1128W = 41,736WHeat input from birds= 16,000 birds x 0.7W = 11,200WTotal supplementary heat requirement= 45,787W + 41,736W - 11,200W – 2,000W (Step 5) (Step 4) (Step 6) (Step 7)= 74,323W or 74kW
100
3 x 0.33
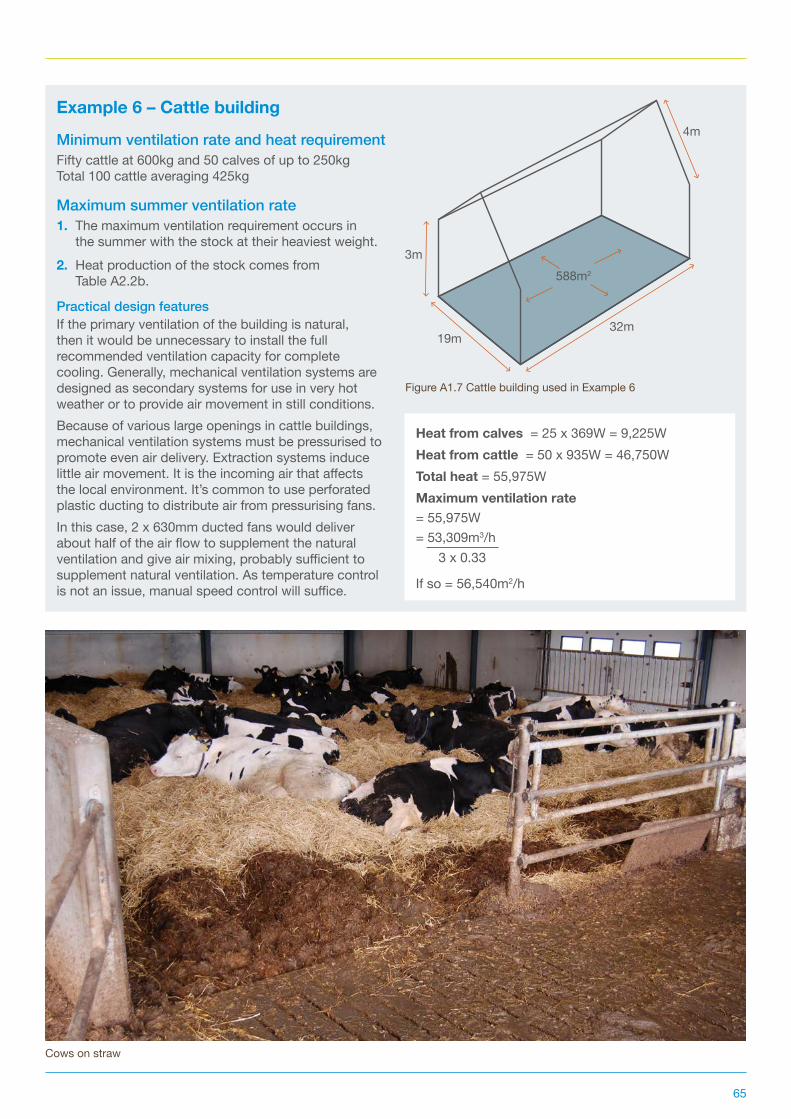
65
Example 6 – Cattle building
Minimum ventilation rate and heat requirementFifty cattle at 600kg and 50 calves of up to 250kg Total 100 cattle averaging 425kg
Maximum summer ventilation rate1. The maximum ventilation requirement occurs in
the summer with the stock at their heaviest weight.2. Heat production of the stock comes from
Table A2.2b.
Practical design featuresIf the primary ventilation of the building is natural, then it would be unnecessary to install the full recommended ventilation capacity for complete cooling. Generally, mechanical ventilation systems are designed as secondary systems for use in very hot weather or to provide air movement in still conditions.Because of various large openings in cattle buildings, mechanical ventilation systems must be pressurised to promote even air delivery. Extraction systems induce little air movement. It is the incoming air that affects the local environment. It’s common to use perforated plastic ducting to distribute air from pressurising fans.In this case, 2 x 630mm ducted fans would deliver about half of the air flow to supplement the natural ventilation and give air mixing, probably sufficient to supplement natural ventilation. As temperature control is not an issue, manual speed control will suffice.
Figure A1.7 Cattle building used in Example 6
Heat from calves = 25 x 369W = 9,225WHeat from cattle = 50 x 935W = 46,750WTotal heat = 55,975WMaximum ventilation rate= 55,975W= 53,309m3/h
If so = 56,540m2/h
3 x 0.33
588m2
32m19m
3m
4m
Cows on straw
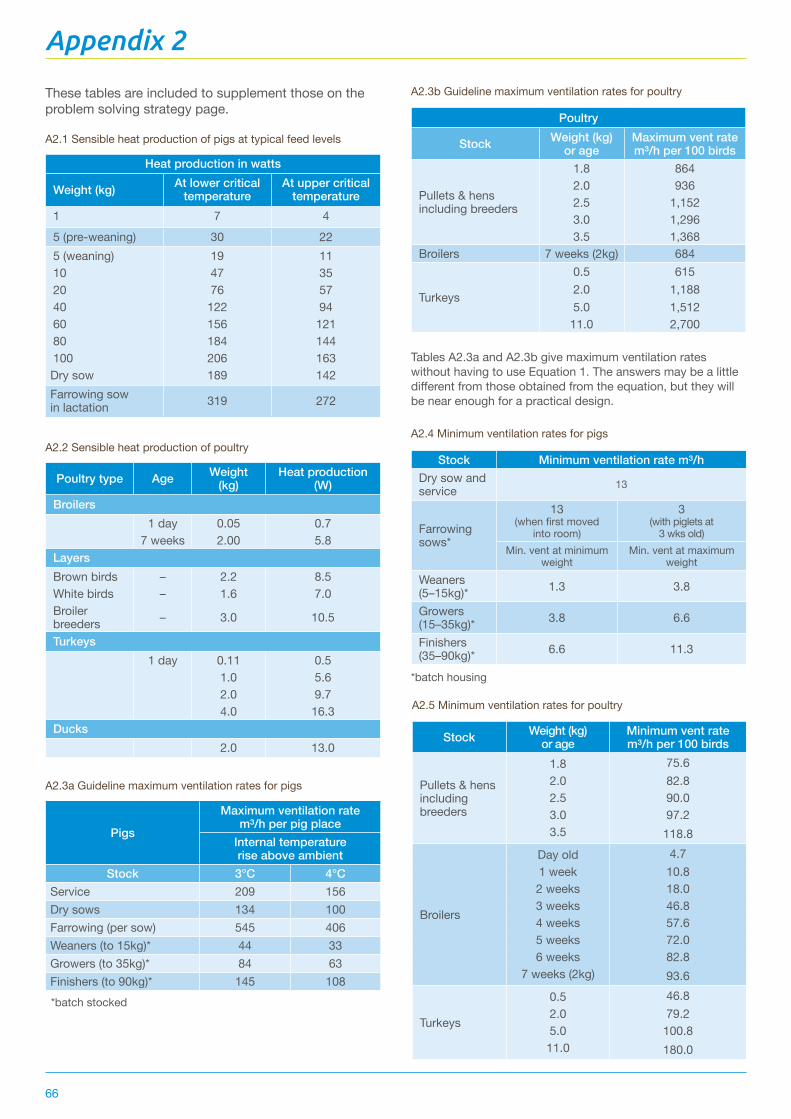
66
Appendix 2
Heat production in watts
Weight (kg) At lower critical temperature
At upper critical temperature
1 7 45 (pre-weaning) 30 225 (weaning) 19 1110 47 3520 76 5740 122 9460 156 12180 184 144100 206 163Dry sow 189 142Farrowing sow in lactation 319 272
A2.1 Sensible heat production of pigs at typical feed levels
Poultry type Age Weight (kg)
Heat production (W)
Broilers1 day 0.05 0.7
7 weeks 2.00 5.8LayersBrown birds – 2.2 8.5White birds – 1.6 7.0Broiler breeders – 3.0 10.5
Turkeys1 day 0.11 0.5
1.0 5.62.0 9.74.0 16.3
Ducks2.0 13.0
A2.2 Sensible heat production of poultry
Poultry
Stock Weight (kg) or age
Maximum vent rate m³/h per 100 birds
Pullets & hens including breeders
1.8 8642.0 9362.5 1,1523.0 1,2963.5 1,368
Broilers 7 weeks (2kg) 684
Turkeys
0.5 6152.0 1,1885.0 1,51211.0 2,700
A2.3b Guideline maximum ventilation rates for poultry
Stock Weight (kg) or age
Minimum vent rate m³/h per 100 birds
Pullets & hens including breeders
1.8 75.62.0 82.82.5 90.03.0 97.23.5 118.8
Broilers
Day old 4.71 week 10.82 weeks 18.03 weeks 46.84 weeks 57.65 weeks 72.06 weeks 82.8
7 weeks (2kg) 93.6
Turkeys
0.5 46.82.0 79.25.0 100.8
11.0 180.0
A2.5 Minimum ventilation rates for poultry
These tables are included to supplement those on the problem solving strategy page.
Tables A2.3a and A2.3b give maximum ventilation rates without having to use Equation 1. The answers may be a little different from those obtained from the equation, but they will be near enough for a practical design.
Pigs
Maximum ventilation rate m³/h per pig place
Internal temperature rise above ambient
Stock 3°C 4°CService 209 156Dry sows 134 100Farrowing (per sow) 545 406Weaners (to 15kg)* 44 33Growers (to 35kg)* 84 63Finishers (to 90kg)* 145 108*batch stocked
A2.3a Guideline maximum ventilation rates for pigs
Stock Minimum ventilation rate m³/hDry sow and service 13
Farrowing sows*
13 (when first moved
into room)
3 (with piglets at
3 wks old)Min. vent at minimum
weightMin. vent at maximum
weightWeaners (5–15kg)* 1.3 3.8
Growers (15–35kg)* 3.8 6.6
Finishers (35–90kg)* 6.6 11.3
A2.4 Minimum ventilation rates for pigs
*batch housing
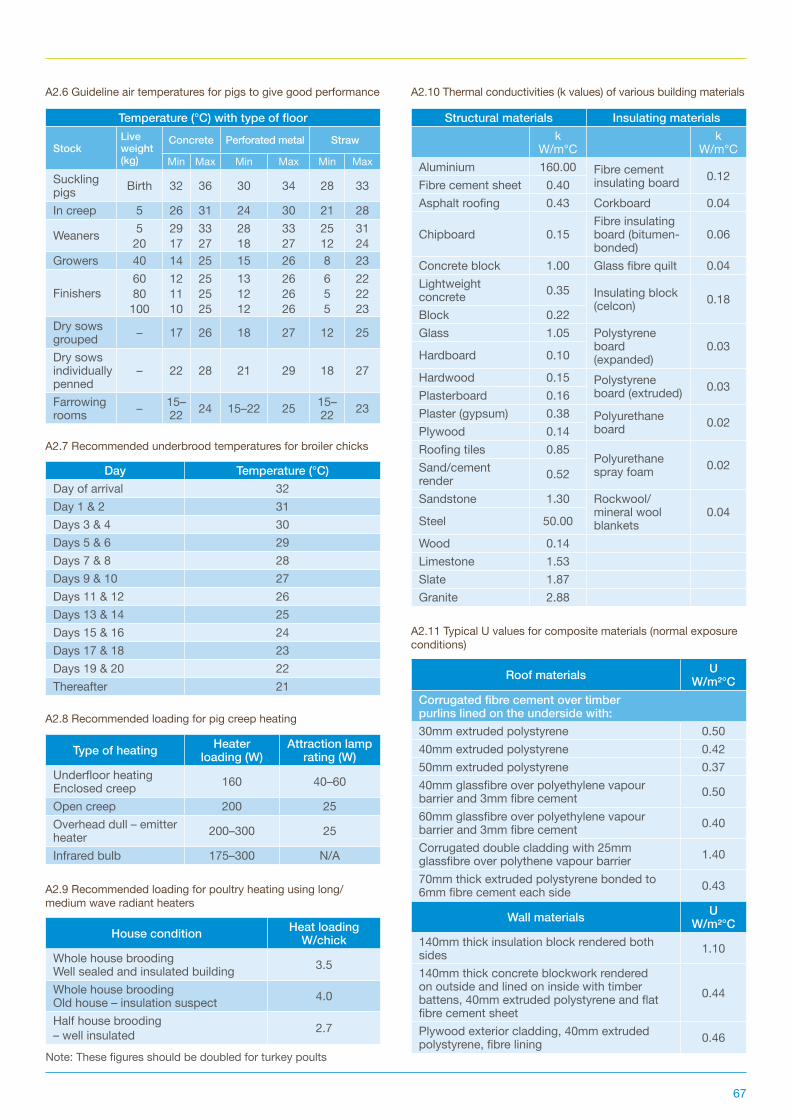
67
Temperature (°C) with type of floor
StockLive weight (kg)
Concrete Perforated metal Straw
Min Max Min Max Min MaxSuckling pigs Birth 32 36 30 34 28 33
In creep 5 26 31 24 30 21 28
Weaners 5 29 33 28 33 25 3120 17 27 18 27 12 24
Growers 40 14 25 15 26 8 23
Finishers60 12 25 13 26 6 2280 11 25 12 26 5 22100 10 25 12 26 5 23
Dry sows grouped – 17 26 18 27 12 25
Dry sows individually penned
– 22 28 21 29 18 27
Farrowing rooms – 15–
22 24 15–22 25 15–22 23
A2.6 Guideline air temperatures for pigs to give good performance
Structural materials Insulating materialsk
W/m°Ck
W/m°CAluminium 160.00 Fibre cement
insulating board 0.12Fibre cement sheet 0.40Asphalt roofing 0.43 Corkboard 0.04
Chipboard 0.15Fibre insulating board (bitumen-bonded)
0.06
Concrete block 1.00 Glass fibre quilt 0.04Lightweight concrete 0.35 Insulating block
(celcon) 0.18Block 0.22Glass 1.05 Polystyrene
board (expanded)
0.03Hardboard 0.10
Hardwood 0.15 Polystyrene board (extruded) 0.03
Plasterboard 0.16Plaster (gypsum) 0.38 Polyurethane
board 0.02Plywood 0.14Roofing tiles 0.85
Polyurethane spray foam 0.02Sand/cement
render 0.52
Sandstone 1.30 Rockwool/mineral wool blankets
0.04Steel 50.00
Wood 0.14Limestone 1.53Slate 1.87Granite 2.88
A2.10 Thermal conductivities (k values) of various building materials
Roof materials U W/m²°C
Corrugated fibre cement over timber purlins lined on the underside with:30mm extruded polystyrene 0.5040mm extruded polystyrene 0.4250mm extruded polystyrene 0.3740mm glassfibre over polyethylene vapour barrier and 3mm fibre cement 0.50
60mm glassfibre over polyethylene vapour barrier and 3mm fibre cement 0.40
Corrugated double cladding with 25mm glassfibre over polythene vapour barrier 1.40
70mm thick extruded polystyrene bonded to 6mm fibre cement each side 0.43
Wall materials U W/m²°C
140mm thick insulation block rendered both sides 1.10
140mm thick concrete blockwork rendered on outside and lined on inside with timber battens, 40mm extruded polystyrene and flat fibre cement sheet
0.44
Plywood exterior cladding, 40mm extruded polystyrene, fibre lining 0.46
A2.11 Typical U values for composite materials (normal exposure conditions)
Day Temperature (°C)Day of arrival 32Day 1 & 2 31Days 3 & 4 30Days 5 & 6 29Days 7 & 8 28Days 9 & 10 27Days 11 & 12 26Days 13 & 14 25Days 15 & 16 24Days 17 & 18 23Days 19 & 20 22Thereafter 21
A2.7 Recommended underbrood temperatures for broiler chicks
Type of heating Heater loading (W)
Attraction lamp rating (W)
Underfloor heating Enclosed creep 160 40–60
Open creep 200 25Overhead dull – emitter heater 200–300 25
Infrared bulb 175–300 N/A
A2.8 Recommended loading for pig creep heating
House condition Heat loading W/chick
Whole house brooding Well sealed and insulated building 3.5
Whole house brooding Old house – insulation suspect 4.0
Half house brooding – well insulated 2.7
A2.9 Recommended loading for poultry heating using long/medium wave radiant heaters
Note: These figures should be doubled for turkey poults
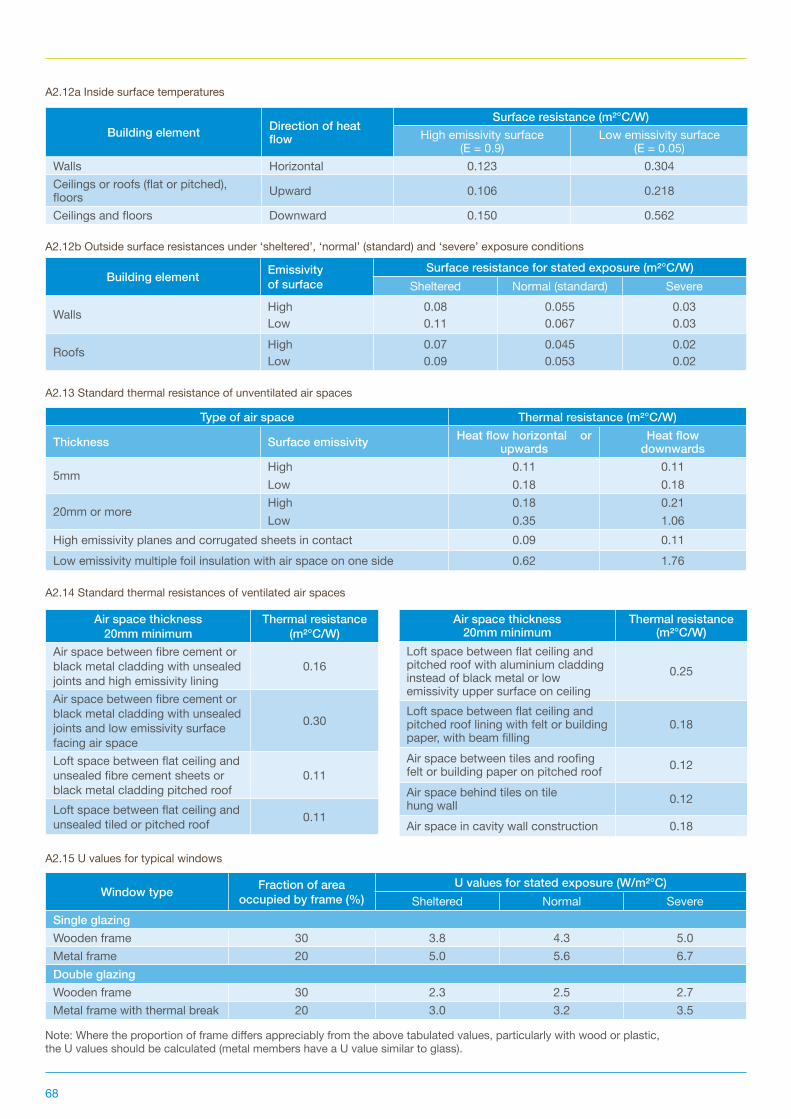
68
Building element Direction of heat flow
Surface resistance (m²°C/W)High emissivity surface
(E = 0.9)Low emissivity surface
(E = 0.05)Walls Horizontal 0.123 0.304Ceilings or roofs (flat or pitched), floors Upward 0.106 0.218
Ceilings and floors Downward 0.150 0.562
A2.12a Inside surface temperatures
Building element Emissivity of surface
Surface resistance for stated exposure (m²°C/W)Sheltered Normal (standard) Severe
Walls High 0.08 0.055 0.03Low 0.11 0.067 0.03
Roofs High 0.07 0.045 0.02Low 0.09 0.053 0.02
A2.12b Outside surface resistances under ‘sheltered’, ‘normal’ (standard) and ‘severe’ exposure conditions
Type of air space Thermal resistance (m²°C/W)
Thickness Surface emissivity Heat flow horizontal or upwards
Heat flow downwards
5mmHigh 0.11 0.11Low 0.18 0.18
20mm or moreHigh 0.18 0.21Low 0.35 1.06
High emissivity planes and corrugated sheets in contact 0.09 0.11Low emissivity multiple foil insulation with air space on one side 0.62 1.76
A2.13 Standard thermal resistance of unventilated air spaces
Window type Fraction of area occupied by frame (%)
U values for stated exposure (W/m²°C)Sheltered Normal Severe
Single glazingWooden frame 30 3.8 4.3 5.0Metal frame 20 5.0 5.6 6.7Double glazingWooden frame 30 2.3 2.5 2.7Metal frame with thermal break 20 3.0 3.2 3.5
A2.15 U values for typical windows
Air space thickness 20mm minimum
Thermal resistance (m²°C/W)
Air space between fibre cement or black metal cladding with unsealed joints and high emissivity lining
0.16
Air space between fibre cement or black metal cladding with unsealed joints and low emissivity surface facing air space
0.30
Loft space between flat ceiling and unsealed fibre cement sheets or black metal cladding pitched roof
0.11
Loft space between flat ceiling and unsealed tiled or pitched roof 0.11
A2.14 Standard thermal resistances of ventilated air spaces
Air space thickness 20mm minimum
Thermal resistance (m²°C/W)
Loft space between flat ceiling and pitched roof with aluminium cladding instead of black metal or low emissivity upper surface on ceiling
0.25
Loft space between flat ceiling and pitched roof lining with felt or building paper, with beam filling
0.18
Air space between tiles and roofing felt or building paper on pitched roof 0.12
Air space behind tiles on tile hung wall 0.12
Air space in cavity wall construction 0.18
Note: Where the proportion of frame differs appreciably from the above tabulated values, particularly with wood or plastic, the U values should be calculated (metal members have a U value similar to glass).
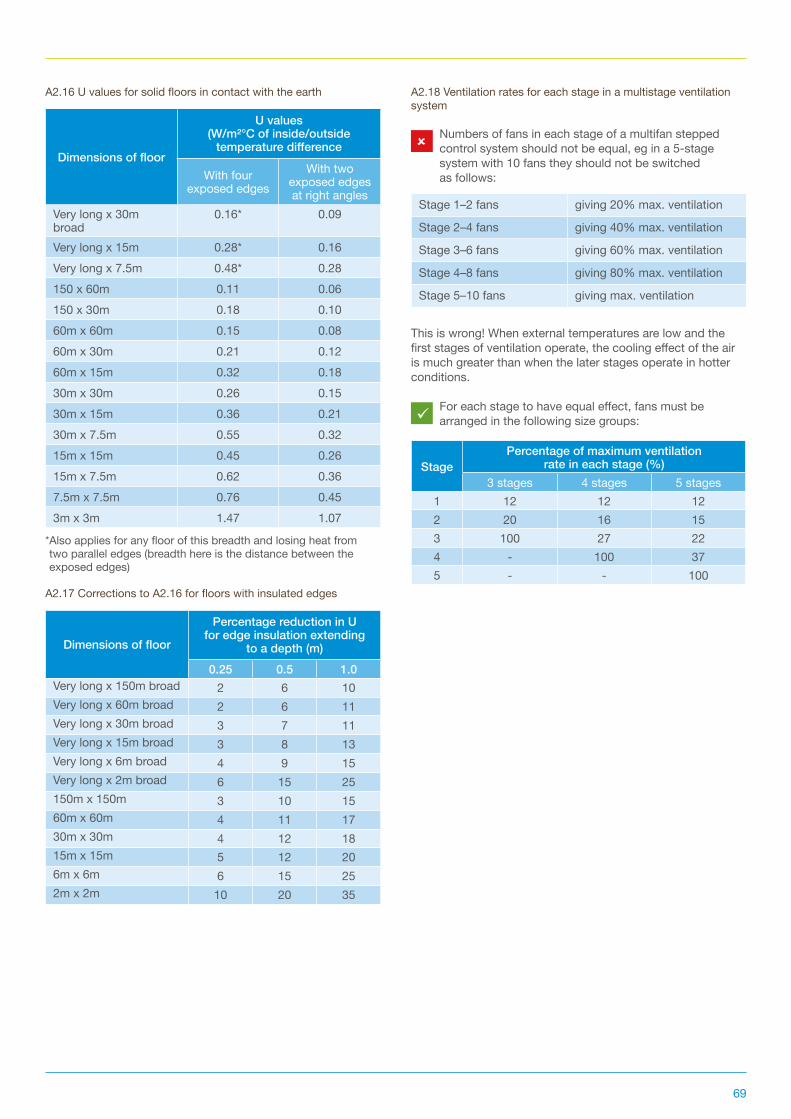
69
Dimensions of floor
U values (W/m²°C of inside/outside
temperature difference
With four exposed edges
With two exposed edges at right angles
Very long x 30m broad
0.16* 0.09
Very long x 15m 0.28* 0.16Very long x 7.5m 0.48* 0.28150 x 60m 0.11 0.06150 x 30m 0.18 0.1060m x 60m 0.15 0.0860m x 30m 0.21 0.1260m x 15m 0.32 0.1830m x 30m 0.26 0.1530m x 15m 0.36 0.2130m x 7.5m 0.55 0.3215m x 15m 0.45 0.2615m x 7.5m 0.62 0.367.5m x 7.5m 0.76 0.453m x 3m 1.47 1.07
A2.16 U values for solid floors in contact with the earth
Dimensions of floor
Percentage reduction in U for edge insulation extending
to a depth (m)0.25 0.5 1.0
Very long x 150m broad 2 6 10Very long x 60m broad 2 6 11Very long x 30m broad 3 7 11Very long x 15m broad 3 8 13Very long x 6m broad 4 9 15Very long x 2m broad 6 15 25150m x 150m 3 10 1560m x 60m 4 11 1730m x 30m 4 12 1815m x 15m 5 12 206m x 6m 6 15 252m x 2m 10 20 35
A2.17 Corrections to A2.16 for floors with insulated edges
StagePercentage of maximum ventilation
rate in each stage (%)3 stages 4 stages 5 stages
1 12 12 122 20 16 153 100 27 224 - 100 375 - - 100
A2.18 Ventilation rates for each stage in a multistage ventilation system
û Numbers of fans in each stage of a multifan stepped control system should not be equal, eg in a 5-stage system with 10 fans they should not be switched as follows:
This is wrong! When external temperatures are low and the first stages of ventilation operate, the cooling effect of the air is much greater than when the later stages operate in hotter conditions.
ü For each stage to have equal effect, fans must be arranged in the following size groups:
Stage 1–2 fans giving 20% max. ventilation
Stage 2–4 fans giving 40% max. ventilation
Stage 3–6 fans giving 60% max. ventilation
Stage 4–8 fans giving 80% max. ventilation
Stage 5–10 fans giving max. ventilation
* Also applies for any floor of this breadth and losing heat from two parallel edges (breadth here is the distance between the exposed edges)
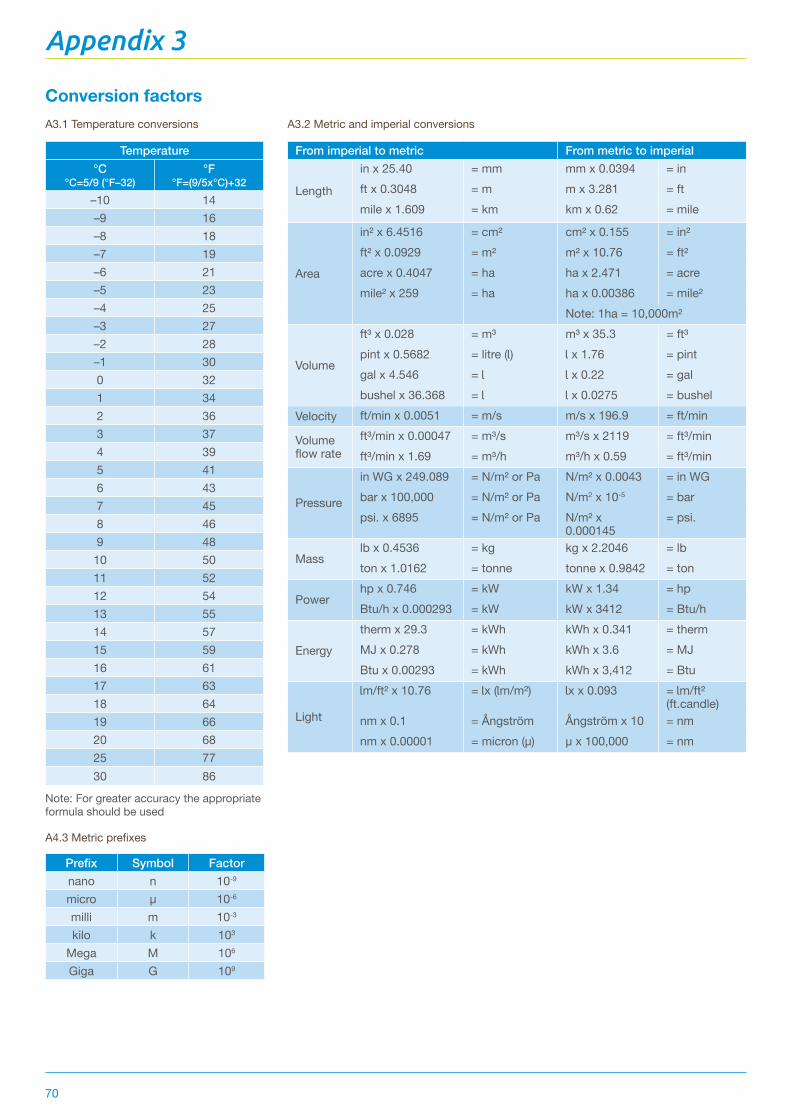
70
Appendix 3
Temperature°C
°C=5/9 (°F–32)°F
°F=(9/5x°C)+32–10 14–9 16–8 18–7 19–6 21–5 23–4 25–3 27–2 28–1 300 321 342 363 374 395 416 437 458 469 4810 5011 5212 5413 5514 5715 5916 6117 6318 6419 6620 6825 7730 86
A3.1 Temperature conversions
Prefix Symbol Factornano n 10-9 micro µ 10-6
milli m 10-3
kilo k 103
Mega M 106
Giga G 109
A4.3 Metric prefixes
From imperial to metric From metric to imperial
Length
in x 25.40 = mm mm x 0.0394 = inft x 0.3048 = m m x 3.281 = ftmile x 1.609 = km km x 0.62 = mile
Area
in² x 6.4516 = cm² cm² x 0.155 = in²ft² x 0.0929 = m² m² x 10.76 = ft²acre x 0.4047 = ha ha x 2.471 = acremile² x 259 = ha ha x 0.00386 = mile²
Note: 1ha = 10,000m²
Volume
ft³ x 0.028 = m³ m³ x 35.3 = ft³pint x 0.5682 = litre (Ɩ) Ɩ x 1.76 = pintgal x 4.546 = Ɩ Ɩ x 0.22 = galbushel x 36.368 = Ɩ Ɩ x 0.0275 = bushel
Velocity ft/min x 0.0051 = m/s m/s x 196.9 = ft/min
Volumeflow rate
ft³/min x 0.00047 = m³/s m³/s x 2119 = ft³/minft³/min x 1.69 = m³/h m³/h x 0.59 = ft³/min
Pressure
in WG x 249.089 = N/m² or Pa N/m² x 0.0043 = in WGbar x 100,000 = N/m² or Pa N/m2 x 10-5 = barpsi. x 6895 = N/m² or Pa N/m² x
0.000145= psi.
Masslb x 0.4536 = kg kg x 2.2046 = lbton x 1.0162 = tonne tonne x 0.9842 = ton
Powerhp x 0.746 = kW kW x 1.34 = hpBtu/h x 0.000293 = kW kW x 3412 = Btu/h
Energytherm x 29.3 = kWh kWh x 0.341 = thermMJ x 0.278 = kWh kWh x 3.6 = MJBtu x 0.00293 = kWh kWh x 3,412 = Btu
Light
Ɩm/ft² x 10.76 = Ɩx (Ɩm/m²) Ɩx x 0.093 = Ɩm/ft² (ft.candle)
nm x 0.1 = Ångström Ångström x 10 = nmnm x 0.00001 = micron (µ) µ x 100,000 = nm
A3.2 Metric and imperial conversions
Note: For greater accuracy the appropriate formula should be used
Conversion factors
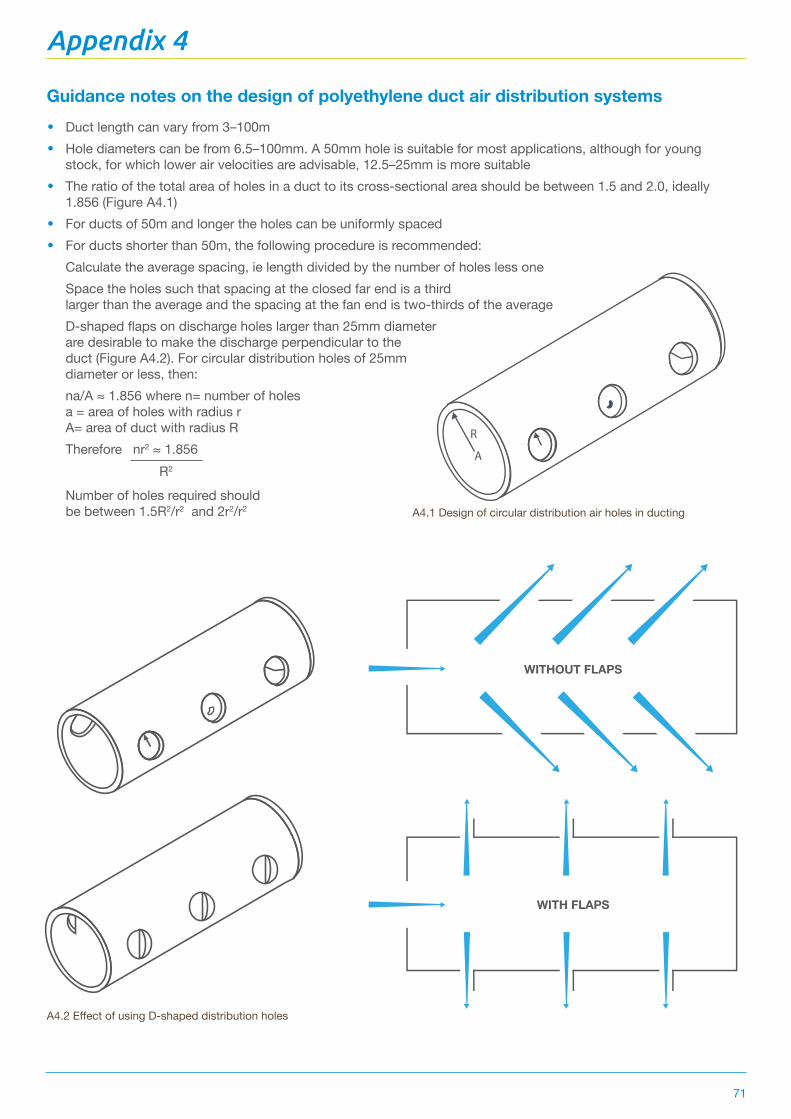
71
Guidance notes on the design of polyethylene duct air distribution systems
WITHOUT FLAPS
WITH FLAPS
• Duct length can vary from 3–100m
• Hole diameters can be from 6.5–100mm. A 50mm hole is suitable for most applications, although for young stock, for which lower air velocities are advisable, 12.5–25mm is more suitable
• The ratio of the total area of holes in a duct to its cross-sectional area should be between 1.5 and 2.0, ideally 1.856 (Figure A4.1)
• For ducts of 50m and longer the holes can be uniformly spaced
• For ducts shorter than 50m, the following procedure is recommended: Calculate the average spacing, ie length divided by the number of holes less oneSpace the holes such that spacing at the closed far end is a third larger than the average and the spacing at the fan end is two-thirds of the averageD-shaped flaps on discharge holes larger than 25mm diameter are desirable to make the discharge perpendicular to the duct (Figure A4.2). For circular distribution holes of 25mm diameter or less, then:na/A ≈ 1.856 where n= number of holes a = area of holes with radius r A= area of duct with radius RTherefore nr2 ≈ 1.856
Number of holes required should be between 1.5R2/r2 and 2r2/r2 A4.1 Design of circular distribution air holes in ducting
A4.2 Effect of using D-shaped distribution holes
R2
Appendix 4
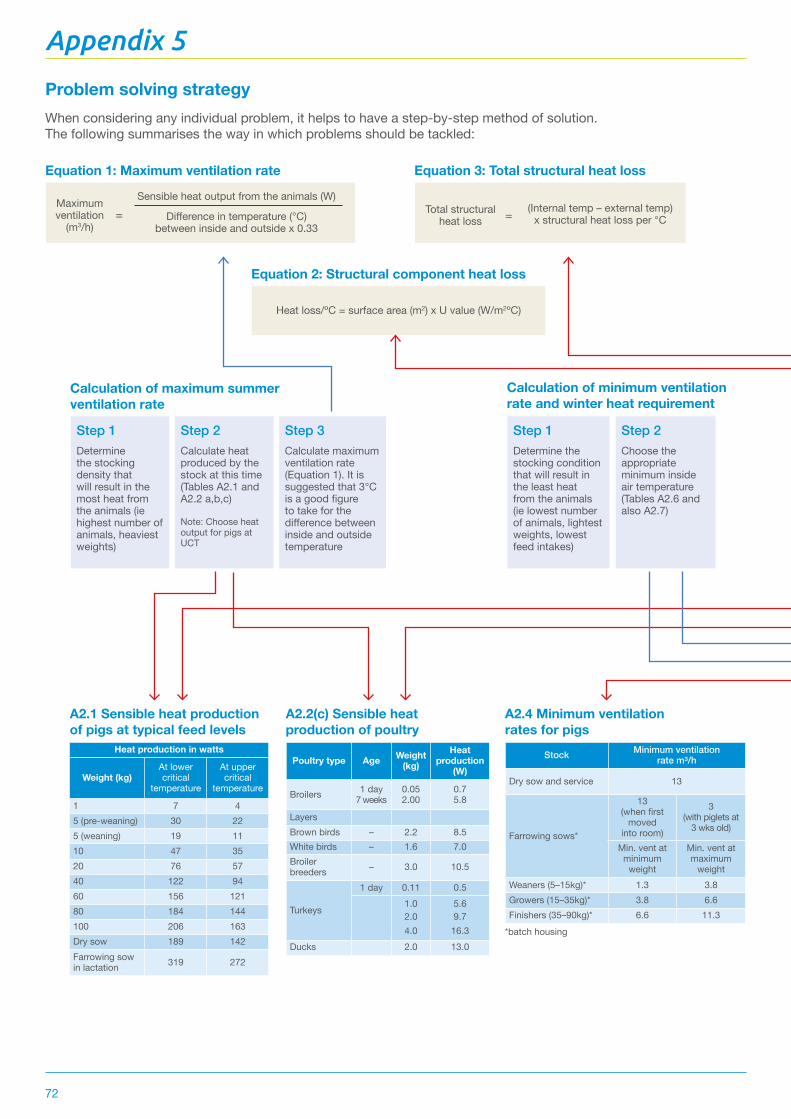
72
Step 1 Determine the stocking density that will result in the most heat from the animals (ie highest number of animals, heaviest weights)
Calculation of maximum summer ventilation rate
Equation 1: Maximum ventilation rate
A2.1 Sensible heat production of pigs at typical feed levels
A2.2(c) Sensible heat production of poultry
A2.4 Minimum ventilation rates for pigs
Equation 3: Total structural heat loss
Equation 2: Structural component heat loss
Heat loss/ºC = surface area (m2) x U value (W/m2ºC)
Calculation of minimum ventilation rate and winter heat requirement
Step 2 Calculate heat produced by the stock at this time (Tables A2.1 and A2.2 a,b,c)
Note: Choose heat output for pigs at UCT
Step 3 Calculate maximum ventilation rate (Equation 1). It is suggested that 3°C is a good figure to take for the difference between inside and outside temperature
Step 1 Determine the stocking condition that will result in the least heat from the animals (ie lowest number of animals, lightest weights, lowest feed intakes)
Step 2 Choose the appropriate minimum inside air temperature (Tables A2.6 and also A2.7)
Heat production in watts
Weight (kg)At lower critical
temperature
At upper critical
temperature
1 7 45 (pre-weaning) 30 225 (weaning) 19 1110 47 3520 76 5740 122 9460 156 12180 184 144100 206 163Dry sow 189 142Farrowing sow in lactation 319 272
Poultry type Age Weight (kg)
Heat production
(W)
Broilers 1 day7 weeks
0.052.00
0.75.8
LayersBrown birds – 2.2 8.5White birds – 1.6 7.0Broiler breeders – 3.0 10.5
Turkeys
1 day 0.11 0.51.0 5.62.0 9.74.0 16.3
Ducks 2.0 13.0
Stock Minimum ventilation rate m³/h
Dry sow and service 13
Farrowing sows*
13 (when first
moved into room)
3 (with piglets at
3 wks old)
Min. vent at minimum
weight
Min. vent at maximum
weightWeaners (5–15kg)* 1.3 3.8Growers (15–35kg)* 3.8 6.6Finishers (35–90kg)* 6.6 11.3
*batch housing
Maximum ventilation
(m3/h)Total structural
heat loss= =Sensible heat output from the animals (W)
(Internal temp – external temp) x structural heat loss per °C
Problem solving strategy
Difference in temperature (°C) between inside and outside x 0.33
When considering any individual problem, it helps to have a step-by-step method of solution. The following summarises the way in which problems should be tackled:
Appendix 5
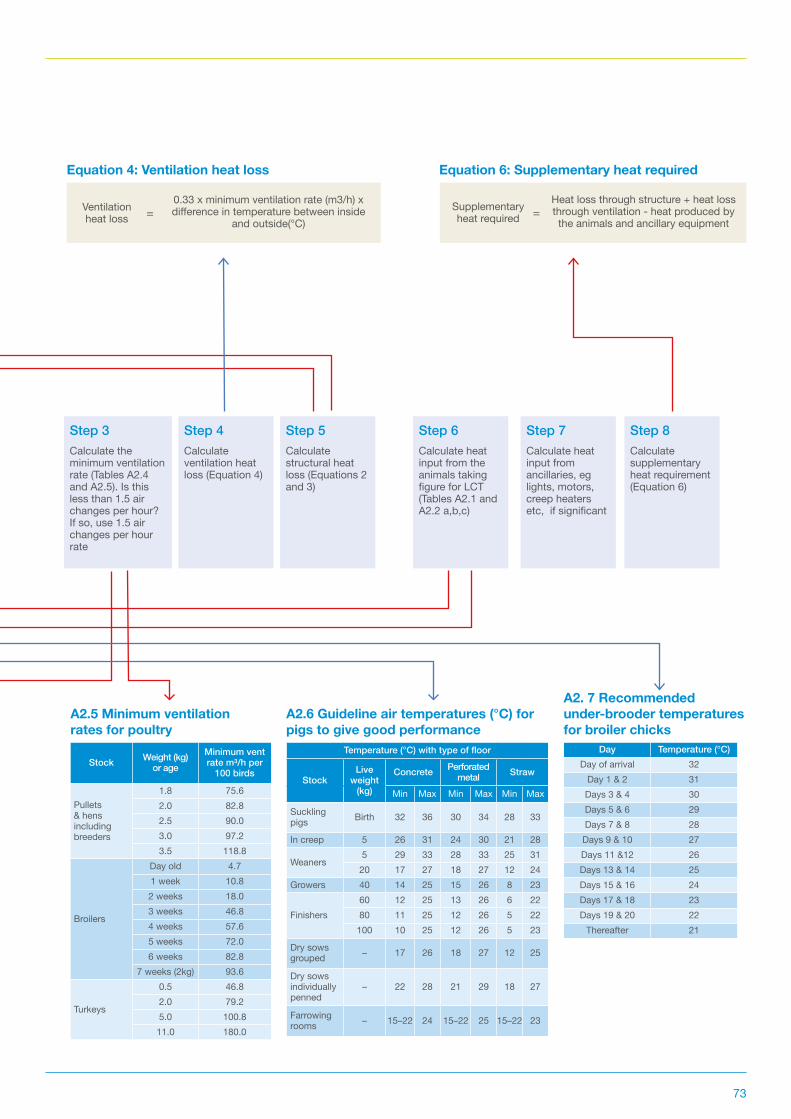
73
A2.5 Minimum ventilation rates for poultry
A2.6 Guideline air temperatures (°C) for pigs to give good performance
A2. 7 Recommended under-brooder temperatures for broiler chicks
Equation 4: Ventilation heat loss Equation 6: Supplementary heat required
Step 3 Calculate the minimum ventilation rate (Tables A2.4 and A2.5). Is this less than 1.5 air changes per hour? If so, use 1.5 air changes per hour rate
Step 4 Calculate ventilation heat loss (Equation 4)
Step 5 Calculate structural heat loss (Equations 2 and 3)
Step 6 Calculate heat input from the animals taking figure for LCT (Tables A2.1 and A2.2 a,b,c)
Step 7 Calculate heat input from ancillaries, eg lights, motors, creep heaters etc, if significant
Step 8 Calculate supplementary heat requirement (Equation 6)
Stock Weight (kg) or age
Minimum vent rate m³/h per
100 birds
Pullets & hens including breeders
1.8 75.62.0 82.82.5 90.03.0 97.23.5 118.8
Broilers
Day old 4.71 week 10.82 weeks 18.03 weeks 46.84 weeks 57.65 weeks 72.06 weeks 82.8
7 weeks (2kg) 93.6
Turkeys
0.5 46.82.0 79.25.0 100.811.0 180.0
Temperature (°C) with type of floor
StockLive
weight (kg)
Concrete Perforated metal Straw
Min Max Min Max Min Max
Suckling pigs Birth 32 36 30 34 28 33
In creep 5 26 31 24 30 21 28
Weaners5 29 33 28 33 25 31
20 17 27 18 27 12 24Growers 40 14 25 15 26 8 23
Finishers60 12 25 13 26 6 2280 11 25 12 26 5 22100 10 25 12 26 5 23
Dry sows grouped – 17 26 18 27 12 25
Dry sows individually penned
– 22 28 21 29 18 27
Farrowing rooms – 15–22 24 15–22 25 15–22 23
Day Temperature (°C)Day of arrival 32
Day 1 & 2 31Days 3 & 4 30Days 5 & 6 29Days 7 & 8 28Days 9 & 10 27Days 11 &12 26Days 13 & 14 25Days 15 & 16 24Days 17 & 18 23Days 19 & 20 22
Thereafter 21
Ventilation heat loss
Supplementary heat required= =
0.33 x minimum ventilation rate (m3/h) x difference in temperature between inside
and outside(°C)
Heat loss through structure + heat loss through ventilation - heat produced by the animals and ancillary equipment
74
Mendes A.S., S..J. Paixão, R. Restelatto, G.M. Morello, D.J. de Moura and J.C. Possenti. 2013. Performance and preference of broiler chickens exposed to different lighting sources. J. Appl. Poult. Res. 22(1):62–70. doi: 10.3382/japr.2012-00580Huber-Eicher B., A. Suter and P. Spring-Stähli. 2013. Effects of colored light-emitting diode illumination on behavior and performance of laying hens. Poult. Sci. 92(4):869–873. doi: 10.3382/ps.2012-02679pork.ahdb.org.uk/media/39814/lighting-for-pig-units-final-report.pdfthepigsite.com/pighealth/article/111/lightthepigsite.com/articles/3282/lighting-for-pig-unitsajas.info/upload/pdf/14-42.pdfaasv.org/shap/issues/v18n5/v18n5p230
References
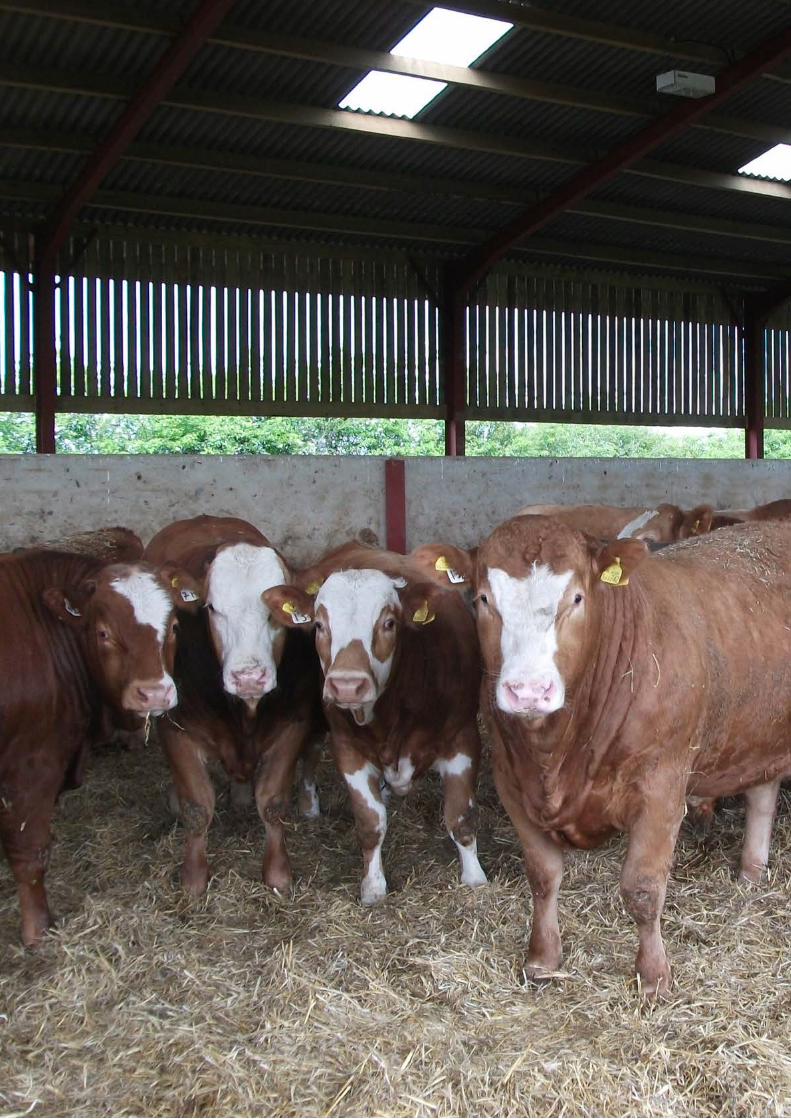
75
Produced for you by:AHDB Stoneleigh Park Kenilworth Warwickshire CV8 2TL
T 024 7669 2051 E [email protected] W ahdb.org.uk
@TheAHDBIf you no longer wish to receive this information, please email us on [email protected]
While the Agriculture and Horticulture Development Board seeks to ensure that the information contained within this document is accurate at the time of printing, no warranty is given in respect thereof and, to the maximum extent permitted by law, the Agriculture and Horticulture Development Board accepts no liability for loss, damage or injury howsoever caused (including that caused by negligence) or suffered directly or indirectly in relation to information and opinions contained in or omitted from this document.
© Agriculture and Horticulture Development Board 2018. All rights reserved.