Embed Size (px)
Citation preview

Controlled coupling of photonic crystal cavities using photochromic tuningTao Cai, Ranojoy Bose, Glenn S. Solomon, and Edo Waks Citation: Applied Physics Letters 102, 141118 (2013); doi: 10.1063/1.4802238 View online: http://dx.doi.org/10.1063/1.4802238 View Table of Contents: http://scitation.aip.org/content/aip/journal/apl/102/14?ver=pdfcov Published by the AIP Publishing Advertisement:
This article is copyrighted as indicated in the abstract. Reuse of AIP content is subject to the terms at: http://scitation.aip.org/termsconditions. Downloaded to IP:
128.143.23.241 On: Tue, 29 Oct 2013 17:41:59
Controlled coupling of photonic crystal cavities using photochromic tuning
Tao Cai (蔡涛),1,a) Ranojoy Bose,1,a) Glenn S. Solomon,2 and Edo Waks1,2,b)1Department of Electrical Engineering, University of Maryland, College Park, Maryland 20742, USA2Joint Quantum Institute, University of Maryland, College Park, Maryland 20742, USA and National Instituteof Standards and Technology, Gaithersburg, Maryland 20899, USA
(Received 9 January 2013; accepted 4 April 2013; published online 12 April 2013)
We present a method to control the resonant coupling interaction in a coupled-cavity photonic
crystal molecule by using a local and reversible photochromic tuning technique. We demonstrate
the ability to tune both a two-cavity and a three-cavity photonic crystal molecule through the
resonance condition by selectively tuning the individual cavities. Using this technique, we can
quantitatively determine important parameters of the coupled-cavity system such as the photon
tunneling rate. This method can be scaled to photonic crystal molecules with larger numbers of
cavities, which provides a versatile method for studying strong interactions in coupled resonator
arrays.VC 2013 AIP Publishing LLC [http://dx.doi.org/10.1063/1.4802238]
Photonic molecules consisting of two or more coupled
microcavities are being explored for a variety of linear and
nonlinear photonics applications such as biological and
chemical sensors,1 optical memory,2 slow light engineering,3
and lasers.4 Two-dimensional photonic crystals (PhC) offer
an ideal device platform for realizing photonic molecules due
to their inherently scalable planar architecture. PhC cavities
also offer the capability of coupling to semiconductor quan-
tum emitters such as quantum dots (QDs) in the strong cou-
pling regime,5,6 which enables strong optical nonlinearities
near the single photon level.7–11 The interaction of photonic
crystal molecules with quantum emitters could enable a broad
range of applications that include quantum computing,12 sin-
gle photon generation,13,14 quantum-optical Josephson inter-
ferometry,15 and quantum simulation.16,17
Photonic crystal molecules have been experimentally
realized in a number of previous works.4,18–24 In order to
strongly couple PhC cavities, it is essential that their reso-
nance frequencies be matched to within the normal-mode
splitting. Once the detuning between the cavities is large
compared to this splitting, they will decouple and behave as
individual cavities as opposed to a coupled system. In PhCs,
engineering coupled cavities with nearly identical frequen-
cies are challenging because of fabrication inaccuracies.
Previous studies of photonic crystal molecules overcame this
problem by engineering large normal mode splitting exceed-
ing 500GHz.18–21 For many applications, however, it is
important to be able to accurately control the detuning
between the cavities. This capability enables selective cou-
pling and decoupling of cavity modes, which is important for
controlling coupled-cavity interaction strength and also for
characterizing fundamental physical properties such as pho-
ton tunneling rate. Accurate control of individual cavities in
photonic crystal molecules could also enable reconfigurable
photonic devices such as tunable filters25,26 and tunable
lasers.27 In addition, local tuning of cavities can serve to cor-
rect for fabrication imperfections, enabling the coupling of a
large number of cavities to form complex arrays of coupled
cavity structures.24
A variety of methods have been demonstrated for tuning
PhC cavity resonances. Nanofluidic tuning22,23 has been
demonstrated as an effective room-temperature approach,
but is difficult to apply for quantum optics applications that
usually require low temperatures. Free-carrier injection28
provides another approach for cavity tuning but typically
provides only small resonance shifts and may also generate
fluorescence from embedded quantum emitters. Thermo-
optic tuning29,30 has been demonstrated in coupled cavity
structures but is difficult to extend to arrays of closely
packed devices and will also shift the resonance frequency
of embedded quantum emitters such as QDs.31 Other
approaches utilize nano-mechanical tuning,32 which requires
a complex setup and can also strongly degrade the cavity
quality factor (Q).In this paper, we demonstrate local and reversible tuning
of individual cavities in a photonic crystal molecule by using
a photochromic thin-film.26,27,33 The photochromic thin film
is spin-coated over the entire sample and locally pumped to
modify the effective refractive index of individual cavities in
the molecule, enabling them to be selectively coupled or
decoupled. By tuning the cavities through the resonance con-
dition, we observe clear normal mode splitting, enabling us
to quantitatively determine the photon tunneling rate. We
demonstrate the ability to resonantly tune both a two-cavity
and a three-cavity photonic crystal molecule, which shows
promise for scaling to more complex devices composed of
large arrays of interacting cavities.
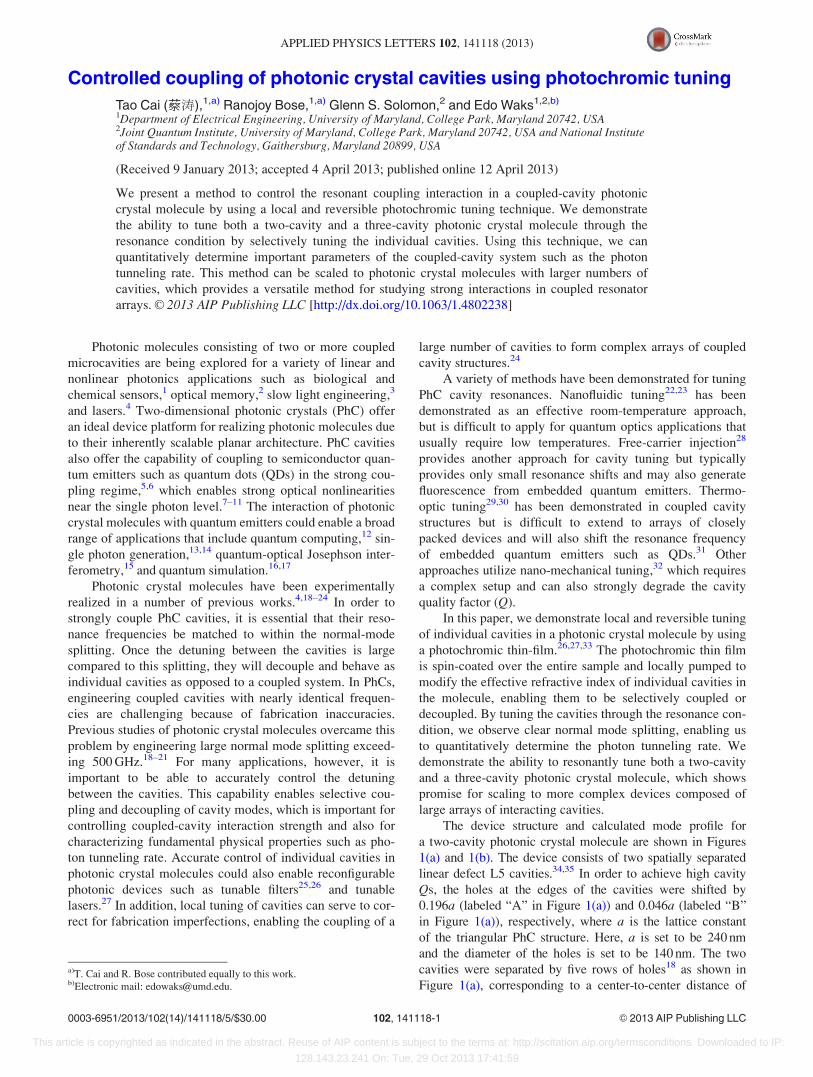
The device structure and calculated mode profile for
a two-cavity photonic crystal molecule are shown in Figures
1(a) and 1(b). The device consists of two spatially separated
linear defect L5 cavities.34,35 In order to achieve high cavity
Qs, the holes at the edges of the cavities were shifted by
0.196a (labeled “A” in Figure 1(a)) and 0.046a (labeled “B”
in Figure 1(a)), respectively, where a is the lattice constant
of the triangular PhC structure. Here, a is set to be 240 nm
and the diameter of the holes is set to be 140 nm. The two
cavities were separated by five rows of holes18 as shown in
Figure 1(a), corresponding to a center-to-center distance of
a)T. Cai and R. Bose contributed equally to this work.b)Electronic mail: [email protected].
0003-6951/2013/102(14)/141118/5/$30.00 VC 2013 AIP Publishing LLC102, 141118-1
APPLIED PHYSICS LETTERS 102, 141118 (2013)
This article is copyrighted as indicated in the abstract. Reuse of AIP content is subject to the terms at: http://scitation.aip.org/termsconditions. Downloaded to IP:
128.143.23.241 On: Tue, 29 Oct 2013 17:41:59
2.92lm. The spatial mode profile of the device was obtained
by three-dimensional finite-difference time-domain simula-
tions and shows that the two-cavity photonic crystal mole-
cule supports both symmetric and anti-symmetric modes
with calculated Q of 7� 105 and 6� 105, respectively, and
a normal-mode splitting of 120GHz (0.37 nm).
The designed device was fabricated using an initial
wafer comprising of a 160-nm thick gallium arsenide (GaAs)
membrane, grown on a 1-lm thick sacrificial layer of alumi-
num gallium arsenide (Al0:78Ga0:22As). A single layer of
indium arsenide (InAs) QDs was grown at the center of the
GaAs membrane (density 100–150 QDs=lm2). The QDs
served as an internal white-light source in order to optically
characterize the device. A schematic of the device structure
is shown in Figure 1(c). PhCs were defined on the GaAs
membrane using electron-beam lithography and chlorine-
based inductively coupled plasma dry etching. The sacrificial
Al0:78Ga0:22As layer was under-cut using a selective wet-
etch process, leading to a free-standing GaAs membrane. A
scanning electron microscope (SEM) image of a fabricated
device is shown in Figure 1(d), with the two cavities labeled
as C1 and C2, respectively. The photochromic thin-film layer
was deposited on the structure through spin coating. Details
of the photochromic film preparation and properties were
previously reported.26,27 The film is composed of a mixture
of 5wt. % 1,3,3-Trimethylindo linonaphthospirooxazine
(TCI America) and 0.5 wt. % 950 PMMA A4 dissolved in
anisole. The solution was spun on the fabricated device sur-
face at a spin rate of 3250 rpm, resulting in a film thickness
of approximately 60 nm. At this film thickness, the maxi-
mum tuning range was previously measured to be 3 nm.26 A
thicker film increases this tuning range but also significantly
degrades the cavity Q.The fabricated device was mounted in a continuous flow
liquid helium cryostat and cooled to a temperature around
35K. QDs in the cavity regions were optically excited using
a continuous wave Ti:sapphire laser at 780 nm. Both cavities
could be excited simultaneously by the excitation laser with
a sufficiently large spot size or either single cavity could be
selectively excited by moving the laser spot around. The
emission was collected using a confocal microscope with an
objective lens (numerical aperture 0.7) and focused onto a
pinhole aperture for spatial filtering. The aperture could be
made large to collect emission from both cavities simultane-
ously, or it could be reduced to isolate the emission from
only one of the two cavities. The collected emission was
spectrally resolved using a grating spectrometer with wave-
length resolution of 0.02 nm.
Figure 1(e) shows the photoluminescence (PL) spectrum
(shown with green circles) of a fabricated device obtained by
exciting both cavities simultaneously and collecting emis-
sion with a large pinhole aperture prior to tuning. The spec-
trum exhibits two bright peaks corresponding to the
resonances of the two cavity modes (labeled CM1 and CM2
in the figure). The bright peaks were numerically fit to a
double Lorentzian function, shown as blue solid line in
Figure 1(e). From the fit, the resonant wavelengths of CM1
and CM2 were found to be 942.12 nm and 942.54 nm,
respectively, which corresponded to a spectral separation of
139GHz (0.42 nm). The cavity linewidths were determined
from the fit to be 0.09 nm and 0.04 nm, respectively, corre-
sponding to a cavity Q of 1:05� 104 (j/2p¼ 30GHz) and
2:36� 104 (j/2p¼ 14GHz). The initial discrepancy in the
cavity resonant frequencies and linewidths is attributed to
fabrication inaccuracies.
The sample was next illuminated with a focused ultra-
violet (UV) laser emitting at 375 nm with an average inten-
sity of 3W/cm2. The laser spot was focused on the cavity C1
and was sufficiently small to enable photochromic tuning of
the CM1 resonance without affecting CM2. Both cavities
were excited with the 780-nm laser and the change in the
cavity wavelength was monitored using PL emission col-
lected from both of the cavity modes simultaneously using a
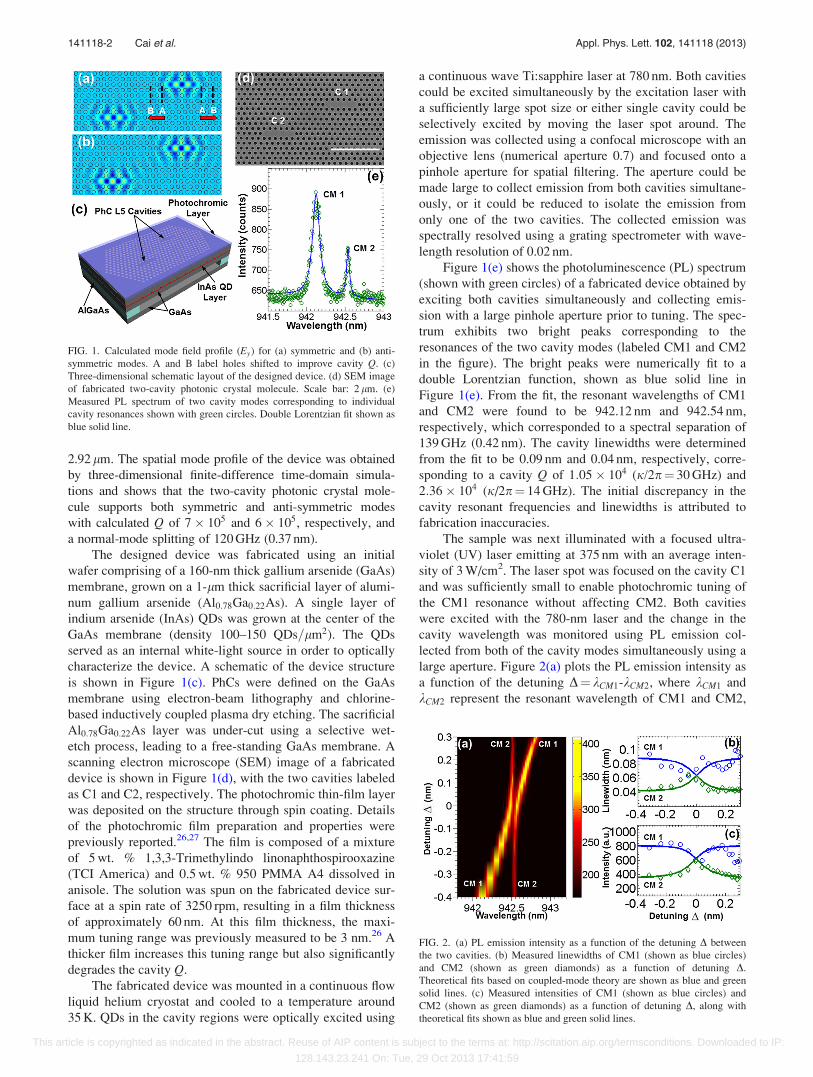
large aperture. Figure 2(a) plots the PL emission intensity as
a function of the detuning D¼ kCM1-kCM2, where kCM1 and
kCM2 represent the resonant wavelength of CM1 and CM2,
FIG. 1. Calculated mode field profile (Ey) for (a) symmetric and (b) anti-
symmetric modes. A and B label holes shifted to improve cavity Q. (c)Three-dimensional schematic layout of the designed device. (d) SEM image
of fabricated two-cavity photonic crystal molecule. Scale bar: 2 lm. (e)
Measured PL spectrum of two cavity modes corresponding to individual
cavity resonances shown with green circles. Double Lorentzian fit shown as
blue solid line.
FIG. 2. (a) PL emission intensity as a function of the detuning D between
the two cavities. (b) Measured linewidths of CM1 (shown as blue circles)
and CM2 (shown as green diamonds) as a function of detuning D.Theoretical fits based on coupled-mode theory are shown as blue and green
solid lines. (c) Measured intensities of CM1 (shown as blue circles) and
CM2 (shown as green diamonds) as a function of detuning D, along with
theoretical fits shown as blue and green solid lines.
141118-2 Cai et al. Appl. Phys. Lett. 102, 141118 (2013)
This article is copyrighted as indicated in the abstract. Reuse of AIP content is subject to the terms at: http://scitation.aip.org/termsconditions. Downloaded to IP:
128.143.23.241 On: Tue, 29 Oct 2013 17:41:59
respectively. Under UV exposure, the wavelength of mode
CM1 was red-shifted and became resonant with CM2 at a
wavelength of 942.54 nm. As CM1 was tuned through CM2,
a clear mode anti-crossing could be observed. A normal
mode splitting of X0=2p¼ 32GHz (0.10 nm) was measured
when the two cavities were tuned on resonance, which can
be used to calculate the photon tunneling rate J between the
two cavities using the equation36
J ¼ffiffiffiffiffiffiffiffiffiffiffiffiffiffiffiffiffiffiffiffiffiffiffiffiffiffiffiffiffiffiffiffiffiffiffiffiffiffiffiffiffiffiffiffiffiffiffiffiffiffiffiffiffiffiffiffiffiffiffiX2
0 � ½x1 � x2 � iðj1 � j2Þ�2q �
2: (1)
In the above equation, x1 and x2 are the angular frequencies
of mode CM1 and CM2, respectively, while j1 and j2 are
the individual cavity decay rates. Using Eq. (1), we calcu-
lated a photon tunneling rate of J=2p ¼ 18 GHz.
Figure 2(b) plots the linewidths of the two cavity
modes as a function of detuning D, where the linewidth
was determined from the Lorentzian fit. As the cavities
were brought into resonance, the linewidths of the two
modes became identical, with both modes showing a fitted
linewidth of 0.06 nm (j/2p¼ 20GHz; Q¼ 1:57� 104).
Convergence of the linewidths is an evidence of hybridiza-
tion of the two cavity modes into a pair of strongly coupled
normal modes. As CM1 continued to be tuned through
resonance, the modes reverted back to their original
linewidths.
Figure 2(c) plots the intensities of the two modes as a
function of detuning D. Mode CM1 initially exhibited a
larger intensity prior to tuning, which was partly attributed to
better overlap with the pump beam, resulting in stronger ex-
citation of the QDs, as well as the fact that mode CM1 was
centered on the aperture while CM2 was off-center resulting
in a slightly lower collection efficiency. However, as CM1
was tuned on resonance with CM2, the cavity intensities
became identical, exhibiting another signature of mode
hybridization.
The observed results can be explained using a coupled-
mode theory. We define the cavity field amplitudes as a1 anda2 corresponding to modes CM1 and CM2, respectively. The
equations of motion for the two cavities can be described by
the coupled-mode equations37
d
dta1ðtÞ ¼ �ix1a1ðtÞ � j1
2a1ðtÞ � iJa2ðtÞ � aint1ðtÞ; (2)
d
dta2ðtÞ ¼ �ix2a2ðtÞ � j2
2a2ðtÞ � iJa1ðtÞ � aint2ðtÞ: (3)
Here, aint1ðtÞ and aint2ðtÞ are the cavity driving field ampli-
tudes that may originate either from an external driving
source, or in our case an internal source composed of
excited QDs embedded in the membrane. Equations (2) and
(3) can be solved in the frequency domain giving the
solutions
a1ðxÞ ¼ �j2aint1ðxÞ=2þ iðD2aint1ðxÞ þ Jaint2ðxÞÞðiD2 � j2=2ÞðiD1 � j1=2Þ þ J2
; (4)
a2ðxÞ ¼ �j1aint2ðxÞ=2þ iðD1aint2ðxÞ þ Jaint1ðxÞÞðiD2 � j2=2ÞðiD1 � j1=2Þ þ J2
; (5)
where x is the driving field angular frequency, D1 ¼ x� x1,
and D2 ¼ x� x2. The collected intensity from the two
cavities (averaged over time) is given by,
hIðxÞi ¼ c1D��a1ðxÞ
��2Eþ c2D��a2ðxÞ
��2E; (6)
where c1 and c2 are decay rates of the cavities into the collec-
tion mode (which is proportional to the collection efficiency).
We assume that the driving sources at the two cavities are
incoherent, which implies that haint1ðxÞaint2ðxÞi ¼ 0. This
assumption is highly realistic for our system because the
cavities are driven by an inhomogeneous distribution of QDs
that fluoresce independently, and each cavity is driven by
different QDs.
The blue and green solid lines in Figures 2(b) and 2(c)
plot the theoretically predicted behavior based on the
coupled-mode theory. The inhomogeneous QD emission
spectrum is much broader than both the cavity linewidths
and the normal mode splitting. We, therefore, treat
aint1ðxÞ ¼ aint1ðx1Þ and aint2ðxÞ ¼ aint2ðx2Þ as independentof x. We use aint1ðx1Þ, aint2ðx2Þ, c1, and c2 as fitting parame-
ters. The calculated results using coupled-mode theory show
extremely good agreement with the experimental results.
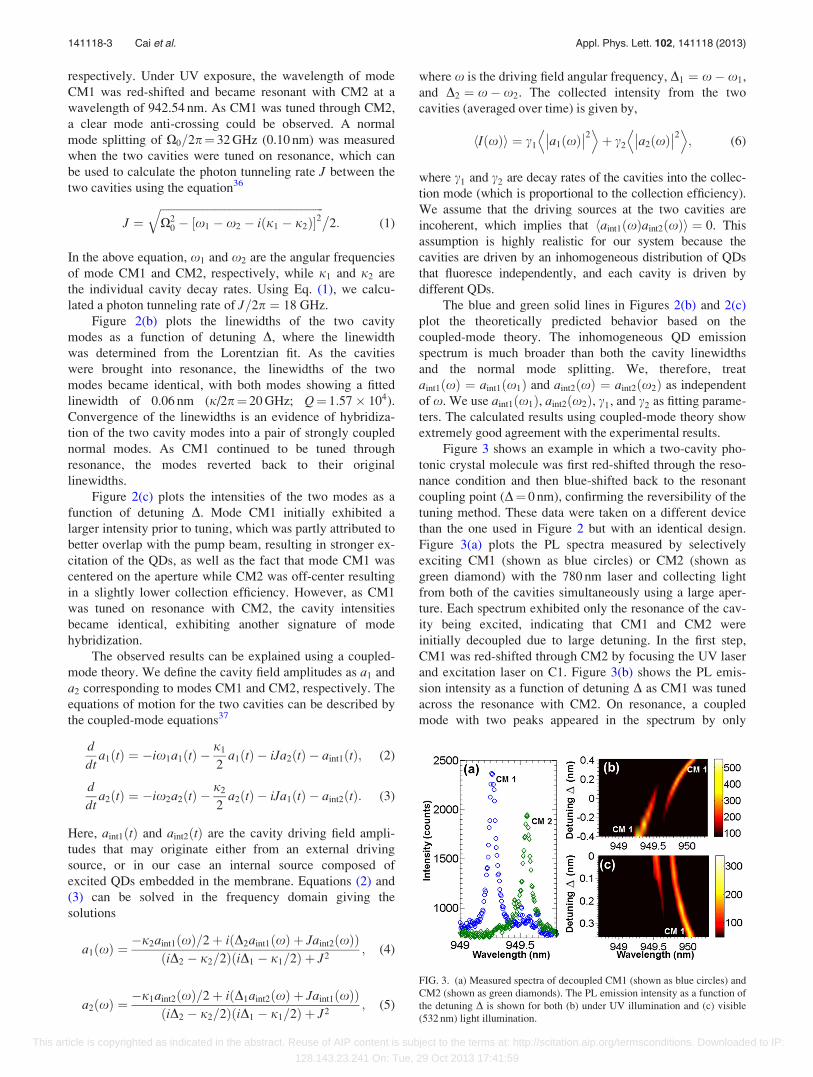
Figure 3 shows an example in which a two-cavity pho-
tonic crystal molecule was first red-shifted through the reso-
nance condition and then blue-shifted back to the resonant
coupling point (D¼ 0 nm), confirming the reversibility of the
tuning method. These data were taken on a different device
than the one used in Figure 2 but with an identical design.
Figure 3(a) plots the PL spectra measured by selectively
exciting CM1 (shown as blue circles) or CM2 (shown as
green diamond) with the 780 nm laser and collecting light
from both of the cavities simultaneously using a large aper-
ture. Each spectrum exhibited only the resonance of the cav-
ity being excited, indicating that CM1 and CM2 were
initially decoupled due to large detuning. In the first step,
CM1 was red-shifted through CM2 by focusing the UV laser
and excitation laser on C1. Figure 3(b) shows the PL emis-
sion intensity as a function of detuning D as CM1 was tuned
across the resonance with CM2. On resonance, a coupled
mode with two peaks appeared in the spectrum by only
FIG. 3. (a) Measured spectra of decoupled CM1 (shown as blue circles) and
CM2 (shown as green diamonds). The PL emission intensity as a function of
the detuning D is shown for both (b) under UV illumination and (c) visible
(532 nm) light illumination.
141118-3 Cai et al. Appl. Phys. Lett. 102, 141118 (2013)
This article is copyrighted as indicated in the abstract. Reuse of AIP content is subject to the terms at: http://scitation.aip.org/termsconditions. Downloaded to IP:
128.143.23.241 On: Tue, 29 Oct 2013 17:41:59
exciting mode CM1, which indicated the resonant coupling
point. Following the acquisition of the data in Figure 3(b),
mode CM1 was red-shifted relative to CM2 using photochro-
mic tuning. A 532 nm green laser (intensity of 24W/cm2)
was utilized to blue-shift it back into resonance with CM2,
as shown in Figure 3(c). Here, the ability to reversibly tune
the cavity frequency plays an important role, enabling us to
first find the resonant coupling point by red-shifting and then
re-establishing it by reversing the shift.
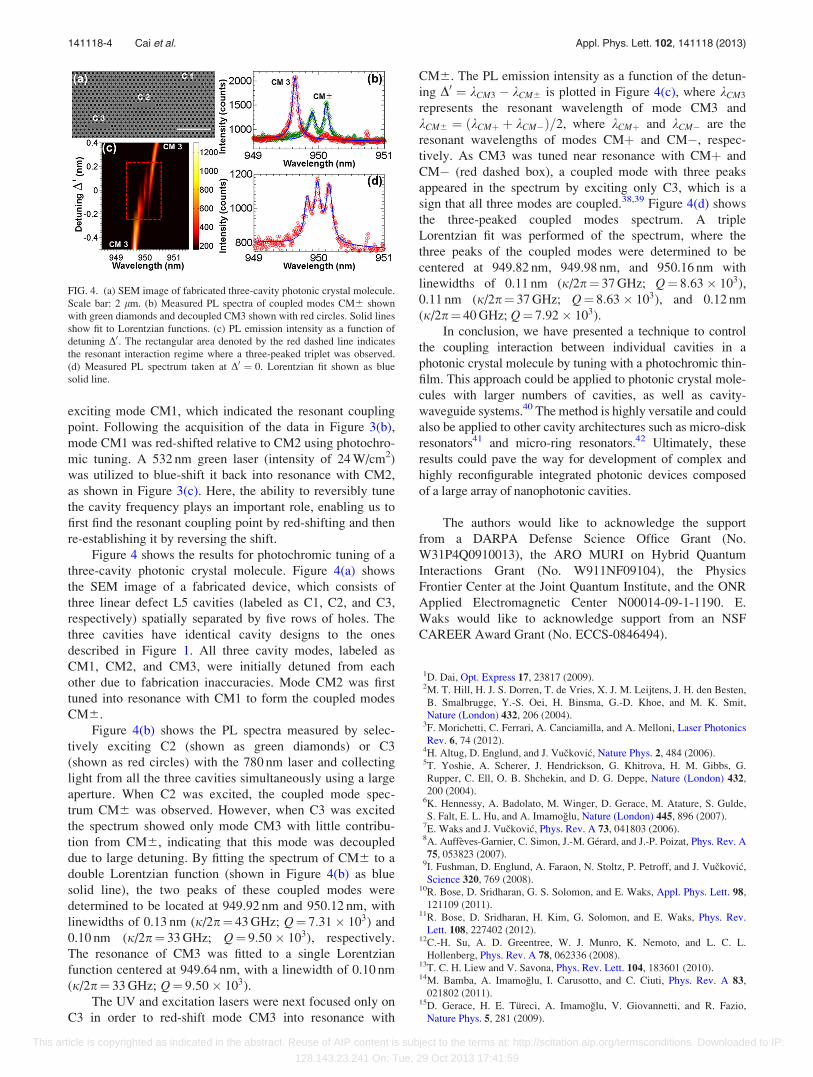
Figure 4 shows the results for photochromic tuning of a
three-cavity photonic crystal molecule. Figure 4(a) shows
the SEM image of a fabricated device, which consists of
three linear defect L5 cavities (labeled as C1, C2, and C3,
respectively) spatially separated by five rows of holes. The
three cavities have identical cavity designs to the ones
described in Figure 1. All three cavity modes, labeled as
CM1, CM2, and CM3, were initially detuned from each
other due to fabrication inaccuracies. Mode CM2 was first
tuned into resonance with CM1 to form the coupled modes
CM6.
Figure 4(b) shows the PL spectra measured by selec-
tively exciting C2 (shown as green diamonds) or C3
(shown as red circles) with the 780 nm laser and collecting
light from all the three cavities simultaneously using a large
aperture. When C2 was excited, the coupled mode spec-
trum CM6 was observed. However, when C3 was excited
the spectrum showed only mode CM3 with little contribu-
tion from CM6, indicating that this mode was decoupled
due to large detuning. By fitting the spectrum of CM6 to a
double Lorentzian function (shown in Figure 4(b) as blue
solid line), the two peaks of these coupled modes were
determined to be located at 949.92 nm and 950.12 nm, with
linewidths of 0.13 nm (j/2p¼ 43GHz; Q¼ 7:31� 103) and
0.10 nm (j/2p¼ 33GHz; Q¼ 9:50� 103), respectively.
The resonance of CM3 was fitted to a single Lorentzian
function centered at 949.64 nm, with a linewidth of 0.10 nm
(j/2p¼ 33GHz; Q¼ 9:50� 103).
The UV and excitation lasers were next focused only on
C3 in order to red-shift mode CM3 into resonance with
CM6. The PL emission intensity as a function of the detun-
ing D0 ¼ kCM3 � kCM6 is plotted in Figure 4(c), where kCM3
represents the resonant wavelength of mode CM3 and
kCM6 ¼ ðkCMþ þ kCM�Þ=2, where kCMþ and kCM� are the
resonant wavelengths of modes CMþ and CM�, respec-
tively. As CM3 was tuned near resonance with CMþ and
CM� (red dashed box), a coupled mode with three peaks
appeared in the spectrum by exciting only C3, which is a
sign that all three modes are coupled.38,39 Figure 4(d) shows
the three-peaked coupled modes spectrum. A triple
Lorentzian fit was performed of the spectrum, where the
three peaks of the coupled modes were determined to be
centered at 949.82 nm, 949.98 nm, and 950.16 nm with
linewidths of 0.11 nm (j/2p¼ 37GHz; Q¼ 8:63� 103),
0.11 nm (j/2p¼ 37GHz; Q¼ 8:63� 103), and 0.12 nm
(j/2p¼ 40GHz; Q¼ 7:92� 103).
In conclusion, we have presented a technique to control
the coupling interaction between individual cavities in a
photonic crystal molecule by tuning with a photochromic thin-
film. This approach could be applied to photonic crystal mole-
cules with larger numbers of cavities, as well as cavity-
waveguide systems.40 The method is highly versatile and could
also be applied to other cavity architectures such as micro-disk
resonators41 and micro-ring resonators.42 Ultimately, these
results could pave the way for development of complex and
highly reconfigurable integrated photonic devices composed
of a large array of nanophotonic cavities.
The authors would like to acknowledge the support
from a DARPA Defense Science Office Grant (No.
W31P4Q0910013), the ARO MURI on Hybrid Quantum
Interactions Grant (No. W911NF09104), the Physics
Frontier Center at the Joint Quantum Institute, and the ONR
Applied Electromagnetic Center N00014-09-1-1190. E.
Waks would like to acknowledge support from an NSF
CAREER Award Grant (No. ECCS-0846494).
1D. Dai, Opt. Express 17, 23817 (2009).2M. T. Hill, H. J. S. Dorren, T. de Vries, X. J. M. Leijtens, J. H. den Besten,
B. Smalbrugge, Y.-S. Oei, H. Binsma, G.-D. Khoe, and M. K. Smit,
Nature (London) 432, 206 (2004).3F. Morichetti, C. Ferrari, A. Canciamilla, and A. Melloni, Laser Photonics
Rev. 6, 74 (2012).4H. Altug, D. Englund, and J. Vuckovic, Nature Phys. 2, 484 (2006).5T. Yoshie, A. Scherer, J. Hendrickson, G. Khitrova, H. M. Gibbs, G.
Rupper, C. Ell, O. B. Shchekin, and D. G. Deppe, Nature (London) 432,200 (2004).
6K. Hennessy, A. Badolato, M. Winger, D. Gerace, M. Atature, S. Gulde,
S. Falt, E. L. Hu, and A. Imamoglu, Nature (London) 445, 896 (2007).7E. Waks and J. Vuckovic, Phys. Rev. A 73, 041803 (2006).8A. Auffeves-Garnier, C. Simon, J.-M. Gerard, and J.-P. Poizat, Phys. Rev. A
75, 053823 (2007).9I. Fushman, D. Englund, A. Faraon, N. Stoltz, P. Petroff, and J. Vuckovic,
Science 320, 769 (2008).10R. Bose, D. Sridharan, G. S. Solomon, and E. Waks, Appl. Phys. Lett. 98,121109 (2011).
11R. Bose, D. Sridharan, H. Kim, G. Solomon, and E. Waks, Phys. Rev.
Lett. 108, 227402 (2012).12C.-H. Su, A. D. Greentree, W. J. Munro, K. Nemoto, and L. C. L.
Hollenberg, Phys. Rev. A 78, 062336 (2008).13T. C. H. Liew and V. Savona, Phys. Rev. Lett. 104, 183601 (2010).14M. Bamba, A. Imamoglu, I. Carusotto, and C. Ciuti, Phys. Rev. A 83,021802 (2011).
15D. Gerace, H. E. Tureci, A. Imamoglu, V. Giovannetti, and R. Fazio,
Nature Phys. 5, 281 (2009).
FIG. 4. (a) SEM image of fabricated three-cavity photonic crystal molecule.
Scale bar: 2 lm. (b) Measured PL spectra of coupled modes CM6 shown
with green diamonds and decoupled CM3 shown with red circles. Solid lines
show fit to Lorentzian functions. (c) PL emission intensity as a function of
detuning D0. The rectangular area denoted by the red dashed line indicates
the resonant interaction regime where a three-peaked triplet was observed.
(d) Measured PL spectrum taken at D0 ¼ 0. Lorentzian fit shown as blue
solid line.
141118-4 Cai et al. Appl. Phys. Lett. 102, 141118 (2013)
This article is copyrighted as indicated in the abstract. Reuse of AIP content is subject to the terms at: http://scitation.aip.org/termsconditions. Downloaded to IP:
128.143.23.241 On: Tue, 29 Oct 2013 17:41:59
16M. J. Hartmann, F. G. S. L. Brandao, and M. B. Plenio, Nature Phys. 2,849 (2006).
17A. D. Greentree, C. Tahan, J. H. Cole, and L. C. L. Hollenberg, Nature
Phys. 2, 856 (2006).18K. A. Atlasov, A. Rudra, B. Dwir, and E. Kapon, Opt. Express 19, 2619(2011).
19R. Bose, T. Cai, G. S. Solomon, and E. Waks, Appl. Phys. Lett. 100,231107 (2012).
20A. Majumdar, A. Rundquist, M. Bajcsy, and J. Vuckovic, Phys. Rev. B 86,045315 (2012).
21A. Majumdar, A. Rundquist, M. Bajcsy, V. D. Dasika, S. R. Bank, and J.
Vuckovic, Phys. Rev. B 86, 195312 (2012).22S. Vignolini, F. Riboli, D. S. Wiersma, L. Balet, L. H. Li, M. Francardi, A.
Gerardino, A. Fiore, M. Gurioli, and F. Intonti, Appl. Phys. Lett. 96,141114 (2010).
23S. Vignolini, F. Riboli, F. Intonti, D. S. Wiersma, L. Balet, L. H. Li, M.
Francardi, A. Gerardino, A. Fiore, and M. Gurioli, Appl. Phys. Lett. 97,063101 (2010).
24M. Notomi, E. Kuramochi, and T. Tanabe, Nature Photon. 2, 741 (2008).25Z. Qiang, W. Zhou, and R. A. Soref, Opt. Express 15, 1823 (2007).26D. Sridharan, E. Waks, G. Solomon, and J. T. Fourkas, Appl. Phys. Lett.
96, 153303 (2010).27D. Sridharan, R. Bose, H. Kim, G. S. Solomon, and E. Waks, Opt. Express
19, 5551 (2011).28I. Fushman, E. Waks, D. Englund, N. Stoltz, P. Petroff, and J. Vuckovic,
Appl. Phys. Lett. 90, 091118 (2007).29M. A. Dundar, J. A. M. Voorbraak, R. Notzel, A. Fiore, and R. W. van der
Heijden, Appl. Phys. Lett. 100, 081107 (2012).
30C. Y. Jin, M. Y. Swinkels, R. Johne, T. B. Hoang, L. Midolo, P. J.
van Veldhoven, and A. Fiore, e-print arXiv:1207.5311.31A. Kiraz, P. Michler, C. Becher, B. Gayral, A. Imamoglu, L. Zhang, E.
Hu, W. V. Schoenfeld, and P. M. Petroff, Appl. Phys. Lett. 78, 3932(2001).
32W. C. L. Hopman, A. J. F. Hollink, R. M. de Ridder, K. O. van der Werf,
V. Subramaniam, and W. Bogaerts, Opt. Express 14, 8745 (2006).33P. El-Kallassi, R. Ferrini, L. Zuppiroli, N. L. Thomas, R. Houdre, A.
Berrier, S. Anand, and A. Talneau, J. Opt. Soc. Am. B 24, 2165 (2007).34Y. Akahane, T. Asano, B.-S. Song, and S. Noda, Nature (London) 425,944 (2003).
35J. Pan, Y. Huo, S. Sandhu, N. Stuhrmann, M. L. Povinelli, J. S. Harris, M.
M. Fejer, and S. Fan, Appl. Phys. Lett. 97, 101102 (2010).36K. A. Atlasov, K. F. Karlsson, A. Rudra, B. Dwir, and E. Kapon, Opt.
Express 16, 16255 (2008).37K. Vahala, Optical Microcavities (World Scientific Publishing, Singapore,
2004).38M. A. Popovic, C. Manolatou, and M. R. Watts, Opt. Express 14, 1208(2006).
39D. O’Brien, M. D. Settle, T. Karle, A. Michaeli, M. Salib, and T. F.
Krauss, Opt. Express 15, 1228 (2007).40R. Bose, D. Sridharan, G. Solomon, and E. Waks, Opt. Express 19, 5398(2011).
41J. Hu, N. Carlie, N.-N. Feng, L. Petit, A. Agarwal, K. Richardson, and L.
Kimerling, Opt. Lett. 33, 2500 (2008).42B. E. Little, J. S. Foresi, G. Steinmeyer, E. R. Thoen, S. T. Chu, H. A.
Haus, E. P. Ippen, L. C. Kimerling, and W. Greene, IEEE Photon.
Technol. Lett. 10, 549 (1998).
141118-5 Cai et al. Appl. Phys. Lett. 102, 141118 (2013)
This article is copyrighted as indicated in the abstract. Reuse of AIP content is subject to the terms at: http://scitation.aip.org/termsconditions. Downloaded to IP:
128.143.23.241 On: Tue, 29 Oct 2013 17:41:59