Embed Size (px)
Citation preview
GATEWAY SCIENCE SUITECONTROLLED ASSESSMENT
LESSON PLANSVERSION 1 SEPTEMBER 2011
ContentsResearch..................................................................................................................................................5
Hypothesis...............................................................................................................................................9
Planning.................................................................................................................................................14
Managing risk.........................................................................................................................................17
Collecting data.......................................................................................................................................20
Processing data 1..................................................................................................................................23
Processing data 2..................................................................................................................................30
Analysing data.......................................................................................................................................39
Evaluating..............................................................................................................................................45
Conclusions...........................................................................................................................................50
© OCR Controlled Assessment Lesson PlansPage 2 of 51 GCSE Gateway Science, J261-J265 V1
IntroductionOCR wishes to support teachers in the delivery of the skills required for Controlled Assessment.
This set of ten sample Lesson Plans is provided in Word format – so that you can use it as a foundation to build upon and amend to suit your teaching style and pupils’ needs.
The sample Lesson Plans provide an example of how to teach each Quality and the teaching time is a suggestion only. Some or all of these lessons may be applicable to your teaching. They are designed to be used either as stand alone one off lessons delivered during the course or as a block of lessons concentrating on skills. Best practice is for skills to be developed within a teaching context and it is hoped that teachers will amend the experiments and activities accordingly.
The Specification is the document on which assessment is based and specifies what content and skills need to be covered. The Guidance to Controlled Assessment booklet should be read in conjunction with the Specification. In Appendix C of this booklet, there is further guidance on the science skills required and suggestions of the Specification items where particular skills could be developed.
An introduction is provided for each Lesson Plan illustrating the link to the Controlled Assessment.
© OCR Controlled Assessment Lesson PlansPage 3 of 51 GCSE Gateway Science, J261-J265 V1
Sample Lesson PlanGCSE Gateway Science J261-J265
Item: Research
OCR recognises that the teaching of this qualification above will vary greatly from school to school and from teacher to teacher. With that in mind this lesson plan is offered as a possible approach but will be subject to modifications by the individual teacher.
Lesson length is assumed to be one hour.
Introduction
Candidates are required to carry out research for Part 1 of the Controlled Assessment. They are required to access a range of resources and select those appropriate for the task. The information/data obtained should be fully referenced.
Learning Objectives for the Lesson
Objective 1 To recognise the most appropriate way to collect information for a particular purpose
Objective 2 To be able to use search engines effectively to collect secondary data
Objective 3 To be able to select appropriate information from web pages or literature
Objective 4 To be able to write a full bibliography of sources used
© OCR Controlled Assessment Lesson PlansPage 4 of 51 GCSE Gateway Science, J261-J265 V1
Time in mins
Learning activitiesResources Assessment
Teacher Pupil
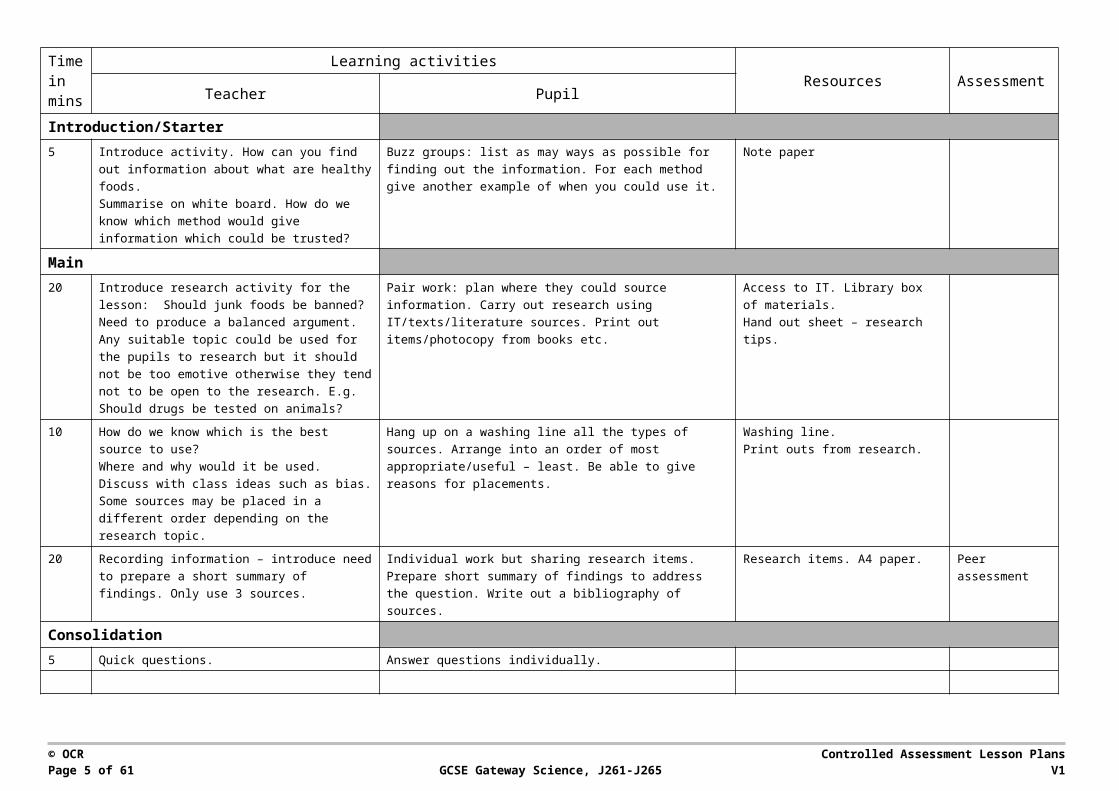
Introduction/Starter5 Introduce activity. How can you find out information
about what are healthy foods.Summarise on white board. How do we know which method would give information which could be trusted?
Buzz groups: list as may ways as possible for finding out the information. For each method give another example of when you could use it.
Note paper
Main20 Introduce research activity for the lesson: Should
junk foods be banned? Need to produce a balanced argument.Any suitable topic could be used for the pupils to research but it should not be too emotive otherwise they tend not to be open to the research. E.g. Should drugs be tested on animals?
Pair work: plan where they could source information. Carry out research using IT/texts/literature sources. Print out items/photocopy from books etc.
Access to IT. Library box of materials.Hand out sheet – research tips.
10 How do we know which is the best source to use?Where and why would it be used. Discuss with class ideas such as bias. Some sources may be placed in a different order depending on the research topic.
Hang up on a washing line all the types of sources. Arrange into an order of most appropriate/useful – least. Be able to give reasons for placements.
Washing line.Print outs from research.
20 Recording information – introduce need to prepare a short summary of findings. Only use 3 sources.
Individual work but sharing research items. Prepare short summary of findings to address the question. Write out a bibliography of sources.
Research items. A4 paper. Peer assessment
Consolidation5 Quick questions. Answer questions individually.
Homework:Collect one short article from a newspaper/magazine. Highlight the key points. Write a reference for the article.
© OCR Controlled Assessment Lesson PlansPage 5 of 51 GCSE Gateway Science, J261-J265 V1
URLs for clips:
http://webarchive.nationalarchives.gov.uk/20110809091832/http://www.teachingandlearningresources.org.uk/secondary/science Pupil P
Key words:Bias
© OCR Controlled Assessment Lesson PlansPage 6 of 51 GCSE Gateway Science, J261-J265 V1
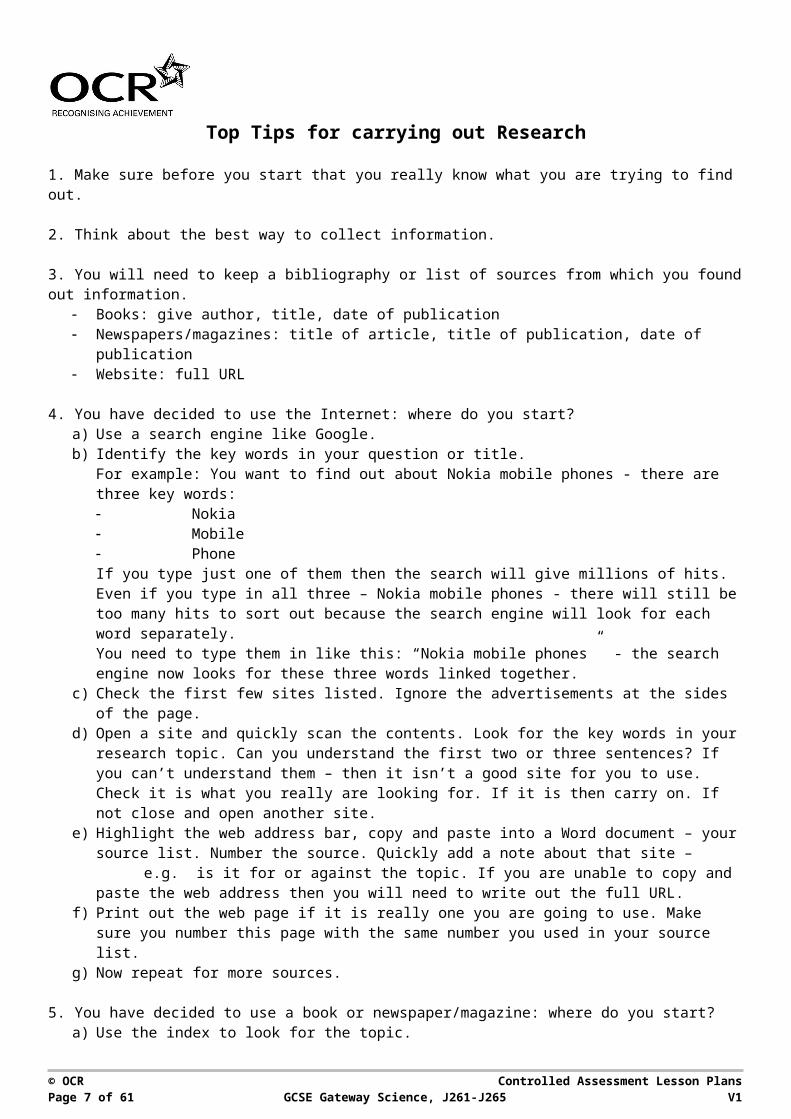
Top Tips for carrying out Research
1. Make sure before you start that you really know what you are trying to find out.
2. Think about the best way to collect information.
3. You will need to keep a bibliography or list of sources from which you found out information. Books: give author, title, date of publication Newspapers/magazines: title of article, title of publication, date of publication Website: full URL
4. You have decided to use the Internet: where do you start?a) Use a search engine like Google.b) Identify the key words in your question or title.
For example: You want to find out about Nokia mobile phones - there are three key words: Nokia Mobile PhoneIf you type just one of them then the search will give millions of hits. Even if you type in all three – Nokia mobile phones - there will still be too many hits to sort out because the search engine will look for each word separately. You need to type them in like this: “Nokia mobile phones” - the search engine now looks for these three words linked together.
c) Check the first few sites listed. Ignore the advertisements at the sides of the page.d) Open a site and quickly scan the contents. Look for the key words in your research topic. Can you
understand the first two or three sentences? If you can’t understand them – then it isn’t a good site for you to use. Check it is what you really are looking for. If it is then carry on. If not close and open another site.
e) Highlight the web address bar, copy and paste into a Word document – your source list. Number the source. Quickly add a note about that site – e.g. is it for or against the topic. If you are unable to copy and paste the web address then you will need to write out the full URL.
f) Print out the web page if it is really one you are going to use. Make sure you number this page with the same number you used in your source list.
g) Now repeat for more sources.
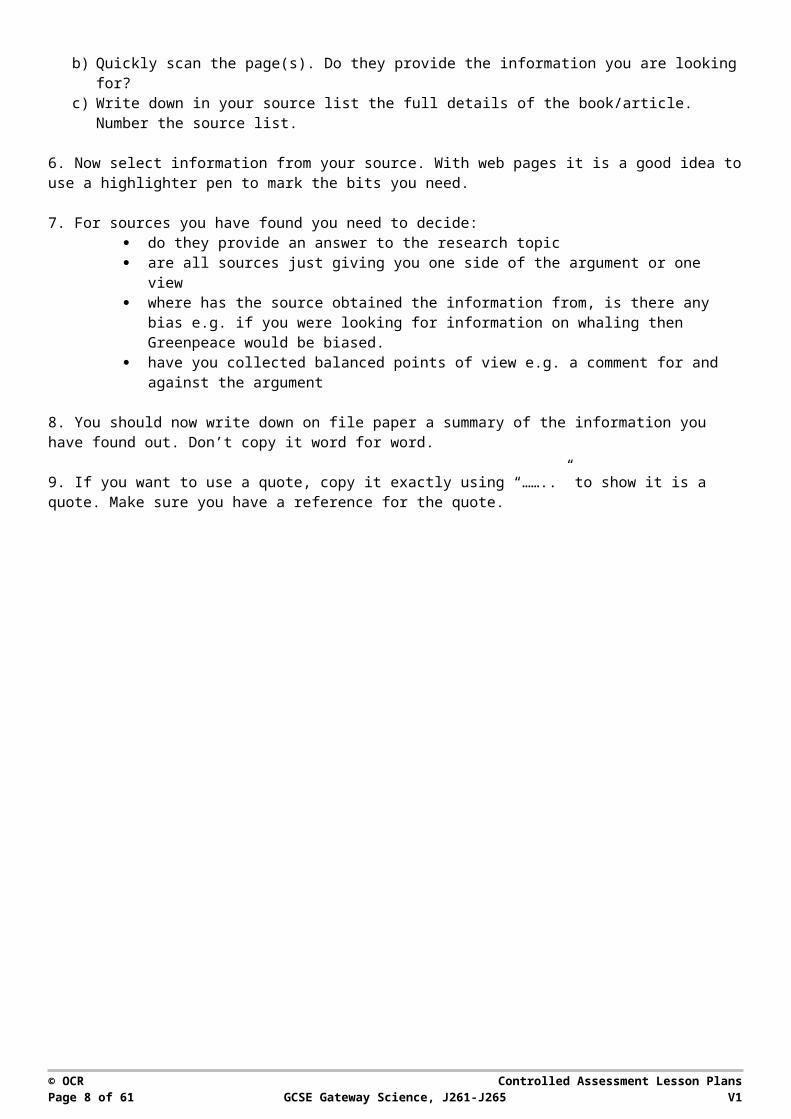
5. You have decided to use a book or newspaper/magazine: where do you start?a) Use the index to look for the topic.b) Quickly scan the page(s). Do they provide the information you are looking for?c) Write down in your source list the full details of the book/article. Number the source list.
6. Now select information from your source. With web pages it is a good idea to use a highlighter pen to mark the bits you need.
7. For sources you have found you need to decide: do they provide an answer to the research topic are all sources just giving you one side of the argument or one view where has the source obtained the information from, is there any bias e.g. if you were
looking for information on whaling then Greenpeace would be biased. have you collected balanced points of view e.g. a comment for and against the argument
8. You should now write down on file paper a summary of the information you have found out. Don’t copy it word for word.
9. If you want to use a quote, copy it exactly using “……..” to show it is a quote. Make sure you have a reference for the quote.
© OCR Controlled Assessment Lesson PlansPage 7 of 51 GCSE Gateway Science, J261-J265 V1
Sample Lesson PlanGCSE Gateway Science J261-J265
Item: Hypothesis
OCR recognises that the teaching of this qualification above will vary greatly from school to school and from teacher to teacher. With that in mind this lesson plan is offered as a possible approach but will be subject to modifications by the individual teacher.
Lesson length is assumed to be one hour.
Introduction
Producing a hypothesis is only required in Part 2 of Controlled Assessment tasks for Additional Science and the separate sciences. Candidates need to understand what a hypothesis is, how it is based on observations and that it should be able to be tested.
In Part 3 of the Controlled Assessment task they will be expected to review the hypothesis they have written in Part 2 in light of their experimental data.
Learning Objectives for the Lesson
Objective 1 To understand that a hypothesis gives an explanation for an observation
Objective 2 To be able to write a hypothesis
Objective 3 To be able to review a hypothesis in relation to experimental outcomes
© OCR Controlled Assessment Lesson PlansPage 8 of 51 GCSE Gateway Science, J261-J265 V1
Time in mins
Learning activitiesResources Assessment
Teacher Pupil
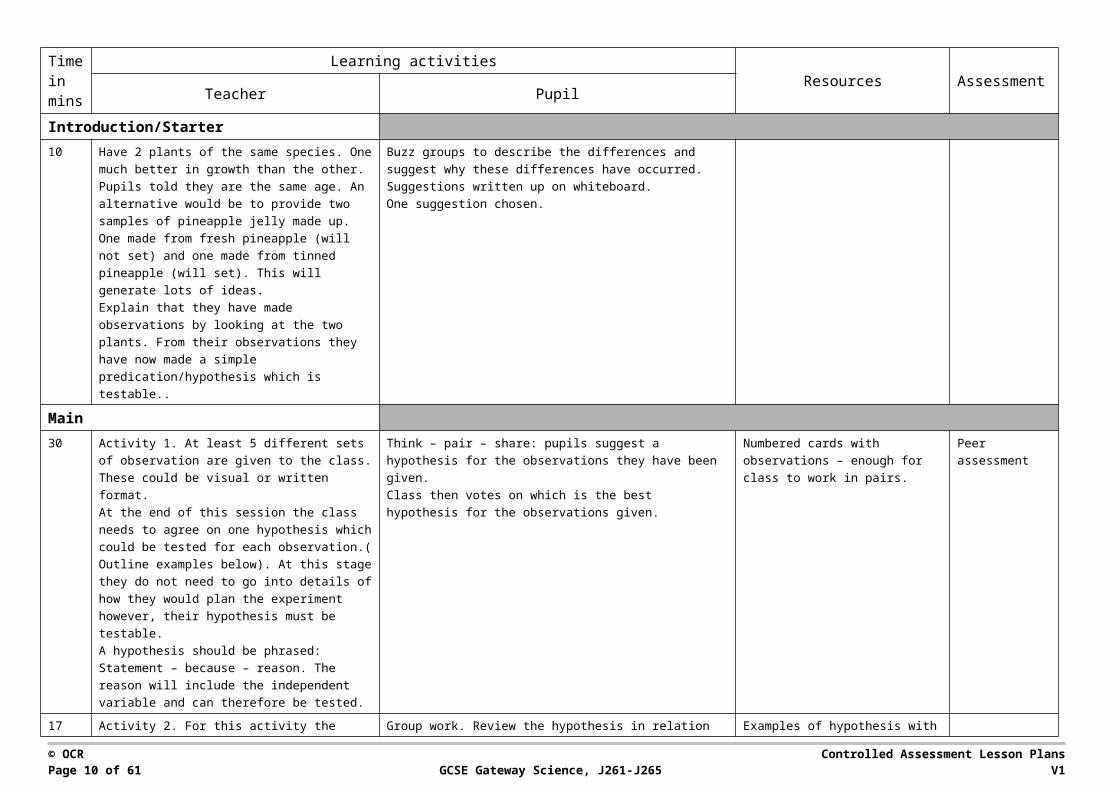
Introduction/Starter10 Have 2 plants of the same species. One much
better in growth than the other. Pupils told they are the same age. An alternative would be to provide two samples of pineapple jelly made up. One made from fresh pineapple (will not set) and one made from tinned pineapple (will set). This will generate lots of ideas.Explain that they have made observations by looking at the two plants. From their observations they have now made a simple predication/hypothesis which is testable..
Buzz groups to describe the differences and suggest why these differences have occurred.Suggestions written up on whiteboard.One suggestion chosen.
Main30 Activity 1. At least 5 different sets of observation
are given to the class. These could be visual or written format.At the end of this session the class needs to agree on one hypothesis which could be tested for each observation.( Outline examples below). At this stage they do not need to go into details of how they would plan the experiment however, their hypothesis must be testable.A hypothesis should be phrased:Statement – because – reason. The reason will include the independent variable and can therefore be tested.
Think – pair – share: pupils suggest a hypothesis for the observations they have been given.Class then votes on which is the best hypothesis for the observations given.
Numbered cards with observations – enough for class to work in pairs.
Peer assessment
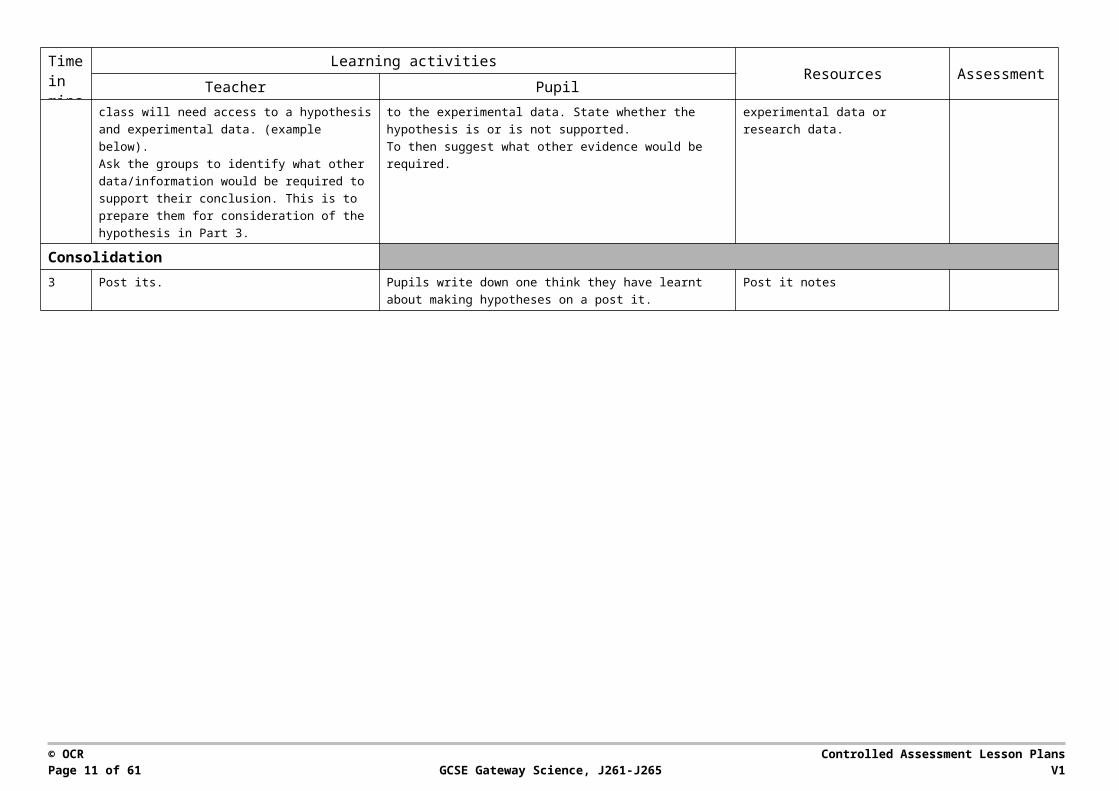
17 Activity 2. For this activity the class will need access to a hypothesis and experimental data. (example below).Ask the groups to identify what other data/information would be required to support their conclusion. This is to prepare them for consideration of the hypothesis in Part 3.
Group work. Review the hypothesis in relation to the experimental data. State whether the hypothesis is or is not supported.To then suggest what other evidence would be required.
Examples of hypothesis with experimental data or research data.
Consolidation
© OCR Controlled Assessment Lesson PlansPage 9 of 51 GCSE Gateway Science, J261-J265 V1
Time in mins
Learning activitiesResources Assessment
Teacher Pupil
3 Post its. Pupils write down one think they have learnt about making hypotheses on a post it.
Post it notes
© OCR Controlled Assessment Lesson PlansPage 10 of 51 GCSE Gateway Science, J261-J265 V1
Key words:Prediction, hypothesis.
© OCR Controlled Assessment Lesson PlansPage 11 of 51 GCSE Gateway Science, J261-J265 V1

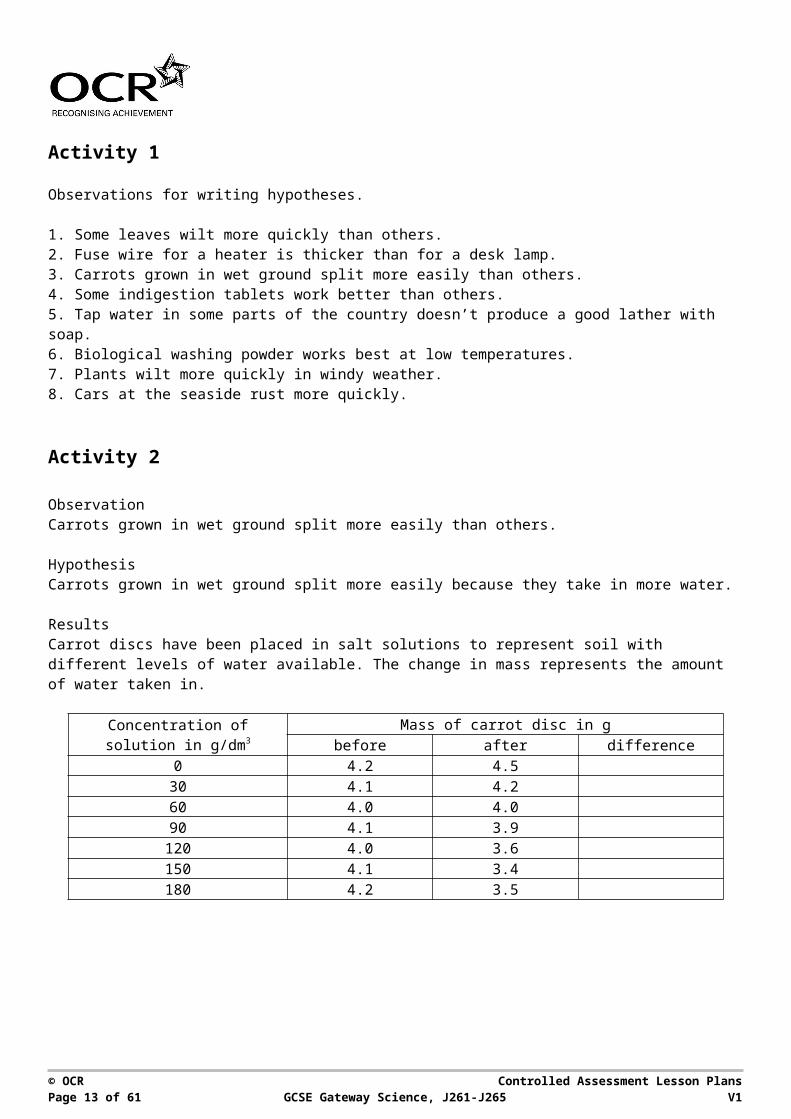
Activity 1
Observations for writing hypotheses.
1. Some leaves wilt more quickly than others.2. Fuse wire for a heater is thicker than for a desk lamp.3. Carrots grown in wet ground split more easily than others.4. Some indigestion tablets work better than others.5. Tap water in some parts of the country doesn’t produce a good lather with soap.6. Biological washing powder works best at low temperatures.7. Plants wilt more quickly in windy weather.8. Cars at the seaside rust more quickly.
Activity 2
ObservationCarrots grown in wet ground split more easily than others.
HypothesisCarrots grown in wet ground split more easily because they take in more water.
ResultsCarrot discs have been placed in salt solutions to represent soil with different levels of water available. The change in mass represents the amount of water taken in.
Concentration of solution in g/dm3
Mass of carrot disc in gbefore after difference
0 4.2 4.530 4.1 4.260 4.0 4.090 4.1 3.9
120 4.0 3.6150 4.1 3.4180 4.2 3.5
© OCR Controlled Assessment Lesson PlansPage 12 of 51 GCSE Gateway Science, J261-J265 V1
Sample Lesson PlanGCSE Gateway Science J261-J265
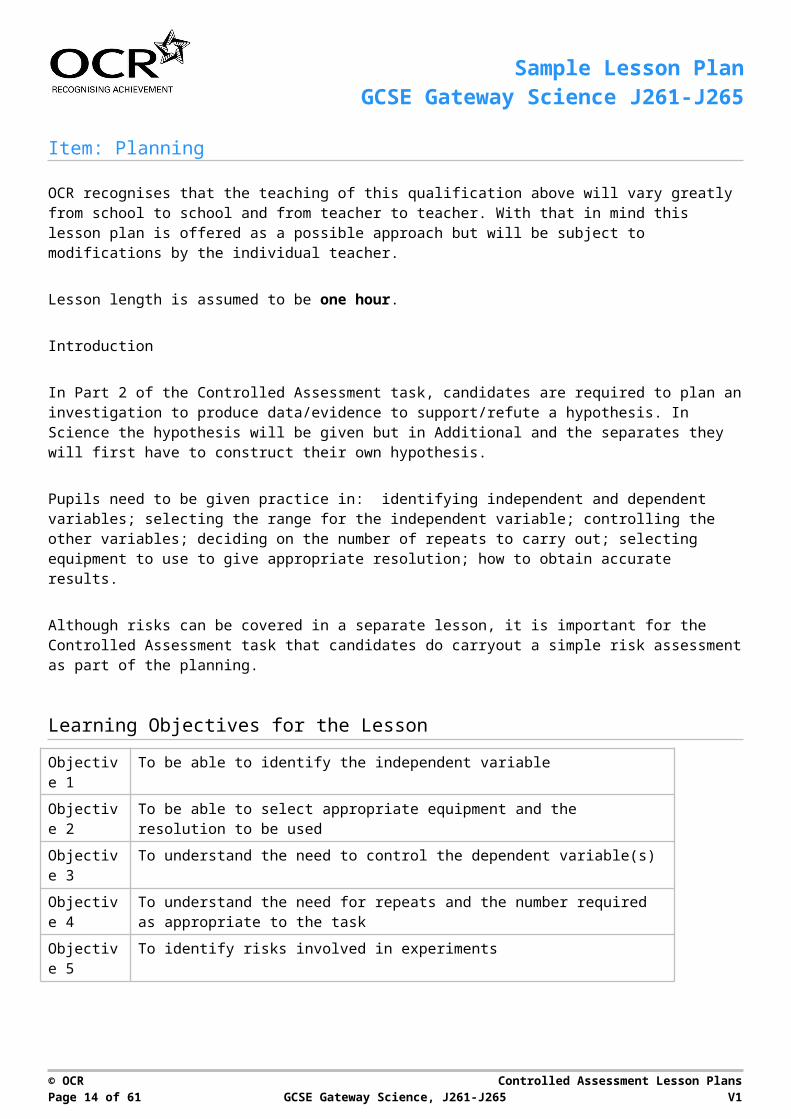
Item: Planning
OCR recognises that the teaching of this qualification above will vary greatly from school to school and from teacher to teacher. With that in mind this lesson plan is offered as a possible approach but will be subject to modifications by the individual teacher.
Lesson length is assumed to be one hour.
Introduction
In Part 2 of the Controlled Assessment task, candidates are required to plan an investigation to produce data/evidence to support/refute a hypothesis. In Science the hypothesis will be given but in Additional and the separates they will first have to construct their own hypothesis.
Pupils need to be given practice in: identifying independent and dependent variables; selecting the range for the independent variable; controlling the other variables; deciding on the number of repeats to carry out; selecting equipment to use to give appropriate resolution; how to obtain accurate results.
Although risks can be covered in a separate lesson, it is important for the Controlled Assessment task that candidates do carryout a simple risk assessment as part of the planning.
Learning Objectives for the Lesson
Objective 1 To be able to identify the independent variable
Objective 2 To be able to select appropriate equipment and the resolution to be used
Objective 3 To understand the need to control the dependent variable(s)
Objective 4 To understand the need for repeats and the number required as appropriate to the task
Objective 5 To identify risks involved in experiments
Recap of Previous Experience and Prior Knowledge
KS3 Fair testing
© OCR Controlled Assessment Lesson PlansPage 13 of 51 GCSE Gateway Science, J261-J265 V1
Time in mins
Learning activitiesResources Assessment
Teacher Pupil
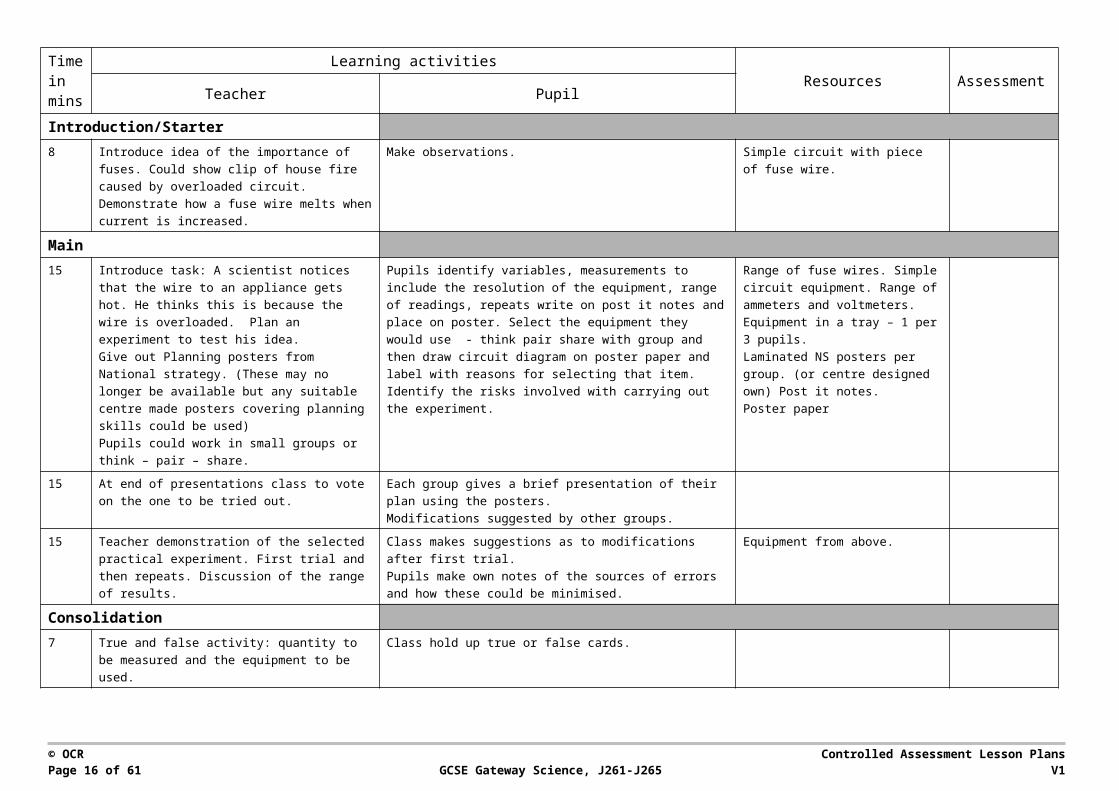
Introduction/Starter8 Introduce idea of the importance of fuses. Could
show clip of house fire caused by overloaded circuit. Demonstrate how a fuse wire melts when current is increased.
Make observations. Simple circuit with piece of fuse wire.
Main15 Introduce task: A scientist notices that the wire to
an appliance gets hot. He thinks this is because the wire is overloaded. Plan an experiment to test his idea.Give out Planning posters from National strategy. (These may no longer be available but any suitable centre made posters covering planning skills could be used)Pupils could work in small groups or think – pair – share.
Pupils identify variables, measurements to include the resolution of the equipment, range of readings, repeats write on post it notes and place on poster. Select the equipment they would use - think pair share with group and then draw circuit diagram on poster paper and label with reasons for selecting that item.Identify the risks involved with carrying out the experiment.
Range of fuse wires. Simple circuit equipment. Range of ammeters and voltmeters. Equipment in a tray – 1 per 3 pupils.Laminated NS posters per group. (or centre designed own) Post it notes.Poster paper
15 At end of presentations class to vote on the one to be tried out.
Each group gives a brief presentation of their plan using the posters.Modifications suggested by other groups.
15 Teacher demonstration of the selected practical experiment. First trial and then repeats. Discussion of the range of results.
Class makes suggestions as to modifications after first trial.Pupils make own notes of the sources of errors and how these could be minimised.
Equipment from above.
Consolidation7 True and false activity: quantity to be measured
and the equipment to be used.Class hold up true or false cards.
© OCR Controlled Assessment Lesson PlansPage 14 of 51 GCSE Gateway Science, J261-J265 V1

Homework:Sheet with list of measurements for pupils to give the correct units. Peer assess next lesson.
URLs/References:http://webarchive.nationalarchives.gov.uk/20110809091832/http://www.teachingandlearningresources.org.uk/secondary/science Pupil P and Pupil J.Badger and CASE are good sources.Focus in Educational Software - www.focuseducational.com/
Key words:Variable, dependent, independent, repeats.
© OCR Controlled Assessment Lesson PlansPage 15 of 51 GCSE Gateway Science, J261-J265 V1
Sample Lesson PlanGCSE Gateway Science J261-J265
Item: Managing risk
OCR recognises that the teaching of this qualification above will vary greatly from school to school and from teacher to teacher. With that in mind this lesson plan is offered as a possible approach but will be subject to modifications by the individual teacher.
Lesson length is assumed to be one hour.
Introduction
In the Controlled Assessment task, managing risk will be evidenced in three areas: from the candidates’ plan in Part 2; the candidates’ comments on how they have managed the risk in Question 4 Part 3; and from teacher observations.
Pupils should be given opportunities to carry out a risk assessment when doing practical work. They should identify the hazards and assess the level of risk. Pupils should also be able to suggest how risks can be reduced.
The use of Hazcards particularly at higher level would be useful.
Learning Objectives for the Lesson
Objective 1 To be able to identify a hazard
Objective 2 To be able to asses the possible risks
Objective 3 To be able to minimise the possible risks
Objective 4 To be able to carry out a risk assessment (HT)
Recap of Previous Experience and Prior Knowledge
KS3 Risk assessing
© OCR Controlled Assessment Lesson PlansPage 16 of 51 GCSE Gateway Science, J261-J265 V1
Time in mins
Learning activitiesResources Assessment
Teacher Pupil
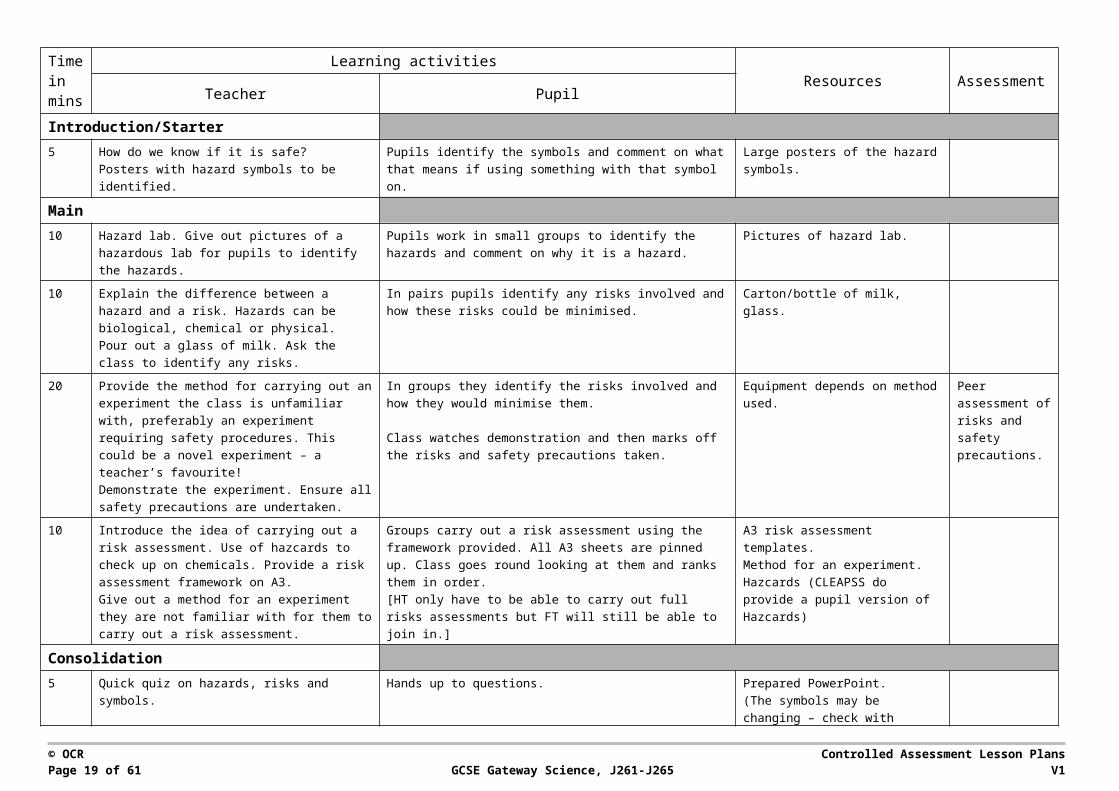
Introduction/Starter5 How do we know if it is safe?
Posters with hazard symbols to be identified. Pupils identify the symbols and comment on what that means if using something with that symbol on.
Large posters of the hazard symbols.
Main10 Hazard lab. Give out pictures of a hazardous lab
for pupils to identify the hazards. Pupils work in small groups to identify the hazards and comment on why it is a hazard.
Pictures of hazard lab.
10 Explain the difference between a hazard and a risk. Hazards can be biological, chemical or physical.Pour out a glass of milk. Ask the class to identify any risks.
In pairs pupils identify any risks involved and how these risks could be minimised.
Carton/bottle of milk, glass.
20 Provide the method for carrying out an experiment the class is unfamiliar with, preferably an experiment requiring safety procedures. This could be a novel experiment – a teacher’s favourite!Demonstrate the experiment. Ensure all safety precautions are undertaken.
In groups they identify the risks involved and how they would minimise them.
Class watches demonstration and then marks off the risks and safety precautions taken.
Equipment depends on method used. Peer assessment of risks and safety precautions.
10 Introduce the idea of carrying out a risk assessment. Use of hazcards to check up on chemicals. Provide a risk assessment framework on A3.Give out a method for an experiment they are not familiar with for them to carry out a risk assessment.
Groups carry out a risk assessment using the framework provided. All A3 sheets are pinned up. Class goes round looking at them and ranks them in order.[HT only have to be able to carry out full risks assessments but FT will still be able to join in.]
A3 risk assessment templates.Method for an experiment.Hazcards (CLEAPSS do provide a pupil version of Hazcards)
Consolidation5 Quick quiz on hazards, risks and symbols. Hands up to questions. Prepared PowerPoint.
(The symbols may be changing – check with CLEAPSS GL101)
© OCR Controlled Assessment Lesson PlansPage 17 of 51 GCSE Gateway Science, J261-J265 V1
Homework:Plan a risk assessment for making a cup of tea. Peer assess next lesson.
URLs/References:Badger and CASE are good sources.Focus in Educational Software - www.focuseducational.com/
Key words:Hazard, risk, toxic, corrosive, irritant.
© OCR Controlled Assessment Lesson PlansPage 18 of 51 GCSE Gateway Science, J261-J265 V1
Sample Lesson PlanGCSE Gateway Science J261-J265
Item: Collecting data
OCR recognises that the teaching of this qualification above will vary greatly from school to school and from teacher to teacher. With that in mind this lesson plan is offered as a possible approach but will be subject to modifications by the individual teacher.
Lesson length is assumed to be one hour.
Introduction
During Part 2 of the Controlled Assessment task all candidates are required to collect results from the practical investigation. Results should be recorded in an appropriate table. The design of the table will be carried out in the supervised session as part of planning.
Pupils are expected to produce results tables with correct headings and units. More able pupils should also be given practice in making decisions as to the number of decimal places to be recorded. This will relate to the resolution of the equipment to some extent.
Learning Objectives for the Lesson
Objective 1 To be able to design a results table
Objective 2 To be able to take measurements to the appropriate resolution
Objective 3 To be able to collect results with appropriate precision
Objective 4 To be able to record results appropriately
Recap of Previous Experience and Prior Knowledge
KS3 Fair testing.
© OCR Controlled Assessment Lesson PlansPage 19 of 51 GCSE Gateway Science, J261-J265 V1
Time in mins
Learning activitiesResources Assessment
Teacher Pupil
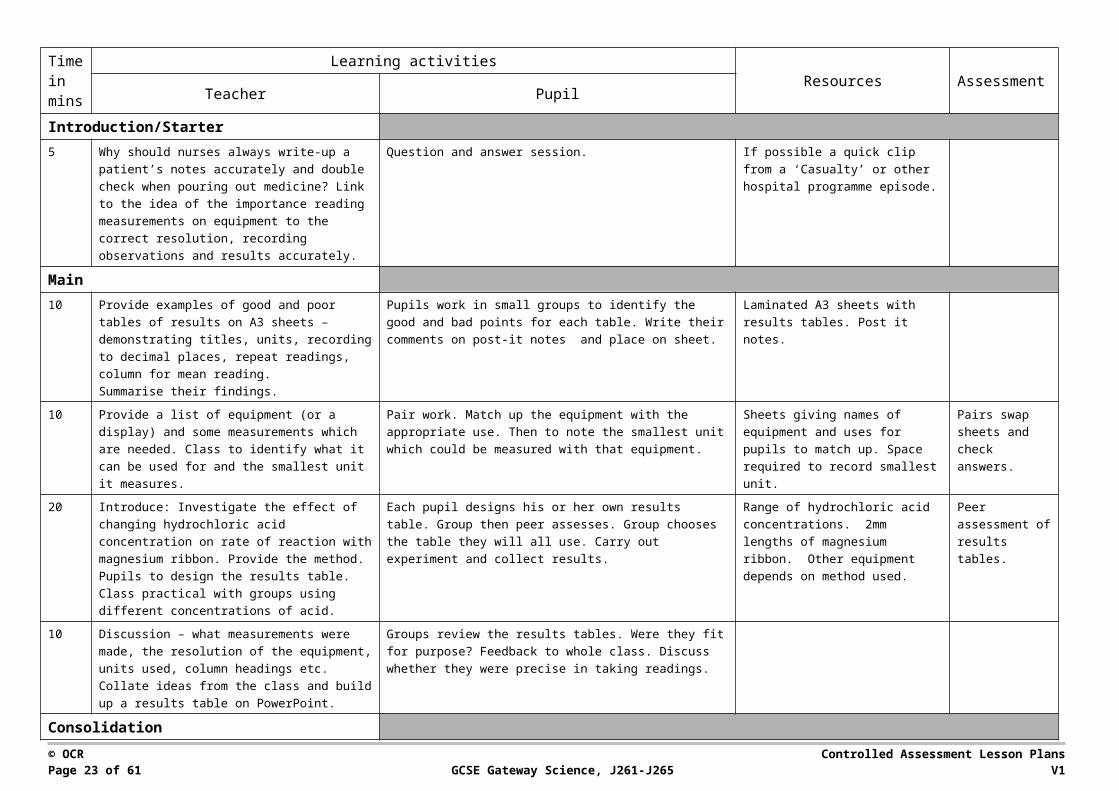
Introduction/Starter5 Why should nurses always write-up a patient’s
notes accurately and double check when pouring out medicine? Link to the idea of the importance reading measurements on equipment to the correct resolution, recording observations and results accurately.
Question and answer session. If possible a quick clip from a ‘Casualty’ or other hospital programme episode.
Main10 Provide examples of good and poor tables of
results on A3 sheets – demonstrating titles, units, recording to decimal places, repeat readings, column for mean reading.Summarise their findings.
Pupils work in small groups to identify the good and bad points for each table. Write their comments on post-it notes and place on sheet.
Laminated A3 sheets with results tables. Post it notes.
10 Provide a list of equipment (or a display) and some measurements which are needed. Class to identify what it can be used for and the smallest unit it measures.
Pair work. Match up the equipment with the appropriate use. Then to note the smallest unit which could be measured with that equipment.
Sheets giving names of equipment and uses for pupils to match up. Space required to record smallest unit.
Pairs swap sheets and check answers.
20 Introduce: Investigate the effect of changing hydrochloric acid concentration on rate of reaction with magnesium ribbon. Provide the method. Pupils to design the results table. Class practical with groups using different concentrations of acid.
Each pupil designs his or her own results table. Group then peer assesses. Group chooses the table they will all use. Carry out experiment and collect results.
Range of hydrochloric acid concentrations. 2mm lengths of magnesium ribbon. Other equipment depends on method used.
Peer assessment of results tables.
10 Discussion – what measurements were made, the resolution of the equipment, units used, column headings etc. Collate ideas from the class and build up a results table on PowerPoint.
Groups review the results tables. Were they fit for purpose? Feedback to whole class. Discuss whether they were precise in taking readings.
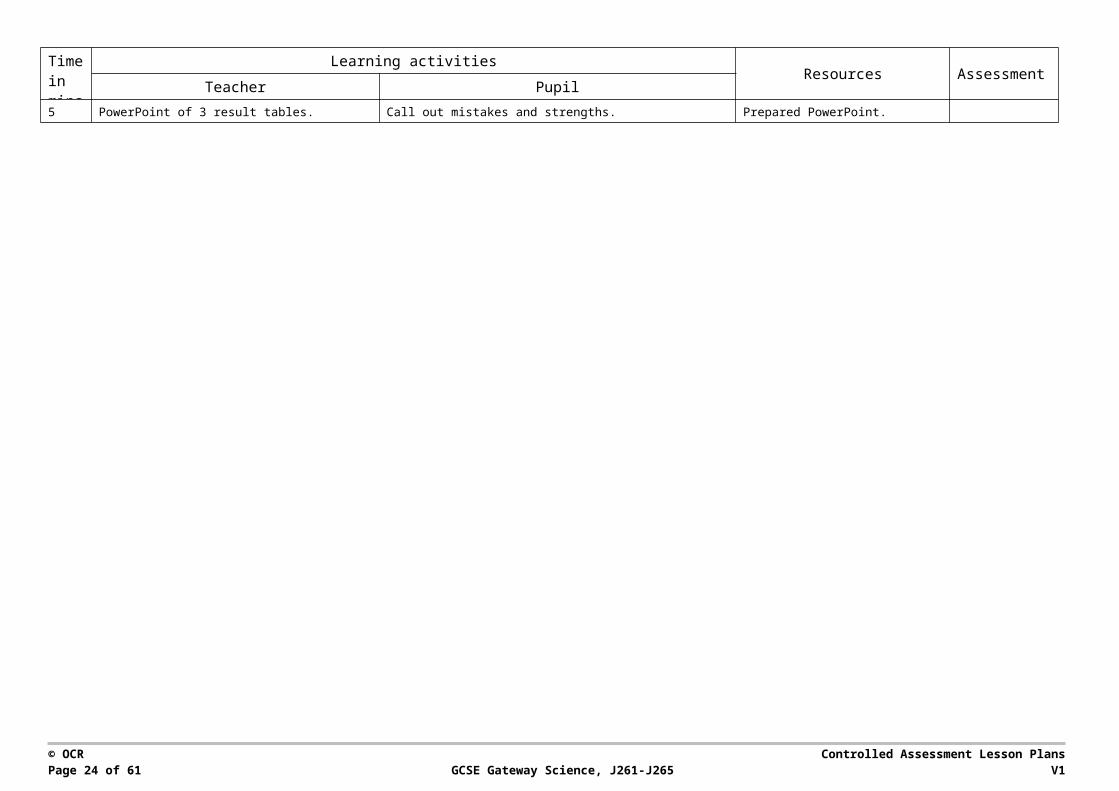
Consolidation5 PowerPoint of 3 result tables. Call out mistakes and strengths. Prepared PowerPoint.
© OCR Controlled Assessment Lesson PlansPage 20 of 51 GCSE Gateway Science, J261-J265 V1
Homework:Sheet with title and table for pupils to plan the experiment. Peer assess next lesson .
URLs/References:Badger and CASE are good sources.Focus in Educational Software - www.focuseducational.com/
Key words:Resolution, precise, accurate
© OCR Controlled Assessment Lesson PlansPage 21 of 51 GCSE Gateway Science, J261-J265 V1
Sample Lesson PlanGCSE Gateway Science J261-J265
Item: Processing data 1
OCR recognises that the teaching of this qualification above will vary greatly from school to school and from teacher to teacher. With that in mind this lesson plan is offered as a possible approach but will be subject to modifications by the individual teacher.
Lesson length is assumed to be one hour.
Introduction
The skill quality Processing data has been allocated two lessons but teachers may wish to condense the two together.
Processing data takes place in Part 3 of the Controlled Assessment task under supervised conditions (high control). It comprises to areas – use of mathematical skills and graphical skills. This lesson addresses only the mathematical skills.
Teachers should remember that candidates may demonstrate mathematical skills during the writing up of their plan for Part 2 if they describe the production of dilutions.
Reference should be made to the Specification, Appendix B Mathematics skills for GCSE science qualifications.
Learning Objectives for the Lesson
Objective 1 To be able to use simple mathematical techniques
Objective 2 To be able to select the appropriate mathematical technique
Objective 3 To be able to use complex mathematical techniques (HT)
Recap of Previous Experience and Prior Knowledge
KS3
© OCR Controlled Assessment Lesson PlansPage 22 of 51 GCSE Gateway Science, J261-J265 V1
Time in mins
Learning activitiesResources Assessment
Teacher Pupil
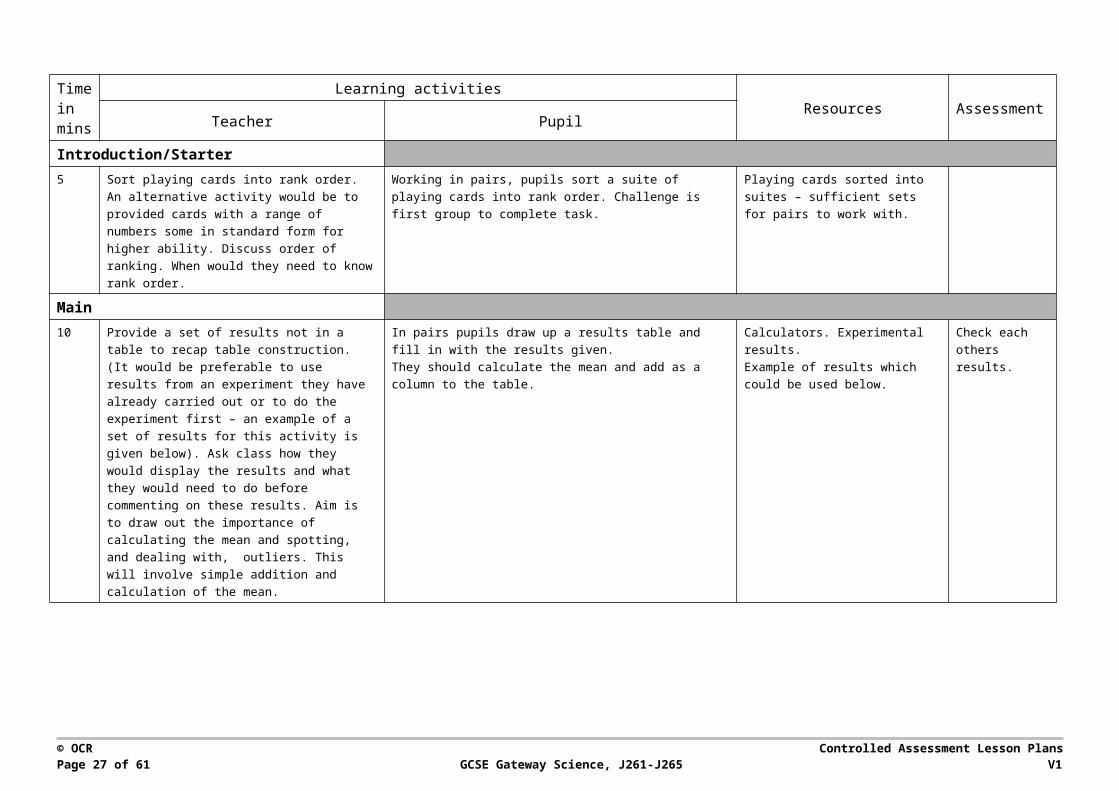
Introduction/Starter5 Sort playing cards into rank order. An alternative
activity would be to provided cards with a range of numbers some in standard form for higher ability. Discuss order of ranking. When would they need to know rank order.
Working in pairs, pupils sort a suite of playing cards into rank order. Challenge is first group to complete task.
Playing cards sorted into suites – sufficient sets for pairs to work with.
Main10 Provide a set of results not in a table to recap table
construction. (It would be preferable to use results from an experiment they have already carried out or to do the experiment first – an example of a set of results for this activity is given below). Ask class how they would display the results and what they would need to do before commenting on these results. Aim is to draw out the importance of calculating the mean and spotting, and dealing with, outliers. This will involve simple addition and calculation of the mean.
In pairs pupils draw up a results table and fill in with the results given. They should calculate the mean and add as a column to the table.
Calculators. Experimental results.Example of results which could be used below.
Check each others results.
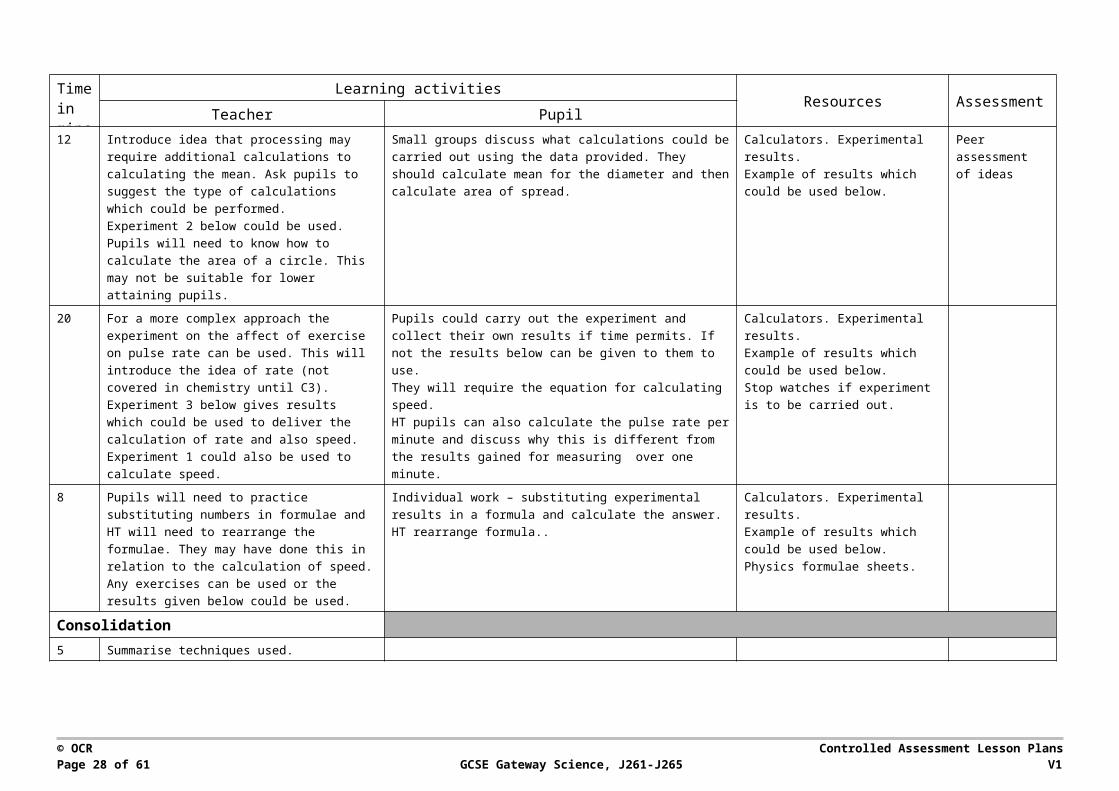
12 Introduce idea that processing may require additional calculations to calculating the mean. Ask pupils to suggest the type of calculations which could be performed.Experiment 2 below could be used. Pupils will need to know how to calculate the area of a circle. This may not be suitable for lower attaining pupils.
Small groups discuss what calculations could be carried out using the data provided. They should calculate mean for the diameter and then calculate area of spread.
Calculators. Experimental results.Example of results which could be used below.
Peer assessment of ideas
20 For a more complex approach the experiment on the affect of exercise on pulse rate can be used. This will introduce the idea of rate (not covered in chemistry until C3). Experiment 3 below gives results which could be used to deliver the calculation of rate and also speed. Experiment 1
Pupils could carry out the experiment and collect their own results if time permits. If not the results below can be given to them to use.They will require the equation for calculating speed.HT pupils can also calculate the pulse rate per minute and discuss why this is different from the results gained for
Calculators. Experimental results.Example of results which could be used below.Stop watches if experiment is to be carried out.
© OCR Controlled Assessment Lesson PlansPage 23 of 51 GCSE Gateway Science, J261-J265 V1
Time in mins
Learning activitiesResources Assessment
Teacher Pupil
could also be used to calculate speed. measuring over one minute.
8 Pupils will need to practice substituting numbers in formulae and HT will need to rearrange the formulae. They may have done this in relation to the calculation of speed. Any exercises can be used or the results given below could be used.
Individual work – substituting experimental results in a formula and calculate the answer.HT rearrange formula..
Calculators. Experimental results.Example of results which could be used below.Physics formulae sheets.
Consolidation5 Summarise techniques used.
URLs/References:Badger and CASE are good sources.Focus in Educational SoftwareKS3 booster materials.
Key words:Mean, rate, surface area, speed
© OCR Controlled Assessment Lesson PlansPage 24 of 51 GCSE Gateway Science, J261-J265 V1
Experimental results 1
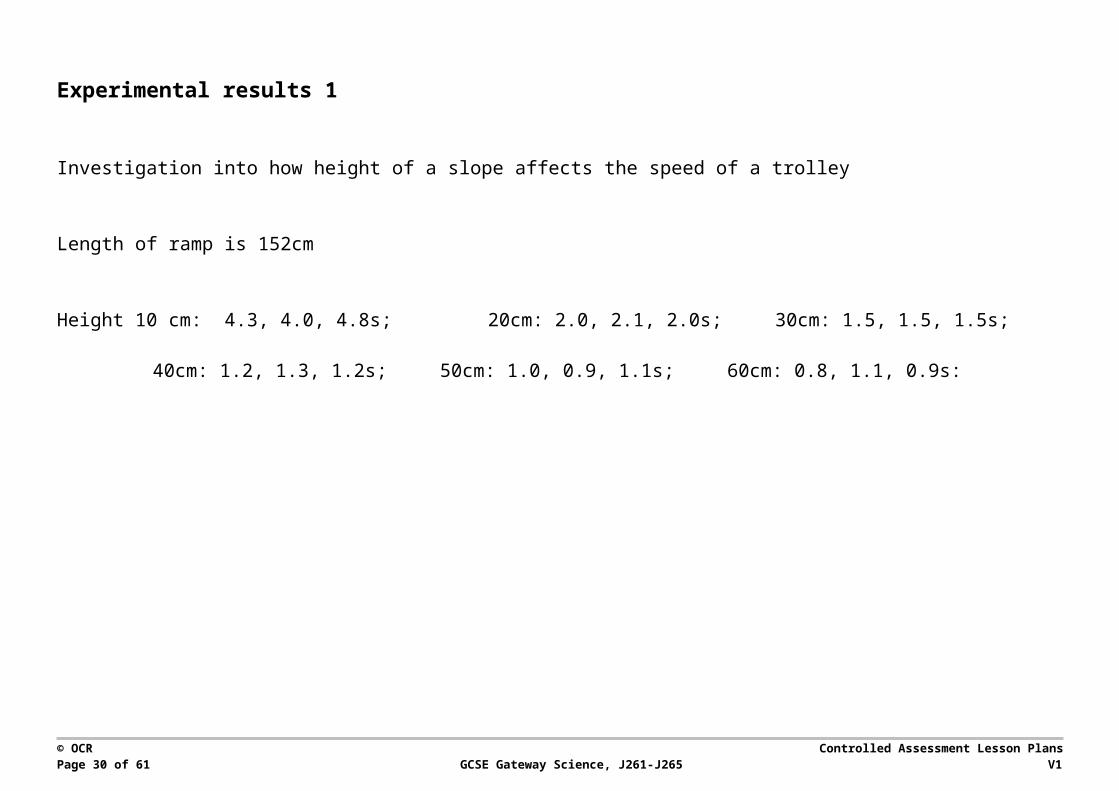
Investigation into how height of a slope affects the speed of a trolley
Length of ramp is 152cm
Height 10 cm: 4.3, 4.0, 4.8s; 20cm: 2.0, 2.1, 2.0s; 30cm: 1.5, 1.5, 1.5s;
40cm: 1.2, 1.3, 1.2s; 50cm: 1.0, 0.9, 1.1s; 60cm: 0.8, 1.1, 0.9s:
© OCR Controlled Assessment Lesson PlansPage 25 of 51 GCSE Gateway Science, J261-J265 V1
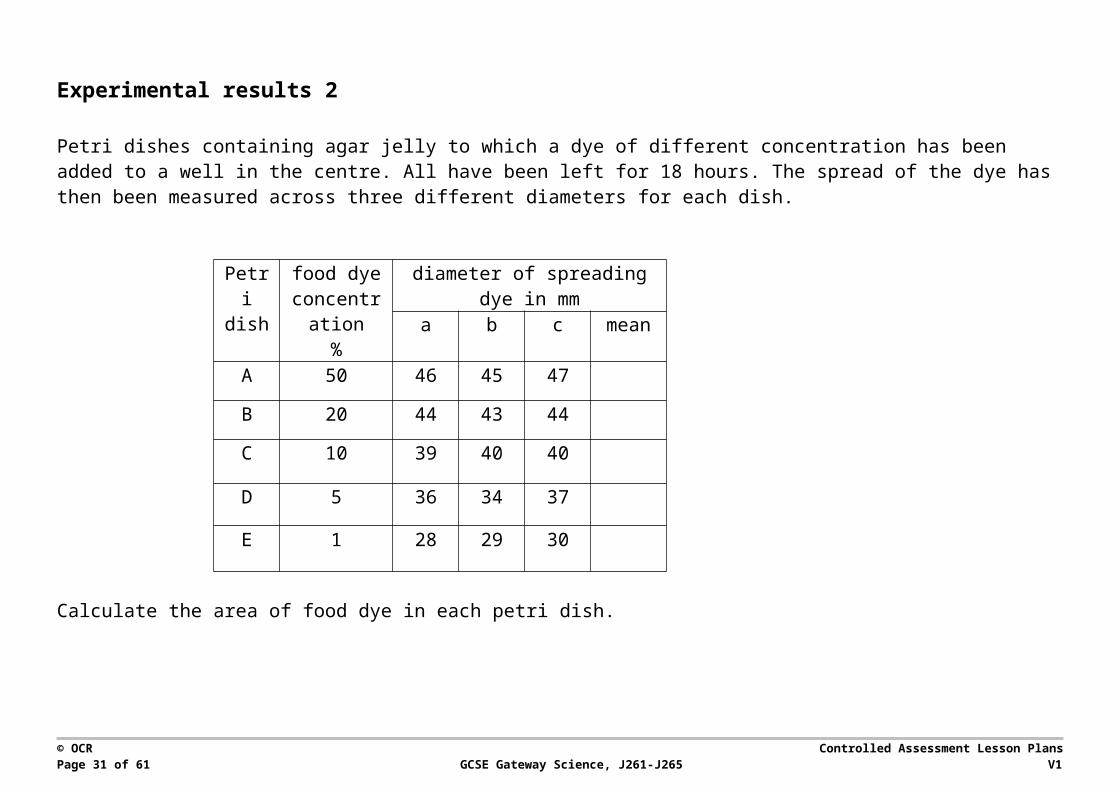
Experimental results 2
Petri dishes containing agar jelly to which a dye of different concentration has been added to a well in the centre. All have been left for 18 hours. The spread of the dye has then been measured across three different diameters for each dish.
Petri dish
food dye concentrati
on %
diameter of spreading dye in mm
a b c mean
A 50 46 45 47
B 20 44 43 44
C 10 39 40 40
D 5 36 34 37
E 1 28 29 30
Calculate the area of food dye in each petri dish.
© OCR Controlled Assessment Lesson PlansPage 26 of 51 GCSE Gateway Science, J261-J265 V1
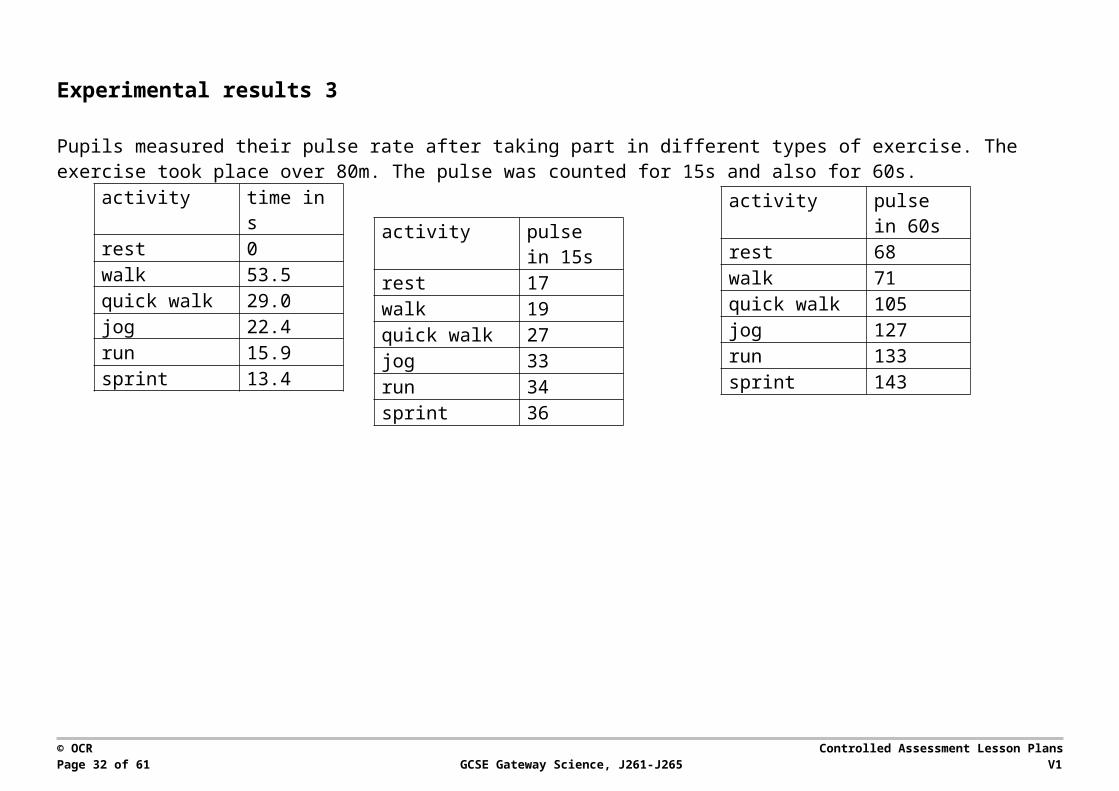
Experimental results 3
Pupils measured their pulse rate after taking part in different types of exercise. The exercise took place over 80m. The pulse was counted for 15s and also for 60s.
activity time in srest 0walk 53.5quick walk 29.0jog 22.4run 15.9sprint 13.4
© OCR Controlled Assessment Lesson PlansPage 27 of 51 GCSE Gateway Science, J261-J265 V1
activity pulse in 60s
rest 68walk 71quick walk 105jog 127run 133sprint 143
activity pulse in 15s
rest 17walk 19quick walk 27jog 33run 34sprint 36
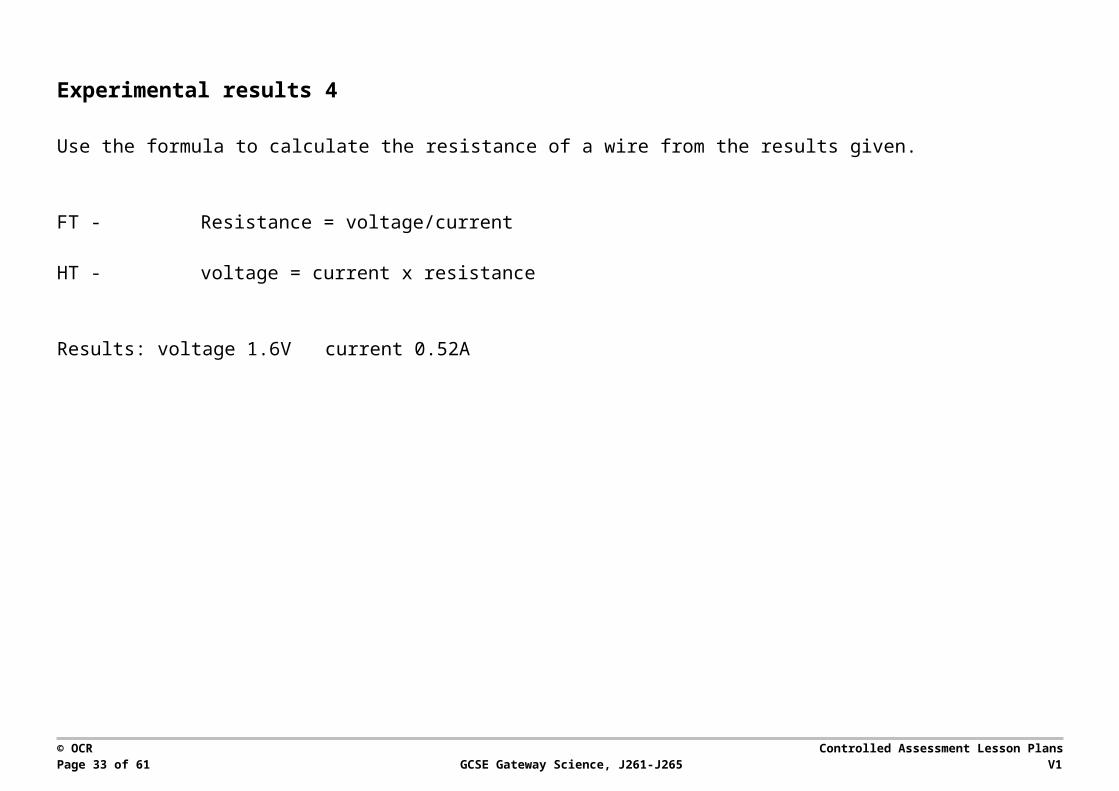
Experimental results 4
Use the formula to calculate the resistance of a wire from the results given.
FT - Resistance = voltage/current
HT - voltage = current x resistance
Results: voltage 1.6V current 0.52A
© OCR Controlled Assessment Lesson PlansPage 28 of 51 GCSE Gateway Science, J261-J265 V1
Sample Lesson PlanGCSE Gateway Science J261-J265
Item: Processing data 2
OCR recognises that the teaching of this qualification above will vary greatly from school to school and from teacher to teacher. With that in mind this lesson plan is offered as a possible approach but will be subject to modifications by the individual teacher.
Lesson length is assumed to be one hour.
Introduction
This is the second lesson allocated to the skill of Processing data.
In Part 3 of the Controlled Assessment task candidates are required to plot an appropriate graph/chart of the results of their investigation.
Pupils will need practice in choosing the type of graph or chart to plot and selecting the scale. They should be encouraged to plot accurately, label the axes and write a title. Higher level pupils will need to practice drawing a line of best fit and using range bars as one way of considering the uncertainty of the data.
Learning Objectives for the Lesson
Objective 1 To be able to display data in an appropriate chart/graph selecting the appropriate scales and axes
Objective 2 To be able to select the appropriate scales, axes title
Objective 3 To be able to include line of best fit
Objective 4 To be able to use a quantitative treatment of the level of uncertainty of data (HT)
© OCR Controlled Assessment Lesson PlansPage 29 of 51 GCSE Gateway Science, J261-J265 V1
Time in mins
Learning activitiesResources Assessment
Teacher Pupil
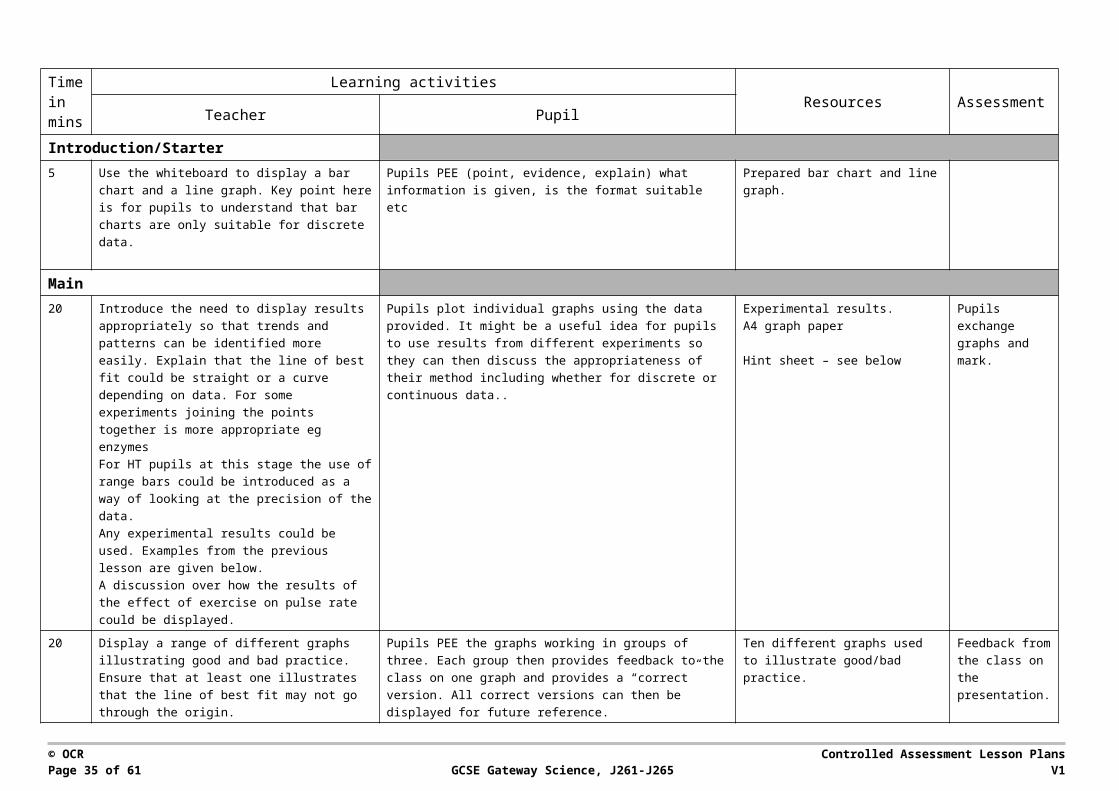
Introduction/Starter5 Use the whiteboard to display a bar chart and a line
graph. Key point here is for pupils to understand that bar charts are only suitable for discrete data.
Pupils PEE (point, evidence, explain) what information is given, is the format suitable etc
Prepared bar chart and line graph.
Main20 Introduce the need to display results appropriately
so that trends and patterns can be identified more easily. Explain that the line of best fit could be straight or a curve depending on data. For some experiments joining the points together is more appropriate eg enzymesFor HT pupils at this stage the use of range bars could be introduced as a way of looking at the precision of the data.Any experimental results could be used. Examples from the previous lesson are given below.A discussion over how the results of the effect of exercise on pulse rate could be displayed.
Pupils plot individual graphs using the data provided. It might be a useful idea for pupils to use results from different experiments so they can then discuss the appropriateness of their method including whether for discrete or continuous data..
Experimental results.A4 graph paper
Hint sheet – see below
Pupils exchange graphs and mark.
20 Display a range of different graphs illustrating good and bad practice. Ensure that at least one illustrates that the line of best fit may not go through the origin.
Pupils PEE the graphs working in groups of three. Each group then provides feedback to the class on one graph and provides a “correct” version. All correct versions can then be displayed for future reference.
Ten different graphs used to illustrate good/bad practice.
Feedback from the class on the presentation.
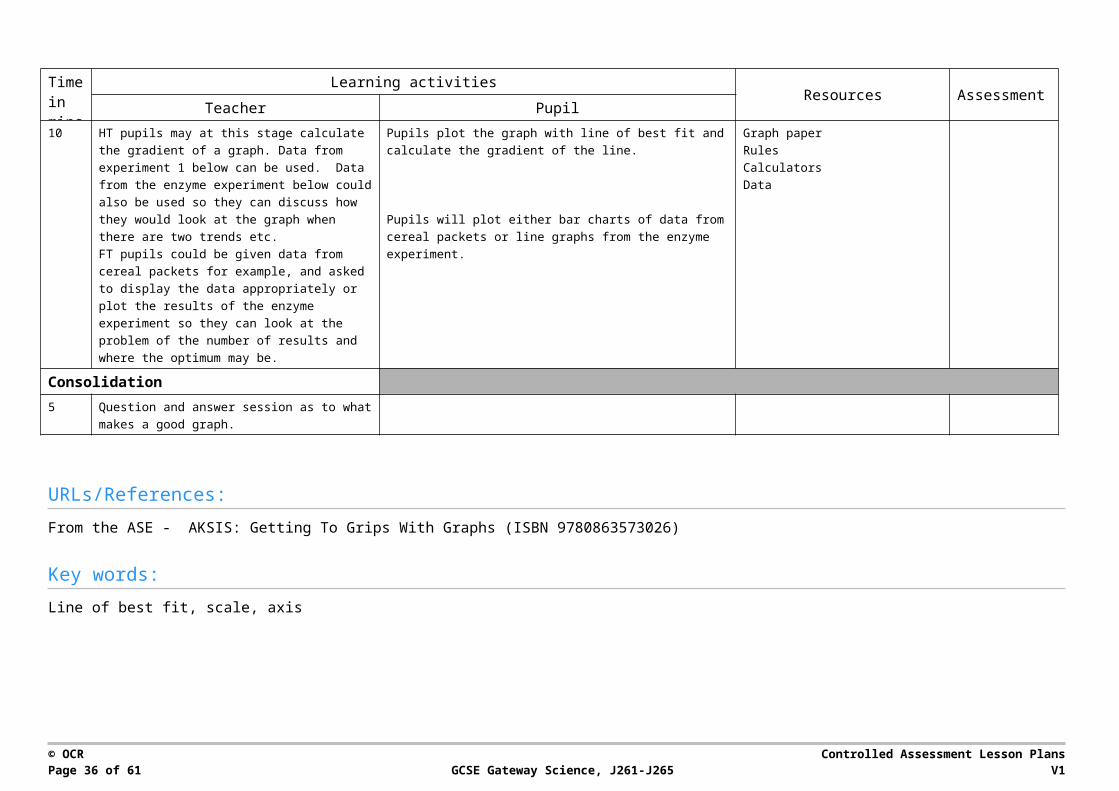
10 HT pupils may at this stage calculate the gradient of a graph. Data from experiment 1 below can be used. Data from the enzyme experiment below could also be used so they can discuss how they would look at the graph when there are two trends etc.FT pupils could be given data from cereal packets for example, and asked to display the data appropriately or plot the results of the enzyme experiment so they can look at the problem of the
Pupils plot the graph with line of best fit and calculate the gradient of the line.
Pupils will plot either bar charts of data from cereal packets or line graphs from the enzyme experiment.
Graph paperRulesCalculatorsData
© OCR Controlled Assessment Lesson PlansPage 30 of 51 GCSE Gateway Science, J261-J265 V1
Time in mins
Learning activitiesResources Assessment
Teacher Pupil
number of results and where the optimum may be.
Consolidation5 Question and answer session as to what makes a
good graph.
URLs/References:From the ASE - AKSIS: Getting To Grips With Graphs (ISBN 9780863573026)
Key words:Line of best fit, scale, axis
© OCR Controlled Assessment Lesson PlansPage 31 of 51 GCSE Gateway Science, J261-J265 V1
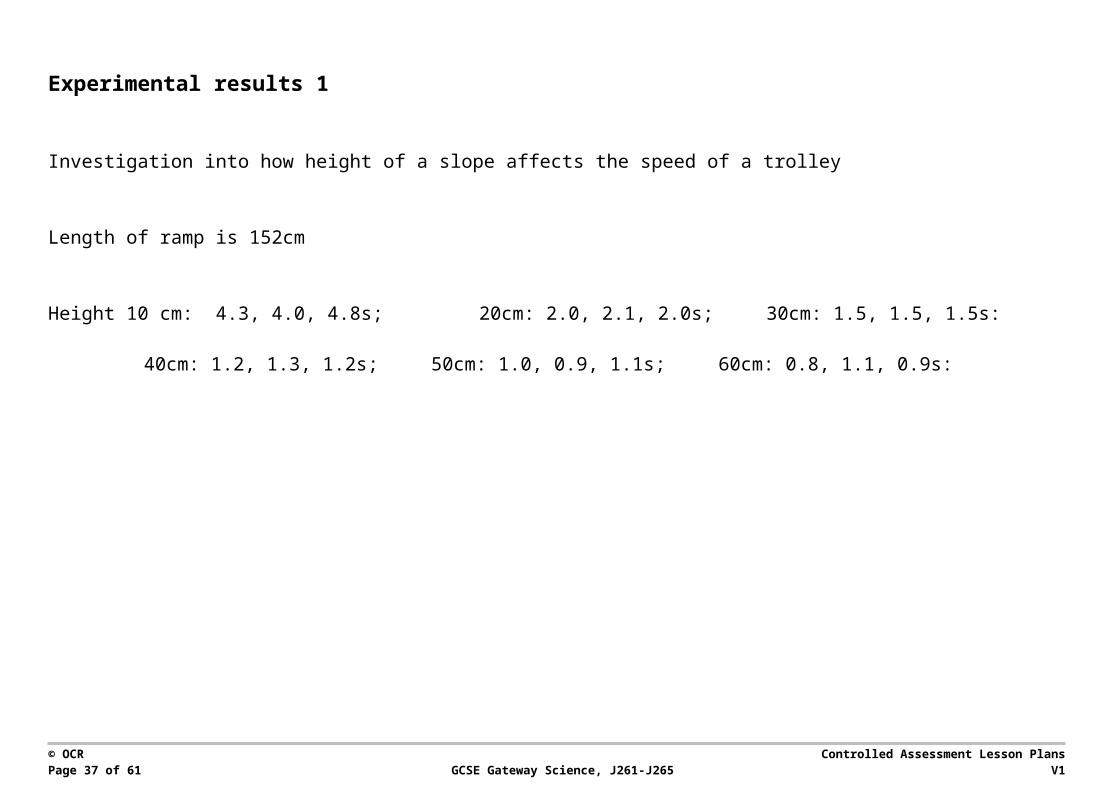
Experimental results 1
Investigation into how height of a slope affects the speed of a trolley
Length of ramp is 152cm
Height 10 cm: 4.3, 4.0, 4.8s; 20cm: 2.0, 2.1, 2.0s; 30cm: 1.5, 1.5, 1.5s:
40cm: 1.2, 1.3, 1.2s; 50cm: 1.0, 0.9, 1.1s; 60cm: 0.8, 1.1, 0.9s:
© OCR Controlled Assessment Lesson PlansPage 32 of 51 GCSE Gateway Science, J261-J265 V1
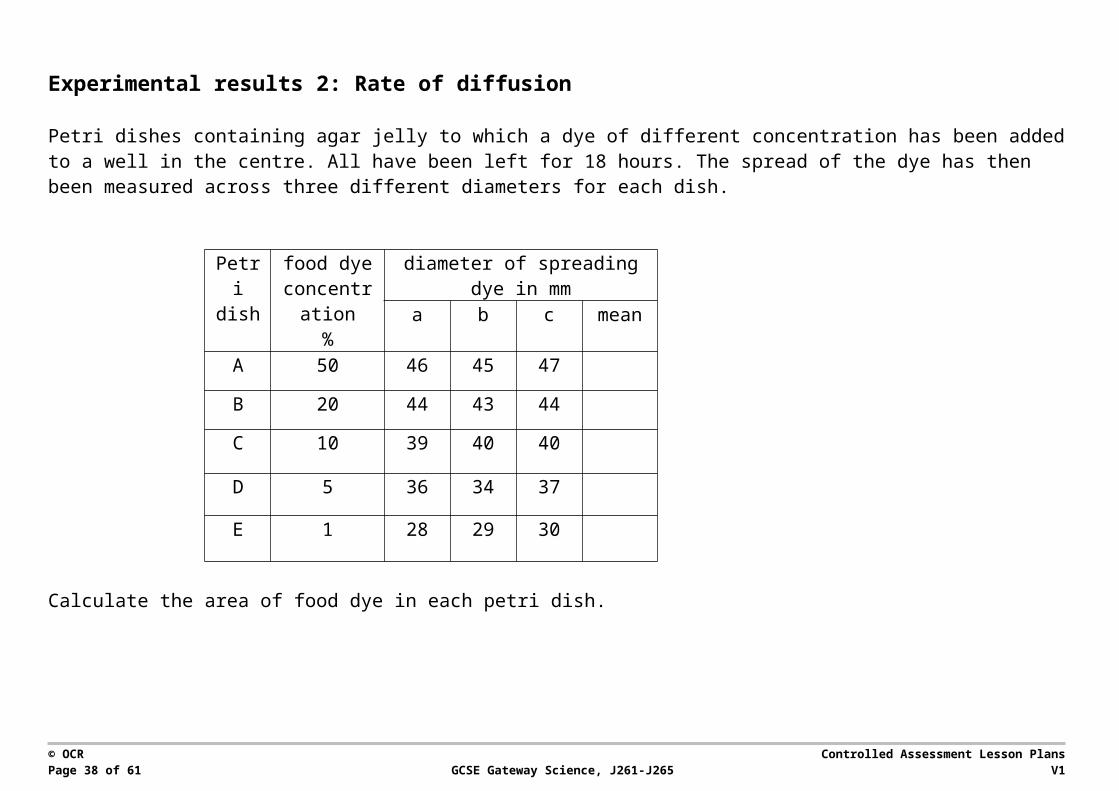
Experimental results 2: Rate of diffusion
Petri dishes containing agar jelly to which a dye of different concentration has been added to a well in the centre. All have been left for 18 hours. The spread of the dye has then been measured across three different diameters for each dish.
Petri dish
food dye concentrati
on %
diameter of spreading dye in mm
a b c mean
A 50 46 45 47
B 20 44 43 44
C 10 39 40 40
D 5 36 34 37
E 1 28 29 30
Calculate the area of food dye in each petri dish.
© OCR Controlled Assessment Lesson PlansPage 33 of 51 GCSE Gateway Science, J261-J265 V1
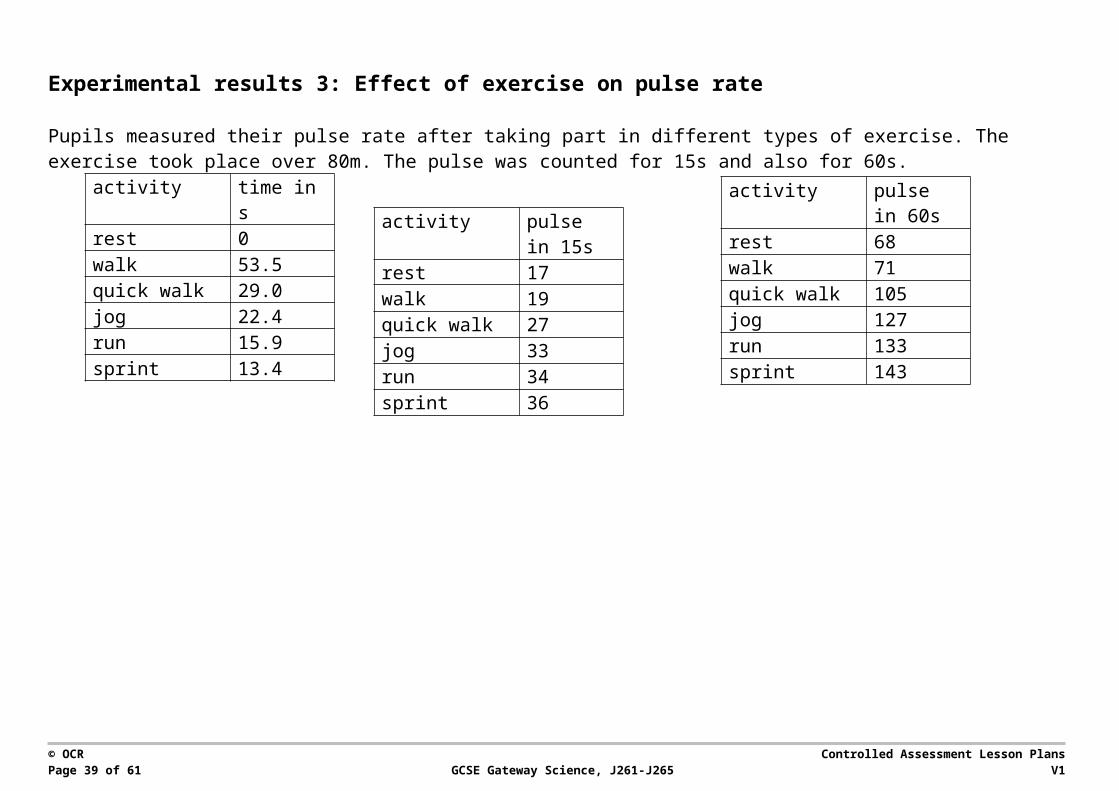
Experimental results 3: Effect of exercise on pulse rate
Pupils measured their pulse rate after taking part in different types of exercise. The exercise took place over 80m. The pulse was counted for 15s and also for 60s.
activity time in srest 0walk 53.5quick walk 29.0jog 22.4run 15.9sprint 13.4
© OCR Controlled Assessment Lesson PlansPage 34 of 51 GCSE Gateway Science, J261-J265 V1
activity pulse in 60s
rest 68walk 71quick walk 105jog 127run 133sprint 143
activity pulse in 15s
rest 17walk 19quick walk 27jog 33run 34sprint 36
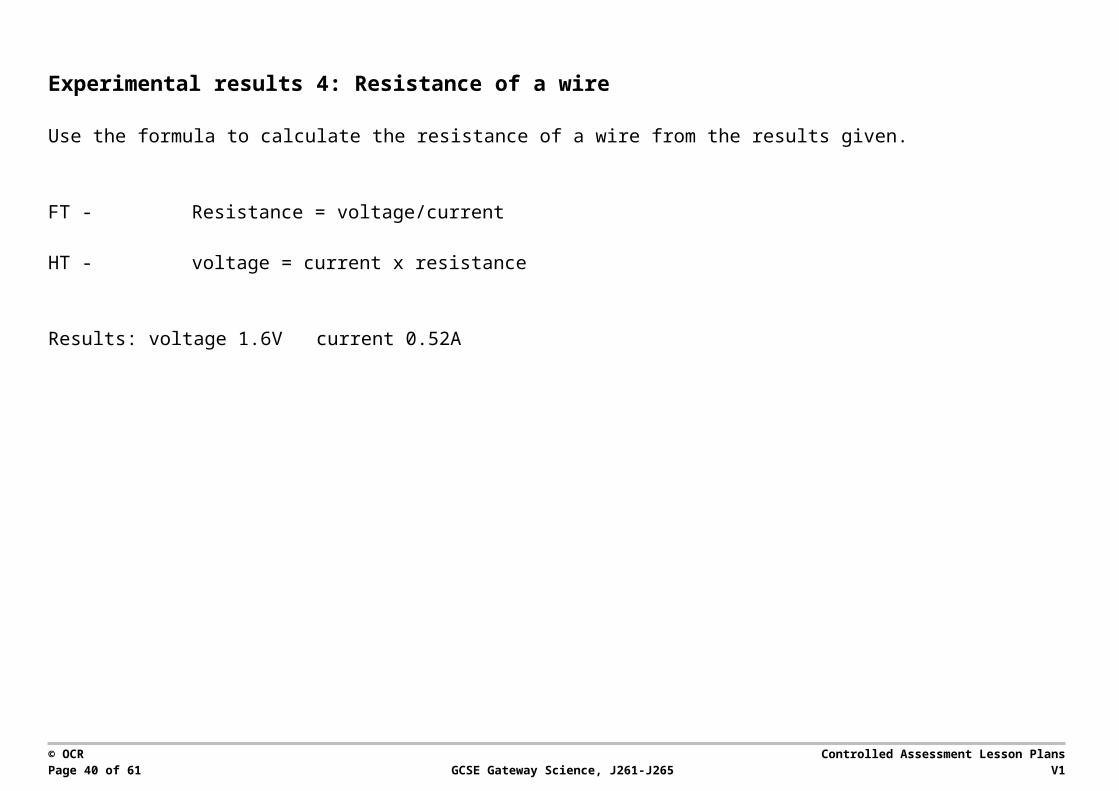
Experimental results 4: Resistance of a wire
Use the formula to calculate the resistance of a wire from the results given.
FT - Resistance = voltage/current
HT - voltage = current x resistance
Results: voltage 1.6V current 0.52A
© OCR Controlled Assessment Lesson PlansPage 35 of 51 GCSE Gateway Science, J261-J265 V1
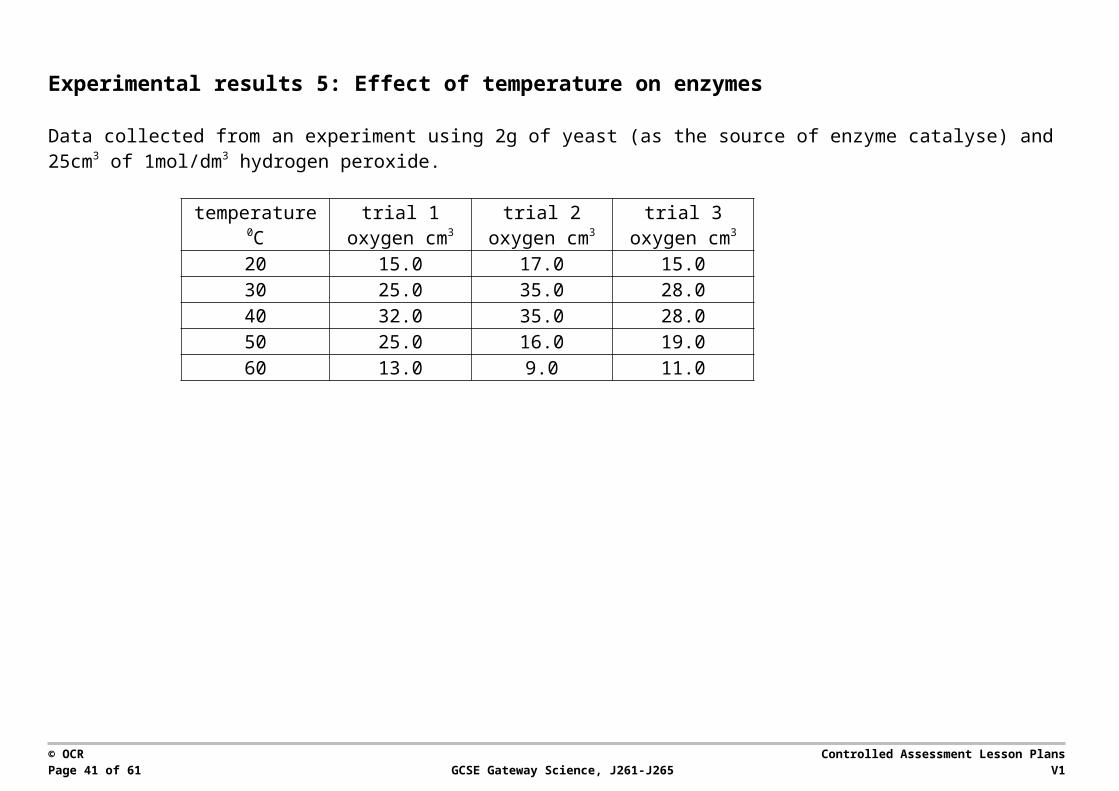
Experimental results 5: Effect of temperature on enzymes
Data collected from an experiment using 2g of yeast (as the source of enzyme catalyse) and 25cm3 of 1mol/dm3 hydrogen peroxide.
temperature0C
trial 1oxygen cm3
trial 2oxygen cm3
trial 3oxygen cm3
20 15.0 17.0 15.030 25.0 35.0 28.040 32.0 35.0 28.050 25.0 16.0 19.060 13.0 9.0 11.0
© OCR Controlled Assessment Lesson PlansPage 36 of 51 GCSE Gateway Science, J261-J265 V1
Top Tips for displaying data
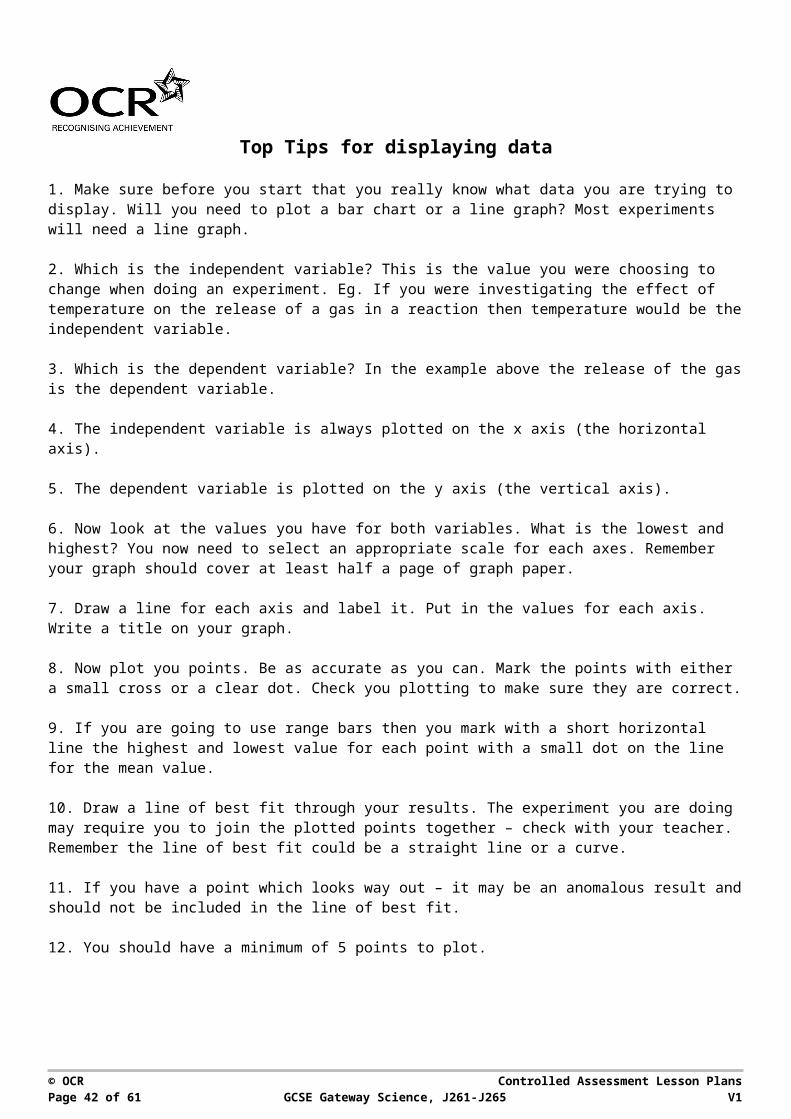
1. Make sure before you start that you really know what data you are trying to display. Will you need to plot a bar chart or a line graph? Most experiments will need a line graph.
2. Which is the independent variable? This is the value you were choosing to change when doing an experiment. Eg. If you were investigating the effect of temperature on the release of a gas in a reaction then temperature would be the independent variable.
3. Which is the dependent variable? In the example above the release of the gas is the dependent variable.
4. The independent variable is always plotted on the x axis (the horizontal axis).
5. The dependent variable is plotted on the y axis (the vertical axis).
6. Now look at the values you have for both variables. What is the lowest and highest? You now need to select an appropriate scale for each axes. Remember your graph should cover at least half a page of graph paper.
7. Draw a line for each axis and label it. Put in the values for each axis. Write a title on your graph.
8. Now plot you points. Be as accurate as you can. Mark the points with either a small cross or a clear dot. Check you plotting to make sure they are correct.
9. If you are going to use range bars then you mark with a short horizontal line the highest and lowest value for each point with a small dot on the line for the mean value.
10. Draw a line of best fit through your results. The experiment you are doing may require you to join the plotted points together – check with your teacher. Remember the line of best fit could be a straight line or a curve.
11. If you have a point which looks way out – it may be an anomalous result and should not be included in the line of best fit.
12. You should have a minimum of 5 points to plot.
© OCR Controlled Assessment Lesson PlansPage 37 of 51 GCSE Gateway Science, J261-J265 V1
Sample Lesson PlanGCSE Gateway Science J261-J265
Item: Analysing data
OCR recognises that the teaching of this qualification above will vary greatly from school to school and from teacher to teacher. With that in mind this lesson plan is offered as a possible approach but will be subject to modifications by the individual teacher.
Lesson length is assumed to be one hour.
Introduction
In Part 3 of the Controlled Assessment task candidates will be asked to identify trends/patterns in the results of their investigation. They will be guided with a question to compare their results with data they have collected or with the results of another group. It is important that candidates refer to the quantitative data in their answer.
Pupils should be given opportunities to look for trends/patterns in results from practical work. Consideration of the graphs produced in earlier lessons would be suitable.
Higher pupils may use range bars to consider the level of uncertainty of the evidence. However, if is important that they understand why the range bars are used and can interpret the results of using them.
Learning Objectives for the Lesson
Objective 1 To identify and interpret trends
Objective 2 To be able to compare primary and secondary data
Objective 3 To be able to identify anomalous results and discuss implications
Objective 4 To be able analyse the level of uncertainty of the evidence (HT)
© OCR Controlled Assessment Lesson PlansPage 38 of 51 GCSE Gateway Science, J261-J265 V1
Time in mins
Learning activitiesResources Assessment
Teacher Pupil
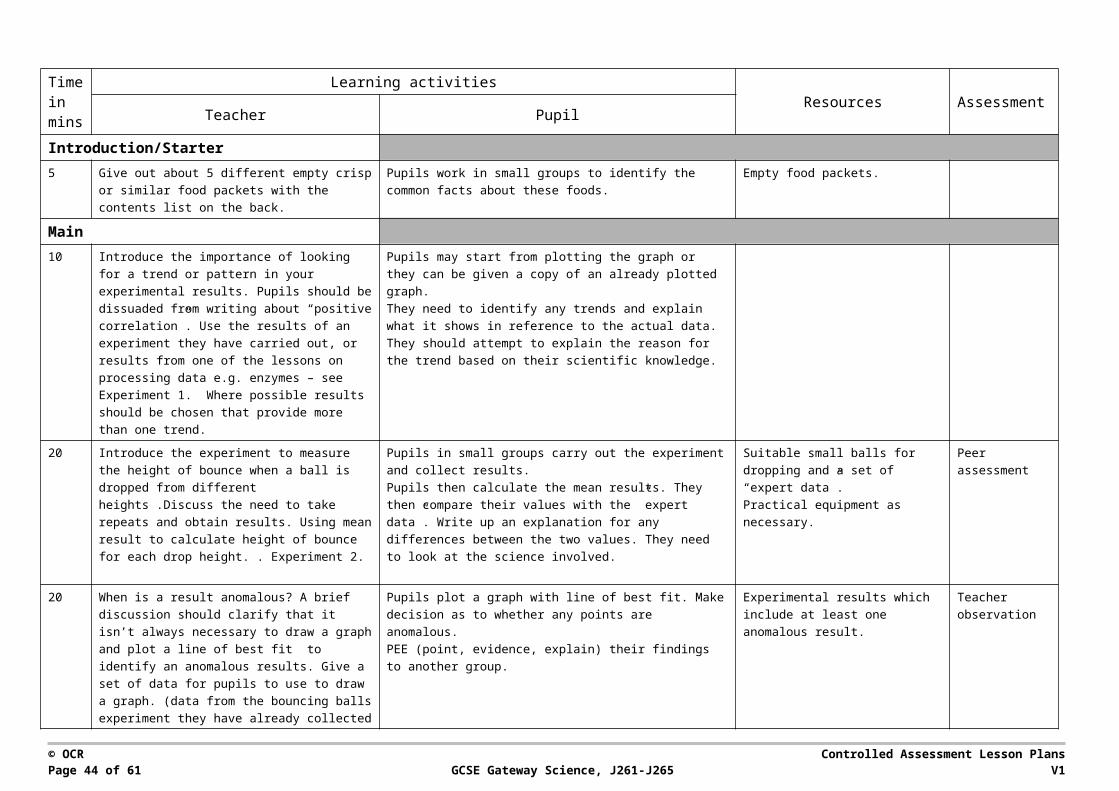
Introduction/Starter5 Give out about 5 different empty crisp or similar
food packets with the contents list on the back.Pupils work in small groups to identify the common facts about these foods.
Empty food packets.
Main10 Introduce the importance of looking for a trend or
pattern in your experimental results. Pupils should be dissuaded from writing about “positive correlation”. Use the results of an experiment they have carried out, or results from one of the lessons on processing data e.g. enzymes – see Experiment 1. Where possible results should be chosen that provide more than one trend.
Pupils may start from plotting the graph or they can be given a copy of an already plotted graph.They need to identify any trends and explain what it shows in reference to the actual data. They should attempt to explain the reason for the trend based on their scientific knowledge.
20 Introduce the experiment to measure the height of bounce when a ball is dropped from different heights .Discuss the need to take repeats and obtain results. Using mean result to calculate height of bounce for each drop height. . Experiment 2.
Pupils in small groups carry out the experiment and collect results.Pupils then calculate the mean results. They then compare their values with the ”expert data”. Write up an explanation for any differences between the two values. They need to look at the science involved.
Suitable small balls for dropping and a set of “expert data”.Practical equipment as necessary.
Peer assessment
20 When is a result anomalous? A brief discussion should clarify that it isn’t always necessary to draw a graph and plot a line of best fit to identify an anomalous results. Give a set of data for pupils to use to draw a graph. (data from the bouncing balls experiment they have already collected could be used). They could do this by first calculating the mean in a table of data – they should make decisions as to whether to ignore values which are way out before calculating the mean. From the graph they should decide whether to include all points when plotting the line of best fit.HT pupils will need to consider how accurate and precise the values are.
Pupils plot a graph with line of best fit. Make decision as to whether any points are anomalous.PEE (point, evidence, explain) their findings to another group.
HT will use range bars to help discuss the level of uncertainty of the data.
Experimental results which include at least one anomalous result.
Teacher observation
© OCR Controlled Assessment Lesson PlansPage 39 of 51 GCSE Gateway Science, J261-J265 V1
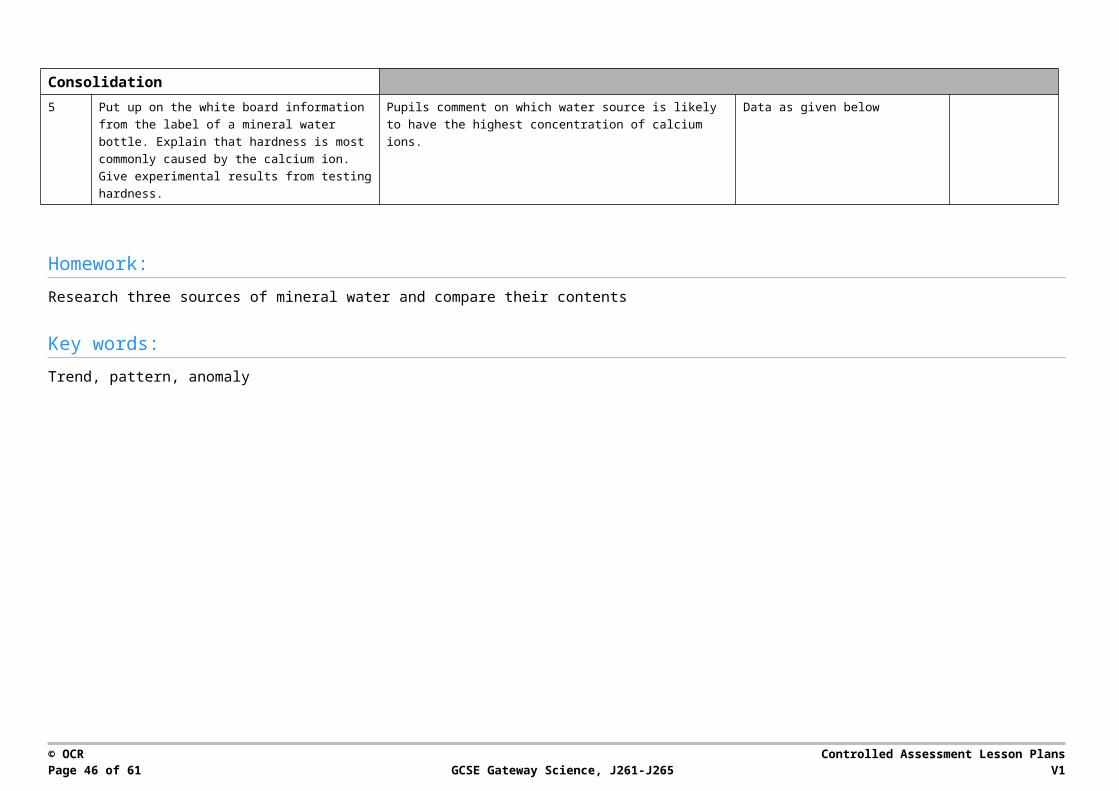
Consolidation5 Put up on the white board information from the
label of a mineral water bottle. Explain that hardness is most commonly caused by the calcium ion. Give experimental results from testing hardness.
Pupils comment on which water source is likely to have the highest concentration of calcium ions.
Data as given below
Homework:Research three sources of mineral water and compare their contents
Key words:Trend, pattern, anomaly
© OCR Controlled Assessment Lesson PlansPage 40 of 51 GCSE Gateway Science, J261-J265 V1
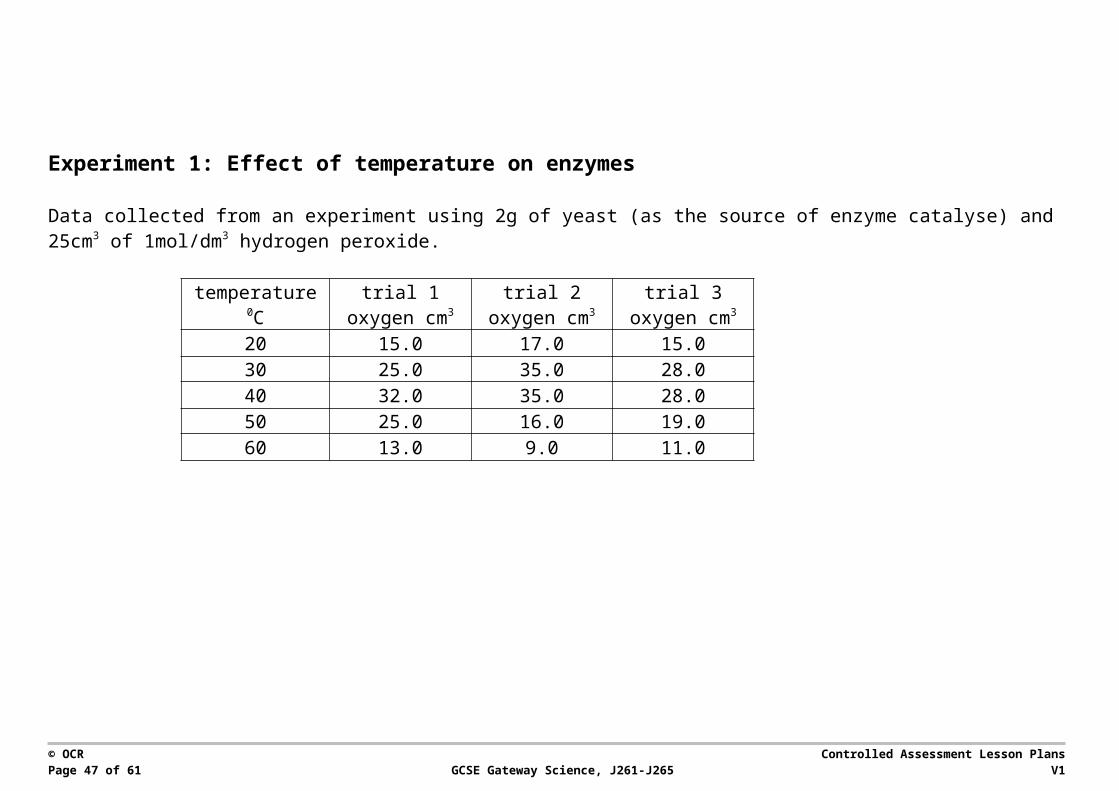
Experiment 1: Effect of temperature on enzymes
Data collected from an experiment using 2g of yeast (as the source of enzyme catalyse) and 25cm3 of 1mol/dm3 hydrogen peroxide.
temperature0C
trial 1oxygen cm3
trial 2oxygen cm3
trial 3oxygen cm3
20 15.0 17.0 15.030 25.0 35.0 28.040 32.0 35.0 28.050 25.0 16.0 19.060 13.0 9.0 11.0
© OCR Controlled Assessment Lesson PlansPage 41 of 51 GCSE Gateway Science, J261-J265 V1
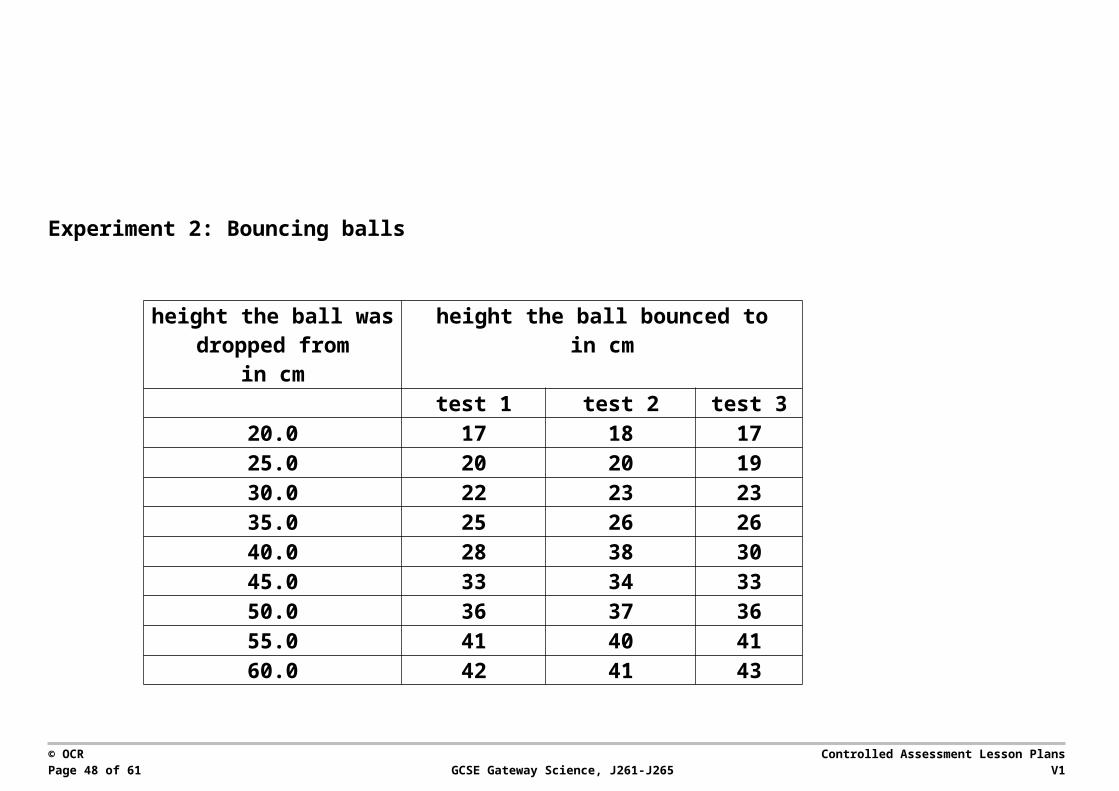
Experiment 2: Bouncing balls
height the ball was dropped from
in cm
height the ball bounced toin cm
test 1 test 2 test 320.0 17 18 1725.0 20 20 1930.0 22 23 2335.0 25 26 2640.0 28 38 3045.0 33 34 3350.0 36 37 3655.0 41 40 4160.0 42 41 43
© OCR Controlled Assessment Lesson PlansPage 42 of 51 GCSE Gateway Science, J261-J265 V1
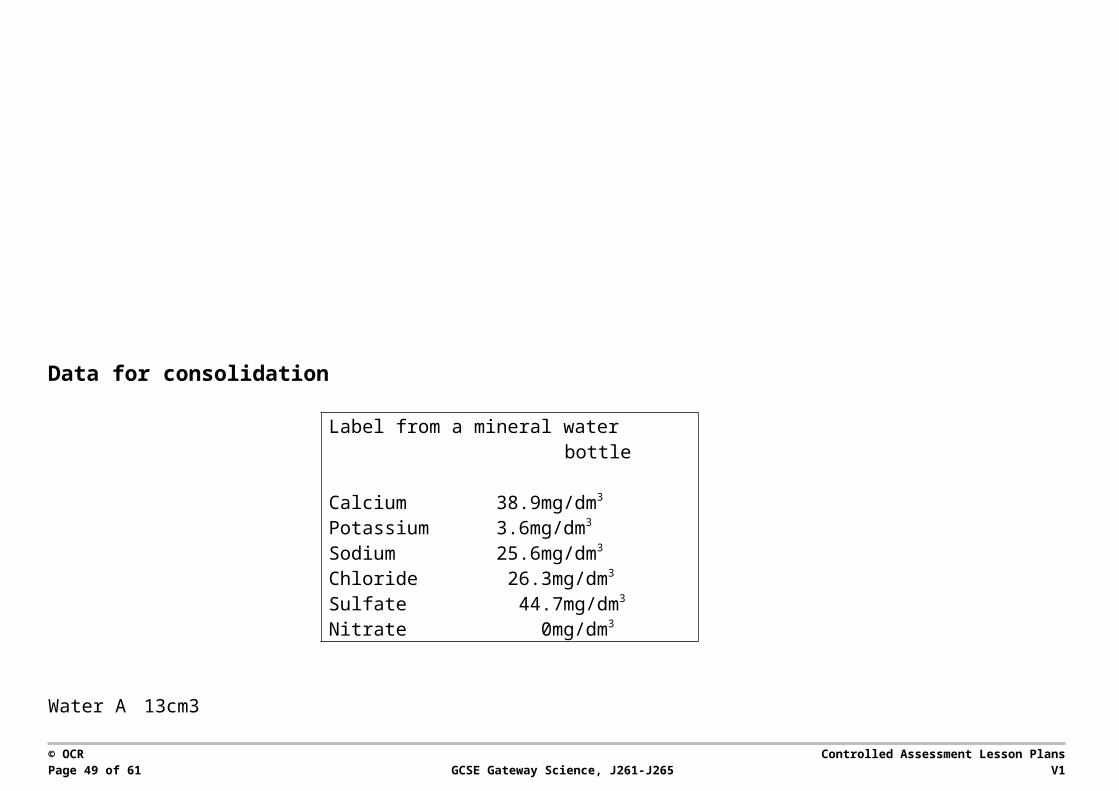
Data for consolidation
Label from a mineral water bottle
Calcium 38.9mg/dm3
Potassium 3.6mg/dm3
Sodium 25.6mg/dm3
Chloride 26.3mg/dm3
Sulfate 44.7mg/dm3
Nitrate 0mg/dm3
Water A 13cm3Water B 23cm3Water C 18cm3
© OCR Controlled Assessment Lesson PlansPage 43 of 51 GCSE Gateway Science, J261-J265 V1
Sample Lesson PlanGCSE Gateway Science J261-J265
Item: Evaluating
OCR recognises that the teaching of this qualification above will vary greatly from school to school and from teacher to teacher. With that in mind this lesson plan is offered as a possible approach but will be subject to modifications by the individual teacher.
Lesson length is assumed to be one hour.
Introduction
Question 4 in Part 3 requires candidates to evaluate the results, the method they used and how well they managed the risks. It is important that they address all three parts of this question.
Terminology which could be used in evaluating is found in the glossary of terms in Appendix E of the Guide to Controlled Assessment Appendix E and in a shortened form attached to this Lesson Plan. All candidates are not expected to be using all these terms but should understand the principles behind the terminology. The key terms they should know and be able to use are listed in the key words.
Pupils need to be given opportunities to evaluate methods, look at the limitations and suggest improvements. They also need to consider the quality of the experimental data collected so it is important that they have the opportunity to carry out repeats and look at the spread of the results.
Learning Objectives for the Lesson
Objective 1 To recognise that evaluation includes consideration of the data, method of collection and suggesting improvements
Objective 2 To be able to understand specific terminology and use it appropriately
Objective 3 To be able to identify the quality of the data and method used
Objective 4 To be able to suggest improvements. HT – justified improvements
Recap of Previous Experience and Prior Knowledge
KS3 pupils will have evaluated scientific evidence and working methods.
© OCR Controlled Assessment Lesson PlansPage 44 of 51 GCSE Gateway Science, J261-J265 V1
Time in mins
Learning activitiesResources Assessment
Teacher Pupil
Introduction/Starter5 Project the instructions for making a paper
aeroplane (or other artefact). Have a paper aeroplane made by this method for pupils to look at.
Pupils comment on the quality of the paper aeroplane and the method used. How would they improve on this method?
Paper aeroplane or similar.Instructions for making it
Main20 Introduce the need to look at the quality of the end
product of an experiment and the method used to collect the data.Teacher demo of an experimental method for collecting data. The demo should not be successful and the results need to show lack of accuracy, precision and resolution.
Pupils work in pairs to say what is wrong with the method or data and explain why in their own words.They use each one of the key terms in relation to the experiment. The terms are given on cards with simplified definitions.
Experiment equipment and results.Key term cards with simplified definitions.
8 Explain the specialist terms are used to evaluate experimental methods and data collection. They have already been given three so now include others: validity, uncertainty, repeatability.
Pupils in small groups use a card sort to match terms to the appropriate definition and an example.
Prepared cards: terms, definitions, example
Peer assessment
22 Provide a circus of stations – experimental methods with equipment, sets of results etc used to illustrate terminology, the quality of the data, the method and how it could be improved. Results and methods from previous lessons could be used.Can be given the ten top tips if required.Plenary to check their responses.
Pupils working in groups work round the circus identifying what is good and works, what will not work. They need to give an explanation hopefully using the terms correctly. Pupils will then need to suggest improvements. HT should justify any suggestions made.
Circus of experiments etc.
Ten top tips for evaluating sheet
Teacher observation
Consolidation5 True or false activity with a few examples on
whiteboard. Pupils hold up true or false cards. True/false cards
Prepared examples on whiteboard.
© OCR Controlled Assessment Lesson PlansPage 45 of 51 GCSE Gateway Science, J261-J265 V1
Homework:Pupils look back at an experiment they have done in a previous lesson and evaluate the method, data collected and make suggestions for improvement.
URLs/References:http://www.focuseducational.com/category/science/1
Key words:Accuracy, precision, resolution, repeatability, validity, uncertainty
© OCR Controlled Assessment Lesson PlansPage 46 of 51 GCSE Gateway Science, J261-J265 V1
Terms for use in evaluation
These definitions are consistent with ASE (2010) The Language of Measurement: Terminology used in school science investigations ASE. ISBN 978 0 86357 424 5
Pupils should be given simplified versions of these definitions.
Term Definition Notes
accuracy a measurement result is considered accurate if it is judged to be close to the true value
how close a reading is to the true valueeg value of resistance obtained from experiment compared to calculated value
precision a quality denoting the closeness of agreement between (consistency, low variability of) measured values obtained by repeated measurements
how close the agreement is between measured valueseg titration results:1.30; 1.20; 1.25cm3
repeatability precision obtained when measurement results are produced in one laboratory, by a single operator, using the same equipment under the same conditions, over a short timescale
how close (precise) values are when repeated by the same person with the same equipment
reproducibility precision obtained when measurement results are produced by different laboratories (and therefore by different operators using different pieces of equipment)
how close (precise) values are when repeated by different people using different equipment
resolution smallest change in the quantity being measured (input) of a measuring instrument that gives a perceptible change in the indication (output)
smallest change in a value that can be detected by an instrument.eg in a titration it would be usual to use a burette and record readings to 0.5 division on the scale.
uncertainty interval within which the true value can be expected to lie, with a given level of confidence or probability
the likelihood of a measurement falling close to the true value. A big range in the measurements of the dependent variable implies a high level of uncertainty. Use of range bars will help to show level of uncertainty.
validity (of experimental design)
suitability of the investigative procedure to answer the question being asked
valid conclusion a conclusion supported by valid data, obtained from an appropriate experimental design an based on sound reasoning
© OCR Controlled Assessment Lesson PlansPage 47 of 51 GCSE Gateway Science, J261-J265 V1
Ten top tips for evaluating
Think about:
which parts of the method worked well
which parts of the method needed to be changed
did you make any errors in reading the measurements on the equipment
did the equipment measure what you expected it to do
were the repeat results close together
were your results similar to the result you expected or the data you found out in your research
did your results have any errors
what are the reasons for any errors
how could you have improved the method
why would you make these changes
© OCR Controlled Assessment Lesson PlansPage 48 of 51 GCSE Gateway Science, J261-J265 V1
Sample Lesson PlanGCSE Gateway Science J261-J265
Item: Conclusions
OCR recognises that the teaching of this qualification above will vary greatly from school to school and from teacher to teacher. With that in mind this lesson plan is offered as a possible approach but will be subject to modifications by the individual teacher.
Lesson length is assumed to be one hour.
Introduction
Candidates will be required to draw and justify a conclusion in Part 3 of the Controlled Assessment. This will mainly be covered by the answer to Questions 5 and 6 but evidence may also be found in the answer to Question 3.
Pupils need to be given practice in deciding whether the results of their investigation support or refute the initial hypothesis, and use the results of the investigation and research data to justify their answer to a specific question. They are expected to show underpinning knowledge of the science involved in their answer.
Learning Objectives for the Lesson
Objective 1 To understand that a conclusion must be based on a consideration of the available data
Objective 2 To be able to base a conclusion on different sources of data
Objective 3 To be able to justify a conclusion and link to relevant science
Recap of Previous Experience and Prior Knowledge
KS3 Pupils will have drawn conclusions based on their experimental work
© OCR Controlled Assessment Lesson PlansPage 49 of 51 GCSE Gateway Science, J261-J265 V1
Time in mins
Learning activitiesResources Assessment
Teacher Pupil
Introduction/Starter5 Drop a tennis ball from 3 different heights. Then
repeat with a table tennis ball. Ask pupils what other information or data would they need to confirm their conclusion.
Pupils watch activity and formulate a conclusion. Tennis and table tennis balls
Main20 Provide research information and set of data for
pupils to consider. See data below. Research on the optimum temperature for catalyse is available.Introduce idea that they need to produce a conclusion about the optimum temperature for the action of catalyse.
Pupils working in small groups consider the secondary data/information and compare with the set of experimental results. They should justify their conclusion using their knowledge of enzyme action and nature of proteins.
Data and research data. Peer assessment
30 Provide 5 sets of: a data sample, research data and a conclusion. Plenary: Explain that all conclusions can be valid as long as they are based on evidence. The better conclusions should be linked to both the experimental results and the research data.
Circus of activities for pupils to work at in small groups. Each group selects the conclusion they think is the best. Each group gives feedback to the class. They must justify their reasons for selecting the conclusion.
5 sets of results with research and prepared conclusions.
Peer assessment
Consolidation5 Ask pupils to give the key things that make good
conclusions. Respond appropriately.
Homework:Write a conclusion for an experiment they have completed before.
Key words:Conclusion
© OCR Controlled Assessment Lesson PlansPage 50 of 51 GCSE Gateway Science, J261-J265 V1
Data: Effect of temperature on enzymes
Data collected from an experiment using 2g of yeast (as the source of enzyme catalyse) and 25cm3 of 1mol/dm3 hydrogen peroxide in 2 minutes.
Data collected from an experiment using 5cm section of potato cut with a 0.5 bore cork borer (as the source of enzyme catalyse) and 25cm3 of 4mol/dm3 hydrogen peroxide in 2 minutes.
© OCR Controlled Assessment Lesson PlansPage 51 of 51 GCSE Gateway Science, J261-J265 V1
temperature 0C
trial 1oxygen cm3
trial 2oxygen cm3
trial 3oxygen cm3
20 15.0 17.0 15.030 25.0 35.0 28.040 32.0 35.0 28.050 25.0 16.0 19.060 13.0 9.0 11.0
temperature 0C
trial 1oxygen cm3
trial 2oxygen cm3
trial 3oxygen cm3
20 2.0 1.0 3.030 16.0 17.0 16.040 18.0 24.0 18.050 13.0 14.0 15.060 8.0 9.0 8.0