Embed Size (px)
Citation preview

Controlled Assessment – Additional Science / Physics ISA PU2.x
Friction (Specimen) For moderation in May 20yy
Teachers’ Notes
This ISA relates to Additional Science / Physics Unit 2: P2.1.3 Forces and braking Topic of investigation Section P2.1.3f: A vehicle’s braking distance can be affected by adverse road and weather
conditions and poor condition of the vehicle. Overview Candidates should: • develop hypotheses and plan practical ways to test them • make risk assessments and manage risks when carrying out practical work • collect, process, analyse and interpret primary and secondary data, including the use of appropriate
technology to draw evidence-based conclusions • review methodology to assess fitness for purpose, and review predictions in light of outcomes.
The teacher should describe the context in which the investigation is set.
Candidates need to develop their own hypothesis. They should research two possible methods to investigate it and develop a detailed plan for one of these methods.
Candidates will need to decide which variables need to be controlled in order to investigate the hypothesis and research a method that could be used, with particular reference to hazards and risk assessment.
In Section 1 of the ISA, candidates will be required to provide a full plan of the method that they have chosen to use.
Once the candidates have researched and written up their own plan in the first part of the ISA, they should carry out their investigation providing that this is workable, valid, safe and manageable in the laboratory. Risk Assessment It is the responsibility of the centre to ensure that a risk assessment is carried out.
Candidates should be told to investigate a factor that may affect the friction between a moving object and the surface. They will need to produce their own hypothesis and research a plan.

Stage 1 – Planning (Limited control) Teachers should provide the candidates with a Candidate Research Notes Form. In Additional Science and Physics teachers should instruct the candidates to write their hypothesis and the chosen context on their Candidate Research Notes Candidates should be given the opportunity to plan an investigation to test their hypothesis. The investigation should be set in a context by the teacher. Examples of suitable contexts could include, the design of car tyres or road surfaces. Whichever context is chosen, the teacher must take care to present it in such a way that it does not limit the candidates' choice of method for the investigation. Teachers should instruct the candidates to write their hypothesis and the chosen context on their Candidate Research Notes.
Candidates should then independently research an appropriate plan to test the hypothesis and decide for themselves factors such as the range, interval and number of repeat readings that they should take, and the variables that need to be controlled. They should use at least two sources for this research.
They will need to undertake independent research to identify two methods that could be used. During this time they may make up to one A4 side of their own Candidate Research Notes for use during Section 1 and Section 2 of the ISA. The Candidate Research Notes sheet must be used for this purpose.
For their research candidates may use technology such as the internet or CD-ROMs, textbooks or any other appropriate sources of information. Candidates should also research how the results of the investigation might be useful in the specified context.
There is no set time allocation for this research, but it is anticipated that it should take no longer than 3 hours of work. This research may be done in the laboratory or elsewhere.
The teacher should check and sign the Candidate Research Notes before allowing the candidate to use them during the completion of Section 1 of the ISA. These must be checked to ensure they do not include plagiarised text or a pre-prepared draft. The candidate may use these notes while completing Section 1 and Section 2 of the ISA. When the candidate has completed Section 2, the Candidate Research Notes should be stapled to the ISA.
Stage 2 – Reporting on the planning research (High control) For this stage, candidates must work individually under direct supervision After the Stage 1 planning session, candidates should be given Section 1 of the ISA and should work on their own, under controlled conditions, to answer it. Candidates should take their Candidate Research Notes into the formal assessment.
Section 1 will require them to: • state and explain their hypothesis • consider the variables (independent, dependent and control) that they will need to
manage during the investigation • report on their research into how to test their hypothesis • write a detailed plan of their chosen method • write a brief outline of an alternative method and explain why it was not chosen • identify possible hazards and write down how the risks may be minimised • draw a blank table suitable for the method they have planned.
Candidates may choose to use technology to draw the table, e.g. a computer spread sheet. This must be done under the direct supervision of the teacher, and may be done at any convenient time between the planning session in Stage 1 and the completion of Section 1 of the ISA.
While answering Section 1 of the ISA, candidates must not be allowed to use notes, textbooks, the Internet or any other source of help apart from their own Candidate Research Notes.
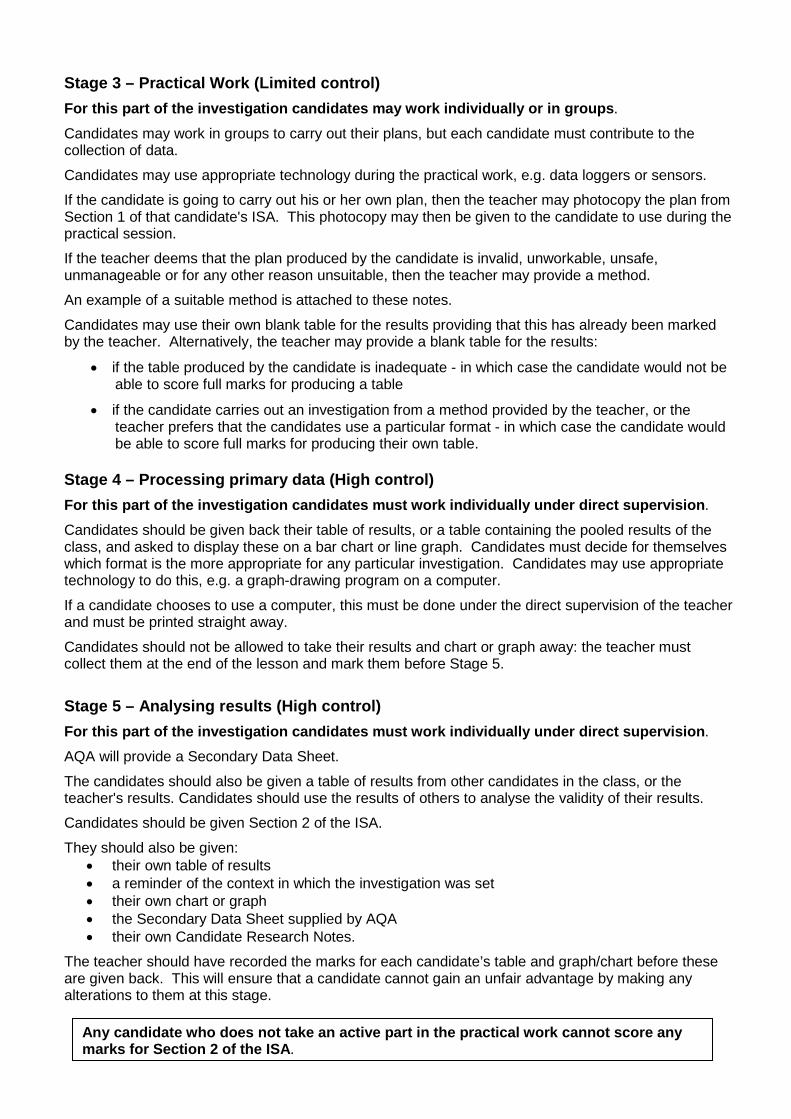
Stage 3 – Practical Work (Limited control) For this part of the investigation candidates may work individually or in groups. Candidates may work in groups to carry out their plans, but each candidate must contribute to the collection of data.
Candidates may use appropriate technology during the practical work, e.g. data loggers or sensors.
If the candidate is going to carry out his or her own plan, then the teacher may photocopy the plan from Section 1 of that candidate's ISA. This photocopy may then be given to the candidate to use during the practical session.
If the teacher deems that the plan produced by the candidate is invalid, unworkable, unsafe, unmanageable or for any other reason unsuitable, then the teacher may provide a method.
An example of a suitable method is attached to these notes.
Candidates may use their own blank table for the results providing that this has already been marked by the teacher. Alternatively, the teacher may provide a blank table for the results:
• if the table produced by the candidate is inadequate - in which case the candidate would not be able to score full marks for producing a table
• if the candidate carries out an investigation from a method provided by the teacher, or the teacher prefers that the candidates use a particular format - in which case the candidate would be able to score full marks for producing their own table.
Stage 4 – Processing primary data (High control) For this part of the investigation candidates must work individually under direct supervision. Candidates should be given back their table of results, or a table containing the pooled results of the class, and asked to display these on a bar chart or line graph. Candidates must decide for themselves which format is the more appropriate for any particular investigation. Candidates may use appropriate technology to do this, e.g. a graph-drawing program on a computer.
If a candidate chooses to use a computer, this must be done under the direct supervision of the teacher and must be printed straight away.
Candidates should not be allowed to take their results and chart or graph away: the teacher must collect them at the end of the lesson and mark them before Stage 5.
Stage 5 – Analysing results (High control) For this part of the investigation candidates must work individually under direct supervision.
AQA will provide a Secondary Data Sheet.
The candidates should also be given a table of results from other candidates in the class, or the teacher's results. Candidates should use the results of others to analyse the validity of their results.
Candidates should be given Section 2 of the ISA.
They should also be given: • their own table of results • a reminder of the context in which the investigation was set • their own chart or graph • the Secondary Data Sheet supplied by AQA • their own Candidate Research Notes.
The teacher should have recorded the marks for each candidate’s table and graph/chart before these are given back. This will ensure that a candidate cannot gain an unfair advantage by making any alterations to them at this stage.
Any candidate who does not take an active part in the practical work cannot score any marks for Section 2 of the ISA.

Section 2 will require candidates to:
• analyse their own results
• draw a conclusion
• match their achieved results to the hypothesis they investigated
• evaluate the method of collection and the quality of the resulting data
• analyse further secondary data drawn from the same topic area as their original investigation
• relate their findings to the context set in the ISA.

Additional Science / Physics Controlled Assessment
PU2.x Friction (Specimen)
This method could be used to investigate the following hypothesis: You will need to prepare a table for the results. Equipment
1 kg mass Small plastic box (e.g. margarine tub) Elastic band G-clamps Ruler Method:
1. Place the 1 kg mass in the small plastic box. 2. Stretch the elastic band between two suitable fixed supports,
eg 2 G-clamps, one on each side of the bench. 3. Pull the elastic band back and use it to catapult the box containing the 1 kg mass so that
it slides along the bench. 4. Measure the distance travelled by the box. 5. Repeat using different types of surface
Copyright 2012 AQA and its licensors. All rights reserved
Controlled Assessment Method Sheet
“The amount of friction depends on the roughness of the surface”

ISA Explanation Sheet
This sheet should accompany each ISA
Centre Number 9 8 7 6 5 Date Practical
Carried Out 10/5/11
ISA Code PU2.1x
Name of Teacher J. Harrison
ISA Title Friction
Did the candidates use their own plans?
YES for Candidate 1235 If NO give details of any changes you made for this investigation.
She decided to investigate friction by allowing a block of wood to slide down a plank Any other information: Teacher
Signature: J.Harrison
Please attach any experimental worksheet or outline used by the candidates to carry out the investigation.

1
For use with: GCSE Science A Route 1 (4405) GCSE Science A Route 2 (4406) Additional Science Route 1 (4408) Additional Science Route 2 (4409)
Biology (4401) Chemistry (4402) Physics (4403) SCA4P AS4P BL4P CH4P PH4P
Centre Number _98765_________ Centre Name __The New Academy___________________
Candidate Name _Jane Thomson__________________ Candidate Number __1235_______
Investigation Title ___Friction_____________________________________________________
ISA Code ___PU2.1x_______________________ The only notes the candidate takes into the Controlled Assessment are to be recorded in the spaces on this sheet. This sheet should be given to the teacher for checking before it is used in Section 1 of the ISA. When Section 1 of the ISA has been completed, this sheet should be retained by the teacher for subsequent use with Section 2. When Section 2 of the ISA has been completed, this sheet should be stapled to it. Declaration I confirm that these are the only notes used in the Controlled Assessment.
Teacher J.Harrison Candidate J Thomson signature
Date: _3/5/11________
Candidate Research Notes Controlled Assessment
This form can be downloaded from Secure Key Materials on e-AQA
To see how AQA complies with the Data Protection Act 1988 please see our Privacy Statement at aqa.org.uk SCIENCE/CN

2
Hypothesis The more weight there is on an object sliding across a surface, the more friction there will be – rough surfaces have small points that dig in. Research sources
The Internet: http://www.virginia.edu/ep/SurfaceScience/friction.html Advanced LEVEL Physics by Abbot
Method(s)
• Put a block on a sloping plank and tilt it til it just starts to slide • Alter the weight on the block • Measure height of plank when it just starts to slide
Equipment
• Plank • Stand and clamp • Ruler • Block • Weights
Risk assessment issues
• Don’t drop the weights on your foot
Context
• Road surfaces Relating the investigation to the context
• Anti skid surfaces at road junctions

Centre Number 9 8 7 6 5 Candidate
Number 1 2 3 5 Surname Thomson Other
Names Jane Notice to Candidate. The work you submit for assessment must be your own. If you copy from someone else or allow another candidate to copy from you, or if you cheat in any other way, you may be disqualified. Candidate Declaration. I have read and understood the Notice to Candidate and can confirm that I have produced the attached work without assistance other than that which is acceptable under the scheme of assessment. Candidate Signature J Thomson Date 1/3/11
General Certificate of Secondary Education
June 20xx
Additional Science / Physics (Specimen) AS4P/PH4P/PU2.x Controlled Assessment ISA PU2.x Friction Section 1
For moderation in May 20xx
You will need: • your Candidate Research notes. • a pencil and a ruler
You may use a calculator.
Time allowed 45 minutes Instructions • Use black ink or black ball-point pen. • Fill in the boxes at the top of this page. • Answer all questions in the spaces provided • Do all rough work in this book. • Cross through any work you do not want to be
marked.
Information • The marks for questions are shown in brackets. • The maximum mark for Section 1 is 20. • The maximum mark for the Controlled
Assessment Unit is 50. • You are reminded of the need for good English
and clear presentation in your answers.
Details of additional assistance (if any). Has the candidate received any help or information from anyone other than the subject teacher(s) in the production of this work? If the answer is yes give the details below or on a separate page. Yes No
Teacher Declaration: I confirm that the candidate’s work was conducted under the conditions laid out by the specification. I have authenticated the candidate’s work and am satisfied that to the best of my knowledge the work produced is solely that of the candidate.
Signature of teacher ………………J.Harrison …………………… Date ……4/3/11………….
As part of AQA’s commitment to assist students, AQA may make your CAU available on a strictly anonymous basis to teachers, examining staff and students in paper form or electronically, through the Internet or other means, for the purpose of indicating a typical mark or for other educational purposes. In the unlikely event that your CAU is made available for the purposes stated above, you may object to this at any time and we will remove the work on reasonable notice. If you have any concerns please contact [email protected]
To see how AQA complies with the Data Protection Act 1988 please see our Privacy Statement at aqa.org.uk
For Teacher’s Use
Section Mark
Section 1 (/20)
Section 2 (/30)
TOTAL (max 50)

2
Do not write outside the
box
1 Write down your hypothesis.
Explain why you made this hypothesis.
Hypothesis……I think that the weight of an object will make a difference to the amount of friction. The heavier an object is, the more friction there will be.
……………………………………………………………………………………………………………..
Explanation…The surface of an object is not entirely smooth. If you could look at it with a microscope you would see lots of tiny sharp points. These dig in to the surface it is sliding on and make the force of friction. If the object is heavier, or if you press down on it, more of the points will be pushed into the other surface……………………………………………………………………………………………
……………………………………………………………………………………………………………..
…………………………………………………………………………………………………………….
……………………………………………………………………………………………………………. (3 marks)
2 Think about the research that you did for your investigation.
Identify two sources that you used for your research.
The Internet: http://www.virginia.edu/ep/SurfaceScience/friction.html Advanced LEVEL Physics by Abbot…………………………………………………………………
Which of these sources was the more useful?
Why was this source better than the other source?
Advanced LEVEL Physics by Abbot because it had a really good section on friction and told me the difference between static and dynamic friction. It also had a method for investigating how to measure static friction.
…….……………………………………………………………………………………………………….
…….……………………………………………………………………………………………………… (3 marks)
3
Turn over
Do not write outside the
box
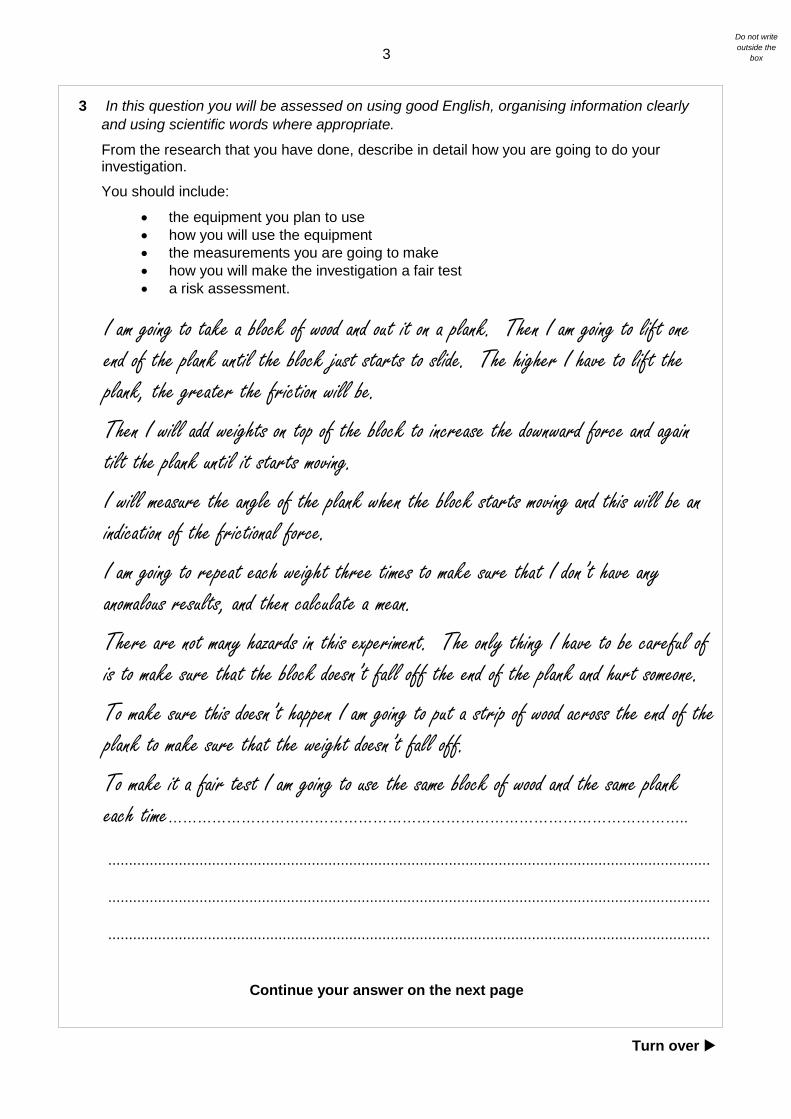
3 In this question you will be assessed on using good English, organising information clearly and using scientific words where appropriate.
From the research that you have done, describe in detail how you are going to do your investigation.
You should include:
• the equipment you plan to use • how you will use the equipment • the measurements you are going to make • how you will make the investigation a fair test • a risk assessment.
I am going to take a block of wood and out it on a plank. Then I am going to lift one end of the plank until the block just starts to slide. The higher I have to lift the plank, the greater the friction will be.
Then I will add weights on top of the block to increase the downward force and again tilt the plank until it starts moving.
I will measure the angle of the plank when the block starts moving and this will be an indication of the frictional force.
I am going to repeat each weight three times to make sure that I don’t have any anomalous results, and then calculate a mean.
There are not many hazards in this experiment. The only thing I have to be careful of is to make sure that the block doesn’t fall off the end of the plank and hurt someone.
To make sure this doesn’t happen I am going to put a strip of wood across the end of the plank to make sure that the weight doesn’t fall off.
To make it a fair test I am going to use the same block of wood and the same plank each time……………………………………………………………………………………………..
.................................................................................................................................................
.................................................................................................................................................
.................................................................................................................................................
Continue your answer on the next page

4
Do not write outside the
box
................................................................................................................................................. ................................................................................................................................................. ................................................................................................................................................. ................................................................................................................................................. ................................................................................................................................................. ................................................................................................................................................. ................................................................................................................................................. ................................................................................................................................................. ................................................................................................................................................. ................................................................................................................................................. ................................................................................................................................................. ................................................................................................................................................. ................................................................................................................................................. ................................................................................................................................................. ................................................................................................................................................. ................................................................................................................................................. ................................................................................................................................................. ................................................................................................................................................. ................................................................................................................................................. ................................................................................................................................................. ................................................................................................................................................. ................................................................................................................................................. .................................................................................................................................................
(9 marks)

5
Turn over
Do not write outside the
box
4 In your research, you will have found other methods that you could have used.
Outline one other method that you could have used.
Explain why you decided not to use this method.
I could have done the experiment by tying a piece of string to the block and passing the string over a pulley. Then hang weights on the other end of the string and keep adding weights until the block started to slide.
I didn’t do this because I thought the pulley might add some friction. ……………….......... …………………………………………………………………………………………………………….. ................................................................................................................................................. …………..……….……………………………………………………………………………………….. ................................................................................................................................................. …….……..……….……………………………………………………………………………………….. …………………………………………………………………………………………………………….. ................................................................................................................................................. …………..……….……………………………………………………………………………………….. ................................................................................................................................................. …….……..……….……………………………………………………………………………………….. …………………………………………………………………………………………………………….. (3 marks)
5 Make sure that you hand in your Candidate Research Notes and your blank table for the results with this paper.
You will be awarded up to two marks for your table.
(2 marks)
END OF QUESTIONS
Copyright 2012 AQA and its licensors. All rights reserved.
___ 20

Centre Number 9 8 7 6 5 Candidate
Number 1 2 3 5 Surname Thomson
Other Names Jane
Notice to Candidate. The work you submit for assessment must be your own. If you copy from someone else or allow another candidate to copy from you, or if you cheat in any other way, you may be disqualified. Candidate Declaration. I have read and understood the Notice to Candidate and can confirm that I have produced the attached work without assistance other than that which is acceptable under the scheme of assessment. Candidate Signature J Thomson Date 4/3/11
General Certificate of Secondary Education
June 20yy
Additional Science / Physics (Specimen) AS4P/PH4P/PU2.X Controlled Assessment ISA PU2.x Friction - Section 2 For moderation in May 20yy
For this paper you must have: • results tables and charts or graphs from your own investigation • your Candidate Research notes • the Secondary Data Sheet • a pencil and ruler You may use a calculator.
Time allowed: 50 minutes Instructions • Use black ink or black ball-point pen. • Fill in the boxes at the top of this page. • Answer all questions in the spaces provided. • Do all rough work in this book. Cross through any work you do not
want to be marked.
Information • The marks for questions are shown in
brackets. • The maximum mark for Section 2 is 30. • The maximum mark for the Controlled
Assessment Unit is 50. • You are reminded of the need for good
English and clear presentation in your answers.
Details of additional assistance (if any). Has the candidate received any help or information from anyone other than the subject teacher(s) in the production of this work? If the answer is yes give the details below or on a separate page. Yes No
Did the candidate take an active part in the practical?
Yes No
Teacher Declaration: I confirm that the candidate’s work was conducted under the conditions laid out by the specification. I have authenticated the candidate’s work and am satisfied that to the best of my knowledge the work produced is solely that of the candidate.
Signature of teacher ……………J.Harrison ………………………………… Date ……5/3/11…………….
As part of AQA’s commitment to assist students, AQA may make your CAU available on a strictly anonymous basis to teachers, examining staff and students in paper form or electronically, through the Internet or other means, for the purpose of indicating a typical mark or for other educational purposes. In the unlikely event that your CAU is made available for the purposes stated above, you may object to this at any time and we will remove the work on reasonable notice. If you have any concerns please contact [email protected].
To see how AQA complies with the Data Protection Act 1988 please see our Privacy Statement at aqa.org.uk.
For Teacher’s Use
Section Mark
Section 2 (/30)

2
1(a) Do your results support the hypothesis you investigated?
You should use any pattern that you can see in your results to support your answer.
You should include examples from your results. Yes they do. The heavier the block, the greater the friction. ................................. My graph shows a pattern, the line is sloping upwards.……………………………….
When the block weighed 11 newtons, the height the plank had to be lifted was only 27 cm, but when I increased the weight to 41 newtons, I had to lift the plank 48 cm. .............................................................................................................................
The higher the end of the plank is lifted, the greater the force it gives to pulling the block down the slope, which means that the force of friction that it had to overcome was greater.…………………………………………………………………… .......
(3 marks)
1(b) Reproducibility is important in experiments.
1(b) (i) Do you think that your results are reproducible by other people?
Use examples from your results to explain the reason for your answer.
I think my results would be reproducible if they used the same block and the same plank that I did.…………………………………………………….
I think this because I repeated the experiment three times for each weight, and all the results were pretty close to each other.…………………………………………..
For example, when the weight of the block was 41 newtons, the three heights were 47, 48 and 49 cm……………………………………………………………………….
(3 marks)
1 (b) (ii) Describe in detail how you could use repeated readings to obtain more accurate results.
If I could use other people’s results as well as mine I would have more to use to calculate the average, and that would mean that any random errors would have less effect. I would make sure that there were no anomalous results in the group, because I would have to get rid of those first before working out the average
……………………………………………………………………………………………………….. (3 marks)

3
1 (c) Did you get any anomalous results?
Explain your answer.
Your explanation should include examples from your results.
Yes, I did get at least one anomalous result. The second try when the weight was 1 newton (just the block on its own) was 25cm, but the first and last tries were 20 and 19 cm. 25 is quite a bit more percentagewise and I think this was probably wrong.
I should have done this one again………..………………………………………………………… ……………………………………………………………………………………………………………
……………………………………………………………………………………………………………
(3 marks)
1 (d) Most experiments contain errors or uncertainties.
What do you think was the cause of the largest error or uncertainty in your investigation?
The biggest error was in judging when the block had started sliding. It could really have been anywhere within a centimetre of what I actually measured………………………
................................................................................................................................................
What you could do to reduce the size of this error if you were to repeat the investigation?
Explain your answer. I don’t think there’s much I could do other than do lots more repeats.……………….. ................................................................................................................................................ ................................................................................................................................................ ................................................................................................................................................ ................................................................................................................................................
(3 marks)

4
2 You have been given a Secondary Data Sheet that provides results from similar investigations.
2 (a) Draw a sketch graph of the results in Case study 1.
The graph should show how the amount of friction varies with the roughness of the surface.
Roughness
(2 marks) 2 (b) A manufacturer of car tyres is investigating how to increase the friction between the tyre
and the road.
The manufacturer’s hypothesis is:
‘The rougher the road surface the greater the friction between the road and the tyre’
2 (b) (i) Look at Case studies 1, 2 and 3
Explain whether or not the results in Case studies 1, 2 and 3 support this hypothesis.
To gain full marks, your explanation should include appropriate examples from Case Studies 1, 2 and 3.
Case Study 1 does support the manufacturer’s hypothesis. This is because the rougher the surface the more force it needs to get it moving.
Case Study 2 also supports the hypothesis because on the smooth concrete surface the graph shows that the car took a lot longer to stop. This means that there must have been less friction than there was on the rough tarmac.
……………………………………………………………………………………………………. ……………………………………………………………………………………………………. …………………………………………………………………………………………………….
(3 marks)
Force
5
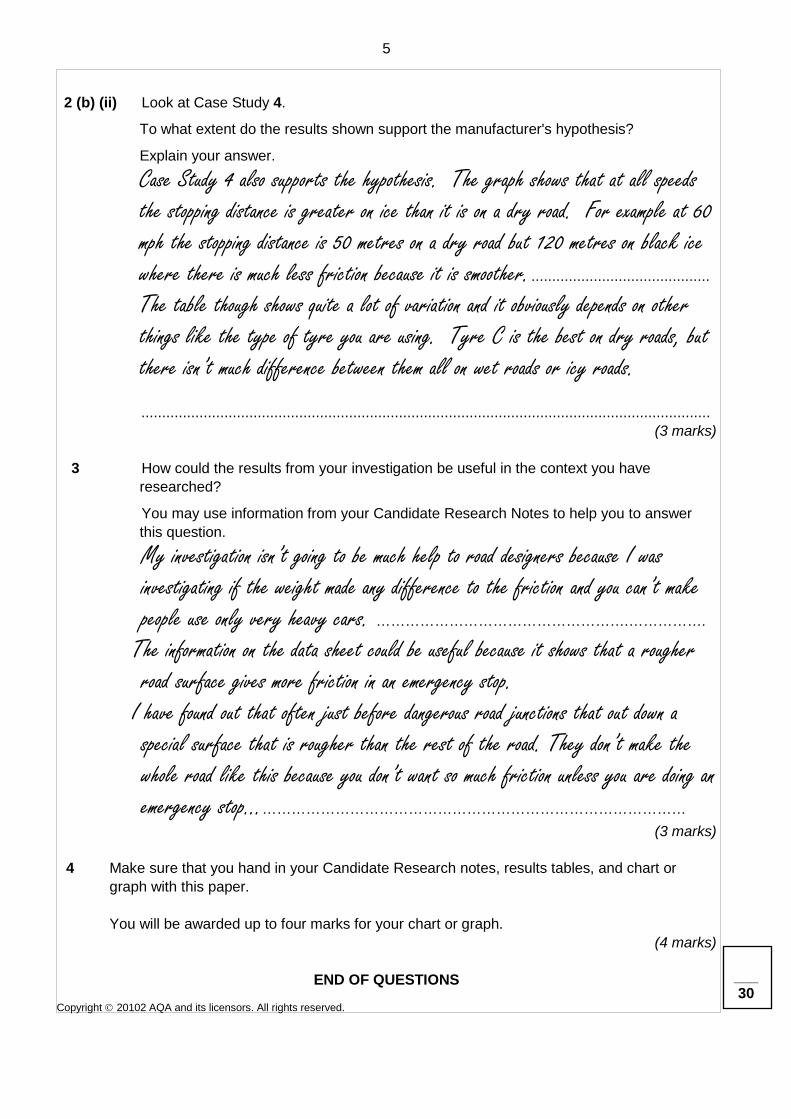
2 (b) (ii) Look at Case Study 4.
To what extent do the results shown support the manufacturer's hypothesis?
Explain your answer.
Case Study 4 also supports the hypothesis. The graph shows that at all speeds the stopping distance is greater on ice than it is on a dry road. For example at 60 mph the stopping distance is 50 metres on a dry road but 120 metres on black ice where there is much less friction because it is smoother. ...........................................
The table though shows quite a lot of variation and it obviously depends on other things like the type of tyre you are using. Tyre C is the best on dry roads, but there isn’t much difference between them all on wet roads or icy roads.
.........................................................................................................................................
(3 marks)
3 How could the results from your investigation be useful in the context you have researched?
You may use information from your Candidate Research Notes to help you to answer this question.
My investigation isn’t going to be much help to road designers because I was investigating if the weight made any difference to the friction and you can’t make people use only very heavy cars. …………………………………………….…………….
The information on the data sheet could be useful because it shows that a rougher road surface gives more friction in an emergency stop.
I have found out that often just before dangerous road junctions that out down a special surface that is rougher than the rest of the road. They don’t make the whole road like this because you don’t want so much friction unless you are doing an emergency stop………………………………………………………………………………
(3 marks)
4 Make sure that you hand in your Candidate Research notes, results tables, and chart or graph with this paper.
You will be awarded up to four marks for your chart or graph.
(4 marks)
END OF QUESTIONS Copyright 20102 AQA and its licensors. All rights reserved.
___ 30

Results table and graph
Weight of block in newtons
Height the plank was raised, in cm
1st try 2nd try 3rd try Mean
1 20 25 19 21
11 25 28 27 27
21 30 32 30 31
31 43 45 39 42
41 47 49 48 48
0
10
20
30
40
50
60
0 10 20 30 40 50Weight of block in newtons
Hei
ght p
lank
was
rais
ed in
cm

Additional Science / Physics
PU2.x Friction
Case Study 1 A student investigated how the roughness of a surface affected friction. The student measured the force needed to make a block start moving on different surfaces.
Here are some of the student’s results. The surfaces are listed in order of roughness.
Roughness of surface Force needed to start block moving in newtons
Glass (least rough) 2 Wood 4 Cloth 6 Sandpaper (most rough) 7
Case Study 2 A local authority is planning to resurface a major road and have asked the Transport and Road Laboratory (TRL) to do some testing for them. The TRL has tested two different types of road surface. For each surface they measured the stopping distance when tyres of different tread depth were used. The tread depth is the depth of the grooves that are cut into the surface of the tyre. The results are shown on the graph below.
Force Block
Surface that is tested
Controlled Assessment Secondary Data Sheet

Case Study 3 The diagram below shows the thinking distances, braking distances and total stopping distances at different speeds.
S p e e d 1 0 m / s
S p e e d 2 0 m / s
S p e e d 3 0 m / s
T h i n k i n g d i s t a n c e
7 m
T h i n k i n g d i s t a n c e 1 4 m
T h i n k i n g d i s t a n c e 2 1 m
B r a k i n g d i s t a n c e
8 m
B r a k i n g d i s t a n c e 3 2 m
B r a k i n g d i s t a n c e 7 2 m
T o t a l s t o p p i n g d i s t a n c e
1 5 m
T o t a l s t o p p i n g d i s t a n c e
4 6 m
T o t a l s t o p p i n g d i s t a n c e
9 3 m
Case Study 4 A tyre manufacturer has produced three new types of tyre. Their scientists tested the tyres by driving them at 90 km/h, then braking hard. When they braked hard, the wheels locked and stopped turning so that the car slid to a halt. They then measured the distance that the car slid. Some of their results are shown in the table below, and some are shown on the graph.
Tyre type Distance of slide in metres
Dry Road Wet Road Icy Road Mean A 100 110 130 113 B 80 120 140 113 C 66 130 140 112

PU2.x Friction - Specimen ISA - Marking Guidelines
1
GCSE Science – Controlled Assessment ISA – Marking Guidelines Additional Science / Physics ISA – PU2.x Friction (Specimen)
For moderation in May 20yy Please mark in red ink, and use one tick for one mark. Each part of each question must show some red ink to indicate that it has been seen. Subtotals for each part of each question should be written in the right-hand margin.
Enter the marks for Section 1 and Section 2 and the total mark on the front cover of the answer booklet for Section 1. Fasten both sections together with the results table(s) and the graphical work and the Candidate’s Research Notes.
The teacher must sign and date the front covers of Section 1 and Section 2 of the ISA.
The papers must be kept in a secure place and must not be returned to the candidates.
These Marking Guidelines are necessarily generic. Additional guidance on how to relate these generic mark schemes to particular investigations is given below the generic section.
Read through the whole of the candidate’s answer and use the Marking Guidelines below to arrive at a ‘best fit’ mark.
SECTION 1
Q. No. 1
0 marks 1 mark 2 marks 3 marks
No creditworthy response
There is a hypothesis that, by implication, identifies the independent and dependent variables:
There is a hypothesis that, by implication, identifies the independent and dependent variables:
There is a hypothesis that, by implication, identifies the independent and dependent variables.
but there is no explanation. however, the explanation for this hypothesis is unclear.
The hypothesis is explained clearly.
Additional Guidance
An example of a hypothesis could be: “I think that if I change the type of surface, the friction will change.”
An example of an unclear explanation could be: “I think this because smooth surfaces are more slippery.”
An example of a clear explanation could be: “I found an example in a book showing where rough surfaces have to be polished as smooth as possible to reduce friction.”

PU2.x Friction - Specimen ISA - Marking Guidelines
2
SECTION 1
Q. No. 2
0 marks 1 mark 2 marks 3 marks
No creditworthy response
Two relevant sources are clearly identified
or
Two relevant sources are clearly identified.
Two relevant sources are clearly identified.
one relevant source is identified and the usefulness of the source commented on.
The usefulness of one of the sources is commented on.
The usefulness of both sources is explained and a comparison made.
Additional Guidance
An identified source is referred to by title and author or for websites at least the name of the web site should be quoted.
Any identified source should be capable of being accessed by the moderator.
A clear comment on only one of the sources may be sufficient to gain 3 marks if the answer implies a comment on the other source.
If candidates have taken part in peer discussion as part of their research, simply stating this is not sufficient to qualify for quoting a source. Similarly, reference to their own notes or exercise book alone is insufficient.
PU2.x Friction - Specimen ISA - Marking Guidelines
3
SECTION 1
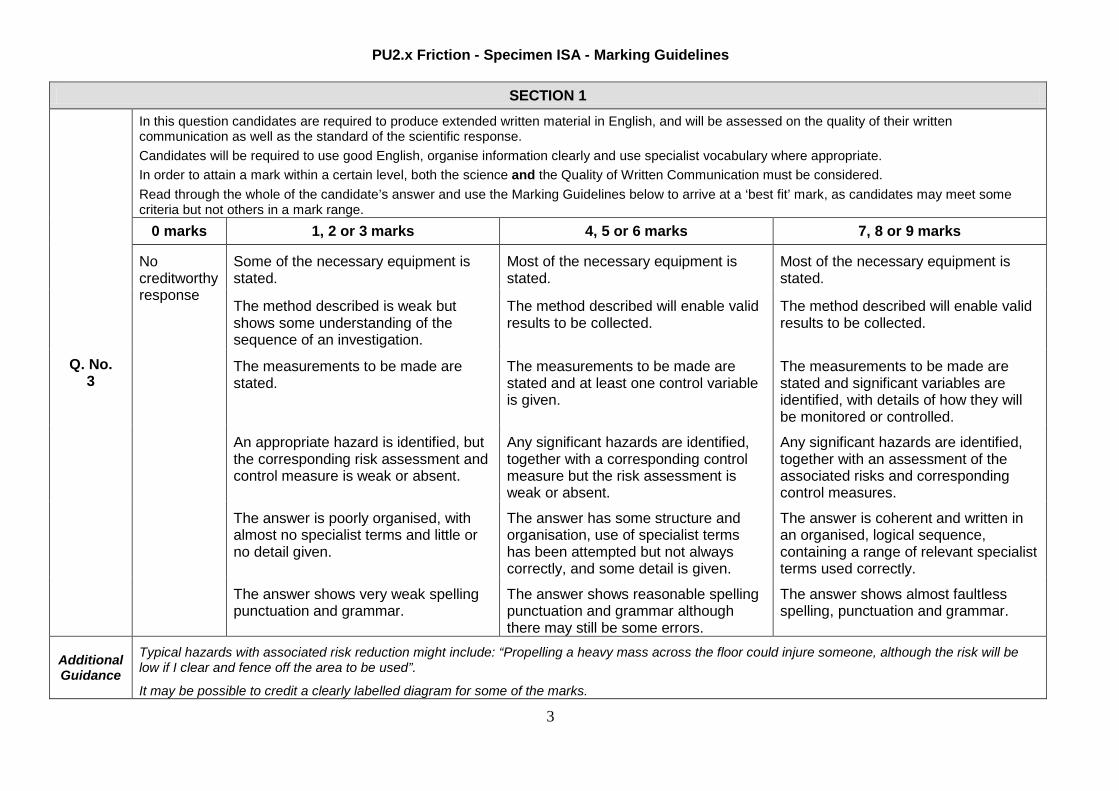
Q. No. 3
In this question candidates are required to produce extended written material in English, and will be assessed on the quality of their written communication as well as the standard of the scientific response. Candidates will be required to use good English, organise information clearly and use specialist vocabulary where appropriate. In order to attain a mark within a certain level, both the science and the Quality of Written Communication must be considered. Read through the whole of the candidate’s answer and use the Marking Guidelines below to arrive at a ‘best fit’ mark, as candidates may meet some criteria but not others in a mark range.
0 marks 1, 2 or 3 marks 4, 5 or 6 marks 7, 8 or 9 marks
No creditworthy response
Some of the necessary equipment is stated.
Most of the necessary equipment is stated.
Most of the necessary equipment is stated.
The method described is weak but shows some understanding of the sequence of an investigation.
The method described will enable valid results to be collected.
The method described will enable valid results to be collected.
The measurements to be made are stated.
The measurements to be made are stated and at least one control variable is given.
The measurements to be made are stated and significant variables are identified, with details of how they will be monitored or controlled.
An appropriate hazard is identified, but the corresponding risk assessment and control measure is weak or absent.
Any significant hazards are identified, together with a corresponding control measure but the risk assessment is weak or absent.
Any significant hazards are identified, together with an assessment of the associated risks and corresponding control measures.
The answer is poorly organised, with almost no specialist terms and little or no detail given.
The answer has some structure and organisation, use of specialist terms has been attempted but not always correctly, and some detail is given.
The answer is coherent and written in an organised, logical sequence, containing a range of relevant specialist terms used correctly.
The answer shows very weak spelling punctuation and grammar.
The answer shows reasonable spelling punctuation and grammar although there may still be some errors.
The answer shows almost faultless spelling, punctuation and grammar.
Additional Guidance
Typical hazards with associated risk reduction might include: “Propelling a heavy mass across the floor could injure someone, although the risk will be low if I clear and fence off the area to be used”.
It may be possible to credit a clearly labelled diagram for some of the marks.
PU2.x Friction - Specimen ISA - Marking Guidelines
4
SECTION 1
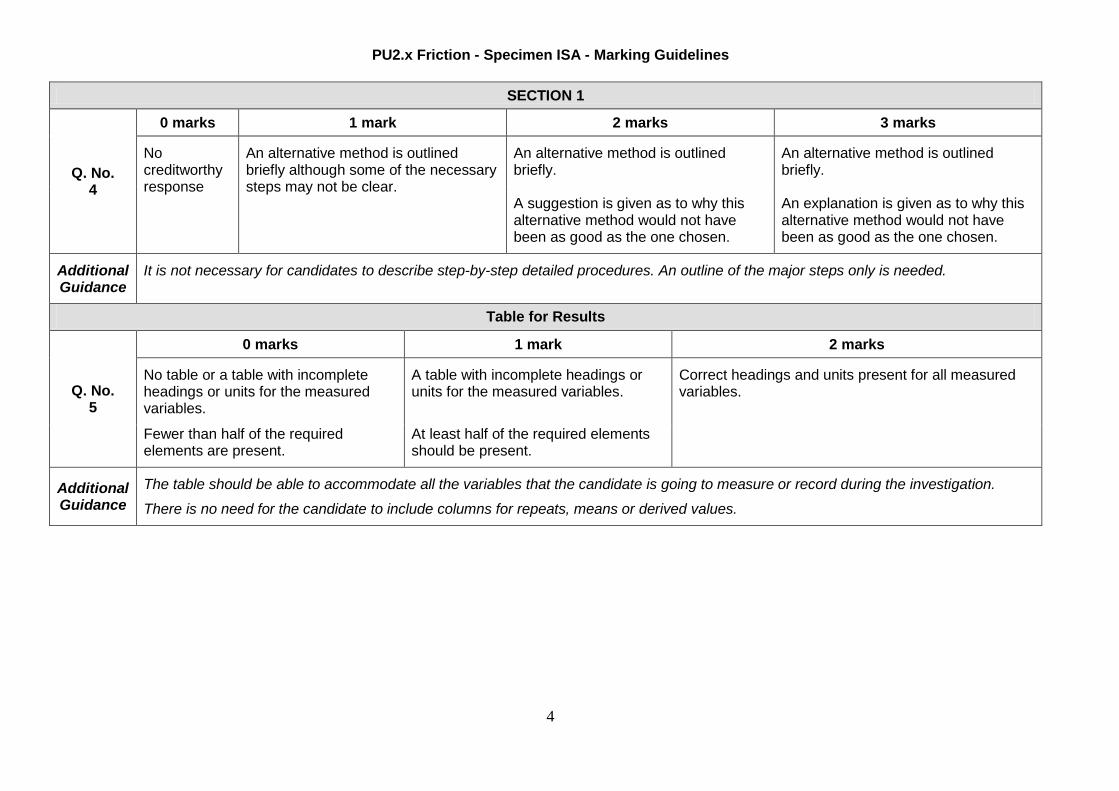
Q. No. 4
0 marks 1 mark 2 marks 3 marks
No creditworthy response
An alternative method is outlined briefly although some of the necessary steps may not be clear.
An alternative method is outlined briefly.
An alternative method is outlined briefly.
A suggestion is given as to why this alternative method would not have been as good as the one chosen.
An explanation is given as to why this alternative method would not have been as good as the one chosen.
Additional Guidance
It is not necessary for candidates to describe step-by-step detailed procedures. An outline of the major steps only is needed.
Table for Results
Q. No. 5
0 marks 1 mark 2 marks
No table or a table with incomplete headings or units for the measured variables.
A table with incomplete headings or units for the measured variables.
Correct headings and units present for all measured variables.
Fewer than half of the required elements are present.
At least half of the required elements should be present.
Additional Guidance
The table should be able to accommodate all the variables that the candidate is going to measure or record during the investigation.
There is no need for the candidate to include columns for repeats, means or derived values.

PU2.x Friction - Specimen ISA - Marking Guidelines
5
SECTION 2
Q. No. 1 (a)
0 marks 1 mark 2 marks 3 marks
No creditworthy response
A valid statement is made about whether or not the results support the hypothesis.
A valid statement is made about whether or not the results support the hypothesis.
The answer includes either a reference to a pattern or some examples from the results.
A valid statement is made about whether or not the results support the hypothesis,
The answer includes a reference to a pattern and some examples from the results.
Additional Guidance
The candidate’s statement(s) must match the candidate’s own results.
An example of a pattern might be “The rougher the surface the shorter the distance the tub went”.
An example of results quoted in support might be ‘”When the surface was sandpaper, the tub only went 10cm but when the surface was plastic it went 150 cm”.
Q. No. 1 (b)(i)
0 marks 1 mark 2 marks 3 marks
No creditworthy response
A statement is made as to whether or not the results are likely to be reproducible, with a reason stated.
A statement is made as to whether or not the results are likely to be reproducible, with a reason stated
A statement is made as to whether or not the results are likely to be reproducible, with a reason stated
and an explanation is given. and an explanation is given.
There is a detailed explanation supported by at least one example from the results .
Additional Guidance The reason is likely to involve the difficulty of maintaining control variables
PU2.x Friction - Specimen ISA - Marking Guidelines
6
SECTION 2
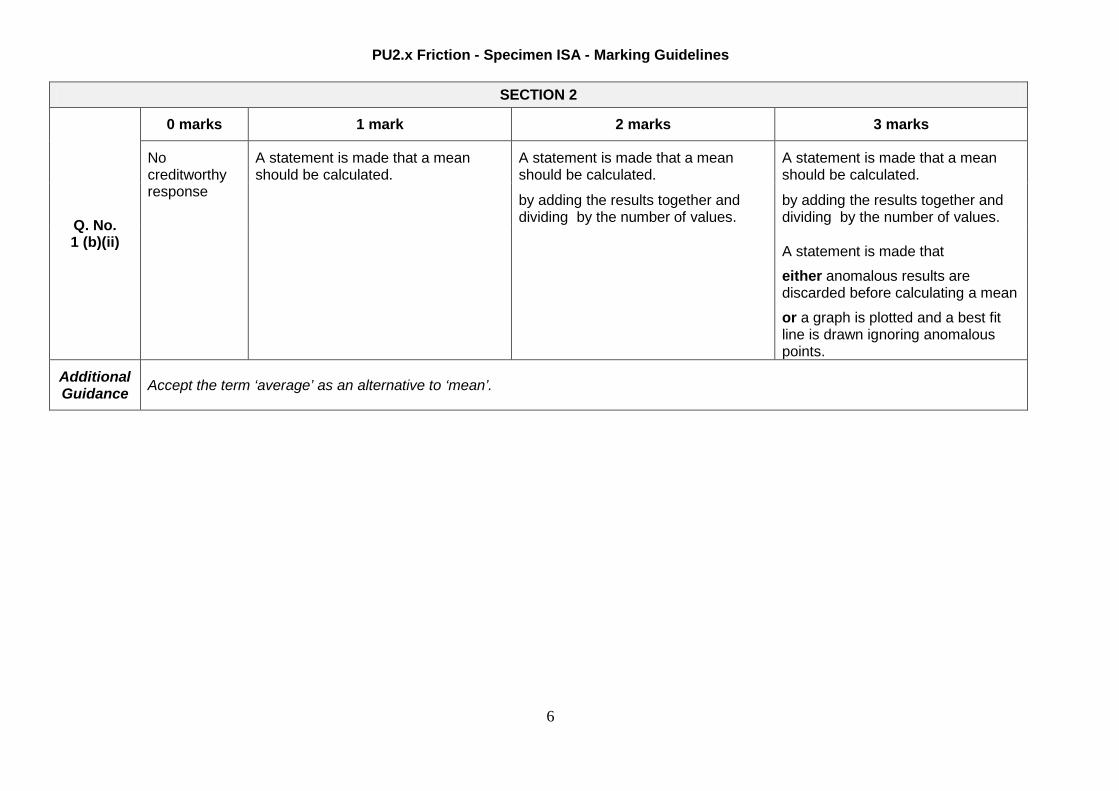
Q. No. 1 (b)(ii)
0 marks 1 mark 2 marks 3 marks
No creditworthy response
A statement is made that a mean should be calculated.
A statement is made that a mean should be calculated.
A statement is made that a mean should be calculated.
by adding the results together and dividing by the number of values.
by adding the results together and dividing by the number of values.
A statement is made that
either anomalous results are discarded before calculating a mean
or a graph is plotted and a best fit line is drawn ignoring anomalous points.
Additional Guidance Accept the term ‘average’ as an alternative to ‘mean’.

PU2.x Friction - Specimen ISA - Marking Guidelines
7
SECTION 2
Q. No. 1 (c)
0 marks 1 mark 2 marks 3 marks
No creditworthy response
There is a correct statement as to whether or not there are any anomalous results.
There is a correct statement as to whether or not there are any anomalous results
There is a correct statement as to whether or not there are any anomalous results
and a statement or implication that anomalous results are ones that do not fit the pattern.
and a statement or implication that anomalous results are ones that do not fit the pattern.
Some examples from the results are given to support this, eg by specifying results that are considered to be anomalous or by referring to the fact that, eg all results are very close to a line of best fit.
Additional Guidance
N.B. The candidate's response must match the candidate's own results.

PU2.x Friction - Specimen ISA - Marking Guidelines
8
Q. No. 1 (d)
0 marks 1 mark 2 marks 3 marks
No creditworthy response.
There is a statement as to the possible cause of the largest error.
There is a statement as to the possible cause of the largest error.
There is a statement as to the possible cause of the largest error.
An appropriate suggestion is made regarding how the size of this error might be reduced.
An appropriate suggestion is made regarding how the size of this error might be reduced.
together with an explanation regarding how the suggestion might lead to a reduction in the size of the error.
Additional Guidance
The most likely source of error if the investigation involves catapulting an object across the floor will be to do with the amount of energy given to the object, e.g. how far the catapult is pulled back each time.

PU2.x Friction - Specimen ISA - Marking Guidelines
9
SECTION 2
Q. No. 2 (a)
0 marks 1 mark 2 marks
No creditworthy response
Both axes labelled with the variables (ignore any units given).
Both axes labelled with the variables (ignore any units given).
and an appropriate line drawn.
Additional Guidance
Accept axes drawn either way round (i.e. it doesn't matter which axis the roughness is on)
The line should slope from bottom left to top right
No values need to be shown on either axis, and the line may intercept either axis.
Q. No. 2 (b) (i)
0 marks 1 mark 2 marks 3 marks
No creditworthy response
A simple correct statement is made about at least two of the Case Studies 1, 2 and 3, as to whether or not they support the hypothesis.
Correct statements are made Case Studies 1, 2 and 3, supported by a more detailed explanation of one of them.
Correct statements are made Case Studies 1, 2 and 3, supported by a more detailed explanation of both Case Studies 2 and 3.
Additional Guidance
An example of a clear statement for Case Study 1 is “The greater roughness of the surface, the greater the force or friction”.
A more detailed explanation for Case Study 2 could be that the car stops in a shorter distance on a rougher surface. A comment on the relevance might refer to the tread depth as being another independent variable.
A more detailed explanation for Case Study 3 could include reference to the fact that the roughness of the surface is not specified.

PU2.x Friction - Specimen ISA - Marking Guidelines
10
SECTION 2
Q. No. 2 (b) (ii)
0 marks 1 mark 2 marks 3 marks
No
There is a simple statement saying whether or not the results in Case study 4 support the manufacturer's hypothesis and this is supported by some qualitative information quoted.
There is a simple statement saying whether or not the results in Case study 4 support the manufacturer's hypothesis and this is supported by some quantitative information quoted.
There is a simple statement saying whether or not the results in Case study 4 support the manufacturer's hypothesis and this is supported by some quantitative information quoted.
There is also a statement that makes clear the limitations of the data in supporting the hypothesis
Additional Guidance
There are no marks for simply stating whether or not the results support the hypothesis, the marks are for the explanation.
A simple statement might be that it supports the hypothesis because on a dry (rough) surface, the car stops quicker.
A more detailed statement might be that the graph shows that at 80 mph the stopping distance has doubled from 100 metres to 200 metres.
Further information about the limitations might include the stopping distance depends on other things as well as the roughness, eg the speed or the type of tyre
Q. No. 3
0 marks 1 mark 2 marks 3 marks
No creditworthy response
Results from the investigation or an idea from the research has been related to the context.
Results from the investigation or an idea from the research has been related to the context.
Results from the investigation or an idea from the research has been related to the context.
There is a simple explanation of how this idea can be applied and used in the given context.
There is a detailed explanation of how this idea can be applied in the given context.
Additional Guidance
An idea from the research could be how manufacturers of anti-skid surfaces on roads could find the best material to use.
A simple explanation could be “The manufacturer should factor in the speed at which the car is likely to be travelling.”
A detailed explanation could be “Testing repeatedly to ensure repeatable results.”

PU2.x Friction - Specimen ISA - Marking Guidelines
11
Graph or chart
Q. No. 4
Answer Additional Guidance Mark
X axis: suitable scales chosen and labelled with quantity and units.
Scale should be such that the plots occupy at least one third of each axis.
Accept axes reversed.
It may not always be necessary to show the origin.
1
Y axis: suitable scales chosen and labelled with quantity and units. 1
Points or bars plotted correctly to within ± 1 mm. Allow one plotting error out of each 5 points/bars plotted. 1
Suitable line drawn on graph or bars correctly labelled on bar chart.
Allow error carried forward from incorrect points. If wrong type of graph / chart, maximum 3 marks. If the independent variable is:
• categoric, should draw a bar chart • continuous, should draw a best fit line
N.B. If no line possible because there is no correlation, candidates should state this on the graph to gain the mark
1