Embed Size (px)
Citation preview
Semiconductors, Vol. 37, No. 7, 2003, pp. 861–865. Translated from Fizika i Tekhnika Poluprovodnikov, Vol. 37, No. 7, 2003, pp. 890–895.Original Russian Text Copyright © 2003 by Cherkashin, Maksimov, Makarov, Shchukin, Ustinov, Lukovskaya, Musikhin, Cirlin, Bert, Alferov, Ledentsov, Bimberg.
LOW-DIMENSIONALSYSTEMS
Control over the Parameters of InAs–GaAs Quantum Dot Arrays in the Stranski–Krastanow Growth Mode
N. A. Cherkashin*, M. V. Maksimov*, A. G. Makarov*, V. A. Shchukin*, V. M. Ustinov*, N. V. Lukovskaya*, Yu. G. Musikhin*, G. E. Cirlin*, N. A. Bert*, Zh. I. Alferov*,
N. N. Ledentsov**, and D. Bimberg***Ioffe Physicotechnical Institute, Russian Academy of Sciences, St. Petersburg, 194021 Russia
e-mail: [email protected]**Technicshe Universität Berlin, Berlin, D-10623 Germany
Submitted October 22, 2002; accepted for publication October 28, 2002
Abstract—The effect of the growth temperature on the density, lateral size, and height of InAs–GaAs quantumdots (QD) has been studied by transmission electron microscopy. With the growth temperature increasing from450 to 520°C, the density and height of QDs decrease, whereas their lateral size increases; i.e., the QDs areflattened. The blue shift of the photoluminescence line indicates decreasing QD volume. The observed behavioris in agreement with the thermodynamic model of QD formation. The effect of lowering the substrate temper-ature immediately after the formation of QDs on the QD parameters has been studied. On lowering the temper-ature, the lateral size of QDs decreases and their density increases; i.e., the parameters of QD arrays tend toacquire the equilibrium parameters corresponding at the temperature to which the cooling is done. The QDheight rapidly increases with cooling and may exceed the equilibrium value for a finite time of cooling, whichenables fabrication of QD arrays with a prescribed ratio between height and lateral size by choosing the timeof cooling. © 2003 MAIK “Nauka/Interperiodica”.
1. INTRODUCTION
The prevalence of structures with unidimensionallocalization of carriers, i.e., quantum wells (QW), inmodern semiconductor electronics is largely connectedwith the simplicity of their 2D bandgap engineering,which allows varying the width and composition ofQWs and the bandgap of a matrix. Quantum-cascadelasers—very complex devices demanding a strictlydefined band structure—have been proposed anddesigned. As further progress in semiconductor elec-tronics will be associated with the wide application ofstructures with 3D localization of carriers, i.e., quan-tum dots (QD), the development of the bandgap engi-neering for these structures is an important fundamen-tal and applied problem.
A recent breakthrough in the technology, physics,and device applications of QDs is associated with theuse of self-organization processes in the course of epi-taxial growth. It was shown experimentally and in the-ory that an array of elastically strained islands orderedin shape and size can be formed on the surface duringthe heteroepitaxial growth of strained layers [1]. Cur-rently, the InAs-GaAs system, in which QDs areformed via Stranski–Krastanow growth mechanism, isthe best studied and the most important for deviceapplications. In spite of the fact that the self-orderingrepresents a decisive factor which enables the use ofQDs as an active region in semiconductor devices, thiseffect imposes serious limitations on the possibility to
1063-7826/03/3707- $24.00 © 20861
control the shape and size of islands and, correspond-ingly, their band diagram. To overcome these limita-tions, a variety of techniques have been proposed, suchas the formation of vertically-coupled QDs [2], the dep-osition of an initial layer of stressors [3], and the acti-vated decomposition of a solid solution [4]. These tech-nological approaches allowed for substantial progressin controlling the parameters of QD arrays. It is neces-sary to note that in all of the above-listed methods alayer of initial dots is formed at the first stage and sub-sequent growth is determined by the elastic fieldinduced by this layer. Thus, control over the shape, size,and density of QDs in the Stranski–Krastanow growthmode can offer additional versatility in the applicationof more sophisticated technologies. In the presentstudy, we have investigated the impact of temperatureconditions on the height, lateral size, and density ofInAs–GaAs QD arrays, and demonstrated that chang-ing the temperature after the deposition of QDs allowsthe tuning of their parameters to be controlled.
2. EXPERIMENT
The structures were MBE-grown on semi-insulating(100)GaAs substrates. After removing the oxide fromthe substrate, a GaAs buffer layer was grown at the sub-strate temperature Ts = 600°C. To prevent the diffusionof nonequilibrium carriers into the substrate, a six-period GaAs/Al0.25Ga0.75As (20 Å/20 Å) superlatticewas grown on the buffer-layer surface. Further, a
003 MAIK “Nauka/Interperiodica”
862
CHERKASHIN
et al
.
0.1 µm-thick GaAs layer was grown, and then the sub-strate was cooled to the temperature of the QD deposi-tion. Next, three InAs monolayers (ML) were depositedat temperatures of 520, 500, 470, 450, or 420°C. Theformation of islands began at approximately 1.7 MLInAs. The formed QD layer was overgrown with a100-Å-thick GaAs layer at the temperature of InAs dep-osition after a 10-s-interruption of growth. The 10-sinterruption was necessary to improve the size unifor-mity of the island arrays [5]. Further, the substrate tem-perature was raised to Ts = 600°C, and a 400-Å-thick
3
1420
N, 1010 cm–2
Ts, °C
10
460440 480 500 520
987654
2520–420°C
470–420°C 500–450°C
(c)
1
3
h, nm11
9
8
7
6
5
4
520–420°C
470–420°C500–450°C
(b)
1
10
12
l, nm
24
22
20
18
16
14
520–420°C
470–420°C
500–450°C
(a)
1
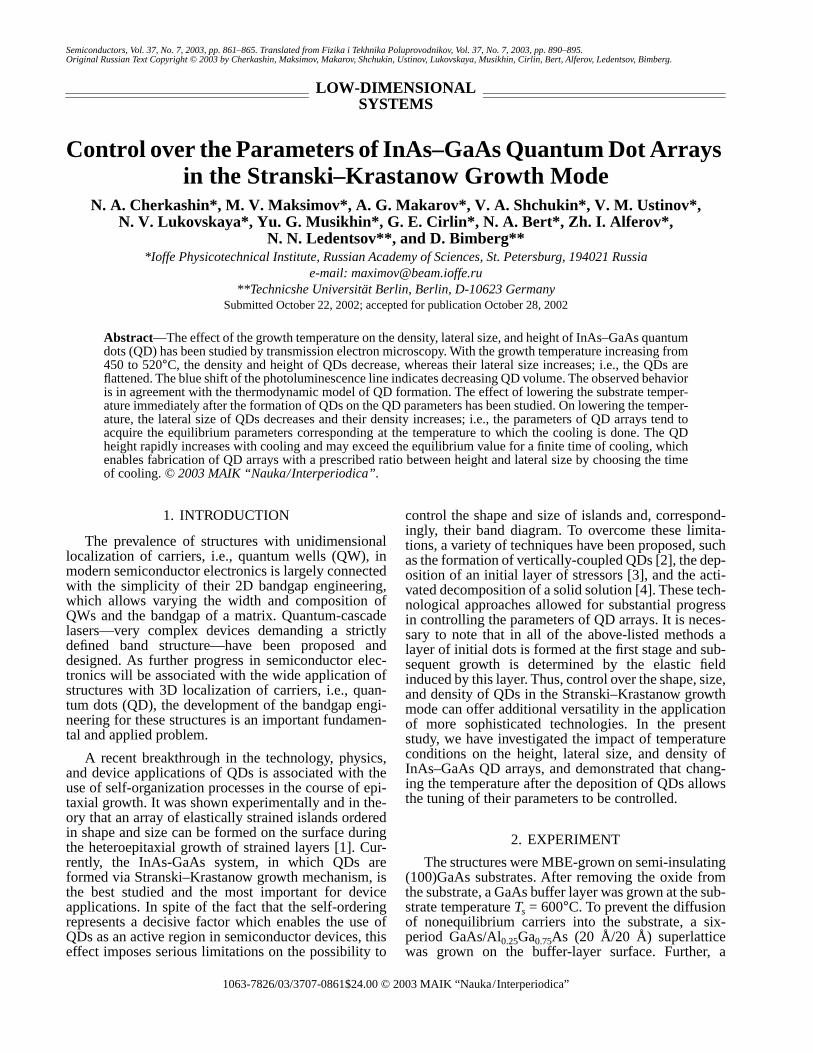
Fig. 1. Average (a) lateral size l, (b) height h, and (c) densityN of QDs vs. the substrate temperature Ts. (1) Structuresgrown at fixed Ts; for structures grown with Ts loweredimmediately after QD deposition, the growth temperaturesand the final temperature of cooling are indicated.
GaAs layer, a superlattice similar to the lower one, anda capping GaAs layer were grown in series. Anotherbatch of samples was grown with the substrate temper-ature lowered after the deposition of QDs. In the modesused, the substrate was cooled for 120 s: from 520 to420, 500 to 450, or 470 to 420°C. The QDs were over-grown with a GaAs layer at the final temperature.
The PL was excited by an argon-ion laser (λ =514.5 nm, the excitation density 500 W cm–2) andrecorded using an MDR-23 monochromator and aNorth Coast E0/817R Ge p–i–n photodiode. A PhilipsEM 420 microscope with 100 kV acceleration voltagewas used for transmission electron microscopy (TEM).The samples in planar (001) and transverse (110) and(010) configuration were prepared by standard thinningtechnology, i.e., grinding, polishing, and final sputter-ing of the material with Ar+ ions at grazing angles to thesample surface.
3. THE EFFECT OF GROWTH TEMPERATURE ON THE PARAMETERS OF QD ARRAYS
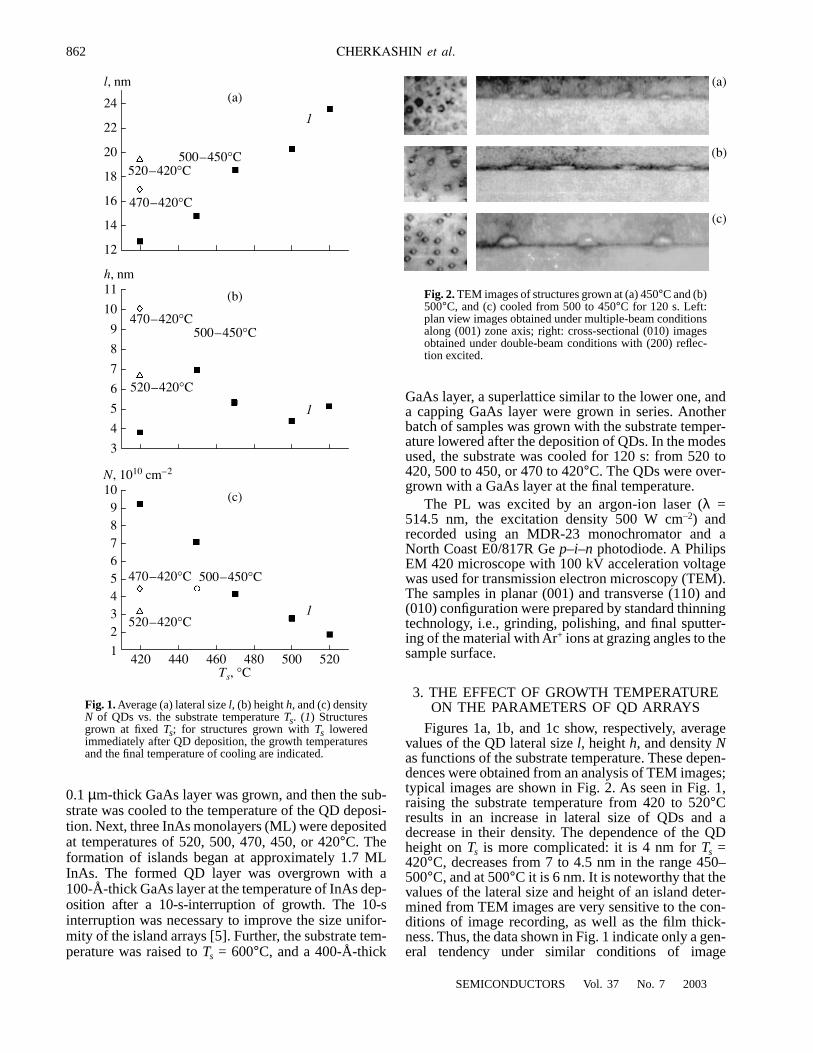
Figures 1a, 1b, and 1c show, respectively, averagevalues of the QD lateral size l, height h, and density Nas functions of the substrate temperature. These depen-dences were obtained from an analysis of TEM images;typical images are shown in Fig. 2. As seen in Fig. 1,raising the substrate temperature from 420 to 520°Cresults in an increase in lateral size of QDs and adecrease in their density. The dependence of the QDheight on Ts is more complicated: it is 4 nm for Ts =420°C, decreases from 7 to 4.5 nm in the range 450–500°C, and at 500°C it is 6 nm. It is noteworthy that thevalues of the lateral size and height of an island deter-mined from TEM images are very sensitive to the con-ditions of image recording, as well as the film thick-ness. Thus, the data shown in Fig. 1 indicate only a gen-eral tendency under similar conditions of image
(a)
(b)
(c)
Fig. 2. TEM images of structures grown at (a) 450°C and (b)500°C, and (c) cooled from 500 to 450°C for 120 s. Left:plan view images obtained under multiple-beam conditionsalong (001) zone axis; right: cross-sectional (010) imagesobtained under double-beam conditions with (200) reflec-tion excited.
SEMICONDUCTORS Vol. 37 No. 7 2003
CONTROL OVER THE PARAMETERS OF InAs–GaAs QUANTUM DOT ARRAYS 863
recording. It should also be noted that the density andaverage lateral size were estimated based on the analy-sis of planar images containing several hundred QDs,whereas the height was determined from several cross-sectional images with the number of QDs an order ofmagnitude smaller. Therefore, the density and lateralsize were determined with higher precision than theheight.
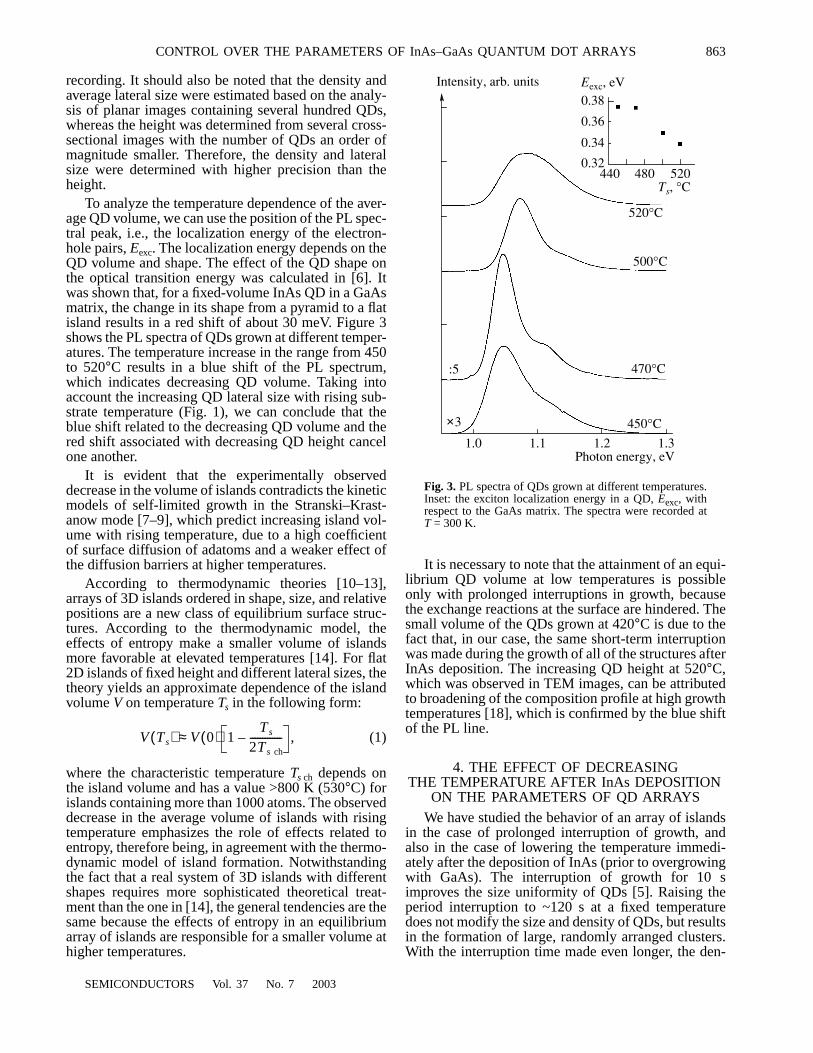
To analyze the temperature dependence of the aver-age QD volume, we can use the position of the PL spec-tral peak, i.e., the localization energy of the electron-hole pairs, Eexc. The localization energy depends on theQD volume and shape. The effect of the QD shape onthe optical transition energy was calculated in [6]. Itwas shown that, for a fixed-volume InAs QD in a GaAsmatrix, the change in its shape from a pyramid to a flatisland results in a red shift of about 30 meV. Figure 3shows the PL spectra of QDs grown at different temper-atures. The temperature increase in the range from 450to 520°C results in a blue shift of the PL spectrum,which indicates decreasing QD volume. Taking intoaccount the increasing QD lateral size with rising sub-strate temperature (Fig. 1), we can conclude that theblue shift related to the decreasing QD volume and thered shift associated with decreasing QD height cancelone another.
It is evident that the experimentally observeddecrease in the volume of islands contradicts the kineticmodels of self-limited growth in the Stranski–Krast-anow mode [7–9], which predict increasing island vol-ume with rising temperature, due to a high coefficientof surface diffusion of adatoms and a weaker effect ofthe diffusion barriers at higher temperatures.
According to thermodynamic theories [10–13],arrays of 3D islands ordered in shape, size, and relativepositions are a new class of equilibrium surface struc-tures. According to the thermodynamic model, theeffects of entropy make a smaller volume of islandsmore favorable at elevated temperatures [14]. For flat2D islands of fixed height and different lateral sizes, thetheory yields an approximate dependence of the islandvolume V on temperature Ts in the following form:
(1)
where the characteristic temperature Ts ch depends onthe island volume and has a value >800 K (530°C) forislands containing more than 1000 atoms. The observeddecrease in the average volume of islands with risingtemperature emphasizes the role of effects related toentropy, therefore being, in agreement with the thermo-dynamic model of island formation. Notwithstandingthe fact that a real system of 3D islands with differentshapes requires more sophisticated theoretical treat-ment than the one in [14], the general tendencies are thesame because the effects of entropy in an equilibriumarray of islands are responsible for a smaller volume athigher temperatures.
V Ts( ) V 0( ) 1Ts
2Ts ch-------------– ,≈
SEMICONDUCTORS Vol. 37 No. 7 2003
It is necessary to note that the attainment of an equi-librium QD volume at low temperatures is possibleonly with prolonged interruptions in growth, becausethe exchange reactions at the surface are hindered. Thesmall volume of the QDs grown at 420°C is due to thefact that, in our case, the same short-term interruptionwas made during the growth of all of the structures afterInAs deposition. The increasing QD height at 520°C,which was observed in TEM images, can be attributedto broadening of the composition profile at high growthtemperatures [18], which is confirmed by the blue shiftof the PL line.
4. THE EFFECT OF DECREASINGTHE TEMPERATURE AFTER InAs DEPOSITION
ON THE PARAMETERS OF QD ARRAYS
We have studied the behavior of an array of islandsin the case of prolonged interruption of growth, andalso in the case of lowering the temperature immedi-ately after the deposition of InAs (prior to overgrowingwith GaAs). The interruption of growth for 10 simproves the size uniformity of QDs [5]. Raising theperiod interruption to ~120 s at a fixed temperaturedoes not modify the size and density of QDs, but resultsin the formation of large, randomly arranged clusters.With the interruption time made even longer, the den-
1.0
Intensity, arb. units
Photon energy, eV1.1
0.34
440 480
Eexc, eV
Ts, °C
0.38
520
520°C
500°C
470°C
450°C
0.36
0.32
1.2 1.3
:5
×3
Fig. 3. PL spectra of QDs grown at different temperatures.Inset: the exciton localization energy in a QD, Eexc, withrespect to the GaAs matrix. The spectra were recorded atT = 300 K.
864
CHERKASHIN
et al
.
sity of large islands increases and that of coherentislands decreases [14, 5]. This effect can be accountedfor as follows: according to the thermodynamic model,there exists a probabilistic size distribution of QDs.Though the probability of formation of large dots islow, a certain number of these exists on the surface. Ifthe volume of an island exceeds some critical value,dislocations can develop within it. Such islands can beformed also due to nonideality of the substrate, i.e., thepresence of defects and dislocations. The islands withdislocations attract In from small coherent islandslocated nearby. It is interesting to note that, even uponprolonged interruptions of growth, the size and shape ofcoherent QDs undergo only small changes, and noislands of intermediate size are observed. Thus, despitethe fact that the applicability of the thermodynamicapproach is, strictly speaking, limited by the presenceof islands with dislocations, it appears to be valid forthe subsystem of coherent QDs in this case as well.
Now we will discuss the effect of lowering the tem-perature after QD formation on the density, lateral size,and height of QDs. As seen from Figs. 1 and 2, coolinginduces a decrease in the lateral size of QDs and a signif-icant rise in their density. These trends are in qualitativeagreement with the thermodynamic model, because, onlowering the temperature from to , the parame-ters of an array of islands tend towards the values cor-responding to . Owing to the finite time of cooling,the lateral size and density of dots do not have enoughtime to reach their equilibrium values corresponding tothe final temperature. It is noteworthy that the averageheights of QDs in structures grown with cooling signif-
Ts1Ts2
Ts2
0.9
Intensity, arb. units
Photon energy, eV
InAsGaAs
GaAs
GaAs
GaAs
InAs
InAs
In In In InInxGa1–xAs
1.0 1.1 1.2 1.3
485–430°C
485°C
a
b
c
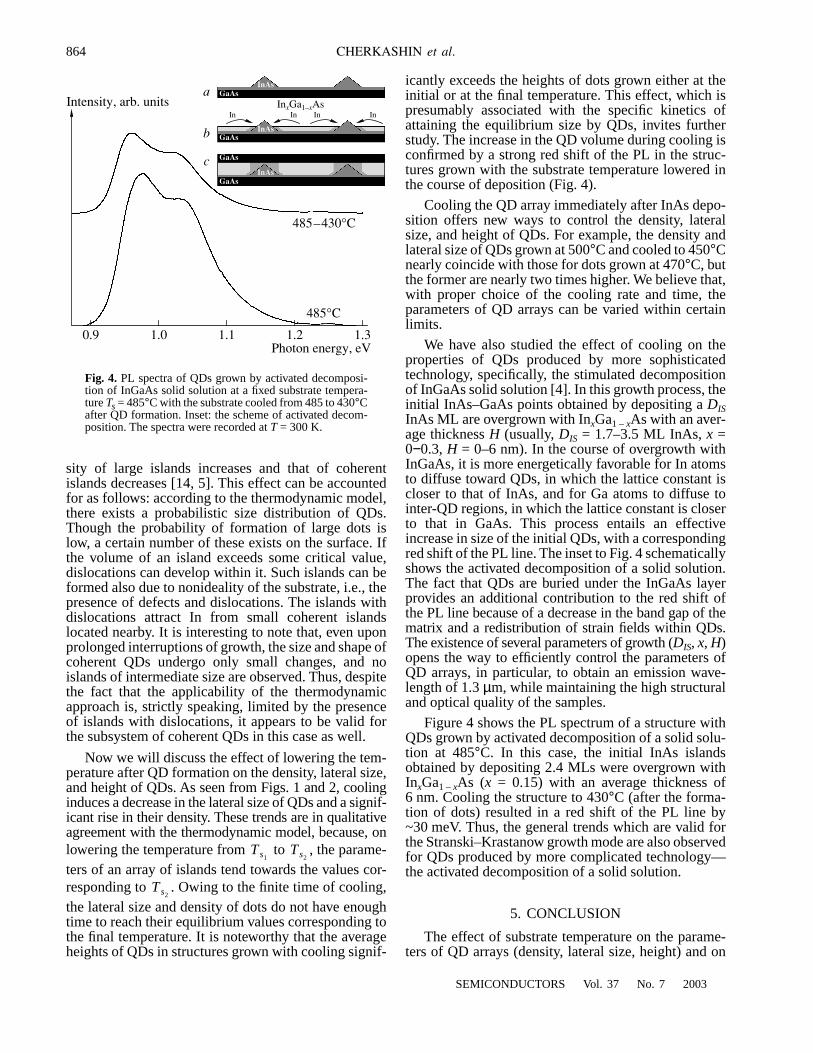
Fig. 4. PL spectra of QDs grown by activated decomposi-tion of InGaAs solid solution at a fixed substrate tempera-ture Ts = 485°C with the substrate cooled from 485 to 430°Cafter QD formation. Inset: the scheme of activated decom-position. The spectra were recorded at T = 300 K.
icantly exceeds the heights of dots grown either at theinitial or at the final temperature. This effect, which ispresumably associated with the specific kinetics ofattaining the equilibrium size by QDs, invites furtherstudy. The increase in the QD volume during cooling isconfirmed by a strong red shift of the PL in the struc-tures grown with the substrate temperature lowered inthe course of deposition (Fig. 4).
Cooling the QD array immediately after InAs depo-sition offers new ways to control the density, lateralsize, and height of QDs. For example, the density andlateral size of QDs grown at 500°C and cooled to 450°Cnearly coincide with those for dots grown at 470°C, butthe former are nearly two times higher. We believe that,with proper choice of the cooling rate and time, theparameters of QD arrays can be varied within certainlimits.
We have also studied the effect of cooling on theproperties of QDs produced by more sophisticatedtechnology, specifically, the stimulated decompositionof InGaAs solid solution [4]. In this growth process, theinitial InAs–GaAs points obtained by depositing a DISInAs ML are overgrown with InxGa1 – xAs with an aver-age thickness H (usually, DIS = 1.7–3.5 ML InAs, x =0−0.3, H = 0–6 nm). In the course of overgrowth withInGaAs, it is more energetically favorable for In atomsto diffuse toward QDs, in which the lattice constant iscloser to that of InAs, and for Ga atoms to diffuse tointer-QD regions, in which the lattice constant is closerto that in GaAs. This process entails an effectiveincrease in size of the initial QDs, with a correspondingred shift of the PL line. The inset to Fig. 4 schematicallyshows the activated decomposition of a solid solution.The fact that QDs are buried under the InGaAs layerprovides an additional contribution to the red shift ofthe PL line because of a decrease in the band gap of thematrix and a redistribution of strain fields within QDs.The existence of several parameters of growth (DIS, x, H)opens the way to efficiently control the parameters ofQD arrays, in particular, to obtain an emission wave-length of 1.3 µm, while maintaining the high structuraland optical quality of the samples.
Figure 4 shows the PL spectrum of a structure withQDs grown by activated decomposition of a solid solu-tion at 485°C. In this case, the initial InAs islandsobtained by depositing 2.4 MLs were overgrown withInxGa1 – xAs (x = 0.15) with an average thickness of6 nm. Cooling the structure to 430°C (after the forma-tion of dots) resulted in a red shift of the PL line by~30 meV. Thus, the general trends which are valid forthe Stranski–Krastanow growth mode are also observedfor QDs produced by more complicated technology—the activated decomposition of a solid solution.
5. CONCLUSION
The effect of substrate temperature on the parame-ters of QD arrays (density, lateral size, height) and on
SEMICONDUCTORS Vol. 37 No. 7 2003
CONTROL OVER THE PARAMETERS OF InAs–GaAs QUANTUM DOT ARRAYS 865
the position of the PL spectral peak has been studied.As the temperature rises from 420 to 520°C, the lateralsize of QDs increases from 13 to 23.5 nm and their den-sity decreases from 9.2 × 10¹⁰ to 1.9 × 1010 cm–2. Theblue shift of the PL line, which is observed as the tem-perature rises from 450 to 520°C, is indicative of adecrease in the QD volume with rising temperature.The increasing lateral size with decreasing volumemeans that the dot height decreases, i.e., dots becomeflatter. The conclusion on decreasing QD height is con-firmed by the TEM data (a slight increase in the heightat 520°C observed in TEM images can be attributed tothe broadening of the composition profile at highergrowth temperatures). Decreasing QD volume with ris-ing substrate temperature is in agreement with the pre-dictions of the thermodynamic model for the Stranski–Krastanow growth mode, which predicts the existenceof an equilibrium shape, volume, and density of QDsfor a given substrate temperature. The small height ofQDs at 420°C is accounted for by the low rate ofexchange reactions at the surface, which results in along time being required for QDs to reach the equilib-rium size.
When the temperature is lowered immediately afterthe formation of QDs, their density, lateral size, andheight tend to the equilibrium values, which correspondto the temperature at which cooling is done. In ourexperiments the time of cooling was limited (120 s), sothe density and lateral size of QDs reached values inter-mediate between the equilibrium parameters for the ini-tial and final temperatures. At the same time, the heightof QDs increased very rapidly and exceeded the equi-librium value corresponding to the final temperature.Thus, the appropriate choice of the rate and time ofcooling allows fabrication of QD arrays with the pre-scribed ratio between the height and lateral size of QDs.The choice of the growth temperature and the use ofcooling immediately after the formation of QDs pro-vides the opportunity to control the QD parameters inthe Stranski–Krastanow growth mode, and also in thecase of more complex technologies such as the forma-tion of vertically coupled QDs [2], growth in the strainfield of the initial layer of stressors [3], and activateddecomposition of a solid solution [4].
SEMICONDUCTORS Vol. 37 No. 7 2003
ACKNOWLEDGMENTS
This study was supported by INTAS, the RussianFoundation for Basic Research, and the Ministry ofIndustry and Science of the Russian Federation pro-gram “Physics of Solid-State Nanostructures.”
M.V.M. and V.A.Shch. are grateful to the Alexandervon Humboldt Foundation for research funding.
REFERENCES
1. D. Bimberg, M. Grundmann, and N. N. Ledentsov,Quantum Dots Heterostructures (Wiley, Baffins Line,Chichester, 1999).
2. N. N. Ledentsov, V. A. Shchukin, M. Grundmann, et al.,Phys. Rev. B 54, 8743 (1996).
3. I. Mukhametzhanov, R. Heitz, J. Zeng, et al., Appl. Phys.Lett. 73, 1841 (1998).
4. M. V. Maximov, A. F. Tsatsul’nikov, B. V. Volovik, et al.,Phys. Rev. B 62, 16671 (2000).
5. N. N. Ledentsov, M. Grundmann, N. Kirstaedter, et al.,Solid-State Electron. 40, 785 (1996).
6. V. A. Shchukin, N. N. Ledentsov, V. M. Ustinov, et al.,Mater. Res. Soc. Symp. Proc. 618, 79 (2000).
7. A. Madhukar, in Low Dimensional Structures Preparedby Epitaxial Growth or Regrowth on Patterned Sub-strates, Ed. by K. Eberl, P. Petroff, and P. Demeester(Kluwer, Dordrecht, 1995), p. 19.
8. A. L. Barabási, Appl. Phys. Lett. 70, 2565 (1997).
9. D. E. Jesson, K. M. Chen, S. J. Pennycook, et al., Phys.Rev. Lett. 77, 1330 (1996).
10. V. A. Shchukin, N. N. Ledentsov, P. S. Kop’ev, andD. Bimberg, Phys. Rev. Lett. 75, 2968 (1995).
11. I. Daruka and A. L. Barabási, Phys. Rev. Lett. 79, 3708(1997).
12. G. Medeiros-Ribeiro, A. M. Bratkovski, T. I. Kamins,et al., Science 279, 353 (1998).
13. V. A. Shchukin, N. N. Ledentsov, and D. Bimberg, Epit-axy of Nanostructures (Springer, Berlin, 2002), p. 320.
14. V. A. Shchukin, N. N. Ledentsov, and D. Bimberg,Mater. Res. Soc. Symp. Proc. 583, 23 (2000).
Translated by D. Mashovets

![Report on Nano-Electronics, -Photonics, and –Magnetics ...blair/T/ece7960/papers/blair04nemp.pdf · crystalline substrate such as InAs/GaAs, Ge/Si, etc. [1,2] dubbed self-assembled](https://img.pdfslide.us/doc/110x75/606f548c1023fe3e71654647/report-on-nano-electronics-photonics-and-amagnetics-blairtece7960papers.jpg)

![Emergence of localized states in narrow GaAs/AlGaAs nanowire quantum well tubes · 2020-02-24 · grown wires[12,13,14]. In addition, 0D quantum dots formed by Stranski-Krastinow-like](https://img.pdfslide.us/doc/110x75/5f0e3fc37e708231d43e53ef/emergence-of-localized-states-in-narrow-gaasalgaas-nanowire-quantum-well-tubes.jpg)