Embed Size (px)
Citation preview
International Research Journal of Engineering and Technology (IRJET) e-ISSN: 2395 -0056
Volume: 02 Issue: 08 | Nov-2015 www.irjet.net p-ISSN: 2395-0072
© 2015, IRJET ISO 9001:2008 Certified Journal Page 1
CONTROL OF DYNAMIC VOLTAGE RESTORER BY CHAOTIC ACCELERATED
PARTICLE SWARM OPTIMIZATION TO IMPROVE POWER QUALITY INDICES
M. Sai kumar1, P.Venkateswararao2
1 PG scholar, Department of EEE, JNTU Anantapur, Andhra Pradesh, India
2 PG scholar, Department of EEE, JNTU Anantapur, Andhra Pradesh, India
---------------------------------------------------------------------***--------------------------------------------------------------------Abstract: – Dynamic voltage restorer (DVR) is the
mostly used custom power device for improving power
quality indices. The main function of DVR is to mitigate
the problems of voltage sag and voltage swells. In this
paper, DVR is used to control voltage sag as its main
objective and to reduce total harmonic distortion (THD)
as the second objective. DVR is controlled by
proportional-integral (PI) controller. To obtain the
optimal values for the coefficients of the PI controller a
new control strategy called chaotic accelerated particle
swarm optimization (CAPSO) algorithm which is an
advanced version of PSO is used. An appropriate
objective function for the optimization process is
developed by the combination of fuzzy logic and neural
network. The simulation results are obtained in
MATLAB/SIMULINK software and a comparison is made
between the results obtained from simulation of classic
PI controller, standard PSO and CAPSO
Key Words: dynamic voltage restorer (DVR), particle swarm optimization (PSO), chaotic accelerated PSO (CAPSO), voltage sag, total harmonic distortion (THD).
1 .INTRODUCTION
In recent years due to the increase of sensitive loads the
demand for stable and qualitative electric power supply
has been increased cumulatively. But, at the same time due
to the rapid growth of industrial loads, power electronic
devices, computer processors lead to the increase in non
linear loads which added to the increase in power quality
problems. So the main aim of the power system is to
supply stable and high quality electric energy to the
customer’s one of the important reasons for the increase
in demand for the stable electric power supply is its
economic advantages. Due to the stable electric supply,
efficiency and equipment lifetime increases leading to
increase in reliability factor and better product quality is
obtained. On the other hand, due to interruption or
deviation in delivered power quality leads to increase in
repair of equipment and interruption in production. Thus
in industrial environment stable power supply not only
influence the asset savings but also increase the
manufacture opportunities [1].
Power quality problems can be defined as any
power problem that results in failure or mal operation of
electric equipment. The minor causes for the power
quality problems are power factor decrement, corona and
skin effect losses, and transmission and distribution
losses. Some of the major causes are asymmetric and
symmetric faults, magnetic inrush currents. Due to these
power quality problems harmful defects such as supply
interruptions, voltage sags/dips, voltage swells, voltage
transients, flickers and harmonic distortions occur. The
most common disturbances in power system is voltage
sags and swells. According to IEEE standard, a sudden
decrease in voltage in the range of 10-90% for 0.5 cycles
up to 1 min is termed as voltage sag [2]. The presence of
dc voltage or current in the ac power system is termed as
dc offset. Due to this, magnetic saturation occurs in
transformer leads to increased heating losses and
reduction in reliability. All these lead to harmonics.
The devices that are installed, maintained and
controlled at the customer premises to improve power
quality are customer power devices. These devices are
based on solid state power electronic components. Some
of the most commonly used custom power devices are
uninterruptible power supplies (UPS), DVR and active
power filters (APF). Among these devices the most reliable
device for voltage abnormalities is the DVR. The main
requirement in the utilization of DVR is its control system
to achieve faster response to the variations of load
voltages. The main purpose of control system is to
generate pulses for the operation of VSC during system
disturbance such that required voltage is injected by the
International Research Journal of Engineering and Technology (IRJET) e-ISSN: 2395 -0056
Volume: 02 Issue: 08 | Nov-2015 www.irjet.net p-ISSN: 2395-0072
© 2015, IRJET ISO 9001:2008 Certified Journal Page 2
DVR to maintain a constant voltage magnitude across the
load terminals [3]. Many researches have done on
performance analysis and control of the DVR. Initially, an
ordinary PI controller is used for the control of DVR [4]
but the classic pi controller has poor operation in steady
states. Several researches are carried out such as
predictive control [5], robust control [6] and sliding mode
control [7]. At present many researches are carried based
on intelligent control techniques to control DVR operation.
Firstly, fuzzy logic controller is used to control DVR in [8].
Design of fuzzy logic controller is very easier than
previously stated methods because exact mathematical
model is not required. Later on emotional controllers [9],
hebb-learning controller in [10] are used to control DVR.
Most of the aforementioned researches even though shown good performance in steady and transient states, owning to complexity and non-linearity of power system, the controller design has become a challenging task. Also these approaches reduce voltage sag but do not consider voltage THD. So in [12] bi-objective PSO is used to vary the coefficients of the PI controller. In this paper a new control technique called CAPSO, a bi-objective optimization technique is developed to reduce voltage sag and voltage THD. The results are obtained in MATLAB software and are compared with other controllers to evaluate the performance of the proposed model.
2. DVR STRUCTURE AND FUNCTIONALITY
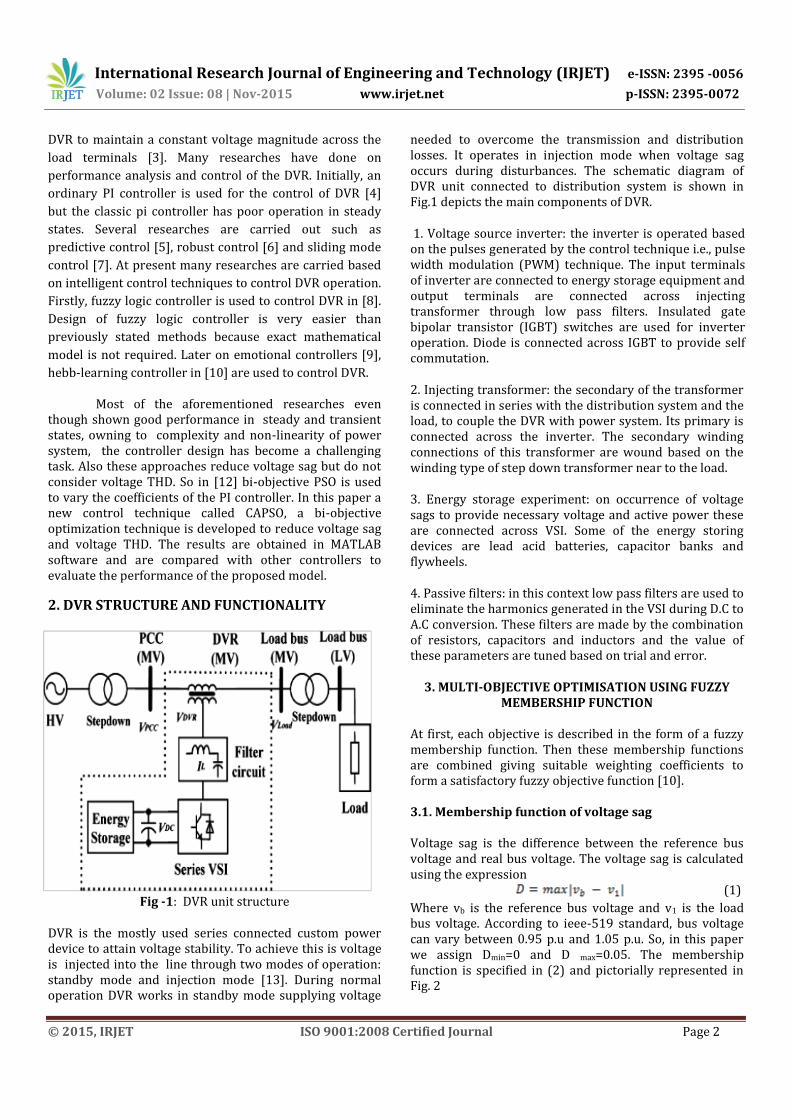
Fig -1: DVR unit structure
DVR is the mostly used series connected custom power device to attain voltage stability. To achieve this is voltage is injected into the line through two modes of operation: standby mode and injection mode [13]. During normal operation DVR works in standby mode supplying voltage
needed to overcome the transmission and distribution losses. It operates in injection mode when voltage sag occurs during disturbances. The schematic diagram of DVR unit connected to distribution system is shown in Fig.1 depicts the main components of DVR.
1. Voltage source inverter: the inverter is operated based on the pulses generated by the control technique i.e., pulse width modulation (PWM) technique. The input terminals of inverter are connected to energy storage equipment and output terminals are connected across injecting transformer through low pass filters. Insulated gate bipolar transistor (IGBT) switches are used for inverter operation. Diode is connected across IGBT to provide self commutation.
2. Injecting transformer: the secondary of the transformer is connected in series with the distribution system and the load, to couple the DVR with power system. Its primary is connected across the inverter. The secondary winding connections of this transformer are wound based on the winding type of step down transformer near to the load.
3. Energy storage experiment: on occurrence of voltage sags to provide necessary voltage and active power these are connected across VSI. Some of the energy storing devices are lead acid batteries, capacitor banks and flywheels.
4. Passive filters: in this context low pass filters are used to eliminate the harmonics generated in the VSI during D.C to A.C conversion. These filters are made by the combination of resistors, capacitors and inductors and the value of these parameters are tuned based on trial and error.
3. MULTI-OBJECTIVE OPTIMISATION USING FUZZY MEMBERSHIP FUNCTION
At first, each objective is described in the form of a fuzzy membership function. Then these membership functions are combined giving suitable weighting coefficients to form a satisfactory fuzzy objective function [10]. 3.1. Membership function of voltage sag Voltage sag is the difference between the reference bus voltage and real bus voltage. The voltage sag is calculated using the expression (1)
Where vb is the reference bus voltage and v1 is the load bus voltage. According to ieee-519 standard, bus voltage can vary between 0.95 p.u and 1.05 p.u. So, in this paper we assign Dmin=0 and D max=0.05. The membership function is specified in (2) and pictorially represented in Fig. 2

International Research Journal of Engineering and Technology (IRJET) e-ISSN: 2395 -0056
Volume: 02 Issue: 08 | Nov-2015 www.irjet.net p-ISSN: 2395-0072
© 2015, IRJET ISO 9001:2008 Certified Journal Page 3
(2)
Fig -2: Voltage sag membership function
Fig -3: Voltage THD membership function
3.2. Membership function of voltage THD Voltage harmonics causes serious effects on sensitive load. So considering harmonic reduction as a second objective along with the voltage sag reduction minimizes the power quality problems on sensitive loads. Supply voltage harmonics are analyzed by voltage THD factor and its membership function is specified in (3) and pictorially represented in Fig.3
(3)
According to IEEE-519 standard, bus voltage can vary between 0.95 p.u and 1.05 p.u. so, we assign Tmin=0 and Tmax=0.05
3.3 Bi-objective function The objective function is a linear combination of the membership functions of voltage sag and voltage THD as specified in (4). (4)
Where µD is the voltage sag member ship function and µT is the voltage THD membership function. Coefficients w1 and w2 are weighting factors. The values of these factors are determined by the power system experts. For optimization of the problem appropriate membership functions and weighting factors corresponding to each object has to be chosen. The value of weights are chosen such that there sum must be equal to 1 and they must be chosen between [0, 1]. These weights represent the priority of the chosen objectives.
The objective function obtained through fuzzification of objectives is fed to feed forward neural network. A feed forward neural network works as compensation signal generator. Feed forward neural networks are designed for each, voltage sag of d and q reference frames and THD of sensitive load voltage. Each network is designed with three layers. The input layer with single neuron, the hidden layer with 21 neurons and the output layer with 1 neuron. Activation functions chosen are tan sigmoidal for input and hidden layers and pure linear for the output layer. The training algorithm used is Levenberg Marquardt back propagation (LMBP). The architecture of neural network is shown in Fig.4. where x(1) and Y(1) are input and output of neural network which are voltage sag of d and q reference frames and THD of sensitive load voltage for three different neural networks.
Fig -4: Architecture of neural network
4. CONTROL STRATEGY
4.1 Standard PSO algorithm Eberhart and Kennedy developed the PSO algorithm for the first time in 1995[14] inspired by the social behavior of animals searching for food such as flock of birds or a school of fishes. Initial population is generated based on the experts view. All particles move randomly in an n-dimensional space and the position of each particle is defined by various components. Each particle has two ways to move. One towards the position of the current global best (Gbest) and the other towards its own best location i.e., individual best (Pbest). For each particle with position vector Xi and velocity vector Vi in an N-dimensional space are determined by (5) and (6) respectively.

International Research Journal of Engineering and Technology (IRJET) e-ISSN: 2395 -0056
Volume: 02 Issue: 08 | Nov-2015 www.irjet.net p-ISSN: 2395-0072
© 2015, IRJET ISO 9001:2008 Certified Journal Page 4
(5)
(6)
After each iteration the position of each particle is compared with its previous positions and best position is determined as Pbest. Let at Kth iteration individual best is
. is the best position reached by the whole
group until Kth iteration. After each iteration, the velocity and position of each particle is generated by using the formula (7) and (8) respectively.
(7)
(8)
Where and are known as learning co-efficient. In this
paper, we assign =2 and =0 at the beginning of search
process. As search process proceeds, decreases linearly
and increases linearly. By the end of search process
they reach 0 and 2 respectively. Inertia constant takes
the value in the range [0, 1]. In this paper it is set to 1 at the beginning because increase of mass stabilizes the movement of particles. During the search its value decreases linearly and reaches to zero by the end of search process. 4.2 Accelerated PSO There are various types of PSO algorithms, of all those accelerated PSO shows some more advantages in convergence for global search than other algorithms. Accelerated PSO (APSO) was developed by Yang for the first time in 2008. Both the global best and the individual best are used by the standard PSO but the APSO uses global best only. The primary reason to use individual best is to increase the diversity in the search solutions but in APSO this is achieved by using the randomness property [15]. Therefore without using individual best a simplified version with only the best group experience is proposed to accelerated the convergence of the algorithm and the velocity vector is generated by using the formula
(9)
Where is the random variable and is the acceleration
constant. takes value in the range [0,1] and for most of
the applications it is between 0.2 and 0.7. 4.3 Chaotic APSO From (9) it is clear that the main parameters of the APSO are learning coefficients because they characterize the variation of the global best. So the value of learning coefficients is very crucial in determining the speed of convergence. For example if assigned to a lower value it
leads to slower convergence rate. On the other hand if it is high, it leads to a false global best. So learning coefficient
values effect the convergence. In this paper chaos generator is used to determine the inertia coefficient ( )
in (7). In order to achieve this, chaos generator is multiplied with the previous value of inertia constant. The updated inertia coefficient can be calculated using (10) and (11). (10)
(11)
Here is the swing range control parameter of chaos
generator. Its takes values in the interval [0, 4]. Due to the sensitivity of the chaos generator to initial values the values mentioned in (12) cannot be assigned. Here we assign and
(12)
5. PROPOSED METHOD
Fig -5: General optimization procedure for optimum PI coefficients determination
The main goal of this project is to select optimum values for the PI’s parameters. The optimization algorithm tries

International Research Journal of Engineering and Technology (IRJET) e-ISSN: 2395 -0056
Volume: 02 Issue: 08 | Nov-2015 www.irjet.net p-ISSN: 2395-0072
© 2015, IRJET ISO 9001:2008 Certified Journal Page 5
to search appropriate values for PI’s parameters. Here we choose CAPSO algorithm as the optimization algorithm. As power system is complex in nature especially during fault conditions a large population size has to be taken. But, a large population size decreases convergence rate of algorithm on the other hand a small population size leads to get struck in local minima. So, the effect of population size on standard PSO is very high. So to increase the convergence rate acceleration factor is introduced and chaos theory creates more diversity. Hence by using just two terms best group experience and inertia, the speed of convergence towards better solution is achieved. Therefore in this approach of algorithm, a combination of chaos theory and APSO is used. The general optimization for optimum PI coefficients is shown in the form of flow chart in Fig.5.
Fig -6: DVR control structure
Fig -7: Proposed control structure
According to this flow chart the values of voltage sag and voltage THD are obtained from MATLAB/SIMULINK software. These values are given to fuzzy membership functions defined in (2) and (3) and these membership functions are placed in objective function in (4). For every particle in the search process this procedure is repeated for each iteration in optimization algorithm. The DVR
control structure and proposed control strategy is shown in Figs 6 and 7 respectively.
When DVR is connected to the supply line the phase angle of the reference signal is synchronized with the supply voltage phase angle. By using feedback synchronizing control loop the deviation of line voltage with the reference voltage is continuously monitored. Through parks transformation three phase (abc) signal is converted to dq rotating reference frame. Angular position of rotating reference frame is calculated by phase locked loop (PLL). PLL synchronizes the variable frequency three phase sinusoidal signals.
By connecting sensitive load voltage to parks transformation block we calculate Vd and Vq. Under balanced conditions Vd=1 and Vq=0 and during fault conditions these values changes. Now the generated dq voltages are compared with the reference dq voltages and the error is feed to the PI controller located in both d and q voltage components. The dq output voltages of PI controller are converted back to three phase voltage by parks transformation as shown in Fig 6. With the help of PWM technique pulses are generated and are applied to voltage source converter to produce voltage that has to be injected into the distribution system.
6. SIMULATION RESULTS
Fig -8: Distribution network with DVR and its proposed controller
A two bus power distribution system with one bus containing sensitive load is considered for the purpose of case study. The DVR with proposed controller is connected to the distribution network as shown in Fig. 8 and its parameter ratings are shown in appendix A. In the view to simulate more critical conditions two faults are simulated. The first fault is near the non sensitive load and the second one is on the source side of the series injection transformer. The first fault is an asymmetric two phase fault and occurs in the A, B phases and second fault is a

International Research Journal of Engineering and Technology (IRJET) e-ISSN: 2395 -0056
Volume: 02 Issue: 08 | Nov-2015 www.irjet.net p-ISSN: 2395-0072
© 2015, IRJET ISO 9001:2008 Certified Journal Page 6
symmetric three phase fault in A, B, C phases. Parameters of both the faults are shown in table 1.
Table -1: Fault parameters
Fig -9: DVR control with classic PI
Fig -10: DVR control with PI controller regulated with single-objective PSO
Initially DVR is controlled with classical PI controller and then the optimal values of PI controller are solved using single objective PSO in MATLAB/SIMULINK environment. The number of dimensions is two for each PI controller.
These dimensions represent the two coefficients i.e., proportional and integral gains of the PI controllers. A PSO algorithm with maximum 100 iterations and particle size 20 is taken. The voltage sag waveforms when DVR controlled with classic PI control and PI controlled with single objective PSO is shown in Fig. 9 and Fig. 10. Voltages at point of common coupling (PCC), across sensitive load terminals, injected voltage by DVR and sensitive load voltage deviations are observed in each of the figures. There harmonic order spectrum are shown in Fig.13 and Fig.14 respectively.
Though there is a noticeable change in there voltage sag values but THD index can be improved further. So in this paper we consider bi-objective optimization algorithm with voltage THD as its second objective. With the same number of iterations and particles considering the same case study we simulate results for DVR control with bi-objective standard PSO and DVR controlled with bi-objective CAPSO algorithm. There voltage sag waveforms are shown in figs. 11 and 12 respectively. Voltages at point of common coupling (PCC), across sensitive load terminals, injected voltage by DVR and sensitive load voltage deviations are observed in each of the figures. There harmonic order spectrum are shown in Fig.15 and Fig.16 respectively. These clearly show an improvement in the THD signal and deviation signal of line voltage caused by system faults than the aforementioned algorithms.
Fig -11: DVR control with PI controller regulated with multi-objective standard PSO

International Research Journal of Engineering and Technology (IRJET) e-ISSN: 2395 -0056
Volume: 02 Issue: 08 | Nov-2015 www.irjet.net p-ISSN: 2395-0072
© 2015, IRJET ISO 9001:2008 Certified Journal Page 7
Fig -12: DVR control with PI controller regulated with multi objective CAPSO
Fig -13: DVR control with PI controller
Fig -14: DVR control with single objective PSO
Fig -15: DVR control with PI controller regulated with bi-objective PSO
Fig -16: DVR control with PI controller regulated with multi objective CAPSO
7. CONCLUSIONS
According to the results obtained it is clearly shown that the CAPSO algorithm outperforms than other control techniques. In this paper, a new modification to PSO algorithm is presented in order to improve its performance. For PI controller better set of coefficients are achieved using this algorithm. Based on the combination of fuzzification and ANN a bi-objective optimization algorithm is developed in order to improve voltage sag and THD indices. The obtained simulation results revels that the bi-objective algorithm has better performance than single objective algorithm. Hence by using CAPSO algorithm to control DVR a stable voltage with low THD can be provided for customers.

International Research Journal of Engineering and Technology (IRJET) e-ISSN: 2395 -0056
Volume: 02 Issue: 08 | Nov-2015 www.irjet.net p-ISSN: 2395-0072
© 2015, IRJET ISO 9001:2008 Certified Journal Page 8
Appendix A System frequency Fn 50 Hz
Power supply voltage Vs 22.5 kV
Active power for sensitive load P
20 kW
Reactive power for sensitive load
Ql =4 kVAR
QC= 1 kVAR Active power for non-sensitive load P
25 kW
Reactive power for non-sensitive load Ql
4 kVAR
Distribution transformer rated power and ratio
Pn = 32 kW, 20000/380
Distribution transformer impedances
Rl = 0.0003 pu, Xl = 0.001 pu, Rm =Xm = 500 pu
Series transformer rated power and ratio
Pn = 15 kW, 100/1000
Series transformer impedances Rl = 0.00001 pu, Xl = 0.0003 pu, Rm = Xm = 500 pu
DVR switching frequency FS 10 kHz
DC voltage source VDC 200 V
REFERENCES
[1] Milanovic, J.V., Zhang, Y.: ‘Global minimization of financial losses due to voltage sags with FACTS based devices, IEEE Trans. Power Deliv., 2010, 25, pp. 298–306 [2] IEEE Recommended Practice for Monitoring Electric Power Quality, IEEE standard 1159–1995 [3] Mohammed, S.A., Cerrada, A.G., Abdel-Moamen, M.A., Hasanin, B.:‘Conventional dynamic voltage restorer (DVR) for mitigation of voltage sag in power distribution systems’, Int. J. Adv. Eng. Technol., 2013, 6, (1), pp. 415–425 [4] Karimian, M., Jalilian, A.: ‘Proportional repetitive control of a dynamic voltage restorer (DVR) for power quality improvement’, Int. J. Tech. Phys. Probl. Eng. (IJTPE), 2012, 4, (2), pp. 18–23 [5]Zhou, H., Wei, T.Z., Zhao, Y.L., Qi, Z.P.: ‘Study on dynamic matrix predictive control of single-phase DVR’. Experimental Thermal and Fluid Science, Proc. Third Int. Conf. Electric Utility Deregulation and Restructuring and Power Technologies, Nanjing, China, 2008, pp. 2136–2140 [6]Li, Y.W., Vilathgamuwa, M., Blaabjerg, F., Loh, P.C.: ‘A robust control scheme for medium-voltage-level DVR implementation’, IEEE Trans. Ind. Electron., 2007, 54, pp. 2249–2261 [7]Nagesh Kumar, G.V., Deepak Chowdary, D.: ‘DVR with sliding mode control to alleviate voltage sags on a distribution system for three phase short circuit fault’.
Proc. Third Int. Conf. Industrial and Information Systems, Kharagpur, India, 2008, pp. 1–4 [8]Jain, S., Singh Thakur, S., Phulambrikar, S.P.: ‘Fuzzy controller based DVR to mitigate power quality and reduce the harmonics distortion of sensitive load’, Int. J. Adv. Res. Electr. Electron. Instrum. Eng., 2012, 1, (5), pp. 351–361 [9] Shamsi-Nejad, M.A., Khalghani, M.R.: ‘DVR control using adaptive PI controller based on human brain learning’. 17th Electric Power Distribution Conf., Tehran, Iran, 2012 [10]Khalghani, M.R., Shamsi-nejad, M.A., Farshad, M., Khooban, M.H.:‘Modifying power quality’s indices of load by presenting an adaptive method based on Hebb learning algorithm for controlling DVR’,Autom. ‒ J. Control Meas. Electron. Comput. Commun., 2012. [11]Dionísio Barros, J., Fernando Silva, J.: ‘Multilevel optimal predictive dynamic voltage restorer’, IEEE Trans. Ind. Electron., 2010, 57, pp. 2747–2760 [12]Shamsi Nejad, M.A., Khalghani, M.R., Zamen, M.A., Dadgar, M., Vahidi, T.: ‘Bi-objective regulating of DVR compensator to modify power quality’s indices of load’. 22nd Int. Conf. Electricity Distribution (CIRED), Stockholm, 10–13 June 2013. [oIN PRESS], pp. 1–4, IET [13] Ramachandaramurthy, V.K., Arulampalam, A., Fitzer, C., Zhan, C., Barnes, M., Jenkins, N.: ‘Supervisory control of dynamic voltage restorers’. IEE Proc. Generation, Transmission, Distribution, 2004, vol. 151, pp. 509–516 [14]Kennedy, J., Eberhart, R.: ‘Particle swarm optimization’. Proc. IEEE Int. Conf. Neural Networks (Perth, Australia), IEEE Service Center.
BIOGRAPHIES
M.Sai kumar is currently pursuing his M.Tech degree in Electrical and Electronics Engineering with specialization in Electrical Power Systems from Jawaharlal Nehru Technological University, Anantapur, India. He did his B.Tech Degree in Electrical and Electronics Engineering from sri Venkateswara College of
Engineering and technology, chittor, A.P, India 2012.
P.Venkateswararao is currently pursuing his M.Tech degree in Electrical and Electronics Engineering with specialization in Electrical Power Systems from Jawaharlal Nehru Technological University, Anantapur, India. He did his B.Tech Degree in Electrical and Electronics
Engineering from V.R Siddhartha engineering college, vijayawada ,India 2013.