Embed Size (px)
Citation preview
ISIJ International, Vol. 57 (2017), No. 5
© 2017 ISIJ 824
ISIJ International, Vol. 57 (2017), No. 5, pp. 824–832
* Corresponding author: E-mail: [email protected]: http://dx.doi.org/10.2355/isijinternational.ISIJINT-2016-684
1. Introduction
1.1. Solidification Structure ControlA typical cast macrostructure of austenitic stainless steel
(ASS) alloyed by Cr, Ni, Mo and the other transition met-als has a fine surface chilled zone followed by an elongated dendrite zone and centrally located equiaxed crystals. The size and morphology of primary grains are of particular importance for physicochemical and mechanical properties of ASS. The grain size in the columnar and equiaxed zones, their ratio, and a columnar-to-equiaxed transition (CET) are the main parameters which characterize ASS solidification macro-structure. A CET zone in high alloy ASS is con-sidered to be a possible place for element segregation and agglomeration of undesirable structural features (inclusion, micro-porosity etc.).
The solidification macrostructure of ASS can be modified in two ways:
(i) A fully columnar grain structure can be promoted. The oriented columnar and single grain cast structures of this type are very effective for high temperature applica-tions, such as for directionally solidified aircraft turbine blades.1) Chills are often employed in ASS castings pro-duced in sand molds for this purpose and to control shrink-age porosity.
(ii) A fully equiaxed grain structure can be promoted. Grain refining extends the equiaxed zone and can partially or fully suppresses the columnar dendrite zone.2)
Control of Columnar to Equiaxed Transition in Solidification Macrostructure of Austenitic Stainless Steel Castings
Simon Naumovich LEKAKH,* Ron O’MALLEY, Mark EMMENDORFER and Brenton HREBEC
Missouri University of Science and Technology, Rolla, MO, 65409 USA.
(Received on November 30, 2016; accepted on January 26, 2017)
Solidification macrostructure is of great importance for the properties and the quality of castings made from austenitic grade stainless steels (ASS) because there are limited options to change as-cast macro-structure in the solid condition. A typical cast macrostructure of ASS has a fine surface chilled zone fol-lowed by an elongated dendrite zone, columnar to equiaxed transition (CET) zone, and centrally located equiaxed crystals. Several castings from ASS were produced to determine the effects of casting geometry, chilling, and grain refinement on CET. The transient thermal field in solidified heavy castings was simulated and used to determine an isotherm velocity (V) and the thermal gradient (G) in mushy zone at 50% solid fraction. The critical value of the parameter Gn/V was determined from the macrostructure of the cylindri-cal casting. Using this value, the location of CET was predicted in the heavy rectangular casting and this prediction was in agreement with experimental macrostructure. Two methods of controlling casting mac-rostructure by using a chilled mold to stimulate extensive columnar zone and by using melt grain refine-ment to produce fine equiaxed crystals were experimentally verified and simulated.
KEY WORDS: solidification; CET; grain refinement; stainless steel.
Grain refinement of the cast structure is an important tool for reducing compositional micro-segregation within grains, for decreasing the large scale macro segregation of alloying elements within the entire casting, and for controlling the structure and composition of the grain boundaries. Control of the solidification structure by grain refining does not have casting geometry restrictions. Effective grain refine-ment requires the enhancement of heterogeneous nucle-ation during solidification. There are a variety of technical approaches that have been developed for cast structure grain refinement. These approaches are based on different principles which can be classified into two groups. The first group of methods can be referred to as physical methods, which involve the breaking of nuclei from dendrite branches by mechanical or electromagnetic stirring.3–5) The second group is comprised of so-called, “chemical” methods, which employ special additives to develop active heterogeneous nuclei.2,6–8)
1.2. Simulation of Solidification Macrostructure in Heavy Castings
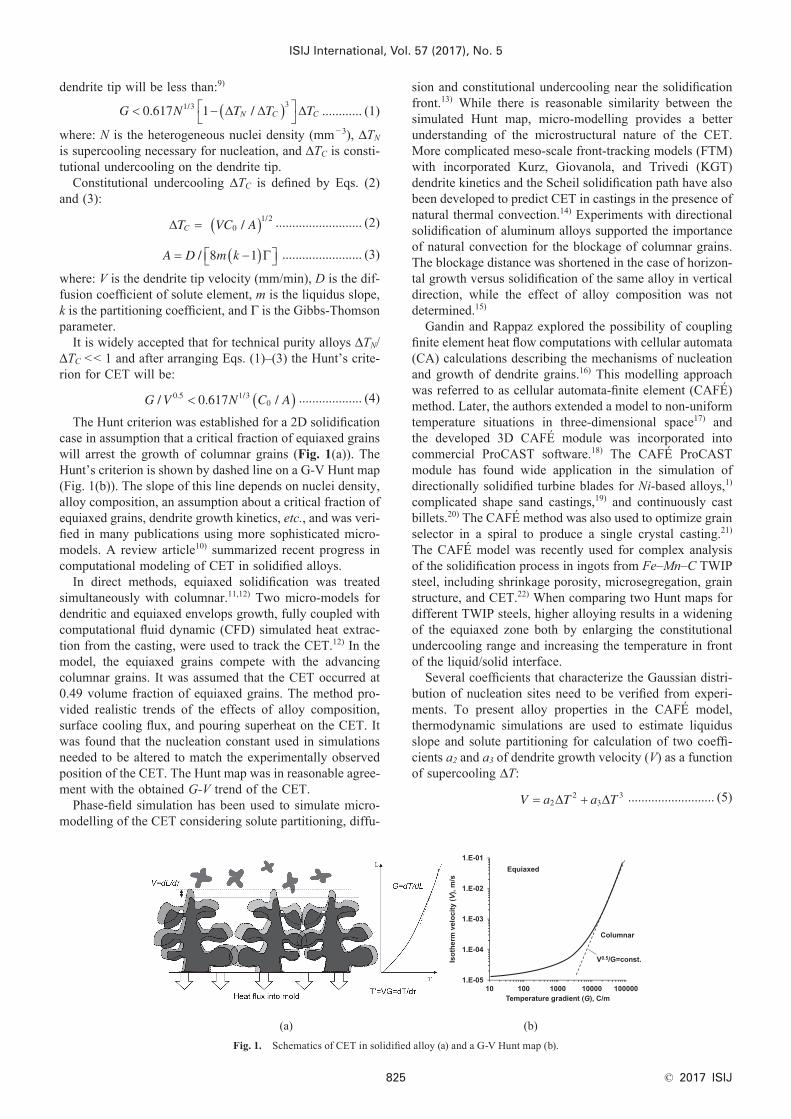
In his seminal publication, Hunt9) established the theory of columnar-to-equiaxed transition (CET). During colum-nar growth, aligned dendrites grow opposite to the heat flow direction, from the casting wall toward the center of the casting. When the necessary chemical and thermal conditions are developed, equiaxed crystals grow in the melt ahead of the dendrite tips, which stops the dendrites from growing. This will happen when a critical fraction of equiaxed grains is achieved. For the suggested critical fraction of 0.49, the temperature gradient G (°C/mm) at the
ISIJ International, Vol. 57 (2017), No. 5
© 2017 ISIJ825
dendrite tip will be less than:9)
G N T T TN C C< − ( )
0 617 11 3 3
. // ∆ ∆ ∆ ............ (1)
where: N is the heterogeneous nuclei density (mm −3), ΔTN is supercooling necessary for nucleation, and ΔTC is consti-tutional undercooling on the dendrite tip.
Constitutional undercooling ΔTC is defined by Eqs. (2) and (3):
∆T VC AC = ( ) 01 2
// .......................... (2)
A D m k= −( ) / 8 1 Γ ........................ (3)
where: V is the dendrite tip velocity (mm/min), D is the dif-fusion coefficient of solute element, m is the liquidus slope, k is the partitioning coefficient, and Γ is the Gibbs-Thomson parameter.
It is widely accepted that for technical purity alloys ΔTN/ΔTC << 1 and after arranging Eqs. (1)–(3) the Hunt’s crite-rion for CET will be:
G V N C A/ . /. /0 5 1 300 617< ( ) ................... (4)
The Hunt criterion was established for a 2D solidification case in assumption that a critical fraction of equiaxed grains will arrest the growth of columnar grains (Fig. 1(a)). The Hunt’s criterion is shown by dashed line on a G-V Hunt map (Fig. 1(b)). The slope of this line depends on nuclei density, alloy composition, an assumption about a critical fraction of equiaxed grains, dendrite growth kinetics, etc., and was veri-fied in many publications using more sophisticated micro-models. A review article10) summarized recent progress in computational modeling of CET in solidified alloys.
In direct methods, equiaxed solidification was treated simultaneously with columnar.11,12) Two micro-models for dendritic and equiaxed envelops growth, fully coupled with computational fluid dynamic (CFD) simulated heat extrac-tion from the casting, were used to track the CET.12) In the model, the equiaxed grains compete with the advancing columnar grains. It was assumed that the CET occurred at 0.49 volume fraction of equiaxed grains. The method pro-vided realistic trends of the effects of alloy composition, surface cooling flux, and pouring superheat on the CET. It was found that the nucleation constant used in simulations needed to be altered to match the experimentally observed position of the CET. The Hunt map was in reasonable agree-ment with the obtained G-V trend of the CET.
Phase-field simulation has been used to simulate micro-modelling of the CET considering solute partitioning, diffu-
sion and constitutional undercooling near the solidification front.13) While there is reasonable similarity between the simulated Hunt map, micro-modelling provides a better understanding of the microstructural nature of the CET. More complicated meso-scale front-tracking models (FTM) with incorporated Kurz, Giovanola, and Trivedi (KGT) dendrite kinetics and the Scheil solidification path have also been developed to predict CET in castings in the presence of natural thermal convection.14) Experiments with directional solidification of aluminum alloys supported the importance of natural convection for the blockage of columnar grains. The blockage distance was shortened in the case of horizon-tal growth versus solidification of the same alloy in vertical direction, while the effect of alloy composition was not determined.15)
Gandin and Rappaz explored the possibility of coupling finite element heat flow computations with cellular automata (CA) calculations describing the mechanisms of nucleation and growth of dendrite grains.16) This modelling approach was referred to as cellular automata-finite element (CAFÉ) method. Later, the authors extended a model to non-uniform temperature situations in three-dimensional space17) and the developed 3D CAFÉ module was incorporated into commercial ProCAST software.18) The CAFÉ ProCAST module has found wide application in the simulation of directionally solidified turbine blades for Ni-based alloys,1) complicated shape sand castings,19) and continuously cast billets.20) The CAFÉ method was also used to optimize grain selector in a spiral to produce a single crystal casting.21) The CAFÉ model was recently used for complex analysis of the solidification process in ingots from Fe–Mn–C TWIP steel, including shrinkage porosity, microsegregation, grain structure, and CET.22) When comparing two Hunt maps for different TWIP steels, higher alloying results in a widening of the equiaxed zone both by enlarging the constitutional undercooling range and increasing the temperature in front of the liquid/solid interface.
Several coefficients that characterize the Gaussian distri-bution of nucleation sites need to be verified from experi-ments. To present alloy properties in the CAFÉ model, thermodynamic simulations are used to estimate liquidus slope and solute partitioning for calculation of two coeffi-cients a2 and a3 of dendrite growth velocity (V) as a function of supercooling ΔT:
V a T a T= +22
33∆ ∆ .......................... (5)
Fig. 1. Schematics of CET in solidified alloy (a) and a G-V Hunt map (b).
ISIJ International, Vol. 57 (2017), No. 5
© 2017 ISIJ 826
The CET simulation on a macro-scale (>1 mm), con-sidering coupling with microscopic scale (<1 mm) scien-tific phenomena, is still a challenge.10) Using macro-scale models with embedded microscopic phenomena requires the assumption of several arbitrary parameters which need to be verified in experiments. A large number of unknown variables make it difficult to tune simulation results because of possible non-linear effects and mutual dependences. On the other hand, a simplified macro-scale model based on Hunt map has a significantly fewer number of unknown parameters but predicts similar G-V trends to those obtained from the more sophisticated micro-models.
Here it is necessary to mention that the Hunt model can only predict the CET, while micro-models simulate the whole grain structure. Also, the constant Gn/V relationship is only valid in the processing window when the nucleation undercooling is small. This assumption has been confirmed to be reasonable for the analysis of solidification structures in many industrial processes, such as welding, casting, or laser treatment.23)
The prediction of the CET in industrial castings based on the Hunt map is supported by experiments in many stud-ies.23–27) The parameter n in Hunt’s criterion Gn/V= con-stant was verified by Kurz, Bezenson, and Gauman23) and the modified value n = 3.4 was recommended. Prediction of the CET in continuous casting 16% Cr ferritic stainless steel was performed using a macro-simulated Gn/V number and a reasonable agreement with experimental structure was obtained at 0.5 solid fraction for different superheats with and without electromagnetic stirring (EMS). In addition, the effect of nominal superheat was not significant with EMS application.24) Prediction of the equiaxed crystal ratio in a continuously cast steel slab was performed for ferritic steel using the Hunt model.25) The Gn/V parameter was simulated at a solid fraction of 0.3. The Hunt model explained the effects of the casting speed, melt superheat, steel composi-tion, EMS and cooling intensity of the position of CET in the slab. A combination of the macro-CFD simulation of the thermal field with the Hunt G-V map successfully predicted the CET in re-melted ingots from a nickel-based superal-loy.26) CET in inoculated aluminum alloys was investigated using measured cooling curves. These cooling curves were superimposed on simulated Hunt type map.27) The experi-
mental G and V values were determined from cooling curves at the liquidus temperature while the predicted position of the CET was closer to the base of the ingot than observed experimentally.
In this article, the possibility of tracking CET in heavy section ASS castings using the modified Hunt’s criterion G3.4/V= constant23) was explored. A combination of CFD simulations with experimental measurements was used. In the first part of the article, the predicted results were com-pared to the experimental macrostructure. In the second part, this approach was used to analyze the mechanisms that control the macrostructure.
2. Procedures
2.1. ExperimentalTo study macrostructure, heavy section castings were
produced from high alloy stainless steel (Table 1).Steel was melted in an induction furnace. Two melt treat-
ments were investigated: the first one included Ca-treatment (“base”) and the second one employed grain refining treat-ment (“refined”). Heterogeneous nucleation of austenite was facilitated by sequential formation of Al–Mg spinel dispersoids in the melt followed by co-precipitation of TiN on dispersoid surfaces above the liquidus temperature dur-ing melt cooling. The details of grain refining treatments are described elsewhere.2)
A set of the experimental castings included:Type A: two castings (“base” and “refined” ASS), each
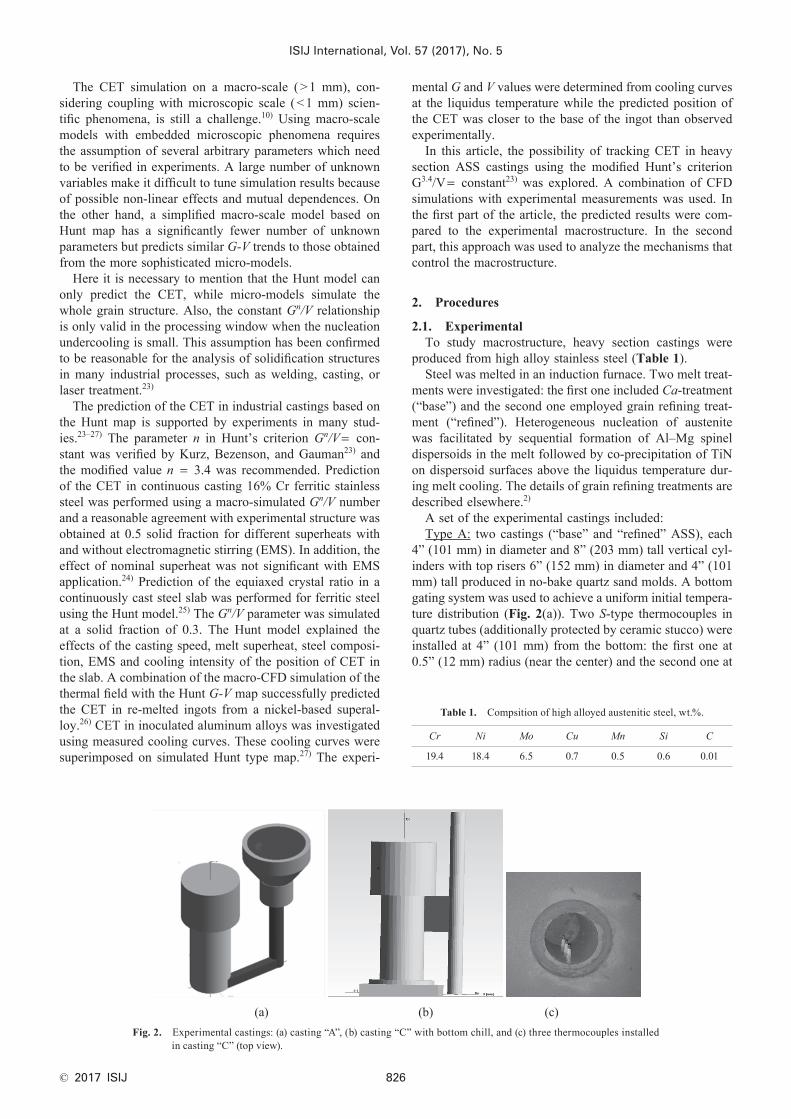
4” (101 mm) in diameter and 8” (203 mm) tall vertical cyl-inders with top risers 6” (152 mm) in diameter and 4” (101 mm) tall produced in no-bake quartz sand molds. A bottom gating system was used to achieve a uniform initial tempera-ture distribution (Fig. 2(a)). Two S-type thermocouples in quartz tubes (additionally protected by ceramic stucco) were installed at 4” (101 mm) from the bottom: the first one at 0.5” (12 mm) radius (near the center) and the second one at
Table 1. Compsition of high alloyed austenitic steel, wt.%.
Cr Ni Mo Cu Mn Si C
19.4 18.4 6.5 0.7 0.5 0.6 0.01
Fig. 2. Experimental castings: (a) casting “A”, (b) casting “C” with bottom chill, and (c) three thermocouples installed in casting “C” (top view).
ISIJ International, Vol. 57 (2017), No. 5
© 2017 ISIJ827
3” (76 mm) radius (near the wall) (Fig. 2(a));Type B: one casting (“base” ASS) with a heavy section
rectangular block with dimensions: 6” (152 mm) × 15” (381 mm) and 6” (152 mm) tall. No-bake quartz sand molds with a bottom gating system and a cylindrical top riser were used;
Type C: one casting (“base” ASS) with a similar geom-etry to casting “A” but designed for directional solidifica-tion. A copper water-cooled chilling plate was incorporated in the bottom of the mold cavity. The design also included a 5” (127 mm) diameter, 1/4” (6 mm) thick addition to the casting bottom to increase cooling intensity. A low thermal conductivity insulation sleeve with a 4” (101 mm) internal diameter and 0.5” (12 mm) wall thickness surrounded by no-bake sand was used to decrease heat flux in radial direc-tion. A side gating system was used for this casting to avoid additional heating of the chill during mold pouring (Fig. 2(b)). Three S-type thermocouples were installed in the cooling direction at 1.5” (38 mm), 3” (76 mm) and 5” (127 mm) from the chill (Fig. 2(c)).
Castings were sectioned along the middle horizontal and vertical planes, milled, ground, and macro-etched using the mixture of ten parts of pure hydrochloric acid and one part of concentrated hydrogen peroxide.
2.2. SimulationsTransient (time dependent) heat transfer between the
solidified casting, the mold, and the environment coupled with buoyancy-driven melt convection flow in the mold cavity was simulated using commercial Computational Fluid Dynamic (CFD) FLUENT software. Details of applied governing equations are given in the User Manual28) and specific simulation details are given in Table 2.
Simulations were performed using transient solvers: (i) coupled Energy and Laminar Flow in gravity (Method 1, “flow”) or, for sake of simplicity, (ii) only transient Energy solvers assuming immobile melt and temperature depen-
dent atomic heat conductivity in the melt29) (Method 2, “no flow”), or (iii) applying approximately the 5 times increased coefficient of heat conductivity (Kaj) of the melt to compensate increased intensity of heat transfer by melt convection 25) at temperatures above the temperature of dendrite coherency (Method 3, “adjusted K”).30)
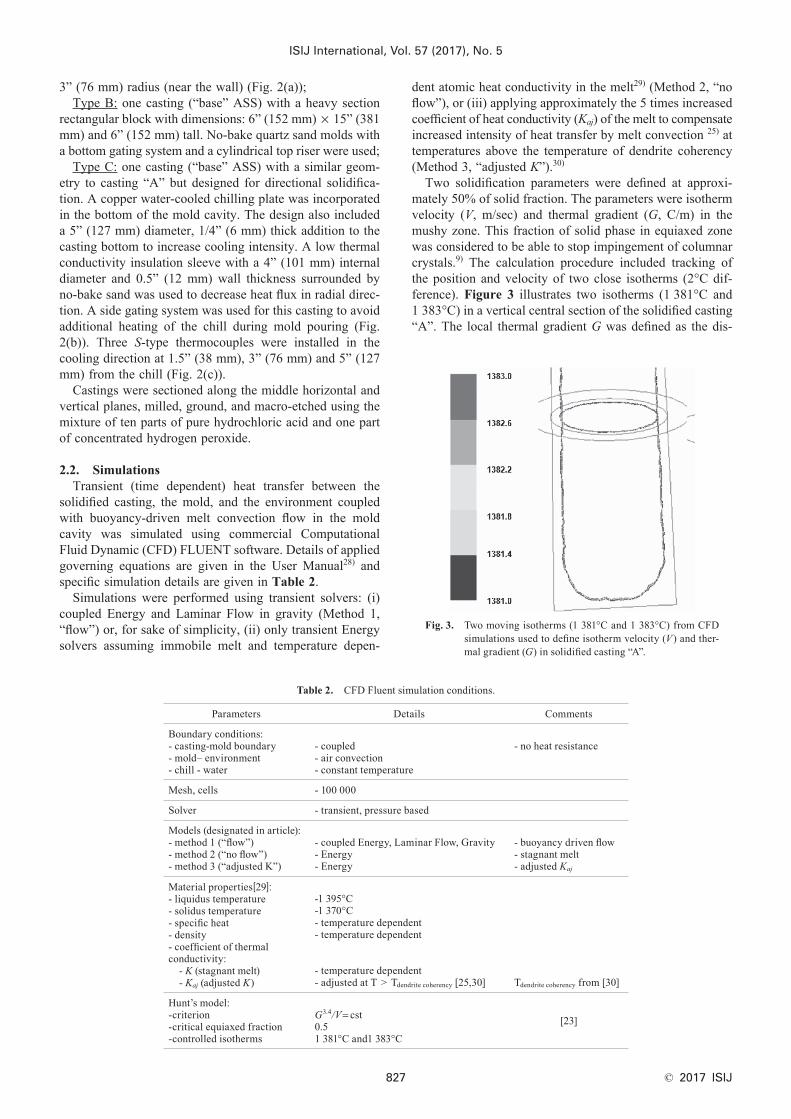
Two solidification parameters were defined at approxi-mately 50% of solid fraction. The parameters were isotherm velocity (V, m/sec) and thermal gradient (G, C/m) in the mushy zone. This fraction of solid phase in equiaxed zone was considered to be able to stop impingement of columnar crystals.9) The calculation procedure included tracking of the position and velocity of two close isotherms (2°C dif-ference). Figure 3 illustrates two isotherms (1 381°C and 1 383°C) in a vertical central section of the solidified casting “A”. The local thermal gradient G was defined as the dis-
Table 2. CFD Fluent simulation conditions.
Parameters Details Comments
Boundary conditions:- casting-mold boundary- mold– environment- chill - water
- coupled- air convection- constant temperature
- no heat resistance
Mesh, cells - 100 000
Solver - transient, pressure based
Models (designated in article):- method 1 (“flow”)- method 2 (“no flow”)- method 3 (“adjusted K”)
- coupled Energy, Laminar Flow, Gravity- Energy- Energy
- buoyancy driven flow- stagnant melt- adjusted Kaj
Material properties[29]:- liquidus temperature- solidus temperature- specific heat- density- coefficient of thermal conductivity:
- K (stagnant melt)- Kaj (adjusted K)
-1 395°C-1 370°C- temperature dependent- temperature dependent
- temperature dependent- adjusted at T > Tdendrite coherency [25,30] Tdendrite coherency from [30]
Hunt’s model:-criterion-critical equiaxed fraction-controlled isotherms
G3.4/V= cst0.51 381°C and1 383°C
[23]
Fig. 3. Two moving isotherms (1 381°C and 1 383°C) from CFD simulations used to define isotherm velocity (V) and ther-mal gradient (G) in solidified casting “A”.
ISIJ International, Vol. 57 (2017), No. 5
© 2017 ISIJ 828
tance between these isotherms in cooling direction. Track-ing the position of each isotherm every 5–10 sec of casting solidification was used to determine isotherm velocity (V). After that, a modified Hunt’s criterion was calculated as an equivalent of Gn/V, with n=3.4.23)
In this study, these two macro-parameters (G and V) were defined from a CFD simulated temperature field in the whole solidified casting using a fine mesh. However, their values could deviate from the local thermal gradient and dendrite tip grow velocity.
3. Results
3.1. Model AdjustmentFigure 4 presents comparison of the experimental and
simulated cooling curves in the Casting A at two points: near the casting wall and near the casting center in the middle horizontal section. Computational approaches are listed in legend. The overall simulated solidification time was in reasonable agreement with all models. The coupled “flow” model better presents an initial period of removing melt superheat at the casting center while the “adjusted K” model improved the predictions when compared to the “no flow” model.
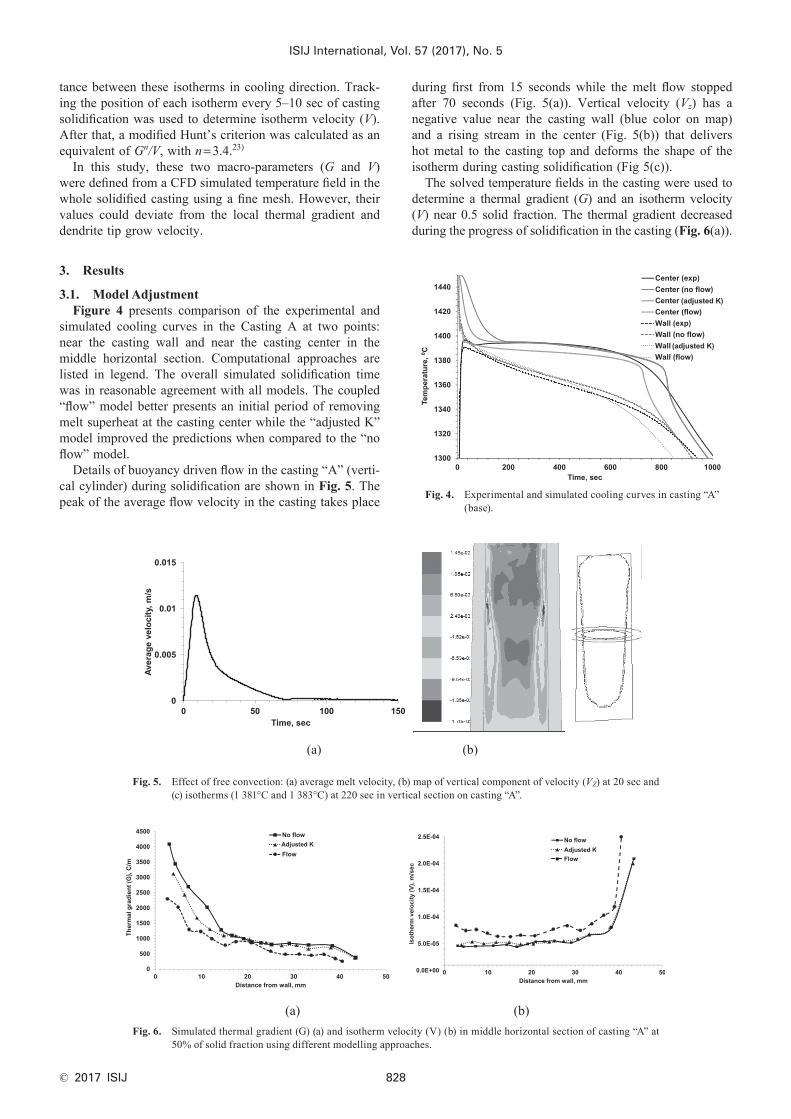
Details of buoyancy driven flow in the casting “A” (verti-cal cylinder) during solidification are shown in Fig. 5. The peak of the average flow velocity in the casting takes place
during first from 15 seconds while the melt flow stopped after 70 seconds (Fig. 5(a)). Vertical velocity (Vz) has a negative value near the casting wall (blue color on map) and a rising stream in the center (Fig. 5(b)) that delivers hot metal to the casting top and deforms the shape of the isotherm during casting solidification (Fig 5(c)).
The solved temperature fields in the casting were used to determine a thermal gradient (G) and an isotherm velocity (V) near 0.5 solid fraction. The thermal gradient decreased during the progress of solidification in the casting (Fig. 6(a)).
Fig. 4. Experimental and simulated cooling curves in casting “A” (base).
Fig. 5. Effect of free convection: (a) average melt velocity, (b) map of vertical component of velocity (VZ) at 20 sec and (c) isotherms (1 381°C and 1 383°C) at 220 sec in vertical section on casting “A”.
Fig. 6. Simulated thermal gradient (G) (a) and isotherm velocity (V) (b) in middle horizontal section of casting “A” at 50% of solid fraction using different modelling approaches.
ISIJ International, Vol. 57 (2017), No. 5
© 2017 ISIJ829
The “flow” model showed a lower thermal gradient than pre-dicted by the “no flow” model because heat was transferred by laminar convection, rather than only by conductivity of still melt. The “adjusted K” model was in reasonable agree-ment with the “flow” model. However, some differences in the predicted isotherm velocity between the “flow” and “no flow” models were not compensated by applying Kaj. Also, partial deformation of the isotherm in a vertical section was not predicted in either model which ignored melt flow.
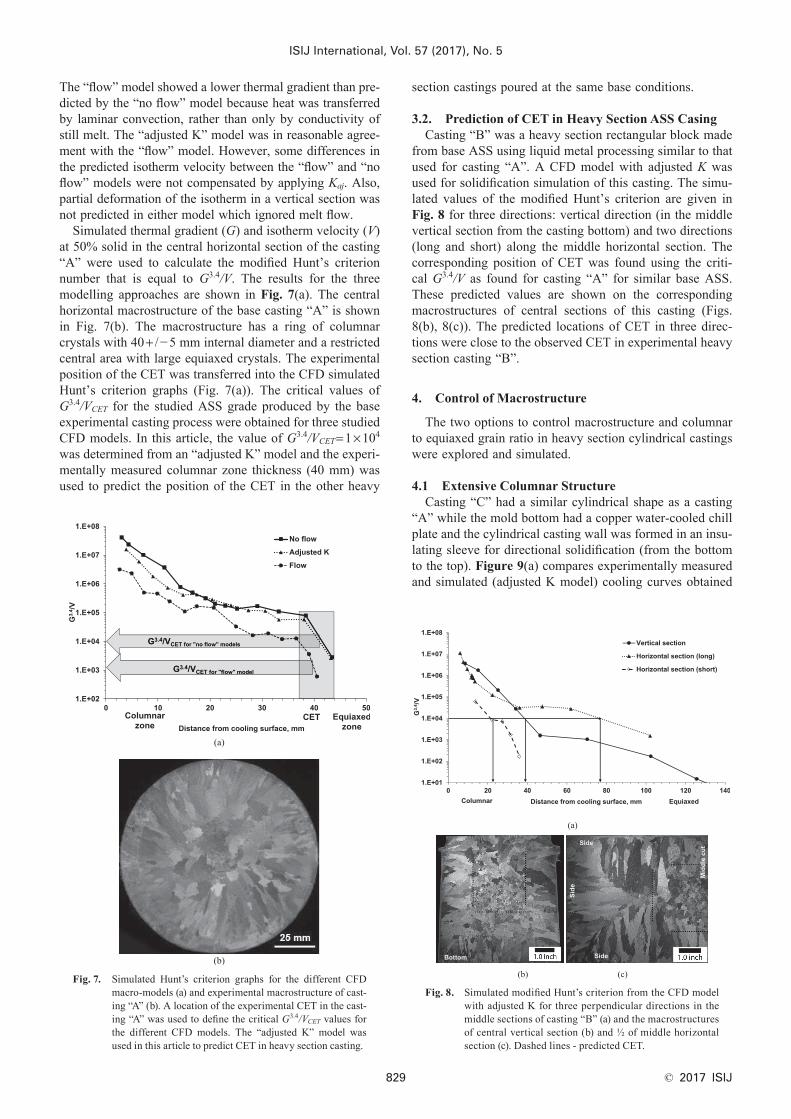
Simulated thermal gradient (G) and isotherm velocity (V) at 50% solid in the central horizontal section of the casting “A” were used to calculate the modified Hunt’s criterion number that is equal to G3.4/V. The results for the three modelling approaches are shown in Fig. 7(a). The central horizontal macrostructure of the base casting “A” is shown in Fig. 7(b). The macrostructure has a ring of columnar crystals with 40+ /−5 mm internal diameter and a restricted central area with large equiaxed crystals. The experimental position of the CET was transferred into the CFD simulated Hunt’s criterion graphs (Fig. 7(a)). The critical values of G3.4/VCET for the studied ASS grade produced by the base experimental casting process were obtained for three studied CFD models. In this article, the value of G3.4/VCET=1×104 was determined from an “adjusted K” model and the experi-mentally measured columnar zone thickness (40 mm) was used to predict the position of the CET in the other heavy
section castings poured at the same base conditions.
3.2. Prediction of CET in Heavy Section ASS CasingCasting “B” was a heavy section rectangular block made
from base ASS using liquid metal processing similar to that used for casting “A”. A CFD model with adjusted K was used for solidification simulation of this casting. The simu-lated values of the modified Hunt’s criterion are given in Fig. 8 for three directions: vertical direction (in the middle vertical section from the casting bottom) and two directions (long and short) along the middle horizontal section. The corresponding position of CET was found using the criti-cal G3.4/V as found for casting “A” for similar base ASS. These predicted values are shown on the corresponding macrostructures of central sections of this casting (Figs. 8(b), 8(c)). The predicted locations of CET in three direc-tions were close to the observed CET in experimental heavy section casting “B”.
4. Control of Macrostructure
The two options to control macrostructure and columnar to equiaxed grain ratio in heavy section cylindrical castings were explored and simulated.
4.1 Extensive Columnar StructureCasting “C” had a similar cylindrical shape as a casting
“A” while the mold bottom had a copper water-cooled chill plate and the cylindrical casting wall was formed in an insu-lating sleeve for directional solidification (from the bottom to the top). Figure 9(a) compares experimentally measured and simulated (adjusted K model) cooling curves obtained
Fig. 7. Simulated Hunt’s criterion graphs for the different CFD macro-models (a) and experimental macrostructure of cast-ing “A” (b). A location of the experimental CET in the cast-ing “A” was used to define the critical G3.4/VCET values for the different CFD models. The “adjusted K” model was used in this article to predict CET in heavy section casting.
Fig. 8. Simulated modified Hunt’s criterion from the CFD model with adjusted K for three perpendicular directions in the middle sections of casting “B” (a) and the macrostructures of central vertical section (b) and ½ of middle horizontal section (c). Dashed lines - predicted CET.
ISIJ International, Vol. 57 (2017), No. 5
© 2017 ISIJ 830
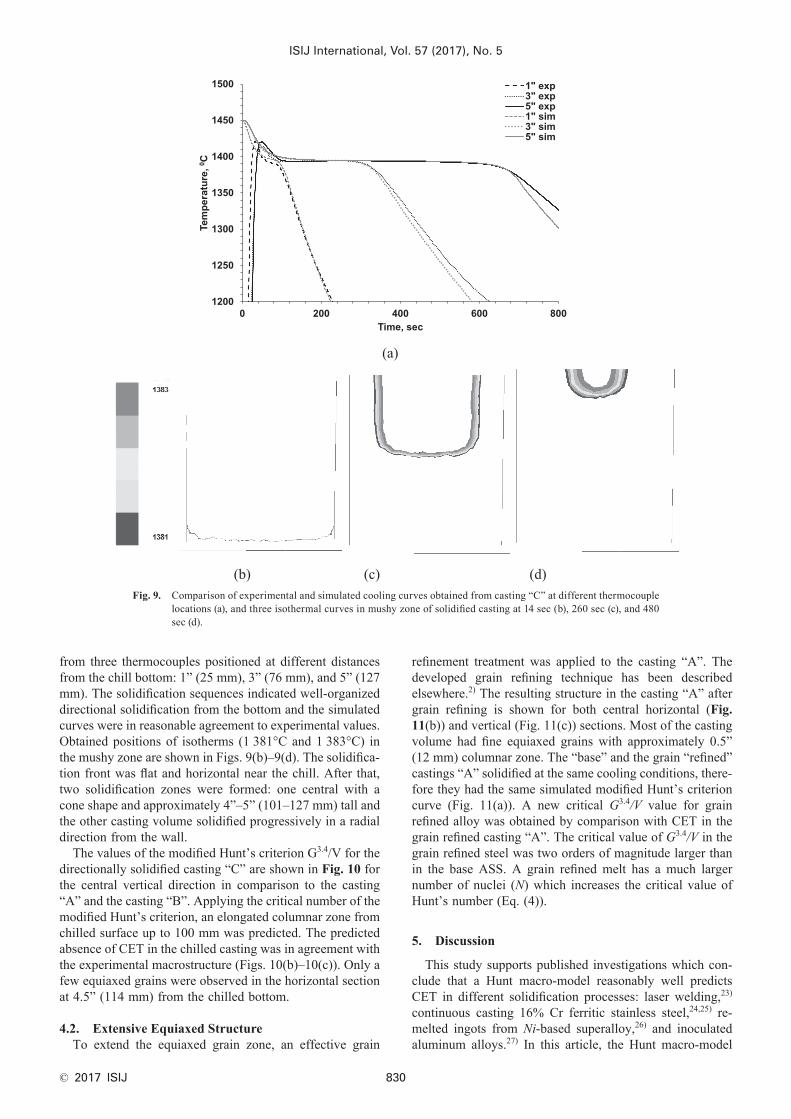
Fig. 9. Comparison of experimental and simulated cooling curves obtained from casting “C” at different thermocouple locations (a), and three isothermal curves in mushy zone of solidified casting at 14 sec (b), 260 sec (c), and 480 sec (d).
from three thermocouples positioned at different distances from the chill bottom: 1” (25 mm), 3” (76 mm), and 5” (127 mm). The solidification sequences indicated well-organized directional solidification from the bottom and the simulated curves were in reasonable agreement to experimental values. Obtained positions of isotherms (1 381°C and 1 383°C) in the mushy zone are shown in Figs. 9(b)–9(d). The solidifica-tion front was flat and horizontal near the chill. After that, two solidification zones were formed: one central with a cone shape and approximately 4”–5” (101–127 mm) tall and the other casting volume solidified progressively in a radial direction from the wall.
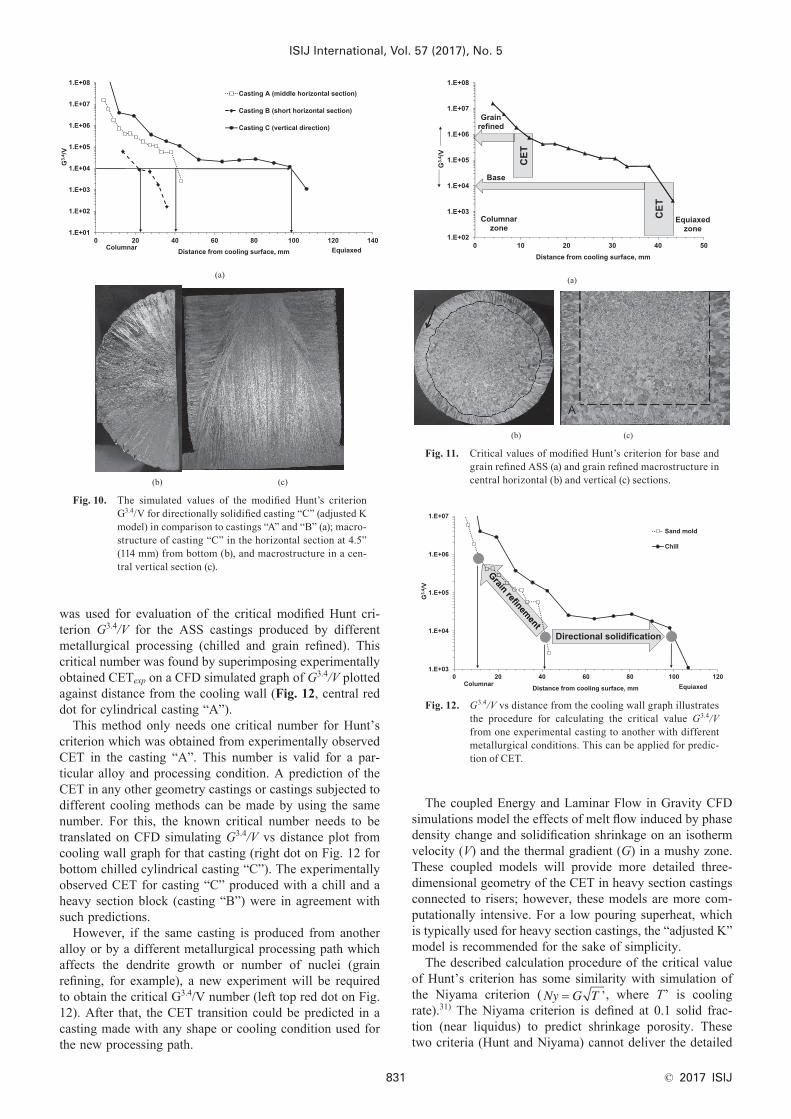
The values of the modified Hunt’s criterion G3.4/V for the directionally solidified casting “C” are shown in Fig. 10 for the central vertical direction in comparison to the casting “A” and the casting “B”. Applying the critical number of the modified Hunt’s criterion, an elongated columnar zone from chilled surface up to 100 mm was predicted. The predicted absence of CET in the chilled casting was in agreement with the experimental macrostructure (Figs. 10(b)–10(c)). Only a few equiaxed grains were observed in the horizontal section at 4.5” (114 mm) from the chilled bottom.
4.2. Extensive Equiaxed StructureTo extend the equiaxed grain zone, an effective grain
refinement treatment was applied to the casting “A”. The developed grain refining technique has been described elsewhere.2) The resulting structure in the casting “A” after grain refining is shown for both central horizontal (Fig. 11(b)) and vertical (Fig. 11(c)) sections. Most of the casting volume had fine equiaxed grains with approximately 0.5” (12 mm) columnar zone. The “base” and the grain “refined” castings “A” solidified at the same cooling conditions, there-fore they had the same simulated modified Hunt’s criterion curve (Fig. 11(a)). A new critical G3.4/V value for grain refined alloy was obtained by comparison with CET in the grain refined casting “A”. The critical value of G3.4/V in the grain refined steel was two orders of magnitude larger than in the base ASS. A grain refined melt has a much larger number of nuclei (N) which increases the critical value of Hunt’s number (Eq. (4)).
5. Discussion
This study supports published investigations which con-clude that a Hunt macro-model reasonably well predicts CET in different solidification processes: laser welding,23) continuous casting 16% Cr ferritic stainless steel,24,25) re-melted ingots from Ni-based superalloy,26) and inoculated aluminum alloys.27) In this article, the Hunt macro-model
ISIJ International, Vol. 57 (2017), No. 5
© 2017 ISIJ831
was used for evaluation of the critical modified Hunt cri-terion G3.4/V for the ASS castings produced by different metallurgical processing (chilled and grain refined). This critical number was found by superimposing experimentally obtained CETexp on a CFD simulated graph of G3.4/V plotted against distance from the cooling wall (Fig. 12, central red dot for cylindrical casting “A”).
This method only needs one critical number for Hunt’s criterion which was obtained from experimentally observed CET in the casting “A”. This number is valid for a par-ticular alloy and processing condition. A prediction of the CET in any other geometry castings or castings subjected to different cooling methods can be made by using the same number. For this, the known critical number needs to be translated on CFD simulating G3.4/V vs distance plot from cooling wall graph for that casting (right dot on Fig. 12 for bottom chilled cylindrical casting “C”). The experimentally observed CET for casting “C” produced with a chill and a heavy section block (casting “B”) were in agreement with such predictions.
However, if the same casting is produced from another alloy or by a different metallurgical processing path which affects the dendrite growth or number of nuclei (grain refining, for example), a new experiment will be required to obtain the critical G3.4/V number (left top red dot on Fig. 12). After that, the CET transition could be predicted in a casting made with any shape or cooling condition used for the new processing path.
The coupled Energy and Laminar Flow in Gravity CFD simulations model the effects of melt flow induced by phase density change and solidification shrinkage on an isotherm velocity (V) and the thermal gradient (G) in a mushy zone. These coupled models will provide more detailed three-dimensional geometry of the CET in heavy section castings connected to risers; however, these models are more com-putationally intensive. For a low pouring superheat, which is typically used for heavy section castings, the “adjusted K” model is recommended for the sake of simplicity.
The described calculation procedure of the critical value of Hunt’s criterion has some similarity with simulation of the Niyama criterion (Ny G T= ’, where T’ is cooling rate).31) The Niyama criterion is defined at 0.1 solid frac-tion (near liquidus) to predict shrinkage porosity. These two criteria (Hunt and Niyama) cannot deliver the detailed
Fig. 10. The simulated values of the modified Hunt’s criterion G3.4/V for directionally solidified casting “C” (adjusted K model) in comparison to castings “A” and “B” (a); macro-structure of casting “C” in the horizontal section at 4.5” (114 mm) from bottom (b), and macrostructure in a cen-tral vertical section (c).
Fig. 11. Critical values of modified Hunt’s criterion for base and grain refined ASS (a) and grain refined macrostructure in central horizontal (b) and vertical (c) sections.
Fig. 12. G3.4/V vs distance from the cooling wall graph illustrates the procedure for calculating the critical value G3.4/V from one experimental casting to another with different metallurgical conditions. This can be applied for predic-tion of CET.
ISIJ International, Vol. 57 (2017), No. 5
© 2017 ISIJ 832
micro-scale analysis, such as particular grain sizes (for Hunt criterion) or shape of shrinkage pores (for Niyama criterion). However, Niyama analysis is very useful when designing gating systems and risers for sound castings. Sim-ilarly, Hunt criterion mapping could be also useful to design processes for a preferred type of macrostructure in austenitic and ferritic stainless steel, which have limited capabilities to change the macrostructure in solid state because of the lack of polymorphous transformations.
6. Conclusions
Several castings from ASS were produced to verify the effects of casting geometry, chilling, and grain refinement on the CET. A simulated transient thermal field for several solidified castings was used to determine an isotherm veloc-ity (V) and a thermal gradient (G) in the melt at 0.5 solid fraction. The critical value of the modified Hunt parameter Gn/V was determined from the macrostructure of the cylin-drical casting. Using this value, the location of the CET was predicted in a heavy rectangular casting and this prediction was in agreement with the experimentally observed macro-structure. Two methods of controlling casting macrostruc-ture were verified experimentally by promoting an extensive columnar zone in a chilled mold and by producing a fine equiaxed grain structure using melt grain refinement. The predicted CET was in agreement with the experimental CET. It was found that the Hunt criterion mapping of CFD simulated temperature fields is a useful tool when designing processes for a preferred change macrostructure.
AcknowledgementsThis study is supported by Kent Peaslee Steel Manufac-
turing Research Center and the authors gratefully thank to the members of the industrial advisers committee of this project for material supply, suggestions in mold design, and regular results discussion. The authors thank Dr. V. Richards for helpful discussion and Dr. D. Robertson for comments that greatly improved the manuscript.
REFERENCES
1) S. M. Seo, I. S. Kim, C. Y. Jo and K. Ogi: Mater. Sci. Eng. A, 25 (2007), 713.
2) S. N. Lekakh, J. Ge, V. Richards, R. O’Malley and J. R. TerBush: Metall. Mater. Trans. B, 48 (2017), Issue1, 406, DOI: 10.1007/s11663-016-0832-5.
3) X. Wu, Y. Yang, J. Zhang, G. Jia and Z. Hu: J. Mater. Eng. Perform., 8 (1999), 525.
4) J. Z. Lu: Acta Mater., 58 (2010), 5354.5) B. Abbasi-Khazaei: J. Mater. Sci. Technol., 10 (2012), 946.6) O. Grong: ISIJ Int., 46 (2006), 824.7) R. Tuttle: Int. J. Metalcast., 6 (2012), issue 2, 51.8) J. S. Park and J. H. Park: Steel Res. Int., 85 (2014), 1303.9) J. D. Hunt: Mater. Sci. Eng., 65 (1984), 75.
10) W. Mirihanage, H. Dai, H. Dong and D. Browne: Adv. Eng. Mater., 15 (2013), 216.
11) S. McFadden and D. Browne: Appl. Math. Model., 22 (2009), 1397.12) C. Wang and C. Beckermann: Metall. Mater. Trans. A, 25A (1994),
1081.13) A. Badillo and C. Beckermann: Acta Mater., 54 (2006), 2015.14) J. Banaszek, S. McFadden, D. Browne and G. Zimmermann: Metall.
Mater. Trans. A, 38A (2007), 1476.15) D. Carvalho, A. Moreira, D. Moutinho, J. Filho, O. Rocha and J.
Spinelli: Mater. Res., 17 (2014), 498.16) M. Rappaz and C. A. Gandin: Acta Metall. Mater., 41 (1993), 345.17) C. A. Gandin and M. Rappaz: Acta Mater., 45 (1997), 2187.18) FESI Group: ProCast, FESI Group, France, http://www. Esi-group.
com, (accessed 02-01-2016).19) J. Roucka, V. Kosour, M. Kovac, V. Krutis and K. Hrbacek: IOP
Conf. Series: Mater. Sci. Eng., 33 (2012), DOI: 10.1088/1757-899X/33/1/012085.
20) A. Burbelco, J. Falkus, W. Kapturkiewicz, K. Solek, P. Drozdz and M. Wrobel: Arch. Metall. Mater., 57 (2012), 379.
21) H. Dai, J. Debelin and M. Newell: Superalloys 2008, TMS, Warrendale, PA, (2008), 367.
22) P. Lan, H. Tang and J. Ahang: Metall. Mater. Trans. A, 47 (2016), 2964.
23) W. Kurz, C. Bezencon and M. Gaumann: Sci. Technol. Adv. Mater., 2 (2001), 185.
24) J. C. Kim, J. J. Kim, J. Y. J. Y. Choi, J. H. Choi and S. K. Kim: La Metallurgia Italiana, September 2009, AIM, Milano, (2009), 43.
25) H. Shibata, S. Itoyama, Y. Kishimoto, S. Takeuchi and H. Sekiguchi: ISIJ Int., 46 (2006), 921.
26) A. Mitchell: Inter. J. Cast. Met. Res., 22 (2009), 216.27) D. Pineda and M. Martorano: Acta Mater., 61 (2013), 1785.28) ANSYS: Fluent, USA, http://www. ansys.com, (accessed 02-10-
2015).29) Sente Software Ltd.: JMatPro,UK, http://www.sentesoftware.co.uk,
(accessed 08-20-2016).30) S. Lekakh and V. Richards: AFS Proc., Paper 11-042, American
Foundry Society, Schaumburg, IL, (2011), 1.31) K. Carlson, S. Ou, R. Hardin and C. Beckermann: Metall. Mater.
Trans. B, 33B (2002), 731.


![Effect of Ladle, Tundish and Mold Design on Melt Flow ...web.mst.edu/~lekakhs/webpage Lekakh/Articles/187.pdf · FLUENT 12.0 CFD software [9] was used to solve multiple cases of 3-D](https://img.pdfslide.us/doc/110x75/5ecf79b96085d9294e78d652/effect-of-ladle-tundish-and-mold-design-on-melt-flow-webmstedulekakhswebpage.jpg)


![Predicting the columnar-to-equiaxed transition for a ...pmt.usp.br/academic/martoran/Publicacoes/ActaMat 2008.pdf · Predicting the columnar-to-equiaxed transition for a ... [9],](https://img.pdfslide.us/doc/110x75/5cec906188c99319498d6130/predicting-the-columnar-to-equiaxed-transition-for-a-pmtuspbracademicmartoranpublicacoesactamat.jpg)