Embed Size (px)
Citation preview
Control of apoptosis in murine B cell hybridomas during stationary batch culture
by Joel R. Charbonneau
A thesis submitted in partial fulfillment of the requirement for the degree of
Master of Science in Chemistry (M.Sc.)
School of Graduate Studies Laurentian University
Sudbury, Ontario
Joel Charbonneau 2001

Acknowledgements
I have devoted many hours of hard work toward obtaining my graduate degree.
However, no amount of hard work would have been sufficient if I did not have the
guidance, encouragement and support of so many people.
First, I would like to thank Dr. Eric Gauthier for his encouragement and guidance,
which was constant during the good and the hard times. Your infectious love for research
will stay with me, always. I would also like to thank Kevin Chartrand and Paul Guérin as
well as the other students who worked in Gauthier’s lab and helped me to vent my
frustrations and have fun. The ‘French Connection’ rules!!
My parents have also been a big source of encouragement and support. You have
moulded my scientific career from a very young age. Thank you!
Finally, I would like to especially thank my family, Renee and Cosette. My wife,
Renee has spent many weekends and one wedding anniversary alone. She also worked
hard to support us financially. Your patience, encouragements, understanding and
sacrifices will never be forgotten. Thank you!
ii
Table of Contents
Acknowledgements............................................................................................................. ii
Table of Contents............................................................................................................... iii
List of Figures .................................................................................................................... vi
List of Tables ..................................................................................................................... ix
List of Abbreviations .......................................................................................................... x
Abstract ............................................................................................................................ xiii
1.0 Introduction.................................................................................................................. 2
1.1 HYBRIDOMA TECHNOLOGY AND MONOCLONAL ANTIBODIES..................................... 2 1.1.1 General aspects of hybridoma technology and monoclonal antibodies............ 2 1.1.2 Hybridoma and monoclonal antibody production ............................................ 3
1.2 APOPTOSIS ................................................................................................................ 7 1.2.1 Apoptosis, development and disease ................................................................ 7 1.2.2 Classic morphological characteristics of apoptosis .......................................... 9 1.2.3 Caspases: the Central Pathway of Apoptosis.................................................. 10
1.2.3.1 Caspases................................................................................................... 10 1.2.3.2 Outcome of Caspase activation............................................................. 13
1.2.4 Induction pathways of Apoptosis.................................................................... 14 1.2.4.1 Extrinsic pathway..................................................................................... 14 1.2.4.2 Intrinsic Pathway ..................................................................................... 16
1.2.5 The Bcl-2 family: Regulators of Apoptosis .................................................... 17 1.2.6 Bcl-xL ............................................................................................................. 20
1.2.6.1 Structure................................................................................................... 21 1.2.6.2 Function ................................................................................................... 23
1.2.6.2.1 Dimerization ..................................................................................... 23 1.2.6.2.2 Mitochondrial homeostasis ............................................................... 25 1.2.6.2.3 Disruption of the Apoptosome.......................................................... 26
1.2.6.3 Regulation ................................................................................................ 26 1.2.6.3.1 Phosphorylation ................................................................................ 26 1.2.6.3.2 Cleavage by caspases........................................................................ 29 1.2.6.3.3 BH3-only protein binding to Bcl-xL................................................. 29 1.2.6.3.4 Alternative splicing........................................................................... 30 1.2.6.3.5 Upregulation of Bcl-xL mRNA ........................................................ 32
2.0 Objectives .................................................................................................................. 34
3.0 Comparison of the culture behaviour of the SP2/0-Ag14 and P3x63-Ag8.653 murine hybridoma cell lines.......................................................................................................... 36
iii

3.1 INTRODUCTION........................................................................................................ 36 3.2 METHODS AND MATERIALS..................................................................................... 39
3.2.1 Reagents.......................................................................................................... 39 3.2.2 Cell lines and cell maintenance....................................................................... 39 3.2.3 Freezing and thawing cells.............................................................................. 40 3.2.4 Long-term stationary batch cell culture .......................................................... 40 3.2.5 DNA laddering assay ...................................................................................... 41 3.2.6 D-glucose and L-glutamine assays ................................................................. 41 3.2.7 Protein extract preparation and Western analysis........................................... 42 3.2.8 MTT Assay ..................................................................................................... 44
3.3 RESULTS.................................................................................................................. 44 3.3.1 Growth and apoptosis in SP2/0-Ag14 and P3x63-Ag8.653 cells in long-term culture ....................................................................................................................... 44 3.3.2 Study of the environmental cause of hybridoma cell death............................ 48 3.3.3 Lack of L-Glutamine is associated with decreased viability by rapidly inducing apoptosis in SP2/0-Ag14 cultures.............................................................. 53
3.4 DISCUSSION............................................................................................................. 57 3.4.1 SP2/0-Ag14 and P3x63-Ag8.653 cells are distinct cell lines even though they share a common lineage............................................................................................ 57 3.4.2 L-glutamine causes apoptosis in SP2/0-Ag14 cell line................................... 58 3.4.3 Another possible inducer of apoptosis in long-term culture........................... 61 3.4.4 Future work and experiments.......................................................................... 62
4.0 Effect of Bcl-xL on SP2/0-Ag14 ............................................................................... 66
4.1 INTRODUCTION........................................................................................................ 66 4.2 METHODS AND MATERIALS..................................................................................... 69
4.2.1 Reagents.......................................................................................................... 69 4.2.2 Cell lines and cell maintenance....................................................................... 69 4.2.3 Long-term stationary batch cell culture .......................................................... 69 4.2.4 DNA laddering assay ...................................................................................... 70 4.2.5 Protein extract preparation and Western analysis........................................... 71 4.2.6 MTT Assay ..................................................................................................... 72 4.2.7 Cell transfection .............................................................................................. 72
4.3 RESULTS ............................................................................................................ 73 4.3.1 Generation of Bcl-xL-transfected SP2/0-Ag14 hybridoma cells.................... 73 4.3.2 Bcl-xL confers apoptosis resistance to SP2/0-Ag14....................................... 75 4.3.3 Bcl-xL increases viability in cultures lacking L-glutamine............................ 78 4.3.4 Bcl-xL overexpression prolongs SP2/0-Ag14’s viability in long-term culture by delaying apoptosis................................................................................................ 81 4.3.5 Bcl-xL-transfected SP2/0-Ag14 are still distinct from P3x63-Ag8.653 cells 84
4.4 DISCUSSION............................................................................................................. 86 4.4.1 Bcl-xL expression in SP2/0-Ag14 restores its apoptosis resistance to levels similar to P3x63-Ag8.653......................................................................................... 86 4.4.2 Future work and experiments.......................................................................... 88
5.0 Mutagenesis of Bcl-xL and its effect on SP2/0-Ag14 ............................................... 90
5.1 INTRODUCTION........................................................................................................ 90
iv
5.2 METHODS AND MATERIALS..................................................................................... 93 5.2.1 Reagents and methods..................................................................................... 93 5.2.2 Cell lines and cell maintenance....................................................................... 93 5.2.3 Long-term stationary batch cell culture .......................................................... 94 5.2.4 DNA laddering assay ...................................................................................... 94 5.2.5 Protein extract preparation and Western analysis........................................... 95 5.2.6 MTT Assay ..................................................................................................... 96 5.2.7 RNA Isolation and Reverse transcription ....................................................... 97 5.2.8 Touchdown Polymerase Chain reaction (PCR) .............................................. 97 5.2.9 Cloning............................................................................................................ 99 5.2.10 PCR-mediated mutagenesis ........................................................................ 103 5.2.11 Cracking Gel Method.................................................................................. 108 5.2.12 Transfection of SP2/0-Ag14 murine cells................................................... 109
5.3 RESULTS................................................................................................................ 110 5.3.1 Mutagenesis and Cloning of Bcl-xL-HA, Bcl-xL-HA/V126G, Bcl-xL-HA/∆loop ................................................................................................................ 110 5.3.2 Generation of mutated Bcl-xL-transfected SP2/0-Ag14 hybridoma cells .... 113 5.3.3 Differential resistance to apoptosis by the expression of mutated Bcl-xL ... 116 5.3.4 Bcl-xL/V126G has no effect on the long-term culture of SP2/0-Ag14 ........ 120 5.3.5 Bcl-xL/∆loop apoptosis resistance is concentration-dependent in long term culture ..................................................................................................................... 122
5.4 DISCUSSION........................................................................................................... 124 5.4.1 The V126G mutation completely destroys the function of Bcl-xL .............. 124 5.4.2 Deletion of the loop domain increases the expression of Bcl-xL but also decreases its function .............................................................................................. 125 5.4.3 Bcl-xL/∆loop function is concentration-dependent or concentration-independent, depending on the apoptotic inducer................................................... 127 5.4.4 Bcl-xL/∆loop significantly extended the longevity of SP2/0-Ag14 cells in long-term culture in a concentration-dependent manner and suggests a second inducer of apoptosis in long-term culture that is CHX-like ................................... 128 5.4.5 Future work and experiments........................................................................ 130
6.0 General Discussion .................................................................................................. 133
7.0 References................................................................................................................ 140
v
List of Figures
Figure 1.1: Monoclonal antibody production using hybridomas........................................ 4
Figure 1.2: Apoptosis and necrosis..................................................................................... 8
Figure 1.3: Apoptosis pathways........................................................................................ 12
Figure 1.4: Schematic drawing of members of the Bcl-2 family...................................... 19
Figure 1.5: Structure of Bcl-xL......................................................................................... 22
Figure 1.6: Three hypothetical models for the protective functions of Bcl-2 family members............................................................................................................................ 24
Figure 1.7: Regulation of Bcl-xL function. ...................................................................... 28
Figure 1.8: Regulation of Bcl-xL through binding of Bad. .............................................. 31
Figure 3.1: Growth behavior of SP2 (A) and P3 (B) in stationary batch culture. ............ 46
Figure 3.2: Apoptosis of SP2 and P3 during long-term culture........................................ 47
Figure 3.3: Effect of daily replacement of culture medium on the growth behaviour of SP2 (A) and P3 (B) cultures.............................................................................................. 49
Figure 3.4: Growth behaviour of SP2 and P3 in limited growth factor conditions. ......... 51
Figure 3.5: Glucose and Glutamine consumption during long-term growth culture conditions in SP2 (circles) and P3 (squares) cultures....................................................... 52
Figure 3.6: Differential reduction in viability caused by apoptosis in SP2 and P3 due to lack of L-Glutamine.......................................................................................................... 54
Figure 3.7: Effect of glutamine (gln) supplementation on SP2 and P3 viability during prolonged culture. ............................................................................................................. 56
Figure 3.8: Sources of glutamine and possible products for the use of glutamine by cells............................................................................................................................................ 59
Figure 4.1: Protein expression levels of Bcl-xL in different cells analysed western blot. 74
Figure 4.2: Differential reduction in viability in SP2, P3, SP2/PTEJ8 clone 5 and SP2/Bcl-xL clone 1. .......................................................................................................... 76
vi
Figure 4.3: Bcl-xL protects SP2 from CHX induced apoptosis........................................ 77
Figure 4.4: Differential reduction of viability of SP2/pTEJ8 clone 5 and SP2/Bcl-xL clone 1 caused by lack of L-Glutamine. ........................................................................... 79
Figure 4.5: Growth behaviour of our cell lines when cultured without glutamine........... 80
Figure 4.6: Effect of Bcl-xL on the growth behaviour of SP2/pTEJ8 clone 4 (A) and SP2/Bcl-xL clone 1 (B) were analysed during stationary batch culture. .......................... 82
Figure 4.7: Apoptosis of SP2/pTEJ8 and SP2/Bcl-xL during long-term culture confirmed by DNA Fragmentation analysis....................................................................................... 83
Figure 4.8: Growth behaviour of SP2/pTEJ8 and SP2/Bcl-xL in limited growth factor conditions.......................................................................................................................... 85
Figure 5.1: Vectors used during the cloning of Bcl-xL, Bcl-xL/V126G and Bcl-xL/∆loop.......................................................................................................................................... 101
Figure 5.2: RT/PCR of Bcl-xL-HA and cloning into pTEJ8. ......................................... 102
Figure 5.3: PCR-mutagenesis of Bcl-xL/V126G and cloning into pTEJ8. .................... 104
Figure 5.4: PCR-mutagenesis of Bcl-xL/∆loop and cloning into pTEJ8........................ 107
Figure 5.5: PCR mediated mutagenesis of Bcl-xL/V126 and Bcl-xL/∆loop.................. 111
Figure 5.6: Cloning of cDNA products into pTAdv and pTEJ8..................................... 112
Figure 5.7: Protein expression levels of Bcl-xL-HA mutant expressing SP2 cells. ....... 114
Figure 5.8: Effect of mutagenesis of Bcl-xL on the resistance to apoptosis of SP2....... 117
Figure 5.9: Differential protection of Bcl-xL mutations in SP2 cells exposed to CHX induces apoptosis. ........................................................................................................... 118
Figure 5.10: Differential protection of Bcl-xL mutations in SP2 cells exposed to lack of L-glutamine induced apoptosis. ...................................................................................... 119
Figure 5.11: Effect of Bcl-xL/V126G on the growth behaviour of SP2......................... 121
Figure 5.12: Effect of Bcl-xL/∆loop on the growth behaviour of SP2........................... 123
Figure 6.1: Model 1 - Glutamine deprivation induce apoptosis via a decrease in glutathione (GSH)........................................................................................................... 134
Figure 6.2: Model 2 - Induction of apoptosis by CHX and concentration dependent protection by Bcl-xL. ...................................................................................................... 136
vii

Figure 6.3: Regulation of Bcl-xL function by phosphorylation of the loop domain during long-term growth culture. ............................................................................................... 138
viii

List of Tables
Table 5.1: Sequence of oligonucleotides used as primers in PCR and mutagenesis experiments. ...................................................................................................................... 98
Table 5.2: Relative expression of Bcl-xL proteins and protection from different inducers of apoptosis. .................................................................................................................... 127
ix

List of Abbreviations Units of Measurement %: percent ±: plus or minus °C: degree Celsius µF: microFarads µl: microlitre µg: microgram bp: base pair cm2: centimetre squared g: gram kDa: kiloDalton kV: kilovolts l: litre min: minute(s) ml: millilitre mg: milligram M: molar concentration mM: millimolar concentration nm: nanometer pM: picomolar concentration pmol: picomole RPM: rotations per minute S: Svedberg sec: second V: volts Reagents and techniques BSA: bovine serum albumin CHX: cycloheximide DMSO: dimethyl sulfoxide DTT: dithiothreitol ECL: enhanced chemiluminescence EDTA: ethylenediaminetetraacetic acid FBS: fetal bovine serum HAT: hypoxanthine + aminopterin + thymidine IPTG: Isopropylthio-β-D-galactoside LB agar: Luria Bertani agar MTT: 3-(4,5-dimethylthiazol-2-yl)-2,5-diphenyltetrazolium bromide NMR: nuclear magnetic resonance PAGE: polyacrylamide gel electrophoresis PBS: phosphate buffered saline PEG: polyethylene glycol PMSF: phenylmethylsulfonylfluoride SDS: sodium dodecyl sulphate TTBS: tris buffered saline with Tween 20 X-Gal: 5-bromo-4-chloro-3-indolyl-β-D-galactopyranoside Molecular Biology abbreviations ATP: adenosine 5’-triphosphate AS: anti-sens cDNA: complementary DNA DNA: deoxyribonucleic acid dATP: deoxyadenosine 5’-triphosphate dCTP: deoxycytidine 5’-triphosphate dGTP: deoxyguanosine 5’-triphosphate
x

dTTP: deoxythymidine 5’-triphosphate dNTP: a mixture of dATP, dTTP, dGTP and dCTP DNA: deoxyribonucleic acid HIFI: high fidelity PCR: polymerase chain reaction mRNA: messenger RNA RNA: ribonucleic acid RT: reverse transcription UTR: untranslated region Nitrogenated bases A: adenosine C: cytidine G: guanosine T: Thymidine Amino Acids A: alanine C: cysteine D: aspartic acid E: glutamate F: phenylalanine G: glycine H: histidine I: isoleucine K: lysine L: leucine M: methionine N: asparagine P: proline Q: glutamine R: arginine S: Ser : serine T: Thr: threonine V: valine W: tryptophan Y: tyrosine X: R, Q or G Gln: glutamine Proteins and enzymes AIF: apoptosis inducing factor ANT: adenine nucleotide translocase Apaf-1: apoptotic protease-activating factor-1 Bad: Bcl-xL-associated death inducer Bax: Bcl-2 associated x protein Bcl-xL/S: B-cell lymphoma x long/short CAD: caspase-activated deoxyribonuclease Caspases: cysteinyl asparate-specific proteases Cyt c: cytochrome c Diablo: direct IAP-binding protein with low pI DISC: death inducing signalling complex DNA-PK: DNA dependent protein kinase Epo: erythropoietin ERK: extracellular regulated kinase FADD: Fas-associated death domain GADD: growth arrest and DNA damage-inducible gene
xi

HGPRT: hypoxanthine guanine phosphoribosyl transferase HRP: horseradish peroxidase IAP: inhibitor of apoptosis protein ICAD: inhibitor of CAD Jak: janus kinase MAPK: mitogen-activated protein kinase MKP: MAP kinase phosphatase PARP: poly(ADP-ribose) polymerase PKA: protein kinase A PKB: protein kinase B PKC: protein kinase C pRb: retinoblastoma protein PTP: permeability transition pore Smac: second mitochondria-derived activator of caspases STAT: signal transducer and activator of transcription TNF: tumor necrosis factor Trail: TNF-related apoptosis-inducing ligand VDAC: voltage-dependent anion channel Protein Domains BH: Bcl-2 homology domain CARD: caspase recruitment domain DD: death domain DED: death effecter domain HA: Influenza Hemagglutinin epitope Miscellaneous 3D: 3 dimensional AIDS: acquired immune deficiency syndrome ATCC: American Type Culture Collection Bcl: B-cell lymphoma FACS: fluorescence activated cell sorter HIV: human immunodeficiency virus Ig: Immunoglobulin IL: interleukin GSH: glutathione P3: P3x63Ag8.653 SP2: SP2/0-Ag14 UV: ultraviolet wt: wild type
xii
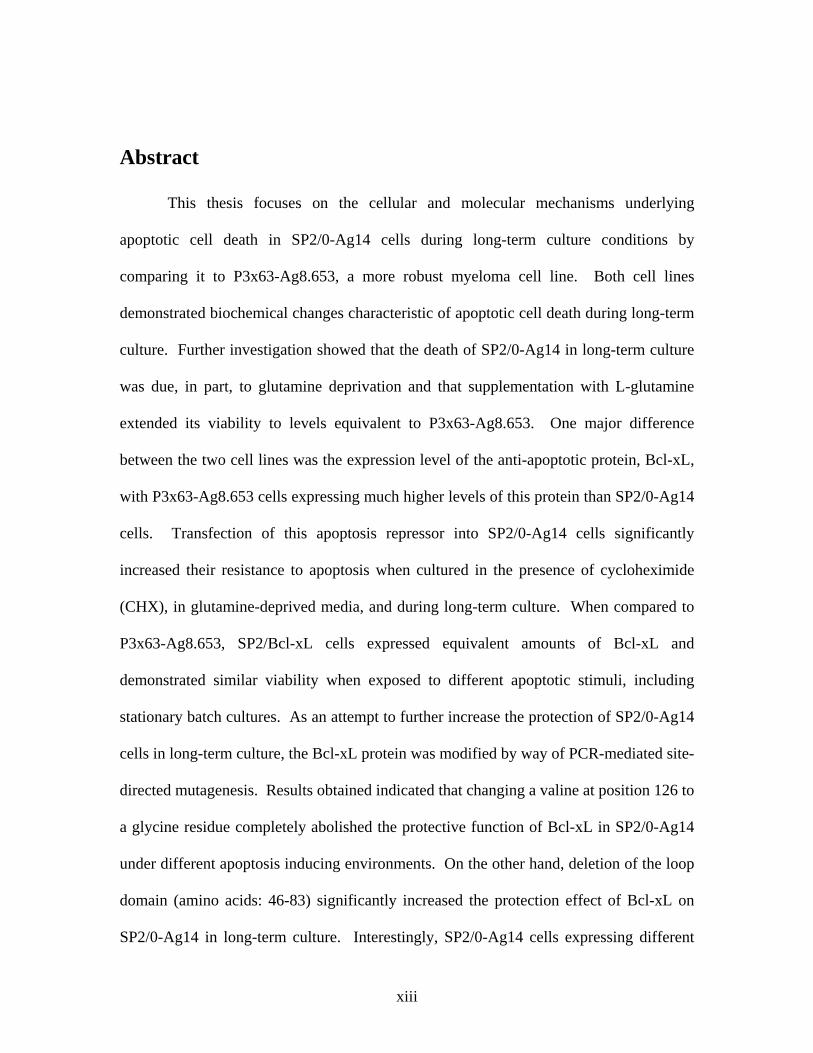
Abstract
This thesis focuses on the cellular and molecular mechanisms underlying
apoptotic cell death in SP2/0-Ag14 cells during long-term culture conditions by
comparing it to P3x63-Ag8.653, a more robust myeloma cell line. Both cell lines
demonstrated biochemical changes characteristic of apoptotic cell death during long-term
culture. Further investigation showed that the death of SP2/0-Ag14 in long-term culture
was due, in part, to glutamine deprivation and that supplementation with L-glutamine
extended its viability to levels equivalent to P3x63-Ag8.653. One major difference
between the two cell lines was the expression level of the anti-apoptotic protein, Bcl-xL,
with P3x63-Ag8.653 cells expressing much higher levels of this protein than SP2/0-Ag14
cells. Transfection of this apoptosis repressor into SP2/0-Ag14 cells significantly
increased their resistance to apoptosis when cultured in the presence of cycloheximide
(CHX), in glutamine-deprived media, and during long-term culture. When compared to
P3x63-Ag8.653, SP2/Bcl-xL cells expressed equivalent amounts of Bcl-xL and
demonstrated similar viability when exposed to different apoptotic stimuli, including
stationary batch cultures. As an attempt to further increase the protection of SP2/0-Ag14
cells in long-term culture, the Bcl-xL protein was modified by way of PCR-mediated site-
directed mutagenesis. Results obtained indicated that changing a valine at position 126 to
a glycine residue completely abolished the protective function of Bcl-xL in SP2/0-Ag14
under different apoptosis inducing environments. On the other hand, deletion of the loop
domain (amino acids: 46-83) significantly increased the protection effect of Bcl-xL on
SP2/0-Ag14 in long-term culture. Interestingly, SP2/0-Ag14 cells expressing different
xiii

levels of Bcl-xL/∆loop mutant showed a concentration-dependent protection against
CHX-induced apoptosis and a concentration-independent protection when cultured
without glutamine. These results may give new insights into the apoptotic pathways of
myeloma/hybridoma cell and their regulation by Bcl-xL.
xiv

Chapter 1 Introduction
1.0 Introduction
1.1 Hybridoma technology and monoclonal antibodies
1.1.1 General aspects of hybridoma technology and monoclonal
antibodies
Biotechnology has progressed by leaps and bounds since the 1970s. Many
discoveries revolutionized the world we live in, and developed into better crops, new
products and better therapies in medicine. One of these potential medical therapies was
developed in 1975 by G. Kohler and C. Milstein. They engineered cells called
hybridomas that are immortalized (continuously divide) while producing antibodies in
culture and suggested that “such cultures could be valuable for medical and industrial
use” (Kohler et al. 1975). Today, antibody therapies show potential to treat diverse
conditions that include viral infections, inflammatory diseases and cancers (Casadevall
1999; Green et al. 2000).
The antibodies secreted by these specialized cells are called “monoclonal
antibodies.” They consist of a single type of antibody that recognize only one specific
epitope – a specific region of an antigenic molecule such as a cluster of several amino
acid side chains on the surface of a protein (Alberts et al. 1989). Their unique specificity
makes them more useful than polyclonal antibodies or antisera which contain a mixture
of antibodies that recognize more than one epitope on a antigen and can also cross-react
with other antigens (Wolfe 1995). The greater specificity of monoclonal antibodies is
desired for their applications in research and therapies. Furthermore, their production in
2

vitro makes them easier to purify than antibodies purified from crude sera. Reduced
costs and decreased complications such as serum sickness caused by foreign antigen
contamination are two advantages for producing monoclonal antibodies with hybridomas
(Casadevall 1999).
Kohler and Milstein developed hybridomas because B cells which produce
antibodies as part of the immune response of the body die after a few days in culture due
to the lack of cytokine survival stimulation in the in vitro environment. A solution to this
problem is to fuse these B cells which secrete the desired antibody with a compatible cell
which strives in culture, a B-cell myeloma. Myeloma cells are cancerous plasma cells
that are easy to culture in vitro. Once a B cell and a myeloma cell are fused, the resulting
hybrid cell, the hybridoma, will possess the desired qualities of both cell lines; the
antibody secreting capability of the B cell and the immortalized quality of the myeloma
cell. Once a hybridoma that produces antibodies of the desired specificity is obtained, the
cells can be cultured indefinitely to produce unlimited supplies of monoclonal antibodies.
1.1.2 Hybridoma and monoclonal antibody production
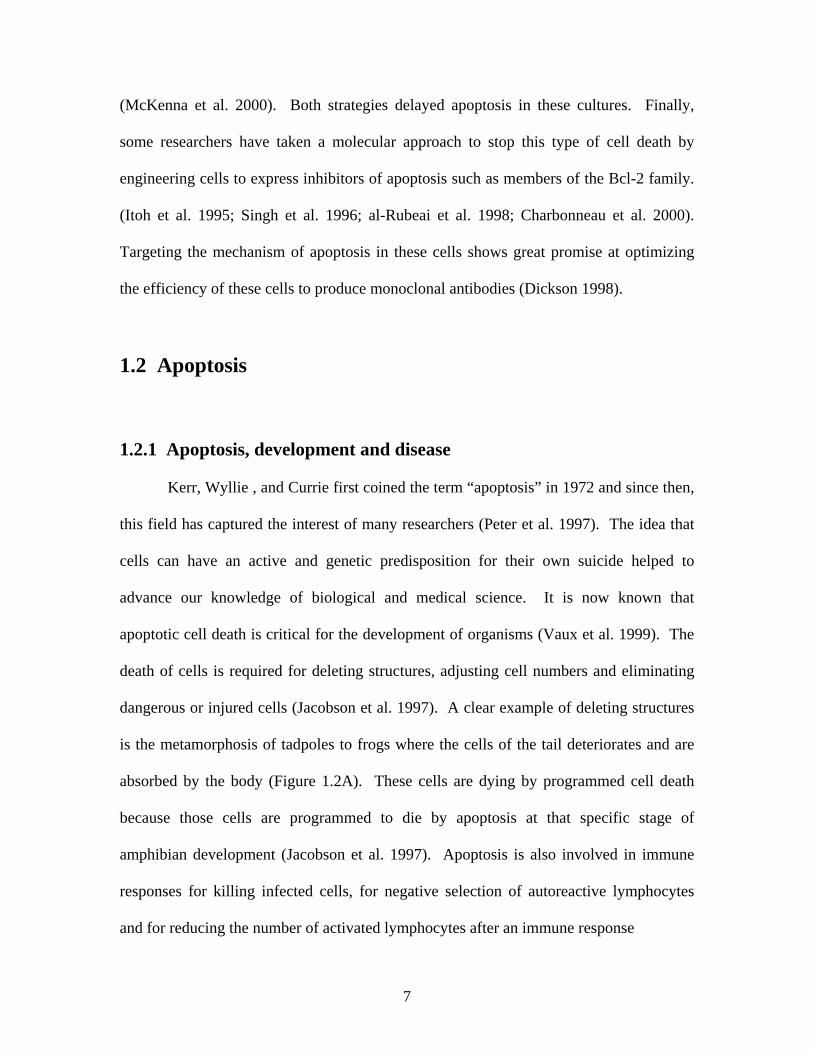
The technique to produce hybridoma cells involves many steps (Figure 1.1A), the
first of which is the selection of the right fusion partners. B cells that express antibodies
against the desired antigen are collected from the spleen of a mouse that has been
immunized with the antigen in question. The immunized mouse will have activated B
cells in this organ. As mentioned above, these cells die after a few days in culture. The
other fusion partner is a myeloma cell line isolated from BALB/c mice. The cell line
originally used by Köhler and Milstein was P3x63-Ag8 which was selected for having a
3
BA
Hypoxanthine
Hypoxanthine guanine
phosphoribosyl transferase Thymidine
Kinases
Phosphoribosyl Pyrophosphate +
Uridylate
Aminopterin
Thymidine
Nucleotides
De novo pathway
Salvage Pathway
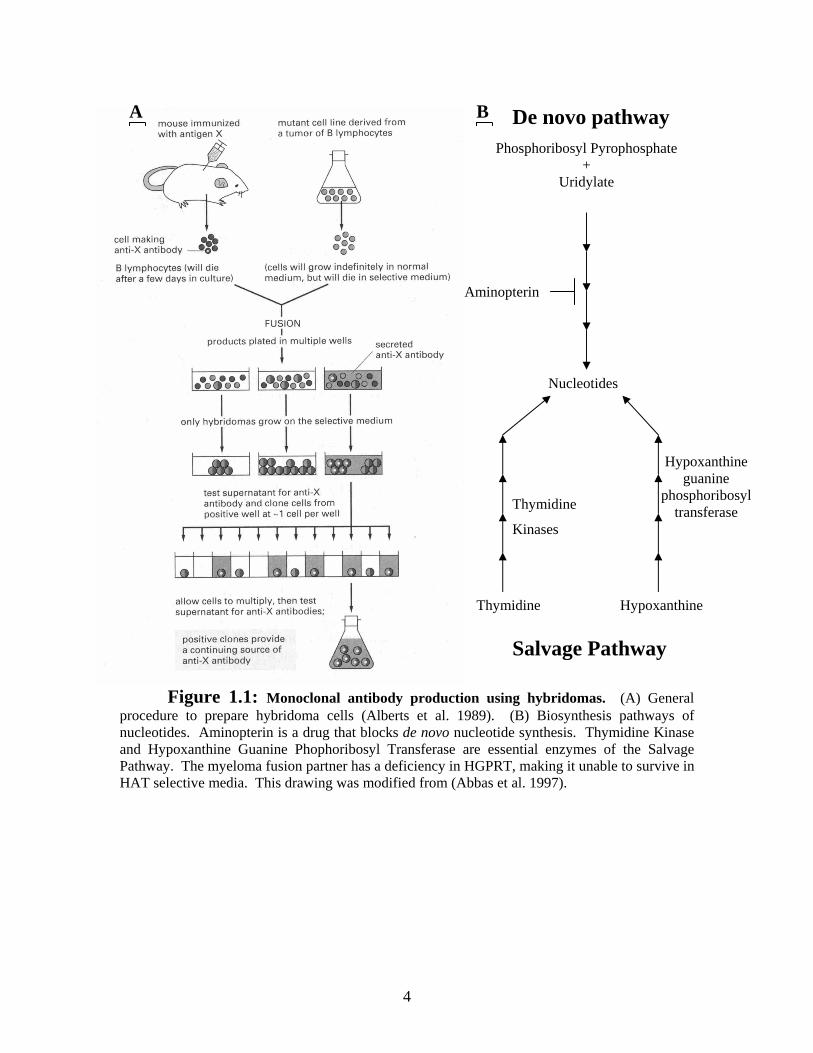
Figure 1.1: Monoclonal antibody production using hybridomas. (A) General procedure to prepare hybridoma cells (Alberts et al. 1989). (B) Biosynthesis pathways of nucleotides. Aminopterin is a drug that blocks de novo nucleotide synthesis. Thymidine Kinase and Hypoxanthine Guanine Phophoribosyl Transferase are essential enzymes of the Salvage Pathway. The myeloma fusion partner has a deficiency in HGPRT, making it unable to survive in HAT selective media. This drawing was modified from (Abbas et al. 1997).
4
mutated Hypoxanthine Guanine Phosphoribosyl Transferase (HGPRT) gene. This gene
encodes an important enzyme of the salvage pathway of pyrimidine synthesis (Figure
1.1B). From the P3x63-Ag8 cell line, other clones have been isolated to produce better
hybridomas (Grosclaude 1988). P3x63-Ag8.653 and SP2/0-Ag14 are better fusion
partners because they do not produce heavy or light immunoglobulin chains, thus they do
not interfere with the immunoglobulin chains of the B cell that they are fused with
(Shulman et al. 1978; Kearney et al. 1979).
The next step is the fusion of both cell lines and the selection for hybrid cells.
Cell fusion can be done with a lipolytic reagent such as polyethylene glycol (PEG), with
an electric field or with viruses like the vesicular stomatitis virus (Kennett 1979;
Grosclaude 1988; Nagata et al. 1991). After fusion, unfused B cells die in culture after a
few days; however, unfused myeloma cells must be eliminated. This is done by the use
of a Hypoxanthine/Aminopterin/Thymidine (HAT) selection media which takes
advantage of the HGPRT deficient status of the myeloma cells. Aminopterin is a drug
that blocks the de novo production of nucleotides. This forces cells to use the Salvage
pathway (Figure 1.1B) to synthesize their nucleotides from hypoxanthine and thymidine
in the media. The myeloma cells cannot produce pyrimidines because of their deficiency
in HGPRT, therefore, they die. In contrast, hybridoma cells will survive in this medium
because they have acquired a functional HGPRT gene from the B cell’s genome. The
surviving cells can then be cloned and screened for the production of antibodies that have
the correct specificity. The resulting hybridomas can survive indefinitely in culture while
producing monoclonal antibodies (Wolfe 1995)..
5
However, some problems are encountered with hybridoma cultures. The fusion
frequently fails, therefore, B cells producing a desired antibody are often lost (Wolfe
1995). Secondly, for unknown reasons, hybridomas are more easily produced from
mouse rather than human B cells (Wolfe 1995). Furthermore, immunotherapy using
mouse-derived antibodies provokes an unfavourable immune response in the patient
against the foreign antibodies. As a result, antibody engineering to switch the conserved
regions of mouse antibodies to human conserved regions has become an important
research field (Wolfe 1995; Hayden et al. 1997; Hudson 1999). Finally, hybridomas
sometimes have decreased viability under certain culturing conditions like during
agitation in bioreactors and during prolonged stationary culture (Linardos et al. 1991;
Gaertner et al. 1993a; Doverskog et al. 1997; al-Rubeai et al. 1998). This loss of viability
limits the number of cells in culture available to produce monoclonal antibodies, thus
limiting the yield.
Many research teams have tackled the problem of low viability in hybridoma
cultures. Some have studied the nutritional needs of these cultures to maximize their
viability and antibody production (Gaertner et al. 1993b; Bibila et al. 1995; Sanfeliu et al.
1996). Others have analysed how these cells die and found that they die by a specific
type of cell death called apoptosis (Vomastek et al. 1993; Mercille et al. 1994; Singh et
al. 1997). Further studies showed that this form of cell death was induced by a lack of
specific amino acids in the culture medium, therefore, successful attempts were made to
improve culture viability by replenishing these amino acids (Franek 1995; Petronini et al.
1996; Franek et al. 1996a, 1996b). Other groups supplemented interleukin-6, a cytokine
that promotes cell survival (Chung et al. 1997) or added synthetic apoptosis inhibitors
6
(McKenna et al. 2000). Both strategies delayed apoptosis in these cultures. Finally,
some researchers have taken a molecular approach to stop this type of cell death by
engineering cells to express inhibitors of apoptosis such as members of the Bcl-2 family.
(Itoh et al. 1995; Singh et al. 1996; al-Rubeai et al. 1998; Charbonneau et al. 2000).
Targeting the mechanism of apoptosis in these cells shows great promise at optimizing
the efficiency of these cells to produce monoclonal antibodies (Dickson 1998).
1.2 Apoptosis
1.2.1 Apoptosis, development and disease
Kerr, Wyllie , and Currie first coined the term “apoptosis” in 1972 and since then,
this field has captured the interest of many researchers (Peter et al. 1997). The idea that
cells can have an active and genetic predisposition for their own suicide helped to
advance our knowledge of biological and medical science. It is now known that
apoptotic cell death is critical for the development of organisms (Vaux et al. 1999). The
death of cells is required for deleting structures, adjusting cell numbers and eliminating
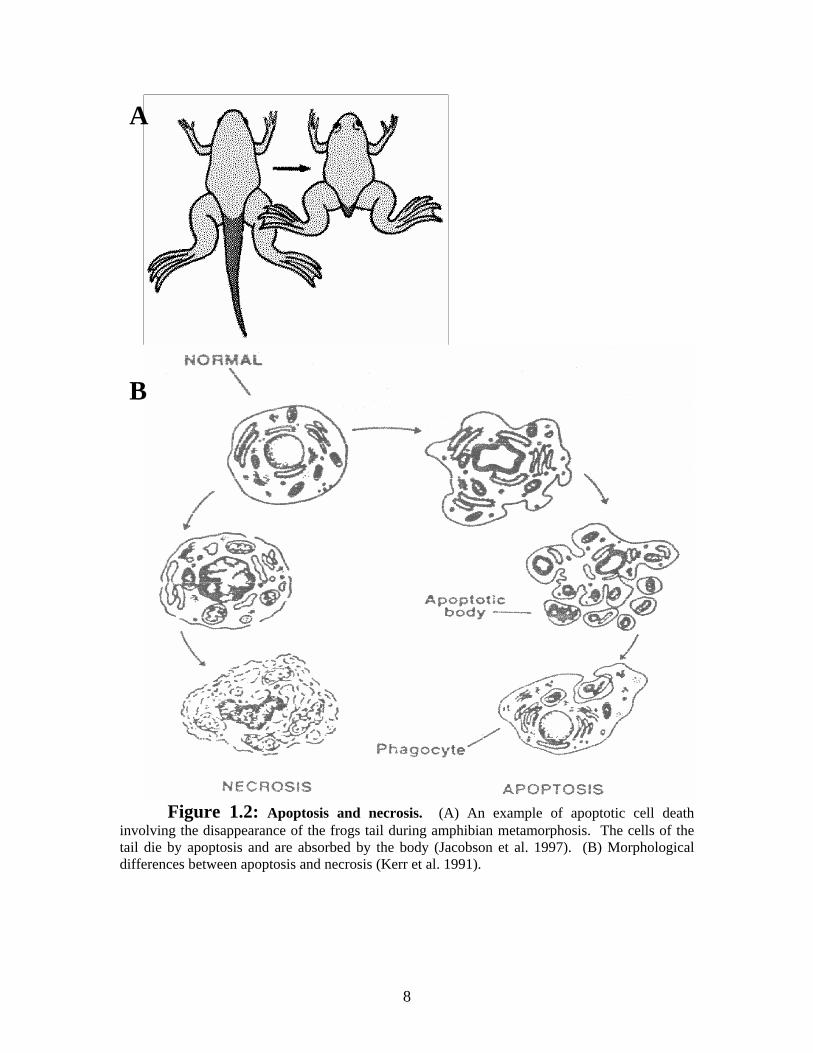
dangerous or injured cells (Jacobson et al. 1997). A clear example of deleting structures
is the metamorphosis of tadpoles to frogs where the cells of the tail deteriorates and are
absorbed by the body (Figure 1.2A). These cells are dying by programmed cell death
because those cells are programmed to die by apoptosis at that specific stage of
amphibian development (Jacobson et al. 1997). Apoptosis is also involved in immune
responses for killing infected cells, for negative selection of autoreactive lymphocytes
and for reducing the number of activated lymphocytes after an immune response
7
B
A
Figure 1.2: Apoptosis and necrosis. (A) An example of apoptotic cell death involving the disappearance of the frogs tail during amphibian metamorphosis. The cells of the tail die by apoptosis and are absorbed by the body (Jacobson et al. 1997). (B) Morphological differences between apoptosis and necrosis (Kerr et al. 1991).
8
(Winoto 1997; Chervonsky 1999; Wold et al. 1999; LeGrand 2000). But, some
infectious organisms have even developed ways of disrupting apoptosis to their
advantage. Viruses have many inhibitors of apoptosis that thwart this last line of defence
for the host organism (Barry et al. 1998; Tschopp et al. 1998).
Apoptosis is such a common and crucial event in the human body that its
deregulation results in diseases. The outcome of deregulation of apoptosis causes either
an increase or a decrease of cell death. Increased apoptosis is linked to decreased cell
numbers that cause neurodegenerative disorders (Alzheimer’s and Huntington’s disease),
autoimmune disorders (multiple sclerosis) as well as others. AIDS, acquired immune
deficiency syndrome, is developed by the gradual depletion of T-helper cells, a
component of the immune system, following infection by the human immunodeficiency
virus (HIV). An unwanted increase in cell numbers from decreased apoptosis also causes
diseases such as cancers and autoimmune diseases (lupus) (Chervonsky 1999; Fadeel et
al. 1999). The implication of deregulated apoptosis in many diseases has raised the
possibility of artificially manipulating apoptosis to treat these diseases (MacCorkle et al.
1998; Bamford et al. 2000; Kaufmann et al. 2000). This noble and profitable possibility
has encouraged researchers to double their efforts to elucidate the mechanisms and
regulatory factors that underlie apoptosis.
1.2.2 Classic morphological characteristics of apoptosis
Researchers realized that there was more than one way for cells to die when they
noticed that some dying cells had a different cellular morphology than others. Necrosis is
a type of cell death caused by an insult to the cell resulting in morphological changes like
9
swelling of the cell, dilation of the mitochondria, dissolving of other organelles and
finally, the rupture of the plasma membrane (Thompson 1998) (Figure 1.2B). On the
other hand, researchers noticed that dying cells sometimes had another morphology that
was later called ‘apoptosis’ (Figure 1.2B). Apoptotic cells show cell shrinkage,
membrane blebbing, chromatin condensation, nuclear fragmentation, production of
apoptotic bodies which are then phagocytosed by surrounding cells or undergo secondary
necrosis (Kerr et al. 1994; Thompson 1998). These two types of cell death are very
different and result in different effects in an organism. When a cell dies by necrosis, its
content is spilled into the surrounding environment, producing an inflammatory response.
But because the cell’s content is neatly packaged in the apoptotic bodies during
apoptosis, there is no inflammatory response.
1.2.3 Caspases: the Central Pathway of Apoptosis
1.2.3.1 Caspases
The morphological changes associated with apoptosis are due to many biochemical
reactions. Because apoptosis is similar between different cell types and organisms, there
must be a conserved central pathway. It is now accepted that this conserved central
pathway is composed of caspases (cysteinyl asparate-specific proteases) (Zhivotovsky et
al. 1997). These proteases have a conserved cysteine in their catalytic site (generally
QACXG, where X is R, Q or G), which enables them to cleave their substrates after an
aspartate residue found in specific recognition motifs (Cohen 1997; Wolf et al. 1999).
Caspases are found in the cell as inactive proenzymes and must be cleaved into a large
and a small subunit. The active enzyme is a heterotetramer consisting of 2 small (~10
10

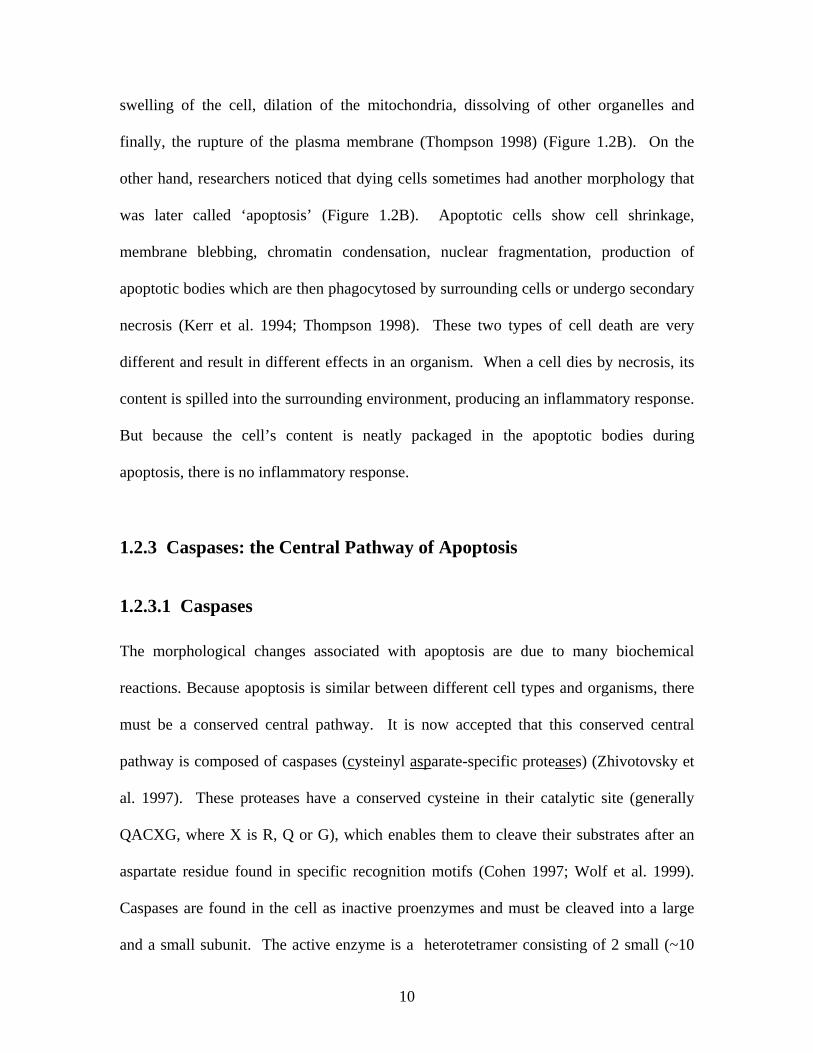
kDa) and 2 large (~20 kDa) subunits presenting 2 catalytic sites. After the induction of
apoptosis, the death signal converges onto the central caspase pathway (Figure 1.3C)
starting with initiator caspases, which trigger the cascade of proteolytic activation of
effector caspases. The latter amplify the signal by cleaving other initiator and effector
caspases, and finally execute the death sentence by cleaving specific substrates, causing
the morphological and functional changes characteristic of apoptosis.
Initiator caspases are at the apex of the caspase activation cascade and include
caspase-2, 8, 9, 10 and 12. These caspases contain a long N-terminal prodomain which
allows them to interact with adapter molecules such as FADD (Fas-associated death
domain) for caspase-8 and Apaf-1 (apoptotic protease-activating factor-1) for caspase-9.
Adapter molecules function by bringing their procaspases into close proximity to each
other to promote auto-activation or trans-activation. Once activated, initiator caspases
activate effector caspases (Cohen 1997; Wolf et al. 1999; Bratton et al. 2000).
Effector caspases, also called “executioner” caspases, are involved in most of the
biochemical changes that actively dismantle and kill the cell. Caspase-3, -6 and –7
belong to this category. Unlike initiator caspases, these caspases have short N-terminal
prodomains. The function of effector caspases is to cleave structural and regulatory
proteins. Furthermore, these caspases can also cleave other caspases thus producing a
positive feedback loop to amplify the death signal (Cohen 1997; Wolf et al. 1999; Bratton
et al. 2000).
11

B
C
D
A
Stress
ATP
Pro-caspase 9 Apaf-1
Bax Bax
PARP DNA-PK Rb
Lamins Fordrin Keratins Actin
ICAD Gelsolin PKA2 MEKK1 PKCδ
Bcl-2 Bcl-xL Bid Bim Bid
Bid fragment
Active caspase 9
Fas Receptor
Fas Ligand
FADD
Pro-caspase 8
Active caspase 8
Bid
Caspase Substrates
Effector Caspases
Inactive Effector Caspases
Other Apoptosis
Factors
Cytochrome c
Figure 1.3: Apoptosis pathways. (A) Fas receptor pathway; (B) Mitochondrial pathway; (C) Central Caspase Cascade; (D) Cleavage substrates and biochemical changes during apoptosis.
APOPTOSIS
12
1.2.3.2 Outcome of Caspase activation
The consequence of caspase activation is the systematic cleavage of specific
cellular substrates that accelerate and finalise the cell death process. The cleaved
molecules can be organized into 4 groups (Figure 1.3D): (1) Pro and anti-apoptotic
proteins, (2) components of the apoptosis machinery, (3) structural proteins and (4)
homeostatic proteins (Wolf et al. 1999). The cleavage of the first group is to inactivate
inhibitors of apoptosis like Bcl-2 and Bcl-xL, and to amplify the death signal by cleavage
activation of other procaspases and proapoptotic molecules such as Bim and Bid.
Many components of the apoptotic machinery are activated by caspases. One of
these, ICAD (Inhibitor of CAD), is found in the cytosol complexed to CAD (caspase-
activated deoxyribonuclease). CAD is a DNAse that is inactivated when complexed with
its inhibitor, ICAD. Following caspase-3-mediated cleavage of ICAD, CAD is liberated
and translocates to the nucleus, where it cleaves DNA into 200 bp multimers (Liu et al.
1997; Enari et al. 1998; Janicke et al. 1998; Sakahira et al. 1998; Nagata 2000). This
DNA cleavage is frequently used to show evidence of apoptotic cell death using DNA
agarose gel electrophoresis (Wyllie 1980).
The change in morphology of apoptotic cells represents a dramatic modification
in structural proteins. Many structural proteins such as lamins, fodrin, keratins and actin
are cleaved by caspases (Porter et al. 1997; Gruenbaum et al. 2000). The cleavage of
these nuclear matrix and cytoskeleton proteins is responsible for many of the nuclear and
cellular changes during apoptosis. The purpose of their cleavage is thought to be the
dissolution of the cells integrity and cellular packaging (Wolf et al. 1999).
13
The last group of cleaved molecules contributing to apoptotic cell death is
homeostatic proteins. These molecules are usually responsible for the regular cellular
functions and maintenance of the cell, however, these duties are counterproductive when
the cell is trying to kill itself. DNA repair is impaired by cleaving DNA maintenance
enzymes such as PARP (poly[ADP-ribose] polymerase) and DNA-PK (Cohen 1997;
Porter et al. 1997). PARP cleavage is an early event during apoptosis and is often used as
a cellular indicator of apoptosis, much like DNA fragmentation and lamin cleavage
(Oberhammer et al. 1994). Another disruption of essential cellular components is the
termination of survival signals. pRb (retinoblastoma protein), an important mediator of
cell cycle progression and regulation, has been observed to be cleaved during apoptosis
(Cohen 1997). These specific caspase substrates show how systematic and efficient the
apoptotic mechanism is.
1.2.4 Induction pathways of Apoptosis
1.2.4.1 Extrinsic pathway
Of the two pathways to induce apoptosis, the receptor-mediated pathway is the
most understood. This pathway involves of plasma membrane receptors called death
receptors. Once the corresponding death ligand binds the receptor, a chain of events
inside the cell ultimately activate caspases and cause apoptosis. These death receptors
are part of the TNF (tumor necrosis factor) receptor superfamily. Fas, TNFR and TRAIL
are a few of the most studied members of this family (Schulze-Osthoff et al. 1998;
Bratton et al. 2000; Walczak et al. 2000). Their structures have common elements; an N-
14

terminal extracellular domain that is rich in cysteine residues, a single membrane
spanning domain and a cytoplasmic death domain (DD) located at the C-terminus. These
receptors are used in mainly three types of physiological apoptosis: for (1) elimination of
activated lymphocyte clones after the immune response, (2) killing of infected cells (virus
infections) or damaged cells (cancer cells) by cytotoxic T cells and by natural killer cells,
and (3) eliminating inflammatory cells at immune privileged sites such as the eye
(Ashkenazi et al. 1998). We will now discuss the extrinsic pathway of apoptosis
induction using the Fas pathway as an example.
The Fas receptor is normally found on the cell surface in its monomeric state
(Figure 1.3A). This receptor must homotrimerise to activate the death signal. This is
done following Fas ligand binding or artificially through receptor ligation by agonistic
antibodies. However, this concept has come into question with a recent article showing
that the receptors are able to trimerise in the absence of ligand binding (Golstein 2000).
Once in close proximity, the cytoplasmic DDs of each receptor unite and lead to the
recruitment of an adapter molecule called FADD. FADD contains its own DD that
interacts with the receptors DDs. The adapter molecule also has another domain at its N-
terminal called a DED (Death Effector Domain) that interacts with a similar DED in the
long prodomain of caspase-8. This protein complex is referred to as the DISC (death-
inducing signaling complex). Its function is to bring procaspase-8 molecules into close
proximity with each other so that they can undergo transactivation through limited
proteolysis. Caspase-8 will then initiate the central caspase cascade, mainly through
caspase-3/7 activation (Nagata 1997; Peter et al. 1998; Bratton et al. 2000; Walczak et al.
2000). In this induction pathway, caspase-8 can also amplify its signal by activating a
15
second induction pathway through the cleavage of an intermediate molecule called Bid.
The cleavage of this Bcl-2 family member induces a conformational change in Bax,
another Bcl-2 member. Bax then translocates to the outer mitochondrial membrane and
amplifies apoptosis through the intrinsic pathway (Yamada et al. 1999; Bratton et al.
2000; Perez et al. 2000).
1.2.4.2 Intrinsic Pathway
The second induction pathway, called the intrinsic pathway, involves the
mitochondria. Researchers have recently added the task of decision-maker for apoptotic
cell death to this energy producing organelle. Many indications point to its involvement:
it contains many components of the apoptotic machinery (procaspase-2, -3 and -9,
cytochrome c, Apoptosis Inducing Factor) and it is the site of localization of many
apoptosis regulators (Bcl-2, Bax, Smac/DIABLO) (Bernardi et al. 1999; Gottlieb 2000;
Green 2000). It is still unknown how the mitochondria senses when the cell should die
(Matsuyama et al. 2000), but its involvement is becoming hard to dispute.
The mitochondria participates in apoptosis induction by the release of components
of the apoptotic machinery such as procaspases, AIF and cytochrome c (Figure 1.3B)
(Bernardi et al. 1999; Gottlieb 2000; Green 2000). In particular, cytochrome c, normally
located in the intermembrane space of the mitochondria, is thought to be released to the
cytosol by a pore complex called the permeability transition pore (PTP). The PTP is
composed of the voltage-dependent anion channel (VDAC), the adenine nucleotide
translocase (ANT) and cyclophilin-D, which opens big enough for low molecular weight
proteins such as cytochrome c to pass through (Bernardi et al. 1999; Crompton 1999;
16

Gottlieb 1999; Bratton et al. 2000). The opening mechanism of this pore is starting to be
understood. High calcium concentrations, Bcl-2 family members such as Bax,
mitochondrial homeostasis and other signal transduction pathways seem to be involved in
this process (Kroemer et al. 1998; Loeffler et al. 2000; Perez et al. 2000).
Once cytochrome c is released from the mitochondria, it becomes a cofactor in a
complex called the “Apoptosome”. The main component of this complex is an adapter
molecule called Apaf-1. Apaf-1 uses cytochrome c and dATP as cofactors to self-
oligomerize through WD-40 protein interaction domains. This exposes a caspase
recruitment domain (CARDs) located in the N-terminal of the protein. Procaspase-9
binds Apaf-1 through CARD-CARD interaction with its own CARD sequence located in
its long prodomain (Hu et al. 1998; Pan et al. 1998). The complex clusters and initiates
transcatalysis activation of caspase-9 (Zou et al. 1999). Caspase-9 is then free to activate
effector caspases through limited proteolysis and engage the central caspase cascade,
leading to apoptosis (Mignotte et al. 1998).
1.2.5 The Bcl-2 family: Regulators of Apoptosis
As we have seen, the mechanisms of apoptosis can effectively and potently kill
cells. Unwanted cell death in an organism can cause many problems such as diseases.
Therefore, this process must be tightly regulated. To protect against inappropriate
activation of apoptosis, cells have compartmentalized certain components of its cell death
machinery. One example: Procaspase-9 and cytochrome c are localized within the
mitochondrial innermembrane space, away from their adaptor molecule Apaf-1
(Crompton 1999). Cells also contain specialized regulatory molecules to control
17

apoptosis such as IAPs (Inhibitor of Apoptosis Proteins) and Smac/Diablo (Green 2000).
The most characterized family of apoptotic regulators is the Bcl-2 family.
Bcl-2 (B-cell lymphoma-2), the first identified member of the Bcl-2 family, was
discovered in 1986 by studying the breakpoint of the t(14;18) chromosome translocation
in human B-cell lymphomas (Cleary et al. 1986; Tsujimoto et al. 1986). The
translocation resulted in the constitutive expression of Bcl-2 at high levels that impaired
the cell’s ability to die, thus leading to a greater predisposition to lymphoma development
(Vaux et al. 1988). Since then, the family has expanded and other new proteins with
structural similarities have been found (Adams et al. 1998; Fadeel et al. 1999; Tsujimoto
et al. 2000). Bcl-2 and these related proteins can inhibit or induce cell death. The family
members can be divided into 3 categories (Figure 1.4): (1) anti-apoptotic members, (2)
pro-apoptotic members of the bax sub-family and (3) pro-apoptotic members of the BH3
sub-family.
These proteins have been grouped together according to sequence homology.
They share conserved sequences called BH domains (for Bcl-2 Homology domains).
There are 4 of these domains, BH1 to BH4, which are found in the different members
(Figure 1.4). Most anti-apoptotic members, like Bcl-2 and Bcl-xL, have all 4 domains,
while Bax and Bak pro-apoptotic members have only BH1, BH2 and BH3. The BH3-
only proteins obviously only have the BH3 domain. Most of these proteins also have
transmembrane (TM) anchor domain thought to target them to the outer membrane of the
mitochondria, the nuclear envelope and the endoplasmic reticulum (Adams et al. 1998;
Tsujimoto et al. 2000).
18

Anti-apoptotic members Bcl-2 Bcl-xL Bcl-w Mcl-1 A1 Boo Pro-apoptosis members Bax Bak Bok Diva BH3-only members (also Pro-apoptotic members) Bad Bid Bim Brk Blk Bnip3 Bnip3L Bik
TMBH3
TMBH2 BH4 BH3 BH1
BH3 BH2BH1 TM
Figure 1.4: Schematic drawing of members of the Bcl-2 family. BH1 to BH4 represent Bcl Homology motifs and TM is a transmembrane domain. This figure was adapted from Tsujimoto and Shimizu (Tsujimoto et al. 2000).
19

The regulation of apoptosis by the Bcl-2 family depends on their relative amounts
inside the cell. If a cell has a high concentration of anti-apoptotic members, it will
survive or be more resistant to certain insults that induce apoptosis. However, if the
concentrations of pro-apoptotic members accumulate due to multiple insults or increased
activation of pro-apoptotic members, the cells death machinery will be activated
(Hengartner 2000; Tsujimoto et al. 2000). The decision of life or death can be simplified
to a balance between both categories of regulatory proteins, however, it is more complex
than that. The different members of the Bcl-2 family can be individually activated or
deactivated by processes such as phosphorylation, caspase-mediated cleavage or
subcellular localization (Fadeel et al. 1999). We will now look at the function of one of
these regulatory proteins: Bcl-xL.
1.2.6 Bcl-xL
Bcl-xL is an anti-apoptotic member of the Bcl-2 family (Reed 1997; Adams et al.
1998; Tsujimoto et al. 2000). It was first isolated in 1993 from avian lymphocytes and
was found to have 44% amino acid identity with human or mouse Bcl-2 (Boise et al.
1993). Even though Bcl-xL and Bcl-2 are structurally similar, they are distinctly
different regulatory molecules. This is evident when studying knockout mice in which
these proteins were inactivated. Bcl-2-/- mice are viable but die at a few months old,
usually due to renal failure. On the other hand, Bcl-x-/- mice have a more dramatic
phenotype because they die at embryonic day 13. They showed a deficiency in the
development of the nervous system and a low survival of immature thymocytes (Vaux et
al. 1999). The different effect of Bcl-2 and Bcl-xL inactivation shows that these two
20
molecules may have a redundant role, however, other functions are unique to their
respective molecule. Therefore, their exact functions must be studied individually.
1.2.6.1 Structure
Murine Bcl-xL (Genebank accession # U51278) is a 233 amino acid protein containing
many structural domains important for its function. It possesses four BH domains and a
N-terminal transmembrane domain like other anti-apoptotic members of its family. X-
ray crystallography and NMR spectroscopy analysis of the 3D structure of Bcl-xL
revealed 7 alpha helices (Figure 1.5) (Muchmore et al. 1996). The basic structure is
composed of two hydrophobic α-helices (α5 and α6) surrounded by amphipathic α-
helices. Furthermore, there is a large unstructured loop region corresponding to residues
24 to 83 between the first and second α-helices (Liang et al. 1997). This loop possesses
many phosphorylatable serine and threonine residues that may potentially regulate the
function of Bcl-xL. Another important aspect of the structure of Bcl-xL is the formation
of a hydrophobic pocket composed of the BH1, BH2 and BH3 domains. The
hydrophobic pocket has been shown to interact strongly with the BH3 domain of Bak
(Sattler et al. 1997). An interesting discovery brought by the resolution of the 3D
structure is the similarity between the structure of Bcl-xL and the membrane insertion
domains of diphtheria toxin and colicins A and E1 (Liang et al. 1997). The helices of
these proteins form pores in lipid membranes (Schendel et al. 1998). Bcl-2 and Bax have
subsequently been shown to also form pores. The exact function of the low pH
dependent monovalent cation pore formed by Bcl-xL is not clear, however, it is suspected
that it functions at the mitochondrial level (Liang et al. 1997; Schendel et al. 1998).
21

Figure 1.5: Structure of Bcl-xL. A RasMol drawing that clearly shows core of the molecule consisting of α-helices and the large unstructured regulatory loop domain. PDB Identifier: 1XLX.
22
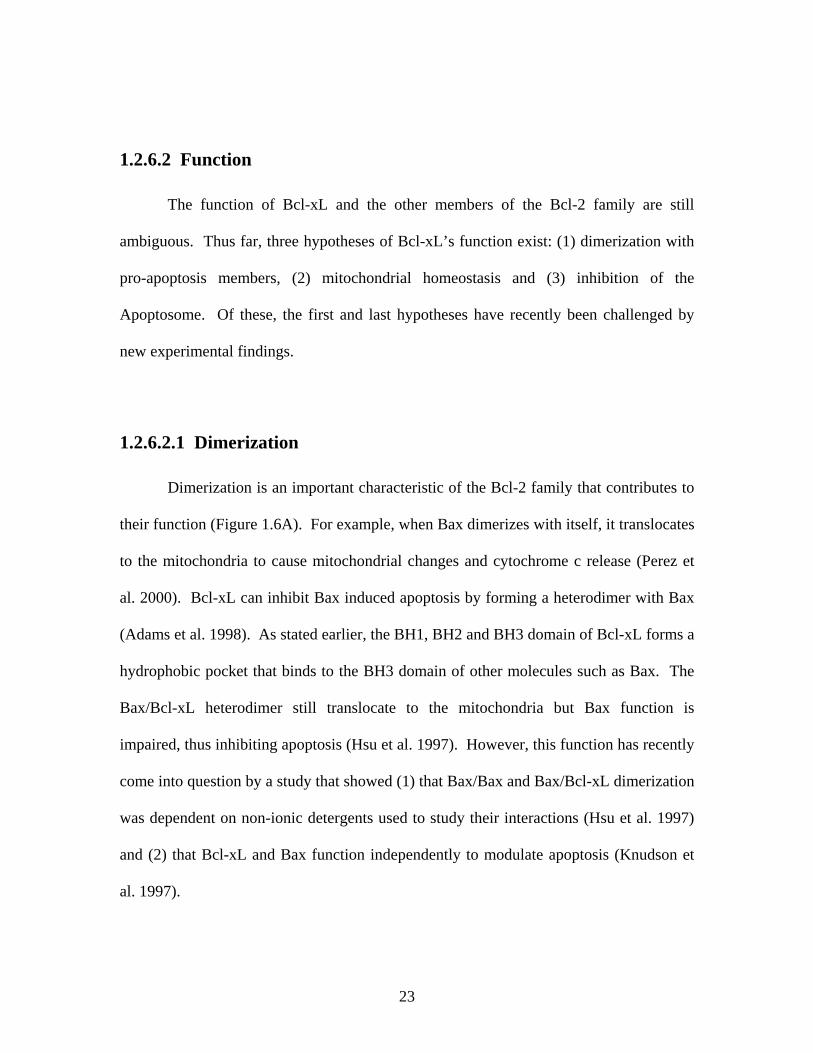
1.2.6.2 Function
The function of Bcl-xL and the other members of the Bcl-2 family are still
ambiguous. Thus far, three hypotheses of Bcl-xL’s function exist: (1) dimerization with
pro-apoptosis members, (2) mitochondrial homeostasis and (3) inhibition of the
Apoptosome. Of these, the first and last hypotheses have recently been challenged by
new experimental findings.
1.2.6.2.1 Dimerization
Dimerization is an important characteristic of the Bcl-2 family that contributes to
their function (Figure 1.6A). For example, when Bax dimerizes with itself, it translocates
to the mitochondria to cause mitochondrial changes and cytochrome c release (Perez et
al. 2000). Bcl-xL can inhibit Bax induced apoptosis by forming a heterodimer with Bax
(Adams et al. 1998). As stated earlier, the BH1, BH2 and BH3 domain of Bcl-xL forms a
hydrophobic pocket that binds to the BH3 domain of other molecules such as Bax. The
Bax/Bcl-xL heterodimer still translocate to the mitochondria but Bax function is
impaired, thus inhibiting apoptosis (Hsu et al. 1997). However, this function has recently
come into question by a study that showed (1) that Bax/Bax and Bax/Bcl-xL dimerization
was dependent on non-ionic detergents used to study their interactions (Hsu et al. 1997)
and (2) that Bcl-xL and Bax function independently to modulate apoptosis (Knudson et
al. 1997).
23

A Pro Ant
Figure 1.6: Three hypothetical models for the protective functions of Bcl-2 family members. (A) Homo and heterodimerization affects the activity and function of the different family members. (B) Three different models of mitochondrial homeostasis regulated by Bcl-2 family members. From left to right, formation of a pore by which proteins such as cytochrome c can be released, interaction with pore channels to effect ATP/ADP exchange or protein release, or formation of ion channels. This figure was adapted from (Hengartner 2000). (C) Disruption of the Apoptosome through protein interaction between Bcl-xL and Apaf-1.
ANT
VDAC
ATP, ADP
ATP, ADP
Bcl-2 family member
Na+, Cl-, K+
Na+, Cl-, K+
Cyt c
ATP Pro-caspase 9
+
Apaf-1
Bcl-xL
Bcl-xL
Cytochrome c
Apaf-1
Pro-caspase 9
Apoptosis
No Apoptosis
No Apoptosis
+
+
+
B
C
24

1.2.6.2.2 Mitochondrial homeostasis
The recognition that Bcl-2 family members might regulate mitochondrial
homeostasis has been a major step in the elucidation of the elusive central function of
these apoptosis regulators. While it is possible that pore forming Bcl-2 members can
contribute to the stabilization or destabilization of the mitochondria on their own,
evidence is pointing to their interaction with other components of this organelle
(Finucane et al. 1999). Bax and Bcl-xL have been shown to interact with VDAC and
ANT, major components of the PTP (Shimizu et al. 1999; Vander Heiden et al. 1999).
Recently, Tsujimoto’s group analysed the effect of Bax and Bcl-xL on this complex.
They showed that these proteins independently regulate the opening of VDAC but not
ANT (Shimizu et al. 2000). Bax and VDAC form a pore 4 to 10 times bigger that the
pore size formed by these proteins alone (Shimizu et al. 2000). The pore size of the
Bax/VDAC complex would be big enough to allow cytochrome c and other proteins to
escape the intermembrane space. Bcl-xL can stop these mitochondrial changes (Shimizu
et al. 1999; Vander Heiden et al. 1999). Furthermore, the BH4 domain of Bcl-xL was
also shown to bind VDAC and inhibit its opening even in the presence of Bax (Figure
1.6B) (Shimizu et al. 2000). This can explain the release of cytochrome c and other
intermembrane proteins from the mitochondria, and how Bcl-xL blocks it, however, other
mechanisms might exist for the release of cytochrome c. The Tsujimoto team further
showed that BH3-only protein of the Bcl-2 family can induce cytochrome c release
independently of VDAC (Shimizu et al. 2000).
25

1.2.6.2.3 Disruption of the Apoptosome
Inhibition of caspase-9 activation at the level of the Apoptosome by Bcl-xL is
another function of this regulatory protein (Figure 1.6C). Accidental release of
cytochrome c can therefore be controlled if cell death is not wanted at that time. Bcl-xL
inhibits caspase-9 activation by binding the C-terminal of Apaf-1 containing WD-40
repeats, resulting in a disruption of the Apoptosome (Hu et al. 1998; Pan et al. 1998).
This function has also come into question like the dimerization of Bcl-2 family members.
A recent paper has done an extensive study on Apaf-1 interactions and showed that Bcl-
xL, as well as other anti-apoptosis Bcl-2 family members, do not interact with Apaf-1
(Moriishi et al. 1999).
1.2.6.3 Regulation
As we have seen, Bcl-xL is a potent inhibitor of apoptosis. A proper regulation of
this protein is therefore important to control the fate of the cell. When a cell must die,
Bcl-xL’s protective activity must be turned off so that cell death is not delayed. There
are five major mechanisms that regulate Bcl-xL’s activity.
1.2.6.3.1 Phosphorylation
The loop domain of Bcl-xL (and Bcl-2) represents an important regulation site for
the molecule (Fadeel et al. 1999) (Figure 1.7A). This domain is easily accessible by
other proteins because it is free from the core of the molecule. Furthermore, this loop
contains many serine and threonine residues that can be phosphorylated (Chang et al.
26

1997). Bcl-xL and Bcl-2 have been shown to be hyperphosphorylated in vivo after
microtubule disruption by Taxol (Ling et al. 1998; Scatena et al. 1998; Fadeel et al. 1999;
Yamamoto et al. 1999). The effect of phosphorylation of this domain is controversial.
Some studies show that phosphorylation of the loop domain increases the survival
function of the protein while others say that it abolishes its protective effect (Ito et al.
1997; Ling et al. 1998; Scatena et al. 1998; Chadebech et al. 1999; Poommipanit et al.
1999; Sooryanarayana et al. 1999; Yamamoto et al. 1999). This may be due to cellular
context or differences in apoptotic stimuli. Nevertheless, deletion of the entire domain in
Bcl-xL and Bcl-2 consistently increases the protective function of these regulators
(Chang et al. 1997; Srivastava et al. 1999; Wang et al. 1999).
Recently, two studies have given insights into the molecular mechanisms
underlying this post-translational regulation. One group found that 3 kinases, PKCα
(Ruvolo et al. 1998), ERK1 and ERK2 (Deng et al. 2000), are responsible for the
phosphorylation of Bcl-2. Survival signals, such as IL-3, can activate these kinases that
specifically phosphorylate the evolutionarily conserved Ser70 located in the loop domain
of Bcl-2. This modification enhances the stability of Bcl-2/Bax heterodimers, which
increases the protective effect of Bcl-2 (Deng et al. 2000). Furthermore, these kinases are
part of the MAPK proliferation pathway which explains the links between the survival
and proliferation signal observed in growth factor-dependent cell lines (Fadeel et al.
1999). Another study also showed a link with the MAPK pathway. The group found that
MAP kinase phosphorylation sites Thr74 and Ser87 within Bcl-2 were dominantly
phophorylated in endothelial cells by the MAPK pathway (Breitschoph et al. 2000).
Upon TNF-α-stimulation, these sites were dephosphorylated by MAP kinase phosphatase
27

Bcl-xS Pro-apoptotic
Bcl-xL Anti-apoptotic
Exon 2 Exon 3 Exon 4 Exon 5 Exon 1
B
Stat
Epo EpoR Jak2 Stat5
Murine Bcl-xL Promotor
T-333TCGGAGGA
C
ARegulatory loop
domain
Caspase cleavage HLAD61↓S and SSLD76↓A
BH3-only protein interactions
Phosphorylation Ser70, Ser87, Thr74
TMBH2 BH4 BH3 BH1
Figure 1.7: Regulation of Bcl-xL function. (A) Regulation by phosphorylation and cleavage within the regulatory loop domain and BH3-protein interaction with the hydrophobic pocket formed by the BH1, BH2 and BH3 domains. (B) Regulation by alternative splicing of pre-mRNA. The use of an alternative splice site within the first exon of Bcl-xL produces a shorter pro-apoptotic translational product called Bcl-xS. (C) Transcriptional upregulation of promotor activity through cytokine receptor activation of the Jak/Stat pathway.
28

(MKP)-3 and -4. Dephosphorylation of these residues resulted in the proteasome-
dependent degradation of Bcl-2 and, consequently, a decreased resistance to apoptosis in
these cells.
1.2.6.3.2 Cleavage by caspases
The accessibility of the loop domain makes it an attractive site for proteolytic
cleavage (Figure 1.7A). Both Bcl-xL and Bcl-2 have caspase cleavage sites in the loop
domain (Clem et al. 1998; Kirsch et al. 1999). Murine Bcl-xL has two cleavage sites:
HLAD61↓S and SSLD76↓A (Hirotani et al. 1999). Cleavage at these sites has a dual
purpose. First, it deactivates the protective function of the protein. Second, the
proteolysis releases the N-terminal part of the protein, leaving a protein that resembles
the pro-apoptotic protein Bax in structure and function. Bcl-xL, which inhibited
apoptosis, now causes apoptosis just like Bax (Clem et al. 1998).
1.2.6.3.3 BH3-only protein binding to Bcl-xL
BH3-only proteins are potent activators of apoptosis. They function mainly by
antagonizing the anti-apoptotic function of Bcl-xL. The BH3 domain of these small
proteins binds the hydrophobic pocket of Bcl-xL (Fesik 2000). This occupation of the
BH3 binding site keeps Bcl-xL from binding and inhibiting pro-apoptotic members as we
have seen earlier. These BH3 proteins must also be tightly regulated. We will now
discuss the activation of two BH3-only proteins, Bad and Bid.
29

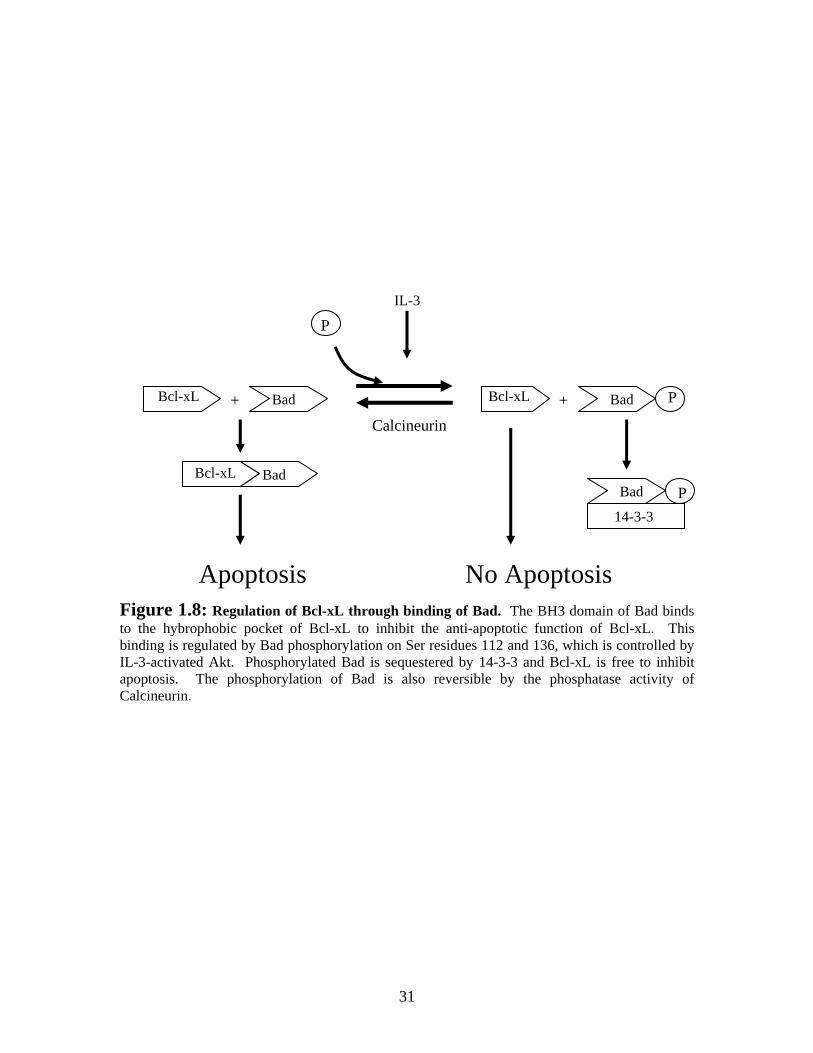
Bcl-xL inhibition by Bad is dependent on the phosphorylation status of this BH3-
only protein (Figure 1.8). Bad can be phosphorylated by PKA and PKB/Akt, kinases that
are activated by survival signals such as IL-3 (Harada et al. 1999; Scheid et al. 1999;
Cross et al. 2000). When murine Bad is phosphorylated on serine residue 112 or 136, it
is sequestered by 14-3-3 proteins which keep it from binding and inhibiting Bcl-xL
(Downward 1999). The Ca2+ activated phosphatase, calcineurin, can reverse the
phosphorylation of Bad leading to its dissociation from 14-3-3 proteins (Wang et al.
1999). Unphosphorylated Bad can then interact with Bcl-xL, inhibiting its anti-apoptotic
function and promoting cell death (Kelekar et al. 1997).
1.2.6.3.4 Alternative splicing
Another regulation of Bcl-xL’s protective effect is through the alternative splicing
of Bcl-xL’s pre-mRNA (figure 1.7B). Ever since the discovery of Bcl-xL, it was known
that the pre-mRNA of Bcl-x is spliced into two major products (Grillot et al. 1997). The
first is a large mRNA which is transcribed into full length Bcl-xL. The second gives a
shorter product, called Bcl-xS, which lacks the BH1 and BH2 domains found in the
deleted 63 amino acids (Boise et al. 1993). This second product is grouped with other
BH3-only Bcl-2 family members even though it seems that it does not function primarily
by binding of anti-apoptotic members (Minn et al. 1996). One example of this regulation
was seen in a rat endometrial cell line where the splicing of the long anti-apoptotic forms
of Bcl-xL was favoured when progesterone was present. After the removal of the
hormone, the Bcl-xL/Bcl-xS ratio decreased and the cells died (Pecci et al. 1997). In
30
IL-3
P
P
P
Bcl-xL
+ Bad Bcl-xL
Bad 14-3-3
Bad
Bcl-xL Bad +Calcineurin
Apoptosis No Apoptosis Figure 1.8: Regulation of Bcl-xL through binding of Bad. The BH3 domain of Bad binds to the hybrophobic pocket of Bcl-xL to inhibit the anti-apoptotic function of Bcl-xL. This binding is regulated by Bad phosphorylation on Ser residues 112 and 136, which is controlled by IL-3-activated Akt. Phosphorylated Bad is sequestered by 14-3-3 and Bcl-xL is free to inhibit apoptosis. The phosphorylation of Bad is also reversible by the phosphatase activity of Calcineurin.
31

1998, another alternative spliced form of Bcl-x was found, Bcl-xβ (Ban et al. 1998). This
discovery further complicates the regulation of Bcl-xL by alternative splicing.
1.2.6.3.5 Upregulation of Bcl-xL mRNA
Bcl-xL expression levels in cells can be changed by hormonal influences (Figure
1.7C). Erythropoietin (Epo), a cytokine, was shown to protect immature erythroblasts
from apoptosis by increasing Bcl-xL mRNA expression through the Jak/Stat pathway
(Silva et al. 1999). Binding of Epo to the erythropoietin receptor causes the receptor to
homodimerize and activate its associated cytoplasmic kinase Jak2. This tyrosine kinase
then activates STAT5, which translocates to the nucleus and interacts with its regulatory
element in Bcl-xL’s promoter region. The result is an increase of Bcl-xL expression that
influences the fate of the cell in favour of survival (Silva et al. 1999; Socolovsky et al.
1999; Williams 2000). Interleukin-6 (IL-6) is another cytokine that affects the viability
of cells in the immune system. It is a growth factor for activated B cells in the late stages
of B cell differentiation and promotes in vitro growth of some hybridomas (Abbas et al.
1997). Many studies have linked the upregulation of Bcl-xL with IL-6 and correlated this
increase with a decrease of apoptosis (Lotem et al. 1995; Schwarze et al. 1995; Puthier et
al. 1999). This suggest that the expression of Bcl-xL can be regulated by cytokines such
as IL-6 and Epo.
32

Chapter 2 Objectives
33

2.0 Objectives
Several laboratories are actively pursuing increasing the productivity of monoclonal
antibody production. One way that is presently being exploited is by increasing the
viability of hybridoma cultures in long-term culture. By maintaining a high viability, it is
believed that hybridoma cultures will produce a higher antibody concentration during the
culture period. The induction of apoptosis has been identified as the culprit responsible
for the decreased viability of these cells in extended culture time used to produce
monoclonal antibodies. Our long-term goal is to effectively increase the viability of
hybridoma cultures. The objectives of this thesis are threefold:
1. Determine which factor(s) in the long-term culture environment may be
responsible for the induction of apoptosis of SP2/0-Ag14 cultures.
2. Analyse the effectiveness of the anti-apoptosis regulator, Bcl-xL, to increase the
viability of SP2/0-Ag14 in long-term culture.
3. Use PCR-mediated site-directed mutagenesis in order to increase the effectiveness
of Bcl-xL for maintaining a high SP2/0-Ag14 culture viability in long-term
culture.
34
Chapter 3 Differences between SP2/0-Ag14 and P3x63-Ag8.653 cell lines
35

3.0 Comparison of the culture behaviour of the SP2/0-Ag14 and P3x63-Ag8.653 murine hybridoma cell lines
3.1 Introduction
Ever since Kohler and Milstein developed the first monoclonal antibody-secreting
hybridoma in 1975, researchers have tried to improve this technology (Kohler et al.
1975). Hybridoma cells are obtained by fusing an antibody-secreting B cell with a
myeloma cell. The resulting hybrid cell retains the desired characteristics of both cell
lines: the antibody producing function of the former and the continuous in vitro
proliferation of the latter. Two better myeloma fusion partners, P3x63-Ag8.653 and
SP2/0-Ag14, were isolated from the same parent cell line a few years later (Shulman et
al. 1978; Kearney et al. 1979). Monoclonal antibodies have since increased in
importance due to their uses in medicine, research and biotechnology. The result of the
high demand for pure, high titre monoclonal antibodies fuelled research in the area of
hybridoma technology. Researchers have noticed that cellular viability is the major
limitation for antibody production (Linardos et al. 1991; Gaertner et al. 1993a).
The type of cell death that limits the viability of these hybridoma cultures is
known as apoptosis (Vomastek et al. 1993; Hu et al. 1997; al-Rubeai et al. 1998; Dickson
1998). The presence of apoptosis in hybridoma cultures comes as the result of mild
stresses that activate the suicidal mechanism of the cells. The exact inducer or inducers
that cause the death of these cells is still not known, but nutritional, environmental and/or
physical stresses are likely candidates (Hu et al. 1997; al-Rubeai et al. 1998).
36
Many attempts to suppress apoptosis and increase the viability of hybridoma
cultures have been made. One popular method is by optimizing the culture medium
according to the specific nutritional needs of these cultures. Medium optimization
maximises the cell culture longevity by taking into account nutrient uptake, waste
product minimization and control of environmental conditions (Bibila et al. 1995). The
study of culture parameters in different hybridoma and myeloma cell lines showed that
glucose and, more importantly, glutamine are vital energy sources (Gaertner et al. 1993b;
Petronini et al. 1996; Sanfeliu et al. 1996). The supplementation of these nutrients can
greatly increase the production of monoclonal antibodies, however, the culture still
eventually dies from the lack of other nutrients such as amino acids and vitamins or toxic
metabolic by-products (Mercille et al. 1994).
Amino acids have received considerable attention to increase the viability of
hybridoma and myeloma cultures. The induction of apoptosis has been shown to
correlate with the exhaustion of one or a few amino acid. Franek and his group have
identified several amino acids that they describe as having a “survival-signal role” in
starvation-induced apoptosis of SP2/0-Ag14 derived hybridomas (Franek 1995; Franek et
al. 1996a, 1996b). Glutamine seems to be especially important, not only as an energy
source, but as a survival signal. Its depletion coincides with the induction of apoptosis in
the D5 hybridoma, which has been derived from SP2/0-Ag14 (Mercille et al. 1994).
Furthermore, glutamine deprivation of human lymphoma cells was associated with
apoptotic cell death that was independent of its energetic function (Petronini et al. 1996).
The same study also showed that reinstatement of glutamine in the culture medium
rescued the cells from death.
37

The work presented in this chapter compares the culture behaviour of
P3x63Ag8.653 and SP2/0-Ag14, two myeloma cell lines commonly used to prepare
hybridomas. These related cell lines were both originally generated from the P3x63Ag8
cell line. SP2/0-Ag14 is a hybrid formed by the fusion of two cells, a spleen cell isolated
form a BALB/c mice and a P3x63Ag8 myeloma cell (Shulman et al. 1978). On the other
hand, P3x63Ag8.653 is simply a clone of P3x63Ag8 (Kearney et al. 1979). These two
cell lines, sharing the same lineage and use, have different susceptibilities to apoptosis.
When exposed to an inhibitor of protein synthesis, cycloheximide (CHX), SP2/0-Ag14 is
dramatically more sensitive than P3x63Ag8.653 and dies by apoptosis (Gauthier et al.
1996). Hybridomas derived from SP2/0-Ag14 can inherit its apoptosis sensitivity which
is an undesirable cellular trait for the production of monoclonal antibodies (Perreault et
al. 1993). One major difference between the two cell lines that may explain the
sensitivity of SP2/0-Ag14 is the lack of anti-apoptotic inhibitor Bcl-xL (Gauthier et al.
1996).
The comparative study presented here examines the culture behaviour of these
two cell lines in long-term stationary culture to help determine environmental causes for
their differential rate of cell death. Cellular crowding, glucose levels and growth factor
limitation did not cause the differential induction of apoptosis in these two cell lines. On
the other hand, lack of glutamine in the culture medium has a dramatic death inducing
effect on SP2/0-Ag14 cells. Furthermore, addition of this amino acid can rescue SP2/0-
Ag14 cells from cell death in long-term stationary culture and restored its growth profile
to one resembling P3x63Ag8.653. Supplementation of glutamine had no effect on
38

P3x63Ag8.653. These results suggest that glutamine has a major regulatory function on
SP2/0-Ag14 in culture that is not observed in P3x63Ag8.653.
3.2 Methods and Materials
3.2.1 Reagents
Unless otherwise stated, all reagents were obtained from Canadian Life
Technologies (Burlington, ON). A 70x stock solution of L-glutamine was made with
PBS (pH 7.4) to replenish the concentration of glutamine in the culture medium to 4.5
mM.
3.2.2 Cell lines and cell maintenance
The murine cell lines P3x63-Ag8.653 (ATCC# CRL1580) and SP2/0-Ag14
(ATCC # CRL1581) were obtained from the American Type Culture Collection
(Rockville, MD). Both cell lines were maintained in Iscove’s modified Eagle’s media
(Media Preparation Lab, Princess Margaret Hospital, Toronto, ON), supplemented with
5% Fetalclone I (Hyclone), 100 U/ml penicillin and 100 Φg/ml streptomycin. Cell
culture was performed at 37 °C under an atmosphere of 5% CO2 / 95% air. All open
flask manipulations of cell cultures were performed under aseptic conditions in a
Labconco Purifier Class II safety cabinet.
39

3.2.3 Freezing and thawing cells
Cell lines were occasionally frozen for future use. Approximately 2 x 10⁶
exponentially growing cells were centrifuged and resuspended in 1 ml of cold culture
medium containing 10% DMSO and transferred to a 2 ml free-standing polypropylene
Wheaton Cryule Vial. The tube was immediately stored in a styrofoam container and
placed at –120 °C for a few days. The frozen cultures where then transferred to a
Thermolyne BioCane 20 cryo-container for long term storage in liquid nitrogen. When
needed, these cultures were thawed rapidly in a 37 °C waterbath, washed once with 10
ml of fresh culture medium and resuspended in another 10 ml of culture medium. The
cells were then cultured as described in section 3.2.2.
3.2.4 Long-term stationary batch cell culture
Exponentially growing cells were centrifuged and resuspended in fresh culture
medium at a concentration of 5 x 10⁴ cells/ml in 25 cm2 flasks and cultured as described
above. Cell viability was determined by the Trypan Blue dye exclusion assay: an aliquot
of cells was diluted in 0.04% trypan blue (Sigma, Oakville, ON) dissolved in PBS (9.1
mM Na2HPO4, 1.7 mM NaH2PO4, 150 mM NaCl, pH 7.4). The viable (white) cells and
dead (blue) cells were counted using a Bright-Line Hemacytometer (Sigma, Oakville,
ON). Each result is the average ± standard deviation of at least 4 determinations.
Experiments studying the effect of limited FBS concentration followed the same
procedures with the exception that the cells were resuspended at 1 x 10⁵ cells/ml in
medium containing 0.1% FBS.
40
3.2.5 DNA laddering assay
DNA fragmentation analysis was performed following a procedure modified from
a previously published protocol (Smith et al. 1989). Briefly, 5 x 10⁵ cells were collected
and washed once with PBS. The cells were lysed with 50 Φl of lysis buffer (10 mM Tris
HCl pH 8, 1 mM EDTA pH 8, 0.5% N-Lauroyl Sarcosine, and freshly added 0.25 mg/ml
Proteinase K and 0.02 mg/ml RNAse). The mixture was then incubated for 5 minutes at
50 °C. An equal volume (50 Φl) of sample buffer (40% sucrose, 0.08% Bromophenol
Blue) was then added to the sample. Fifteen microliters of each sample was loaded in the
wells of a 2% agarose gel and electrophoresis was performed using a BioRad Mini Sub
Cell DNA electrophoresis unit in TBE Buffer (0.089 M Tris Base, 0.089 M Boric Acid,
0.002 M EDTA pH 8) at 95 V for 45 minutes. The DNA was then stained for 5 minutes
with ethidium bromide (0.7 Φg/ml) and washed in H2O for 3 hours before visualization
under UV transillumination.
3.2.6 D-glucose and L-glutamine assays
D-glucose and L-glutamine concentrations were analysed by enzymatic assays
from samples of culture medium removed on each day of the long-term cultures. The
cells were pelleted by centrifugation (1 500 RPM, 4 °C for 10 min) and the supernatant
removed and frozen at –20 °C until needed.
D-glucose determination was performed as described by Bozimowski
(Bozimowski et al. 1985). Briefly, D-glucose concentrations were measured by mixing
10 Φl of 1:2 (medium: H2O) diluted culture medium with 80 Φl Glucose reagent (33
41

KU/L glucose oxidase, 7.64 U peroxidase, 2 mM aminoantipyrine, 3 mM 2-hydroxy-3,5-
dichlorobenxenesulfonate dissolved in 100 mM Tris/HCl Buffer pH 7.0) and 110 Φl H2O
in a 96-well plate. The plate was incubated at 37 °C for 10 min and the optical density
was measured at 510 nm using a PowerWaveX micro-plate reader (Bio-Tek Instruments,
Inc). Glucose concentrations were obtained using a standard curve made with D-glucose.
All samples were analysed in triplicate.
L-glutamine concentrations were analysed using a Glutamine Assay Kit (GLN-2)
from Sigma, following the instructions from the manufacturer. Optical density readings
were performed in triplicate at 550 nm using a PowerWaveX micro-plate reader (Bio-Tek
Instruments, Inc).
3.2.7 Protein extract preparation and Western analysis
Soluble cellular protein extracts were prepared as follows. Two million cells
were wash once with PBS and pelleted by centrifugation (1 500 RPM, 4ΕC for 10 min).
For soluble nuclear protein extracts, 3 x 10⁶ cells were washed once with PBS, washed
again in 2.5 ml of Lysis Buffer 1 (10 mM Tris/HCl pH 7.4, 3 mM CaCl2, and 2 mM
MgCl2), resuspended in 2.5 ml Lysis Buffer 2 (10 mM Tris/HCl pH 7.4, 3 mM CaCl2, 2
mM MgCl2, and 1% IGEPAL CA-630), homogenized on ice with 10 strokes of a dounce
homogenizer and then centrifuged (1 500 RPM, 4ΕC for 10 min) to pellet the nuclei. The
cell or nuclei pellets were stored at -80ΕC until needed or used right away.
The cell/nuclei pellets were resuspended in 500 Φl of RIPA buffer (1% IGEPAL,
1% deoxycholic acid, 0.1% SDS in PBS) and incubated on ice for 30 min. The samples
were then sonicated for 10 seconds before adding 5 Φl of 10 mg/ml PMSF dissolved in
42

isopropanol, followed by a 30 min incubation on ice. Following centrifugation (12 500
RPM, 4ΕC for 20 min), the supernatant was transferred to another tube and its protein
content determined using the DC Protein Assay Kit (Bio-Rad) using BSA as standard.
The extracts were then stored at -80ΕC until needed.
For Western Blot analysis, equal amounts of proteins were loaded into the wells
of a 10% PAGE-SDS polyacrylamide gel and resolved using a Bio-Rad Mini-Protean II
electrophoresis unit. The proteins were transferred to a Hybond-P membrane
(Amersham-Pharmacia, Baie d’Urfé, QC) following the manufacturer’s instructions, and
then stained for 5 min with Ponceau S (5% Ponceau S, 2% glacial acetic acid) to confirm
transfer efficiency. For the immunodetection, the membrane was blocked for 1 hour in
blotto (5% non-fat dry milk, in TTBS [0.1% Tween-20, 0.02 M Tris/HCl pH 7.6, 0.14 M
NaCl]), rinsed with TTBS three times for 5 min at room temperature and then incubated
for 1 hour with the primary antibody. The following polyclonal IgG primary antibodies
were used at the indicated dilutions: 1/1500 rabbit anti-PARP (H-250) (Santa Cruz
Biotechnology, Santa Cruz, CA) or 1/200 goat anti-Lamin B (M-20) (Santa Cruz
Biotechnology) diluted in blotto. The membrane was then washed three times for 5 min
with TTBS. The appropriate horseradish peroxidase coupled secondary antibody (anti-
rabbit IgG-HRP [Santa Cruz Biotechnology] or anti-goat IgG-HRP [Santa Cruz
Biotechnology]) was diluted to 1/5000 with blotto and the membrane was incubated in
this solution for 1 hour. Finally, the membrane was washed once for 10 min and 4 times
for 5 min in TTBS before visualization using ECLPlus chemiluminescence Kit
(Amersham-Pharmacia, Baie d’Urfé, QC) and HyperfilmECL (Amersham-
43
Pharmacia, Baie d’Urfé, QC). The film was developed using Kodak GBX developer and
fixer (Sigma).
3.2.8 MTT Assay
Cell viability was determined using the MTT viability assay (Hansen et al. 1989).
In a 96-well plate, 2×10⁵ cells were incubated in a total volume of 100 Φl in the presence
of 25 Φg/ml CHX (Sigma) or in Iscove’s media lacking L-glutamine (Sigma) for 2 and 3
hours, respectively. Twenty-five microlitres of MTT dye (5 mg/ml dissolved in PBS)
was then added to each well, followed by a 2 hours incubation at 37 °C. One hundred
microlitres of Lysis buffer (20% SDS, 50% N-N’-dimethylformamide, pH 4.7) was then
added to each well and the plates were incubated overnight at 37 °C. Optical density
readings were performed at 570 nm using a PowerWaveX micro-plate reader (Bio-Tek
Instruments, Inc). The experiments were done using 4 replicates and the results shown
are expressed as the average ± standard deviation of three independent experiments.
3.3 Results
3.3.1 Growth and apoptosis in SP2/0-Ag14 and P3x63-Ag8.653 cells in
long-term culture
The growth behaviour of SP2/0-Ag14 and P3x63-Ag8.653 cells was observed during
long-term culture without changing the culture medium. We used these conditions to
44
simulate the environment that these cells would be subjected to if they were used to
produce monoclonal antibodies. Exponentially growing cells were seeded at 5 x 10⁴
cells/ml and aliquots of culture was taken daily to analyse the cellular viability by the
Trypan Blue exclusion assay. As seen in Figure 3.1, SP2/0-Ag14 and P3x63-Ag8.653
have different growth profiles. First, a maximum viable cell density was reached on day
4 for SP2/0-Ag14 and on day 5 for the P3x63-Ag8.653 culture. The density for SP2/0-
Ag14 was approximately 1.5 x 10⁶ cells/ml while P3x63-Ag8.653’s peak was slightly
lower. More importantly, the time it took for both cultures to reach 5% viability was
different. It took SP2/0-Ag14 6 days to reach 95 % cell death, while P3x63-Ag8.653
maintained a higher viability until day 10. This difference in culture time is mostly
attributed to different decline in viable cells. SP2/0-Ag14 cells died rapidly after day 4.
On the other hand, P3x63-Ag8.653 cells had a more gradual decrease of viable cell
density. The decreased in viable cells concentration in both cultures was accompanied by
an increase in the number of dead cells.
It is generally accepted that the reduced viability of myeloma and hybridoma cells
is associated with apoptotic cell death (Hu et al. 1997; Dickson 1998). To support this,
we studied three different biochemical markers of apoptosis from samples collected daily
from SP2/0-Ag14 and P3x63-Ag8.653 cultures grown in the same conditions as in Figure
3.1. Figure 3.2A shows DNA laddering which is a classic marker for apoptosis
(Robertson et al. 2000). In SP2/0-Ag14 cultures, the 200 bp- multi-oligomer pattern start
to appear on day 4, while the P3x63-Ag8.653 cells showed signs of DNA fragmentation
only on day 5. On subsequent days, DNA laddering increased in intensity for both cell
lines. Two proteolytic markers were also used to confirm apoptosis: cleavage of PARP
45

0
5
10
15
20
25
1 2 3 4 5 6 7 8 9 10
Time (day)
Cel
l den
sity
(cel
ls/m
l x 1
0-5)
0
5
10
15
20
25
1 2 3 4 5 6
Time (day)
Cel
l den
sity
(c
ells
/ml x
10-5
)
A B
Figure 3.1: Growth behavior of SP2 (A) and P3 (B) cells in stationary batch culture. The number of viable cells (circles) and dead cells (squares) were determined by Trypan Blue exclusion assay. The dotted line with triangles represents the total number of cells in the culture. Each data point is the average of at least 4 determinations.
46
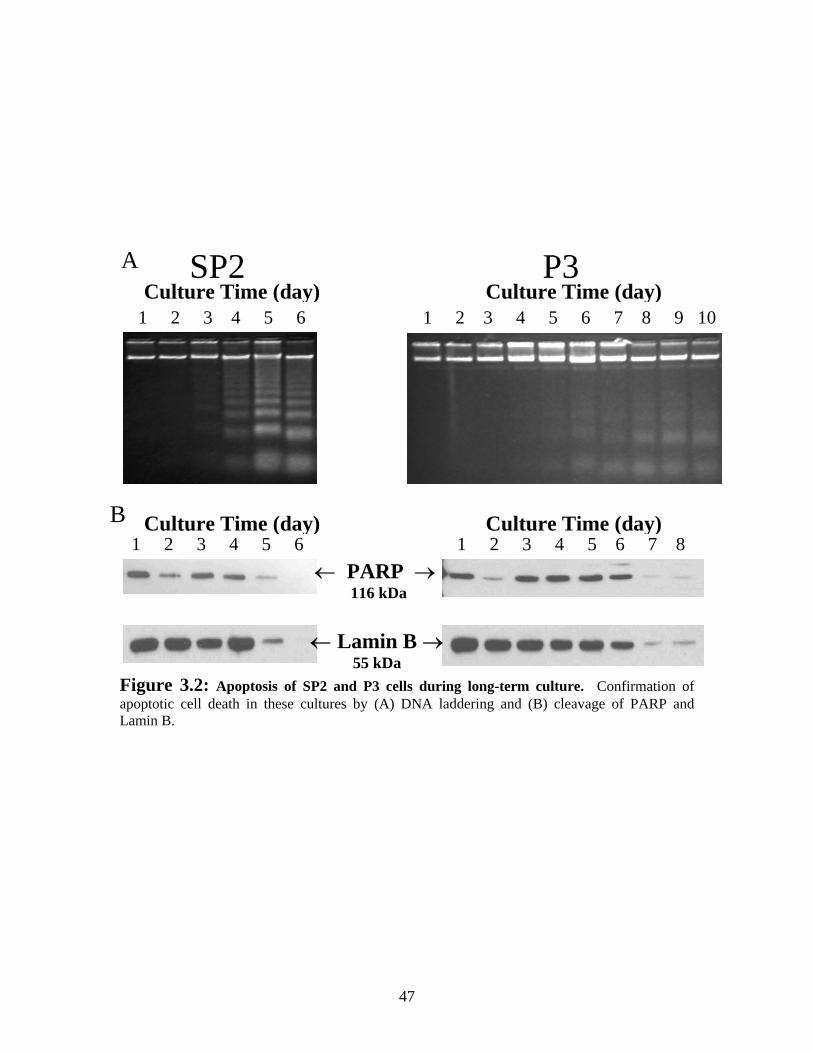
A SP2 1 2 3 4 5 6
Culture Time (day) P3
1 2 3 4 5 6 7 8 9 10 Culture Time (day)
Figure 3.2: Apoptosis of SP2 and P3 cells during long-term culture. Confirmation of apoptotic cell death in these cultures by (A) DNA laddering and (B) cleavage of PARP and Lamin B.
← Lamin B →55 kDa
B 1 2 3 4 5 6 1 2 3 4 5 6 7 8
Culture Time (day) Culture Time (day)
← PARP → 116 kDa
47
and Lamin B (Porter et al. 1997) (Figure 3.2B). These two proteins are cleaved during
apoptosis by caspases. Immunodetection of 116 kDa PARP and 53 kDa Lamin B showed
a progressive decrease in the level of the full length forms of these proteins that start after
day 4 and day 6 for SP2/0-Ag14 and P3x63-Ag8.653, respectively. This coincides with
the increases in dead cells in Figure 3.1A and B. The cleavage of DNA and caspase
substrates suggests that the decreased viability in these two cell lines is associated to
apoptotic cell death.
3.3.2 Study of the environmental cause of hybridoma cell death
With the hope of understanding the environmental factors that stimulate these cell to die
during prolonged culture, we tested the effect of certain culture related stresses. We first
investigated the possibility that culture components may be limiting during prolonged
culture. To test this, we seeded SP2/0-Ag14 and P3x63-Ag8.653 cells at 5 x 10⁴ cells/ml
and replaced the culture medium daily. By replacing the media, we are replenishing the
supply of nutrients and growth factors for the cells and limiting the accumulation of toxic
metabolites such as ammonia and lactate (Gaertner et al. 1993b). This procedure
dramatically extended the viability of both SP2/0-Ag14 and P3x63-Ag8.653 cell lines
(Figure 3.3). Both cultures also increased their maximum number of viable cells. SP2/0-
Ag14 reached a plateau of ~2.5 x 10⁶ cells/ml on day 4 while P3x63-Ag8.653 maintained
a viable cell concentration between 2.5 x 10⁶ and 3.5 x 10⁶ cells/ml after day 6. At these
high concentrations, the cells were probably using up an essential factor in the culture
medium or succumbing to toxic metabolites that induced a fraction of the population die
before the medium could be replenished the next day. The surviving cells continued to
48

0
10
20
30
40
50
60
70
80
1 2 3 4 5 6 7 8 9 10 11
Time (day)
Cel
l den
sity
(cel
ls/m
l x 1
0-5)
0
10
20
30
40
50
60
70
80
1 2 3 4 5 6 7 8 9
Time (day)
Cel
l den
sity
(cel
ls/m
l x 1
0-5)
A B
Figure 3.3: Effect of daily replacement of culture medium on the growth behaviour of SP2 (A) and P3 (B) cells. Cells were seeded at 5 x 10⁴ cell/ml in 15 ml of culture and counted daily with Trypan Blue dye. The media was then replaced by resuspending the cells in new culture media at the density of that day. Viable cell number of the control culture is represented by circles and changed medium culture are squares. The solid (triangle) and dotted (diamond) lines show the total cell number in the control and changed medium cultures, respectively. Each point is the average of at least 4 determinations.
49
proliferate in the replenished medium because the concentration of total cells increased
linearly in both cell lines during the whole experiment (Figure 3.3). Therefore, there is a
factor or factors that cause these cells to die during long-term culture.
One possible environmental stress is the exhaustion of growth factors. To test this
possibility, we resuspended SP2/0-Ag14 and P3x63-Ag8.653 cells at 5 x 10⁵ cells/ml in
Iscove’s medium containing 0.1% FBS and the viable cell number was counted daily
from an aliquot of cells using the Trypan Blue dye exclusion assay. Figure 3.4 shows
that SP2/0-Ag14 and P3x63-Ag8.653 behave very differently under these conditions.
SP2/0-Ag14 cells continue to grow slowly, while P3x63-Ag8.653 cells stopped growing
altogether and started dying after 3 days. Growth factor exhaustion is not the cause for
cell death because both cell lines do not die rapidly once FBS is removed, however, it
does suggest that P3x63-Ag8.653 proliferation/survival is more growth factor-dependent
than SP2/0-Ag14.
Myeloma and hybridoma cells have been shown to undergo apoptosis when they
lacked glucose (Mercille et al. 1994). Glutamine was also shown to be important for
hybridoma cells and has been suggested to act as a survival signal (Mercille et al. 1994;
Franek 1995; Petronini et al. 1996; Franek et al. 1996b). We tested the consumption of
these two culture media components to determine their rate of utilization during
prolonged growth culture of SP2/0-Ag14 and P3x63-Ag8.653. Figure 3.5A shows that
the consumption of glucose was similar for SP2/0-Ag14 and P3x63-Ag8.653 cells.
Furthermore, it is not the limiting factor because of the large excess of glucose in the
media during the late stages of culture. In contrast, the concentration of glutamine
available for uptake by the cells is limited. In Figure 3.5B, we see that SP2/0-Ag14 cells
50

0,0
0,5
1,0
1,5
2,0
2,5
3,0
1 2 3 4 5 6 7
Time (day)
Via
ble
cell
num
ber
(cel
ls/m
l x 1
0-5)
Figure 3.4: Growth behaviour of SP2 and P3 cells in limited growth factor conditions. SP2 (circles) and P3 (squares) cells were washed with PBS and resuspended in Iscove’s medium containing 0.1% FBS. Cells were counted daily using Trypan Blue dye. Each data point is the average of at least 4 determinations.
51
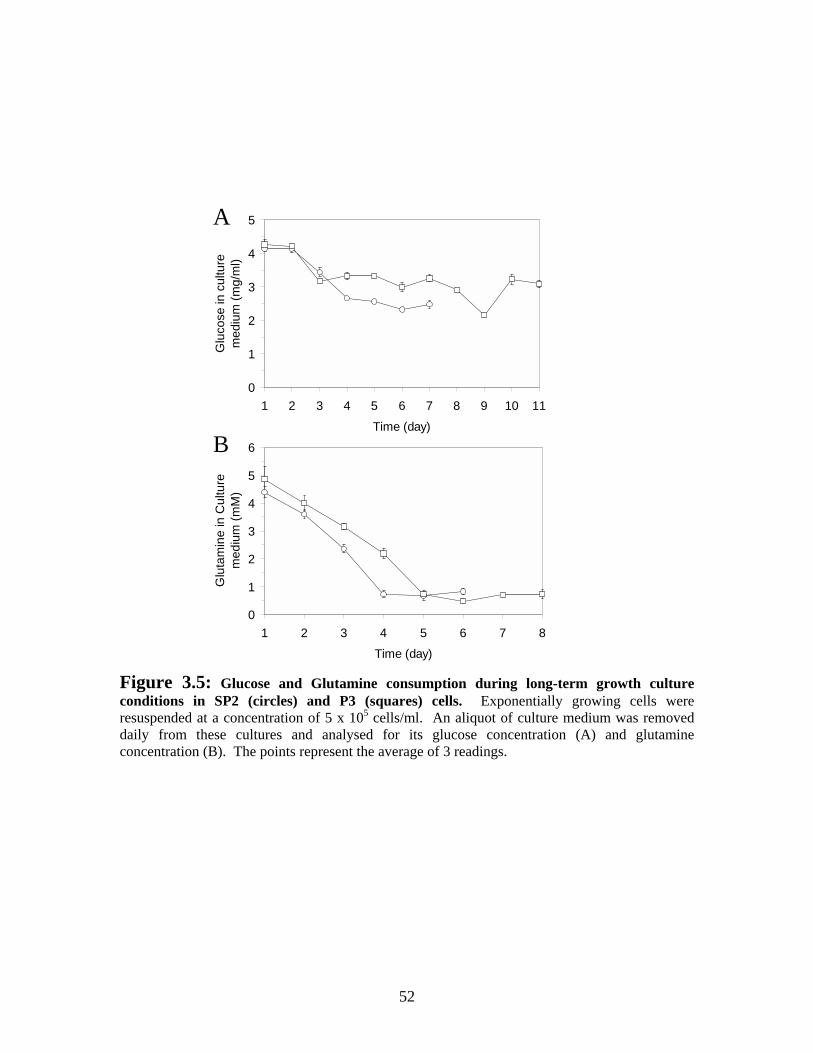
0
1
2
3
4
5
6
1 2 3 4 5 6 7 8
Time (day)
Glu
tam
ine
in C
ultu
rem
ediu
m (m
M)
0
1
2
3
4
5
1 2 3 4 5 6 7 8 9 10 11
Time (day)
Glu
cose
in c
ultu
rem
ediu
m (m
g/m
l)
B
A
Figure 3.5: Glucose and Glutamine consumption during long-term growth culture conditions in SP2 (circles) and P3 (squares) cells. Exponentially growing cells were resuspended at a concentration of 5 x 10⁵ cells/ml. An aliquot of culture medium was removed daily from these cultures and analysed for its glucose concentration (A) and glutamine concentration (B). The points represent the average of 3 readings.
52

have almost consumed all the available glutamine by day 4, which coincides with the loss
in viability (Figure 3.1A). A similar effect is seen with P3x63-Ag8.653 cells. Glutamine
is almost completely exhausted when the P3x63-Ag8.653 culture reaches its maximum of
viability and the cells start to die (Figure 3.1B). This may indicate that the exhaustion of
glutamine may cause these cells to die by apoptosis during long-term culture.
3.3.3 Lack of L-Glutamine is associated with decreased viability by
rapidly inducing apoptosis in SP2/0-Ag14 cultures
To test the effect of glutamine on the viability of SP2/0-Ag14 and P3x63-Ag8.653
cultures, we resuspended exponentially growing cells in medium lacking glutamine and
analysed their viability by MTT viability assay after 3 hours (Figure 3.6A). The P3x63-
Ag8.653 culture was two fold more viable than the SP2/0-Ag14 culture under these
conditions. P3x63-Ag8.653 cells remained relatively viable at 60% while SP2/0-Ag14
cells showed a dramatic reduction in viability at 30%. The MTT assay only measures the
viability of the cells tested and does not give any indication on how the cells died.
Therefore, we tested for DNA laddering in SP2/0-Ag14 and P3x63-Ag8.653 cultures
exposed to the same condition in order to confirm the presence of apoptotic cell death.
We can clearly see the DNA laddering of SP2/0-Ag14 cells cultured without glutamine in
Figure 3.6B. P3x63-Ag8.653 cells, on the other hand, did not show DNA laddering after
3 hours of incubation without glutamine. The results presented in Figure 3.6 suggest that
glutamine may be the limiting factor which induces apoptosis during long-term culture of
SP2/0-Ag14 cells.
53
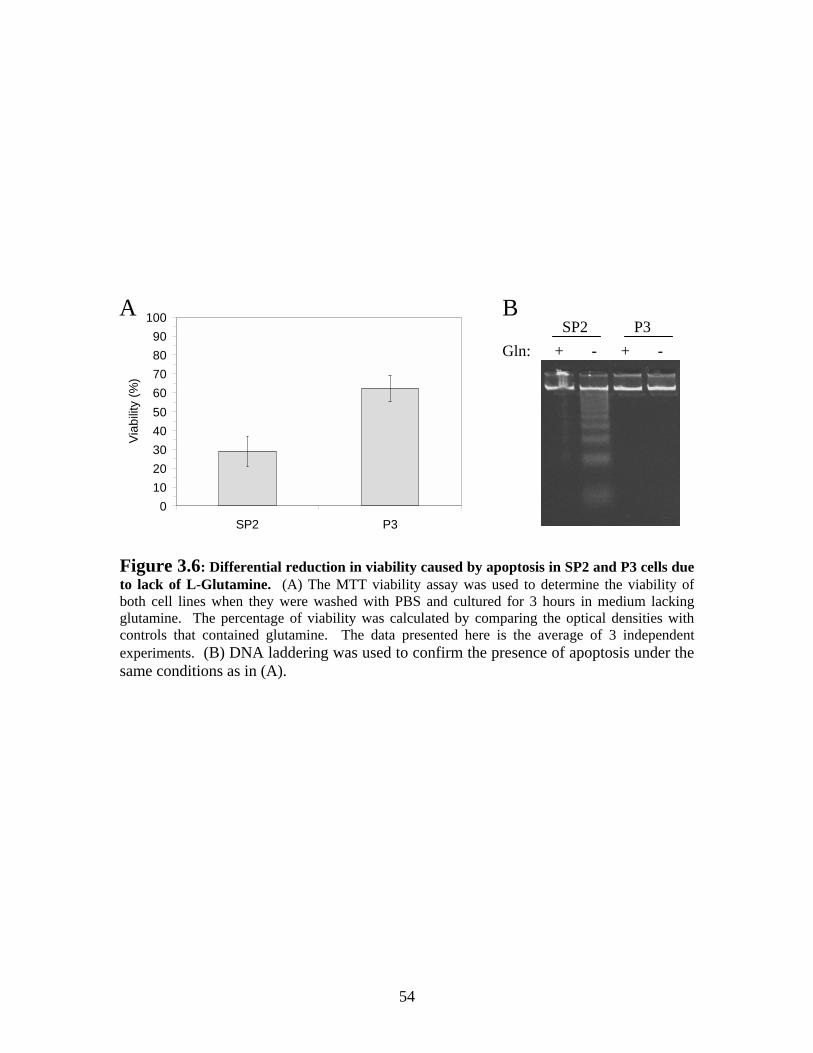
0102030405060708090
100
SP2 P3
Viab
ility
(%)
A BSP2 P3
Gln: + - + -
Figure 3.6: Differential reduction in viability caused by apoptosis in SP2 and P3 cells due to lack of L-Glutamine. (A) The MTT viability assay was used to determine the viability of both cell lines when they were washed with PBS and cultured for 3 hours in medium lacking glutamine. The percentage of viability was calculated by comparing the optical densities with controls that contained glutamine. The data presented here is the average of 3 independent experiments. (B) DNA laddering was used to confirm the presence of apoptosis under the same conditions as in (A).
54
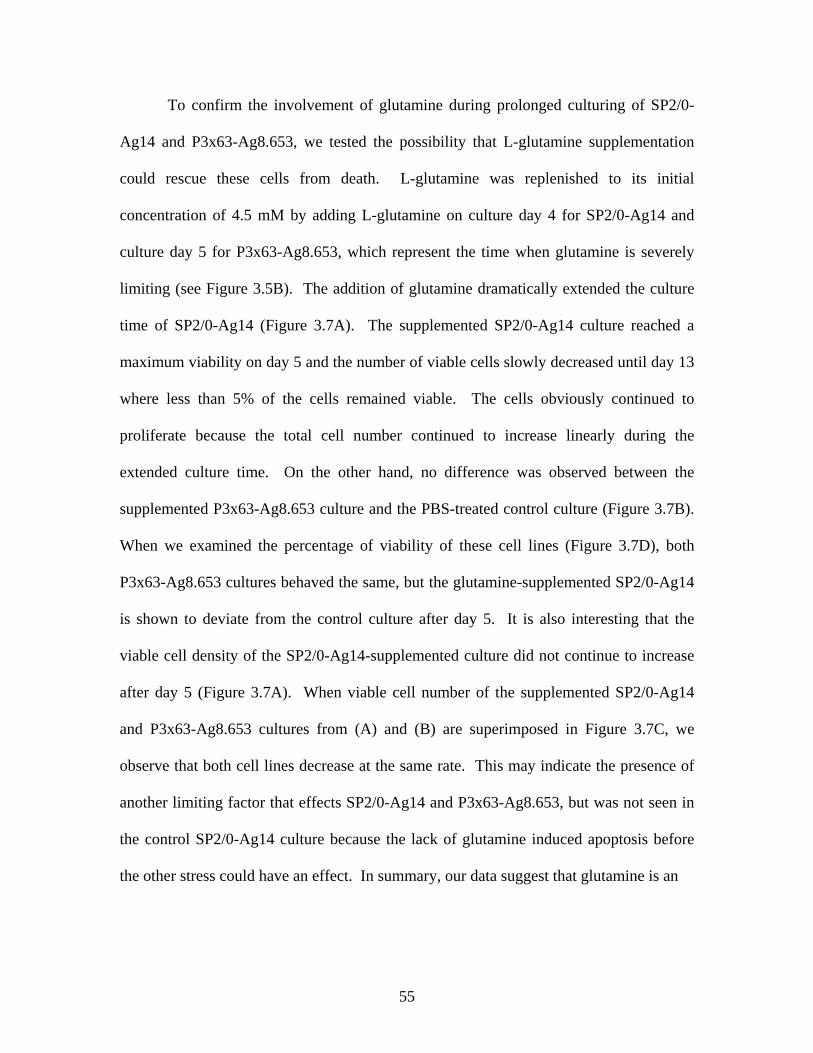
To confirm the involvement of glutamine during prolonged culturing of SP2/0-
Ag14 and P3x63-Ag8.653, we tested the possibility that L-glutamine supplementation
could rescue these cells from death. L-glutamine was replenished to its initial
concentration of 4.5 mM by adding L-glutamine on culture day 4 for SP2/0-Ag14 and
culture day 5 for P3x63-Ag8.653, which represent the time when glutamine is severely
limiting (see Figure 3.5B). The addition of glutamine dramatically extended the culture
time of SP2/0-Ag14 (Figure 3.7A). The supplemented SP2/0-Ag14 culture reached a
maximum viability on day 5 and the number of viable cells slowly decreased until day 13
where less than 5% of the cells remained viable. The cells obviously continued to
proliferate because the total cell number continued to increase linearly during the
extended culture time. On the other hand, no difference was observed between the
supplemented P3x63-Ag8.653 culture and the PBS-treated control culture (Figure 3.7B).
When we examined the percentage of viability of these cell lines (Figure 3.7D), both
P3x63-Ag8.653 cultures behaved the same, but the glutamine-supplemented SP2/0-Ag14
is shown to deviate from the control culture after day 5. It is also interesting that the
viable cell density of the SP2/0-Ag14-supplemented culture did not continue to increase
after day 5 (Figure 3.7A). When viable cell number of the supplemented SP2/0-Ag14
and P3x63-Ag8.653 cultures from (A) and (B) are superimposed in Figure 3.7C, we
observe that both cell lines decrease at the same rate. This may indicate the presence of
another limiting factor that effects SP2/0-Ag14 and P3x63-Ag8.653, but was not seen in
the control SP2/0-Ag14 culture because the lack of glutamine induced apoptosis before
the other stress could have an effect. In summary, our data suggest that glutamine is an
55
0
5
10
15
20
1 2 3 4 5 6 7 8 9 10 11 12 13
Time (day)
Viab
le c
ell n
umbe
r(c
ells
/ml x
10-5
)
0102030405060708090
100
1 2 3 4 5 6 7 8 9 10 11 12 13
Time (day)
Viab
ility
(%)
0
10
20
30
40
50
60
70
80
1 2 3 4 5 6 7 8 9 10 11 12 13
Time (day)
Cel
l den
sity
(cel
ls/m
l x 1
0-5)
0
5
10
15
20
25
1 2 3 4 5 6 7 8 9 10 11 12 13
Time (day)
Cel
l den
sity
(cel
ls/m
l x 1
0-5)
A
C D
B
Figure 3.7: Effect of glutamine (gln) supplementation on SP2 and P3 cell viability during prolonged culture. L-gln or PBS was added to SP2 (A) and P3 (B) cultures at the times indicated by the black arrows and these cultures were counted using Trypan Blue dye. Enough glutamine was added to replenish the concentration of L-gln to that of day 0. In (A) and (B), open squares are the gln-supplemented cultures, open circles are PBS-supplemented cultures, dotted lines (diamonds) are total cells in the gln-supplemented cultures and solid lines (triangles) are the total cells in the PBS cultures. Each point is the average of at least 4 determinations. (C) super-imposes the viable cell number of SP2 (closed circles) and P3 (closed squares) cultures supplemented with Gln shown in (A) and (B). (D) shows the data in (A) and (B) as percentage of viability. Series are labelled as follows: SP2 with PBS (open circles), SP2 with L-gln (closed circles), P3 with PBS (open squares) and P3 with L-gln (closed squares).
56

important limiting factor that causes apoptosis and decreases the viability of our SP2/0-
Ag14 long-term culture system but not of P3x63-Ag8.653 cells.
3.4 Discussion
3.4.1 SP2/0-Ag14 and P3x63-Ag8.653 cells are distinct cell lines even
though they share a common lineage.
SP2/0-Ag14 and P3x63-Ag8.653 cells have a similar cellular lineage, however, P3x63-
Ag8 was radically altered when a spleen cell was fused with it to eventually produce
SP2/0-Ag14. A genetic instability resulted form this fusion, that, once settled, resulted in
a dramatically altered phenotype found in SP2/0-Ag14 cells. Indication of this instability
comes from the chromosomal content of SP2/0-Ag14 which is 73 chromosomes
(Shulman et al. 1978). This number is 8 chromosomes more than the number found in
the murine P3x63-Ag8 cell line (Shulman et al. 1978). The different number of
chromosomes must distort the homeostasis of regulatory elements found in the genome of
the cell. The difference in the behaviour of SP2/0-Ag14 (Figure 3.1A) and P3x63-
Ag8.653 (Figure 3.1B) under prolonged culture conditions caused by this genetic
distinction is evident. Furthermore, the effect of glutamine withdrawal is also different in
these two cell lines (Figure 3.6A). Both of these differences have been attributed to an
earlier onset of apoptosis in SP2/0-Ag14 cells (Figure 3.2 and 3.6B). The difference in
apoptosis susceptibility is most likely due to a differential expression of Bcl-xL in both
57
cell lines, as shown by Gauthier et al. (Gauthier et al. 1996) and discussed in the next
chapter.
Another difference was observed between SP2/0-Ag14 and P3x63-Ag8.653 when
they where grown with limited concentration of FBS. Growth arrest is a regularly
observed outcome to growth factor withdrawal in many cell types (Dean et al. 1986;
Howard et al. 1993; Shichiri et al. 1993; Jayadev et al. 1995). Interestingly, the viable
cell number did not increase in the P3x63-Ag8.653 culture following FBS withdrawal
(Figure 3.4), suggesting growth arrest. However, SP2/0-Ag14 continued to grow slowly
under this condition (Figure 3.4). The control of SP2/0-Ag14’s proliferation may have
been compromised, perhaps by the deregulation of the MAPK pathway or modification
of the cell cycle checkpoints. FACS analysis of the DNA content of these cells in FBS
deficient media would help us determine the growth status of the our cells. Nevertheless,
the alterations in SP2/0-Ag14’s genome have produced a distinct cell line.
3.4.2 L-glutamine causes apoptosis in SP2/0-Ag14 cell line
Our results demonstrate that glutamine deprivation is a major factor limiting the viability
of SP2/0-Ag14 cells during long-term culture (Figure 3.7A). More specifically, L-
glutamine depletion causes apoptosis in these cells (Figure 3.6B). Figure 3.8 indicates
the production and uses of L-glutamine by cells. L-glutamine is usually synthesised from
L-glutamate and NH4+ through Glutamine Synthase. This pathway would assure that the
cell would have a constant supply of L-glutamine for the production of cellular
components for which L-glutamine is a precursor such as purines, pyrimidines and, of
course, proteins. Therefore, lack of extracellular L-glutamine would probably not be the
58

L-glutamine
De novo production
or from glutamate
Production of GSH
Production of energy
Import from environment
Regulation of enzyme activity (kinases, phosphatases, …)
Regulation of protein expression
Synthesis of nucleotides and
proteins
Figure 3.8: Sources of glutamine and possible products for the use of glutamine by cells. The lack of glutamine import may inhibit the different pathways in which glutamine or its metabolites are used in.
59
cause of apoptosis through the limitation of nucleotide and protein synthesis. On the
other hand, this non-essential amino acid has received a lot of attention concerning its
potential role as an energy source (Reitzer et al. 1979) and as a potential survival factor
(Franek 1995; Petronini et al. 1996; Franek et al. 1996a, 1996b). From the conversion of
L-glutamine to L-glutamate by the enzyme glutaminase, α-ketoglutarate is produced and
energy can be generated via the cell’s citric acid cycle. This process is particularly useful
to rapidly dividing cells (Newsholme et al. 1985) such as hybridomas. However, our
cells start to die even when glucose in still available to produce energy (Figure 3.5A).
Furthermore, a study of lymphoma-leukemia cell lines showed that glutamine deprivation
induced apoptosis was independent of energetic failure and that lack of glucose killed
cells by necrosis (Petronini et al. 1996). Therefore, the lack of glutamine probably does
not cause apoptosis by limiting the production of energy. This leaves glutamine’s
function as a survival factor to explain the suppression of apoptosis by glutamine.
There are a few studies that have explored different ways by which glutamine can
encourage cells to survive. We will briefly discuss two possible pathways. The first
involves the regulation of the redox potential of the cell by glutathione. Apoptosis is
typically accompanied by increased oxidative stress in the cell (Slater et al. 1996). This
also correlates with the depletion of glutathione (GSH) (Cotgreave et al. 1998), which is
the most abundant cellular reducing thiol agent (Sies 1999). The GSH tripeptide is
synthesised from L-glutamate, L-cysteine and glycine in two consecutive steps catalyzed
by γ-glutamyl-cysteine synthase and glutathione synthase (Sies 1999). Interestingly, L-
glutamate can be produced directly from L-glutamine by glutaminase. Also, glutamate
can be used to import cysteine through the anionic acid transporter (Bannai et al. 1988).
60

When glutamine is limited, a more oxidative environment could be produced in the cell
because less GSH is synthesized. Such a change may cause the activation of
transcription factors, such as NF-κB and p53, that are reliant on the redox status of their
cysteinyl thiols for their structure (Cotgreave et al. 1998). The final result would be the
activation or inactivation of genes that would induce apoptosis.
L-Glutamine could also encourage cell survival by regulating the expression of
specific genes. GADD (growth arrest and DNA damage-inducible) genes are suggested
to have a role in the induction of apoptosis and growth arrest (Sheikh et al. 2000). The
expression of GADD45 and GADD153 proteins are up-regulated by the absence of L-
glutamine. This up-regulation was demonstrated to be due primarily to mRNA
stabilization (Abcouver et al. 1999; Huang et al. 1999). The time frame of GADD
mRNA increase after glutamine withdrawal is within 2 hours (Abcouver et al. 1999;
Huang et al. 1999), which is consistent with the time to induce apoptosis in SP2/0-Ag14
under similar condition (Figure 3.6). The mechanisms of stabilization by lack of
glutamine or destabilization by its presence is not yet known, nor are the mechanims of
GADD45/GADD153-mediated apoptosis.
3.4.3 Another possible inducer of apoptosis in long-term culture
By adding L-glutamine to P3x63-Ag8.653 cells, we did not expect a significant change in
its growth behaviour because they were more resistant to glutamine deprivation in prior
experiments. On the other hand, L-glutamine supplementation in SP2/0-Ag14 cells was
expected to increase the length of culture time and the maximum number of viable cells,
however, only the culture time was extended. The limited increase in viability could be
61
explained in a few ways. (1) The L-glutamine was probably added too late to the SP2/0-
Ag14 culture to save the cells that were already committed to die at that time. (2) It may
have taken 24 hours for glutamine to have its survival effect on the cells, which may
explain why the supplemented SP2/0-Ag14 culture continued to resemble the control
until day 5 (Figure 3.7D). (3) There may be another inducer of cell death later during
long-term culture. Interestingly, we observed that the viable cell number in SP2/0-Ag14
and P3x63-Ag8.653 cultures declined at similar rates when they were supplemented with
glutamine (Figure 3.7C). This hypothetical apoptotic stress was previously hidden
because SP2/0-Ag14 cells died from glutamine exhaustion before it could be seen. The
inducer could be the exhaustion of another amino acid or other factors such as the
accumulation of toxic metabolites. Nevertheless, the cause for this death will have to be
addressed if we hope to further extend the viability of SP2/0-Ag14 cells in long-term
culture by nutritional supplementation.
3.4.4 Future work and experiments
From research on other cell lines, apoptosis caused by L-glutamine deprivation is not
likely the result of energy failure or lack of nucleotide synthesis. However, this will have
to be confirmed in our cell model. Supplementing SP2/0-Ag14 cells with cell-permeable
components of the citric acid cycle when they are cultured in L-glutamine deficient
media and during long-term culture could test this hypothesis. This would determine if
the inhibition of these pathways were responsible for the induction of apoptosis by
glutamine deprivation. Other possible cause for the induction of apoptosis, such as
decrease in glutathione levels or up regulation of GADD45/153 mRNA will also have to
62

be addressed by directly analysing their levels. Standard assays are available to measure
glutathione and can be used to compare the level of this molecule in SP2/0-Ag14 cells
grown in L-glutamine rich or deficient media. GADD45/153 expression levels could by
analysed by Northern analysis or quantitative RT-PCR when SP2/0-Ag14 cells are
exposed to the same conditions.
Biochemical differences between SP2/0-Ag14 and P3x63-Ag8.653 must also be
considered. One difference that will be considered in the next chapter is the different
levels of Bcl-xL in both cell lines. Bcl-xL will be added to SP2/0-Ag14 cells to see if the
difference in growth behaviour is caused by Bcl-xL’s inhibition of apoptosis in these cell
lines or if other factors are involved.
Finally, the possibility of a second inducer of cell death acting after the
exhaustion of L-glutamine in SP2/0-Ag14 and P3x63-Ag8.653 has to be confirmed. We
could collect the culture media by centrifugation from a 6-day-old SP2/0-Ag14 culture
and use it as a preliminary screening tool. This used media can be replenished with L-
glutamine and used in MTT viability assays using exponentially growing SP2/0-Ag14
cells. We could then observe a decline in viability that is independent of glutamine
withdrawal. Once the presence of the second inducer is confirmed, the glutamine-
replenished used media can be modified by systematically adding amino acids or other
components of the culture media, and retesting by MTT viability assay. A stable viability
would identify which compound could further extend the viability of the SP2/0-Ag14
under glutamine-supplemented long-term culture conditions. If the added compounds do
not further extend the viability of the culture, the accumulation of toxic metabolites
63

would probably be the second cause of cell death of SP2/0-Ag14 cell and the primary
inducer of death for P3x63-Ag8.653 cultures.
A more controlled experiment could also be used to identify the second inducer.
The cells could be cultured in serum-free media instead of Iscove’s media with FBS.
Measure of the levels of different amino acids and the accumulation of ammonia and
lactate during the long-term culture supplemented with L-glutamine could be examined.
The resulting effect on the viability of these cells would be independent of the FBS in the
media which may have an effect the cells at later culture times. Then, the systematic
control of the media components may further increase the viability of the cells under
long-term culture conditions.
64

Chapter 4 Effect of Bcl-xL on SP2/0-Ag14
65
4.0 Effect of Bcl-xL on SP2/0-Ag14
4.1 Introduction
The high cost of monoclonal antibody production limits their availability for
diagnostic screening of diseases, antibody therapies and other applications. A limiting
factor in their production is the decreased viability of the hybridoma cultures that secrete
these antibodies (Dickson 1998). The hybridoma cells die from culture stresses by a type
of cell death called “apoptosis”. Apoptotic death is characterized by many morphological
and biochemical markers. These include the condensation of chromatin, cleavage of
DNA into 200bp multimers, activation of death proteases called “caspases”, cleavage of
cellular substrates, blebbing of the membrane and packaging of the cells content into
vesicles called apoptotic bodies (Kroemer et al. 1998). Many groups identified this form
of cell death as the major cause of decreased viability in hybridoma cultures leading to a
reduction in antibody productivity (Vomastek et al. 1993; Mercille et al. 1994; al-Rubeai
et al. 1998).
Many attempts have been made to increase the viability and antibody yield of
hybridoma culture. A conventional method is by optimizing the culture medium to
extend the longevity of the culture. This can be done by supplementing additional
nutrients (glucose and glutamine), growth factors (FBS) and survival factors (IL-6 and
certain amino acids) (Bibila et al. 1995; Franek et al. 1996a; Chung et al. 1997).
Inhibiting the central apoptosis mechanism consisting of caspases can also increase the
viability of the hybridoma cultures. Cell permeable inhibitors of cellular caspases added
66

to culture medium delayed apoptotic cell death in hybridoma cultures, however, the
antibody production was not increased (McKenna et al. 2000). Another method uses
molecular biology to disrupt the apoptotic pathway of the cell. In particular, the use of
anti-apoptotic members of the Bcl-2 family shows great promise to increase the
productivity of hybridoma cell lines.
The Bcl-2 family contains endogenous regulators of apoptosis that have been
conserved in many organisms. Homologous family members can be found from humans
to worms, and even viruses contain some members that enable them to thwart the
defences of the host cell (Barry et al. 1998; Tschopp et al. 1998). This family contains
anti-apoptosis members (Bcl-2, Bcl-xL, Mcl-1, Bcl-w and A1) and many pro-apoptotic
members (Bax, Bak, Bad, Bid, Bim, etc…). These proteins have been grouped together
because they all contain at least one of four Bcl-2 Homology (BH) domains (Tsujimoto et
al. 2000). Anti-apoptotic members usually contain all four BH domain which contribute
to their protective function. Their functions are not completely understood, however,
they can protect cells from a wide range of apoptosis inducing insults including ionizing
and non-ionizing radiation, nutrient deprivation, growth factor withdrawal,
chemotherapeutic drugs and some cytokines (Adams et al. 1998; Chao et al. 1998).
Several studies have analysed the effect of Bcl-2, the founding member of the
Bcl-2 family, on the long-term viability of cell cultures (Itoh et al. 1995; Fujita et al.
1996; Murray et al. 1996; Singh et al. 1996; Singh et al. 1997; Terada et al. 1997;
Fassnacht et al. 1998). The general trend observed in these experiments was that Bcl-2
increased the length of time that the cells remained viable, however, the level of
protection from apoptosis was highly variable, from 0% to 300%. In particular, NSO and
67

P3x63Ag8.653 myeloma cells, both of which already express high endogenous levels of
Bcl-xL (an anti-apoptotic Bcl-2 family member), do not show any increase in viability
following ectopic Bcl-2 overexpression (Murray et al. 1996; Fujita et al. 1997). This may
suggest that Bcl-2 and Bcl-xL share a redundant function in myeloma/hybridoma cell
lines under culture-related stresses. However, the effect of Bcl-xL under these conditions
has not been studied yet.
In this chapter, we will discuss the results obtained from our study of the role of
Bcl-xL in mediating cellular survival in prolonged culture conditions. SP2/0-Ag14, a
myeloma/hybridoma cell line that expresses very low levels of Bcl-xL, was transfected
with the pTEJ8 mammalian expression vector containing the cDNA of murine Bcl-xL.
The observations presented here show that the apoptosis sensitivity of the Bcl-xL-
expressing SP2/0-Ag14 cells resembles that of P3x63Ag8.653, a related cell line that
endogenously expresses Bcl-xL. Furthermore, Bcl-xL also protected SP2/0-Ag14 in
long-term cultures to levels similar to P3x63Ag8.653. However, these two cell lines are
still distinct because they exhibited different behaviours when cultured in a growth factor
limited media. In conclusion, we demonstrated that Bcl-xL has an important role in
protecting myeloma/hybridoma cells in stationary batch culture. Part of this work was
recently published (Charbonneau et al. 2000) and presented in a poster at the
Biochemistry and Molecular Biology ’99 conference in San Francisco.
68

4.2 Methods and Materials
4.2.1 Reagents
Unless otherwise stated, all reagents were obtained from Canadian Life
Technologies (Burlington, ON). A 70x stock solution of glutamine was made with PBS
(pH 7.4) to replenish the concentration of glutamine in the culture medium to 4.5 mM.
4.2.2 Cell lines and cell maintenance
The murine cell lines P3x63-Ag8.653 (ATCC# CRL1580) and SP2/0-Ag14
(ATCC # CRL1581) were obtained from the American Type Culture Collection
(Rockville, MD). Both cell lines were maintained in Iscove’s modified Eagle’s media
(Media Preparation Lab, Princess Margaret Hospital, Toronto, ON), supplemented with
5% Fetalclone I (Hyclone), 100 U/ml penicillin and 100 Φg/ml streptomycin. Cell
culture was performed at 37 °C under an atmosphere of 5% CO2 / 95% air. Transfected
cell lines were maintained in culture media supplemented with 750 Φg/ml of Geneticin
(G-418). All open flask manipulations of cell cultures were performed under aseptic
conditions in a Labconco Purifier Class II safety cabinet.
4.2.3 Long-term stationary batch cell culture
Exponentially growing cells were centrifuged and resuspended in fresh culture
medium at a concentration of 5 x 10⁴ cells/ml in 25 cm2 flasks and cultured as described
69
above. Cell viability was determined by the Trypan Blue dye exclusion assay: an aliquot
of cells was diluted in 0.04% trypan blue (Sigma, Oakville, ON) dissolved in PBS. The
viable (white) cells and dead (blue) cells were counted using a Bright-Line
Hemacytometer (Sigma, Oakville, ON). Each result is the average ± standard deviation
of at least 4 determinations. Experiments studying the effect of FBS followed the same
procedures except cells were resuspended at 1 x 10⁵ cells/ml in medium containing 0.1%
FBS.
4.2.4 DNA laddering assay
DNA fragmentation analysis was performed following a procedure modified from
a previously reported protocol (Smith et al. 1989). Briefly, 5 x 10⁵ cells were collected
and washed once with PBS. The cells were lysed with 50 Φl of lysis buffer (10 mM Tris
HCl pH 8, 1 mM EDTA pH 8, 0.5% N-Lauroyl Sarcosine, and freshly added 0.25 mg/ml
Proteinase K and 0.02 mg/ml RNAse). The mixture was then incubated for 5 minutes at
50 °C. An equal volume (50 Φl) of sample buffer (40% sucrose, 0.08% Bromophenol
Blue) was then added to the sample. Fifteen microliters of sample was loaded in a well
of a 2% agarose gel and electrophoresis was performed using a BioRad Mini Sub Cell
DNA electrophoresis unit in TBE Buffer (0.089 M Tris Base, 0.089 M Boric Acid, 0.002
M EDTA pH 8) at 95 V for 45 minutes. The DNA was then stained for 5 minutes with
ethidium bromide (0.7 Φg/ml) and washed in H2O for 3 hours before visualization under
UV illumination.
70

4.2.5 Protein extract preparation and Western analysis
Soluble cellular protein extracts were prepared as follows: two million cells were
wash with PBS and pelleted by centrifugation (1 500 RPM, 4ΕC for 10 min). The cell
pellet was resuspended in 500 Φl of RIPA buffer (1% IGEPAL, 1% deoxycholic acid,
0.1% SDS in PBS) and incubated on ice for 30 min. The samples were then sonicated for
10 seconds before adding 5 Φl of 10 mg/ml PMSF dissolved in isopropanol, followed by
a 30 min incubation on ice. Following centrifugation (12 500 RPM, 4ΕC for 20 min), the
supernatant was transferred to another tube and its protein content determined using the
DC Protein Assay Kit (Bio-Rad) using BSA as standard. The extracts were then stored at
-80ΕC until needed.
For Western Blot analysis, equal amounts of proteins were loaded into the wells
of a 10% PAGE-SDS polyacrylamide gel and resolved using a Bio-Rad Mini-Protean II
electrophoresis unit. The proteins were transferred to a Hybond-P membrane
(Amersham-Pharmacia, Baie d’Urfé, QC) following the manufacturer’s instructions, and
then stained for 5 min with Ponceau S (5% Ponceau S, 2% glacial acetic acid) to confirm
transfer efficiency. For the immunodetection, the membrane was blocked for 1 hour in
blotto (5% non-fat dry milk, in TTBS [0.1% Tween-20, 0.02 M Tris/HCl pH 7.6, 0.14 M
NaCl]), rinsed three times for 5 min at room temperature with TTBS and incubated for 1
hour with the primary antibody. An anti-bcl-xL/S rabbit polyclonal IgG primary
antibody (S-18) (Santa Cruz Biotechnology, Santa Cruz, CA) was used at a dilution of
1/1500. The membrane was then washed twice with TTBS. The horseradish peroxidase-
coupled secondary antibody, anti-rabbit IgG-HRP (Santa Cruz Biotechnology), was
diluted to 1/5000 with blotto and the membrane was incubated in this solution for 1 hour.
71
Finally, the membrane was washed once for 10 min and 4 times for 5 min with TTBS
before visualization using ECLPlus chemiluminescence Kit (Amersham-Pharmacia,
Baie d’Urfé, QC) and HyperfilmECL (Amersham-Pharmacia). The film was
developed using Kodak GBX developer and fixer (Sigma).
4.2.6 MTT Assay
Cell viability was determined using the MTT viability assay (Hansen et al. 1989).
In a 96-well plate, 2×10⁵ cells were incubated in a total volume of 100 Φl in the presence
of 25 Φg/ml CHX (Sigma) or in Iscove’s media lacking L-glutamine (Sigma) for 2 and 3
hours, respectively. Twenty-five microlitres of MTT dye (5 mg/ml dissolved in PBS)
was then added to each well, followed by a 2 hours incubation at 37 °C. One hundred
microlitres of Lysis buffer (20% SDS, 50% N-N’-dimethylformamide, pH 4.7) was then
added to each well and the plates were incubated overnight at 37 °C. Optical density
readings were performed at 570 nm using a PowerWaveX micro-plate reader (Bio-Tek
Instruments, Inc). The experiments were done using 4 replicates and the results shown
are expressed as the average ± standard deviation of three independent experiments.
4.2.7 Cell transfection
The cloning of the BclxL cDNA into pTEJ8 was previously described (Gauthier
et al. 1996). Plasmids (10 Φg) were linearized with PvuI and purified by
phenol/chloroform extraction and ethanol precipitation. The linearised plasmid was then
resuspended in 5 Φl of TE Buffer (10 mM Tris/HCl pH 7.5, 1 mM EDTA) and added to 5
x 105 SP2/0-Ag14 cells in 400 Φl PBS. The mixture was submitted to electroporation
72

(180 V, 960 ΦF) using a Gene Pulser Plus unit (Bio-Rad, Mississauga, ON). After a 30
min incubation on ice, 10 ml of culture media was added and the cells were cultured in a
25 cm2 flask for 2 days. Geneticin (G-418) was added at a concentration of 750 Φg/ml to
select for transfected cells. Geneticin-resistant cells were then cloned by the single-cell
dilution technique and tested for Bcl-xL expression by Western analysis.
4.3 Results
4.3.1 Generation of Bcl-xL-transfected SP2/0-Ag14 hybridoma cells
The difference in apoptosis resistance between SP2/0-Ag14 and P3x63-Ag8.653 has been
attributed to the lower expression of the apoptotic suppressor, Bcl-xL, in SP2/0-Ag14.
Figure 4.1 shows that the protein expression levels of Bcl-xL are indeed different in these
cell lines, P3x63-Ag8.653 cells expressing high levels of Bcl-xL while SP2/0-Ag14 had
no detectable amounts. To examine the effects of Bcl-xL on the behaviour of SP2/0-
Ag14, we transfected SP2/0-Ag14 cells with the pTEJ8 expression vector containing
murine Bcl-xL cDNA (Gauthier et al. 1996). From this transfection, pTEJ8 containing
cells were selected using G-418 and several clones were isolated. Five clones were
selected by Western Blot analysis that expressed Bcl-xL at levels similar to P3x63-
Ag8.653 (Figure 4.1). The vector containing SP2/0-Ag14 clones as well as the wild type
SP2/0-Ag14 cells did not express any detectable amounts of Bcl-xL. Of particular
73
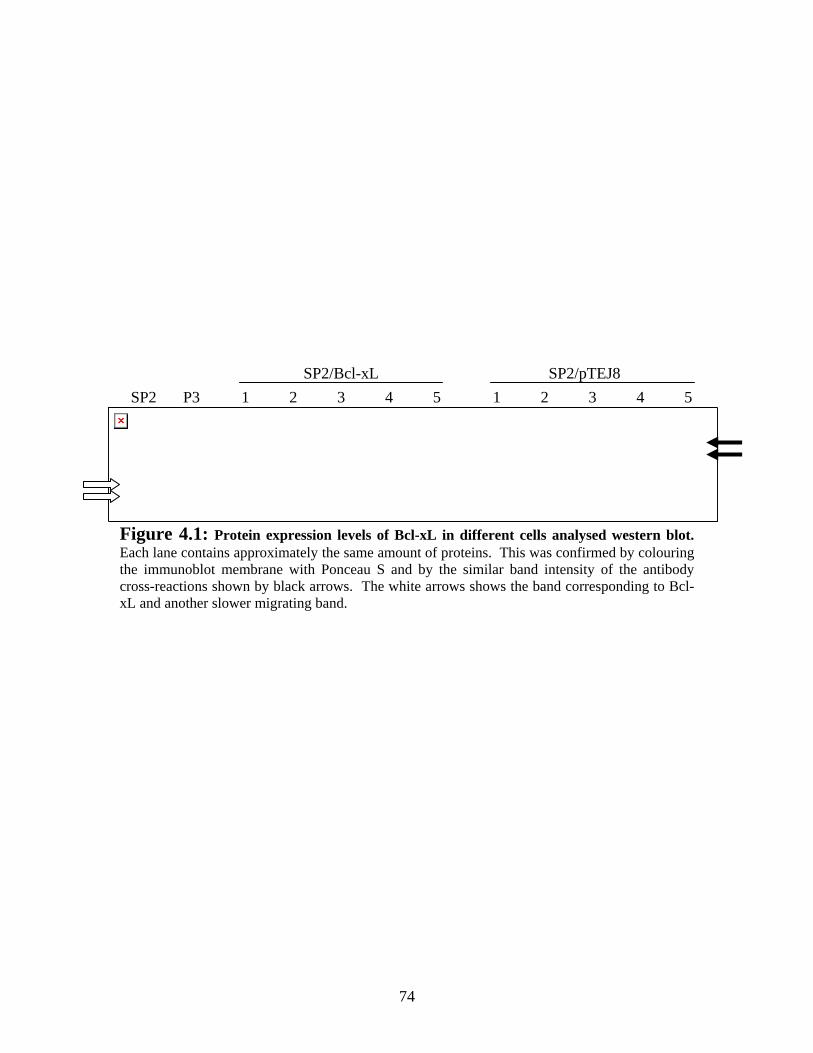
Figure 4.1: Protein expression levels of Bcl-xL in different cells analysed western blot. Each lane contains approximately the same amount of proteins. This was confirmed by colouring the immunoblot membrane with Ponceau S and by the similar band intensity of the antibody cross-reactions shown by black arrows. The white arrows shows the band corresponding to Bcl-xL and another slower migrating band.
SP2/Bcl-xL SP2/pTEJ8 P3 2 1 SP2 3 5 4 2 1 3 4 5
74
interest, we observed a slower migrating band just above the bands for Bcl-xL, which
may represent the post-translational phosphorylation of Bcl-xL (Fadeel et al. 1999).
4.3.2 Bcl-xL confers apoptosis resistance to SP2/0-Ag14
As we have seen in Chapter 3, P3x63-Ag8.653 was much more resistant to apoptosis than
SP2/0-Ag14 under prolonged culture conditions. Because Bcl-xL expression might give
SP2/0-Ag14 a survival advantage, we tested our isolated clones for resistance to
apoptotic cell death. We exposed these cells to an inhibitor of protein synthesis,
cycloheximide (CHX), that causes rapid apoptosis in several myeloma and hybridoma
cell lines (Perreault et al. 1993; Gauthier et al. 1996). The cell lines were incubated in
Iscove’s media containing 25 µg/ml of CHX for 2 hours and the viability was assessed by
the MTT viability assay. As seen in Figure 4.2, Bcl-xL-expressing SP2/0-Ag14 (clone 5)
cells showed a remarkable increase in viability in the presence of CHX when compared
to the vector-containing cells. Furthermore, the viability of SP2/Bcl-xL cells resembled
that of P3x63-Ag8.653 cell at ~90%, whereas SP2/pTEJ8 (clone 1) and wild type SP2/0-
Ag14 both had much lower viabilities around 40%. The results obtained with SP2/Bcl-
xL (clone 5) and SP2/pTEJ8 (clone 1) are representative of the effect seen in the other
clones. To test if the cells were protected form apoptotic cell death, a DNA Laddering
analysis experiment was performed on all the clones following exposed to CHX. Figure
4.3 shows the results of this analysis. All Bcl-xL containing cells had reduced or
undetectable DNA laddering when compared to the control cells and wild type SP2/0-
Ag14. Together, these results show that Bcl-xL maintains the viability of SP2/0-Ag14
cells by inhibiting or delaying apoptotic cell death induced by CHX.
75

0102030405060708090
100
SP2 P3 SP2/BclxL SP2/pTEJ8
Via
bilit
y (%
)
Figure 4.2: Differential reduction in viability in SP2, P3, SP2/PTEJ8 clone 5 and SP2/Bcl-xL clone 1. The resistance to cell death was tested under protein synthesis inhibition, which is known to induce apoptosis. The MTT viability assay was used to determine the viability of the cell lines when they were incubated for 2 hours with 25 µg/ml of CHX. The percentage of viability was calculated by comparing the optical densities with controls to which PBS used in place of CHX. The data presented here is the average of 3 independent experiments.
76
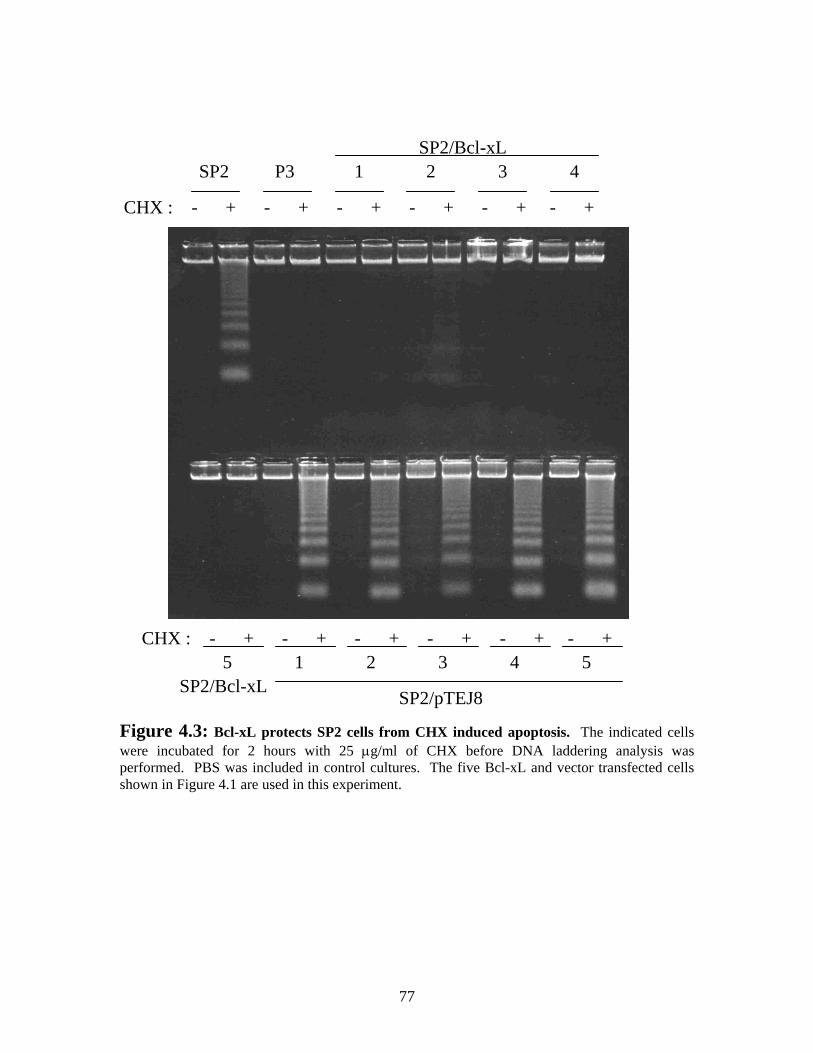
SP2 P3
CHX : - + - + - + - + - + - +
1 SP2/Bcl-xL
SP2/Bcl-xL
CHX : - + - + - + - + - + - + 5 1 3 2 4 5
SP2/pTEJ8
3 2 4
Figure 4.3: Bcl-xL protects SP2 cells from CHX induced apoptosis. The indicated cells were incubated for 2 hours with 25 µg/ml of CHX before DNA laddering analysis was performed. PBS was included in control cultures. The five Bcl-xL and vector transfected cells shown in Figure 4.1 are used in this experiment.
77
4.3.3 Bcl-xL increases viability in cultures lacking L-glutamine
To further study the protection of Bcl-xL on SP2/0-Ag14 cells, our clones were incubated
in L-glutamine-deficient media. In chapter 3, this stress was shown to rapidly induce
SP2/0-Ag14 cells to die by apoptosis while P3x63-Ag8.653 cells were more resistant.
Bcl-xL may be responsible for the robust characteristic of the P3x63-Ag8.653 cell line.
Our SP2/Bcl-xL clones were, therefore, used to study the effect of Bcl-xL against
apoptosis induced by lack of glutamine in our SP2/0-Ag14 system. The MTT viability
assay was used to measure the viability of SP2/pTEJ8 and SP2/Bcl-xL clones exposed to
these conditions. Again, SP2/Bcl-xL cells maintained a higher viability, at 55%, than the
control cells (30%) (Figure 4.4A). A similar difference in viability was also observed in
SP2/0-Ag14 and P3x63-Ag8.653 cells incubated without glutamine (Figure 3.6A). The
inhibition or delay of apoptosis by Bcl-xL was confirmed by incubating a SP2/Bcl-xL
clone and a SP2/pTEJ8 clone without glutamine and analysing the DNA laddering pattern
produced after 3 hours (Figure 4.4B). The control showed an intense apoptosis DNA
ladder while the Bcl-xL-containing SP2/0-Ag14 had almost no DNA laddering. The
protective effect of Bcl-xL by suppression of apoptosis induced by lack of glutamine is
consistent with the protection against CHX induced apoptosis seen above.
We further studied the effect of Bcl-xL on the cell death of SP2/0-Ag14 by
following the growth behaviour of SP2/0-Ag14, P3x63-Ag8.653, SP2/pTEJ8 and
SP2/Bcl-xL resuspended in Iscove’s media without L-glutamine. The SP2/pTEJ8 and
wild type SP2/0-Ag14 behaved similarly and died almost completely (85% dead cells)
within 24 hours (Figure 4.5). After 24 hours, SP2/Bcl-xL and P3x63-Ag8.653 were still
78
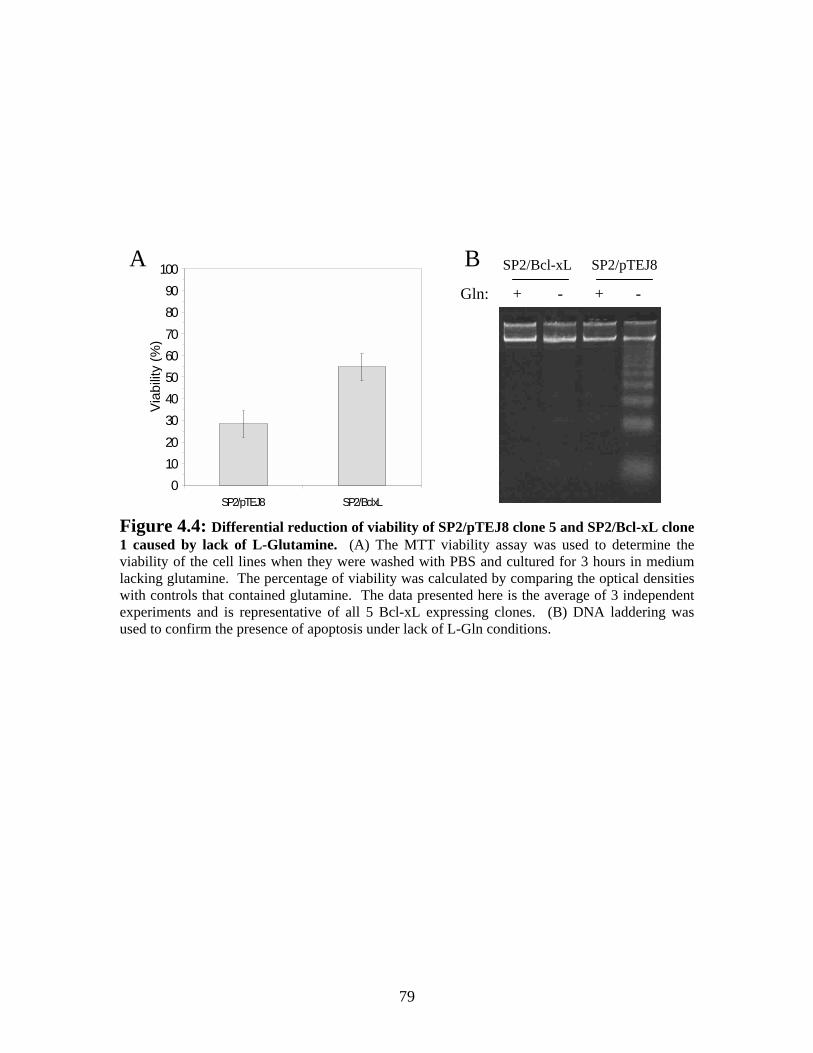
Gln: + - + -
SP2/pTEJ8 SP2/Bcl-xL
0102030405060708090
100
SP2/pTEJ8 SP2/BclxL
Viab
ility
(%)
A B Figure 4.4: Differential reduction of viability of SP2/pTEJ8 clone 5 and SP2/Bcl-xL clone 1 caused by lack of L-Glutamine. (A) The MTT viability assay was used to determine the viability of the cell lines when they were washed with PBS and cultured for 3 hours in medium lacking glutamine. The percentage of viability was calculated by comparing the optical densities with controls that contained glutamine. The data presented here is the average of 3 independent experiments and is representative of all 5 Bcl-xL expressing clones. (B) DNA laddering was used to confirm the presence of apoptosis under lack of L-Gln conditions.
79
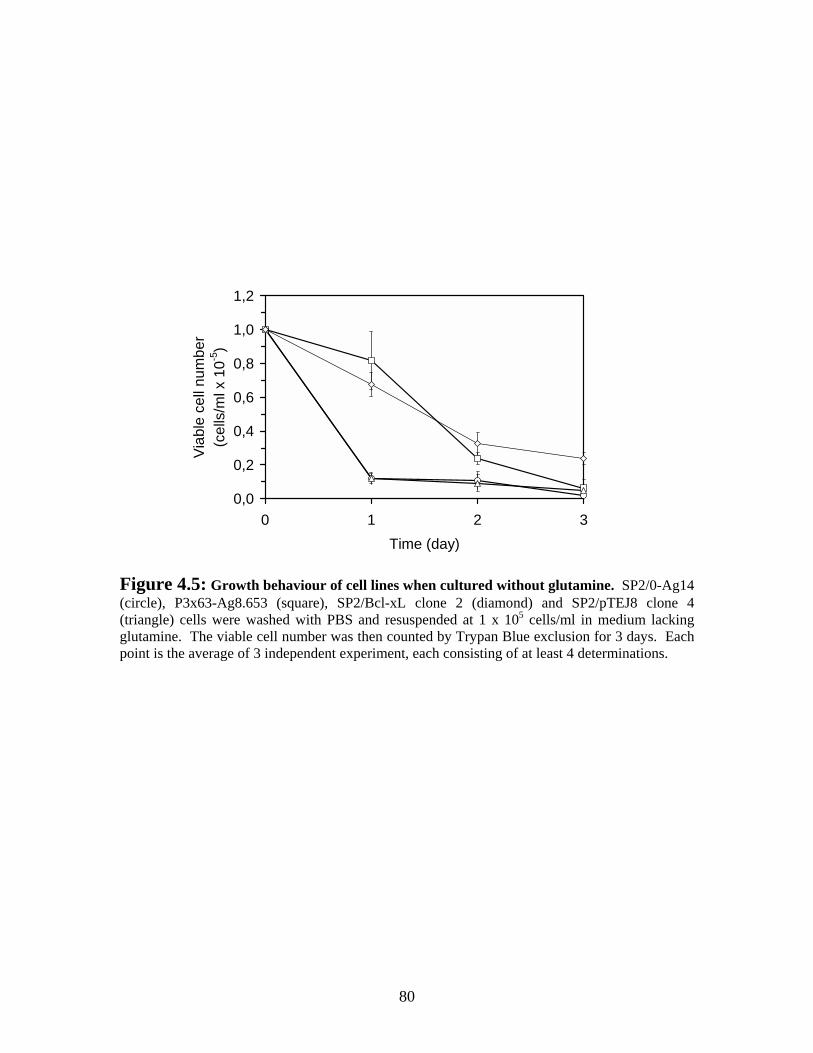
0,0
0,2
0,4
0,6
0,8
1,0
1,2
0 1 2Time (day)
Via
ble
cell
num
ber
(cel
ls/m
l x 1
0-5)
3
Figure 4.5: Growth behaviour of cell lines when cultured without glutamine. SP2/0-Ag14 (circle), P3x63-Ag8.653 (square), SP2/Bcl-xL clone 2 (diamond) and SP2/pTEJ8 clone 4 (triangle) cells were washed with PBS and resuspended at 1 x 10⁵ cells/ml in medium lacking glutamine. The viable cell number was then counted by Trypan Blue exclusion for 3 days. Each point is the average of 3 independent experiment, each consisting of at least 4 determinations.
80

viable at 67% and 90% viable, respectively. Bcl-xL had a protective effect against this
induction of apoptosis by slowing the rate of cell death in SP2/0-Ag14 to a rate
comparable to P3x63-Ag8.653. Therefore, we see that Bcl-xL changes the death
behaviour of SP2/0-Ag14 to one that is similar to P3x63-Ag8.653.
4.3.4 Bcl-xL overexpression prolongs SP2/0-Ag14’s viability in long-
term culture by delaying apoptosis
We next wished to determine whether Bcl-xL can extend the survival of SP2/0-Ag14
hybridomas in long-term culture by delaying cell death. The SP2/pTEJ8 and SP2/Bcl-xL
clones were prepared for stationary batch cultures and viable and dead cells were
enumerated daily using the Trypan Blue dye exclusion assay. The cultures presented in
Figure 4.6 are representative of the five controls and five Bcl-xL clones studied. Figure
4.6A shows the growth behaviour of SP2/pTEJ8. A lower than expected maximum
viable cell density was reached on day 5, compared to the maximum observed on day 4
for wild type SP2/0-Ag14 (Figure 3.1A). This effect is probably contributed by the
presence of the G-418 antibiotic used for clone selection and maintenance. In contrast,
SP2/Bcl-xL clones grew to a higher cell density than the control and peaked on day 6
(Figure 4.6B and C). We superimposed the percentage of viability of these clones as well
as the viability of wild type SP2/0-Ag14 and P3x63-Ag8.653 from Figure 3.1 on Figure
4.6D for a better comparison. The control and wild type SP2/0-Ag14 both start
decreasing in viability after day 3. SP2/Bcl-xL and P3x63-Ag8.653, both of which
contain Bcl-xL maintained a high viability until day 5. Their viability then gradually
decreased at similar rates. In cell culture, the decrease in viability was caused by the
81

0
5
10
15
20
25
1 2 3 4 5 6 7 8 9 10
Time (day)
Cel
l den
sity
(cel
ls/m
l x 1
0-5)
0
5
10
15
20
25
1 2 3 4 5 6 7
Time (day)
Cel
l den
sity
(cel
ls/m
l x 1
0-5)
0
5
10
15
20
1 2 3 4 5 6 7 8 9 10
Time (day)
Viab
le c
ell n
umbe
r(c
ells
/ml x
10-5
)
0102030405060708090
100
1 2 3 4 5 6 7 8 9 10
Time (day)
Viab
ility
(%)
A B
C D
Figure 4.6: Effect of Bcl-xL on the growth behaviour of SP2/pTEJ8 clone 4 (A) and SP2/Bcl-xL clone 1 (B) were analysed during stationary batch culture. Viable cells (circles) and dead cells (squares) were determined by Trypan Blue exclusion assay and counted with a hemacytometer. The dotted line with triangles represents the total number of cells in the culture. Each point is the average of at least 4 determinations. (C) super-imposes the viable cell number of SP2/pTEJ8 (closed circles) and SP2/Bcl-xL (closed squares) cultures shown in (A) and (B). Part (D) shows the data in (A) and (B) as percentage of viability and also includes SP2 and P3 cultures from Figure 3.1 (A) and (B). Series in (D) are labeled as follows: SP2 (open circles), SP2/pTEJ8 (closed circles), P3 (open squares) and SP2/Bcl-xL (closed squares).
82
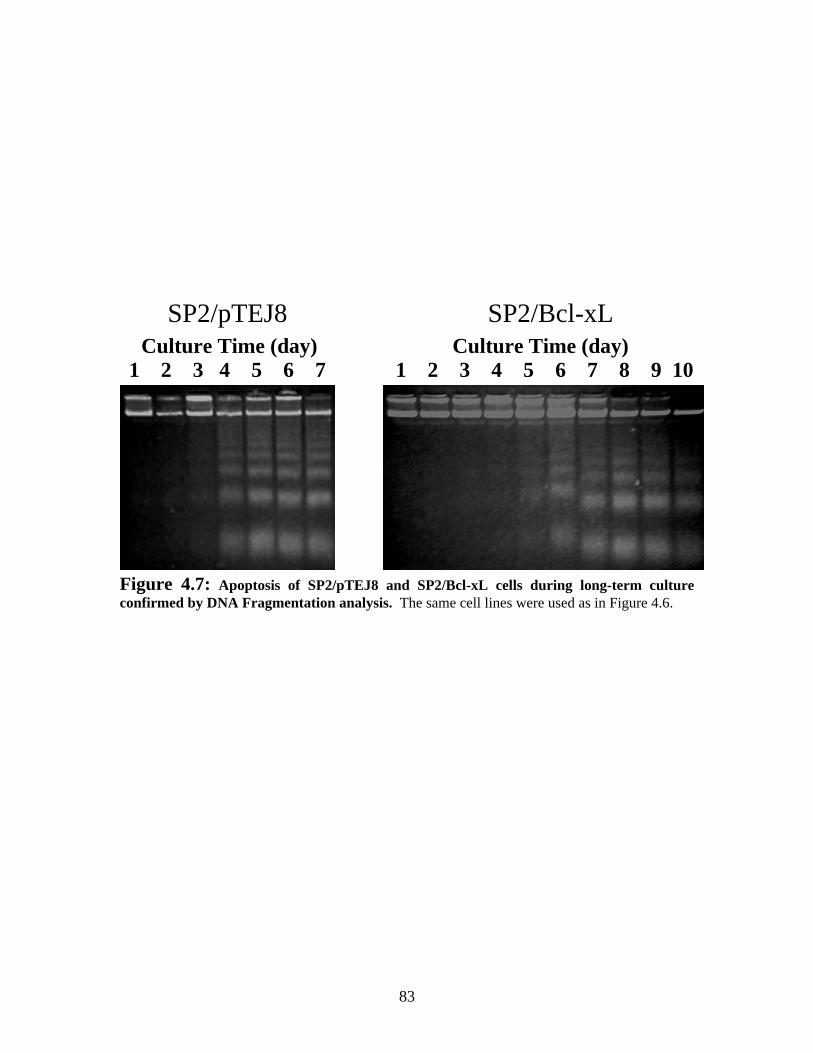
SP2/pTEJ8 SP2/Bcl-xL
1 2 3 4 5 6 7 Culture Time (day)
1 2 3 4 5 6 7 8 9 10 Culture Time (day)
Figure 4.7: Apoptosis of SP2/pTEJ8 and SP2/Bcl-xL cells during long-term culture confirmed by DNA Fragmentation analysis. The same cell lines were used as in Figure 4.6.
83
induction of apoptotic cell death as indicated by DNA laddering analysis (Figure 4.7),
which coincides with the decrease in viability after day 2 of SP2/pTEJ8 and after day 5
for SP2/Bcl-xL. These results suggest that Bcl-xL can modify the death behaviour of
SP2/0-Ag14 cells to make their resistance to apoptosis similar to that of P3x63-Ag8.653.
4.3.5 Bcl-xL-transfected SP2/0-Ag14 are still distinct from P3x63-
Ag8.653 cells
Because of the similarities in growth profiles and death kinetics between SP2/Bcl-xL and
P3x63-Ag8.653, we tested the possibility that Bcl-xL changed the growth behaviour of
SP2/0-Ag14 when cultured in the presence of low concentration of FBS. SP2/Bcl-xL and
SP2/pTEJ8 were, therefore, resuspended in media containing only 0.1% FBS, and we
counted the viable cell number daily using Trypan Blue dye (Figure 4.8). Bcl-xL does
not alter the growth behaviour of SP2/0-Ag14 because SP2/pTEJ8 and SP2/Bcl-xL both
have a similar growth profile. Furthermore, their profiles are also similar to wild type
SP2/0-Ag14 (Figure 3.4). Therefore, SP2/Bcl-xL and P3x63-Ag8.653 are distinct cell
lines and the differences in SP2/0-Ag14 caused by Bcl-xL are primarily due to an
acquired resistance to apoptosis.
84

0,0
0,5
1,0
1,5
2,0
2,5
1 2 3 4 5 6
Time (day)
Via
ble
cell
num
ber
(cel
ls/m
l x 1
0-5)
7
Figure 4.8: Growth behaviour of SP2/pTEJ8 and SP2/Bcl-xL cells in limited growth factor conditions. SP2/pTEJ8 clone 4 (triangles) and SP2/Bcl-xL clone 2 (diamonds) cells were washed with PBS and resuspended in Iscove’s medium containing 0.1% FBS. Cells were counted daily using Trypan Blue dye and each point is the average of at least 4 determinations.
85

4.4 Discussion
4.4.1 Bcl-xL expression in SP2/0-Ag14 restores its apoptosis resistance
to levels similar to P3x63-Ag8.653
From the results obtained from the transfection of Bcl-xL in SP2/0-Ag14 cells, we can
state that the distinct susceptibility to apoptosis of SP2/0-Ag14 and P3x63-Ag8.653 is
primarily attributed to differences in levels of Bcl-xL. SP2/0-Ag14 cells do not express
detectable amounts of Bcl-xL (Figure 4.1) and undergo apoptosis under CHX (Figure 4.2
and Figure 4.3) and lack of glutamine (Figure 3.6) conditions. However, when SP2/0-
Ag14 cells were engineered to express Bcl-xL at levels similar to the endogenous levels
of P3x63-Ag8.653 (Figure 3.6), it mirrored the apoptosis resistance of P3x63-Ag8.653
under these same conditions (Figure 4.2-4.4). Furthermore, Bcl-xL also extended the
viability of SP2/0-Ag14 in long-term culture and produced a growth profile resembling
P3x63-Ag8.653’s (Figure 3.1B and Figure 4.6) by delaying apoptosis (Figure 4.7).
The exact mechanism by which Bcl-xL protect these cells is still not known,
however, it is thought that Bcl-xL and Bcl-2 share redundancy in their functional
pathways (Chao et al. 1998). Both of these anti-apoptotic proteins are expressed at
different stages of lymphocyte development. Bcl-xL is expressed in immature
lymphocytes while Bcl-2 is expressed in mature lymphocytes (Chao et al. 1998), which
allows them to use the same protection pathway. Furthermore, this redundancy is clear in
some myeloma expressing high levels of Bcl-xL, and in which the ectopic expression of
Bcl-2 is without effect (Murray et al. 1996; Fujita et al. 1997). Effectively, in NS/0 and
P3x63Ag8.653 cells, the endogenous levels of Bcl-xL would saturate the apoptotic
86

machinery, thus making the overexpression of Bcl-2 ineffective. In light of this, the
simultaneous overexpression of Bcl-2 and Bcl-xL anti-apoptotic proteins would not be
expected to significantly increase the viability of hybridoma cells in long-term culture.
There are many proposed mechanisms for the protective effect of Bcl-2 and Bcl-
xL. One mechanism that has recently been proposed could explain Bcl-xL’s protective
function in our cell system. In several studies, the level of glutathione (GSH) was
observed to decrease during apoptosis (Cotgreave et al. 1998; Sies 1999). Furthermore,
Bcl-2 and Bcl-xL has been shown to maintain and increase the level of total GSH in cells
(Bojes et al. 1997; Voehringer 1999). It is not clear how Bcl-2 family members can
regulate the synthesis of GSH, but it was observed that Bcl-2 lost its protective function if
cellular GSH was depleted (Voehringer 1999). In SP2/pTEJ8 cells, and wild-type SP2/0-
Ag14, glutamine deprivation potentially decreases the levels of GSH and causes
apoptosis, while Bcl-xL overexpression partially restore the levels of GSH (Guérin and
Gauthier, unpublished data). Perhaps Bcl-xL maintains these levels or regulates the
redox potential of the cell by other means.
Bcl-xL could also inhibit apoptosis in SP2/Bcl-xL and P3x63-Ag8.653 cells by
other mechanism. Bcl-xL binding and inhibition of pro-apoptotic family members such
as Bax could cause the life or death decision of the cell to tilt in the favour of survival
(Hengartner 2000; Tsujimoto et al. 2000). Also, Bcl-xL could inhibit cytochrome c
release by binding the PTP (Hengartner 2000; Tsujimoto et al. 2000) or regulate other
channels within the cells (Voehringer 1999), thus inhibiting the activation of the
apoptotic death pathway.
87

4.4.2 Future work and experiments
Future work on the effect of Bcl-xL in murine myeloma/hybridoma cell would consist of
studying the mechanism of Bcl-xL’s protective function. Traditional Bcl-2 functions
such as dimerization with Bax and regulation of VDAC would be analysed by
immunoprecipitation studies and by detecting the release of cytochrome c. The decrease
of GSH by glutamine deprivation is an interesting hypothesis that would have to be tested
in our cell system. A simple experiment that could be performed is to measure the levels
of GSH in SP2/Bcl-xL and SP2/pTEJ8 cells induced to die by apoptosis during long-term
culture. If Bcl-xL functions by maintaining the level of GSH, then GSH levels should
not change considerably in SP2/Bcl-xL cells.
88

Chapter 5 Mutagenesis of Bcl-xL and its effect on SP2/0-Ag14
89
5.0 Mutagenesis of Bcl-xL and its effect on SP2/0-Ag14
5.1 Introduction
The production of monoclonal antibodies by hybridoma cell lines is a very lucrative
business. The antibodies produced are widely used in medical, research and industrial
applications (Bibila et al. 1995; Dickson 1998; Casadevall 1999; Green et al. 2000).
However, the production yields are limited due to the premature death of the cells caused
by nutritional and environmental stresses. Apoptotic cell death was recognized as the
major form of cell death in these cell cultures (Franek et al. 1991; Franek et al. 1992;
Mercille et al. 1994; Singh et al. 1994). The suicide of the cells is a natural response to
the culture stresses imposed on the cells during extended culture periods required to
obtain high yield of monoclonal antibodies. Some studies have optimized the culture
medium by supplementing nutrients, growth factors and survival factors with the hope to
avoid this cellular response or at least delay it (Bibila et al. 1995; Franek 1995). Others
have taken a more active approach that focuses on disrupting the apoptosis pathway with
apoptosis inhibitors such as members of the Bcl-2 family, E1B-19K, and HSP70 (Itoh et
al. 1995; Terada et al. 1997; Ahn et al. 1999; Mercille et al. 1999; Simpson et al. 1999;
Charbonneau et al. 2000).
One group of apoptosis inhibitors that shows great promise at delaying apoptotic
cell death in hybridoma cultures are the anti-apoptosis members of the Bcl-2 family. The
founding member, Bcl-2, has yielded varied results upon over expression in myeloma and
hybridoma cell lines (Itoh et al. 1995; Fujita et al. 1996; Murray et al. 1996; Singh et al.
1996; Singh et al. 1997; Terada et al. 1997; Fassnacht et al. 1998). Another member of
90

the family, Bcl-xL, has recently been shown to also be a prime candidate by delaying cell
death in myeloma/hybridoma culture (Charbonneau et al. 2000). This apoptosis regulator
was found to delay cell death in SP2/0-Ag14 cell to a level comparable to P3x63Ag8.653,
a related cell line that naturally expresses Bcl-xL. This level of protection may be the
limit of anti-apoptotic effect of this group of apoptosis inhibitors in this cell type, because
the transfection of Bcl-2 in myelomas that already containing Bcl-xL does not show any
additive effects (Murray et al. 1996; Fujita et al. 1997). This may be due to a redundant
function of the two proteins or the activation of a negative regulatory mechanism
inhibiting Bcl-2 and Bcl-xL. Studies done on Bcl-xL have shown that specific mutations
in the Bcl-xL sequences have increased the protective effect of the protein by disrupting
its negative regulation. Therefore, the expression of carefully mutated Bcl-xL could
further increase the viability of hybridoma cells lines and lead to an increase in the
monoclonal antibody production.
One of Bcl-xL’s major forms of regulation is through the binding of BH3-only
proteins such as Bad, Bim, Bid and others (Tsujimoto et al. 2000). These regulators are
pro-apoptotic members of the Bcl-2 family that possess only the BH3 domain. They
function by inserting their BH3 domain into the hydrophobic pocket (formed by BH1,
BH2 and BH3) of Bcl-xL proteins. Once Bcl-xL heterodimerizes with a BH3-only
protein, it can no longer inhibit apoptosis. A study looking at the dimerization of Bcl-xL
with Bad showed that a mutation of a single residue located in the hydrophobic pocket of
Bcl-xL could completely abrogate the interaction between these two proteins (Kelekar et
al. 1997). The mutation involves the valine residue at position 126 that is important for
interacting with a conserved leucine residue from the incoming BH3 domain. When V126
91

is converted to a glycine, Bcl-xL can no longer interact with Bad. Bcl-xL is then free to
continue to protect the cell from activated Bad.
Another regulatory mechanism of Bcl-xL is by phosphorylation of its loop
domain. The loop domain is found between amino acid 46 and 83 and contains many
phosphorylatable serine residues. Phosphorylation of the loop domain was observed to
change the activity of Bcl-xL and Bcl-2 (Chang et al. 1997). The effect of this
posttranslational modification may be dependent on cellular context because
phosphorylation of these proteins were reported to increase the protective function in
some cell lines or deactivate it in others (Ito et al. 1997; Ling et al. 1998; Scatena et al.
1998; Chadebech et al. 1999; Poommipanit et al. 1999; Sooryanarayana et al. 1999;
Yamamoto et al. 1999). Nevertheless, the deletion of the whole domain consistently
increased the anti-apoptotic effect of Bcl-xL and Bcl-2 (Chang et al. 1997; Srivastava et
al. 1999; Wang et al. 1999).
With the hope of increasing the effectiveness of Bcl-xL in hybridoma/myeloma
cell lines, we transfected SP2/0-Ag14 with one of these two forms of Bcl-xL. The Bcl-
xL cDNA was first mutagenized using PCR and cloned into a mammalian expression
vector, pTEJ8. Individually propagated clones of SP2/pTEJ8/V126G, SP2/pTEJ8/∆loop,
SP2/pTEJ8/Bcl-xL (wild type) were compared to SP2/pTEJ8 and anti-sense controls to
observe the effect of the mutations on the cell’s sensitivity to apoptosis. Clones
expressing similar recombinant protein levels were selected by immunodetection. Direct
comparison between SP2/pTEJ8/Bcl-xL and SP2/pTEJ8/∆loop was not possible because
the ∆loop clones expressed much higher levels of these proteins. Low, medium and high
expressing clones of the Bcl-xL/∆loop construct were, therefore, analysed instead. The
92
susceptibility of these clones to apoptosis was analysed using cycloheximide exposure
and glutamine deprivation triggers. The robustness of these cells was further analysed
under prolonged growth culture conditions. The results obtained here may give insights
into the function of Bcl-xL and the regulation of this anti-apoptotic protein in
myeloma/hybridoma cell lines.
5.2 Methods and Materials
5.2.1 Reagents and methods
Unless otherwise stated, all reagents were obtained from Canadian Life Technologies
(Burlington, ON). A 70x stock solution of glutamine was made with PBS (7.4) to
replenish the concentration of glutamine in the culture medium to 4.5 mM. All general
molecular biology techniques used were performed according to Sambrook et al.
(Sambrook et al. 1989).
5.2.2 Cell lines and cell maintenance
The murine cell lines P3x63-Ag8.653 (ATCC# CRL1580) and SP2/0-Ag14 (ATCC #
CRL1581) were obtained from the American Type Culture Collection (Rockville, MD).
Both cell lines were maintained in Iscove’s modified Eagle’s media (Media Preparation
Lab, Princess Margaret Hospital, Toronto, ON), supplemented with 5% Fetalclone I
93

(Hyclone), 100 U/ml penicillin and 100 Φg/ml streptomycin. Cell culture was performed
at 37 °C under an atmosphere of 5% CO2 / 95% air. Transfected cells were maintained in
culture media supplemented with 750 Φg/ml of Geneticin (G-418) to the culture medium.
All open flask manipulations of cell cultures were performed under aseptic conditions in
a Labconco Purifier Class II safety cabinet.
5.2.3 Long-term stationary batch cell culture
Exponentially growing cells were centrifuged and resuspended in fresh culture medium at
a concentration of 5 x 10⁴ cells/ml in 25 cm2 flasks and cultured as described above. Cell
viability was determined by the Trypan Blue dye exclusion assay: an aliquot of cells was
diluted in 0.04% trypan blue (Sigma, Oakville, ON) dissolved in PBS. The viable (white)
cells and dead (blue) cells were counted using a Bright-Line Hemacytometer (Sigma,
Oakville, ON). Each result is the average ± standard deviation of at least 4
determinations.
5.2.4 DNA laddering assay
DNA fragmentation analysis was performed following a procedure modified from a
previously reported protocol (Smith et al. 1989). Briefly, 5 x 10⁵ cells were collected and
washed once with PBS. The cells were lysed with 50 Φl of lysis buffer (10 mM Tris HCl
pH 8, 1 mM EDTA pH 8, 0.5% N-Lauroyl Sarcosine, and freshly added 0.25 mg/ml
Proteinase K and 0.02 mg/ml RNAse). The mixture was then incubated for 5 minutes at
50 °C. An equal volume (50 Φl) of sample buffer (40% sucrose, 0.08% Bromophenol
Blue) was then added to the sample. Fifteen microliters of the samples were loaded in
94
the wells of a 2% agarose gel and electrophoresis was performed using a BioRad Mini
Sub Cell DNA electrophoresis unit in TBE Buffer (0.089 M Tris Base, 0.089 M Boric
Acid, 0.002 M EDTA pH 8) at 95V for 45 minutes. The DNA was then stained for 5
minutes with ethidium bromide (0.7 Φg/ml) and washed with H2O for 3 hours, before
visualization under UV illumination.
5.2.5 Protein extract preparation and Western analysis
Soluble cellular protein extracts were prepared as follows: two million cells were wash
with PBS and pelleted by centrifugation (1 500 RPM, 4ΕC for 10 min). The cell pellet
was resuspended in 500 Φl of RIPA buffer (1% IGEPAL, 1% deoxycholic acid, 0.1%
SDS in PBS) and incubated on ice for 30 min. The samples were then sonicated for 10
seconds before adding 5 Φl of 10 mg/ml PMSF dissolved in isopropanol, followed by a
30 min incubation on ice. Following centrifugation (12 500 RPM, 4ΕC for 20 min), the
supernatant was transferred to another tube and its protein content determined using the
DC Protein Assay Kit (Bio-Rad) using BSA as standard. The extracts were then stored at
-80ΕC until needed.
For Western Blot analysis, equal amount of proteins were loaded into the wells of
a 10% PAGE-SDS polyacrylamide gel and resolved using a Bio-Rad Mini-Protean II
electrophoresis unit. The proteins were transferred to a Hybond-P membrane
(Amersham-Pharmacia, Baie d’Urfé, QC) following the manufacturer’s instructions, and
then stained for 5 min with Ponceau S (5% Ponceau S, 2% glacial acetic acid) to confirm
transfer efficiency. For the immunodetection, the membrane was blocked for 1 hour in
blotto (5% non-fat dry milk, in TTBS [0.1% Tween-20, 0.02 M Tris/HCl pH 7.6, 0.14 M
95

NaCl]), rinsed three times for 5 min at room temperature with TTBS and incubated for 1
hour with the primary antibody. The following polyclonal IgG primary antibodies were
used at the indicated dilutions: 1/1500 rabbit anti-BclxL/S antibody (S-18) (Santa Cruz
Biotechnology, Santa Cruz, CA) or 1/2000 rabbit anti-HA probe antibody (Y-11) (Santa
Cruz Biotechnology) diluted in blotto. The membrane was then washed twice for 5 min
with TTBS. The horseradish peroxidase coupled secondary antibody, anti-rabbit IgG-
HRP (Santa Cruz Biotechnology), was diluted to 1/5000 with blotto and the membrane
was incubated in this solution for 1 hour. Finally, the membrane was washed once for 10
min and 4 times for 5 min with TTBS before visualization using ECLPlus
chemiluminescence Kit (Amersham-Pharmacia, Baie d’Urfé, QC) and HyperfilmECL
(Amersham-Pharmacia, Baie d’Urfé, QC). The film was developed using Kodak GBX
developer and fixer (Sigma).
5.2.6 MTT Assay
Cell viability was determined using the MTT viability assay (Hansen et al. 1989). In a
96-well plate, 2×10⁵ cells were incubated in a total volume of 100 Φl in the presence of
25 Φg/ml CHX (Sigma) or in Iscove’s media lacking L-glutamine (Sigma) for 2 and 3
hours, respectively. Twenty-five microlitres of MTT dye (5 mg/ml dissolved in PBS)
was then added to each well, followed by a 2 hours incubation at 37 °C. One hundred
microlitres of Lysis buffer (20% SDS, 50% N-N’-dimethylformamide, pH 4.7) was then
added to each well and the plates were incubated overnight at 37 °C. Optical density
readings were performed at 570 nm using a PowerWaveX micro-plate reader (Bio-Tek
96
Instruments, Inc). The experiments were done in 4 replicates and the results shown are
expressed as the average ± standard deviation of three independent experiments.
5.2.7 RNA Isolation and Reverse transcription
RNA was isolated from murine brain tissue (CD-1 mice) using a technique described by
Gauthier and al. (Gauthier et al. 1997). The RNA yield (Φg/Φl) and purity (260 nm/ 280
nm ratio) were determined with a Pharmacia Biotech Ultrospec 3000 UV/Visible
spectrophotometer using the manufacturer’s software. The quality of the RNA was also
verified by agarose gel electrophoresis and ethidium bromide staining. cDNA was
prepared in a 0.5 ml microcentrifuge tube by mixing 1 µg of RNA with 2.5 µl of 10
pmol/µl oligo-dT(12-18) in a volume of molecular biology grade H2O that would give a
final reaction volume of 40 µl. The tube was then incubated at 85 °C for 10 min followed
by 15 min on ice. Four microliters of 10x reverse transcription buffer (500 mM of
Tris/HCl pH 8.3, 0.75 M of KCl, 30 mM of MgCl2, 0.1 M DTT), 2 µl of dNTP (10 mM
of each), 1 µl of RNAse inhibitor and 1 µl of M-MLV-reverse transcriptase (200 U) were
added to the mixture. The sample was then incubated at room temperature for 15 min
followed by a 1 hour incubation at 37 °C. The resulting cDNA was stored at –20 °C until
needed.
5.2.8 Touchdown Polymerase Chain reaction (PCR)
Polymerase chain reactions were carried out using murine brain cDNA, Platinum Taq
HIFI DNA polymerase and primers found in Table 5.1. The forward primers that
corresponded to the 5’ coding sequence of Bcl-xL included the Kozak concensus
97

sequence (CCACCATG) to facilitate translation initiation by increasing the recognition
of the start codon by ribosomes (Kozak 1991a, 1991b). Also, the downstream primer that
was complementary to the 3’ end of the coding sequence of Bcl-xL replaced the stop
codon with the sequence for a HA tag followed by a stop codon. All PCR reactions were
carried out in a total volume of 50 Φl containing High Fidelity PCR Buffer, 3 mM of
MgSO4, 10 mM of each dNTP and 1.25 U of polymerase and 1 µl of template DNA.
Using a PTC-100 Programmable Thermal Controler thermocycler (MJ Research, Inc.),
the primer mixes (10 pmol of each primer) were added after a 5 min hot start at 95°C.
Touchdown PCR was then performed for 5 cycles as follows: denaturation at 95 °C for
30 sec, primer annealing for 30 sec from 61 °C to 56 °C in 1 °C intervals per cycle, and
primer elongation at 72 °C for 30 sec. This was followed by 20 PCR cycles using 56 °C
as the annealing temperature. The last cycle was followed by a 10 min incubation at 72
°C. The products were then separated by agarose gel electrophoresis and isolated using a
Concert Rapid Gel Extraction Kit following the manufacturer’s instructions.
Table 5.1: Sequence of oligonucleotides used as primers in PCR and mutagenesis experiments.
Primer name Sequence (5’→3’); the position of the sequences on wt Bcl-xL cDNA is given.
Description
Kozak-Bcl-xL CCACCA1TGTCTCAGAGCAACCGGGAG21 Kozak consensus sequence Bcl-xL-HA TCAAGCATAATCTGGAACGTCATATGGATAC699
TTCCGACTGAAGAGTGAGCCC678 HA epitope tag (YPYDVPDYA) followed by a stop codon
downstream V126G
A389GTTCATTCACTCCCTGCTCAAAGCTCTGATACG356
Base pair substitution of T377 to G on non-coding strand
upstream V126G G365CTTTGAGCAGGGAGTGAATGAACTCTTTCGGGATG400
Base pair substitution of A377 to C on coding strand
upstream ∆loop G114AAGAAACTGAAGCAGAGAGGG136CTGCTGCTGCTGC251AGCAGTGAAGCAAGCGCTG270
Ala-Ala-Ala-Ala replacing the loop domain
98
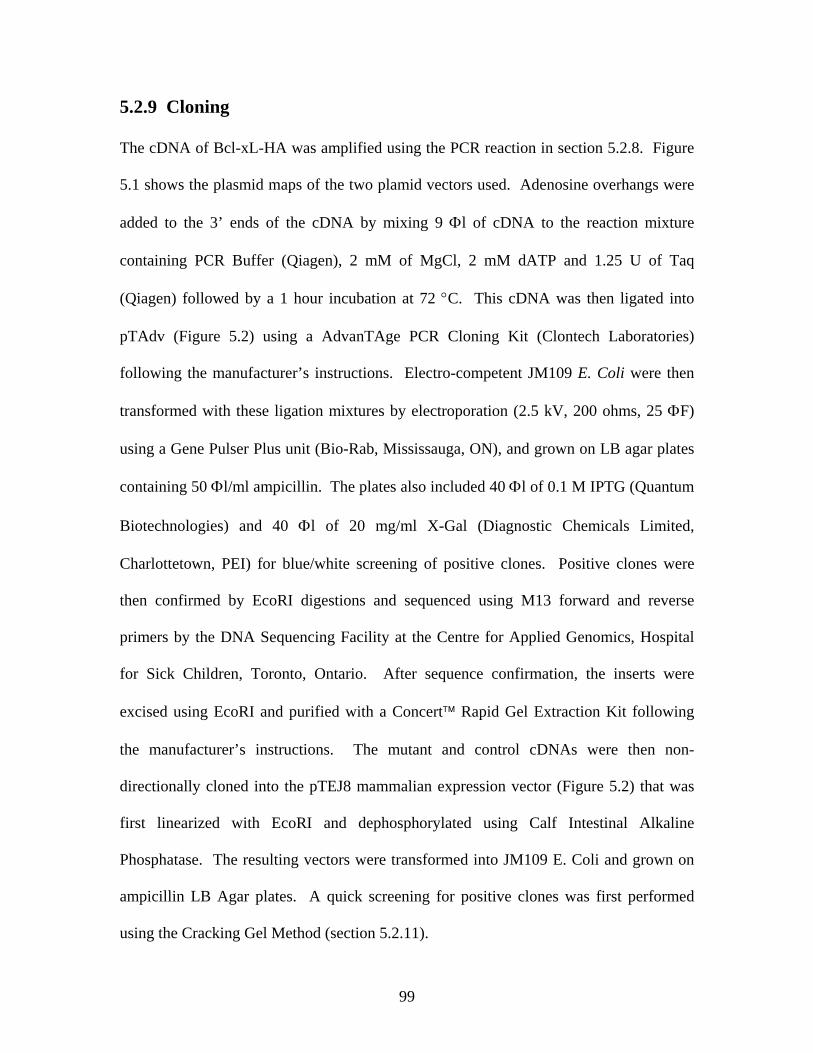
5.2.9 Cloning
The cDNA of Bcl-xL-HA was amplified using the PCR reaction in section 5.2.8. Figure
5.1 shows the plasmid maps of the two plamid vectors used. Adenosine overhangs were
added to the 3’ ends of the cDNA by mixing 9 Φl of cDNA to the reaction mixture
containing PCR Buffer (Qiagen), 2 mM of MgCl, 2 mM dATP and 1.25 U of Taq
(Qiagen) followed by a 1 hour incubation at 72 °C. This cDNA was then ligated into
pTAdv (Figure 5.2) using a AdvanTAge PCR Cloning Kit (Clontech Laboratories)
following the manufacturer’s instructions. Electro-competent JM109 E. Coli were then
transformed with these ligation mixtures by electroporation (2.5 kV, 200 ohms, 25 ΦF)
using a Gene Pulser Plus unit (Bio-Rab, Mississauga, ON), and grown on LB agar plates
containing 50 Φl/ml ampicillin. The plates also included 40 Φl of 0.1 M IPTG (Quantum
Biotechnologies) and 40 Φl of 20 mg/ml X-Gal (Diagnostic Chemicals Limited,
Charlottetown, PEI) for blue/white screening of positive clones. Positive clones were
then confirmed by EcoRI digestions and sequenced using M13 forward and reverse
primers by the DNA Sequencing Facility at the Centre for Applied Genomics, Hospital
for Sick Children, Toronto, Ontario. After sequence confirmation, the inserts were
excised using EcoRI and purified with a Concert Rapid Gel Extraction Kit following
the manufacturer’s instructions. The mutant and control cDNAs were then non-
directionally cloned into the pTEJ8 mammalian expression vector (Figure 5.2) that was
first linearized with EcoRI and dephosphorylated using Calf Intestinal Alkaline
Phosphatase. The resulting vectors were transformed into JM109 E. Coli and grown on
ampicillin LB Agar plates. A quick screening for positive clones was first performed
using the Cracking Gel Method (section 5.2.11).
99

100

Figure 5.1: Vectors used during the cloning of Bcl-xL, Bcl-xL/V126G and Bcl-xL/∆loop. pTAdv was obtained from Clontech. pTEJ8 was donated by Dr. Réal Lemieux, HémaQuébec (St-Foy, Québec)
101
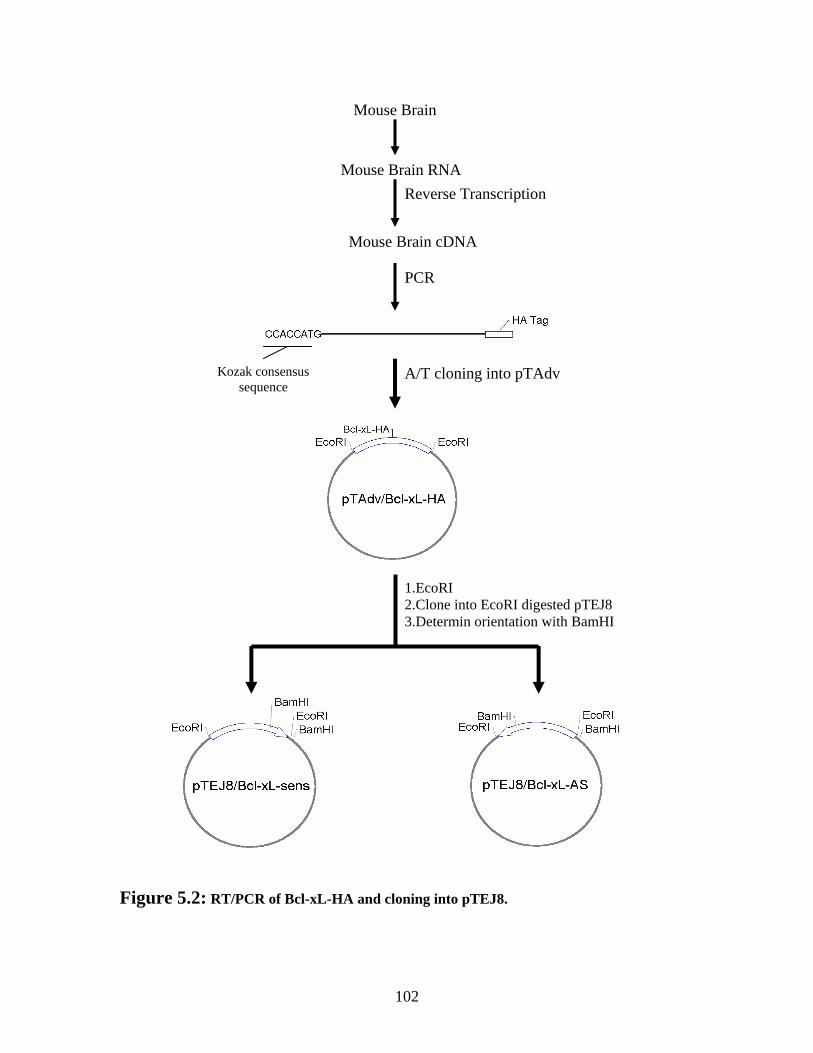
Mouse Brain
Mouse Brain RNA
Kozak consensus sequence
1.EcoRI 2.Clone into EcoRI digested pTEJ8 3.Determin orientation with BamHI
PCR
Reverse Transcription
Mouse Brain cDNA
A/T cloning into pTAdv
Figure 5.2: RT/PCR of Bcl-xL-HA and cloning into pTEJ8.
102
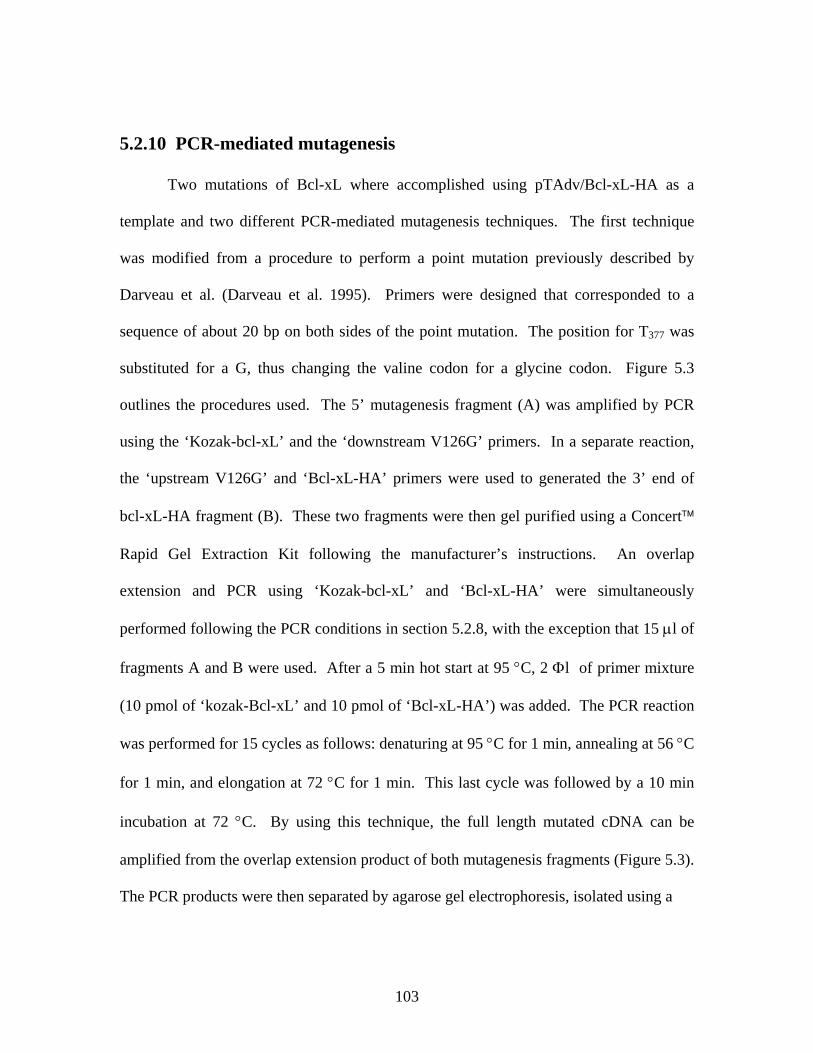
5.2.10 PCR-mediated mutagenesis
Two mutations of Bcl-xL where accomplished using pTAdv/Bcl-xL-HA as a
template and two different PCR-mediated mutagenesis techniques. The first technique
was modified from a procedure to perform a point mutation previously described by
Darveau et al. (Darveau et al. 1995). Primers were designed that corresponded to a
sequence of about 20 bp on both sides of the point mutation. The position for T377 was
substituted for a G, thus changing the valine codon for a glycine codon. Figure 5.3
outlines the procedures used. The 5’ mutagenesis fragment (A) was amplified by PCR
using the ‘Kozak-bcl-xL’ and the ‘downstream V126G’ primers. In a separate reaction,
the ‘upstream V126G’ and ‘Bcl-xL-HA’ primers were used to generated the 3’ end of
bcl-xL-HA fragment (B). These two fragments were then gel purified using a Concert
Rapid Gel Extraction Kit following the manufacturer’s instructions. An overlap
extension and PCR using ‘Kozak-bcl-xL’ and ‘Bcl-xL-HA’ were simultaneously
performed following the PCR conditions in section 5.2.8, with the exception that 15 µl of
fragments A and B were used. After a 5 min hot start at 95 °C, 2 Φl of primer mixture
(10 pmol of ‘kozak-Bcl-xL’ and 10 pmol of ‘Bcl-xL-HA’) was added. The PCR reaction
was performed for 15 cycles as follows: denaturing at 95 °C for 1 min, annealing at 56 °C
for 1 min, and elongation at 72 °C for 1 min. This last cycle was followed by a 10 min
incubation at 72 °C. By using this technique, the full length mutated cDNA can be
amplified from the overlap extension product of both mutagenesis fragments (Figure 5.3).
The PCR products were then separated by agarose gel electrophoresis, isolated using a
103
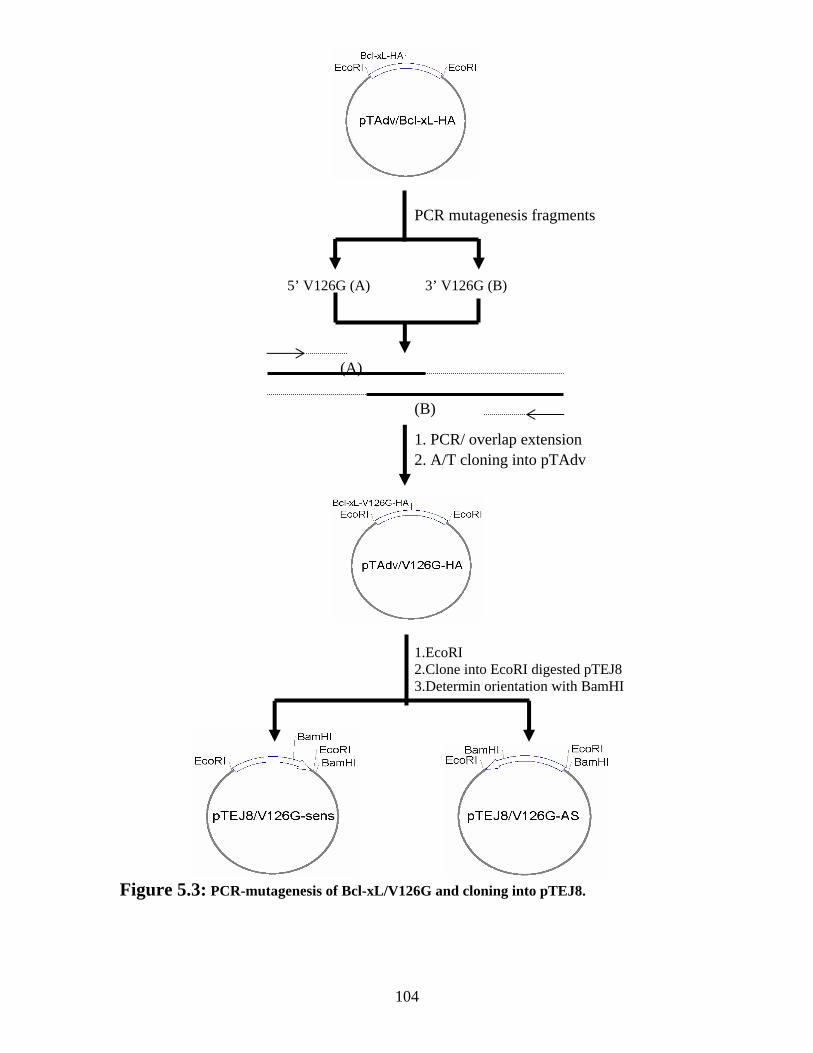
1.EcoRI 2.Clone into EcoRI digested pTEJ8 3.Determin orientation with BamHI
(B)
(A)
3’ V126G (B)
PCR mutagenesis fragments
5’ V126G (A)
1. PCR/ overlap extension 2. A/T cloning into pTAdv
Figure 5.3: PCR-mutagenesis of Bcl-xL/V126G and cloning into pTEJ8.
104

Concert Rapid Gel Extraction Kit following the manufacturer’s instructions, and cloned
using the procedures described in 5.2.9. EcoRI digestions confirmed the insertion of this
751 bp mutant in pTAdv and in pTEJ8. The orientation of the fragment in pTEJ8 was
confirmed by BamHI digestion yielding a 194 bp excision product if the mutant was in
the sens orientation in pTEJ8 or a 557 bp excision product if the mutant was in the
antisens orientation. The pTAdv/V126G plasmid was sequenced to confirm that only the
desired mutation had been introduced.
The second mutation of Bcl-xL cDNA eliminated the sequence corresponding to
amino acids 46 to 83 in murine Bcl-xL cDNA using a modified technique published in
BioTechniques (Pont-Kingdon 1994). For this mutagenesis experiment, a PCR primer
was designed from the sequences that flanked the region that coded for the loop domain.
These sequences were rejoined together in one primer by a small sequence that translated
into 4 consecutive alanines to replace the loop domain. Figure 5.4 outlines the procedure
used. The ‘upstream ∆loop’ primer was used with the ‘Bcl-xL-HA’ 3’ primer to produce
the 3’ Delta loop mutagenesis fragment. This fragment was then gel purified and used in
a second PCR reaction with the pTAdv/Bcl-xL-HA vector to amplify the full length bcl-
xL-∆loop fragment. The PCR reaction used the same conditions as in section 5.2.8, with
the exception that 30 µl of 3’ Delta loop fragments and 1 µl of pTAdv/Bcl-xL-HA were
used. Also, after a 5 min hot start at 95 °C, 2 Φl of primer ‘kozak-Bcl-xL’ (20 pmol)
only was added. By following this procedure, the Delta loop fragment acted as a
downstream primer that will amplify only the sequence before the loop region on the
pTAdv/Bcl-xL-HA template thus omitting the loop region from the full length PCR
105

product (Figure 5.4). The PCR reaction was performed for 15 cycles as follows:
denaturing at 95 °C for 1 min,
106

1.EcoRI 2.Clone into EcoRI digested pTEJ8 3.Determin orientation with BamHI
(A)
1.PCR/ overlap extension 2.A/T cloning into pTAdv
3’ Delta loop (A)
PCR mutagenesis fragments
Figure 5.4: PCR-mutagenesis of Bcl-xL/∆loop and cloning into pTEJ8.
107

annealing at 56 °C for 1 min, and elongation at 72 °C for 1 min. This last cycle was
followed by a 10 min incubation at 72 °C. The PCR products were then separated by
agarose gel electrophoresis and isolated using a Concert Rapid Gel Extraction Kit. The
product was then cloned using the procedures described in section 5.2.9. EcoRI
digestions confirmed the insertion of this smaller 649 bp mutant cDNA in pTAdv and in
pTEJ8. The orientation of the fragment in pTEJ8 was confirmed by BamHI digestion
yielding the a 250 bp band if the insert was in the sens orientation or a 484 bp band if the
insert was anti-sens. The pTAdv/∆loop clone was sequenced to confirm that the desired
mutation had been introduced.
5.2.11 Cracking Gel Method
To quickly screen a large number of transformed bacteria, a method called ‘Cracking
Gel’ was used. This method was given to us by Dr Baoquin Guo (Northeastern Ontario
Regional Cancer Centre, Sudbury). Small streaks were made on an LB Agar plate with
individual bacterial colonies, and the plate was incubated overnight at 37 °C. The next
day, Cracking Gel Buffer was prepared (50 Φl of 1 M Tris/HCl pH 7.5, 50 Φl of 20%
SDS, 4 Φl of 500 mM EDTA, 167 Φl of 6x DNA Loading Buffer, 10 Φl of 10 Φg/Φl
RNAse, in a total volume of 1 ml) and a small loop of bacteria was added to 70 Φl of this
buffer in a 1.5 ml microcentrifuge tube. The tube was incubated at room temperature for
10 min and an aliquot was loaded on a 1% agarose gel and electrophoresis was
performed. After staining with ethidium bromide, bands corresponding to plasmids can
be seen. Those that show a slower migration compared to a control vector probably have
the insert, however, endonuclease digestion must be performed to confirm these positives
108
clones. Potential recombinant plasmids were purified using the alkaline lysis procedure
(Sambrook et al. 1989) and digested with EcoRI for confirmation. BamHI digestions
determined Sens or anti-sens orientation of the insert.
5.2.12 Transfection of SP2/0-Ag14 murine cells
The transfection of the pTEJ8 derived mammalian expression vectors in SP2/0-Ag14 was
done as follows. Plasmids (10 Φg) were linearized with PvuI and purified by
phenol/chloroform extraction and ethanol precipitation. The linearized plasmid was then
resuspended in 5 Φl of TE Buffer and added to 5 x 10⁵ SP2/0-Ag14 cells in 400 Φl of
PBS. The mixture was submitted to electroporation (180 V, 960 ΦF) using a Gene Pulser
Plus unit (Bio-Rad, Mississauga, ON). After a 30 min incubation on ice, 10 ml of culture
media was added and the cells were cultured in a 25 cm2 flask for 2 days. Geneticin (G-
418) was added at a concentration of 750 Φg/ml to select for transfected cells. Geneticin-
resistant cells were then cloned by the single-cell dilution technique and tested for Bcl-xL
and HA tag expression by western analysis.
109

5.3 Results
5.3.1 Mutagenesis and Cloning of Bcl-xL-HA, Bcl-xL-HA/V126G, Bcl-
xL-HA/∆loop
Two mutations were produced to attempt to increase the function of Bcl-xL in our cells
lines. The first is a point mutation of the thymidine at position 377 of the coding
sequence of Bcl-xL to a guanosine by overlap extension. The resulting mutation
substitutes valine126, which is located in the hydrophobic pocket for Bcl-xL, for a glycine.
This mutation was shown to interfere with the interaction between Bcl-xL and Bad
(Kelekar et al. 1997). This disruption should eliminate the inhibitory influence of Bad on
the protective function of Bcl-xL. The second mutation produced in this study eliminated
the regulatory loop domain in Bcl-xL. Several studies have shown that the deletion of
this region increases the protective effect of this anti-apoptotic regulator (Chang et al.
1997; Srivastava et al. 1999; Wang et al. 1999). In order to produce these forms of
mutated Bcl-xL, we first had to obtain the cDNA coding for this protein by steps that are
outlined in Figure 5.2. We first isolated RNA from mouse brain tissue which is shown in
lane 1 of Figure 5.5. The 28S, 18S, and 5S bands are clearly seen indicating that the
RNA is of good quality and intact. An RT-PCR experiment was then performed to
amplify a 721 bp band (Figure 5.5, lane 7) corresponding to the full length bcl-xL cDNA
containing 5’ Kozak sequence and a 3’ HA tag. This cDNA was cloned into pTAdv
(Figure 5.6A, lane 2) and used as the PCR template to amplify the three mutagenesis
fragments (Figure 5.5, lanes 3, 4 and 5). Overlap/extension/PCR reactions produced the
mutated bcl-xL cDNAs as a 606 bp band for Bcl-xL/∆loop and a 721 bp band for Bcl-
xL/V126G. These products were subsequently cloned into pTAdv and confirmed by
110

1 2 3 4 5 6 7 8 9
721 bp
606 bp
700 bp – 500 bp –
300 bp – 200 bp –
- 362 bp - 504 bp
- 184 bp
800 bp - 600 bp - 400 bp - 200 bp -
5S →
28S →
18S →
Figure 5.5: PCR mediated mutagenesis of Bcl-xL/V126 and Bcl-xL/∆loop. Lane 1 shows mouse brain RNA. The resulting cDNA was used to PCR and clone Bcl-xL-HA into pTAdv. Using this plasmid as a template, mutagenesis fragments were amplified by PCR as seen in lanes 3 (5’V126G), lane 4 (3’V126G) and lane 5 (3’∆loop). Lane 7, 8 and 9 show the band corresponding to Bcl-xL-HA, Bcl-xL/∆loop and Bcl-xL/V126G, respectively. Lane 2 is a 100 bp ladder and lane 6 is a ladder from Quantum Biotechnologies called Grand Ladder Low. The lengths of the visualized bands were calculated using Fluor Chem software by Alpha Innotech Corp.
111
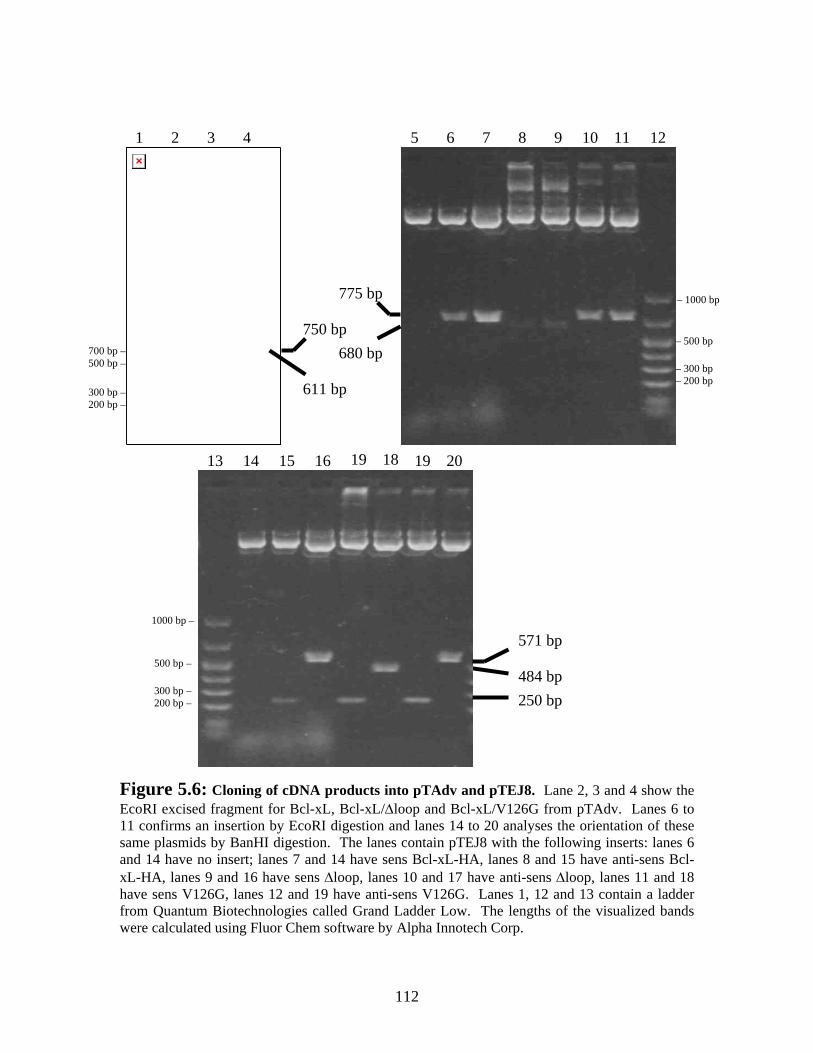
2 1 3 4 5 7 6 10 11 9 8 12
– 1000 bp
– 500 bp
– 300 bp – 200 bp
775 bp
680 bp
1000 bp –
500 bp –
300 bp – 200 bp –
571 bp
250 bp 484 bp
20 19 18 13 14 15 16 19
700 bp – 500 bp –
300 bp – 200 bp –
750 bp
611 bp
Figure 5.6: Cloning of cDNA products into pTAdv and pTEJ8. Lane 2, 3 and 4 show the EcoRI excised fragment for Bcl-xL, Bcl-xL/∆loop and Bcl-xL/V126G from pTAdv. Lanes 6 to 11 confirms an insertion by EcoRI digestion and lanes 14 to 20 analyses the orientation of these same plasmids by BanHI digestion. The lanes contain pTEJ8 with the following inserts: lanes 6 and 14 have no insert; lanes 7 and 14 have sens Bcl-xL-HA, lanes 8 and 15 have anti-sens Bcl-xL-HA, lanes 9 and 16 have sens ∆loop, lanes 10 and 17 have anti-sens ∆loop, lanes 11 and 18 have sens V126G, lanes 12 and 19 have anti-sens V126G. Lanes 1, 12 and 13 contain a ladder from Quantum Biotechnologies called Grand Ladder Low. The lengths of the visualized bands were calculated using Fluor Chem software by Alpha Innotech Corp.
112

EcoRI digestion (Figure 5.6A, lanes 3 and 4). The Bcl-xL-HA, Bcl-xL/∆loop and Bcl-
xL/V126G cDNAs were then excised from pTAdv using EcoRI, cloned into pTEJ8 and
selected for sens and antisens orientation. Figure 5.6B confirms the integration of the
fragments into pTEJ8 by EcoRI digestion. Figure 5.6C show the orientation of the
fragments confirmed by BamHI digestion. All sens fragments have a 250 bp band while
the Bcl-xL-HA and Bcl-xL/V126G anti-sens fragments show a 571 bp fragment and Bcl-
xL/∆loop migrates to 484 bp.
5.3.2 Generation of mutated Bcl-xL-transfected SP2/0-Ag14 hybridoma
cells
As we have seen in chapter 4, Bcl-xL can protect SP2/0-Ag14 cells from apoptosis under
CHX exposure, lack of glutamine and long-term culture conditions. To test if our newly
produced mutants of Bcl-xL can better protect SP2/0-Ag14 cells from apoptosis, we
transfected SP2/0-Ag14 cells with sens and anti-sens Bcl-xL-HA, Bcl-xL/V126G and
Bcl-xL/∆loop as well as with the pTEJ8 vector. Figure 5.7 shows Bcl-xL protein
expression levels of selected G-418 resistant cells when probed with polyclonal anti-Bcl-
xL and anti-HA anitbodies. Both antibodies do not recognise Bcl-xL protein in wild type
SP2/0-Ag14, the vector and the anti-sens transfected SP2/0-Ag14 cells. Furthermore, the
HA probe does not recognise the endogenously expressed Bcl-xL in P3x63-Ag8.653
soluble protein extracts demonstrating that the anti-HA antibody specifically recognized
the exogenously expressed Bcl-xL and mutants labelled with the HA tag. Two clones
expressing similar levels of Bcl-xL-HA as well as Bcl-xL/V126G were selected by
Western Blot analysis. The levels can be estimated as being equal because the same
113

SP2/
pTEJ
8-2
SP2/
Dlo
op-lo
w
SP2/
Dlo
op-h
igh
SP2/
Dlo
op-m
ed
SP2/
Dlo
op-a
ntis
ens
L
SP2/
V12
6G a
nti-s
ens
SP2/
v126
G-1
SP2/
V12
5G-2
SP2/
Bcl
-xL
anti-
sens
SP2/
Bcl
-xL-
4
SP2/
Bcl
-xL-
14
SP2/
pTEJ
8-1
P3
SP2/
Bcl
-xL-
5 (h
igh)
Figure 5.7: Protein expression levels of Bcl-xL-HA mutant expressing SP2 cells. Levels of expression of Bcl-xL in different cells were analysed western blot. (A) Western using an anti-Bcl-xL polyclonal antibody. (B) Western using and anti-HA antibody. Each lane contains approximately the same amount of proteins. This was confirmed by colouring the immunoblot membrane with Ponceau S and by the similar band intensity of the antibody cross-reactions shown by black arrows. The white arrow shows the band corresponding to Bcl-xL.
114

amount of proteins (10 µg) were loaded into each well. Furthermore, the anti-Bcl-xL
primary antibody cross-reacted with another protein in all cell lines tested which
produced a high molecular weight band that is of similar intensity between all the wells.
A SP2/Bcl-xL-HA clone (clone 5) expressing higher levels of Bcl-xL-HA was also
chosen for further analysis. No SP2/0-Ag14 clones expressing Bcl-xL/∆loop at
comparable levels to Bcl-xL-HA and V126 could be found because all isolated clones
expressed much higher levels of Bcl-xL/∆loop protein than SP2/Bcl-xL-HA and SP2/Bcl-
xL/V126G clones as determined with the anti-HA antibody. The anti-Bcl-xL antibody
showed similar expression of ∆loop to the other transfections, however, the removal of
the loop domain may have modified the affinity of the antibody in the loop-deficient
mutant. The HA tag is, therefore, a more reliable indicator of Bcl-xL protein expression
because it constitutes a common epitope for all mutagenized Bcl-xL proteins. We
therefore chose a low, medium and high expressing SP2/∆loop clone for further analysis.
By using the Fluor Chem v.2.0.0 densitometry software (Alpha Innotech Corporation),
we calculated that the medium and high ∆loop clones respectively expressed 1.8 and 4.3
times more Bcl-xL/∆loop that the low expressing clone. The lowest expressing ∆loop
mutant clone expressed the same level of protein than the highest expressing Bcl-xL-HA
clone isolated (SP2/Bcl-xL-HA clone 5). This Bcl-xL-HA clone expressed about 2 times
more than the other clones we analysed.
115
5.3.3 Differential resistance to apoptosis by the expression of mutated
Bcl-xL
The effect of the mutations on Bcl-xL’s anti-apoptotic function was tested by exposing
our clones to different inducers of apoptosis. We used CHX, which induces apoptosis by
inhibiting protein synthesis, and glutamine depletion, which also rapidly causes
apoptosis. After the cells were incubated with CHX for 2 hours or without glutamine for
3 hours, the viability was analysed by the MTT viability assay. Figure 5.8A and B shows
that the 3 Bcl-xL-HA expressing clones are still over 50% viable when compared to the
vector and anti-sens Bcl-xL-HA controls that were at 20-30% viability under both
conditions. The protection was not as high as P3x63-Ag8.653 cells which is probably
attributable to a lower expression of the anti-apoptotic protein in these clones (Figure
5.7A). The V126G mutation in Bcl-xL had an effect that was opposite to what was
expected. Instead of increasing the protective effect of Bcl-xL, the mutation nullified its
function completely because the SP2/V126G had the same viability as the controls in the
presence of CHX and following L-glutamine deprivation. DNA laddering analysis
confirmed that all controls and both SP2/V126G clones underwent apoptosis while
P3x63-Ag8.653 and SP2/Bcl-xL-HA had no or faint DNA laddering patterns under CHX
(Figure 5.9) and glutamine-depletion (Figure 5.10) conditions.
The removal of the regulatory domain had different effects when exposed to these
two stresses. When the SP2/∆loop clones were incubated without glutamine, they all
showed a viability of about 60% (Figure 5.8D). This is attributed to a protection from
apoptosis because no or faint DNA laddering, which is indicative of apoptosis, was seen
for these clones compared to intense bands seen in the control cultures (Figure 5.10).
116
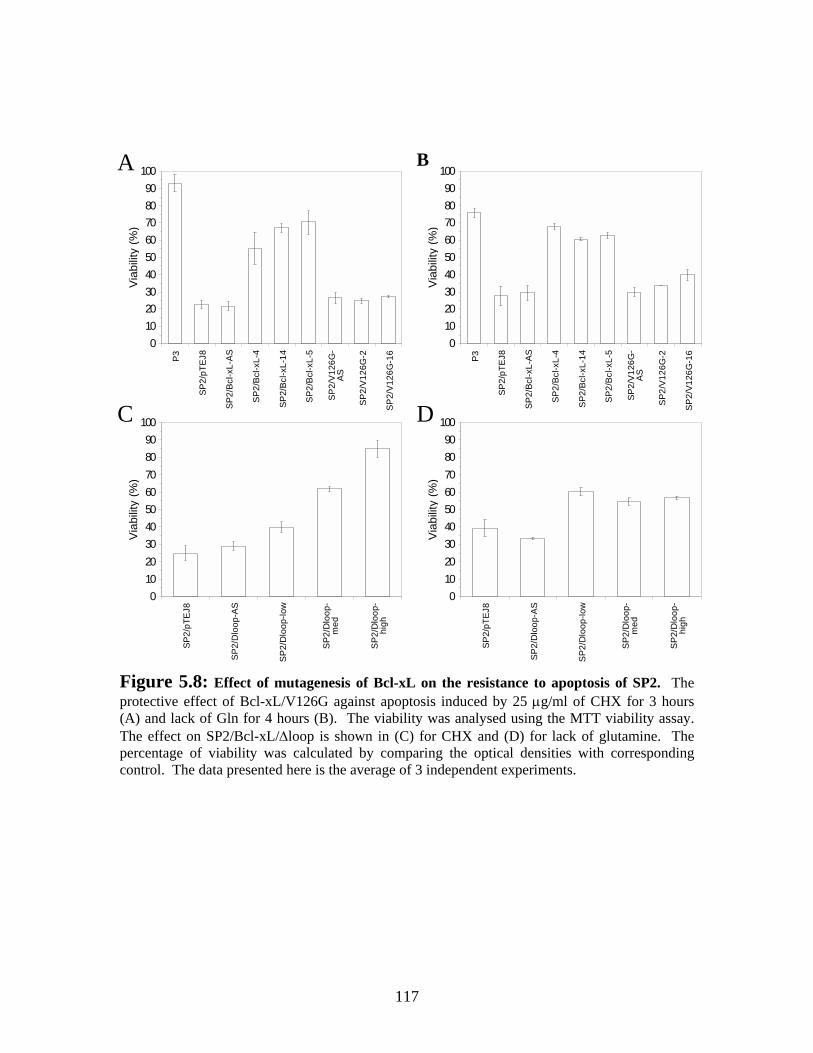
01020304050607080900
SP
2/pT
EJ8
SP
2/D
loop
-AS
SP
2/D
loop
-low
SP
2/D
loop
-m
ed
SP
2/D
loop
-hi
gh
Via
bilit
y (%
)
01020304050607080900
P3
SP
2/pT
EJ8
SP
2/B
cl-x
L-A
S
SP
2/B
cl-x
L-4
SP
2/B
cl-x
L-14
SP
2/B
cl-x
L-5
SP
2/V
126G
-A
S
SP
2/V
126G
-2
SP
2/V
126G
-16
Via
bilit
y (%
)
0102030405060708090
100
P3
SP
2/pT
EJ8
SP
2/B
cl-x
L-A
S
SP
2/B
cl-x
L-4
SP
2/B
cl-x
L-14
SP
2/B
cl-x
L-5
SP
2/V
126G
-A
S
SP
2/V
126G
-2
SP
2/V
126G
-16
Via
bilit
y (%
)
0102030405060708090
100
SP
2/pT
EJ8
SP
2/D
loop
-AS
SP
2/D
loop
-low
SP
2/D
loop
-m
ed
SP
2/D
loop
-hi
gh
Via
bilit
y (%
)D
B10A
10C
Figure 5.8: Effect of mutagenesis of Bcl-xL on the resistance to apoptosis of SP2. The protective effect of Bcl-xL/V126G against apoptosis induced by 25 µg/ml of CHX for 3 hours (A) and lack of Gln for 4 hours (B). The viability was analysed using the MTT viability assay. The effect on SP2/Bcl-xL/∆loop is shown in (C) for CHX and (D) for lack of glutamine. The percentage of viability was calculated by comparing the optical densities with corresponding control. The data presented here is the average of 3 independent experiments.
117

Bcl-xL 4
Bcl-xL 14
pTEJ8 1
pTEJ8 2
Bcl-xL AS
Bcl-xL 5
P3
CHX : - + - + - + + - - + - + - +
CHX : - + - + - + - + - + - + - +
V126G
16 V126G
AS V126G
2 ∆loop
AS ∆loop med
∆loop high
∆loop low
Figure 5.9: Differential protection of Bcl-xL mutations in SP2 cells exposed to CHX induces apoptosis. The indicated cells were incubated for 3 hours with 25 µg/ml of CHX before DNA laddering analysis was performed. PBS was included in control cultures.
118
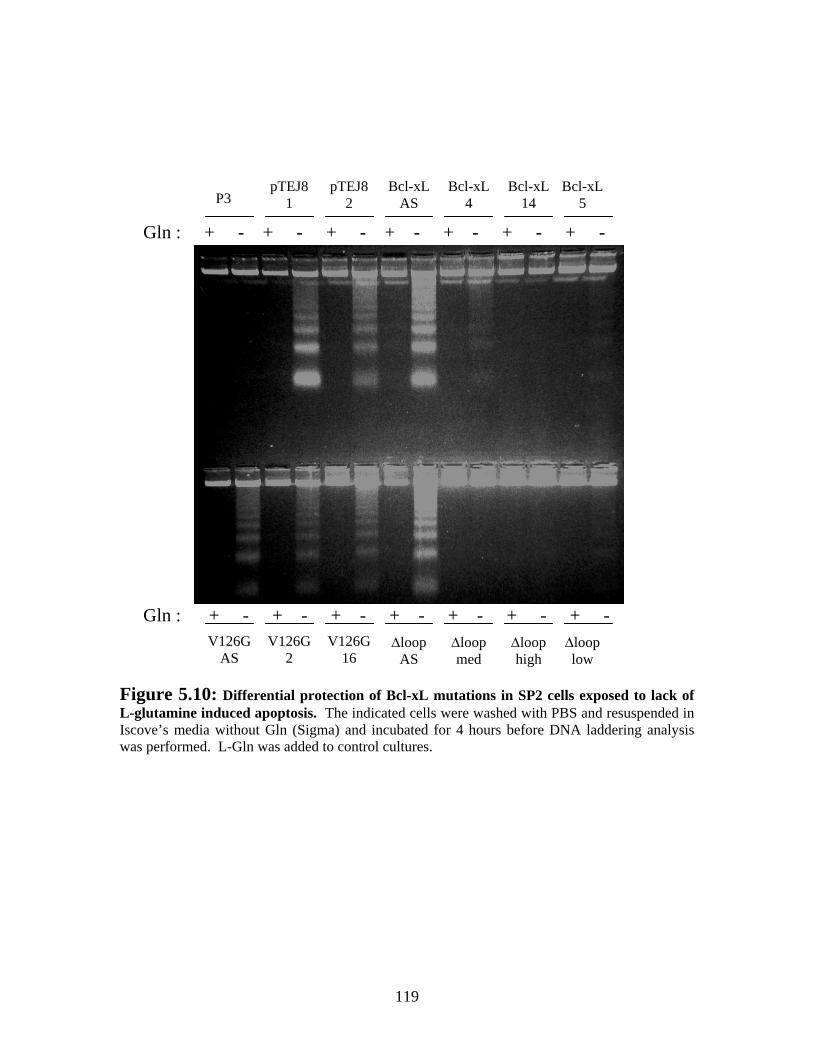
Bcl-xL
4 Bcl-xL
14 pTEJ8
1 pTEJ8
2 Bcl-xL
AS Bcl-xL
5 P3
Gln : + - + - + - + - + - + - + -
Gln : + - + - + - + - + - + - + -
V126G
16 V126G
AS V126G
2 ∆loop
AS ∆loop med
∆loop high
∆loop low
Figure 5.10: Differential protection of Bcl-xL mutations in SP2 cells exposed to lack of L-glutamine induced apoptosis. The indicated cells were washed with PBS and resuspended in Iscove’s media without Gln (Sigma) and incubated for 4 hours before DNA laddering analysis was performed. L-Gln was added to control cultures.
119
However, the Bcl-xL/∆loop clones showed a sensitivity to CHX that was inversely
related to the level of Bcl-xL/∆loop expression. The low expressing clone was only 40%
viable, the medium was 60% viable and the high expressing clone maintained its viability
at 85% (Figure 5.8C). This differential protection was also seen with the DNA laddering
assay. Interestingly, the high, medium and low expressing ∆loop clones have DNA
laddering pattern that increase in intensity with decreasing levels of Bcl-xL/∆loop (Figure
5.9). Another observation that may give insights into the function of the regulatory loop
domain is that, despite the higher expression levels of this mutant form of Bcl-xL, it did
not significantly increase its protective effect against CHX when compared to normal
Bcl-xL-HA (Figure 5.8A and C).
5.3.4 Bcl-xL/V126G has no effect on the long-term culture of SP2/0-
Ag14
To further study the effect of Bcl-xL/V126G, we compared the growth behaviour of
SP2/Bcl-xL-HA, SP2/V126G and SP2/0-Ag14 controls under prolonged culture
conditions. Exponentially growing cells were seeded at 5 x 10⁴ cells/ml and the viable
cells were counted daily using Trypan Blue dye. The SP2/pTEJ8 cells and anti-sens
controls of all three inserts had similar growth profiles in culture (Figure 5.11A). The
length of culture time and the maximum viable cell density of the SP2/Bcl-xL-HA cells
were similar to the SP2/Bcl-xL cells (section 4.3). They both grew for 10 days in culture
and reached a maximum number of viable cells on day 6 (Figure 5.11B). The expression
of the Bcl-xL/V126G construct did not affect the growth behaviour of SP2/0-Ag14
(Figure 5.11C). The growth behaviour of both clones was identical to that of the control
120

0
5
10
15
20
25
1 2 3 4 5 6 7
Time (day)
Viab
le c
ell n
umbe
r(c
ells
/ml x
10-
5)
0
5
10
15
20
25
1 2 3 4 5 6 7 8 9 10
Time (day)
Viab
le c
ell n
umbe
r(c
ells
/ml x
10-5
)
0
5
10
15
20
25
1 2 3 4 5 6 7
Time (day)
Viab
le c
ell n
umbe
r(c
ells
/ml x
10-5
)
0
5
10
15
20
25
1 2 3 4 5 6 7 8 9 10
Time (day)
Viab
le c
ell n
umbe
r(c
ells
/ml x
10-5
)
A B
C D
Figure 5.11: Effect of Bcl-xL/V126G on the growth behaviour of SP2. (A) pTEJ8 and anti-sens controls of all 3 inserts show the same behaviour during long-term culture. (B) SP2/Bcl-xL-HA clone 14 behaviour in long term culture. (C) Both SP2/V126G behave similarly under these conditions. The viable cell number was determined by counting with a hemacytometer using Trypan Blue dye and each point is the average of at least 4 determinations. In (D), pTEJ8 clone 1 (circle), V126G clone 1 (squares) and Bcl-xL-HA (triangles) SP2 cells from (A), (B) and (C) are superimposed for comparison.
121

cell lines (Figure 5.11A, C and D) and was far from resembling the growth profile of
SP2/Bcl-xL-HA (Figure 5.11D). Therefore, as expected from its lack of effect in the
presence of CHX and following L-glutamine depletion, the V126G mutation had no
effect on the survival of SP2/0-Ag14 cell in long-term culture.
5.3.5 Bcl-xL/∆loop apoptosis resistance is concentration-dependent in
long term culture
The effect of the removal of the regulatory loop domain was also studied in order to
establish if it could improve the viability of SP2/0-Ag14 cells in long-term culture.
Exponentially growing cells were seeded at 5 x 10⁴ cells/ml and the viable cells were
counted daily using Trypan Blue dye exclusion assay. Interestingly, the cellular
concentration of Bcl-xL/∆loop had a proportional effect on the viability of these SP2/0-
Ag14 cells. The SP2/∆loop anti-sens control had a maximum viable cell density on day 4
and died rapidly to under 5% viability after 7 days of culturing (Figure 5.12A). However,
the three SP2/0-Ag14 clones expressing Bcl-xL/∆loop all peaked in viable cell number
on day 5 followed by different rates of declining viability which variably prolonged the
time of culturing from 10 days for the low expressing clone to over 13 days for the high
expressing clone (Figure 5.12A). Figure 5.12B clearly shows that Bcl-xL/∆loop prolongs
the viability of these hybridoma cells in long-term culture in a concentration dependent
manner. After 7 days, the control was under 5% viability, and the low, medium and high
expressing ∆loop clone were at 30%, 55% and 65% (Figure 5.12B). All four cell lines
seem to start declining in viability after day 3, but at different rates. The SP2/Bcl-xL-HA
clone 14 started to decline at the same time as all the ∆loop clones, maintained a high
122

0102030405060708090
1 2 3 4 5 6 7 8 9 10 11 12 13
Time (day)
Viab
ility
(%)
100B
0
5
10
15
20
1 2 3 4 5 6 7 8 9 10 11 12 13
Time (day)
Viab
le c
ell n
umbe
r(c
ells
/ml x
10-5
)
25A
Figure 5.12: Effect of Bcl-xL/∆loop on the growth behaviour of SP2. (A) shows SP2/∆loop-AS (circles), SP2/∆loop-low (squares), SP2/∆loop-med (triangles) and SP2/∆loop-high (diamonds). The viable cell number was determined by counting with a hemacytometer using Trypan Blue dye and each point is the average of at least 4 determinations. (B) The same series are expressed by percent viability and the viability of SP2/Bcl-xL-HA found in Figure 5.11 is also represented by a dotted line and closed circles.
123

viability until day 7, but rapidly lost viability thereafter (Figure 5.12B). This results
support the regulatory function of the loop domain of Bcl-xL and suggest that its deletion
causes a deregulation of the anti-apoptotic function of Bcl-xL.
5.4 Discussion
5.4.1 The V126G mutation completely destroys the function of Bcl-xL
Contrary to published results that showed that the V126G mutation disrupted the
dimerization of Bcl-xL with Bad while maintaining the protective function of Bcl-xL
(Kelekar et al. 1997), our results demonstrate that this mutation completely repressed the
protective function of Bcl-xL in our cell system. SP2/V126G clearly expressed
significant levels of Bcl-xL/V126G (Figure 5.7). This Bcl-xL mutant was incapable of
protecting SP2/0-Ag14 cells from apoptosis induced by CHX (Figure 5.8A) and L-
glutamine deprivation (Figure 5.8B) (also see Table 5.2). Furthermore, this mutant was
unable to extend the viability of this cell line in long term culture (Figure 5.11C). From
the data obtained, this mutation of Bcl-xL would not be useful to increase the viability of
hybridoma cultures.
The conditions used in the original experiment with the V126G mutation may
explain why this mutant did not work in our cell system (Kelekar et al. 1997).
Thompson’s group studied this mutant only in murine FL5.12 cells that were
cotransfected with Bad. They also only used IL-3 withdrawal to induce apoptosis in
these cells. Their results may be specific for their experimental model in which IL-3
124

withdrawal induces apoptosis only via the Bad/Bcl-xL specific interaction in the FL5.12
cells overexpressing Bad. In other words, by disrupting the hydrophobic pocket of Bcl-
xL, the mutant may have lost its ability to bind all pro-apoptosis members of the Bcl-2
family such as Bax, which was confirmed during in vitro studies in the same paper.
Since their model may require only Bad/Bcl-xL to induce apoptosis, their mutant could
protect their cells. We know that our cell system expresses Bax (Gauthier et al. 1996).
Therefore, Bcl-xL/V126G can be thought to be unable to bind Bax and inhibit its death
function in the presence of culture-related stresses.
5.4.2 Deletion of the loop domain increases the expression of Bcl-xL but
also decreases its function
The loop domain of Bcl-2 and Bcl-xL has been shown to be an important regulatory
domain. Only recently has the mechanism of regulation by Bcl-2’s loop domain begun to
be understood. Phosphorylation of this domain has two major outcomes; (1) a gain of
function by stabilization of Bcl-2/Bax dimers (Deng et al. 2000) or maintenance of
expression levels by inhibiting the targeting of Bcl-2 proteins to the proteosome via the
ubiquitin pathway (Dimmeler et al. 1999; Breitschoph et al. 2000). The regulation of the
Bcl-xL loop domain has not been studied, however, our results with the ∆loop mutant
gave us insights into its regulation. It has previously been observed that Bcl-xL is
phosphorylated (Poruchynsky et al. 1998) and we have seen the presence of a band that
may suggest phosphorylation of Bcl-xL in our cells (Figure 4.1). Even though the loop
domain of Bcl-xL is not identical to the loop domain of Bcl-2, it also contains many
phosphorylatable residues (Figure 6.3B). Our results suggest that the loop domain of
125

Bcl-xL functions similarly to Bcl-2’s regulatory domain. Firstly, when the expression of
Bcl-xL/∆loop mutants was analysed, all clones obtained contained much higher levels of
Bcl-xL/∆loop than we were generally able to obtain with Bcl-xL-HA transfected cells.
SP2/Bcl-xL-5, the clone that expressed the most Bcl-xL-HA, contained about the same
level of protein expression as the lowest expressing Bcl-xL/∆loop analysed (Figure
5.7B). This data suggests that deleting the loop domain has increased the levels of Bcl-
xL by maybe disrupting the targeting of the protein for degradation as has been seen in
Bcl-2 (Breitschoph et al. 2000). Secondly, the ∆loop mutants do not protect cells as
much as wild type Bcl-xL-HA from CHX induced apoptosis. This effect was seen under
CHX conditions when SP2/0-Ag14 cells expressing medium levels of Bcl-xL/∆loop were
compared with SP2/Bcl-xL-HA cells. Even if Bcl-xL/∆loop is expressed at much higher
levels than the wild-type containing SP2/0-Ag14 cells, they both protect to about 60 %
viability (Figure 5.8A and C; Table 5.2). The phosphorylation-controlled Bcl-2/Bax
stability through the loop domain is probably conserved in Bcl-xL. Thus, to explain our
results, the possible effect of reduced dimer stability in the Bcl-xL/∆loop could be
counteracted by the high expression of the protein caused by the deletion of the
degradation function found in the same regulation site.
126
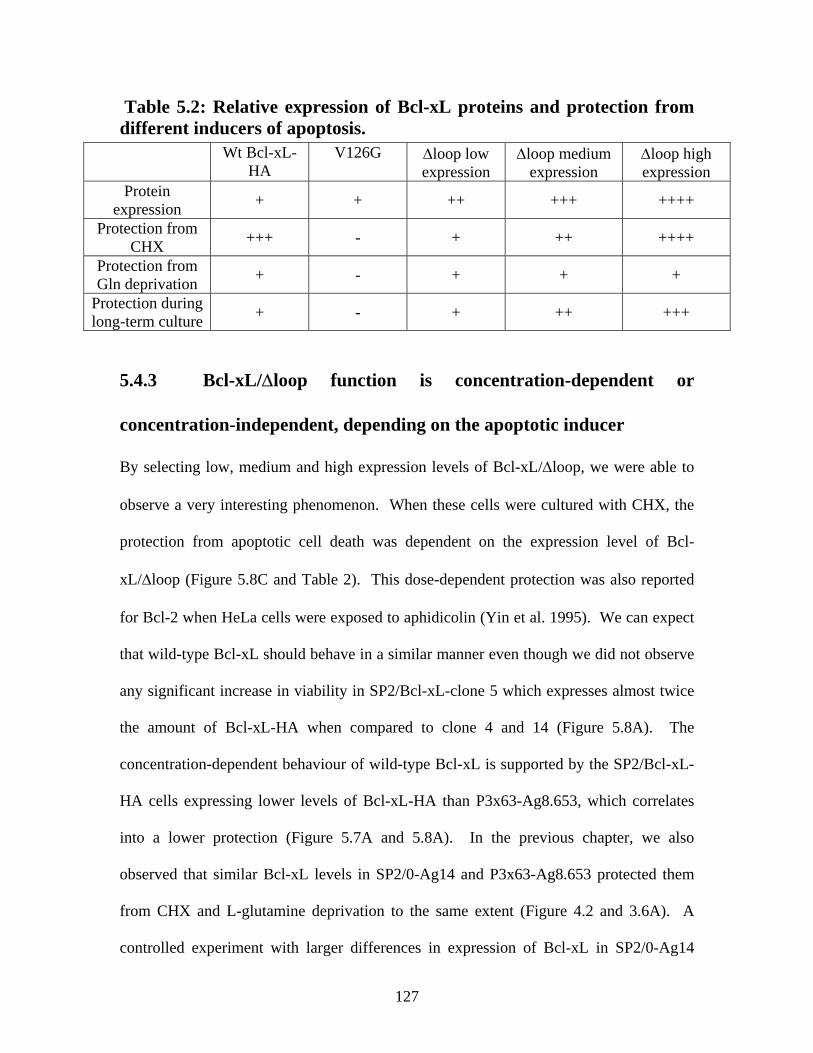
Table 5.2: Relative expression of Bcl-xL proteins and protection from different inducers of apoptosis.
Wt Bcl-xL-HA
V126G ∆loop low expression
∆loop medium expression
∆loop high expression
Protein expression + + ++ +++ ++++
Protection from CHX +++ - + ++ ++++
Protection from Gln deprivation + - + + +
Protection during long-term culture + - + ++ +++
5.4.3 Bcl-xL/∆loop function is concentration-dependent or
concentration-independent, depending on the apoptotic inducer
By selecting low, medium and high expression levels of Bcl-xL/∆loop, we were able to
observe a very interesting phenomenon. When these cells were cultured with CHX, the
protection from apoptotic cell death was dependent on the expression level of Bcl-
xL/∆loop (Figure 5.8C and Table 2). This dose-dependent protection was also reported
for Bcl-2 when HeLa cells were exposed to aphidicolin (Yin et al. 1995). We can expect
that wild-type Bcl-xL should behave in a similar manner even though we did not observe
any significant increase in viability in SP2/Bcl-xL-clone 5 which expresses almost twice
the amount of Bcl-xL-HA when compared to clone 4 and 14 (Figure 5.8A). The
concentration-dependent behaviour of wild-type Bcl-xL is supported by the SP2/Bcl-xL-
HA cells expressing lower levels of Bcl-xL-HA than P3x63-Ag8.653, which correlates
into a lower protection (Figure 5.7A and 5.8A). In the previous chapter, we also
observed that similar Bcl-xL levels in SP2/0-Ag14 and P3x63-Ag8.653 protected them
from CHX and L-glutamine deprivation to the same extent (Figure 4.2 and 3.6A). A
controlled experiment with larger differences in expression of Bcl-xL in SP2/0-Ag14
127

would have to be preformed to confirm this. Interestingly, when the ∆loop mutants cells
were culture in media lacking glutamine, they all showed a constant level of protection
around 60 % (Figure 5.8D), which was also observed with the wild-type Bcl-xL-HA
(Figure 5.8B and Table 5.2). These results suggest that Bcl-xL protects cells by two
distinct mechanisms. The first way that Bcl-xL could protects against CHX induced
apoptosis may involve the dimerization and inhibition of pro-apoptotic Bax. Higher
expression of Bcl-xL could better inhibit Bax and protect the cell. This could explain its
function in CHX-induced apoptosis. The other possible function of Bcl-xL could be its
binding and regulation of channels such as mitochondrial VDAC (Hengartner 2000) or
other suspected channels in the nuclear and endoplasmic reticulum membrane
(Voehringer 1999), or still other proteins in the cell that are in limited supply and that
Bcl-2 (and possibly other family members) has been shown to interact with such as Raf-1
(Fadeel et al. 1999). This kind of function would support a concentration-independent
protection because once all the limiting cellular components have been saturated with
Bcl-xL molecules, the excess anti-apoptotic molecules could not confer additional
protection to the cell.
5.4.4 Bcl-xL/∆loop significantly extended the longevity of SP2/0-Ag14
cells in long-term culture in a concentration-dependent manner and
suggests a second inducer of apoptosis in long-term culture that is CHX-
like .
We observed that the culture time of SP2/0-Ag14 was directly dependent on the
expression levels of Bcl-xL/∆loop (Figure 5.12). From the viability assays done under L-
128

glutamine deprivation conditions (Figure 5.8D), we expected that all three level of
expression would extend the culture viability of SP2/0-Ag14 similarly because the lack of
glutamine was identified as the major cause of apoptosis in long-term culture (section
3.0). A minimal decrease in viability was observed with the ∆loop mutants and wild-type
Bcl-xL-HA between day 3 and 6 (Figure 5.12B), which we may attribute to glutamine
deprivation. However, the SP2/∆loop clones died at different rates which is reminiscent
of their concentration-dependent behaviour when they were exposed to CHX (Figure
5.8C). These results support the hypothesis that there is another event that induces
apoptosis after glutamine exhaustion and suggest that its pathway is analogous to the
effect induced by CHX.
Another consequence of this CHX-like inducer of apoptosis is seen when the
viability of wild-type Bcl-xL-HA with Bcl-xL/∆loop are compared in long-term culture
(Figure 5.12B). Wild-type Bcl-xL-HA maintains a high viability until day 6 when it
drops dramatically. In contrast, the ∆loop mutants maintain a slow rate of death. Since
the major difference between these proteins is the presence of the regulatory loop
domain, we propose that the loop domain of wild-type Bcl-xL-HA is phosphorylated or
dephosphorylated after day 6. This action would consequently remove the anti-apoptotic
function of Bcl-xL by disrupting its interaction with Bax or down-regulating the protein’s
expression. The ∆loop mutants do not act this way because they are missing their
regulatory domain.
129

5.4.5 Future work and experiments
The main goal of this study was to increase the effectiveness of Bcl-xL, which was partly
accomplished by extending the length of culture time of SP2/0-Ag14 cells with Bcl-
xL/∆loop. The mutant forms of Bcl-xL also gave us insights into the possible regulation
and function of Bcl-xL. The proposed mechanisms must still be confirmed. Firstly, the
dimerization of Bcl-xL with Bax can be studied in CHX induced cultures and in long-
term culture by immunoprecipitation studies similar to those done on Bcl-2 (Deng et al.
2000). Secondly, the interaction of Bcl-xL with channels should yield interesting results,
especially when our cell system is protected by Bcl-xL from glutamine deprivation.
Voehringer has recently proposed a model for Bcl-2 regulation of nuclear channels that
control the transport of glutathione into the nucleus (Voehringer et al. 1998; Voehringer
1999). This could regulate apoptosis through a redox control of gene expression. A
simple preliminary experiment that could be performed on our cell system would be to
measure the levels of nuclear GSH in SP2/Bcl-xL and SP2/pTEJ8 cells induced to die by
glutamine deprivation. If Bcl-xL functions by maintaining the nuclear levels of GSH,
then GSH levels should not fluctuate significantly in the nucleus of SP2/Bcl-xL cells. If
this hypothesis is correct, co-immunoprecipitation studies of Bcl-xL-HA on nuclear
extracts may identify the nuclear channel to which it binds. Thirdly, mutagenesis
analysis of the loop domain of Bcl-xL would reveal which serine and/or threonine
phosphorylation/dephosphorylation are responsible for activating the anti-apoptotic
function of Bcl-xL or for regulating in protein levels. These residues can be changed for
non-phosphorylatable alanine residues, or for aspartate which mimics a constitutively
phosphorylated residue. These modifications can be done by the PCR-mediated
130
mutagenesis described in this chapter. Finally, lysine residues are important for the
covalent binding of ubiquitin in order to target proteins to the proteosome. The are 7
lysines in the protein sequence of murine Bcl-xL that could be changed to arginines. This
would inhibit the targeting of this mutated Bcl-xL for degradation. Five of these lysine
residues (at position 16, 20, 205, 207, 233) are in close proximity of the 4 lysine residues
in human Bcl-2, which were shown to be important for Bcl-2 degradation (Dimmeler et
al. 1999). Using this mutant, we could (1) study the regulation of the loop domain
independently of Bcl-xL degradation and (2) use it to further increase the effectiveness of
Bcl-xL in long-term culture by assuring a high expression level without loosing the gain
of function role of the loop domain.
131

Chapter 6 General Discussion
132

6.0 General Discussion
The data obtained throughout this thesis will help us to understand the mechanism of
apoptosis in myeloma/hybridoma cell lines. We have observed that a major cause of
apoptotic cell death of SP2/0-Ag14 in long-term culture is glutamine deprivation.
Furthermore, this cell death can be delayed by Bcl-xL. We also observed that, according
to the apoptotic inducer, the protection against cell death can be dependent or
independent of the expression levels of Bcl-xL lacking its regulatory loop domain. From
these results, we can propose models that may explain the biochemical pathways eliciting
these specific responses.
Our first model demonstrates one mechanism by which glutamine deprivation can
induce apoptosis (Figure 6.1). Under normal condition, glutamine is available for import
into the cell. The cell can convert the available glutamine to glutamate, which is a
precursor for glutathione (GSH) synthesis. Glutathione regulates the redox potential of
the cell. GSH is transported into the nucleus through a ATP-dependent nuclear GSH
sequestration system to regulate certain transcription factors that require a specific redox
potential for their function (Voehringer et al. 1998; Voehringer 1999). If glutamine is
limited, the synthesis of GSH may be hindered. This could result in a decrease of cellular
and nuclear GSH level, thus producing an oxidizing environment that will affect the
structure and function of some transcription factors (Voehringer et al. 1998; Voehringer
1999). These modified transcription factors can then activate or suppress the expression
of specific genes, resulting in the activation of apoptosis. Although the lack of glutamine
can affect the cell in many other ways, this model is attractive because it could explain
133
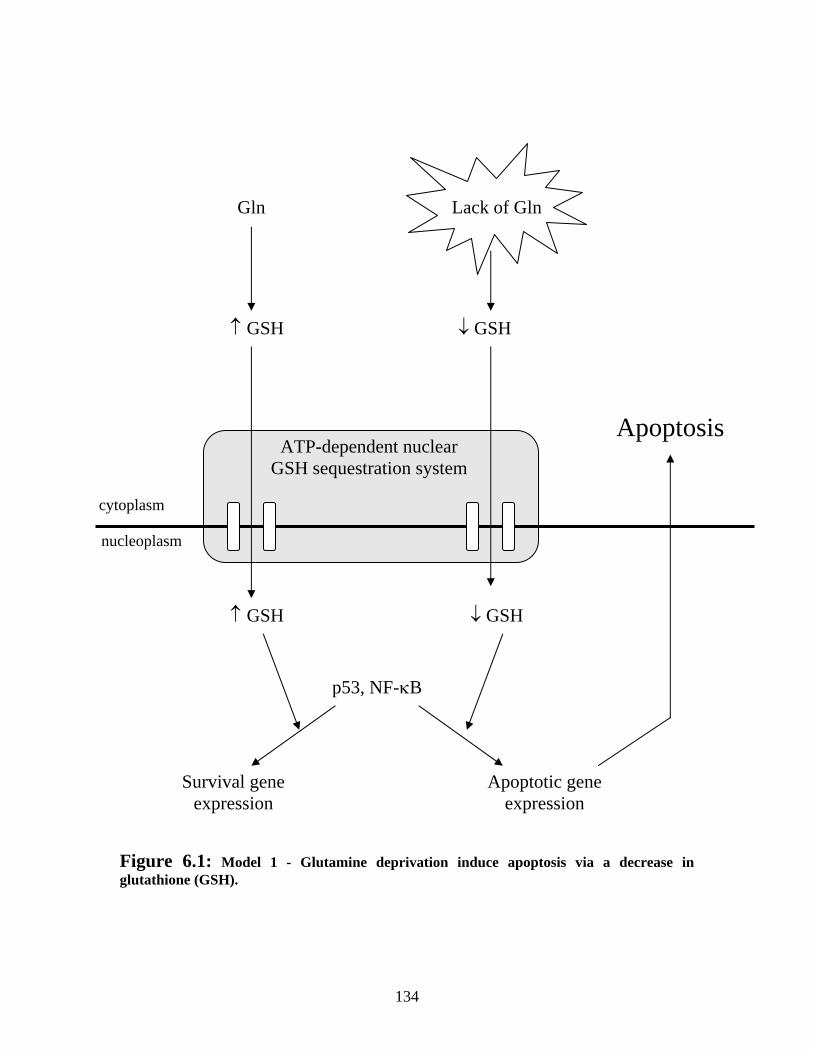
cytoplasm
nucleoplasm
ATP-dependent nuclear GSH sequestration system
p53, NF-κB
↓ GSH ↑ GSH
↓ GSH ↑ GSH
Apoptosis
Lack of Gln Gln
Survival gene expression
Apoptotic gene expression
Figure 6.1: Model 1 - Glutamine deprivation induce apoptosis via a decrease in glutathione (GSH).
134
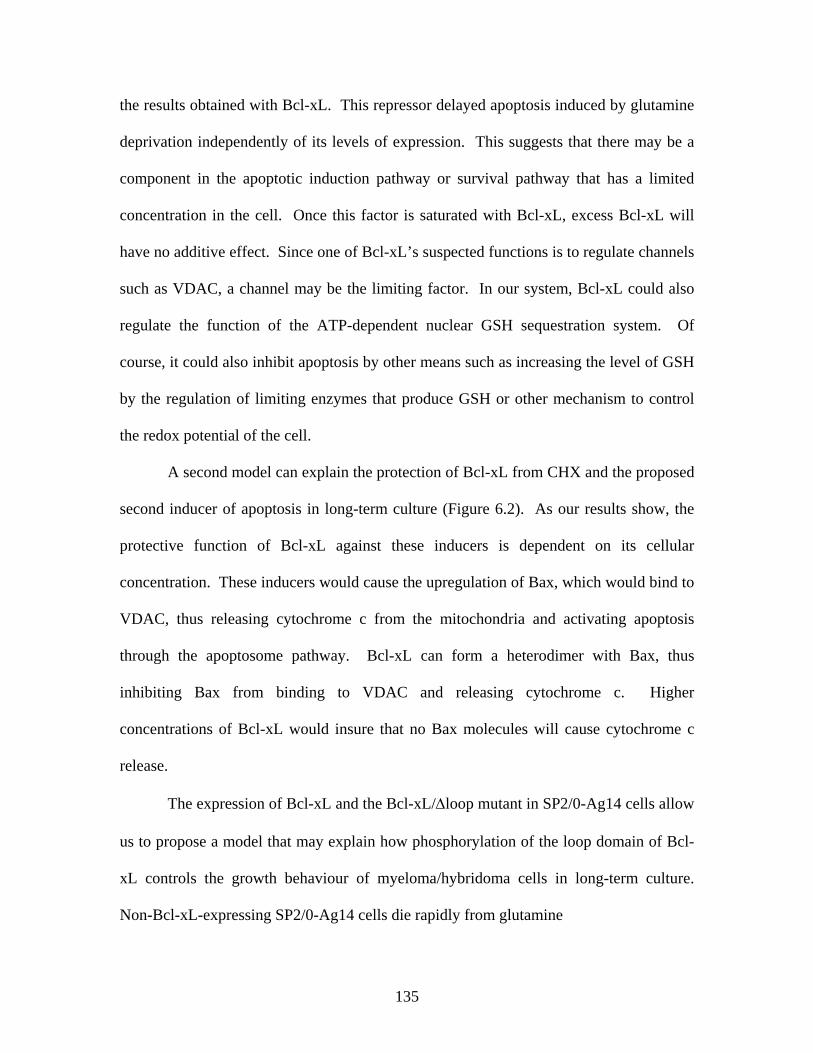
the results obtained with Bcl-xL. This repressor delayed apoptosis induced by glutamine
deprivation independently of its levels of expression. This suggests that there may be a
component in the apoptotic induction pathway or survival pathway that has a limited
concentration in the cell. Once this factor is saturated with Bcl-xL, excess Bcl-xL will
have no additive effect. Since one of Bcl-xL’s suspected functions is to regulate channels
such as VDAC, a channel may be the limiting factor. In our system, Bcl-xL could also
regulate the function of the ATP-dependent nuclear GSH sequestration system. Of
course, it could also inhibit apoptosis by other means such as increasing the level of GSH
by the regulation of limiting enzymes that produce GSH or other mechanism to control
the redox potential of the cell.
A second model can explain the protection of Bcl-xL from CHX and the proposed
second inducer of apoptosis in long-term culture (Figure 6.2). As our results show, the
protective function of Bcl-xL against these inducers is dependent on its cellular
concentration. These inducers would cause the upregulation of Bax, which would bind to
VDAC, thus releasing cytochrome c from the mitochondria and activating apoptosis
through the apoptosome pathway. Bcl-xL can form a heterodimer with Bax, thus
inhibiting Bax from binding to VDAC and releasing cytochrome c. Higher
concentrations of Bcl-xL would insure that no Bax molecules will cause cytochrome c
release.
The expression of Bcl-xL and the Bcl-xL/∆loop mutant in SP2/0-Ag14 cells allow
us to propose a model that may explain how phosphorylation of the loop domain of Bcl-
xL controls the growth behaviour of myeloma/hybridoma cells in long-term culture.
Non-Bcl-xL-expressing SP2/0-Ag14 cells die rapidly from glutamine
135
CHX
Bcl-xL ↑ Bax
Inhibition of protein synthesis
?
Second inducer of apoptosis in long-term
culture
Bax PTP
Apoptosome
Apoptosis
Cytochrome c
Figure 6.2: Model 2 - Induction of apoptosis by CHX and concentration dependent protection by Bcl-xL.
136
deprivation after 3 days in stationary batch culture (Figure 6.3A ‘no Bcl-xL’). Bcl-xL-
expressing cells such as P3x63-Ag8.653 and SP2/Bcl-xL have very similar growth
profiles and their viability decreases rapidly after day 6 (Figure 6.3A ‘with Bcl-xL’).
They are mildly affected by the lack of glutamine, however, another apoptotic stimuli
dramatically switches off the protective function of Bcl-xL. In contrast, the Bcl-
xL/∆loop mutant does not contain the phosphorylatable regulatory site within the loop
domain, which allows it to temporarily escape this negative regulation. We propose that
the regulation of Bcl-xL by its regulatory loop domain is similar to Bcl-2. Prior to day 7,
the loop domain of Bcl-xL is phosphorylated by kinases such as ERKs, which may
activate its anti-apoptotic function in a manner similar to Bcl-2 (Deng et al. 2000). The
second inducer of apoptosis activates phosphatases, which dephosphorylate the loop
domain of Bcl-xL. This results in inactivation of its function or down regulation of its
expression levels by targeting the protein to the ubiquitin pathway for proteosomal
degradation. The loop deficient mutants remain active because it is not subject to this
down regulation and thus continue to protect the cells.
From this work, we have observed that L-glutamine is an important nutritional
component for the survival of SP2/0-Ag14 cells in culture and that the expression of the
apoptosis repressor, Bcl-xL, helps to maintain a high viability during long-term stationary
batch culturing of these cells. This knowledge could help increase monoclonal antibody
production in industry. Furthermore, this thesis has shown that the loop domain is an
important site of Bcl-xL regulation during long-term culture, which can be exploited to
further increase the viability of hybridoma cell lines. We also have an interesting cell
system to further study the regulation of Bcl-xL by its loop domain.
137
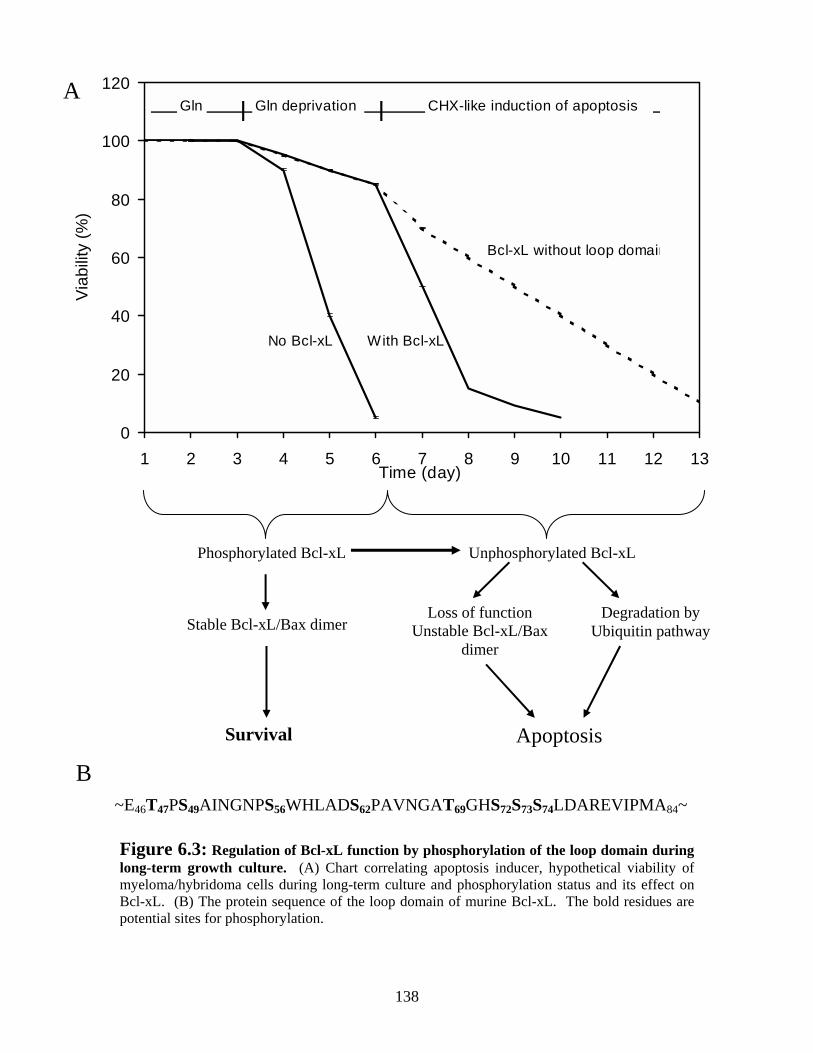
0
20
40
60
80
100
1 2 3 4 5 6 7 8 9 10 11 12 13Time (day)
Via
bilit
y (%
)
No Bcl-xL With Bcl-xL
Bcl-xL without loop domain
Gln deprivation CHX-like induction of apoptosisGlnA
Degradation by Ubiquitin pathway
Loss of function Unstable Bcl-xL/Bax
dimer Stable Bcl-xL/Bax dimer
Unphosphorylated Bcl-xL Phosphorylated Bcl-xL
120
Apoptosis Survival
B ~E46T47PS49AINGNPS56WHLADS62PAVNGAT69GHS72S73S74LDAREVIPMA84~
Figure 6.3: Regulation of Bcl-xL function by phosphorylation of the loop domain during long-term growth culture. (A) Chart correlating apoptosis inducer, hypothetical viability of myeloma/hybridoma cells during long-term culture and phosphorylation status and its effect on Bcl-xL. (B) The protein sequence of the loop domain of murine Bcl-xL. The bold residues are potential sites for phosphorylation.
138

Chapter 7 References
139
7.0 References
Abbas, A. K., A. H. Lichtmen and J. S. Pober (1997). Cellular and Molecular
Immunology. W.B. Saunders Company, Toronto.
Abcouver, S. F., C. Schwarz and R. A. Medguid (1999). “Glutamine Deprivation Induces
the Expression of GADD45 and GADD153 by mRNA Stabilization.” J Biol
Chem 274(40): 28645-28651.
Adams, J. M. and S. Cory (1998). “The Bcl-2 protein family: arbiters of cell survival.”
Science 281(5381): 1322-1326.
Ahn, J. H., Y. G. Ko, W. Y. Park, Y. S. Kang, H. Y. Chung and J. S. Soe (1999).
“Suppression of ceramide-mediated apoptosis by HSP70.” Mol Cell 9(2): 200-
206.
Alberts, B., D. Bray, J. Lewis, M. Raff, K. Roberts and J. D. Watson (1989). Molecular
Biology of The Cell. M. Robertson. Garland Publishing, Inc., New York: 187-
188.
al-Rubeai, M. and R. P. Singh (1998). “Apoptosis in cell culture.” Curr Opin Biotechnol
9(2): 152-156.
Ashkenazi, A. and V. M. Dixit (1998). “Death Receptors: Signaling and Modulation.”
Science 281: 1305-1308.
Bamford, M., G. Walkinshaw and R. Brown (2000). “Therapeutic applications of
apoptosis research.” Exp Cell Res 256(1): 1-11.
140

Ban, J., L. Eckhart, W. Weninger, M. Mildner and E. Tschachler (1998). “Identification
of a human cDNA encoding a novel Bcl-x isoform.” Biochem Biophys Res
Commun 248(1): 147-152.
Bannai, S. and T. Ishii (1988). “A novel function of glutamine in cell culture: utilization
of glutamine for the uptake of cystine in human fibroblasts.” J Cell Physiol
137(2): 360-366.
Barry, M. and G. McFadden (1998). “Apoptosis regulators from DNA viruses.” Curr
Opin Immunol 10(4): 422-430.
Bernardi, P., L. Scorrano, R. Colonna, V. Petronilli and F. Di Lisa (1999). “Mitochondria
and cell death. Mechanistic aspects and methodological issues.” Eur J Biochem
264(3): 687-701.
Bibila, T. A. and D. K. Robinson (1995). “In pursuit of the optimal fed-batch process for
monoclonal antibody production.” Biotechnol Prog 11(1): 1-13.
Boise, L. H., M. Gonzalez-Garcia, C. E. Postema, L. Ding, T. Lindsten, L. A. Turka, X.
Mao, G. Nunez and C. B. Thompson (1993). “bcl-x, a bcl-2-related gene that
functions as a dominant regulator of apoptotic cell death.” Cell 74(4): 597-608.
Bojes, H. K., K. Datta, J. Xu, A. Chin, P. Siminian, G. Nunez and J. P. Kehrer (1997).
“Bcl-xL overexpression attenuates glutathione depletion in FL5.12 cells following
interleukin-3 withdrawal.” Biochem J 325: 315-319.
Bozimowski, D., J. D. Artiss and B. Zak (1985). “Sensitive determination of
cerebrospinal fluid pyruvate, lactate and glucose concentrations.” Clin Chim Acta
153(1): 63-69.
141

Bratton, S. B., M. MacFarlane, K. Cain and G. M. Cohen (2000). “Protein complexes
activate distinct caspase cascades in death receptor and stress-induced apoptosis.”
Exp Cell Res 256(1): 27-33.
Breitschoph, K., J. Haendeler, P. Malchow, A. M. Zeiher and S. Dimmeler (2000).
“Posttranslational Modification of Bcl-2 Facilitates Its Proteasome-Dependent
Degradation: Molecular Characterization of the Involved Signaling Pathway.”
Mol Cell Biol 20: 1886-1896.
Casadevall, A. (1999). “Passive antibody therapies: progress and continuing challenges.”
Clin Immunol 93(1): 5-15.
Chadebech, P., L. Brichese, V. Baldin, S. Vidal and A. Valette (1999). “Phosphorylation
and proteasome-dependent degradation of Bcl-2 in mitotic-arrested cells after
microtubule damage.” Biochem Biophys Res Commun 262(3): 823-827.
Chang, B. S., A. J. Minn, S. W. Muchmore, S. W. Fesik and C. B. Thompson (1997).
“Identification of a novel regulatory domain in Bcl-X(L) and Bcl-2.” Embo J
16(5): 968-977.
Chao, D. T. and S. J. Korsmeyer (1998). “BCL-2 family: regulators of cell death.” Annu
Rev Immunol 16: 395-419.
Charbonneau, J. R. and E. R. Gauthier (2000). “Prolongation of murine hybridoma cell
survival in stationary batch culture by Bcl-xL expression.” Cytotechnology 34:
131-135.
Chervonsky, A. V. (1999). “Apoptotic and effector pathways in autoimmunity.” Curr
Opin Immunol 11(6): 684-688.
142
Chung, J. D., C. Zabel, A. J. Sinskey and G. Stephanopoulos (1997). “Extension of Sp2/0
Hybridoma Cell Viability Through Interleukin-6 Supplementation.” Biotechnol
Bioeng 55(2): 439-446.
Cleary, M. L., S. D. Smith and J. Sklar (1986). “Cloning and structural analysis of
cDNAs for bcl-2 and a hybrid bcl-2/immunoglobin transcript resulting from the
t(14,18) translocation.” Cell 47: 18-28.
Clem, R. J., E. H. Cheng, C. L. Karp, D. G. Kirsch, K. Ueno, A. Takahashi, M. B.
Kastan, D. E. Griffin, W. C. Earnshaw, M. A. Veliuona and J. M. Hardwick
(1998). “Modulation of cell death by Bcl-XL through caspase interaction.” Proc
Natl Acad Sci USA 95(2): 554-559.
Cohen, G. M. (1997). “Caspases: the executioners of apoptosis.” Biochem J 326(Pt 1): 1-
16.
Cotgreave, I. A. and R. G. Gerdes (1998). “Recent trends in Glutathione biochemistry-
glutathione-protein interactions: A molecular link between oxidative stress and
cell proliferation?” Biochem Biophys Res Commun 242: 1-9.
Crompton, M. (1999). “The mitochondrial permeability transition pore and its role in cell
death.” Biochem J 341(Pt 2): 233-249.
Cross, T. G., D. Scheel-Toellner, N. V. Henriquez, E. Deacon, M. Salmon and J. M. Lord
(2000). “Serine/threonine protein kinases and apoptosis.” Exp Cell Res 256(1):
34-41.
Darveau, A., A. Pelletier and J. Perreault (1995). “PCR-Mediated Synthesis of Chimeric
Molecules.” Methods Neurosc 26: 77-85.
143

Dean, M. and e. al. (1986). “Regulation of c-myc transcription and mRNA abundance by
serum growth factors and cell contact.” J Biol Chem 261(20): 9161-9166.
Deng, X., P. Ruvolo, B. Carr and W. S. May (2000). “Survival function of ERK1/2 as IL-
3-activated staurosporine-resistant Bcl2 kinases.” Proc Natl Acad Sci USA 97(4):
1578-1583.
Dickson, A. J. (1998). “Apoptosis regulation and its applications to biotechnology.”
Trends Biotechnol 16(8): 339-342.
Dimmeler, S., K. Breitschoph, J. Haendeler and A. M. Zeiher (1999).
“Dephosphorylation Targets Bcl-2 for Ubiquitin-dependent Degradation: A Link
between the Apoptosome and the Proteasome Pathway.” J Exp Med 189(11):
1815-1822.
Doverskog, M., J. Ljunggren, L. Ohman and L. Haggstrom (1997). “Physiology of
cultured animal cells.” J Biotechnol 59(1-2): 103-115.
Downward, J. (1999). “How BAD phosphorylation is good for survival.” Nat Cell Biol
1(2): E33-35.
Enari, M., H. Sakahira, H. Yokoyama, K. Okawa, A. Iwamatsu and S. Nagata (1998). “A
caspase-activated DNase that degrades DNA during apoptosis, and its inhibitor
ICAD.” Nature 391(6662): 43-50.
Fadeel, B., S. Orrenius and B. Zhivotovsky (1999). “Apoptosis in human disease: a new
skin for the old ceremony?” Biochem Biophys Res Commun 266(3): 699-717.
Fadeel, B., B. Zhivotovsky and S. Orrenius (1999). “All along the watchtower: on the
regulation of apoptosis regulators.” Faseb J 13(13): 1647-1657.
144

Fassnacht, D., S. Rossing, F. Franek, M. al-Rubeai and R. Protner (1998). “Effect of Bcl-
2 expression on hybridoma cell growth in serum-supplemented, protein-free and
diluted media.” Cytotechnology 26: 219-225.
Fesik, S. W. (2000). “Insights into programmed cell death through structural biology.”
Cell 103: 273-282.
Finucane, D. M., E. Bossy-Wetzel, N. J. Waterhouse, T. G. Cotter and D. R. Green
(1999). “Bax-induced caspase activation and apoptosis via cytochrome c release
from mitochondria is inhibitable by Bcl-xL.” J Biol Chem 274(4): 2225-2233.
Franek, F. (1995). “Starvation-Induced Programmed Death of Hybridoma Cells:
Prevention by Amino Acid Mixtures.” Biotechnol Bioeng 45(1): 86-90.
Franek, F. and J. Dolnikova (1991). “Nucleosomes occurring in protein free hybridoma
cell culture. Evidence for programmed cell death.” FEBS Lett 284: 285-287.
Franek, F. and K. Sramkova (1996a). “Protection of B lymphocyte hybridoma against
starvation-induced apoptosis: survival-signal role of some amino acids.” Immunol
Lett 52(2-3): 139-144.
Franek, F. and K. Sramkova (1996b). “Cell suicide in starving hybridoma culture:
survival-signal effect of some amino acids.” Cytotechnology 21: 81-89.
Franek, F., T. Vomastek and J. Dolnikova (1992). “Fragmented DNA and apoptotic
bodies document the programmed way of cell death in hybridoma cultures.”
Cytotechnology 9: 117-123.
Fujita, T., S. Terada, K. Fukuoa, A. Kitayama, H. Ueda and E. Suzuki (1997).
“Reinforcing apoptosis-resistance of COS and myeloma cells by transfecting with
Bcl-2 gene.” Cytotechnology 25: 25-33.
145
Fujita, T., S. Terada, H. Ueda and E. Suzuki (1996). “Overexpression of bcl-2 Improved
Survival of Cos-1 Cells and Enhanced Transient Protein Production.” J Fermen
Bioeng 82(6): 589-591.
Gaertner, J. G. and P. Dhurjati (1993a). “Fractional factorial study of hybridoma
behavior. 1. Kinetics of growth and antibody production.” Biotechnol Prog 9(3):
298-308.
Gaertner, J. G. and P. Dhurjati (1993b). “Fractional factorial study of hybridoma
behavior. 2. Kinetics of nutrient uptake and waste production.” Biotechnol Prog
9(3): 309-316.
Gauthier, E. R., S. D. Madison and R. N. Michel (1997). “Rapid RNA isolation without
the use of commercial kits: application to small tissue samples.” Eur J Physiol
433: 664-668.
Gauthier, E. R., L. Piche, G. Lemieux and R. Lemieux (1996). “Role of bcl-xL in the
control of Apoptosis in Murine Myeloma Cells.” Cancer Res 56: 1451-1456.
Golstein, P. (2000). “Signal transduction. FasL binds preassembled Fas.” Science
288(5475): 2328-2329.
Gottlieb, R. A. (1999). “Mitochondria: ignition chamber for apoptosis.” Mol Genet
Metab 68(2): 227-231.
Gottlieb, R. A. (2000). “Mitochondria: execution central.” FEBS Lett 482: 6-12.
Green, D. R. (2000). “Apoptotic pathways: paper wraps stone blunts scissors.” Cell
102(1): 1-4.
Green, M. C., J. L. Murray and G. N. Hortobagyi (2000). “Monoclonal antibody therapy
for solid tumors.” Cancer Treat Rev 26(4): 269-286.
146
Grillot, D. A. M., M. Gonzalez-Garcia, D. Ekhterae, L. Duan, N. Inohara, S. Ohta, M. F.
Seldin and G. Nunez (1997). “Genomic organization, promoter region analysis,
and chromosome localization of the mouse bcl-x gene.” J Immunol 158: 4750-
4757.
Grosclaude, J. (1988). Culture d'hybridomes. Culture de cellules animales -
Methodologies applications. M. Adolphe and G. Barlovatz-Meimon. Paris: 313-
320.
Gruenbaum, Y., K. L. Wilson, A. Harel, M. Goldberg and M. Cohen (2000). “Review:
nuclear lamins--structural proteins with fundamental functions.” J Struct Biol
129(2-3): 313-323.
Hansen, M. B., S. E. Nielsen and K. Berg (1989). “Re-examination and further
development of a precise and rapid dye method for measuring cell growth/cell
kill.” J Immunol Methods 119: 203-210.
Harada, H., B. Becknell, M. Wilm, M. Mann, L. J. Huang, S. S. Taylor, J. D. Scott and S.
J. Korsmeyer (1999). “Phosphorylation and inactivation of BAD by
mitochondria-anchored protein kinase A.” Mol Cell 3(4): 413-422.
Hayden, M. S., L. K. Gilliland and J. A. Ledbetter (1997). “Antibody engineering.” Curr
Opin Immunol 9: 201-212.
Hengartner, M. O. (2000). “The biochemistry of apoptosis.” Nature 407: 770-776.
Hirotani, M., Y. Zhang, N. Fujita, M. Naito and T. Tsuruo (1999). “NH2-terminal BH4
domain of Bcl-2 is functional for heterodimerization with Bax and inhibition of
apoptosis.” J Biol Chem 274(29): 20415-20420.
147

Howard, M. K. and e. al. (1993). “Cell cycle arrest of proliferating neuronal cells by
serum deprivation can result in either apoptosis or differentiation.” J Neurochem
60(5): 1783-1791.
Hsu, Y. T., K. G. Wolter and R. J. Youle (1997). “Cytosol-to-membrane redistribution of
Bax and Bcl-X(L) during apoptosis.” Proc Natl Acad Sci USA 94(8): 3668-3672.
Hsu, Y. T. and R. J. Youle (1997). “Nonionic detergents induce dimerization among
members of the Bcl-2 family.” J Biol Chem 272(21): 13829-13834.
Hu, W. S. and J. G. Aunins (1997). “Large-scale mammalian cell culture.” Curr Opin
Biotechnol 8(2): 148-153.
Hu, Y., M. A. Benedict, D. Wu, N. Inohara and G. Nunez (1998). “Bcl-XL interacts with
Apaf-1 and inhibits Apaf-1-dependent caspase-9 activation.” Proc Natl Acad Sci
USA 95(8): 4386-4391.
Huang, Q., S. S. Lau and T. J. Monks (1999). “Induction of gadd153 mRNA by nutrient
deprivation is overcome by glutamine.” Biochem J 341(Pt 1): 225-231.
Hudson, P. J. (1999). “Recombinant antibody constructs in cancer therapy.” Curr Opin
Immunol 11: 548-557.
Ito, T., X. Deng, B. Carr and W. S. May (1997). “Bcl-2 phosphorylation required for anti-
apoptosis function.” J Biol Chem 272(18): 11671-11673.
Itoh, Y., H. Ueda and E. Suzuki (1995). “Overexpression of bcl-2, Apoptosis Suppressing
Gene: Prolonged Viable Culture Period of Hybridoma and Enhanced Antibody
Production.” Biotechnol Bioeng 48: 118-122.
Jacobson, M. D., M. Weil and M. C. Raff (1997). “Programmed cell death in animal
development.” Cell 88(3): 347-354.
148
Janicke, R. U., M. L. Sprengart, M. R. Wati and A. G. Porter (1998). “Caspase-3 is
required for DNA fragmentation and morphological changes associated with
apoptosis.” J Biol Chem 273(16): 9357-9360.
Jayadev, S., B. Liu, A. E. Bielawska, J. Y. Lee, F. Nazaire, M. Y. Pushkareva, L. M.
Obeid and Y. A. Hannun (1995). “Role for Ceramide in Cell Cycle Arrest.” J Biol
Chem 270(5): 2047-2052.
Kaufmann, S. H. and W. C. Earnshaw (2000). “Induction of apoptosis by cancer
chemotherapy.” Exp Cell Res 256(1): 42-49.
Kearney, J. F., A. Radbruch, B. Liesegang and K. Rajewsky (1979). “A new mouse
myeloma cell line that has lost immunoglobulin expression but permits the
construction of antibody-secreting hybrid cell lines.” J Immunol 123(4): 1548-
1550.
Kelekar, A., B. S. Chang, J. E. Harlan, S. W. Fesik and C. B. Thompson (1997). “Bad is a
BH3 domain-containing protein that forms an inactivating dimer with Bcl-XL.”
Mol Cell Biol 17(12): 7040-7046.
Kennett, R. H. (1979). Cell Culture. W. B. Jakoby and I. H. Pastan. Toronto, Academic
Press, Inc. LVIII: 345-359.
Kerr, J. F. and B. V. Hamon (1991). Apoptosis: The molecular basis of cell death. Cold
Spring Harbor, Cold Spring Harbor Laboratory Press.
Kerr, J. F., C. M. Winterford and B. V. Harmon (1994). “Apoptosis. Its significance in
cancer and cancer therapy.” Cancer 73(8): 2013-2026.
Kirsch, D. G., A. Doseff, B. N. Chau, D. S. Lim, N. C. de Souza-Pinto, R. Hansford, M.
B. Kastan, Y. A. Lazebnik and J. M. Hardwick (1999). “Caspase-3-dependent
149

cleavage of Bcl-2 promotes release of cytochrome c.” J Biol Chem 274(30):
21155-21161.
Knudson, C. M. and S. J. Korsmeyer (1997). “Bcl-2 and Bax function independently to
regulate cell death.” Nature Genet 16(4): 358-363.
Kohler, G. and C. Milstein (1975). “Continuous cultures of fused cells secreting antibody
of predefined specificity.” Nature 256(5517): 495-497.
Kozak, M. (1991a). “An analysis of vertebrate mRNA sequences: Initiations of
translational control.” J Cell Biol 115(4): 887-903.
Kozak, M. (1991b). “Structural features in eukaryotic mRNAs that modulate the
initiation of translation.” J Biol Chem 266(30): 19867-19870.
Kroemer, G., B. Dallaporta and M. Resche-Rigon (1998). “The mitochondrial death/life
regulator in apoptosis and necrosis.” Annu Rev Physiol 60: 619-642.
LeGrand, E. K. (2000). “Implications of early apoptosis of infected cells as an important
host defense.” Med Hypotheses 54(4): 591-596.
Liang, H. and S. W. Fesik (1997). “Three-dimensional structures of proteins involved in
programmed cell death.” J Mol Biol 274(3): 291-302.
Linardos, T. I., N. Kalogerakis and L. A. Behie (1991). “The Effect of Specific Growth
Rate and Death Rate on Monoclonal Antibody Production in hybridoma
Chemostat Cultures.” The Can J Chemical Eng 69: 429-438.
Ling, Y. H., C. Tornos and R. Perez-Soler (1998). “Phosphorylation of Bcl-2 is a marker
of M phase events and not a determinant of apoptosis.” J Biol Chem 273(30):
18984-18991.
150

Liu, X., H. Zou, C. Slaughter and X. Wang (1997). “DFF, a heterodimeric protein that
functions downstream of caspase-3 to trigger DNA fragmentation during
apoptosis.” Cell 89(2): 175-184.
Loeffler, M. and G. Kroemer (2000). “The mitochondrion in cell death control:
certainties and incognita.” Exp Cell Res 256(1): 19-26.
Lotem, J. and L. Sachs (1995). “Regulation of bcl-2, bcl-XL and bax in the control of
apoptosis by hematopoietic cytokines and dexamethasone.” Cell Growth Differ
6(6): 647-653.
MacCorkle, R. A., K. W. Freeman and D. M. Spencer (1998). “Synthetic activation of
caspases: artificial death switches.” Proc Natl Acad Sci USA 95(7): 3655-3660.
Matsuyama, S., J. Llopis, Q. L. Deveraux, R. Y. Tsien and J. C. Reed (2000). “Changes
in intramitochondrial and cytosolic pH: early events that modulate caspase
activation during apoptosis.” Nat Cell Biol 2(6): 318-325.
McKenna, S. L. and T. G. Cotter (2000). “Inhibition of caspase activity delays apoptosis
in a transfected NS/0 myeloma cell line.” Biotechnol Bioeng 67(2): 165-176.
Mercille, S., P. Jolicoeur, C. Gervais, D. Paquette, D. D. Mosser and B. Massie (1999).
“Dose-dependent reduction of apoptosis in nutrient-limited cultues of NS/0
myeloma cells transfected with teh E1B-19K adenoviral gene.” Biotechnol
Bioeng 63(5): 516-528.
Mercille, S. and B. Massie (1994). “Induction of Apoptosis in Nutrient-Deprived
Cultures of Hybridoma and Myeloma cells.” Biotechnol Bioeng 44: 1140-1154.
Mignotte, B. and J. L. Vayssiere (1998). “Mitochondria and apoptosis.” Eur J Biochem
252(1): 1-15.
151
Minn, A. J., L. H. Boise and C. B. Thompson (1996). “Bcl-x(S) anatagonizes the
protective effects of Bcl-x(L).” J Biol Chem 271(11): 6306-6312.
Moriishi, K., D. C. Huang, S. Cory and J. M. Adams (1999). “Bcl-2 family members do
not inhibit apoptosis by binding the caspase activator Apaf-1.” Proc Natl Acad Sci
USA 96(17): 9683-9688.
Muchmore, S. W., M. Sattler, H. Liang, R. P. Meadows, J. E. Harlan, H. S. Yoon, D.
Nettesheim, B. S. Chang, C. B. Thompson, S.-L. Wong, S.-C. Ng and S. W. Fesik
(1996). “X-ray and NMR structure of human Bcl-xL, an inhibitor of programmed
cell death.” Nature 381: 335-341.
Murray, K., C. E. Agn, K. Gull, J. A. Hichman and A. J. Dickson (1996). “NSO myeloma
cell death: Influence of Bcl-2 overexpression.” Biotechnol Bioeng 51: 298-304.
Nagata, S. (1997). “Apoptosis by death factor.” Cell 88(3): 355-365.
Nagata, S. (2000). “Apoptotic DNA fragmentation.” Exp Cell Res 256(1): 12-18.
Nagata, S., K. Yamamoto, K. Ueno, T. Kurata and J. Chiba (1991). “Production of
monoclonal antibodies by the use of pH-dependent vesicular stomatitis virus-
mediated cell fusion.” Hybridoma 10(2): 317-322.
Newsholme, E. A., B. Crabtree and M. S. Ardawi (1985). “The role of high rates of
glycolysis and glutamine utilization in rapidly dividing cells.” Biosci Rep 5(5):
393-400.
Oberhammer, F. A., K. Hochegger, G. Froschl, R. Tieffenbacher and M. Pavelka (1994).
“Chromatin condensation during apoptosis is accompanied by degradation of
lamin A+B, without enhanced activation of cdc2 kinase.” J Cell Biol 126(4): 827-
837.
152

Pan, G., K. O'Rourke and V. M. Dixit (1998). “Caspase-9, Bcl-XL, and Apaf-1 form a
ternary complex.” J Biol Chem 273(10): 5841-5845.
Pecci, A., A. Scholz, D. Pelster and M. Beato (1997). “Progestins prevent apoptosis in a
rat endometrial cell line and increase the ratio of bcl-XL to bcl-XS.” J Biol Chem
272(18): 11791-11798.
Perez, D. and E. White (2000). “TNF-alpha Signals Apoptosis through a Bid-Dependent
Conformational Change in Bax that is Inhibited by E1B 19K.” Mol Cell 6: 53-63.
Perreault, J. and R. Lemieux (1993). “Rapid apoptotic cell death of B-cell hybridomas in
absence of gene expression.” J Cell Physiol 156(2): 286-293.
Peter, M. E., A. E. Heufelder and M. O. Hengartner (1997). “Advances in apoptosis
research.” Proc Natl Acad Sci USA 94(24): 12736-12737.
Peter, M. E. and P. H. Krammer (1998). “Mechanisms of CD95 (APO-1/Fas)-mediated
apoptosis.” Curr Opin Immunol 10(5): 545-551.
Petronini, P. G., S. Urbani, R. Alfieri, A. F. Borghetti and G. G. Guidotti (1996). “Cell
susceptibility to apoptosis by glutamine deprivation and rescue: survival and
apoptotic death in cultured lymphoma-leukemia cell lines.” J Cell Physiol 169(1):
175-185.
Pont-Kingdon, G. (1994). “Construction of Chimeric Molecules by a Two-Step
Recombinant PCR Method.” Biotechniques 16(6): 1010-1011.
Poommipanit, P. B., B. Chen and Z. N. Oltvai (1999). “Interleukin-3 induces the
phosphorylation of a distinct fraction of bcl- 2.” J Biol Chem 274(2): 1033-1039.
Porter, A. G., P. Ng and R. U. Janicke (1997). “Death substrates come alive.” Bioessays
19(6): 501-507.
153

Poruchynsky, M. S., E. E. Wang, C. M. Rudin, M. V. Blagosklonny and T. Fojo (1998).
“Bcl-xL is phosphorylated in malignant cells following microtubule disruption.”
Cancer Res 58(11): 3331-3338.
Puthier, D., S. Derenne, S. Barille, P. Moreau, J. L. Harousseau, R. Bataille and M.
Amiot (1999). “Mcl-1 and Bcl-xL are co-regulated by IL-6 in human myeloma
cells.” Br J Haematol 107(2): 392-395.
Reed, J. C. (1997). “Double identity for proteins of the Bcl-2 family.” Nature 387(6635):
773-776.
Reitzer, L. J., B. M. Wince and D. Dennell (1979). “Evidence That Glutamine, not sugar,
is the major energy source for cultured HeLa cells.” J Biol Chem 254(8): 2669-
2676.
Robertson, J. D., S. Orrenius and B. Zhivotovsky (2000). “Review: nuclear events in
apoptosis.” J Struct Biol 129(2-3): 346-358.
Ruvolo, P. P., X. Deng, B. Carr and W. S. May (1998). “A functional role for
mitochondrial protein kinase Calpha in Bcl2 phosphorylation and suppression of
apoptosis.” J Biol Chem 273(39): 25436-25442.
Sakahira, H., M. Enari and S. Nagata (1998). “Cleavage of CAD inhibitor in CAD
activation and DNA degradation during apoptosis.” Nature 391(6662): 96-99.
Sambrook, J., E. F. Fritsch and T. Maniatis (1989). Molecular Cloning - a laboratory
manual. Cold Spring Harbor, Cold Spring Harbor Laboratory Press.
Sanfeliu, A., J. J. Cairo, C. Casas, C. Sola and F. Godia (1996). “Analysis of nutritional
factors and physical conditions affecting growth and monoclonal antibody
production of the hybridoma KB-26.5 cell line.” Biotechnol Prog 12(2): 209-216.
154

Sattler, M., H. Liang, D. Nettesheim, R. P. Meadows, J. E. Harlan, M. Eberstadt, H. S.
Yoon, S. B. Shuker, B. S. Chang, A. J. Minn, C. B. Thompson and S. W. Fesik
(1997). “Structure of Bcl-xL-Bak peptide complex: recognition between
regulators of apoptosis.” Science 275(5302): 983-986.
Scatena, C. D., Z. A. Stewart, D. Mays, L. J. Tang, C. J. Keefer, S. D. Leach and J. A.
Pietenpol (1998). “Mitotic phosphorylation of Bcl-2 during normal cell cycle
progression and Taxol-induced growth arrest.” J Biol Chem 273(46): 30777-
30784.
Scheid, M. P., K. M. Schubert and V. Duronio (1999). “Regulation of bad
phosphorylation and association with Bcl-x(L) by the MAPK/Erk kinase.” J Biol
Chem 274(43): 31108-31113.
Schendel, S. L., M. Montal and J. C. Reed (1998). “Bcl-2 family proteins as ion-
channels.” Cell Death Differ 5(5): 372-380.
Schulze-Osthoff, K., D. Ferrari, M. Los, S. Wesselborg and M. E. Peter (1998).
“Apoptosis signaling by death receptors.” Eur J Biochem 254(3): 439-459.
Schwarze, M. M. and R. G. Hawley (1995). “Prevention of myeloma cell apoptosis by
ectopic bcl-2 expression or interleukin 6-mediated up-regulation of bcl-xL.”
Cancer Res 55(11): 2262-2265.
Sheikh, M. S., M. C. Hollander and A. J. Fornace Jr (2000). “Role of Gadd45 in
Apoptosis.” Biochemical Pharmacology 59: 43-45.
Shichiri, M., K. D. Hanson and J. M. Sedivy (1993). “Effects of c-myc expression on
proliferation, quiescence, and the G0 to G1 transition in nontransformed cells.”
Cell Growth Differ 4(2): 93-104.
155
Shimizu, S., T. Ide, T. Yanagida and Y. Tsujimoto (2000). “Electrophysiological study of
a novel large pore formed by Bax and the voltage-dependent anion channel that is
permeable to cytochrome c.” J Biol Chem 275(16): 12321-12325.
Shimizu, S., A. Konishi, T. Kodama and Y. Tsujimoto (2000). “BH4 domain of
antiapoptotic Bcl-2 family members closes voltage- dependent anion channel and
inhibits apoptotic mitochondrial changes and cell death.” Proc Natl Acad Sci USA
97(7): 3100-3105.
Shimizu, S., M. Narita and Y. Tsujimoto (1999). “Bcl-2 family proteins regulate the
release of apoptogenic cytochrome c by the mitochondrial channel VDAC.”
Nature 399(6735): 483-487.
Shimizu, S., Y. Shinohara and Y. Tsujimoto (2000). “Bax and Bcl-xL independently
regulate apoptotic changes of yeast mitochondria that require VDAC but not
adenine nucleotide translocator.” Oncogene 19(38): 4309-4318.
Shimizu, S. and Y. Tsujimoto (2000). “Proapoptotic BH3-only Bcl-2 family members
induce cytochrome c release, but not mitochondrial membrane potential loss, and
do not directly modulate voltage-dependent anion channel activity.” Proc Natl
Acad Sci USA 97(2): 577-582.
Shulman, M., C. D. Wilde and G. Kohler (1978). “A better cell line for making
hybridomas secreting specific antibodies.” Nature 276(5685): 269-270.
Sies, H. (1999). “Glutathione and its role in cellular functions.” Free Rad Biol Med
27(9/10): 916-921.
Silva, M., A. Benito, C. Sanz, F. Prosper, D. Ekhterae, G. Nunez and J. L. Fernandez-
Luna (1999). “Erythropoietin Can Induce the Expression of Bcl-xL through Stat5
156

in Erythropoietin-dependent Progenitor Cell Lines.” J Biol Chem 274(32): 22165-
22169.
Simpson, N. H., R. P. Singh, A. N. Emery and M. al-Rubeai (1999). “Bcl-2 over-
expression reduces growth rate and prolongs G1 phase in continuous chemostat
cultures of hybridoma cells.” Biotechnol Bioeng 64(2): 174-186.
Singh, R. P., M. al-Rubeai, C. D. Gregory and A. N. Emery (1994). “Cell death in
bioreactors: a role for apoptosis.” Biotechnol Bioeng 44: 720-726.
Singh, R. P., A. N. Emery and M. al-Rubeai (1996). “Enhancement of Survivability of
mammalian Cells by Overexpression of the Apoptosis-Suppressor Gene bcl-2.”
Biotechnol Bioeng 52: 166-175.
Singh, R. P., A. Finka, A. N. Emery and M. al-Rubeai (1997). “Apoptosis and its control
in cell culture system.” Cytotechnology 23: 87-93.
Slater, A., F. G., C. Stefan, I. Nobel, D. J. van den Dobbelsteen and O. Sten (1996).
“Intracellular redox changes during apoptosis.” Cell Death Differ 3: 57-62.
Smith, C. A., G. T. Williams, R. Kingston, E. J. Jenkinson and J. J. T. Owen (1989).
“Antibodies to CD3/T-cell receptor complex induce death by apoptosis in
immature T cells in thymic cultures.” Nature 337: 181-184.
Socolovsky, M., A. E. J. Fallon, S. Wang, C. Brugnara and H. F. Lodish (1999). “Fetal
Anemia and Apoptosis of Red Cell Progenitors in Stat5a-/-5b-/- Mice: A direct
Role for Stat5 in Bcl-xL Induction.” Cell 98: 181-191.
Sooryanarayana, N. Prasad, E. Bonnin, A. Pashov, K. Ben Jilani, J. C. Ameisen, M. D.
Kazatchkine and S. V. Kaveri (1999). “Phosphorylation of Bcl-2 and
mitochondrial changes are associated with apoptosis of lymphoblastoid cells
157
induced by normal immunoglobulin G.” Biochem Biophys Res Commun 264(3):
896-901.
Srivastava, R. K., Q. S. Mi, J. M. Hardwick and D. L. Longo (1999). “Deletion of the
loop region of Bcl-2 completely blocks paclitaxel- induced apoptosis.” Proc Natl
Acad Sci USA 96(7): 3775-3780.
Terada, S., K. Fukuoka, T. Fujita, T. Komatsu, S. Takayama, J. C. Reed and E. Suzuki
(1997). “Anti-apoptotic genes, bag-1 and bcl-2, enable hybridoma cells to survive
under treatment for arresting cell cycle.” Cytotechnology 25: 17-23.
Thompson, E. B. (1998). “Special topic: apoptosis.” Annu Rev Physiol 60: 525-532.
Tschopp, J., M. Thome, K. Hofmann and E. Meinl (1998). “The fight of viruses against
apoptosis.” Curr Opin Genet Dev 8(1): 82-87.
Tsujimoto, Y. and C. M. Croce (1986). “Analysis of the structure, transcripts, and protein
products of bcl-2, the gene involved in human follicular lymphoma.” Proc Natl
Acad Sci USA 83: 5214-5218.
Tsujimoto, Y. and S. Shimizu (2000). “Bcl-2 family: life-or-death switch.” FEBS Lett
466(1): 6-10.
Vander Heiden, M. G., N. S. Chandel, P. T. Schumacker and C. B. Thompson (1999).
“Bcl-xL prevents cell death following growth factor withdrawal by facilitating
mitochondrial ATP/ADP exchange.” Mol Cell 3(2): 159-167.
Vander Heiden, M. G. and C. B. Thompson (1999). “Bcl-2 proteins: regulators of
apoptosis or of mitochondrial homeostasis?” Nat Cell Biol 1(8): E209-E216.
158

Vaux, D. L., S. Cory and J. M. Adams (1988). “Bcl-2 gene promotes haemopoietic cell
survival and cooperates with c- myc to immortalize pre-B cells.” Nature
335(6189): 440-442.
Vaux, D. L. and S. J. Korsmeyer (1999). “Cell death in development.” Cell 96(2): 245-
254.
Voehringer, D. W. (1999). “Bcl-2 and Gluthathione: alterations in cellular redox state
that regulate apoptosis sensitivity.” Free Rad Biol Med 27(9/10): 945-950.
Voehringer, D. W., D. J. McConkey, T. J. McDonnell, S. Brisbay and R. E. Meyn (1998).
“Bcl-2 expression causes redistribution of glutathione to the nucleus.” Proc Natl
Acad Sci USA 95: 2956-2960.
Vomastek, T. and F. Franek (1993). “Kinetics of development of spontaneous apoptosis
in B cell hybridoma cultures.” Immunol Lett 35(1): 19-24.
Walczak, H. and P. H. Krammer (2000). “The CD95 (APO-1/Fas) and the TRAIL (APO-
2L) apoptosis systems.” Exp Cell Res 256(1): 58-66.
Wang, H. G., N. Pathan, I. M. Ethell, S. Krajewski, Y. Yamaguchi, F. Shibasaki, F.
McKeon, T. Bobo, T. F. Franke and J. C. Reed (1999). “Ca2+-induced apoptosis
through calcineurin dephosphorylation of BAD.” Science 284(5412): 339-343.
Wang, S., Z. Wang, L. Boise, P. Dent and S. Grant (1999). “Loss of the bcl-2
phosphorylation loop domain increases resistance of human leukemia cells
(U937) to paclitaxel-mediated mitochondrial dysfunction and apoptosis.”
Biochem Biophys Res Commun 259(1): 67-72.
Williams, J. G. (2000). “Stat signalling in cell proliferation and in development.” Curr
Opin Gen Bioeng 10: 503-507.
159
Winoto, A. (1997). “Cell death in the regulation of immune responses.” Curr Opin
Immunol 9(3): 365-370.
Wold, W. S., K. Doronin, K. Toth, M. Kuppuswamy, D. L. Lichtenstein and A. E.
Tollefson (1999). “Immune responses to adenoviruses: viral evasion mechanisms
and their implications for the clinic.” Curr Opin Immunol 11(4): 380-386.
Wolf, B. B. and D. R. Green (1999). “Suicidal tendencies: apoptotic cell death by caspase
family proteinases.” J Biol Chem 274(29): 20049-20052.
Wolfe, S. L. (1995). Introduction to Cell and Molecular Biology. M. Arbogast. Toronto,
Wadsworth Publishing Company: 555-557.
Wyllie, A. H. (1980). “Glucocorticoid-induced thymocyte apoptosis is associated with
endogenous endonuclease activation.” Nature 284(5756): 555-556.
Yamada, H., S. Tada-Oikawa, A. Uchida and S. Kawanishi (1999). “TRAIL causes
cleavage of bid by caspase-8 and loss of mitochondrial membrane potential
resulting in apoptosis in BJAB cells.” Biochem Biophys Res Commun 265(1):
130-133.
Yamamoto, K., H. Ichijo and S. J. Korsmeyer (1999). “BCL-2 is phosphorylated and
inactivated by an ASK1/Jun N-terminal protein kinase pathway normally
activated at G(2)/M.” Mol Cell Biol 19(12): 8469-8478.
Yin, D. X. and R. T. Schimke (1995). “Bcl-2 expression delays drug-induced apoptosis
but does not increase clonogenic survival after drug treatment in HeLa cells.”
Cancer Res 55(21): 4922-4928.
160
161
Zhivotovsky, B., D. H. Burgess, D. M. Vanags and S. Orrenius (1997). “Involvement of
cellular proteolytic machinery in apoptosis.” Biochem Biophys Res Commun
230(3): 481-488.
Zou, H., Y. Li, X. Liu and X. Wang (1999). “An APAF-1.cytochrome c multimeric
complex is a functional apoptosome that activates procaspase-9.” J Biol Chem
274(17): 11549-11556.


![· Web viewOne research revealed that human dickkopf-1 and human heat shock protein-70 fusion vaccine could effectively elicit tumor apoptosis and prolonged survival in murine MM.[66]](https://img.pdfslide.us/doc/110x75/5e30bd8027762b1f3e7e4929/web-view-one-research-revealed-that-human-dickkopf-1-and-human-heat-shock-protein-70.jpg)