Embed Size (px)
Citation preview
Control Loop PerformanceMonitoring
© 2020 General Electric Company
Contents
Chapter 1: Control Loop Performance Monitoring Overview 1What is Process Control? 2
What is a Control Loop? 2
What is a PID Control Loop? 2
What is Control Loop Performance Monitoring? 3
The Asset Model in CLPM 4
CLPM Components 5
User Workflow in CLPM 6
CLPM Terminology 7
Chapter 2: Get Started with CLPM 8Getting Started with CLPM 9
Prerequisites for CLPM 9
Define the Asset Model 10
Deploy Data Collection 10
Deploy CLPM Analytics 15
Access Loop and Fleet Dashboards 45
Chapter 3: The Fleet Report 46The Fleet Report 47
Access the Fleet Report 47
Modify the Date Range for a Fleet Report 47
Average Control Loop Performance Chart 48
The Diagnostic Alerts Filtering Smart Filter 48
The Control Loop Performance Table 49
Chapter 4: The Loop Report 52About the Loop Report 53
Access the Loop Report 53
Modify the Date for a Loop Report 54
ii Control Loop Performance Monitoring
The Process Variable Performance Chart 54
The Manipulated Variable Distribution Chart 55
The Control Overview Chart 57
The Error Distribution Chart 59
The Control Mode Summary Table 60
The Controller Performance Table 60
The PV Performance Table 63
The Error Statistics Table 63
The Controller Configuration Table 64
Chapter 5: The Loop Analysis Template 65About the Loop Analysis Template 66
Access the Loop Analysis Template 66
Modify the Date for a Loop Analysis 66
Chapter 6: Manage Loops 68Add a Loop 69
Modify a Loop 69
Delete a Loop 70
Chapter 7: Reference 71CLPM Terminology 72
Control Loop Asset Definition 72
KPI Reference for CLPM 107
Chapter 8: Release Notes 126Control Loop Performance Monitoring Release Notes Q2 2019 127
Control Loop Performance Monitoring Release Notes Q1 2019 127
iii

Copyright GE Digital© 2020 General Electric Company.
GE, the GE Monogram, and Predix are either registered trademarks or trademarks of General ElectricCompany. All other trademarks are the property of their respective owners.
This document may contain Confidential/Proprietary information of General Electric Company and/or itssuppliers or vendors. Distribution or reproduction is prohibited without permission.
THIS DOCUMENT AND ITS CONTENTS ARE PROVIDED "AS IS," WITH NO REPRESENTATION ORWARRANTIES OF ANY KIND, WHETHER EXPRESS OR IMPLIED, INCLUDING BUT NOT LIMITED TOWARRANTIES OF DESIGN, MERCHANTABILITY, OR FITNESS FOR A PARTICULAR PURPOSE. ALL OTHERLIABILITY ARISING FROM RELIANCE UPON ANY INFORMATION CONTAINED HEREIN IS EXPRESSLYDISCLAIMED.
Access to and use of the software described in this document is conditioned on acceptance of the EndUser License Agreement and compliance with its terms.
iv © 2020 General Electric Company
Chapter
1Control Loop Performance Monitoring OverviewTopics:
• What is Process Control?• What is a Control Loop?• What is a PID Control Loop?• What is Control Loop
Performance Monitoring?• The Asset Model in CLPM• CLPM Components• User Workflow in CLPM• CLPM Terminology
© 2020 General Electric Company 1
What is Process Control?Process control is an engineering discipline for maintaining the output of a specific process within adesired range.
A control system is a device or set of devices used to manage the behavior of other devices or systems inan industrial process facility.
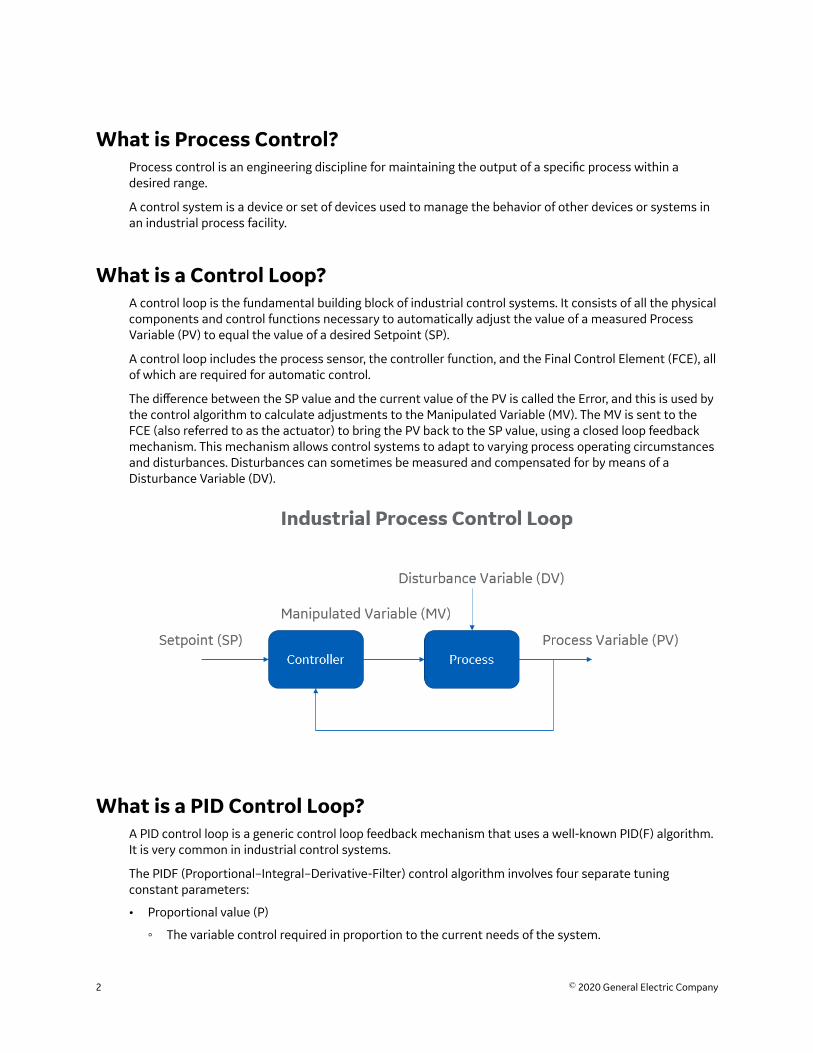
What is a Control Loop?A control loop is the fundamental building block of industrial control systems. It consists of all the physicalcomponents and control functions necessary to automatically adjust the value of a measured ProcessVariable (PV) to equal the value of a desired Setpoint (SP).
A control loop includes the process sensor, the controller function, and the Final Control Element (FCE), allof which are required for automatic control.
The difference between the SP value and the current value of the PV is called the Error, and this is used bythe control algorithm to calculate adjustments to the Manipulated Variable (MV). The MV is sent to theFCE (also referred to as the actuator) to bring the PV back to the SP value, using a closed loop feedbackmechanism. This mechanism allows control systems to adapt to varying process operating circumstancesand disturbances. Disturbances can sometimes be measured and compensated for by means of aDisturbance Variable (DV).
What is a PID Control Loop?A PID control loop is a generic control loop feedback mechanism that uses a well-known PID(F) algorithm.It is very common in industrial control systems.
The PIDF (Proportional–Integral–Derivative-Filter) control algorithm involves four separate tuningconstant parameters:
• Proportional value (P)
◦ The variable control required in proportion to the current needs of the system.
2 © 2020 General Electric Company
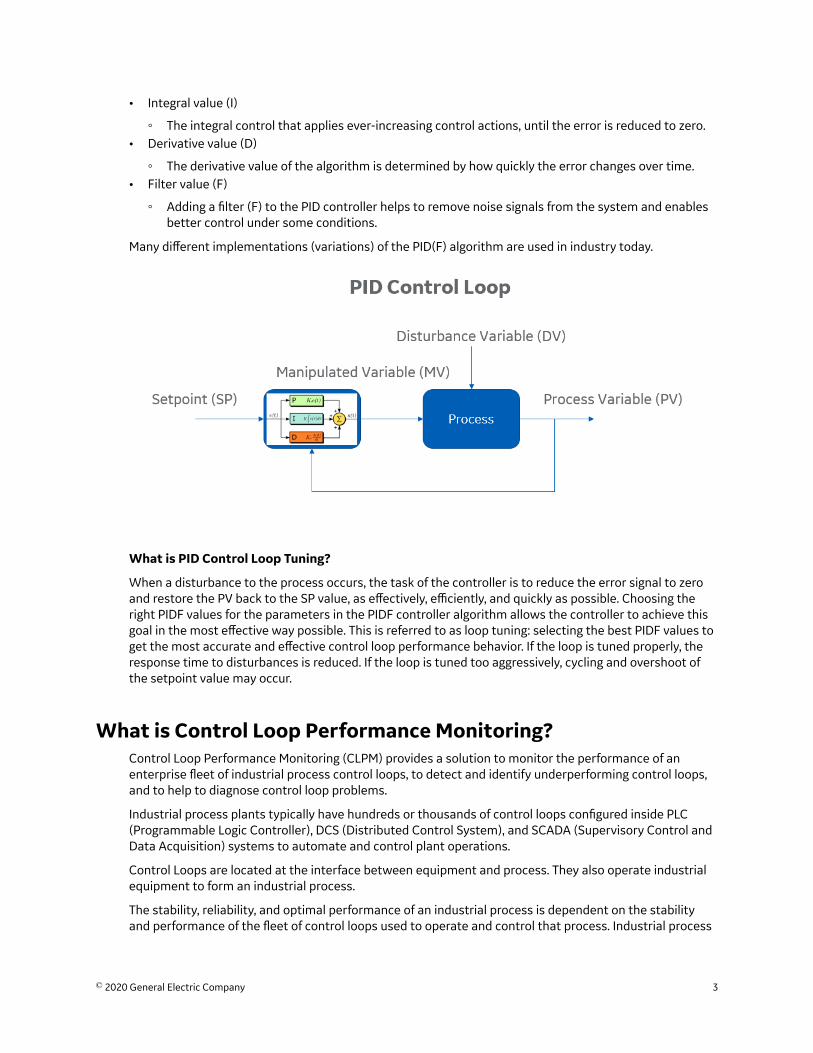
• Integral value (I)
◦ The integral control that applies ever-increasing control actions, until the error is reduced to zero.• Derivative value (D)
◦ The derivative value of the algorithm is determined by how quickly the error changes over time.• Filter value (F)
◦ Adding a filter (F) to the PID controller helps to remove noise signals from the system and enablesbetter control under some conditions.
Many different implementations (variations) of the PID(F) algorithm are used in industry today.
What is PID Control Loop Tuning?
When a disturbance to the process occurs, the task of the controller is to reduce the error signal to zeroand restore the PV back to the SP value, as effectively, efficiently, and quickly as possible. Choosing theright PIDF values for the parameters in the PIDF controller algorithm allows the controller to achieve thisgoal in the most effective way possible. This is referred to as loop tuning: selecting the best PIDF values toget the most accurate and effective control loop performance behavior. If the loop is tuned properly, theresponse time to disturbances is reduced. If the loop is tuned too aggressively, cycling and overshoot ofthe setpoint value may occur.
What is Control Loop Performance Monitoring?Control Loop Performance Monitoring (CLPM) provides a solution to monitor the performance of anenterprise fleet of industrial process control loops, to detect and identify underperforming control loops,and to help to diagnose control loop problems.
Industrial process plants typically have hundreds or thousands of control loops configured inside PLC(Programmable Logic Controller), DCS (Distributed Control System), and SCADA (Supervisory Control andData Acquisition) systems to automate and control plant operations.
Control Loops are located at the interface between equipment and process. They also operate industrialequipment to form an industrial process.
The stability, reliability, and optimal performance of an industrial process is dependent on the stabilityand performance of the fleet of control loops used to operate and control that process. Industrial process
© 2020 General Electric Company 3
plants are also capital-intensive assets. Suboptimal control loops can directly impact equipmentreliability, equipment lifetime, and operational performance.
It is therefore essential to manage the performance of control loops as valuable assets in an industrialenterprise facility that should be continuously monitored and optimized.
Evaluating Control Loop Performance
• Control loops are performing well when the monitored process variable (PV) varies within the definedupper and lower control limits from the desired SP value.
• Control loops are performing poorly where the monitored PV functions outside of the desired processcontrol limits.
The Asset Model in CLPMThe asset model is central to CLPM in a number of ways:
• Loops are defined as assets, according to a predefined template/definition for a control loop.• Deployment of data collections in Edge Analytics is driven by the asset model.• CLPM configuration is driven from the asset.• Loop thresholds and control limits are defined on the asset.• Edge data is extracted from the asset.• Actions on a control mode are defined on the asset.
Consult the Control Loop Asset Definition for details.
4 © 2020 General Electric Company
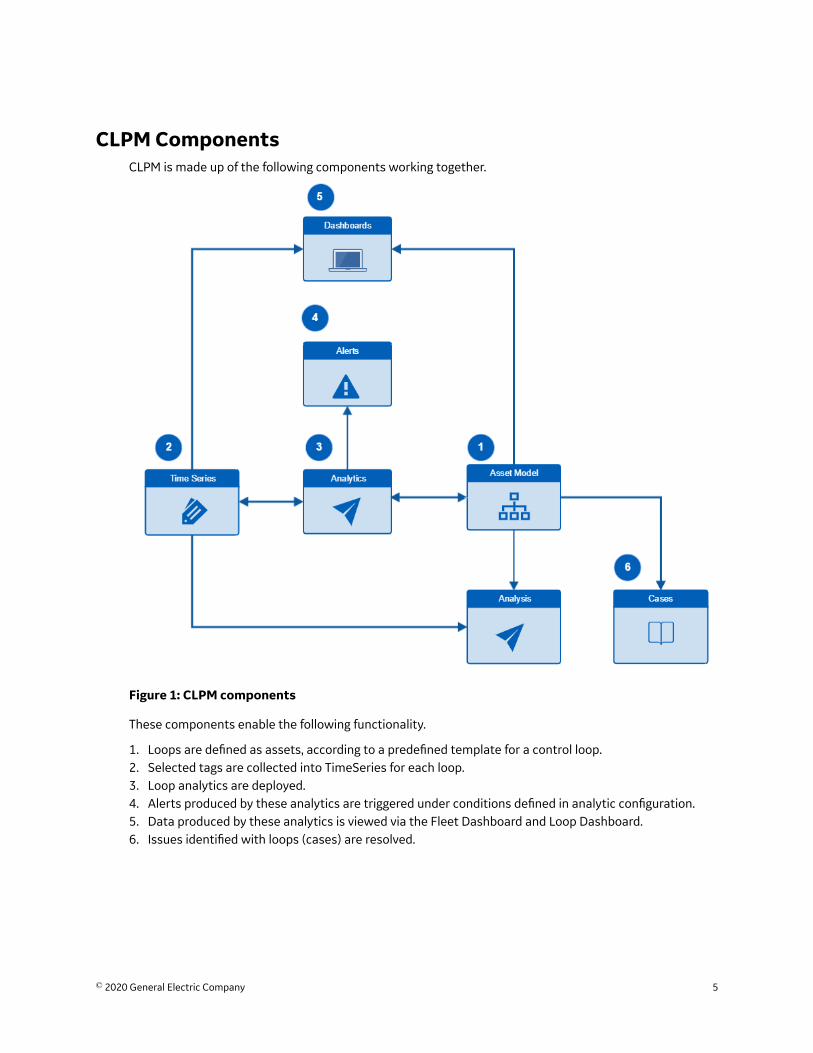
CLPM ComponentsCLPM is made up of the following components working together.
Figure 1: CLPM components
These components enable the following functionality.
1. Loops are defined as assets, according to a predefined template for a control loop.2. Selected tags are collected into TimeSeries for each loop.3. Loop analytics are deployed.4. Alerts produced by these analytics are triggered under conditions defined in analytic configuration.5. Data produced by these analytics is viewed via the Fleet Dashboard and Loop Dashboard.6. Issues identified with loops (cases) are resolved.
© 2020 General Electric Company 5
User Workflow in CLPMFollowing the CLPM workflow / process described below helps users monitor and optimize theperformance of an enterprise fleet of control loops. Underperforming control loops can be identified,prioritized, and optimized.
Figure 2: User workflow / process
1. The Fleet Dashboard
Use the Fleet Dashboard to rank the performance of all control loops contained in any level of anenterprise asset model (Enterprise, Segment, Site, etc.) over a specified time period. This helps inidentifying underperforming control loops and prioritizing them for optimization. Consult the FleetDashboard section of this documentation for details.
OR
1. Alerts
Alerts notify you about potential problems with control loops. Consult the section of this documentationon deploying CLPM analytics for details on analytics that trigger alerts and how to configure them.
2. The Loop Dashboard
Use the Loop Dashboard to visualize the performance of any individual control loop in detail over aspecified time period. This helps in assessing control loop performance and diagnosing potential causes ofsuboptimal performance. Consult the Loop Dashboard section of this documentation for details.
3. Loop KPI Analysis
Analyze the historical performance of loop KPIs over any historical time period to gain further insight.Loop KPIs can be assessed in relation to other loop KPIs or compared with the same loop KPIs calculatedusing other data and other tags available in Predix TimeSeries. Consult the KPI Reference for CLPM formore on loop KPIs.
6 © 2020 General Electric Company
4. Case Management
Action, collaborate on, and resolve any issues identified with control loops. Consult the ApplicationAnalytics documentation for details.
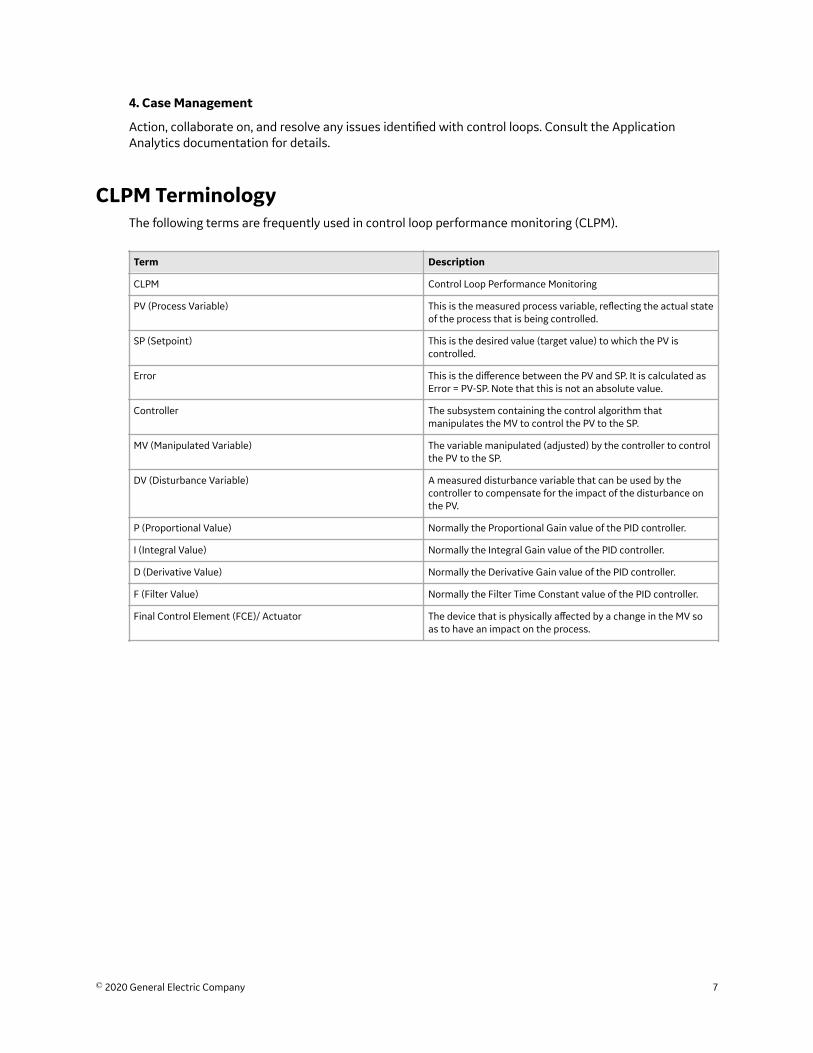
CLPM TerminologyThe following terms are frequently used in control loop performance monitoring (CLPM).
Term Description
CLPM Control Loop Performance Monitoring
PV (Process Variable) This is the measured process variable, reflecting the actual stateof the process that is being controlled.
SP (Setpoint) This is the desired value (target value) to which the PV iscontrolled.
Error This is the difference between the PV and SP. It is calculated asError = PV-SP. Note that this is not an absolute value.
Controller The subsystem containing the control algorithm thatmanipulates the MV to control the PV to the SP.
MV (Manipulated Variable) The variable manipulated (adjusted) by the controller to controlthe PV to the SP.
DV (Disturbance Variable) A measured disturbance variable that can be used by thecontroller to compensate for the impact of the disturbance onthe PV.
P (Proportional Value) Normally the Proportional Gain value of the PID controller.
I (Integral Value) Normally the Integral Gain value of the PID controller.
D (Derivative Value) Normally the Derivative Gain value of the PID controller.
F (Filter Value) Normally the Filter Time Constant value of the PID controller.
Final Control Element (FCE)/ Actuator The device that is physically affected by a change in the MV soas to have an impact on the process.
© 2020 General Electric Company 7
Chapter
2Get Started with CLPMTopics:
• Getting Started with CLPM• Prerequisites for CLPM• Define the Asset Model• Deploy Data Collection• Deploy CLPM Analytics• Access Loop and Fleet
Dashboards
8 © 2020 General Electric Company
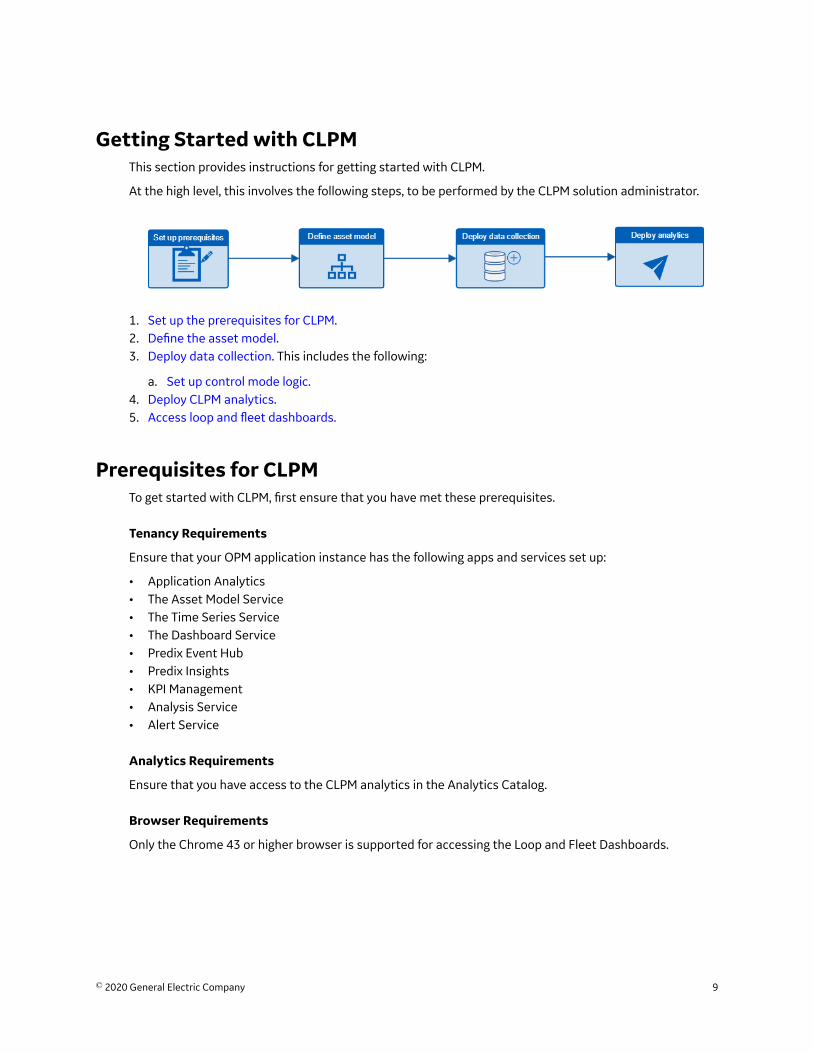
Getting Started with CLPMThis section provides instructions for getting started with CLPM.
At the high level, this involves the following steps, to be performed by the CLPM solution administrator.
1. Set up the prerequisites for CLPM.2. Define the asset model.3. Deploy data collection. This includes the following:
a. Set up control mode logic.4. Deploy CLPM analytics.5. Access loop and fleet dashboards.
Prerequisites for CLPMTo get started with CLPM, first ensure that you have met these prerequisites.
Tenancy Requirements
Ensure that your OPM application instance has the following apps and services set up:
• Application Analytics• The Asset Model Service• The Time Series Service• The Dashboard Service• Predix Event Hub• Predix Insights• KPI Management• Analysis Service• Alert Service
Analytics Requirements
Ensure that you have access to the CLPM analytics in the Analytics Catalog.
Browser Requirements
Only the Chrome 43 or higher browser is supported for accessing the Loop and Fleet Dashboards.
© 2020 General Electric Company 9
Define the Asset ModelConstruct the asset ingestion file required by Application Analytics and perform asset ingestion.
The asset ingestion files (there can be several files or they can be combined into one) are JSON files thatspecify customer assets and their hierarchical structure or asset model. In the context of CLPM, theassets in this file are control loops that together define an industrial control system.
The basic structure of the files is as outlined in the APM Assets documentation for asset ingestion.
In addition to the required attributes that are standard for all such files, files describing control loopassets require custom attributes defined in the Control Loop Asset Definition for CLPM that you need tospecify.
Note: It is important to ensure that your asset ingestion file conforms to the control loop asset definitionfor CLPM. If your file does not conform to this definition, CLPM will be unable to function correctly.
To define the asset model, carefully follow the instructions given with the Control Loop Asset Definitionfor CLPM.
Deploy Data CollectionCollect data into TimeSeries for all the analytic input tags as defined in your asset model. Therecommended rate for data collection is every 5 seconds or slower.
Once you have set up data collection, you are ready to set up control mode logic.
Set Up Control Mode LogicSet up control mode logic for CLPM by creating and deploying your Control Mode Analytic. Use the Pythonexample provided here to create a Predix Insights-based analytic.
What Is the Control Mode Analytic?
CLPM analytics require an input tag that describes the current control mode for each loop. The controlmode tag must contain values of type double and must be one of the following:
Tag Value Description
1 A tag value of 1 indicates a control loop that is currently
operating manually. The controller is not controlling the process.
2 A tag value of 2 indicates a control loop where the process is
currently being controlled by the controller.
3 A tag value of 3 indicates a controller that is currently set to
CASCADE.
4 A tag value of 4 indicates a process that is currently shut down.
Note: Most KPIs will not be calculated for this control mode.
CLPM provides an example Predix Insights analytic to get you started towards developing your owncontrol mode analytic. The resulting analytic will vary depending on your available data, but each controlmode analytic must produce a result that matches one of the tag values in the table above.
10 © 2020 General Electric Company
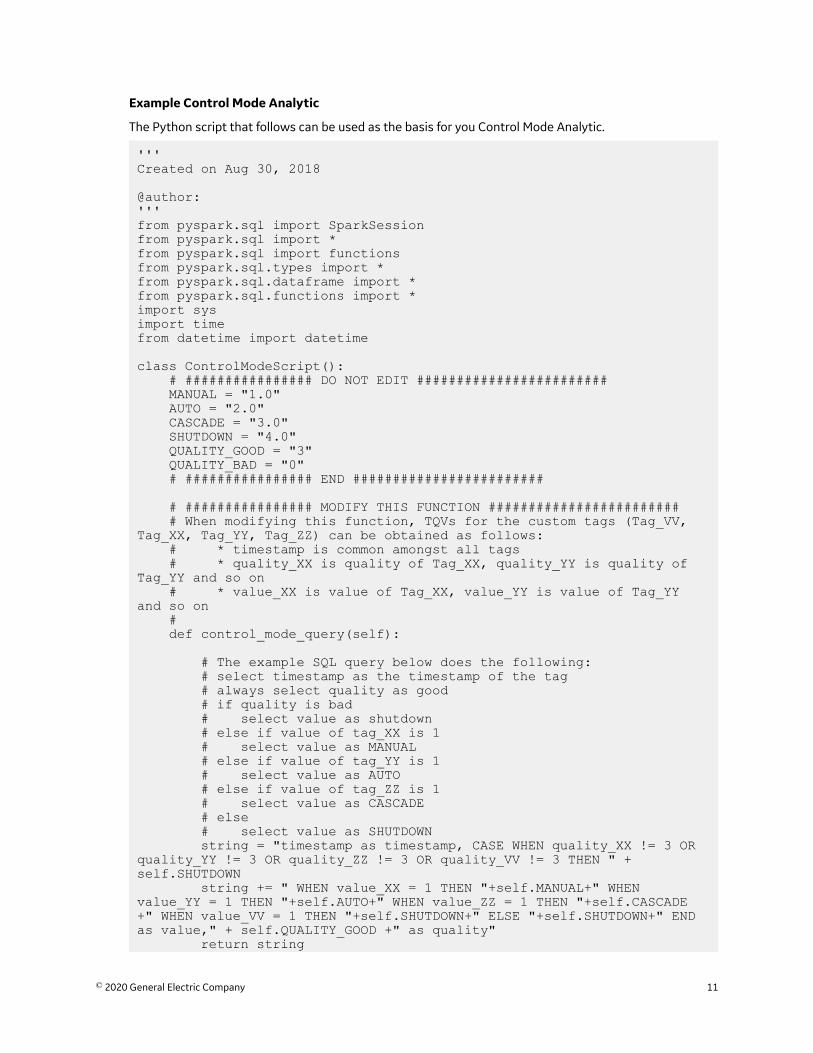
Example Control Mode Analytic
The Python script that follows can be used as the basis for you Control Mode Analytic.
'''Created on Aug 30, 2018
@author: '''from pyspark.sql import SparkSessionfrom pyspark.sql import *from pyspark.sql import functionsfrom pyspark.sql.types import *from pyspark.sql.dataframe import *from pyspark.sql.functions import *import sysimport timefrom datetime import datetime
class ControlModeScript(): # ################ DO NOT EDIT ######################## MANUAL = "1.0" AUTO = "2.0" CASCADE = "3.0" SHUTDOWN = "4.0" QUALITY_GOOD = "3" QUALITY_BAD = "0" # ################ END ######################## # ################ MODIFY THIS FUNCTION ######################## # When modifying this function, TQVs for the custom tags (Tag_VV, Tag_XX, Tag_YY, Tag_ZZ) can be obtained as follows: # * timestamp is common amongst all tags # * quality_XX is quality of Tag_XX, quality_YY is quality of Tag_YY and so on # * value_XX is value of Tag_XX, value_YY is value of Tag_YY and so on # def control_mode_query(self): # The example SQL query below does the following: # select timestamp as the timestamp of the tag # always select quality as good # if quality is bad # select value as shutdown # else if value of tag_XX is 1 # select value as MANUAL # else if value of tag_YY is 1 # select value as AUTO # else if value of tag_ZZ is 1 # select value as CASCADE # else # select value as SHUTDOWN string = "timestamp as timestamp, CASE WHEN quality_XX != 3 OR quality_YY != 3 OR quality_ZZ != 3 OR quality_VV != 3 THEN " + self.SHUTDOWN string += " WHEN value_XX = 1 THEN "+self.MANUAL+" WHEN value_YY = 1 THEN "+self.AUTO+" WHEN value_ZZ = 1 THEN "+self.CASCADE+" WHEN value_VV = 1 THEN "+self.SHUTDOWN+" ELSE "+self.SHUTDOWN+" END as value," + self.QUALITY_GOOD +" as quality" return string
© 2020 General Electric Company 11
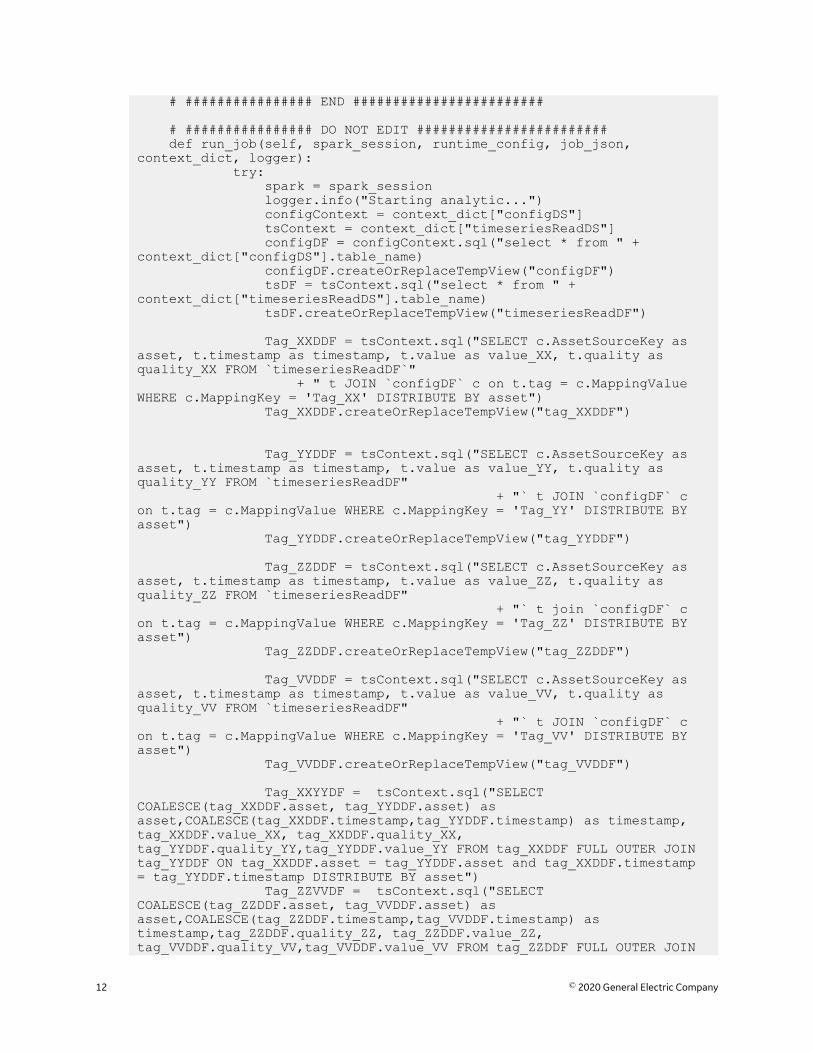
# ################ END ######################## # ################ DO NOT EDIT ######################## def run_job(self, spark_session, runtime_config, job_json, context_dict, logger): try: spark = spark_session logger.info("Starting analytic...") configContext = context_dict["configDS"] tsContext = context_dict["timeseriesReadDS"] configDF = configContext.sql("select * from " + context_dict["configDS"].table_name) configDF.createOrReplaceTempView("configDF") tsDF = tsContext.sql("select * from " + context_dict["timeseriesReadDS"].table_name) tsDF.createOrReplaceTempView("timeseriesReadDF") Tag_XXDDF = tsContext.sql("SELECT c.AssetSourceKey as asset, t.timestamp as timestamp, t.value as value_XX, t.quality as quality_XX FROM `timeseriesReadDF`" + " t JOIN `configDF` c on t.tag = c.MappingValue WHERE c.MappingKey = 'Tag_XX' DISTRIBUTE BY asset") Tag_XXDDF.createOrReplaceTempView("tag_XXDDF")
Tag_YYDDF = tsContext.sql("SELECT c.AssetSourceKey as asset, t.timestamp as timestamp, t.value as value_YY, t.quality as quality_YY FROM `timeseriesReadDF" + "` t JOIN `configDF` c on t.tag = c.MappingValue WHERE c.MappingKey = 'Tag_YY' DISTRIBUTE BY asset") Tag_YYDDF.createOrReplaceTempView("tag_YYDDF") Tag_ZZDDF = tsContext.sql("SELECT c.AssetSourceKey as asset, t.timestamp as timestamp, t.value as value_ZZ, t.quality as quality_ZZ FROM `timeseriesReadDF" + "` t join `configDF` c on t.tag = c.MappingValue WHERE c.MappingKey = 'Tag_ZZ' DISTRIBUTE BY asset") Tag_ZZDDF.createOrReplaceTempView("tag_ZZDDF") Tag_VVDDF = tsContext.sql("SELECT c.AssetSourceKey as asset, t.timestamp as timestamp, t.value as value_VV, t.quality as quality_VV FROM `timeseriesReadDF" + "` t JOIN `configDF` c on t.tag = c.MappingValue WHERE c.MappingKey = 'Tag_VV' DISTRIBUTE BY asset") Tag_VVDDF.createOrReplaceTempView("tag_VVDDF") Tag_XXYYDF = tsContext.sql("SELECT COALESCE(tag_XXDDF.asset, tag_YYDDF.asset) as asset,COALESCE(tag_XXDDF.timestamp,tag_YYDDF.timestamp) as timestamp, tag_XXDDF.value_XX, tag_XXDDF.quality_XX, tag_YYDDF.quality_YY,tag_YYDDF.value_YY FROM tag_XXDDF FULL OUTER JOIN tag_YYDDF ON tag_XXDDF.asset = tag_YYDDF.asset and tag_XXDDF.timestamp = tag_YYDDF.timestamp DISTRIBUTE BY asset") Tag_ZZVVDF = tsContext.sql("SELECT COALESCE(tag_ZZDDF.asset, tag_VVDDF.asset) as asset,COALESCE(tag_ZZDDF.timestamp,tag_VVDDF.timestamp) as timestamp,tag_ZZDDF.quality_ZZ, tag_ZZDDF.value_ZZ, tag_VVDDF.quality_VV,tag_VVDDF.value_VV FROM tag_ZZDDF FULL OUTER JOIN
12 © 2020 General Electric Company
tag_VVDDF ON tag_ZZDDF.asset = tag_VVDDF.asset and tag_ZZDDF.timestamp = tag_VVDDF.timestamp DISTRIBUTE BY asset") Tag_XXYYDF.createOrReplaceTempView("tag_XXYYDF") Tag_ZZVVDF.createOrReplaceTempView("tag_ZZVVDF") timeseriesDF = tsContext.sql("SELECT COALESCE(tag_XXYYDF.asset,tag_ZZVVDF.asset) as asset, COALESCE(tag_XXYYDF.timestamp,tag_ZZVVDF.timestamp) as timestamp, tag_XXYYDF.quality_XX, tag_XXYYDF.value_XX, tag_XXYYDF.quality_YY,tag_XXYYDF.value_YY, tag_ZZVVDF.quality_ZZ,tag_ZZVVDF.value_ZZ, tag_ZZVVDF.quality_VV,tag_ZZVVDF.value_VV FROM tag_XXYYDF FULL OUTER JOIN tag_ZZVVDF ON tag_XXYYDF.asset = tag_ZZVVDF.asset and tag_XXYYDF.timestamp = tag_ZZVVDF.timestamp") timeseriesDF.createOrReplaceTempView("collectedDS") queryString = "SELECT configDF.MappingValue as tag, " queryString += self.control_mode_query() queryString += " FROM `collectedDS` JOIN `configDF` on collectedDS.asset = configDF.assetSourceKey WHERE configDF.mappingType = 'OutputMappings'" resultDF = tsContext.sql(queryString) resultDF.createOrReplaceTempView("resultDF") timeseriesWriteDF = tsContext.sql("SELECT tag, timestamp, CAST((value) as double) as value, quality FROM `resultDF`") logger.info("Returning result...") result = {"timeseriesWriteDS" : timeseriesWriteDF} return result except Exception as e: print("ERROR RETURNED") logger.info("Error: " + str(e)) exc_tb = sys.exc_info()[2] logger.info("Line number: " + str(exc_tb.tb_lineno)) # ################ END ########################
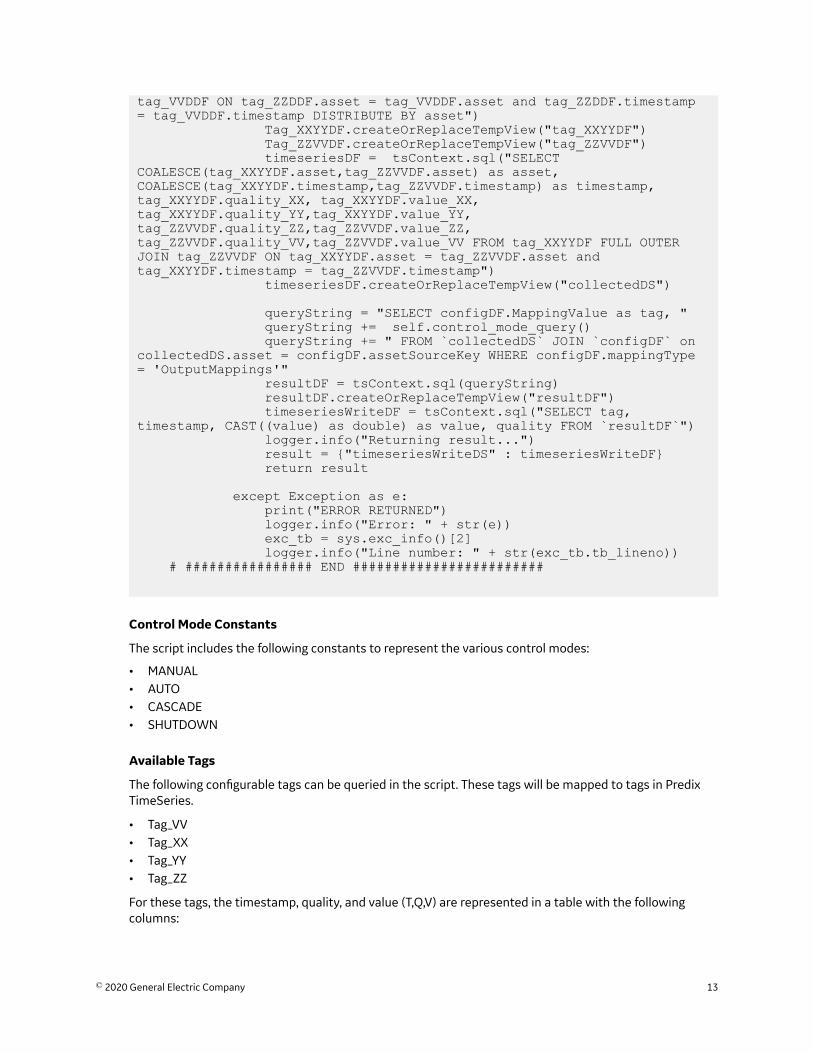
Control Mode Constants
The script includes the following constants to represent the various control modes:
• MANUAL• AUTO• CASCADE• SHUTDOWN
Available Tags
The following configurable tags can be queried in the script. These tags will be mapped to tags in PredixTimeSeries.
• Tag_VV• Tag_XX• Tag_YY• Tag_ZZ
For these tags, the timestamp, quality, and value (T,Q,V) are represented in a table with the followingcolumns:
© 2020 General Electric Company 13
Timestamp value_VV quality_VV value_XX quality_XX value_YY quality_YY value_ZZ quality_ZZ
Note: The timestamp is common among all these tags.
Example Query
The script includes the following example query:
def control_mode_query(self): string = "timestamp as timestamp, CASE WHEN quality_XX != 3 OR quality_YY != 3 OR quality_ZZ != 3 OR quality_VV != 3 THEN " + self.SHUTDOWN string += " WHEN value_XX = 1 THEN "+self.MANUAL+" WHEN value_YY = 1 THEN "+self.AUTO+" WHEN value_ZZ = 1 THEN "+self.CASCADE+" WHEN value_VV = 1 THEN "+self.SHUTDOWN+" ELSE "+self.SHUTDOWN+" END as value," + self.QUALITY_GOOD +" as quality" return string
The preceding query does the following:
1. Sets the control mode timestamp to the timestamp used by these tags.2. Sets the control mode quality to good.3. Sets the control mode value as follows:
a. If the quality of any of the tags is bad, sets the control mode value to SHUTDOWN.b. Else if the value of tag_XX is 1, sets the control mode value to MANUAL.c. Else if the value of tag_YY is 1, sets the control mode value to AUTO.d. Else if the value of tag_ZZ is 1, sets the control mode value to CASCADE.e. Else, sets the control mode value to SHUTDOWN.
You should create your own query, based on your own business needs.
Modify the Control Mode Analytic
Modify the control_mode_query() function in the Python script, building up a SQL string to queryone or more of the available tags and (based on the T,Q,V of these tags) to return a T,Q,V for the controlmode.
Note: You should modify ONLY the control_mode_query() function in this template. Do not modifyanything else in the template.
Note: You MUST use Tag_VV in your query. Using the other available tags in your query is optional.
Create Your Analytic Template
Once you have modified the Python script to include the control mode logic you require, do the following.
Procedure
1. For the Control Mode Template Analytic, create a Spark analytic called OPM-CLPM-Control_Mode,following the guidance given in the Spark and Application Analytics documentation.
2. Publish the analytic to the Analytics Catalog.3. Set up the input and output definitions as follows:
14 © 2020 General Electric Company
Table 1: INPUT DEFINITION: TAGS
Name Type Required
Tag_VV Double Yes
Tag_XX Double No
Tag_YY Double No
Tag_ZZ Double No
Note: For each of the tags used in your Control Mode Analytic, ensure that you specify thecorresponding tag as Required in the input definition.
Table 2: OUTPUT DEFINITION: TAGS
Name Type Required
Control Mode Double Yes
Next Steps
Now that you have set up the control mode logic, you are ready to deploy the CLPM analytics.
Deploy CLPM AnalyticsDeploy each of the CLPM analytics as described in this section.
Overview of CLPM Analytics
The following specialized analytics are provided with CLPM, and these are used for data collection andtransformation.
Table 3: CLPM Analytics
Analytic Name Use Location
OPM-CLPM-Control_Mode Operates on scheduled data and contains
the control mode logic.
Will be in your Analytics Catalog if you
have correctly performed the step to Set
Up Control Mode Logic.
OPM-CLPM-PV_Statistics Scheduled and produces the following
KPIs based on the incoming data:
• PV Error
• Lower SP Threshold
• Upper SP Threshold
Consult the KPI Reference for details on
the KPIs produced by this analytic.
Located in your Analytics Catalog. If you
do not find it there, contact your tenant
administrator.
OPM-CLPM-Performance Scheduled and produces a set of
performance KPIs based on the incoming
data.
Consult the KPI Reference for details on
the KPIs produced by this analytic.
Located in your Analytics Catalog. If you
do not find it there, contact your tenant
administrator.
© 2020 General Electric Company 15
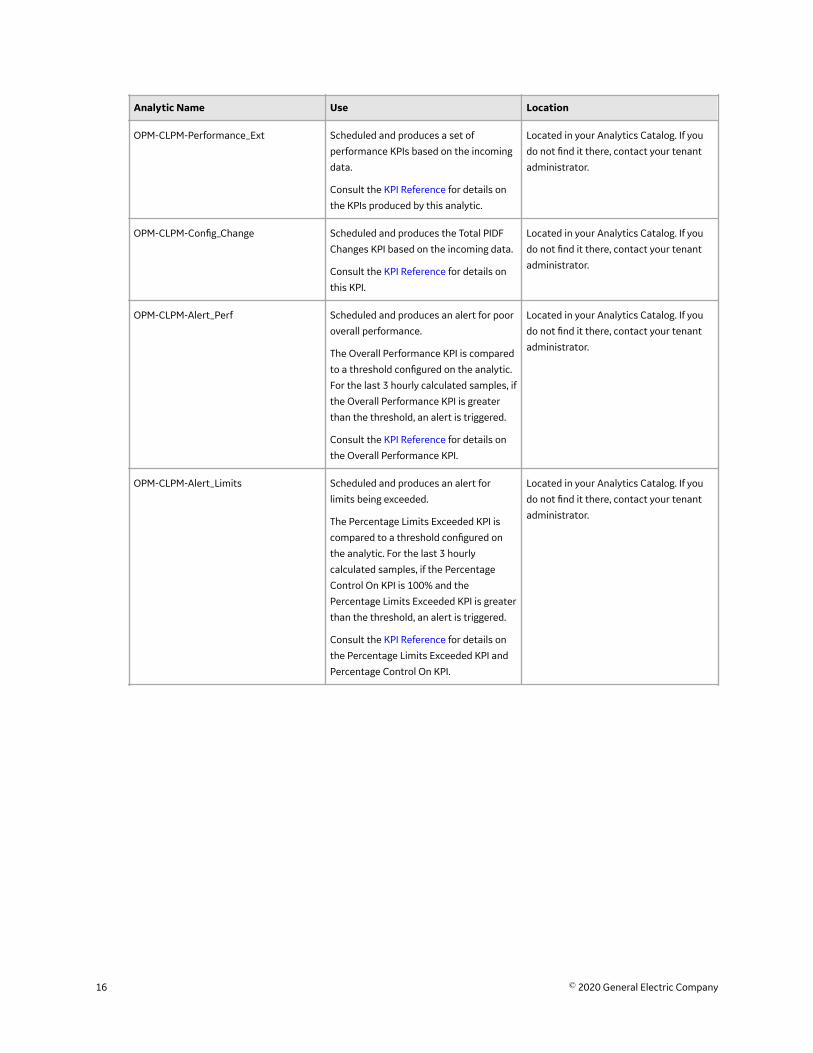
Analytic Name Use Location
OPM-CLPM-Performance_Ext Scheduled and produces a set of
performance KPIs based on the incoming
data.
Consult the KPI Reference for details on
the KPIs produced by this analytic.
Located in your Analytics Catalog. If you
do not find it there, contact your tenant
administrator.
OPM-CLPM-Config_Change Scheduled and produces the Total PIDF
Changes KPI based on the incoming data.
Consult the KPI Reference for details on
this KPI.
Located in your Analytics Catalog. If you
do not find it there, contact your tenant
administrator.
OPM-CLPM-Alert_Perf Scheduled and produces an alert for poor
overall performance.
The Overall Performance KPI is compared
to a threshold configured on the analytic.
For the last 3 hourly calculated samples, if
the Overall Performance KPI is greater
than the threshold, an alert is triggered.
Consult the KPI Reference for details on
the Overall Performance KPI.
Located in your Analytics Catalog. If you
do not find it there, contact your tenant
administrator.
OPM-CLPM-Alert_Limits Scheduled and produces an alert for
limits being exceeded.
The Percentage Limits Exceeded KPI is
compared to a threshold configured on
the analytic. For the last 3 hourly
calculated samples, if the Percentage
Control On KPI is 100% and the
Percentage Limits Exceeded KPI is greater
than the threshold, an alert is triggered.
Consult the KPI Reference for details on
the Percentage Limits Exceeded KPI and
Percentage Control On KPI.
Located in your Analytics Catalog. If you
do not find it there, contact your tenant
administrator.
16 © 2020 General Electric Company
Analytic Name Use Location
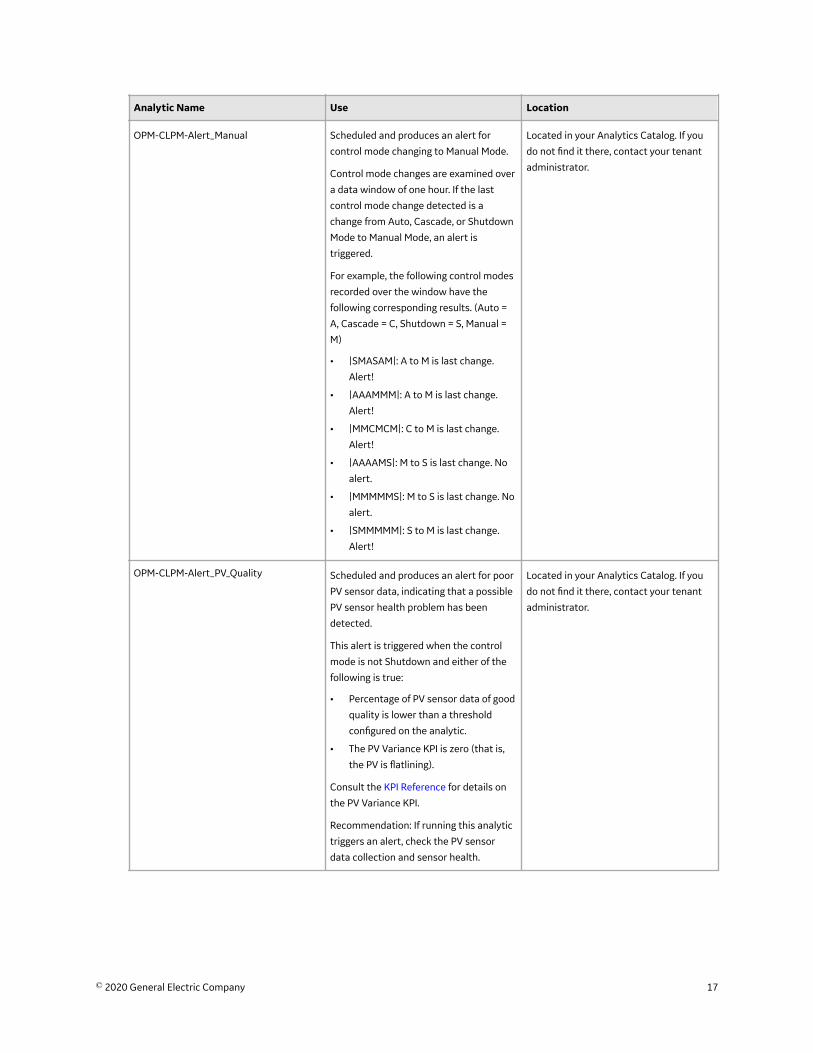
OPM-CLPM-Alert_Manual Scheduled and produces an alert for
control mode changing to Manual Mode.
Control mode changes are examined over
a data window of one hour. If the last
control mode change detected is a
change from Auto, Cascade, or Shutdown
Mode to Manual Mode, an alert is
triggered.
For example, the following control modes
recorded over the window have the
following corresponding results. (Auto =
A, Cascade = C, Shutdown = S, Manual =
M)
• |SMASAM|: A to M is last change.
Alert!
• |AAAMMM|: A to M is last change.
Alert!
• |MMCMCM|: C to M is last change.
Alert!
• |AAAAMS|: M to S is last change. No
alert.
• |MMMMMS|: M to S is last change. No
alert.
• |SMMMMM|: S to M is last change.
Alert!
Located in your Analytics Catalog. If you
do not find it there, contact your tenant
administrator.
OPM-CLPM-Alert_PV_Quality Scheduled and produces an alert for poor
PV sensor data, indicating that a possible
PV sensor health problem has been
detected.
This alert is triggered when the control
mode is not Shutdown and either of the
following is true:
• Percentage of PV sensor data of good
quality is lower than a threshold
configured on the analytic.
• The PV Variance KPI is zero (that is,
the PV is flatlining).
Consult the KPI Reference for details on
the PV Variance KPI.
Recommendation: If running this analytic
triggers an alert, check the PV sensor
data collection and sensor health.
Located in your Analytics Catalog. If you
do not find it there, contact your tenant
administrator.
© 2020 General Electric Company 17
Analytic Name Use Location
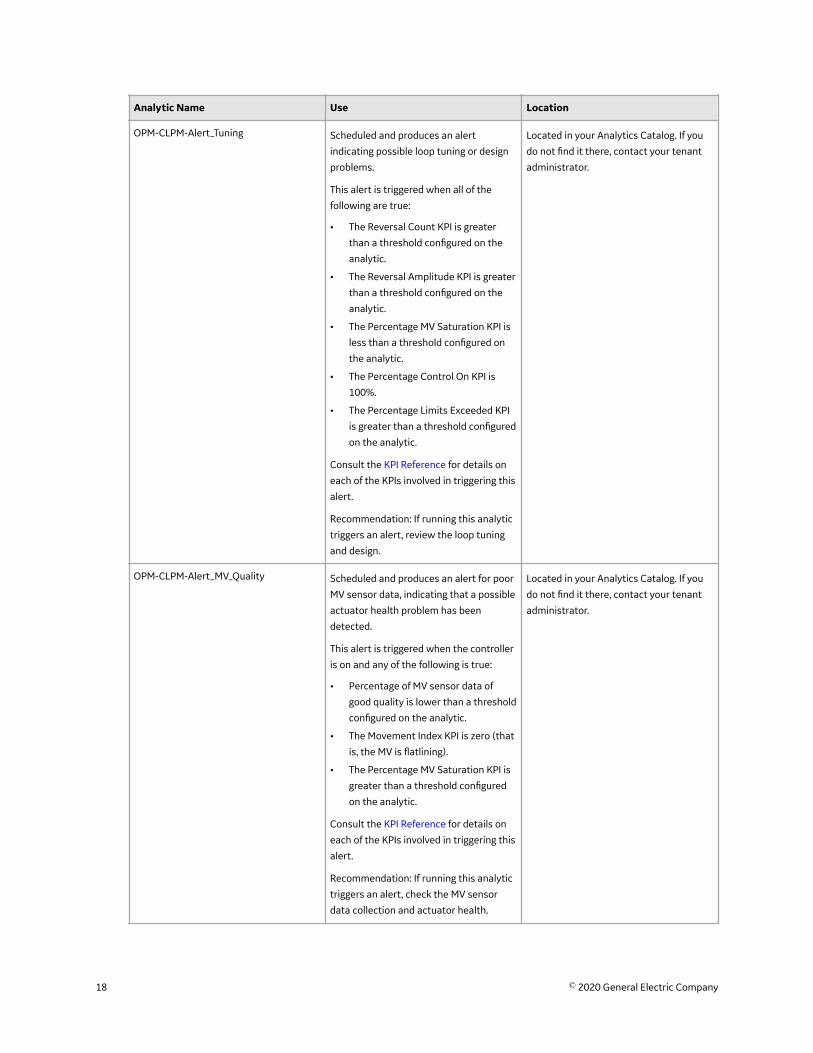
OPM-CLPM-Alert_Tuning Scheduled and produces an alert
indicating possible loop tuning or design
problems.
This alert is triggered when all of the
following are true:
• The Reversal Count KPI is greater
than a threshold configured on the
analytic.
• The Reversal Amplitude KPI is greater
than a threshold configured on the
analytic.
• The Percentage MV Saturation KPI is
less than a threshold configured on
the analytic.
• The Percentage Control On KPI is
100%.
• The Percentage Limits Exceeded KPI
is greater than a threshold configured
on the analytic.
Consult the KPI Reference for details on
each of the KPIs involved in triggering this
alert.
Recommendation: If running this analytic
triggers an alert, review the loop tuning
and design.
Located in your Analytics Catalog. If you
do not find it there, contact your tenant
administrator.
OPM-CLPM-Alert_MV_Quality Scheduled and produces an alert for poor
MV sensor data, indicating that a possible
actuator health problem has been
detected.
This alert is triggered when the controller
is on and any of the following is true:
• Percentage of MV sensor data of
good quality is lower than a threshold
configured on the analytic.
• The Movement Index KPI is zero (that
is, the MV is flatlining).
• The Percentage MV Saturation KPI is
greater than a threshold configured
on the analytic.
Consult the KPI Reference for details on
each of the KPIs involved in triggering this
alert.
Recommendation: If running this analytic
triggers an alert, check the MV sensor
data collection and actuator health.
Located in your Analytics Catalog. If you
do not find it there, contact your tenant
administrator.
18 © 2020 General Electric Company
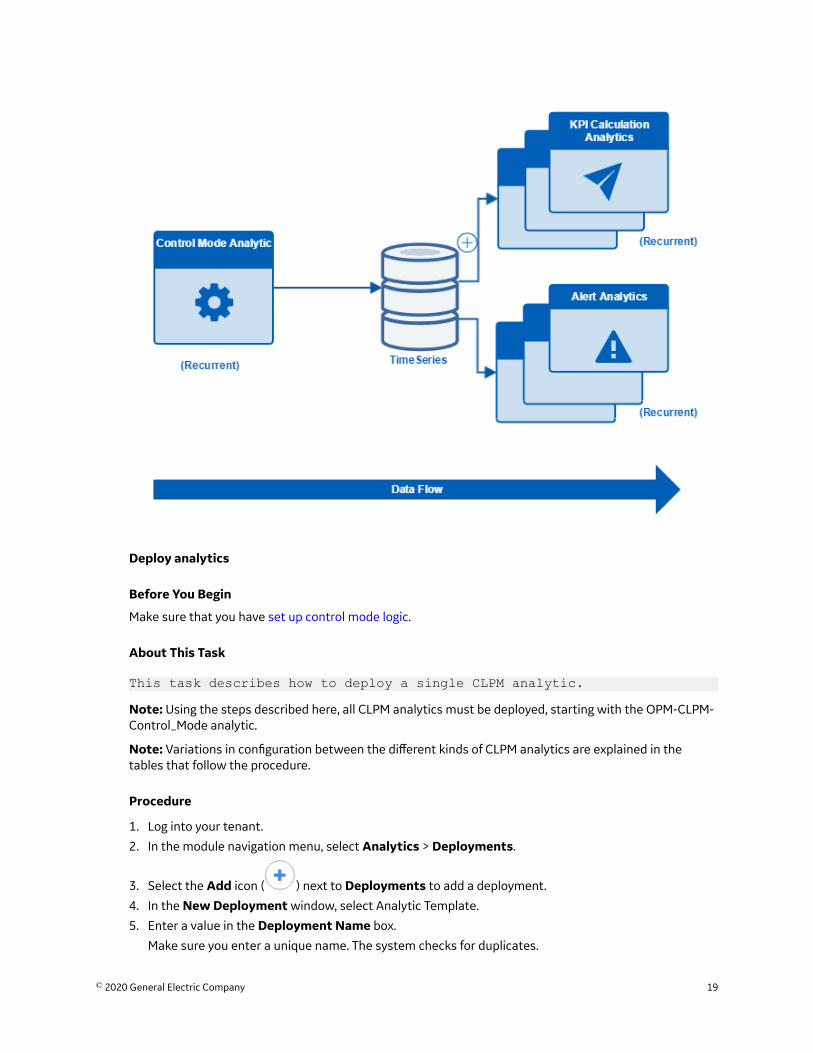
Deploy analytics
Before You Begin
Make sure that you have set up control mode logic.
About This Task
This task describes how to deploy a single CLPM analytic.Note: Using the steps described here, all CLPM analytics must be deployed, starting with the OPM-CLPM-Control_Mode analytic.
Note: Variations in configuration between the different kinds of CLPM analytics are explained in thetables that follow the procedure.
Procedure
1. Log into your tenant.
2. In the module navigation menu, select Analytics > Deployments.
3. Select the Add icon ( ) next to Deployments to add a deployment.
4. In the New Deployment window, select Analytic Template.
5. Enter a value in the Deployment Name box.
Make sure you enter a unique name. The system checks for duplicates.
© 2020 General Electric Company 19
The Author box will be pre-populated with your login name and cannot be modified.6. Enter a value in the Template Name box for the particular CLPM Analytic. All CLPM analytics start
with OPM-CLPM-...
This field is pre-populated to autocomplete with all matching options for the template name youspecify. You cannot modify any of these names; you must select one of them.
7. Step through the deployment wizard, in the same way you would for other kinds of analytics. Refer tothe APM Analytics documentation for details on how to map analytic inputs and outputs to tags. ForCLPM analytic configuration, it is important to adhere to the CLPM-specific guidance in the tables thatfollow.
8. Select Deploy.
CLPM Analytic ConfigurationThese tables give a configuration reference for the different types of CLPM analytics.
• OPM-CLPM-Control_Mode• KPI analytics (share common configuration)
◦ OPM-CLPM-Performance◦ OPM-CLPM-Performance_Ext◦ OPM-CLPM-PV_Statistics
• KPI analytic: OPM-CLPM-Config_Change• Alert analytic: OPM-CLPM-Alert_Perf• Alert analytic: OPM-CLPM-Alert_Limits• Alert analytic: OPM-CLPM-Alert_Manual• Alert analytic: OPM-CLPM-Alert_PV_Quality• Alert analytic: OPM-CLPM-Alert_Tuning• Alert analytic: OPM-CLPM-Alert_MV_Quality
20 © 2020 General Electric Company
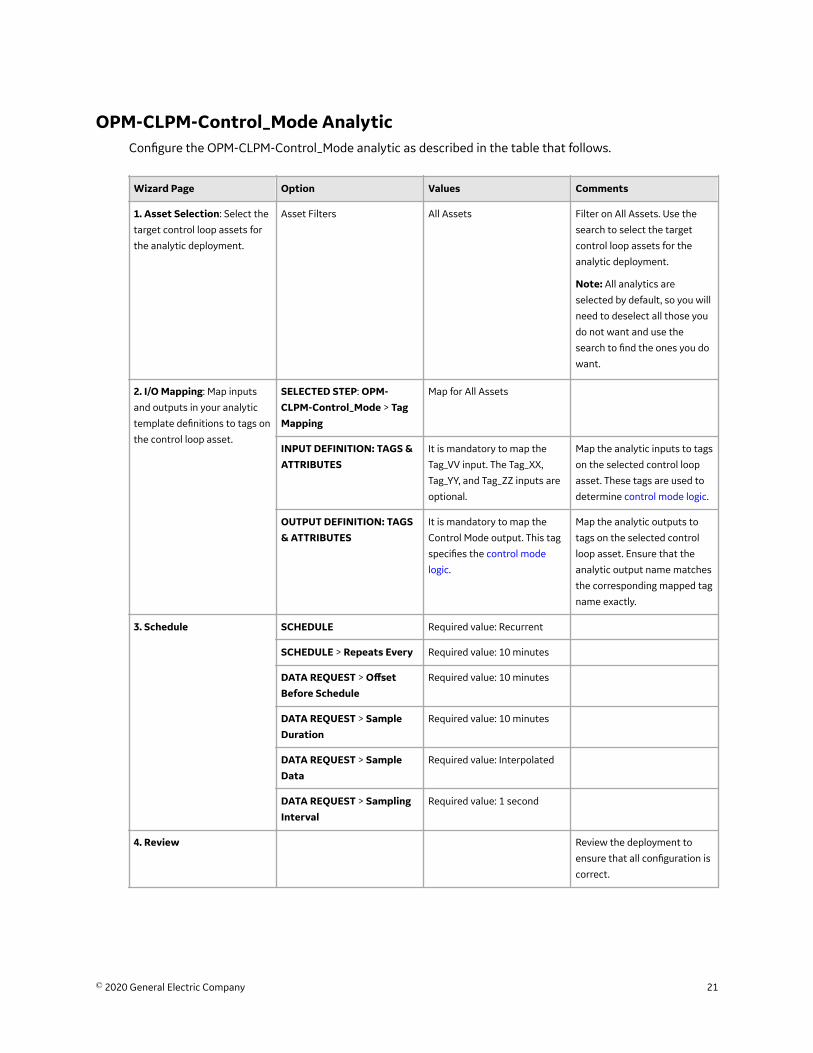
OPM-CLPM-Control_Mode AnalyticConfigure the OPM-CLPM-Control_Mode analytic as described in the table that follows.
Wizard Page Option Values Comments
1. Asset Selection: Select the
target control loop assets for
the analytic deployment.
Asset Filters All Assets Filter on All Assets. Use the
search to select the target
control loop assets for the
analytic deployment.
Note: All analytics are
selected by default, so you will
need to deselect all those you
do not want and use the
search to find the ones you do
want.
2. I/O Mapping: Map inputs
and outputs in your analytic
template definitions to tags on
the control loop asset.
SELECTED STEP: OPM-CLPM-Control_Mode > TagMapping
Map for All Assets
INPUT DEFINITION: TAGS &ATTRIBUTES
It is mandatory to map the
Tag_VV input. The Tag_XX,
Tag_YY, and Tag_ZZ inputs are
optional.
Map the analytic inputs to tags
on the selected control loop
asset. These tags are used to
determine control mode logic.
OUTPUT DEFINITION: TAGS& ATTRIBUTES
It is mandatory to map the
Control Mode output. This tag
specifies the control mode
logic.
Map the analytic outputs to
tags on the selected control
loop asset. Ensure that the
analytic output name matches
the corresponding mapped tag
name exactly.
3. Schedule SCHEDULE Required value: Recurrent
SCHEDULE > Repeats Every Required value: 10 minutes
DATA REQUEST > OffsetBefore Schedule
Required value: 10 minutes
DATA REQUEST > SampleDuration
Required value: 10 minutes
DATA REQUEST > SampleData
Required value: Interpolated
DATA REQUEST > SamplingInterval
Required value: 1 second
4. Review Review the deployment to
ensure that all configuration is
correct.
© 2020 General Electric Company 21
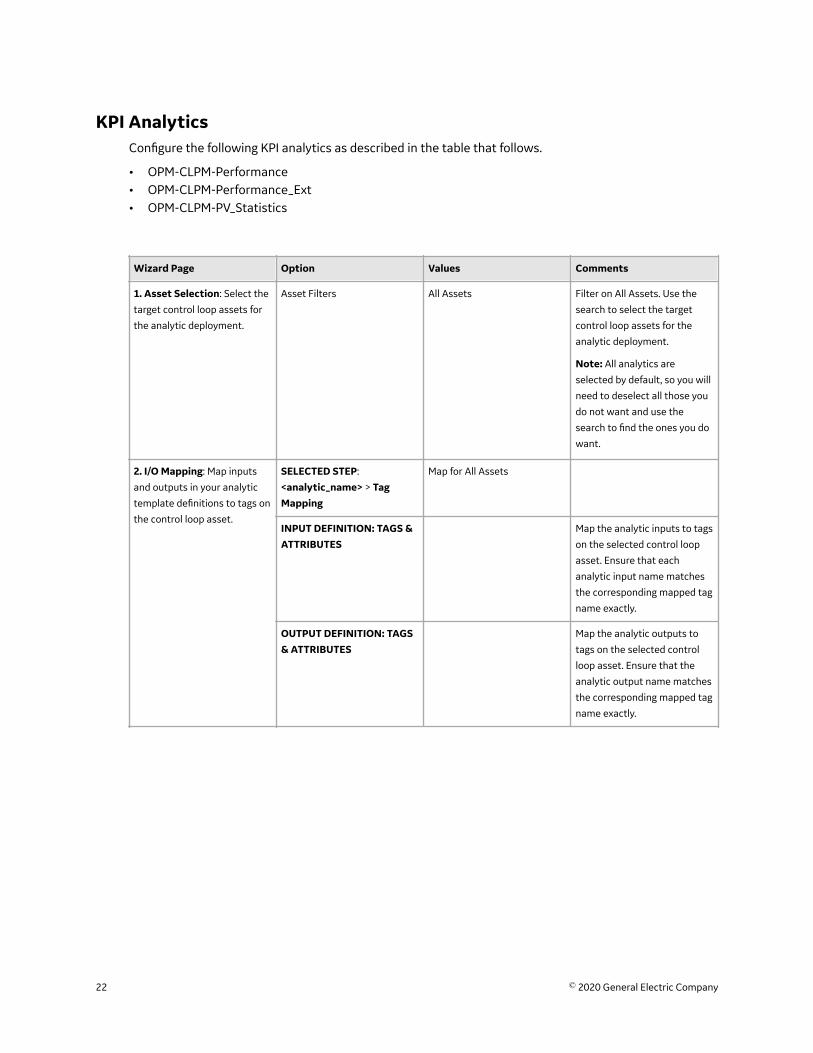
KPI AnalyticsConfigure the following KPI analytics as described in the table that follows.
• OPM-CLPM-Performance• OPM-CLPM-Performance_Ext• OPM-CLPM-PV_Statistics
Wizard Page Option Values Comments
1. Asset Selection: Select the
target control loop assets for
the analytic deployment.
Asset Filters All Assets Filter on All Assets. Use the
search to select the target
control loop assets for the
analytic deployment.
Note: All analytics are
selected by default, so you will
need to deselect all those you
do not want and use the
search to find the ones you do
want.
2. I/O Mapping: Map inputs
and outputs in your analytic
template definitions to tags on
the control loop asset.
SELECTED STEP:
<analytic_name> > TagMapping
Map for All Assets
INPUT DEFINITION: TAGS &ATTRIBUTES
Map the analytic inputs to tags
on the selected control loop
asset. Ensure that each
analytic input name matches
the corresponding mapped tag
name exactly.
OUTPUT DEFINITION: TAGS& ATTRIBUTES
Map the analytic outputs to
tags on the selected control
loop asset. Ensure that the
analytic output name matches
the corresponding mapped tag
name exactly.
22 © 2020 General Electric Company
Wizard Page Option Values Comments
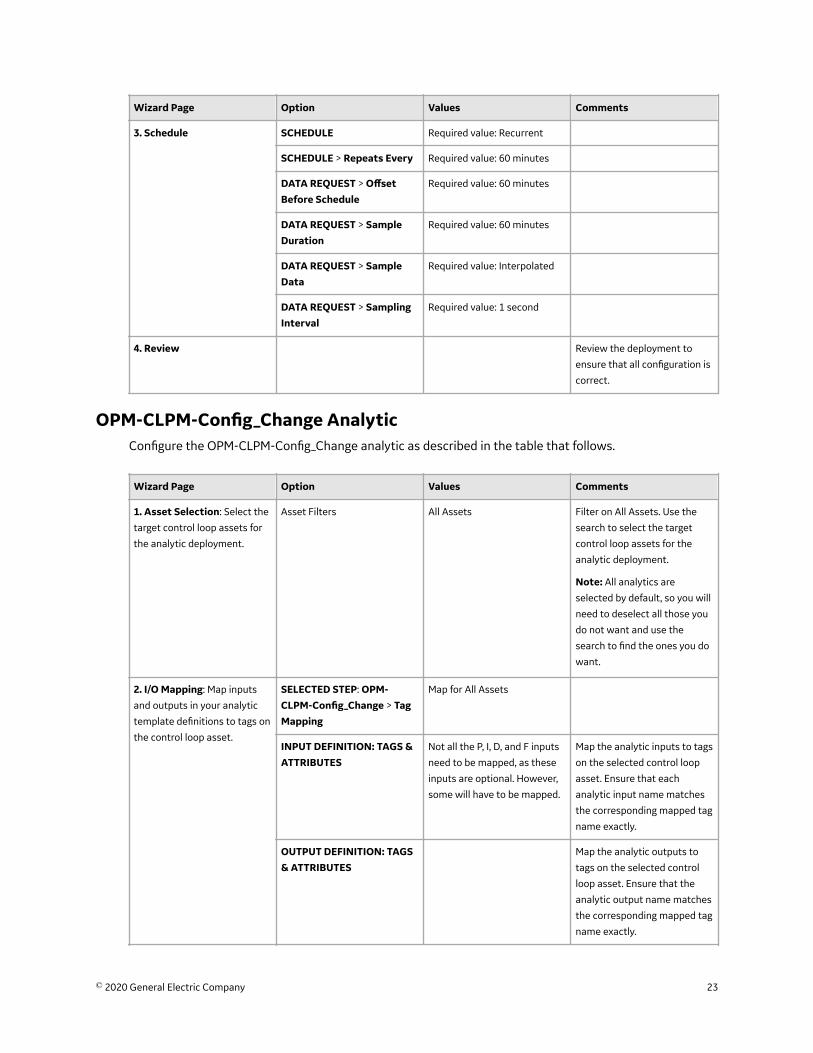
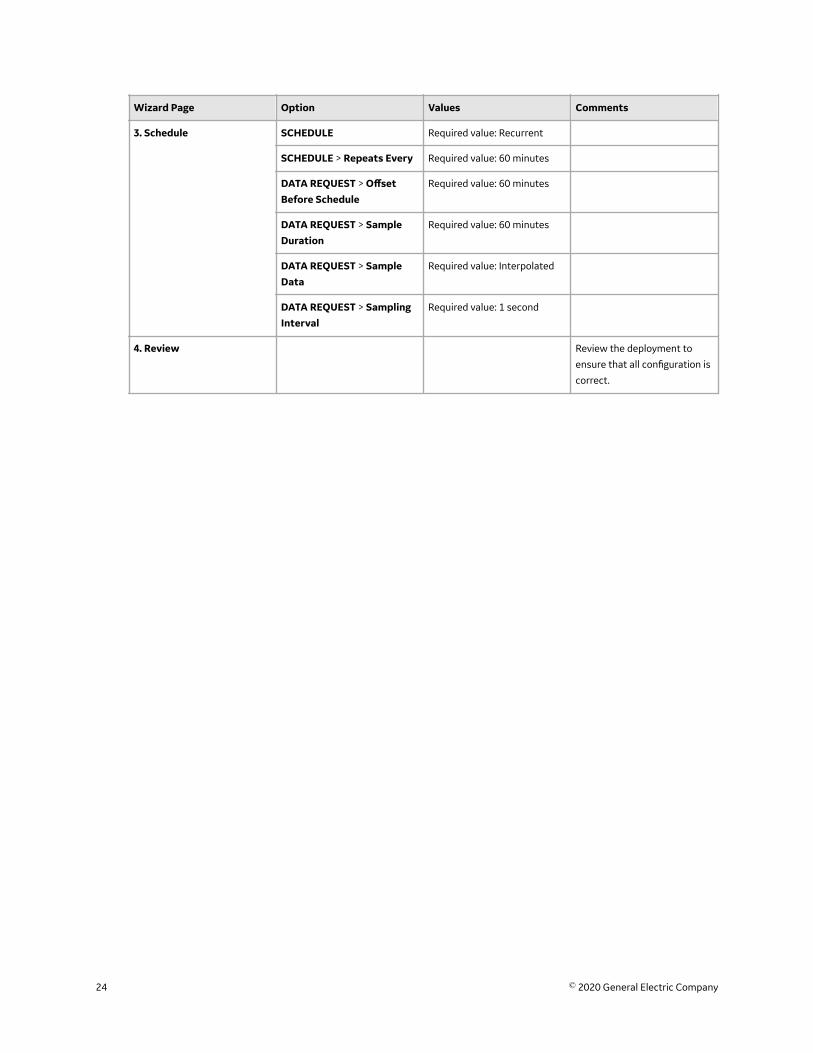
3. Schedule SCHEDULE Required value: Recurrent
SCHEDULE > Repeats Every Required value: 60 minutes
DATA REQUEST > OffsetBefore Schedule
Required value: 60 minutes
DATA REQUEST > SampleDuration
Required value: 60 minutes
DATA REQUEST > SampleData
Required value: Interpolated
DATA REQUEST > SamplingInterval
Required value: 1 second
4. Review Review the deployment to
ensure that all configuration is
correct.
OPM-CLPM-Config_Change AnalyticConfigure the OPM-CLPM-Config_Change analytic as described in the table that follows.
Wizard Page Option Values Comments
1. Asset Selection: Select the
target control loop assets for
the analytic deployment.
Asset Filters All Assets Filter on All Assets. Use the
search to select the target
control loop assets for the
analytic deployment.
Note: All analytics are
selected by default, so you will
need to deselect all those you
do not want and use the
search to find the ones you do
want.
2. I/O Mapping: Map inputs
and outputs in your analytic
template definitions to tags on
the control loop asset.
SELECTED STEP: OPM-CLPM-Config_Change > TagMapping
Map for All Assets
INPUT DEFINITION: TAGS &ATTRIBUTES
Not all the P, I, D, and F inputs
need to be mapped, as these
inputs are optional. However,
some will have to be mapped.
Map the analytic inputs to tags
on the selected control loop
asset. Ensure that each
analytic input name matches
the corresponding mapped tag
name exactly.
OUTPUT DEFINITION: TAGS& ATTRIBUTES
Map the analytic outputs to
tags on the selected control
loop asset. Ensure that the
analytic output name matches
the corresponding mapped tag
name exactly.
© 2020 General Electric Company 23
Wizard Page Option Values Comments
3. Schedule SCHEDULE Required value: Recurrent
SCHEDULE > Repeats Every Required value: 60 minutes
DATA REQUEST > OffsetBefore Schedule
Required value: 60 minutes
DATA REQUEST > SampleDuration
Required value: 60 minutes
DATA REQUEST > SampleData
Required value: Interpolated
DATA REQUEST > SamplingInterval
Required value: 1 second
4. Review Review the deployment to
ensure that all configuration is
correct.
24 © 2020 General Electric Company
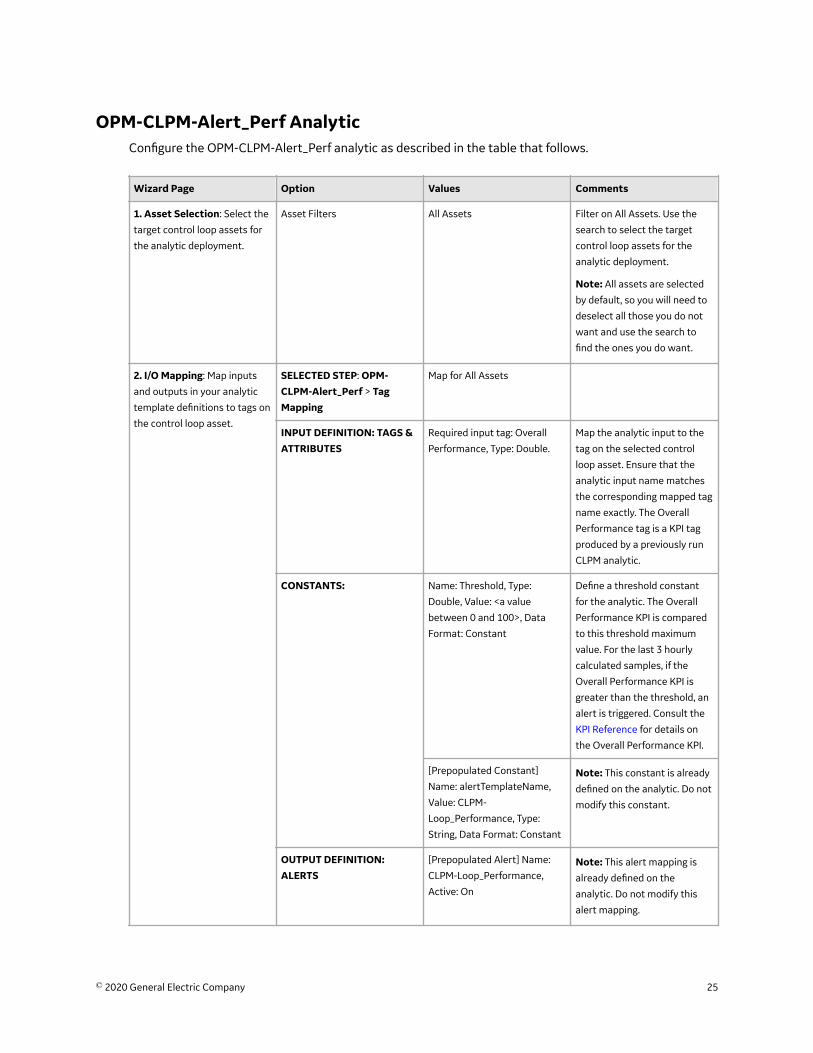
OPM-CLPM-Alert_Perf AnalyticConfigure the OPM-CLPM-Alert_Perf analytic as described in the table that follows.
Wizard Page Option Values Comments
1. Asset Selection: Select the
target control loop assets for
the analytic deployment.
Asset Filters All Assets Filter on All Assets. Use the
search to select the target
control loop assets for the
analytic deployment.
Note: All assets are selected
by default, so you will need to
deselect all those you do not
want and use the search to
find the ones you do want.
2. I/O Mapping: Map inputs
and outputs in your analytic
template definitions to tags on
the control loop asset.
SELECTED STEP: OPM-CLPM-Alert_Perf > TagMapping
Map for All Assets
INPUT DEFINITION: TAGS &ATTRIBUTES
Required input tag: Overall
Performance, Type: Double.
Map the analytic input to the
tag on the selected control
loop asset. Ensure that the
analytic input name matches
the corresponding mapped tag
name exactly. The Overall
Performance tag is a KPI tag
produced by a previously run
CLPM analytic.
CONSTANTS: Name: Threshold, Type:
Double, Value: <a value
between 0 and 100>, Data
Format: Constant
Define a threshold constant
for the analytic. The Overall
Performance KPI is compared
to this threshold maximum
value. For the last 3 hourly
calculated samples, if the
Overall Performance KPI is
greater than the threshold, an
alert is triggered. Consult the
KPI Reference for details on
the Overall Performance KPI.
[Prepopulated Constant]
Name: alertTemplateName,
Value: CLPM-
Loop_Performance, Type:
String, Data Format: Constant
Note: This constant is already
defined on the analytic. Do not
modify this constant.
OUTPUT DEFINITION:ALERTS
[Prepopulated Alert] Name:
CLPM-Loop_Performance,
Active: On
Note: This alert mapping is
already defined on the
analytic. Do not modify this
alert mapping.
© 2020 General Electric Company 25

Wizard Page Option Values Comments
3. Schedule SCHEDULE Required value: Recurrent
SCHEDULE > Repeats Every Required value: 60 minutes
DATA REQUEST > OffsetBefore Schedule
Required value: 60 minutes
DATA REQUEST > SampleDuration
Required value: 180 minutes
DATA REQUEST > SampleData
Required value: Interpolated
DATA REQUEST > SamplingInterval
Required value: 1 hour
4. Review Review the deployment to
ensure that all configuration is
correct.
26 © 2020 General Electric Company

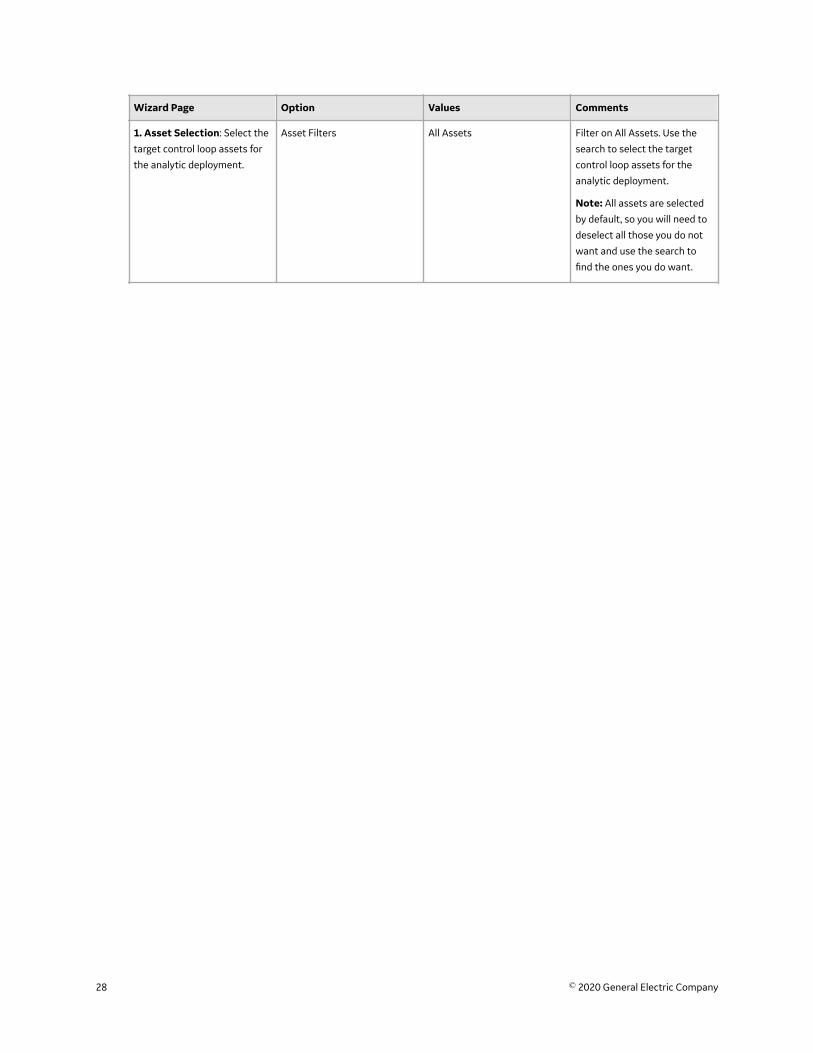
OPM-CLPM-Alert_Limits AnalyticConfigure the OPM-CLPM-Alert_Limits analytic as described in the table that follows.
© 2020 General Electric Company 27
Wizard Page Option Values Comments
1. Asset Selection: Select the
target control loop assets for
the analytic deployment.
Asset Filters All Assets Filter on All Assets. Use the
search to select the target
control loop assets for the
analytic deployment.
Note: All assets are selected
by default, so you will need to
deselect all those you do not
want and use the search to
find the ones you do want.
28 © 2020 General Electric Company
Wizard Page Option Values Comments
2. I/O Mapping: Map inputs
and outputs in your analytic
template definitions to tags on
the control loop asset.
SELECTED STEP: OPM-CLPM-Alert_Limits > TagMapping
Map for All Assets
INPUT DEFINITION: TAGS &ATTRIBUTES
Required input tag: Percentage
Limits Exceeded, Type: Double.
Map the analytic input to the
tag on the selected control
loop asset. Ensure that the
analytic input name matches
the corresponding mapped tag
name exactly. The Percentage
Limits Exceeded tag is a KPI
tag produced by a previously
run CLPM analytic.
Required input tag: Percentage
Control On, Type: Double.
Map the analytic input to the
tag on the selected control
loop asset. Ensure that the
analytic input name matches
the corresponding mapped tag
name exactly. The Percentage
Control On tag is a KPI tag
produced by a previously run
CLPM analytic.
CONSTANTS: Name: Threshold, Type:
Double, Value: <a value
between 0 and 100>, Data
Format: Constant
Define a threshold constant
for the analytic. The
Percentage Limits Exceeded
KPI is compared to this
threshold maximum value. For
the last 3 hourly calculated
samples, if the Percentage
Control On KPI is 100% and
the Percentage Limits
Exceeded KPI is greater than
this threshold, an alert is
triggered. Consult the KPI
Reference for details on the
Percentage Limits Exceeded
KPI.
[Prepopulated Constant]
Name: alertTemplateName,
Value: CLPM-Limits_Exceeded,
Type: String, Data Format:
Constant
Note: This constant is already
defined on the analytic. Do not
modify this constant.
OUTPUT DEFINITION:ALERTS
[Prepopulated Alert] Name:
CLPM-Limits_Exceeded,
Active: On
Note: This alert mapping is
already defined on the
analytic. Do not modify this
alert mapping.
© 2020 General Electric Company 29

Wizard Page Option Values Comments
3. Schedule SCHEDULE Required value: Recurrent
SCHEDULE > Repeats Every Required value: 60 minutes
DATA REQUEST > OffsetBefore Schedule
Required value: 60 minutes
DATA REQUEST > SampleDuration
Required value: 180 minutes
DATA REQUEST > SampleData
Required value: Interpolated
DATA REQUEST > SamplingInterval
Required value: 1 hour
4. Review Review the deployment to
ensure that all configuration is
correct.
30 © 2020 General Electric Company
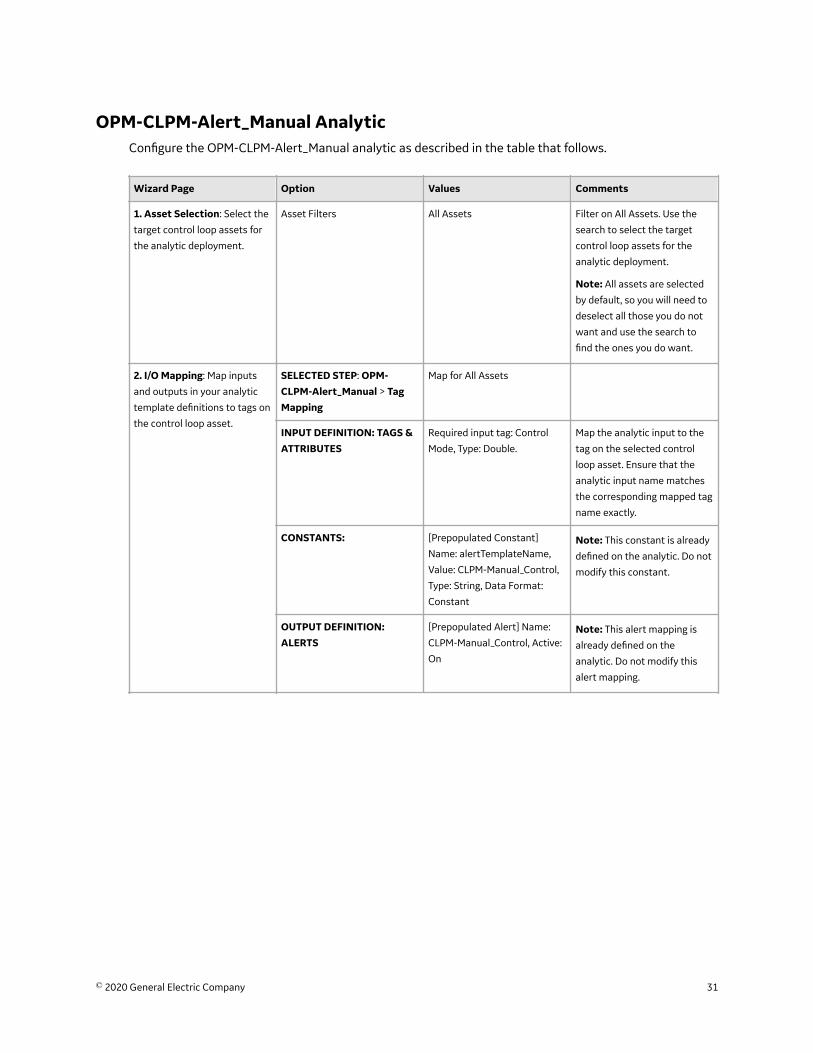
OPM-CLPM-Alert_Manual AnalyticConfigure the OPM-CLPM-Alert_Manual analytic as described in the table that follows.
Wizard Page Option Values Comments
1. Asset Selection: Select the
target control loop assets for
the analytic deployment.
Asset Filters All Assets Filter on All Assets. Use the
search to select the target
control loop assets for the
analytic deployment.
Note: All assets are selected
by default, so you will need to
deselect all those you do not
want and use the search to
find the ones you do want.
2. I/O Mapping: Map inputs
and outputs in your analytic
template definitions to tags on
the control loop asset.
SELECTED STEP: OPM-CLPM-Alert_Manual > TagMapping
Map for All Assets
INPUT DEFINITION: TAGS &ATTRIBUTES
Required input tag: Control
Mode, Type: Double.
Map the analytic input to the
tag on the selected control
loop asset. Ensure that the
analytic input name matches
the corresponding mapped tag
name exactly.
CONSTANTS: [Prepopulated Constant]
Name: alertTemplateName,
Value: CLPM-Manual_Control,
Type: String, Data Format:
Constant
Note: This constant is already
defined on the analytic. Do not
modify this constant.
OUTPUT DEFINITION:ALERTS
[Prepopulated Alert] Name:
CLPM-Manual_Control, Active:
On
Note: This alert mapping is
already defined on the
analytic. Do not modify this
alert mapping.
© 2020 General Electric Company 31
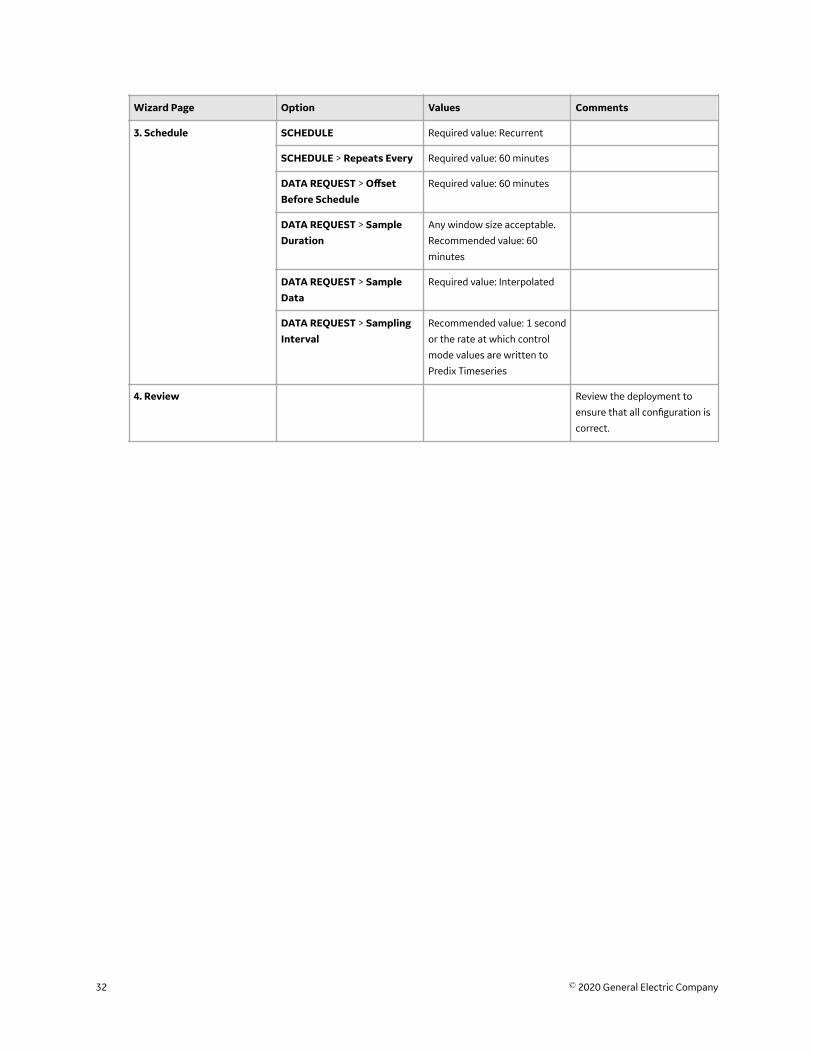
Wizard Page Option Values Comments
3. Schedule SCHEDULE Required value: Recurrent
SCHEDULE > Repeats Every Required value: 60 minutes
DATA REQUEST > OffsetBefore Schedule
Required value: 60 minutes
DATA REQUEST > SampleDuration
Any window size acceptable.
Recommended value: 60
minutes
DATA REQUEST > SampleData
Required value: Interpolated
DATA REQUEST > SamplingInterval
Recommended value: 1 second
or the rate at which control
mode values are written to
Predix Timeseries
4. Review Review the deployment to
ensure that all configuration is
correct.
32 © 2020 General Electric Company
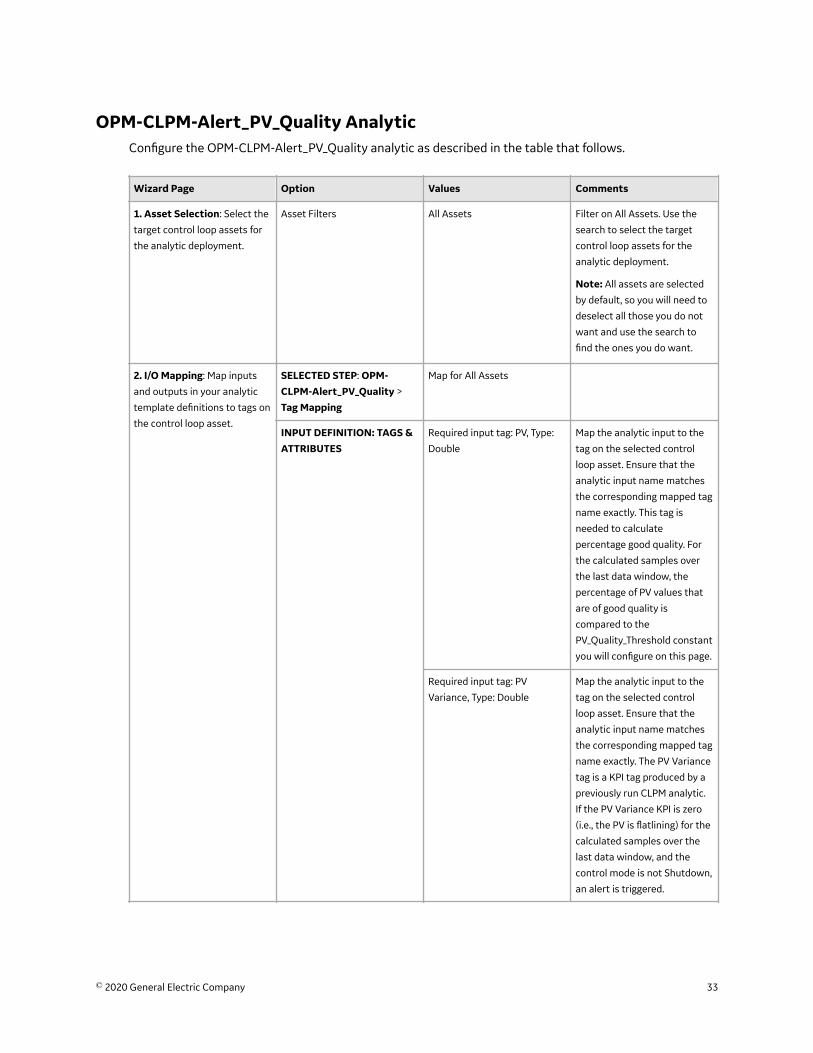
OPM-CLPM-Alert_PV_Quality AnalyticConfigure the OPM-CLPM-Alert_PV_Quality analytic as described in the table that follows.
Wizard Page Option Values Comments
1. Asset Selection: Select the
target control loop assets for
the analytic deployment.
Asset Filters All Assets Filter on All Assets. Use the
search to select the target
control loop assets for the
analytic deployment.
Note: All assets are selected
by default, so you will need to
deselect all those you do not
want and use the search to
find the ones you do want.
2. I/O Mapping: Map inputs
and outputs in your analytic
template definitions to tags on
the control loop asset.
SELECTED STEP: OPM-CLPM-Alert_PV_Quality >
Tag Mapping
Map for All Assets
INPUT DEFINITION: TAGS &ATTRIBUTES
Required input tag: PV, Type:
Double
Map the analytic input to the
tag on the selected control
loop asset. Ensure that the
analytic input name matches
the corresponding mapped tag
name exactly. This tag is
needed to calculate
percentage good quality. For
the calculated samples over
the last data window, the
percentage of PV values that
are of good quality is
compared to the
PV_Quality_Threshold constant
you will configure on this page.
Required input tag: PV
Variance, Type: Double
Map the analytic input to the
tag on the selected control
loop asset. Ensure that the
analytic input name matches
the corresponding mapped tag
name exactly. The PV Variance
tag is a KPI tag produced by a
previously run CLPM analytic.
If the PV Variance KPI is zero
(i.e., the PV is flatlining) for the
calculated samples over the
last data window, and the
control mode is not Shutdown,
an alert is triggered.
© 2020 General Electric Company 33
Wizard Page Option Values Comments
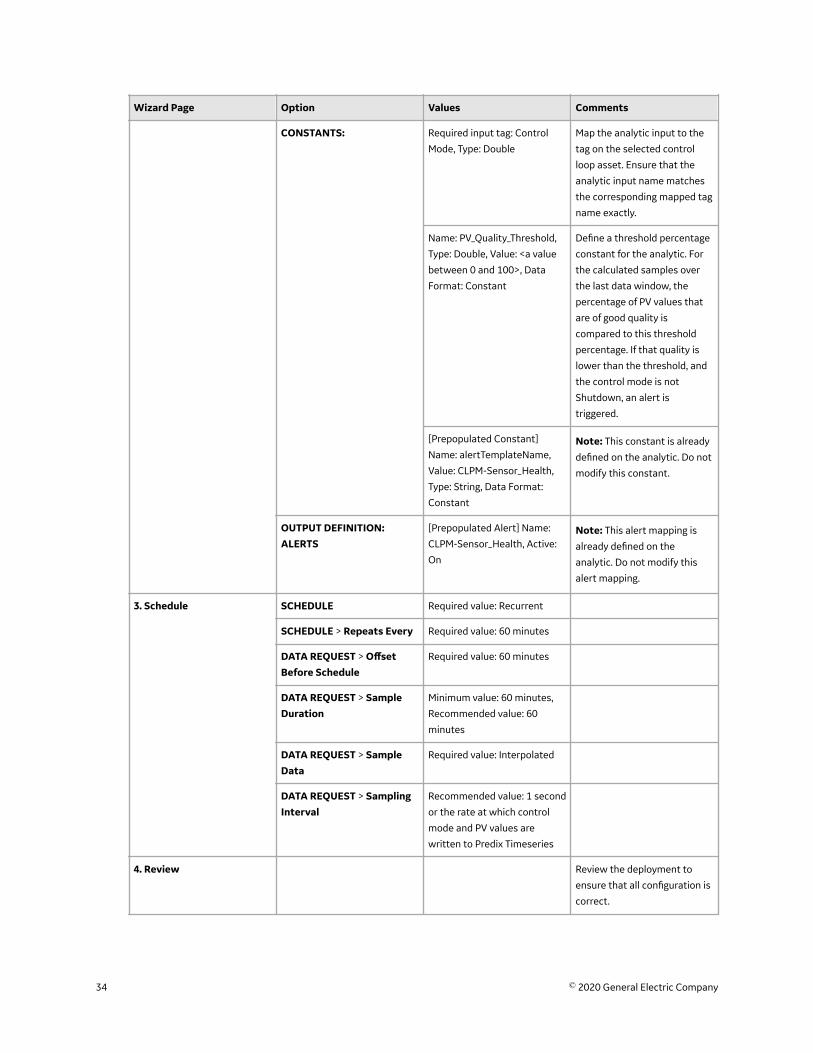
CONSTANTS: Required input tag: Control
Mode, Type: Double
Map the analytic input to the
tag on the selected control
loop asset. Ensure that the
analytic input name matches
the corresponding mapped tag
name exactly.
Name: PV_Quality_Threshold,
Type: Double, Value: <a value
between 0 and 100>, Data
Format: Constant
Define a threshold percentage
constant for the analytic. For
the calculated samples over
the last data window, the
percentage of PV values that
are of good quality is
compared to this threshold
percentage. If that quality is
lower than the threshold, and
the control mode is not
Shutdown, an alert is
triggered.
[Prepopulated Constant]
Name: alertTemplateName,
Value: CLPM-Sensor_Health,
Type: String, Data Format:
Constant
Note: This constant is already
defined on the analytic. Do not
modify this constant.
OUTPUT DEFINITION:ALERTS
[Prepopulated Alert] Name:
CLPM-Sensor_Health, Active:
On
Note: This alert mapping is
already defined on the
analytic. Do not modify this
alert mapping.
3. Schedule SCHEDULE Required value: Recurrent
SCHEDULE > Repeats Every Required value: 60 minutes
DATA REQUEST > OffsetBefore Schedule
Required value: 60 minutes
DATA REQUEST > SampleDuration
Minimum value: 60 minutes,
Recommended value: 60
minutes
DATA REQUEST > SampleData
Required value: Interpolated
DATA REQUEST > SamplingInterval
Recommended value: 1 second
or the rate at which control
mode and PV values are
written to Predix Timeseries
4. Review Review the deployment to
ensure that all configuration is
correct.
34 © 2020 General Electric Company

OPM-CLPM-Alert_Tuning AnalyticConfigure the OPM-CLPM-Alert_Tuning analytic as described in the table that follows.
© 2020 General Electric Company 35

Wizard Page Option Values Comments
1. Asset Selection: Select the
target control loop assets for
the analytic deployment.
Asset Filters All Assets Filter on All Assets. Use the
search to select the target
control loop assets for the
analytic deployment.
Note: All assets are selected
by default, so you will need to
deselect all those you do not
want and use the search to
find the ones you do want.
36 © 2020 General Electric Company
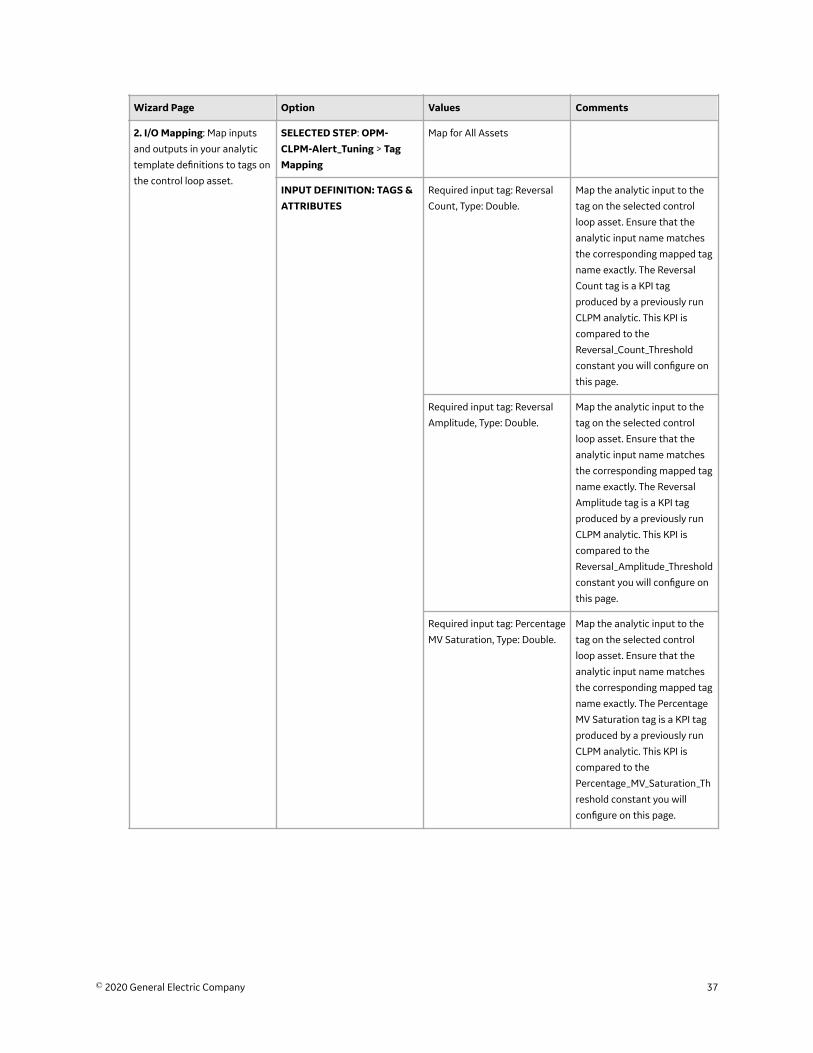
Wizard Page Option Values Comments
2. I/O Mapping: Map inputs
and outputs in your analytic
template definitions to tags on
the control loop asset.
SELECTED STEP: OPM-CLPM-Alert_Tuning > TagMapping
Map for All Assets
INPUT DEFINITION: TAGS &ATTRIBUTES
Required input tag: Reversal
Count, Type: Double.
Map the analytic input to the
tag on the selected control
loop asset. Ensure that the
analytic input name matches
the corresponding mapped tag
name exactly. The Reversal
Count tag is a KPI tag
produced by a previously run
CLPM analytic. This KPI is
compared to the
Reversal_Count_Threshold
constant you will configure on
this page.
Required input tag: Reversal
Amplitude, Type: Double.
Map the analytic input to the
tag on the selected control
loop asset. Ensure that the
analytic input name matches
the corresponding mapped tag
name exactly. The Reversal
Amplitude tag is a KPI tag
produced by a previously run
CLPM analytic. This KPI is
compared to the
Reversal_Amplitude_Threshold
constant you will configure on
this page.
Required input tag: Percentage
MV Saturation, Type: Double.
Map the analytic input to the
tag on the selected control
loop asset. Ensure that the
analytic input name matches
the corresponding mapped tag
name exactly. The Percentage
MV Saturation tag is a KPI tag
produced by a previously run
CLPM analytic. This KPI is
compared to the
Percentage_MV_Saturation_Th
reshold constant you will
configure on this page.
© 2020 General Electric Company 37
Wizard Page Option Values Comments
Required input tag: Percentage
Control On, Type: Double,
Value: <a value between 0 and
100>
Map the analytic input to the
tag on the selected control
loop asset. Ensure that the
analytic input name matches
the corresponding mapped tag
name exactly. The Percentage
Control On tag is a KPI tag
produced by a previously run
CLPM analytic. If the
Percentage Control On KPI is
100%, this satisfies one of the
requirements for an alert to be
triggered.
Required input tag: Percentage
Limits Exceeded, Type: Double.
Map the analytic input to the
tag on the selected control
loop asset. Ensure that the
analytic input name matches
the corresponding mapped tag
name exactly. The Percentage
Limits Exceeded tag is a KPI
tag produced by a previously
run CLPM analytic. This KPI is
compared to the
Percentage_Limits_Exceeded_
Threshold constant you will
configure on this page.
38 © 2020 General Electric Company
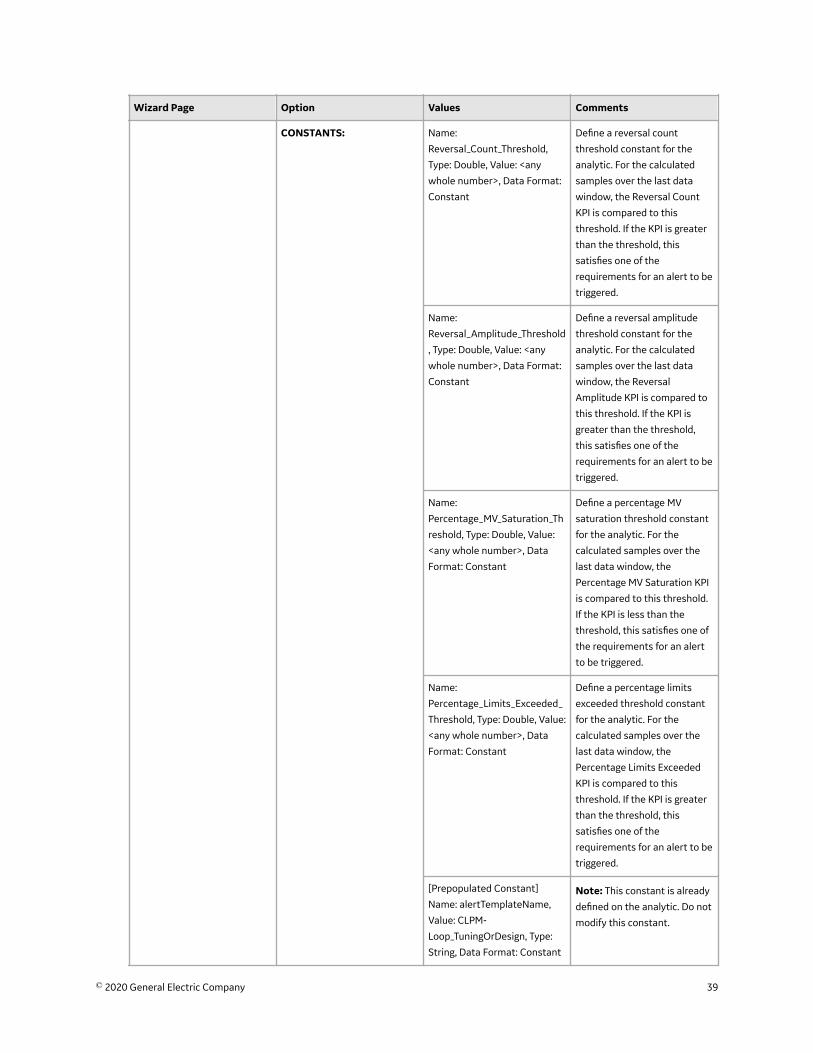
Wizard Page Option Values Comments
CONSTANTS: Name:
Reversal_Count_Threshold,
Type: Double, Value: <any
whole number>, Data Format:
Constant
Define a reversal count
threshold constant for the
analytic. For the calculated
samples over the last data
window, the Reversal Count
KPI is compared to this
threshold. If the KPI is greater
than the threshold, this
satisfies one of the
requirements for an alert to be
triggered.
Name:
Reversal_Amplitude_Threshold
, Type: Double, Value: <any
whole number>, Data Format:
Constant
Define a reversal amplitude
threshold constant for the
analytic. For the calculated
samples over the last data
window, the Reversal
Amplitude KPI is compared to
this threshold. If the KPI is
greater than the threshold,
this satisfies one of the
requirements for an alert to be
triggered.
Name:
Percentage_MV_Saturation_Th
reshold, Type: Double, Value:
<any whole number>, Data
Format: Constant
Define a percentage MV
saturation threshold constant
for the analytic. For the
calculated samples over the
last data window, the
Percentage MV Saturation KPI
is compared to this threshold.
If the KPI is less than the
threshold, this satisfies one of
the requirements for an alert
to be triggered.
Name:
Percentage_Limits_Exceeded_
Threshold, Type: Double, Value:
<any whole number>, Data
Format: Constant
Define a percentage limits
exceeded threshold constant
for the analytic. For the
calculated samples over the
last data window, the
Percentage Limits Exceeded
KPI is compared to this
threshold. If the KPI is greater
than the threshold, this
satisfies one of the
requirements for an alert to be
triggered.
[Prepopulated Constant]
Name: alertTemplateName,
Value: CLPM-
Loop_TuningOrDesign, Type:
String, Data Format: Constant
Note: This constant is already
defined on the analytic. Do not
modify this constant.
© 2020 General Electric Company 39
Wizard Page Option Values Comments
OUTPUT DEFINITION:ALERTS
[Prepopulated Alert] Name:
CLPM-Loop_TuningOrDesign,
Active: On
Note: This alert mapping is
already defined on the
analytic. Do not modify this
alert mapping.
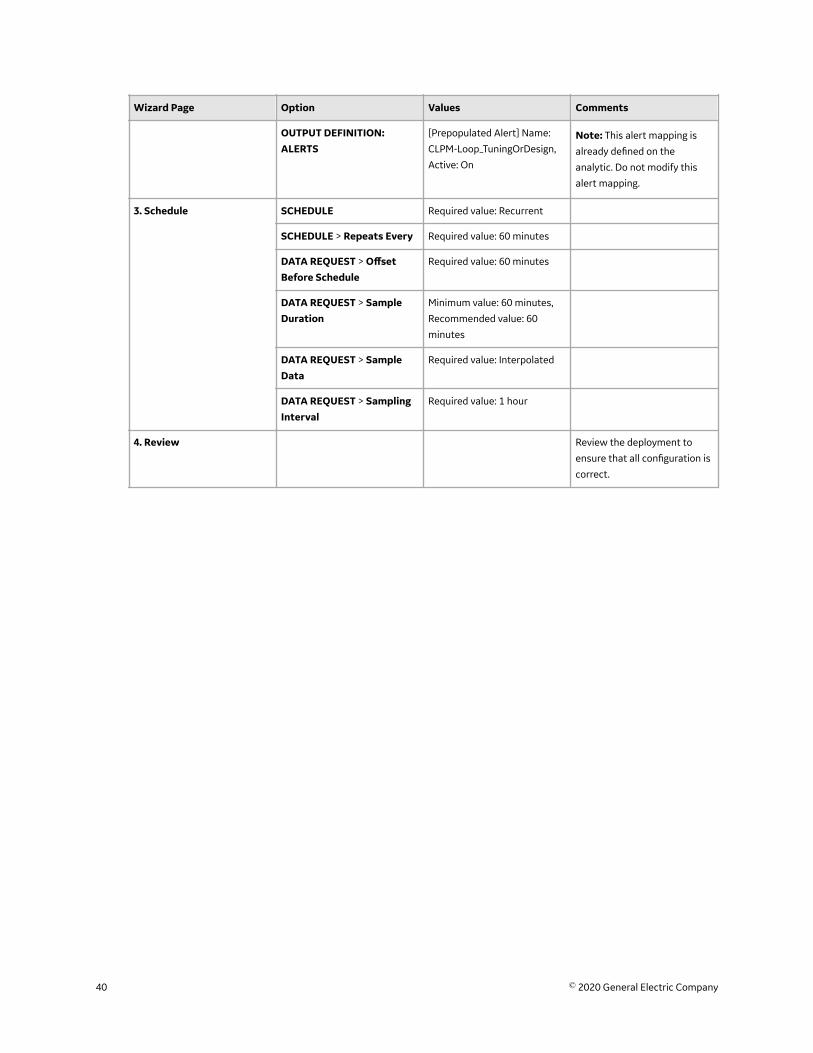
3. Schedule SCHEDULE Required value: Recurrent
SCHEDULE > Repeats Every Required value: 60 minutes
DATA REQUEST > OffsetBefore Schedule
Required value: 60 minutes
DATA REQUEST > SampleDuration
Minimum value: 60 minutes,
Recommended value: 60
minutes
DATA REQUEST > SampleData
Required value: Interpolated
DATA REQUEST > SamplingInterval
Required value: 1 hour
4. Review Review the deployment to
ensure that all configuration is
correct.
40 © 2020 General Electric Company

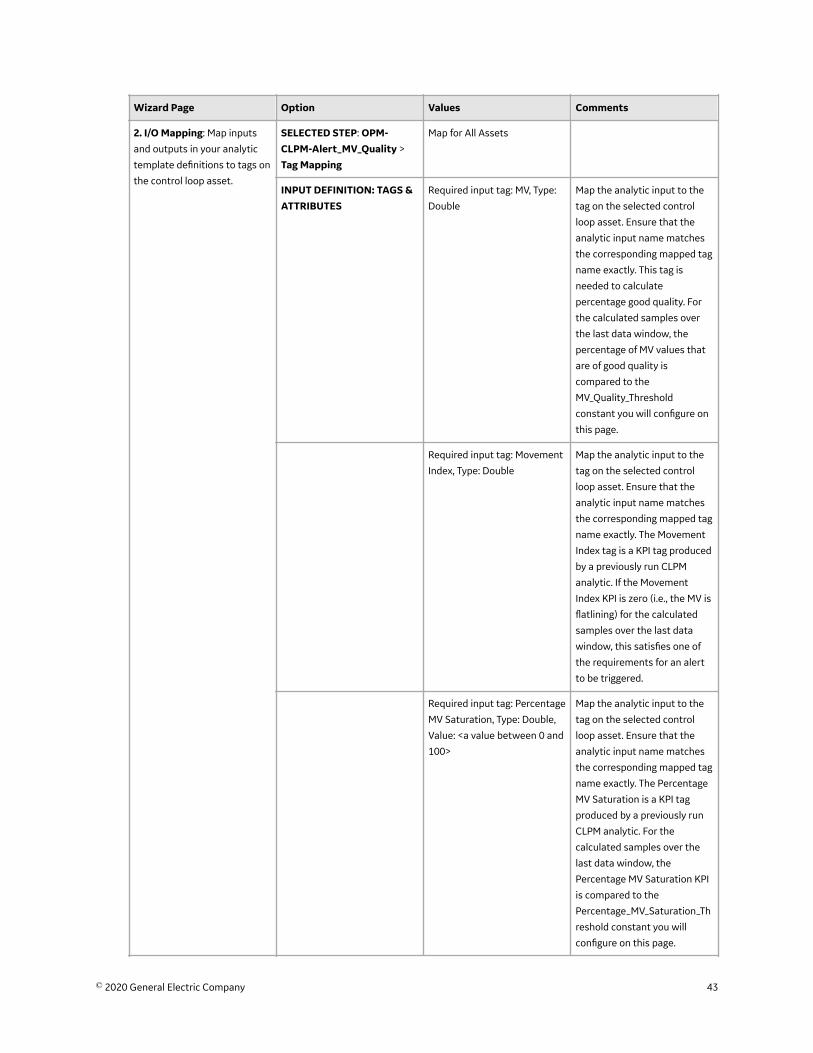
OPM-CLPM-Alert_MV_Quality AnalyticConfigure the OPM-CLPM-Alert_MV_Quality analytic as described in the table that follows.
© 2020 General Electric Company 41

Wizard Page Option Values Comments
1. Asset Selection: Select the
target control loop assets for
the analytic deployment.
Asset Filters All Assets Filter on All Assets. Use the
search to select the target
control loop assets for the
analytic deployment.
Note: All assets are selected
by default, so you will need to
deselect all those you do not
want and use the search to
find the ones you do want.
42 © 2020 General Electric Company
Wizard Page Option Values Comments
2. I/O Mapping: Map inputs
and outputs in your analytic
template definitions to tags on
the control loop asset.
SELECTED STEP: OPM-CLPM-Alert_MV_Quality >
Tag Mapping
Map for All Assets
INPUT DEFINITION: TAGS &ATTRIBUTES
Required input tag: MV, Type:
Double
Map the analytic input to the
tag on the selected control
loop asset. Ensure that the
analytic input name matches
the corresponding mapped tag
name exactly. This tag is
needed to calculate
percentage good quality. For
the calculated samples over
the last data window, the
percentage of MV values that
are of good quality is
compared to the
MV_Quality_Threshold
constant you will configure on
this page.
Required input tag: Movement
Index, Type: Double
Map the analytic input to the
tag on the selected control
loop asset. Ensure that the
analytic input name matches
the corresponding mapped tag
name exactly. The Movement
Index tag is a KPI tag produced
by a previously run CLPM
analytic. If the Movement
Index KPI is zero (i.e., the MV is
flatlining) for the calculated
samples over the last data
window, this satisfies one of
the requirements for an alert
to be triggered.
Required input tag: Percentage
MV Saturation, Type: Double,
Value: <a value between 0 and
100>
Map the analytic input to the
tag on the selected control
loop asset. Ensure that the
analytic input name matches
the corresponding mapped tag
name exactly. The Percentage
MV Saturation is a KPI tag
produced by a previously run
CLPM analytic. For the
calculated samples over the
last data window, the
Percentage MV Saturation KPI
is compared to the
Percentage_MV_Saturation_Th
reshold constant you will
configure on this page.
© 2020 General Electric Company 43
Wizard Page Option Values Comments
Required input tag: Percentage
Control On, Type: Double,
Value: <a value between 0 and
100>
Map the analytic input to the
tag on the selected control
loop asset. Ensure that the
analytic input name matches
the corresponding mapped tag
name exactly. The Percentage
Control On tag is a KPI tag
produced by a previously run
CLPM analytic. If the
Percentage Control On KPI is
100%, this satisfies one of the
requirements for an alert to be
triggered.
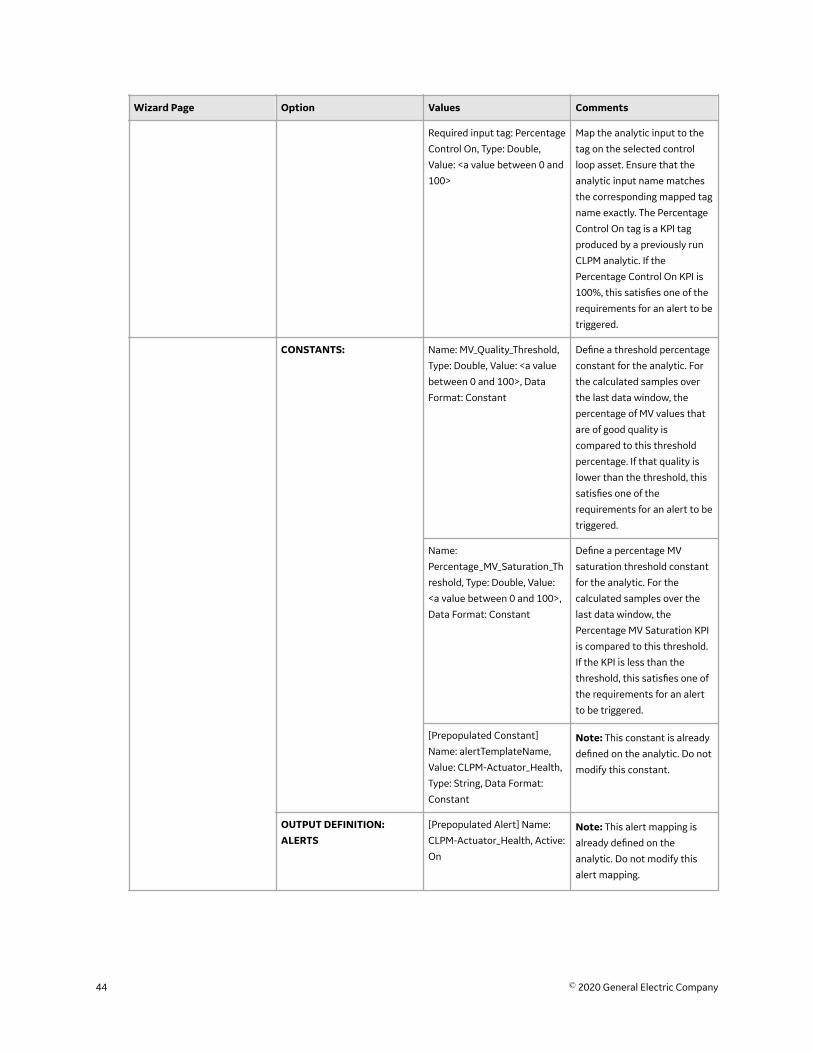
CONSTANTS: Name: MV_Quality_Threshold,
Type: Double, Value: <a value
between 0 and 100>, Data
Format: Constant
Define a threshold percentage
constant for the analytic. For
the calculated samples over
the last data window, the
percentage of MV values that
are of good quality is
compared to this threshold
percentage. If that quality is
lower than the threshold, this
satisfies one of the
requirements for an alert to be
triggered.
Name:
Percentage_MV_Saturation_Th
reshold, Type: Double, Value:
<a value between 0 and 100>,
Data Format: Constant
Define a percentage MV
saturation threshold constant
for the analytic. For the
calculated samples over the
last data window, the
Percentage MV Saturation KPI
is compared to this threshold.
If the KPI is less than the
threshold, this satisfies one of
the requirements for an alert
to be triggered.
[Prepopulated Constant]
Name: alertTemplateName,
Value: CLPM-Actuator_Health,
Type: String, Data Format:
Constant
Note: This constant is already
defined on the analytic. Do not
modify this constant.
OUTPUT DEFINITION:ALERTS
[Prepopulated Alert] Name:
CLPM-Actuator_Health, Active:
On
Note: This alert mapping is
already defined on the
analytic. Do not modify this
alert mapping.
44 © 2020 General Electric Company
Wizard Page Option Values Comments
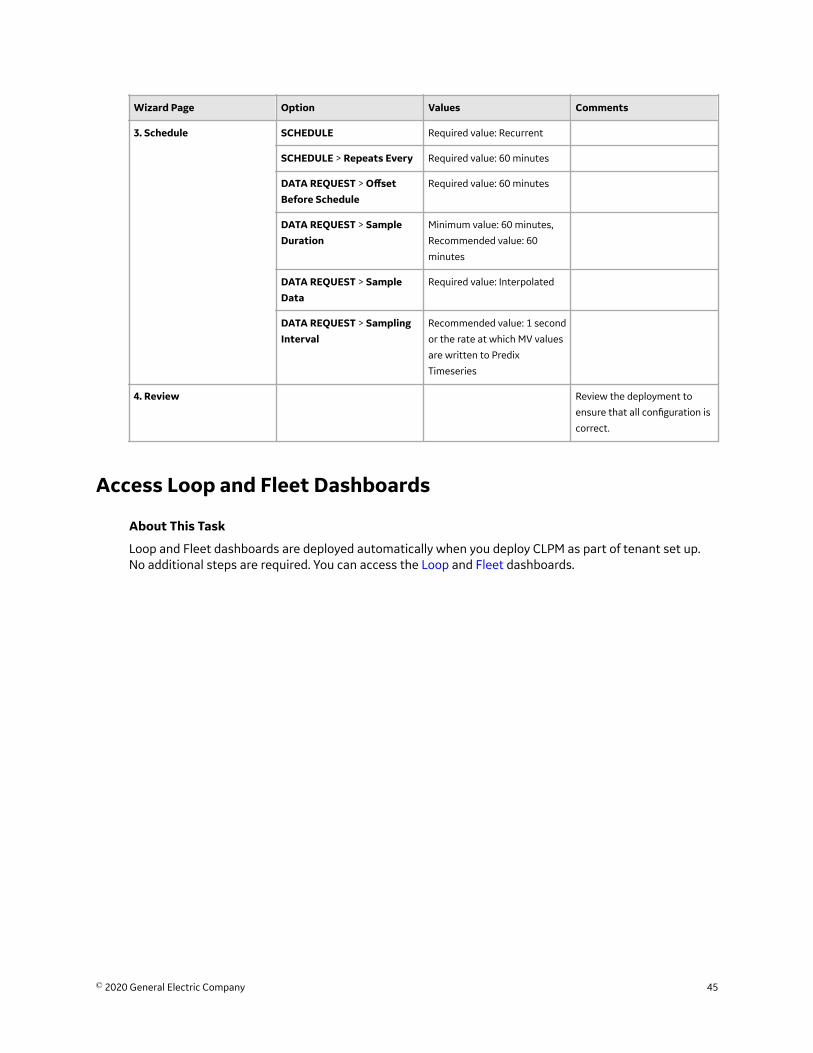
3. Schedule SCHEDULE Required value: Recurrent
SCHEDULE > Repeats Every Required value: 60 minutes
DATA REQUEST > OffsetBefore Schedule
Required value: 60 minutes
DATA REQUEST > SampleDuration
Minimum value: 60 minutes,
Recommended value: 60
minutes
DATA REQUEST > SampleData
Required value: Interpolated
DATA REQUEST > SamplingInterval
Recommended value: 1 second
or the rate at which MV values
are written to Predix
Timeseries
4. Review Review the deployment to
ensure that all configuration is
correct.
Access Loop and Fleet Dashboards
About This Task
Loop and Fleet dashboards are deployed automatically when you deploy CLPM as part of tenant set up.No additional steps are required. You can access the Loop and Fleet dashboards.
© 2020 General Electric Company 45

Chapter
3The Fleet ReportTopics:
• The Fleet Report• Access the Fleet Report• Modify the Date Range for a
Fleet Report• Average Control Loop
Performance Chart• The Diagnostic Alerts Filtering
Smart Filter• The Control Loop Performance
Table
46 © 2020 General Electric Company
The Fleet Report
The Fleet Report provides a summary of all loops in the selected asset context for the selected timeperiod. The report contains the following information:
• Average Control Loop Performance chart• The Diagnostic Alerts Filtering smart filter• Control Loop Performance table
Note:
• CLPM analytics process raw tag data and produce results that are interpolated. These interpolatedresults are then used to produce the Fleet Report chart and table.
• The measures presented in the Fleet Report are derived from KPIs that are produced by CLPManalytics. Consult the KPI Reference for details on these KPIs.
Access the Fleet Report
Procedure
In the module navigation menu, select Intelligence and then go to Control Loop Performance.The Fleet Report appears, displaying the Average Control Loop Performance graph, diagnostics alertsfiltering, and the Control Loop Performance table on selecting the required asset context, in the SelectContext window. By default, the data reported in the Fleet Report is for seven days prior to the currentdate.
Note: Control Loop Performance reports are also accessible from the Dashboard menu.
Tip: If needed, you can perform the following steps:
• Modify the asset context by selecting SELECT ASSET CONTEXT, navigating to the asset, and thenselecting OPEN.
• Modify the date range for which the data is reported.
Modify the Date Range for a Fleet Report
Procedure
1. Access the Fleet Report.2. In the Fleet Report workspace, specify the new date range by selecting the start date and end date.
The report is updated with the new data.
Note: The date and time range for the reported data also appears in the report.
Important: The Fleet Report supports only a date range of up to 30 days.
Note: When you navigate from a Fleet Report to a Loop Report, the Loop Report is plotted with theend date selected in the Fleet Report. For example, if the date range selected in the Fleet Report is12th November, 2018 00:00:00 to 18th November, 2018 23:59:59 (the last data point is from 19thNovember, 2018 00:00:00 to include any last micro second data point), after you navigate to the LoopReport, the Loop Report is plotted with data reported for 18th November, 2018 (that is, 18thNovember, 2018 00:00:00 to 19th November, 2018 00:00:00).
© 2020 General Electric Company 47
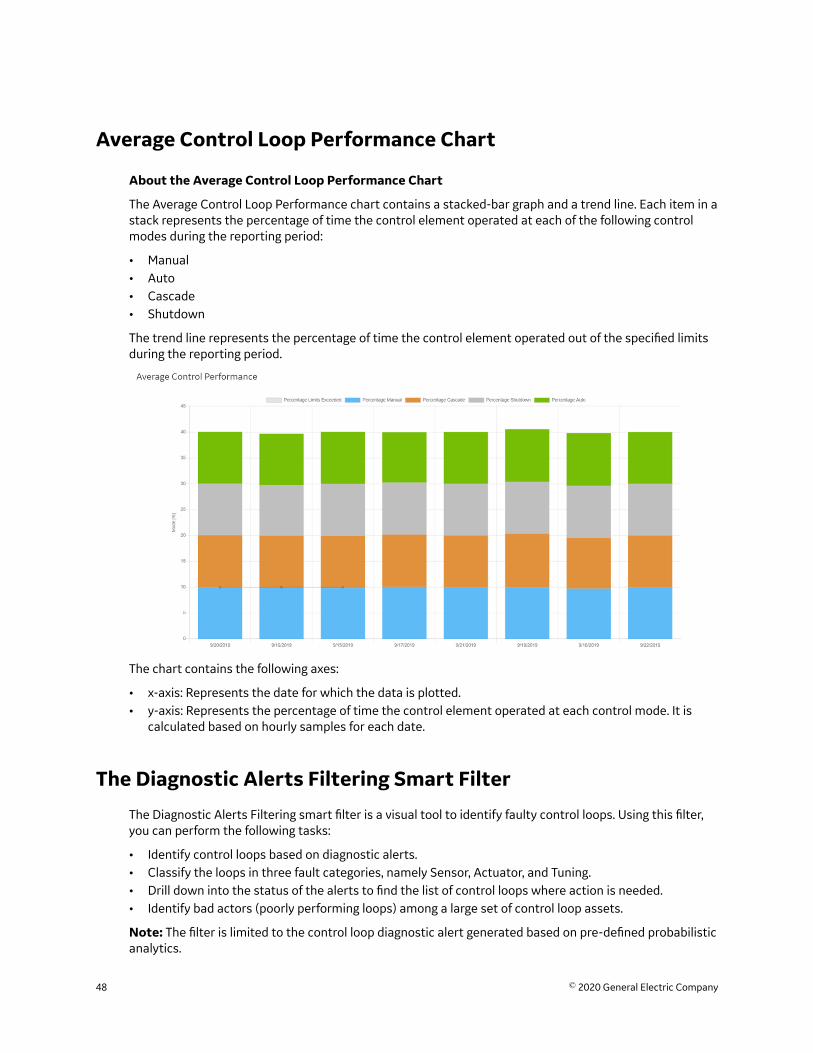
Average Control Loop Performance Chart
About the Average Control Loop Performance Chart
The Average Control Loop Performance chart contains a stacked-bar graph and a trend line. Each item in astack represents the percentage of time the control element operated at each of the following controlmodes during the reporting period:
• Manual• Auto• Cascade• Shutdown
The trend line represents the percentage of time the control element operated out of the specified limitsduring the reporting period.
The chart contains the following axes:
• x-axis: Represents the date for which the data is plotted.• y-axis: Represents the percentage of time the control element operated at each control mode. It is
calculated based on hourly samples for each date.
The Diagnostic Alerts Filtering Smart Filter
The Diagnostic Alerts Filtering smart filter is a visual tool to identify faulty control loops. Using this filter,you can perform the following tasks:
• Identify control loops based on diagnostic alerts.• Classify the loops in three fault categories, namely Sensor, Actuator, and Tuning.• Drill down into the status of the alerts to find the list of control loops where action is needed.• Identify bad actors (poorly performing loops) among a large set of control loop assets.
Note: The filter is limited to the control loop diagnostic alert generated based on pre-defined probabilisticanalytics.
48 © 2020 General Electric Company
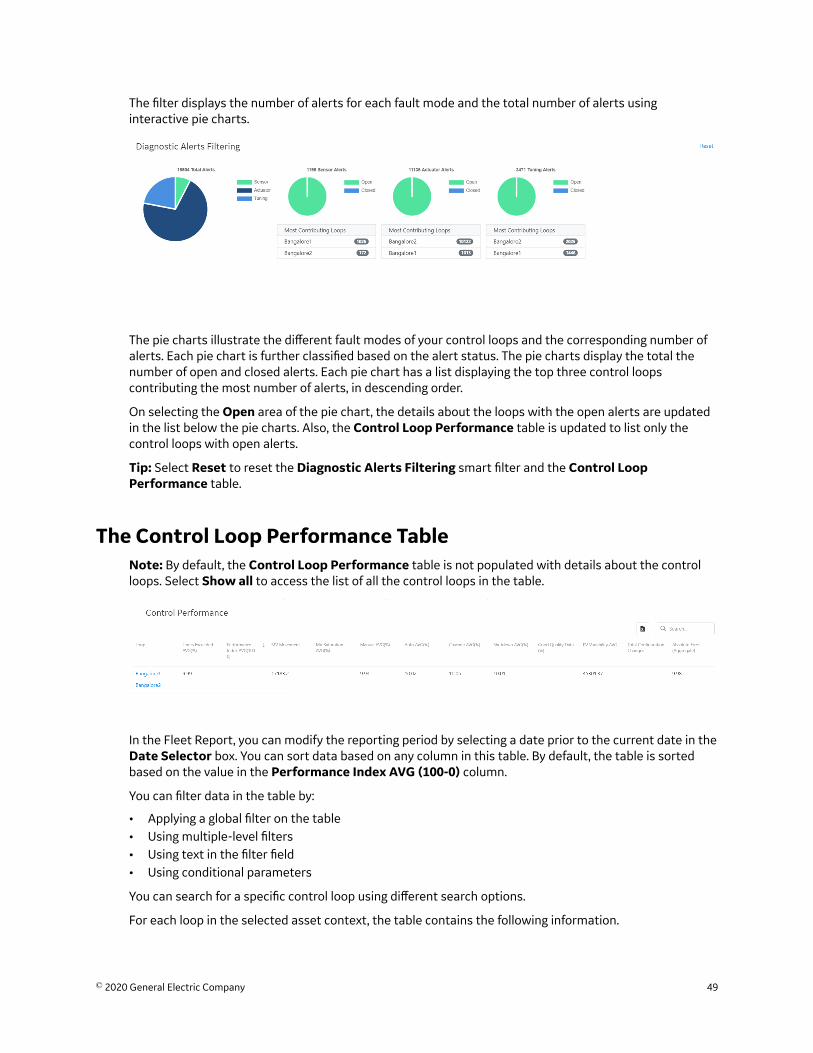
The filter displays the number of alerts for each fault mode and the total number of alerts usinginteractive pie charts.
The pie charts illustrate the different fault modes of your control loops and the corresponding number ofalerts. Each pie chart is further classified based on the alert status. The pie charts display the total thenumber of open and closed alerts. Each pie chart has a list displaying the top three control loopscontributing the most number of alerts, in descending order.
On selecting the Open area of the pie chart, the details about the loops with the open alerts are updatedin the list below the pie charts. Also, the Control Loop Performance table is updated to list only thecontrol loops with open alerts.
Tip: Select Reset to reset the Diagnostic Alerts Filtering smart filter and the Control LoopPerformance table.
The Control Loop Performance TableNote: By default, the Control Loop Performance table is not populated with details about the controlloops. Select Show all to access the list of all the control loops in the table.
In the Fleet Report, you can modify the reporting period by selecting a date prior to the current date in theDate Selector box. You can sort data based on any column in this table. By default, the table is sortedbased on the value in the Performance Index AVG (100-0) column.
You can filter data in the table by:
• Applying a global filter on the table• Using multiple-level filters• Using text in the filter field• Using conditional parameters
You can search for a specific control loop using different search options.
For each loop in the selected asset context, the table contains the following information.
© 2020 General Electric Company 49
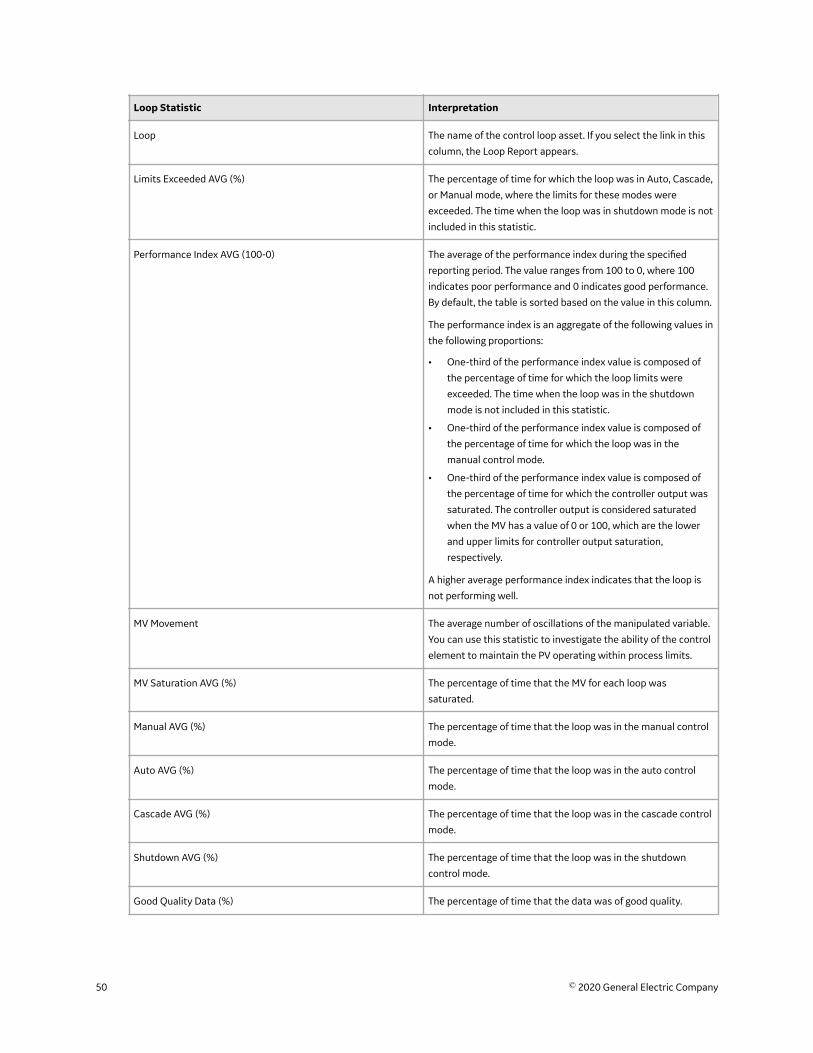
Loop Statistic Interpretation
Loop The name of the control loop asset. If you select the link in this
column, the Loop Report appears.
Limits Exceeded AVG (%) The percentage of time for which the loop was in Auto, Cascade,
or Manual mode, where the limits for these modes were
exceeded. The time when the loop was in shutdown mode is not
included in this statistic.
Performance Index AVG (100-0) The average of the performance index during the specified
reporting period. The value ranges from 100 to 0, where 100
indicates poor performance and 0 indicates good performance.
By default, the table is sorted based on the value in this column.
The performance index is an aggregate of the following values in
the following proportions:
• One-third of the performance index value is composed of
the percentage of time for which the loop limits were
exceeded. The time when the loop was in the shutdown
mode is not included in this statistic.
• One-third of the performance index value is composed of
the percentage of time for which the loop was in the
manual control mode.
• One-third of the performance index value is composed of
the percentage of time for which the controller output was
saturated. The controller output is considered saturated
when the MV has a value of 0 or 100, which are the lower
and upper limits for controller output saturation,
respectively.
A higher average performance index indicates that the loop is
not performing well.
MV Movement The average number of oscillations of the manipulated variable.
You can use this statistic to investigate the ability of the control
element to maintain the PV operating within process limits.
MV Saturation AVG (%) The percentage of time that the MV for each loop was
saturated.
Manual AVG (%) The percentage of time that the loop was in the manual control
mode.
Auto AVG (%) The percentage of time that the loop was in the auto control
mode.
Cascade AVG (%) The percentage of time that the loop was in the cascade control
mode.
Shutdown AVG (%) The percentage of time that the loop was in the shutdown
control mode.
Good Quality Data (%) The percentage of time that the data was of good quality.
50 © 2020 General Electric Company
Loop Statistic Interpretation
PV Variability AVG The average PV variability. This value is a measure of the data
spread in the PV data set, expressed as a percentage.
This is the average value of the PV Variability KPI. Refer to the
KPI Reference for the definition of this KPI.
Total Configuration Changes The number of times the controller configuration was changed
during the reporting period.
Absolute Error (Aggregate) AVG The average of the absolute values of all errors during the
reporting period. Error is calculated as the difference between
PV and SP.
Tip: Sorting the table based on this field is useful only if all loops
use the same unit of measure.
© 2020 General Electric Company 51
Chapter
4The Loop ReportTopics:
• About the Loop Report• Access the Loop Report• Modify the Date for a Loop
Report• The Process Variable
Performance Chart• The Manipulated Variable
Distribution Chart• The Control Overview Chart• The Error Distribution Chart• The Control Mode Summary
Table• The Controller Performance
Table• The PV Performance Table• The Error Statistics Table• The Controller Configuration
Table
52 © 2020 General Electric Company
About the Loop Report
The Loop Report provides a systematic approach to optimizing the performance of a control loop bymonitoring the loop performance and providing diagnostic data about the loop. The report containsvarious charts and tables that help in assessing the performance of a control loop. The data used forassessing the performance of the loop is derived from the tags associated with the control loop assets.
Note: CLPM analytics process raw tag data and produce results that are interpolated. These interpolatedresults are then used to produce the Loop Report charts and tables.
Note: The measures presented in the Loop Report are derived from KPIs that are produced by CLPManalytics. Consult the KPI Reference for details on these KPIs.
Note: Unless otherwise stated, only data of good quality is considered when calculating the measuresrepresented in these tables and charts. Bad quality data is ignored.
The Loop Report: Charts
The Loop Report contains the following charts:
• Process Variable Performance• Manipulated Variable Distribution (%)• Control Overview• Error Distribution
The Loop Report: Tables
The Loop Report contains the following tables:
• Control Mode Summary• Controller Performance• PV Performance• Error Statistics• Controller Configuration
Access the Loop Report
About This Task
This topic describes how to access the Loop Report from the module navigation menu.
Procedure
1. In the OPM navigation menu, go to Intelligence > Control Loop Performance.The fleet dashboard appears, displaying the Average Control Loop Performance graph, diagnosticalerts filtering, and the Control Loop Performance Table on selecting the required asset in the SelectContext window.
2. In the Control Loop Performance Table of an associated fleet report, select the link in the loopcolumn.The Loop Report appears, displaying the preconfigured widgets for graphs and tables. The reportcontains data for the selected asset context from the Fleet Report.
© 2020 General Electric Company 53
Note: If there is no context selected, select the required asset by selecting the Select Context tab inthe header.
Note: Control Loop Performance reports are also accessible from the Dashboard menu.
Modify the Date for a Loop Report
About This Task
This topic describes how to modify the date for a Loop Report.
Procedure
Note: By default, the Loop Report is plotted with data reported for the current date. For example, whenyou directly access the loop report on 12th November, 2018 20:00:00, the dashboard is plotted with datareported from 12th November, 2018 00:00:00 to 12th November, 2018 20:00:00 (till the latest availabledata point). The loop report can be displayed for a time period of one day only.1. Access the Loop Report whose date you want to modify.
The Date Selector box appears, displaying the default date. You can access data for a single day. Datais reported till the current time of the day. For example, if the current date and time is 20th November,2018 20:00:00, and you select 20th November, 2018, then data is reported from 20th November, 201800:00:00 to 20th November, 2018 20:00:00. However, if the current date and time is 20th November,2018 20:00:00, and you select 19th November, 2018, then data is reported from 19th November, 201800:00:00 to 20th November, 2018 00:00:00.
2. Select the Date Selector box.The date selector window appears.
3. Select the date you want to set, and then select Apply.The date is modified, and the report is updated. The date for which the data is reported appears in theupper-right corner of the report.
Tip: You can reset the date to the default value by selecting reset.
The Process Variable Performance ChartThe process variable performance (PVP) chart helps in analyzing the trend of the process variable (PV)against the setpoint (SP).
The chart contains the following axes:
• x-axis: Represents the time period selected in the control loop report.• y-axis: Represents the PV and SP values.
The trend of each value over the selected time period appears as a step chart, which helps youunderstand the magnitude of change at a specific timestamp. The following trend lines are plotted on thechart:
54 © 2020 General Electric Company
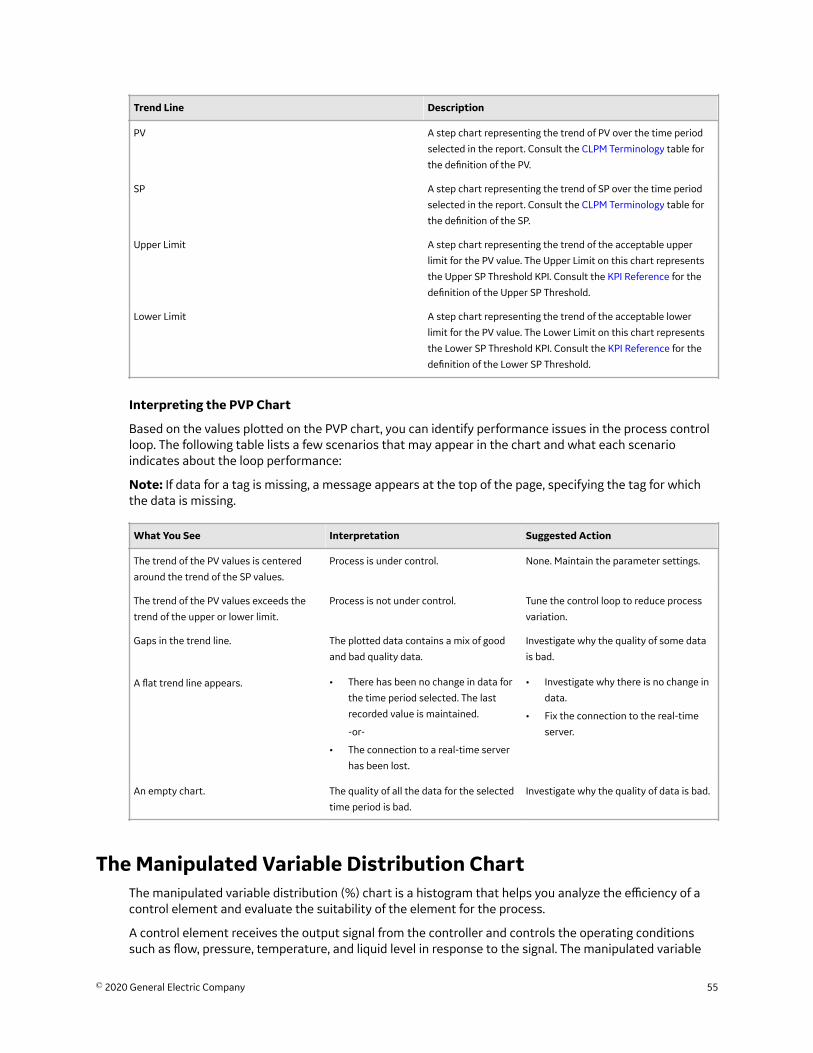
Trend Line Description
PV A step chart representing the trend of PV over the time period
selected in the report. Consult the CLPM Terminology table for
the definition of the PV.
SP A step chart representing the trend of SP over the time period
selected in the report. Consult the CLPM Terminology table for
the definition of the SP.
Upper Limit A step chart representing the trend of the acceptable upper
limit for the PV value. The Upper Limit on this chart represents
the Upper SP Threshold KPI. Consult the KPI Reference for the
definition of the Upper SP Threshold.
Lower Limit A step chart representing the trend of the acceptable lower
limit for the PV value. The Lower Limit on this chart represents
the Lower SP Threshold KPI. Consult the KPI Reference for the
definition of the Lower SP Threshold.
Interpreting the PVP Chart
Based on the values plotted on the PVP chart, you can identify performance issues in the process controlloop. The following table lists a few scenarios that may appear in the chart and what each scenarioindicates about the loop performance:
Note: If data for a tag is missing, a message appears at the top of the page, specifying the tag for whichthe data is missing.
What You See Interpretation Suggested Action
The trend of the PV values is centered
around the trend of the SP values.
Process is under control. None. Maintain the parameter settings.
The trend of the PV values exceeds the
trend of the upper or lower limit.
Process is not under control. Tune the control loop to reduce process
variation.
Gaps in the trend line. The plotted data contains a mix of good
and bad quality data.
Investigate why the quality of some data
is bad.
A flat trend line appears. • There has been no change in data for
the time period selected. The last
recorded value is maintained.
-or-
• The connection to a real-time server
has been lost.
• Investigate why there is no change in
data.
• Fix the connection to the real-time
server.
An empty chart. The quality of all the data for the selected
time period is bad.
Investigate why the quality of data is bad.
The Manipulated Variable Distribution ChartThe manipulated variable distribution (%) chart is a histogram that helps you analyze the efficiency of acontrol element and evaluate the suitability of the element for the process.
A control element receives the output signal from the controller and controls the operating conditionssuch as flow, pressure, temperature, and liquid level in response to the signal. The manipulated variable
© 2020 General Electric Company 55
(MV) is a percentage measure of the value at which the control element is functioning. For example, in thetemperature control loop in an air conditioner, based on how much cooling is required (that is, setpoint),the thermostat (that is, the controller) sends a signal to manipulate the flow of cooling agent such thatthe room temperature (that is, the process variable) is adjusted to match the desired temperature. In thisexample, MV is the percentage of flow of cooling agent allowed through the valve.
The chart contains the following axes:
• x-axis: Represents the value of the MV measured in percentage• y-axis: Represents the count of samples of the MV
The histogram represents the count of samples that the control element was set to at each percentagevalue, and not the length of time the element remained at each value. Therefore, you must alwaysconsider the distribution pattern of MV when interpreting the statistical significance of the samplesdisplayed in this histogram.
Interpreting the Manipulated Variable Distribution Chart
Based on the values plotted on the chart, you can identify performance issues in the controller. Thefollowing table provides a few scenarios that may appear in the chart and what each scenario indicatesregarding the controller performance.
Note: If data for a tag is missing, a message appears at the top of the page, specifying the tag for whichthe data is missing.
What you see Interpretation Required action
Red bars appear. The samples can be interpreted as
follows:
• < 6%: Indicates that the control
element is operating at a very low
saturation level and that the element
is oversized.
• > 95%: Indicates that the control
element is operating at a very high
saturation level and that the element
is undersized.
A controller operating at the extreme high
or low values of its capacity will result in
asset fatigue over time.
Install a different type of controller, either
a larger one that is more suitable for the
purpose, or a smaller one that is more
energy-efficient and cost-effective.
Yellow bars appear. The samples can be interpreted as
follows:
• 6% - 30%: Indicates that the control
element is operating close to its
lower saturation level.
• 71% - 95%: Indicates that the control
element is operating close to its
higher saturation level.
A controller operating at high or low
values of its capacity will result in asset
fatigue over time.
Monitor the control element for signs of
asset fatigue.
56 © 2020 General Electric Company
What you see Interpretation Required action
Blue bars appear. The controller is operating at the desired
capacity, that is, in the range of 31%
through 70%. More samples in this range
indicate that the controller is well-
designed.
None. This is the ideal value.
Image displays a message stating that
there is no data.
Data is not available for the selected time
period.
Investigate if there is a loss of connection
with the database.
An empty histogram appears. The quality of all the data for the selected
time period is bad.
Investigate why the quality of data is bad.
One trend interval (bin) appears with
majority of data counts.This indicates that there has been no data
change, and that the last recorded value
has been maintained.
This can possibly occur as a result of loss
of connection to a real-time server.
Verify and fix the connection to the real-
time server.
Flat histogram, with no discernible peaks,
appears.
The control element is operating over its
whole range to control the PV. This
typically indicates that the control
element is too small for the system and
will cause asset fatigue over time.
Optimize the size of the control element.
The Control Overview ChartThe control overview chart displays the trend of the manipulated variable (MV). The chart contains thefollowing axes:
• x-axis: Represents the time period selected in the report.• y-axes (two in number): Represent the MV value and the control mode in which the control loop was
operating over the time period. The following table provides the number that represents each controlmode:
Number Control Mode
1 Manual
2 Auto
3 Cascade
4 Shutdown
Trend lines appear in the following colors in the chart:
• Blue: Indicates the control mode in which the system is operating. The control mode can change overthe recording period.
• Red: Indicates the trend of the MV value over the total calibrated range.
Interpreting the Control Overview Chart
Based on the values plotted on the chart, you can identify performance issues in the controller. Thefollowing table provides a few scenarios that may appear in the chart and what each scenario indicatesregarding the controller performance.
© 2020 General Electric Company 57
Note: If data for a tag is missing, a message appears at the top of the page, specifying the tag for whichthe data is missing.
What you see Interpretation Required action
The blue trend line is set to Shutdown. Indicates that the control element is in
the Shutdown mode.Ensure that the system is operating in the
required control mode.
Investigate causes of a change to
Shutdown mode.
The red trend line indicates the MV
percentage functioning value over the
total calibrated range.
• < 5%: Indicates that the control
element is operating at a very low
saturation level and that the element
is oversized.
• 5 - 30%: Indicates that the control
element is operating close to its
lower saturation level.
• 30 - 70%: Indicates that the control
element is operating at its optimal
value. This is the ideal value for the
variable.
• 70 - 95%: Indicates that the control
element is operating close to its
higher saturation level.
• > 95%: Indicates that the control
element is operating at a very high
saturation level and that the element
is undersized.
Optimize the size of the controller.
The blue trend line is set to Bad. The data was of bad quality and loop
statistics could not be calculated.Identify the reason for bad quality data.
Check the connection to the server or
database.
A report with no value for MV in the y-axis
appears.
Either the MV has no data or the data is of
bad quality.
Investigate which of these is true and
why.
Gaps in the trend line appear. Data was a mixture of good and bad
quality.
Investigate why the quality of some data
is bad.
A flat trend line appears. • There has been no change in data for
the time period selected. The last
recorded value is maintained.
-or-
• The connection to a real-time server
has been lost.
• Investigate why there is no change in
data.
• Fix the connection to the real-time
server.
The Control Mode and MV values are
responding quickly relative to the PV and
SP values in the PV trend.
The control element has an appropriate
reaction to changes in the PV.
None. The controller is well-tuned.
The Control Mode and MV values are
responding very slowly relative to the PV
and SP values in the PV trend.
The control element has a sluggish
reaction to changes in the PV.
Tune the control loop PIDF parameters.
58 © 2020 General Electric Company
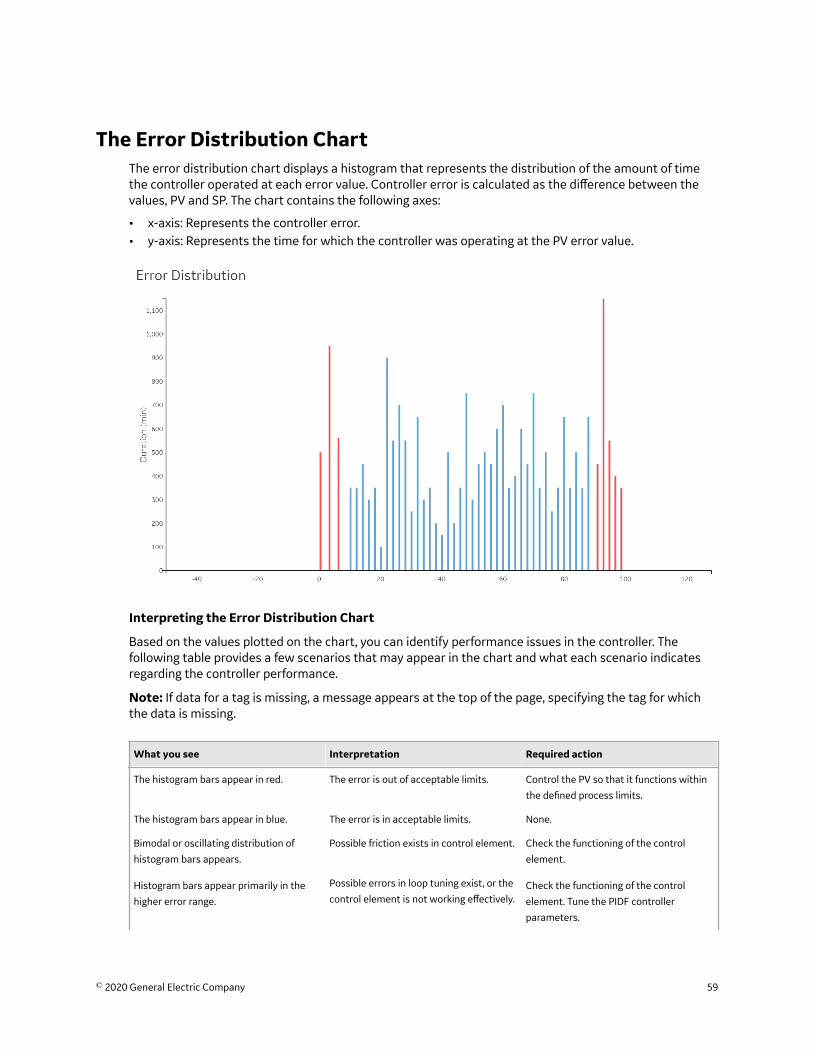
The Error Distribution ChartThe error distribution chart displays a histogram that represents the distribution of the amount of timethe controller operated at each error value. Controller error is calculated as the difference between thevalues, PV and SP. The chart contains the following axes:
• x-axis: Represents the controller error.• y-axis: Represents the time for which the controller was operating at the PV error value.
Interpreting the Error Distribution Chart
Based on the values plotted on the chart, you can identify performance issues in the controller. Thefollowing table provides a few scenarios that may appear in the chart and what each scenario indicatesregarding the controller performance.
Note: If data for a tag is missing, a message appears at the top of the page, specifying the tag for whichthe data is missing.
What you see Interpretation Required action
The histogram bars appear in red. The error is out of acceptable limits. Control the PV so that it functions within
the defined process limits.
The histogram bars appear in blue. The error is in acceptable limits. None.
Bimodal or oscillating distribution of
histogram bars appears.
Possible friction exists in control element. Check the functioning of the control
element.
Histogram bars appear primarily in the
higher error range.
Possible errors in loop tuning exist, or the
control element is not working effectively.Check the functioning of the control
element. Tune the PIDF controller
parameters.
© 2020 General Electric Company 59
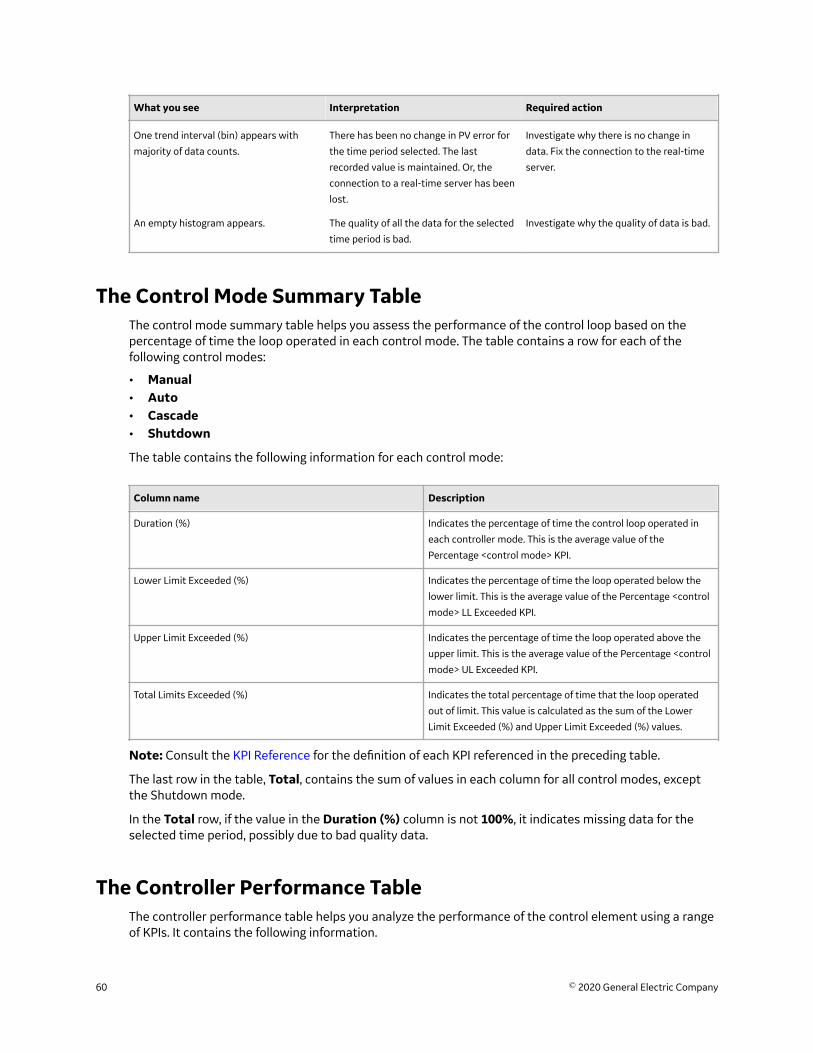
What you see Interpretation Required action
One trend interval (bin) appears with
majority of data counts.
There has been no change in PV error for
the time period selected. The last
recorded value is maintained. Or, the
connection to a real-time server has been
lost.
Investigate why there is no change in
data. Fix the connection to the real-time
server.
An empty histogram appears. The quality of all the data for the selected
time period is bad.
Investigate why the quality of data is bad.
The Control Mode Summary TableThe control mode summary table helps you assess the performance of the control loop based on thepercentage of time the loop operated in each control mode. The table contains a row for each of thefollowing control modes:
• Manual• Auto• Cascade• Shutdown
The table contains the following information for each control mode:
Column name Description
Duration (%) Indicates the percentage of time the control loop operated in
each controller mode. This is the average value of the
Percentage <control mode> KPI.
Lower Limit Exceeded (%) Indicates the percentage of time the loop operated below the
lower limit. This is the average value of the Percentage <control
mode> LL Exceeded KPI.
Upper Limit Exceeded (%) Indicates the percentage of time the loop operated above the
upper limit. This is the average value of the Percentage <control
mode> UL Exceeded KPI.
Total Limits Exceeded (%) Indicates the total percentage of time that the loop operated
out of limit. This value is calculated as the sum of the Lower
Limit Exceeded (%) and Upper Limit Exceeded (%) values.
Note: Consult the KPI Reference for the definition of each KPI referenced in the preceding table.
The last row in the table, Total, contains the sum of values in each column for all control modes, exceptthe Shutdown mode.
In the Total row, if the value in the Duration (%) column is not 100%, it indicates missing data for theselected time period, possibly due to bad quality data.
The Controller Performance TableThe controller performance table helps you analyze the performance of the control element using a rangeof KPIs. It contains the following information.
60 © 2020 General Electric Company
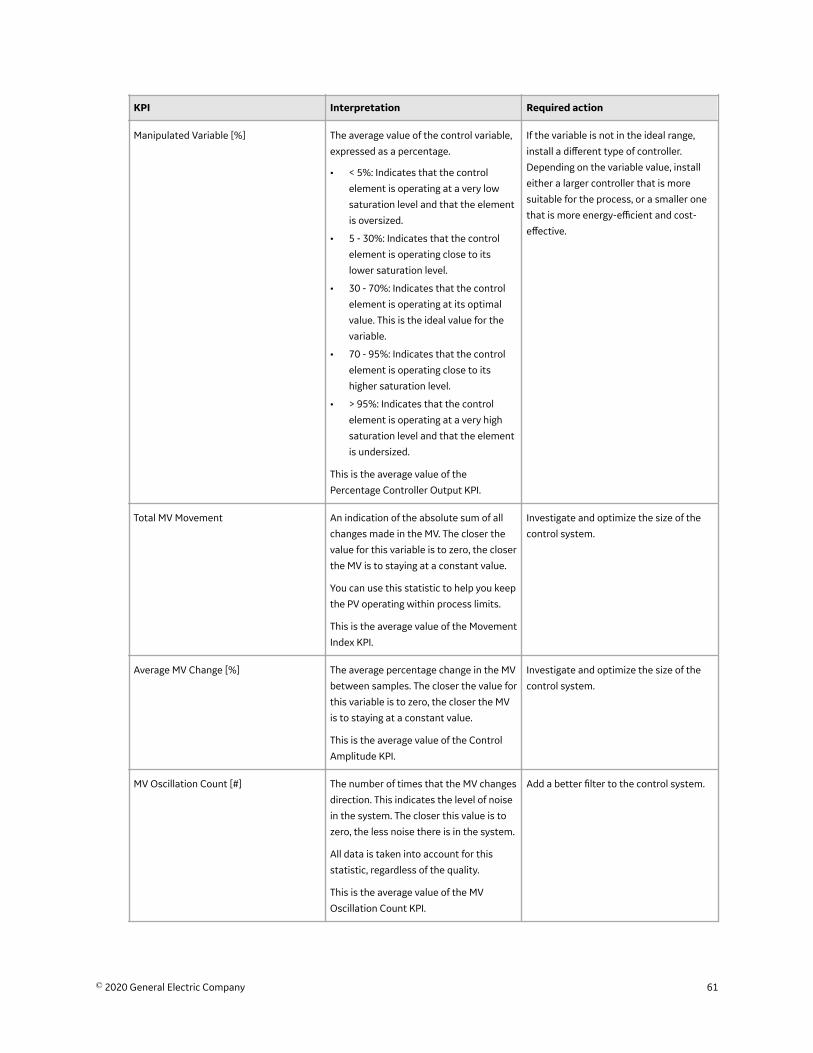
KPI Interpretation Required action
Manipulated Variable [%] The average value of the control variable,
expressed as a percentage.
• < 5%: Indicates that the control
element is operating at a very low
saturation level and that the element
is oversized.
• 5 - 30%: Indicates that the control
element is operating close to its
lower saturation level.
• 30 - 70%: Indicates that the control
element is operating at its optimal
value. This is the ideal value for the
variable.
• 70 - 95%: Indicates that the control
element is operating close to its
higher saturation level.
• > 95%: Indicates that the control
element is operating at a very high
saturation level and that the element
is undersized.
This is the average value of the
Percentage Controller Output KPI.
If the variable is not in the ideal range,
install a different type of controller.
Depending on the variable value, install
either a larger controller that is more
suitable for the process, or a smaller one
that is more energy-efficient and cost-
effective.
Total MV Movement An indication of the absolute sum of all
changes made in the MV. The closer the
value for this variable is to zero, the closer
the MV is to staying at a constant value.
You can use this statistic to help you keep
the PV operating within process limits.
This is the average value of the Movement
Index KPI.
Investigate and optimize the size of the
control system.
Average MV Change [%] The average percentage change in the MV
between samples. The closer the value for
this variable is to zero, the closer the MV
is to staying at a constant value.
This is the average value of the Control
Amplitude KPI.
Investigate and optimize the size of the
control system.
MV Oscillation Count [#] The number of times that the MV changes
direction. This indicates the level of noise
in the system. The closer this value is to
zero, the less noise there is in the system.
All data is taken into account for this
statistic, regardless of the quality.
This is the average value of the MV
Oscillation Count KPI.
Add a better filter to the control system.
© 2020 General Electric Company 61
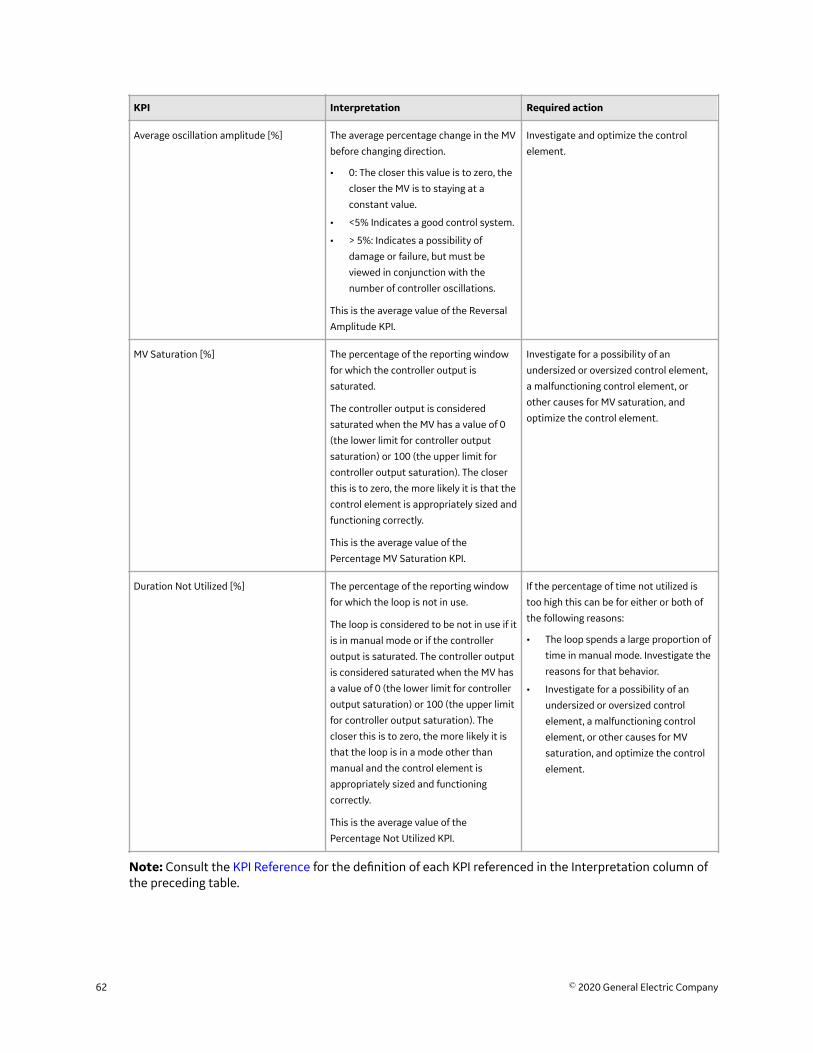
KPI Interpretation Required action
Average oscillation amplitude [%] The average percentage change in the MV
before changing direction.
• 0: The closer this value is to zero, the
closer the MV is to staying at a
constant value.
• <5% Indicates a good control system.
• > 5%: Indicates a possibility of
damage or failure, but must be
viewed in conjunction with the
number of controller oscillations.
This is the average value of the Reversal
Amplitude KPI.
Investigate and optimize the control
element.
MV Saturation [%] The percentage of the reporting window
for which the controller output is
saturated.
The controller output is considered
saturated when the MV has a value of 0
(the lower limit for controller output
saturation) or 100 (the upper limit for
controller output saturation). The closer
this is to zero, the more likely it is that the
control element is appropriately sized and
functioning correctly.
This is the average value of the
Percentage MV Saturation KPI.
Investigate for a possibility of an
undersized or oversized control element,
a malfunctioning control element, or
other causes for MV saturation, and
optimize the control element.
Duration Not Utilized [%] The percentage of the reporting window
for which the loop is not in use.
The loop is considered to be not in use if it
is in manual mode or if the controller
output is saturated. The controller output
is considered saturated when the MV has
a value of 0 (the lower limit for controller
output saturation) or 100 (the upper limit
for controller output saturation). The
closer this is to zero, the more likely it is
that the loop is in a mode other than
manual and the control element is
appropriately sized and functioning
correctly.
This is the average value of the
Percentage Not Utilized KPI.
If the percentage of time not utilized is
too high this can be for either or both of
the following reasons:
• The loop spends a large proportion of
time in manual mode. Investigate the
reasons for that behavior.
• Investigate for a possibility of an
undersized or oversized control
element, a malfunctioning control
element, or other causes for MV
saturation, and optimize the control
element.
Note: Consult the KPI Reference for the definition of each KPI referenced in the Interpretation column ofthe preceding table.
62 © 2020 General Electric Company
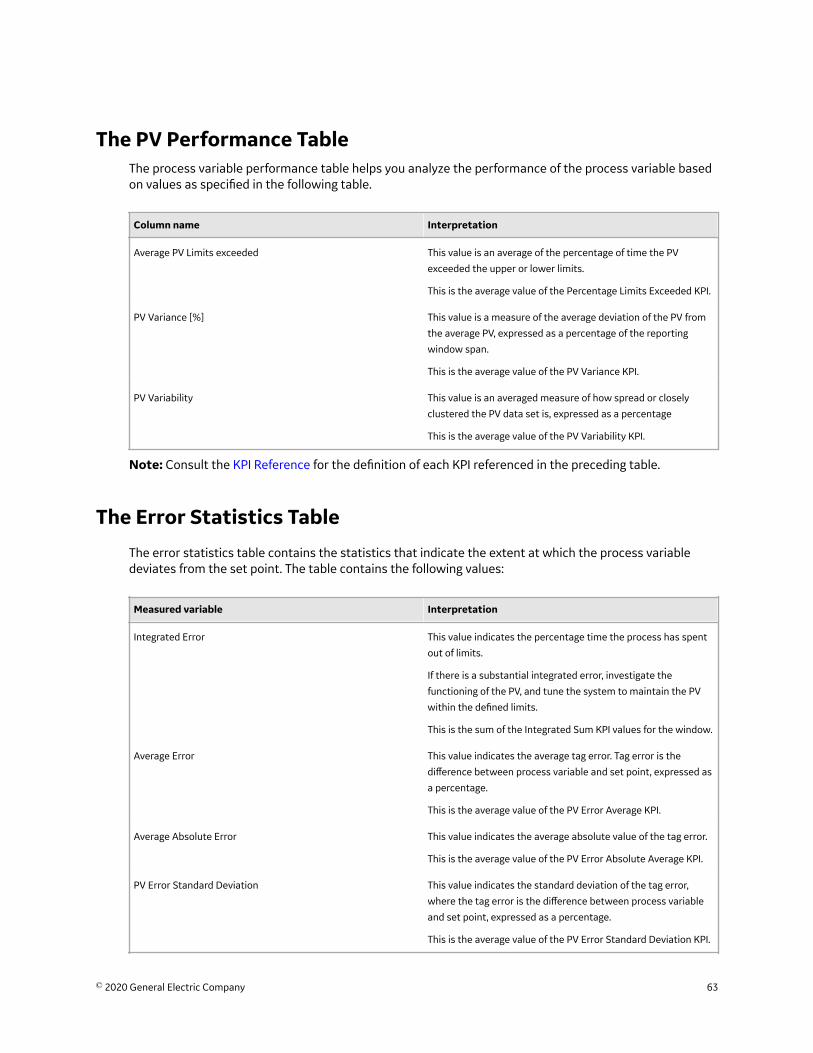
The PV Performance TableThe process variable performance table helps you analyze the performance of the process variable basedon values as specified in the following table.
Column name Interpretation
Average PV Limits exceeded This value is an average of the percentage of time the PV
exceeded the upper or lower limits.
This is the average value of the Percentage Limits Exceeded KPI.
PV Variance [%] This value is a measure of the average deviation of the PV from
the average PV, expressed as a percentage of the reporting
window span.
This is the average value of the PV Variance KPI.
PV Variability This value is an averaged measure of how spread or closely
clustered the PV data set is, expressed as a percentage
This is the average value of the PV Variability KPI.
Note: Consult the KPI Reference for the definition of each KPI referenced in the preceding table.
The Error Statistics Table
The error statistics table contains the statistics that indicate the extent at which the process variabledeviates from the set point. The table contains the following values:
Measured variable Interpretation
Integrated Error This value indicates the percentage time the process has spent
out of limits.
If there is a substantial integrated error, investigate the
functioning of the PV, and tune the system to maintain the PV
within the defined limits.
This is the sum of the Integrated Sum KPI values for the window.
Average Error This value indicates the average tag error. Tag error is the
difference between process variable and set point, expressed as
a percentage.
This is the average value of the PV Error Average KPI.
Average Absolute Error This value indicates the average absolute value of the tag error.
This is the average value of the PV Error Absolute Average KPI.
PV Error Standard Deviation This value indicates the standard deviation of the tag error,
where the tag error is the difference between process variable
and set point, expressed as a percentage.
This is the average value of the PV Error Standard Deviation KPI.
© 2020 General Electric Company 63

Note: Consult the KPI Reference for the definition of each KPI referenced in the preceding table.
The Controller Configuration Table
The controller configuration table contains the Proportional (P), Integral (I), Derivative (D), or Filter (F)values at the beginning and end of the selected time period.
64 © 2020 General Electric Company
Chapter
5The Loop Analysis TemplateTopics:
• About the Loop AnalysisTemplate
• Access the Loop AnalysisTemplate
• Modify the Date for a LoopAnalysis
© 2020 General Electric Company 65
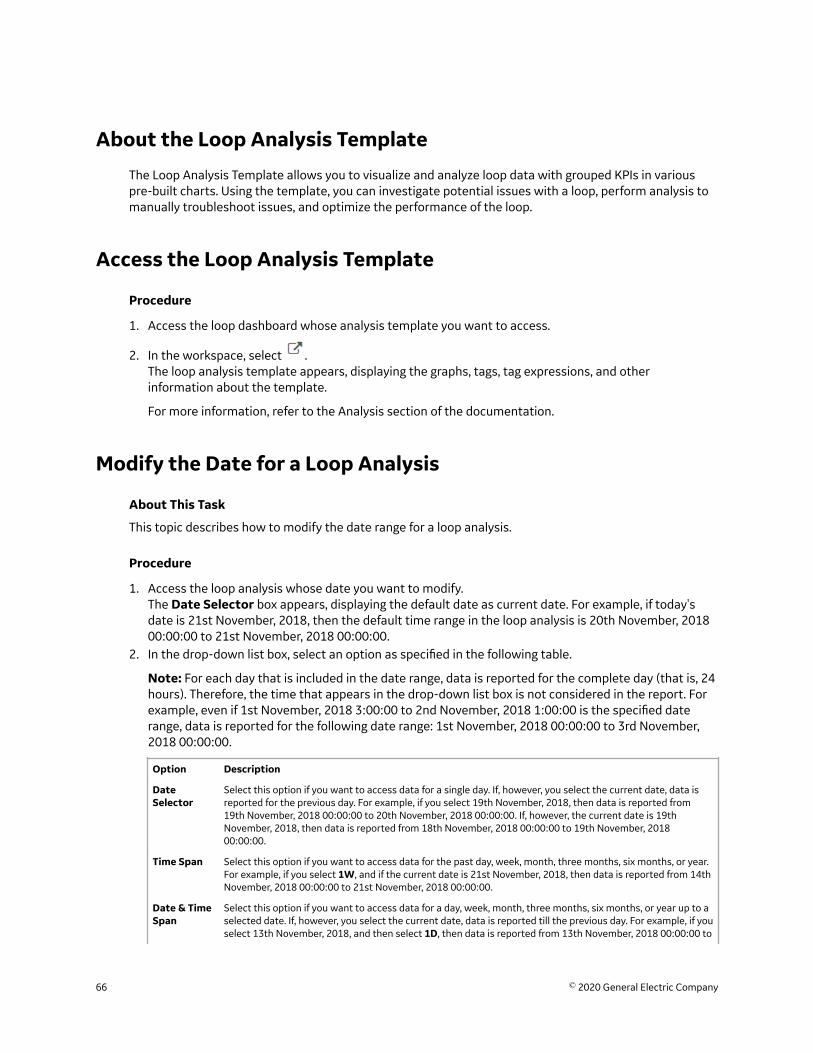
About the Loop Analysis Template
The Loop Analysis Template allows you to visualize and analyze loop data with grouped KPIs in variouspre-built charts. Using the template, you can investigate potential issues with a loop, perform analysis tomanually troubleshoot issues, and optimize the performance of the loop.
Access the Loop Analysis Template
Procedure
1. Access the loop dashboard whose analysis template you want to access.
2. In the workspace, select .The loop analysis template appears, displaying the graphs, tags, tag expressions, and otherinformation about the template.
For more information, refer to the Analysis section of the documentation.
Modify the Date for a Loop Analysis
About This Task
This topic describes how to modify the date range for a loop analysis.
Procedure
1. Access the loop analysis whose date you want to modify.The Date Selector box appears, displaying the default date as current date. For example, if today'sdate is 21st November, 2018, then the default time range in the loop analysis is 20th November, 201800:00:00 to 21st November, 2018 00:00:00.
2. In the drop-down list box, select an option as specified in the following table.
Note: For each day that is included in the date range, data is reported for the complete day (that is, 24hours). Therefore, the time that appears in the drop-down list box is not considered in the report. Forexample, even if 1st November, 2018 3:00:00 to 2nd November, 2018 1:00:00 is the specified daterange, data is reported for the following date range: 1st November, 2018 00:00:00 to 3rd November,2018 00:00:00.
Option Description
DateSelector
Select this option if you want to access data for a single day. If, however, you select the current date, data isreported for the previous day. For example, if you select 19th November, 2018, then data is reported from19th November, 2018 00:00:00 to 20th November, 2018 00:00:00. If, however, the current date is 19thNovember, 2018, then data is reported from 18th November, 2018 00:00:00 to 19th November, 201800:00:00.
Time Span Select this option if you want to access data for the past day, week, month, three months, six months, or year.For example, if you select 1W, and if the current date is 21st November, 2018, then data is reported from 14thNovember, 2018 00:00:00 to 21st November, 2018 00:00:00.
Date & TimeSpan
Select this option if you want to access data for a day, week, month, three months, six months, or year up to aselected date. If, however, you select the current date, data is reported till the previous day. For example, if youselect 13th November, 2018, and then select 1D, then data is reported from 13th November, 2018 00:00:00 to
66 © 2020 General Electric Company

Option Description
14th November, 2018 00:00:00. If, however, the current date is 13th November, 2018, then data is reportedfrom 12th November, 2018 00:00:00 to 13th November, 2018 00:00:00.
CustomTime Span
Select this option if you want to access data for a specific date range. If, however, you select current date, datais reported till the previous day. For example, if you select 10th November, 2018 to 15th November, 2018, datais reported from 10th November, 2018 00:00:00 to 16th November, 2018 00:00:00. If, however, the currentdate is 15th November, 2018, then data is reported from 10th November, 2018 00:00:00 to 15th November2018 00:00:00.
The date range is modified, and the analysis is updated. The date and time range for which the data isreported appears in the upper-right corner of the analysis.
Tip: You can reset the date range to the default value by selecting reset.
© 2020 General Electric Company 67
Chapter
6Manage LoopsTopics:
• Add a Loop• Modify a Loop• Delete a Loop
68 © 2020 General Electric Company
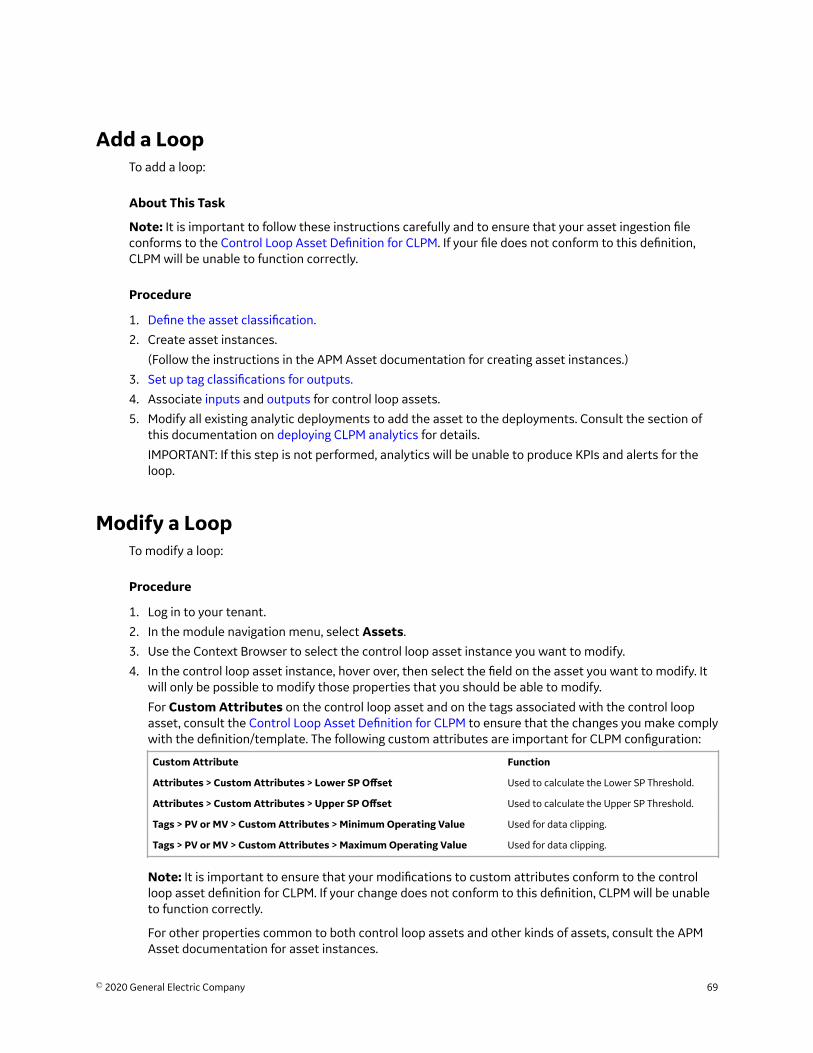
Add a LoopTo add a loop:
About This Task
Note: It is important to follow these instructions carefully and to ensure that your asset ingestion fileconforms to the Control Loop Asset Definition for CLPM. If your file does not conform to this definition,CLPM will be unable to function correctly.
Procedure
1. Define the asset classification.2. Create asset instances.
(Follow the instructions in the APM Asset documentation for creating asset instances.)3. Set up tag classifications for outputs.4. Associate inputs and outputs for control loop assets.5. Modify all existing analytic deployments to add the asset to the deployments. Consult the section of
this documentation on deploying CLPM analytics for details.
IMPORTANT: If this step is not performed, analytics will be unable to produce KPIs and alerts for theloop.
Modify a LoopTo modify a loop:
Procedure
1. Log in to your tenant.2. In the module navigation menu, select Assets.3. Use the Context Browser to select the control loop asset instance you want to modify.4. In the control loop asset instance, hover over, then select the field on the asset you want to modify. It
will only be possible to modify those properties that you should be able to modify.
For Custom Attributes on the control loop asset and on the tags associated with the control loopasset, consult the Control Loop Asset Definition for CLPM to ensure that the changes you make complywith the definition/template. The following custom attributes are important for CLPM configuration:
Custom Attribute Function
Attributes > Custom Attributes > Lower SP Offset Used to calculate the Lower SP Threshold.
Attributes > Custom Attributes > Upper SP Offset Used to calculate the Upper SP Threshold.
Tags > PV or MV > Custom Attributes > Minimum Operating Value Used for data clipping.
Tags > PV or MV > Custom Attributes > Maximum Operating Value Used for data clipping.
Note: It is important to ensure that your modifications to custom attributes conform to the controlloop asset definition for CLPM. If your change does not conform to this definition, CLPM will be unableto function correctly.
For other properties common to both control loop assets and other kinds of assets, consult the APMAsset documentation for asset instances.
© 2020 General Electric Company 69
5. Make the change you want to make, then press Enter or select outside the field.
Results
The newly modified value for the field you have changed appears on the control loop asset instance page.
Delete a LoopTo delete a loop:
About This Task
Note: This action cannot be reversed.
Procedure
1. Log in to your tenant.2. In the module navigation menu, select Assets.3. Use the Context Browser to select the asset instance you want to delete.4. Select the trash icon and confirm that you want to delete the loop.5. Modify all existing CLPM analytic deployments to remove the asset from the deployments.
70 © 2020 General Electric Company
Chapter
7ReferenceTopics:
• CLPM Terminology• Control Loop Asset Definition• KPI Reference for CLPM
© 2020 General Electric Company 71
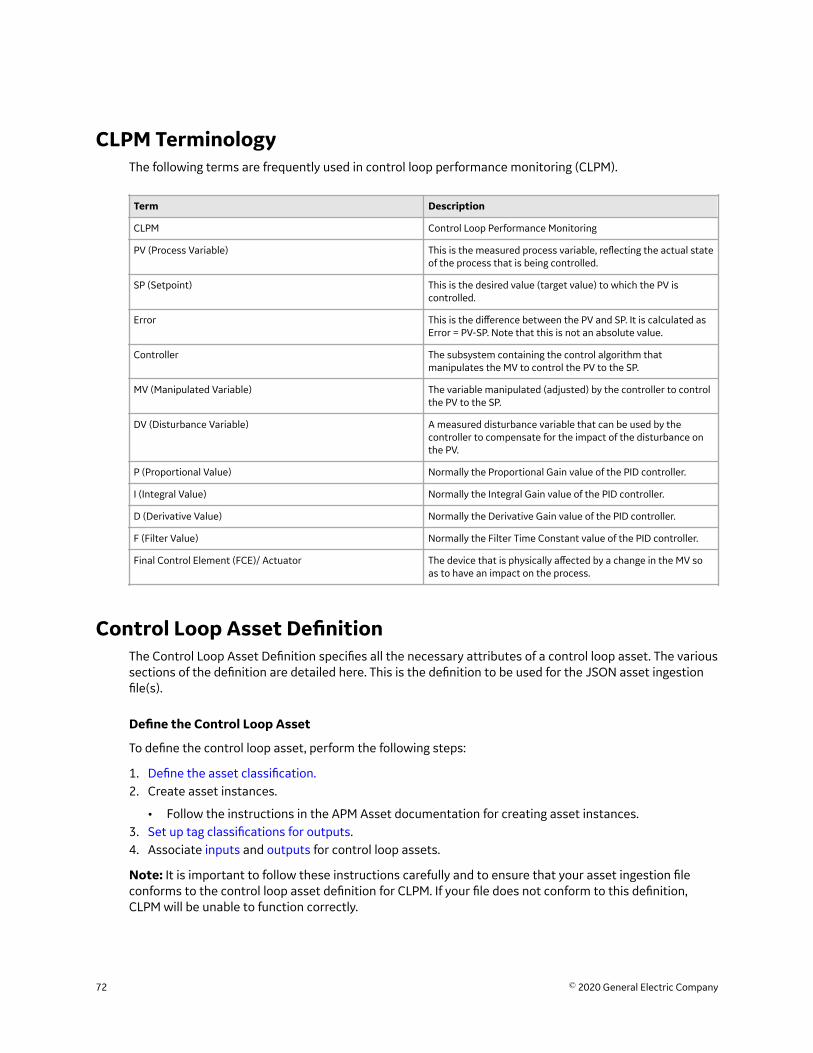
CLPM TerminologyThe following terms are frequently used in control loop performance monitoring (CLPM).
Term Description
CLPM Control Loop Performance Monitoring
PV (Process Variable) This is the measured process variable, reflecting the actual stateof the process that is being controlled.
SP (Setpoint) This is the desired value (target value) to which the PV iscontrolled.
Error This is the difference between the PV and SP. It is calculated asError = PV-SP. Note that this is not an absolute value.
Controller The subsystem containing the control algorithm thatmanipulates the MV to control the PV to the SP.
MV (Manipulated Variable) The variable manipulated (adjusted) by the controller to controlthe PV to the SP.
DV (Disturbance Variable) A measured disturbance variable that can be used by thecontroller to compensate for the impact of the disturbance onthe PV.
P (Proportional Value) Normally the Proportional Gain value of the PID controller.
I (Integral Value) Normally the Integral Gain value of the PID controller.
D (Derivative Value) Normally the Derivative Gain value of the PID controller.
F (Filter Value) Normally the Filter Time Constant value of the PID controller.
Final Control Element (FCE)/ Actuator The device that is physically affected by a change in the MV soas to have an impact on the process.
Control Loop Asset DefinitionThe Control Loop Asset Definition specifies all the necessary attributes of a control loop asset. The varioussections of the definition are detailed here. This is the definition to be used for the JSON asset ingestionfile(s).
Define the Control Loop Asset
To define the control loop asset, perform the following steps:
1. Define the asset classification.2. Create asset instances.
• Follow the instructions in the APM Asset documentation for creating asset instances.3. Set up tag classifications for outputs.4. Associate inputs and outputs for control loop assets.
Note: It is important to follow these instructions carefully and to ensure that your asset ingestion fileconforms to the control loop asset definition for CLPM. If your file does not conform to this definition,CLPM will be unable to function correctly.
72 © 2020 General Electric Company
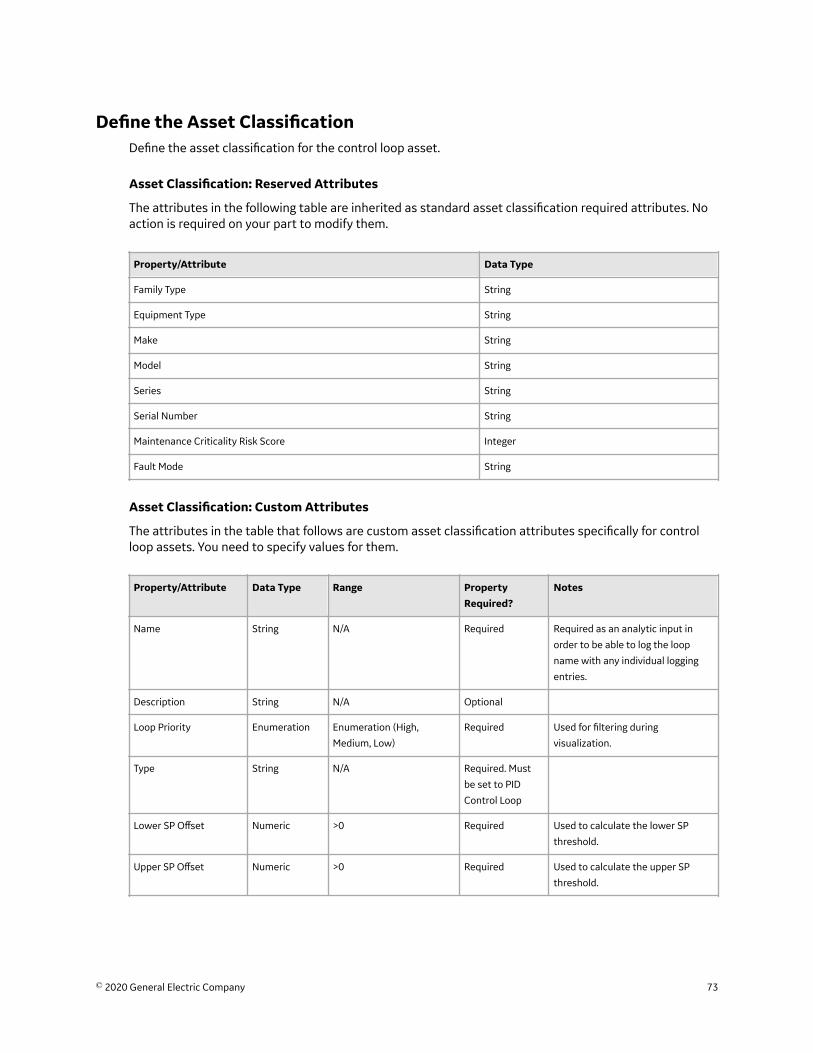
Define the Asset ClassificationDefine the asset classification for the control loop asset.
Asset Classification: Reserved Attributes
The attributes in the following table are inherited as standard asset classification required attributes. Noaction is required on your part to modify them.
Property/Attribute Data Type
Family Type String
Equipment Type String
Make String
Model String
Series String
Serial Number String
Maintenance Criticality Risk Score Integer
Fault Mode String
Asset Classification: Custom Attributes
The attributes in the table that follows are custom asset classification attributes specifically for controlloop assets. You need to specify values for them.
Property/Attribute Data Type Range PropertyRequired?
Notes
Name String N/A Required Required as an analytic input in
order to be able to log the loop
name with any individual logging
entries.
Description String N/A Optional
Loop Priority Enumeration Enumeration (High,
Medium, Low)
Required Used for filtering during
visualization.
Type String N/A Required. Must
be set to PID
Control Loop
Lower SP Offset Numeric >0 Required Used to calculate the lower SP
threshold.
Upper SP Offset Numeric >0 Required Used to calculate the upper SP
threshold.
© 2020 General Electric Company 73
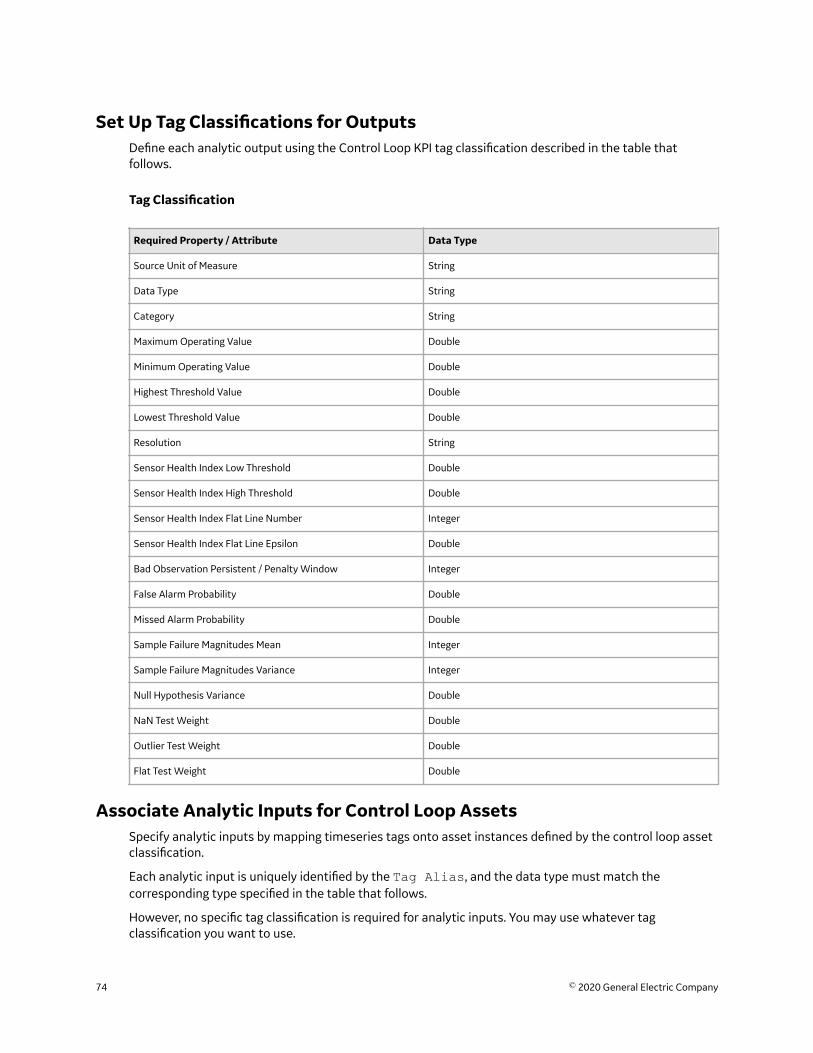
Set Up Tag Classifications for OutputsDefine each analytic output using the Control Loop KPI tag classification described in the table thatfollows.
Tag Classification
Required Property / Attribute Data Type
Source Unit of Measure String
Data Type String
Category String
Maximum Operating Value Double
Minimum Operating Value Double
Highest Threshold Value Double
Lowest Threshold Value Double
Resolution String
Sensor Health Index Low Threshold Double
Sensor Health Index High Threshold Double
Sensor Health Index Flat Line Number Integer
Sensor Health Index Flat Line Epsilon Double
Bad Observation Persistent / Penalty Window Integer
False Alarm Probability Double
Missed Alarm Probability Double
Sample Failure Magnitudes Mean Integer
Sample Failure Magnitudes Variance Integer
Null Hypothesis Variance Double
NaN Test Weight Double
Outlier Test Weight Double
Flat Test Weight Double
Associate Analytic Inputs for Control Loop AssetsSpecify analytic inputs by mapping timeseries tags onto asset instances defined by the control loop assetclassification.
Each analytic input is uniquely identified by the Tag Alias, and the data type must match thecorresponding type specified in the table that follows.
However, no specific tag classification is required for analytic inputs. You may use whatever tagclassification you want to use.
74 © 2020 General Electric Company
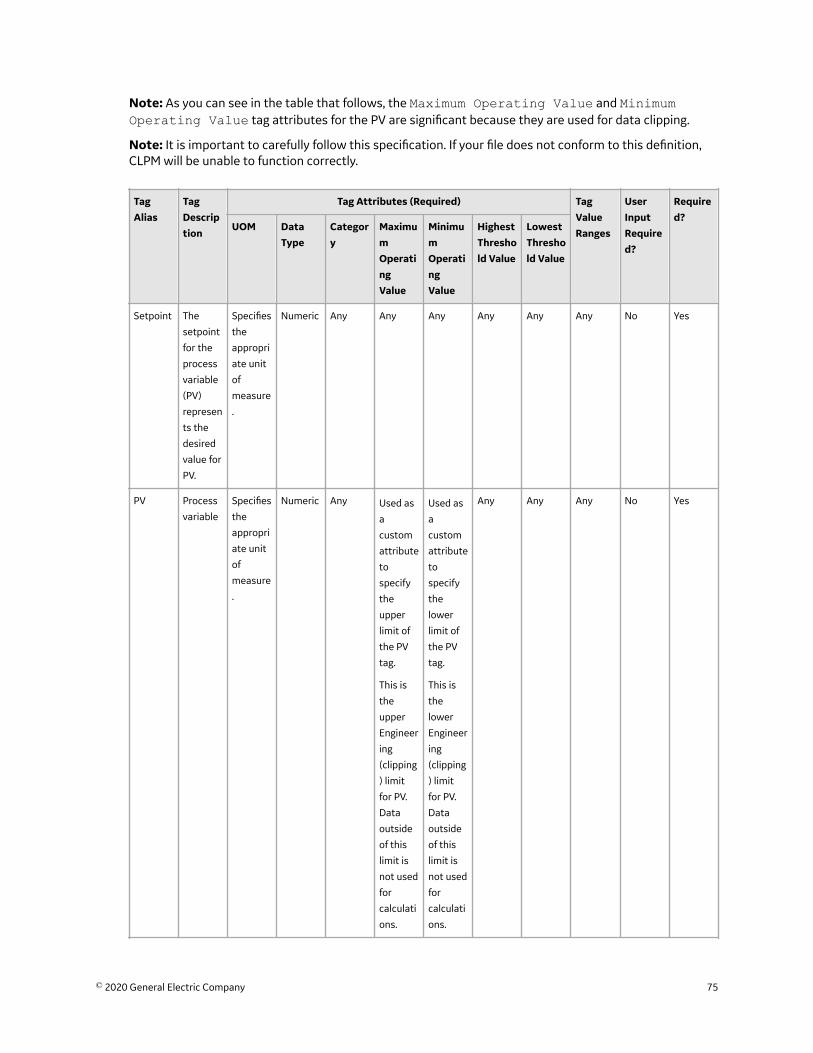
Note: As you can see in the table that follows, the Maximum Operating Value and MinimumOperating Value tag attributes for the PV are significant because they are used for data clipping.
Note: It is important to carefully follow this specification. If your file does not conform to this definition,CLPM will be unable to function correctly.
TagAlias
TagDescription
Tag Attributes (Required) TagValueRanges
UserInputRequired?
Required?
UOM DataType
Category
MaximumOperatingValue
MinimumOperatingValue
HighestThreshold Value
LowestThreshold Value
Setpoint The
setpoint
for the
process
variable
(PV)
represen
ts the
desired
value for
PV.
Specifies
the
appropri
ate unit
of
measure
.
Numeric Any Any Any Any Any Any No Yes
PV Process
variable
Specifies
the
appropri
ate unit
of
measure
.
Numeric Any Used as
a
custom
attribute
to
specify
the
upper
limit of
the PV
tag.
This is
the
upper
Engineer
ing
(clipping
) limit
for PV.
Data
outside
of this
limit is
not used
for
calculati
ons.
Used as
a
custom
attribute
to
specify
the
lower
limit of
the PV
tag.
This is
the
lower
Engineer
ing
(clipping
) limit
for PV.
Data
outside
of this
limit is
not used
for
calculati
ons.
Any Any Any No Yes
© 2020 General Electric Company 75
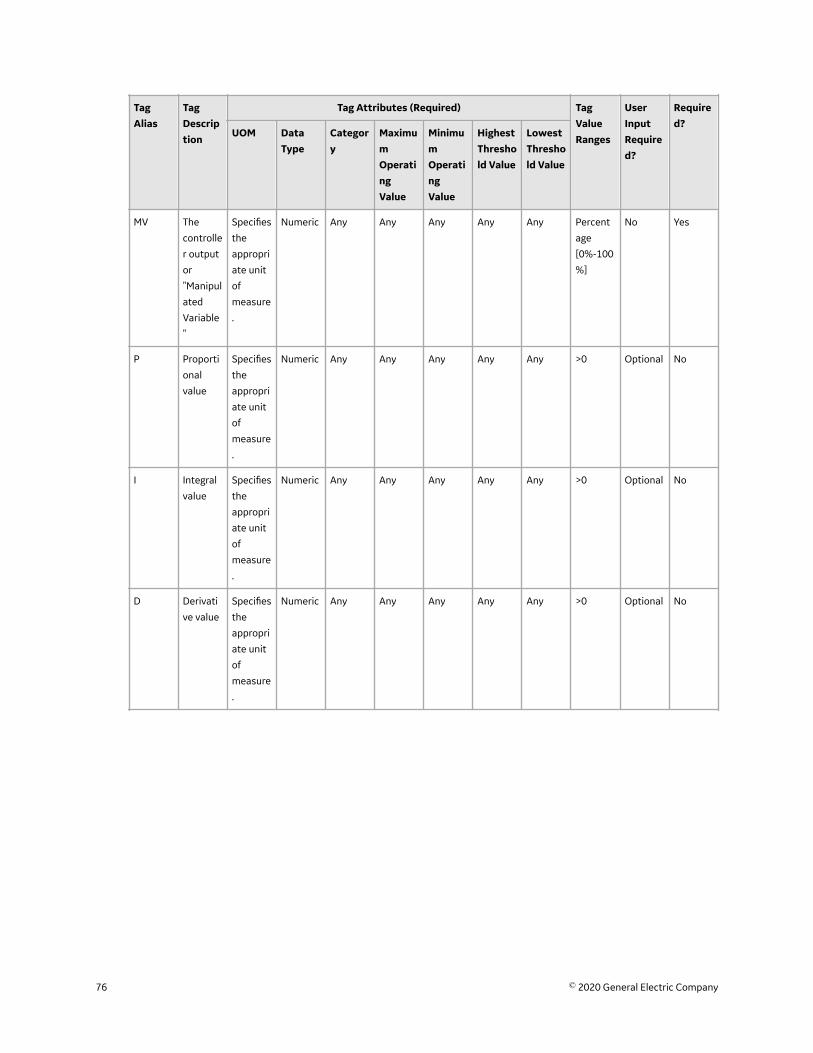
TagAlias
TagDescription
Tag Attributes (Required) TagValueRanges
UserInputRequired?
Required?
UOM DataType
Category
MaximumOperatingValue
MinimumOperatingValue
HighestThreshold Value
LowestThreshold Value
MV The
controlle
r output
or
"Manipul
ated
Variable
"
Specifies
the
appropri
ate unit
of
measure
.
Numeric Any Any Any Any Any Percent
age
[0%-100
%]
No Yes
P Proporti
onal
value
Specifies
the
appropri
ate unit
of
measure
.
Numeric Any Any Any Any Any >0 Optional No
I Integral
value
Specifies
the
appropri
ate unit
of
measure
.
Numeric Any Any Any Any Any >0 Optional No
D Derivati
ve value
Specifies
the
appropri
ate unit
of
measure
.
Numeric Any Any Any Any Any >0 Optional No
76 © 2020 General Electric Company
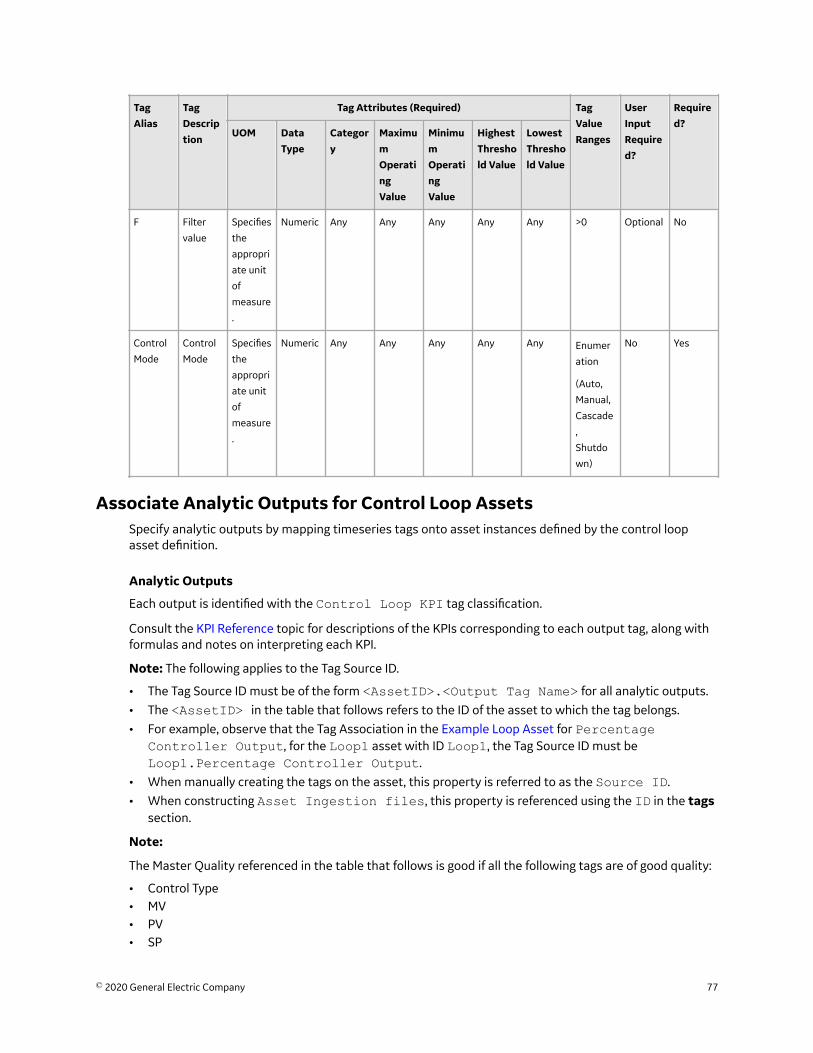
TagAlias
TagDescription
Tag Attributes (Required) TagValueRanges
UserInputRequired?
Required?
UOM DataType
Category
MaximumOperatingValue
MinimumOperatingValue
HighestThreshold Value
LowestThreshold Value
F Filter
value
Specifies
the
appropri
ate unit
of
measure
.
Numeric Any Any Any Any Any >0 Optional No
Control
Mode
Control
Mode
Specifies
the
appropri
ate unit
of
measure
.
Numeric Any Any Any Any Any Enumer
ation
(Auto,
Manual,
Cascade
,
Shutdo
wn)
No Yes
Associate Analytic Outputs for Control Loop AssetsSpecify analytic outputs by mapping timeseries tags onto asset instances defined by the control loopasset definition.
Analytic Outputs
Each output is identified with the Control Loop KPI tag classification.
Consult the KPI Reference topic for descriptions of the KPIs corresponding to each output tag, along withformulas and notes on interpreting each KPI.
Note: The following applies to the Tag Source ID.
• The Tag Source ID must be of the form <AssetID>.<Output Tag Name> for all analytic outputs.• The <AssetID> in the table that follows refers to the ID of the asset to which the tag belongs.• For example, observe that the Tag Association in the Example Loop Asset for Percentage
Controller Output, for the Loop1 asset with ID Loop1, the Tag Source ID must beLoop1.Percentage Controller Output.
• When manually creating the tags on the asset, this property is referred to as the Source ID.• When constructing Asset Ingestion files, this property is referenced using the ID in the tags
section.
Note:
The Master Quality referenced in the table that follows is good if all the following tags are of good quality:
• Control Type• MV• PV• SP
© 2020 General Electric Company 77
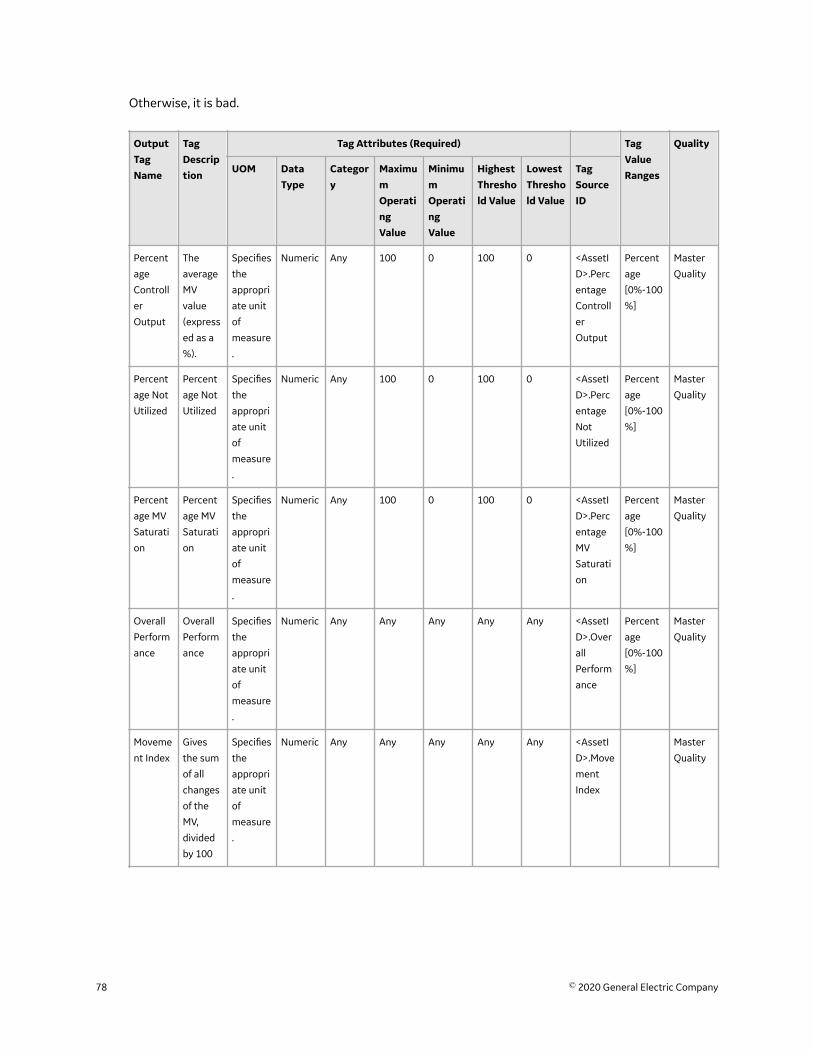
Otherwise, it is bad.
OutputTagName
TagDescription
Tag Attributes (Required) TagValueRanges
Quality
UOM DataType
Category
MaximumOperatingValue
MinimumOperatingValue
HighestThreshold Value
LowestThreshold Value
TagSourceID
Percent
age
Controll
er
Output
The
average
MV
value
(express
ed as a
%).
Specifies
the
appropri
ate unit
of
measure
.
Numeric Any 100 0 100 0 <AssetI
D>.Perc
entage
Controll
er
Output
Percent
age
[0%-100
%]
Master
Quality
Percent
age Not
Utilized
Percent
age Not
Utilized
Specifies
the
appropri
ate unit
of
measure
.
Numeric Any 100 0 100 0 <AssetI
D>.Perc
entage
Not
Utilized
Percent
age
[0%-100
%]
Master
Quality
Percent
age MV
Saturati
on
Percent
age MV
Saturati
on
Specifies
the
appropri
ate unit
of
measure
.
Numeric Any 100 0 100 0 <AssetI
D>.Perc
entage
MV
Saturati
on
Percent
age
[0%-100
%]
Master
Quality
Overall
Perform
ance
Overall
Perform
ance
Specifies
the
appropri
ate unit
of
measure
.
Numeric Any Any Any Any Any <AssetI
D>.Over
all
Perform
ance
Percent
age
[0%-100
%]
Master
Quality
Moveme
nt Index
Gives
the sum
of all
changes
of the
MV,
divided
by 100
Specifies
the
appropri
ate unit
of
measure
.
Numeric Any Any Any Any Any <AssetI
D>.Move
ment
Index
Master
Quality
78 © 2020 General Electric Company
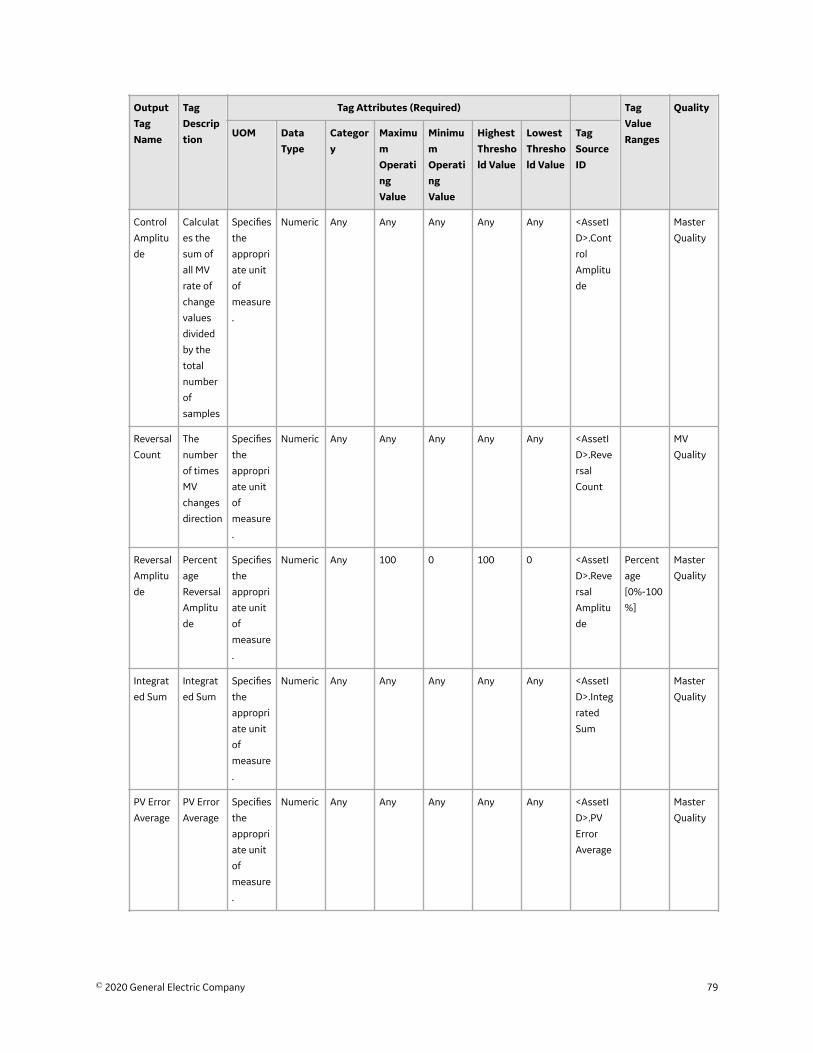
OutputTagName
TagDescription
Tag Attributes (Required) TagValueRanges
Quality
UOM DataType
Category
MaximumOperatingValue
MinimumOperatingValue
HighestThreshold Value
LowestThreshold Value
TagSourceID
Control
Amplitu
de
Calculat
es the
sum of
all MV
rate of
change
values
divided
by the
total
number
of
samples
Specifies
the
appropri
ate unit
of
measure
.
Numeric Any Any Any Any Any <AssetI
D>.Cont
rol
Amplitu
de
Master
Quality
Reversal
Count
The
number
of times
MV
changes
direction
Specifies
the
appropri
ate unit
of
measure
.
Numeric Any Any Any Any Any <AssetI
D>.Reve
rsal
Count
MV
Quality
Reversal
Amplitu
de
Percent
age
Reversal
Amplitu
de
Specifies
the
appropri
ate unit
of
measure
.
Numeric Any 100 0 100 0 <AssetI
D>.Reve
rsal
Amplitu
de
Percent
age
[0%-100
%]
Master
Quality
Integrat
ed Sum
Integrat
ed Sum
Specifies
the
appropri
ate unit
of
measure
.
Numeric Any Any Any Any Any <AssetI
D>.Integ
rated
Sum
Master
Quality
PV Error
Average
PV Error
Average
Specifies
the
appropri
ate unit
of
measure
.
Numeric Any Any Any Any Any <AssetI
D>.PV
Error
Average
Master
Quality
© 2020 General Electric Company 79
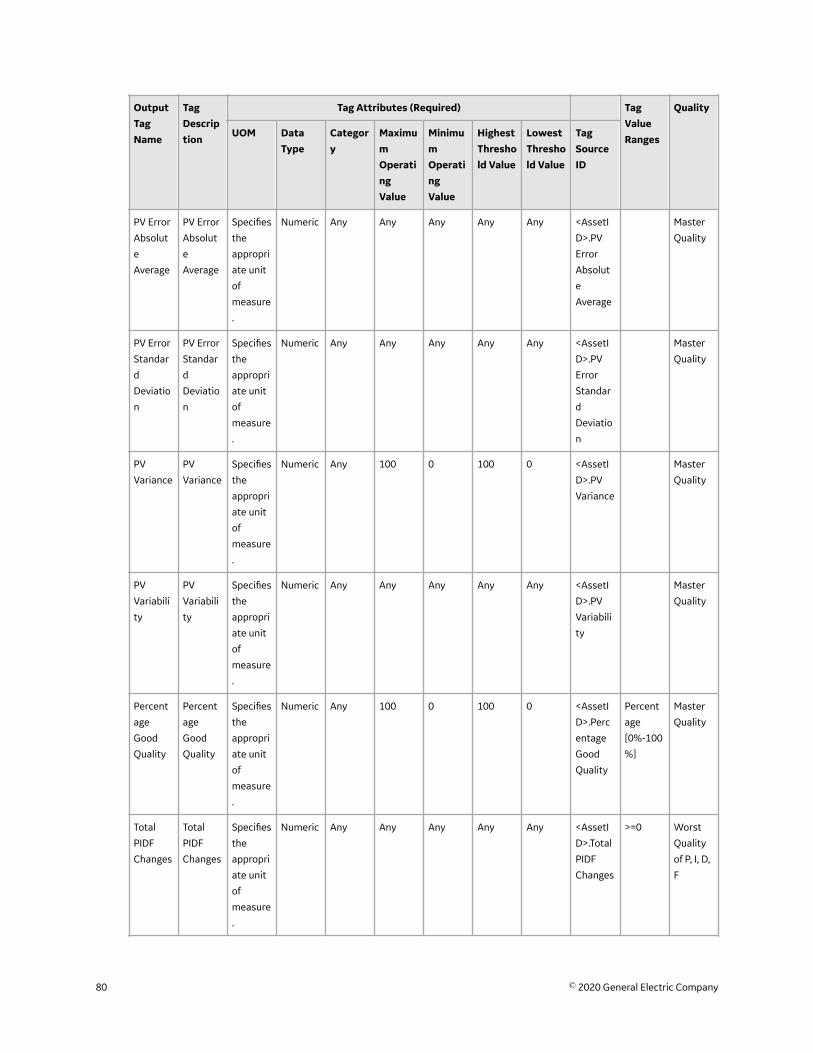
OutputTagName
TagDescription
Tag Attributes (Required) TagValueRanges
Quality
UOM DataType
Category
MaximumOperatingValue
MinimumOperatingValue
HighestThreshold Value
LowestThreshold Value
TagSourceID
PV Error
Absolut
e
Average
PV Error
Absolut
e
Average
Specifies
the
appropri
ate unit
of
measure
.
Numeric Any Any Any Any Any <AssetI
D>.PV
Error
Absolut
e
Average
Master
Quality
PV Error
Standar
d
Deviatio
n
PV Error
Standar
d
Deviatio
n
Specifies
the
appropri
ate unit
of
measure
.
Numeric Any Any Any Any Any <AssetI
D>.PV
Error
Standar
d
Deviatio
n
Master
Quality
PV
Variance
PV
Variance
Specifies
the
appropri
ate unit
of
measure
.
Numeric Any 100 0 100 0 <AssetI
D>.PV
Variance
Master
Quality
PV
Variabili
ty
PV
Variabili
ty
Specifies
the
appropri
ate unit
of
measure
.
Numeric Any Any Any Any Any <AssetI
D>.PV
Variabili
ty
Master
Quality
Percent
age
Good
Quality
Percent
age
Good
Quality
Specifies
the
appropri
ate unit
of
measure
.
Numeric Any 100 0 100 0 <AssetI
D>.Perc
entage
Good
Quality
Percent
age
[0%-100
%]
Master
Quality
Total
PIDF
Changes
Total
PIDF
Changes
Specifies
the
appropri
ate unit
of
measure
.
Numeric Any Any Any Any Any <AssetI
D>.Total
PIDF
Changes
>=0 Worst
Quality
of P, I, D,
F
80 © 2020 General Electric Company
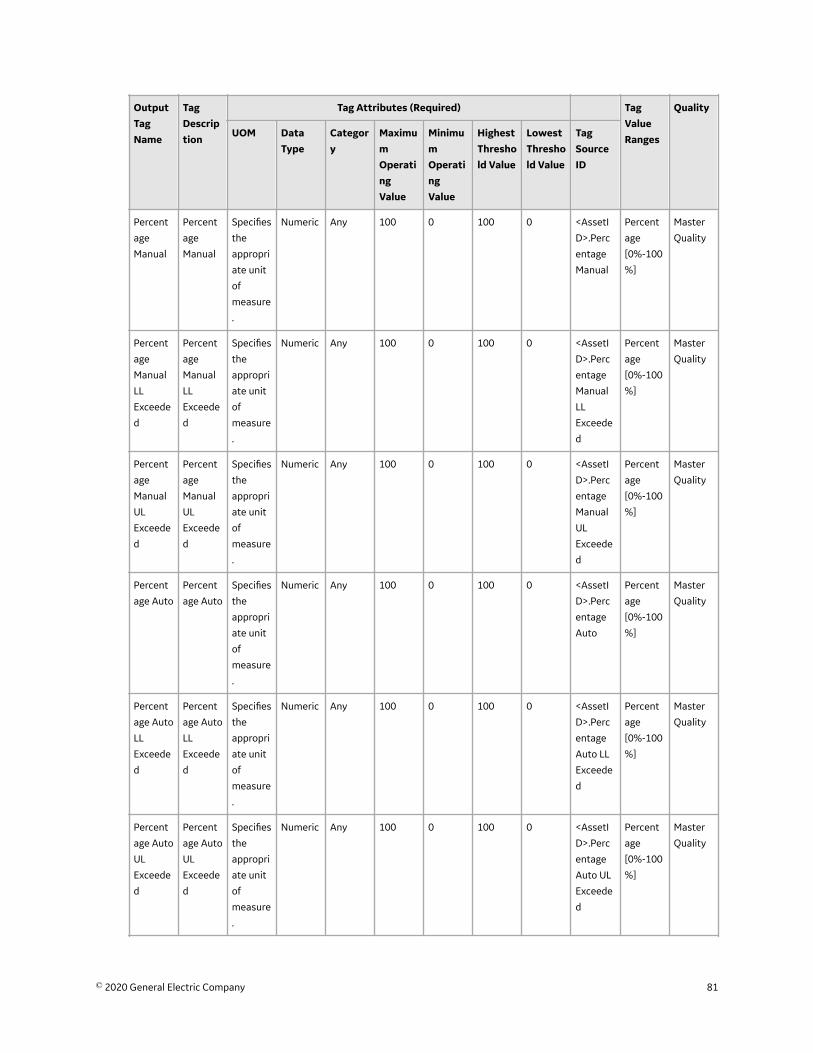
OutputTagName
TagDescription
Tag Attributes (Required) TagValueRanges
Quality
UOM DataType
Category
MaximumOperatingValue
MinimumOperatingValue
HighestThreshold Value
LowestThreshold Value
TagSourceID
Percent
age
Manual
Percent
age
Manual
Specifies
the
appropri
ate unit
of
measure
.
Numeric Any 100 0 100 0 <AssetI
D>.Perc
entage
Manual
Percent
age
[0%-100
%]
Master
Quality
Percent
age
Manual
LL
Exceede
d
Percent
age
Manual
LL
Exceede
d
Specifies
the
appropri
ate unit
of
measure
.
Numeric Any 100 0 100 0 <AssetI
D>.Perc
entage
Manual
LL
Exceede
d
Percent
age
[0%-100
%]
Master
Quality
Percent
age
Manual
UL
Exceede
d
Percent
age
Manual
UL
Exceede
d
Specifies
the
appropri
ate unit
of
measure
.
Numeric Any 100 0 100 0 <AssetI
D>.Perc
entage
Manual
UL
Exceede
d
Percent
age
[0%-100
%]
Master
Quality
Percent
age Auto
Percent
age Auto
Specifies
the
appropri
ate unit
of
measure
.
Numeric Any 100 0 100 0 <AssetI
D>.Perc
entage
Auto
Percent
age
[0%-100
%]
Master
Quality
Percent
age Auto
LL
Exceede
d
Percent
age Auto
LL
Exceede
d
Specifies
the
appropri
ate unit
of
measure
.
Numeric Any 100 0 100 0 <AssetI
D>.Perc
entage
Auto LL
Exceede
d
Percent
age
[0%-100
%]
Master
Quality
Percent
age Auto
UL
Exceede
d
Percent
age Auto
UL
Exceede
d
Specifies
the
appropri
ate unit
of
measure
.
Numeric Any 100 0 100 0 <AssetI
D>.Perc
entage
Auto UL
Exceede
d
Percent
age
[0%-100
%]
Master
Quality
© 2020 General Electric Company 81
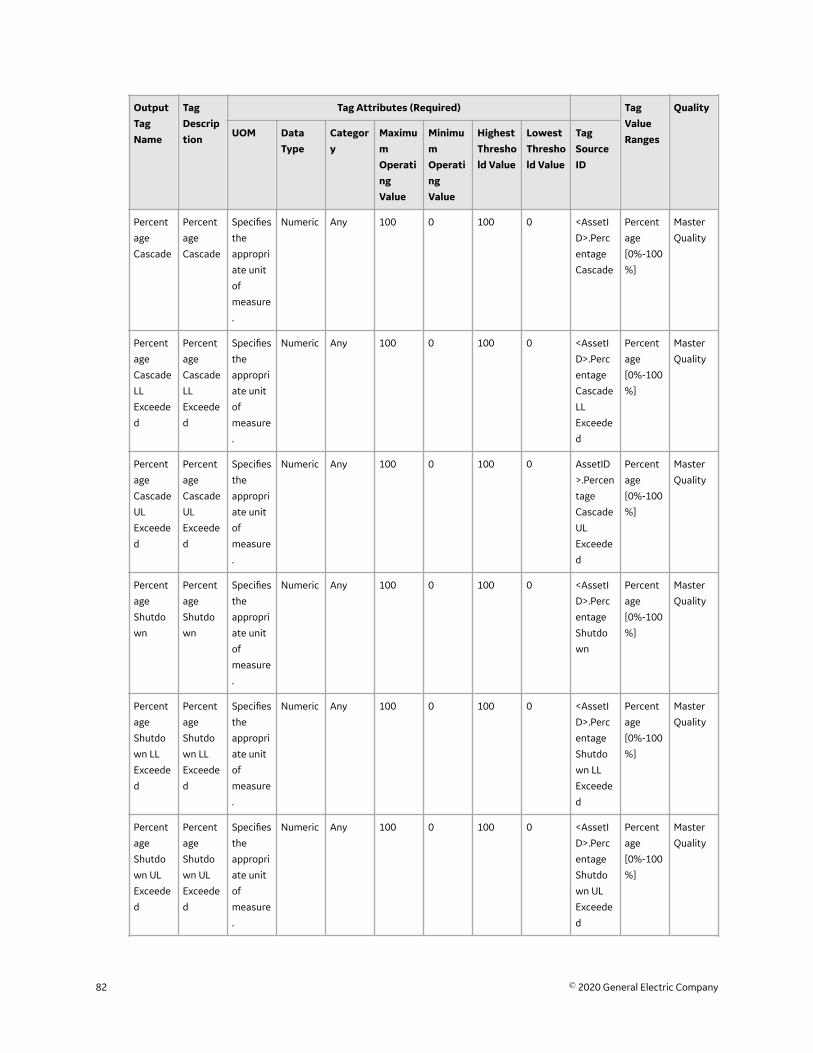
OutputTagName
TagDescription
Tag Attributes (Required) TagValueRanges
Quality
UOM DataType
Category
MaximumOperatingValue
MinimumOperatingValue
HighestThreshold Value
LowestThreshold Value
TagSourceID
Percent
age
Cascade
Percent
age
Cascade
Specifies
the
appropri
ate unit
of
measure
.
Numeric Any 100 0 100 0 <AssetI
D>.Perc
entage
Cascade
Percent
age
[0%-100
%]
Master
Quality
Percent
age
Cascade
LL
Exceede
d
Percent
age
Cascade
LL
Exceede
d
Specifies
the
appropri
ate unit
of
measure
.
Numeric Any 100 0 100 0 <AssetI
D>.Perc
entage
Cascade
LL
Exceede
d
Percent
age
[0%-100
%]
Master
Quality
Percent
age
Cascade
UL
Exceede
d
Percent
age
Cascade
UL
Exceede
d
Specifies
the
appropri
ate unit
of
measure
.
Numeric Any 100 0 100 0 AssetID
>.Percen
tage
Cascade
UL
Exceede
d
Percent
age
[0%-100
%]
Master
Quality
Percent
age
Shutdo
wn
Percent
age
Shutdo
wn
Specifies
the
appropri
ate unit
of
measure
.
Numeric Any 100 0 100 0 <AssetI
D>.Perc
entage
Shutdo
wn
Percent
age
[0%-100
%]
Master
Quality
Percent
age
Shutdo
wn LL
Exceede
d
Percent
age
Shutdo
wn LL
Exceede
d
Specifies
the
appropri
ate unit
of
measure
.
Numeric Any 100 0 100 0 <AssetI
D>.Perc
entage
Shutdo
wn LL
Exceede
d
Percent
age
[0%-100
%]
Master
Quality
Percent
age
Shutdo
wn UL
Exceede
d
Percent
age
Shutdo
wn UL
Exceede
d
Specifies
the
appropri
ate unit
of
measure
.
Numeric Any 100 0 100 0 <AssetI
D>.Perc
entage
Shutdo
wn UL
Exceede
d
Percent
age
[0%-100
%]
Master
Quality
82 © 2020 General Electric Company
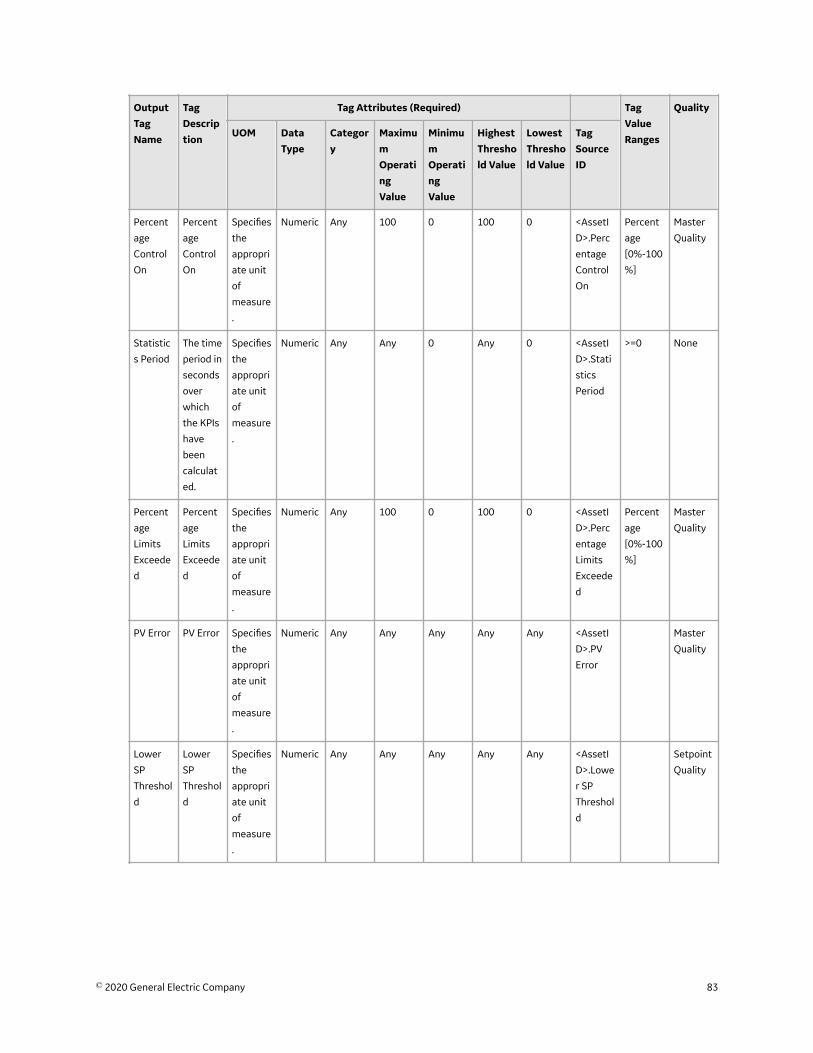
OutputTagName
TagDescription
Tag Attributes (Required) TagValueRanges
Quality
UOM DataType
Category
MaximumOperatingValue
MinimumOperatingValue
HighestThreshold Value
LowestThreshold Value
TagSourceID
Percent
age
Control
On
Percent
age
Control
On
Specifies
the
appropri
ate unit
of
measure
.
Numeric Any 100 0 100 0 <AssetI
D>.Perc
entage
Control
On
Percent
age
[0%-100
%]
Master
Quality
Statistic
s Period
The time
period in
seconds
over
which
the KPIs
have
been
calculat
ed.
Specifies
the
appropri
ate unit
of
measure
.
Numeric Any Any 0 Any 0 <AssetI
D>.Stati
stics
Period
>=0 None
Percent
age
Limits
Exceede
d
Percent
age
Limits
Exceede
d
Specifies
the
appropri
ate unit
of
measure
.
Numeric Any 100 0 100 0 <AssetI
D>.Perc
entage
Limits
Exceede
d
Percent
age
[0%-100
%]
Master
Quality
PV Error PV Error Specifies
the
appropri
ate unit
of
measure
.
Numeric Any Any Any Any Any <AssetI
D>.PV
Error
Master
Quality
Lower
SP
Threshol
d
Lower
SP
Threshol
d
Specifies
the
appropri
ate unit
of
measure
.
Numeric Any Any Any Any Any <AssetI
D>.Lowe
r SP
Threshol
d
Setpoint
Quality
© 2020 General Electric Company 83
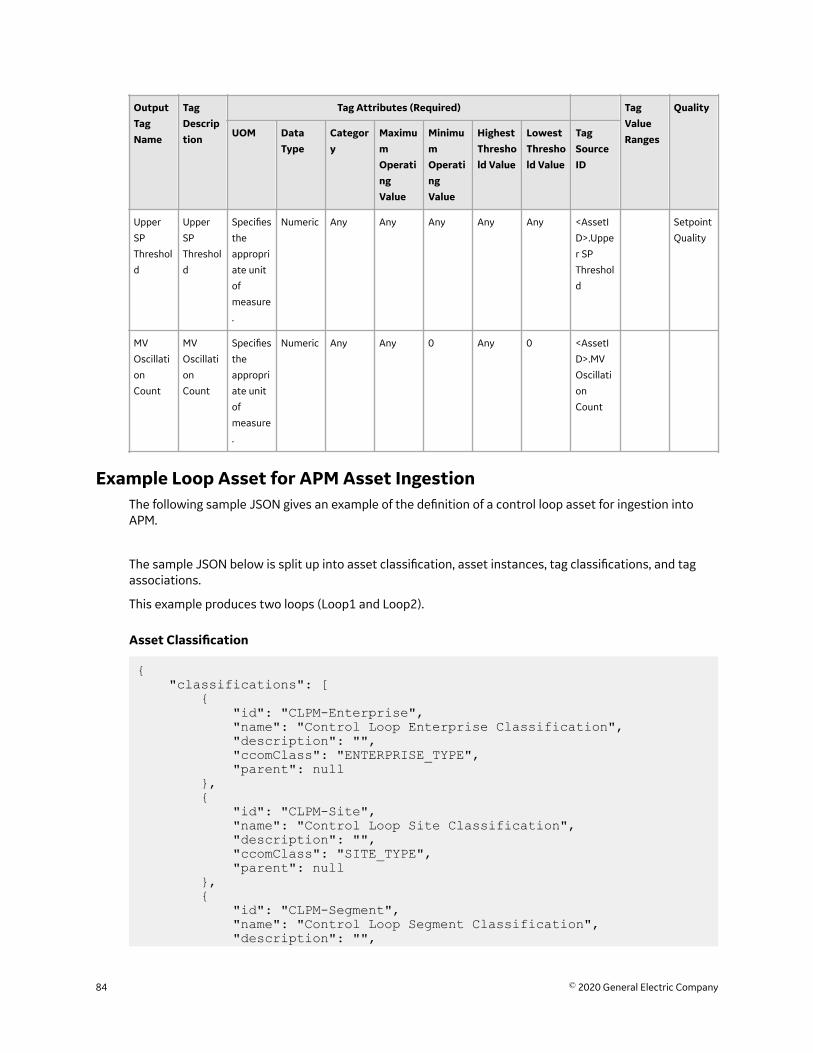
OutputTagName
TagDescription
Tag Attributes (Required) TagValueRanges
Quality
UOM DataType
Category
MaximumOperatingValue
MinimumOperatingValue
HighestThreshold Value
LowestThreshold Value
TagSourceID
Upper
SP
Threshol
d
Upper
SP
Threshol
d
Specifies
the
appropri
ate unit
of
measure
.
Numeric Any Any Any Any Any <AssetI
D>.Uppe
r SP
Threshol
d
Setpoint
Quality
MV
Oscillati
on
Count
MV
Oscillati
on
Count
Specifies
the
appropri
ate unit
of
measure
.
Numeric Any Any 0 Any 0 <AssetI
D>.MV
Oscillati
on
Count
Example Loop Asset for APM Asset IngestionThe following sample JSON gives an example of the definition of a control loop asset for ingestion intoAPM.
The sample JSON below is split up into asset classification, asset instances, tag classifications, and tagassociations.
This example produces two loops (Loop1 and Loop2).
Asset Classification
{ "classifications": [ { "id": "CLPM-Enterprise", "name": "Control Loop Enterprise Classification", "description": "", "ccomClass": "ENTERPRISE_TYPE", "parent": null }, { "id": "CLPM-Site", "name": "Control Loop Site Classification", "description": "", "ccomClass": "SITE_TYPE", "parent": null }, { "id": "CLPM-Segment", "name": "Control Loop Segment Classification", "description": "",
84 © 2020 General Electric Company
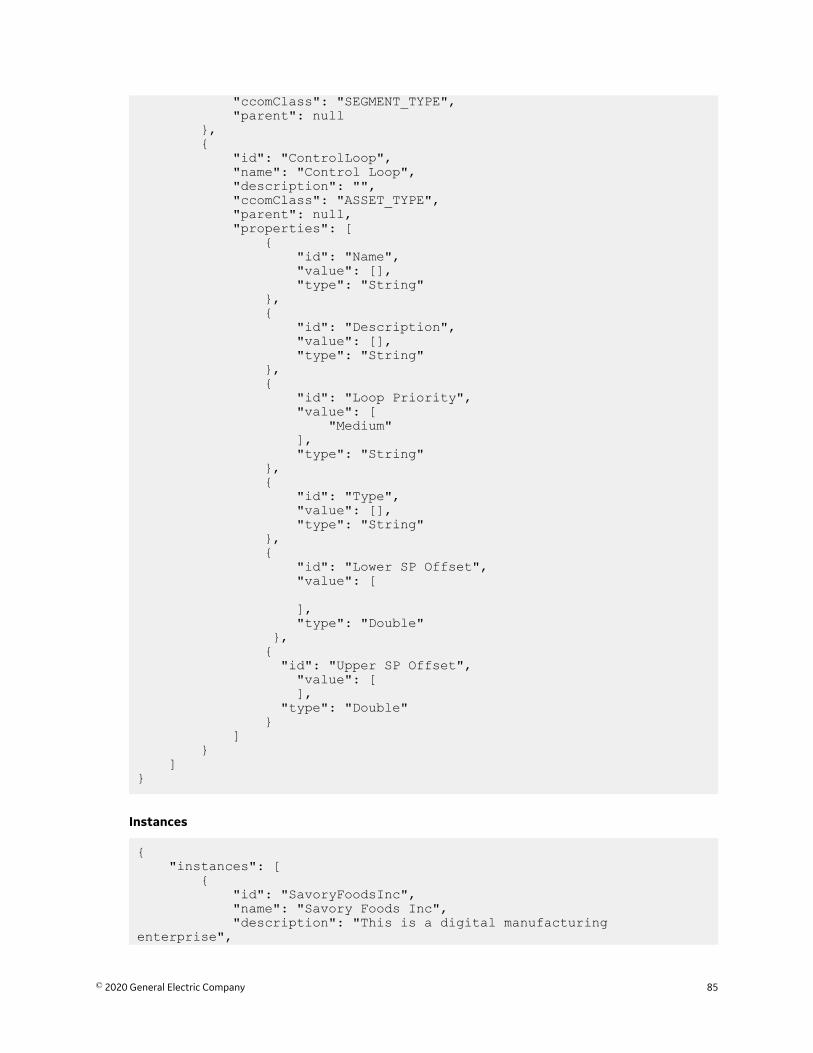
"ccomClass": "SEGMENT_TYPE", "parent": null }, { "id": "ControlLoop", "name": "Control Loop", "description": "", "ccomClass": "ASSET_TYPE", "parent": null, "properties": [ { "id": "Name", "value": [], "type": "String" }, { "id": "Description", "value": [], "type": "String" }, { "id": "Loop Priority", "value": [ "Medium" ], "type": "String" }, { "id": "Type", "value": [], "type": "String" }, { "id": "Lower SP Offset", "value": [ ], "type": "Double" }, { "id": "Upper SP Offset", "value": [ ], "type": "Double" } ] } ]}
Instances
{ "instances": [ { "id": "SavoryFoodsInc", "name": "Savory Foods Inc", "description": "This is a digital manufacturing enterprise",
© 2020 General Electric Company 85
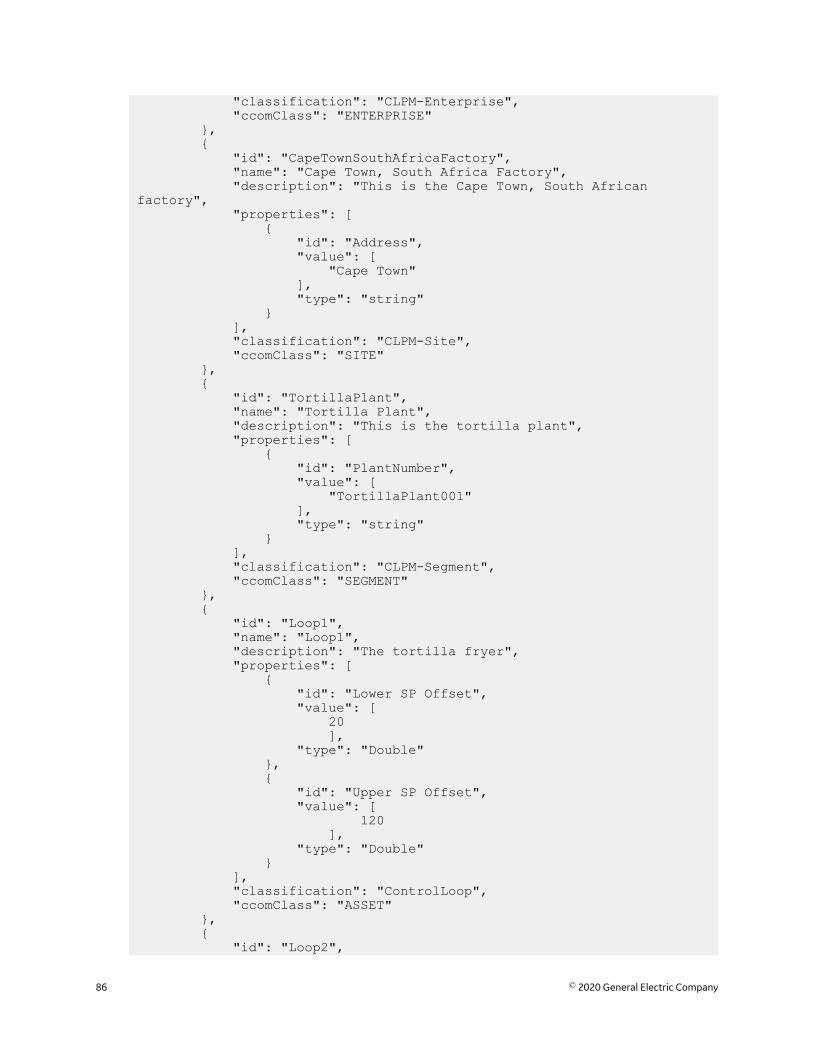
"classification": "CLPM-Enterprise", "ccomClass": "ENTERPRISE" }, { "id": "CapeTownSouthAfricaFactory", "name": "Cape Town, South Africa Factory", "description": "This is the Cape Town, South African factory", "properties": [ { "id": "Address", "value": [ "Cape Town" ], "type": "string" } ], "classification": "CLPM-Site", "ccomClass": "SITE" }, { "id": "TortillaPlant", "name": "Tortilla Plant", "description": "This is the tortilla plant", "properties": [ { "id": "PlantNumber", "value": [ "TortillaPlant001" ], "type": "string" } ], "classification": "CLPM-Segment", "ccomClass": "SEGMENT" }, { "id": "Loop1", "name": "Loop1", "description": "The tortilla fryer", "properties": [ { "id": "Lower SP Offset", "value": [ 20 ], "type": "Double" }, { "id": "Upper SP Offset", "value": [ 120 ], "type": "Double" } ], "classification": "ControlLoop", "ccomClass": "ASSET" }, { "id": "Loop2",
86 © 2020 General Electric Company
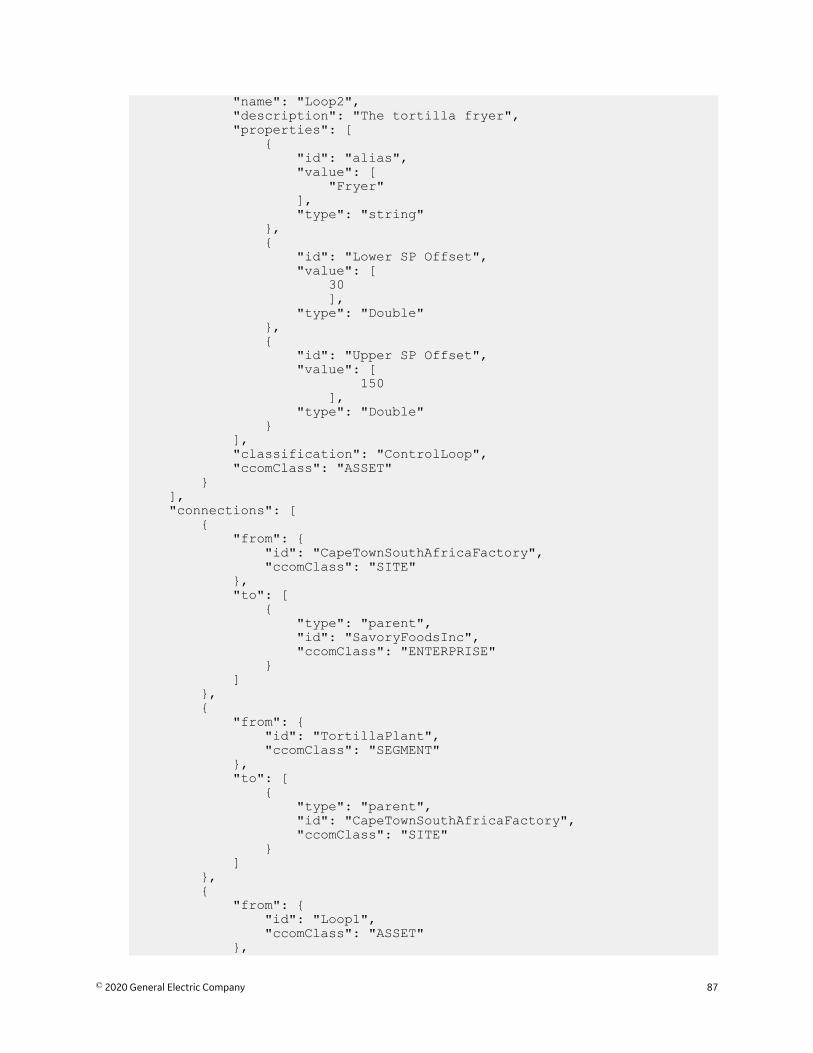
"name": "Loop2", "description": "The tortilla fryer", "properties": [ { "id": "alias", "value": [ "Fryer" ], "type": "string" }, { "id": "Lower SP Offset", "value": [ 30 ], "type": "Double" }, { "id": "Upper SP Offset", "value": [ 150 ], "type": "Double" } ], "classification": "ControlLoop", "ccomClass": "ASSET" } ], "connections": [ { "from": { "id": "CapeTownSouthAfricaFactory", "ccomClass": "SITE" }, "to": [ { "type": "parent", "id": "SavoryFoodsInc", "ccomClass": "ENTERPRISE" } ] }, { "from": { "id": "TortillaPlant", "ccomClass": "SEGMENT" }, "to": [ { "type": "parent", "id": "CapeTownSouthAfricaFactory", "ccomClass": "SITE" } ] }, { "from": { "id": "Loop1", "ccomClass": "ASSET" },
© 2020 General Electric Company 87
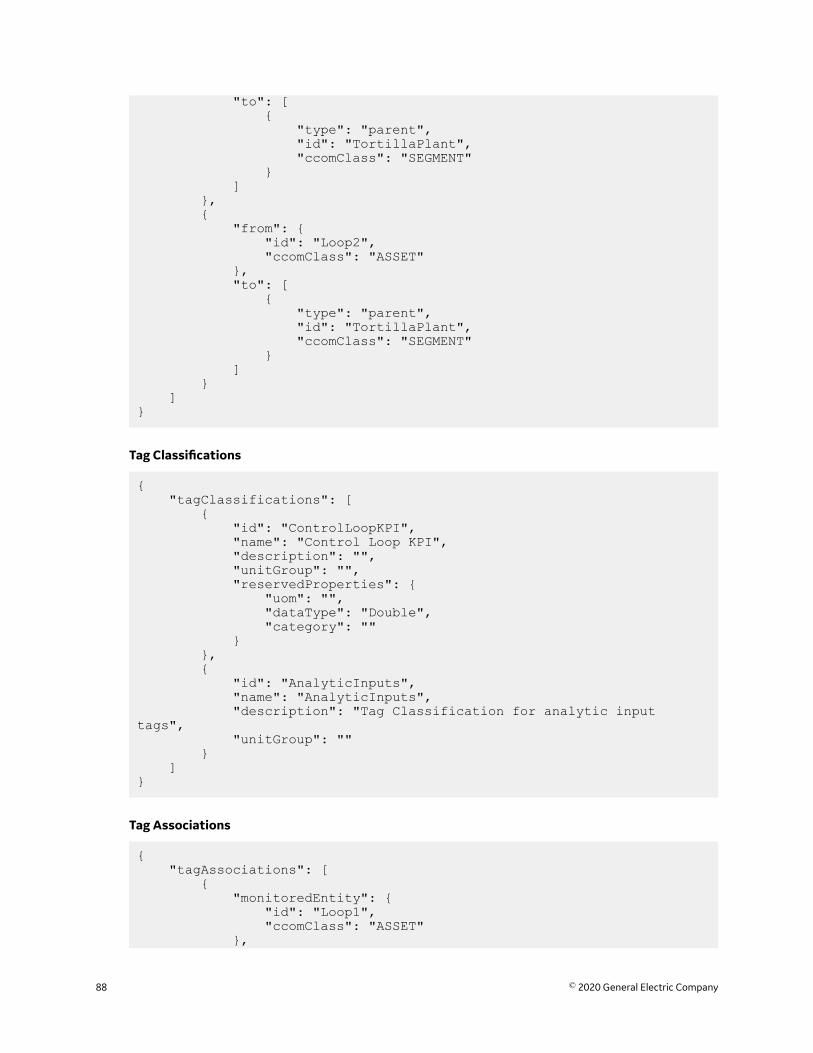
"to": [ { "type": "parent", "id": "TortillaPlant", "ccomClass": "SEGMENT" } ] }, { "from": { "id": "Loop2", "ccomClass": "ASSET" }, "to": [ { "type": "parent", "id": "TortillaPlant", "ccomClass": "SEGMENT" } ] } ]}
Tag Classifications
{ "tagClassifications": [ { "id": "ControlLoopKPI", "name": "Control Loop KPI", "description": "", "unitGroup": "", "reservedProperties": { "uom": "", "dataType": "Double", "category": "" } }, { "id": "AnalyticInputs", "name": "AnalyticInputs", "description": "Tag Classification for analytic input tags", "unitGroup": "" } ]}
Tag Associations
{ "tagAssociations": [ { "monitoredEntity": { "id": "Loop1", "ccomClass": "ASSET" },
88 © 2020 General Electric Company
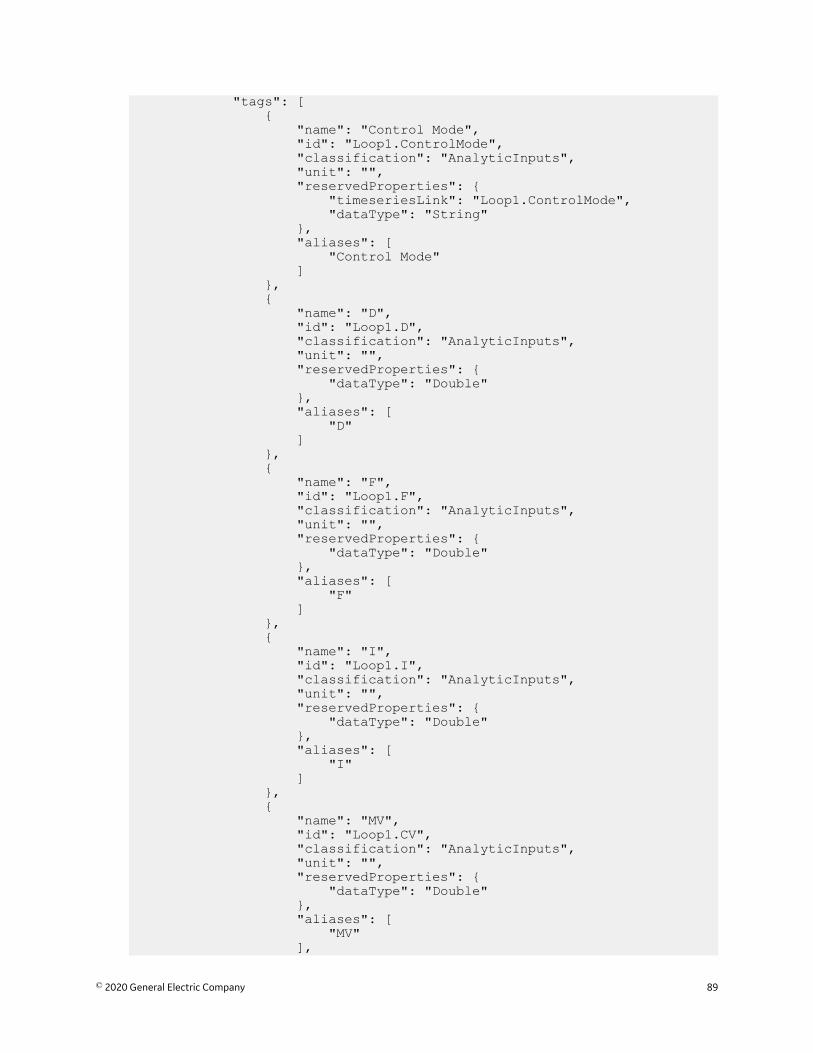
"tags": [ { "name": "Control Mode", "id": "Loop1.ControlMode", "classification": "AnalyticInputs", "unit": "", "reservedProperties": { "timeseriesLink": "Loop1.ControlMode", "dataType": "String" }, "aliases": [ "Control Mode" ] }, { "name": "D", "id": "Loop1.D", "classification": "AnalyticInputs", "unit": "", "reservedProperties": { "dataType": "Double" }, "aliases": [ "D" ] }, { "name": "F", "id": "Loop1.F", "classification": "AnalyticInputs", "unit": "", "reservedProperties": { "dataType": "Double" }, "aliases": [ "F" ] }, { "name": "I", "id": "Loop1.I", "classification": "AnalyticInputs", "unit": "", "reservedProperties": { "dataType": "Double" }, "aliases": [ "I" ] }, { "name": "MV", "id": "Loop1.CV", "classification": "AnalyticInputs", "unit": "", "reservedProperties": { "dataType": "Double" }, "aliases": [ "MV" ],
© 2020 General Electric Company 89
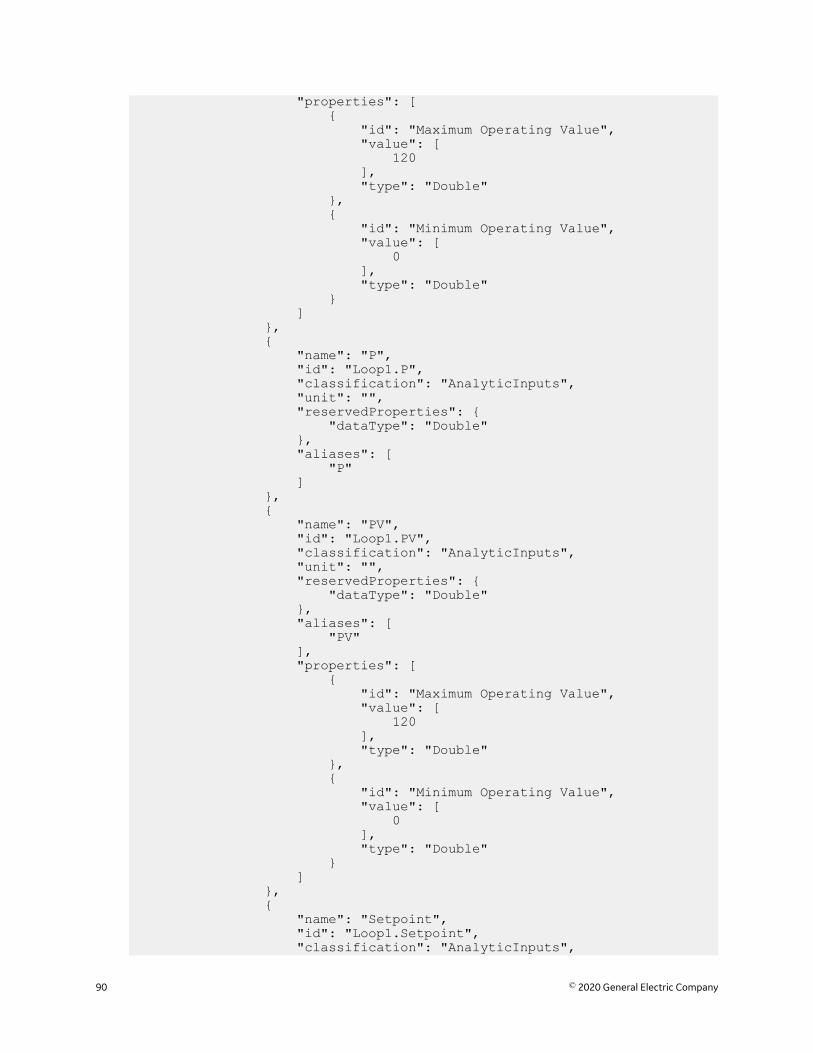
"properties": [ { "id": "Maximum Operating Value", "value": [ 120 ], "type": "Double" }, { "id": "Minimum Operating Value", "value": [ 0 ], "type": "Double" } ] }, { "name": "P", "id": "Loop1.P", "classification": "AnalyticInputs", "unit": "", "reservedProperties": { "dataType": "Double" }, "aliases": [ "P" ] }, { "name": "PV", "id": "Loop1.PV", "classification": "AnalyticInputs", "unit": "", "reservedProperties": { "dataType": "Double" }, "aliases": [ "PV" ], "properties": [ { "id": "Maximum Operating Value", "value": [ 120 ], "type": "Double" }, { "id": "Minimum Operating Value", "value": [ 0 ], "type": "Double" } ] }, { "name": "Setpoint", "id": "Loop1.Setpoint", "classification": "AnalyticInputs",
90 © 2020 General Electric Company
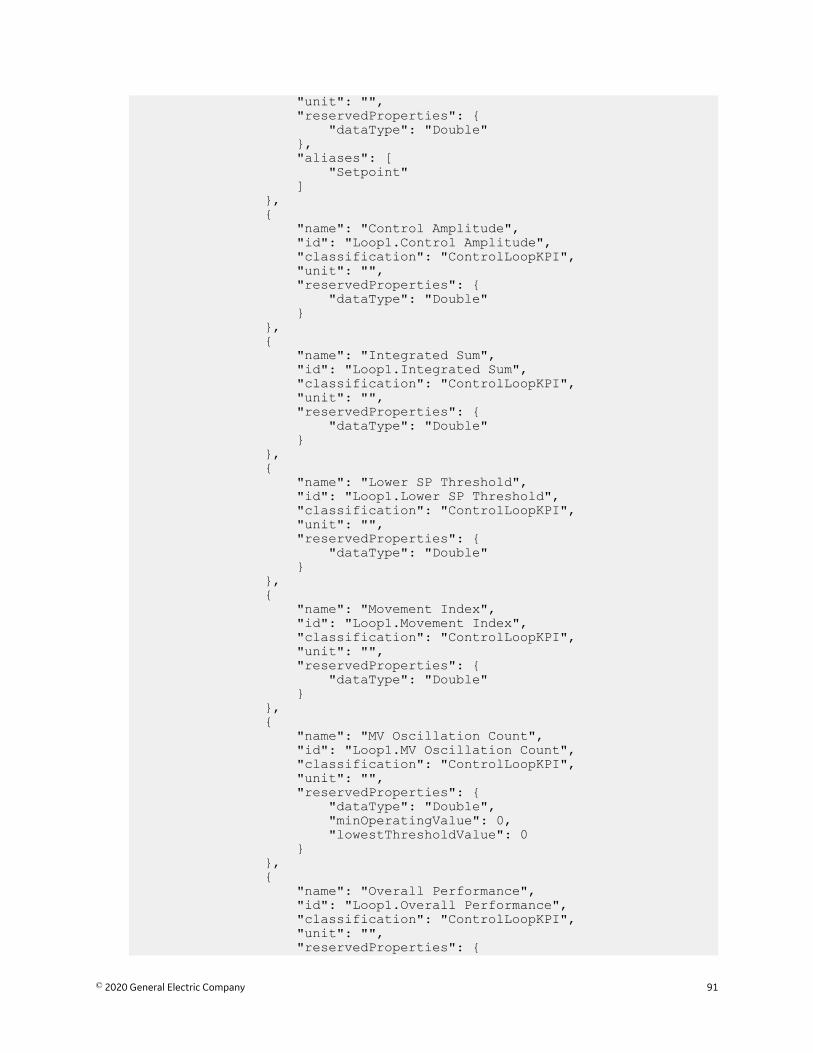
"unit": "", "reservedProperties": { "dataType": "Double" }, "aliases": [ "Setpoint" ] }, { "name": "Control Amplitude", "id": "Loop1.Control Amplitude", "classification": "ControlLoopKPI", "unit": "", "reservedProperties": { "dataType": "Double" } }, { "name": "Integrated Sum", "id": "Loop1.Integrated Sum", "classification": "ControlLoopKPI", "unit": "", "reservedProperties": { "dataType": "Double" } }, { "name": "Lower SP Threshold", "id": "Loop1.Lower SP Threshold", "classification": "ControlLoopKPI", "unit": "", "reservedProperties": { "dataType": "Double" } }, { "name": "Movement Index", "id": "Loop1.Movement Index", "classification": "ControlLoopKPI", "unit": "", "reservedProperties": { "dataType": "Double" } }, { "name": "MV Oscillation Count", "id": "Loop1.MV Oscillation Count", "classification": "ControlLoopKPI", "unit": "", "reservedProperties": { "dataType": "Double", "minOperatingValue": 0, "lowestThresholdValue": 0 } }, { "name": "Overall Performance", "id": "Loop1.Overall Performance", "classification": "ControlLoopKPI", "unit": "", "reservedProperties": {
© 2020 General Electric Company 91
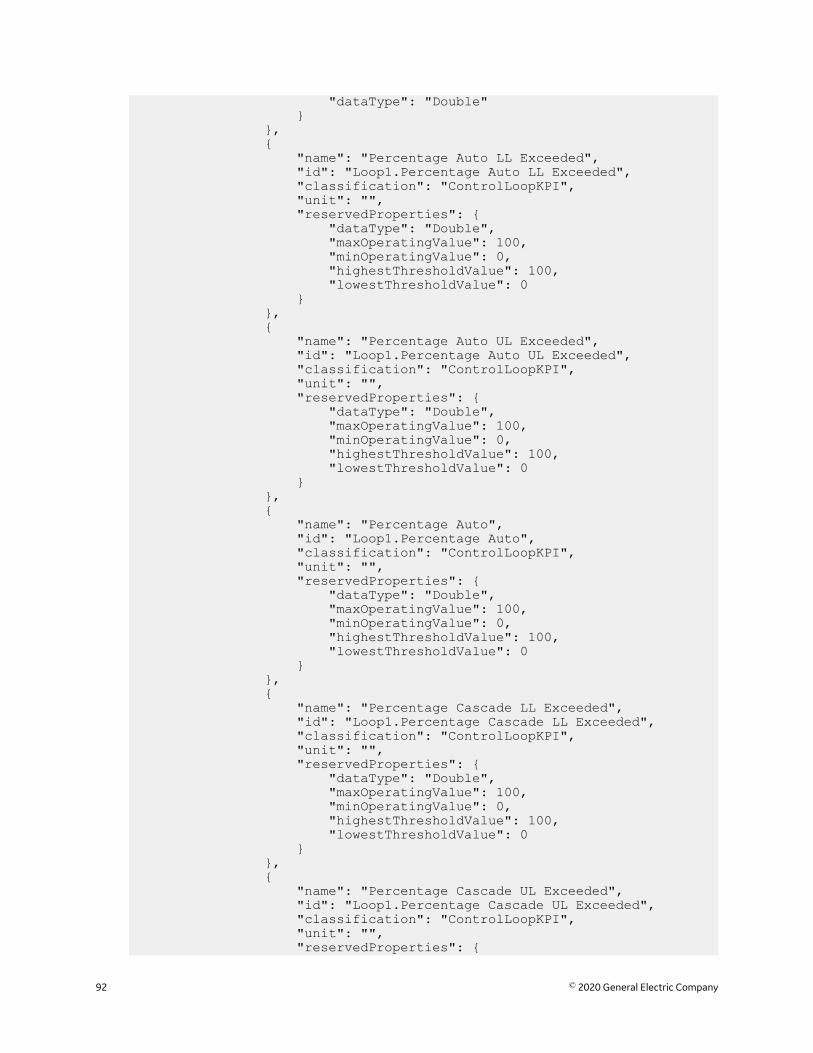
"dataType": "Double" } }, { "name": "Percentage Auto LL Exceeded", "id": "Loop1.Percentage Auto LL Exceeded", "classification": "ControlLoopKPI", "unit": "", "reservedProperties": { "dataType": "Double", "maxOperatingValue": 100, "minOperatingValue": 0, "highestThresholdValue": 100, "lowestThresholdValue": 0 } }, { "name": "Percentage Auto UL Exceeded", "id": "Loop1.Percentage Auto UL Exceeded", "classification": "ControlLoopKPI", "unit": "", "reservedProperties": { "dataType": "Double", "maxOperatingValue": 100, "minOperatingValue": 0, "highestThresholdValue": 100, "lowestThresholdValue": 0 } }, { "name": "Percentage Auto", "id": "Loop1.Percentage Auto", "classification": "ControlLoopKPI", "unit": "", "reservedProperties": { "dataType": "Double", "maxOperatingValue": 100, "minOperatingValue": 0, "highestThresholdValue": 100, "lowestThresholdValue": 0 } }, { "name": "Percentage Cascade LL Exceeded", "id": "Loop1.Percentage Cascade LL Exceeded", "classification": "ControlLoopKPI", "unit": "", "reservedProperties": { "dataType": "Double", "maxOperatingValue": 100, "minOperatingValue": 0, "highestThresholdValue": 100, "lowestThresholdValue": 0 } }, { "name": "Percentage Cascade UL Exceeded", "id": "Loop1.Percentage Cascade UL Exceeded", "classification": "ControlLoopKPI", "unit": "", "reservedProperties": {
92 © 2020 General Electric Company
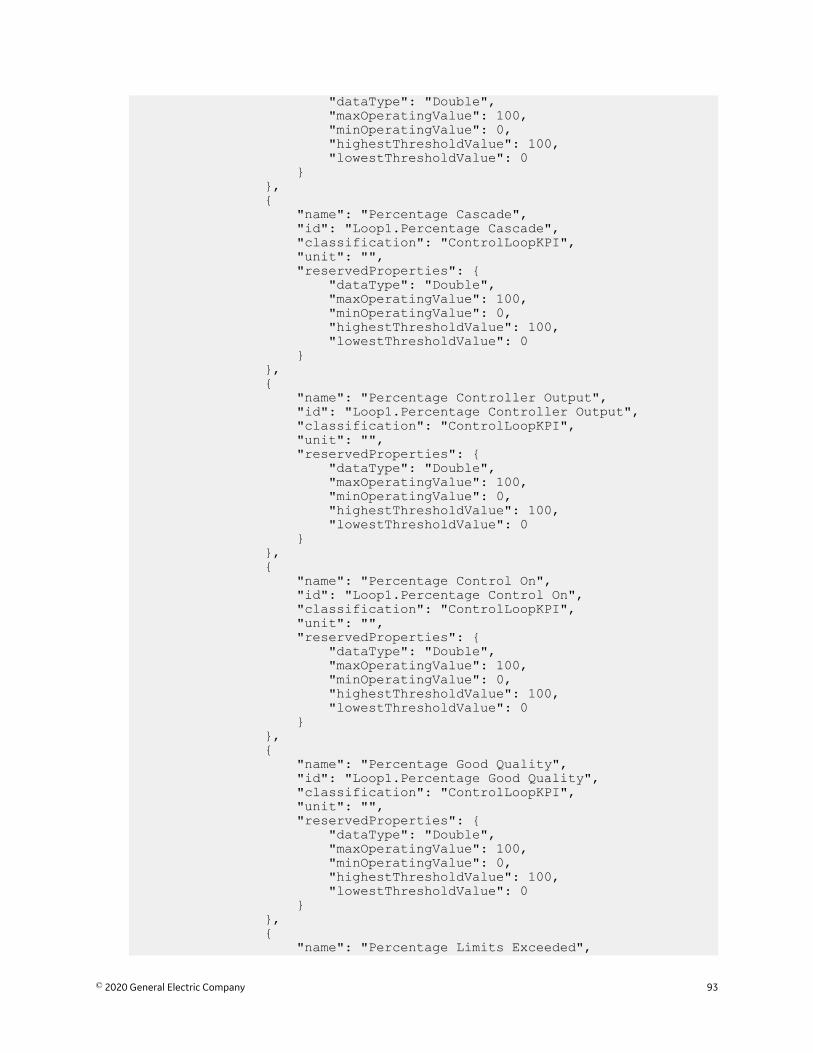
"dataType": "Double", "maxOperatingValue": 100, "minOperatingValue": 0, "highestThresholdValue": 100, "lowestThresholdValue": 0 } }, { "name": "Percentage Cascade", "id": "Loop1.Percentage Cascade", "classification": "ControlLoopKPI", "unit": "", "reservedProperties": { "dataType": "Double", "maxOperatingValue": 100, "minOperatingValue": 0, "highestThresholdValue": 100, "lowestThresholdValue": 0 } }, { "name": "Percentage Controller Output", "id": "Loop1.Percentage Controller Output", "classification": "ControlLoopKPI", "unit": "", "reservedProperties": { "dataType": "Double", "maxOperatingValue": 100, "minOperatingValue": 0, "highestThresholdValue": 100, "lowestThresholdValue": 0 } }, { "name": "Percentage Control On", "id": "Loop1.Percentage Control On", "classification": "ControlLoopKPI", "unit": "", "reservedProperties": { "dataType": "Double", "maxOperatingValue": 100, "minOperatingValue": 0, "highestThresholdValue": 100, "lowestThresholdValue": 0 } }, { "name": "Percentage Good Quality", "id": "Loop1.Percentage Good Quality", "classification": "ControlLoopKPI", "unit": "", "reservedProperties": { "dataType": "Double", "maxOperatingValue": 100, "minOperatingValue": 0, "highestThresholdValue": 100, "lowestThresholdValue": 0 } }, { "name": "Percentage Limits Exceeded",
© 2020 General Electric Company 93
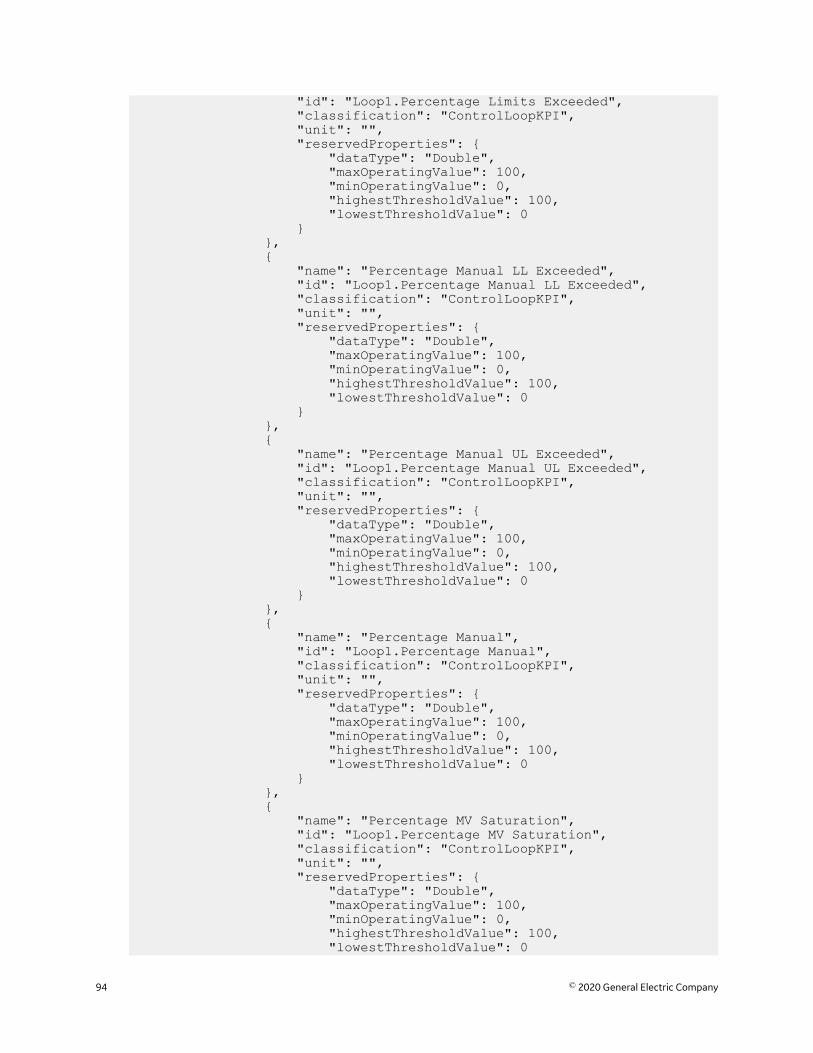
"id": "Loop1.Percentage Limits Exceeded", "classification": "ControlLoopKPI", "unit": "", "reservedProperties": { "dataType": "Double", "maxOperatingValue": 100, "minOperatingValue": 0, "highestThresholdValue": 100, "lowestThresholdValue": 0 } }, { "name": "Percentage Manual LL Exceeded", "id": "Loop1.Percentage Manual LL Exceeded", "classification": "ControlLoopKPI", "unit": "", "reservedProperties": { "dataType": "Double", "maxOperatingValue": 100, "minOperatingValue": 0, "highestThresholdValue": 100, "lowestThresholdValue": 0 } }, { "name": "Percentage Manual UL Exceeded", "id": "Loop1.Percentage Manual UL Exceeded", "classification": "ControlLoopKPI", "unit": "", "reservedProperties": { "dataType": "Double", "maxOperatingValue": 100, "minOperatingValue": 0, "highestThresholdValue": 100, "lowestThresholdValue": 0 } }, { "name": "Percentage Manual", "id": "Loop1.Percentage Manual", "classification": "ControlLoopKPI", "unit": "", "reservedProperties": { "dataType": "Double", "maxOperatingValue": 100, "minOperatingValue": 0, "highestThresholdValue": 100, "lowestThresholdValue": 0 } }, { "name": "Percentage MV Saturation", "id": "Loop1.Percentage MV Saturation", "classification": "ControlLoopKPI", "unit": "", "reservedProperties": { "dataType": "Double", "maxOperatingValue": 100, "minOperatingValue": 0, "highestThresholdValue": 100, "lowestThresholdValue": 0
94 © 2020 General Electric Company
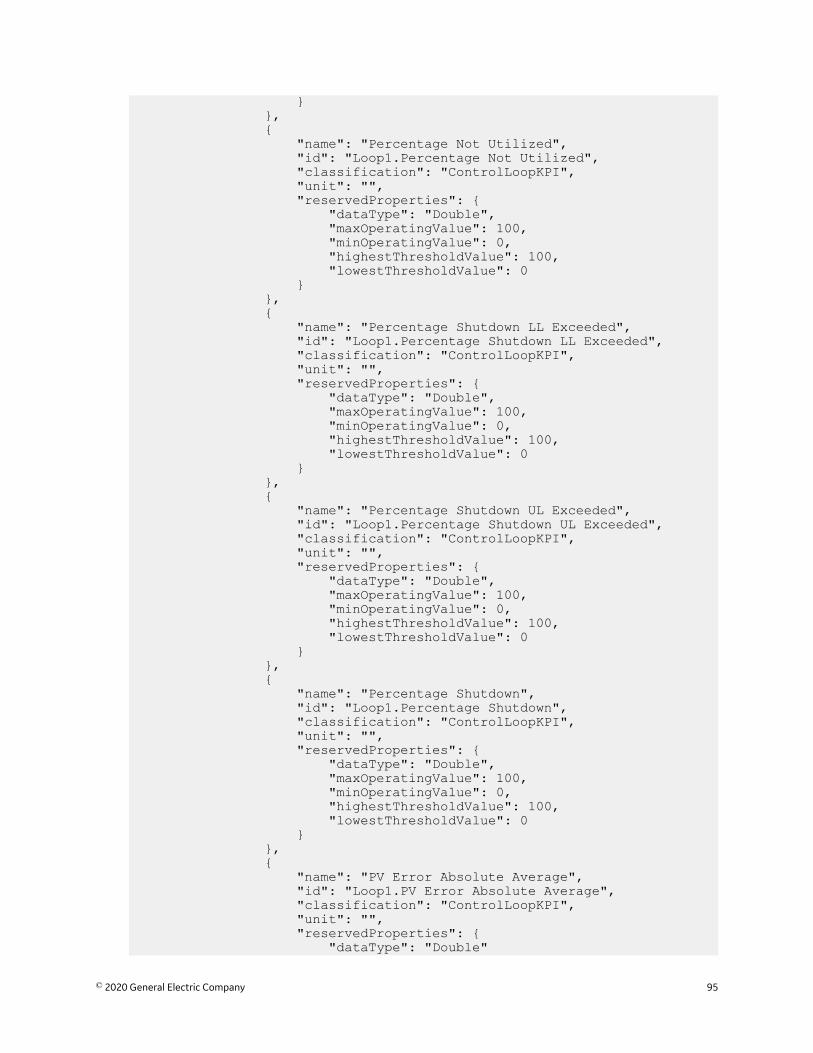
} }, { "name": "Percentage Not Utilized", "id": "Loop1.Percentage Not Utilized", "classification": "ControlLoopKPI", "unit": "", "reservedProperties": { "dataType": "Double", "maxOperatingValue": 100, "minOperatingValue": 0, "highestThresholdValue": 100, "lowestThresholdValue": 0 } }, { "name": "Percentage Shutdown LL Exceeded", "id": "Loop1.Percentage Shutdown LL Exceeded", "classification": "ControlLoopKPI", "unit": "", "reservedProperties": { "dataType": "Double", "maxOperatingValue": 100, "minOperatingValue": 0, "highestThresholdValue": 100, "lowestThresholdValue": 0 } }, { "name": "Percentage Shutdown UL Exceeded", "id": "Loop1.Percentage Shutdown UL Exceeded", "classification": "ControlLoopKPI", "unit": "", "reservedProperties": { "dataType": "Double", "maxOperatingValue": 100, "minOperatingValue": 0, "highestThresholdValue": 100, "lowestThresholdValue": 0 } }, { "name": "Percentage Shutdown", "id": "Loop1.Percentage Shutdown", "classification": "ControlLoopKPI", "unit": "", "reservedProperties": { "dataType": "Double", "maxOperatingValue": 100, "minOperatingValue": 0, "highestThresholdValue": 100, "lowestThresholdValue": 0 } }, { "name": "PV Error Absolute Average", "id": "Loop1.PV Error Absolute Average", "classification": "ControlLoopKPI", "unit": "", "reservedProperties": { "dataType": "Double"
© 2020 General Electric Company 95
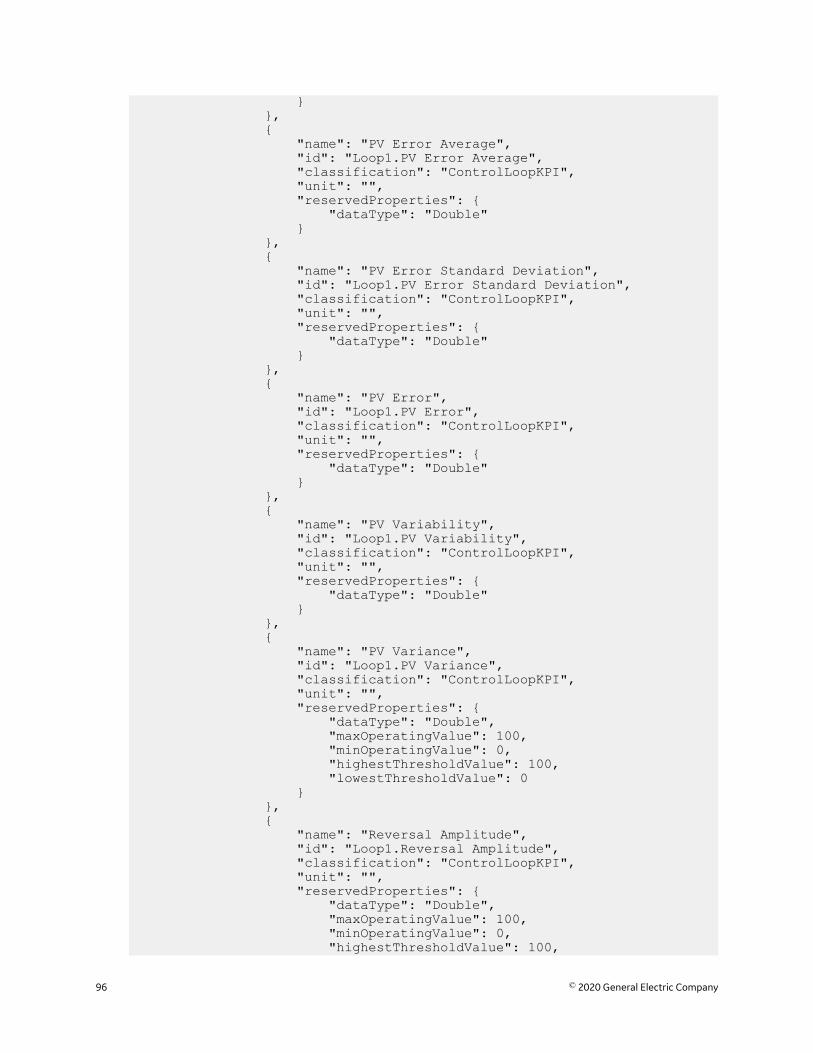
} }, { "name": "PV Error Average", "id": "Loop1.PV Error Average", "classification": "ControlLoopKPI", "unit": "", "reservedProperties": { "dataType": "Double" } }, { "name": "PV Error Standard Deviation", "id": "Loop1.PV Error Standard Deviation", "classification": "ControlLoopKPI", "unit": "", "reservedProperties": { "dataType": "Double" } }, { "name": "PV Error", "id": "Loop1.PV Error", "classification": "ControlLoopKPI", "unit": "", "reservedProperties": { "dataType": "Double" } }, { "name": "PV Variability", "id": "Loop1.PV Variability", "classification": "ControlLoopKPI", "unit": "", "reservedProperties": { "dataType": "Double" } }, { "name": "PV Variance", "id": "Loop1.PV Variance", "classification": "ControlLoopKPI", "unit": "", "reservedProperties": { "dataType": "Double", "maxOperatingValue": 100, "minOperatingValue": 0, "highestThresholdValue": 100, "lowestThresholdValue": 0 } }, { "name": "Reversal Amplitude", "id": "Loop1.Reversal Amplitude", "classification": "ControlLoopKPI", "unit": "", "reservedProperties": { "dataType": "Double", "maxOperatingValue": 100, "minOperatingValue": 0, "highestThresholdValue": 100,
96 © 2020 General Electric Company
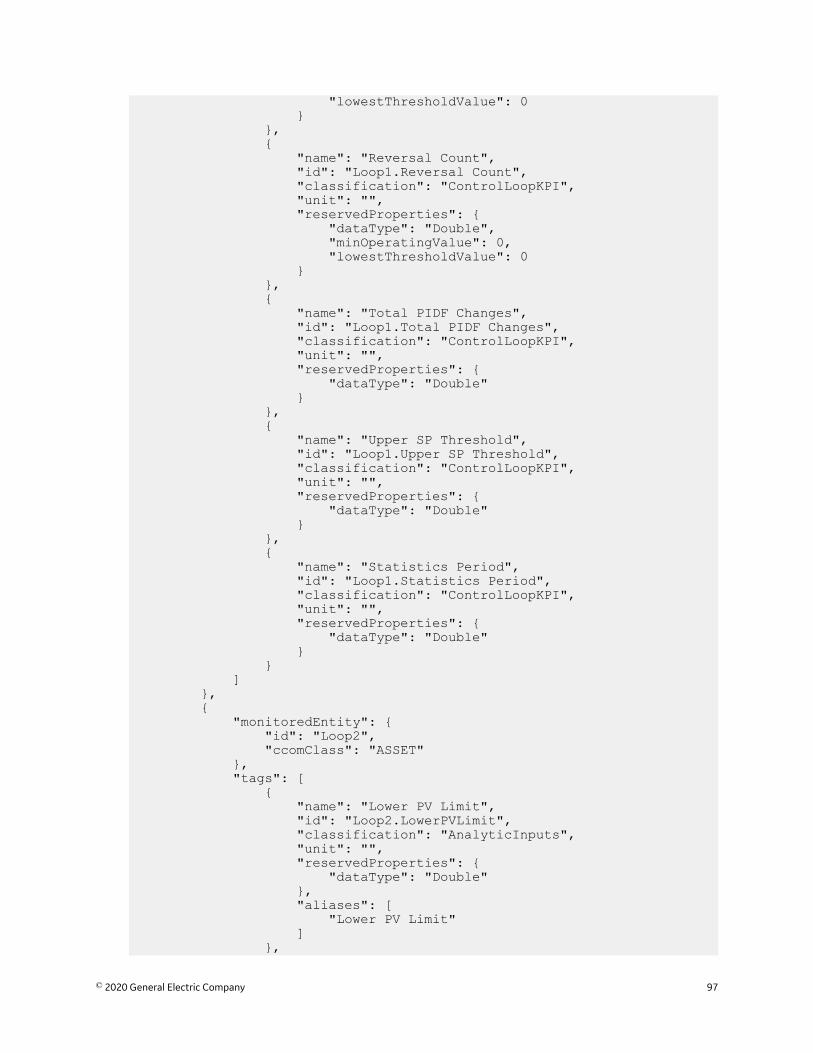
"lowestThresholdValue": 0 } }, { "name": "Reversal Count", "id": "Loop1.Reversal Count", "classification": "ControlLoopKPI", "unit": "", "reservedProperties": { "dataType": "Double", "minOperatingValue": 0, "lowestThresholdValue": 0 } }, { "name": "Total PIDF Changes", "id": "Loop1.Total PIDF Changes", "classification": "ControlLoopKPI", "unit": "", "reservedProperties": { "dataType": "Double" } }, { "name": "Upper SP Threshold", "id": "Loop1.Upper SP Threshold", "classification": "ControlLoopKPI", "unit": "", "reservedProperties": { "dataType": "Double" } }, { "name": "Statistics Period", "id": "Loop1.Statistics Period", "classification": "ControlLoopKPI", "unit": "", "reservedProperties": { "dataType": "Double" } } ] }, { "monitoredEntity": { "id": "Loop2", "ccomClass": "ASSET" }, "tags": [ { "name": "Lower PV Limit", "id": "Loop2.LowerPVLimit", "classification": "AnalyticInputs", "unit": "", "reservedProperties": { "dataType": "Double" }, "aliases": [ "Lower PV Limit" ] },
© 2020 General Electric Company 97
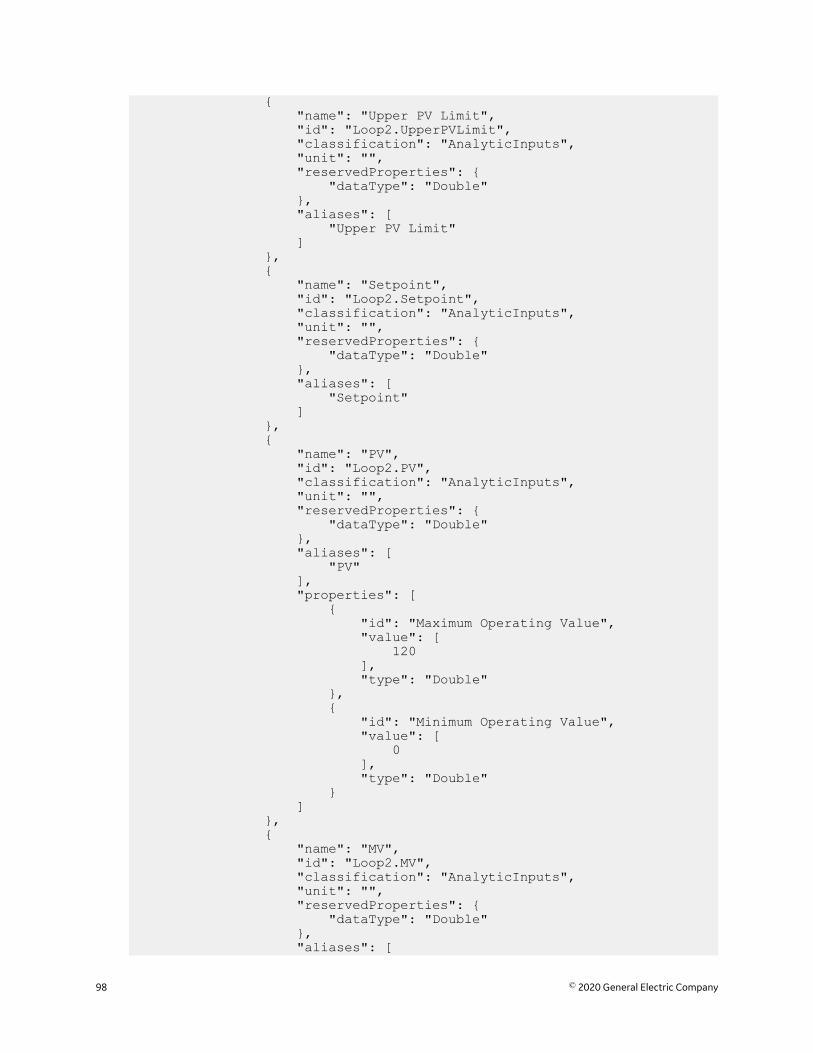
{ "name": "Upper PV Limit", "id": "Loop2.UpperPVLimit", "classification": "AnalyticInputs", "unit": "", "reservedProperties": { "dataType": "Double" }, "aliases": [ "Upper PV Limit" ] }, { "name": "Setpoint", "id": "Loop2.Setpoint", "classification": "AnalyticInputs", "unit": "", "reservedProperties": { "dataType": "Double" }, "aliases": [ "Setpoint" ] }, { "name": "PV", "id": "Loop2.PV", "classification": "AnalyticInputs", "unit": "", "reservedProperties": { "dataType": "Double" }, "aliases": [ "PV" ], "properties": [ { "id": "Maximum Operating Value", "value": [ 120 ], "type": "Double" }, { "id": "Minimum Operating Value", "value": [ 0 ], "type": "Double" } ] }, { "name": "MV", "id": "Loop2.MV", "classification": "AnalyticInputs", "unit": "", "reservedProperties": { "dataType": "Double" }, "aliases": [
98 © 2020 General Electric Company
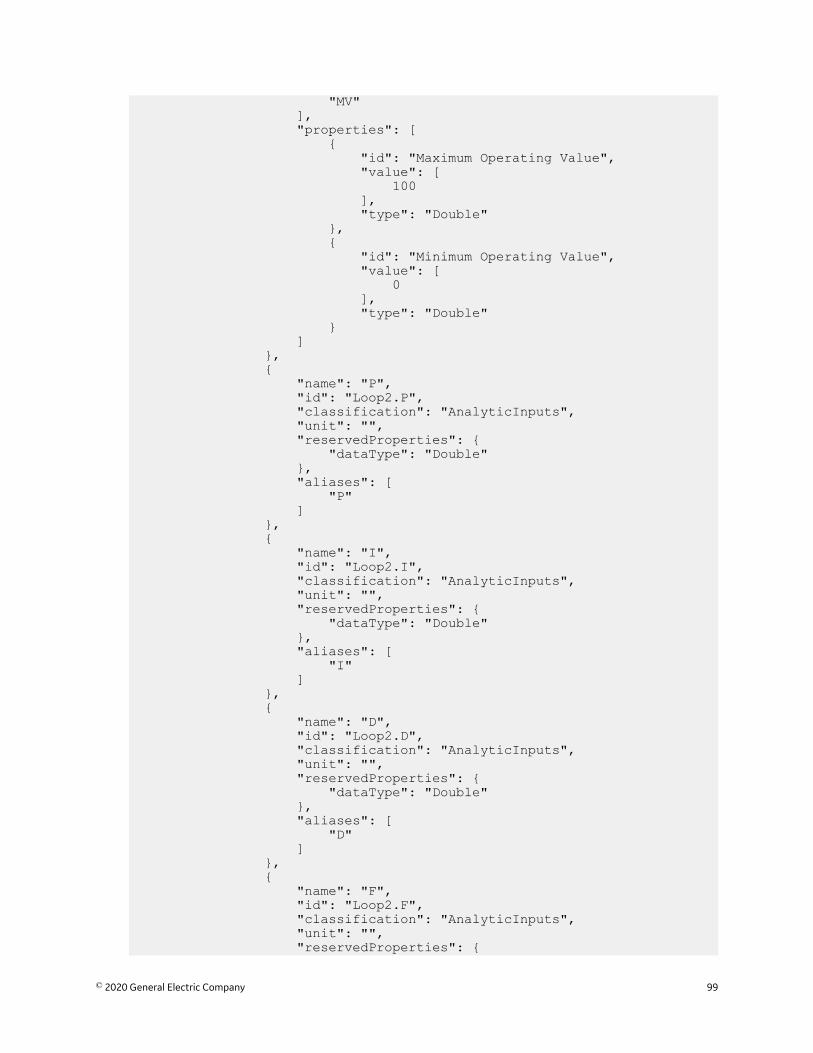
"MV" ], "properties": [ { "id": "Maximum Operating Value", "value": [ 100 ], "type": "Double" }, { "id": "Minimum Operating Value", "value": [ 0 ], "type": "Double" } ] }, { "name": "P", "id": "Loop2.P", "classification": "AnalyticInputs", "unit": "", "reservedProperties": { "dataType": "Double" }, "aliases": [ "P" ] }, { "name": "I", "id": "Loop2.I", "classification": "AnalyticInputs", "unit": "", "reservedProperties": { "dataType": "Double" }, "aliases": [ "I" ] }, { "name": "D", "id": "Loop2.D", "classification": "AnalyticInputs", "unit": "", "reservedProperties": { "dataType": "Double" }, "aliases": [ "D" ] }, { "name": "F", "id": "Loop2.F", "classification": "AnalyticInputs", "unit": "", "reservedProperties": {
© 2020 General Electric Company 99
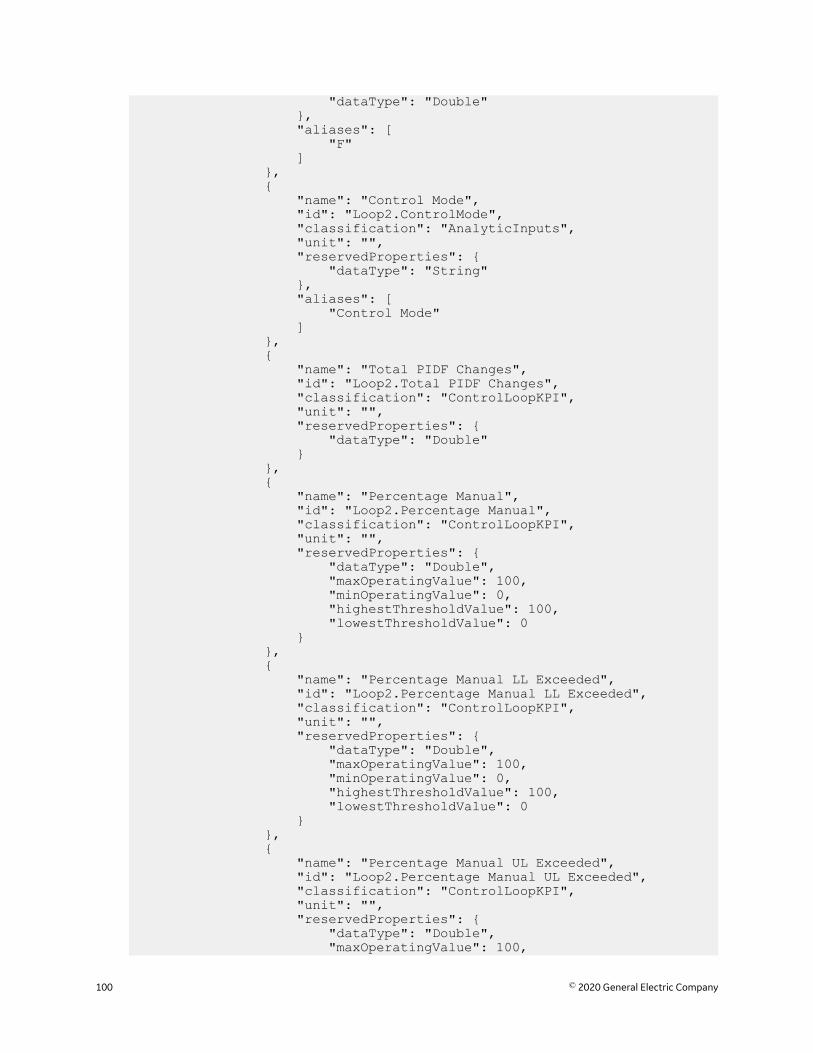
"dataType": "Double" }, "aliases": [ "F" ] }, { "name": "Control Mode", "id": "Loop2.ControlMode", "classification": "AnalyticInputs", "unit": "", "reservedProperties": { "dataType": "String" }, "aliases": [ "Control Mode" ] }, { "name": "Total PIDF Changes", "id": "Loop2.Total PIDF Changes", "classification": "ControlLoopKPI", "unit": "", "reservedProperties": { "dataType": "Double" } }, { "name": "Percentage Manual", "id": "Loop2.Percentage Manual", "classification": "ControlLoopKPI", "unit": "", "reservedProperties": { "dataType": "Double", "maxOperatingValue": 100, "minOperatingValue": 0, "highestThresholdValue": 100, "lowestThresholdValue": 0 } }, { "name": "Percentage Manual LL Exceeded", "id": "Loop2.Percentage Manual LL Exceeded", "classification": "ControlLoopKPI", "unit": "", "reservedProperties": { "dataType": "Double", "maxOperatingValue": 100, "minOperatingValue": 0, "highestThresholdValue": 100, "lowestThresholdValue": 0 } }, { "name": "Percentage Manual UL Exceeded", "id": "Loop2.Percentage Manual UL Exceeded", "classification": "ControlLoopKPI", "unit": "", "reservedProperties": { "dataType": "Double", "maxOperatingValue": 100,
100 © 2020 General Electric Company
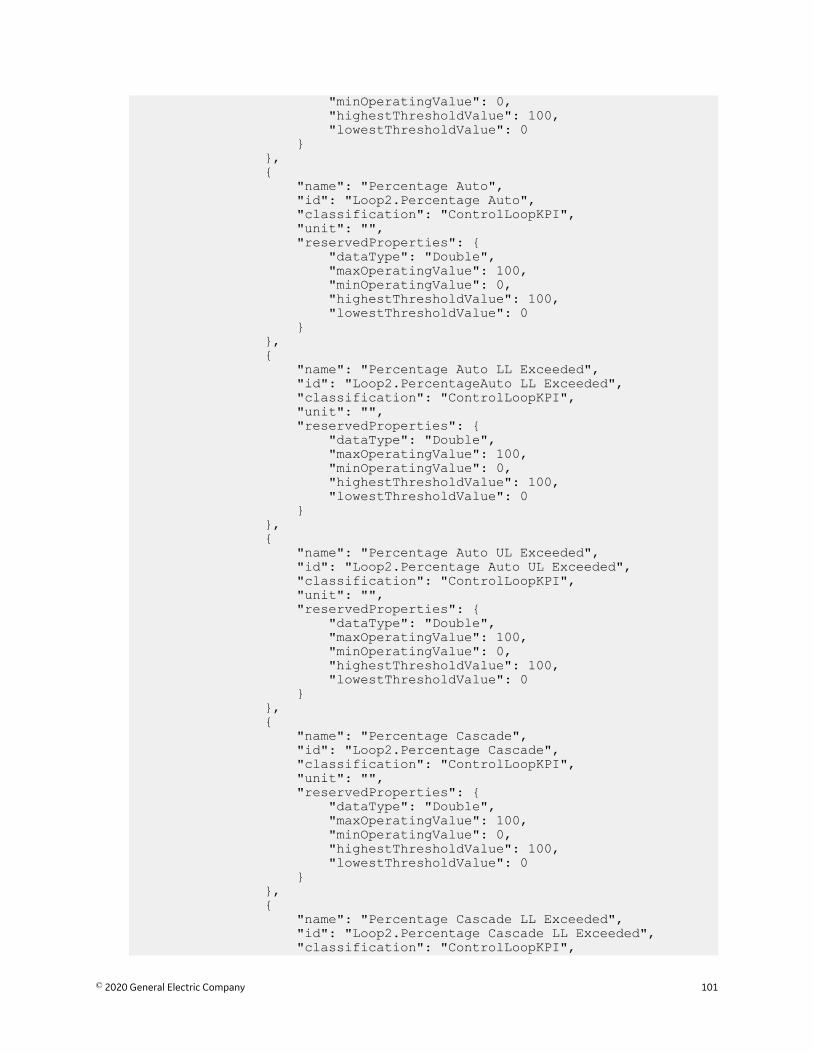
"minOperatingValue": 0, "highestThresholdValue": 100, "lowestThresholdValue": 0 } }, { "name": "Percentage Auto", "id": "Loop2.Percentage Auto", "classification": "ControlLoopKPI", "unit": "", "reservedProperties": { "dataType": "Double", "maxOperatingValue": 100, "minOperatingValue": 0, "highestThresholdValue": 100, "lowestThresholdValue": 0 } }, { "name": "Percentage Auto LL Exceeded", "id": "Loop2.PercentageAuto LL Exceeded", "classification": "ControlLoopKPI", "unit": "", "reservedProperties": { "dataType": "Double", "maxOperatingValue": 100, "minOperatingValue": 0, "highestThresholdValue": 100, "lowestThresholdValue": 0 } }, { "name": "Percentage Auto UL Exceeded", "id": "Loop2.Percentage Auto UL Exceeded", "classification": "ControlLoopKPI", "unit": "", "reservedProperties": { "dataType": "Double", "maxOperatingValue": 100, "minOperatingValue": 0, "highestThresholdValue": 100, "lowestThresholdValue": 0 } }, { "name": "Percentage Cascade", "id": "Loop2.Percentage Cascade", "classification": "ControlLoopKPI", "unit": "", "reservedProperties": { "dataType": "Double", "maxOperatingValue": 100, "minOperatingValue": 0, "highestThresholdValue": 100, "lowestThresholdValue": 0 } }, { "name": "Percentage Cascade LL Exceeded", "id": "Loop2.Percentage Cascade LL Exceeded", "classification": "ControlLoopKPI",
© 2020 General Electric Company 101
"unit": "", "reservedProperties": { "dataType": "Double", "maxOperatingValue": 100, "minOperatingValue": 0, "highestThresholdValue": 100, "lowestThresholdValue": 0 } }, { "name": "Percentage Cascade UL Exceeded", "id": "Loop2.Percentage Cascade UL Exceeded", "classification": "ControlLoopKPI", "unit": "", "reservedProperties": { "dataType": "Double", "maxOperatingValue": 100, "minOperatingValue": 0, "highestThresholdValue": 100, "lowestThresholdValue": 0 } }, { "name": "Percentage Shutdown", "id": "Loop2.Percentage Shutdown", "classification": "ControlLoopKPI", "unit": "", "reservedProperties": { "dataType": "Double", "maxOperatingValue": 100, "minOperatingValue": 0, "highestThresholdValue": 100, "lowestThresholdValue": 0 } }, { "name": "Percentage Shutdown LL Exceeded", "id": "Loop2.Percentage Shutdown LL Exceeded", "classification": "ControlLoopKPI", "unit": "", "reservedProperties": { "dataType": "Double", "maxOperatingValue": 100, "minOperatingValue": 0, "highestThresholdValue": 100, "lowestThresholdValue": 0 } }, { "name": "Percentage Shutdown UL Exceeded", "id": "Loop2.Percentage Shutdown UL Exceeded", "classification": "ControlLoopKPI", "unit": "", "reservedProperties": { "dataType": "Double", "maxOperatingValue": 100, "minOperatingValue": 0, "highestThresholdValue": 100, "lowestThresholdValue": 0 } },
102 © 2020 General Electric Company
{ "name": "Percentage Control On", "id": "Loop2.Percentage Control On", "classification": "ControlLoopKPI", "unit": "", "reservedProperties": { "dataType": "Double", "maxOperatingValue": 100, "minOperatingValue": 0, "highestThresholdValue": 100, "lowestThresholdValue": 0 } }, { "name": "Percentage Controller Output", "id": "Loop2.Percentage Controller Output", "classification": "ControlLoopKPI", "unit": "", "reservedProperties": { "dataType": "Double", "maxOperatingValue": 100, "minOperatingValue": 0, "highestThresholdValue": 100, "lowestThresholdValue": 0 } }, { "name": "Percentage Good Quality", "id": "Loop2.Percentage Good Quality", "classification": "ControlLoopKPI", "unit": "", "reservedProperties": { "dataType": "Double", "maxOperatingValue": 100, "minOperatingValue": 0, "highestThresholdValue": 100, "lowestThresholdValue": 0 } }, { "name": "Percentage Not Utilized", "id": "Loop2.Percentage Not Utilized", "classification": "ControlLoopKPI", "unit": "", "reservedProperties": { "dataType": "Double", "maxOperatingValue": 100, "minOperatingValue": 0, "highestThresholdValue": 100, "lowestThresholdValue": 0 } }, { "name": "Percentage MV Saturation", "id": "Loop2.Percentage MV Saturation", "classification": "ControlLoopKPI", "unit": "", "reservedProperties": { "dataType": "Double", "maxOperatingValue": 100, "minOperatingValue": 0,
© 2020 General Electric Company 103
"highestThresholdValue": 100, "lowestThresholdValue": 0 } }, { "name": "Overall Performance", "id": "Loop2.Overall Performance", "classification": "ControlLoopKPI", "unit": "", "reservedProperties": { "dataType": "Double" } }, { "name": "Movement Index", "id": "Loop2.Movement Index", "classification": "ControlLoopKPI", "unit": "", "reservedProperties": { "dataType": "Double" } }, { "name": "Control Amplitude", "id": "Loop2.Control Amplitude", "classification": "ControlLoopKPI", "unit": "", "reservedProperties": { "dataType": "Double" } }, { "name": "Reversal Count", "id": "Loop2.Reversal Count", "classification": "ControlLoopKPI", "unit": "", "reservedProperties": { "dataType": "Double", "minOperatingValue": 0, "lowestThresholdValue": 0 } }, { "name": "Reversal Amplitude", "id": "Loop2.Reversal Amplitude", "classification": "ControlLoopKPI", "unit": "", "reservedProperties": { "dataType": "Double", "maxOperatingValue": 100, "minOperatingValue": 0, "highestThresholdValue": 100, "lowestThresholdValue": 0 } }, { "name": "Integrated Sum", "id": "Loop2.Integrated Sum", "classification": "ControlLoopKPI", "unit": "", "reservedProperties": {
104 © 2020 General Electric Company
"dataType": "Double" } }, { "name": "PV Error Average", "id": "Loop2.PV Error Average", "classification": "ControlLoopKPI", "unit": "", "reservedProperties": { "dataType": "Double" } }, { "name": "PV Error Absolute Average", "id": "Loop2.PV Error Absolute Average", "classification": "ControlLoopKPI", "unit": "", "reservedProperties": { "dataType": "Double" } }, { "name": "PV Error Standard Deviation", "id": "Loop2.PV Error Standard Deviation", "classification": "ControlLoopKPI", "unit": "", "reservedProperties": { "dataType": "Double" } }, { "name": "PV Variance", "id": "Loop2.PV Variance", "classification": "ControlLoopKPI", "unit": "", "reservedProperties": { "dataType": "Double", "maxOperatingValue": 100, "minOperatingValue": 0, "highestThresholdValue": 100, "lowestThresholdValue": 0 } }, { "name": "PV Variability", "id": "Loop2.PV Variability", "classification": "ControlLoopKPI", "unit": "", "reservedProperties": { "dataType": "Double" } }, { "name": "Percentage Limits Exceeded", "id": "Loop2.Percentage Limits Exceeded", "classification": "ControlLoopKPI", "unit": "", "reservedProperties": { "dataType": "Double", "maxOperatingValue": 100, "minOperatingValue": 0,
© 2020 General Electric Company 105
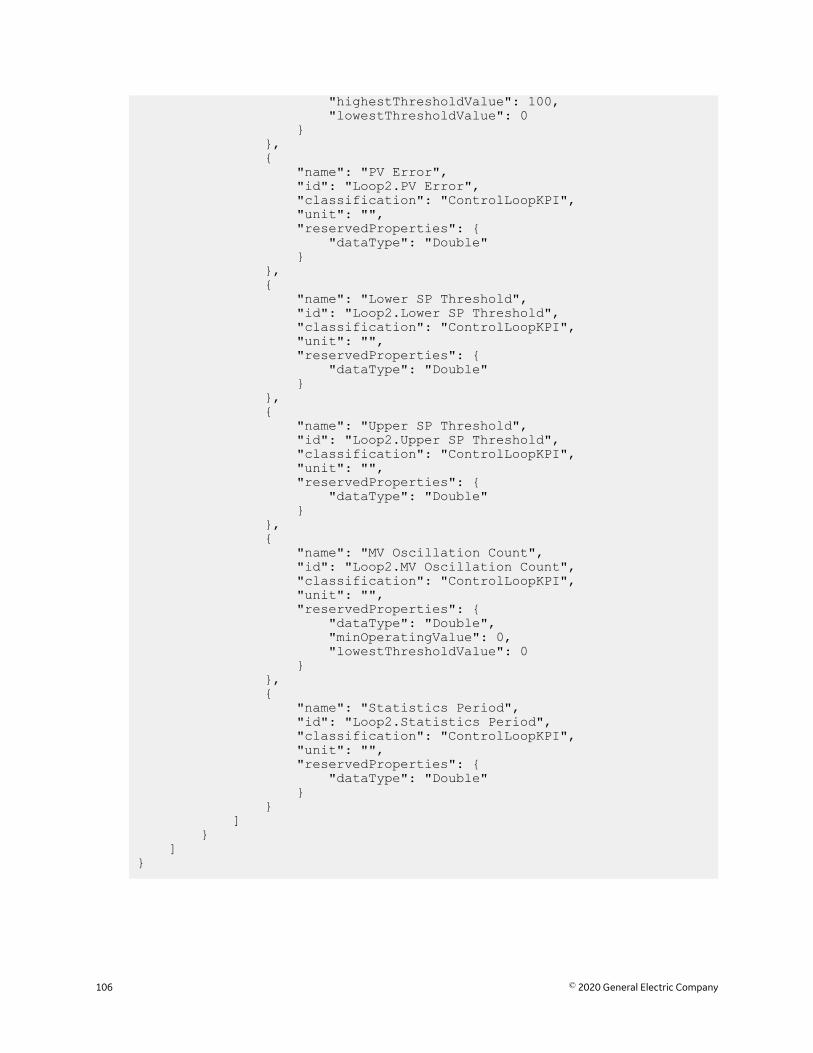
"highestThresholdValue": 100, "lowestThresholdValue": 0 } }, { "name": "PV Error", "id": "Loop2.PV Error", "classification": "ControlLoopKPI", "unit": "", "reservedProperties": { "dataType": "Double" } }, { "name": "Lower SP Threshold", "id": "Loop2.Lower SP Threshold", "classification": "ControlLoopKPI", "unit": "", "reservedProperties": { "dataType": "Double" } }, { "name": "Upper SP Threshold", "id": "Loop2.Upper SP Threshold", "classification": "ControlLoopKPI", "unit": "", "reservedProperties": { "dataType": "Double" } }, { "name": "MV Oscillation Count", "id": "Loop2.MV Oscillation Count", "classification": "ControlLoopKPI", "unit": "", "reservedProperties": { "dataType": "Double", "minOperatingValue": 0, "lowestThresholdValue": 0 } }, { "name": "Statistics Period", "id": "Loop2.Statistics Period", "classification": "ControlLoopKPI", "unit": "", "reservedProperties": { "dataType": "Double" } } ] } ]}
106 © 2020 General Electric Company
KPI Reference for CLPMThis reference details all the KPIs calculated over the data window.
These KPIs are produced by deployed CLPM analytics and are associated with assets in Predix TimeSeries.
The KPIs are also used to produce the tables and charts on the Loop Dashboard and Fleet Dashboard,which help you monitor and diagnose loop performance.
The KPIs are categorized in the tables that follow as:
• Aggregate KPIs• Non-Aggregate KPIs
Note: The samples over which these KPIs are calculated are resampled to be at regular intervals. Theresulting samples are therefore equally weighted in the calculations. All KPIs are calculated offinterpolated data.
© 2020 General Electric Company 107
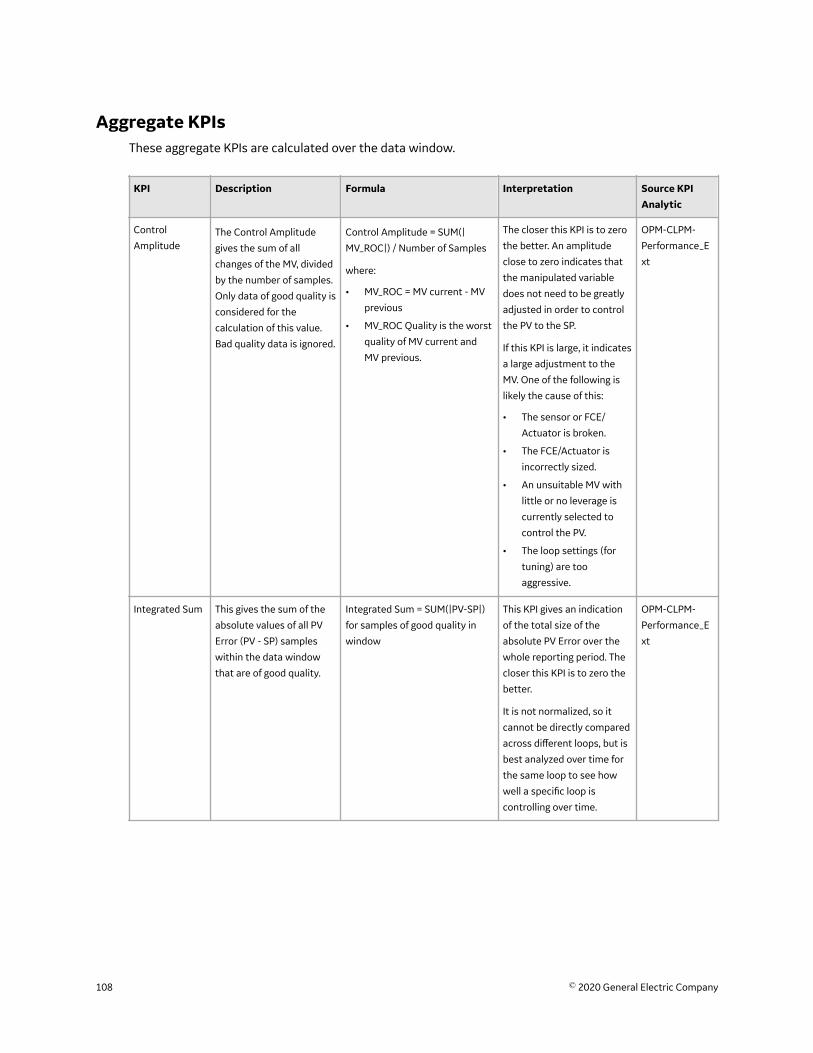
Aggregate KPIsThese aggregate KPIs are calculated over the data window.
KPI Description Formula Interpretation Source KPIAnalytic
Control
AmplitudeThe Control Amplitude
gives the sum of all
changes of the MV, divided
by the number of samples.
Only data of good quality is
considered for the
calculation of this value.
Bad quality data is ignored.
Control Amplitude = SUM(|
MV_ROC|) / Number of Samples
where:
• MV_ROC = MV current - MV
previous
• MV_ROC Quality is the worst
quality of MV current and
MV previous.
The closer this KPI is to zero
the better. An amplitude
close to zero indicates that
the manipulated variable
does not need to be greatly
adjusted in order to control
the PV to the SP.
If this KPI is large, it indicates
a large adjustment to the
MV. One of the following is
likely the cause of this:
• The sensor or FCE/
Actuator is broken.
• The FCE/Actuator is
incorrectly sized.
• An unsuitable MV with
little or no leverage is
currently selected to
control the PV.
• The loop settings (for
tuning) are too
aggressive.
OPM-CLPM-
Performance_E
xt
Integrated Sum This gives the sum of the
absolute values of all PV
Error (PV - SP) samples
within the data window
that are of good quality.
Integrated Sum = SUM(|PV-SP|)
for samples of good quality in
window
This KPI gives an indication
of the total size of the
absolute PV Error over the
whole reporting period. The
closer this KPI is to zero the
better.
It is not normalized, so it
cannot be directly compared
across different loops, but is
best analyzed over time for
the same loop to see how
well a specific loop is
controlling over time.
OPM-CLPM-
Performance_E
xt
108 © 2020 General Electric Company
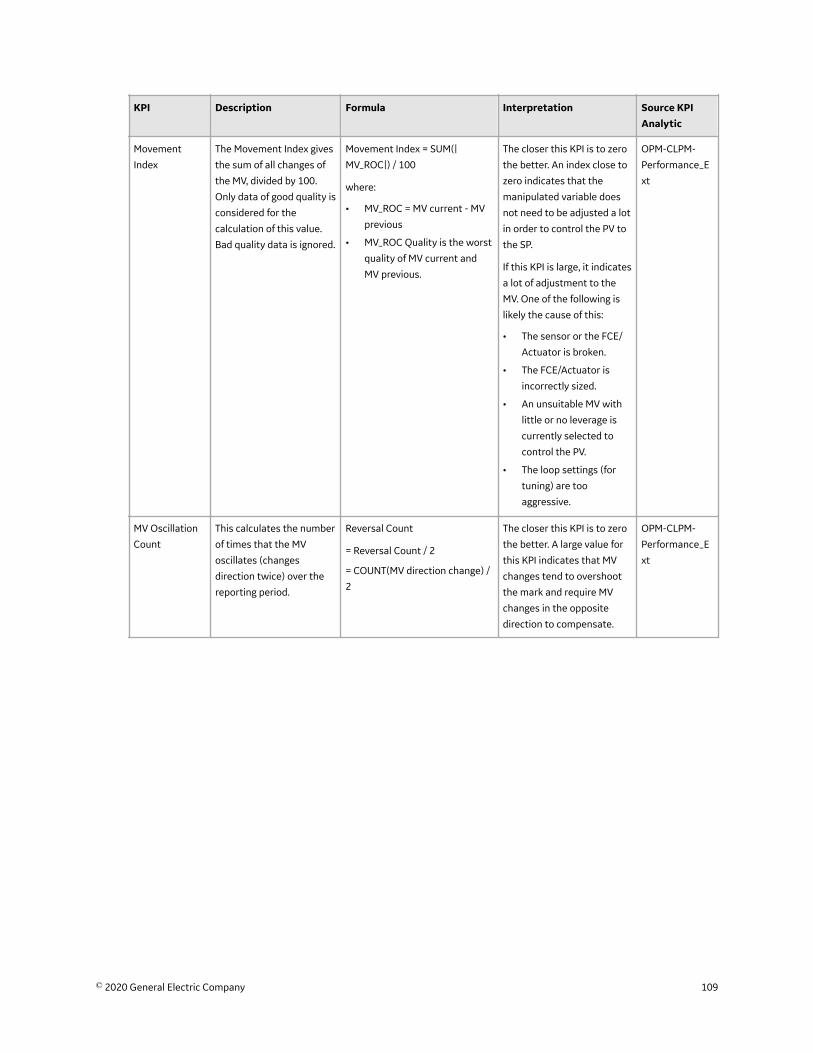
KPI Description Formula Interpretation Source KPIAnalytic
Movement
Index
The Movement Index gives
the sum of all changes of
the MV, divided by 100.
Only data of good quality is
considered for the
calculation of this value.
Bad quality data is ignored.
Movement Index = SUM(|
MV_ROC|) / 100
where:
• MV_ROC = MV current - MV
previous
• MV_ROC Quality is the worst
quality of MV current and
MV previous.
The closer this KPI is to zero
the better. An index close to
zero indicates that the
manipulated variable does
not need to be adjusted a lot
in order to control the PV to
the SP.
If this KPI is large, it indicates
a lot of adjustment to the
MV. One of the following is
likely the cause of this:
• The sensor or the FCE/
Actuator is broken.
• The FCE/Actuator is
incorrectly sized.
• An unsuitable MV with
little or no leverage is
currently selected to
control the PV.
• The loop settings (for
tuning) are too
aggressive.
OPM-CLPM-
Performance_E
xt
MV Oscillation
Count
This calculates the number
of times that the MV
oscillates (changes
direction twice) over the
reporting period.
Reversal Count
= Reversal Count / 2
= COUNT(MV direction change) /
2
The closer this KPI is to zero
the better. A large value for
this KPI indicates that MV
changes tend to overshoot
the mark and require MV
changes in the opposite
direction to compensate.
OPM-CLPM-
Performance_E
xt
© 2020 General Electric Company 109
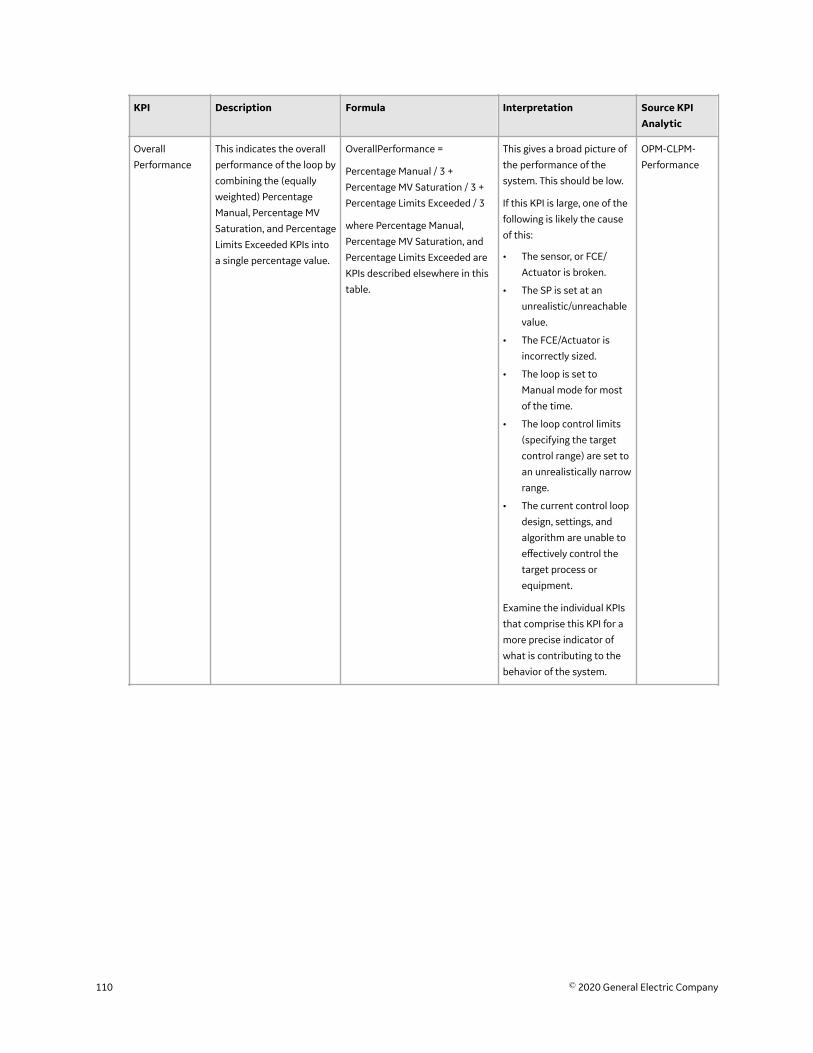
KPI Description Formula Interpretation Source KPIAnalytic
Overall
Performance
This indicates the overall
performance of the loop by
combining the (equally
weighted) Percentage
Manual, Percentage MV
Saturation, and Percentage
Limits Exceeded KPIs into
a single percentage value.
OverallPerformance =
Percentage Manual / 3 +
Percentage MV Saturation / 3 +
Percentage Limits Exceeded / 3
where Percentage Manual,
Percentage MV Saturation, and
Percentage Limits Exceeded are
KPIs described elsewhere in this
table.
This gives a broad picture of
the performance of the
system. This should be low.
If this KPI is large, one of the
following is likely the cause
of this:
• The sensor, or FCE/
Actuator is broken.
• The SP is set at an
unrealistic/unreachable
value.
• The FCE/Actuator is
incorrectly sized.
• The loop is set to
Manual mode for most
of the time.
• The loop control limits
(specifying the target
control range) are set to
an unrealistically narrow
range.
• The current control loop
design, settings, and
algorithm are unable to
effectively control the
target process or
equipment.
Examine the individual KPIs
that comprise this KPI for a
more precise indicator of
what is contributing to the
behavior of the system.
OPM-CLPM-
Performance
110 © 2020 General Electric Company
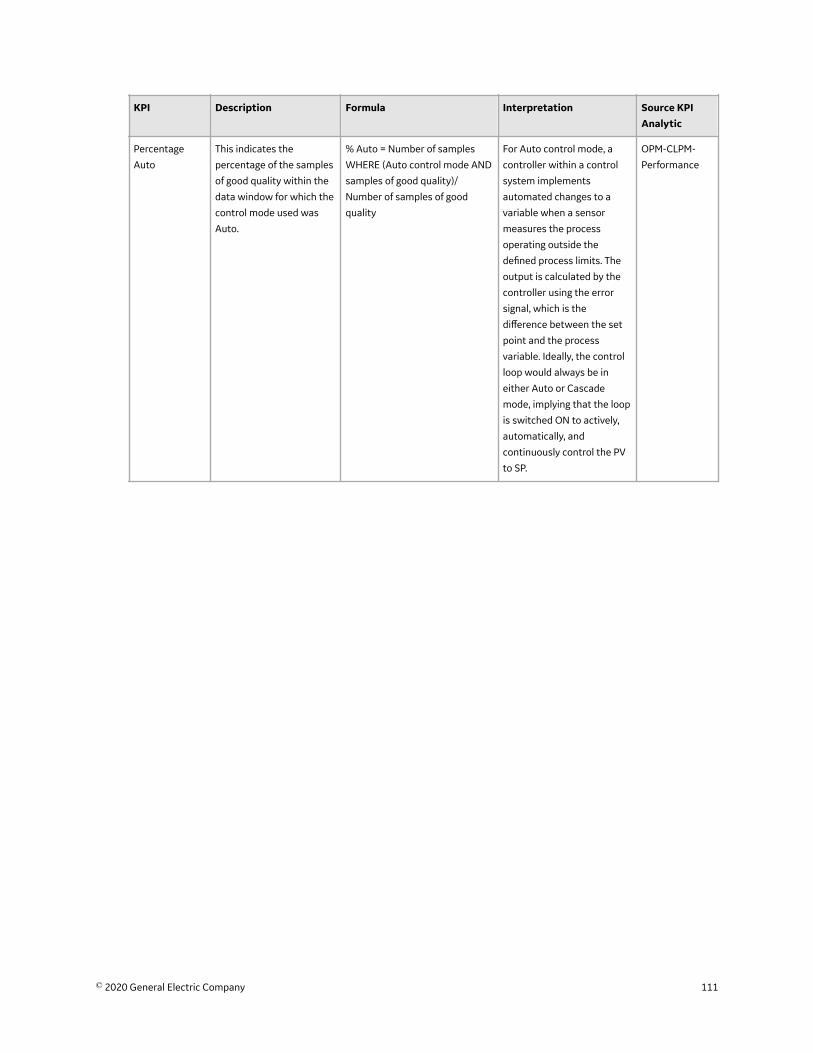
KPI Description Formula Interpretation Source KPIAnalytic
Percentage
Auto
This indicates the
percentage of the samples
of good quality within the
data window for which the
control mode used was
Auto.
% Auto = Number of samples
WHERE (Auto control mode AND
samples of good quality)/
Number of samples of good
quality
For Auto control mode, a
controller within a control
system implements
automated changes to a
variable when a sensor
measures the process
operating outside the
defined process limits. The
output is calculated by the
controller using the error
signal, which is the
difference between the set
point and the process
variable. Ideally, the control
loop would always be in
either Auto or Cascade
mode, implying that the loop
is switched ON to actively,
automatically, and
continuously control the PV
to SP.
OPM-CLPM-
Performance
© 2020 General Electric Company 111
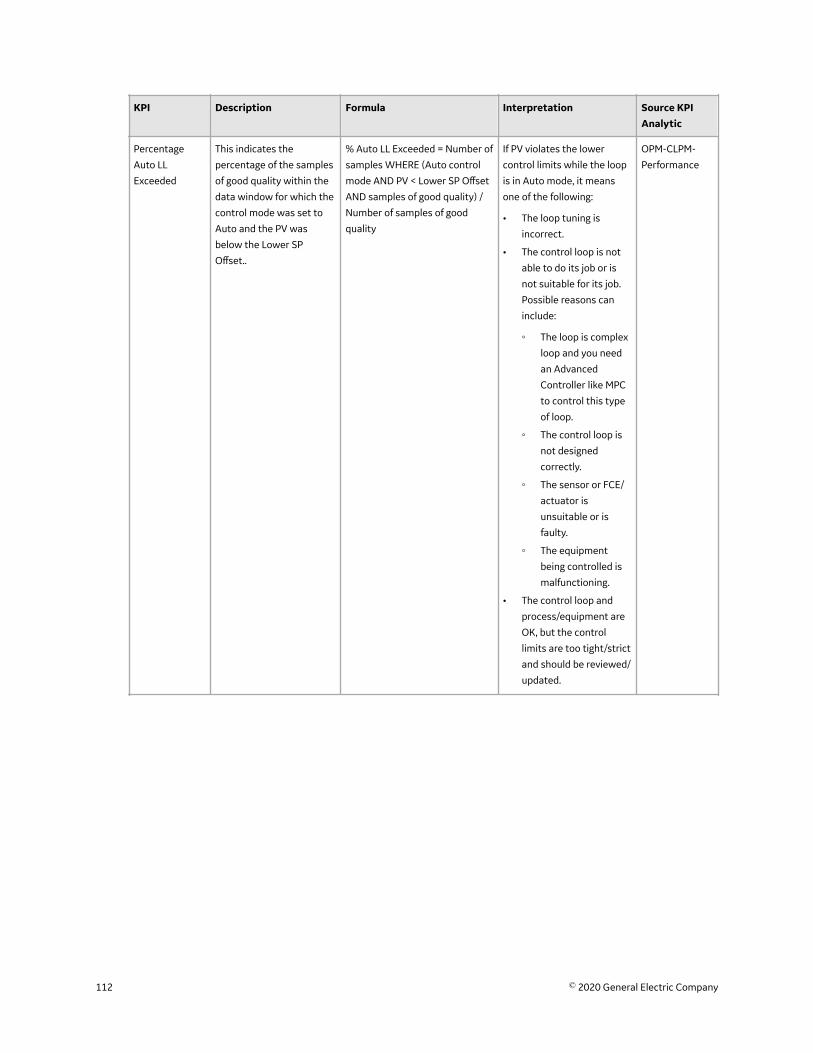
KPI Description Formula Interpretation Source KPIAnalytic
Percentage
Auto LL
Exceeded
This indicates the
percentage of the samples
of good quality within the
data window for which the
control mode was set to
Auto and the PV was
below the Lower SP
Offset..
% Auto LL Exceeded = Number of
samples WHERE (Auto control
mode AND PV < Lower SP Offset
AND samples of good quality) /
Number of samples of good
quality
If PV violates the lower
control limits while the loop
is in Auto mode, it means
one of the following:
• The loop tuning is
incorrect.
• The control loop is not
able to do its job or is
not suitable for its job.
Possible reasons can
include:
◦ The loop is complex
loop and you need
an Advanced
Controller like MPC
to control this type
of loop.
◦ The control loop is
not designed
correctly.
◦ The sensor or FCE/
actuator is
unsuitable or is
faulty.
◦ The equipment
being controlled is
malfunctioning.
• The control loop and
process/equipment are
OK, but the control
limits are too tight/strict
and should be reviewed/
updated.
OPM-CLPM-
Performance
112 © 2020 General Electric Company
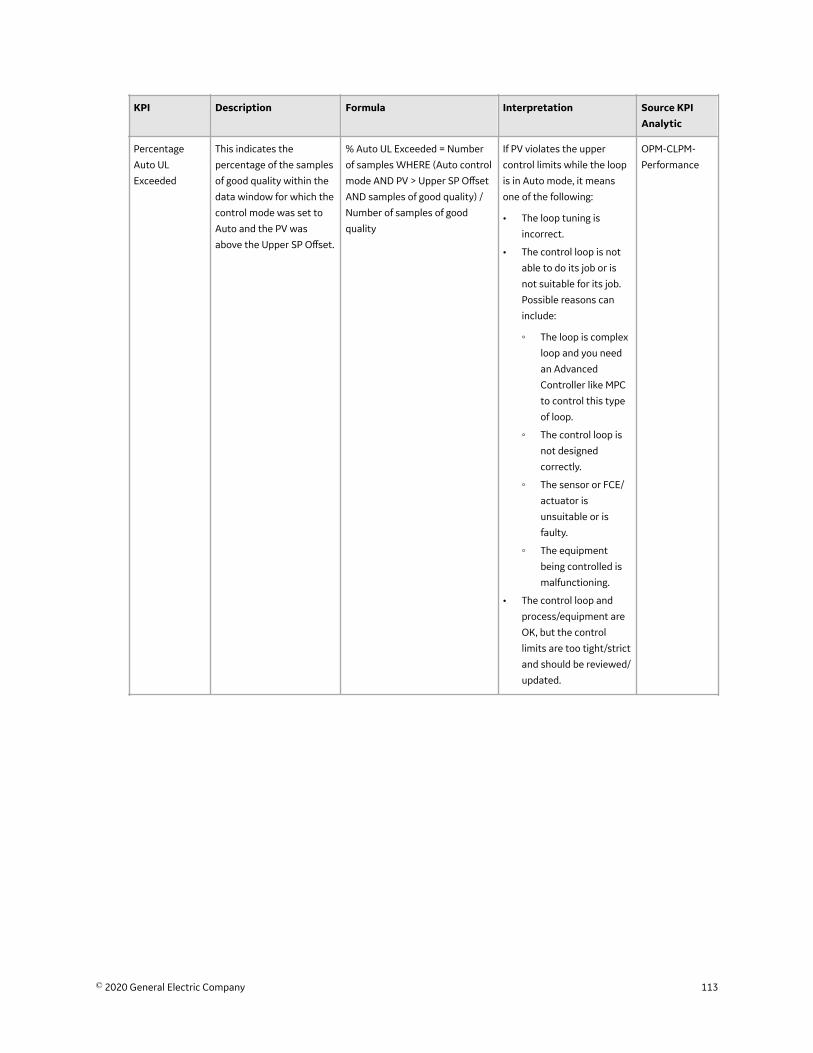
KPI Description Formula Interpretation Source KPIAnalytic
Percentage
Auto UL
Exceeded
This indicates the
percentage of the samples
of good quality within the
data window for which the
control mode was set to
Auto and the PV was
above the Upper SP Offset.
% Auto UL Exceeded = Number
of samples WHERE (Auto control
mode AND PV > Upper SP Offset
AND samples of good quality) /
Number of samples of good
quality
If PV violates the upper
control limits while the loop
is in Auto mode, it means
one of the following:
• The loop tuning is
incorrect.
• The control loop is not
able to do its job or is
not suitable for its job.
Possible reasons can
include:
◦ The loop is complex
loop and you need
an Advanced
Controller like MPC
to control this type
of loop.
◦ The control loop is
not designed
correctly.
◦ The sensor or FCE/
actuator is
unsuitable or is
faulty.
◦ The equipment
being controlled is
malfunctioning.
• The control loop and
process/equipment are
OK, but the control
limits are too tight/strict
and should be reviewed/
updated.
OPM-CLPM-
Performance
© 2020 General Electric Company 113
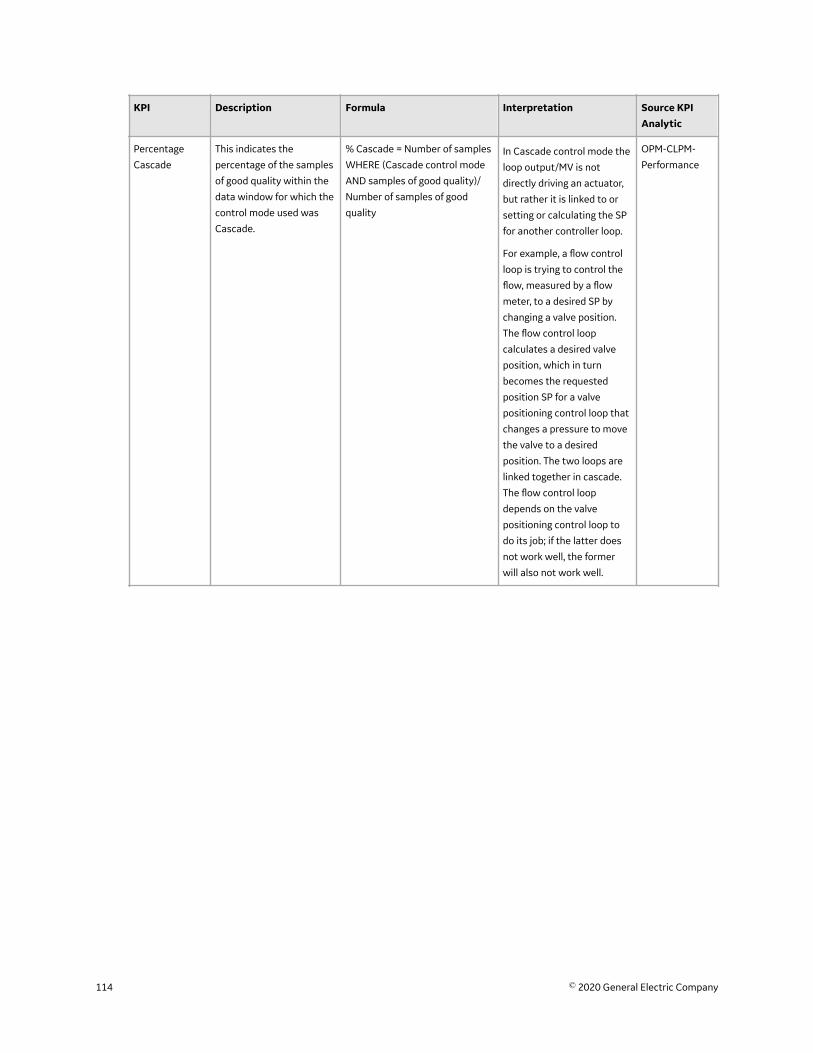
KPI Description Formula Interpretation Source KPIAnalytic
Percentage
Cascade
This indicates the
percentage of the samples
of good quality within the
data window for which the
control mode used was
Cascade.
% Cascade = Number of samples
WHERE (Cascade control mode
AND samples of good quality)/
Number of samples of good
quality
In Cascade control mode the
loop output/MV is not
directly driving an actuator,
but rather it is linked to or
setting or calculating the SP
for another controller loop.
For example, a flow control
loop is trying to control the
flow, measured by a flow
meter, to a desired SP by
changing a valve position.
The flow control loop
calculates a desired valve
position, which in turn
becomes the requested
position SP for a valve
positioning control loop that
changes a pressure to move
the valve to a desired
position. The two loops are
linked together in cascade.
The flow control loop
depends on the valve
positioning control loop to
do its job; if the latter does
not work well, the former
will also not work well.
OPM-CLPM-
Performance
114 © 2020 General Electric Company
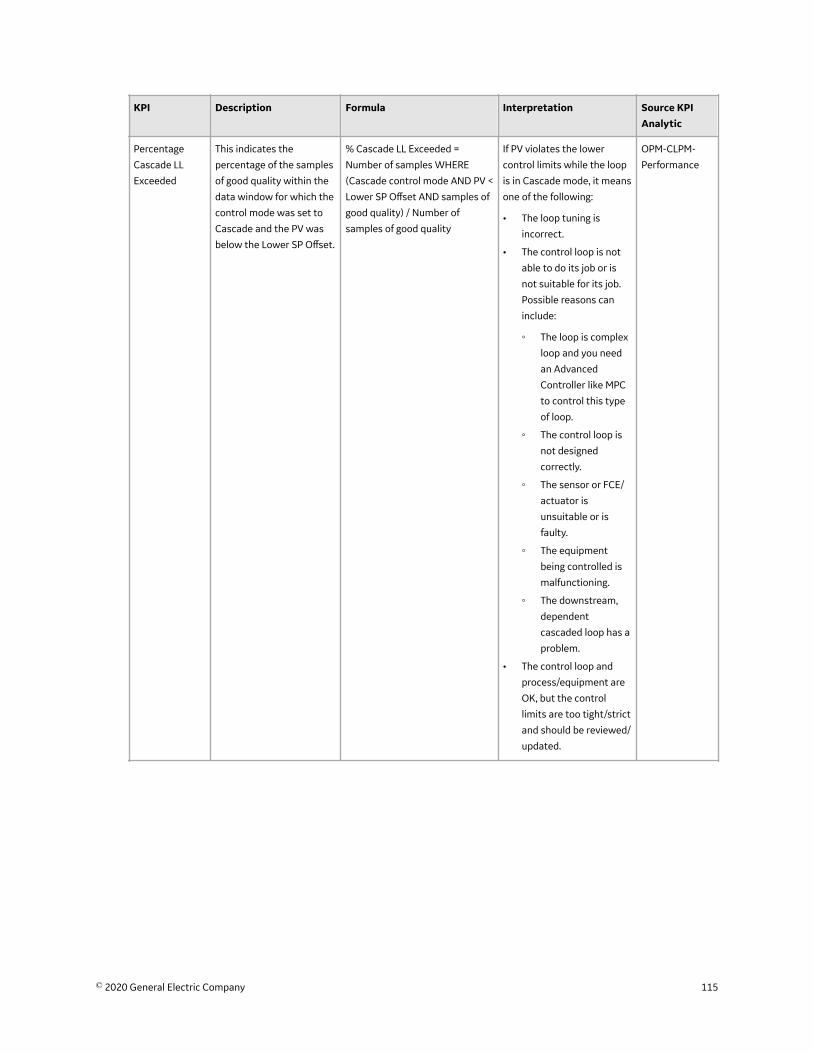
KPI Description Formula Interpretation Source KPIAnalytic
Percentage
Cascade LL
Exceeded
This indicates the
percentage of the samples
of good quality within the
data window for which the
control mode was set to
Cascade and the PV was
below the Lower SP Offset.
% Cascade LL Exceeded =
Number of samples WHERE
(Cascade control mode AND PV <
Lower SP Offset AND samples of
good quality) / Number of
samples of good quality
If PV violates the lower
control limits while the loop
is in Cascade mode, it means
one of the following:
• The loop tuning is
incorrect.
• The control loop is not
able to do its job or is
not suitable for its job.
Possible reasons can
include:
◦ The loop is complex
loop and you need
an Advanced
Controller like MPC
to control this type
of loop.
◦ The control loop is
not designed
correctly.
◦ The sensor or FCE/
actuator is
unsuitable or is
faulty.
◦ The equipment
being controlled is
malfunctioning.
◦ The downstream,
dependent
cascaded loop has a
problem.
• The control loop and
process/equipment are
OK, but the control
limits are too tight/strict
and should be reviewed/
updated.
OPM-CLPM-
Performance
© 2020 General Electric Company 115
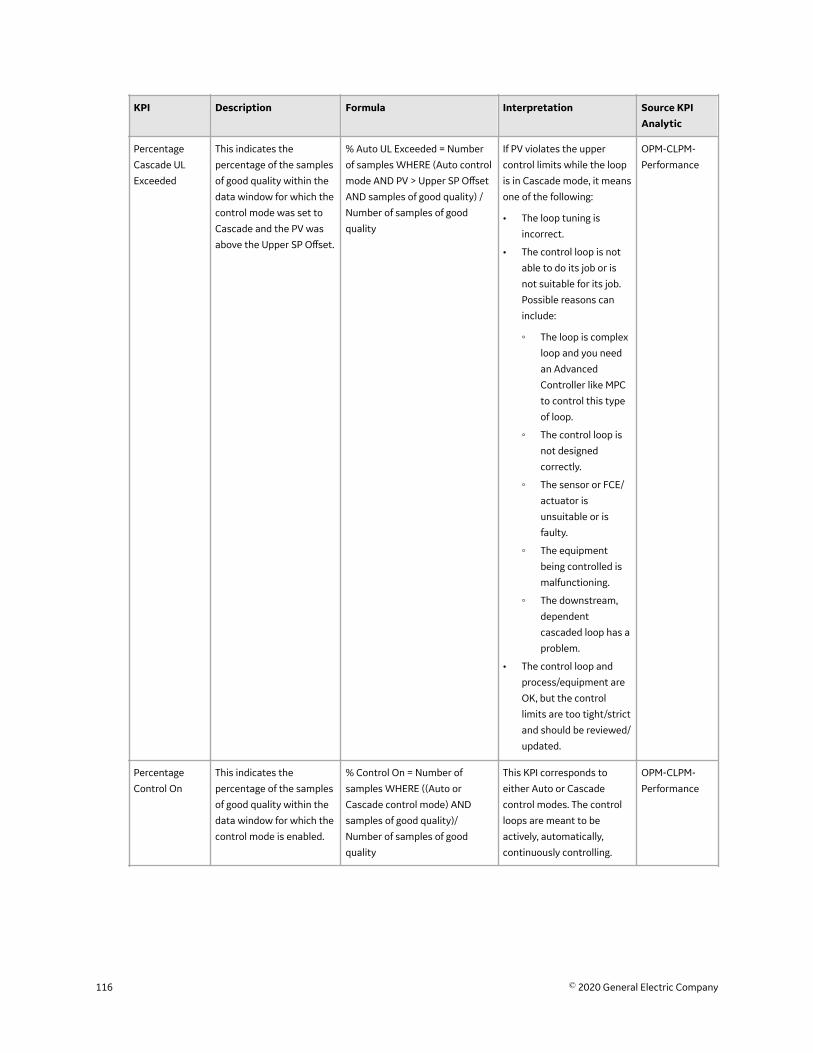
KPI Description Formula Interpretation Source KPIAnalytic
Percentage
Cascade UL
Exceeded
This indicates the
percentage of the samples
of good quality within the
data window for which the
control mode was set to
Cascade and the PV was
above the Upper SP Offset.
% Auto UL Exceeded = Number
of samples WHERE (Auto control
mode AND PV > Upper SP Offset
AND samples of good quality) /
Number of samples of good
quality
If PV violates the upper
control limits while the loop
is in Cascade mode, it means
one of the following:
• The loop tuning is
incorrect.
• The control loop is not
able to do its job or is
not suitable for its job.
Possible reasons can
include:
◦ The loop is complex
loop and you need
an Advanced
Controller like MPC
to control this type
of loop.
◦ The control loop is
not designed
correctly.
◦ The sensor or FCE/
actuator is
unsuitable or is
faulty.
◦ The equipment
being controlled is
malfunctioning.
◦ The downstream,
dependent
cascaded loop has a
problem.
• The control loop and
process/equipment are
OK, but the control
limits are too tight/strict
and should be reviewed/
updated.
OPM-CLPM-
Performance
Percentage
Control On
This indicates the
percentage of the samples
of good quality within the
data window for which the
control mode is enabled.
% Control On = Number of
samples WHERE ((Auto or
Cascade control mode) AND
samples of good quality)/
Number of samples of good
quality
This KPI corresponds to
either Auto or Cascade
control modes. The control
loops are meant to be
actively, automatically,
continuously controlling.
OPM-CLPM-
Performance
116 © 2020 General Electric Company
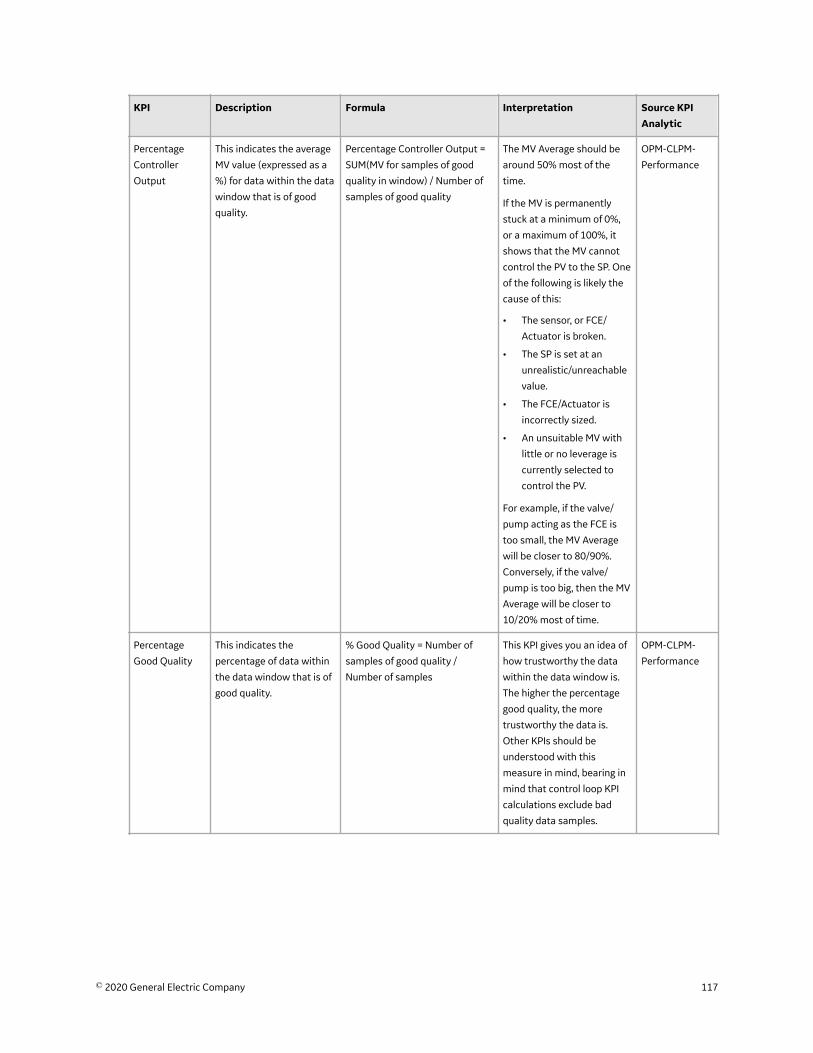
KPI Description Formula Interpretation Source KPIAnalytic
Percentage
Controller
Output
This indicates the average
MV value (expressed as a
%) for data within the data
window that is of good
quality.
Percentage Controller Output =
SUM(MV for samples of good
quality in window) / Number of
samples of good quality
The MV Average should be
around 50% most of the
time.
If the MV is permanently
stuck at a minimum of 0%,
or a maximum of 100%, it
shows that the MV cannot
control the PV to the SP. One
of the following is likely the
cause of this:
• The sensor, or FCE/
Actuator is broken.
• The SP is set at an
unrealistic/unreachable
value.
• The FCE/Actuator is
incorrectly sized.
• An unsuitable MV with
little or no leverage is
currently selected to
control the PV.
For example, if the valve/
pump acting as the FCE is
too small, the MV Average
will be closer to 80/90%.
Conversely, if the valve/
pump is too big, then the MV
Average will be closer to
10/20% most of time.
OPM-CLPM-
Performance
Percentage
Good Quality
This indicates the
percentage of data within
the data window that is of
good quality.
% Good Quality = Number of
samples of good quality /
Number of samples
This KPI gives you an idea of
how trustworthy the data
within the data window is.
The higher the percentage
good quality, the more
trustworthy the data is.
Other KPIs should be
understood with this
measure in mind, bearing in
mind that control loop KPI
calculations exclude bad
quality data samples.
OPM-CLPM-
Performance
© 2020 General Electric Company 117
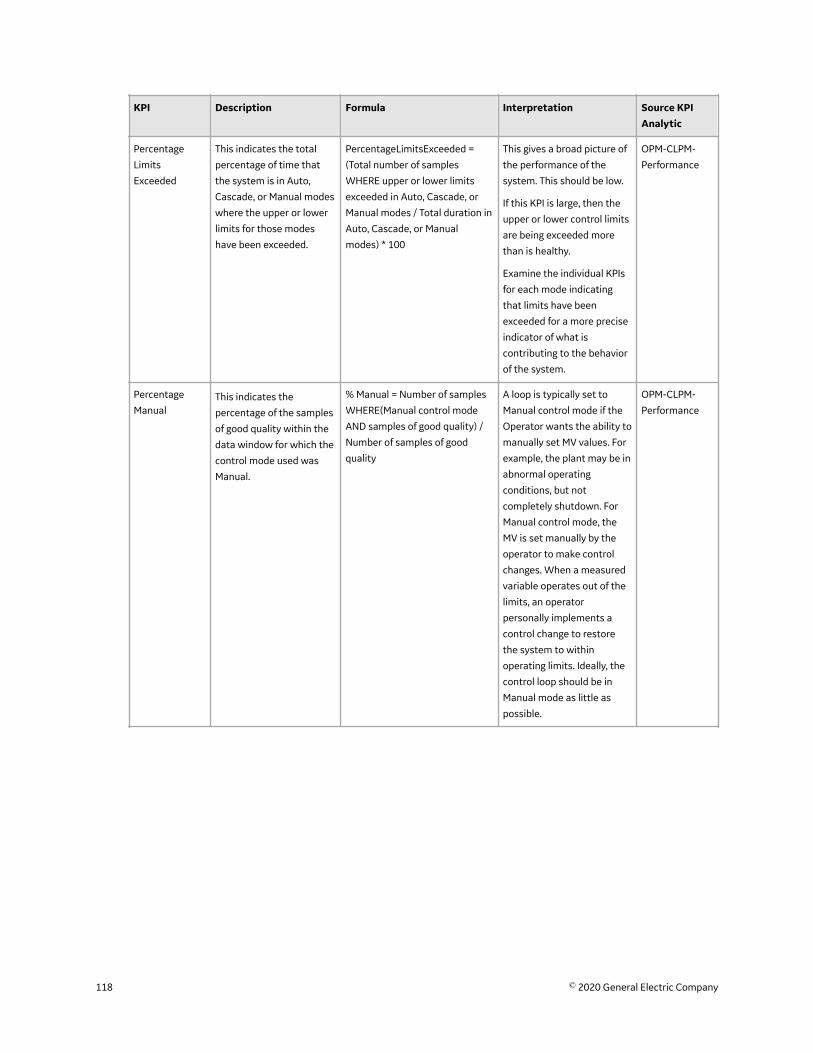
KPI Description Formula Interpretation Source KPIAnalytic
Percentage
Limits
Exceeded
This indicates the total
percentage of time that
the system is in Auto,
Cascade, or Manual modes
where the upper or lower
limits for those modes
have been exceeded.
PercentageLimitsExceeded =
(Total number of samples
WHERE upper or lower limits
exceeded in Auto, Cascade, or
Manual modes / Total duration in
Auto, Cascade, or Manual
modes) * 100
This gives a broad picture of
the performance of the
system. This should be low.
If this KPI is large, then the
upper or lower control limits
are being exceeded more
than is healthy.
Examine the individual KPIs
for each mode indicating
that limits have been
exceeded for a more precise
indicator of what is
contributing to the behavior
of the system.
OPM-CLPM-
Performance
Percentage
ManualThis indicates the
percentage of the samples
of good quality within the
data window for which the
control mode used was
Manual.
% Manual = Number of samples
WHERE(Manual control mode
AND samples of good quality) /
Number of samples of good
quality
A loop is typically set to
Manual control mode if the
Operator wants the ability to
manually set MV values. For
example, the plant may be in
abnormal operating
conditions, but not
completely shutdown. For
Manual control mode, the
MV is set manually by the
operator to make control
changes. When a measured
variable operates out of the
limits, an operator
personally implements a
control change to restore
the system to within
operating limits. Ideally, the
control loop should be in
Manual mode as little as
possible.
OPM-CLPM-
Performance
118 © 2020 General Electric Company
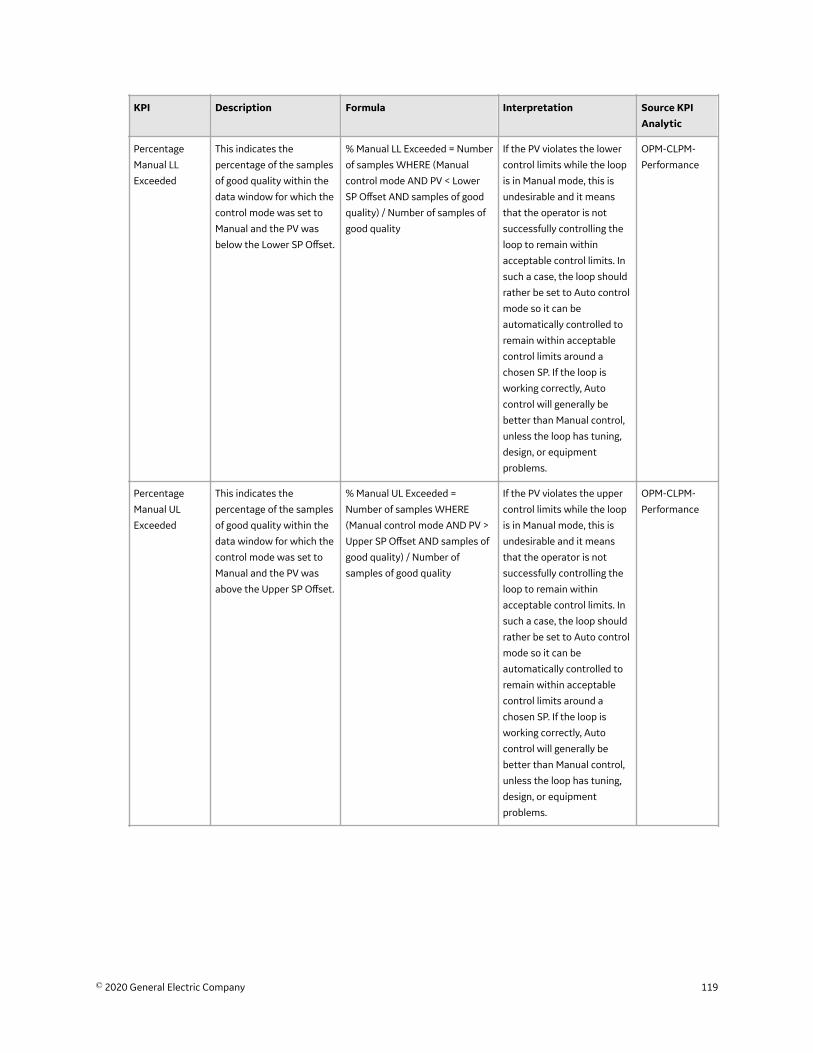
KPI Description Formula Interpretation Source KPIAnalytic
Percentage
Manual LL
Exceeded
This indicates the
percentage of the samples
of good quality within the
data window for which the
control mode was set to
Manual and the PV was
below the Lower SP Offset.
% Manual LL Exceeded = Number
of samples WHERE (Manual
control mode AND PV < Lower
SP Offset AND samples of good
quality) / Number of samples of
good quality
If the PV violates the lower
control limits while the loop
is in Manual mode, this is
undesirable and it means
that the operator is not
successfully controlling the
loop to remain within
acceptable control limits. In
such a case, the loop should
rather be set to Auto control
mode so it can be
automatically controlled to
remain within acceptable
control limits around a
chosen SP. If the loop is
working correctly, Auto
control will generally be
better than Manual control,
unless the loop has tuning,
design, or equipment
problems.
OPM-CLPM-
Performance
Percentage
Manual UL
Exceeded
This indicates the
percentage of the samples
of good quality within the
data window for which the
control mode was set to
Manual and the PV was
above the Upper SP Offset.
% Manual UL Exceeded =
Number of samples WHERE
(Manual control mode AND PV >
Upper SP Offset AND samples of
good quality) / Number of
samples of good quality
If the PV violates the upper
control limits while the loop
is in Manual mode, this is
undesirable and it means
that the operator is not
successfully controlling the
loop to remain within
acceptable control limits. In
such a case, the loop should
rather be set to Auto control
mode so it can be
automatically controlled to
remain within acceptable
control limits around a
chosen SP. If the loop is
working correctly, Auto
control will generally be
better than Manual control,
unless the loop has tuning,
design, or equipment
problems.
OPM-CLPM-
Performance
© 2020 General Electric Company 119
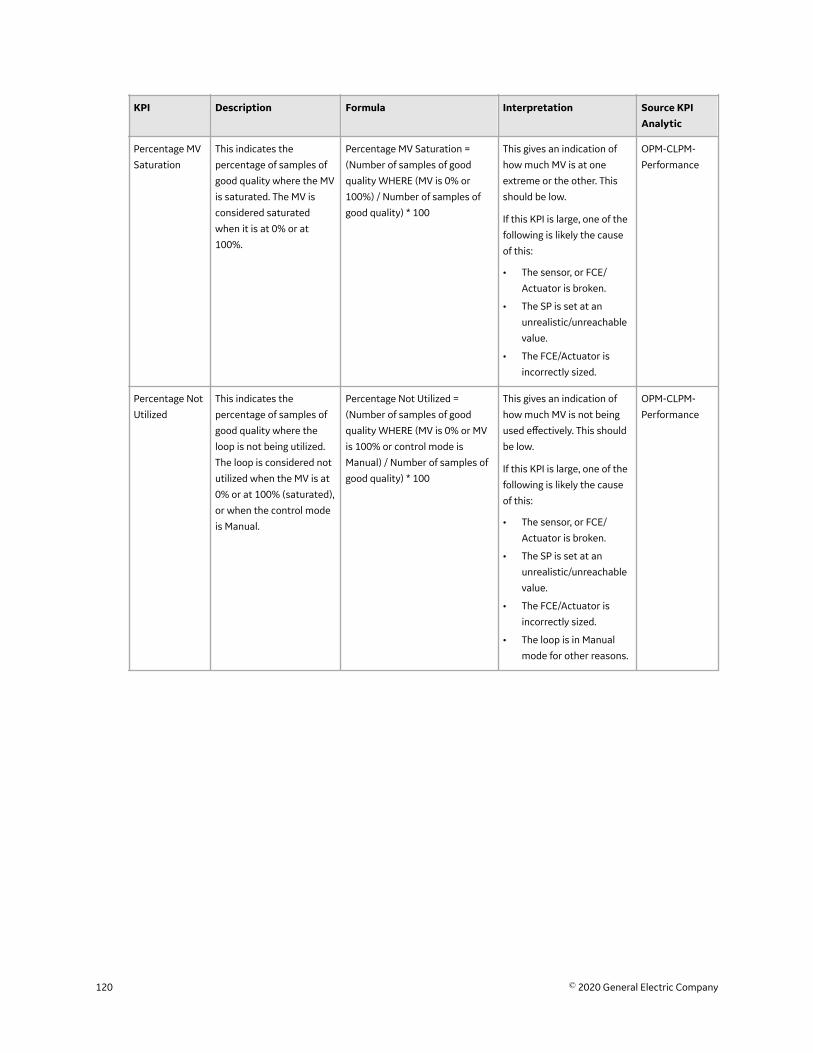
KPI Description Formula Interpretation Source KPIAnalytic
Percentage MV
Saturation
This indicates the
percentage of samples of
good quality where the MV
is saturated. The MV is
considered saturated
when it is at 0% or at
100%.
Percentage MV Saturation =
(Number of samples of good
quality WHERE (MV is 0% or
100%) / Number of samples of
good quality) * 100
This gives an indication of
how much MV is at one
extreme or the other. This
should be low.
If this KPI is large, one of the
following is likely the cause
of this:
• The sensor, or FCE/
Actuator is broken.
• The SP is set at an
unrealistic/unreachable
value.
• The FCE/Actuator is
incorrectly sized.
OPM-CLPM-
Performance
Percentage Not
Utilized
This indicates the
percentage of samples of
good quality where the
loop is not being utilized.
The loop is considered not
utilized when the MV is at
0% or at 100% (saturated),
or when the control mode
is Manual.
Percentage Not Utilized =
(Number of samples of good
quality WHERE (MV is 0% or MV
is 100% or control mode is
Manual) / Number of samples of
good quality) * 100
This gives an indication of
how much MV is not being
used effectively. This should
be low.
If this KPI is large, one of the
following is likely the cause
of this:
• The sensor, or FCE/
Actuator is broken.
• The SP is set at an
unrealistic/unreachable
value.
• The FCE/Actuator is
incorrectly sized.
• The loop is in Manual
mode for other reasons.
OPM-CLPM-
Performance
120 © 2020 General Electric Company
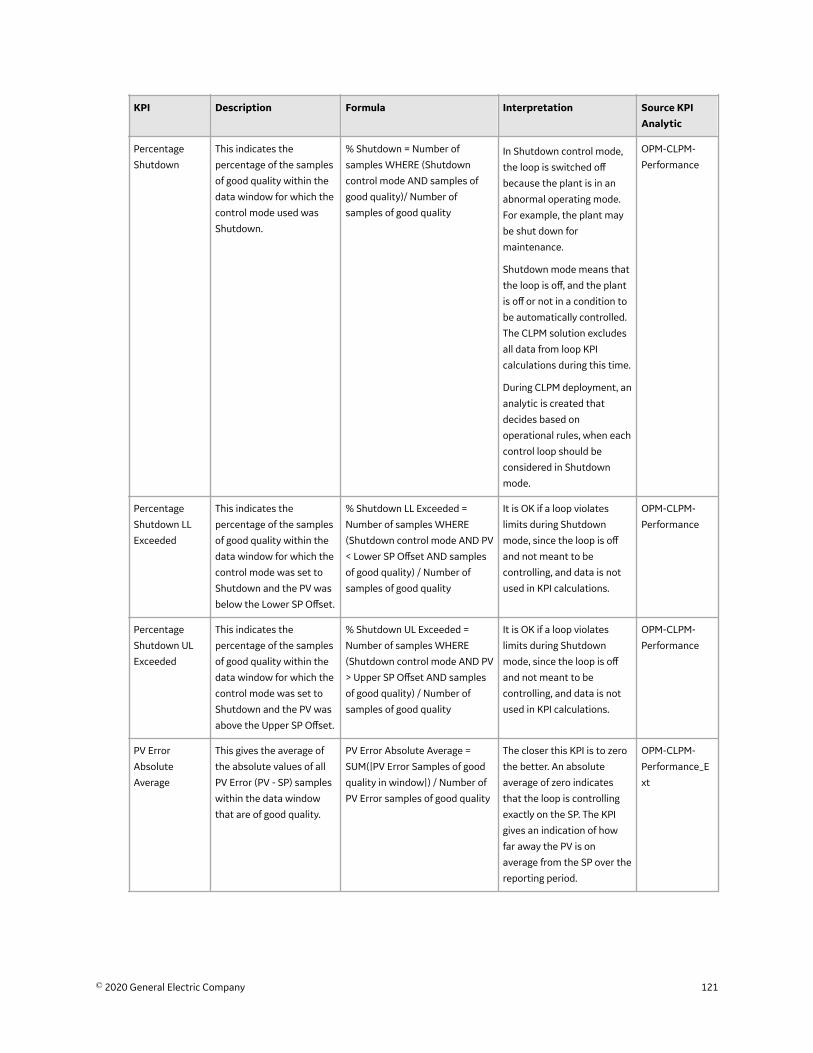
KPI Description Formula Interpretation Source KPIAnalytic
Percentage
Shutdown
This indicates the
percentage of the samples
of good quality within the
data window for which the
control mode used was
Shutdown.
% Shutdown = Number of
samples WHERE (Shutdown
control mode AND samples of
good quality)/ Number of
samples of good quality
In Shutdown control mode,
the loop is switched off
because the plant is in an
abnormal operating mode.
For example, the plant may
be shut down for
maintenance.
Shutdown mode means that
the loop is off, and the plant
is off or not in a condition to
be automatically controlled.
The CLPM solution excludes
all data from loop KPI
calculations during this time.
During CLPM deployment, an
analytic is created that
decides based on
operational rules, when each
control loop should be
considered in Shutdown
mode.
OPM-CLPM-
Performance
Percentage
Shutdown LL
Exceeded
This indicates the
percentage of the samples
of good quality within the
data window for which the
control mode was set to
Shutdown and the PV was
below the Lower SP Offset.
% Shutdown LL Exceeded =
Number of samples WHERE
(Shutdown control mode AND PV
< Lower SP Offset AND samples
of good quality) / Number of
samples of good quality
It is OK if a loop violates
limits during Shutdown
mode, since the loop is off
and not meant to be
controlling, and data is not
used in KPI calculations.
OPM-CLPM-
Performance
Percentage
Shutdown UL
Exceeded
This indicates the
percentage of the samples
of good quality within the
data window for which the
control mode was set to
Shutdown and the PV was
above the Upper SP Offset.
% Shutdown UL Exceeded =
Number of samples WHERE
(Shutdown control mode AND PV
> Upper SP Offset AND samples
of good quality) / Number of
samples of good quality
It is OK if a loop violates
limits during Shutdown
mode, since the loop is off
and not meant to be
controlling, and data is not
used in KPI calculations.
OPM-CLPM-
Performance
PV Error
Absolute
Average
This gives the average of
the absolute values of all
PV Error (PV - SP) samples
within the data window
that are of good quality.
PV Error Absolute Average =
SUM(|PV Error Samples of good
quality in window|) / Number of
PV Error samples of good quality
The closer this KPI is to zero
the better. An absolute
average of zero indicates
that the loop is controlling
exactly on the SP. The KPI
gives an indication of how
far away the PV is on
average from the SP over the
reporting period.
OPM-CLPM-
Performance_E
xt
© 2020 General Electric Company 121
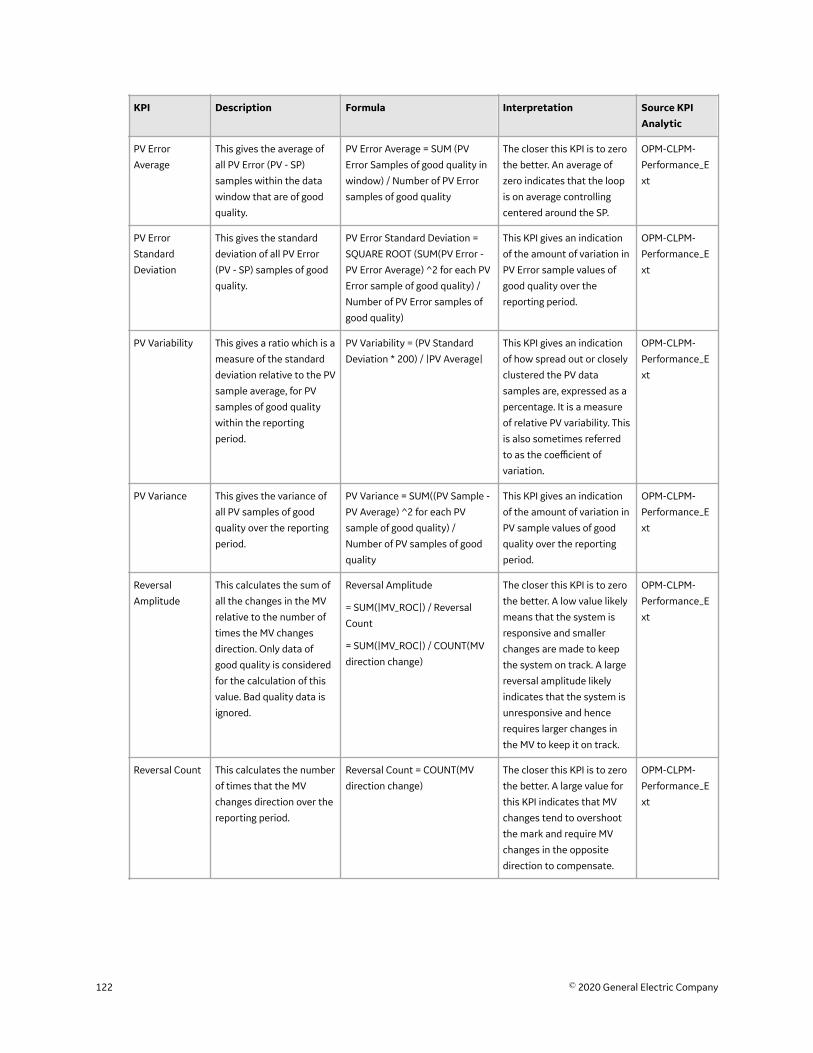
KPI Description Formula Interpretation Source KPIAnalytic
PV Error
Average
This gives the average of
all PV Error (PV - SP)
samples within the data
window that are of good
quality.
PV Error Average = SUM (PV
Error Samples of good quality in
window) / Number of PV Error
samples of good quality
The closer this KPI is to zero
the better. An average of
zero indicates that the loop
is on average controlling
centered around the SP.
OPM-CLPM-
Performance_E
xt
PV Error
Standard
Deviation
This gives the standard
deviation of all PV Error
(PV - SP) samples of good
quality.
PV Error Standard Deviation =
SQUARE ROOT (SUM(PV Error -
PV Error Average) ^2 for each PV
Error sample of good quality) /
Number of PV Error samples of
good quality)
This KPI gives an indication
of the amount of variation in
PV Error sample values of
good quality over the
reporting period.
OPM-CLPM-
Performance_E
xt
PV Variability This gives a ratio which is a
measure of the standard
deviation relative to the PV
sample average, for PV
samples of good quality
within the reporting
period.
PV Variability = (PV Standard
Deviation * 200) / |PV Average|
This KPI gives an indication
of how spread out or closely
clustered the PV data
samples are, expressed as a
percentage. It is a measure
of relative PV variability. This
is also sometimes referred
to as the coefficient of
variation.
OPM-CLPM-
Performance_E
xt
PV Variance This gives the variance of
all PV samples of good
quality over the reporting
period.
PV Variance = SUM((PV Sample -
PV Average) ^2 for each PV
sample of good quality) /
Number of PV samples of good
quality
This KPI gives an indication
of the amount of variation in
PV sample values of good
quality over the reporting
period.
OPM-CLPM-
Performance_E
xt
Reversal
Amplitude
This calculates the sum of
all the changes in the MV
relative to the number of
times the MV changes
direction. Only data of
good quality is considered
for the calculation of this
value. Bad quality data is
ignored.
Reversal Amplitude
= SUM(|MV_ROC|) / Reversal
Count
= SUM(|MV_ROC|) / COUNT(MV
direction change)
The closer this KPI is to zero
the better. A low value likely
means that the system is
responsive and smaller
changes are made to keep
the system on track. A large
reversal amplitude likely
indicates that the system is
unresponsive and hence
requires larger changes in
the MV to keep it on track.
OPM-CLPM-
Performance_E
xt
Reversal Count This calculates the number
of times that the MV
changes direction over the
reporting period.
Reversal Count = COUNT(MV
direction change)
The closer this KPI is to zero
the better. A large value for
this KPI indicates that MV
changes tend to overshoot
the mark and require MV
changes in the opposite
direction to compensate.
OPM-CLPM-
Performance_E
xt
122 © 2020 General Electric Company
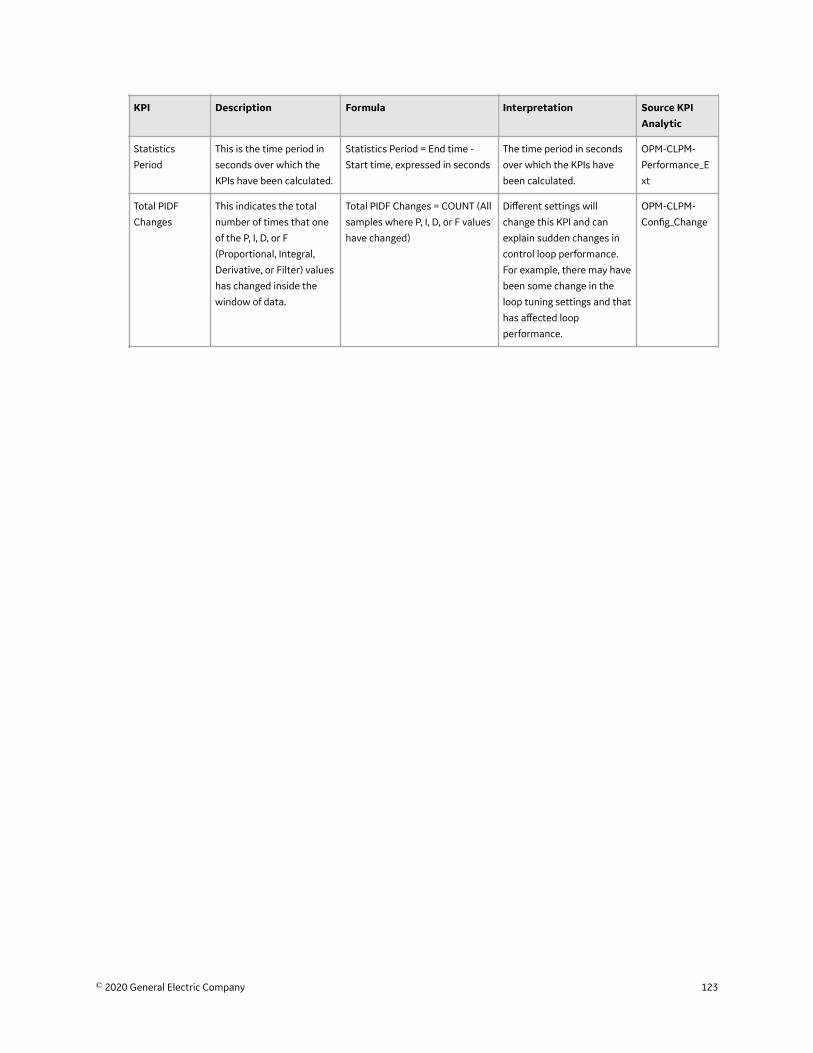
KPI Description Formula Interpretation Source KPIAnalytic
Statistics
Period
This is the time period in
seconds over which the
KPIs have been calculated.
Statistics Period = End time -
Start time, expressed in seconds
The time period in seconds
over which the KPIs have
been calculated.
OPM-CLPM-
Performance_E
xt
Total PIDF
Changes
This indicates the total
number of times that one
of the P, I, D, or F
(Proportional, Integral,
Derivative, or Filter) values
has changed inside the
window of data.
Total PIDF Changes = COUNT (All
samples where P, I, D, or F values
have changed)
Different settings will
change this KPI and can
explain sudden changes in
control loop performance.
For example, there may have
been some change in the
loop tuning settings and that
has affected loop
performance.
OPM-CLPM-
Config_Change
© 2020 General Electric Company 123

Non-Aggregate KPIsThese non-aggregate KPIs are given for the data window.
124 © 2020 General Electric Company
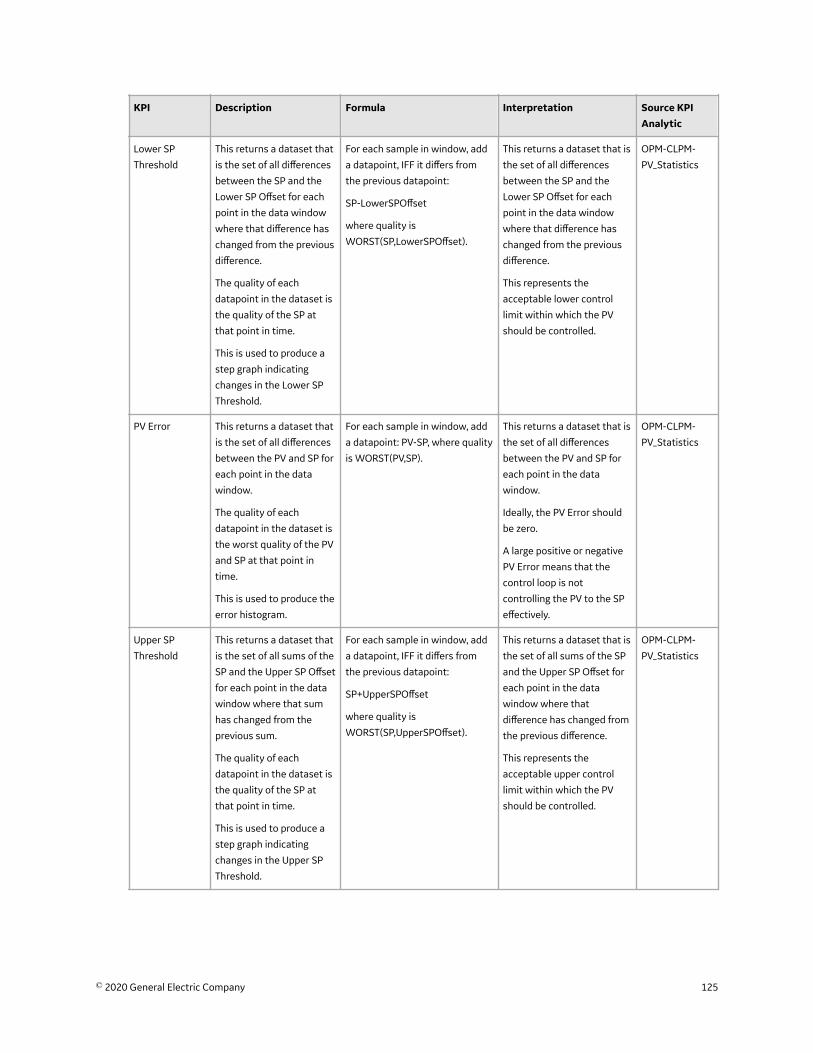
KPI Description Formula Interpretation Source KPIAnalytic
Lower SP
Threshold
This returns a dataset that
is the set of all differences
between the SP and the
Lower SP Offset for each
point in the data window
where that difference has
changed from the previous
difference.
The quality of each
datapoint in the dataset is
the quality of the SP at
that point in time.
This is used to produce a
step graph indicating
changes in the Lower SP
Threshold.
For each sample in window, add
a datapoint, IFF it differs from
the previous datapoint:
SP-LowerSPOffset
where quality is
WORST(SP,LowerSPOffset).
This returns a dataset that is
the set of all differences
between the SP and the
Lower SP Offset for each
point in the data window
where that difference has
changed from the previous
difference.
This represents the
acceptable lower control
limit within which the PV
should be controlled.
OPM-CLPM-
PV_Statistics
PV Error This returns a dataset that
is the set of all differences
between the PV and SP for
each point in the data
window.
The quality of each
datapoint in the dataset is
the worst quality of the PV
and SP at that point in
time.
This is used to produce the
error histogram.
For each sample in window, add
a datapoint: PV-SP, where quality
is WORST(PV,SP).
This returns a dataset that is
the set of all differences
between the PV and SP for
each point in the data
window.
Ideally, the PV Error should
be zero.
A large positive or negative
PV Error means that the
control loop is not
controlling the PV to the SP
effectively.
OPM-CLPM-
PV_Statistics
Upper SP
Threshold
This returns a dataset that
is the set of all sums of the
SP and the Upper SP Offset
for each point in the data
window where that sum
has changed from the
previous sum.
The quality of each
datapoint in the dataset is
the quality of the SP at
that point in time.
This is used to produce a
step graph indicating
changes in the Upper SP
Threshold.
For each sample in window, add
a datapoint, IFF it differs from
the previous datapoint:
SP+UpperSPOffset
where quality is
WORST(SP,UpperSPOffset).
This returns a dataset that is
the set of all sums of the SP
and the Upper SP Offset for
each point in the data
window where that
difference has changed from
the previous difference.
This represents the
acceptable upper control
limit within which the PV
should be controlled.
OPM-CLPM-
PV_Statistics
© 2020 General Electric Company 125

Chapter
8Release NotesTopics:
• Control Loop PerformanceMonitoring Release Notes Q22019
• Control Loop PerformanceMonitoring Release Notes Q12019
126 © 2020 General Electric Company
Control Loop Performance Monitoring Release Notes Q2 2019This topic provides a list of product changes released for this module on the dates listed below.
Release Date: June 3, 2019
Table 4: Enhancements and New Features
The following enhancements and new features have been added.
Description Tracking ID
The Loop Dashboard now has the capability to display information till the latest available data
point for the specified dates.
US340762
In the Fleet Dashboard, you can now access the historical data by specifying a date range of up to
30 days.
US325581
Control Loop Performance Monitoring Release Notes Q1 2019This topic provides a list of product changes released for this module on the dates listed below.
Release Date: March 29, 2019
Table 5: Enhancements and New Features
The following enhancements and new features have been added.
Note Tracking ID
Additional alerting analytics are now available for scheduling. Once configured, these alerts can
notify you of the following situations:
• Poor PV sensor data.
• Potential problems with loop tuning or design.
• Poor MV sensor data.
Consult the Deploy CLPM Analytics section of this documentation for more information.
F41291
Enhancements have been made to the Control Loop Performance Table in the Fleet Dashboard.
• Advanced filters are now available, including a global filter, multiple-level filters, text filters,
and conditional parameters to filter data in the table.
• Updates have also been made to improve responsiveness when loading the table.
F41287
The Diagnostic Alerts Filtering smart filter has been added to the Fleet Dashboard in this release.
This smart filter is a visual tool to identify faulty control loops.
F36574
Table 6: Known Issues
The following issues are unresolved in this release.
© 2020 General Electric Company 127
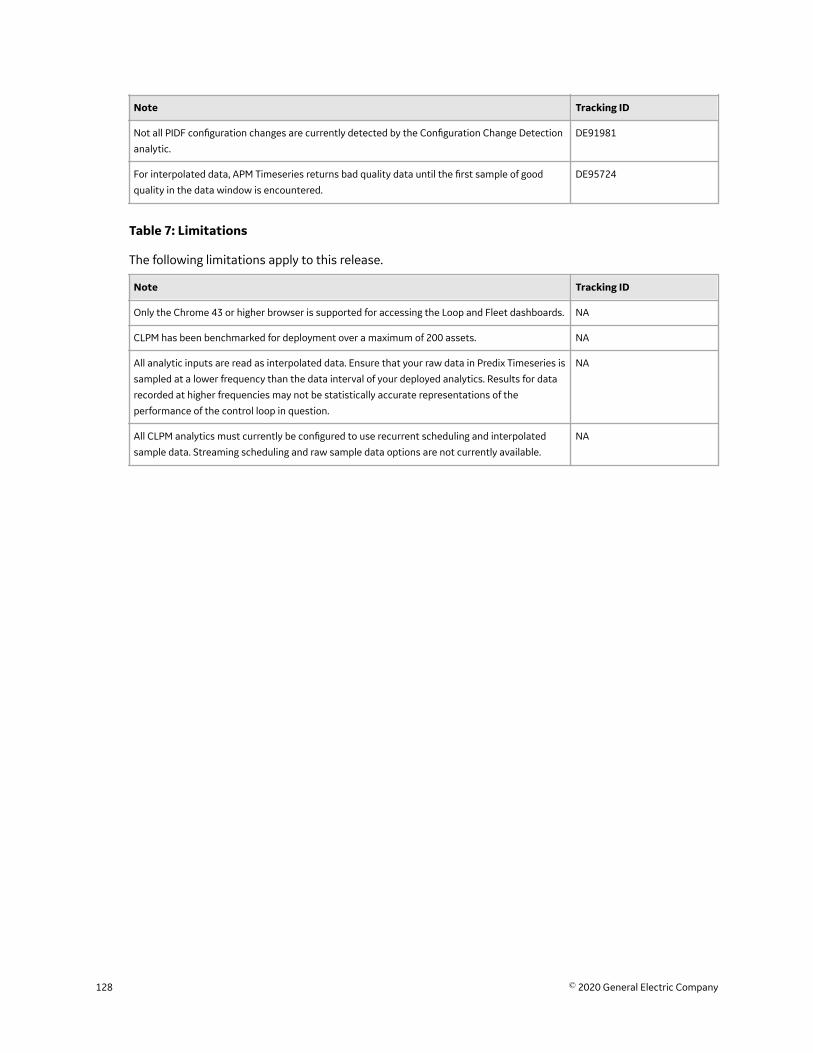
Note Tracking ID
Not all PIDF configuration changes are currently detected by the Configuration Change Detection
analytic.
DE91981
For interpolated data, APM Timeseries returns bad quality data until the first sample of good
quality in the data window is encountered.
DE95724
Table 7: Limitations
The following limitations apply to this release.
Note Tracking ID
Only the Chrome 43 or higher browser is supported for accessing the Loop and Fleet dashboards. NA
CLPM has been benchmarked for deployment over a maximum of 200 assets. NA
All analytic inputs are read as interpolated data. Ensure that your raw data in Predix Timeseries is
sampled at a lower frequency than the data interval of your deployed analytics. Results for data
recorded at higher frequencies may not be statistically accurate representations of the
performance of the control loop in question.
NA
All CLPM analytics must currently be configured to use recurrent scheduling and interpolated
sample data. Streaming scheduling and raw sample data options are not currently available.
NA
128 © 2020 General Electric Company