Embed Size (px)
Citation preview

Data-Driven Methods to Monitor, Model, Forecast and
Control Covid-19 Pandemic: Leveraging Data Science,
Epidemiology and Control Theory
Teodoro Alamo∗, Daniel G. Reina†, Pablo Milln Gata ‡
Abstract
This document analyzes the role of data-driven methodologies in Covid-19 pan-demic. We provide a SWOT analysis and a roadmap that goes from the access to datasources to the final decision-making step. We aim to review the available methodolo-gies while anticipating the difficulties and challenges in the development of data-drivenstrategies to combat the Covid-19 pandemic. A 3M-analysis is presented: Monitoring,Modelling and Making decisions. The focus is on the potential of well-known data-driven schemes to address different challenges raised by the pandemic: i) monitoringand forecasting the spread of the epidemic; (ii) assessing the effectiveness of governmentdecisions; (iii) making timely decisions. Each step of the roadmap is detailed through areview of consolidated theoretical results and their potential application in the Covid-19context. When possible, we provide examples of their applications on past or presentepidemics. We do not provide an exhaustive enumeration of methodologies, algorithmsand applications. We do try to serve as a bridge between different disciplines requiredto provide a holistic approach to the epidemic: data science, epidemiology, control-theory, etc. That is, we highlight effective data-driven methodologies that have beenshown to be successful in other contexts and that have potential application in thedifferent steps of the proposed roadmap. To make this document more functional andadapted to the specifics of each discipline, we encourage researchers and practitionersto provide feedback1. We will update this document regularly.
CONCO-Team: The authors of this paper belong to the CONtrol COvid-19 Team,which is composed of more than 35 researches from universities of Spain, Italy, France,Germany, United Kingdom and Argentina. The main goal of CONCO-Team is todevelop data-driven methods for the better understanding and control of the pandemic.
Keywords: Covid-19, Coronavirus, SARS-Cov-2, data repositories, epidemiologicalmodels, machine learning, forecasting, surveillance systems, epidemic control, optimal con-trol theory, model predictive control.
∗Departamento de Ingenierıa de Sistemas y Automatica, Universidad de Sevilla, Escuela Superior deIngenieros, Camino de los Descubrimientos s/n, 41092 Sevilla, Spain (e-mail: [email protected])†Departamento de Ingenierıa Electrnica, Universidad de Sevilla, Escuela Superior de Ingenieros, Camino
de los Descubrimientos s/n, 41092 Sevilla, Spain (e-mail: [email protected])‡Departamento de Ingeniera, Universidad Loyola Andaluca, 41014 Seville, Spain (e-mail: pmil-
[email protected])[email protected]
arX
iv:2
006.
0173
1v2
[q-
bio.
PE]
10
Jun
2020

Contents
1 Introduction 4
2 SWOT analysis of data-driven methods in Covid-19 pandemic 62.1 Strengths . . . . . . . . . . . . . . . . . . . . . . . . . . . . . . . . . . . . . . 62.2 Weaknesses . . . . . . . . . . . . . . . . . . . . . . . . . . . . . . . . . . . . . 82.3 Opportunities . . . . . . . . . . . . . . . . . . . . . . . . . . . . . . . . . . . . 82.4 Threats . . . . . . . . . . . . . . . . . . . . . . . . . . . . . . . . . . . . . . . 9
3 Data sources 93.1 Limitations of available data sources . . . . . . . . . . . . . . . . . . . . . . . 103.2 Covid-19 data sources . . . . . . . . . . . . . . . . . . . . . . . . . . . . . . . 103.3 Government measures . . . . . . . . . . . . . . . . . . . . . . . . . . . . . . . 113.4 Social-economic indicators . . . . . . . . . . . . . . . . . . . . . . . . . . . . . 113.5 Auxilary data sources . . . . . . . . . . . . . . . . . . . . . . . . . . . . . . . 123.6 Data curation . . . . . . . . . . . . . . . . . . . . . . . . . . . . . . . . . . . . 13
4 Consolidated Time-Series 134.1 Pre-processing data . . . . . . . . . . . . . . . . . . . . . . . . . . . . . . . . . 144.2 Data reconciliation . . . . . . . . . . . . . . . . . . . . . . . . . . . . . . . . 144.3 Data fusion . . . . . . . . . . . . . . . . . . . . . . . . . . . . . . . . . . . . . 154.4 Clustering methods . . . . . . . . . . . . . . . . . . . . . . . . . . . . . . . . . 154.5 Time-series theory . . . . . . . . . . . . . . . . . . . . . . . . . . . . . . . . . 16
5 Estimation of the state of the pandemic 175.1 Real-time epidemiology . . . . . . . . . . . . . . . . . . . . . . . . . . . . . . 175.2 Proactive testing . . . . . . . . . . . . . . . . . . . . . . . . . . . . . . . . . . 185.3 State space estimation methods . . . . . . . . . . . . . . . . . . . . . . . . . . 185.4 Epidemic wave surveillance . . . . . . . . . . . . . . . . . . . . . . . . . . . . 18
6 Epidemiological models 196.1 Time-response and viral shedding of Covid-19 . . . . . . . . . . . . . . . . . . 196.2 Compartmental models . . . . . . . . . . . . . . . . . . . . . . . . . . . . . . 20
6.2.1 Basic compartmental models . . . . . . . . . . . . . . . . . . . . . . . 206.2.2 Extended compartmental models . . . . . . . . . . . . . . . . . . . . . 216.2.3 Age-structured models . . . . . . . . . . . . . . . . . . . . . . . . . . . 226.2.4 Modelling the seasonal behaviour of Covid-19 . . . . . . . . . . . . . . 22
6.3 Spatial epidemilogy . . . . . . . . . . . . . . . . . . . . . . . . . . . . . . . . . 226.4 Computer-based models . . . . . . . . . . . . . . . . . . . . . . . . . . . . . . 246.5 Modelling the effect of containment measures . . . . . . . . . . . . . . . . . . 246.6 Fitting epidemic models to data . . . . . . . . . . . . . . . . . . . . . . . . . . 25
6.6.1 Sensitivity analysis . . . . . . . . . . . . . . . . . . . . . . . . . . . . . 266.6.2 Validation and model selection . . . . . . . . . . . . . . . . . . . . . . 26
2

7 Forecasting 277.1 Identifying relevant variables . . . . . . . . . . . . . . . . . . . . . . . . . . . 287.2 Parametric methods . . . . . . . . . . . . . . . . . . . . . . . . . . . . . . . . 297.3 Non-parametric approaches . . . . . . . . . . . . . . . . . . . . . . . . . . . . 317.4 Deep Learning . . . . . . . . . . . . . . . . . . . . . . . . . . . . . . . . . . . 327.5 Ensemble methods . . . . . . . . . . . . . . . . . . . . . . . . . . . . . . . . . 337.6 Time Series Theory . . . . . . . . . . . . . . . . . . . . . . . . . . . . . . . . . 347.7 Assessing the performance of forecasting models . . . . . . . . . . . . . . . . 35
7.7.1 Performance metrics . . . . . . . . . . . . . . . . . . . . . . . . . . . . 36
8 Impact Assessment Tools 378.1 Spread of the virus and reproductive number . . . . . . . . . . . . . . . . . . 378.2 Saturation of the health-care systems . . . . . . . . . . . . . . . . . . . . . . . 388.3 Social impact . . . . . . . . . . . . . . . . . . . . . . . . . . . . . . . . . . . . 39
9 Decision Making 409.1 Controllability of the pandemic . . . . . . . . . . . . . . . . . . . . . . . . . . 419.2 Optimal allocation of limited resources . . . . . . . . . . . . . . . . . . . . . . 419.3 Trigger Control . . . . . . . . . . . . . . . . . . . . . . . . . . . . . . . . . . . 429.4 Optimal Control Theory . . . . . . . . . . . . . . . . . . . . . . . . . . . . . . 449.5 Model Predictive Control . . . . . . . . . . . . . . . . . . . . . . . . . . . . . 459.6 Multi-objective control . . . . . . . . . . . . . . . . . . . . . . . . . . . . . . . 459.7 Reinforcement Learning . . . . . . . . . . . . . . . . . . . . . . . . . . . . . . 46
10 Conclusions 4710.1 Updates and Contributors . . . . . . . . . . . . . . . . . . . . . . . . . . . . . 48
3
1 Introduction
The outbreak of 2019 novel coronavirus disease (Covid-19) is a public health emergencyof international concern. Governments, public institutions, health-care professionals andresearches of different disciplines are addressing the problem of controlling the spread of thevirus while reducing the negative effect on the economy and society. The challenges raisedby the pandemic require a holistic approach. In this document we analyze the interplaybetween data science, epidemiology and control theory in the decision making process. Inline with the current and urgent needs identified by epidemiologists [81], this paper aims tosift the available methodologies while anticipating the difficulties and challenges encounteredin the development of data-driven strategies to combat the Covid-19 pandemic. Data-drivenschemes can be fundamental to: i) monitor, model and forecast the spread of the epidemic;(ii) assess the potential impacts of government decisions not only from a health-care pointof view but also from an economic and social one; (iii) make timely decisions.
Data-driven community is formed by those researches and practitioners that developprediction models and decision-making tools based on data. As an initial step previous tothe description of the available methodologies, the strengths, weaknesses, opportunities andthreats encountered by this community when addressing the multiple challenges raised byCovid-19 pandemic are discussed by means of a SWOT analysis.
Optimal decision making in the context of Covid-19 pandemic is a complex process thatrequires to deal with a significant amount of uncertainty and the severe consequences ofnot reacting timely and with the adequate intensity. In this document, a roadmap thatgoes from the access to data sources to the final decision-making step is provided. A 3M-analysis is proposed: Monitoring, Modelling and Making decisions. See Figure 1. Each stepof the roadmap is analyzed through a review of consolidated theoretical results and theirpotential use in the Covid-19 context. When possible, examples of applications of thesemethodologies on past or present epidemics are provided. Data-driven methodologies thathave been shown to be successful in other biological contexts (e.g [139]), or that have beenidentified as promising solutions in the present pandemic, are highlighted. This documentdoes not provide an exhaustive enumeration of methodologies, algorithms and applications.Instead, it is conceived to serve as a bridge between the different disciplines required toprovide a holistic approach to the epidemic: data science, epidemiology and control theory.
Data is a fundamental pillar to understand, model, forecast, and manage many of theaspects required to provide a comprehensive response. There exists many different opendata resources and institutions providing relevant information not only in terms of specificepidemiological Covid-19 variables, but also of other auxiliary variables that facilitate theassessment of the effectiveness of the implemented interventions. See [4] for a review onCovid-19 open data resources and repositories.
Data reconciliation techniques play a relevant role in the proposed approach since theavailable data sources suffer from severe limitations. Methodologies like data reconciliation,data-fusion, data-clustering, signal processing, to name just a few, can be used to detectanomalies in the raw data and generate time-series with enhanced quality.
Another important aspect on the 3M-approach is the real-time surveillance of the epi-demic. This is implemented by monitorization of the mobility, the use of social media toassess the compliance of the restrictions and recommendations, pro-active testing, contact-
4

Figure 1: 3M-Approach to data-driven control of an epidemic: Monitoring, Modelling andMaking Decisions.
tracing, etc. In this context is also relevant the design and implementation of surveillancesystems capable of detecting secondary waves of the pandemic.
Modelling techniques are called to play a relevant role in the combat against Covid-19[190]. Epidemiological models range from low dimensional compartmental models to com-plex spatially distributed ones. Fundamental parameters that characterize the spreadingcapacity of the virus can be obtained from the adjusted models. Besides, data-driven para-metric inference provides mechanisms to anticipate the effectiveness of the adopted interven-tions. However, fitting the models to the available data requires specific techniques because
5

of critical issues like partial observation, non-linearities and non-identifiability. Sensitivityanalysis, model selection and validation methodologies have to be implemented. Apart fromthe forecasting possibilities that epidemiological models offer, there exists other possibili-ties. Different forecasting techniques from the field of data science can be applied in thiscontext. The choice ranges from simple linear parametric methods to complex deep-learningapproaches. The methods can be parametric or non parametric in nature. Some of thesetechniques provide probabilistic characterizations of the provided forecasts.
There are a myriad of potential measures to mitigate the epidemic, but some might notbe effective [244]. Besides, some of them, like lock-down of an entire country, have an unbear-able effect on economy and should be adopted at the precise moment and for the shortestperiod of time. Others, like pro-active testing and contact-tracing can be very effective andhave a minor impact on the economy [72]. Control theory provides a consolidated frameworkto formulate many of the decision-making problems: optimal allocation of resources, deter-mination of the optimal moment to strengthen the mitigation interventions, etc. The use ofoptimal control theory in epidemic control has a long history. We also mention the potentialof (distributed) model predictive control. Control theory, along with other mathematicalmethodologies like bifurcation theory, lyapunov theory, etc. have been extensively used tocharacterize the different possible qualitative behaviours of a given epidemic.
This document is organized as follows. In Section 2 we provide a SWOT analysis of therole of data-driven approaches in the control of the Covid-19 pandemic. Section 3 describesthe main data sources that can be used to develop data-driven methods. Section 4 is devotedto the available methodologies to improve the quality of data and the generation of consoli-dated time-series. Section 5 describes different methodologies to monitor the current state ofthe pandemic. An overview of the different techniques to model the epidemic is provided inSection 6. The main forecasting techniques are described in Section 7. The question of howto assess the effectiveness of different non-pharmaceutical measures is analyzed in Section8. The decision making process, and its link with control theory is addressed in Section 9.The paper is finished with a section of conclusions.
2 SWOT analysis of data-driven methods in Covid-19pandemic
With the aim of providing an overview of the potential impact of data-driven methodologiesin the control of Covid-19 pandemic, a SWOT analysis identifying strengths, weaknesses,opportunities, and threats is presented in this section. A summary of the conducted SWOTanalysis is presented in Figure 2. In the following subsections, the identified bullet pointsare further developed.
2.1 Strengths
Some of the main strengths of data-driven methods and related research groups fightingCovid-19 are given below:
• Experience acquired on past epidemics: Recent epidemics preceding Covid-19,like SARS or MERS, motivated a huge amount of research in the past (see for ex-
6

Figure 2: SWOT
ample [92], [12] and the references therein). This previous research effort not onlyprovides invaluable information about other epidemics, but it also enables today’s re-searches to count on data-driven techniques developed to estimate, model, forecast,and make decisions in the context of an epidemic outbreak. For example, [29] containsa comprehensive collection of mathematical models for epidemiology. In [242] relevantinformation about previous coronavirus epidemics is presented.
• Solid theoretical foundations of data-driven methods: Data-driven methods aresupported by strong theoretical foundations. This enables decision-makers to managepandemics with different tools, adapted to different contexts and data, and guarantee-ing different degrees of certainty and efficacy.
• Efficient optimization algorithms and solvers: Many data-driven methods areformulated as the solution of one or several optimization problems, which can beaddressed by means of efficient optimization algorithms and solvers [27].
• Big data analytics resources: Accurate and effective tools to control the evolutionof a pandemic require gathering and processing pervasive data. Big data analytics,developed in the 21st century to an unprecedented level, provides hundreds of differentinformation systems. Some examples are the use of mobile phones for contact tracing[186] or real-time mapping of epidemics using social networks [58].
• High computation capacity: The continuous fulfilment of Moore’s law for morethan 50 years has made possible enormous advances in hardware technologies, such
7

as supercomputers, clusters, and cloud computing, that include a large number ofprocessors and graphical processing units (GPUs). Such computation capacity benefitsthe development of complex data-driven methods.
2.2 Weaknesses
In what regards effectiveness fighting Covid-19, some general flaws of the academic commu-nity are detailed next:
• Many research groups do not possess the required interdisciplinary: Theworks reviewed in this survey suggest a relevant lack of interdisciplinary. Many re-ported analysis and results are not conducted joining efforts of, for example, epidemi-ologists, data-science scientists, experts in system engineering and economists. This islikely to produce results and recommendations that might be biased or may tend tooverlook aspects related to public health, advanced statistic tools, dynamics effects oreconomic impact.
• A solid and validated academic response is often slow: Academic outcomescome often in the form of academic publications and tools to produce predictions andrecommendations. Solid academic results require time to collect and process reliabledata, make developments, conduct validation and go through a peer-reviewing process.
• Poor characterization of Covid-19: Although a huge amount of effort has beendone to determine the main characteristics of Covid-19, months after the epidemicoutbreak, it is still difficult to count on consolidated results. As an example, there arestill many open questions related to the seasonal behaviour of the virus or the durationof the immunological protection after recovery.
2.3 Opportunities
Some of the most important opportunities are detailed below:
• Applicability of data-driven methodologies: As it is detailed in this document,many epidemiology subproblems, ranging from the estimation of the epidemic charac-teristics to forecasting and assessment of government measures, can be addressed usingdata-driven techniques. Decisions taken at the right time, like partial/total lock-downs,can save thousands of lives while limiting the damage to other socio-economic aspects.A quite comprehensive review of the measures taken by 11 European countries is madein [74], estimating a total impact in the reduction of the number of deaths from 87.000to 29.000, only for Europe and up until 30 March 2020.
• Coordinating institutions: A relevant number of institutions, like the World HealthOrganization and the different Centers for Disease Prevention and Control from a na-tional or continental scope, are making a great effort to provide a coordinated responseto the epidemic. Furthermore, many governments and research institutions have cre-ated interdisciplinary task forces aimed at developing data-driven approaches to fightCovid-19.
8

• Availability of many open data sources: The increasing number of institutionsand research teams working against Covid-19 is providing an invaluable amount ofmeaningful, open-data resources to address the pandemic from a data science point ofview (see [5] for an actualized survey of the main institutions and open-data repositoriesto fight Covid-19).
• Funding: The unthinkable social and economic impact of the Covid-19 pandemic isfostering the mobilization of huge public and private economic resources for relatedresearch.
2.4 Threats
Finally, this section summarizes the most important threats to success fighting the viruswith data-driven tools:
• Reduced government transparency: The secrecy on many aspects of the pandemicof some governments is hindering the access to valuable information [96].
• Inconsistent data sets: Unfortunately, the quality of the available data is far fromideal because of a good number of issues like changing criteria, insufficiently docu-mented large diversity of sources and formats, non-comparable metrics between coun-tries, aggregated data without a clear timestamp (often, some significant increases inthe time series are due to the aggregation on several days), etc. [4].
• Difficulties to transfer obtained results to society: The complexity of pandemicevolution, aggravated in today’s highly entangled and global world, makes it complexto transfer meaningful results to society in a clear way.
• Lack of validation of many results: The complexity of the phenomena and theneed for a rapid response against Covid-19 involves important risks. Many of thepublished results suffer from a lack of validation or test to assess their performance.Therefore, results or recommendations based on insufficiently corroborated analysismay be transferred to society at a given moment. This could explain, for example,the discrepant recommendations on the use of masks given by different national andinternational health institutions [63].
3 Data sources
Open data resources play an important role in the fight against Covid-19. Time series of thenumber of confirmed cases and deaths rates, among other indicators, are daily analyzed bythe scientific community. The objective is to study the spread and impact of Covid-19, bothworldwide and locally in each country or region, to evaluate the impact on several aspectssuch as citizens life, health systems, and economy. The main open data resources related toCovid-19 are summarized in [5] and [4].
9

3.1 Limitations of available data sources
Although plenty of information is available for Covid-19 pandemic, it is also clear thatimportant limitations are also presented in the available data sources ([4, Section 4]). Themain limitations are:
1. Wide variety of data formats and structures, making it difficult to aggregate all thedata in just one data set.
2. Time-varying nature of the sources, which limits simultaneous analysis on differentlocations.
3. Some metrics do not reflect reality; for example, the number of confirmed cases un-derestimates the fraction of infected population.
4. Difficulty in calculating some characteristics of the virus: Because of the general lackof individual case data, relevant characteristics like latent and incubation periods, haveto be inferred indirectly from aggregated time-series.
5. Variability on governments’ criteria to make the data available. This translates indifferent formats and contents of the respective data-sets. Besides, many open sourcesare not properly documented.
6. Lack of transparency related to the real impact of the pandemic [96].
These limitations undermine the use of the available raw data to i) measure the realstate of the pandemic, ii) develop appropriated epidemic models, iii) assess the quality ofgovernments’ mitigation actions, and iv) plan ahead suitable strategies.
Accurate models of Covid-19 pandemic cannot be developed just by using data relatedto the impact of the virus in human health. The reason is that the majority of parametersof the models cannot be explained isolating other related variables, such as demographic,connectivity, mobility, and weather. Therefore, a wide variety of variables to enhance theprediction models are required. Similarly, these variables are also necessary to evaluate theimpact of the assessment tools [4, Section 3].
3.2 Covid-19 data sources
Different open data sources with specific Covid-19 information are enumerated in this sub-section. For a detailed list of resources, see [5].
• Confirmed cases: Data sets collect the temporal series of the number of confirmednew cases, deaths, and recovered. Normally, data is available by country, and in somecases, also by region. The most used data set so far is maintained by Johns HopkinsUniversity (JHU)2. Other similar data sets can be found in [5]. Furthermore, localrepositories for each country can also be found. On this line, Table 1 contains someexample of regional data sets. This type of data sets presents a big picture of thepandemic in terms of human life impact.
2https://github.com/CSSEGISandData/COVID-19
10

• Pro-active testing: The data sets related to pro-active testing should provide infor-mation about the type of test carried out, the number of tests and number of positivecases. It is also essential to have access to auxiliary information such as age and gendergroup, professional activity, and the methodology used to carry out the selection of theindividuals to be tested. The website https://ourworldindata.org/ provides dataabout number of test carried out by country3.
• Contact-tracing: This data is related to contact among infected people and otherpersons. The data sets should indicate the connections of infected people with othersin the last few days. In [72], the authors state that the speed of the spread of Covid-19makes it impossible to implement manual tracing of contacts among infected people.Thus, it is clear that technology [166], such as Internet of Thing (IoT) [112] and wirelesscommunications [153], should play an important role in this task. One important issuefor measuring contacts and tracing citizens is data privacy. Currently, there is scarcityof data sets including contact-tracing (i.e., [22]). However, data sets used in multi-hopnetworks can be a direction to explore4 [106] to develop models since this field hasstudied human behaviour in terms of contacts for two decades [174][188].
• Individual data: Individual data collection refers to data gathered directly fromcitizens. The individual data differs from the official data release from governmentsand institutions in many ways since it can be biased, and therefore, it should beanalyzed carefully. Nevertheless, it is a useful source of data that should be taken intoaccount to monitor the impact of individuals point of view. Moreover, pre-diagnosiscan be done remotely using mobile devices, i.e., Apple has developed a pre-evaluationapplication5.
3.3 Government measures
The level and severity of the executed strategies are variable, ranging from soft actions, likeencouraging social distance and mask use, to hard measures such as closing schools, forbidmassive events, and complete lock-down. In this context, in [86], the authors developedthe Stringency Index (SI)6, that captures variation in containment and closure policies. SIconsiders 17 indicators of government responses, including containment and closure policies,economic policies, and health system policies. The values of SI are within the interval[0, 100], being a value of 100 the strictest response.
3.4 Social-economic indicators
Different data resources on social-economic indicators are presented in what follows. Seealso [5].
3https://ourworldindata.org/coronavirus-testing4http://crawdad.org/5https://www.apple.com/covid19/6https://www.bsg.ox.ac.uk/research/research-projects/coronavirus-government-response-tracker
11

Source GitHub repositoriesArgentina Ministry of Health Covid19arDataAustralia Australian Health Department covid-19-au
China China National Health Commission JHU, Midas-ChinaFrance Public France Health System opencovid19-fr
Germany Robert Koch Institute covid-19-germany-gaeIceland Government of Iceland gaui-covid19Italy Italian Civil Protection Department pcm-dpc
Paraguay Ministry of Public Health and Soc. Welfare covidpy-restSouth Africa National Inst. Communicable Diseases covid19zaSouth Korea Centers for Disease Control and Prevention COVID19-Korea
Spain Ministry of Health datadista-Covid-19United Kingdom Pubic Health England covid-19-uk-data
United States Centers for Disease Control and Prevention JHU, Nytimes
Table 1: Some examples of regional Covid-19 data resources. See more examples of opendata sets in [4].
• Mobility: Data regarding to mobility refers to reports on changes of mobility patterns[234]. For instance, community mobility. On this line, both Google7 and Apple8
present mobility reports by location.
• Online questionnaires: There are several data sources that collected individual dataregarding the social impact of Covid-19 in citizens, such as [165] [185] and [111].
• Social networks: Several social networks like Facebook and Twitter9 [211] allowusers to post their emotion and feelings [111].
• Internet search: Google searches and Baidu Search Index (BSI) are good examples ofsocial indicators. Although not longer available, Google Flue application was createdto measure the trends of Google queries about flu and dengue. The historical data isstill available for analysis10.
3.5 Auxilary data sources
In this subsection, we include datasets relevant for the study and development of models ofCovid-19, such as health-care system, demography, weather and air transport connectivity.These are variables that are under research to evaluate their influence on virus propagation.See [5] for a more detailed enumeration.
• Health-care system: Data related to health care systems should include, amongothers, the number of Intensive Care Unit (ICU) and ventilators. The data about
7https://www.google.com/covid19/mobility/8https://www.apple.com/covid19/mobility9https://ieee-dataport.org/open-access/corona-virus-covid-19-geolocation-based-sentiment-
data10https://www.google.org/flutrends/about/
12

health-care resources is maintained by the national health-care systems of each country,and only partially accessible in some data-sets.
• Demographics: The normalization of the Covid-19 data should be carried out consid-ering demographic data to develop general models and actions11. Population densityis also relevant to explain the rapid spread of the virus in some locations. Besides, agegroups are relevant to infer the mortality of Covid-1912.
• Weather and climate data: The seasonal behavior of Covid-19 is under study anddiscussion [213] [252] [204]. Data sets on weather and climate should include variablesthat affect the spread of the virus. For instance, high temperature and humidity reducethe spread of the virus [169]. There are several institutions that provide weather data[5], such as the European Centre for Medium-Range Weather Forecasts (ECMWF) andthe National Oceanic and Atmospheric Administration (NOAA). Regarding climatechange, some reports indicate that pollution levels also favors the spread of the virus[261][178].
• Air transport connectivity: International air routes explain the propagation ofCovid-19 from Wuhan outbreak to other territories [78] [85]. Datasets on air transportconnectivity should contain information on passengers and routes13.
3.6 Data curation
Data curation is the active management of data over its life cycle to ensure it meets thenecessary data quality requirements for its effective usage [137]. Data curation processescan be categorised into different activities such as content creation, selection, classification,transformation, validation, and preservation [75].
Covid-19 data-driven methods require that data is trustworthy, discoverable, accessible,reusable, and frequently updated. A key trend for the curation of Covid-19 data sets aredifferent open-source communities like Kaggle and GitHub [5].
4 Consolidated Time-Series
The available data collections and resources offer many opportunities in the context ofmonitoring, modelling and decision-making. However, this is intrinsically tied to the trustwe can put in the origins and quality of the underlying data [208].
In this section, We review some of the most relevant theories and methodologies thatcan be used to process raw data from different and heterogeneous sources in order to ob-tain consolidated time-series serving to monitor Covid-19 pandemic. The goals are i) detectand correct inconsistencies in the raw data; ii) take advantage of spatial and time simi-larities in segregated regional data to produce enhanced aggregated time series; iii) detectregional clusters with similar characteristics; iv) statistically characterize the interplay be-tween different variables in order to provided enhanced estimations of the real dynamics ofthe pandemic.
11https://www.kaggle.com/tanuprabhu/population-by-country-202012https://ourworldindata.org/age-structure13https://flirt.eha.io/
13

The methodologies presented in this section have not clear borders distinguishing onefrom each other because they share many tools and approaches. The nomenclature canvary across the different disciplines using these methodologies (data science, epidemiology,control theory, to name just a few).
4.1 Pre-processing data
In the field of epidemiology, it is usual to employ the term “cleaning data” to refer to theprocess in which one identifies the errors in collected data and corrects them, or at leastminimizes their effects on subsequent analysis. As detailed in [225], this process involvesthree steps: screening of the data, detecting possible outliers, and editing data abnormalities.Another standard procedure is the initial normalization of the data, ensuring that each ofthe values is included in the [0, 1] interval. This translates, for example, in dividing bythe total size of the population, the counts of confirmed and death cases. This is relevantwhen comparing the impact of the epidemic in different regions. Besides, another importantprocedure is standardization, in which the original value x of a given variable is replaced bythe quotient (x − µ)/σ, where µ and σ are the empirical mean and standard deviation ofthe variable under consideration. The standardization process can be applied in auxiliaryvariables like temperature and humidity. Normalization and standardization are commonprocedures in clustering methods because they facilitate the comparison between variablesand the computation of dissimilarity indices [223], [237, Chapter 2].
4.2 Data reconciliation
Data reconciliation is a methodology that incorporates prior knowledge on the data toenhance its consistency (see e.g. [7], [154]). The idea is to “reconcile” the data with someinitial assumptions. Suppose, for example, that x ∈ IRn is known to satisfy the constraintsAx = b and Cx � d, where � denotes componentwise inequalities. If we have an estimationxe on x that does not satisfy the constraints, then the reconciled value xr for x is obtainedfrom xr = xe + ∆x, where ∆x is obtained from the solution of the following optimizationproblem
min∆x
‖∆x‖2
s.t. A(xe + ∆x) = b
C(xe + ∆x) � d
where ‖ · ‖ denotes a possibly weighted Euclidean norm. The data reconciliation procedureis written as a projection problem: computing the minimum distance to a convex set. In thepresence of only equality constraints, the reconciliation optimization problem can be solvedby means of the solution of a linear system of equations. From the theory of projectionsoperators [59], [157, Lemma 2.2.8] we have that if xe is not consistent with the assumptionsAx = b and Cx � d, then the reconciled value xr = xe + ∆x is closer to x than the initialvalue xe. More specifically,
‖xr − x‖2 ≤ ‖xe − x‖2 − ‖∆x‖2.
14
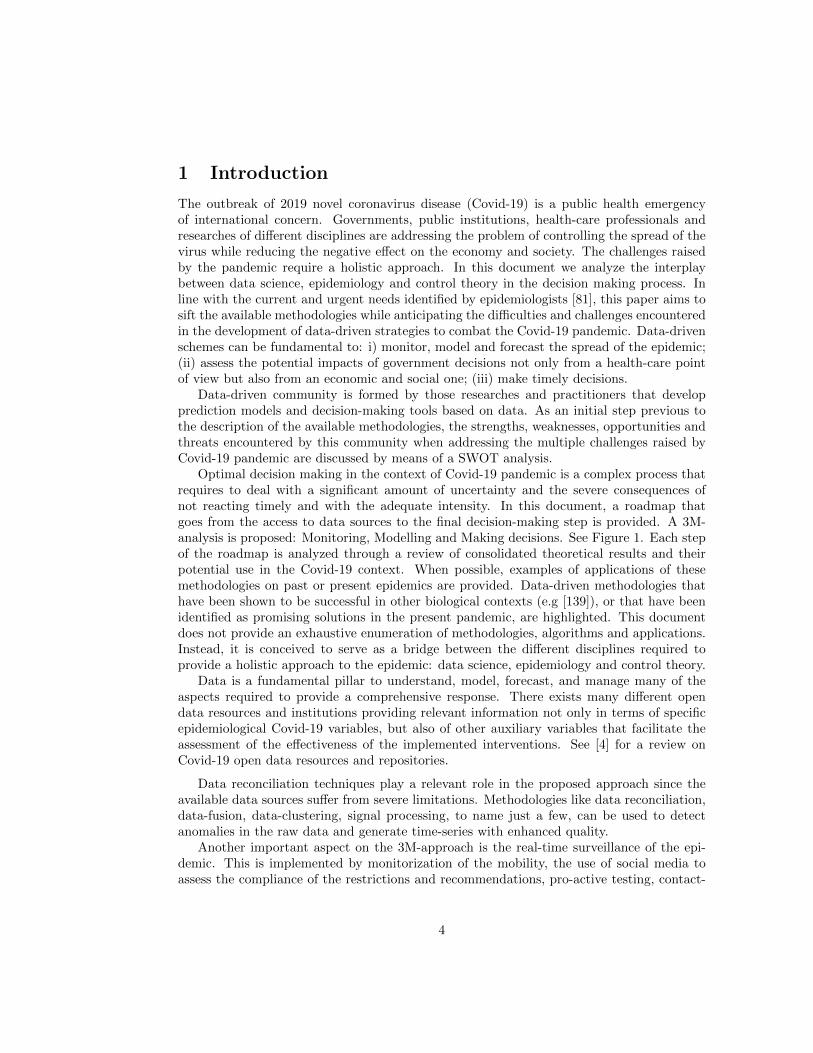
Illustrative example: Suppose that (Ia, Da) and (Ib, Db) represent the accumulatedcounts of confirmed and death cases in regions Ra and Rb respectively. If we assume thatthe probability of dying, once infected, is similar in both regions the quantities Da
Iaand Db
Ibshould be similar (equivalently DaIb should be close to DbIa). If one is confident about theaccuracy on the number of death counts Da and Db, but not too much on the values Ia andIb, one could reconcile them using the assumption that the probability of dying is equal inboth regions. The theory of data reconciliation states that the reconciled values for Ira andIrb are Ira = Ia + ∆Ia and Irb = Ib + ∆Ib where ∆Ia and ∆Ib are obtained from the solutionof the following optimization problem.
min∆Ia,∆Ib
(∆IaNa
)2
+
(∆IbNb
)2
s.t. (Ia + ∆Ia)Db = (Ib + ∆Ib)Da,
where Na and Nb are the sizes of the populations of regions Ra and Rb. We notice that theoptimization problem obtains the minimal norm modification on the fraction of confirmedcases that forces the assumption on equal death risk to be satisfied.
As commented in Section 3, there are many limitations and inaccuracies in the time-series related to Covid-19. On the other hand, there are multiple data sets correspondingto different locations. Identifying valid equality and inequality constraints for the timeseries provides, along with the data reconciliation methodology, a powerful tool to obtainconsolidated time-series. In this way, inaccuracies in the available data are significantlycompensated.
4.3 Data fusion
Data fusion is defined as the theory, techniques and tools that are used to combine data fromdifferent sources into a common representation format [149], [159]. Simultaneous monitoringof signals coming from different sources, or surveying diverse aspects of data, even if it comesfrom a single source, can yield improvement in accuracy over more traditional univariateanalyses [61].
Data fusion is very valuable in the context of Covid-19 because, in many situations, asingle variable, or single time-series has to be obtained from numerous data sources (forexample, the evolution of a single mobility index is inferred from the geo-localization ofa large number of individuals). Specific techniques like temporal alignment [149, Chapter6] can also be used to compare better two time-series corresponding to epidemic data ofdifferent locations.
4.4 Clustering methods
Cluster analysis restructures the data into clusters sharing common statistical character-istics [237], [69]. Seasonality, climate, geography, measurement strategies or implementedmitigating measures are possible reasons for the existence of cluster formation. Being ableto detect such configuration is important prior to further analysis. For example, spatialclustering is used in [40] to better assess the thresholds required to detect the outbreak of
15

an infectious disease. In [78], clustering is used to group countries with similar importationpatterns of Covid-19 cases in African countries.
One is advised to apply a clustering method prior to further analysis because the existenceof clusters may impact the results, as intra-cluster correlation may exist so that the frequentindependence assumptions are violated [237]. Moreover, cluster analysis allows to assessbetter why a specific control strategy is working better in one location than in another.Actions applied in locations belonging to the same cluster have a larger probability of yieldingsimilar outcomes.
Cluster analysis in a spatial setting has already been used in the monitoring and under-standing of SARS epidemic [121], [214]. The number of detected clusters and their spatialdistribution is relevant to the effectiveness of control measures [214].
4.5 Time-series theory
In this subsection, some mature techniques from signal processing [168], time series analysis[62] and stochastic processes [170, 217] are commented. They can be applied to enhance thequality of the raw time-series and these are used, for example, to characterize the raw dailyprevalence data of Covid-19 [20].
• Discrete signal processing: Filtering methods, based on the characterization of thesignals on the frequency domain, are used to smooth signals reducing the effect of highfrequency noisy signals due to measurement errors [170]. Moving averaging filters areused, for example, to smooth the signal corresponding to the daily death counts [4,Subsection 7.1.1].
• State space methods: State space modelling provides a unified methodology fortreating a wide range of problems in time series analysis: filtering, smoothing, andforecasting. In this approach, it is assumed that the development over time of thesystem under study is determined by an unobserved series of variables associated toa series of observations. The relationship between observed and unobserved variablesis done by means of a state space representation [62]. A key ingredient of thesemethodologies is the Kalman Filter, which is employed to obtain an estimation ofthe non-observed variables. A direct application is the smoothing and filtering of thesignal: one can consider the noisy signal as the observed one and the noise-free signalas the unobserved. This leads to the implementation of methods to enhance the qualityof the processed signals [217, Chapter 9].
• Stochastic processes: The theory of stochastic processes [170] allows us to character-ize in a probabilistic way the time series related to the epidemic. This characterizationis the base of statistical signal processing (see [217, Chapter 9]) that is used to estimaterandom variables and implement Kalman filtering approaches.
All these techniques can find a direct application in the context of the consolidation ofthe historical data of an epidemic. Besides, statistic signal processing is one of the pillarsof different inference methods required to fit epidemiological models to data (see Subsection6.6).
16

5 Estimation of the state of the pandemic
The control of Covid-19 pandemic requires monitoring of essential indicators. This includesnot only estimations of the current incidence of the disease in the population, but also the(daily) surveillance of measures such as social-distancing, mobility and others, with directeffects on its spread. Monitoring is key in the decision-making process because it providesfundamental information to decide whether to lift or strengthen measures and restrictions.
A pandemic outbreak, or a recurring wave, needs an immediate response, which requiresup-to-date estimations of the state of the pandemic. This estimation process is hindered bythe incubation period of Covid-19, which introduces a time-delay between the infection andits potential detection. Another issue is the infectious asymptomatic population, which isan important transmission vector difficult to detect [72]. All these shortcomings motivatethe deployment of specific surveillance and estimation methodologies capable of using theavailable information to enable quick adjustment of different control measures.
In this section, we cover the most relevant techniques to monitor the state of the pan-demic, focusing on the approaches that are oriented to i) real-time monitoring of differentaspects of the pandemic (real-time epidemiology), ii) early detection of infected cases andimmune response estimation (pro-active testing); iii) estimation of the current fraction ofinfected population, symptomatic or not (state estimation methods); v) early detection ofnew waves (epidemic wave surveillance).
5.1 Real-time epidemiology
The use of a large number of real-time data streams to infer the status and dynamics of thepublic health of a population presents enormous opportunities as well as significant scientificand technological challenges [24], [255], [60].
Real-time Covid-19 data can be of very different nature and origin (e.g. mobile phonedata, social media data, IoT data and public health systems) [221]. Mobile phone data,when used properly and carefully, represents a critical arsenal of tools for supporting publichealth actions across early, middle, and late-stage phases of the Covid-19 pandemic [167].Voluntary installed Covid-19 apps or web-based tools enable self-report of data related toexposure and infections. The information steaming from these sources provide real-timescalable epidemiological data, which is used to identify populations with highly prevalentsymptoms that may emerge as hot spots for outbreaks [60]. In this context, it is alsoimportant to mention social media, which is relevant to assess the mobility of the populationand its awareness with regard to social distancing, the state of the economy and many otherkey indicators [259], [46].
The magnitude and scale of population mobility are essential information for spatialtransmission prediction, risk area division, and control measure decision-making for infec-tious diseases. Nowadays, the most effective tool to access this sort of real-time informationis through Big Data technologies and Geographic Information Systems (GIS). These sys-tems have played a relevant role when addressing past epidemics like SARS and MERS [173],providing efficient aggregation of multi-source big data, rapid visualization of epidemic infor-mation, spatial tracking of confirmed cases, surveillance of regional transmission and spatialsegmentation of the epidemic risk [259], [231].
17

5.2 Proactive testing
Proactive testing is key in the control of infectious diseases because it provides a way toidentify and isolate the infected population. Besides, it is also a relevant source of infor-mation to identify risk areas, percentage of asymptomatic carriers and attained levels ofimmunology response in the population [238].
There are different methodologies to approach proactive testing:
• Risk based approach: The individuals with the highest probability of being carriersof the disease are tested. This implies testing not only the individuals with symptomsbut also the ones that are more exposed. For example, health-care workers are at highrisk and can also be relevant vectors (this is also the case in other professional sectors).In a second level, we have the individuals that thanks to personal contact-tracing havebeen identified to be more exposed to a specific confirmed case. In a third level, wefind the individuals that have travelled, of often go, to hot spots of the pandemic[231]. The determination of risk zones can be done by means of government mobilitysurveillance or by personal software environments [60].
• Voucher-based system: People who test positive are given an anonymous voucherwhich they can share with a limited number of people whom they think they might beinfected. The recipients can use this voucher to book a Covid-19 test and can receivetheir test results without ever revealing their identity. People receiving positive resultare given vouchers to further backtrack the path of infection [197]. See also [153].
• Serology studies: One of the main limitations of RT-PCR tests is its inability todetect past infection. Serological testing carried out within the correct time frame af-ter disease onset can detect both active and past infections. Furthermore, serologicalanalysis can be useful to define clusters of cases, retrospectively delineate transmis-sion chains and ascertain how long transmission has been ongoing or to estimate theproportion of asymptomatic individuals in the population [238].
5.3 State space estimation methods
Dynamic state-space epidemiological models are fundamental to characterize how the virusspreads in a specific region and to estimate not directly measurable time-varying epidemi-ological variables [36]. Classical state space estimation methods like Kalman filter [155],[191] are employed to estimate the fraction of current infected population. The objective ofKalman filter is to update knowledge about the state of the system each time a new obser-vation is available [62]. Different modifications and generalizations of Kalman filter are alsoable to address the specifics of an epidemic model. These methodologies are essential bothto the estimation problem and to the inference of the parameters that describe the model(see [209] and [1]).
5.4 Epidemic wave surveillance
Based on current evidence, the most plausible scenario may involve recurring epidemic wavesinterspersed with periods of low-level transmission [239]. In this context, it is crucial to
18

implement a surveillance system able to detect or anticipate, possible recurring epidemicwaves. These systems enable an immediate response that reduces the potential burden ofthe outbreak.
Outbreak detection relies on methodologies able to process a large amount of data steam-ing from the different surveillance systems [56], [11]. With this information, mechanisms todetermine if the spread of the virus has surpassed a threshold requiring mitigation mea-sures can be implemented, see, e.g. [124]. There is a large body of literature on this epi-demiological detection problem since many infectious diseases undergo considerable seasonalfluctuations with peaks seriously impacting the health-care systems [216], [224]. Nationalsurveillance systems are implemented worldwide to detect influenza-like illnesses outbreaksrapidly, and assess the effectiveness of influenza vaccines [228], [37]. Specific methodologiesto determine the baseline influenza activity and epidemic thresholds have been proposedand implemented [227]. The focus of these methods is to reduce false alerts and detectionlags. Outbreak detection can be implemented in different ways that range from simple pre-dictors based on moving average filters [71] and fusion methods [61] to complex spatial andtemporal clustering [40].
The detection of Covid-19 recurring epidemic waves poses new challenges for severalreasons: i) lack of historical seasonal data, ii) difficulties in determining the current fractionof infected population, and iii) computation of baselines and thresholds demands a precisecharacterization of the regional (time-varying) reproduction number.
6 Epidemiological models
Epidemiology is a well established field [145] that models the spread of infectious diseases.Given the high complexity of these phenomena, models are key to synthesize information tounderstand epidemiological patterns and support decision making processes [92].
6.1 Time-response and viral shedding of Covid-19
The available epidemiological and clinical studies of the virus allow to model it from a timeevolution point of view [129], [233], [94]. How the disease and its potential infectious evolveswith time is characterized by means of the following key epidemiological parameters (seee.g. [90] and [94]):
• Latent time: time during which an individual is infected but not yet infectious.Initial estimates are of 3-4 days [129].
• Incubation time: the time between infection and onset of symptoms. The medianincubation period is estimated to be 5.1 days, and 97.5% of those who develop symp-toms will do so within 11.5 days of infection [123]. The median time between the onsetof symptoms to death is close to 3 weeks [260].
• Serial interval: time step between symptom onsets of successive cases in a trans-mission chain. Initial estimates of the median serial interval yield a value of around4 days, which is shorter than its median incubation period [161]. This implies that asubstantial proportion of secondary transmission may occur prior to illness onset.
19

• Infectiousness profile: characterizes the infectiousness of an infected individualalong time. In [260], the median duration of viral shedding estimation was 20 days insurvivors while the most prolonged observed duration of viral shedding in survivorswas 37 days.
• Basic reproduction number R0: represents the average number of new infectionsgenerated by an infectious person at the early stages of the outbreak, when everyoneis susceptible, and no countermeasures have been taken [136], [171]. First estimationsrange from 2.24 to 3.58 [257]. The effect of temperature and humidity in this parameteris addressed in different studies. See, for example [147] and Subsection 6.2.4.
The basic reproduction number, along with the serial interval, can be used to estimatethe number of infections that are caused by a single case in a given time period. Withoutany control measure, at the early stages of the outbreak, more than 400 people can beinfected by one single Covid-19 case in one month [160]. Estimates of the basic reproductivenumber are of interest during an outbreak because they provide information about the levelof intervention required to interrupt transmission and about the potential final size of theoutbreak [171].
We notice that the aforementioned parameters are often inferred from epidemiologicalmodels, once they have been fitted to the available data on the number of confirmed casesand dying patients.
6.2 Compartmental models
The idea underneath a compartmental model is dividing a population into different groupsor compartments. Each compartment tracks the number of individuals in the same state ofthe epidemic.
6.2.1 Basic compartmental models
The simplest compartmental approach is the so-called SIR model, introduced by Kermackand McKendrick at the beginning of the 20th century. The model has only three com-partments: Susceptible (S), representing healthy individuals susceptible of getting infected,Infected (R), and Recovered (R). This last compartment can also take into account de-ceased individuals. Nevertheless, for low mortality rate diseases, including only recoveredindividuals, is a good approximation.
The dynamics of an epidemic using a SIR model can be written as follows:
dS(t)
dt= −βS(t)
I(t)
N, (1)
dI(t)
dt= +βS(t)
I(t)
N− µI(t), (2)
dR(t)
dt= µI(t), (3)
where N represents the total population size, β is the rate of infection, and µ is therecovery rate. At the beginning of an epidemic S equals approximately the entire population,
20

and thus from (2) it holds that I(t) = I0e(β−µ)t = I0e
µ(R0−1)t, where I0 represents the initialnumber of infected I0 = I(0) and R0 = β/µ is the basic reproduction number mentioned inthe previous section. This number can be understood as the average number of secondarycases produced by an infectious individual. Clearly, when R0 is greater than 1, there is anexponential increase in the number of infected individuals on the early days of the epidemic.The same equation can also be used to estimate the point at which the rate of newly infectedindividuals begins to fall S(t) < N/R0. At this point, the given population has reached whatis known as herd immunity.
To account for the incubation time, an enhanced version of SIR model, the SEIR model,includes an extra compartment: Exposed (E). Exposed individuals are not able to trans-mit the disease yet, but are transferred to the Infectious compartment with a fixed rate,modelling the incubation period.
SEIR models have been recently used to analyze Covid-19 pandemic. For example, in[70] and [117], the spread dynamics and different control measures are modelled with a SEIRmodel. The parameters of the model are adjusted by simulation and data fitting. A SEIRmodel is also used in [242] fitted with data from Wuhan. This model is improved in [241]to estimate clinical severity.
6.2.2 Extended compartmental models
Further extended versions of compartmental models include extra compartments and transi-tions between them, as for instance, symptomatic and asymptomatic individuals (see Figure3), the possibility of re-infection after recovery, or individuals in quarantine [52].
Figure 3: Illustration of an extended compartment epidemic model with six compartments:Susceptible (S), Expose (E), Asymptomatic Infected (Ia), Symptomatic Infected (Is), Re-covered (R), and Dead (D). The β value is the transmission rate, ε is the expose rate andµ is the recovery rate (including deaths). The parameter rβ determines the contributionof asymptomatic infected individuals to the transmission rate. The term pa represents theprobability that an infected individual becomes an asymptomatic one. The term pd reflectsthe probability of death of an symptomatic infected individual
21

Many applications of these extended models can be found in the literature. For example,in [194], the authors used a dynamical compartmental model to analyze the effective trans-mission rate of SARS epidemic in Hong Kong. The model consisted of 7 compartments:susceptible, latent, infectious, hospitalized, recovered, and dead individuals. Moreover, in[44], a stochastic SEIR model is used to estimate the basic reproduction number of MERS-CoV in the Arabian Peninsula. The compartments distinguish between cases transmitted byanimals and secondary cases, and the estimation of the model parameters employs a delayedrejection adaptive Metropolis-Hastings algorithm in a Markov-Chain Montecarlo framework.
In the case of Covid-19 pandemic, asymptomatic infected people play an important rolein the spread of the Covid-19 (see [80] and [72]). In [80], a SIDARTHE model is proposed.The total population is partitioned into: S, Susceptible; I, Infected (asymptomatic infected,undetected); D, Diagnosed (asymptomatic infected, detected); A, Ailing (symptomatic in-fected, undetected); R, Recognised (symptomatic infected, detected); T, Threatened (in-fected with life-threatening symptoms, detected); H, Healed (recovered); E, Extinct (dead).The interactions among these eight stages are modelled by a set of parameters. In [72], theepidemic model considers a transmission rate β that takes into account the contributionsof asymptomatic transmission, presymptomatic (asymptomatic) transmission, symptomatictransmission, and environmental transmission compartments. The results indicate that thecontribution of asymptomatic infected to R0 is higher than symptomatic infected and otherways of transmission. The main reason is that symptomatic infected are often rapidly de-tected and isolated.
6.2.3 Age-structured models
Age-structured epidemic models make it possible to relax random mixing hypothesis incor-porating heterogeneous, age-dependent contact rates between individuals [57]. In [245] and[202], stability results for different age-structured SEIR models are given. For Covid-19, anage-structure model, aiming at estimating the effect of social distancing measures in Wuhan,is presented in [180]. In [206], a stratified approach is used to model the epidemic in France.
6.2.4 Modelling the seasonal behaviour of Covid-19
Some works have studied the influence on temperature and humidity in the spread of Covid-19 (e.g. [147] and [204]). It has been reported that both variables have an effect on thebasic reproduction number R0 [232]. As an example, the results in [232] indicate that anincrement of one-degree Celsius in temperature and one per cent in relative humidity lowerR0 by 0.0225 and 0.0158. This influence should be included in the epidemic models tocapture the seasonal behaviour of Covid-19. For instance, by considering the parametersβ and µ functions of both temperature [230] and relative humidity. Yet it remains unclearwhether seasonal and geographic variations in climate can substantially alter the pandemictrajectory, given high susceptibility is a core driver [15].
6.3 Spatial epidemilogy
One of the flaws of compartmental models is that they were developed to describe theevolution of epidemics in a single population where each individual is assumed to interact
22

with every other at a common rate (homogeneous contact). This can be a reasonableapproximation within a given population, but it is not appropriate to study the globalspread of a pandemic.
In the last decade, compartmental models have been extended successfully to spatialepidemiology models in order to analyze spreading phenomena in a more accurate way.
• Metapopulation models: Metapopulation models integrate two types of dynam-ics: the one related to the disease, typically driven by a compartmental model, andthe mobility of individuals (agent-based model) across the subpopulations that buildthe metapopulation under analysis. As a representative example, in [31] the authorsintroduce the notion of effective distance to capture the spatio-temporal dynamicsof epidemics, combining the SIR model of n = 1, 2, . . . , p populations with mobilityamong them. The resulting model for each population is
dSn(t)
dt= −βSn(t)
I(t)
Nn+∑m 6=n
(wnmSm − wmnSn), (4)
dIn(t)
dt= +βSn(t)
In(t)
Nn− µIn(t) +
∑m6=n
(wnmIm − wmnIn), (5)
dRn(t)
dt= µIn(t) +
∑m 6=n
(wnmRm −RmnIn). (6)
In this model, wnm is the per capita traffic flux from population n to population m,given by wnm = Fnm/Nm, where Fnm is the total flux and Nm is the size of thepopulation m. In [8], the authors used a SEIR compartmental model together withstochastic data-driven simulations to capture the mobility in all Spanish provinces.The work focuses on evaluating the effectiveness of contention measurements in Spainon February 28th, when a few dozen cases of Covid-19 had been detected. By capturingboth temporal and spatial evolution of epidemics, metapopulation models are alsocapable of forecasting the effectiveness of mobility restrictions.
• Social networks models: Another approach to address the same problem is based onsocial networks models [64]. These models consider that transmission can only occuralong linked or connected individuals, which makes it possible to model heterogeneityin contact patterns in an explicit manner. Small-world networks have been used incombination with compartmental models to model disease transmission of SARSs [214]and Covid-19 [30], and also to assess the efficacy of measurements as contact tracing[109]. In general, network models produce a more accurate prediction of the diseasespread. In particular, the use of homogeneous compartmental models in populationwith heterogeneous contacts tends to underestimate disease burden early in the out-break and overestimate it towards the end, although for certain kind of networks itis possible to modify compartmental models to fix this problem [17]. Another inter-esting aspect of studying epidemic spread with network models is the observation ofthe percolation phase transition. That is, a change on the connection among nodesthat abruptly modifies the global connectivity of a graph. Percolation theory has been
23

widely studied in random networks [6]. In the context of epidemic modelling, thetransition phase occurs where isolated clusters of infected people join to form a giantcomponent that is able to infect many people [87].
6.4 Computer-based models
Computer-based simulation methods to predict the spread of epidemics can take into accountnumerous factors, such as heterogeneous behavioural patterns, mobility patterns, both atlong and short scales, demographics, epidemiological data, or disease-specific mechanisms[93].
As a representative example, the Global Epidemic and Mobility simulation framework(GLEAM) allows performing stochastic simulations of a global epidemic with differentglobal-local mobility patterns, as well as data regarding demographics or hospitalization[226].
However, detailed simulation-based methods depend on a significant number of parame-ters, which need to be chosen a fixed for a specific simulation. This is especially difficult inthe early days of an epidemic outbreak. Furthermore, these approaches do not reveal whichfactors are actually relevant in the spread of epidemics.
Simpler data-driven tools have also been developed to overcome these difficulties. Forexample, in [97], a model-free tool based on daily newly confirmed and recovery cases isdeveloped. As no model is used to calculate how asymptomatic infected infect others, themethod does not need information about infection rate, asymptomatic infected or susceptibleindividuals. The disadvantage is that the method cannot be used when the epidemic hasstarted, and the data is incomplete.
6.5 Modelling the effect of containment measures
Controlling an emerging communicable disease requires both the prompt implementation ofmeasures and the rapid assessment of their efficacy [35]. In what follows, we enumerate themost relevant non-pharmaceutical interventions, focusing on different research works thatassess their efficacy.
• Mobility restrictions: Governments often introduce long-range or local mobility re-strictions aimed at reducing disease transmission. Spatial epidemiology is particularlyuseful to model the effects of such measures. For instance, in [30], the authors pro-pose a social network approach to assess the post-lockdown mobility measurements forCovid-19. A SEIR model is combined with a small-world network, concluding that theblockage of long-distance mobility can contain the second peak of infected individualseffectively.
• Social distancing: Social distancing is another measure promoted by governments,public and private institutions in an attempt to reduce disease transmission. Reducingor stopping the activity in educational institutions or factories are examples of this.In [142], the authors conduct a simulation-based analysis to determine the effects ofsocial distancing both in public health and in the economy. Two social network models(regular and small-world networks) are combined with a compartmental SIR model,and the economic impact takes into account the costs of individuals falling ill and
24

the cost of a reduction in social contacts. The obtained results suggest that socialdistancing is effective only when adopted in a highly strict manner, giving a worseoutcome than doing nothing when implemented in a weak fashion (do it well or not atall).
• Pro-active testing: Proactive testing of asymptomatic individuals is very relevantfor the monitoring and control of the pandemic [240]. It allows to isolate infectedindividuals and implement contact tracing strategies which have been shown to becrucial in the effective control of the pandemic [80].
• Quarantine: Quarantine of a whole population is the most extreme measure in thescope of social distancing/mobility restrictions. The extreme impact of Covid-19 yieldto the quarantine of the epicentre of the pandemic (Wuhan) on January 24th, 2020,and the same measures were subsequently adopted in different countries of Europe andAmerica. In [53], a SIR model is augmented to consider the time-varying strength ofquarantine Q(t). Using data from Wuhan, the authors conclude that SIR and SEIRmodels (with time-constant parameters) are not able to capture the stagnation ofthe epidemic caused by the imposed quarantine and need time-varying terms as Q(t)to take into account isolation measurements. Then, Q(t) estimated by means of adeep neural network trained with Wuhan data, which suggests that about 70% of theinfected population was effectively isolated at the peak of the quarantine measures.
• Contact tracing: Contact tracing is a widely used epidemic control measure thataims to identify and isolate infected individuals as soon as possible, by following thecontacts of individuals that are known to be infectious. A review of contact-tracingbased epidemic models for SARS and MERS epidemics can be found in [118]. In [109],a small-world, free-scale network model is combined with a compartmental model toassess the efficacy of contact tracing.
• Use of masks: Recommendations and common practices regarding face mask useby the general public have varied greatly and rapidly over the course of Covid-19pandemic. Messages differ from country to country, and at the same time, somegovernments or public health bodies were pleading to the population to stop buyingmasks, other countries were distributing them to the general public [126]. In order toassess the impact of mask use by the general public, a modified compartmental SEIRmodel is employed in [63], taking into account asymptomatic individuals, stratifyingthe total population into those who habitually do and do not wear face masks in public,and introducing parameters to model mask effectiveness. The model is fitted with dataof Washington and New York states around March 2020. Their results suggest thatbroad adoption of even relative low-quality masks may meaningfully reduce communitytransmission and decrease peak hospitalizations and deaths.
6.6 Fitting epidemic models to data
Epidemiology dynamical models rely on a set of parameters that have to be tuned in order toprovide functional prediction models and/or infer from them essential characteristics, suchas the (time-varying) effective reproductive factor [51], the latent period, etc. [80]. Fitting
25

epidemic models to data is a fundamental problem in epidemiology that can be approachedin different ways. A first classification is to distinguish between classical methods, in whichthe parameters of the model are unknown but fixed, and Bayesian methods, in which they areassumed to be random variables [119]. Another classification follows from the accessibilityto the populations considered in the compartments of the model:
• Full access to the evolution of the number of cases in each compartment: In mostmodels, the parameters that determine the dynamics enter in a linear way (multiplyinglinear or bi-linear terms that depend on the current number of cases in each compart-ment). This means that a (vector) equality constraint, that depends linearly on theparameters to fit, can be obtained at each sample time. Thus, standard linear identi-fication schemes, like least-square methods, can be applied to estimate the parametersthat best fit the model to the data. See, for example, [145, Chapter 6] and [10].
• Partial access to the number of cases in each compartment: In many situations, thereare no available time series for one or more of the groups considered in the model.This complicates the data-fitting process considerably because it is no longer possibleto obtain, in a simple way, the equality constraints described in the full access case.The standard approach in this case is to resort to non-linear identification techniques(see [209] and [1]). In this context, Monte Carlo based methods (e.g. Markov ChainMonte Carlo and Sequential Monte Carlo algorithms) play a crucial role in addressingthe challenges that lie in reconciling predictions and observations [146].
6.6.1 Sensitivity analysis
Sensitivity analysis (SA) is the study of how the uncertainty in the output of a model(numerical or otherwise) can be apportioned to different sources of uncertainty in the modelinput [207]. See the review paper [183] on the use of this technique in the context of biologicalsciences. A monovariate and multivariate sensitivity analysis for a data-fitted SARS modelis given in [12]. The use of SA is common in many research papers on modelling Covid-19(see e.g. [70] and [206]).
6.6.2 Validation and model selection
The ultimate test of the validity of any model is that its behaviour is in accord with realdata. Because of the simplifications introduced in any mathematical model of a biologicalsystem, we must expect some divergence between the results of a model and reality evenfor the most carefully collected data and well-constructed model. Different questions arise:i) How can we determine if a model describes data well? ii) How can we determine theparameter values in a model that are appropriate for describing real data? These questionsare much too broad to have a single answer [10], [229].
Epidemic models depend on their data calibration. However, many possible models arepotentially suited to analyze the spread of the pandemic in a given moment. The models areinherently linked to the goal for which they were envisaged. For a given goal (for examplesecond outbreak detection), different models can be considered. Model selection techniquesare used on a regular basis in epidemiology [176]. They address the problem of choosingamong a set of candidate models the most suitable one [32]. The selection is based on
26
different aspects: i) How the calibrated model is able to reconcile and match observationsand ii) The complexity of the model. Under similar adjustment to observations, simplermodels are preferred since they are more robust and sound from an information theorypoint of view [98].
There are often different sets of parameters yielding a similar fit to data, but providingsignificantly different estimations of the main characteristics of the spread of the epidemic(like peak size, reproduction number, etc.). This issue is known as nonidentifiability [196].Identifiability issues may lead to inferences that are driven more by prior assumptions thanby the data themselves [135]. There are some approaches to address this difficulty. Thefirst one is to resort to simplified models (SIR and SEIR models, for example) in which thenumber of parameters to adjust is small [196] and [177]. The second one is to use datafrom different regions in a not aggregated way, which reduces the probability of parametricover-fitting. In this context, model selection theory provides systematic methodologies todetermine which model structure best suit the purposes of the model, [32], [176].
7 Forecasting
Forecasting is a supervised learning approach in which a number of variables or predictors(also called features in machine learning literature) are used to predict the value or a categoryof a variable of interest (target variable). Supervised learning is normally classified into twomain categories: i) classification, and ii) regression or forecasting. Classification methodscan be employed for diagnosis and detection of Covid-19 cases (see [189] for a review). Forinstance, to detect Covid-19 cases through X-ray images [107], [138], [164]. In this document,we focus on regression methods and their use to forecast epidemiological variables. Theforecasting approaches presented in this section are not necessarily linked to the (prior)design and adjustment of an epidemic model.
The applications of forecasting models related to Covid-19 pandemic are numerous [141][175], ranging from predicting the number of infected cases and deaths, to estimating theparameters of epidemic models such as the rate of infection β of a population and the basicreproduction number R0. However, some considerations should be taken into account inorder to select a suitable model.
First, from the statistical point of view:
• The use of frequentist or classical versus Bayesian empirical statistical methods. In theformer, probabilities are assigned according to experiment repetition and occurrence.In the latter, a probability is assigned based on a quantitative understanding of thenature of the experiment [26], that is Bayes theorem and probability distributions(priors).
• Parametric versus non-parametric approaches. In the former, there is a fixed mappingfunction between the input and the output of the model with several parameters tobe obtained. In the latter, there is no such fixed mapping function, or it is unknown.
Second, from the temporal point of view:
• Temporal series methods rely on the previous values of the target and the temporalcharacteristics of the data, such as trend and seasonality, to make predictions. Thus,
27

they are based on autoregression techniques and temporal differences. In contrast,regression models use previous values of the predictors to predict the future value ofthe target. Furthermore, mixed techniques can be used.
Other considerations are:
• The model should be trained with reliable data. If the input data is poor, the forecastsproduced will also be poor. Therefore, reliable data should be collected. On this line,techniques such as data reconciliation, standardization, filtering, outlier detection, etc.,can improve the raw data collected (see Section 4).
• The amount of data for training can vary from one forecast model to another. Forinstance, deep learning approaches require much more data compared with classicalmachine learning approaches.
• Learning procedures should include training, validation, and test phases executed sep-arately. Therefore, the data set should be divided into three parts, each one used for adifferent purpose. In the training stage, model parameters are tuned according to thecorresponding training data. The validation step is typically used to adjust the modelhyper-parameters and to perform comparisons with other counterparts. Finally, thetest of the selected model should be carried out with unseen data for reporting theperformance of the model. Due to the scarcity of data related to Covid-19, in somecases, the learning procedure can be reduced to training and test.
• Scalability of selected model with input data. Some models do not scale well withthe input data, for instance, kernel-based methods, since the computational burden oftheir implementation does not grow linearly with the number of observations.
• Interpretability of the internal functioning of the models should be considered since it iscomplicated in some of them. This is the case for instance, in deep learning approachesand complex ensemble methods. It can be questionable to develop decision making forCovid-19 based on models with low interpretability (black box modeling)[14]. Otherprediction models, like the ones implemented by means of an epidemic model (seeSection 6) are more interpretable because their parameters are directly related tomeaningful characteristics of the virus or the considered population.
In the following sections we first list the potential variables that can be used to feedthe models. Second, we review the main forecasting tools available to predict future spreadof Covid-19 pandemic. We have classified the methods into different categories, such asparametric, non parametric, temporal series methods, and deep learning approaches. Finally,we review different assessing methodologies for validating the models.
7.1 Identifying relevant variables
Previous works on epidemic modelling, before the Covid-19 outbreak, already pointed outkey features or variables to be considered in successful data-driven forecasting methods,such as demographic variation, mobility patterns that include the entire global air-trafficsystem as well as the short-scale, daily commuter movements in almost every country on the
28

planet, detailed epidemiological data, and disease-specific mechanisms. However, today, theavailability of big data and IoT technologies makes the list of potential variables to considermuch larger. Next, we provide some categories and examples of variables that have beenused in the current literature [4].
• Variables directly associated to the Covid-19 outbreak: Regional time series of thenumber of confirmed cases, suspicious cases, deaths, recovered, number of tests, hos-pitalized cases, ICU cases, isolated positive cases, etc.
• Geographic variables: Locations of Covid-19 variables such as GPS coordinates: lon-gitude and latitude.
• Demographic variables: Population and density of population.
• Health system variables: Total number of ICU beds, number of doctors and nurses,personal protective equipment (PPE), respirators, number and types of tests.
• Government measures: Social distancing, movement restrictions, lockdowns, etc.
• Weather variables: Temperature and relative humidity, among others.
• Contamination variables: Air pollution indicators, for example, fine particulate matterPM2.5 and NOx concentrations.
• Mobility data: International and national mobility patterns. Traffic patterns.
• International and national connectivity: Number of international and national flights,number of train connections, etc.
• Economic impact variables: Stock market, crude oil, agricultural futures, gold price.
Furthermore, there are several techniques for identifying relevant variables, also called fea-ture selection in machine learning literature, such as statistical tests (F-test or ANOVA),recursive feature elimination, forward selection, and principal component analysis, amongothers. In addition, correlation coefficients can be also used to identify potential variablesto be considered [78] [85].
7.2 Parametric methods
These are learning models that condense relations between variables in a set of parametersof fixed cardinality [200], independent of the number of training examples. The assumptionsabout the relationship between input and output variables are fixed. For instance, thisrelation can be linear or exponential. The training of this type of models results on a setof weights (parameters) that determine how each of the inputs affects the model output(s).These weights are obtained through an optimization process that aims at reducing the errorbetween the forecast (model estimations) and the outputs available in the training data.It is important to highlight that, as predicted by epidemiological models (see Section 6),at the initial stages of the Covid-19 outbreak the number of cases and deaths showed anexponential relationship with time. This fact is used to obtain simple forecasting models atthe early stages of the pandemic.
29

In what follows, we review representative cases for parametric techniques used for fightingCovid-19 pandemic:
• Linear Regression: In a linear regression model the estimation of the target outputis calculated through a weighted linear combination of the inputs. This is one of thesimplest methods for forecasting. The main limitations of linear regression are i) theassumption of linearity between the dependent variable and the independent variables,ii) it is highly sensitive to outliers, and iii) It can be prone to overfitting if there aretoo many parameters to adjust and not enough data. In the context of Covid-19,linear regression can be used to determine the significance of some variables (weather,demographic, connectivity, etc.) on Covid-19 spread. For instance, the influence oftemperature and humidity in the basic reproduction number R in China has beenstudied in [232].
• Ridge Regression: Ridge regression or Tikhomonov regularization is a regularizedversion of the linear regression aimed at reducing the weights of the model [95]. Thebasic idea is to include a quadratic regularization term to avoid over-fitting. In Ridgeregression, an L2 norm-based penalty term is added to the cost function to regular-ize the model. In [184], the authors use Ridge regression to predict the number ofsuspected cases in China using social media information. They use the Baidu SearchIndex (BSI) to account for social media search indexes (SMSI) such as dry cough,fever, chest distress, coronavirus, and pneumonia. The model uses these variables topredict the number of cases. Moreover, the authors compare the results with otherregression models, such as LASSO regression and elastic net.
• LASSO Regression: Least Absolute Shrinkage and Selection Operator Regression(LASSO) is also a regularized version of linear regression [220]. In this case, the normL1 is used to penalize the weights of the linear model. The idea is that the weights ofthe variables that are not important to predict the output often attain a zero value.Regarding its use in Covid-19 pandemic, in [2], the authors use LASSO regression topredict the cumulative cases, new infections, and mortality rates. The model cap-tures a combination of epidemiological, socio-economic and health system readinessrelated covariates. The results provide predictions for the five sub-regions of Africa(Central, Eastern, Northern, Southern, and Western). The predictions suggest thatsome variables play an especially important role the spread of the pandemic, such asi) urbanization level and socio-demographic index (SDI), ii) international connectivityiii) living standards and health systems, and iv) population density.
• Generalized Linear Methods (GLM): One of the main assumptions of linearmodels is that the error in the prediction follows a normal distribution. However, thisassumption does not hold in many scenarios, for instance, in the case of binomial orPoisson responses [152][256]. The GML methods use link functions to generalize theresponse of regression models. As application cases on Covid-19, in [116], the authorsuse GLM to predict the growth rate of Covid-19 in China as a function of mobility. Asimilar approach can be found in [243], where the authors use Generalized Richardsmodel (GRM) [193] to predict the number of cases in 29 provinces of China. Anotherexample of GLM can be found in [198]. In [201], the authors use a generalized linear
30

mixed model (GLMM) with a variable response from the Gaussian family to predictthe number of accumulated cases in Spain. Moreover, in [213], a Generalized AdditiveModel (GAM) is employed to estimate the effect of temperature and the spread ofCovid-19 in China. In [252], the study is extended for 166 countries. A Poisson modelis used in [256] to detect turning points in the epidemics of some western countriessuch as Canada, France, Germany, Italy, UK and USA.
• Gaussian error function: The Gaussian error function or erf is a sigmoid functionused in probability, statistics and partial differential equations to describe diffusionphenomena. This function can be used for predicting the exponential behaviour ofsome Covid-19 variables, such as the number of new cases and/or new deaths. However,one important limitation of this approach is the fact that it is based on curve fittingof some parameters and, therefore, the quality of the forecasting depends on both thedata and the fitting method. This is particularly critical at the early stages of theoutbreak because of time-varying criteria for confirmed-cases. In [91], the authors usea Gaussian error function to predict the rate of deaths. They used curve fitting anddata from Wuhan. The model is used along with a microsimulation model to predicthealth system utilization in USA in the following four months. A similar approach forforecasting the number of positive cases in Italy can be found in [47].
In the context of parametric methods, it is important to make reference to Bayesianinference, which makes it possible to incorporate prior information at the early stages of anepidemic [55], updating the predicted outputs with posterior probabilities as more data isprovided. In addition, Bayesian methods are more suitable for quantifying uncertainties thanclassical frequentist methods [55]. There exist a large number of Bayesian tools [77], such aslinear regression, hierarchical models, generalized models, Gaussian processes, and Dirichletprocess, among others. As an application case in Covid-19 pandemic, in [74] the authorsuse a semi-mechanistic Bayesian hierarchical model to estimate the impact of governmentmeasures on Covid-19 spread in 11 European countries. By using the model, they assessthe mitigation actions taken by 11 European countries. Because of the scarcity of data,the model is significantly affected by countries with more cases, such as Italy and Spain.Furthermore, Bayesian inference has been widely used to incorporate prior knowledge anduncertainty in the parameters of epidemic models [72] [206] [55]. As limitations of Bayesianmethods, the selection of priors can be difficult in some scenarios since it depends on previousexperience on the field.
7.3 Non-parametric approaches
In non-parametric techniques, there is not any predefined mapping function between theinput variables and the target output. In other words, no assumption is made about therelation between the features and the forecast output(s). In this section, we review the mostsignificant non-parametric methods that can be used for forecasting in Covid-19 relatedproblems. Additionally, some related works are briefly described.
• Kernel methods: These techniques are based on the “kernel trick”, that is, us-ing mapping functions to transform inputs in a new dimensional space, normally ofa much higher dimension. Nonlinear forecasting problems can be transformed into
31
high dimensional ones by using appropriated kernels. Similarity functions are usuallysuitable kernels like the well-known Gaussian Radial Basis Function (RBF). SupportVector Machines (SVM) are by far the most representative techniques of kernel meth-ods [41]. SVM are widely used for both classification and regression tasks. The mainlimitation of kernel-based methods is that they do not scale well with large data setssince the quadratic problems involved in their numerical implementation grow withthe number of data points [172].
• Symbolic regression: In symbolic regression, the objective is to achieve the optimalrelationships/operations, in the form of a relational tree, between the input variablesin order to reduce the prediction errors [54]. Since no assumption is made between thepredictors and the target, a set of possible operators, constants, and analytic functionsare predefined. Thus, the optimal operations among the variables and their orderare normally obtained through an evolutionary computation approach [115]. Withrespect to machine learning approaches, in symbolic regression, both model structuresand model parameters are optimized. As a result, a tree of operations among thepredictors is obtained. As an example of application, in [205] a genetic programmingapproach is used to predict the the number of cases and deaths due to Covid-19 inIndia. The main limitations are: i) prone to overfitting and ii) poor interpretability.Both issues can be alleviated by limiting the depth of the resulting trees.
7.4 Deep Learning
Deep Learning techniques represent an evolution of Artificial Neural Networks (ANNs),where the number of layers is increased notably [83]. A standard deep neural network (DNN)is, technically speaking, parametric if it has a fixed number of parameters. However, mostDNNs have so many parameters that they could be interpreted as non-parametric. Deeplearning neural networks are sequentially improved using successive slots of training data.Thus, these networks require much more data than classical machine learning techniques.One of the main features of deep learning consists in the determination of an encoding vectorfrom the raw input, features or variables. Therefore, they do not need feature engineeringof the predictors. Each layer contributes to the encoding vector: the first ones obtain basicfeatures of the data, while deepest layers use the previous results to develop more complexand higher-level features. Several well-known architectures of deep learning networks canbe found depending on the structure and type of data that is used as input, such as Fully-Connected Networks (FCN), Recurrent Neural Networks (RNN) and Convolutional NeuralNetwork (CNN).
• Fully Connected Networks: In FCNs, each neuron of a given layer is connected toall the neurons of the previous layer. In [195], the authors use a feed-forward neuralnetwork improved with an interior search algorithm to predict the number of casesof Covid-19. Similarly, in [222] the authors use a three-layer network to predict thenumber of cases in Mexico. In [16], a FCNs is used with a SIR model to predict thepeak of Covid-19 in Spain.
• Recurrent Neural Networks: RNNs are the main tool for studying data in theform of temporal series in the deep learning community. In RNNs, the neurons of a
32

given layer are fed with both the previous layer outputs and previous values of thefollowing layers. Therefore, bidirectional communication is established at each layer.This characteristic allows determining short and long terms relationships among thetarget output and the predictors. One advantage of RNNs with respect temporal seriesmethods is that RNNs do not require to remove trend and seasonality (although it canimprove the obtained results). Regarding the use of RNN for Covid-19 analysis, in[249], the authors use an RNN to predict the number of new infections. They trainedthe network with data from the 2003 SARS epidemic and then used the results ina SEIR model to forecast epidemics trend of Covid-19 in China under public healthinterventions. In [42], a Long Short Term Memory (LSTM) is used to forecast thenumber of cases in Canada outbreak. A similar work can be found in [219], where anLSTM architecture is used to estimate the number of cases in India. In [258] a LSTMmodel and NLP techniques are combined to predict Covid-19 propagation in China.
• Convolutional Neural Networks: CNNs are in general suitable for image classi-fication tasks, in particular 2D CNNs. However, they can also be used for temporalseries like 1D CNNs. CNNs apply convolutional filters to the input data to obtainan encoding vector of the data. In the context of Covid-19, 2D CNNs can be usedfor detection and diagnosis [107], [138], [164]. The main idea behind these works isto present alternative techniques for RT-PCR testing. Another interesting researchdirection to explore is 1D CNNs. These networks have been successfully employed indata processing tasks [127]. In 1D CNNs, convolutional filters are applied to severaltemporal series simultaneously. With respect to RNNs, the 1D CNNs are suitablefor obtaining short term relationships among the input and the output, while RNNsallows long terms explanations.
Finally, in [13], the authors highlighted the potential of transfer learning in deep learningapproaches. This technique is especially useful when data is relatively scarce, as it is thecase in Covid-19 pandemic. The idea is to transfer pre-trained architectures successfullyemployed in forecasting problems to make predictions of variables related to Covid-19.
The main limitations of deep learning approaches are: i) they require a high amount ofdata, ii) hiperparametrization of the models is complex, and iii) the interpretability of theresulting model is low.
7.5 Ensemble methods
These methods are based on the aggregated response of several forecasting models. Alsoknown as wisdom of the crowd [203], the main idea behind these methods is that a suitablycombined prediction from many models will hopefully outperform the predictions of thebest one. The diversity of the models in the ensemble plays an important role since eachof them can specialize in learning some input-output relations or aspects of the predictedoutput. As a representative example of ensemble methods, Random Forest technique [130]aggregates the response of many decision trees. The main limitations of these techniquesare: i) an increase of the complexity of the model with respect to single models and, thus, anincrease in the amount of data required for training, and ii) reduced model interpretability.An ensemble method is proposed in [19] to obtain one-week ahead forecasts of the numberof Covid-19 hospitalized cases in Andalusia, Spain. The predictors used are SVM regressors
33

and Random Forests, and a blending method is used to aggregate the responses. In [48],the authors use random forest to evaluate social distancing on the compound growth rateof Covid-19 at the county level in the USA. In [192], an ensemble method is used to predictthe number of cases in Brazil, the techniques used are the cubist, random forest, RIDGE,and SVR as base-learners, and Gaussian process (GP) as meta-learner.
7.6 Time Series Theory
Time series analysis comprises techniques for analyzing time series data. Time series mod-els used for forecasting include decomposition models, exponential smoothing models andARIMA models, among others (see [99]). One of the main differences with regression modelsis that the predictors are previous values of the target variable. For instance, if we considerthe number of new confirmed cases of Covid-19 cases as a temporal series, the forecastingmethod uses the previous values of new confirmed cases to predict future values. Normally,linear models are considered; however, these methods can be extended to non-linear rela-tionships. In what follows, we review different techniques from the field of time series theory,that are used to forecast Covid-19 spread:
• Decomposition models: A time series can be divided into three components: atrend-cycle or trend component (T), a seasonal component (S), and a remainder com-ponent (R). Thus, the target value to be predicted can be expressed as yt = St+Tt+Rt(multiplicative formulations can also be used). Examples of decomposition techniquesare X1, SEATS, and STL (see Section 6 in [99]). These methods can be used todetermine the trend and seasonality of Covid-19 cases.
• Auto Regressive Moving Average (ARMA and ARIMA): This approach com-bines Auto Regressive (AR) and Moving Average (MA) models. AR model specifiesthat the target variable depends linearly on its own previous values plus a randomwhite noise error. In MA model, the output is the sum of the mean of the targetvariable and a linear relationship of the previous white errors. MA is used to measurethe trend component. The ARIMA model is a generalization of ARMA model, whichis suitable for non-stationary data. Thus, both trend and seasonality of the time se-ries change over time. The integrated part of the model is employed to eliminate thenon-stationary. Notice that Covid-19 spread changes over time due to contention andmitigation techniques employed by decision-makers. Therefore, ARIMA models aresuitable for Covid-19 forecasting. As application examples, in [21], the ARIMA modelis used to forecast the spread of the virus in terms of prevalence and incidence. In[43], an ARIMA model is used to estimate the number of cases and recovered in Italyafter several days in a lockdown scenario. Similarly, in [39] prevalence is estimated inFrance, Italy and Spain through an ARIMA model. Furthermore, there are improvedARIMA models, for instance, in [3] use a SutteARIMA model to predict stock marketin Spain.
Regarding the limitations of time series methods, they work well for measuring trendsand seasonality of temporal data; however, since these methods rely on past data (pastevents), they present difficulties for modelling the effects of events that have not happenedbefore. For instance, in Covid-19 pandemic context, they can be used for determining the
34

trend and seasonality before and after control techniques are employed. Nevertheless, duringthe transition phases, these methods could present some problems to estimate the changesin a short period of time. Furthermore, the poor quality of the data reported on Covid-19temporal series, for instance, changing criteria (see [4]) can also be an issue for time seriesmethods.
As for a comparison work between temporal series techniques and other methods, seefor example [104] where a comparison of ARIMA model and random forests for an influenzapandemic in Egypt is presented.
7.7 Assessing the performance of forecasting models
The generalized performance of a forecasting method can be defined as its prediction capacityon an independent test, that is, data that the model has not seen previously. The objectiveof assessing methodologies is to reduce error and avoid overfitting, i.e., the model workswell during training but poorly during testing. Therefore, assessment methods are crucialto validate the developed forecasting methods. The validation process in the context of theCovid-19 pandemic is not simple because available data can be highly correlated. In orderto address this issue, it is desirable to validate the forecasting methodologies with data setsfrom different regions and different periods of time. This is much easier to be done withother infectious diseases like seasonal influenza because of the availability of time-series fromdifferent locations and different years.
The literature reviewed to prepare this paper shows that the vast majority of proposedmodels for Covid-19 forecasting do not include suitable assessment techniques. The modelsare normally trained with data of similar specific locations. Such models perform relativelywell in these locations. However, they might not generalize well for other territories orperiods of time. Besides, often just one single model or methodology is proposed, withoutcomparing the performance with other counterparts.
The assessment of models includes the validation and test phases. The main objectivesare:
• Determining the optimal hyper-parameters for a given prediction model. This step isalso called hyperparametrization and it is crucial for a fair comparison among differentmodels. This procedure should be employed in the validation step [215].
• Model selection by the comparison of several models. Model selection should also becarried out in the validation phase [176].
• Assessment of the performance of the model by estimating the generalization error ofthe selected model using new data in the test phase.
Assessment could be performed including data of a collection of territories with similarcharacteristics (See Cluster methods in Section 4) in terms of the state of the pandemic,size, population, weather, etc. The two main techniques used for evaluating the generalizederror are cross-validation and bootstrapping.
• Cross validation: It is a useful tool used for model validation in cases of a scarcityof data [76]. In cross-validation [23], the whole data is used for both training and
35
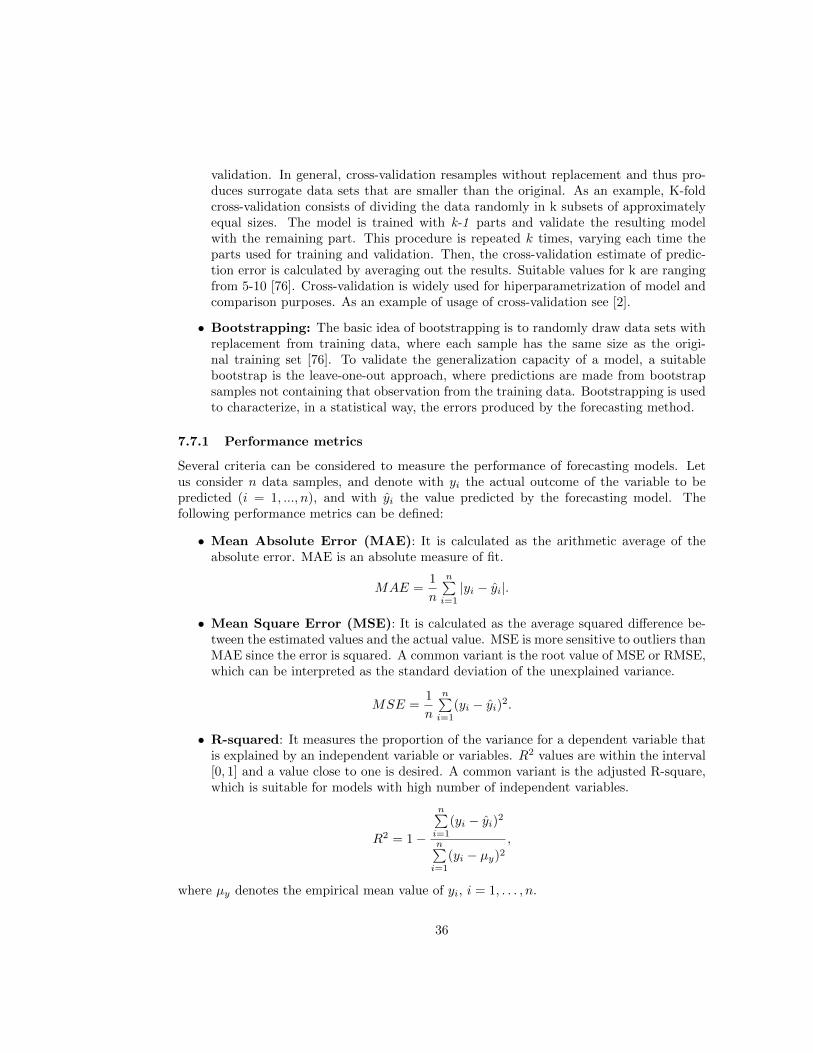
validation. In general, cross-validation resamples without replacement and thus pro-duces surrogate data sets that are smaller than the original. As an example, K-foldcross-validation consists of dividing the data randomly in k subsets of approximatelyequal sizes. The model is trained with k-1 parts and validate the resulting modelwith the remaining part. This procedure is repeated k times, varying each time theparts used for training and validation. Then, the cross-validation estimate of predic-tion error is calculated by averaging out the results. Suitable values for k are rangingfrom 5-10 [76]. Cross-validation is widely used for hiperparametrization of model andcomparison purposes. As an example of usage of cross-validation see [2].
• Bootstrapping: The basic idea of bootstrapping is to randomly draw data sets withreplacement from training data, where each sample has the same size as the origi-nal training set [76]. To validate the generalization capacity of a model, a suitablebootstrap is the leave-one-out approach, where predictions are made from bootstrapsamples not containing that observation from the training data. Bootstrapping is usedto characterize, in a statistical way, the errors produced by the forecasting method.
7.7.1 Performance metrics
Several criteria can be considered to measure the performance of forecasting models. Letus consider n data samples, and denote with yi the actual outcome of the variable to bepredicted (i = 1, ..., n), and with yi the value predicted by the forecasting model. Thefollowing performance metrics can be defined:
• Mean Absolute Error (MAE): It is calculated as the arithmetic average of theabsolute error. MAE is an absolute measure of fit.
MAE =1
n
n∑i=1
|yi − yi|.
• Mean Square Error (MSE): It is calculated as the average squared difference be-tween the estimated values and the actual value. MSE is more sensitive to outliers thanMAE since the error is squared. A common variant is the root value of MSE or RMSE,which can be interpreted as the standard deviation of the unexplained variance.
MSE =1
n
n∑i=1
(yi − yi)2.
• R-squared: It measures the proportion of the variance for a dependent variable thatis explained by an independent variable or variables. R2 values are within the interval[0, 1] and a value close to one is desired. A common variant is the adjusted R-square,which is suitable for models with high number of independent variables.
R2 = 1−
n∑i=1
(yi − yi)2
n∑i=1
(yi − µy)2
,
where µy denotes the empirical mean value of yi, i = 1, . . . , n.
36

• F-test: It compares the proposed model with a model with no predictors. Thus, it isused to reject the null hypothesis. A high value is desired.
Other metrics can be used. However, the previous ones cover the main spectrum. Inaddition, each performance metric evaluates a model in a different way, and the suitabilityof each depends on the data and the selected model.
8 Impact Assessment Tools
In order to be able to design effective control strategies, it is important to define the goalsfirst. It is relatively easy to formulate the objectives in a qualitative way: the ultimategoal is to maintain the spread of the virus within an adequate threshold while minimizingthe economic and social impacts of the interventions. Possible non-pharmaceutical controlstrategies include social distancing, border closures, school closures, isolation of symptomaticindividuals, among others.
However, to resort to advanced decision-making techniques, like the ones proposed in thenext section, one has to state the control objectives in a more precise way. Furthermore, it isnecessary to assess which interventions have the desired impact of controlling the epidemicand, besides, which of those or other actions are necessary to maintain control [35].
This tasks can be accomplished by employing suitable indexes that model the impact ofthe actions on the different aspects considered in the decision-making process. Examples ofpossible indexes are the mean reproductive number, the mortality index, the unemploymentrate or public debt, to name just a few. Once the indexes are established, the goals can bestated in a formal way in terms of constraints and minimization of a weighted cost index.For example, the goal could be stated in terms of satisfying that the mean reproductivenumber is kept smaller than one while minimizing a weighted index modelling the impactson economy and society.
The quantitative computation of such indexes is not an easy task because they require thedesign of data-driven strategies to assess the effect of the decisions on the different indexes.This can be done by means of the predictive models and forecasting schemes analyzed inthe previous sections.
In some cases, to demonstrate a significant effect of one measure or intervention overthe spread of the epidemic is complex since multiple factors are present simultaneously.Thus, the isolation of one parameter over others is difficult or impossible [89]. In thesescenarios, correlation analyses like Pearson Correlation Coefficient (PCC) can be a naiveway to assess the effect [85]. A more interesting approach to conduct these analyses is theso-called Randomized Control Trials (RTC) [89]. In an RTC, a subset of randomly chosenindividuals or regions receives an intervention and randomly selected control groups receivesno intervention. This enables to evaluate the impact of the intervention taken.
We now enumerate, for the most relevant aspects of the Covid-19 pandemic context,possible indexes that could be included in the decision-making process.
8.1 Spread of the virus and reproductive number
It is natural to express the effectiveness of control strategies in terms of the effective repro-ductive number R(t). As introduced in Section 6, the basic reproduction number R0 deter-
37

mines the potential of an epidemic to spread exponentially at its early stage. In contrast,when an epidemic is on course, the effective reproduction number, R(t), is a time varyingquantity that indicates the average number of secondary cases produced by an infectiousindividual. The effective reproduction number can assess the ability of control measures todecrease the spread of an epidemic. By combining measures that maintain R(t) below 1,the incidence of new infections decreases and the spread of epidemics fades with time.
In [51], the authors presented a software tool that can be executed with Microsoft Excelor R. The tool was validated with 5 different epidemics, including SARS and influenza,being able to estimate the daily reproductive number R(t) and its variation in the presenceof vaccination and super spreading events.
For Covid-19 pandemic, an example of this kind of assessment can be found in [70], whereusing data and a SEIR model, the authors estimate R(t) in Wuhan city and conclude aboutthe effectiveness of government measures. However, the dynamic trend of R(t) dependson a parameter k which role and definition is unclear. Based on the number of deaths, in[74], the Imperial College Covid-19 Response Team used a semi-mechanistic Bayesian modelto estimate the evolution of R(t) when measures as social distancing, self-isolation, schoolclosure, public events banned, and complete lock-down are recommended/enforced.
Limitations of using R(t) as an assessment tool arisen from the problems presentedin Section 2 related to the data sources. The procedures used to collect the data aboutinfections and deaths are far from being reliable. As a result, determining the real value ofR(t) is difficult. Other indirect measures, like the number of deaths, ICU cases, saturationof health-care systems are also employed to assess the current epidemic burden. See thenext subsection.
8.2 Saturation of the health-care systems
From the early stages of Covid-19 epidemic, its virulence and high contagiousness collapsedor made insufficient, health-care resources in different places around the world, resulting inhigher mortality rates [100, 120]. Furthermore, in countries with low capacity like Africanand South American countries saturation levels are reached even with a significantly smallernumber of cases [2].
The preparedness of each country to respond against a disaster like Covid-19 pandemicis a useful metric to measure the capacity of each country. This is especially relevant toaccount for the initial situation of each country to fight Covid-19. The IHR MEF is usedas a metric to account for preparedness in [78]. This is a set of four components developedby WHO to support the evaluation of a countrys functional ability to detect and respondto a health emergency. The IHR MEF is composed of a mandatory self-reporting (SPARreport) of capacity and three optional components, such as the Joint External Evaluation,the after-action reviews, and simulation exercises. The SPAR report develops five indices:(1) prevent, (2) detect, (3) respond, (4) enabling function, and (5) operational readiness.On this line, in [103] IHR MEF metric is used to evaluate in the context of Covid-19 thehealth system capacity of 182 countries.
To limit the saturation of health-care systems and plan the distribution of these resources,it is of invaluable help to count on tools to assess how the different interventions have an effecton the magnitude and timing of the epidemic peak during first and secondary outbreaks (seeSections 6 and 7). However, obtaining precise tools to forecast these peaks is challenging due
38

to the limitations of the available data and the time-varying nature of the mitigation effortsand potential seasonal behaviour of the pandemic. In order to circumvent these issues,forecasts of cumulative disease burden are often looked for. While missing the intensity andtiming of the peaks, these projections can at least allow to identify areas with heavy presentand/or future affection of Covid-19 [148].
8.3 Social impact
With regard to assessment tools, it is really difficult to aggregate all social aspects affectedby Covid-19 pandemic in just one metric. Here we review some of the methodologies thatcould be helpful to design indexes to model the social impact of the pandemic.
• Social network analysis: social networks such as Facebook and Twitter can beused to assess the impact of Covid-19 in society. People post in these social networks,their feelings and worries. In [211], 530.206 tweets in the USA were analyzed tomeasure the social impact of Covid-19. The hashtags were classified into six categorieslike general covid, quarantine, school closures, panic buying, lockdowns, frustrationand hope. Thus, the number of tweets in each category can be used as a metric ofimpact. Similarly, Weibo microblogging social network was used in [128] to study thepropagation of situational information on social media related to Covid-19 in China.
• Search engines: the searches made by citizens in search engines, such as Google,Bing, and Baidu, among others, can be used to measure the social impact of theepidemic in different locations. Normally, people try to find information of unknowndiseases, drugs, vaccines, and treatments on the Internet. On this line, it has beendemonstrated correlation of relative frequency of certain queries in Google and thepercentage of physician visits in which a patient presents with influenza-like symptoms[79]. Furthermore, other works have studied this assessment tool for other epidemicslike Influenza Virus A (H1N1) pandemic [50]. Regarding Covid-19, in [184], the Baiduengine is used to estimate the number of new cases of Covid-19 in China by the numberof searches of five keywords, such as dry cough, fever, chest distress, coronavirus, andpneumonia. These five keywords showed a high correlation with the number of newcases.
• News: the number and the content of posts in online newspapers can also be usedto assess the spread of the virus. On this line, in [258], Natural Language Processing(NLP) technique is used to extract the relevant features of news media in China.
• Online questionnaires: Another tool for measuring the social impact of Covid-19 is through online questionnaires such as [165] (Spain, 146.728 participants) [185](China, 52.730 participants) and [111] (UK, 2500 participants). These allow to rapidlyformulate to citizens multiple questions related to psychological, social and economicimpact, among other aspects. The main difficulty is to spread the questionnairesthroughout the population, although social networks and web-based tools help to reacha large amount of population.
• Mobility: reduction of mobility is not only due to the imposed quarantines and lock-downs by governments. Such reductions is also explained by the increasing popula-
39

tion’s fear of getting infected. In [66], the perceived risk index of contracting Covid-19is defined. This metric is measured the individuals perception of risk, and it is deter-mined by several variables, such as prevalence in both local and neighbouring locations,as well as population demographics. The results in [66] indicate that a rise of localinfection rate from 0% to 0.003% reduces mobility by 2.31%.
9 Decision Making
Determining which of the far-reaching social and economic restrictions are most effective andthe conditions under which they can be safely lifted is one of the main goals of data-drivendecision approaches to combat Covid-19. Unlike an unmitigated pandemic, which burnsthrough the susceptible population and eventually fades out, a mitigated first wave preservesa population of unexposed, susceptible individuals. This means that when social distancingguidelines are relaxed, the epidemic can once again spread worldwide. It is compulsory toput in place surveillance systems and reactive mechanisms to reduce the potential burdenof secondary epidemic waves. The decision-making process in this context is complex formany reasons:
• The uncertainty on some crucial parameters characterizing the spread: seasonality,extent and duration of immunity, etc. [49], [110].
• The difficulties in assessing the quantitative effect of a specific set of mitigation inter-ventions on the effective reproduction number [89].
• The significant non-symptomatic transmission of Covid-19, which render some inter-ventions less effective [161], [178] .
• Its different regional incidence, which motivates decisions in a spatially distributedway [210].
• The necessity of an adequate trade-off between mitigating the spread of the epidemicand reducing the socio-economic impacts.
• The time-delay nature of the system, which does not allow for a prompt evaluation ofthe effect of the implemented actions.
• The difficulties of assessing in a quantitative way the disruptive effects of the under-taken measures in relevant macroeconomic variables.
In what follows, we analyze under which circumstances the epidemic can be mitigated(controllability of the pandemic). After that, we also discuss some methodologies that havebeen applied to combat other infectious diseases, or that could potentially be applied in thecontext of Covid-19 pandemic. See also the review paper [162] for the use of control theoryin the context of pandemic control.
40

9.1 Controllability of the pandemic
In this subsection, we review the most important factors determining the controllability ofthe pandemic. That is, those aspects that have a relevant impact on the effective repro-duction number. We link them with standard epidemic threshold theorems (eg. [18], [236],[105]).
The epidemic threshold theorem of Kermack and McKendrick [105], stated in 1927,and in particular, its stochastic form as given by Whittle [236], is fundamental to predictthe size and nature of an outbreak of an infectious disease. The theorem indicates thatin homogeneously mixed communities major epidemics can be prevented by keeping theproduct of the size of the susceptible population, the infection rate, and the mean durationof the infectious period, sufficiently small [18]. We now discuss how to have an impact oneach of these factors by means of control actions.
• Size of the susceptible population: The most effective way to reduce the suscep-tible population is by means of vaccines, which are able to increase the herd immunityto a level that prevents further spread of the disease. A key question is whether pro-tection against Covid-19 will happen by widespread deployment of an effective vaccineor by repeated waves of infection over the next few years until 60% to 70% of peopledevelop immunity [84]. Another issue is the duration of the acquired immunity [110],which in some infectious diseases, like the seasonal influenza, is not long enough toprevent recurring seasonal peaks [49].
• Infection rate: This factor can be reduced by means of different control actionslike social distancing, mobility constraints, prohibition of certain activities, etc. [171],[116], [158]. It is suspected that Covid-19 will exhibit a seasonal behaviour, like in-fluenza viruses and the four seasonal human coronaviruses HKU1, NL63, OC43 and229E [49], [156]. Depending on the seasonality and the specific demographic charac-teristics of a given population, the implemented measures can exhibit a time-varyingeffect on the infection rate [51],[70]. This might cause flows from tropical to tem-perate regions and back in each hemispheres respective winter, limiting opportunitiesfor global population declines [49] and implying that surveillance methods to detect aseasonal peak should be put in place.
• Mean duration of the infectious period: An effective way to reduce the infectiousperiod consists in detecting infected cases and setting them into quarantine. However,because of the relative small latent period and the asymptomatic cases, the impact ofthis measure depends very much on how fast the detection is taking place. It has beenshown that the probability of control decreases with long delays from symptom onsetto isolation [94], [72]. This is one of the key issues because of asymptomatic casesand the significant probability that transmission occurs before the onset of symptoms(median latent delay is slightly smaller than median incubation time) [72].
9.2 Optimal allocation of limited resources
Among other resources, Covid-19 pandemic has provoked shortages in intensive care beds,ventilators, tests, high-filtration masks and other Individual Protection Equipment (IPE).
41

This fact led to the problem of how to ethically and consistently allocate resources. In thiscontext, the term “resource” is not limited to hospital beds or ventilators, but extends itselfto issues as where and when to allocate the available resources.
A rigorous and precise allocation method should lead to the formulation of an optimiza-tion problem, composed of a mathematical formulation and efficient algorithms to obtainits numerical solution. In the mathematical model, resource allocations are the decisionvariables while the objectives are encoded in cost functions and equality or inequality con-straints. For example, in [254] and [28], budget allocation models for multiple populationare provided. In [179], a network model is used together with geometric programming inorder to optimally allocate resources to eradicate an initial epidemic outbreak (see also [67]).The same authors extend this last result to the optimal allocation of vaccines in [163].
However, to the best of the author’s knowledge, the literature addressing the optimal al-location of resources specifically for Covid-19 is scarce. Some exceptions to this include [122],where an optimization problem is formulated to find the number of tests to be performedin the different Italian regions in order to maximize the overall detection capabilities. Theproblem is a quadratic, convex optimization programming. In [82], a group testing approachis considered, and it is shown how the optimization of the group size can save between 85%and 95% of tests with respect to individual testing.
Estimation, forecasting, and impact assessment techniques, discussed in previous sec-tions of this work, are often used to decide the allocation of resources, as they enabledecision-makers to predict imbalances between supply and demand and to evaluate theoverall efficiency of different alternatives of allocation.
In [65], the authors propose fair resource allocation guidelines in the time of Covid-19.These guidelines come from 4 fundamental values: i) maximizing the benefits, ii) treatingpeople equally, iii) promoting instrumental value, and iv) giving priority to the worst off.As a result, these guidelines are condensed in some recommendations:
1. To maximize the number of saved lives and live-years, with the latter metric subordi-nated to the former.
2. To prioritize critical interventions for those health care workers and others who takecare of ill patients because of their instrumental value.
3. For patients with similar prognoses, equality should be invoked and operationalizedthrough random allocation.
4. To distinguish priorities depending on the interventions and the scientific evidence(e.g. vaccines could be prioritized for older persons while allocation ICU resources,depending on prognosis, might mean giving priority to younger patients).
5. People who participate in research to prove the safety and effectiveness of vaccines andtherapeutics should receive some priority for interventions.
9.3 Trigger Control
We comment on this section a strategy that permits to modulate the intensity of the non-pharmaceutical interventions. The idea is to implement a trigger mechanism to maintain
42

the effective reproductive factor close to one, avoiding the saturation of the health caresystem while reducing, when possible, the economic and social burden of the pandemic [35].The on-line surveillance of the pandemic permits to estimate the time-varying value of theeffective reproductive factor. Three cases are possible:
• The effective reproductive factor is clearly under 1: in this case, one could considerlifting one, or more non-pharmaceutical measures. However, other criteria should bemet in order to implement a reduction on the confinements measures in a safe way.The three criteria highlighted by the European Commission to decide on the lifting ofconfinement measures [68] are:
1. Epidemiological criteria showing that the spread of the disease has significantlydecreased and stabilised for a sustained period of time. This can, for example,be indicated by a sustained reduction in the number of new infections, hospitali-sations and patients in intensive care.
2. Sufficient health system capacity, in terms of, for instance, occupancy rate forIntensive Care Units; adequate number of hospital beds; access to pharmaceuticalproducts required in intensive care units; reconstitution of stocks of equipment;access to care, in particular for vulnerable groups; availability of primary carestructures, as well as sufficient staff with appropriate skills to care for patientsdischarged from hospitals or maintained at home and to engage in measures tolift confinement (testing for example). This criterion is essential as it indicatesthat the different national health care systems can cope with future increases incases after lifting of the measures. At the same time, hospitals are likely to face abacklog of elective interventions that had been temporarily postponed during thepandemics peak. Therefore, states health systems should have recovered sufficientcapacity in general, and not only related to the management of Covid-19.
3. Appropriate monitoring capacity, including large-scale testing capacity to detectand monitor the spread of the virus combined with contact tracing and possibil-ities to isolate people in case of reappearance and further spread of infections.Antibody detection capacities, when confirmed specifically for Covid-19, will pro-vide complementary data on the share of the population that has successfullyovercome the disease and eventually measure the acquired immunity.
• The effective reproductive factor has increased to a level clearly above 1: this woulddemand, in most cases, prompt strengthening of the mitigation interventions. Theintensity of the new measures should guarantee that the health system is not over-whelmed with the arriving new epidemic wave. This requires the implementation offorecasting tools that help to decision-makers to determine the most suitable set ofmitigating measures.
• The effective reproductive factor is close to 1: in this case, a deeper analysis is required.The decision on whether to keep the same set of current mitigation measures or not willdepend on the current fraction of infected population, the health-care system capacity,and the potentiality of implementing in a short period of time a mitigating intervention,which is capable of bringing the effective reproductive number to admissible values.
43

That is, the decision could be determined by the worst-case cost of delaying in oneweek the implementation of new measures.
In order to develop a timely and appropriate response, different methodologies from thefield of control theory are available (see e.g. [162], [25], [34], [114]). We describe them inthe following subsections.
9.4 Optimal Control Theory
Optimal control theory [131] can be applied to reduce in an effective way the burden of anepidemic [125], [145, Chapter 9]. The dynamic optimization techniques of the calculus ofvariations and of optimal control theory provide methods for solving planning problems incontinuous time. The solution is a continuous function (or a set of functions) indicating theoptimal path to be followed by the variables through time or space [102]. We present herea common formulation of a continuous dynamical optimization problem [88, Section 2]:
minx(·),u(·)
S(x(T ), T ) +
T∫0
F (x(T ), u(t), t)dt
s.t. x(0) = x0,
x = f(x(t), u(t), t),
g(x(t), u(t), t) ≥ 0, (7)
h(x(t), t) ≥ 0, (8)
a(x(T ), T ) ≥ 0, (9)
b(x(T ), T ) = 0. (10)
In an epidemic control problem x(t) represents the state of the pandemic at time t (forexample, in terms of the populations of the different compartments), u(t) is the controlaction which can be stated in a direct way (intensity of the interventions, number of vaccines,treatments), or in an indirect way (infection rate, immunologic protection, recovery rate).The differential equation x(·) = f(·, ·, ·) represents the epidemic model, constraint (7) allowsus to incorporate (mixed) constraints on x(·) and u(·) whereas the (pure) constraint (8) canbe used to impose limits on the size of the components of x(·). Finally, (9) and (10) areterminal constraints. The question of existence of optimal pairs (x∗(·), u∗(·)) was studied inin [38] and [73]. See also [88, Section 3] and references therein.
Pontryagin’s maximum principle provides necessary conditions that characterize the op-timal solutions in the presence of inequality constraints [131], [108]. These necessary condi-tions become sufficient under certain convexity conditions on the objective and constraintfunctions [144],[101]. In general, the solution of the optimal problem in the presence ofnonlinear dynamics and constraints requires iterative numerical methods to solve the so-called Hamiltonian system, which is a two-point boundary value problem, plus a maximum(minimum) condition of the Hamiltonian (see e.g. [108, Chapter 6]).
We now describe some examples of the use of the optimal control theory in epidemiccontrol. In [253], the dynamic optimal vaccination strategy for a SIR epidemic model isdescribed. The optimal solution is obtained using a forward-backward iterative method
44

with a Runge-Kutta fourth-order solver. An example of how to deploy scarce resources fordisease control when epidemics occur in different but interconnected regions is presentedin [199]. The authors solve the optimal control problem of minimizing the total level ofinfection when the control actions are bounded.
In [251] the authors apply Pontryagin’s Theorem to obtain an optimal Bang-Bang strat-egy to minimize the total number of infection cases during the spread of susceptible-infected-recovered SIR epidemics in contact networks. Optimal control theory is employed to designthe best policies to control the spread of seasonal and novel A-H1N1 strains in [181]. Anexample of the use of optimal control theory to control the present Covid-19 pandemic ispresented in [143], where the authors design an optimal strategy, for a five compartmentalmodel, in order to minimize the number of infected cases while minimizing the cost of thenon-pharmaceutical interventions.
9.5 Model Predictive Control
Model predictive control (MPC) is a methodology that provides optimal solutions to a con-trol decision problem subject to constraints [33], [187]. MPC is a receding horizon method-ology that involves repeatedly solving a constrained optimization problem, using predictionsof future costs, disturbances, and constraints over a moving time horizon. In epidemic con-trol, the aforementioned optimization problem is solved daily, or weekly, in order to decidethe optimal control action (for example, the intensity of mitigation interventions, or theoptimal allocation of resources). The output of the model predictive controller is adaptivein the sense that it takes into consideration the latest available information on the state ofthe pandemic. See, for example [9], [114] and [151] for MPC formulations that address thecontrol of the Covid-19 pandemic.
Because of the spatial clustered distribution of an epidemic, it is possible to apply spe-cific control techniques from the field of distributed model predictive control [140], [45].For example, non linear model predictive control can be used to control the epidemics bysolely acting upon the individuals contact pattern or network [210]. Another example ofdistributed MPC in the control of epidemics is given in [113], where the problem of dynam-ically allocating limited resources (vaccines and antidotes) to control an epidemic spreadingprocess over a network is addressed.
9.6 Multi-objective control
Pareto optimality is used in multi-objective control problems with counter-balanced objec-tives. For instance, in a counter-balanced bi-objective problem, improving one objectiveimplies to worsen the other one. Pareto optimality is based on the Pareto dominance, whichdefines that one solution dominates another one iff it is strictly superior in all the objectives.Thus, the goal of the optimization algorithm is to find the Pareto front, which includes alldominant solutions of the control problem. Therefore, there is a set of optimal solutionsinstead of one optimal solution. The Pareto front is a useful tool for decision-makers thatallows to visualize all the possible optimal solutions (for two objectives is a curve, for threeobjectives a plane, and so forth) and to evaluate the trade-off between different strategies.In the context of epidemic control [212], Pareto optimality has been used in [250] in a bi-objective control problem, the goals are related to epidemic measures like the number of
45

cases and economic costs. Thus, the results show that economic and epidemiology goals arecounter-balanced. In general, this result can be expected since the security of a populationwith respect to the spread of a virus can only be guaranteed by increasing the economiccosts through contention and mitigation strategies that reduce mobility.
9.7 Reinforcement Learning
In this section, a brief introduction to Reinforcement Learning and its use in the context ofepidemic control is presented.
Reinforcement learning is an artificial intelligence technique where an agent learns byactions. For an executed action a ∈ A in a given state s ∈ S, where A is the set ofpossible actions in a state s and S is the set of possible states of the agent, the agentwill move stochastically to a new state s+. The new state s+ is given by the dynamicmodel of the environment where the agent performs. Thus, reinforcement learning problemsare usually formulated as finite Markov Decision Processes (MDP) [182]. In an MDP, theMarkov property indicates that the state includes information about all aspects of the pastagentenvironment interaction that make a difference for the future. On the transition fromone state to another after executing a given action, the agent receives a reward signal r ∈ R.Normally, if an action is positive for the agent’s global objective, the reward will be positive.In contrast, bad actions will lead to negative rewards. Thus, the learning procedure is atrial-and-error search [218]. The agent can know its state s by sensing the environmentand the final goal of the agent is to maximize the long term reward received by finding theoptimal policy π∗ in a sequential decision-making scenario. It is important to highlight thelong term feature of the agent’s goal; otherwise, it will select greedily the best action at eachstate.
In [248], the authors study how to design environments to represent the problem ofcontrol epidemics and finding optimal interventions. The main aspects to take into accountare:
• In the control epidemic problem, the agent represents decision markers such as gov-ernments and institutions, and the goal is to find the optimal intervention strategy(π∗).
• The state of the agent is the state of the pandemic measured not only in terms ofthe size of the different populations of the compartmental model (SIR, SEIR, etc.),but also through the parameters of the underlying epidemic model like infection rate,basic reproduction number, etc. Therefore, the set S represents all possible states ofthe epidemic model.
• The agent’s actions are contention and mitigation techniques established by decision-makers, such as wearing masks, social distance, contact tracing, closing schools, lock-downs, etc.
• The reward signal is related to the decision maker’ goals. For instance, if the goal is toreduce the total number of deaths, the reward can be related with the rate of deathsat each time step by a simple function growing with the decrease of the rate of deaths.
46

• The policy is a function that indicates an action a ∈ A to perform for each state s ∈ S,π : S → A.
From the optimization point of view, the problem to solve is to find the optimal policyπ that selects at each state s the optimal action a to obtain the maximum expected rewardafter a number of decision t ∈ T (long-term benefit), π∗ = argmaxπE[
∑Tt=1 rt]. There are
different methods to solve the optimization problem, such as dynamic programming andheuristic approaches with exploration and exploitation capabilities. Dynamic optimizationrequires a dynamic model of the environment (pandemic) in order to access to a completeMDP representation of the disease. As examples of this case, see [247], where an approximatedynamic policy aimed at optimizing the population’s net health benefit for H1N1 influenzais proposed, and [246], where it is applied to tuberculosis epidemics. If a dynamical modelis not available or it is too complex, there are free-model solutions like temporal differencelearning [218] and Q-learning [235]. In [132], the authors model the problem of selectingoptimal strategies for influenza as k-armed bandit problem, which is well-known in thereinforcement learning community. Bayesian best-arm identification algorithms [133], suchas top-two Thompson sampling and BayesGap, are evaluated to solve the problem.
There are some limitations of reinforcement learning approaches:
• It requires a training process to obtain the optimal policy. The duration of the trainingprocess depends on the complexity of the problem. Therefore, a realistic epidemicsimulation environment is crucial to obtain the optimal policy. In addition, since theprocess requires trial-error steps and heuristics, it cannot be trained on real-time.
• The number of states and the observability of the environment can be limiting factors.
• The definition of a suitable reward signal is also sometimes challenging.
Reinforcement learning approaches have also been combined with deep learning tech-niques in Deep Reinforcement Learning methods [150]. In these approaches, the power ofdeep learning algorithms for data representation is used to obtain the optimal policy. Forinstance, in [134], a deep learning approach is used to learn prevention strategies in thecontext of influenza epidemics.
10 Conclusions
This document presents a roadmap for controlling Covid-19 pandemic from a 3M data-drivenperspective: Monitoring, Modelling, and Making decisions. A holistic approach is requiredto efficiently content and mitigate the impact of the pandemic. We have highlighted theinterplay between data science, epidemiology, and control theory in a data-driven approachto address the different challenges raised by the pandemic.
Methodologies and approaches proposed for previous epidemics and current Covid-19have been reviewed. Although the literature is large and many approaches have been stud-ied in the past, further research is still necessary. The implementation of effective controlstrategies to mitigate the pandemic is difficult because of different reasons: i) the significantnon-symptomatic transmission of Covid-19, ii) the uncertainty on some crucial parameters
47

characterizing the spread, iii) the difficulties in assessing the quantitative effect of the miti-gation interventions, iv) the impossibility of obtaining a prompt evaluation of the effect ofthe implemented intervention.
The first step for the modelling of different aspects of the pandemic is the processing ofthe available raw data to obtain consolidated time-series. Different methodologies from thefield of Data-Reconciliation, Data-Fusion, Clustering Methods and Signal Processing havebeen reviewed. In order to obtain prediction models, which are crucial for the decision-making process, we provide an enumeration of techniques from epidemiology and machinelearning. We describe the most relevant modelling and forecasting approaches focusing onthe adjustment of the prediction models to the available data, model selection and validationprocesses.
The most plausible scenario may involve recurring epidemic waves interspersed withperiods of low-level transmission. Thus, different surveillance systems able to detect, or an-ticipate, possible recurring epidemic waves are surveyed. These systems enable an immediateresponse that reduces the potential burden of the outbreak. We also analyze different tech-niques for the implementation of surveillance and monitoring systems, enabling a promptresponse in case of a secondary epidemic wave. Different methods from control theory can beapplied to provide an optimal, robust and adaptive response to the time-varying incidenceof the epidemic. These methods can be applied to the optimal allocation of resources, andto the determination of trigger control schemes that increase or decrease the intensity of theinterventions. We review the control-theory literature in the context of analysis and designof feedback structures leading to efficient control of an epidemic. Besides, we also mentionsome techniques from distributed model predictive control that can be applied to addressthe temporal and spatial dimension of the spread of Covid-19.
10.1 Updates and Contributors
To keep pace with the pandemic, this paper will be updated regularly in arXiv14 dur-ing the Covid-19 pandemic. We thank feedback and collaboration from the communityto enrich and update the paper. Contributors can contact the CONCO-Team via e-mail:[email protected].
References
[1] D. Abreu and A. Dutra. Uncertainty estimation in equality-constrained MAP andmaximum likelihood estimation with applications to system identification and stateestimation. Automatica, 116:108935, 2020.
[2] T. Achoki et al. Covid-19 pandemic in the African continent: forecasts of cumulativecases, new infections, and mortality. medRxiv, 2020.
[3] A. S. Ahmar and E. B. del Val. SutteARIMA: Short-term forecasting method, a case:Covid-19 and stock market in Spain. Science of The Total Environment, page 138883,2020.
14https://arxiv.org/
48

[4] T. Alamo, D. G. Reina, M. Mammarella, and A. Abella. Covid-19: Open-Data Re-sources for Monitoring, Modeling, and Forecasting the Epidemic. Electronics, 9(5):827,2020.
[5] T. Alamo, D. G. Reina, M. Mammarella, and A. Abella. Open data resources forfighting covid-19. arXiv preprint arXiv:2004.06111, 2020.
[6] R. Albert and A. L. Barabasi. Statistical mechanics of complex networks. Reviews ofmodern physics, 74(1):47, 2002.
[7] J. S. Albuquerque and L. T. Biegler. Data reconciliation and gross-error detection fordynamic systems. AIChE Journal, 42(10):2841–2856, 1996.
[8] A. Aleta and Y. Moreno. Evaluation of the potential incidence of covid-19 and effec-tiveness of contention measures in Spain: a data-driven approach. medRxiv, 2020.
[9] T. Alleman, E. Torfs, and I. Nopens. Covid-19: from model prediction to modelpredictive control. Technical report, Ghent University, 2020.
[10] E. S. Allman and J. A. Rhodes. Mathematical Models in Biology. An Introduction.Cambridge University Press, 2004.
[11] Benjamin M. Althouse, Samuel V. Scarpino, Lauren Ancel Meyers, Ayers, et al. En-hancing disease surveillance with novel data streams: challenges and opportunities.EPJ Data Science, 4(1):1–8, 2015.
[12] E. Alvarez, J. Donado-Campos, and F. Morilla. New coronavirus outbreak. Lessonslearned from the severe acute respiratory syndrome epidemic. Epidemiology and In-fection, 143(13):2882–2893, 2015.
[13] I. D. Apostolopoulos and T. A. Mpesiana. Covid-19: automatic detection from X-rayimages utilizing transfer learning with convolutional neural networks. Physical andEngineering Sciences in Medicine, pages 1–6, 2020.
[14] A. Arrieta et al. Explainable artificial intelligence (xai): Concepts, taxonomies, oppor-tunities and challenges toward responsible ai. Information Fusion, 58:82–115, 2020.
[15] R. E. Baker et al. Susceptible supply limits the role of climate in the early SARS-CoV-2pandemic. Science, page eabc2535, 2020.
[16] G Baltas, F. A. Prieto-Rodrıguez, M. Frantzi, C. Garcıa-Alonso, P. Rodrıguez-Cortes,et al. Monte carlo deep neural network model for spread and peak prediction of covid-19. 2020.
[17] S. Bansal, B. T. Grenfell, and L. A. Meyers. When individual behaviour matters:Homogeneous and network models in epidemiology. Journal of the Royal SocietyInterface, 4(16):879–891, 2007.
[18] N. G. Becker. On a general stochastic epidemic model. Theoretical Population Biology,11(1):23–36, 1977.
49

[19] Sandra Bentez-Pea, Emilio Carrizosa, Vanesa Guerrero, Mara Dolores Jimnez-Gamero, et al. Short-term predictions of the evolution of covid-19 in andalusia. anensemble method. ResearchGate preprint, 2020.
[20] D. Benvenuto et al. Application of the ARIMA model on the COVID-2019 epidemicdataset. Data in Brief, 29:105340, 2020.
[21] D. Benvenuto et al. Application of the arima model on the covid-2019 epidemic dataset.Data in brief, page 105340, 2020.
[22] G. Beraud et al. The french connection: the first large population-based contact surveyin france relevant for the spread of infectious diseases. PloS one, 10(7), 2015.
[23] C. Bergmeir and J. M. Bentez. On the use of cross-validation for time series predictorevaluation. Information Sciences, 191:192 – 213, 2012. Data Mining for SoftwareTrustworthiness.
[24] L. M. A. Bettencourt et al. Towards real time epidemiology: Data assimilation, mod-eling and anomaly detection of health surveillance data streams. In Lecture Notesin Computer Science (including subseries Lecture Notes in Artificial Intelligence andLecture Notes in Bioinformatics), volume 4506 LNCS, pages 79–90. Springer, Berlin,Heidelberg, 2007.
[25] M. Bin et al. On Fast Multi-Shot COVID-19 Interventions for Post Lock-Down Miti-gation. arXiv preprint arXiv2005.03580, pages 1–18, 2020.
[26] M. Bonamente. Statistics and analysis of scientific data. Springer, 2013.
[27] L. Bottou, F. E. Curtis, and J. Nocedal. Optimization methods for large-scale machinelearning. Siam Review, 60(2):223–311, 2018.
[28] M. L. Brandeau, G. S. Zaric, and A. Richter. Resource allocation for control of infec-tious diseases in multiple independent populations: Beyond cost-effectiveness analysis.Journal of Health Economics, 22(4):575–598, 2003.
[29] F. Brauer and C. Castillo-Chavez. Mathematical models in epidemiology, volume 69.Springer, 2000.
[30] J. Brethouwer et al. ”Stay nearby or get checked”: A Covid-19 lockdown exit strategy.arXiv preprint arXiv:2004.06891, 2020.
[31] D. Brockmann and D. Helbing. The hidden geometry of complex, network-drivencontagion phenomena. Science, 342(6164):1337–1342, 2013.
[32] K. P. Burnham and D. R. Anderson. Model Selection and Multimodel Inference: Apractical Information Theoretic Approach. Springer, second edition, 2010.
[33] E. F. Camacho and C. Bordons. Model predictive control. Springer Science & BusinessMedia, 2013.
50

[34] F. Casella. Can the covid-19 epidemic be managed on the basis of daily data? arXivpreprint arXiv:2003.06967, 2020.
[35] S. Cauchemez et al. Estimating in real time the efficacy of measures to control emergingcommunicable diseases. American Journal of Epidemiology, 164(6):591–597, 2006.
[36] B. Cazelles and N. P. Chau. Using the Kalman filter and dynamic models to assessthe changing HIV/AIDS epidemic. Mathematical Biosciences, 140(2):131–154, 1997.
[37] European centre for disease prevention and control. Seasonal influenza 2012 / 13 inEurope ( EU / EEA countries ) Executive summary. Technical Report February,European Centre for Disease Prevention and Control, 2013.
[38] L. Cesari. Existence Theorems for Optimal Solutions in Pontryagin and LagrangeProblems. Journal of the Society for Industrial and Applied Mathematics Series AControl, 3(3):475–498, 1965.
[39] Z. Ceylan. Estimation of covid-19 prevalence in italy, spain, and france. Science ofThe Total Environment, page 138817, 2020.
[40] T. Chan and C. King. Surveillance and Epidemiology of Infectious Diseases usingSpatial and Temporal Clustering Methods. In D Zeng, H Chen, C Castillo-Chavez,WB Lober, and Mark Thurmond, editors, Infectious Disease Informatics and Bio-surveillance, pages 207–234. Springer, 2011.
[41] V. Cherkassky and Y. Ma. Practical selection of svm parameters and noise estimationfor svm regression. Neural networks, 17(1):113–126, 2004.
[42] V. K. R. Chimmula and L. Zhang. Time series forecasting of covid-19 transmission incanada using lstm networks. Chaos, Solitons & Fractals, page 109864, 2020.
[43] N. Chintalapudi, G. Battineni, and F. Amenta. Covid-19 disease outbreak forecastingof registered and recovered cases after sixty day lockdown in italy: A data drivenmodel approach. Journal of Microbiology, Immunology and Infection, 2020.
[44] G. Chowell et al. Synthesizing data and models for the spread of MERS-CoV, 2013:Key role of index cases and hospital transmission. Epidemics, 9:40–51, 2014.
[45] P. D. Christofides et al. Distributed model predictive control: A tutorial review andfuture research directions. Computers and Chemical Engineering, 51:21–41, 2013.
[46] M. Cinelli et al. The covid-19 social media infodemic. arXiv preprint arXiv:2003.05004,2020.
[47] I. Ciufolini and A. Paolozzi. Prediction of the time evolution of the covid-19 pandemicin italy by a gauss error function and monte carlo simulations. medRxiv, 2020.
[48] J. S. Cobb and M. A. Seale. Examining the effect of social distancing on the compoundgrowth rate of sars-cov-2 at the county level (united states) using statistical analysesand a random forest machine learning model. Public Health, 2020.
51

[49] S. Cobey. Modeling infectious disease dynamics. Science, page eabb5659, 2020.
[50] S. Cook et al. Assessing Google Flu trends performance in the United States duringthe 2009 influenza virus A (H1N1) pandemic. PLoS ONE, 6(8), 2011.
[51] A. Cori et al. A new framework and software to estimate time-varying reproductionnumbers during epidemics. American Journal of Epidemiology, 178(9):1505–1512,2013.
[52] N. Crokidakis. Data analysis and modeling of the evolution of COVID-19 in Brazil.arXiv preprint arXiv:2003.12150, 2020.
[53] R. Dandekar and G. Barbastathis. Neural Network aided quarantine control modelestimation of COVID spread in Wuhan, China. arXiv preprint arXiv:2003.09403,2020:1–9, 2020.
[54] J. W. Davidson, D. A. Savic, and G. A. Walters. Symbolic and numerical regression:experiments and applications. Information Sciences, 150(1-2):95–117, 2003.
[55] J. Dehning et al. Inferring change points in the spread of covid-19 reveals the effec-tiveness of interventions. Science, 2020.
[56] Sara Del Valle, Herbert W. Hethcote, Mac Hyman, Carlos Castillo-Chavez, PhillStroud, Sue Mniszwwski, Jane Riese, and Syd Sydoriak. Modeling Secondary Wavesof Infection Issued :. In After the first wave, Santa Fe, New Mexico, United States,2020.
[57] Sara Del Valle, James M. Hyman, and Nakul Chitnis. Mathematical models of contactpatterns between age groups for predicting the spread of infectious diseases. Mathe-matical Biosciences and Engineering, 10(5-6):1475–1497, oct 2013.
[58] Delphi Research Group (Cargenie Mellon University). COVIDcast.
[59] F. R. Deutsch. Best approximation in inner product spaces. Springer Science \&Business Media, 2012.
[60] D. A. Drew et al. Rapid implementation of mobile technology for real-time epidemi-ology of COVID-19. Science, 2020.
[61] A. Dubrawski. Detection of events in multiple streams of surveillance data. In D Zeng,H Chen, C Castillo-Chavez, WB Lober, and Mark Thurmond, editors, Infectious Dis-ease Informatics and Biosurveillance, pages 145–171. Springer, 2011.
[62] J. Durbin and S. J. Koopman. Time Series Analysis by State Space Methods. OxfordUniversity Press, second edition, 2012.
[63] S. E. Eikenberry et al. To mask or not to mask: Modeling the potential for facemask use by the general public to curtail the COVID-19 pandemic. Infectious DiseaseModelling, 2020.
52

[64] A. M. El-Sayed et al. Social network analysis and agent-based modeling in socialepidemiology. Epidemiologic Perspectives and Innovations, 9(1):1–9, 2012.
[65] E. J. Emanuel et al. Fair Allocation of Scarce Medical Resources in the Time ofCovid-19. The New England journal of medicine, pages 1–7, 2020.
[66] S. Engle, J. Stromme, and A. Zhou. Staying at Home: Mobility Effects of COVID-19.SSRN Electronic Journal, 2020.
[67] C. Enyioha et al. Distributed resource allocation for control of spreading processes.2015 European Control Conference, ECC 2015, pages 2216–2221, 2015.
[68] European Commission. Joint European Roadmap towards lifting COVID-19 contain-ment measures. Technical report, European Commission, 2020.
[69] B. S. Everitt et al. Cluster Analysis. John Wiley and Sons, 2011.
[70] Y. Fang, Y. Nie, and M. Penny. Transmission dynamics of the COVID19 outbreak andeffectiveness of government interventions: A datadriven analysis. Journal of MedicalVirology, pages 1–15, 2020.
[71] C. P. Farrington et al. A Statistical Algorithm for the Early Detection of Outbreaksof Infectious Disease. Journal of the Royal Statistical Society. Series A (Statistics inSociety), 159(3):547, 1996.
[72] L. Ferretti et al. Quantifying SARS-CoV-2 transmission suggests epidemic controlwith digital contact tracing. Science, 368(6491), 2020.
[73] A. F. Filippov. On Certain Questions in the Theory of Optimal Control. Journalof the Society for Industrial and Applied Mathematics Series A Control, 1(1):76–84,1962.
[74] S. Flaxman et al. Estimating the number of infections and the impact of non-pharmaceutical interventions on COVID-19 in 11 European countries. Technical Re-port March, Imperial College London, 2020.
[75] A. Freitas and E. Curry. Big data curation. In New horizons for a data-driven economy,pages 87–118. Springer, Cham, 2016.
[76] J. Friedman, T. Hastie, and R. Tibshirani. The elements of statistical learning, vol-ume 1. Springer series in statistics New York, 2001.
[77] A. Gelman et al. Bayesian data analysis. CRC press, 2013.
[78] M. Gilbert et al. Preparedness and vulnerability of african countries against importa-tions of covid-19: a modelling study. The Lancet, 395(10227):871–877, 2020.
[79] J. Ginsberg et al. Detecting influenza epidemics using search engine query data.Nature, 457(7232):1012–1014, 2009.
[80] G. Giordano et al. Modelling the COVID-19 epidemic and implementation ofpopulation-wide interventions in Italy. Nature Medicine, pages 1–6, 2020.
53

[81] J. R. Gog. How you can help with COVID-19 modelling. Nature Reviews Physics,2020.
[82] C. Gollier and O Grossner. Group Testing Against Covid-19. Covid Economics, 2,2020.
[83] I. Goodfellow, Y. Bengio, and A. Courville. Deep Learning. MIT Press, 2016. http:
//www.deeplearningbook.org.
[84] B. S. Graham. Rapid COVID-19 vaccine development. Science, 2020.
[85] N. Haider et al. Passengers’ destinations from China: Low risk of Novel Coronavirus(2019-nCoV) transmission into Africa and South America. Epidemiology and Infection,2020.
[86] T. Hale, A. Petherick, and T. S. Phillips. Variation in government responses to covid-19: version 2.0. Blavatnik School of Government, 2020.
[87] N. Harding, R. E. Spinney, and M. Prokopenko. Phase transitions in spatial connec-tivity during influenza pandemics. Entropy, 22(2):133, 2020.
[88] R. F. Hartl, S. P. Sethi, and R. G. Vickson. Survey of the maximum principles foroptimal control problems with state constraints. SIAM Review, 37(2):181–218, 1995.
[89] J. Haushofer, C. Jessica, and E. Metcalf. Which interventions work best in a pandemic?Science, Published, 2020.
[90] X. He et al. Temporal dynamics in viral shedding and transmissibility of covid-19.Nature Medicine, pages 1–4, 2020.
[91] IHME COVID-19 health service utilization forecasting Team and Christopher JL Mur-ray. Forecasting COVID-19 impact on hospital bed-days, ICU-days, ventilator-daysand deaths by US state in the next 4 months. medRxiv, 114:2020.03.27.20043752,2020.
[92] H. Heesterbeek et al. Modeling infectious disease dynamics in the complex landscapeof global health. Science, 347, 2015.
[93] D. Helbing et al. Saving Human Lives: What Complexity Science and InformationSystems can Contribute. Journal of Statistical Physics, 158:735–781, 2015.
[94] J. Hellewell et al. Feasibility of controlling COVID-19 outbreaks by isolation of casesand contacts. The Lancet Global Health, 8(4):e488–e496, 2020.
[95] A. E. Hoerl and R. W. Kennard. Ridge regression: Biased estimation for nonorthogonalproblems. Technometrics, 12(1):55–67, 1970.
[96] H. Holden Thorp. The costs of secrecy. Science, 367(6481):959, 2020.
[97] N. E. Huang, F. Qiao, and K. Tung. A data-driven model for predicting the course ofCOVID-19 epidemic with applications for China, Korea, Italy, Germany, Spain, UKand USA. medRxiv, 2020.
54

[98] K. P. Huyvaert, K. P. Burnham, and D. R. Anderson. AIC model selection andmultimodel inference in behavioral ecology: some background, observations, and com-parisons. Behavioral Ecology and Sociobiology, 65:23–35, 2011.
[99] R. J. Hyndman and G. Athanasopoulos. Forecasting: principles and practice. OTexts,2018.
[100] Y. Ji et al. Potential association between COVID-19 mortality and health-care resourceavailability. The Lancet Global Health, 8(April), 2020.
[101] M. I. Kamien and N. L. Schwartz. Sufficient conditions in optimal control theory,1971.
[102] M. I. Kamien and N. L. Schwartz. Dynamic Optimization: The Calculus of Variationsand Optimal Control in Economics and Management. Dover, fourth edition, 2012.
[103] N. Kandel et al. Health security capacities in the context of covid-19 outbreak: ananalysis of international health regulations annual report data from 182 countries. TheLancet, 2020.
[104] M. J. Kane et al. Comparison of arima and random forest time series models forprediction of avian influenza h5n1 outbreaks. BMC bioinformatics, 15(1):276, 2014.
[105] W. O. Kermack and A. G. McKendrick. A contribution to the mathematical theoryof epidemics. Proceedings of the royal society of london. Series A, 115(772):700–721,1927.
[106] M. J. Khabbaz, C. M. Assi, and W. F. Fawaz. Disruption-tolerant networking: Acomprehensive survey on recent developments and persisting challenges. IEEE Com-munications Surveys & Tutorials, 14(2):607–640, 2011.
[107] A. I. Khan, J. L. Shah, and M. Bhat. Coronet: A deep neural network for detectionand diagnosis of covid-19 from chest x-ray images. arXiv preprint arXiv:2004.04931,2020.
[108] D. E. Kirk. Optimal Control Theory. An Introduction. DOVER, 2004.
[109] I. Z. Kiss, D. M. Green, and R. R. Kao. Infectious disease control using contact tracingin random and scale-free networks. Journal of the Royal Society Interface, 3(6):55–62,2006.
[110] S. M. Kissler et al. Projecting the transmission dynamics of SARS-CoV-2 through thepostpandemic period. Science, page eabb5793, 2020.
[111] B. Kleinberg, I. van der Vegt, and M. Mozes. Measuring emotions in the covid-19 realworld worry dataset. arXiv preprint arXiv:2004.04225, 2020.
[112] L. C. Klopfenstein et al. Digital Ariadne: Citizen Empowerment for Epidemic Control.arXiv preprint arXiv:2004.07717, 2020.
55

[113] J. Kohler, C. Enyioha, and F. Allgower. Dynamic Resource Allocation to Control Epi-demic Outbreaks A Model Predictive Control Approach. Proceedings of the AmericanControl Conference, 2018-June:1546–1551, 2018.
[114] J. Kohler, L. Schwenkel, A. Koch, J. Berberich, P. Pauli, and F. Allgwer. Ro-bust and optimal predictive control of the COVID-19 outbreak. arXiv preprintarXiv2005.03580, 2020.
[115] J. R. Koza. Genetic programming as a means for programming computers by naturalselection. Statistics and computing, 4(2):87–112, 1994.
[116] M. U. G. Kraemer et al. The effect of human mobility and control measures on theCOVID-19 epidemic in China. Science, page eabb4218, 2020.
[117] A. J. Kucharski et al. Articles Early dynamics of transmission and control of COVID-19: a mathematical modelling study. The Lancet Infectious Diseases, 2020.
[118] K. Kwok et al. Epidemic models of contact tracing: Systematic review of transmissionstudies of severe acute respiratory syndrome and middle east respiratory syndrome.Computational and structural biotechnology journal, 2019.
[119] T. Kypraios, P. Neal, and D. Prangle. A tutorial introduction to Bayesian inference forstochastic epidemic models using Approximate Bayesian Computation. MathematicalBiosciences, 287:42–53, 2017.
[120] C. C. Lai et al. Global epidemiology of coronavirus disease 2019 (COVID-19): diseaseincidence, daily cumulative index, mortality, and their association with country health-care resources and economic status. International Journal of Antimicrobial Agents,55(4):In press, 2020.
[121] P. C. Lai et al. Understanding the Spatial Clustering of Severe Acute RespiratorySyndrome (SARS) in Hong Kong. Environmental Health Perspectives, 112, 2004.
[122] L. Lampariello and S. Sagratella. Effectively managing diagnostic tests to monitor theCOVID-19 outbreak in Italy, 2020.
[123] S. A. Lauer et al. The Incubation Period of Coronavirus Disease 2019 (COVID-19)From Publicly Reported Confirmed Cases: Estimation and Application. Annals ofinternal medicine, 2020.
[124] R. Lazarus. Automated, High-throughput Surveillance Systems for Public Health. InVitali Sintchenko, editor, Infectious Disease Informatics, chapter 16, pages 323–344.Springer, 2010.
[125] S. Lenhart and J. T. Workman. Optimal control applied to biological models. Chapman& Hall/CRC, 2007.
[126] H. Leung. Why Face Masks Are Encouraged in Asia, but Shunned in the U.S. —Time.
56

[127] D. Li et al. Classification of ecg signals based on 1d convolution neural network. In2017 IEEE 19th International Conference on e-Health Networking, Applications andServices (Healthcom), pages 1–6. IEEE, 2017.
[128] L. Li et al. Characterizing the propagation of situational information in social mediaduring covid-19 epidemic: A case study on weibo. IEEE Transactions on Computa-tional Social Systems, 7(2):556–562, 2020.
[129] R. Li et al. Substantial undocumented infection facilitates the rapid dissemination ofnovel coronavirus (SARS-CoV2). Science (New York, N.Y.), 368(6490):489–493, 2020.
[130] A. Liaw et al. Classification and regression by randomforest. R news, 2(3):18–22,2002.
[131] D. Liberzon. Calculus of Variations and Optimal Control Theory: A Concise Intro-duction. Princeton University Press, 2012.
[132] P. Libin et al. Bayesian best-arm identification for selecting influenza mitigation strate-gies. In Joint European Conference on Machine Learning and Knowledge Discoveryin Databases, pages 456–471. Springer, 2018.
[133] P Libin et al. Bayesian anytime m-top exploration. In 2019 IEEE 31st InternationalConference on Tools with Artificial Intelligence (ICTAI), pages 1422–1428. IEEE,2019.
[134] P. Libin et al. Deep reinforcement learning for large-scale epidemic control. arXivpreprint arXiv:2003.13676, 2020.
[135] J. Lintusaari et al. On the identifiability of transmission dynamic models for infectiousdiseases. Genetics, 202(3):911–918, 2016.
[136] Y. Liu et al. The reproductive number of covid-19 is higher compared to sars coron-avirus. Journal of travel medicine, 2020.
[137] P. Lord et al. From data deluge to data curation. In Proceedings of the UK e-scienceAll Hands meeting, pages 371–375. Citeseer, 2004.
[138] E. Luz et al. Towards an efficient deep learning model for covid-19 patterns detectionin x-ray images. arXiv preprint arXiv:2004.05717, 2020.
[139] E. T. Maddalena, Y. Lian, and C. N. Jones. Data-driven methods for building control-A review and promising future directions. Control Engineering Practice, 95:104211,2020.
[140] J. M. Maestre and R. R. Negenborn. Distributed Model Predictive Control Made Easy,volume 69. Springer, 2014.
[141] P. Mahalle et al. Forecasting models for coronavirus (covid-19): A survey of thestate-of-the-art. TechRxiv, 2020.
57

[142] S. Maharaj and A. Kleczkowski. Controlling epidemic spread by social distancing: doit well or not at all. BMC public health, 12(1):679, 2012.
[143] M. Mandal et al. A model based study on the dynamics of COVID-19: Prediction andcontrol. Chaos, Solitons & Fractals, page 109889, 2020.
[144] O. L. Mangasarian. Sufficient Conditions for the Optimal Control of Nonlinear Sys-tems. SIAM Journal on Control, 4(1):139–152, 1966.
[145] M. Martcheva. An Introduction to Mathematical Epidemiology. Springer Science andBusiness Media LLC, 2015.
[146] T. McKinley, A. R. Cook, and R. Deardon. Inference in epidemic models withoutlikelihoods. International Journal of Biostatistics, 5(1), 2009.
[147] P. Mecenas et al. Effects of temperature and humidity on the spread of COVID-19:A systematic review. medRxiv, page 2020.04.14.20064923, 2020.
[148] I. F. Miller et al. Mapping the Burden of COVID-19 in the United States Ian. medRxiv,2020.
[149] H. B. Mitchell. Data fusion: Concepts and ideas. Springer Berlin Heidelberg, 2012.
[150] V. Mnih et al. Human-level control through deep reinforcement learning. Nature,518(7540):529–533, 2015.
[151] Marcelo Menezes Morato, Saulo Benchimol Bastos, Daniel Oliveira Cajueiro, andJulio Elias Normey-Rico. An Optimal Predictive Control Strategy for COVID-19(SARS-CoV-2) Social Distancing Policies in Brazil. Arxiv preprint, arXiv:2005.10797,may 2020.
[152] R. H. Myers and D. C. Montgomery. A tutorial on generalized linear models. Journalof Quality Technology, 29(3):274–291, 1997.
[153] Nanni et al. Give more data, awareness and control to individual citizens, and theywill help covid-19 containment. arXiv preprint arXiv:2004.05222, 2020.
[154] S. Narasimhan and C. Jordache. Data reconciliation and gross error detection: Anintelligent use of process data. Elsevier, 1999.
[155] R. Narci et al. Inference for partially observed epidemic dynamics guided by Kalmanfiltering techniques. working paper or preprint (hal.archives-ouvertes.fr), 2020.
[156] R. A. Neher et al. Potential impact of seasonal forcing on a SARS-CoV-2 pandemic.Swiss medical weekly, 150:w20224, 2020.
[157] Y. Nesterov. Lectures on convex optimization, volume 137. Springer, second edition,2018.
[158] C. N. Ngonghala et al. Mathematical assessment of the impact of non-pharmaceuticalinterventions on curtailing the 2019 novel Coronavirus. Mathematical Biosciences,325:108364, 2020.
58

[159] H. Nguyen, N. Cressie, and A. Braverman. Spatial Statistical Data Fusion for RemoteSensing Applications. Journal of the American Statistical Association, 107:1004–1018,2012.
[160] M. Nicola et al. Evidence Based Management Guideline for the COVID-19 Pandemic- Review article. International Journal of Surgery, 2020.
[161] H. Nishiura et al. Serial interval of novel coronavirus (COVID-19) infections. Inter-national Journal of Infectious Diseases, 93:284–286, 2020.
[162] C. Nowzari et al. Analysis and Control of Epidemics: A Survey of Spreading Processeson Complex Networks. IEEE Control Systems, 36(1):26–46, 2016.
[163] C. Nowzari et al. Optimal resource allocation for control of networked epidemic models.IEEE Transactions on Control of Network Systems, 4(2):159–169, 2017.
[164] Y. Oh, S. Park, and J. C. Ye. Deep learning covid-19 features on cxr using limitedtraining data sets. arXiv preprint arXiv:2004.05758, 2020.
[165] N. Oliver et al. The covid19 impact survey: Assessing the pulse of the covid-19pandemic in spain via 24 questions. arXiv preprint arXiv:2004.01014, 2020.
[166] N. Oliver et al. Mobile phone data for informing public health actions across thecovid-19 pandemic life cycle, 2020.
[167] N. Oliver et al. Mobile phone data for informing public health actions across theCOVID-19 pandemic life cycle. Science Advances, 0764:eabc0764, 2020.
[168] A. V. Oppenheim and G. C. Verghese. Signals, systems and inference. Pearson, 2015.
[169] J. A. Otter et al. Transmission of sars and mers coronaviruses and influenza virus inhealthcare settings: the possible role of dry surface contamination. Journal of HospitalInfection, 92(3):235–250, 2016.
[170] A. Papoulis and S. U. Pillai. Probability, random variables, and stochastic processes.Mc Graw Hill, fourth edition, 2002.
[171] S. W. Park et al. Reconciling early-outbreak estimates of the basic reproductivenumber and its uncertainty: a new framework and applications to the novel coronavirus(2019-nCoV) outbreak. medRxiv, page 2020.01.30.20019877, 2020.
[172] D. Pavlov, D. Chudova, and P. Smyth. Towards scalable support vector machinesusing squashing. In Proceedings of the sixth ACM SIGKDD international conferenceon Knowledge discovery and data mining, pages 295–299, 2000.
[173] N. C. Peeri et al. The SARS, MERS and novel coronavirus (COVID-19) epidemics, thenewest and biggest global health threats: what lessons have we learned? Internationaljournal of epidemiology, pages 1–10, 2020.
[174] L. Pelusi, A. Passarella, and M. Conti. Opportunistic networking: data forwarding indisconnected mobile ad hoc networks. IEEE communications Magazine, 44(11):134–141, 2006.
59

[175] F. Petropoulos and S. Makridakis. Forecasting the novel coronavirus covid-19. PloSone, 15(3):e0231236, 2020.
[176] S. Portet. A primer on model selection using the Akaike Information Criterion. Infec-tious Disease Modelling, 5:111–128, 2020.
[177] E. B. Postnikov. Estimation of COVID-19 dynamics on a back-of-envelope: Does thesimplest SIR model provide quantitative parameters and predictions? Chaos, Solitonsand Fractals, 135:109841, 2020.
[178] K. A. Prather, C. C. Wang, and R. T. Schooley. Reducing transmission of sars-cov-2.Science, 2020.
[179] V. M. Preciado et al. Optimal vaccine allocation to control epidemic outbreaks inarbitrary networks. In 52nd IEEE Conference on Decision and Control, pages 7486–7491. IEEE, 2013.
[180] K. Prem et al. The effect of control strategies to reduce social mixing on outcomesof the COVID-19 epidemic in Wuhan, China: a modelling study. The Lancet PublicHealth, 2020.
[181] O. Prosper et al. Modeling control strategies for concurrent epidemics of seasonal andpandemic H1N1 influenza. Mathematical Biosciences and Engineering, 8(1):141–170,2011.
[182] M. L. Puterman. Markov decision processes: discrete stochastic dynamic programming.John Wiley & Sons, 2014.
[183] G. Qian and A. Mahdi. Sensitivity analysis methods in the biomedical sciences. Math-ematical Biosciences, 323:108306, 2020.
[184] L. Qin et al. Prediction of number of cases of 2019 novel coronavirus (COVID-19)using social media search index. International Journal of Environmental Researchand Public Health, 17(7):2365, 2020.
[185] J. Qiu et al. A nationwide survey of psychological distress among chinese people inthe covid-19 epidemic: implications and policy recommendations. General psychiatry,33(2), 2020.
[186] A. S. R. S Rao and J. A. Vazquez. Identification of COVID-19 can be quicker throughartificial intelligence framework using a mobile phone-based survey in the populationswhen cities/towns are under quarantine. Infection Control and Hospital Epidemiology,1400:1–18, 2020.
[187] J. B. Rawlings, D. Q Mayne, and M. Diehl. Model predictive control: theory, compu-tation, and design. Nob Hill Publishing Madison, WI, 2017.
[188] D. G Reina, S. L. Toral, P. Johnson, and F. Barrero. A survey on probabilisticbroadcast schemes for wireless ad hoc networks. Ad Hoc Networks, 25:263–292, 2015.
60

[189] S rekha Hanumanthu. Role of Intelligent Computing in COVID-19 Prognosis: AState-of-the-Art Review. Chaos, Solitons & Fractals, page 109947, 2020.
[190] T. Rhodes, K. Lancaster, and M. Rosengarten. A model society: maths, models andexpertise in viral outbreaks. Critical Public Health, 30(3):253–256, 2020.
[191] M. H. Riad et al. Short-term forecast and dual state-parameter estimation for JapaneseEncephalitis transmission using ensemble Kalman filter. In Proceedings of the Ameri-can Control Conference, pages 3444–3449. IEEE, 2019.
[192] M. Ribeiro et al. Short-term forecasting COVID-19 cumulative confirmed cases: Per-spectives for brazil. Chaos, Solitons & Fractals, page 109853, 2020.
[193] F. J. Richards. A flexible growth function for empirical use. Journal of experimentalBotany, 10(2):290–301, 1959.
[194] S. Riley et al. Transmission dynamics of the etiological agent of SARS in Hong Kong:Impact of public health interventions. Science, 300(5627):1961–1966, 2003.
[195] R. M. Rizk-Allah and A. E. Hassanien. COVID-19 forecasting based on an improvedinterior search algorithm and multi-layer feed forward neural network. arXiv preprintarXiv:2004.05960, 2020.
[196] W. C. Roda et al. Why is it difficult to accurately predict the COVID-19 epidemic?Infectious Disease Modelling, 5:271–281, 2020.
[197] K. Roomp and N. Oliver. ACDC-Tracing: Towards anonymous citizen-driven contacttracing. arXiv preprint arXiv:2004.07463, 2020.
[198] K. Roosa et al. Real-time forecasts of the COVID-19 epidemic in China from February5th to February 24th, 2020. Infectious Disease Modelling, 5:256–263, 2020.
[199] R. E. Rowthorn, R. Laxminarayan, and C. A. Gilligan. Optimal control of epidemicsin metapopulations. Journal of the Royal Society Interfac, 6(41):1135–1144, 2009.
[200] S. Russel et al. Artificial intelligence: a modern approach. Pearson Education Limited,2013.
[201] M. Saez et al. Effectiveness of the measures to flatten the epidemic curve of COVID-19.The case of Spain. Science of the Total Environment, 727:138761, 2020.
[202] M. A. Safi, A. B Gumel, and E. H Elbasha. Qualitative analysis of an age-structuredSEIR epidemic model with treatment. Applied Mathematics and Computation, 219,2013.
[203] O. Sagi and L. Rokach. Ensemble learning: A survey. Wiley Interdisciplinary Reviews:Data Mining and Knowledge Discovery, 8(4):1249, 2018.
[204] M. M. Sajadi et al. Temperature and latitude analysis to predict potential spread andseasonality for covid-19. Available at SSRN 3550308, 2020.
61

[205] R. Salgotra, M. Gandomi, and Amir H. Gandomi. Time Series Analysis and Forecastof the COVID-19 Pandemic in India using Genetic Programming. Chaos, Solitons &Fractals, page 109945, 2020.
[206] H. Salje et al. Estimating the burden of sars-cov-2 in france. Science, 2020.
[207] A. Saltelli. Sensitivity analysis for importance assessment. Risk Analysis, 22(3):579–590, 2002.
[208] J. Sanger et al. Trust and big data: A roadmap for research. In Proceedings - In-ternational Workshop on Database and Expert Systems Applications, DEXA, pages278–282, 2014.
[209] T.B. Schon, A. Wills, and B. Ninness. System identification of nonlinear state-spacemodels. Automatica, 47:39–49, 2011.
[210] F. Selley et al. Dynamic control of modern, network-based epidemic models. SIAMJournal on Applied Dynamical Systems, 14(1):168–187, 2015.
[211] S. Gowdra Shanthakumar, Anand S., and A. Ramesh. Understanding the socio-economic disruption in the united states during covid-19’s early days. arXiv preprintarXiv:2004.05451, 2020.
[212] O. Sharomi and T. Malik. Optimal control in epidemiology. Annals of OperationsResearch, 251(1-2):55–71, 2017.
[213] P. Shi et al. Impact of temperature on the dynamics of the covid-19 outbreak in china.Science of The Total Environment, page 138890, 2020.
[214] M. Small and C. K. Tse. Clustering model for transmission of the SARS virus: Appli-cation to epidemic control and risk assessment. Physica A: Statistical Mechanics andits Applications, 351(2-4):499–511, 2005.
[215] J. Snoek, H. Larochelle, and R. P. Adams. Practical bayesian optimization of machinelearning algorithms. In Advances in neural information processing systems, pages2951–2959, 2012.
[216] R. Sparks. Challenges in designing a disease surveillance plan: What we have andwhat we need? IIE Transactions on Healthcare Systems Engineering, 3(3):181–192,2013.
[217] H. Stark and J. W. Woods. Probability and Random Processes: With applications tosignal processing. Prentice-Hall, third edition, 2002.
[218] R. S. Sutton and A. G. Barto. Reinforcement learning: An introduction. MIT press,2018.
[219] Anuradha T. and Neeraj G. Prediction for the spread of covid-19 in india and ef-fectiveness of preventive measures. Science of The Total Environment, 728:138762,2020.
62

[220] R. Tibshirani. Regression shrinkage and selection via the lasso. Journal of the RoyalStatistical Society: Series B (Methodological), 58(1):267–288, 1996.
[221] D. S. W. Ting et al. Digital technology and covid-19. Nature Medicine, 26(4):459–461,2020.
[222] O. Torrealba-Rodriguez, R.A. Conde-Gutierrez, and A.L. Hernandez-Javier. Modelingand prediction of COVID-19 in Mexico applying mathematical and computationalmodels. Chaos, Solitons & Fractals, page 109946, 2020.
[223] P. Trebua et al. The importance of normalization and standardization in the process ofclustering. In SAMI 2014 - IEEE 12th International Symposium on Applied MachineIntelligence and Informatics, Proceedings, pages 381–385. IEEE Computer Society,2014.
[224] S. Unkel et al. Statistical methods for the prospective detection of infectious diseaseoutbreaks: A review. Journal of the Royal Statistical Society. Series A: Statistics inSociety, 175(1):49–82, 2012.
[225] J. Van den Broeck and L. T. Fadnes. In Epidemiology: Principles and PracticalGuidelines, pages 389–399. Springer Netherlands, 2013.
[226] W. Van Den Broeck et al. The GLEaMviz computational tool, a publicly availablesoftware to explore realistic epidemic spreading scenarios at the global scale. BMCInfectious Diseases, 11(37), 2011.
[227] T. Vega et al. Influenza surveillance in Europe: Establishing epidemic thresholds bythe Moving Epidemic Method. Influenza and other Respiratory Viruses, 7(4):546–558,2013.
[228] T. Vega et al. Influenza surveillance in Europe: Comparing intensity levels calculatedusing the moving epidemic method. Influenza and other Respiratory Viruses, 9(5):234–246, 2015.
[229] E. Vittinghoff et al. Regression Methods in Biostatistics. Linear, Logistic, Survival,and Repeated Measures Models. Springer, 2012.
[230] P. Waikhom, R. Jain, and S. Tegar. Sensitivity and stability analysis of a delayedstochastic epidemic model with temperature gradients. Modeling Earth Systems andEnvironment, 2(1):49, 2016.
[231] C. J. Wang et al. Response to COVID-19 in Taiwan: Big Data Analytics, NewTechnology, and Proactive Testing, 2020.
[232] J. Wang et al. High temperature and high humidity reduce the transmission of covid-19. Available at SSRN 3551767, 2020.
[233] Y. Wang et al. Unique epidemiological and clinical features of the emerging 2019 novelcoronavirus pneumonia (COVID-19) implicate special control measures. Journal ofmedical virology, 92(6):568–576, 2020.
63

[234] M. S. Warren and S. W. Skillman. Mobility changes in response to covid-19. arXivpreprint arXiv:2003.14228, 2020.
[235] C. J. Watkins and P. Dayan. Q-learning. Machine learning, 8(3-4):279–292, 1992.
[236] P. Whittle. The Outcome of a Stochastic Epidemic–A Note on Bailey’s Paper.Biometrika, 42(1-2):116–122, 1955.
[237] S. Wierzchon and M. K lopotek. Modern Algorithms of Cluster Analysis, volume 34.Springer, 2018.
[238] A. K. Winter and S. T. Hegde. The important role of serology for covid-19 control.The Lancet. Infectious Diseases, 2020.
[239] World Health Organization. Considerations in adjusting public health and social mea-sures in the context of COVID-19: interim guidance, 16 April 2020. Technical report,World Health Organization, 2020.
[240] World Health Organization (WHO). Considerations in the investigation of cases andclusters of COVID-19. Technical Report 2nd April, World Health Organization, 2020.
[241] J.T. Wu et al. Estimating clinical severity of COVID-19 from the transmission dy-namics in Wuhan, China. Nature Medicine Letters, 26:506–510, 2020.
[242] J.T. Wu, K. Leung, and G.M. Leung. Nowcasting and forecasting the potential domes-tic and international spread of the 2019-nCoV outbreak originating in Wuhan, China:a modelling study. The Lancet, 395(10225):689–697, 2020.
[243] K. Wu et al. Generalized logistic growth modeling of the COVID-19 outbreak in 29provinces in china and in the rest of the world. arXiv preprint arXiv:2003.05681, 2020.
[244] Y. Xiao and M. E. Torok. Taking the right measures to control COVID-19. The LancetInfectious Diseases, 20(5):523–524, 2020.
[245] L. Xue-Zhi, G. Gupur, and Z. Guang-Tian. Threshold and Stability Results for an Age-Structured SEIR Epidemic Model. Computers and Mathematics with Applications,42:883–907, 2001.
[246] R. Yaesoubi and T. Cohen. Identifying dynamic tuberculosis case-finding policies forhiv/tb coepidemics. Proceedings of the National Academy of Sciences, 110(23):9457–9462, 2013.
[247] R. Yaesoubi and T. Cohen. Identifying cost-effective dynamic policies to control epi-demics. Statistics in medicine, 35(28):5189–5209, 2016.
[248] A. Yanez, C. Hayes, and F. Glavin. Towards the control of epidemic spread: Designingreinforcement learning environments. Master’s thesis, University of Central Florida,2019.
[249] Z. Yang et al. Modified SEIR and AI prediction of the epidemics trend of COVID-19 inChina under public health interventions. Journal of Thoracic Disease, 12(3):165–174,2020.
64

[250] A. Yousefpour, H. Jahanshahi, and S. Bekiros. Optimal policies for control of thenovel coronavirus (COVID-19). Chaos, Solitons & Fractals, page 109883, 2020.
[251] M. Youssef and C. Scoglio. Mitigation of epidemics in contact networks throughoptimal contact adaptation. Mathematical Biosciences and Engineering, 10(4):1227–1251, 2013.
[252] W. Yu and ohters. Effects of temperature and humidity on the daily new cases and newdeaths of covid-19 in 166 countries. Science of The Total Environment, 729:139051,2020.
[253] G. Zaman, Y. H. Kang, and H. Jung. Stability analysis and optimal vaccination of anSIR epidemic model. BioSystems, 93:240–249, 2008.
[254] G. S. Zaric and M. L. Brandeau. Dynamic resource allocation for epidemic control inmultiple populations. IMA Journal of Mathematics Applied in Medicine and Biology,19(4):235–255, 2002.
[255] D. Zeng et al. Infectious disease informatics and biosurveillance. Springer, 2010.
[256] X. Zhang, R. Ma, and L. Wang. Predicting turning point, duration and attack rateof COVID-19 outbreaks in major Western countries. Chaos, Solitons & Fractals,135:109829, 2020.
[257] S. Zhao et al. Preliminary estimation of the basic reproduction number of novelcoronavirus (2019-nCoV) in China, from 2019 to 2020: A data-driven analysis in theearly phase of the outbreak. International Journal of Infectious Diseases, 92:214–217,2020.
[258] N. Zheng et al. Predicting covid-19 in china using hybrid AI model. IEEE Transactionson Cybernetics, 2020.
[259] C. Zhou et al. COVID-19: Challenges to GIS with Big Data. Geography and Sustain-ability, 2020.
[260] F. Zhou et al. Clinical course and risk factors for mortality of adult inpatientswith COVID-19 in Wuhan, China: a retrospective cohort study. The Lancet,395(10229):1054–1062, 2020.
[261] Y. Zhu et al. Association between short-term exposure to air pollution and COVID-19infection: Evidence from China. Science of the total environment, 727:138704, 2020.
65