Embed Size (px)
Citation preview
UNIVERSITÉ DE MONTRÉAL
CONTROL AND OPTIMIZATION OF SEALING LAYER IN FILMS
ZAHRA NAJARZADEH
DÉPARTEMENT DE GÉNIE CHIMIQUE
ÉCOLE POLYTECHNIQUE DE MONTRÉAL
THÈSE PRÉSENTÉE EN VUE DE L’OBTENTION
DU DIPLÔME DE PHILOSOPHIAE DOCTOR
(GÉNIE CHIMIQUE)
AVRIL 2014
© Zahra Najarzadeh, 2014.
UNIVERSITÉ DE MONTRÉAL
ÉCOLE POLYTECHNIQUE DE MONTRÉAL
Cette thèse intitulée:
CONTROL AND OPTIMIZATION OF SEALING LAYER IN FILMS
présentée par : NAJARZADEH Zahra
en vue de l’obtention du diplôme de : Philosophiae Doctor
a été dûment acceptée par le jury d’examen constitué de :
M. CARREAU Pierre, Ph.D., président
M. AJJI Abdellah Ph.D., membre et directeur de recherche
M. TABATABAEI Hesam, Ph.D., membre
M. BATES Philip John Ph.D., membre

iii
DEDICATION
“To my beloved family”

iv
ACKNOWLEDGEMENTS
First of all, I would like to express my deep and sincere gratitude to my supervisor, Prof. Abdellah
Ajji for supporting and challenging me. His wide knowledge and hard work has always been a great
motivation for me. I appreciate his patience, encouragements, advice, and guidance as well as all the
productive discussions we had.
I am grateful to Prof. Seyyed Hesammoddin Tabatabaei for his support, advices, sharing his industrial
and scientific experience, and his comments on the experimental work and papers.
This work would have not been possible without Prolamina and Saputo companies, who provided the
financial support throughout the project. I appreciate sharing their up to date industrial experience and
knowledge. Especial thanks to Prolamina facility in Terrebonne for allowing me to use some of their
equipment during my Ph.D. study.
A special word of thanks is owed to our brilliant and helpful research associate in 3S Pack chair
group Ms. Claire Cerclé. I would also like to thank her for translating a part of this thesis to French.
My gratitude to the staff and technicians of Ecole Polytechnique Montreal, chemical engineering
department especially Ms. Mélina Hamdine, Ms. Weawkamol Leelapornpisit, and Mr. Guillaume
Lessard.
One of the most valuable experiences that I had was the opportunity to work as a part of the great
3SPack research team. The cooperative atmosphere and sharing the results and ideas improved this
work. I am especially grateful to my fellow student, Ramin Yousefzadeh, Richard Silverwood.
I would like to thank Jean-Baptiste Bruchet for conducting some experiments for the third paper of
this work during summer and autumn of 2013.
My sincere thanks to my friends in École Polytechnique of Montreal who their help, discussions, and
encouragements were very valuable.
I would also like to thank my family and my husband, Mohammad, who believed in me more than I
believed in myself, whose constant support and encouragement gave me the strength to get through
many difficulties.
v
RÉSUMÉ
Le scellage à chaud est un procédé qui permet de sceller hermétiquement un emballage en
appliquant de la chaleur et de la pression sur deux films de polymère pendant un temps spécifique
(temps de scellage). Le scellage à chaud est utilisé dans le domaine de l’emballage pour une vaste
gamme d’applications, et en particulier dans le domaine de l’emballage alimentaire. Depuis les
vingt dernières années, les équipements de scellage à chaud fonctionnent sur les lignes de
production, à très hautes vitesses, ce qui requiert des conditions de procédé et d’optimisation des
matériaux. Les paramètres du scellage à chaud, tels que la température, le temps de scellage, la
pression ainsi que les caractéristiques du matériau du film tels que le poids moléculaire, la
distribution en poids moléculaire et la présence de petites et de longues ramifications de chaînes
sont des facteurs clés pour contrôler la qualité finale de la zone scellée.
Dans la première partie de cette étude, les relations existantes entre les paramètres du procédé de
scellage à chaud et la résistance de l’interface ainsi que les mécanismes ont été étudiés. Au cours
du procédé de scellage, les effets de la température, de la pression et du temps de scellage sur la
force de scellage du LLDPE sont très importants. Ils ont été illustrés par une carte 3D ‘temps-
température’ et ‘pression-température’, une méthode qui est facilement applicable à d’autres
systèmes. Les mécanismes d’adhésion des polymères semi-cristallins étant mal connus, nous
avons donc étudié le comportement en adhésion du LLDPE, un polymère semi-cristallin. Les
résultats montrent que la dépendance ‘temps-température’ de la force d’adhésion est une
conséquence de la disponibilité d’une certaine fraction de la phase amorphe du polymère à
l’interface du film. La force d’adhésion suit une corrélation linéaire avec la racine carrée du
temps de scellage ce qui est également confirmé par les modèles de soudure. La pente de cette
corrélation linéaire augmente avec la température.
Par la suite, ce travail met en concurrence les deux principales approches d’analyse du
comportement des chaînes du polymère : le point de vue microscopique basé sur la théorie de
reptation, et le point de vue macroscopique basé sur une analyse des propriétés du polymère dans
son volume. Les mécanismes de rupture et les deux surfaces pelées ont également été analysés
après pelage. De plus, la topographie et la morphologie des surfaces pelées, qui ont été scellées
auparavant avec différentes conditions de scellage ont été étudiées à l’aide des techniques d’AFM
et SEM. Dans le cas d’une rupture des liens, la propagation la rupture génère de nombreuses
vi
fibrilles très orientées dans le sens de la rupture sur la surface du pelage. Les fibrilles étaient
visibles en AFM et au SEM sur les surfaces pelées qui avaient été scellées à basses températures.
Pour les spécimens scellés à plus hautes températures, la morphologie fibrillaire se développe en
fibrilles plus épaisses et plus larges. Ce comportement est une conséquence d’un meilleur
mouillage et interdiffusion des chaînes à hautes températures.
Les paramètres de rugosité ont été comparés et agissent comme représentants du degré
d’interdiffusion des molécules et d’aire de contact de la surface du film. Augmenter la
température de scellage résulte en une surface plus rugueuse ce qui témoigne d’une meilleure
diffusion moléculaire.
Dans la deuxième partie de ce travail, le rôle de l’architecture moléculaire du polymère sur l’auto
adhésion interfaciale à des températures supérieures à la température de fusion (appelé hot tack) a
été étudié. Le poids moléculaire (Mw), la distribution en poids moléculaire (MWD), le nombre et
la distribution de longues ramifications (LCB) et de courtes ramifications (SCB) le long des
chaînes de polyéthylène sont autant de paramètres moléculaires étudiés. Cette analyse révèle une
corrélation linéaire positive entre la force d’adhésion et le poids moléculaire pour des
polyéthylènes métallocènes. De plus, la même corrélation est observée pour la viscosité
élongationnelle transitoire ce qui met l’emphase sur le rôle de la force en fondue dans l’obtention
d’une bonne force d’adhésion. Cependant l’augmentation de la présence de longues chaînes de
ramification ainsi que l’augmentation de leur nombre réduisent la force d’adhésion. Les
copolymères métallocènes catalysés éthylène α-oléfine ont généré une force d’adhésion
supérieure à celle des polyéthylènes conventionnels et ceci est expliqué par une composition des
chaînes plus homogènes pour les premiers. Enfin, il a été déterminé que la force interfaciale
d’auto-adhésion était le premier facteur influençant l’interdiffusion des chaînes à travers la
surface et, ensuite, la force en fondue du polymère.
Finalement, dans la dernière partie de ce travail, les mélanges de polyéthylènes avec des
architectures de chaînes différentes ont été étudiés. La force d’adhésion et la dépendance à la
température pour des mélanges binaires de polyéthylènes métallocènes catalysés éthylène α-
oléfine et de polyéthylène conventionnels, de différentes compositions, ont été analysées. Il a été
observé que le niveau d’amélioration de la force d’adhésion dépend fortement de l’architecture
moléculaire et des longues ramifications de chaînes. Les polymères étudiés exhibent un plateau
vii
aux hautes forces d’adhésion pour une certaine plage de température. Ce plateau est appelé
‘fenêtre de température au plateau’ (plateau temperature window). Notre étude a montré que la
largeur de ce plateau est corrélée avec l’aire sous la courbe ‘contrainte-élongation’ obtenue grâce
aux expériences de rhéologie. Il est donc suggéré qu’une plus grande ténacité du matériau en
fondue résulte en un plateau de force d’adhésion plus large.
viii
ABSTRACT
Heat sealing is the process to achieve the hermetic closure of a package by applying heat and
pressure on two polymer films for a specified dwell time. The heat sealing process has been used
in packaging of a wide spectrum of products, in particular for food packaging. During the past
two decades, heat sealing machinery has been developed for very high speed line production
which requires very precise process condition and material optimization. Heat seal process
conditions, including temperature, dwell time, and pressure as well as film characteristics such as
molecular weight, molecular weight distribution, long and short chain branching are the key
factors that control the final quality of the joint.
In the first part of this study, we have investigated the interrelated influence of heat seal process
parameters on the strengthening of the interface as well as the micro mechanisms involved. The
effects of heat seal temperature, pressure, and dwell time on seal strength of LLDPE were
illustrated in “time-temperature” and “pressure-temperature” 3D maps, a methodology that is
easily applicable to other systems. The interfacial adhesion of semicrystalline polymers was not
well understood. We thus studied the adhesion behaviour of LLDPE as a semicrystalline
polymer. The results indicated that the time and temperature dependence of seal strength is a
consequence of the fraction of amorphous phase available at the interface of films. The seal
strength had a linear correlation with the square root of sealing time which was also supported by
the welding models. The slope of this linear correlation increased with temperature.
This work was followed concurrently by two main approaches: analysis of polymer chain
behaviour from microscopic point of view based on reptation theory and conventional
macroscopic analysis based on bulk properties of the polymer. Failure mechanisms and fractured
surfaces were also analyzed after peeling. Moreover, the topography and morphology of peeled
surfaces, which were sealed at different heat seal conditions, were investigated by AFM and
SEM. In the debonding failure mode, the crack propagation caused numerous highly oriented
fractured craze fibrils on the peeled surfaces. The fractured fibrils were visible in AFM and SEM
peeled surfaces of samples sealed at low temperatures. In specimens sealed at higher temperature
the fibrillar morphology developed into thicker and larger fibrils. This behaviour was a result of
better wetting and interdiffusion by increasing temperature.

ix
We also utilized the comparative roughness parameters as representatives of the level of film
surfaces’ contact area and molecular interdiffusion. Increasing the seal temperature resulted in
rougher surfaces which indicated the improved diffusion.
In the second part of this work, we investigated the role of molecular architecture of the seal
polymer in interfacial self-adhesion at temperatures higher than melting point i.e. hot tack. The
analyzed molecular structures include molecular weight (Mw), molecular weight distribution
(MWD), amount and distribution of long chain branch (LCB) and short chain branch (SCB)
distribution among and along polyethylene chains. Our analysis revealed a positive linear
correlation between seal strength and molecular weight for linear metallocene polyethylene.
Furthermore, the same relation was observed for elongational transient viscosity emphasizing the
role of melt strength in adhesion strength. However, the presence of long chain branching and
increasing the long chain branch content reduced the adhesion strength. We explained the
superior adhesion strength of metallocene catalyzed ethylene α-olefin copolymers compared to
conventional polyethylene resins based on the homogenous composition distribution of their
chains. Finally, we argued that the interfacial self-adhesion strength was primarily the outcome of
chain interdiffusion across the interface and then the melt strength of the polymer.
In the last part of this work, we focused on the blends of polyethylene resins with different chain
architectures. The dependency of adhesion strength on temperature for binary blends of
metallocene catalyzed ethylene α-olefins and conventional polyethylene resins were analyzed for
a range of different compositions. We found that the level of improvement in adhesion strength
depended on the molecular architecture and long chain branching. The polymer shows a plateau
of its highest adhesion strength for a range of temperature, called plateau temperature window.
Our findings indicated that the plateau broadness was correlated with the area under stress-strain
curve of extensional rheological measurements. We thus suggested that the higher melt toughness
can result in a broader plateau of adhesion strength.
x
TABLE OF CONTENTS
DEDICATION .............................................................................................................................. III
ACKNOWLEDGEMENTS .......................................................................................................... IV
RÉSUMÉ ........................................................................................................................................ V
ABSTRACT ............................................................................................................................... VIII
TABLE OF CONTENTS ............................................................................................................... X
LIST OF TABLES ..................................................................................................................... XIV
LIST OF APPENDIXES ............................................................................................................. XV
LIST OF SYMBOLS AND ABBREVIATIONS....................................................................... XVI
CHAPTER 1 .................................................................................................................................... 1
INTRODUCTION ........................................................................................................................... 1
CHAPTER 2 .................................................................................................................................... 4
LITERATURE REVIEW ................................................................................................................ 4
2.1 Heat seal process .............................................................................................................. 4
2.1.1 Heat seal properties ...................................................................................................... 6
2.1.2 Heat seal process parameters ...................................................................................... 11
2.1.3 The effect of process parameters on heat seal properties ........................................... 13
2.1.4 Lamination ................................................................................................................. 18
2.1.5 Seal layer material ...................................................................................................... 18
2.2 Adhesion between polymers at their interfaces .............................................................. 22
2.2.1 Wetting ....................................................................................................................... 24
2.2.2 Interdiffusion at polymer interfaces ........................................................................... 25
2.2.3 Polymer adhesion between amorphous polymers ...................................................... 27
2.2.4 Self-adhesion of semicrystalline polymers ................................................................ 29
xi
2.3 Originality of the work ................................................................................................... 32
2.4 Objectives of the current study ....................................................................................... 33
CHAPTER 3 .................................................................................................................................. 34
ORGANIZATION OF ARTICLES .............................................................................................. 34
CHAPTER 4 .................................................................................................................................. 35
ARTICLE 1: A NOVEL APPROACH TOWARD THE EFFECT OF SEAL PROCESS
PARAMETERS ON FINAL SEAL STRENGTH AND MICROSTRUCTURE OF LLDPE ..... 35
4.1 Abstract .......................................................................................................................... 35
4.2 Introduction .................................................................................................................... 36
4.3 Materials and methods ................................................................................................... 40
4.3.1 Film production .......................................................................................................... 40
4.3.2 Differential scanning calorimetry (DSC) ................................................................... 40
4.3.3 Heat seal measurements ............................................................................................. 40
4.3.4 Atomic force microscopy (AFM) ............................................................................... 40
4.3.5 Scanning electron microscopy (SEM) ........................................................................ 41
4.4 Results and Discussion ................................................................................................... 41
4.4.1 Effect of Heat seal process parameters ...................................................................... 41
4.4.2 Amorphous fraction .................................................................................................... 44
4.4.3 Time dependence of seal strength .............................................................................. 46
4.4.4 Failure mode analysis ................................................................................................. 49
4.4.5 Topographic and morphological analysis by AFM and SEM .................................... 50
4.5 Conclusions .................................................................................................................... 55
4.6 Acknowledgement .......................................................................................................... 55
4.7 References ...................................................................................................................... 56
CHAPTER 5 .................................................................................................................................. 59
xii
ARTICLE 2: ROLE OF MOLECULAR ARCHITECTURE IN INTERFACIAL SELF-
ADHESION OF POLYETHYLENE FILMS ............................................................................... 59
5.1 Abstract .......................................................................................................................... 59
5.2 Introduction .................................................................................................................... 60
5.3 Experiments .................................................................................................................... 61
5.3.1 Materials and films preparation .................................................................................. 61
5.3.2 Differential scanning calorimetry (DSC) ................................................................... 62
5.3.3 Nuclear magnetic resonance spectroscopy (NMR) .................................................... 63
5.3.4 Gel permeation chromatography (GPC) .................................................................... 63
5.3.5 Interfacial self-adhesion measurements ..................................................................... 63
5.3.6 Extensional rheology .................................................................................................. 64
5.4 Results and discussion .................................................................................................... 64
5.4.1 Material characterization ............................................................................................ 64
5.4.2 Effect of molecular weight on self-adhesion strength ................................................ 70
5.4.3 Effect of long chain branching on self-adhesion strength .......................................... 74
5.4.4 Effect of heterogeneity and homogeneity of molecule structure on self-adhesion
strength ................................................................................................................................... 79
5.5 Conclusions .................................................................................................................... 84
5.6 Acknowledgement .......................................................................................................... 84
5.7 References ...................................................................................................................... 84
CHAPTER 6 .................................................................................................................................. 89
ARTICLE 3: INTERFACIAL SELF-ADHESION OF POLYETHYLENE BLENDS: THE ROLE
OF LONG CHAIN BRANCHING AND EXTENSIONAL RHEOLOGY .................................. 89
6.1 Abstract .......................................................................................................................... 89
6.2 Introduction .................................................................................................................... 90
xiii
6.3 Experiments .................................................................................................................... 92
6.3.1 Materials and films preparation .................................................................................. 92
6.3.2 Differential scanning calorimetry (DSC) ................................................................... 93
6.3.3 Extensional rheology .................................................................................................. 93
6.3.4 Interfacial self-adhesion measurements ..................................................................... 93
6.4 Results and discussion .................................................................................................... 94
6.4.1 Differential scanning calorimetry (DSC) ................................................................... 94
6.4.2 Transient extensional rheology .................................................................................. 97
6.4.3 Interfacial self-adhesion strength ............................................................................... 99
6.4.4 Temperature dependence of interfacial self-adhesion strength ................................ 101
6.5 Conclusions .................................................................................................................. 107
6.6 Acknowledgement ........................................................................................................ 108
6.7 References .................................................................................................................... 108
CHAPTER 7 ................................................................................................................................ 112
GENERAL DISCUSSION .......................................................................................................... 112
CHAPTER 8 ................................................................................................................................ 116
CONCLUSIONS AND RECOMMENDATIONS...................................................................... 116
8.1 Conclusions .................................................................................................................. 116
8.2 Original contributions .................................................................................................. 118
8.3 Recommendations ........................................................................................................ 119
BIBLIOGRAPHIE ...................................................................................................................... 120
APPENDIX A ............................................................................................................................. 127
xiv
LIST OF TABLES
Table 5-1 Main characteristics of polyethylene resins ................................................................... 62
Table 5-2 NMR spectrum peaks and peak assignments observed for an ethylene-1-hexene
copolymer ............................................................................................................................... 67
Table 5-3 Mole % comonomer and number of SCBs per 1000 carbon atom of PE resins ............ 68
Table 5-4 Crystallinity properties of films ..................................................................................... 69
Table 5-5 LCB contents of long chain branch resins obtained from GPC ..................................... 75
Table 6-1 Main characteristics of the resins ................................................................................... 93
Table 6-2 Relaxation time and De number of neat resins ............................................................ 105
Table 6-3 Melt toughness obtained from area under σ-ε curve in extensional flow at =10 s-1
.. 106
xv
LIST OF APPENDIXES
ARTICLE 4: SEALABILITY AND SEAL CHARACTERISTICS OF PE/EVA AND PLA/PCL
BLENDS ..................................................................................................................................... 127
1. Abstract ............................................................................................................................ 127
2. Introduction ...................................................................................................................... 128
3. Materials and Methods ..................................................................................................... 129
4. Results and discussion for PE/EVA system ..................................................................... 131
4.1. Differential Scanning Calorimetry (DSC) results .................................................... 131
4.2. Sealability results ..................................................................................................... 132
4.3. Blend morphology .................................................................................................... 137
5. Results and discussion for PLA/PCL system ................................................................... 139
5.1. Viscoelastic Behaviour and Blends Morphology ..................................................... 139
5.2. Blend Morphology ................................................................................................... 140
5.3. Thermal analysis results ........................................................................................... 141
5.4. Sealability results ..................................................................................................... 142
6. Conclusion ........................................................................................................................ 144
7. References: ....................................................................................................................... 145
xvi
LIST OF SYMBOLS AND ABBREVIATIONS
AFM Atomic force microscopy
BOPP Biaxially oriented polypropylene
CCD Comonomer composition distribution
De Deborah number
DSC Differential scanning calorimetry
Dself Self diffusion coefficient
EVA Ethylene vinyl acetate copolymer
fa Amorphous fraction
FDA Food and Drug Administration
GPC Gel permeation chromatography
H Microscopic property at interface
h Film thickness (μ)
HDPE High density polyethylene
HFFS Horizontal form fill seal
LCB Long chain branch
LDPE Low density polyethylene
LD Low density polyethylene
LLDPE Linear low density polyethylene
LL Linear low density polyethylene
LVE Linear viscoelastic behaviour
m-PE Metallocene catalyzed polyethylene
Mc Critical entanglement molecular weight
MFI Melt flow index (g/10min)

xvii
Mw Weight average molecular weight (kg/mol)
MWD Molecular weight distribution
N Number of points within the AFM image
NMR Nuclear magnetic resonance
PBS Polybutylene succinate
PCL Polycaprolactone
PDI Polydispersity index
PE Polyethylene
PE-g-MA Polyethylene grafted maleic anhydride
PET Polyethylene terephthalate
PHA Polyhydroxyalkonoate
PLA Polylactic acid
PVA Polyvinylalcohol
PVOH Polyvinylalcohol
Ra Arithmetic average of the absolute values of the surface height deviations (nm)
Rg Radius of gyration (nm)
RMS Root mean square average of height deviations (nm)
S Interface strength
SBR Styrene-butadiene rubber
SCB Short chain branch
SER Sentmanat extensional rheometer
SEM Scanning electron microscopy
SSp Plateau seal strength (g/25.4mm)
t Time (s)
xviii
Tc Crystallization temperature (°C)
TESP Tapping etched silicon probe
Tg Glass transition temperature (°C)
Tmf Final melting point (°C)
Tpi Plateau initiation temperature (°C)
Tpf final plateau temperature (°C)
Tsi Seal initiation temperature (°C)
wt Weight fraction
v Peel rate (mm.s-1
)
VFFS Vertical form fill seal
Xc Degree of crystallinity
Z Height from mean plane of the AFM image (nm)
Zn Ziegler-Natta catalyst
Greek letters
Strain rate (s-1)
τ Saturation time (s), reptation time (s)
Transient elongational viscosity (Pa.s)
Complex viscosity (Pa.s)
ΔHS Heat of fusion (J.g-1
)
ΔHU Heat of fusion for a theoretically 100% crystalline polyethylene (J.g-1
)
ΔHT cumulative heat of fusion (J.g-1
)
μ Micron
Strain rate (s-1)
ω angular frequency (rad/s)
1
CHAPTER 1
INTRODUCTION
The flexible packaging industry grows every year to replace other kinds of containers in food
industry because of cost benefits and environmental advantages such as landfill occupation space.
The majority of pouches are made of multilayer polymer films and are sealed mostly by a heating
method. The final package integrity ultimately depends on the seal quality. The seal protects the
product from environmental influences and provides a barrier against oxygen to prevent spoilage
of product and thus increases shelf life.
The seal layer is the last layer of a multilayer film which is in contact with the product inside the
package. Generally, the seal layer is attached to the barrier layer by an adhesive or tie layer. The
most common method of sealing is heat sealing. Heat sealing is one of the major processes of
flexible packaging. Heat sealing is bonding two polymer surfaces by applying heat and pressure
for a certain period of time. In heat sealing, the surfaces are forced into intimate contact while
they are in at least a partially molten state. Many factors determine the quality of a heat seal.
They can be classified as heat seal process parameters or film properties.
The process parameters influencing the seal are energy (often temperature), pressure, dwell time,
and the machine design. Distinct levels of energy are required for different materials, thicknesses,
package types, and processing steps. Dwell time is the time during which heat and pressure is
applied. It should be easily adjustable to fractions of a second because of the economic concerns
oblige the modern packaging lines to run as fast as possible. Likewise, the pressure between the
jaws should be easily adjustable and uniform through the dimensions of seal area. These factors
may vary for different materials.
The film properties are thickness, material characteristics, and post treatment of the film (e.g.
corona treatment, printing). Material characteristics such as density, crystallinity, molecular
weight, molecular orientations, polarity, and additives in the resin change the film properties and
affect the sealing conditions and performances.
All of these factors tend to interact in a complex way. For example, the amount of heat available
may be limited by the capacity of the heater elements, by the rate of heat transfer from the sealing
bar and its coating, by the type of product being packaged, or by the amount of energy
2
consumption in order to maintain the jaw’s temperature. Increasing the dwell time would permit
increasing the heat available at seal layer surface, but this is not economically beneficial because
fewer packages will be produced per minute and the production line speed will reduce.
At the microscopic scale, a variety of molecular mechanisms are engaged in heat sealing such as
melting, wetting, inter-diffusion, and re-crystallization. During heat sealing, adhesion is
developed between two surfaces. As a fast self-adhesion process, heat sealing has seldom been
studied from a fundamental perspective. One reason is that it has to be performed in a very short
dwell time far less than the time required for most welding and adhesion processes. Furthermore,
the architecture of polymer chains plays a significant role on all micro-mechanisms involved in
sealing. Moreover, there is a vast possibility of choices of materials to be used as seal layer. This
makes it difficult to find an optimal combination of two or more polymers in blends to obtain a
high quality product.
Research in this area has been inadequate and limited to the companies that produce materials
and design seal layer for superior performance. Therefore, lack of fundamental studies in
academic research labs led to limited information in open literature.
The main objective of this work is to understand how the process and material parameters affect
the final seal quality. To achieve this goal, the first part of this thesis is dedicated to provide a
clear understanding about the influence of seal process parameters on final seal quality. Then,
several types of polyethylene resins were analyzed by performing systematic experiments to
obtain a comprehensive knowledge about the role of molecular architecture of the polymer on
heat seal performance. Finally, the role of blending a conventional polyethylene with metallocene
catalyzed ethylene α-olefins copolymer was investigated. The correlation of rheological
properties and heat seal performance of the resins was also studied.
This dissertation is based on three articles that have been accepted or submitted to scientific
journals and consists of the following sections:
Chapter 2 provides a broad literature review considering the related issues and followed
by the originality and main objectives of this dissertation.
The summary and organization of the articles are described in Chapter 3.
3
The main achievements of the thesis are given in the format of three scientific papers in
Chapters 4, 5 and 6.
Chapter 7 presents a general discussion of the main results.
Finally, Chapter 8 presents the final conclusions of this work and the recommendations
for future works.
During this project and in collaboration with other members of 3SPack, we had the
opportunity to compare the heat seal properties of blends of biodegradable polymers with the
blends of polyolefin based copolymers. The result of this sub project has been published in
International Polymer Processing (IPP), available in Appendix A.

4
CHAPTER 2
LITERATURE REVIEW
2.1 Heat seal process
Heat sealing is bonding two polymer surfaces while applying heat and pressure for a certain
period of time. In heat sealing the surfaces are forced into intimate contact while they are in at
least a partially molten state (Theller, 1989). There are several methods of heat sealing. The main
differences between the common types of seal methods are in how they supply the energy and/or
pressure to the sealant in the seal area.
In impulse-sealing, heat is supplied by sending an electrical impulse into a resistant wire or
ribbon. In dielectric sealing which is specified for polar sealants, energy is provided by an
alternating electrical field which heats up polar sealants. In laser sealing energy is provided by
laser radiation and the sealing area absorbs heat from the laser light. In ultrasonic sealing energy
is provided by friction of the sealants due to ultrasonic vibrations. Cold sealing is when the seal is
achieved without heat and only by adding mechanical pressure. It is the alternative for heat
sensitive products (Selke et al., 2004). Conductance sealers, also named as conductive sealer or
heated bar sealer, are the most common type of heat sealers in commercial usages. This system
typically consist of two metal jaws, one or both of which are electrically heated. (See Figure 2-1)
Two films are brought into intimate contact by heated jaws and thus are bonded. The bar sealing
is the subject of this study which uses the least expensive equipment compared to others, and it is
the most preferred technique.
Figure 2-1 Schematics of heated bar sealing of two films
5
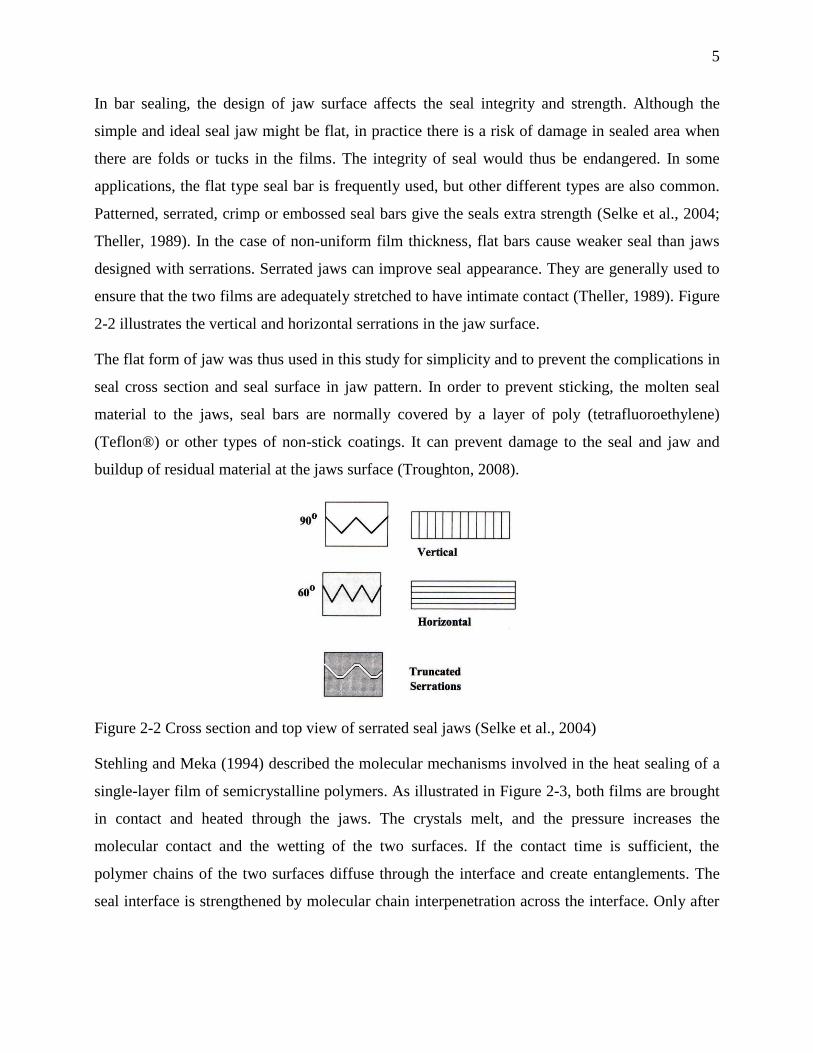
In bar sealing, the design of jaw surface affects the seal integrity and strength. Although the
simple and ideal seal jaw might be flat, in practice there is a risk of damage in sealed area when
there are folds or tucks in the films. The integrity of seal would thus be endangered. In some
applications, the flat type seal bar is frequently used, but other different types are also common.
Patterned, serrated, crimp or embossed seal bars give the seals extra strength (Selke et al., 2004;
Theller, 1989). In the case of non-uniform film thickness, flat bars cause weaker seal than jaws
designed with serrations. Serrated jaws can improve seal appearance. They are generally used to
ensure that the two films are adequately stretched to have intimate contact (Theller, 1989). Figure
2-2 illustrates the vertical and horizontal serrations in the jaw surface.
The flat form of jaw was thus used in this study for simplicity and to prevent the complications in
seal cross section and seal surface in jaw pattern. In order to prevent sticking, the molten seal
material to the jaws, seal bars are normally covered by a layer of poly (tetrafluoroethylene)
(Teflon®) or other types of non-stick coatings. It can prevent damage to the seal and jaw and
buildup of residual material at the jaws surface (Troughton, 2008).
Figure 2-2 Cross section and top view of serrated seal jaws (Selke et al., 2004)
Stehling and Meka (1994) described the molecular mechanisms involved in the heat sealing of a
single-layer film of semicrystalline polymers. As illustrated in Figure 2-3, both films are brought
in contact and heated through the jaws. The crystals melt, and the pressure increases the
molecular contact and the wetting of the two surfaces. If the contact time is sufficient, the
polymer chains of the two surfaces diffuse through the interface and create entanglements. The
seal interface is strengthened by molecular chain interpenetration across the interface. Only after
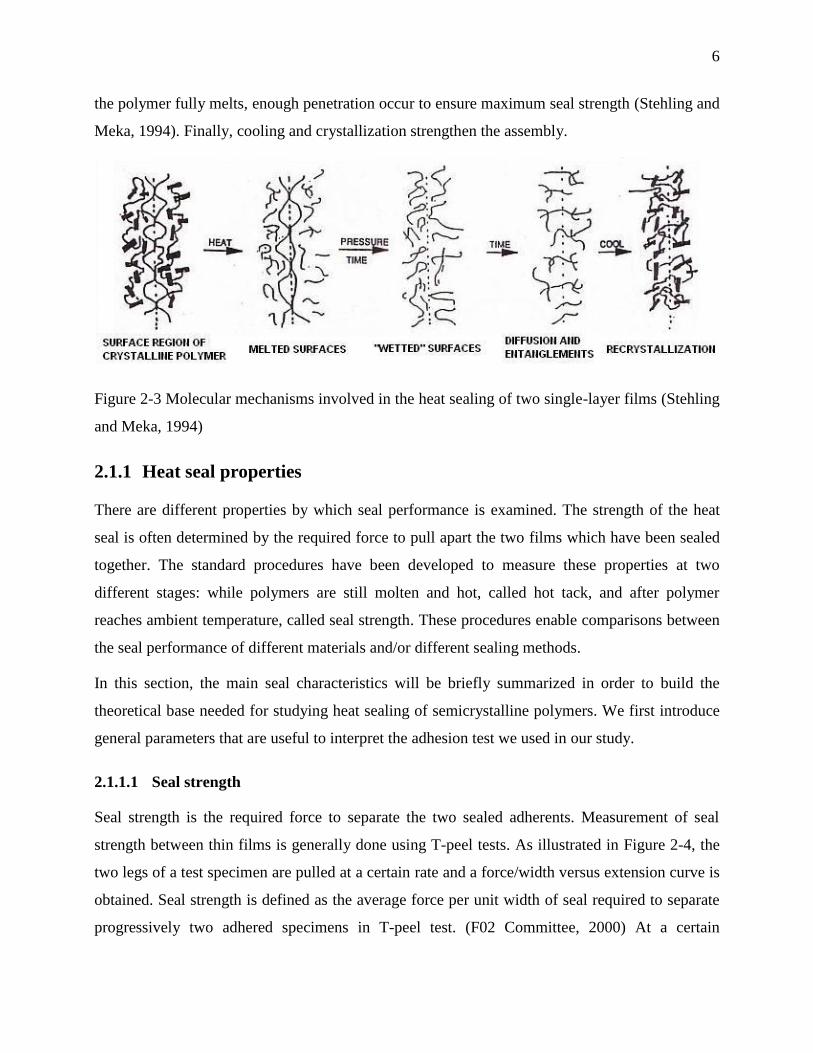
6
the polymer fully melts, enough penetration occur to ensure maximum seal strength (Stehling and
Meka, 1994). Finally, cooling and crystallization strengthen the assembly.
Figure 2-3 Molecular mechanisms involved in the heat sealing of two single-layer films (Stehling
and Meka, 1994)
2.1.1 Heat seal properties
There are different properties by which seal performance is examined. The strength of the heat
seal is often determined by the required force to pull apart the two films which have been sealed
together. The standard procedures have been developed to measure these properties at two
different stages: while polymers are still molten and hot, called hot tack, and after polymer
reaches ambient temperature, called seal strength. These procedures enable comparisons between
the seal performance of different materials and/or different sealing methods.
In this section, the main seal characteristics will be briefly summarized in order to build the
theoretical base needed for studying heat sealing of semicrystalline polymers. We first introduce
general parameters that are useful to interpret the adhesion test we used in our study.
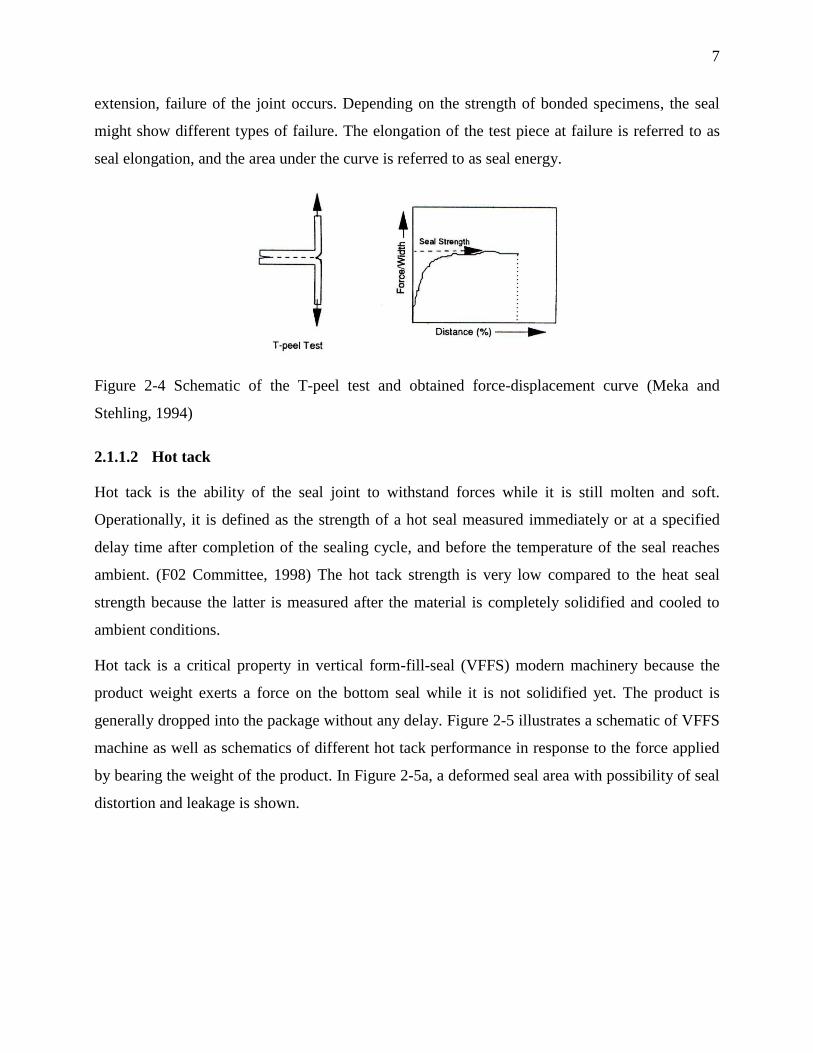
2.1.1.1 Seal strength
Seal strength is the required force to separate the two sealed adherents. Measurement of seal
strength between thin films is generally done using T-peel tests. As illustrated in Figure 2-4, the
two legs of a test specimen are pulled at a certain rate and a force/width versus extension curve is
obtained. Seal strength is defined as the average force per unit width of seal required to separate
progressively two adhered specimens in T-peel test. (F02 Committee, 2000) At a certain
7
extension, failure of the joint occurs. Depending on the strength of bonded specimens, the seal
might show different types of failure. The elongation of the test piece at failure is referred to as
seal elongation, and the area under the curve is referred to as seal energy.
Figure 2-4 Schematic of the T-peel test and obtained force-displacement curve (Meka and
Stehling, 1994)
2.1.1.2 Hot tack
Hot tack is the ability of the seal joint to withstand forces while it is still molten and soft.
Operationally, it is defined as the strength of a hot seal measured immediately or at a specified
delay time after completion of the sealing cycle, and before the temperature of the seal reaches
ambient. (F02 Committee, 1998) The hot tack strength is very low compared to the heat seal
strength because the latter is measured after the material is completely solidified and cooled to
ambient conditions.
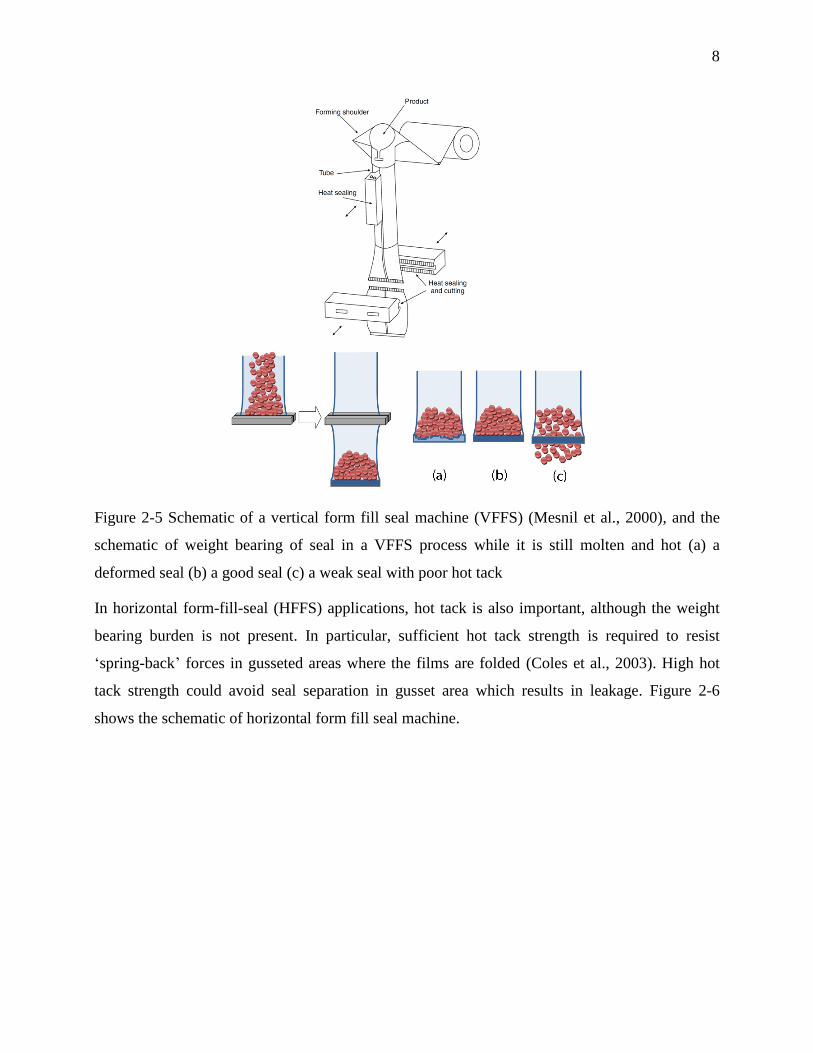
Hot tack is a critical property in vertical form-fill-seal (VFFS) modern machinery because the
product weight exerts a force on the bottom seal while it is not solidified yet. The product is
generally dropped into the package without any delay. Figure 2-5 illustrates a schematic of VFFS
machine as well as schematics of different hot tack performance in response to the force applied
by bearing the weight of the product. In Figure 2-5a, a deformed seal area with possibility of seal
distortion and leakage is shown.
8
Figure 2-5 Schematic of a vertical form fill seal machine (VFFS) (Mesnil et al., 2000), and the
schematic of weight bearing of seal in a VFFS process while it is still molten and hot (a) a
deformed seal (b) a good seal (c) a weak seal with poor hot tack
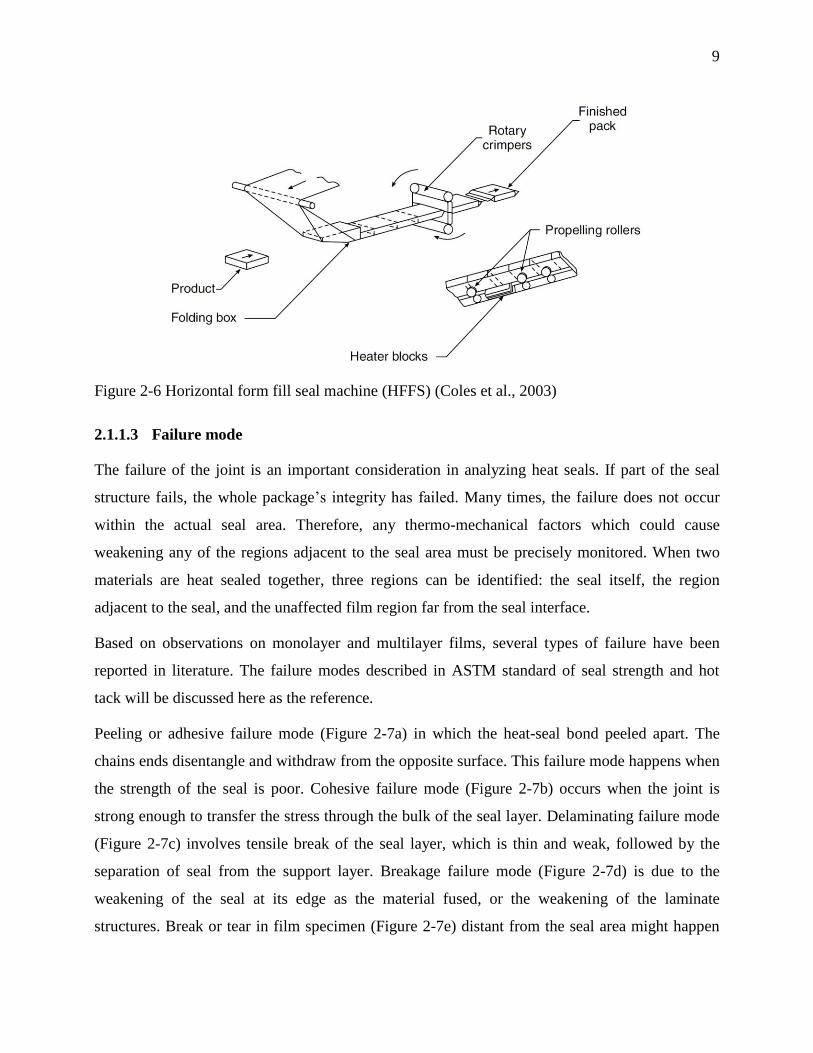
In horizontal form-fill-seal (HFFS) applications, hot tack is also important, although the weight
bearing burden is not present. In particular, sufficient hot tack strength is required to resist
‘spring-back’ forces in gusseted areas where the films are folded (Coles et al., 2003). High hot
tack strength could avoid seal separation in gusset area which results in leakage. Figure 2-6
shows the schematic of horizontal form fill seal machine.
9
Figure 2-6 Horizontal form fill seal machine (HFFS) (Coles et al., 2003)
2.1.1.3 Failure mode
The failure of the joint is an important consideration in analyzing heat seals. If part of the seal
structure fails, the whole package’s integrity has failed. Many times, the failure does not occur
within the actual seal area. Therefore, any thermo-mechanical factors which could cause
weakening any of the regions adjacent to the seal area must be precisely monitored. When two
materials are heat sealed together, three regions can be identified: the seal itself, the region
adjacent to the seal, and the unaffected film region far from the seal interface.
Based on observations on monolayer and multilayer films, several types of failure have been
reported in literature. The failure modes described in ASTM standard of seal strength and hot
tack will be discussed here as the reference.
Peeling or adhesive failure mode (Figure 2-7a) in which the heat-seal bond peeled apart. The
chains ends disentangle and withdraw from the opposite surface. This failure mode happens when
the strength of the seal is poor. Cohesive failure mode (Figure 2-7b) occurs when the joint is
strong enough to transfer the stress through the bulk of the seal layer. Delaminating failure mode
(Figure 2-7c) involves tensile break of the seal layer, which is thin and weak, followed by the
separation of seal from the support layer. Breakage failure mode (Figure 2-7d) is due to the
weakening of the seal at its edge as the material fused, or the weakening of the laminate
structures. Break or tear in film specimen (Figure 2-7e) distant from the seal area might happen
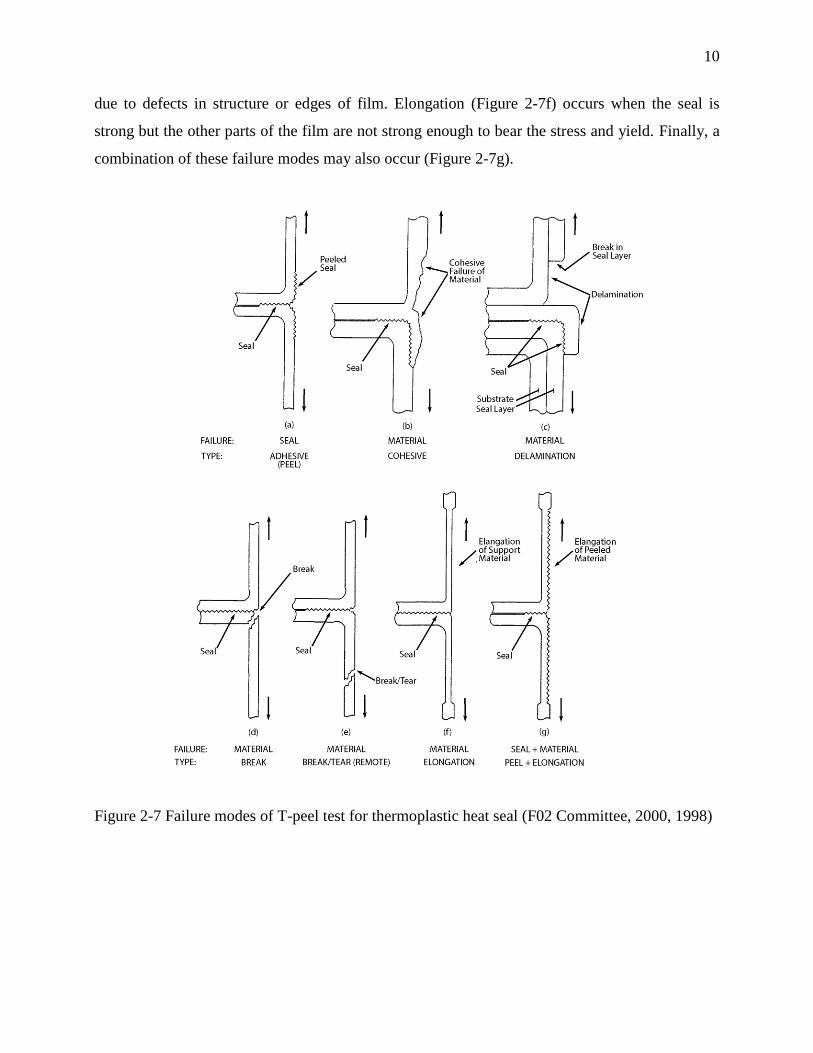
10
due to defects in structure or edges of film. Elongation (Figure 2-7f) occurs when the seal is
strong but the other parts of the film are not strong enough to bear the stress and yield. Finally, a
combination of these failure modes may also occur (Figure 2-7g).
Figure 2-7 Failure modes of T-peel test for thermoplastic heat seal (F02 Committee, 2000, 1998)
11
2.1.2 Heat seal process parameters
Heat seal process parameters are the conditions of heat sealing. Temperature, dwell time, and
pressure are recognized as the most important seal process variables (Gardon, 1963a, 1963b;
Stokes, 1989). The adjustment of these three parameters controls the final seal properties.
2.1.2.1 Seal bar temperature
The strength of a heat seal is primarily determined by the maximum temperature achieved at the
interface during heat sealing. For every semicrystalline polymer, the seal strength as a function of
temperature was shown to behave similar to the curve presented in Figure 2-8. Ideally the
temperature at the interface of the films should be considered as the controlling factor. However,
measuring the value of temperature at the interface is practically challenging, and the required
equipment for that is often unavailable and expensive. Therefore, the seal curve is commonly
plotted as a function of bar temperature.
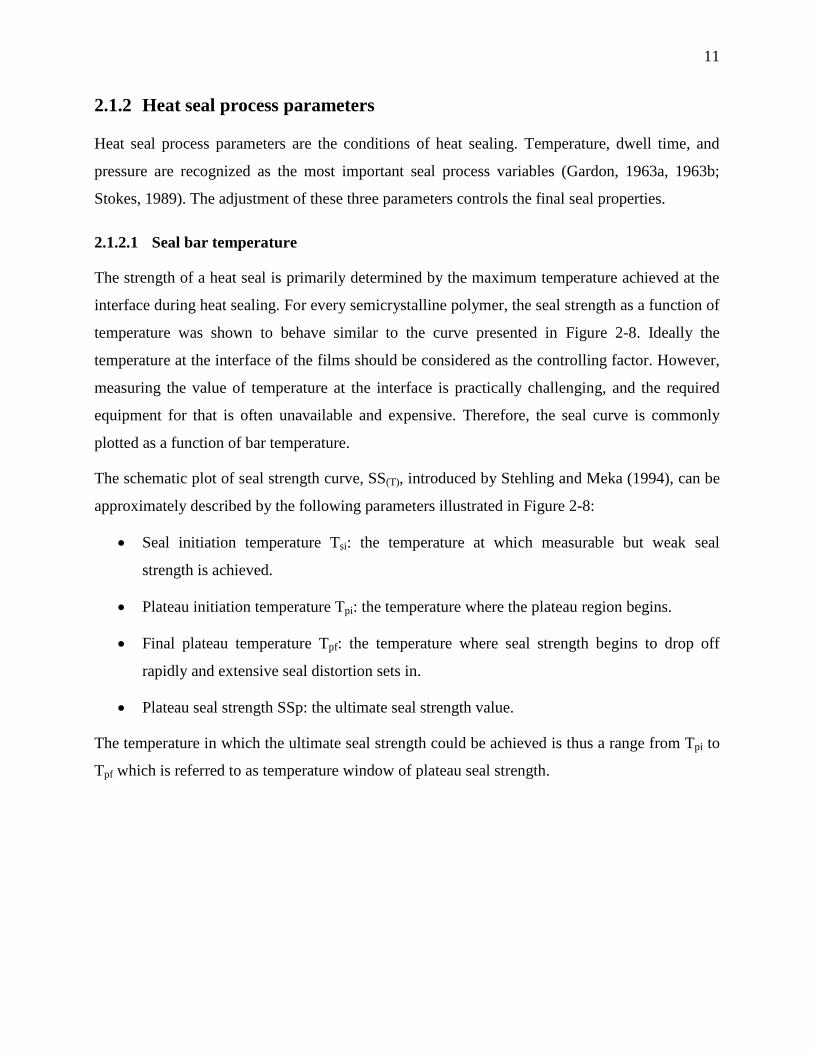
The schematic plot of seal strength curve, SS(T), introduced by Stehling and Meka (1994), can be
approximately described by the following parameters illustrated in Figure 2-8:
Seal initiation temperature Tsi: the temperature at which measurable but weak seal
strength is achieved.
Plateau initiation temperature Tpi: the temperature where the plateau region begins.
Final plateau temperature Tpf: the temperature where seal strength begins to drop off
rapidly and extensive seal distortion sets in.
Plateau seal strength SSp: the ultimate seal strength value.
The temperature in which the ultimate seal strength could be achieved is thus a range from Tpi to
Tpf which is referred to as temperature window of plateau seal strength.
12
Figure 2-8 Schematic of general heat sealing curve, SS(T), seal strength as a function of sealing
temperature for semicrystalline polymers (Stehling and Meka, 1994)
2.1.2.2 Dwell time
Dwell time is the period of time that the two films are brought into intimate contact by the heated
bars. The heated bars are in direct contact with films so heat could be transferred to the interface.
The greater the heat flow rate, the shorter the dwell time required. Thus, the heat flow rate
determines the dwell time of the process. Generally, the dwell time in modern flexible packaging
industry is of the order of fractions of a second, or in some cases 1-2 seconds. The optimum
dwell time ensures no excessive time is wasted, to keep up the production speed.
2.1.2.3 Pressure
Pressure is required to ensure the film surfaces are in intimate contact for interfacial penetration
to occur. Excessive pressure, however, may result in the squeeze-out of the molten film from the
seal area. For most heat seal materials, pressure is less important than either temperature or dwell
time (Hassan, 2007; Stehling and Meka, 1994). Furthermore, in industrial production lines,
higher pressure may be required if the pressure control is not precise, the film thickness is non-
uniform, or the heated bars are poorly aligned (Selke et al., 2004).
13
2.1.3 The effect of process parameters on heat seal properties
Theller (1989), the pioneer in heat sealing variable investigations, examined the seal strength of
LDPE film with serrated jaws. He showed that at 379°K, LDPE required 280 ms to reach a seal
strength of 0.53 kN/m and at 383°K required 150ms. Regarding pressure, from 1 to 600psi he
reported no effect of pressure on the seal strength of LDPE. Meka and Stehling (1994) applied a
finite element (FE) model based on conduction heat transfer to predict the interfacial temperature
of the seal as a function of dwell time. The results of the model were verified by a micro-
thermocouple. The heat of fusion, conductivity, and film-thickness changes occurring during
sealing were not considered in this model. Therefore, their model was not valid for temperatures
above the final melting point of thermoplastics. Meka and Stehling (1994) also reported that the
heat seal strength is primarily controlled by sealing temperature and dwell time, rather than
pressure.
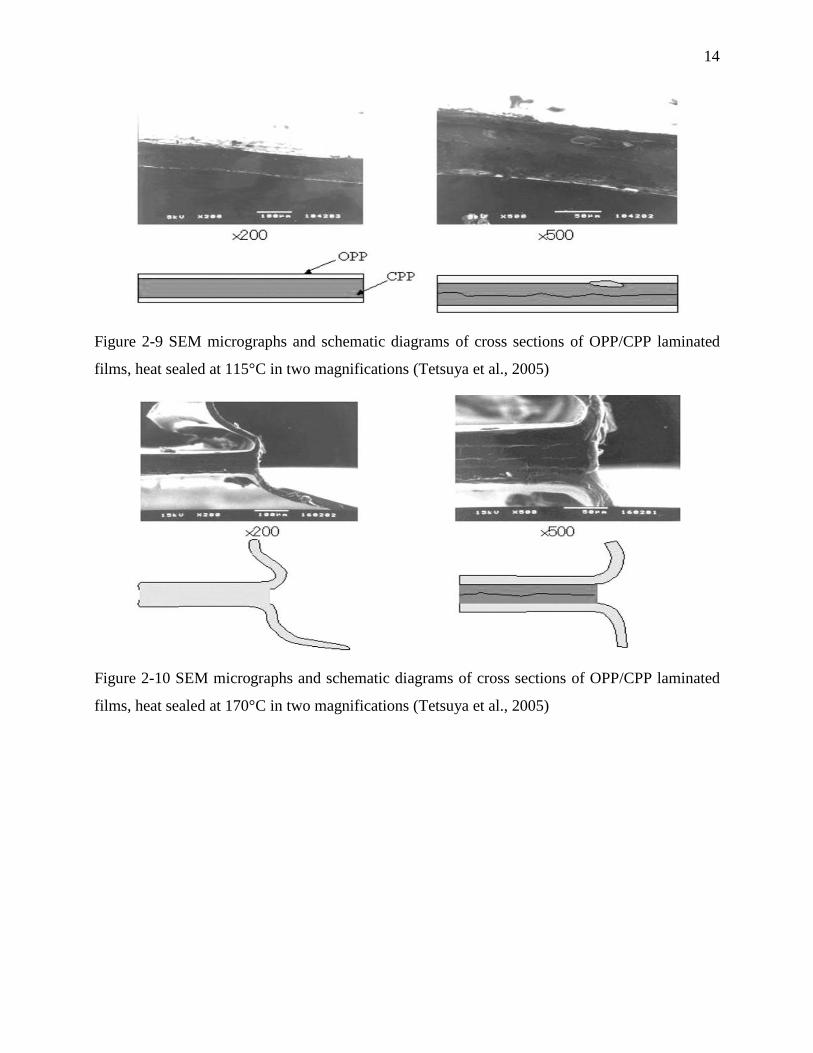
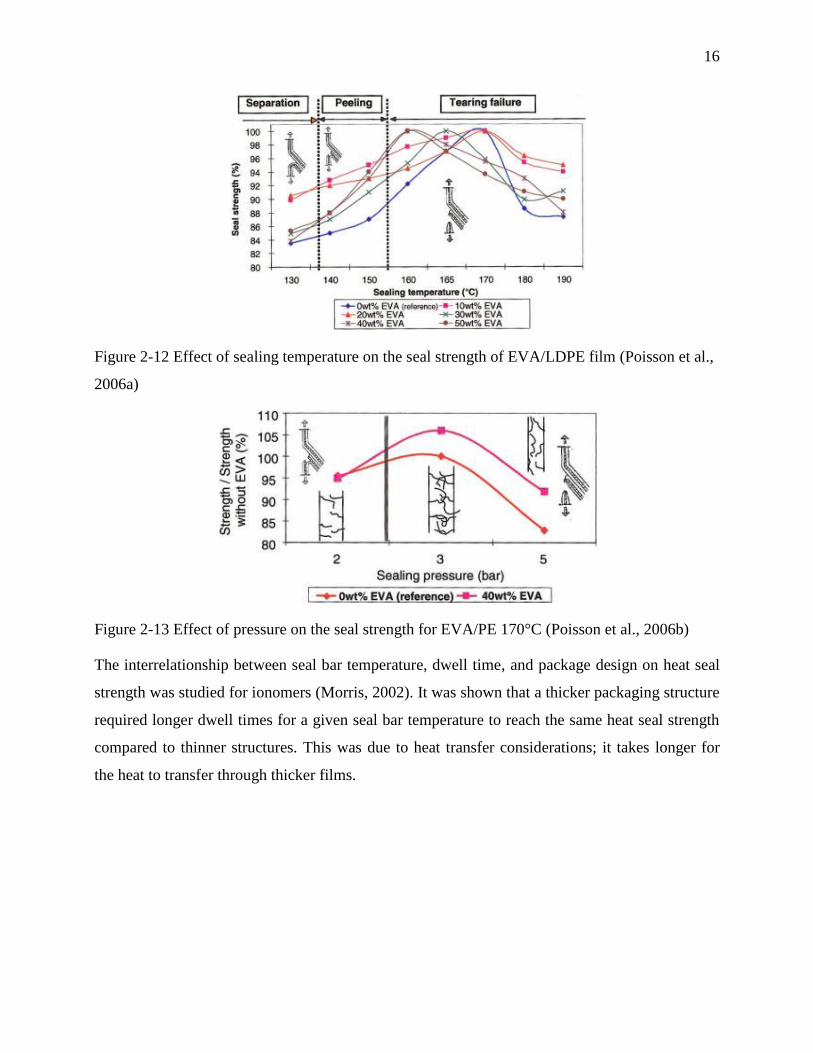
Tetsuya et al. (2005) studied oriented polypropylene (OPP)/cast polypropylene (CPP) laminate
films. They reported that the tensile strength of the seal was affected by the orientation of the
films. The SEM images from seal cross section revealed that the seal was not well formed at
lower temperatures, while the laminates were totally fused together at high temperatures. In
Figure 2-9, the interface of the CPP layers clearly indicated that the heat seal was not well
formed. In Figure 2-10 the boundary is not clear and this essentially implies more complete heat
sealing. At 170°C, melting and interdiffusion of polymer chains across the interface resulted in
the formation of a good heat seal. This resulted in higher peel strength. In
Figure 2-11 the boundaries between the CPP-CPP heat seal in OPP/CPP laminated films are no
longer distinguishable. The temperature of 250°C is much higher than the melting temperature of
both OPP and CPP films, so both films melted during heat sealing.
14
Figure 2-9 SEM micrographs and schematic diagrams of cross sections of OPP/CPP laminated
films, heat sealed at 115°C in two magnifications (Tetsuya et al., 2005)
Figure 2-10 SEM micrographs and schematic diagrams of cross sections of OPP/CPP laminated
films, heat sealed at 170°C in two magnifications (Tetsuya et al., 2005)

15
Figure 2-11 SEM micrographs and schematic diagrams of cross sections of OPP/CPP laminated
films, heat sealed at 250˚C in two magnifications (Tetsuya et al., 2005)
In another study Tetsuya et al., 2006 carried out investigations on the failure criteria of the
OPP/CPP heat seals made by impulse heat sealing. They reported that heat seals were stronger at
temperatures low enough not to destroy the level of crystalline orientation in OPP as support
layer. The possibility of breakage in the heat seal edges because of the existence of the so-called
weak spots and also the deformation of seal area was also emphasised (Hashimoto et al., 2006;
Tetsuya et al., 2006).
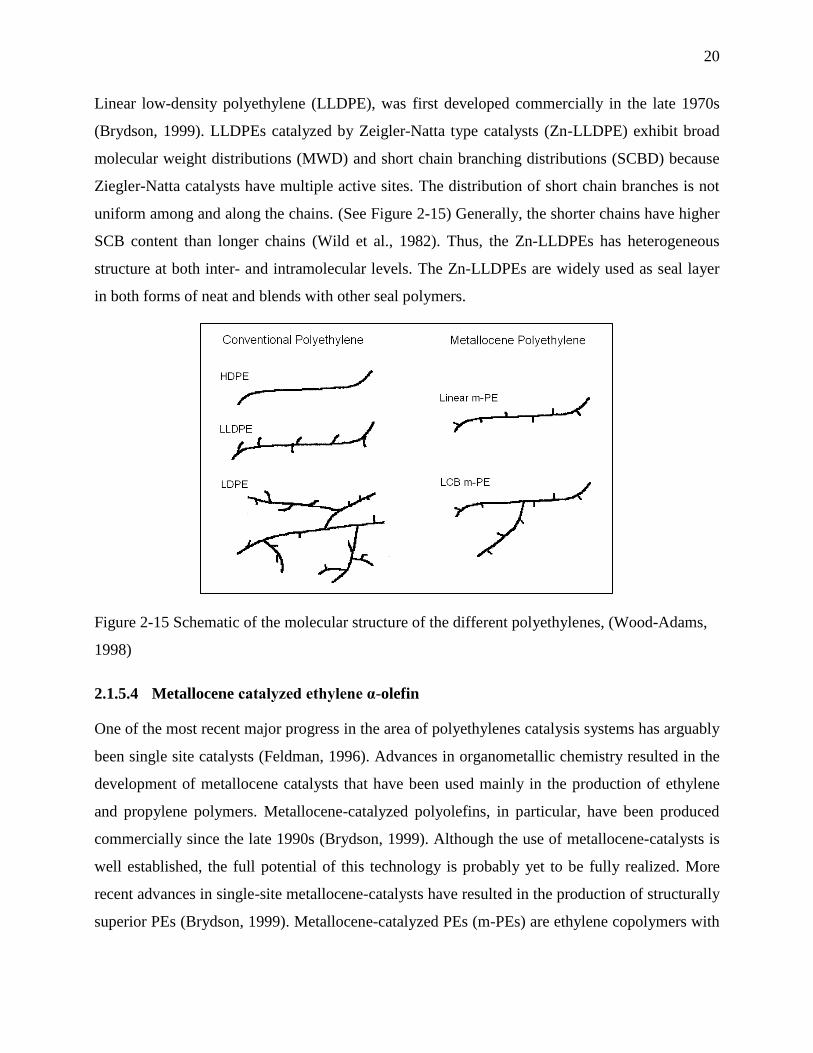
Poisson et al. (2006) reported that blending ethylene vinyl acetate (EVA) to LDPE in the seal
layer positively influence sealability. A decrease in melting temperature, reduction in
crystallinity, and finer crystalline structure in EVA/LDPE shifted the seal initiation temperature
to lower temperatures. (See Figure 2-12) Enhancement in seal strength was observed because of
strong intermolecular forces appearing between the C=O polar groups of EVA. This mechanism
is reinforced by the migration of the EVA to the surface of the seal layers (Poisson et al., 2006a,
2006b). The seal strength of EVA/LDPE as a function of pressure was also studied. As illustrated
in Figure 2-13, by increasing pressure, the seal strength increases and then decreases. In spite of
the minor effect of pressure mentioned in other studies, pressure might be influential in seal
strength performance.
16
Figure 2-12 Effect of sealing temperature on the seal strength of EVA/LDPE film (Poisson et al.,
2006a)
Figure 2-13 Effect of pressure on the seal strength for EVA/PE 170°C (Poisson et al., 2006b)
The interrelationship between seal bar temperature, dwell time, and package design on heat seal
strength was studied for ionomers (Morris, 2002). It was shown that a thicker packaging structure
required longer dwell times for a given seal bar temperature to reach the same heat seal strength
compared to thinner structures. This was due to heat transfer considerations; it takes longer for
the heat to transfer through thicker films.

17
Figure 2-14 Interfacial temperature as a function of dwell time as calculated by the finite
elements model under different platen temperatures
Meka and Stehling, (1994) used heat transfer finite elements model to obtain the temperature at
interface and they showed that the interface temperature will reach to the jaw temperature after
0.3-0.5 s. They measured seal strength of several polyethylene resins based on the interface
temperature which is not practically possible to measure in an industrial process. They concluded
that the seal strength is strongly dependent to interface temperature (Stehling and Meka, 1994). In
an industrial process however, the heat sealing occurs at a non-isothermal condition and
temperature setting is based on the control temperature on the heated jaws.
Mueller et al., (1998) studied the time dependence of welding two films at long contact times of 1
- 1000 s and showed the linear dependence of peel strength to the square root of contact time. The
contact time they had applied however was much longer than the short contact times usually used
in heat sealing.
There have been several studies on the influence of heat seal variables on sealability. However, to
our knowledge there has been no comprehensive study in open literature on the interactive effects
of these variables, trends of their influences and the micro-mechanism involved in the process.

18
2.1.4 Lamination
Generally, the seal layer is a part of a multilayer film for which every layer provides a certain
advantage to the whole structure. In heat sealing, these other layers protect the seal layer from
sticking to the jaws and deformation, because direct contact to the jaws weakens the seal
properties. Furthermore, a strong bond between seal layer and other layers is necessary for high
hot tack and seal strength. Excluding the multilayer films produced in coextrusion, the
combinations of two or more polymer films is known as lamination. Sometimes, a metal foil or
paper web may also be used as substrates. There are several methods of lamination which can be
categorized into two main types of extrusion and adhesive lamination. Hot-melt lamination and
extrusion lamination are processes that apply a heated adhesive or thermoplastic to the substrates,
and joining them as it cools down.
In adhesive lamination, adhesives are used to hold the films together into a single structure. There
are several methods of adhesive lamination. Depending on the type of the adhesive, they can be
solvent-based, water-based, or solvent less. Generally, it is required to modify the film surface in
order to generate radicals and active groups through corona or plasma treatments. Reaction
between the materials and the adhesive is necessary for strong lamination. The complete wetting
of the surface to create flawless laminates is important, especially for non-polar materials such as
polyolefins (Selke et al., 2004).
2.1.5 Seal layer material
A wide range of materials has been used as a seal layer for flexible packaging applications, either
in laboratory or industrial scale. Polyolefins including polyethylene and polypropylene families,
ionomers, ethylene vinyl acetate copolymers, biodegradable resins such as poly(lactic acid) and
polycaprolactone (PCL), are the most utilized resins for seal layer applications (Hanlon et al.,
1998; Wagner, 2009) In spite of many efforts carried out by raw material producers, no existing
polymer is able to combine all the properties required by some challenging industrial packaging
applications. Therefore, melt blending has been an alternative.
For the purpose of this study, a number of polyethylene resins have been used. Therefore, in this
work we will focus on this group of polymers and describe variety of molecular architectures as
well as their heat seal properties.

19
2.1.5.1 Low Density Polyethylene (LDPE)
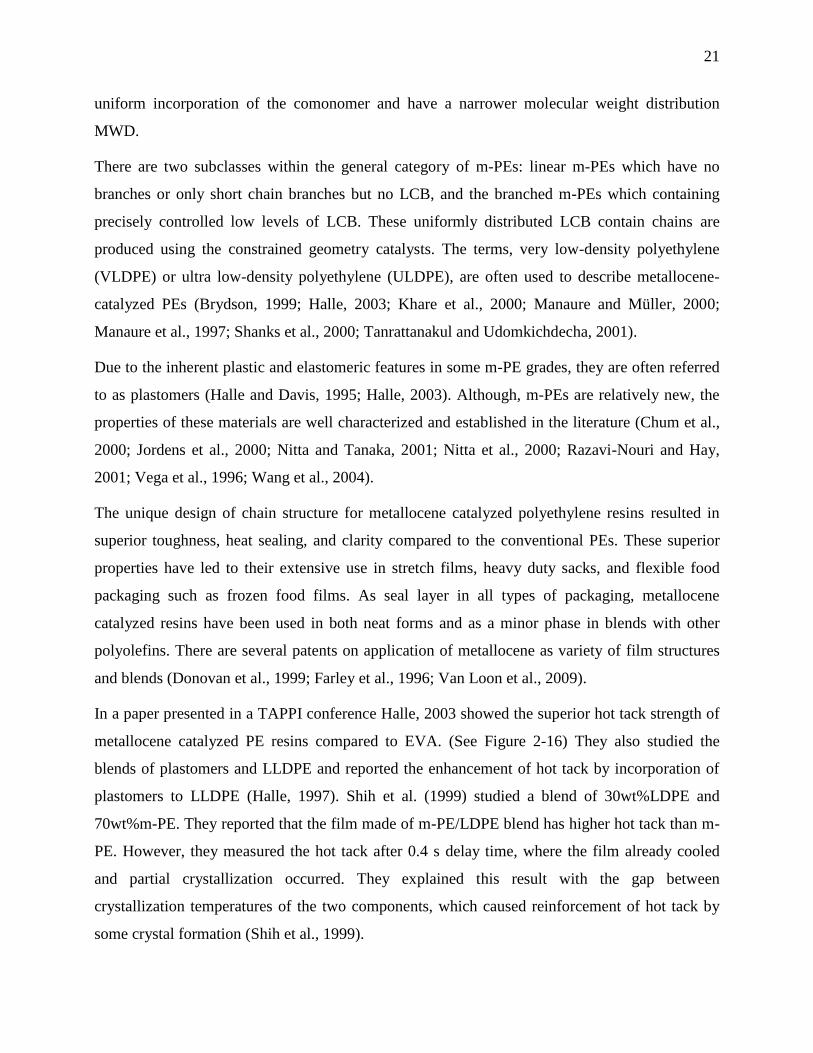
Low-density polyethylene, LDPE was one of the first commercially produced polyolefins in the
early 1940s by the free radical polymerization of ethylene using a high temperature and high
pressure process (Brydson, 1999). The product of this polymerization is a broad MWD
polyethylene with chains containing branches of many different lengths distributed non-
uniformly throughout the chain backbone. (See Figure 2-15) The main advantage of LDPE is its
high melt strength and good processability, especially in film production processes, e.g. film
blowing and casting.
However, there are some disadvantages for LDPE in seal layer which makes it impractical for
some applications. For instance, it can be difficult to open the package because of the way the
film stretches without tearing (Hanlon et al., 1998). Because of the high elongation of LDPE,
when opening a seal of a LDPE/PET laminated structure, the PET layer may break first. High
crystallinity, and thus high Tsi, is not desirable for many application and equipments (Selke et al.,
2004). Therefore LDPE is used mostly in the form of blends with LLDPE, metallocene catalyzed
PEs, or other copolymers such as EVA or ionomers (Nase et al., 2009; Poisson et al., 2006a).
Blends of LDPE/LLDPE at several compositions could provide a good balance of processability,
mechanical, optical, and heat seal properties (Colls et al., 2006).
2.1.5.2 HDPE
The development of highly active catalysts made polymerization possible at lower temperatures
and low pressures. Then, the production of linear PE (or high-density polyethylene, HDPE) was
developed in the mid-1950s (Brydson, 1999). HDPE chains are linear, containing neither short
nor long chain branches. (See Figure 2-15) Application of HDPE in seal layer is very limited due
to its high crystallinity, high Tm, difficult melt processing, and lack of flexibility. Therefore, it is
used in the form of blends with other resins and in easy-open heat seals (Malsen et al., 2008;
Miyata and Toshiyuki, 2011; Theller, 1989).
2.1.5.3 Linear low density polyethylene LLDPE
Further developments in catalyst technology led to the possibility of copolymerization of
ethylene with small amounts of an α-olefin (Hosoda, 1988; Mirabella and Ford, 1987). This
method of polymerization incorporates short side-chain branches to the ethylene backbone.
20
Linear low-density polyethylene (LLDPE), was first developed commercially in the late 1970s
(Brydson, 1999). LLDPEs catalyzed by Zeigler-Natta type catalysts (Zn-LLDPE) exhibit broad
molecular weight distributions (MWD) and short chain branching distributions (SCBD) because
Ziegler-Natta catalysts have multiple active sites. The distribution of short chain branches is not
uniform among and along the chains. (See Figure 2-15) Generally, the shorter chains have higher
SCB content than longer chains (Wild et al., 1982). Thus, the Zn-LLDPEs has heterogeneous
structure at both inter- and intramolecular levels. The Zn-LLDPEs are widely used as seal layer
in both forms of neat and blends with other seal polymers.
Figure 2-15 Schematic of the molecular structure of the different polyethylenes, (Wood-Adams,
1998)
2.1.5.4 Metallocene catalyzed ethylene α-olefin
One of the most recent major progress in the area of polyethylenes catalysis systems has arguably
been single site catalysts (Feldman, 1996). Advances in organometallic chemistry resulted in the
development of metallocene catalysts that have been used mainly in the production of ethylene
and propylene polymers. Metallocene-catalyzed polyolefins, in particular, have been produced
commercially since the late 1990s (Brydson, 1999). Although the use of metallocene-catalysts is
well established, the full potential of this technology is probably yet to be fully realized. More
recent advances in single-site metallocene-catalysts have resulted in the production of structurally
superior PEs (Brydson, 1999). Metallocene-catalyzed PEs (m-PEs) are ethylene copolymers with
21
uniform incorporation of the comonomer and have a narrower molecular weight distribution
MWD.
There are two subclasses within the general category of m-PEs: linear m-PEs which have no
branches or only short chain branches but no LCB, and the branched m-PEs which containing
precisely controlled low levels of LCB. These uniformly distributed LCB contain chains are
produced using the constrained geometry catalysts. The terms, very low-density polyethylene
(VLDPE) or ultra low-density polyethylene (ULDPE), are often used to describe metallocene-
catalyzed PEs (Brydson, 1999; Halle, 2003; Khare et al., 2000; Manaure and Müller, 2000;
Manaure et al., 1997; Shanks et al., 2000; Tanrattanakul and Udomkichdecha, 2001).
Due to the inherent plastic and elastomeric features in some m-PE grades, they are often referred
to as plastomers (Halle and Davis, 1995; Halle, 2003). Although, m-PEs are relatively new, the
properties of these materials are well characterized and established in the literature (Chum et al.,
2000; Jordens et al., 2000; Nitta and Tanaka, 2001; Nitta et al., 2000; Razavi-Nouri and Hay,
2001; Vega et al., 1996; Wang et al., 2004).
The unique design of chain structure for metallocene catalyzed polyethylene resins resulted in
superior toughness, heat sealing, and clarity compared to the conventional PEs. These superior
properties have led to their extensive use in stretch films, heavy duty sacks, and flexible food
packaging such as frozen food films. As seal layer in all types of packaging, metallocene
catalyzed resins have been used in both neat forms and as a minor phase in blends with other
polyolefins. There are several patents on application of metallocene as variety of film structures
and blends (Donovan et al., 1999; Farley et al., 1996; Van Loon et al., 2009).
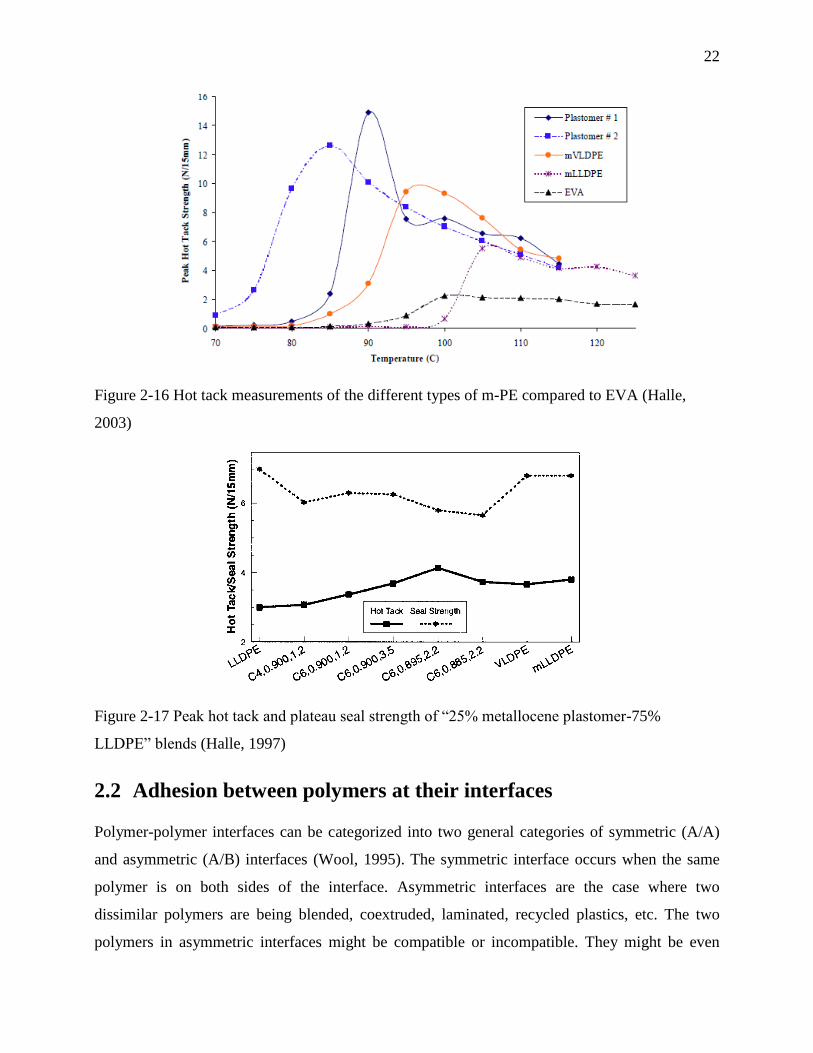
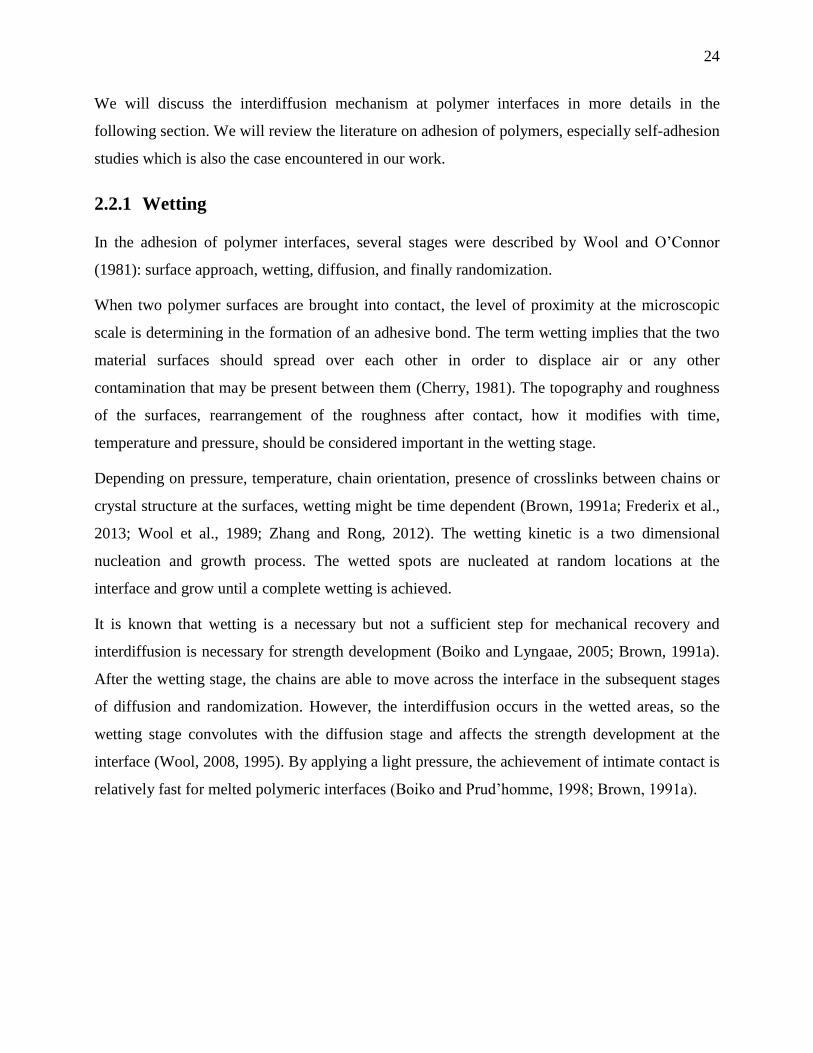
In a paper presented in a TAPPI conference Halle, 2003 showed the superior hot tack strength of
metallocene catalyzed PE resins compared to EVA. (See Figure 2-16) They also studied the
blends of plastomers and LLDPE and reported the enhancement of hot tack by incorporation of
plastomers to LLDPE (Halle, 1997). Shih et al. (1999) studied a blend of 30wt%LDPE and
70wt%m-PE. They reported that the film made of m-PE/LDPE blend has higher hot tack than m-
PE. However, they measured the hot tack after 0.4 s delay time, where the film already cooled
and partial crystallization occurred. They explained this result with the gap between
crystallization temperatures of the two components, which caused reinforcement of hot tack by
some crystal formation (Shih et al., 1999).
22
Figure 2-16 Hot tack measurements of the different types of m-PE compared to EVA (Halle,
2003)
Figure 2-17 Peak hot tack and plateau seal strength of “25% metallocene plastomer-75%
LLDPE” blends (Halle, 1997)
2.2 Adhesion between polymers at their interfaces
Polymer-polymer interfaces can be categorized into two general categories of symmetric (A/A)
and asymmetric (A/B) interfaces (Wool, 1995). The symmetric interface occurs when the same
polymer is on both sides of the interface. Asymmetric interfaces are the case where two
dissimilar polymers are being blended, coextruded, laminated, recycled plastics, etc. The two
polymers in asymmetric interfaces might be compatible or incompatible. They might be even

23
from the same chemical structure but with different molecular weight or chain architecture.
Therefore, the number and complexity of asymmetric interfaces are far beyond symmetric
interfaces (Boiko and Prud’homme, 1999; Brown, 1991a; Lee, 1991).
Because the focus of this study is the heat sealing process of polymer films in flexible packaging
applications, the adhesion of symmetric interfaces will be reviewed in this section. The primary
interest here is to describe adhesion between surfaces that had not been in contact previously.
Thus, the literature and theories of crack healing and fractured surfaces are not of interest here.
Thus, in the following section we will review the adhesion between pairs of polymeric materials,
and more specifically the formation of interfaces between non-reactive polymers.
The majority of studies on polymer adhesion in this subject focused on the welding of polymers
for a certain time (usually a few minutes or hours) (Brown, 1991a; Hamed and Shieh, 1983; Kim
et al., 1994; Klein, 1990; Wool, 2006) in a certain temperature. In the studies on welding of
polymers, the strength of the interface is examined using several types of geometries (Wool,
1995). However, the adhesive fracture energy is the main criteria to examine the strength at
polymer interface. The work of adhesion or adhesive fracture energy is the irreversible fracture
energy of interface. It is defined as the energy required for crack propagation through the material
by a unit length in a specimen of unit width (Brown, 1991a; Zhang and Rong, 2012).
The adhesive fracture energy known as Gc, will encompass all forms of the energy losses
incurred around the crack tip. Similar to ordinary fracture mechanics, the adhesive fracture
energy is determined by the local dissipation energy at crack tip during fracture (Brown, 1989;
Xu et al., 1991). At the microscopic scale, crack propagation is mainly led by the growth of a
craze at the crack tip (Brown, 1991b; Miller et al., 1991). Crazing is a deformation mechanism
which generally leads to a significant increase in fracture toughness (Wool, 1995). The craze
corresponds to the plastic response of a material at the crack tip and the energy dissipation occurs
mainly by crazing (Brown, 1991b; Kramer and Berger, 1990; Kramer, 1983; Miller et al., 1991).
As polymer chains diffuse across the interface during welding, more material will be involved in
the deformation process during the fracture test (Creton et al., 1992). Until the adhesive fracture
energy reaches the fracture energy of bulk polymer. The main complication here is to connect the
examined fracture energy at interface with microscopic diffusion parameters.
24
We will discuss the interdiffusion mechanism at polymer interfaces in more details in the
following section. We will review the literature on adhesion of polymers, especially self-adhesion
studies which is also the case encountered in our work.
2.2.1 Wetting
In the adhesion of polymer interfaces, several stages were described by Wool and O’Connor
(1981): surface approach, wetting, diffusion, and finally randomization.
When two polymer surfaces are brought into contact, the level of proximity at the microscopic
scale is determining in the formation of an adhesive bond. The term wetting implies that the two
material surfaces should spread over each other in order to displace air or any other
contamination that may be present between them (Cherry, 1981). The topography and roughness
of the surfaces, rearrangement of the roughness after contact, how it modifies with time,
temperature and pressure, should be considered important in the wetting stage.
Depending on pressure, temperature, chain orientation, presence of crosslinks between chains or
crystal structure at the surfaces, wetting might be time dependent (Brown, 1991a; Frederix et al.,
2013; Wool et al., 1989; Zhang and Rong, 2012). The wetting kinetic is a two dimensional
nucleation and growth process. The wetted spots are nucleated at random locations at the
interface and grow until a complete wetting is achieved.
It is known that wetting is a necessary but not a sufficient step for mechanical recovery and
interdiffusion is necessary for strength development (Boiko and Lyngaae, 2005; Brown, 1991a).
After the wetting stage, the chains are able to move across the interface in the subsequent stages
of diffusion and randomization. However, the interdiffusion occurs in the wetted areas, so the
wetting stage convolutes with the diffusion stage and affects the strength development at the
interface (Wool, 2008, 1995). By applying a light pressure, the achievement of intimate contact is
relatively fast for melted polymeric interfaces (Boiko and Prud’homme, 1998; Brown, 1991a).
25
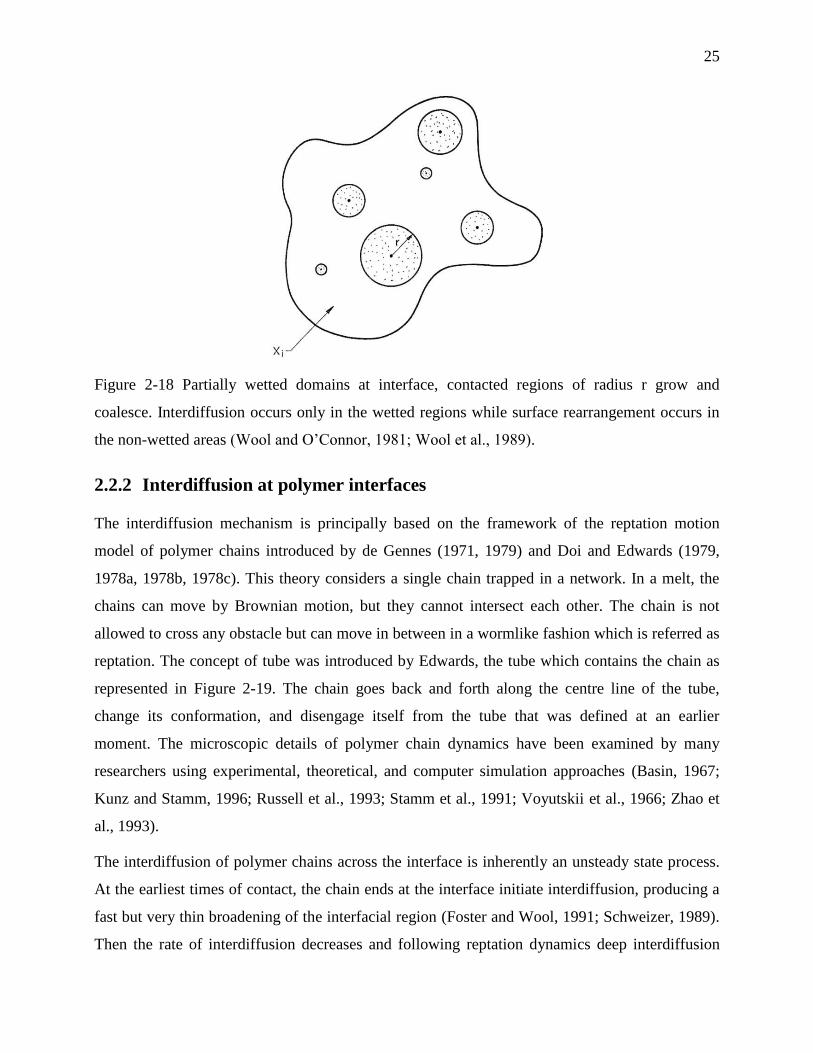
Figure 2-18 Partially wetted domains at interface, contacted regions of radius r grow and
coalesce. Interdiffusion occurs only in the wetted regions while surface rearrangement occurs in
the non-wetted areas (Wool and O’Connor, 1981; Wool et al., 1989).
2.2.2 Interdiffusion at polymer interfaces
The interdiffusion mechanism is principally based on the framework of the reptation motion
model of polymer chains introduced by de Gennes (1971, 1979) and Doi and Edwards (1979,
1978a, 1978b, 1978c). This theory considers a single chain trapped in a network. In a melt, the
chains can move by Brownian motion, but they cannot intersect each other. The chain is not
allowed to cross any obstacle but can move in between in a wormlike fashion which is referred as
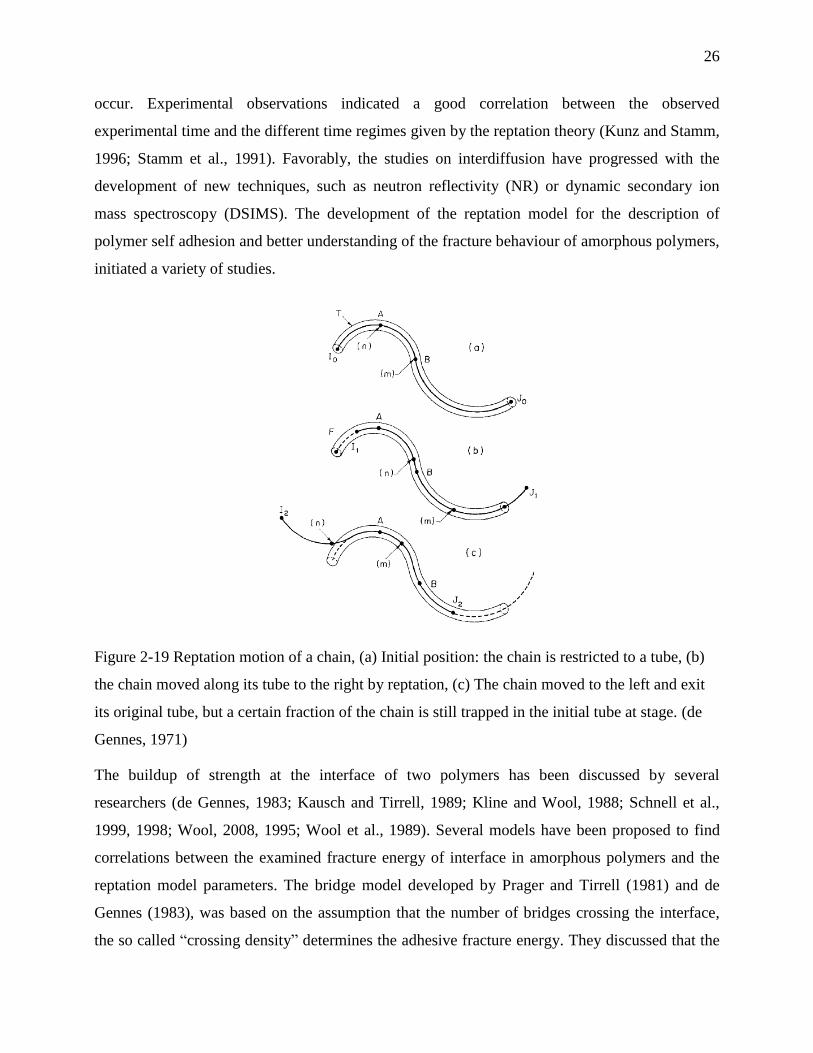
reptation. The concept of tube was introduced by Edwards, the tube which contains the chain as
represented in Figure 2-19. The chain goes back and forth along the centre line of the tube,
change its conformation, and disengage itself from the tube that was defined at an earlier
moment. The microscopic details of polymer chain dynamics have been examined by many
researchers using experimental, theoretical, and computer simulation approaches (Basin, 1967;
Kunz and Stamm, 1996; Russell et al., 1993; Stamm et al., 1991; Voyutskii et al., 1966; Zhao et
al., 1993).
The interdiffusion of polymer chains across the interface is inherently an unsteady state process.
At the earliest times of contact, the chain ends at the interface initiate interdiffusion, producing a
fast but very thin broadening of the interfacial region (Foster and Wool, 1991; Schweizer, 1989).
Then the rate of interdiffusion decreases and following reptation dynamics deep interdiffusion
26
occur. Experimental observations indicated a good correlation between the observed
experimental time and the different time regimes given by the reptation theory (Kunz and Stamm,
1996; Stamm et al., 1991). Favorably, the studies on interdiffusion have progressed with the
development of new techniques, such as neutron reflectivity (NR) or dynamic secondary ion
mass spectroscopy (DSIMS). The development of the reptation model for the description of
polymer self adhesion and better understanding of the fracture behaviour of amorphous polymers,
initiated a variety of studies.
Figure 2-19 Reptation motion of a chain, (a) Initial position: the chain is restricted to a tube, (b)
the chain moved along its tube to the right by reptation, (c) The chain moved to the left and exit
its original tube, but a certain fraction of the chain is still trapped in the initial tube at stage. (de
Gennes, 1971)
The buildup of strength at the interface of two polymers has been discussed by several
researchers (de Gennes, 1983; Kausch and Tirrell, 1989; Kline and Wool, 1988; Schnell et al.,
1999, 1998; Wool, 2008, 1995; Wool et al., 1989). Several models have been proposed to find
correlations between the examined fracture energy of interface in amorphous polymers and the
reptation model parameters. The bridge model developed by Prager and Tirrell (1981) and de
Gennes (1983), was based on the assumption that the number of bridges crossing the interface,
the so called “crossing density” determines the adhesive fracture energy. They discussed that the
27
crossing density is simply proportional to the adhesive fracture energy, which result the following
scaling law:
where M is molecular weight and t diffusion time.
Another model is Wool’s minor chain model (Wool et al., 1989) which assumes that the average
monomer interpenetration distance, X(t), determines the adhesive fracture energy. From the
reptation theory, it is known that X(t) scales with the average contour length, <l(t)>, of those
parts of the chains which have escaped the initial tube, referred as “minor chains”, as X(t)~
<l(t)>1/2
. The adhesive fracture energy, Ga is simply assumed to be proportional to the average
length of the minor chains <l(t)>. Therefore, Ga exhibits the same scaling laws with respect to
molecular weight and welding time as <l(t)>:
Both welding models mentioned above predict that the adhesive fracture energy will increase
with the square root of welding time. This scaling law is confirmed by experimental data on both
glassy polymers (Bastien and Gillespie, 1991; Foster and Wool, 1991; Fowler et al., 1987; Kline
and Wool, 1988; Yoo et al., 1991) and elastomers (Wool and O’Connor, 1981). The experimental
data on the influence of molecular weight on the adhesion fracture energy was reported to favour
the minor chain model (Wool and O’Connor, 1981).
2.2.3 Polymer adhesion between amorphous polymers
In this section, different studies on the fracture toughness of interfaces between amorphous
polymers will be reviewed. In the early 90’s, the advances made on the understanding of the
micromechanisms of interdiffusion and fracture at interfaces and the development of neutron
reflectivity as a technique to measure interfacial width between polymers, with angstrom
resolution, reinforced progress of polymer adhesion.
In welding of glassy interfaces of amorphous polymers, the interfacial width and the average
distance between entanglements are the parameters that control fracture toughness (Gc) (Brown,
1991a). It has been shown that the chains need to diffuse over a certain distance in order to
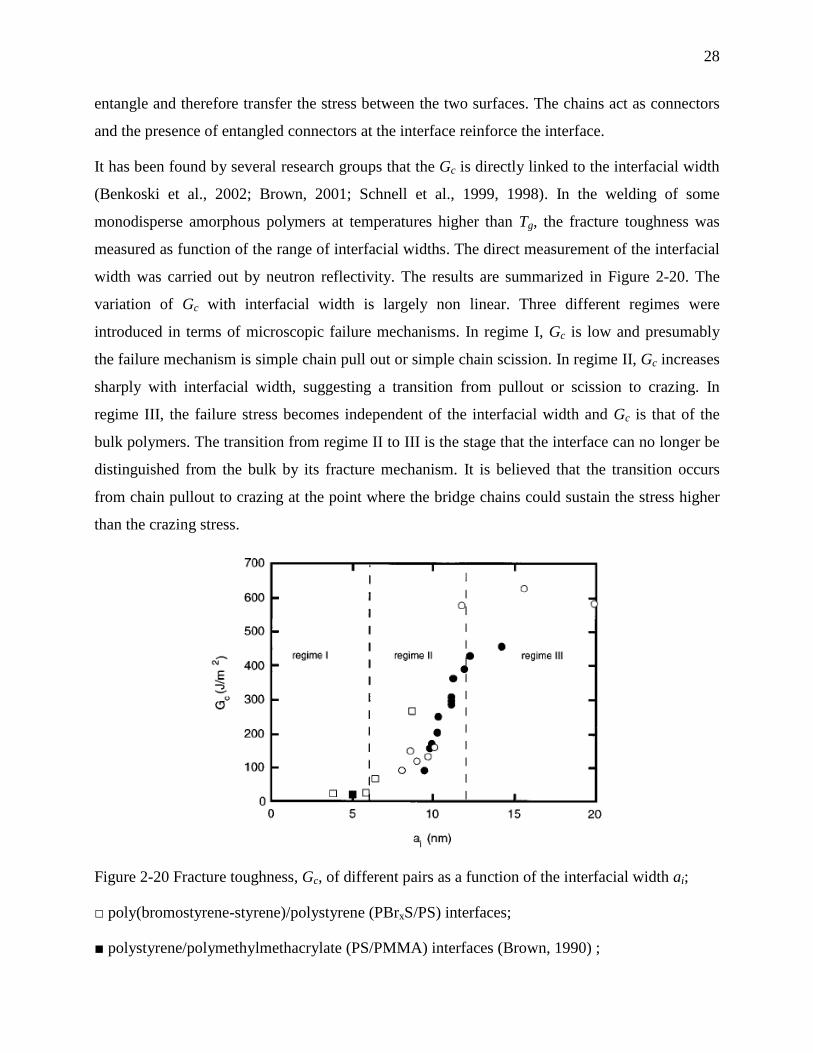
28
entangle and therefore transfer the stress between the two surfaces. The chains act as connectors
and the presence of entangled connectors at the interface reinforce the interface.
It has been found by several research groups that the Gc is directly linked to the interfacial width
(Benkoski et al., 2002; Brown, 2001; Schnell et al., 1999, 1998). In the welding of some
monodisperse amorphous polymers at temperatures higher than Tg, the fracture toughness was
measured as function of the range of interfacial widths. The direct measurement of the interfacial
width was carried out by neutron reflectivity. The results are summarized in Figure 2-20. The
variation of Gc with interfacial width is largely non linear. Three different regimes were
introduced in terms of microscopic failure mechanisms. In regime I, Gc is low and presumably
the failure mechanism is simple chain pull out or simple chain scission. In regime II, Gc increases
sharply with interfacial width, suggesting a transition from pullout or scission to crazing. In
regime III, the failure stress becomes independent of the interfacial width and Gc is that of the
bulk polymers. The transition from regime II to III is the stage that the interface can no longer be
distinguished from the bulk by its fracture mechanism. It is believed that the transition occurs
from chain pullout to crazing at the point where the bridge chains could sustain the stress higher
than the crazing stress.
Figure 2-20 Fracture toughness, Gc, of different pairs as a function of the interfacial width ai;
□ poly(bromostyrene-styrene)/polystyrene (PBrxS/PS) interfaces;
■ polystyrene/polymethylmethacrylate (PS/PMMA) interfaces (Brown, 1990) ;
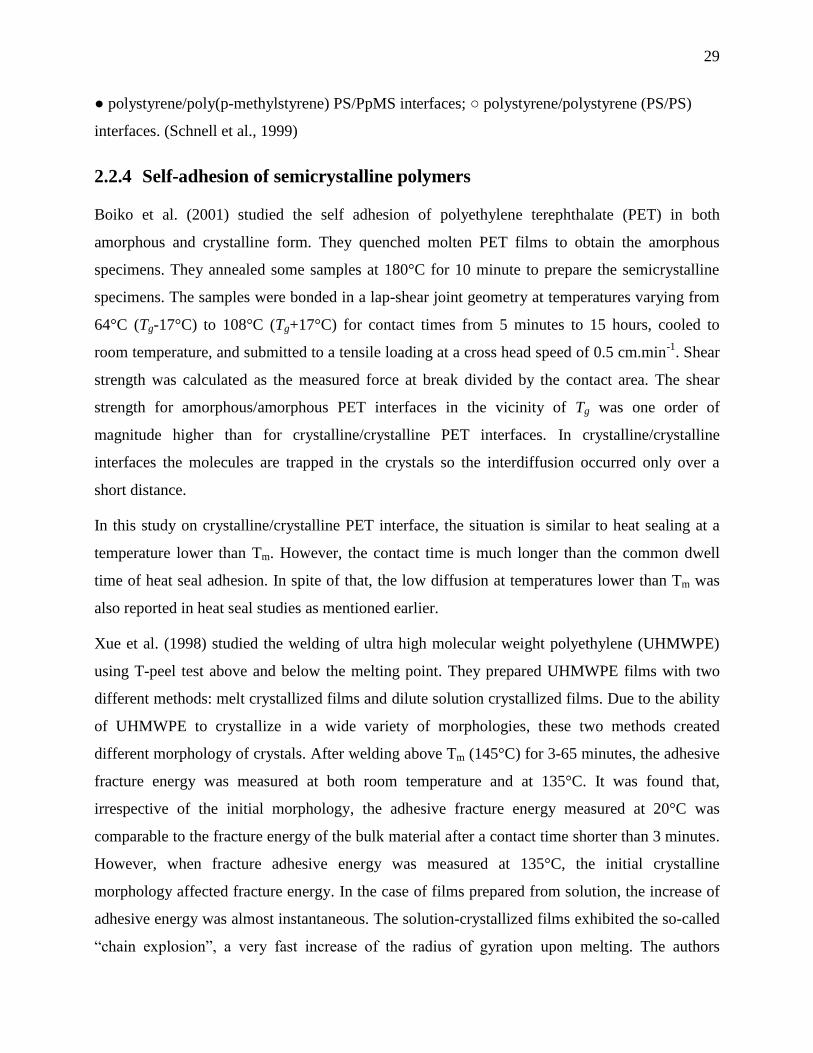
29
● polystyrene/poly(p-methylstyrene) PS/PpMS interfaces; ○ polystyrene/polystyrene (PS/PS)
interfaces. (Schnell et al., 1999)
2.2.4 Self-adhesion of semicrystalline polymers
Boiko et al. (2001) studied the self adhesion of polyethylene terephthalate (PET) in both
amorphous and crystalline form. They quenched molten PET films to obtain the amorphous
specimens. They annealed some samples at 180°C for 10 minute to prepare the semicrystalline
specimens. The samples were bonded in a lap-shear joint geometry at temperatures varying from
64°C (Tg-17°C) to 108°C (Tg+17°C) for contact times from 5 minutes to 15 hours, cooled to
room temperature, and submitted to a tensile loading at a cross head speed of 0.5 cm.min-1
. Shear
strength was calculated as the measured force at break divided by the contact area. The shear
strength for amorphous/amorphous PET interfaces in the vicinity of Tg was one order of
magnitude higher than for crystalline/crystalline PET interfaces. In crystalline/crystalline
interfaces the molecules are trapped in the crystals so the interdiffusion occurred only over a
short distance.
In this study on crystalline/crystalline PET interface, the situation is similar to heat sealing at a
temperature lower than Tm. However, the contact time is much longer than the common dwell
time of heat seal adhesion. In spite of that, the low diffusion at temperatures lower than Tm was
also reported in heat seal studies as mentioned earlier.
Xue et al. (1998) studied the welding of ultra high molecular weight polyethylene (UHMWPE)
using T-peel test above and below the melting point. They prepared UHMWPE films with two
different methods: melt crystallized films and dilute solution crystallized films. Due to the ability
of UHMWPE to crystallize in a wide variety of morphologies, these two methods created
different morphology of crystals. After welding above Tm (145°C) for 3-65 minutes, the adhesive
fracture energy was measured at both room temperature and at 135°C. It was found that,
irrespective of the initial morphology, the adhesive fracture energy measured at 20°C was
comparable to the fracture energy of the bulk material after a contact time shorter than 3 minutes.
However, when fracture adhesive energy was measured at 135°C, the initial crystalline
morphology affected fracture energy. In the case of films prepared from solution, the increase of
adhesive energy was almost instantaneous. The solution-crystallized films exhibited the so-called
“chain explosion”, a very fast increase of the radius of gyration upon melting. The authors

30
suggested that for UHMWPE the crystallization from an extremely dilute solution results in
“single crystal mats”, in which entire polymer chains are confined to one crystal that caused a
large reduction of the radius of gyration. Then, the chains rapidly recovered their Rg by heating to
Tm. They suggested that this phenomenon caused the instantaneous strengthening of interface in
case of pre-wetted solution-crystallized films (Xue et al., 1998). In contrast to solution-
crystallized films, for melt crystallized films, the peel force gradually increased with contact time
and even after 65 hours of welding, it could not attain the fracture energy of the bulk material.
In the second part of their work (Xue et al., 2000), they studied the effect of cocrystallization at
the interface on self-adhesion of UHMWPE. They used solution-cast films containing regularly
stacked lamellae, which exactly doubled in thickness upon annealing for 15 min at 125°C. (See
Figure 2-21) In amorphous polymers, the strengthening of the interface is due to the formation of
entanglements upon diffusion. The deep chain diffusion, and consequently long welding times, is
required for good adhesion. The results of peel force in co-crystallized specimens showed that,
for semicrystalline polymers, large-scale chain diffusion is not a prerequisite for good welding
performance. The strength at the interface could be developed by cocrystallization at relatively
low welding time (Xue et al., 2000).
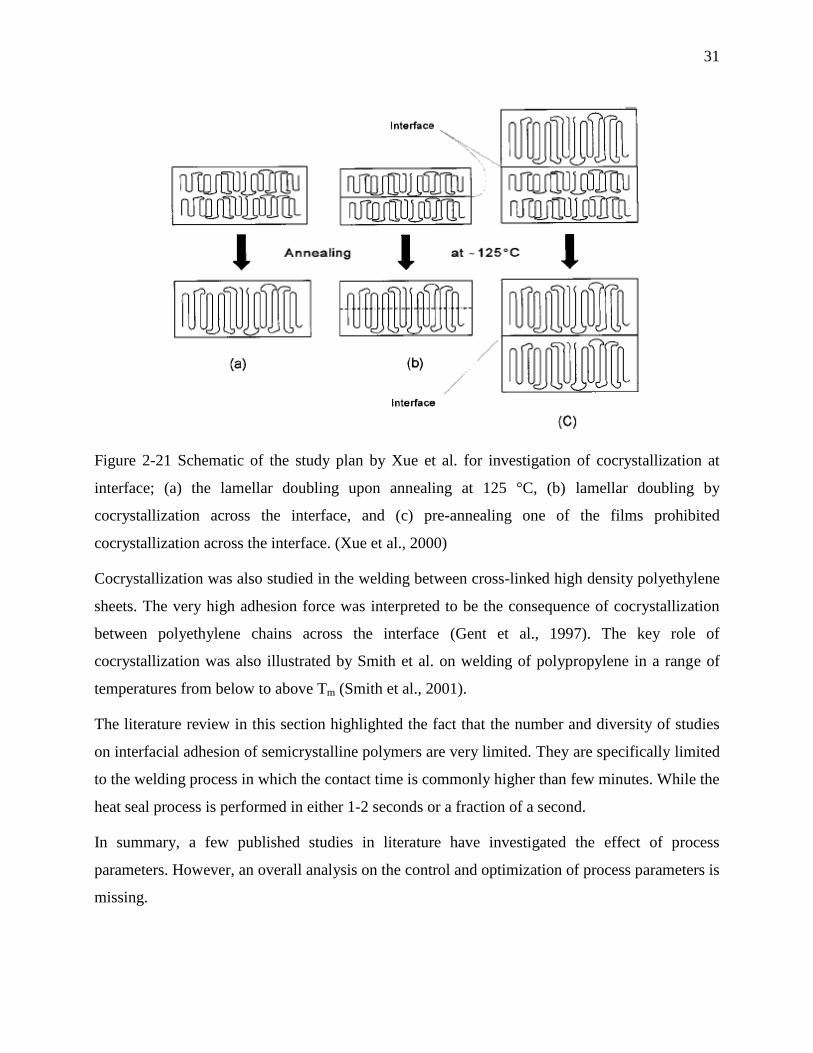
31
Figure 2-21 Schematic of the study plan by Xue et al. for investigation of cocrystallization at
interface; (a) the lamellar doubling upon annealing at 125 °C, (b) lamellar doubling by
cocrystallization across the interface, and (c) pre-annealing one of the films prohibited
cocrystallization across the interface. (Xue et al., 2000)
Cocrystallization was also studied in the welding between cross-linked high density polyethylene
sheets. The very high adhesion force was interpreted to be the consequence of cocrystallization
between polyethylene chains across the interface (Gent et al., 1997). The key role of
cocrystallization was also illustrated by Smith et al. on welding of polypropylene in a range of
temperatures from below to above Tm (Smith et al., 2001).
The literature review in this section highlighted the fact that the number and diversity of studies
on interfacial adhesion of semicrystalline polymers are very limited. They are specifically limited
to the welding process in which the contact time is commonly higher than few minutes. While the
heat seal process is performed in either 1-2 seconds or a fraction of a second.
In summary, a few published studies in literature have investigated the effect of process
parameters. However, an overall analysis on the control and optimization of process parameters is
missing.

32
As mentioned earlier, in the work of Meka and Stehling (1994) the analysis was based on the
interface temperature which is not practically possible to measure in industrial process. They
used a finite elements model to obtain the temperature at interface and they showed that the
interface temperature will reach to the jaw temperature after 0.3-0.5 s. In the industrial process
however, the heat sealing occur in a non-isothermal condition and temperature setting is based on
the control temperature on the heated jaws. They also introduced the heat sealing curve but did
not discuss the trend of seal strength, plateau initiation temperature, and plateau broadness with
regard to dwell time and pressure (Stehling and Meka, 1994).
Moreover, the seal strength of several polymers has been studied but there is not an overall
fundamental investigation on seal strength of a resin at different process conditions (Mueller et
al., 1998; Poisson et al., 2006a). Also, the analysis of the amorphous fraction of polyethylene
resins has been done only in one process condition, where the amorphous fraction might be
different for every process condition.
In studies on heat seal process parameters, the effect of pressure or dwell time were mostly
discussed at one temperature. So the concurrent effects of dwell time-temperature and pressure-
temperature have not been investigated before.
In addition, the models connecting the reptation parameters to the final interface strength has
been verified in welding process where the contact time is much higher than the contact time of
heat sealing in flexible packaging applications. So it needs to be verified in dwell times less than
a second as the realistic dwell time.
A good hot tack performance and the influential parameters on it is still a major challenge. The
reports on hot tack are limited to a few conference papers and patents comparing the hot tack
performance of different polymers. To our best knowledge there is no study about the effect of
molecular structure on hot tack properties. Also there is lack of fundamental knowledge about
parameters affecting hot tack performances such as hot tack strength and also hot tack plateau
broadness.
2.3 Originality of the work
According to the literature review above, the heat sealing process has not been well explored.
There is a lack of knowledge about how the material structure or process parameters affect heat
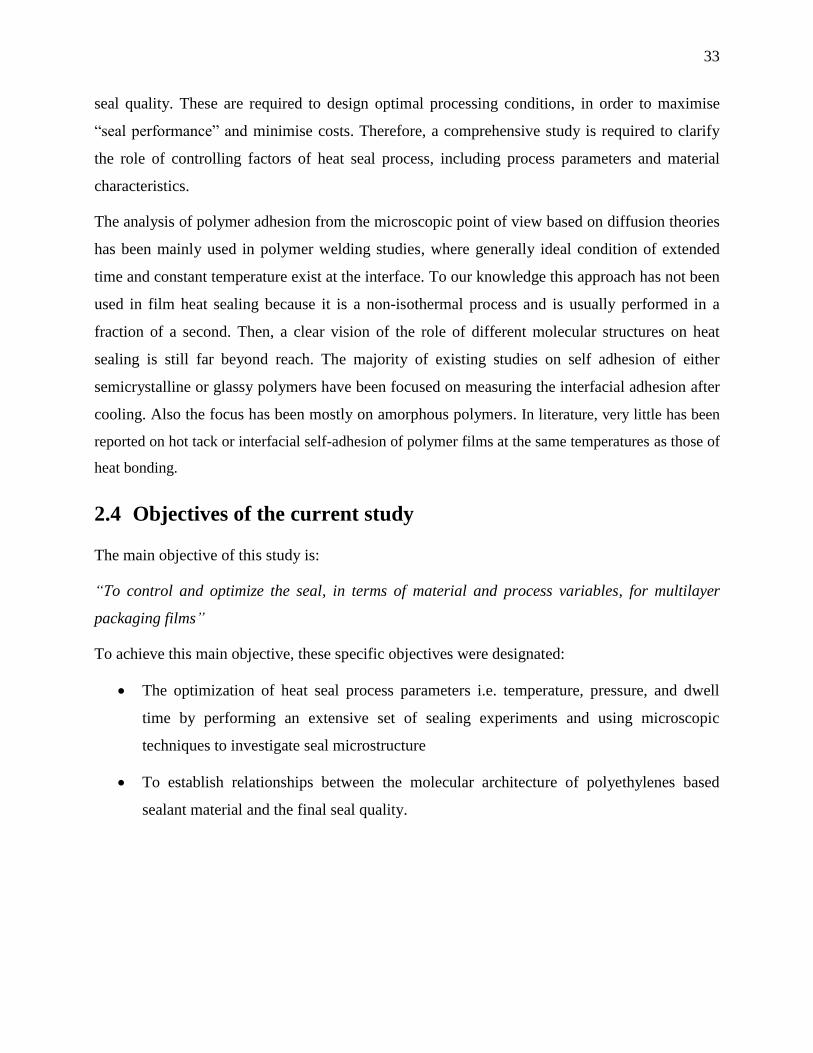
33
seal quality. These are required to design optimal processing conditions, in order to maximise
“seal performance” and minimise costs. Therefore, a comprehensive study is required to clarify
the role of controlling factors of heat seal process, including process parameters and material
characteristics.
The analysis of polymer adhesion from the microscopic point of view based on diffusion theories
has been mainly used in polymer welding studies, where generally ideal condition of extended
time and constant temperature exist at the interface. To our knowledge this approach has not been
used in film heat sealing because it is a non-isothermal process and is usually performed in a
fraction of a second. Then, a clear vision of the role of different molecular structures on heat
sealing is still far beyond reach. The majority of existing studies on self adhesion of either
semicrystalline or glassy polymers have been focused on measuring the interfacial adhesion after
cooling. Also the focus has been mostly on amorphous polymers. In literature, very little has been
reported on hot tack or interfacial self-adhesion of polymer films at the same temperatures as those of
heat bonding.
2.4 Objectives of the current study
The main objective of this study is:
“To control and optimize the seal, in terms of material and process variables, for multilayer
packaging films”
To achieve this main objective, these specific objectives were designated:
The optimization of heat seal process parameters i.e. temperature, pressure, and dwell
time by performing an extensive set of sealing experiments and using microscopic
techniques to investigate seal microstructure
To establish relationships between the molecular architecture of polyethylenes based
sealant material and the final seal quality.
34
CHAPTER 3
ORGANIZATION OF ARTICLES
The main achievements of this research project are presented in the form of three scientific
papers in the following three chapters:
Chapter 4 presents the results of the first paper: “A novel approach toward the effect of seal
process parameters on final seal strength and microstructure of LLDPE” accepted to be
published in the Journal of adhesion science and technology. In this work, we investigated the
different active mechanisms in the heat seal process of a semicrystalline polymer. We have
chosen to work on monolayer LLDPE film. The atomic force microscopy technique and the
comparative roughness analysis were use to obtain information on the seal microstructure
molecular interdiffusion.
Chapter 5 presents the results of the second paper: “Role of Molecular Architecture in Interfacial
Self-adhesion of Polyethylene Films” submitted to Macromolecules. In this work, we
investigated the role of molecular architecture of a polymer chain on final hot tack strength. The
investigated molecular structures include: molecular weight (Mw), molecular weight distribution
(MWD), amount and distribution of long chain branch (LCB), and short chain branch (SCB)
distribution among and along polyethylene chains. A variety of polyethylene resins with different
chain structures were utilized in this part.
Chapter 6 presents the results of the third paper: “Interfacial Self-Adhesion of Polyethylene
Blends: the Role of Long Chain Branching and Extensional Rheology” submitted to Rheologica
Acta. In this work, we focused on binary blends of two main categories of polyethylene,
metallocene catalyzed and conventional polyethylene resins. Through different blend
compositions, we studied the influence of blending of resins with different chain structure on hot
tack properties. The correlation of melt elongational rheological properties with final hot tack
strength was discussed in this part of the work.

35
CHAPTER 4
ARTICLE 1: A NOVEL APPROACH TOWARD THE EFFECT OF SEAL
PROCESS PARAMETERS ON FINAL SEAL STRENGTH AND
MICROSTRUCTURE OF LLDPE*
Zahra Najarzadeh, Abdellah Ajji
4.1 Abstract
The optimization of heat sealing process parameters, including time, temperature, and pressure,
was performed on a monolayer linear low density polyethylene (LLDPE) film. The seal
properties examined for each process condition were: Seal initiation temperature (Tsi), plateau
initiation temperature (Tpi), final plateau temperature (Tpf), plateau seal strength (SSp) and failure
mode. Increasing dwell time enhanced seal strength. However, it was found that the rate of this
enhancement is different for each interval of dwell time. In term of temperature window
broadness at each specific dwell time, a narrow temperature plateau was observed for dwell times
lower than 0.4 s and higher than 2 s. While in between a broad temperature window was
observed. The pressure shows its influence up to the stage of wetting. And after providing the
intimate contact between two film layers, additional increase in pressure does not enhance seal
strength significantly. At high pressures, seal curves showed a narrower temperature window.
Moreover, it was shown that the level of plateau seal strength in LLDPE changes slightly with
process conditions. A 3D mapping of process safety zone was introduced for seal strength in the
range of heat seal process variables for the very first time. The analysis of this 3D representation
revealed that seal strength has a linear correlation with the square root of dwell time. In addition,
the interfacial bond strength was shown to be proportional to the fraction of melted crystals. It
was found that this fraction is determined by dwell time and temperature. Topography and
morphology of surfaces after peeling revealed enlargement of fibrillar morphology to taller
* Accepted to publish in Journal of Adhesion Science and Technology, March 2014.
36
failure fracture complex shapes. Extensive roughness analysis on film surfaces after peeling
found the much rougher surfaces after breakage of strong bonding.
4.2 Introduction
Heat sealing is the process of joining thermoplastic materials and is the most popular method for
bonding two polymer films in package closures. It is performed by direct contact of films with
heated bars and applying sufficient pressure. Factors dictating the ultimate performance of heat
sealed films could be categorized as process related and film related. Process related factors are
heat seal process conditions: the applied temperature, dwell time, and pressure. Previous studies
have confirmed that seal strength depends mainly on temperature and dwell time, and less on
pressure 1–4
. However, the trend of this influence in various time intervals is not straightforward
and has not been discussed yet.
The general heat sealing curve introduced by Meka and Stehling 2 describes seal temperature
dependence of seal strength in semicrystalline polymers at a constant dwell time and pressure.
Figure 4-1 shows the schematic of this curve and its important features: Seal initiation
temperature (Tsi) is the lowest temperature in which a seal is created with a minimum level of
seal strength. After a few degrees increase in temperature from Tsi, a sharp increase in seal
strength occurs and stays almost constant for a temperature interval afterward. Plateau initiation
temperature (Tpi) is the temperature in which the plateau seal strength begins, and the final
plateau temperature (Tpf) is the terminal temperature of plateau.
The ability to design optimum processing conditions to maximise “seal performance” while
minimising costs is certainly desirable. The term “Seal performance” encompass not only
consistency of film’s joints but time and temperature dependence of seal strength, broadness of
the temperature range which produce the highest seal strength, seal initiation temperature, seal
failure mode, and seal uniformity. In high speed industrial sealing lines, fluctuations in
temperature of heated bars require obtaining high seal strength in a broad range of temperatures.
This is where the broadness of the plateau is required. Depending on the material and process, the
temperature window of plateau seal strength varies from a few degrees to 15˚C or more.

37
Figure 4-1 Heat seal curve for semicrystalline polymers introduced by Meka and Stehling 1; Tsi:
Seal initiation temperature, Tpi: Plateau initiation temperature, Tpi: Final plateau temperature,
SSp: Plateau seal strength, Seal strength plateau is the interval of Tpi and Tpf;
In the vertical and horizontal form fill seal (VFFS and HFFS) modern machines are generally
required to operate at high production speed. The balance of sacrifice in either production speed
or energy would be determined by optimization of process condition. Stehling and Meka 1
introduced a model for the heat sealing mechanism at the molecular scale in semicrystalline
polymer films. Figure 4-2 represents a schematic of it: crystal melting by applied heat,
interdiffusion of polymer chains across the interface, making entanglements, and re-
crystallization upon cooling. Based on this mechanism, the final seal performance depends also
on crystallinity and polymer chain ability to interdiffuse as material characteristics.
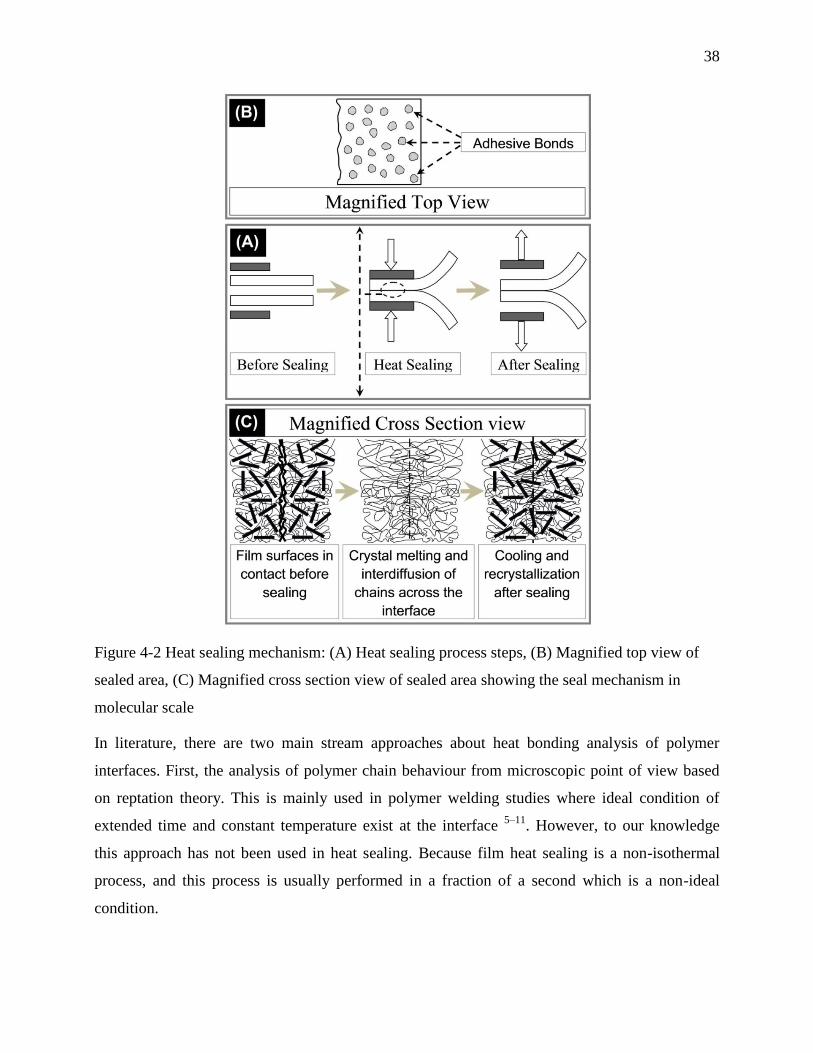
38
Figure 4-2 Heat sealing mechanism: (A) Heat sealing process steps, (B) Magnified top view of
sealed area, (C) Magnified cross section view of sealed area showing the seal mechanism in
molecular scale
In literature, there are two main stream approaches about heat bonding analysis of polymer
interfaces. First, the analysis of polymer chain behaviour from microscopic point of view based
on reptation theory. This is mainly used in polymer welding studies where ideal condition of
extended time and constant temperature exist at the interface 5–11
. However, to our knowledge
this approach has not been used in heat sealing. Because film heat sealing is a non-isothermal
process, and this process is usually performed in a fraction of a second which is a non-ideal
condition.
39
Second approach is the conventional macroscopic analysis. This method empirically investigates
the seal strength based on bulk properties of the polymer. Unlike the former, this approach does
not consider chain motion and polymer chains interdiffusion. Through this approach, the
macroscopic analysis, including mechanical and thermal properties, has been performed on some
common sealant materials 1–3,12–16
. Several studies have been carried out on sealing properties of
different materials and film structures. In a study on ionomers, Morris et al. 17
investigated the
influence of thickness on the relation between applied temperature and dwell time. Also, by the
use of impulse heat sealing on two laminated layers of oriented and cast polypropylene, the effect
of orientation in machine and transverse direction on seal strength was studied 14,18
.
Unfortunately there are not several previous studies on such a technically important topic and on
LLDPE as the most widely used polymer in seal layer applications.
This study attempts to address both approaches by performing an extensive set of sealing
experiments on a conventional LLDPE and using microscopic techniques to investigate seal
microstructure.
Strength development at polymer-polymer interfaces was described by de Gennes, 5,19,20
Prager
and Tirrell 21
, and by Wool 22
through polymer chain diffusion based on reptation motion theory
7. They illustrated power law dependence of chain displacements to molecular weight and time.
For ideal welding condition, the argument of non-Fickian diffusion was utilized to generate
empirical equations for the number of chains crossing the interface and the average diffusion
distance. These arguments have been utilized in researches on variety of subjects of polymer
interfaces such as welding, adhesives, emulsions, polymer blends, etc 23–29
.
In this work, seal experiments are conducted in order to optimize the sealing parameters and to
perceive the effect of concurrent change of “temperature - dwell time” and “temperature -
pressure” on seal strength. The atomic force microscopy technique was used to determine surface
roughness of the seal interface after peeling in order to obtain information on the seal
microstructure. The comparative roughness was utilized as representative of the level of film
surfaces’ contact area and molecular interdiffusion.
40
4.3 Materials and methods
4.3.1 Film production
A hexane based ethylene α-olefin copolymer, produced with a conventional Ziegler-Natta
catalyst for seal applications, was supplied by ExxonMobil Chemicals in the form of granules
with MFI=2 g/10min and density 0.918 g.cm-3
. Monolayer films were produced using a
laboratory scale cast line comprised of a 45 mm Killion single screw extruder and an 8 inch cast
film die. Cooling was performed using an air knife and calendar. The films were produced at
constant throughput without slip or antiblock additives with a nominal film thickness of 2 mils
(50μ).
4.3.2 Differential scanning calorimetry (DSC)
Thermal analysis was performed using a TA Instruments Q1000 DSC with 10°C/min heating rate
in first heating cycle. The melting temperature of the LLDPE film was determined as 120˚C. Heat
of fusion of a theoretically 100% crystalline polyethylene, which is 290 Jg-1
, was used to
determine the crystalline and amorphous fractions of film30
. The final melting temperature (Tmf)
was also considered as the temperature where all the crystals are melted.
4.3.3 Heat seal measurements
Heat seal experiments were performed on a SL10 LakoTool laboratory hot-tack and seal tester
purchased from “Lako Tool & Manufacturing Inc.” at a determined temperature, pressure, dwell
time and peel rate. Heat seals were made using flat seal bars covered with a layer of Teflon
coating. Seal samples were cut in 2.54 cm×33 cm strips specimens parallel to the machine
direction and a BOPP tape was used as the back-layer to protect the seal films from fusion and
sticking to the hot seal bars. Seal strength experiments were performed based on ASTM F2029
and ASTM F88. T-peel tests were done at a constant peel rate (3.3 mm.s-1
) and peel strength was
taken as the average plateau peel strength of 5 specimens.
4.3.4 Atomic force microscopy (AFM)
Escope AFM was operated in the tapping mode at room temperature using nanosensor tapping
etched silicon probes (TESP) with single beam cantilevers. The amplitudes of the drive signal
41
used to set the cantilever oscillation were in the range between 2.8 and 4.2 V. The samples were
attached to the AFM magnetic disk sample holders using double-sided tape. Height and phase
images were collected simultaneously. Surface topography was performed before and after seal
and peeling at the scan rate of 1 Hz. They were processed using NanoScope softwar by flattening
to remove background shapes. Then the surface roughness parameters of height images were
calculated.
4.3.5 Scanning electron microscopy (SEM)
In order to investigate the morphology of surfaces SEM was used. The surface of original films
before adhesion and the peeled surfaces after sealing and the subsequent T-peel test were
examined. They were gold sputtered and observed under a HITACHI S-4700 SEM.
4.4 Results and Discussion
4.4.1 Effect of Heat seal process parameters
Time and temperature dependence of seal strength is presented in a 3D graph shown in Figure
4-3. To see the effect of dwell time, the applied pressure was kept constant at 0.5 Nmm-2
and
dwell time was varied from 0.1-3 s. In the interval of very low dwell times (0-0.5 s) sealing was
done at every 0.1 s while for dwell times higher than 0.5 s it was done in steps of 0.5 s. In this 3D
graph, the level of seal strength at each single point is represented by a color. Considering
red/orange area as adequate seal strength (above 2000 g/25.4mm), at very low dwell time (lower
than 0.4 s), a narrow plateau can be seen. While for higher dwell times, the orange area covers a
wider range of temperature meaning a broader plateau, and become narrower again at very high
dwell time. The broadest plateau is obtained in the range of 0.5-1.5 s. The lowest dwell time with
broadest plateau is 0.5 s.
The border of the lower blue area represents Tsi. This border shows that an increase in dwell time
decreases Tsi. Similarly the breakage zone is the area for which the time-temperature
combinations leads to seal distortion due to very high sealing temperature or long dwell time.
This seal distortion means a brittle seal area with the possibility of defects which may break the
seal edge and threaten the integrity of seal and package.
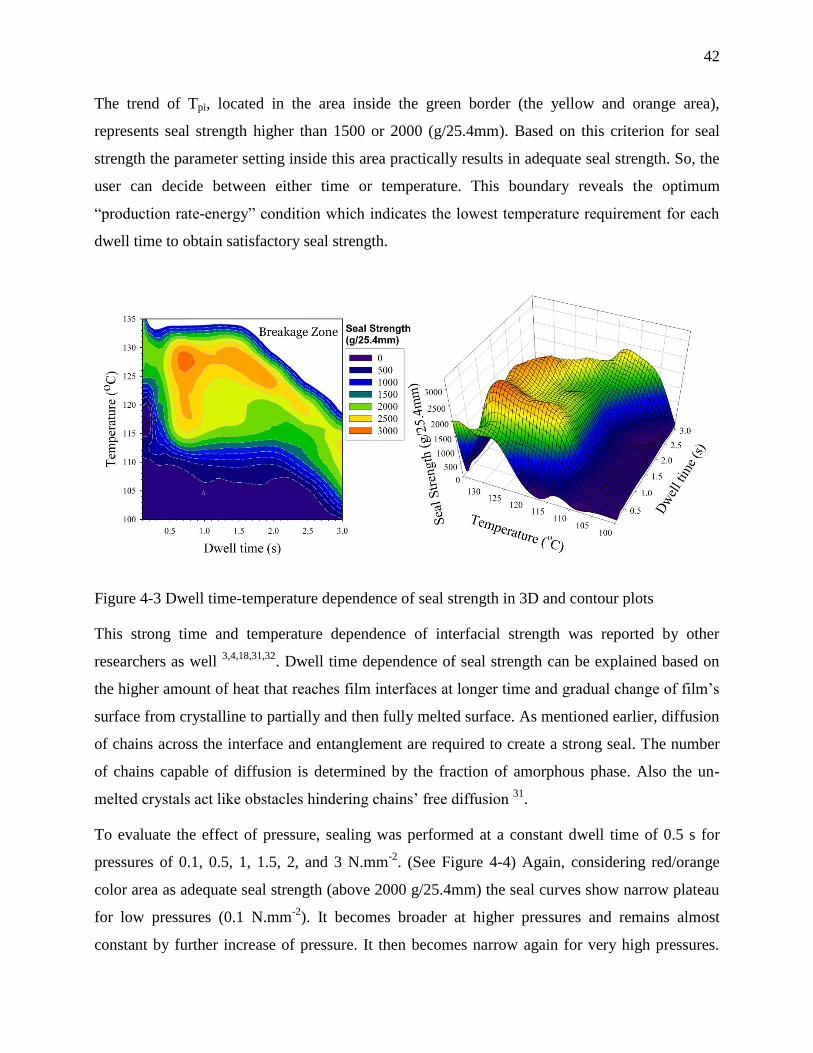
42
The trend of Tpi, located in the area inside the green border (the yellow and orange area),
represents seal strength higher than 1500 or 2000 (g/25.4mm). Based on this criterion for seal
strength the parameter setting inside this area practically results in adequate seal strength. So, the
user can decide between either time or temperature. This boundary reveals the optimum
“production rate-energy” condition which indicates the lowest temperature requirement for each
dwell time to obtain satisfactory seal strength.
Figure 4-3 Dwell time-temperature dependence of seal strength in 3D and contour plots
This strong time and temperature dependence of interfacial strength was reported by other
researchers as well 3,4,18,31,32
. Dwell time dependence of seal strength can be explained based on
the higher amount of heat that reaches film interfaces at longer time and gradual change of film’s
surface from crystalline to partially and then fully melted surface. As mentioned earlier, diffusion
of chains across the interface and entanglement are required to create a strong seal. The number
of chains capable of diffusion is determined by the fraction of amorphous phase. Also the un-
melted crystals act like obstacles hindering chains’ free diffusion 31
.
To evaluate the effect of pressure, sealing was performed at a constant dwell time of 0.5 s for
pressures of 0.1, 0.5, 1, 1.5, 2, and 3 N.mm-2
. (See Figure 4-4) Again, considering red/orange
color area as adequate seal strength (above 2000 g/25.4mm) the seal curves show narrow plateau
for low pressures (0.1 N.mm-2
). It becomes broader at higher pressures and remains almost
constant by further increase of pressure. It then becomes narrow again for very high pressures.

43
The trend observed for low pressures is because of reduced contact at film interfaces, so even if
temperature goes up and melt the crystals, it cannot provide enough interdiffusion. In addition, at
very high temperatures, the film surfaces are totally molten and there is a possibility of shear flow
under pressure which cause seal distortion and results in a decrease of seal strength. By
increasing pressure from 0.1 to 0.5 N.mm-2
, the plateau initiation temperature (Tpi) shifts to lower
temperatures. However, it remains constant after that. Thus, the effect of pressure is not as
significant as the effect of dwell time as long as the films are in sufficient contact. Although some
previous researchers 3 doubted the possibility of producing a good seal at pressure as low as 1 bar
(= 0.1 N.mm-2
), adjusting temperature allowed us to obtain a plateau of high seal strength.
Figure 4-4 Pressure-temperature dependence of seal strength in 3D and contour plots
Compared to the effect of dwell time on seal strength, pressure influences seal through an entirely
different mechanism. The role of pressure is to provide intimate contact at interface.
Establishment of this contact at the molecular scale is known as “wetting” at interface. Wetting is
sensitive to surface topography and hydrostatic pressure 10,33
. With an increase in pressure,
wetting is enhanced at interface and provides improved contact for polymer chains at interface.
The next step after wetting is chain diffusion by reptation motion. Generally high hydrostatic
pressure decreases free volume, thus retards segmental motion and hence reduces the diffusion
coefficient. This effect is not prominent for hydrostatic pressures lower than 100 N.mm-2
.
Consequently, in seal process, pressure would not influence significantly chains’ interdiffusion 22
.
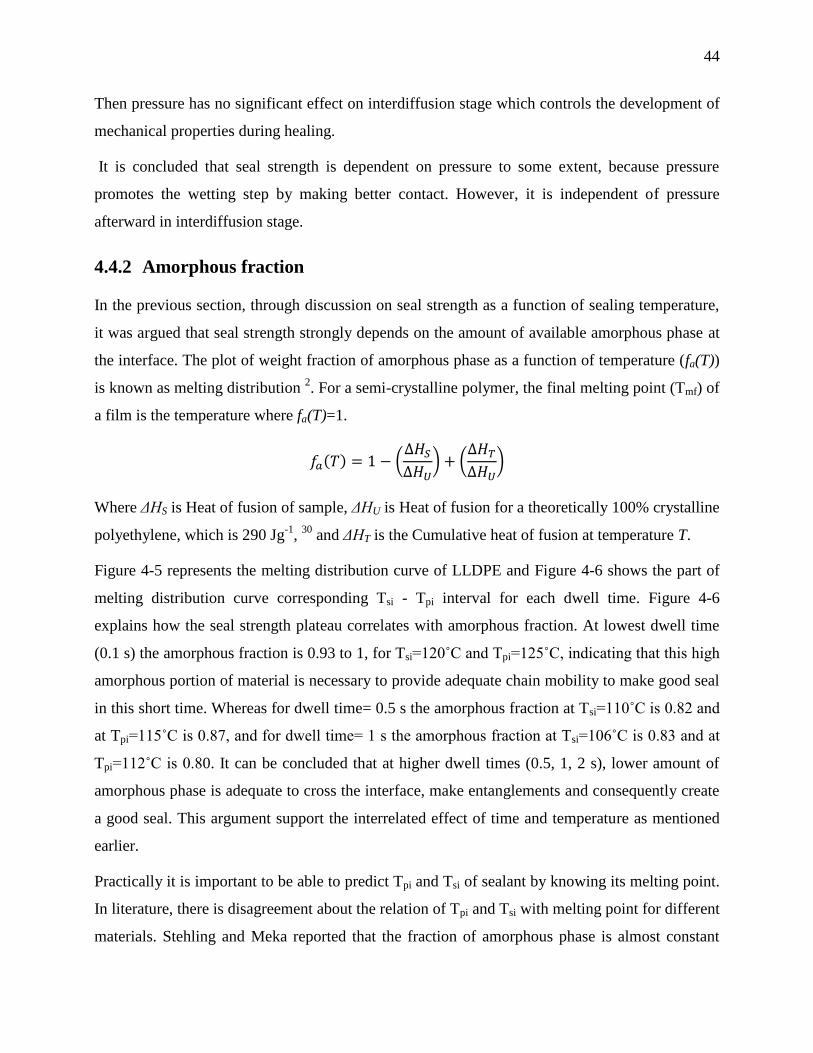
44
Then pressure has no significant effect on interdiffusion stage which controls the development of
mechanical properties during healing.
It is concluded that seal strength is dependent on pressure to some extent, because pressure
promotes the wetting step by making better contact. However, it is independent of pressure
afterward in interdiffusion stage.
4.4.2 Amorphous fraction
In the previous section, through discussion on seal strength as a function of sealing temperature,
it was argued that seal strength strongly depends on the amount of available amorphous phase at
the interface. The plot of weight fraction of amorphous phase as a function of temperature (fa(T))
is known as melting distribution 2. For a semi-crystalline polymer, the final melting point (Tmf) of
a film is the temperature where fa(T)=1.
Where ΔHS is Heat of fusion of sample, ΔHU is Heat of fusion for a theoretically 100% crystalline
polyethylene, which is 290 Jg-1
, 30
and ΔHT is the Cumulative heat of fusion at temperature T.
Figure 4-5 represents the melting distribution curve of LLDPE and Figure 4-6 shows the part of
melting distribution curve corresponding Tsi - Tpi interval for each dwell time. Figure 4-6
explains how the seal strength plateau correlates with amorphous fraction. At lowest dwell time
(0.1 s) the amorphous fraction is 0.93 to 1, for Tsi=120˚C and Tpi=125˚C, indicating that this high
amorphous portion of material is necessary to provide adequate chain mobility to make good seal
in this short time. Whereas for dwell time= 0.5 s the amorphous fraction at Tsi=110˚C is 0.82 and
at Tpi=115˚C is 0.87, and for dwell time= 1 s the amorphous fraction at Tsi=106˚C is 0.83 and at
Tpi=112˚C is 0.80. It can be concluded that at higher dwell times (0.5, 1, 2 s), lower amount of
amorphous phase is adequate to cross the interface, make entanglements and consequently create
a good seal. This argument support the interrelated effect of time and temperature as mentioned
earlier.
Practically it is important to be able to predict Tpi and Tsi of sealant by knowing its melting point.
In literature, there is disagreement about the relation of Tpi and Tsi with melting point for different
materials. Stehling and Meka reported that the fraction of amorphous phase is almost constant
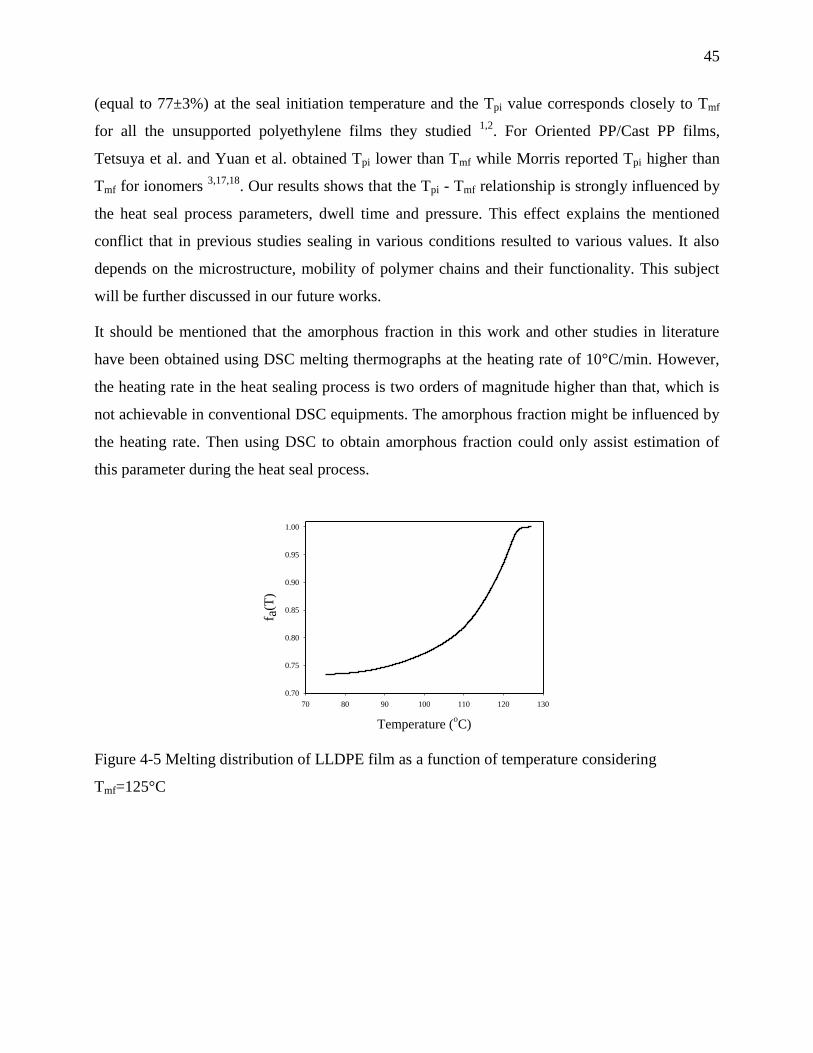
45
(equal to 77±3%) at the seal initiation temperature and the Tpi value corresponds closely to Tmf
for all the unsupported polyethylene films they studied 1,2
. For Oriented PP/Cast PP films,
Tetsuya et al. and Yuan et al. obtained Tpi lower than Tmf while Morris reported Tpi higher than
Tmf for ionomers 3,17,18
. Our results shows that the Tpi - Tmf relationship is strongly influenced by
the heat seal process parameters, dwell time and pressure. This effect explains the mentioned
conflict that in previous studies sealing in various conditions resulted to various values. It also
depends on the microstructure, mobility of polymer chains and their functionality. This subject
will be further discussed in our future works.
It should be mentioned that the amorphous fraction in this work and other studies in literature
have been obtained using DSC melting thermographs at the heating rate of 10°C/min. However,
the heating rate in the heat sealing process is two orders of magnitude higher than that, which is
not achievable in conventional DSC equipments. The amorphous fraction might be influenced by
the heating rate. Then using DSC to obtain amorphous fraction could only assist estimation of
this parameter during the heat seal process.
Figure 4-5 Melting distribution of LLDPE film as a function of temperature considering
Tmf=125°C
Temperature (oC)
70 80 90 100 110 120 130
f a(T
)
0.70
0.75
0.80
0.85
0.90
0.95
1.00
46
Figure 4-6 Melting distribution of LLDPE as a function of temperature, the corresponding
amorphous fraction at Tsi and Tpi are indicated at: (a) dwell time=0.1 s, (b) dwell time=0.5 s, (c)
dwell time=1 s, (d) dwell time=2 s, (e) dwell time=3 s
4.4.3 Time dependence of seal strength
The development of a heat seal at the microscopic scale involves joining two polymer surfaces by
the action of time, temperature and pressure. To create a weld that is indistinguishable from bulk,
120 125
f a(T
)
0.70
0.93
1.00
110 115
f a(T
)
0.70
0.82
0.87
1.00
106 112
f a(T
)
0.70
0.80
0.83
1.00
105 111
f a(T
)
0.70
0.79
0.83
1.00
Temperature(oC)
100 105
f a(T
)
0.70
0.770.79
1.00
t=0.1 s
t=0.5 s
t=1 s
t=2 s
t=3 s
b
a
c
e
d
47
the polymer chains need to diffuse across the interface. The temperature needs to be high enough
for free chain ends to have reptation motion in process time.
As discussed by de Gennes 5 in reptation theory, chain ends located at the interface are going to
relinquish their initial tube, cross the interface, and create junctions at the other side. With time,
the number and the length of interdiffused chains increase. Over time the chain ends could
diffuse deeper to the other polymer layer. This part of chain ends which escaped from their initial
tube is called “minor chain”. The lengths of minor chains increase by time until they are long
enough to make entanglements. Therefore, the number of entanglements also increases over time.
At a critical time, known as saturation time (τ), the interface is going to disappear and the
properties of bulk material would be reached. This is the time in which the maximum interface
strength is reached 22
.
In order to relate microscopic properties of the interface to macroscopic properties of polymer
bulk; the healing theory was introduced 34
:
In which S(t) represents interface strength (as macroscopic property) and H(t) represents the
microscopic property (such as minor chain length). Both H(t) and S(t) are time dependent, thus
they are known as dynamic terms of healing. An increase in macroscopic strength of interface
(H(t)) is a function of increase in chain interdiffusion (S(t)). In a fully healed interface which has
the strength of bulk material, S∞ and H∞ were introduced. They are defined as the equilibrium
values of S(t) and H(t). S∞ and H∞ are known as static terms of healing. S∞ represents minor chain
length (or any other microscopic property at interface) after t = τ when the chains at interface are
at the equilibrium state of bulk material, and the gap at interface is disappeared 22,34
.
At polymer-polymer interface the scaling law 22,35
was introduced to show the relation of
dynamic (H(t)) and static (H∞) terms of microscopic property in healing:
Which τ is saturation time (as mentioned earlier), and r=1, 2, 3 … is a power law factor. The
value of r is determined by the type of microscopic property (H). Assuming that the
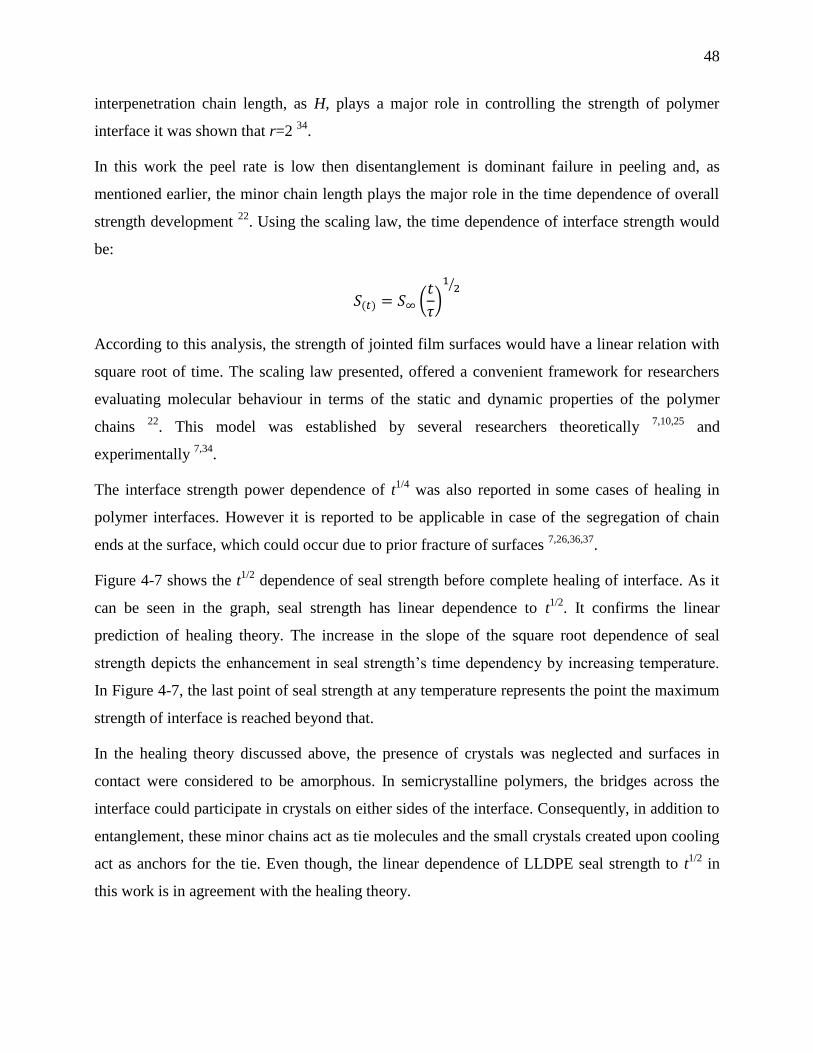
48
interpenetration chain length, as H, plays a major role in controlling the strength of polymer
interface it was shown that r=2 34
.
In this work the peel rate is low then disentanglement is dominant failure in peeling and, as
mentioned earlier, the minor chain length plays the major role in the time dependence of overall
strength development 22
. Using the scaling law, the time dependence of interface strength would
be:
According to this analysis, the strength of jointed film surfaces would have a linear relation with
square root of time. The scaling law presented, offered a convenient framework for researchers
evaluating molecular behaviour in terms of the static and dynamic properties of the polymer
chains 22
. This model was established by several researchers theoretically 7,10,25
and
experimentally 7,34
.
The interface strength power dependence of t1/4
was also reported in some cases of healing in
polymer interfaces. However it is reported to be applicable in case of the segregation of chain
ends at the surface, which could occur due to prior fracture of surfaces 7,26,36,37
.
Figure 4-7 shows the t1/2
dependence of seal strength before complete healing of interface. As it
can be seen in the graph, seal strength has linear dependence to t1/2
. It confirms the linear
prediction of healing theory. The increase in the slope of the square root dependence of seal
strength depicts the enhancement in seal strength’s time dependency by increasing temperature.
In Figure 4-7, the last point of seal strength at any temperature represents the point the maximum
strength of interface is reached beyond that.
In the healing theory discussed above, the presence of crystals was neglected and surfaces in
contact were considered to be amorphous. In semicrystalline polymers, the bridges across the
interface could participate in crystals on either sides of the interface. Consequently, in addition to
entanglement, these minor chains act as tie molecules and the small crystals created upon cooling
act as anchors for the tie. Even though, the linear dependence of LLDPE seal strength to t1/2
in
this work is in agreement with the healing theory.
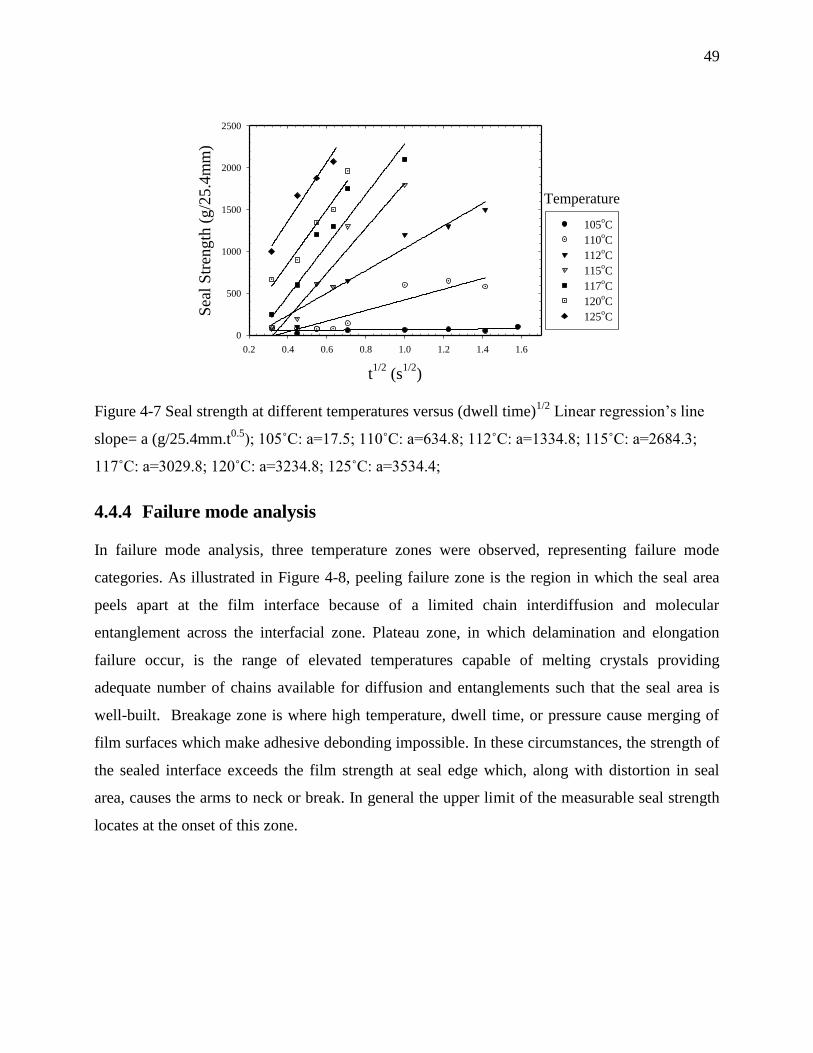
49
Figure 4-7 Seal strength at different temperatures versus (dwell time)1/2
Linear regression’s line
slope= a (g/25.4mm.t0.5); 105˚C: a=17.5; 110˚C: a=634.8; 112˚C: a=1334.8; 115˚C: a=2684.3;
117˚C: a=3029.8; 120˚C: a=3234.8; 125˚C: a=3534.4;
4.4.4 Failure mode analysis
In failure mode analysis, three temperature zones were observed, representing failure mode
categories. As illustrated in Figure 4-8, peeling failure zone is the region in which the seal area
peels apart at the film interface because of a limited chain interdiffusion and molecular
entanglement across the interfacial zone. Plateau zone, in which delamination and elongation
failure occur, is the range of elevated temperatures capable of melting crystals providing
adequate number of chains available for diffusion and entanglements such that the seal area is
well-built. Breakage zone is where high temperature, dwell time, or pressure cause merging of
film surfaces which make adhesive debonding impossible. In these circumstances, the strength of
the sealed interface exceeds the film strength at seal edge which, along with distortion in seal
area, causes the arms to neck or break. In general the upper limit of the measurable seal strength
locates at the onset of this zone.
t1/2
(s1/2
)
0.2 0.4 0.6 0.8 1.0 1.2 1.4 1.6
Sea
l S
tren
gth
(g
/25
.4m
m)
0
500
1000
1500
2000
2500
105oC
110oC
112oC
115oC
117oC
120oC
125oC
Temperature

50
Figure 4-8 Representation of failure modes observed in seal curve of LLDPE films supported
with BOPP tape
4.4.5 Topographic and morphological analysis by AFM and SEM
In the debonding failure mode, the crack propagates through the sealed interface and it leaves
numerous fractured craze fibrils on the peeled surfaces. Depictive AFM 3D height micrographs
of virgin film and peeled surfaces are shown in Figure 4-9. To capture all topographic aspects and
tiny features of the examined surfaces in 3D, height imaging of 5μm scan sizes was found the
most efficient.
The origin of these fibrils is the bridges formed during sealing by diffusion of chains across the
interface and entanglements they made. These bridges constructed from moveable amorphous
parts of polymer chains act as stitches attaching two film layers. Fibrils density and length
depend on the depth of diffusion and number of chains available for motion at every definite
sealing condition. At sealing temperatures below Tpi (115˚C) the chain motion is more confined
and, consequently, fewer bridges cause lower peel strength and leave smaller fibrils at peeled
surface. By increasing temperature, the broken stitches are stronger thus the fibrils on the peeled
surface are noticeably longer and thicker.
In peeled surfaces from sealing at temperatures above Tpi, a network of connected larger peaks
and valleys is more prominent than isolated fractured thin fibrils. This shows a better adhesion in
higher temperatures. Hiltner et al. have reported similar connections between fibrils as sealing
time was increased to 1000-3500 s in welding of LLDPE films. They called it a three-
Temperature
Sea
l S
tren
gth FailurePeel
Failure
BreakageTear /
Failure
ationminDela
Elongation
Peel
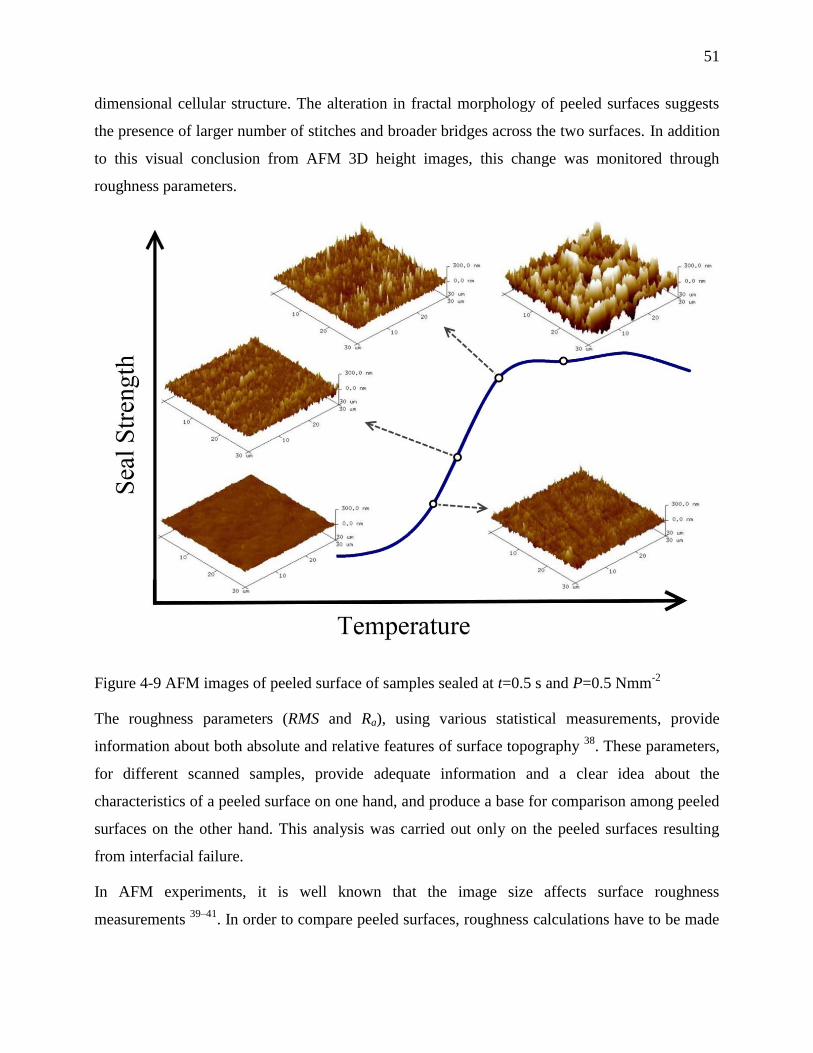
51
dimensional cellular structure. The alteration in fractal morphology of peeled surfaces suggests
the presence of larger number of stitches and broader bridges across the two surfaces. In addition
to this visual conclusion from AFM 3D height images, this change was monitored through
roughness parameters.
Figure 4-9 AFM images of peeled surface of samples sealed at t=0.5 s and P=0.5 Nmm-2
The roughness parameters (RMS and Ra), using various statistical measurements, provide
information about both absolute and relative features of surface topography 38
. These parameters,
for different scanned samples, provide adequate information and a clear idea about the
characteristics of a peeled surface on one hand, and produce a base for comparison among peeled
surfaces on the other hand. This analysis was carried out only on the peeled surfaces resulting
from interfacial failure.
In AFM experiments, it is well known that the image size affects surface roughness
measurements 39–41
. In order to compare peeled surfaces, roughness calculations have to be made
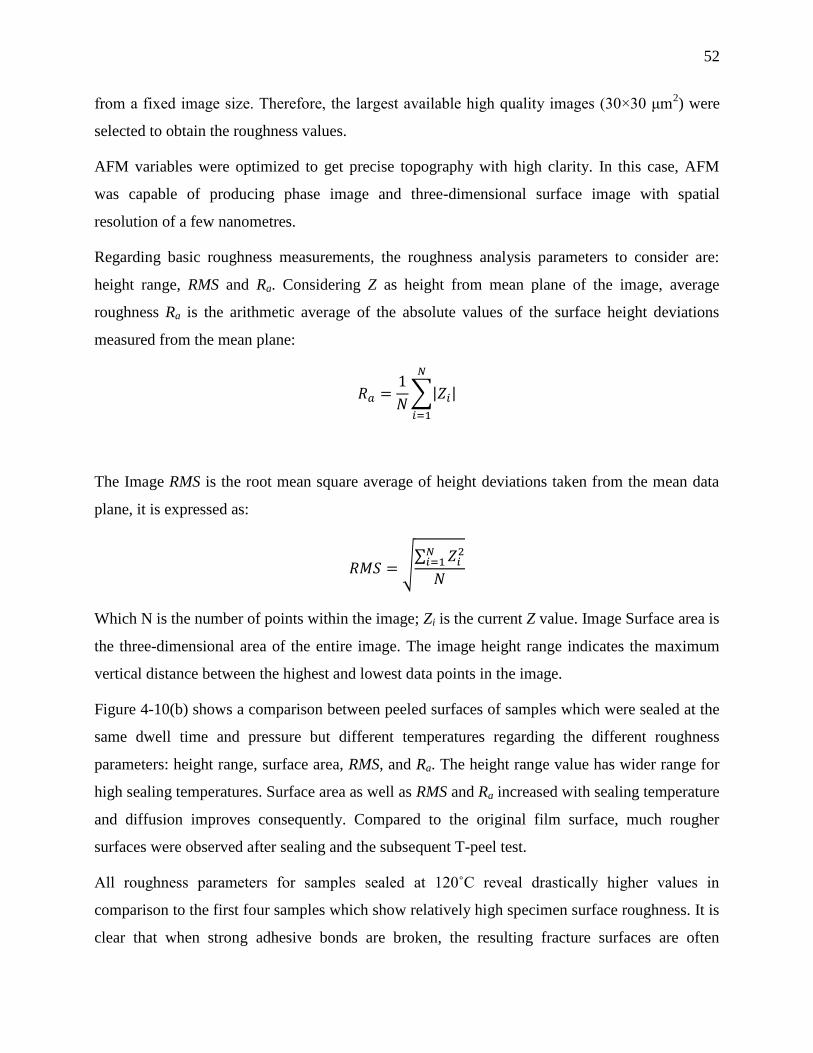
52
from a fixed image size. Therefore, the largest available high quality images (30×30 μm2) were
selected to obtain the roughness values.
AFM variables were optimized to get precise topography with high clarity. In this case, AFM
was capable of producing phase image and three-dimensional surface image with spatial
resolution of a few nanometres.
Regarding basic roughness measurements, the roughness analysis parameters to consider are:
height range, RMS and Ra. Considering Z as height from mean plane of the image, average
roughness Ra is the arithmetic average of the absolute values of the surface height deviations
measured from the mean plane:
The Image RMS is the root mean square average of height deviations taken from the mean data
plane, it is expressed as:
Which N is the number of points within the image; Zi is the current Z value. Image Surface area is
the three-dimensional area of the entire image. The image height range indicates the maximum
vertical distance between the highest and lowest data points in the image.
Figure 4-10(b) shows a comparison between peeled surfaces of samples which were sealed at the
same dwell time and pressure but different temperatures regarding the different roughness
parameters: height range, surface area, RMS, and Ra. The height range value has wider range for
high sealing temperatures. Surface area as well as RMS and Ra increased with sealing temperature
and diffusion improves consequently. Compared to the original film surface, much rougher
surfaces were observed after sealing and the subsequent T-peel test.
All roughness parameters for samples sealed at 120˚C reveal drastically higher values in
comparison to the first four samples which show relatively high specimen surface roughness. It is
clear that when strong adhesive bonds are broken, the resulting fracture surfaces are often

53
extremely rough. After peeling, the film surfaces in sealed parts are opaque. This is believed to be
due to scattering of visible light, which become effective when RMS roughness is over 50 nm.
Figure 4-10(a) shows the measured roughness parameters from peeled surfaces of the films which
were sealed for different dwell times (0.1, 0.5, 2.5 s) at their plateau initiation temperature. All
the measured roughness parameters are in the same range, which illustrates that the diffusion
reached to a certain point at Tpi regardless of the process conditions. Although Tpi is different at
each dwell time, the roughness parameters are similar for the various sealing temperature and
dwell time.
Figure 4-10 Roughness parameters of (a) peeled surface of samples sealed 0.5 Nmm-2
at t=0.1,
0.5, 2.5 s at T=Tpi; Blue dash lines in height rang graph are the height range of film before seal,
(b) peeled surface of samples sealed at t=0.5 s and P=0.5 Nmm-2
and T= 110, 112, 114, 115,
120˚C
Figure 4-11 shows SEM images of the original films before adhesion and the peeled surfaces
after sealing and the subsequent T-peel test. In SEM image of peeled surfaces, the fractured
fibrils are visible. In specimens sealed at higher temperature (120˚C) the fibrillar morphology
developed into larger, higher fracture points and became more complex. They thus appear more
like a network.
Dwell time (s)
0.0 0.5 1.0 1.5 2.0 2.5 3.0
Ra
10
15
20
25
30
35
Dwell time (s)
0.0 0.5 1.0 1.5 2.0 2.5 3.0
RM
S
10
20
30
40
50
Sealing temperature(oC)
108 110 112 114 116 118 120 122
Ra
10
20
30
40
50
60
70
Sealing temperature(oC)
108 110 112 114 116 118 120 122
RM
S
10
20
30
40
50
60
70
80
90
Sealing temperature (oC)
108 110 112 114 116 118 120 122
Hei
gh
t ra
nge
(nm
)
-400
-300
-200
-100
0
100
200
300
400
Dwell time (s)
0.0 0.5 1.0 1.5 2.0 2.5 3.0
Hei
gh
t R
an
g (
nm
)
-300
-200
-100
0
100
200
300(a)
(b)
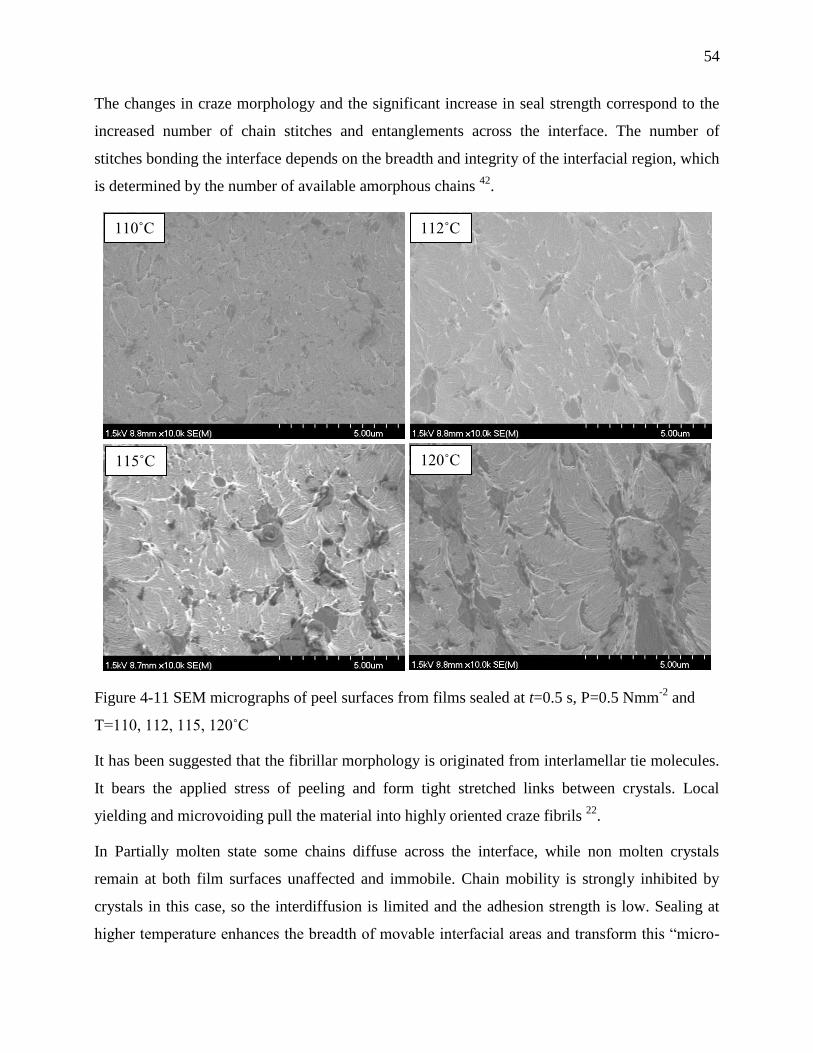
54
The changes in craze morphology and the significant increase in seal strength correspond to the
increased number of chain stitches and entanglements across the interface. The number of
stitches bonding the interface depends on the breadth and integrity of the interfacial region, which
is determined by the number of available amorphous chains 42
.
Figure 4-11 SEM micrographs of peel surfaces from films sealed at t=0.5 s, P=0.5 Nmm-2
and
T=110, 112, 115, 120˚C
It has been suggested that the fibrillar morphology is originated from interlamellar tie molecules.
It bears the applied stress of peeling and form tight stretched links between crystals. Local
yielding and microvoiding pull the material into highly oriented craze fibrils 22
.
In Partially molten state some chains diffuse across the interface, while non molten crystals
remain at both film surfaces unaffected and immobile. Chain mobility is strongly inhibited by
crystals in this case, so the interdiffusion is limited and the adhesion strength is low. Sealing at
higher temperature enhances the breadth of movable interfacial areas and transform this “micro-
110˚C 112˚C
115˚C 120˚C

55
spot adhesion” into a more integrated adhesion. Then it produces an interconnected texture in the
fractured area of peeled surfaces 43
.
4.5 Conclusions
In this work, the main variables of the heat sealing process were evaluated in term of their
influence on the development of seal strength. Interrelated influence of “dwell time - sealing
temperature” and “pressure - sealing temperature” was established simultaneously. This
optimization was performed on LLDPE as the most widely used polymer in seal application. It
was shown that dwell time and temperature affect seal strength through the same mechanism of
crystal melting and interdiffusion. However, pressure affects seal strength through wetting as a
very different microscopic scale mechanism. It was concluded that the time and temperature
dependence of seal strength is a consequence of the amount of heat available in the interface of
films.
It was found that the seal strength has a linear correlation with square root of sealing time. This
was shown to be in agreement with healing theory. Moreover, the slope of this linear correlation
increases with temperature.
Analysis of melting distribution revealed that the amorphous fraction of film required for high
seal strength is not a unique value for all the process conditions. And depending on the process
variables including temperature and dwell time, it may locate within a certain range.
Peeled seal surfaces roughness analysis revealed that its topography strongly depends on the seal
creation process variables. The fibrillar structure was observed by AFM and SEM from the
peeled surfaces of the samples sealed at low temperatures. In specimens sealed at high
temperature, the fibrillar morphology developed into larger, higher fracture points and became
more complex in shape.
4.6 Acknowledgement
Financial support from 3S Pack NSERC/Saputo/Prolamina industrial research chair is gratefully
acknowledged.
56
4.7 References
1. Meka, P. & Stehling, F. C. Heat sealing of semicrystalline polymer films. I. Calculation and
measurement of interfacial temperatures: Effect of process variables on seal properties. J. Appl.
Polym. Sci. 51, 89–103 (1994).
2. Stehling, F. C. & Meka, P. Heat sealing of semicrystalline polymer films. II. Effect of melting
distribution on heat-sealing behavior of polyolefins. J. Appl. Polym. Sci. 51, 105–119 (1994).
3. Hassan, A. Effect of bar sealing parameter on OPP/MCPP heat seal strength. Express Polym. Lett.
1, 773–779 (2007).
4. Theller, H. W. Heatsealability of Flexible Web Materials in Hot-Bar Sealing Applications. J.
Plast. Film Sheeting 5, 66–93 (1989).
5. De Gennes, P. G. Reptation of a Polymer Chain in the Presence of Fixed Obstacles. J. Chem.
Phys. 55, 572–579 (1971).
6. Frederix, C., Beauchene, P., Seguela, R. & Lefebvre, J. M. Kinetics of the non-isothermal fusion-
welding of unlike ethylene copolymers over a wide crystallinity range. Polymer 54, 2755–2763
(2013).
7. Kim, K. D., Sperling, L. H., Klein, A. & Hammouda, B. Reptation Time, Temperature, and
Cosurfactant Effects on the Molecular Interdiffusion Rate during Polystyrene Latex Film
Formation. Macromolecules 27, 6841–6850 (1994).
8. Klein, J. The Interdiffision of Polymers. Science 250, 640–646 (1990).
9. Tashiro, K. & Gose, N. Diffusion and aggregation of hydrogeneous and deuterated polyethylene
chains at their interfacial boundary as studied by time- and space-resolved FTIR microscopic
measurements. Polymer 42, 8987–8998 (2001).
10. Wool, R. P. & O’Connor, K. M. A theory crack healing in polymers. J. Appl. Phys. 52, 5953–
5963 (1981).
11. Zhao, R. & Macosko, C. W. Polymer–polymer mutual diffusion via rheology of coextruded
multilayers. AIChE J. 53, 978–985 (2007).
12. Gardon, J. L. Peel adhesion. II. A theoretical analysis. J. Appl. Polym. Sci. 7, 643–665 (1963).
13. Gardon, J. L. Peel adhesion. I. Some phenomenological aspects of the test. J. Appl. Polym. Sci. 7,
625–641 (1963).
14. Hashimoto, Y., Ishiaku, U. S., Leong, Y. W., Hamada, H. & Tsujii, T. Effect of heat-sealing
temperature on the failure criteria of oriented polypropylene/cast polypropylene heat seal. Polym.
Eng. Sci. 46, 205–214 (2006).
15. Poisson, Hervais, V., Lacrampe, M. F. & Krawczak, P. Optimization of PE/Binder/PA extrusion
blow molded films. I. Heat sealing ability improvement using PE/EVA blends. J. Appl. Polym.
Sci. 99, 974–985 (2006).
16. Dowling, D. P. et al. Atmospheric pressure plasma treatment of amorphous polyethylene
terephthalate for enhanced heatsealing properties. Int. J. Adhes. Adhes. 35, 1–8 (2012).
17. Morris, B. A. Predicting the Heat Seal Performance of Ionomer Films. J. Plast. Film Sheeting 18,
157–167 (2002).

57
18. Tetsuya, T., Ishiaku, U. S., Mizoguchi, M. & Hamada, H. The effect of heat sealing temperature
on the properties of OPP/CPP heat seal. I. Mechanical properties. J. Appl. Polym. Sci. 97, 753–
760 (2005).
19. De Gennes, P.-G. Entangled polymers. Phys. Today 36, 33–39 (1983).
20. Gennes, P.-G. de. Introduction to Polymer Dynamics. (CUP Archive, 1990).
21. Prager, S. & Tirrell, M. The healing process at polymer–polymer interfaces. J. Chem. Phys. 75,
5194–5198 (1981).
22. Wool, R. P., Yuan, B.-L. & McGarel, O. J. Welding of polymer interfaces. Polym. Eng. Sci. 29,
1340–1367 (1989).
23. Anderson K.L., Wescott J.T., Carver T.J. & Windle A.H. Mesoscale modelling of polymer
welding. Mater. Sci. Eng. A 365, 14–24 (2004).
24. Ezekoye, O. A., Lowman, C. D., Fahey, M. T. & Hulme-Lowe, A. G. Polymer weld strength
predictions using a thermal and polymer chain diffusion analysis. Polym. Eng. Sci. 38, 976–991
(1998).
25. Wool, R. P. Adhesion at polymer–polymer interfaces: a rigidity percolation approach. Comptes
Rendus Chim. 9, 25–44 (2006).
26. Boiko, Y. M., Guérin, G., Marikhin, V. A. & Prud’homme, R. E. Healing of interfaces of
amorphous and semi-crystalline poly(ethylene terephthalate) in the vicinity of the glass transition
temperature. Polymer 42, 8695–8702 (2001).
27. Xue, Y.-Q., Tervoort, T. A. & Lemstra, P. J. Welding behavior of semicrystalline polymers. 1.
The effect of nonequilibrium chain conformations on autoadhesion of UHMWPE.
Macromolecules 31, 3075–3080 (1998).
28. Xue, Y.-Q., Tervoort, T. A., Rastogi, S. & Lemstra, J. Welding Behavior of Semicrystalline
Polymers. 2. Effect of Cocrystallization on Autoadhesion. Macromolecules 33, 7084–7087
(2000).
29. Yu, W., Peri, S. R., Akgun, B. & Foster, M. D. Manipulation of Polymer/Polymer Interface Width
from Nonequilibrium Deposition. ACS Appl. Mater. Interfaces 5, 2976–2984 (2013).
30. Wunderlich, B. & Czornyj, G. A Study of Equilibrium Melting of Polyethylene. Macromolecules
10, 906–913 (1977).
31. Mueller, C., Capaccio, G., Hiltner, A. & Baer, E. Heat sealing of LLDPE: relationships to melting
and interdiffusion. J. Appl. Polym. Sci. 70, 2021–2030 (1998).
32. Kim, S. et al. Enhanced Interfacial Adhesion between an Amorphous Polymer (Polystyrene) and a
Semicrystalline Polymer [a Polyamide (Nylon 6)]. ACS Appl. Mater. Interfaces 3, 2622–2629
(2011).
33. Buckley, C. P., Wu, J. & Haughie, D. W. The integrity of welded interfaces in ultra high
molecular weight polyethylene: Part 1—Model. Biomaterials 27, 3178–3186 (2006).
34. Wool, R. P. Polymer Interfaces: Structure and Strength. (Hanser-Gardner Publications, 1995).
35. Kim, Y. H. & Wool, R. P. A theory of healing at a polymer-polymer interface. Macromolecules
16, 1115–1120 (1983).
36. Wool, R. P. Self-healing materials: a review. Soft Matter 4, 400–418 (2008).
37. Bousmina, M., Qiu, H., Grmela, M. & Klemberg-Sapieha, J. E. Diffusion at Polymer/Polymer
Interfaces Probed by Rheological Tools. Macromolecules 31, 8273–8280 (1998).
58
38. Marcott, S. A., Ada, S., Gibson, P., Camesano, T. A. & Nagarajan, R. Novel Application of
Polyelectrolyte Multilayers as Nanoscopic Closures with Hermetic Sealing. ACS Appl. Mater.
Interfaces 4, 1620–1628 (2012).
39. Kamal, M. R., Tang, Z. & Huang, T. Morphological characterization of PE blown films by atomic
force microscopy. Int. Polym. Process. 16, 376–387 (2001).
40. Teichert, C., Haas, A., Wallner, G. M. & Lang, R. W. Nanometer scale characterization of
polymer films by atomic-force microscopy. Macromol. Symp. 181, 457–466 (2002).
41. Simpson, G. J., Sedin, D. L. & Rowlen, K. L. Surface Roughness by Contact versus Tapping
Mode Atomic Force Microscopy. Langmuir 15, 1429–1434 (1999).
42. Cole, P. J., Cook, R. F. & Macosko, C. W. Adhesion between Immiscible Polymers Correlated
with Interfacial Entanglements. Macromolecules 36, 2808–2815 (2003).
43. Yang, H., Ward, T. C. & Zhang, W. Interfacial Interpretation of Autohesion of Ethylene/1-Octene
Copolymers by Atomic Force Microscopy. J. Adhes. 83, 1043–1068 (2007).
59
CHAPTER 5
ARTICLE 2: ROLE OF MOLECULAR ARCHITECTURE IN
INTERFACIAL SELF-ADHESION OF POLYETHYLENE FILMS*
Zahra Najarzadeh, Abdellah Ajji
5.1 Abstract
The influence of molecular architecture on interfacial self-adhesion above melting temperature of
polyethylene films was examined in this study. The investigated molecular structures include
molecular weight (Mw), molecular weight distribution (MWD), amount and distribution of long
chain branch (LCB) and short chain branch (SCB) distribution among and along polyethylene
chains. The amount of long and short chain branches was quantified using gel permeation
chromatography (GPC) and nuclear magnetic resonance (NMR) techniques, respectively. The
adhesion strength was measured immediately after melt bonding using T-Peel test. The results
showed that increasing Mw resulted in higher adhesion strength in linear metallocene ethylene α-
olefins. The presence of even a low amount of LCB hinders the reptation motion and diffusion,
and resulted in lower adhesion strength in the metallocene ethylene α-olefins. In addition, highly
branched chains of low density polyethylene (LDPE) yielded to a very low self-adhesion. A
drastic difference in adhesion strength between metallocene and conventional linear low density
polyethylene (LLDPE) was observed and was attributed to the homogeneity versus heterogeneity
of composition distribution, including MWD and SCB distribution. The low interfacial self
adhesion in the conventional polyethylene was concluded to be due to enrichment of highly
branched low molecular weight chains at the surfaces of the films. These segregated chains at the
interface diffuse before the high molecular weight chains located in the bulk.
* Submitted to Macromolecules, March 2014.
60
5.2 Introduction
Interfacial adhesion of polymer surfaces, which is categorized into either symmetric or
asymmetric types, is an immensely complicated subject. Self adhesion is a symmetric type of
adhesion having critical importance in some specific applications such as flexible packaging
industry. It happens through inter-diffusion of chains at the interface at temperatures high enough
to allow chains to perform segmental motion through reptation in a reasonable process time.
Knowing that interface strength development depends on the total molecular crossing density 1,
chain diffusion has the main role in strength build up at interface.
The foundation for our current understanding of chain dynamics in polymer diffusion is reptation
model. Many researchers have tried to explain the reptation mechanism associated with the
influence of several parameters such as molecular weight, repeat unit, long and short chain
branches etc. 1–4
.
Former studies on interfacial adhesion were concerned with the strength of the interface at room
temperature 2,5–7
. To eliminate the additional complication due to crystallization upon cooling, the
focus has been mostly on amorphous polymers 8. Thus, the molecular characteristics for effective
interfacial reinforcement are relatively well established for glassy polymers. But there is less
information on the interfacial strength of semicrystalline polymers 9. Studies on self adhesion of
semicrystalline polymers are limited to a few cases, in which self adhesion occurred at
temperatures higher than the melting point and adhesion strength measurements performed at
room temperature 10–14
.
Another reason for limited fundamental studies on self adhesion in the melt state is that the
measurement of interfacial adhesion between two polymer melts is practically challenging.
Recently, Schach et.al 9 used a custom-designed probe test (known for pressure sensitive
adhesives) to measure the tack of SBR random copolymers. In this method two polymer layers
with different thicknesses of 1 and 200 μm were bonded to silicon and glass substrates,
respectively 9. The thinner layer of SBR (1 μm) was attached to a moving probe. Adhesion
occurred when the probe approached the other layer for a certain contact time and pressure. Then
by recording the required force for debonding in the last step, the adhesion strength was
measured.
61
Although this method might apply for adhesive applications at the industrial scale, it is not
realistic for flexible packaging. In this work, the T-Peel test was used by a machine capable of
measuring the adhesion strength immediately after melt adhesion while interface is still molten.
This technique allows performing adhesion in a fraction of a second and the measurement of
interface strength in a few milliseconds. This creates a unique opportunity to study self adhesion
at very short time which is very scarce in literature.
Since the development and commercialization of metallocene single site catalysts polyolefins,
these have found significant applications and use in packaging industry. They have been used as
sealant layer in various types of packaging structures and their performance was observed to be
far better than that of conventional polyethylenes. However, a clear understanding of the
mechanisms of action and interpretation of this high performance is still to be developed. Single
site catalysts polymerization enabled a great opportunity for the control of polydispersity, type
and distribution of branch, and branch content. These structural features at the molecular scale
have modulated the physical properties of metallocene PE in the solid and melt states, such as
crystallinity, bulk mechanical properties, melt rheology and flow behaviour. The general term of
homogeneous molecular structure used for m-PE, refers to narrow molecular weight distribution,
homogeneous distribution of branches among the chains and along one chain.
To our knowledge, there is no study on the role of molecular architecture of a polymer chain on
the self adhesion strength at the melt state. This work is aimed at investigating the micro-
mechanisms and molecular structure features involved in this property for m-PEs. The
investigated molecular structures include: molecular weight (Mw), molecular weight distribution
(MWD), amount and distribution of long chain branch (LCB), and short chain branch (SCB)
distribution among and along polyethylene chains. To reach this goal, the materials were selected
from a wide range of the polyethylene family from highly branched to linear, high molecular
weight to low, and heterogeneous to homogeneous composition distribution.
5.3 Experiments
5.3.1 Materials and films preparation
Five commercial polyethylene plastomers (mSC1, mSC2, mSC3, mSC4, and mSC5) produced
with Exxpol™ metallocene catalyst were supplied by ExxonMobil. Two commercial long chain
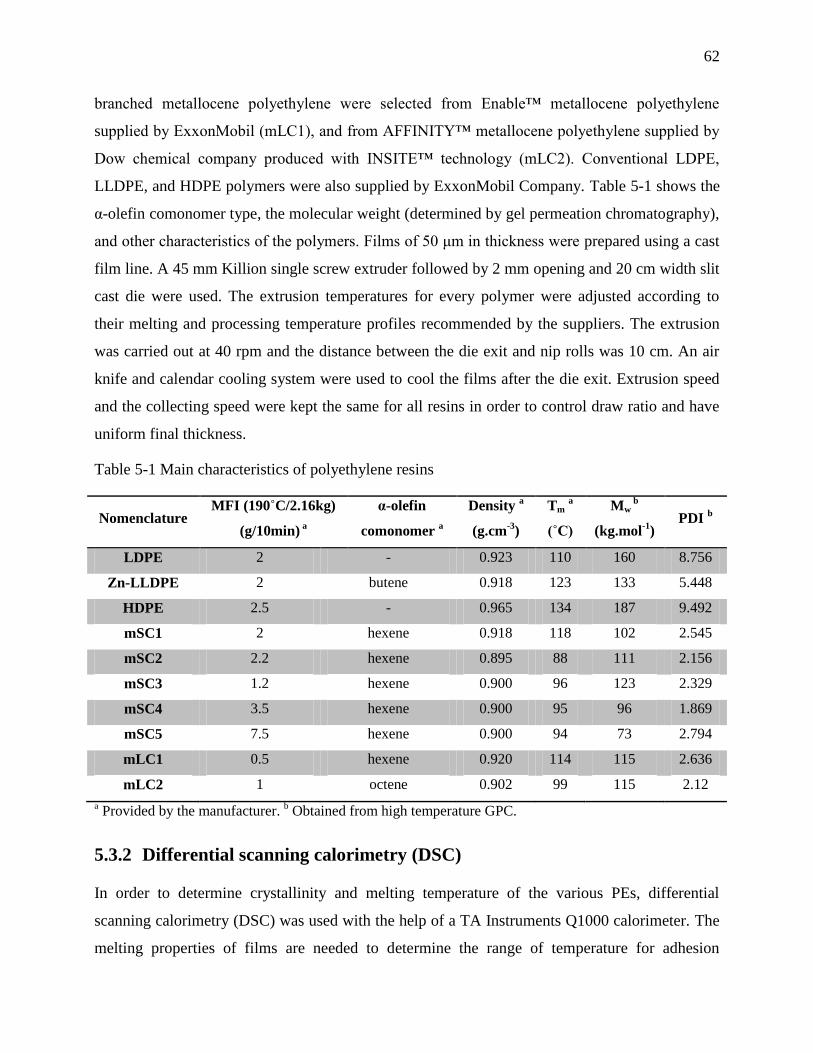
62
branched metallocene polyethylene were selected from Enable™ metallocene polyethylene
supplied by ExxonMobil (mLC1), and from AFFINITY™ metallocene polyethylene supplied by
Dow chemical company produced with INSITE™ technology (mLC2). Conventional LDPE,
LLDPE, and HDPE polymers were also supplied by ExxonMobil Company. Table 5-1 shows the
α-olefin comonomer type, the molecular weight (determined by gel permeation chromatography),
and other characteristics of the polymers. Films of 50 μm in thickness were prepared using a cast
film line. A 45 mm Killion single screw extruder followed by 2 mm opening and 20 cm width slit
cast die were used. The extrusion temperatures for every polymer were adjusted according to
their melting and processing temperature profiles recommended by the suppliers. The extrusion
was carried out at 40 rpm and the distance between the die exit and nip rolls was 10 cm. An air
knife and calendar cooling system were used to cool the films after the die exit. Extrusion speed
and the collecting speed were kept the same for all resins in order to control draw ratio and have
uniform final thickness.
Table 5-1 Main characteristics of polyethylene resins
Nomenclature MFI (190˚C/2.16kg)
(g/10min) a
α-olefin
comonomer a
Density a
(g.cm-3
)
Tm a
(˚C)
Mw b
(kg.mol-1
) PDI
b
LDPE 2 - 0.923 110 160 8.756
Zn-LLDPE 2 butene 0.918 123 133 5.448
HDPE 2.5 - 0.965 134 187 9.492
mSC1 2 hexene 0.918 118 102 2.545
mSC2 2.2 hexene 0.895 88 111 2.156
mSC3 1.2 hexene 0.900 96 123 2.329
mSC4 3.5 hexene 0.900 95 96 1.869
mSC5 7.5 hexene 0.900 94 73 2.794
mLC1 0.5 hexene 0.920 114 115 2.636
mLC2 1 octene 0.902 99 115 2.12
a Provided by the manufacturer.
b Obtained from high temperature GPC.
5.3.2 Differential scanning calorimetry (DSC)
In order to determine crystallinity and melting temperature of the various PEs, differential
scanning calorimetry (DSC) was used with the help of a TA Instruments Q1000 calorimeter. The
melting properties of films are needed to determine the range of temperature for adhesion

63
experiments. The melting temperature and degree of crystallinity of the films were determined
from the first heating ramp. The samples were heated from room temperature to 200°C at a
heating rate of 10°C/min. In order to eliminate initial thermal history, samples were equilibrated
for three minutes at 200°C, then cooled down to -90˚C by cooling rate of 10°C/min to obtain the
crystallization point. For crystallinity determinations, a value of 290 J.g-1
was taken as the
enthalpy of fusion of a 100% crystalline PE 15
.
5.3.3 Nuclear magnetic resonance spectroscopy (NMR)
NMR spectra were recorded on Varian Inova 600 (Agilent, Santa Clara, CA, USA) operating at
frequencies of 150.87 MHz for 13
C, using a double resonance 5mm broadband probe. Spectra
were recorded following the ASTM protocol D-5017 – 96 for the determination of composition
of low density polyethylene. Briefly, the quantitative 13
C NMR spectra were recorded at 120 °C
with 10 s recycle delay, 90° pulses (16 μs long), an acquisition time of 2 s, full decoupling and a
spectral width of 250 ppm. Spectra were accumulated until a signal to noise ratio of 2500:1 was
obtained using 2 Hz exponential apodization.
Samples were dissolved in 1,1,2,2-tetrachloroethane-d2 with concentrations of more than 35%wt
in 10 mm sample tubes to get the much needed sensitivity. Figure 5-1 gives a typical spectrum of
a hexene based ethylene-α-olefin sample and Table 5-2 shows the assignment of the different
chemical shifts according to Randall 16
.
5.3.4 Gel permeation chromatography (GPC)
Molecular weight and molecular weight distribution were determined on a Viscotek HT-GPC
Triple Detection. The samples were dissolved in 1,2,4-trichlorobenzene (TCB) and the
measurements were carried out at 150˚C. The OmniSEC software was used to determine the
number of long chain branches in 104 carbon atom. The calculations were based on tri-functional
Zimm-Stockmayer equation 17–19
.
5.3.5 Interfacial self-adhesion measurements
Adhesion experiments were performed using SL10 Lako-Tool equipment based on T-Peel test
method. Heat bonding was made with two metallic jaws of 19.1 mm×25.4 mm covered by
Teflon. The film samples were cut in 2.54 cm×33 cm strips specimens parallel to machine

64
direction. This method consists in two stages of bonding and peeling: in the first stage, two layers
of film locate between two jaws, then the jaws approach to provide the contact between the two
sides of the film with a controlled pressure for 0.5 s. In the second stage, the jaws were removed
and simultaneously two arms of the machine pull the films to measure the adhesion strength,
while still hot (also called hot tack). To avoid film distortion due to direct contact to heated jaw,
the PE films were laminated to a layer of PET support film using a polyurethane based
solventless adhesive. To obtain reliable results for adhesion in the molten state, the PE films must
be strongly attached to the support film. The adhesion experiments were performed in a range of
jaw temperatures from 50˚C to 140˚C at a constant pressure of 0.5 MPa and dwell time of 0.5 s.
The values reported in adhesion graphs are averages of at least five tests.
5.3.6 Extensional rheology
The melt extensional behaviour of the polymers was determined using the SER geometry of the
ARES Rheometric Scientific rheometer. The data were recorded at a Hencky strain rate of ε =1 s-
1 on samples having dimensions of 13mm×18mm×0.8mm. Since the adhesion measurements
were performed at different temperatures, the melt strength measurements should be also be
performed at the corresponding temperature for every polymer. Thus, in order to achieve
coherent results, Tm+10˚C was selected to be the reference temperature for each resin.
5.4 Results and discussion
5.4.1 Material characterization
Molecular weight and molecular weight distribution, long and short chain branching (LCB and
SCB) are the most important structural variables influencing the properties of polyethylene.
Therefore, it is necessary to obtain qualitative and quantitative information on the nature and
number of chain branches. High resolution 13
C NMR spectroscopy was used to determine the
number of short chain branches per 103 carbon atoms.
Figure 5-1 shows the spectrum of mSC3 as a sample of hexene based ethylene α-olefin
copolymers and the assignment of important chemical shifts. A tabulation of chemical shifts and
assignments are listed in Table 5-2. The nomenclatures and chemical shifts assigned to different
carbonyl groups were introduced by Randall and later developed by others 16
. The Greek
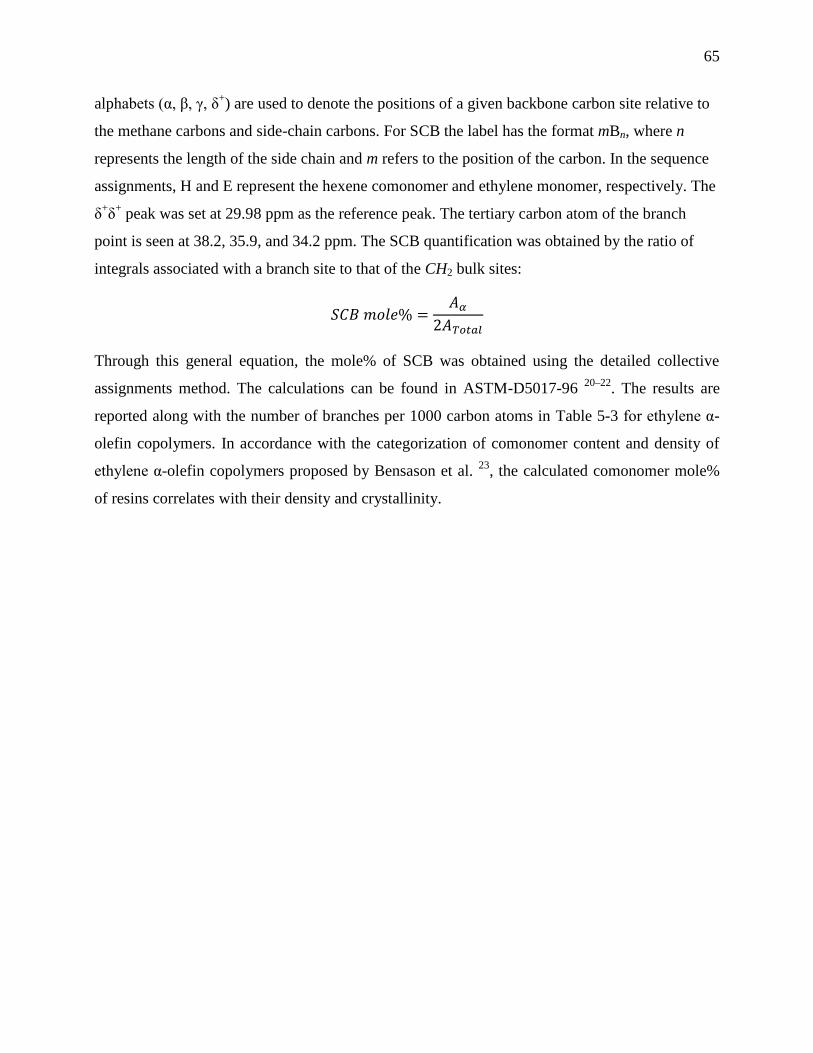
65
alphabets (α, β, γ, δ+) are used to denote the positions of a given backbone carbon site relative to
the methane carbons and side-chain carbons. For SCB the label has the format mBn, where n
represents the length of the side chain and m refers to the position of the carbon. In the sequence
assignments, H and E represent the hexene comonomer and ethylene monomer, respectively. The
δ+δ
+ peak was set at 29.98 ppm as the reference peak. The tertiary carbon atom of the branch
point is seen at 38.2, 35.9, and 34.2 ppm. The SCB quantification was obtained by the ratio of
integrals associated with a branch site to that of the CH2 bulk sites:
Through this general equation, the mole% of SCB was obtained using the detailed collective
assignments method. The calculations can be found in ASTM-D5017-96 20–22
. The results are
reported along with the number of branches per 1000 carbon atoms in Table 5-3 for ethylene α-
olefin copolymers. In accordance with the categorization of comonomer content and density of
ethylene α-olefin copolymers proposed by Bensason et al. 23
, the calculated comonomer mole%
of resins correlates with their density and crystallinity.
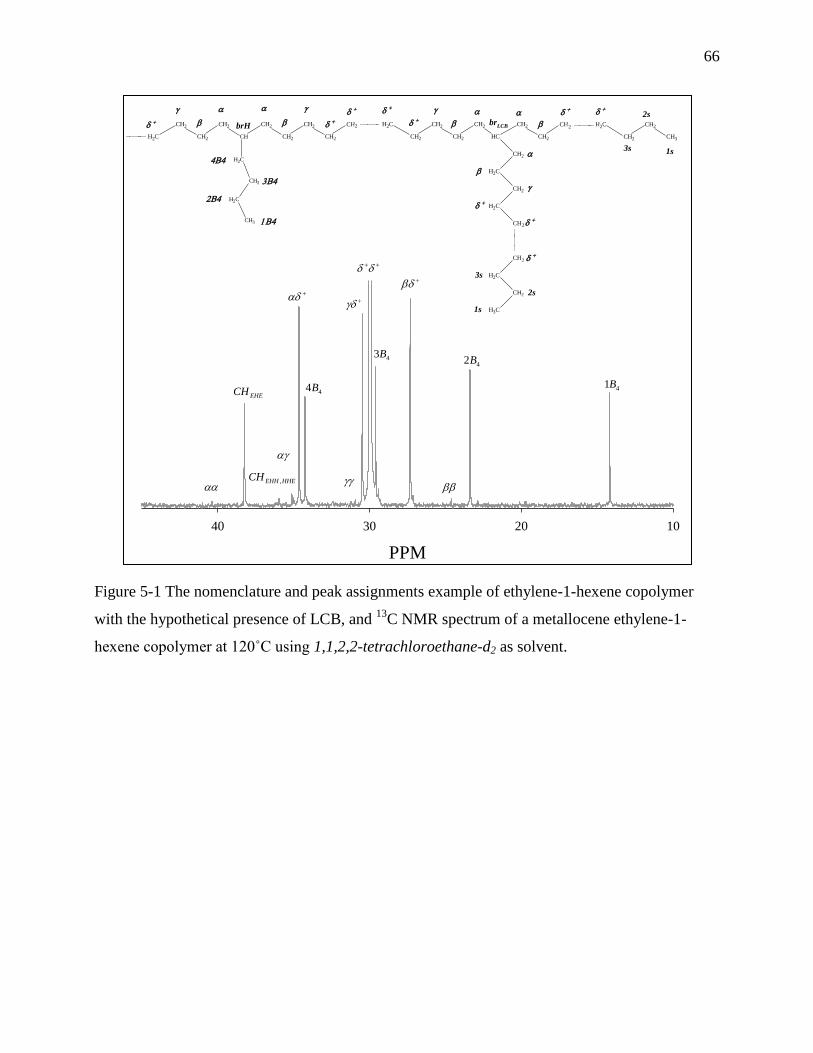
66
Figure 5-1 The nomenclature and peak assignments example of ethylene-1-hexene copolymer
with the hypothetical presence of LCB, and 13
C NMR spectrum of a metallocene ethylene-1-
hexene copolymer at 120˚C using 1,1,2,2-tetrachloroethane-d2 as solvent.
PPM
10203040
41B
42B
43B
44B
EHECH
HHEEHHCH ,
brH brLCB
CH3
CH2
CH2
CH3
1s
2s
3s
CH3
CH2
CH2
CH3CH3
CH2
CH2
CH2
CH
CH2
CH2
CH2
CH2
CH2
CH2
CH2
CH3
CH3 CH3
CH2
CH2
CH2
CH2
CH
CH2
CH2
CH3
CH2
CH2
CH2
CH2
CH3
1s
2s
3s
2 2
2
2 2
2
2
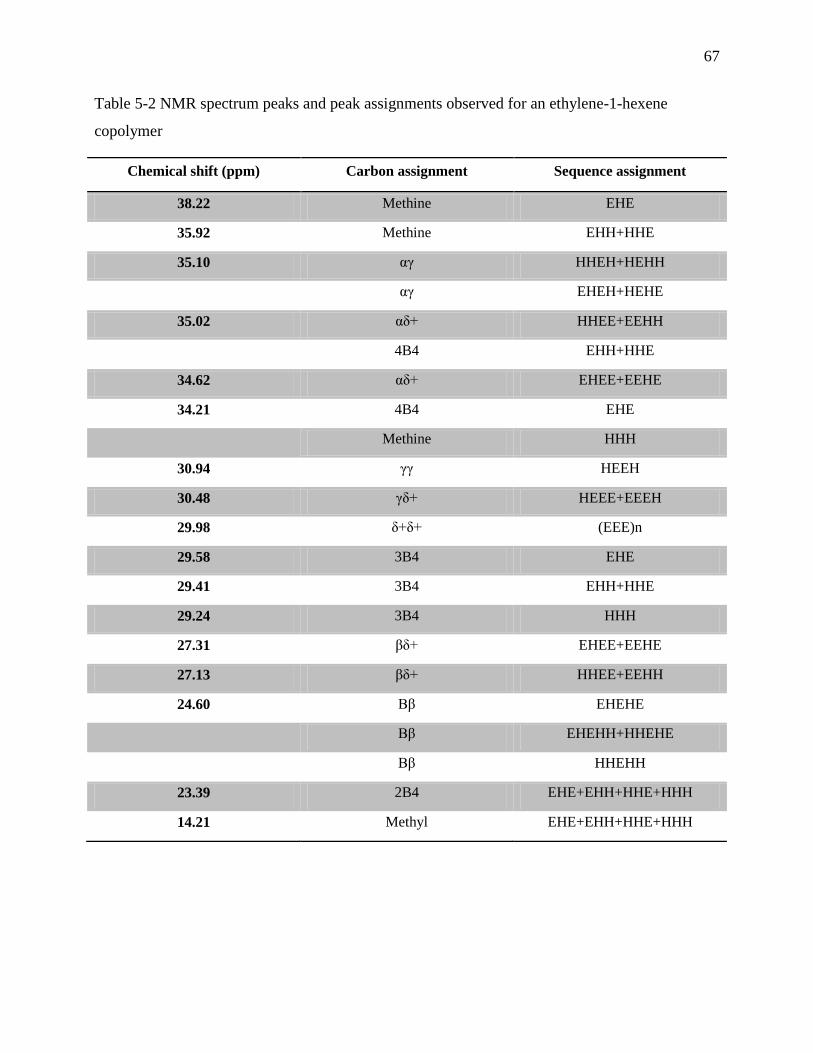
67
Table 5-2 NMR spectrum peaks and peak assignments observed for an ethylene-1-hexene
copolymer
Chemical shift (ppm) Carbon assignment Sequence assignment
38.22 Methine EHE
35.92 Methine EHH+HHE
35.10 αγ HHEH+HEHH
αγ EHEH+HEHE
35.02 αδ+ HHEE+EEHH
4B4 EHH+HHE
34.62 αδ+ EHEE+EEHE
34.21 4B4 EHE
Methine HHH
30.94 γγ HEEH
30.48 γδ+ HEEE+EEEH
29.98 δ+δ+ (EEE)n
29.58 3B4 EHE
29.41 3B4 EHH+HHE
29.24 3B4 HHH
27.31 βδ+ EHEE+EEHE
27.13 βδ+ HHEE+EEHH
24.60 Ββ EHEHE
Ββ EHEHH+HHEHE
Ββ HHEHH
23.39 2B4 EHE+EHH+HHE+HHH
14.21 Methyl EHE+EHH+HHE+HHH
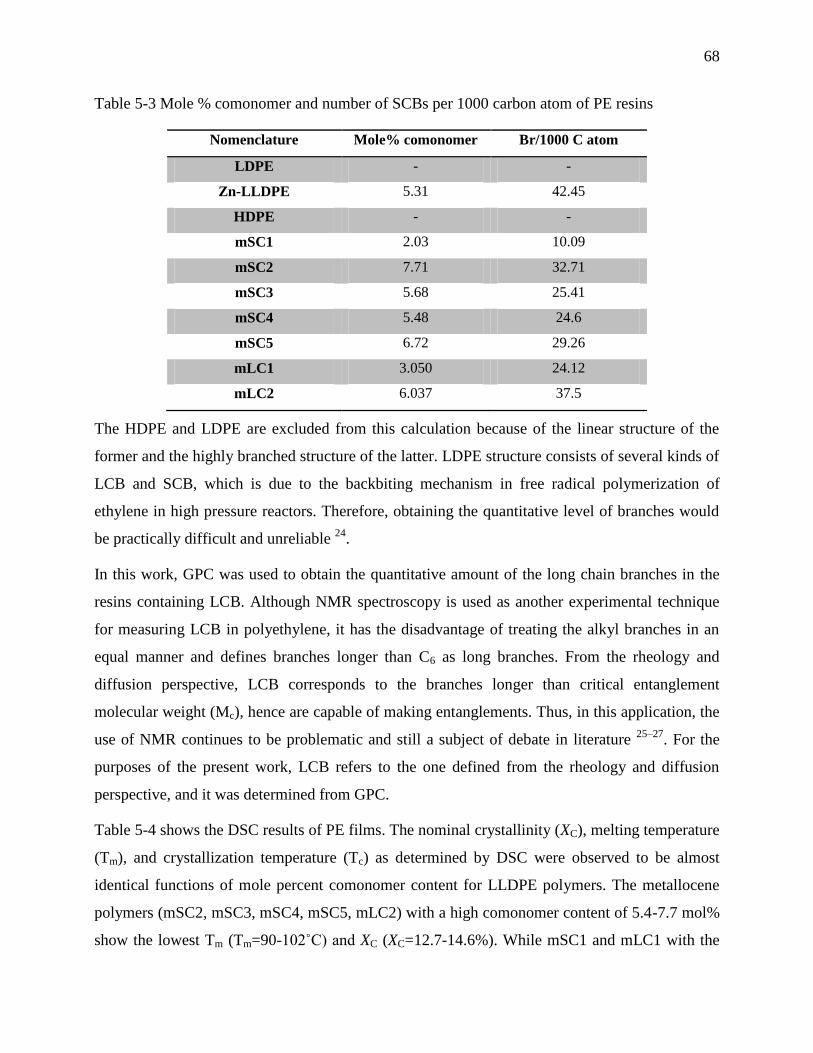
68
Table 5-3 Mole % comonomer and number of SCBs per 1000 carbon atom of PE resins
Nomenclature Mole% comonomer Br/1000 C atom
LDPE - -
Zn-LLDPE 5.31 42.45
HDPE - -
mSC1 2.03 10.09
mSC2 7.71 32.71
mSC3 5.68 25.41
mSC4 5.48 24.6
mSC5 6.72 29.26
mLC1 3.050 24.12
mLC2 6.037 37.5
The HDPE and LDPE are excluded from this calculation because of the linear structure of the
former and the highly branched structure of the latter. LDPE structure consists of several kinds of
LCB and SCB, which is due to the backbiting mechanism in free radical polymerization of
ethylene in high pressure reactors. Therefore, obtaining the quantitative level of branches would
be practically difficult and unreliable 24
.
In this work, GPC was used to obtain the quantitative amount of the long chain branches in the
resins containing LCB. Although NMR spectroscopy is used as another experimental technique
for measuring LCB in polyethylene, it has the disadvantage of treating the alkyl branches in an
equal manner and defines branches longer than C6 as long branches. From the rheology and
diffusion perspective, LCB corresponds to the branches longer than critical entanglement
molecular weight (Mc), hence are capable of making entanglements. Thus, in this application, the
use of NMR continues to be problematic and still a subject of debate in literature 25–27
. For the
purposes of the present work, LCB refers to the one defined from the rheology and diffusion
perspective, and it was determined from GPC.
Table 5-4 shows the DSC results of PE films. The nominal crystallinity (XC), melting temperature
(Tm), and crystallization temperature (Tc) as determined by DSC were observed to be almost
identical functions of mole percent comonomer content for LLDPE polymers. The metallocene
polymers (mSC2, mSC3, mSC4, mSC5, mLC2) with a high comonomer content of 5.4-7.7 mol%
show the lowest Tm (Tm=90-102˚C) and XC (XC=12.7-14.6%). While mSC1 and mLC1 with the
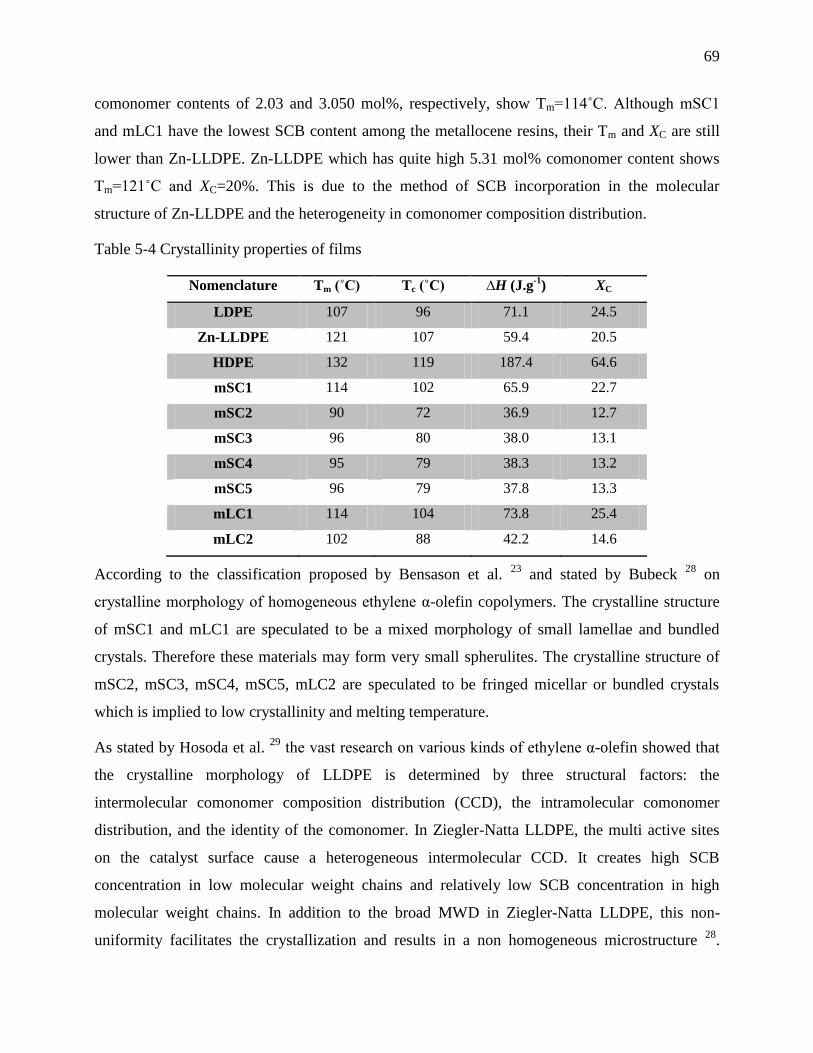
69
comonomer contents of 2.03 and 3.050 mol%, respectively, show Tm=114˚C. Although mSC1
and mLC1 have the lowest SCB content among the metallocene resins, their Tm and XC are still
lower than Zn-LLDPE. Zn-LLDPE which has quite high 5.31 mol% comonomer content shows
Tm=121˚C and XC=20%. This is due to the method of SCB incorporation in the molecular
structure of Zn-LLDPE and the heterogeneity in comonomer composition distribution.
Table 5-4 Crystallinity properties of films
Nomenclature Tm (˚C) Tc (˚C) ∆H (J.g-1
) XC
LDPE 107 96 71.1 24.5
Zn-LLDPE 121 107 59.4 20.5
HDPE 132 119 187.4 64.6
mSC1 114 102 65.9 22.7
mSC2 90 72 36.9 12.7
mSC3 96 80 38.0 13.1
mSC4 95 79 38.3 13.2
mSC5 96 79 37.8 13.3
mLC1 114 104 73.8 25.4
mLC2 102 88 42.2 14.6
According to the classification proposed by Bensason et al. 23
and stated by Bubeck 28
on
crystalline morphology of homogeneous ethylene α-olefin copolymers. The crystalline structure
of mSC1 and mLC1 are speculated to be a mixed morphology of small lamellae and bundled
crystals. Therefore these materials may form very small spherulites. The crystalline structure of
mSC2, mSC3, mSC4, mSC5, mLC2 are speculated to be fringed micellar or bundled crystals
which is implied to low crystallinity and melting temperature.
As stated by Hosoda et al. 29
the vast research on various kinds of ethylene α-olefin showed that
the crystalline morphology of LLDPE is determined by three structural factors: the
intermolecular comonomer composition distribution (CCD), the intramolecular comonomer
distribution, and the identity of the comonomer. In Ziegler-Natta LLDPE, the multi active sites
on the catalyst surface cause a heterogeneous intermolecular CCD. It creates high SCB
concentration in low molecular weight chains and relatively low SCB concentration in high
molecular weight chains. In addition to the broad MWD in Ziegler-Natta LLDPE, this non-
uniformity facilitates the crystallization and results in a non homogeneous microstructure 28
.
70
While in single site-metallocene catalyst LLDPE, intermolecular CCD and intramolecular CCD
are uniform. Then comonomer sequence length distribution is uniform as a result of
intramolecular CCD 28–30
.
SCB can be incorporated in LLDPE by copolymerisation of ethylene with α-olefin monomers, or
by isomerisation reactions during ethylene homopolymerisation. They are incorporated into
ethylene backbone as side branches typically at concentrations of 1- 19 mol%. Presence of SCB
is particularly critical in morphology and solid state properties. Commonly they do not
incorporate into crystal cells and act as structural defects during crystallisation 28,29
and thus
strongly affect size and amount of crystals, ultimately crystallinity, melting temperature,
crystallisation rates, and consequently other solid state bulk properties. As discussed in
connection with Table 5-4 and Table 5-3, DSC is very sensitive to the presence of branching.
Through crystallinity, it provides qualitative insight into the degree of branching 23,28
.
5.4.2 Effect of molecular weight on self-adhesion strength
Experimental investigation of molecular weight influence on self-adhesion strength requires a
careful polymer selection. In order to eliminate the influence of other parameters (such as MWD,
LCB and SCB content) polymers are selected from a group of linear metallocene α-olefin
copolymers. These resins (mSC3, mSC4, mSC5) have narrow MWD and they are produced
through the same polymerization method using the same metallocene catalyst technology. As
seen in Table 5-1 and Table 5-3, they have the same short chain branches length, amount and
distribution.
Figure 5-2 shows interfacial strength of ≈6000, ≈5000, and 3500 N.m-1
for mSC3, mSC4, and
mSC5, respectively. It implies that the higher Mw results in a stronger interface. This is in
agreement with what was reported in literature. It was found that long chains are more effective
than shorter ones in strengthening the interface. The long molecules are more efficient to increase
the energy of separation between polymer films than short chains 3,31,32
.
On the other hand, in adhesion measurement using the peeling method, the melt strength of the
material is determinant 8,31,33
because the extensional field/force at the head of crack tip
associates the adhesion strength to viscoelastic response of the material 33
. In melt adhesion,
interface strength is developed by the diffusion of chains across the interface. By peeling, the

71
applied force for separation of the films at the interface is determined by dis-entanglement or
deformation of the entangled network of polymer chains at the interface. Peeling pulls out the
diffused spots across interfaces which were developed as stitches between two surfaces. If v
designates the peel rate and is 33 mm.s-1
and h the film thickness=50 μm, the strain rate could be
estimated roughly from
relation. The strain rate would be ≈660 s
-1. So peeling is equivalent
to applying an extensional force on entangled chains at very high strain rates. Therefore, the
peeling of interface correlates the adhesion strength with melt strength of polymers 34–36
. This
was confirmed for self-adhesion of un-crosslinked elastomers, polyethylene and other
thermoplastics 8,31,37,38
. In the case of mSC3, mSC4, and mSC5, since the molecular architecture
is similar, the reptation dynamic occurs at a similar mechanism. Then the melt strength is the
distinct feature between them. The transient elongational viscosity of the resins at 1 s-1
strain rate
is illustrated in Figure 5-3. It is clear from those results that the melt strength curves have the
same sequence as adhesion strengths in Figure 5-2.
Figure 5-2 Self adhesion strength of mSC3, mSC4, and mSC5 films as a function of temperature,
obtained from T-peel tests with peel rate of 33 mm.s-1
Temperature(oC)
90 100 110 120 130 140
Adh
esio
n S
tren
gth
(N
.m-1
)
0
1000
2000
3000
4000
5000
6000
7000
mSC3
mSC4
mSC5
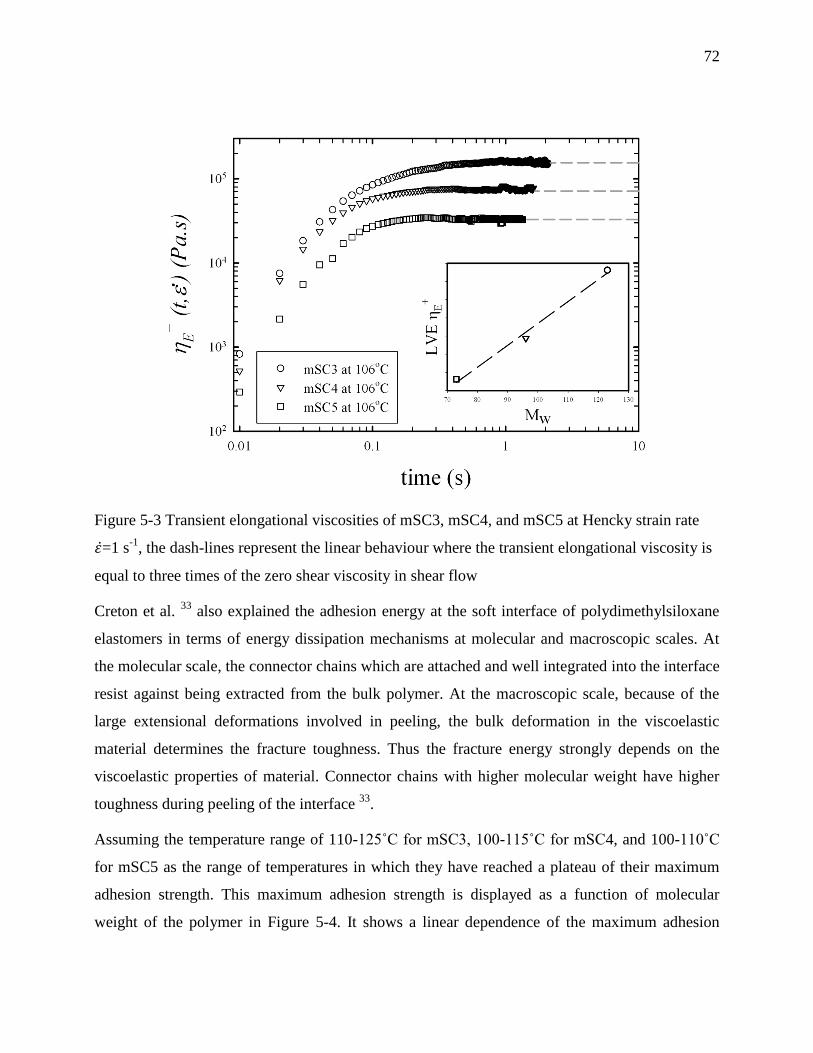
72
Figure 5-3 Transient elongational viscosities of mSC3, mSC4, and mSC5 at Hencky strain rate
=1 s-1
, the dash-lines represent the linear behaviour where the transient elongational viscosity is
equal to three times of the zero shear viscosity in shear flow
Creton et al. 33
also explained the adhesion energy at the soft interface of polydimethylsiloxane
elastomers in terms of energy dissipation mechanisms at molecular and macroscopic scales. At
the molecular scale, the connector chains which are attached and well integrated into the interface
resist against being extracted from the bulk polymer. At the macroscopic scale, because of the
large extensional deformations involved in peeling, the bulk deformation in the viscoelastic
material determines the fracture toughness. Thus the fracture energy strongly depends on the
viscoelastic properties of material. Connector chains with higher molecular weight have higher
toughness during peeling of the interface 33
.
Assuming the temperature range of 110-125˚C for mSC3, 100-115˚C for mSC4, and 100-110˚C
for mSC5 as the range of temperatures in which they have reached a plateau of their maximum
adhesion strength. This maximum adhesion strength is displayed as a function of molecular
weight of the polymer in Figure 5-4. It shows a linear dependence of the maximum adhesion

73
strength of mSC3, mSC4, and mSC5 to molecular weight. To our knowledge, there is no report
on the direct and linear dependence of self adhesion strength to molecular weight.
In the measurement of self-adhesion strength at temperatures higher than Tm, it is practically not
possible to separate the influence of interdiffusion and melt elasticity because both of them are
affected by molecular weight. According to the reptation model, the self diffusion coefficient
Dself is proportional to M-2
. However, the definition of Dself is based on the total displacement of
center of mass of a chain or diffusion of the order of Rg of the chain 1. In fact, it was reported that
the full strength at the interface could be developed by interdiffusion of the chains in the order of
a fraction of Rg (≈0.81Rg) 1,39
. Therefore the diffusion of long chains is sufficient to strengthen
the interface as long as they are able to make entanglements on the other side of the interface.
This length is a chain length of the order of the critical molecular weight of entanglements (Mc).
For polyethylene, this molecular weight was reported to be ≈4000 g.mol-1
40–42
. Therefore, as
presented in Figure 5-3 and Figure 5-4 for the resins with similar molecular architecture
investigated in this study, the influence of melt elasticity is dominant.
Figure 5-4 Linear dependence of maximum self adhesion strength of mSC3, mSC4, and mSC5
films to molecular weight
Mw (kg.mol
-1)
70 80 90 100 110 120 130
Ad
hes
ion
Str
eng
th (
N.m
-1)
1000
2000
3000
4000
5000
6000
7000
mSC5
mSC4
mSC3
74
In the following sections, the focus will be on the influence of PEs chain structural characteristics
such as long chain branches, molecular weight distribution and heterogeneity of composition
distribution on adhesion strength. In order to eliminate the effect of molecular weight, polymers
were selected from the same range of Mw. In addition, because of the slight differences in Mw and
to exclude its potential minor effect, the adhesion strengths were normalized by dividing by Mw,
since they are linearly related as shown above. The normalized ultimate adhesion strengths for
these three resins overlapped at the value ≈0.048 N.m-1
/g.mol-1
. Therefore, dividing by Mw
removed the gap between adhesion strengths of mSC3, mSC4, and mSC5. Following this result,
the measured adhesion strength of polymers in this work would be normalized by their Mw.
5.4.3 Effect of long chain branching on self-adhesion strength
There are two kinds of long chain branch (LCB) containing polymers in the polyethylene family:
Conventional LCB polymers (such as LDPE) synthesized by free-radical polymerization at high
temperature and pressure which have very broad molecular weight distribution, heterogenous
LCB length, and distribution; Sparsely long chain branch ethylene α-olefin copolymers with
narrow MWD, homogenous branch composition, and distribution (such as metallocene ethylene
α-olefin copolymers containing sparsely LCB). The advent of metallocene catalysts has offered
this great opportunity for producing sparsely LCB content PEs. It improved the control of the
final ethylene backbone and branching microstructure through synthesis. In this work, the effect
of LCB on self-adhesion will be evaluated in these two categories.
As mentioned earlier, long-chain branching has a profound effect on melt rheology and process-
ability of polyethylenes. Even at very low branching densities, such as 1 LCB/104 carbon atoms,
melt elasticity and strain hardening was reported to be influenced by the presence of the long
branches 43
. This is due to the involvement of these side chains in entanglements and playing an
anchor role in polymer melt.
As mentioned above, LCB densities were determined quantitatively (albeit averaged over all
molecules present) using high temperature GPC. Table 5-4 shows LCB contents of LDPE,
mLC1, and mLC2 determined by GPC. Generally, the presence of LCB changes the dynamics of
chain diffusion from simple reptation to arm retraction, which retards the movement of chains
along their backbone.
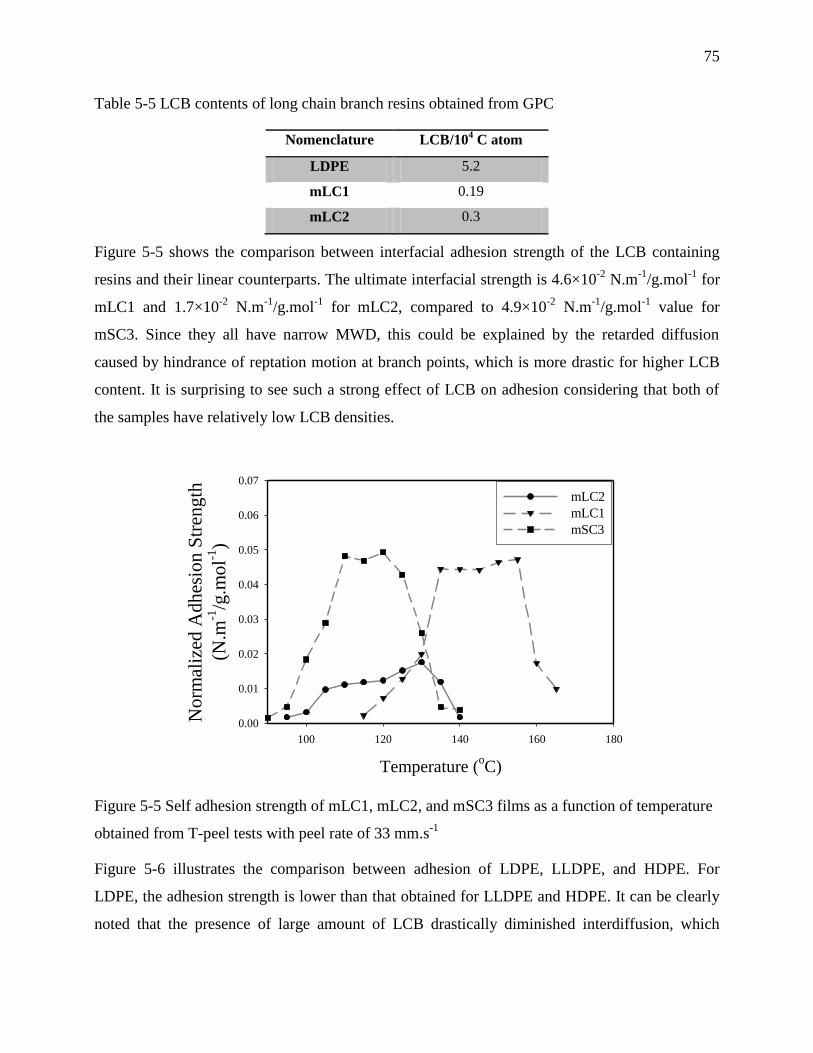
75
Table 5-5 LCB contents of long chain branch resins obtained from GPC
Nomenclature LCB/104 C atom
LDPE 5.2
mLC1 0.19
mLC2 0.3
Figure 5-5 shows the comparison between interfacial adhesion strength of the LCB containing
resins and their linear counterparts. The ultimate interfacial strength is 4.6×10⁻²
N.m-1
/g.mol-1
for
mLC1 and 1.7×10⁻²
N.m-1
/g.mol-1
for mLC2, compared to 4.9×10⁻²
N.m-1
/g.mol-1
value for
mSC3. Since they all have narrow MWD, this could be explained by the retarded diffusion
caused by hindrance of reptation motion at branch points, which is more drastic for higher LCB
content. It is surprising to see such a strong effect of LCB on adhesion considering that both of
the samples have relatively low LCB densities.
Figure 5-5 Self adhesion strength of mLC1, mLC2, and mSC3 films as a function of temperature
obtained from T-peel tests with peel rate of 33 mm.s-1
Figure 5-6 illustrates the comparison between adhesion of LDPE, LLDPE, and HDPE. For
LDPE, the adhesion strength is lower than that obtained for LLDPE and HDPE. It can be clearly
noted that the presence of large amount of LCB drastically diminished interdiffusion, which
Temperature (oC)
100 120 140 160 180
Norm
aliz
ed A
dh
esio
n S
tren
gth
(N.m
-1/g
.mol-1
)
0.00
0.01
0.02
0.03
0.04
0.05
0.06
0.07
mLC2
mLC1
mSC3
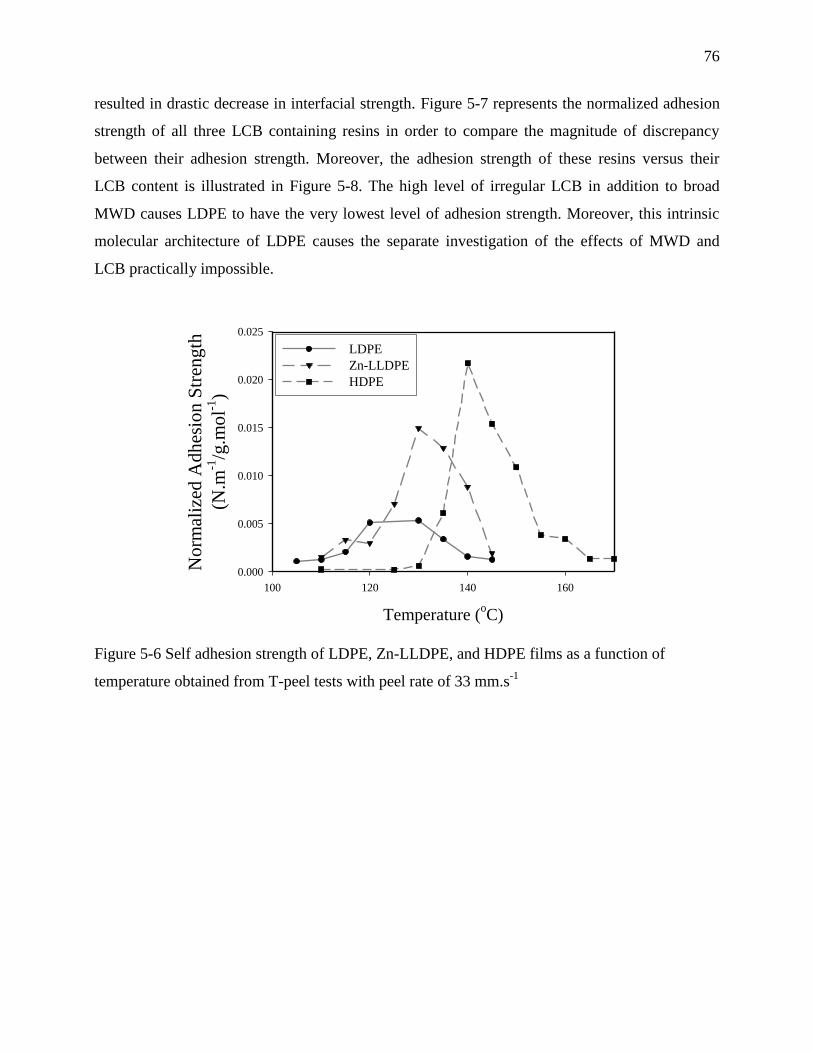
76
resulted in drastic decrease in interfacial strength. Figure 5-7 represents the normalized adhesion
strength of all three LCB containing resins in order to compare the magnitude of discrepancy
between their adhesion strength. Moreover, the adhesion strength of these resins versus their
LCB content is illustrated in Figure 5-8. The high level of irregular LCB in addition to broad
MWD causes LDPE to have the very lowest level of adhesion strength. Moreover, this intrinsic
molecular architecture of LDPE causes the separate investigation of the effects of MWD and
LCB practically impossible.
Figure 5-6 Self adhesion strength of LDPE, Zn-LLDPE, and HDPE films as a function of
temperature obtained from T-peel tests with peel rate of 33 mm.s-1
Temperature (oC)
100 120 140 160
No
rmal
ized
Ad
hes
ion
Str
eng
th
(N.m
-1/g
.mo
l-1)
0.000
0.005
0.010
0.015
0.020
0.025
LDPE
Zn-LLDPE
HDPE
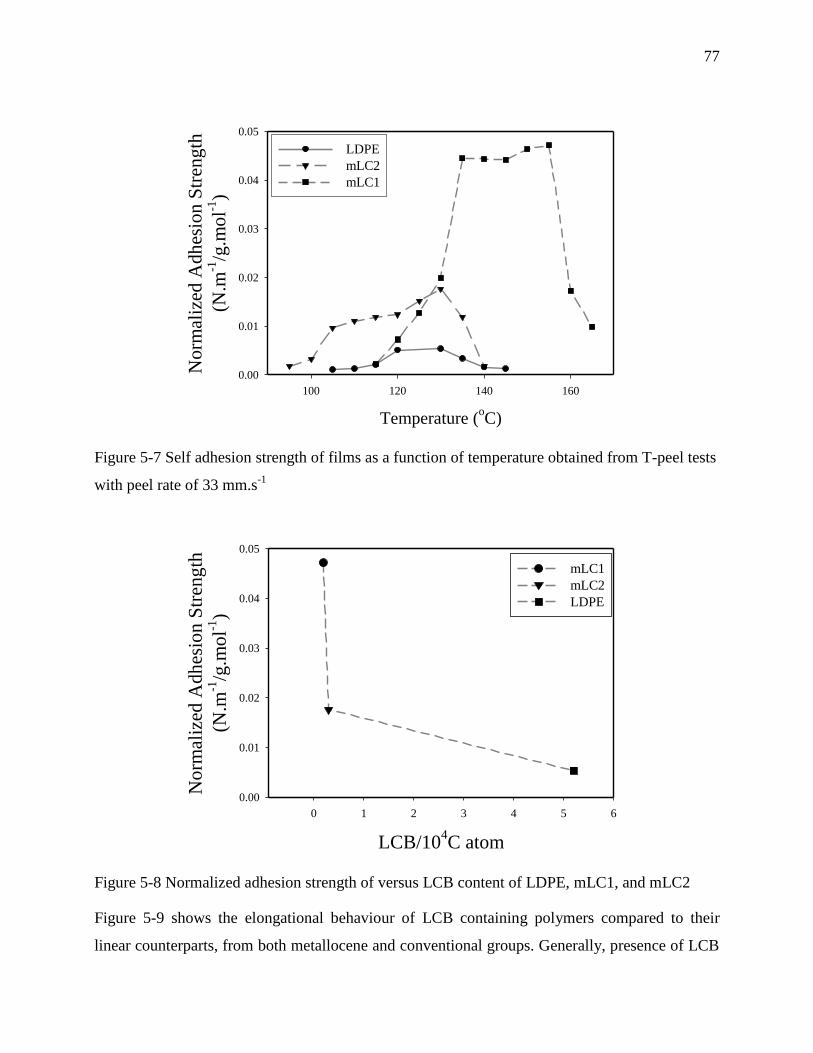
77
Figure 5-7 Self adhesion strength of films as a function of temperature obtained from T-peel tests
with peel rate of 33 mm.s-1
Figure 5-8 Normalized adhesion strength of versus LCB content of LDPE, mLC1, and mLC2
Figure 5-9 shows the elongational behaviour of LCB containing polymers compared to their
linear counterparts, from both metallocene and conventional groups. Generally, presence of LCB
Temperature (oC)
100 120 140 160
Norm
aliz
ed A
dh
esio
n S
tren
gth
(N.m
-1/g
.mol-1
)
0.00
0.01
0.02
0.03
0.04
0.05
LDPE
mLC2
mLC1
LCB/104C atom
0 1 2 3 4 5 6
No
rmal
ized
Ad
hes
ion
Str
eng
th
(N.m
-1/g
.mo
l-1)
0.00
0.01
0.02
0.03
0.04
0.05
mLC1
mLC2
LDPE
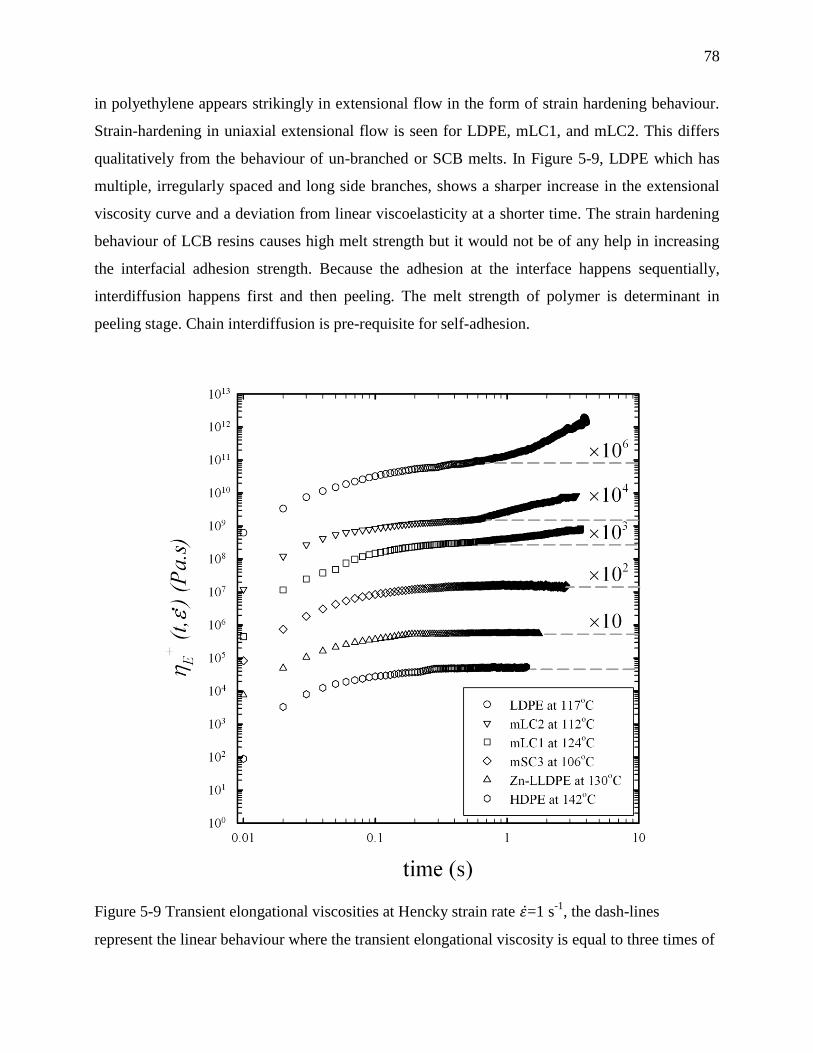
78
in polyethylene appears strikingly in extensional flow in the form of strain hardening behaviour.
Strain-hardening in uniaxial extensional flow is seen for LDPE, mLC1, and mLC2. This differs
qualitatively from the behaviour of un-branched or SCB melts. In Figure 5-9, LDPE which has
multiple, irregularly spaced and long side branches, shows a sharper increase in the extensional
viscosity curve and a deviation from linear viscoelasticity at a shorter time. The strain hardening
behaviour of LCB resins causes high melt strength but it would not be of any help in increasing
the interfacial adhesion strength. Because the adhesion at the interface happens sequentially,
interdiffusion happens first and then peeling. The melt strength of polymer is determinant in
peeling stage. Chain interdiffusion is pre-requisite for self-adhesion.
Figure 5-9 Transient elongational viscosities at Hencky strain rate =1 s-1
, the dash-lines
represent the linear behaviour where the transient elongational viscosity is equal to three times of
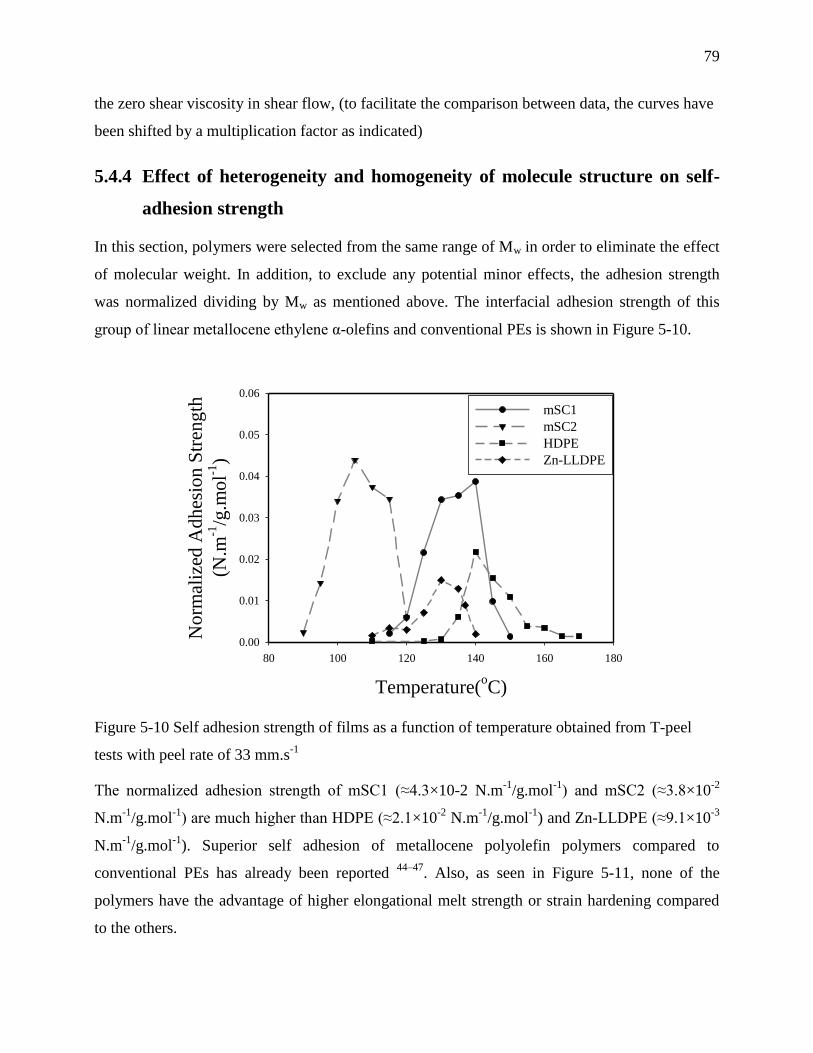
79
the zero shear viscosity in shear flow, (to facilitate the comparison between data, the curves have
been shifted by a multiplication factor as indicated)
5.4.4 Effect of heterogeneity and homogeneity of molecule structure on self-
adhesion strength
In this section, polymers were selected from the same range of Mw in order to eliminate the effect
of molecular weight. In addition, to exclude any potential minor effects, the adhesion strength
was normalized dividing by Mw as mentioned above. The interfacial adhesion strength of this
group of linear metallocene ethylene α-olefins and conventional PEs is shown in Figure 5-10.
Figure 5-10 Self adhesion strength of films as a function of temperature obtained from T-peel
tests with peel rate of 33 mm.s-1
The normalized adhesion strength of mSC1 (≈4.3×10⁻² N.m-1
/g.mol-1) and mSC2 (≈3.8×10
-2
N.m-1
/g.mol-1) are much higher than HDPE (≈2.1×10
-2 N.m
-1/g.mol
-1) and Zn-LLDPE (≈9.1×10
-3
N.m-1
/g.mol-1
). Superior self adhesion of metallocene polyolefin polymers compared to
conventional PEs has already been reported 44–47
. Also, as seen in Figure 5-11, none of the
polymers have the advantage of higher elongational melt strength or strain hardening compared
to the others.
Temperature(oC)
80 100 120 140 160 180
No
rmal
ized
Ad
hes
ion
Str
eng
th
(N.m
-1/g
.mo
l-1)
0.00
0.01
0.02
0.03
0.04
0.05
0.06
mSC1
mSC2
HDPE
Zn-LLDPE
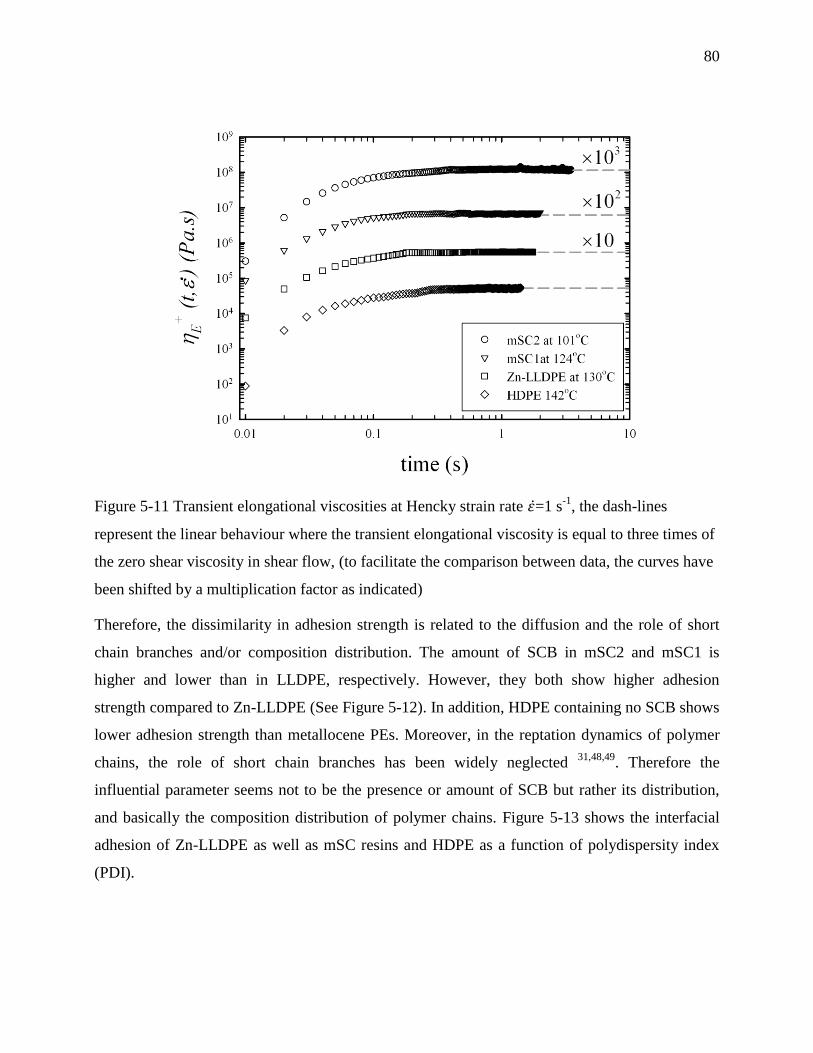
80
Figure 5-11 Transient elongational viscosities at Hencky strain rate =1 s-1
, the dash-lines
represent the linear behaviour where the transient elongational viscosity is equal to three times of
the zero shear viscosity in shear flow, (to facilitate the comparison between data, the curves have
been shifted by a multiplication factor as indicated)
Therefore, the dissimilarity in adhesion strength is related to the diffusion and the role of short
chain branches and/or composition distribution. The amount of SCB in mSC2 and mSC1 is
higher and lower than in LLDPE, respectively. However, they both show higher adhesion
strength compared to Zn-LLDPE (See Figure 5-12). In addition, HDPE containing no SCB shows
lower adhesion strength than metallocene PEs. Moreover, in the reptation dynamics of polymer
chains, the role of short chain branches has been widely neglected 31,48,49
. Therefore the
influential parameter seems not to be the presence or amount of SCB but rather its distribution,
and basically the composition distribution of polymer chains. Figure 5-13 shows the interfacial
adhesion of Zn-LLDPE as well as mSC resins and HDPE as a function of polydispersity index
(PDI).
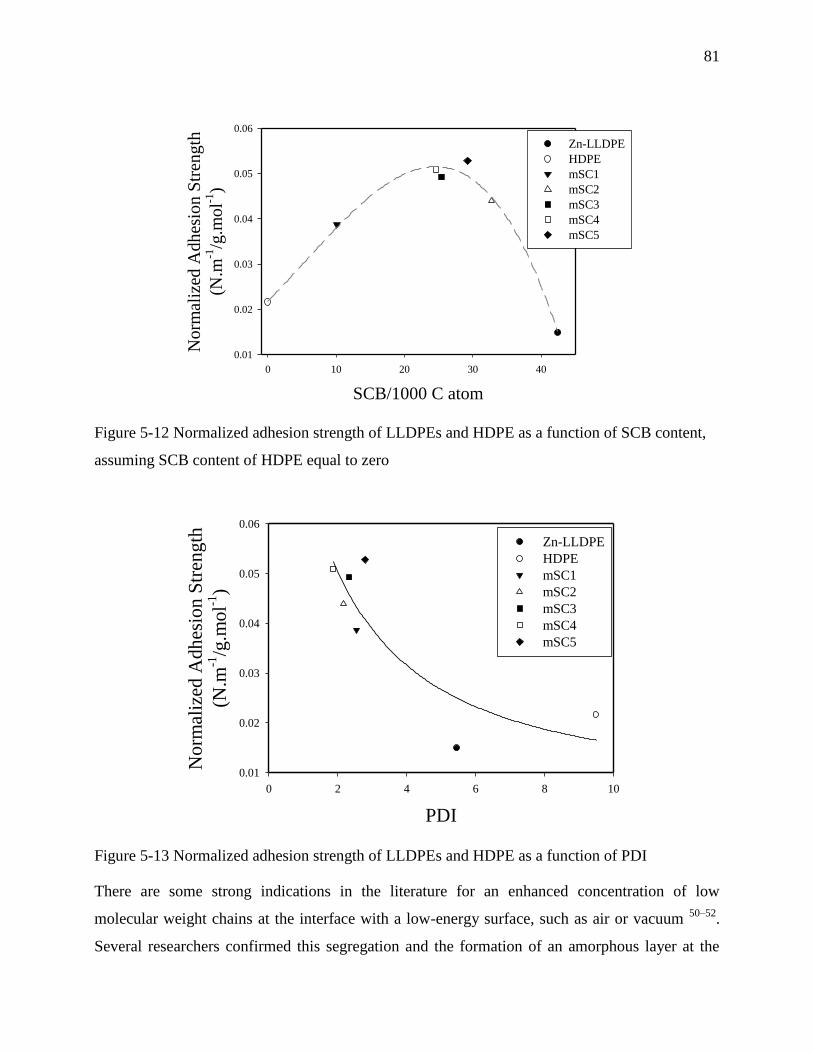
81
Figure 5-12 Normalized adhesion strength of LLDPEs and HDPE as a function of SCB content,
assuming SCB content of HDPE equal to zero
Figure 5-13 Normalized adhesion strength of LLDPEs and HDPE as a function of PDI
There are some strong indications in the literature for an enhanced concentration of low
molecular weight chains at the interface with a low-energy surface, such as air or vacuum 50–52
.
Several researchers confirmed this segregation and the formation of an amorphous layer at the
SCB/1000 C atom
0 10 20 30 40
No
rmal
ized
Ad
hes
ion
Str
eng
th
(N.m
-1/g
.mo
l-1)
0.01
0.02
0.03
0.04
0.05
0.06
Zn-LLDPE
HDPE
mSC1
mSC2
mSC3
mSC4
mSC5
PDI
0 2 4 6 8 10
No
rmal
ized
Ad
hes
ion
Str
eng
th
(N.m
-1/g
.mo
l-1)
0.01
0.02
0.03
0.04
0.05
0.06
Zn-LLDPE
HDPE
mSC1
mSC2
mSC3
mSC4
mSC5
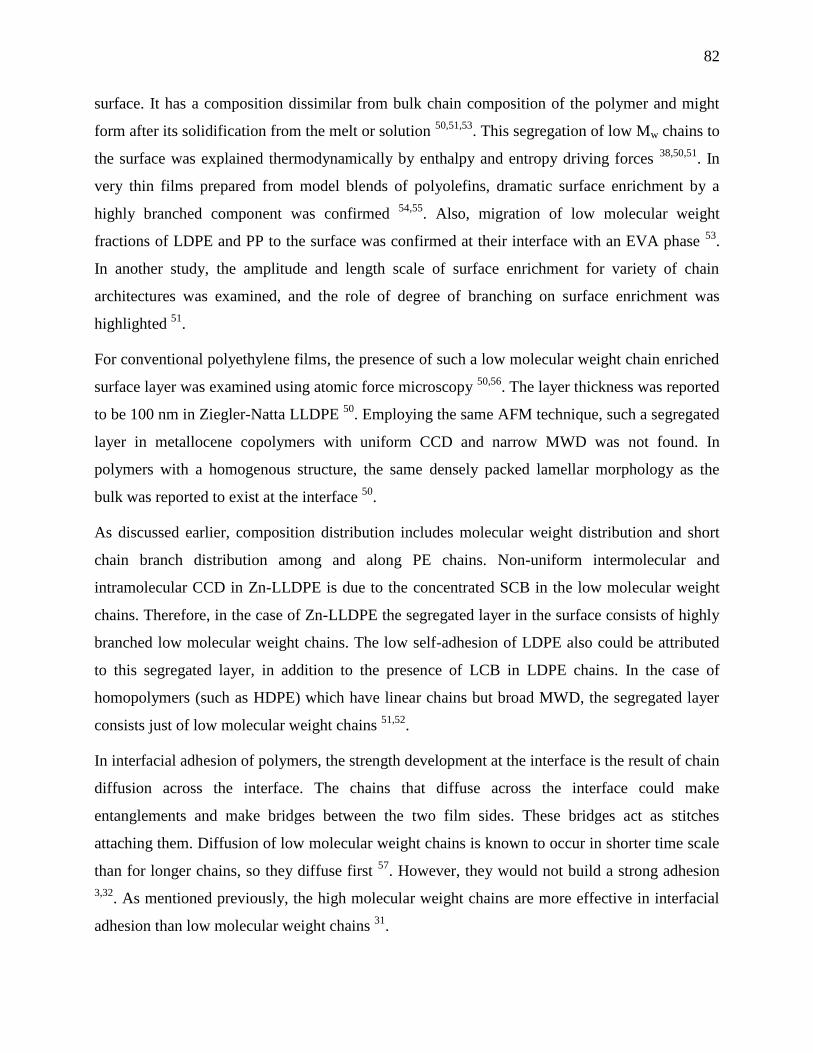
82
surface. It has a composition dissimilar from bulk chain composition of the polymer and might
form after its solidification from the melt or solution 50,51,53
. This segregation of low Mw chains to
the surface was explained thermodynamically by enthalpy and entropy driving forces 38,50,51
. In
very thin films prepared from model blends of polyolefins, dramatic surface enrichment by a
highly branched component was confirmed 54,55
. Also, migration of low molecular weight
fractions of LDPE and PP to the surface was confirmed at their interface with an EVA phase 53
.
In another study, the amplitude and length scale of surface enrichment for variety of chain
architectures was examined, and the role of degree of branching on surface enrichment was
highlighted 51
.
For conventional polyethylene films, the presence of such a low molecular weight chain enriched
surface layer was examined using atomic force microscopy 50,56
. The layer thickness was reported
to be 100 nm in Ziegler-Natta LLDPE 50
. Employing the same AFM technique, such a segregated
layer in metallocene copolymers with uniform CCD and narrow MWD was not found. In
polymers with a homogenous structure, the same densely packed lamellar morphology as the
bulk was reported to exist at the interface 50
.
As discussed earlier, composition distribution includes molecular weight distribution and short
chain branch distribution among and along PE chains. Non-uniform intermolecular and
intramolecular CCD in Zn-LLDPE is due to the concentrated SCB in the low molecular weight
chains. Therefore, in the case of Zn-LLDPE the segregated layer in the surface consists of highly
branched low molecular weight chains. The low self-adhesion of LDPE also could be attributed
to this segregated layer, in addition to the presence of LCB in LDPE chains. In the case of
homopolymers (such as HDPE) which have linear chains but broad MWD, the segregated layer
consists just of low molecular weight chains 51,52
.
In interfacial adhesion of polymers, the strength development at the interface is the result of chain
diffusion across the interface. The chains that diffuse across the interface could make
entanglements and make bridges between the two film sides. These bridges act as stitches
attaching them. Diffusion of low molecular weight chains is known to occur in shorter time scale
than for longer chains, so they diffuse first 57
. However, they would not build a strong adhesion
3,32. As mentioned previously, the high molecular weight chains are more effective in interfacial
adhesion than low molecular weight chains 31
.
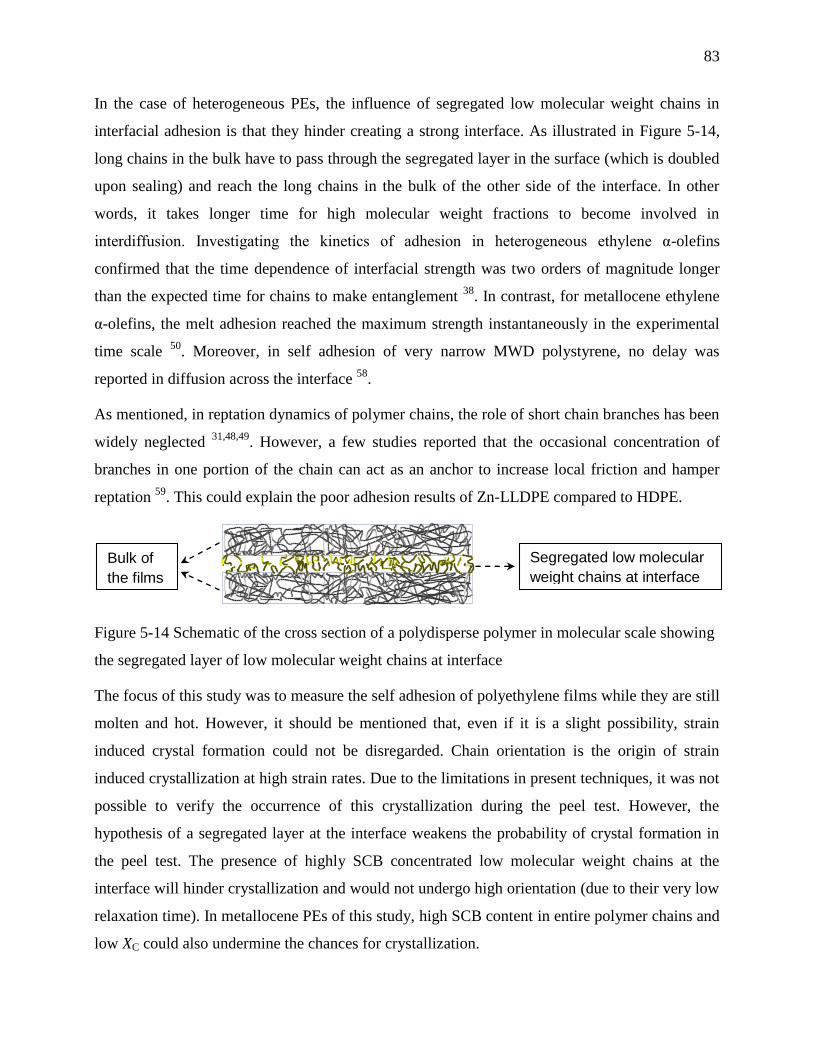
83
In the case of heterogeneous PEs, the influence of segregated low molecular weight chains in
interfacial adhesion is that they hinder creating a strong interface. As illustrated in Figure 5-14,
long chains in the bulk have to pass through the segregated layer in the surface (which is doubled
upon sealing) and reach the long chains in the bulk of the other side of the interface. In other
words, it takes longer time for high molecular weight fractions to become involved in
interdiffusion. Investigating the kinetics of adhesion in heterogeneous ethylene α-olefins
confirmed that the time dependence of interfacial strength was two orders of magnitude longer
than the expected time for chains to make entanglement 38
. In contrast, for metallocene ethylene
α-olefins, the melt adhesion reached the maximum strength instantaneously in the experimental
time scale 50
. Moreover, in self adhesion of very narrow MWD polystyrene, no delay was
reported in diffusion across the interface 58
.
As mentioned, in reptation dynamics of polymer chains, the role of short chain branches has been
widely neglected 31,48,49
. However, a few studies reported that the occasional concentration of
branches in one portion of the chain can act as an anchor to increase local friction and hamper
reptation 59
. This could explain the poor adhesion results of Zn-LLDPE compared to HDPE.
Figure 5-14 Schematic of the cross section of a polydisperse polymer in molecular scale showing
the segregated layer of low molecular weight chains at interface
The focus of this study was to measure the self adhesion of polyethylene films while they are still
molten and hot. However, it should be mentioned that, even if it is a slight possibility, strain
induced crystal formation could not be disregarded. Chain orientation is the origin of strain
induced crystallization at high strain rates. Due to the limitations in present techniques, it was not
possible to verify the occurrence of this crystallization during the peel test. However, the
hypothesis of a segregated layer at the interface weakens the probability of crystal formation in
the peel test. The presence of highly SCB concentrated low molecular weight chains at the
interface will hinder crystallization and would not undergo high orientation (due to their very low
relaxation time). In metallocene PEs of this study, high SCB content in entire polymer chains and
low XC could also undermine the chances for crystallization.
Segregated low molecular
weight chains at interface
Bulk of
the films

84
5.5 Conclusions
In this work, the influence of chain architecture on interfacial self-adhesion of polyethylene
above melting temperature was investigated. It was particularly pointed out that the level of
interfacial self-adhesion strength is the outcome of chain interdiffusion across the interface and
melt strength of polymer. The following conclusions can be drawn:
1. For stereo regular and narrow molecular weight distribution metallocene ethylene α-
olefins containing equal amount of SCB, higher adhesion strength was observed for the
polymer with higher Mw. Having all the other characteristics similar, a linear dependence
of adhesion strength to Mw was observed. Interfacial self-adhesion at temperatures higher
than the melting point was closely related to their melt elasticity.
2. The presence of even low amount of long chain branches hinders the reptation motion and
diffusion, and results in lower adhesion force in metallocene ethylene α-olefins. In
addition, highly branched chains cause LDPE to have very low self-adhesion.
3. Heterogeneity in composition distribution of conventional polyethylene results in poor
self-adhesion performance. In these reins long chains in the bulk have to pass through the
segregated layer at the surface, which is doubled upon sealing, and reach the long chains
in bulk of the other side of the interface, in order to make entanglements and strengthen
the interface.
5.6 Acknowledgement
We would like to thank A.Arnold in Université du Québec à Montréal (UQAM) for performing
NMR experiments, his excellent technical assistance, and helpful advices on NMR analysis.
Financial support from 3S Pack NSERC/Saputo/Prolamina industrial research chair is gratefully
acknowledged.
5.7 References
1. Kim, K. D., Sperling, L. H., Klein, A. & Hammouda, B. Reptation Time, Temperature,
and Cosurfactant Effects on the Molecular Interdiffusion Rate during Polystyrene Latex
Film Formation. Macromolecules 27, 6841–6850 (1994).

85
2. Wool, R. P., Yuan, B.-L. & McGarel, O. J. Welding of polymer interfaces. Polymer
Engineering & Science 29, 1340–1367 (1989).
3. Kausch, H. H., Nguyen, T. Q. & Petrovska-Delacrétaz, D. Chain interdiffusion:
macromolecules between Rouse and de Gennes. Phys. Scr. 1991, 57 (1991).
4. Wool, R. P. & O’Connor, K. M. A theory crack healing in polymers. Journal of Applied
Physics 52, 5953–5963 (1981).
5. Jud, K., Kausch, H. H. & Williams, J. G. Fracture mechanics studies of crack healing and
welding of polymers. J Mater Sci 16, 204–210 (1981).
6. Prager, S. & Tirrell, M. The healing process at polymer–polymer interfaces. The Journal
of Chemical Physics 75, 5194–5198 (1981).
7. Kausch, H. H. & Tirrell, M. Polymer Interdiffusion. Annual Review of Materials Science
19, 341–377 (1989).
8. Wool, R. P. Polymer Interfaces: Structure and Strength. (Hanser-Gardner Publications,
1995).
9. Schach, R. & Creton, C. Adhesion at interfaces between highly entangled polymer melts.
Journal of Rheology 52, 749–767 (2008).
10. Boiko, Y. M., Guérin, G., Marikhin, V. A. & Prud’homme, R. E. Healing of interfaces of
amorphous and semi-crystalline poly(ethylene terephthalate) in the vicinity of the glass
transition temperature. Polymer 42, 8695–8702 (2001).
11. Gent, A. N., Kim, E.-G. & Ye, P. Autohesion of crosslinked polyethylene. Journal of
Polymer Science Part B: Polymer Physics 35, 615–622 (1997).
12. Smith, G. D., Plummer, C. J. G., Bourban, P.-E. & Månson, J.-A. E. Non-isothermal
fusion bonding of polypropylene. Polymer 42, 6247–6257 (2001).
13. Xue, Y.-Q., Tervoort, T. A. & Lemstra, P. J. Welding behavior of semicrystalline
polymers. 1. The effect of nonequilibrium chain conformations on autoadhesion of
UHMWPE. Macromolecules 31, 3075–3080 (1998).
14. Xue, Y.-Q., Tervoort, T. A., Rastogi, S. & Lemstra, J. Welding Behavior of
Semicrystalline Polymers. 2. Effect of Cocrystallization on Autoadhesion.
Macromolecules 33, 7084–7087 (2000).
15. Wunderlich, B. & Czornyj, G. A Study of Equilibrium Melting of Polyethylene.
Macromolecules 10, 906–913 (1977).
16. Randall, J. C. A Review of High Resolution Liquid 13carbon Nuclear Magnetic
Resonance Characterizations of Ethylene-Based Polymers. Journal of Macromolecular
Science, Part C: Polymer Reviews 29, 201–317 (1989).
17. Zimm, B. H. & Stockmayer, W. H. The Dimensions of Chain Molecules Containing
Branches and Rings. The Journal of Chemical Physics 17, 1301–1314 (2004).
18. Zimm, B. H. & Kilb, R. W. Dynamics of branched polymer molecules in dilute solution.
Journal of Polymer Science 37, 19–42 (1959).

86
19. Yu, Y., DesLauriers, P. J. & Rohlfing, D. C. SEC-MALS method for the determination of
long-chain branching and long-chain branching distribution in polyethylene. Polymer 46,
5165–5182 (2005).
20. Hsieh, E. T. & Randall, J. C. Monomer sequence distributions in ethylene-1-hexene
copolymers. Macromolecules 15, 1402–1406 (1982).
21. RANDALL J. C. & HSIEH E. T. in NMR and Macromolecules 247, 131–151 (American
Chemical Society, 1984).
22. D20 Committee. Test Method for Determination of Linear Low Density Polyethylene
(LLDPE) Composition by Carbon-13 Nuclear Magnetic Resonance. (ASTM
International,2009).
23. Bensason, S. et al. Classification of homogeneous ethylene-octene copolymers based on
comonomer content. Journal of Polymer Science Part B: Polymer Physics 34, 1301–1315
(1996).
24. Bovey, F. A., Schilling, F. C., McCrackin, F. L. & Wagner, H. L. Short-Chain and Long-
Chain Branching in Low-Density Polyethylene. Macromolecules 9, 76–80 (1976).
25. Klimke, K. et al. Optimisation and Application of Polyolefin Branch Quantification by
Melt-State 13C NMR Spectroscopy. Macromolecular Chemistry and Physics 207, 382–
395 (2006).
26. Pollard, M. et al. Observation of Chain Branching in Polyethylene in the Solid State and
Melt via 13C NMR Spectroscopy and Melt NMR Relaxation Time Measurements.
Macromolecules 37, 813–825 (2004).
27. Shroff, R. N. & Mavridis, H. Assessment of NMR and Rheology for the Characterization
of LCB in Essentially Linear Polyethylenes. Macromolecules 34, 7362–7367 (2001).
28. Bubeck, R. A. Structure–property relationships in metallocene polyethylenes. Materials
Science and Engineering: R: Reports 39, 1–28 (2002).
29. Hosoda, S. et al. Effect of the Sequence Length Distribution on the Lamellar Crystal
Thickness and Thickness Distribution of Polyethylene: Perfectly Equisequential ADMET
Polyethylene vs Ethylene/α-Olefin Copolymer. Macromolecules 44, 313–319 (2011).
30. Hung, J., Cole, A. P. & Waymouth, R. M. Control of Sequence Distribution of Ethylene
Copolymers: Influence of Comonomer Sequence on the Melting Behavior of Ethylene
Copolymers. Macromolecules 36, 2454–2463 (2003).
31. Roland, C. M. & Boehm, G. G. A. Macromolecular diffusion and the autoadhesion of
polybutadiene. Macromolecules 18, 1310–1314 (1985).
32. Su, G. M., Best, K., Ranganathan, T., Emrick, T. & Crosby, A. J. Tailored Nanoparticles
for Enhancing Polymer Adhesion. Macromolecules 44, 5256–5261 (2011).
33. Léger, L. & Creton, C. Adhesion mechanisms at soft polymer interfaces. Phil. Trans. R.
Soc. A 366, 1425–1442 (2008).
34. Micic, P. & Bhattacharya, S. N. Rheology of LLDPE, LDPE and LLDPE/LDPE blends
and its relevance to the film blowing process. Polymer international 49, 1580–1589
(2000).
87
35. Ghijsels, A., Ente, J. & Raadsen, J. Melt Strength Behavior of PE and its Relation to
Bubble Stability in Film Blowing. International Polymer Processing 5, 284–286 (1990).
36. La Mantia, F. P. & Acierno, D. Influence of the molecular structure on the melt strength
and extensibility of polyethylenes. Polymer Engineering & Science 25, 279–283 (1985).
37. Brown, H. R. The Adhesion Between Polymers. Annual Review of Materials Science 21,
463–489 (1991).
38. Qureshi, N. Z., Stepanov, E. V., Capaccio, G., Hiltner, A. & Baer, E. Self-adhesion of
polyethylene in the melt. 1. Heterogeneous copolymers. Macromolecules 34, 1358–1364
(2001).
39. Wool, R. P. Adhesion at polymer–polymer interfaces: a rigidity percolation approach.
Comptes Rendus Chimie 9, 25–44 (2006).
40. Wool, R. P. Self-healing materials: a review. Soft Matter 4, 400–418 (2008).
41. Vega, J. F., Rastogi, S., Peters, G. W. M. & Meijer, H. E. H. Rheology and reptation of
linear polymers. Ultrahigh molecular weight chain dynamics in the melt. Journal of
Rheology (1978-present) 48, 663–678 (2004).
42. Fetters, L. J., Lohse, D. J. & Colby, R. H. in Physical Properties of Polymers Handbook
43. Wang, W.-J., Yan, D., Zhu, S. & Hamielec, A. E. Kinetics of Long Chain Branching in
Continuous Solution Polymerization of Ethylene Using Constrained Geometry
Metallocene. Macromolecules 31, 8677–8683 (1998).
44. Halle, R. W. & Davis, D. S. Heat sealing linear ethylene plastomers to ionomers or
LLDPEs. Tappi journal 78, 200–206 (1995).
45. Farley, J. M., Meka, P., Stehling, F. C., Trudell, B. C. & Kurtzman, M. B. United States
Patent: 5530065 - Heat sealable films and articles made therefrom. (1996).
46. Shih, H. H., Wong, C. M., Wang, Y. C., Huang, C. J. & Wu, C. C. Hot tack of
metallocene catalyzed polyethylene and low-density polyethylene blend. Journal of
Applied Polymer Science 73, 1769–1773 (1999).
47. Majumdar, A. & Kale, D. D. Properties of films made from ternary blends of metallocene
and conventional polyolefins. Journal of Applied Polymer Science 81, 53–57 (2001).
48. Von Seggern, J., Klotz, S. & Cantow, H. J. Reptation and constraint release in linear
polymer melts: an experimental study. Macromolecules 24, 3300–3303 (1991).
49. Pearson, D. S., Fetters, L. J., Graessley, W. W., Ver Strate, G. & von Meerwall, E.
Viscosity and self-diffusion coefficient of hydrogenated polybutadiene. Macromolecules
27, 711–719 (1994).
50. Qureshi, N. Z. et al. Self-adhesion of polyethylene in the melt. 2. Comparison of
heterogeneous and homogeneous copolymers. Macromolecules 34, 3007–3017 (2001).
51. Wu, D. T. & Fredrickson, G. H. Effect of Architecture in the Surface Segregation of
Polymer Blends. Macromolecules 29, 7919–7930 (1996).
52. Jones, R. A. & Richards, R. W. Polymers at surfaces and interfaces. (Cambridge
University Press, 1999).
88
53. McEvoy, R. L. & Krause, S. Interfacial Interactions between Polyethylene and
Polypropylene and Some Ethylene-Containing Copolymers. Macromolecules 29, 4258–
4266 (1996).
54. Scheffold, F. et al. Surface phase behavior in binary polymer mixtures. II. Surface
enrichment from polyolefin blends. The Journal of Chemical Physics 104, 8795–8806
(1996).
55. Brant, P., Karim, A., Douglas, J. F. & Bates, F. S. Surface Composition of Amorphous
and Crystallizable Polyethylene Blends As Measured by Static SIMS. Macromolecules
29, 5628–5634 (1996).
56. Magonov, S. & Godovsky, Y. Atomic force microscopy, Part 8: Visualization of granular
nanostructure in crystalline polymers. American Laboratory 31, 52–58 (1999).
57. Schuman, T. et al. Solid state structure and melting behavior of interdiffused
polyethylenes in microlayers. Polymer 40, 7373–7385 (1999).
58. Reiter, G. & Steiner, U. in Application of Scattering Methods to the Dynamics of Polymer
Systems (Ewen, B., Fischer, E. W. & Fytas, G.) 93–96 (Steinkopff, 1993).
59. Schuman, T. et al. Interdiffusion of linear and branched polyethylene in microlayers
studied via melting behavior. Macromolecules 31, 4551–4561 (1998).
89
CHAPTER 6
ARTICLE 3: INTERFACIAL SELF-ADHESION OF POLYETHYLENE
BLENDS: THE ROLE OF LONG CHAIN BRANCHING AND
EXTENSIONAL RHEOLOGY*
Zahra Najarzadeh, Abdellah Ajji
6.1 Abstract
The interfacial self-adhesion strength of polyethylene binary blends in temperatures higher than
Tm was investigated in relation to their components’ structures and elongational rheological
properties. Four binary blends were prepared from the combination of a conventional
polyethylene; LDPE or Ziegler-Natta LLDPE, with a metallocene catalyzed ethylene α-olefin
copolymer; linear (Linear-m) or long chain branched (LCB-m). Differential scanning calorimetry
(DSC) melting curve of the blend films showed the gradual shift of Tm and partial
cocrystallization for all blend compositions, which influenced the adhesion temperature.
Interfacial bonding was carried out through intimate contact under slight pressure and heat for 0.5
s. Adhesion strength was measured by peeling immediately after sealing, while the adherents
were still in molten state. Incorporation of a metallocene, of both kinds, into conventional PEs
enhanced the self adhesion. The adhesion strength of the blends containing 60wt% metallocene
resins was far lower than the superior adhesion strength of neat metallocene resins. This was due
to the formation of a segregated layer of highly branched short chains of LDPE or LLDPE at the
surface of films. Blending with Linear-m caused higher enhancement in adhesion strength than
blending with LCB-m. This was attributed to the faster reptation of linear chains, hence superior
diffusion across the interface. The larger increase of adhesion strength was observed for all
compositions of LDPE blends compared to their LLDPE counterparts. This suggested that for
LDPE blends, a fast diffusion was provided by both Linear-m and LCB-m. The upper and lower
limits of the temperature range in which the film showed a plateau of its highest adhesion
strength were determined for all compositions. The temperature window of plateau adhesion
* Submitted to Rheologica Acta, April 2014.
90
strength for LDPE blends was broader than their Zn-LLDPE counterparts. This work suggests
that the final plateau temperature (Tpf) can be correlated with the area under stress-strain curve of
extensional rheological measurements. Also, the higher melt toughness can result in a broader
adhesion strength plateau.
6.2 Introduction
Self-adhesion in glassy or semicrystalline polymers is created by heating the materials above
their glass transition or melting temperature to permit interdiffusion and is referred to as welding,
sealing or crack healing. This area of melt adhesion strength is an ongoing topic in fundamental
polymer research. So far, the majority of studies on self-adhesion of either semicrystalline or
glassy polymers have been concentrated on the adhesion strength after cooling 1–4
. However, in
some applications, the strength of the joint is critical while it is still molten and under tension.
For example in modern machinery of flexible packaging industry where the speed must be as
high as possible, the heated joint should resist the stress caused by the weight of the product
inside the packaged. The strength of an interface is estimated as the required force when
separating the adherents, while they are still molten and hot. The melt strength of the adherent is
critical as well as its ability for interdiffusion at the interface 5.
In the case of semicrystalline polymers, the focus has been on measuring the interfacial adhesion
after heated bonding at room temperature where crystallization occur 6–13
. One of the main
reasons for limited fundamental studies on self adhesion in the melt state is that the measurement
of interfacial adhesion between two polymer melts is challenging. Therefore, there is less
information on interfacial adhesion of semicrystalline polymers at temperatures higher than the
melting point.
The main distinction between adhesion measurement before and after cooling is not the joining
mechanism but in peeling and fracture mechanics. Fracture toughness is controlled by the local
yielding mechanisms and the rheological properties of the materials, and thus tends to differ
significantly before and after cooling 6,8,14
.
The use of single-site catalyst technology for the polymerization of olefins allows the efficient
control of the molecular structure and led to the formation of polyethylene chains with narrow
MWD and relatively homogeneous comonomer distributions among and along chains. This novel
91
technology has been particularly useful for more uniform α-olefin comonomer incorporation in
ethylene chains than it is with conventional Ziegler-Natta catalysts. This technology offered also
the possibility for the production of metallocene catalyzed ethylene olefins with controlled long
chain branches 15
.
In a previous work 16
, the influence of molecular architecture such as molecular weight (Mw),
molecular weight distribution (MWD), amount and distribution of long chain branch (LCB), and
short chain branch (SCB) distribution among and along polyethylene chains on interfacial self-
adhesion at temperatures higher than melting point was studied. However, because of economical
concerns and difficulties in metallocene extrusion and film processing, they have been used in
blends with conventional PEs. In addition, the improved toughness, clarity, mechanical properties
and down gauging are the advantages of these blends. Metallocene resins have been the subject
of extensive studies on thermal and rheological properties as well as miscibility and process
ability. Several reports investigated the miscibility/immiscibility of LDPE/m-LLDPE and Zn-
LLDPE/m-LLDPE blends 17–23
. The main outcome of these studies was that the blend properties
depend on Mw, MWD, blend composition, comonomer type and the content of each component.
Due to the broad diversity of these parameters in PEs, a universal conclusion might not be
accurate. However, the majority of these studies reported the miscibility in the melt state and
partial miscibility with the probability of partial co-crystallization in solid state 17–23
.
To our knowledge, there is no study on interfacial adhesion of polyethylene blends at
temperatures higher than the melting point. In this study, hot tack equipment was used in order to
seal film specimens above the melting point and measure peeling force immediately after sealing.
This technique provided the possibility to measure the adhesion strength in the first milliseconds
of peeling. This creates a unique opportunity to study self adhesion at very short time, which is
very limited in literature.
In this study, two metallocene ethylene α-olefin copolymers were selected. To investigate the role
of sparse LCB in metallocene chains in the blends with conventional PEs, one contains a low
level of LCB while its counterpart has no LCB. They were individually blended with Zn-LLDPE
and LDPE at 20, 40 and 60wt%. Accordingly, by producing four types of blends we investigated
the presence of LCB based on branch distribution and content in this work. The adhesion strength
experiments were discussed with regard to the melting behaviour and melting temperature which
92
control adhesion temperature. The correlation between the adhesion strength of the blends and
the extensional rheology was also explored at different temperatures.
Results of this study bring new insights about the behaviour of polyethylene blends in interfacial
self-adhesion at molten stage and under tension. This is of particular interest for modern
machinery of high speed flexible packaging.
6.3 Experiments
6.3.1 Materials and films preparation
Conventional LDPE and LLDPE resins and the commercial metallocene, linear and containing
sparse LCB ethylene α-olefin copolymers, were supplied by ExxonMobil Company. Table 6-1
shows the main characteristics of these resins. Films from blends of conventional/metallocene
polyethylene resins containing 20, 40, and 60wt% of metallocene resins were prepared using a
cast film line. A 45mm Killion single screw extruder followed by 2 mm opening and 20 cm width
slit cast die was used. Films of 50μm in thickness were prepared from the entire blend
compositions. The temperature profile along the barrel (from hopper to die) was set at
160/180/190/200/200ºC. The extrusion was carried out at 40 rpm and the distance between the
die exit to the nip roll was 10 cm. An air knife and calendar cooling system were used to cool the
films after the die exit. Extrusion speed and the collecting speed were kept the same for all resins
in order to control draw ratio and have uniform final thickness.
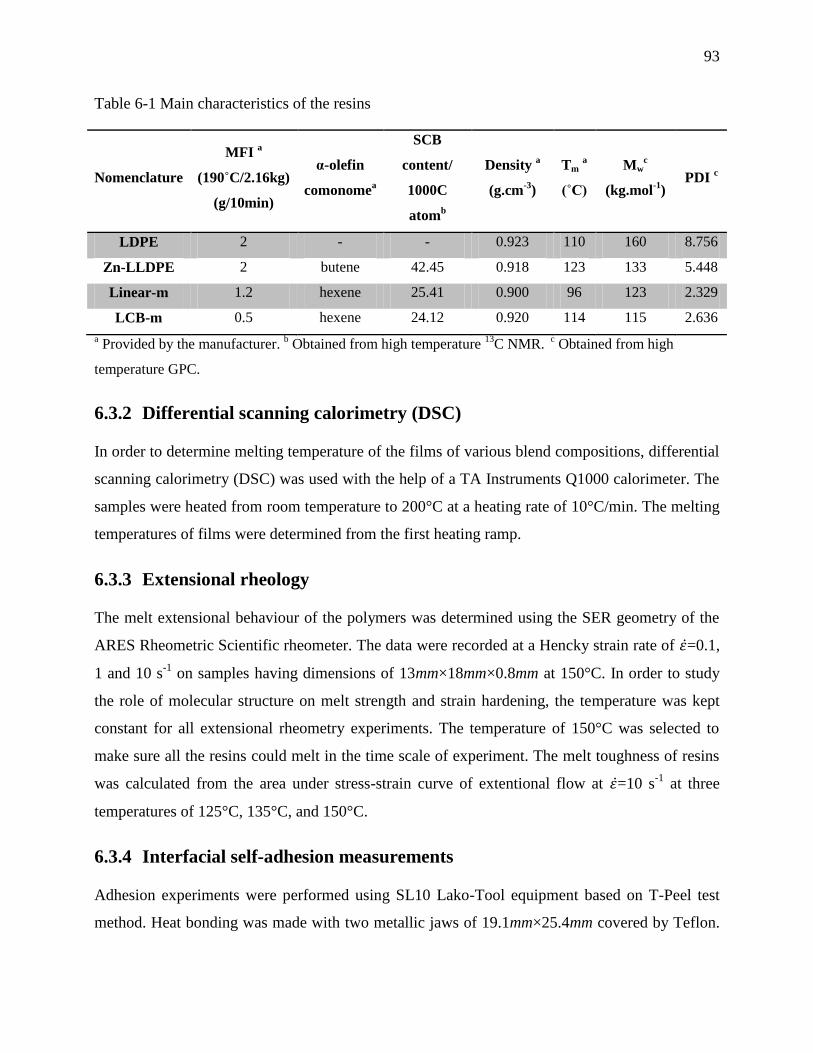
93
Table 6-1 Main characteristics of the resins
Nomenclature
MFI a
(190˚C/2.16kg)
(g/10min)
α-olefin
comonomea
SCB
content/
1000C
atomb
Density a
(g.cm-3
)
Tm a
(˚C)
Mwc
(kg.mol-1
) PDI
c
LDPE 2 - - 0.923 110 160 8.756
Zn-LLDPE 2 butene 42.45 0.918 123 133 5.448
Linear-m 1.2 hexene 25.41 0.900 96 123 2.329
LCB-m 0.5 hexene 24.12 0.920 114 115 2.636
a Provided by the manufacturer.
b Obtained from high temperature
13C NMR.
c Obtained from high
temperature GPC.
6.3.2 Differential scanning calorimetry (DSC)
In order to determine melting temperature of the films of various blend compositions, differential
scanning calorimetry (DSC) was used with the help of a TA Instruments Q1000 calorimeter. The
samples were heated from room temperature to 200°C at a heating rate of 10°C/min. The melting
temperatures of films were determined from the first heating ramp.
6.3.3 Extensional rheology
The melt extensional behaviour of the polymers was determined using the SER geometry of the
ARES Rheometric Scientific rheometer. The data were recorded at a Hencky strain rate of =0.1,
1 and 10 s-1
on samples having dimensions of 13mm×18mm×0.8mm at 150°C. In order to study
the role of molecular structure on melt strength and strain hardening, the temperature was kept
constant for all extensional rheometry experiments. The temperature of 150°C was selected to
make sure all the resins could melt in the time scale of experiment. The melt toughness of resins
was calculated from the area under stress-strain curve of extentional flow at =10 s-1
at three
temperatures of 125°C, 135°C, and 150°C.
6.3.4 Interfacial self-adhesion measurements
Adhesion experiments were performed using SL10 Lako-Tool equipment based on T-Peel test
method. Heat bonding was made with two metallic jaws of 19.1mm×25.4mm covered by Teflon.
94
The film samples were cut in 2.54cm×33cm strips specimens parallel to machine direction. This
method is consisted of two stages of bonding and peeling: in the first stage, two layers of film
were located between the two jaws, then the jaws closed to provide the contact between the two
sides of the film with a controlled pressure for 0.5 s. In the second stage, the jaws were removed
and simultaneously two arms of the machine pulled the films to measure the adhesion strength,
while it was still hot (also called hot tack). To avoid film distortion due to direct contact to heated
jaw, the PE films were laminated to a layer of PET support film using a polyurethane based
solventless adhesive. To obtain reliable results for adhesion in the molten state, the PE films must
be strongly attached to the support film. The adhesion experiments were performed in a range of
jaw temperatures from 80˚C to 160˚C at a constant pressure of 0.5 MPa and dwell time of 0.5 s.
The values reported in adhesion graphs were averaged over at least five tests.
6.4 Results and discussion
6.4.1 Differential scanning calorimetry (DSC)
In the heat bonding of thermoplastic films, the primary requirement for chain diffusion across the
interface is the capability of polymer chains to reptate. The chain reptation motion in
semicrystalline polymers is possible when the chains are not stocked in crystals. It is known that
the number of chains capable of diffusion is determined by the fraction of amorphous phase in
LLDPE films 24
. The un-melted crystals however act like obstacles hindering chains’ free
diffusion across the interface, thus the crystal content of films is important. Therefore, in the self-
adhesion of thermoplastic films, the temperature in which adhesion is done is determined by the
melting temperature of the film. Especially, for blends of two thermoplastic materials because of
the different melting points of components, the adhesion temperature might vary based on the
melting behaviour of every component. The size of crystals and the possibility of co-
crystallization during the cooling of polymer films after extrusion influence the melting
behaviour of film in heat bonding. Therefore, thermal characterization was performed to
investigate the melting behaviour of PE blend films.
Figure 6-1 illustrates DSC melting endotherm curves of the first heating run for films of the neat
polymers and their corresponding blends. The neat LLDPE showed higher melting temperature
(Tm) than Linear-m and LCB-m blends. (See Figure 6-1a and b) The Tm shifted to lower
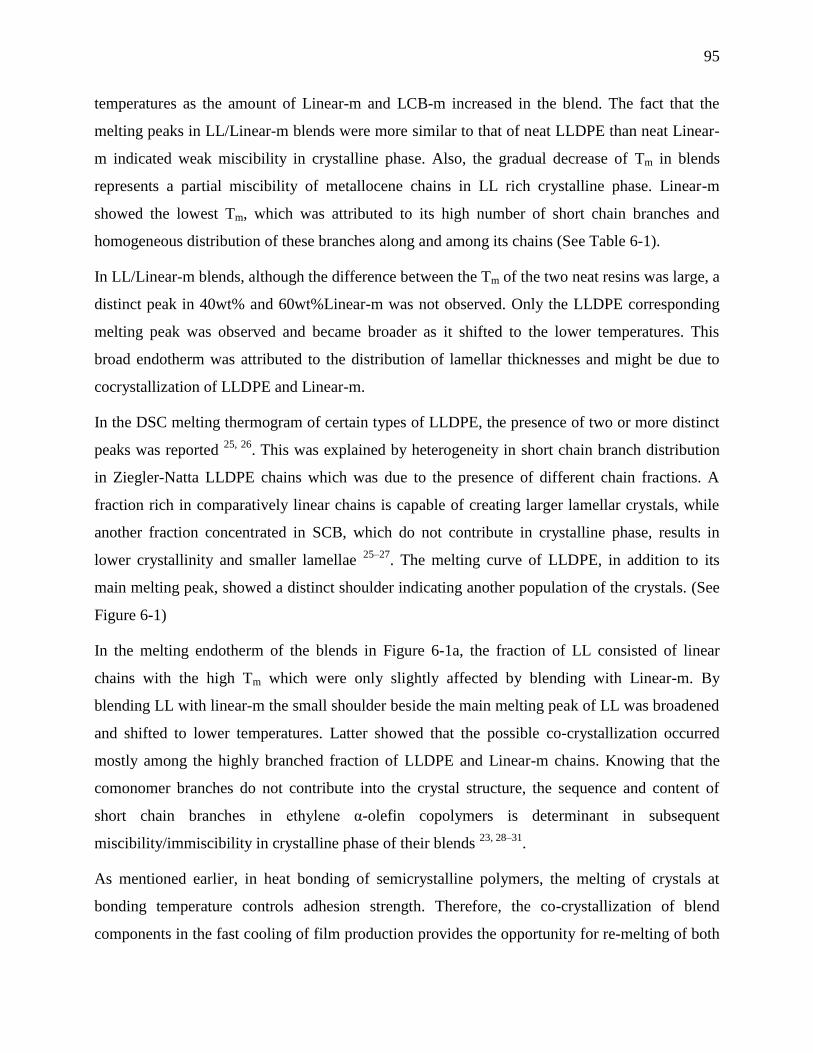
95
temperatures as the amount of Linear-m and LCB-m increased in the blend. The fact that the
melting peaks in LL/Linear-m blends were more similar to that of neat LLDPE than neat Linear-
m indicated weak miscibility in crystalline phase. Also, the gradual decrease of Tm in blends
represents a partial miscibility of metallocene chains in LL rich crystalline phase. Linear-m
showed the lowest Tm, which was attributed to its high number of short chain branches and
homogeneous distribution of these branches along and among its chains (See Table 6-1).
In LL/Linear-m blends, although the difference between the Tm of the two neat resins was large, a
distinct peak in 40wt% and 60wt%Linear-m was not observed. Only the LLDPE corresponding
melting peak was observed and became broader as it shifted to the lower temperatures. This
broad endotherm was attributed to the distribution of lamellar thicknesses and might be due to
cocrystallization of LLDPE and Linear-m.
In the DSC melting thermogram of certain types of LLDPE, the presence of two or more distinct
peaks was reported 25, 26
. This was explained by heterogeneity in short chain branch distribution
in Ziegler-Natta LLDPE chains which was due to the presence of different chain fractions. A
fraction rich in comparatively linear chains is capable of creating larger lamellar crystals, while
another fraction concentrated in SCB, which do not contribute in crystalline phase, results in
lower crystallinity and smaller lamellae 25–27
. The melting curve of LLDPE, in addition to its
main melting peak, showed a distinct shoulder indicating another population of the crystals. (See
Figure 6-1)
In the melting endotherm of the blends in Figure 6-1a, the fraction of LL consisted of linear
chains with the high Tm which were only slightly affected by blending with Linear-m. By
blending LL with linear-m the small shoulder beside the main melting peak of LL was broadened
and shifted to lower temperatures. Latter showed that the possible co-crystallization occurred
mostly among the highly branched fraction of LLDPE and Linear-m chains. Knowing that the
comonomer branches do not contribute into the crystal structure, the sequence and content of
short chain branches in ethylene α-olefin copolymers is determinant in subsequent
miscibility/immiscibility in crystalline phase of their blends 23, 28–31
.
As mentioned earlier, in heat bonding of semicrystalline polymers, the melting of crystals at
bonding temperature controls adhesion strength. Therefore, the co-crystallization of blend
components in the fast cooling of film production provides the opportunity for re-melting of both
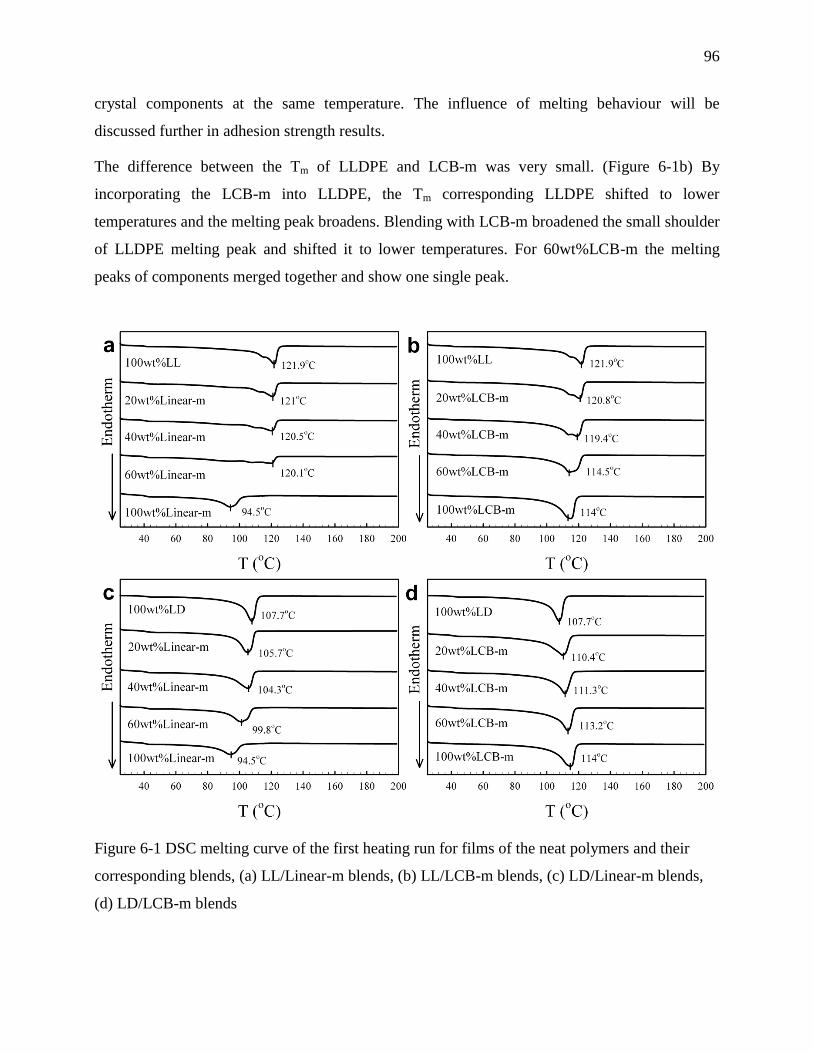
96
crystal components at the same temperature. The influence of melting behaviour will be
discussed further in adhesion strength results.
The difference between the Tm of LLDPE and LCB-m was very small. (Figure 6-1b) By
incorporating the LCB-m into LLDPE, the Tm corresponding LLDPE shifted to lower
temperatures and the melting peak broadens. Blending with LCB-m broadened the small shoulder
of LLDPE melting peak and shifted it to lower temperatures. For 60wt%LCB-m the melting
peaks of components merged together and show one single peak.
Figure 6-1 DSC melting curve of the first heating run for films of the neat polymers and their
corresponding blends, (a) LL/Linear-m blends, (b) LL/LCB-m blends, (c) LD/Linear-m blends,
(d) LD/LCB-m blends
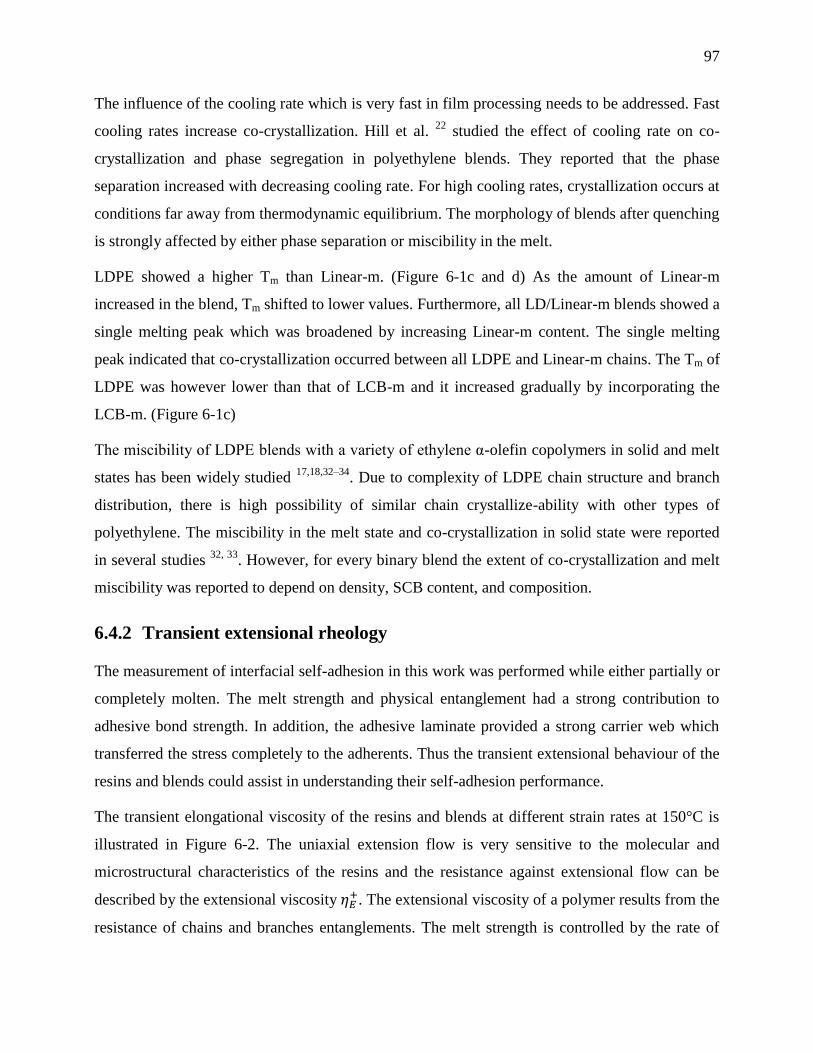
97
The influence of the cooling rate which is very fast in film processing needs to be addressed. Fast
cooling rates increase co-crystallization. Hill et al. 22
studied the effect of cooling rate on co-
crystallization and phase segregation in polyethylene blends. They reported that the phase
separation increased with decreasing cooling rate. For high cooling rates, crystallization occurs at
conditions far away from thermodynamic equilibrium. The morphology of blends after quenching
is strongly affected by either phase separation or miscibility in the melt.
LDPE showed a higher Tm than Linear-m. (Figure 6-1c and d) As the amount of Linear-m
increased in the blend, Tm shifted to lower values. Furthermore, all LD/Linear-m blends showed a
single melting peak which was broadened by increasing Linear-m content. The single melting
peak indicated that co-crystallization occurred between all LDPE and Linear-m chains. The Tm of
LDPE was however lower than that of LCB-m and it increased gradually by incorporating the
LCB-m. (Figure 6-1c)
The miscibility of LDPE blends with a variety of ethylene α-olefin copolymers in solid and melt
states has been widely studied 17,18,32–34
. Due to complexity of LDPE chain structure and branch
distribution, there is high possibility of similar chain crystallize-ability with other types of
polyethylene. The miscibility in the melt state and co-crystallization in solid state were reported
in several studies 32, 33
. However, for every binary blend the extent of co-crystallization and melt
miscibility was reported to depend on density, SCB content, and composition.
6.4.2 Transient extensional rheology
The measurement of interfacial self-adhesion in this work was performed while either partially or
completely molten. The melt strength and physical entanglement had a strong contribution to
adhesive bond strength. In addition, the adhesive laminate provided a strong carrier web which
transferred the stress completely to the adherents. Thus the transient extensional behaviour of the
resins and blends could assist in understanding their self-adhesion performance.
The transient elongational viscosity of the resins and blends at different strain rates at 150°C is
illustrated in Figure 6-2. The uniaxial extension flow is very sensitive to the molecular and
microstructural characteristics of the resins and the resistance against extensional flow can be
described by the extensional viscosity . The extensional viscosity of a polymer results from the
resistance of chains and branches entanglements. The melt strength is controlled by the rate of
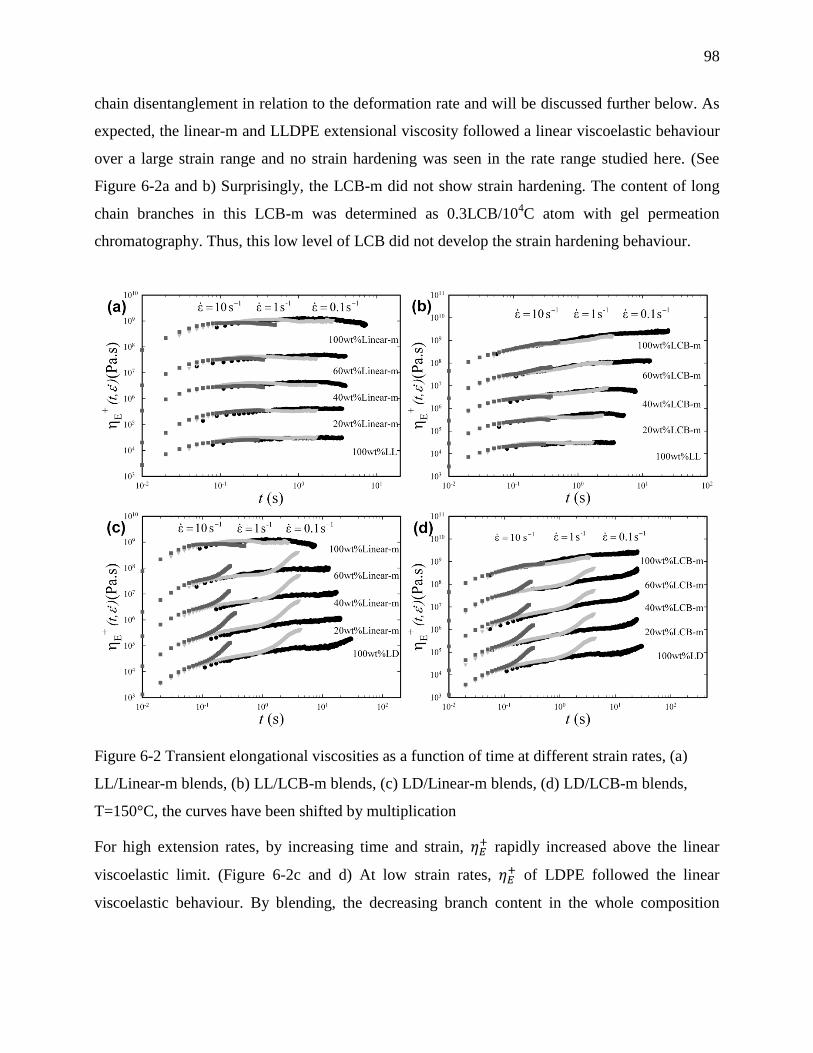
98
chain disentanglement in relation to the deformation rate and will be discussed further below. As
expected, the linear-m and LLDPE extensional viscosity followed a linear viscoelastic behaviour
over a large strain range and no strain hardening was seen in the rate range studied here. (See
Figure 6-2a and b) Surprisingly, the LCB-m did not show strain hardening. The content of long
chain branches in this LCB-m was determined as 0.3LCB/104C atom with gel permeation
chromatography. Thus, this low level of LCB did not develop the strain hardening behaviour.
Figure 6-2 Transient elongational viscosities as a function of time at different strain rates, (a)
LL/Linear-m blends, (b) LL/LCB-m blends, (c) LD/Linear-m blends, (d) LD/LCB-m blends,
T=150°C, the curves have been shifted by multiplication
For high extension rates, by increasing time and strain, rapidly increased above the linear
viscoelastic limit. (Figure 6-2c and d) At low strain rates, of LDPE followed the linear
viscoelastic behaviour. By blending, the decreasing branch content in the whole composition
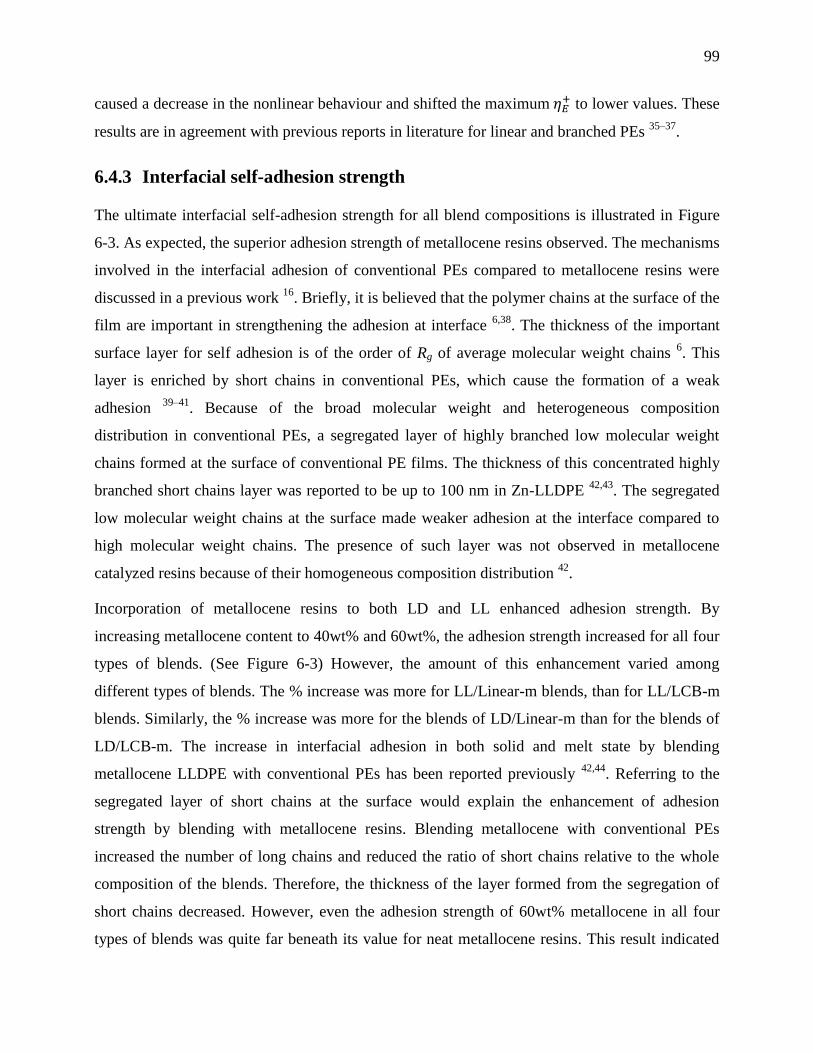
99
caused a decrease in the nonlinear behaviour and shifted the maximum to lower values. These
results are in agreement with previous reports in literature for linear and branched PEs 35–37
.
6.4.3 Interfacial self-adhesion strength
The ultimate interfacial self-adhesion strength for all blend compositions is illustrated in Figure
6-3. As expected, the superior adhesion strength of metallocene resins observed. The mechanisms
involved in the interfacial adhesion of conventional PEs compared to metallocene resins were
discussed in a previous work 16
. Briefly, it is believed that the polymer chains at the surface of the
film are important in strengthening the adhesion at interface 6,38
. The thickness of the important
surface layer for self adhesion is of the order of Rg of average molecular weight chains 6. This
layer is enriched by short chains in conventional PEs, which cause the formation of a weak
adhesion 39–41
. Because of the broad molecular weight and heterogeneous composition
distribution in conventional PEs, a segregated layer of highly branched low molecular weight
chains formed at the surface of conventional PE films. The thickness of this concentrated highly
branched short chains layer was reported to be up to 100 nm in Zn-LLDPE 42,43
. The segregated
low molecular weight chains at the surface made weaker adhesion at the interface compared to
high molecular weight chains. The presence of such layer was not observed in metallocene
catalyzed resins because of their homogeneous composition distribution 42
.
Incorporation of metallocene resins to both LD and LL enhanced adhesion strength. By
increasing metallocene content to 40wt% and 60wt%, the adhesion strength increased for all four
types of blends. (See Figure 6-3) However, the amount of this enhancement varied among
different types of blends. The % increase was more for LL/Linear-m blends, than for LL/LCB-m
blends. Similarly, the % increase was more for the blends of LD/Linear-m than for the blends of
LD/LCB-m. The increase in interfacial adhesion in both solid and melt state by blending
metallocene LLDPE with conventional PEs has been reported previously 42,44
. Referring to the
segregated layer of short chains at the surface would explain the enhancement of adhesion
strength by blending with metallocene resins. Blending metallocene with conventional PEs
increased the number of long chains and reduced the ratio of short chains relative to the whole
composition of the blends. Therefore, the thickness of the layer formed from the segregation of
short chains decreased. However, even the adhesion strength of 60wt% metallocene in all four
types of blends was quite far beneath its value for neat metallocene resins. This result indicated
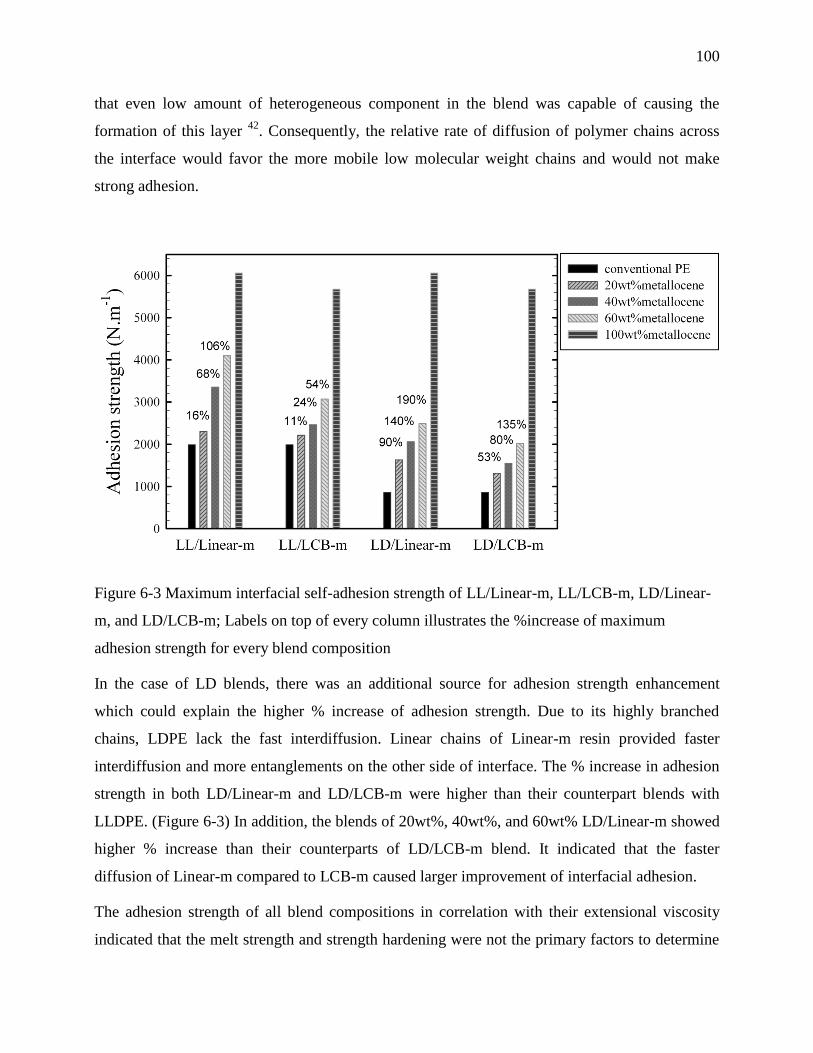
100
that even low amount of heterogeneous component in the blend was capable of causing the
formation of this layer 42
. Consequently, the relative rate of diffusion of polymer chains across
the interface would favor the more mobile low molecular weight chains and would not make
strong adhesion.
Figure 6-3 Maximum interfacial self-adhesion strength of LL/Linear-m, LL/LCB-m, LD/Linear-
m, and LD/LCB-m; Labels on top of every column illustrates the %increase of maximum
adhesion strength for every blend composition
In the case of LD blends, there was an additional source for adhesion strength enhancement
which could explain the higher % increase of adhesion strength. Due to its highly branched
chains, LDPE lack the fast interdiffusion. Linear chains of Linear-m resin provided faster
interdiffusion and more entanglements on the other side of interface. The % increase in adhesion
strength in both LD/Linear-m and LD/LCB-m were higher than their counterpart blends with
LLDPE. (Figure 6-3) In addition, the blends of 20wt%, 40wt%, and 60wt% LD/Linear-m showed
higher % increase than their counterparts of LD/LCB-m blend. It indicated that the faster
diffusion of Linear-m compared to LCB-m caused larger improvement of interfacial adhesion.
The adhesion strength of all blend compositions in correlation with their extensional viscosity
indicated that the melt strength and strength hardening were not the primary factors to determine
101
the adhesion strength. These results indicated that the interdiffusion is the main parameter
controlling the maximum self-adhesion strength. However, the role of melt strength and
extensional rheological behaviour of resins will be discussed further sections.
6.4.4 Temperature dependence of interfacial self-adhesion strength
As mentioned earlier, interfacial self-adhesion of semicrystalline polymers depends strongly on
the temperature. Presence of the crystals at the interface vicinity hinders the chain motion and
diffusion across the interface. Therefore, the adhesion experiments should be performed in a
range of temperature for any semicrystalline polymer. Figure 6-4 illustrates the adhesion strength
in a range temperature for every blend composition. At low temperatures, a week adhesion was
created. Few degrees increase in temperature improved the adhesion strength sharply. Afterward,
adhesion strength remained almost constant for a temperature interval, called plateau adhesion
strength. This plateau covered a temperature range which had a lower and an upper boundary,
called plateau initiation temperature (Tpi) and final plateau temperature (Tpf), respectively. For a
few degrees higher than Tpf, a sharp decrease in adhesion strength occurred. The upper boundary
of the temperature plateau was bounded by the damage to the joint caused by heat and pressure;
the lower temperature boundary was bounded by the amount of heat available at the interface to
melt the two adherents and was affected by crystallinity and Tm. The lower limit was controlled
by crystallinity and the upper limit was controlled by rheological properties, specifically melt
strength of the polymer. In order to achieve the highest adhesion strength, the temperature must
be high enough to melt the interface between the two polymer layers, yet low enough to prevent
the distortion at the joint area. The temperature windows of plateau for all blend compositions are
illustrated in Figure 6-5.

102
Figure 6-4 Interfacial self-adhesion strength of (a) LL/Linear-m, (b) LL/LCB-m, (c) LD/Linear-
m, and (d) LD/LCB-m, as a function of temperature
It can be seen in Figure 6-4, the incorporation of metallocene caused either an increase or a
decrease in Tpi. Regarding the thermal properties, the melting point and crystal content of
LD/Linear-m and LL/Linear-m blends decreased when the metallocene content increased. (See
Figure 6-1) Consequently, a decrease in Tpi was observed in Figure 6-4a, b, and c. In LD/LCB-m
blends, increasing metallocene content increased Tpi because of higher Tm of LCB-m than LD.
Therefore, the presence of LCB had no significant effect on Tpi and the amount and distribution
of SCB were rather the controlling parameters. Smaller crystal sizes induced bonding at lower
temperatures. The temperature dependence of interfacial adhesion and the role of both Tg in
glassy and Tm in thermoplastic polymers has been reported 44,45
. To our knowledge, there is no
study discussing the temperature boundaries for a polymer’s interfacial adhesion.
The sharp drop down of adhesion strength occurred in high temperatures a few degrees higher
than the upper limit. This was the result of complete merging of the two film layers together.
Consequently, the crack propagation in peeling did not follow the interface. Then a breakage at
the edge of joint area occurred, followed by a cohesive failure in the vicinity of the support layer
103
8,14,45. This means that increasing the temperature caused lower melt strength with the possibility
of defects, which caused breakage at the edge. The low interface strength at the temperatures
above a certain limit has been also reported before 44
.
Figure 6-5 illustrates the temperature window of plateau broadness for all blend compositions.
For LL/Linear-m and LL/LCB-m blends as well as neat LLDPE, the temperature window was
narrow. For all compositions of LD/Linear-m and LD/LCB-m blends as well as neat LDPE, the
temperature window was very broad. Moreover, both metallocene resins showed a broad
temperature window. As mentioned earlier, the lower limit of plateau was controlled by
crystallinity. Accordingly, the Tpf was the origin of the difference between these two groups of
blends. It is thus important to explore the influence of molecular architecture in ethylene olefin
blends on the position of Tpf.
Peeling a joint at temperatures higher than melting point involve unsteady-state and time
dependent deformations. The deformation of entangled network of chains is elastic while the
pull-out of chains at the interface is a viscous process. If v designate the peel rate and is 33mm.s-1
and h is the film thickness=50 μ, the strain rate could be estimated roughly from
. A rough
estimation for strain rate would thus be 660 s-1
. So, peeling is equivalent to applying an
extensional force on entangled chains at very high strain rates. It is therefore necessary to
examine the dynamic characteristics of these different macromolecular structures of
polyethylene.
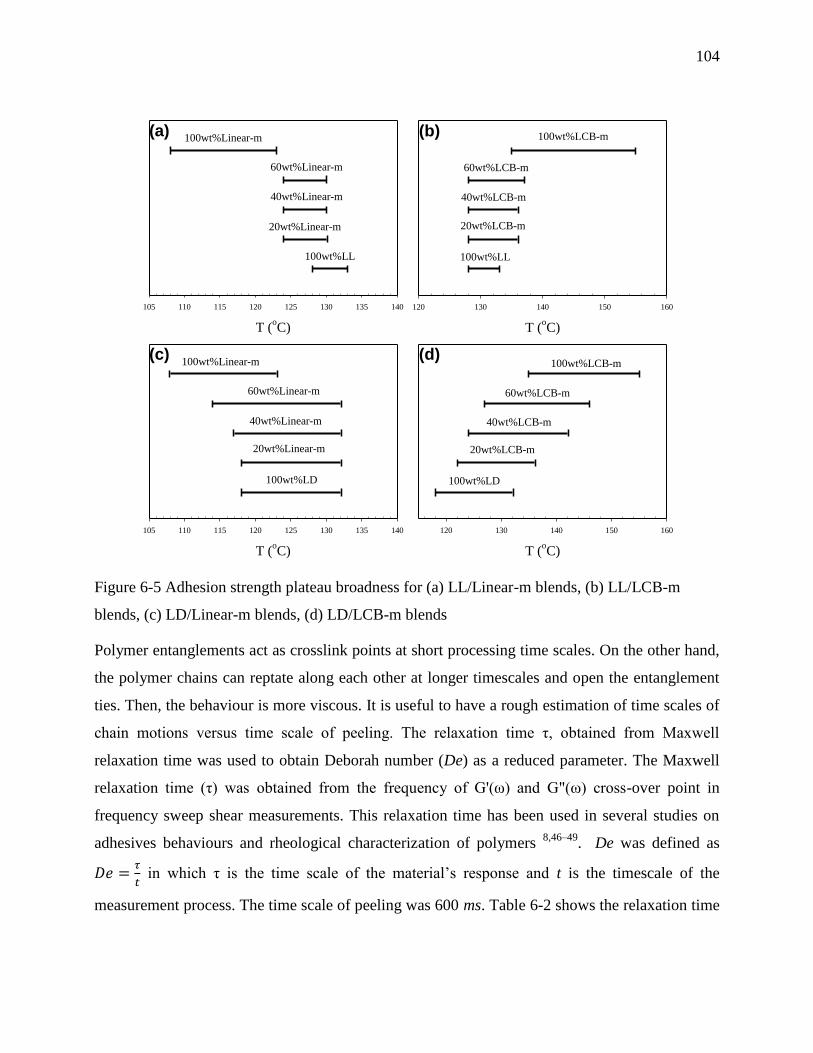
104
Figure 6-5 Adhesion strength plateau broadness for (a) LL/Linear-m blends, (b) LL/LCB-m
blends, (c) LD/Linear-m blends, (d) LD/LCB-m blends
Polymer entanglements act as crosslink points at short processing time scales. On the other hand,
the polymer chains can reptate along each other at longer timescales and open the entanglement
ties. Then, the behaviour is more viscous. It is useful to have a rough estimation of time scales of
chain motions versus time scale of peeling. The relaxation time τ, obtained from Maxwell
relaxation time was used to obtain Deborah number (De) as a reduced parameter. The Maxwell
relaxation time (τ) was obtained from the frequency of G'(ω) and G"(ω) cross-over point in
frequency sweep shear measurements. This relaxation time has been used in several studies on
adhesives behaviours and rheological characterization of polymers 8,46–49
. De was defined as
in which τ is the time scale of the material’s response and t is the timescale of the
measurement process. The time scale of peeling was 600 ms. Table 6-2 shows the relaxation time
T (oC)
105 110 115 120 125 130 135 140
100wt%Linear-m
100wt%LD
20wt%Linear-m
40wt%Linear-m
60wt%Linear-m
(c)
T (oC)
120 130 140 150 160
100wt%LCB-m
100wt%LD
20wt%LCB-m
40wt%LCB-m
60wt%LCB-m
(d)
T (oC)
120 130 140 150 160
100wt%LCB-m
100wt%LL
20wt%LCB-m
40wt%LCB-m
60wt%LCB-m
(b)
T (oC)
105 110 115 120 125 130 135 140
100wt%Linear-m
100wt%LL
20wt%Linear-m
40wt%Linear-m
60wt%Linear-m
(a)

105
and the De calculated for four neat resins in this study. The rlaxation time τ is one or two order of
magnitude smaller than timescale of peeling.
Creton et al. 8 also calculated De in debonding of SBR elastomers as pressure sensitive adhesives.
Analyzing the corresponding failure mechanism, they defined a critical value for Deborah
number (Decrit) which was estimated ≈0.8 for the elastomers studied and the probe geometry in
their work. They showed that for De< Decrit, SBR behaves as a viscoelastic fluid. The exact value
of Decrit=0.8 might not be accurate to apply for the experiment and materials in this study.
However, the very small values represented in Table 6-2 for De for all the resins indicate a
viscous dominant regime, indicating an irreversibly consumed energy when fracture develops and
propagate.
Among all resins, LD has the highest τ and consequently highest De. As long branches are
incorporated to the chains and get involved in entanglements, the relaxation mechanism of chains
changes from simple reptation to arm retraction 50,51
. The relaxation time of the material increases
strongly and it becomes elastic at larger timescales. Due to the presence of long chain branches, τ
for LDPE is one order of magnitude higher than for linear resins.
Table 6-2 Relaxation time and De number of neat resins
Resin τ (ms) De
LDPE 199 0.332
Zn-LLDPE 10 0.016
Linear-m 15 0.025
LCB-m 25 0.042
It is necessary to compare the viscous dissipation of the resins, which provides a better
understanding of the broadness of plateau adhesion strength. As mentioned earlier, the type of
deformation in melt adhesion measurement resembles the uniaxial extensional flow. Therefore,
the toughness calculated from the area under the stress-strain curve in extensional flow can be
used to estimate the energy dissipated by melt before rupture. Although the high strain rate
involved in peeling is practically unattainable, the data from lower strain rates provides a
comparative estimation. The toughness of neat resins obtained from area under the extensional
flow curve at =10 s-1
at three different temperature of 125°C, 135°C and 150°C are listed in
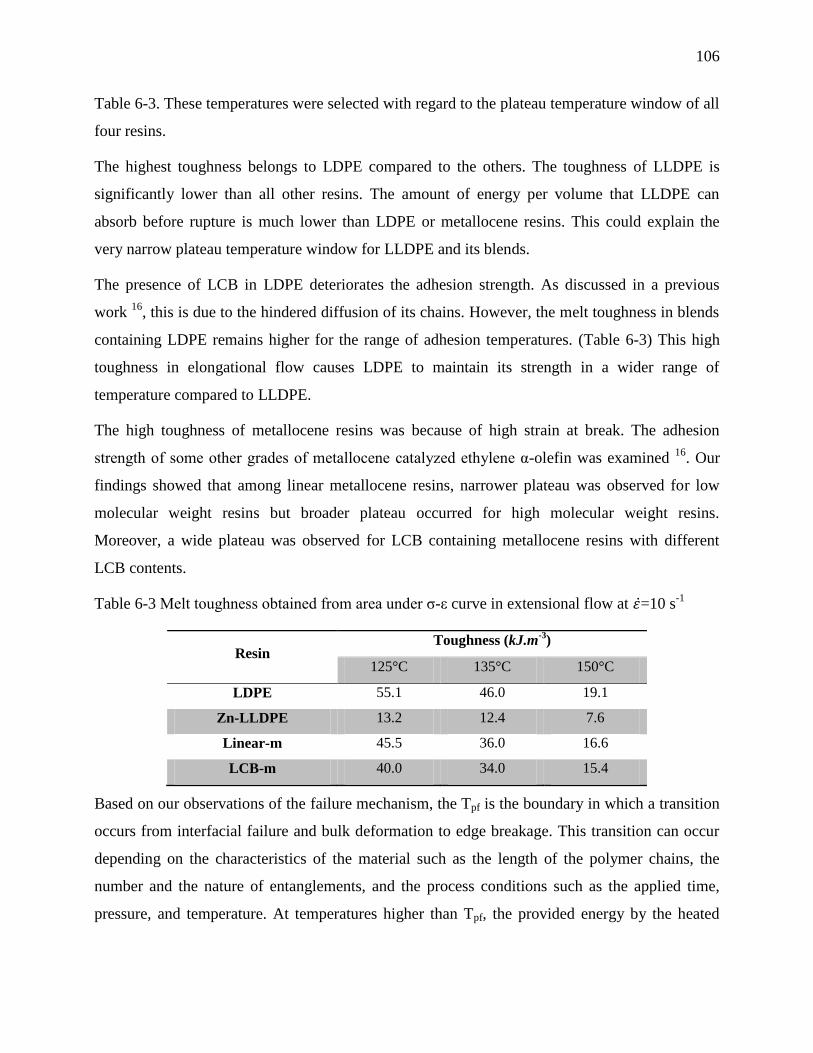
106
Table 6-3. These temperatures were selected with regard to the plateau temperature window of all
four resins.
The highest toughness belongs to LDPE compared to the others. The toughness of LLDPE is
significantly lower than all other resins. The amount of energy per volume that LLDPE can
absorb before rupture is much lower than LDPE or metallocene resins. This could explain the
very narrow plateau temperature window for LLDPE and its blends.
The presence of LCB in LDPE deteriorates the adhesion strength. As discussed in a previous
work 16
, this is due to the hindered diffusion of its chains. However, the melt toughness in blends
containing LDPE remains higher for the range of adhesion temperatures. (Table 6-3) This high
toughness in elongational flow causes LDPE to maintain its strength in a wider range of
temperature compared to LLDPE.
The high toughness of metallocene resins was because of high strain at break. The adhesion
strength of some other grades of metallocene catalyzed ethylene α-olefin was examined 16
. Our
findings showed that among linear metallocene resins, narrower plateau was observed for low
molecular weight resins but broader plateau occurred for high molecular weight resins.
Moreover, a wide plateau was observed for LCB containing metallocene resins with different
LCB contents.
Table 6-3 Melt toughness obtained from area under σ-ε curve in extensional flow at =10 s-1
Resin Toughness (kJ.m
-3)
125°C 135°C 150°C
LDPE 55.1 46.0 19.1
Zn-LLDPE 13.2 12.4 7.6
Linear-m 45.5 36.0 16.6
LCB-m 40.0 34.0 15.4
Based on our observations of the failure mechanism, the Tpf is the boundary in which a transition
occurs from interfacial failure and bulk deformation to edge breakage. This transition can occur
depending on the characteristics of the material such as the length of the polymer chains, the
number and the nature of entanglements, and the process conditions such as the applied time,
pressure, and temperature. At temperatures higher than Tpf, the provided energy by the heated
107
bars overcomes the required energy for polymer chains to disentangle. Latter would allow the
polymer chains to slip out of the bulk by applying lower peeling force.
High melt toughness in elongational flow indicates higher required energy to overcome the chain
entanglements at a certain temperatures. Hence for a polymer with higher melt toughness to fail
in a joint a higher temperature would be required which in result would broaden the adhesion
plateau. The broad temperature plateau window in LD and its blends could be explained by
higher melt toughness in extensional melt flow. Creton et al. 14
also examined the adhesion
energy at the soft interface of poly dimethylsiloxane elastomers in terms of energy dissipation
mechanisms at molecular and macroscopic scales. They concluded that both large extensional
bulk deformations and interfacial failure determine the adhesion strength.
6.5 Conclusions
Investigation of interfacial self adhesion for polyethylene blend films in melt state has provided
novel information on the role of molecular architecture of components on adhesion performance.
Four binary blends were prepared from the combination of a conventional polyethylene; LDPE or
Ziegler-Natta LLDPE, with a metallocene catalyzed ethylene α-olefin copolymer; linear (Linear-
m) or long chain branched (LCB-m). These films were examined in terms of interfacial self-
adhesion at temperatures higher than Tm.
Melting behaviour and partial co-crystallization, was observed for all blend compositions. All
compositions of LL/Linear-m and LD/Linear-m blends showed higher increase percentage in
adhesion strength compared to their counterparts in LL/LCB-m and LL/LCB-m blends.
Moreover, the increase percentage of adhesion strength for LDPE blends was higher than LLDPE
blends. The chain interdiffusion has the primary role to build up the strength at the interface.
Moreover, melt toughness has a crucial role on maintaining its highest strength for a wide range
of temperatures. The presence of LCB in either low content in LCB-m or high content in LDPE
hinder the chain motion compared to linear chains with approximately the same length. The
broad adhesion strength plateau of LDPE as highly LCB containing resin illustrated the important
role of high relaxation time of chains and high level of entanglements in the melt behaviour.
Based on the correlations, melt toughness in extensional flow provides a basis to predict the
108
relative plateau broadness of a polymer. The broad adhesion strength plateau for metallocene
resins was attributed to their high melt toughness.
6.6 Acknowledgement
Financial support from 3S Pack NSERC/Saputo/Prolamina industrial research chair is gratefully
acknowledged.
6.7 References
1. Wool, R. P., Yuan, B.-L. & McGarel, O. J. Welding of polymer interfaces. Polymer
Engineering & Science 29, 1340–1367 (1989).
2. Jud, K., Kausch, H. H. & Williams, J. G. Fracture mechanics studies of crack healing and
welding of polymers. J Mater Sci 16, 204–210 (1981).
3. Prager, S. & Tirrell, M. The healing process at polymer–polymer interfaces. The Journal
of Chemical Physics 75, 5194–5198 (1981).
4. Kausch, H. H. & Tirrell, M. Polymer Interdiffusion. Annual Review of Materials Science
19, 341–377 (1989).
5. Kim, K. D., Sperling, L. H., Klein, A. & Hammouda, B. Reptation Time, Temperature,
and Cosurfactant Effects on the Molecular Interdiffusion Rate during Polystyrene Latex
Film Formation. Macromolecules 27, 6841–6850 (1994).
6. Wool, R. P. Polymer Interfaces: Structure and Strength. (Hanser-Gardner Publications,
1995).
7. Brown. The Adhesion Between Polymers. Annual Review of Materials Science 21, 463–
489 (1991).
8. Schach, R. & Creton, C. Adhesion at interfaces between highly entangled polymer melts.
Journal of Rheology 52, 749–767 (2008).
9. Boiko, Y. M., Guérin, G., Marikhin, V. A. & Prud’homme, R. E. Healing of interfaces of
amorphous and semi-crystalline poly(ethylene terephthalate) in the vicinity of the glass
transition temperature. Polymer 42, 8695–8702 (2001).
10. Gent, A. N., Kim, E.-G. & Ye, P. Autohesion of crosslinked polyethylene. Journal of
Polymer Science Part B: Polymer Physics 35, 615–622 (1997).
11. Smith, G. D., Plummer, C. J. G., Bourban, P.-E. & Månson, J.-A. E. Non-isothermal
fusion bonding of polypropylene. Polymer 42, 6247–6257 (2001).
12. Xue, Y.-Q., Tervoort, T. A. & Lemstra, P. J. Welding behaviour of semicrystalline
polymers. 1. The effect of nonequilibrium chain conformations on autoadhesion of
UHMWPE. Macromolecules 31, 3075–3080 (1998).
109
13. Xue, Y.-Q., Tervoort, T. A., Rastogi, S. & Lemstra, J. Welding Behavior of
Semicrystalline Polymers. 2. Effect of Cocrystallization on Autoadhesion.
Macromolecules 33, 7084–7087 (2000).
14. Léger, L. & Creton, C. Adhesion mechanisms at soft polymer interfaces. Phil. Trans. R.
Soc. A 366, 1425–1442 (2008).
15. Brydson, J. A. Plastics Materials. (Butterworth-Heinemann, 1999).
16. Najarzadeh, Z. & Ajji, A. Role of molecular architecture in interfacial self-adhesion of
polyethylene films.
17. Delgadillo-Velázquez, O., Hatzikiriakos, S. G. & Sentmanat, M. Thermorheological
properties of LLDPE/LDPE blends: Effects of production technology of LLDPE. Journal
of Polymer Science Part B: Polymer Physics 46, 1669–1683 (2008).
18. Hussein, I. A., Hameed, T., Abu Sharkh, B. F. & Mezghani, K. Miscibility of hexene-
LLDPE and LDPE blends: Influence of branch content and composition distribution.
Polymer 44, 4665–4672 (2003).
19. Fang, Y., Carreau, P. J., Lafleur, P. G. & Ymmel, S. Properties of mLLDPE/LDPE blends
in film blowing. Polymer Engineering and Science 45, 343–353 (2005).
20. Fang, Y., Carreau, P. J. & Lafleur, P. G. Thermal and rheological properties of
mLLDPE/LDPE blends. Polymer Engineering & Science 45, 1254–1264 (2005).
21. Chen, F., Shanks, R. A. & Amarasinghe, G. Rheological and thermal properties of single-
site polyethylene blends. Journal of Applied Polymer Science 95, 1549–1557 (2005).
22. Hill, M. J. & Barham, P. J. Morphology maps of binary blends of copolymers produced
using the metallocene catalyst process. Polymer 41, 1621–1625 (2000).
23. Rana, D., Kim, H. L., Kwag, H. & Choe, S. Hybrid blends of similar ethylene 1-octene
copolymers. Polymer 41, 7067–7082 (2000).
24. Najarzadeh, Z. & Ajji, A. A novel approach toward the effect of seal process parameters
on final seal strength and microstructure of LLDPE. Journal of Adhesion Science and
Technology (2014).
25. Bensason, S. et al. Classification of homogeneous ethylene-octene copolymers based on
comonomer content. Journal of Polymer Science Part B: Polymer Physics 34, 1301–1315
(1996).
26. Bubeck, R. A. Structure–property relationships in metallocene polyethylenes. Materials
Science and Engineering: R: Reports 39, 1–28 (2002).
27. Hosoda, S. et al. Effect of the Sequence Length Distribution on the Lamellar Crystal
Thickness and Thickness Distribution of Polyethylene: Perfectly Equisequential ADMET
Polyethylene vs Ethylene/α-Olefin Copolymer. Macromolecules 44, 313–319 (2011).
28. Rana, D., Cho, K., Woo, T., Lee, B. H. & Choe, S. Blends of ethylene 1‐octene
copolymer synthesized by Ziegler–Natta and metallocene catalysts. I. Thermal and
mechanical properties. Journal of Applied Polymer Science 74, 1169–1177 (1999).
110
29. Rana, D. et al. Blends of ethylene 1‐octene copolymer synthesized by Ziegler–Natta and
metallocene catalysts. II. Rheology and morphological behaviors. Journal of Applied
Polymer Science 76, 1950–1964 (2000).
30. Kuwabara, K., Kaji, H., Horii, F., Bassett, D. C. & Olley, R. H. Solid-State 13C NMR
Analyses of the Crystalline−Noncrystalline Structure for Metallocene-Catalyzed Linear
Low-Density Polyethylene. Macromolecules 30, 7516–7521 (1997).
31. Janicek, M., Cermak, R., Obadal, M., Piel, C. & Ponizil, P. Ethylene Copolymers with
Crystallizable Side Chains. Macromolecules 44, 6759–6766 (2011).
32. Hameed, T. & Hussein, I. A. Rheological study of the influence of MW and comonomer
type on the miscibility of m-LLDPE and LDPE blends. Polymer 43, 6911–6929 (2002).
33. Hussein, I. A. & Hameed, T. Influence of branching characteristics on thermal and
mechanical properties of Ziegler-Natta and metallocene hexene linear low-density
polyethylene blends with low-density polyethylene. Journal of Applied Polymer Science
97, 2488–2498 (2005).
34. Robledo, N., Vega, J. F., Nieto, J. & Martínez-Salazar, J. The role of the interface in melt
linear viscoelastic properties of LLDPE/LDPE blends: Effect of the molecular
architecture of the matrix. J. Appl. Polym. Sci. 114, 420–429 (2009).
35. Wagner, M. H., Kheirandish, S. & Yamaguchi, M. Quantitative analysis of melt
elongational behavior of LLDPE/LDPE blends. Rheol Acta 44, 198–218 (2004).
36. Kasehagen, L. J. & Macosko, C. W. Nonlinear shear and extensional rheology of long-
chain randomly branched polybutadiene. Journal of Rheology (1978-present) 42, 1303–
1327 (1998).
37. Tabatabaei, S. H., Carreau, P. J. & Ajji, A. Rheological and thermal properties of blends
of a long-chain branched polypropylene and different linear polypropylenes. Chemical
Engineering Science 64, 4719–4731 (2009).
38. Basin, V. E. Role of diffusion in the formation of adhesion bonds between polymers.
Polymer Mechanics 3, 561–563 (1967).
39. Kausch, H. H., Nguyen, T. Q. & Petrovska-Delacrétaz, D. Chain interdiffusion:
macromolecules between Rouse and de Gennes. Phys. Scr. 1991, 57 (1991).
40. Roland, C. M. & Boehm, G. G. A. Macromolecular diffusion and the autoadhesion of
polybutadiene. Macromolecules 18, 1310–1314 (1985).
41. Su, G. M., Best, K., Ranganathan, T., Emrick, T. & Crosby, A. J. Tailored Nanoparticles
for Enhancing Polymer Adhesion. Macromolecules 44, 5256–5261 (2011).
42. Qureshi, N. Z. et al. Self-adhesion of polyethylene in the melt. 2. Comparison of
heterogeneous and homogeneous copolymers. Macromolecules 34, 3007–3017 (2001).
43. Magonov, S. & Godovsky, Y. Atomic force microscopy, Part 8: Visualization of granular
nanostructure in crystalline polymers. American Laboratory 31, 52–58 (1999).
44. Shih, H. H., Wong, C. M., Wang, Y. C., Huang, C. J. & Wu, C. C. Hot tack of
metallocene catalyzed polyethylene and low-density polyethylene blend. Journal of
Applied Polymer Science 73, 1769–1773 (1999).
111
45. Shih, H.-H. & Hamed, G. R. Peel adhesion and viscoelasticity of poly(ethylene-co-vinyl
acetate)-based hot melt adhesives. I. The effect of tackifier compatibility. Journal of
Applied Polymer Science 63, 323–331 (1997).
46. O’Connor, A. E. & Macosko, C. W. Melt versus solvent coating: Structure and properties
of block–copolymer-based pressure-sensitive adhesives. J. Appl. Polym. Sci. 86, 3355–
3367 (2002).
47. Ganapathy, R. & Sood, A. K. Tuning Rheochaos by Temperature in Wormlike Micelles.
Langmuir 22, 11016–11021 (2006).
48. Lin, G.-G., Shih, H.-H., Chai, P.-C. & Hsu, S.-J. Influence of side-chain structures on the
viscoelasticity and elongation viscosity of polyethylene melts. Polym Eng Sci 42, 2213–
2221 (2002).
49. Gahleitner, M. Melt rheology of polyolefins. Progress in Polymer Science 26, 895–944
(2001).
50. McLeish, T. C. B. & Larson, R. G. Molecular constitutive equations for a class of
branched polymers: The pom-pom polymer. J. Rheol. 42, 81 (1998).
51. Chen, X., Costeux, C. & Larson, R. G. Characterization and prediction of long-chain
branching in commercial polyethylenes by a combination of rheology and modeling
methods. Journal of Rheology (1978-present) 54, 1185–1205 (2010).

112
CHAPTER 7
GENERAL DISCUSSION
Heat sealing is the process of joining thermoplastic materials and is the most popular method for
bonding two polymer films in package closure. Heat sealing is an immensely complicated type of
symmetric interfacial adhesion of polymer surfaces. The process is non-isothermal and generally
occurs in a very short time. The strength of heat seal joint is critical in two conditions: before
cooling while the joint is still molten and after cooling and re-crystallization of the joint area. The
final package integrity depends on the heat seal performance. The quality of a heat seal is
assessed based on the integrity of the joint, the behaviour of seal strength at various times and
temperatures, broadness of the temperature range, seal initiation temperature, seal failure mode,
and seal uniformity. The factors, which determine the quality of a heat seal, can be classified as
heat seal process parameters and film parameters. Process parameters are applied temperature,
dwell time, and pressure. These parameters should be optimized to maximize seal performance
while minimizing costs. Film parameters are generally the material characteristics, film thickness,
crystallinity, orientation, etc. Polyethylene is the most used polymer in the seal layer. Thus, in
this work different types of polyethylene resin were used to study the role of molecular
architecture on seal performance.
The concurrent role of temperature, time and pressure should be considered when the effect of
process parameters on final seal strength is analyzed. Furthermore, optimization of each of these
parameters should be done with respect to the other two, which has not been done in previous
studies. Therefore, in the first part of this study, the seal experiments were conducted for LLDPE
in order to optimize the sealing parameters and to perceive the effect of concurrent change of
“temperature - dwell time” and “temperature - pressure” on the seal strength. Mapping of process
safety zone was introduced for seal strength in a range of heat seal process variables.
It is practically important to predict seal initiation temperature (Tsi) and plateau initiation
temperature (Tpi) of sealant by knowing its melting point. The Tsi and Tpi are correlated with the
initial amorphous fraction of the film. In the melting distribution curve of LLDPE, the interval
corresponding Tsi – Tpi temperature window is shown for every dwell time. We argue here that
113
the Tpi - Tmf relationship is strongly influenced by the dwell time of the heat seal process which,
to our knowledge, was not considered by the previous studies.
The time dependence of seal strength before complete sealing of the interface is studied in regard
to adhesion models based on reptation theory. We found that the seal strength has a linear
correlation with the square root of dwell time. This is supported by the prediction of reptation
motion theory and adhesion models. Moreover, seal strength increases faster over time at higher
temperature.
Analysis of the AFM and SEM images reveal topography and morphology of surfaces after
peeling of seal from microscopic point of view. The AFM 3D height micrographs at different
sealing temperatures along with the heat sealing curve showed the morphology of fractured
surface after debonding. Our findings indicated that the crack propagation through the sealed
interface leaved numerous fractured craze fibrils on the peeled surfaces. The origin of these
fibrils was attributed to the bridges formed during sealing by the interdiffusion of chains across
the interface and the entanglements made by them. These entanglements act as stitches attaching
two film layers. The density and length of these fibrils depends on the depth of diffusion and the
number of chains available for motion at every defined sealing temperature. Our findings
revealed that, by increasing the temperature the fibrils became thicker and larger.
The roughness analysis on film surfaces after peeling could quantitatively characterize the
topography of peeled surfaces. The RMS and Ra roughness parameters illustrate the much rougher
surfaces after breakage of the strong bonds. Then, increasing the temperature causes rougher
surfaces. Moreover, the roughness parameters are in the same range in the case of the peeled
surfaces after sealing at Tpi for every dwell time. Although Tpi is different at each dwell time, the
roughness parameters are similar for various sealing temperatures and dwell times. This indicates
that the diffusion had reached to a certain point at Tpi, regardless of the process conditions.
The fibrillar surface morphologies observed by AFM are also confirmed by the SEM
micrographs. The fibrillar morphology is originated from interlamellar tie molecules which have
formed tight stretched links between crystals across the interface. As it was also reported in
literature, the local yielding and microvoiding pull the material into highly oriented craze fibrils.
In the second phase of this work we focused on the role of molecular architecture of sealant
material in heat sealing. A series of polyethylene polymers with variety of chain structures were
114
chosen. In order to avoid complications due to crystallization in seal area after cooling, the hot
tack strength has to be examined. Furthermore, the importance of hot tack in flexible packaging
modern machinery as well as the lack of knowledge in open literature about controlling
mechanisms of hot tack emphasises the need for a fundamental investigation. In current work, the
adhesion strength terminology was used as the substitute for industrial term of hot tack, because
the adhesion strength terminology has been used in fundamental studies on interfacial adhesion in
literature. In this part, the level of SCB and LCB in resins was quantitatively determined using
NMR and GPC techniques.
For the three linear metallocene catalyzed LLDPE containing equal amount of SCB, increasing
Mw augments the adhesion strength. Furthermore, a linear dependence of adhesion strength to Mw
and a similar linear relationship for elongational viscosity was observed. These results revealed
that the adhesion strength at temperatures higher than the melting point is closely related to the
melt strength of the resins. However, the fast diffusion of linear chains across the interface is a
prerequisite to create entanglements across the interface.
The influence of LCB should be examined in two categories of conventional and single site
catalyzed polyethylene resins. In conventional polyethylene resins, highly long branched chains
cause LDPE to have very low self-adhesion strength. In metallocene catalyzed resins, the
presence of a very low amount of long chain branches leads to lower adhesion strength compared
to their linear counterparts. We argued that even low level of LCB hinder the reptation motion
and diffusion. As the main conclusion of this part, the interfacial self-adhesion strength is
primarily the outcome of chain interdiffusion across the interface and then the melt strength of
polymer.
The ultimate adhesion strength of linear Ziegler-Natta and metallocene catalyzed LLDPE are
evaluated. Our findings indicate that the heterogeneity in composition distribution of
conventional polyethylene result in much lower self-adhesion strength compared to their
homogeneous counterparts. This was explained to occur because of high concentration of highly
branched low molecular weight chains in the surface of heterogeneous films. The segregated
layer of short chains at the surface, which is doubled upon sealing, is less effective in
strengthening the interface than long chains. Therefore, the composition distribution of polymer
chains including SCB distribution is the influential parameter.

115
Due to cost and processability concerns, metallocene catalyzed ethylene –olefins are being
generally used in the form of blends with conventional polyethylene resins. Therefore, the
performance of variety of chain structures in the blends should be explored. Long chain
branching is a key factor in both categories of metallocene catalyzed and conventional
polyethylene resins. In the third part of the our work, four binary blends were prepared from one
component of conventional polyethylene either LDPE or Ziegler-Natta LLDPE, and another
component of metallocene catalyzed ethylene α-olefin copolymer either linear (Linear-m) or long
chain branch containing (LCB-m). In order to determine the adhesion temperature range, the
melting behaviour of films should primarily be examined. The melting thermographs of the first
DSC cycle of the blend films indicate cocrystallization and hence partial miscibility for all blend
compositions. It also showed the gradual shift of Tm toward the melting point of second
component by blending.
Our findings showed that the incorporation of metallocene of both kinds into conventional PEs
enhance the self adhesion. However, the adhesion strength of the blends containing 60wt%
metallocene resins is far weaker than the adhesion strength of neat metallocene resins. This is due
to the formation of a segregated layer of highly branched short chains of LDPE or LLDPE at the
surface of the films (as discussed in the second paper). In addition, blending linear-m with both
LDPE and LLDPE leads to higher improvement in adhesion strength than blending with LCB-m.
This is attributed to the superior diffusion of Linear-m across the interface, because of its linear
chains. All compositions of LDPE blends showed higher %increase for adhesion strength
compared to their LLDPE counterparts. This finding suggests that for LDPE blends, a fast
diffusion was provided by both Linear-m and LCB-m. The temperature ranges in which the films
show a plateau of their highest adhesion strength were determined. For all LDPE/metallocene
blends composition, the broadness of temperature window was broader than for the blends of
LLDPE/metallocene. This indicates an inherent difference in melt behaviour of these two resins
in extensional deformation. In order to understand this behaviour, the melt toughness obtained
from extensional rheology was examined. Our findings indicated that the higher relaxation time
of LDPE chains and higher level of entanglements in the melt results in higher melt toughness
compared to LLDPE.
116
CHAPTER 8
CONCLUSIONS AND RECOMMENDATIONS
8.1 Conclusions
In this dissertation, the controlling parameters of heat sealing were explored. In the first phase of
this work we studied the behaviour and effects of process parameters of heat seal quality for
monolayer films of LLDPE as the most widely used polymer in seal layer applications. We
investigated the seal strength of 50μ monolayer LLDPE films supported by BOPP tape, in a
range of 100-135°C for temperature, 0.1-3 s for dwell time and 0.1-3 for N.mm-2
pressure.
Increasing dwell time enhanced seal strength however, the rate of this enhancement varied for
every interval of dwell time. We suggested that dwell time and temperature affect seal strength
through the same mechanism of crystal melting and interdiffusion. However, pressure affected
seal strength through wetting as a very different microscopic scale mechanism.
We also introduced the 3D mapping of process safety zone for the effect of concurrent change of
“temperature - dwell time” and “temperature - pressure” on the seal strength. The temperature
plateau broadness was studied in the range of dwell time and pressure. We showed that the time
and temperature dependence of seal strength is a consequence of the amount of amorphous phase
available at the interface of films. We investigated the time dependence of seal strengthening and
confirmed our observations with the welding models. We showed that the seal strength has a
linear correlation with the square root of sealing time. The slope of this linear correlation
increased with temperature.
The topography and morphology of peeled surfaces which were sealed at different heat seal
conditions were investigated. In the debonding failure mode, the crack propagates through the
sealed interface and it leaves numerous highly oriented fractured craze fibrils on the peeled
surfaces. The fractured fibrils were visible in AFM and SEM peeled surfaces of samples sealed at
low temperatures. In specimens sealed at higher temperature (120˚C) the fibrillar morphology
developed into thicker and larger fibrils. They thus appear more like a network. This was
explained by the better wetting and interdiffusion as a result of increasing temperature.
117
We also utilized the comparative RMS and Ra roughness parameters as representatives of the
level of film surfaces’ contact area and molecular interdiffusion. Increasing the seal temperature
resulted in higher RMS and Ra values indicating much rougher surfaces. Thus, when strong
adhesive bonds were broken, the resulting fracture surfaces were often extremely rough. It
indicated the improved diffusion. The roughness parameters were similar for samples sealed at
the Tpi for every dwell time, although Tpi is different for every dwell time. This finding indicated
that the diffusion reached to a certain point at Tpi regardless of the process conditions.
In the second phase we fundamentally studied the role of molecular architecture on adhesion
strength of variety of neat polyethylene resins. By increasing Mw, adhesion strength improved for
linear metallocene ethylene α-olefins containing similar amount of SCB. For the metallocene
ethylene α-olefins the presence of sparsely LCB resulted in lower adhesion strength compare to
the linear chains. The presence of LCB hindered the reptation motion and diffusion. Highly
branched chains of low density polyethylene (LDPE) yielded to a very low self-adhesion.
Therefore, our findings indicated that the increase of LCB content results in decrease of
interfacial self-adhesion strength.
The adhesion strength of Ziegler-Natta LLDPE was drastically lower than and metallocene
catalyzed LLDPE. This was explained to be attributed to the homogeneous composition
distribution of metallocene catalysed resins versus heterogeneous composition distribution of
Zigler-Natta catalyzed resins. The enrichment of highly branched low molecular weight chains at
the surfaces of the films in polymers with heterogeneous composition distribution was explained
to cause this phenomenon. The segregated layer of short chains in the surface, which is doubled
upon sealing, is less effective in strengthening the interface than the long chains.
The role of different molecular structures of polyethylene was studied through the designated
blend compositions of conventional and metallocene catalyzed polyethylene resins. Four binary
blends were prepared: LLDPE/Linear metallocene, LLDPE/LCB contain metallocene,
LDPE/Linear metallocene, LDPE/LCB contain metallocene. Incorporation of metallocene resins
to both LD and LL enhanced the adhesion strength. By increasing metallocene content to 40wt%
and 60wt% the adhesion strength increased for all four types of the blends. However, the %
increase of adhesion strength varied among different types of blends. All compositions of
LL/Linear-m and LD/Linear-m blends showed higher % increase in adhesion strength compared

118
to their counterparts in LL/LCB-m and LL/LCB-m blends. These results indicated that the
Linear-m was more effective than LCB-m in term of enhancement in adhesion strength.
Moreover, adhesion strength improvement for all of the compositions of LDPE was higher than
their LLDPE counterparts. This suggested that both Linear-m and LCB-m provided a faster
interdiffusion in LDPE blends.
The broad adhesion strength plateau of LDPE as highly LCB containing resin illustrated the
important role of high relaxation time of chains and high level of entanglements in melt
behaviour. Based on the correlations, melt toughness in extensional flow could provide a basis
for prediction of relative plateau broadness of a polymer. The broad adhesion strength plateau
was also observed for metallocene resins, which was attributed to their high melt toughness.
8.2 Original contributions
The concurrent effects of heat seal temperature-dwell time and temperature-pressure on
seal were illustrated in 3D maps, a methodology that is easily applicable to other
materials. Our results indicated that the time and temperature dependence of seal strength
is a consequence of the fraction of amorphous phase available at the interface of films.
We found that the seal strength has a linear correlation with the square root of sealing
time, particularly at short sealing times, which complements literature results for long
welding models.
A fundamental study was performed on the effect of different molecular architectures on
hot tack performance of resins from the polyethylene family. To our best knowledge, this
has not been addressed in the literature. Our findings indicated that by increasing Mw, the
hot tack (self-adhesion strength) improved for linear metallocene ethylene α-olefins. Also,
the presence of even low amount of LCB results in a decrease of interfacial self-adhesion
strength.
The lower adhesion strength of conventional PEs than metallocene catalyzed PEs was
explained to be attributed to the homogeneous composition distribution of metallocene
catalysed resins versus heterogeneous composition distribution of conventional PEs.
Our findings indicated that the Linear-metallocene resins was more effective than LCB-
metallocene in term of enhancement in adhesion strength. The broadness of adhesion

119
strength plateau depended on the melt toughness obtained from extensional rheological
properties and which could provide a basis for prediction of relative plateau broadness of
a polymer.
8.3 Recommendations
In the previous section, we summarized what has been accomplished in the current work
concerning the optimization of process parameters and material characteristics for heat seal
process. The following unexplored aspects are recommended for the continuation of this work
and future research:
1. To optimize seal process parameters in hot tack performance of polyethylene resins. Since
the trend of dwell time, pressure and temperature dependency of hot tack might differ
from seal strength, it is important to optimize hot tack based on these process parameters
2. To model heat transfer from heated bars to the film interfaces. It is important to estimate
the required time for heat transfer across the film thickness. It is necessary to consider the
phase change of material from solid to melt in heat sealing. In modeling of heat transfer,
the consumption of energy for melting the crystals and the change in heat capacity of
material from solid to melt should be considered.
3. To study the effect of molecular architecture on the hot tack after variety of delay times.
The seal strength is measured after complete cooling while hot tack is measured instantly
after heat sealing. However, in some industrial heat sealing processes the product fell into
the package after a certain delay time which is normally a fraction of a second. This delay
time enables partial crystallization which varies for different polymers.
4. To design metallocene and conventional polyethylene resins in a multilayer seal layer. In
a design that the metallocene resin covers a thin layer of a few micron at the surface of
seal layer. In order to avoid the influence of the segregated layer of highly branched low
molecular weight chains of heterogeneous conventional polyethylene resins. To
investigate the performance of LCB or linear metallocene at the surface of seal layer.
5. To improve the sustainability by reducing the thickness of seal layer. The possible
alternatives could be neat metallocene resins or using blends of different types of
metallocene together with different compositions.
120
BIBLIOGRAPHIE
Basin, V.E., 1967. Role of diffusion in the formation of adhesion bonds between polymers.
Polym. Mech. 3, 561–563. doi:10.1007/BF00859242
Bastien, L.J., Gillespie, J.W., 1991. A non-isothermal healing model for strength and toughness
of fusion bonded joints of amorphous thermoplastics. Polym. Eng. Sci. 31, 1720–1730.
doi:10.1002/pen.760312406
Benkoski, J.J., Fredrickson, G.H., Kramer, E.J., 2002. Model for the fracture energy of glassy
polymer–polymer interfaces. J. Polym. Sci. Part B Polym. Phys. 40, 2377–2386.
doi:10.1002/polb.10288
Boiko, Y.M., Guérin, G., Marikhin, V.A., Prud’homme, R.E., 2001. Healing of interfaces of
amorphous and semi-crystalline poly(ethylene terephthalate) in the vicinity of the glass
transition temperature. Polymer 42, 8695–8702. doi:10.1016/S0032-3861(01)00406-2
Boiko, Y.M., Lyngaae, J., 2005. Fracture energy–fracture stress relationship for weak polymer–
polymer interfaces. Polymer 46, 6016–6024. doi:10.1016/j.polymer.2005.05.064
Boiko, Y.M., Prud’homme, R.E., 1998. Morphology of fractured polymer surfaces self-bonded
below the glass transition temperature. Mech. Compos. Mater. 34, 473–482.
doi:10.1007/BF02254711
Boiko, Y.M., Prud’homme, R.E., 1999. Interdiffusion and adhesion at the inteface of a
polystyrene-poly(2,6-dimethyl-1,4-phenylene oxide) blend below the glass transition
temperature. Mech. Compos. Mater. 35, 441–446. doi:10.1007/BF02329331
Brown, 1991a. The Adhesion Between Polymers. Annu. Rev. Mater. Sci. 21, 463–489.
doi:10.1146/annurev.ms.21.080191.002335
Brown, 1991b. A molecular interpretation of the toughness of glassy polymers. Macromolecules
24, 2752–2756. doi:10.1021/ma00010a018
Brown, H.R., 1989. Effect of a diblock copolymer on the adhesion between incompatible
polymers. Macromolecules 22, 2859–2860. doi:10.1021/ma00196a059
Brown, H.R., 1990. Mixed-mode effects on the toughness of polymer interfaces. J. Mater. Sci.
25, 2791–2794. doi:10.1007/BF00584881
Brown, H.R., 2001. Relation between the Width of an Interface between Two Polymers and Its
Toughness. Macromolecules 34, 3720–3724. doi:10.1021/ma991821v
Brydson, J.A., 1999. Plastics Materials. Butterworth-Heinemann.
Cherry, B.W., 1981. Polymer surfaces. Cambridge University Press, Cambridge [Eng.]; New
York.
Chum, P.S., Kruper, W.J., Guest, M.J., 2000. Materials Properties Derived from INSITE
Metallocene Catalysts. Adv. Mater. 12, 1759–1767. doi:10.1002/1521-
4095(200012)12:23<1759::AID-ADMA1759>3.0.CO;2-7
Coles, R., McDowell, D., Kirwan, M.J., 2003. Food packaging technology. CRC Press.
121
Colls, N., Torres, A., Méndez, F., 2006. Material Selector for LLDPE/LDPE Blends for FFS
Applications. J. Plast. Film Sheeting 22, 19–27. doi:10.1177/8756087906062563
Creton, C., Kramer, E.J., Hui, C.Y., Brown, H.R., 1992. Failure mechanisms of polymer
interfaces reinforced with block copolymers. Macromolecules 25, 3075–3088.
doi:10.1021/ma00038a010
De Gennes, P.G., 1971. Reptation of a Polymer Chain in the Presence of Fixed Obstacles. J.
Chem. Phys. 55, 572–579. doi:doi:10.1063/1.1675789
De Gennes, P.-G., 1979. Scaling Concepts in Polymer Physics. Cornell University Press, Ithaca,
NY.
De Gennes, P.-G., 1983. Entangled polymers. Phys. Today 36, 33–39. doi:10.1063/1.2915700
Doi, M., Edwards, S.F., 1978a. Dynamics of rod-like macromolecules in concentrated solution.
Part 1. J. Chem. Soc. Faraday Trans. 2 Mol. Chem. Phys. 74, 560–570.
doi:10.1039/F29787400560
Doi, M., Edwards, S.F., 1978b. Dynamics of concentrated polymer systems. Part 2.—Molecular
motion under flow. J. Chem. Soc. Faraday Trans. 2 Mol. Chem. Phys. 74, 1802–1817.
doi:10.1039/F29787401802
Doi, M., Edwards, S.F., 1978c. Dynamics of concentrated polymer systems. Part 3.—The
constitutive equation. J. Chem. Soc. Faraday Trans. 2 Mol. Chem. Phys. 74, 1818–1832.
doi:10.1039/F29787401818
Doi, M., Edwards, S.F., 1979. Dynamics of concentrated polymer systems. Part 4.—Rheological
properties. J. Chem. Soc. Faraday Trans. 2 Mol. Chem. Phys. 75, 38–54.
doi:10.1039/F29797500038
Donovan, K.M., Kong, D.-C., Liu, L., Sexton, D.F., Su, T.-K., 1999. United States Patent:
5888648 - Multi-layer hermetically sealable film and method of making same. 5888648.
F02 Committee, 1998. ASTM 1921-98 Test Methods for Hot Seal Strength (Hot Tack) of
Thermoplastic Polymers and Blends Comprising the Sealing Surfaces of Flexible Webs.
ASTM International.
F02 Committee, 2000. ASTM F88 Test Method for Seal Strength of Flexible Barrier Materials.
ASTM International.
Farley, J.M., Meka, P., Stehling, F.C., Trudell, B.C., Kurtzman, M.B., 1996. United States
Patent: 5530065 - Heat sealable films and articles made therefrom. 5530065.
Feldman, D., 1996. Synthetic Polymers: Technology, Properties, Applications. Springer.
Foster, K.L., Wool, R.P., 1991. Strength of polystyrene-poly(methyl methacrylate) interfaces.
Macromolecules 24, 1397–1403. doi:10.1021/ma00006a028
Fowler, M.E., Barlow, J.W., Paul, D.R., 1987. Kinetics of adhesion development at PMMA-SAN
interfaces. Polymer 28, 2145–2150. doi:10.1016/0032-3861(87)90056-5
Frederix, C., Beauchene, P., Seguela, R., Lefebvre, J.M., 2013. Kinetics of the non-isothermal
fusion-welding of unlike ethylene copolymers over a wide crystallinity range. Polymer
54, 2755–2763. doi:10.1016/j.polymer.2013.03.038
122
Gardon, J.L., 1963a. Peel adhesion. I. Some phenomenological aspects of the test. J. Appl.
Polym. Sci. 7, 625–641. doi:10.1002/app.1963.070070219
Gardon, J.L., 1963b. Peel adhesion. II. A theoretical analysis. J. Appl. Polym. Sci. 7, 643–665.
doi:10.1002/app.1963.070070220
Gent, A.N., Kim, E.-G., Ye, P., 1997. Autohesion of crosslinked polyethylene. J. Polym. Sci. Part
B Polym. Phys. 35, 615–622. doi:10.1002/(SICI)1099-0488(199703)35:4<615::AID-
POLB9>3.0.CO;2-O
Halle, R.W., 1997. Use of Ethylene Plastomers to Improve Polyethylene Films, in: 1997
Polymers, Laminations & Coatings Conference. Presented at the TAPPI Polymers,
Laminations & Coatings Conference.
Halle, R.W., 2003. Plastomer-mVLDPE Blends for High Performance Heat Sealing Applications,
in: TAPPI 2003 Conference. Presented at the TAPPI Conference, Orlando, Florida, pp. 7–
45.
Halle, R.W., Davis, D.S., 1995. Heat sealing linear ethylene plastomers to ionomers or LLDPEs.
Tappi J. 78, 200–206.
Hamed, G.R., Shieh, C.-H., 1983. Relationship between the cohesive strength and the tack of
elastomers. J. Polym. Sci. Polym. Phys. Ed. 21, 1415–1425.
doi:10.1002/pol.1983.180210812
Hanlon, J.F., Kelsey, R.J., Forcinio, H.E., 1998. Handbook of package engineering. CRC.
Hashimoto, Y., Ishiaku, U. s., Leong, Y. w., Hamada, H., Tsujii, T., 2006. Effect of heat-sealing
temperature on the failure criteria of oriented polypropylene/cast polypropylene heat seal.
Polym. Eng. Sci. 46, 205–214. doi:10.1002/pen.20452
Hassan, A., 2007. Effect of bar sealing parameter on OPP/MCPP heat seal strength. Express
Polym. Lett. 1, 773–779.
Hosoda, S., 1988. Structural Distribution of Linear Low-Density Polyethylenes. Polym. J. 20,
383–397. doi:10.1295/polymj.20.383
Jordens, K., Wilkes, G.L., Janzen, J., Rohlfing, D.C., Welch, M.B., 2000. The influence of
molecular weight and thermal history on the thermal, rheological, and mechanical
properties of metallocene-catalyzed linear polyethylenes. Polymer 41, 7175–7192.
doi:10.1016/S0032-3861(00)00073-2
Kausch, H.H., Tirrell, M., 1989. Polymer Interdiffusion. Annu. Rev. Mater. Sci. 19, 341–377.
doi:10.1146/annurev.ms.19.080189.002013
Khare, A.R., Westphal, S.P., Ling, M.T.K., Qin, C., Woo, L., 2000. Thermal and dynamic
mechanical analysis on metallocene ULDPE/PP blends to optimize impact properties.
Thermochim. Acta 357–358, 155–160. doi:10.1016/S0040-6031(00)00384-1
Kim, K.D., Sperling, L.H., Klein, A., Hammouda, B., 1994. Reptation Time, Temperature, and
Cosurfactant Effects on the Molecular Interdiffusion Rate during Polystyrene Latex Film
Formation. Macromolecules 27, 6841–6850. doi:10.1021/ma00101a024
Klein, J., 1990. The Interdiffision of Polymers. Science 250, 640–646.
doi:10.1126/science.250.4981.640
123
Kline, D.B., Wool, R.P., 1988. Polymer welding relations investigated by a lap shear joint
method. Polym. Eng. Sci. 28, 52–57. doi:10.1002/pen.760280109
Kramer, E.J., 1983. Microscopic and molecular fundamentals of crazing, in: Kausch, H.H. (Ed.),
Crazing in Polymers, Advances in Polymer Science. Springer Berlin Heidelberg, pp. 1–
56.
Kramer, E.J., Berger, L.L., 1990. Fundamental processes of craze growth and fracture, in:
Kausch, H.-H. (Ed.), Crazing in Polymers Vol. 2, Advances in Polymer Science. Springer
Berlin Heidelberg, pp. 1–68.
Kunz, K., Stamm, M., 1996. Initial Stages of Interdiffusion of PMMA across an Interface.
Macromolecules 29, 2548–2554. doi:10.1021/ma950187s
Lee, L.H., 1991. Fundamentals of Adhesion. Springer.
Malsen, J. van, Tenpierik, M.J., Looman, R.H.J., Cauberg, J.J.M., 2008. Heat Seal Strength of
Barrier Films Used in Vacuum Insulation Panels At Room Temperature and At -130°C. J.
Plast. Film Sheeting 24, 35–52. doi:10.1177/8756087908089092
Manaure, A.C., Morales, R.A., Sánchez, J.J., Müller, A.J., 1997. Rheological and calorimetric
evidences of the fractionated crystallization of iPP dispersed in ethylene/α-olefin
copolymers. J. Appl. Polym. Sci. 66, 2481–2493. doi:10.1002/(SICI)1097-
4628(19971226)66:13<2481::AID-APP11>3.0.CO;2-0
Manaure, A.C., Müller, A.J., 2000. Nucleation and crystallization of blends of poly(propylene)
and ethylene/α-olefin copolymers. Macromol. Chem. Phys. 201, 958–972.
doi:10.1002/1521-3935(20000601)201:9<958::AID-MACP958>3.0.CO;2-0
Meka, P., Stehling, F.C., 1994. Heat sealing of semicrystalline polymer films. I. Calculation and
measurement of interfacial temperatures: Effect of process variables on seal properties. J.
Appl. Polym. Sci. 51, 89–103.
Mesnil, P., Arnauts, J., Halle, R.W., Rohse, N., 2000. Seal Through Contamination Performance
of Metallocene Plastomers. Presented at the TAPPI POLYMERS LAMINATIONS AND
COATINGS CONFERENCE, pp. 669–686.
Miller, P., Buckley, D.J., Kramer, E.J., 1991. Microstructure and origin of cross-tie fibrils in
crazes. J. Mater. Sci. 26, 4445–4454. doi:10.1007/BF00543666
Mirabella, F.M., Ford, E.A., 1987. Characterization of linear low-density polyethylene: Cross-
fractionation according to copolymer composition and molecular weight. J. Polym. Sci.
Part B Polym. Phys. 25, 777–790. doi:10.1002/polb.1987.090250407
Miyata, K., Toshiyuki, H., 2011. EFFECT OF LLDPE CONTENT ON HEAT SEAL
PROPERTIES FOR HDPE/LLDPE FILM, in: ANTEC 2011 Plastics: Annual Technical
Conference Proceedings. Presented at the ANTEC 2011.
Morris, B.A., 2002. Predicting the Heat Seal Performance of Ionomer Films. J. Plast. Film
Sheeting 18, 157–167. doi:10.1177/8756087902018003002
Mueller, C., Capaccio, G., Hiltner, A., Baer, E., 1998. Heat sealing of LLDPE: relationships to
melting and interdiffusion. J. Appl. Polym. Sci. 70, 2021–2030.
124
Nase, M., Langer, B., Grellmann, W., 2009. Influence of Processing Conditions On the Peel
Behavior of Polyethylene/ Polybutene-1 Peel Systems. J. Plast. Film Sheeting 25, 61–80.
doi:10.1177/8756087909343139
Nitta, K., Suzuki, K., Tanaka, A., 2000. Comparison of tensile properties in the pre-yield region
of metallocene-catalyzed and Ziegler-Natta-catalyzed linear polyethylenes. J. Mater. Sci.
35, 2719–2727. doi:10.1023/A:1004710127185
Nitta, K.–., Tanaka, A., 2001. Dynamic mechanical properties of metallocene catalyzed linear
polyethylenes. Polymer 42, 1219–1226. doi:10.1016/S0032-3861(00)00418-3
Poisson, Hervais, V., Lacrampe, M.F., Krawczak, P., 2006a. Optimization of PE/Binder/PA
extrusion blow molded films. I. Heat sealing ability improvement using PE/EVA blends.
J. Appl. Polym. Sci. 99, 974–985.
Poisson, Hervais, V., Lacrampe, M.F., Krawczak, P., 2006b. Optimization of PE/binder/PA
extrusion blow molded films. II. Adhesion properties improvement using binder/EVA
blends. J. Appl. Polym. Sci. 101, 118–127.
Prager, S., Tirrell, M., 1981. The healing process at polymer–polymer interfaces. J. Chem. Phys.
75, 5194–5198. doi:10.1063/1.441871
Razavi-Nouri, M., Hay, J.N., 2001. Thermal and dynamic mechanical properties of metallocene
polyethylene. Polymer 42, 8621–8627. doi:10.1016/S0032-3861(01)00377-9
Russell, T.P., Deline, V.R., Dozier, W.D., Felcher, G.P., Agrawal, G., Wool, R.P., Mays, J.W.,
1993. Direct observation of reptation at polymer interfaces. Nature 365, 235–237.
doi:10.1038/365235a0
Schnell, R., Stamm, M., Creton, C., 1998. Direct Correlation between Interfacial Width and
Adhesion in Glassy Polymers. Macromolecules 31, 2284–2292. doi:10.1021/ma971020x
Schnell, R., Stamm, M., Creton, C., 1999. Mechanical Properties of Homopolymer Interfaces: Transition from Simple Pullout To Crazing with Increasing Interfacial Width.
Macromolecules 32, 3420–3425. doi:10.1021/ma980860o
Schweizer, K.S., 1989. Mode‐coupling theory of the dynamics of polymer liquids: Qualitative
predictions for flexible chain and ring melts. J. Chem. Phys. 91, 5822–5839.
doi:10.1063/1.457534
Selke, S.E.M., Culter, J.D., Hernandez, R.J., 2004. Plastics Packaging: Properties, Processing,
Applications, And Regulations, 2nd ed. Hanser Gardner Publications.
Shanks, R.A., Li, J., Yu, L., 2000. Polypropylene–polyethylene blend morphology controlled by
time–temperature–miscibility. Polymer 41, 2133–2139. doi:10.1016/S0032-
3861(99)00399-7
Shih, H.H., Wong, C.M., Wang, Y.C., Huang, C.J., Wu, C.C., 1999. Hot tack of metallocene
catalyzed polyethylene and low-density polyethylene blend. J. Appl. Polym. Sci. 73,
1769–1773.
Smith, G.D., Plummer, C.J.G., Bourban, P.-E., Månson, J.-A.E., 2001. Non-isothermal fusion
bonding of polypropylene. Polymer 42, 6247–6257. doi:10.1016/S0032-3861(01)00060-
X

125
Stamm, M., Hüttenbach, S., Reiter, G., Springer, T., 1991. Initial Stages of Polymer
Interdiffusion Studied by Neutron Reflectometry. EPL Europhys. Lett. 14, 451.
doi:10.1209/0295-5075/14/5/011
Stehling, F.C., Meka, P., 1994. Heat sealing of semicrystalline polymer films. II. Effect of
melting distribution on heat-sealing behavior of polyolefins. J. Appl. Polym. Sci. 51, 105–
119.
Stokes, V.K., 1989. Joining methods for plastics and plastic composites: an overview. Polym.
Eng. Sci. 29, 1310–1324.
Tanrattanakul, V., Udomkichdecha, W., 2001. Development of novel elastomeric blends
containing natural rubber and ultra-low-density polyethylene. J. Appl. Polym. Sci. 82,
650–660. doi:10.1002/app.1893
Tetsuya, T., Hashimoto, Y., Ishiaku, U.S., Mizoguchi, M., Leong, Y.W., Hamada, H., 2006.
Effect of heat-sealing temperature on the properties of OPP/CPP heat seals. Part II.
Crystallinity and thermomechanical properties. J. Appl. Polym. Sci. 99, 513–519.
Tetsuya, T., Ishiaku, U.S., Mizoguchi, M., Hamada, H., 2005. The effect of heat sealing
temperature on the properties of OPP/CPP heat seal. I. Mechanical properties. J. Appl.
Polym. Sci. 97, 753–760.
Theller, H.W., 1989. Heatsealability of Flexible Web Materials in Hot-Bar Sealing Applications.
J. Plast. Film Sheeting 5, 66–93. doi:10.1177/875608798900500107
Troughton, M.J., 2008. Handbook of Plastics Joining: A Practical Guide. Cambridge University
Press.
Van Loon, A.J., Tierens, M.D., Permentier, D.J., 2009. United States Patent: 7588706 - Multi-
layer films with improved properties. 7588706.
Vega, J.F., Muñoz-Escalona, A., Santamaría, A., Muñoz, M.E., Lafuente, P., 1996. Comparison
of the Rheological Properties of Metallocene-Catalyzed and Conventional High-Density
Polyethylenes. Macromolecules 29, 960–965. doi:10.1021/ma9504633
Voyutskii, S.S., Kamenskii, A.N., Fodiman, N.M., 1966. Direct proofs of self- and mutual
diffusion in the formation of adhesion bonds between polymers. Polym. Mech. 2, 279–
283. doi:10.1007/BF00860301
Wagner, J.R., 2009. Multilayer Flexible Packaging: Technology and Applications for the Food,
Personal Care, and Over-the-Counter Pharmaceutical Industries. William Andrew.
Wang, W.-J., Ye, Z., Fan, H., Li, B.-G., Zhu, S., 2004. Dynamic mechanical and rheological
properties of metallocene-catalyzed long-chain-branched ethylene/propylene copolymers.
Polymer 45, 5497–5504. doi:10.1016/j.polymer.2004.05.053
Wild, L., Ryle, T.R., Knobeloch, D.C., Peat, I.R., 1982. Determination of branching distributions
in polyethylene and ethylene copolymers. J. Polym. Sci. Polym. Phys. Ed. 20, 441–455.
doi:10.1002/pol.1982.180200307
Wood-Adams, P.M., 1998. The effect of long chain branching on the rheological behavior of
polyethylenes synthesized using constrained geometry and metallocene catalysts
(Ph.D.Thesis). McGill University, Canada.
126
Wool, R.P., 1995. Polymer Interfaces: Structure and Strength. Hanser-Gardner Publications.
Wool, R.P., 2006. Adhesion at polymer–polymer interfaces: a rigidity percolation approach.
Comptes Rendus Chim. 9, 25–44. doi:10.1016/j.crci.2005.04.008
Wool, R.P., 2008. Self-healing materials: a review. Soft Matter 4, 400–418.
doi:10.1039/b711716g
Wool, R.P., O’Connor, K.M., 1981. A theory crack healing in polymers. J. Appl. Phys. 52, 5953–
5963. doi:10.1063/1.328526
Wool, R.P., Yuan, B.-L., McGarel, O.J., 1989. Welding of polymer interfaces. Polym. Eng. Sci.
29, 1340–1367. doi:10.1002/pen.760291906
Xu, D.-B., Hui, C.-Y., Kramer, E.J., Creton, C., 1991. A micromechanical model of crack growth
along polymer interfaces. Mech. Mater. 11, 257–268. doi:10.1016/0167-6636(91)90007-
M
Xue, Y.-Q., Tervoort, T.A., Lemstra, P.J., 1998. Welding behavior of semicrystalline polymers.
1. The effect of nonequilibrium chain conformations on autoadhesion of UHMWPE.
Macromolecules 31, 3075–3080.
Xue, Y.-Q., Tervoort, T.A., Rastogi, S., Lemstra, J., 2000. Welding Behavior of Semicrystalline
Polymers. 2. Effect of Cocrystallization on Autoadhesion. Macromolecules 33, 7084–
7087. doi:10.1021/ma000754y
Yoo, J.N., Sperling, L.H., Glinka, C.J., Klein, A., 1991. Characterization of film formation from
polystyrene latex particles via SANS. 2. High molecular weight. Macromolecules 24,
2868–2876. doi:10.1021/ma00010a036
Zhang, M.Q., Rong, M.Z., 2012. Theoretical consideration and modeling of self-healing
polymers. J. Polym. Sci. Part B Polym. Phys. 50, 229–241. doi:10.1002/polb.22387
Zhao, W., Zhao, X., Rafailovich, M.H., Sokolov, J., Composto, R.J., Smith, S.D., Russell, T.P.,
Dozier, W.D., Mansfield, T., Satkowski, M., 1993. Segregation of chain ends to polymer
melt surfaces and interfaces. Macromolecules 26, 561–562. doi:10.1021/ma00055a026
127
APPENDIX A
Article 4: Sealability and Seal Characteristics of PE/EVA
and PLA/PCL Blends*
Zahra Najarzadeh, Ramin Yousefzadeh Tabasi, A. Ajji
1. Abstract
Seal strength behaviour of low density polyethylene and ethylene vinyl acetate copolymer
(PE/EVA) blends as well as that of blends of a seal grade PLA with aliphatic polyester (PCL)
was studied. Polyethylene is commonly used for seal application in packaging multilayer
structures and amorphous PLA is considered to be its counterpart for compostable and/or
biodegradables ones. Incorporation of EVA in polyethylene improves its sealability in terms of a
decrease in seal initiation temperature and broadness of sealability plateau. This was interpreted
as due to the formation of finer crystals, a decrease in the melting point and presence of vinyl
acetate polar group. These were supported by results obtained from differential scanning
calorimetry (DSC) and Scanning electron microscopy (SEM). For the PLA/PCL system, the
dispersed phase was stretched into elongated ellipsoidal domains. This type of morphology
affected the mechanical and seal properties of the blends. As a result of blending, both hot-tack
initiation temperature and strength as well as seal initiation temperature were enhanced. The
enhancement in these seal properties was significant when the concentration of the dispersed
phase exceeded 20wt% in the blend. Hot-tack strength of up to twice of pure PLA was achieved
through blending. This was attributed to the lower glass transition temperature of PCL, resulting
in enhanced mobility of PLA chains and also the high aspect ratio of the dispersed phase. The
maximum obtained hot-tack strength (1200 g/25mm) at 40% dispersed content compared
advantageously to commercially available polyolefin based sealant resins. The seal and hot-tack
initiation temperatures were shifted to lower temperatures by as much as 30 °C, which can allow
faster and more energy efficient sealing process.
* Published in International Polymer Processing, 2014, Vol. 29, No. 1, pp. 95-102.

128
Keywords: Seal strength, hot tack, EVA, PLA/PCL blend, flexible packaging;
2. Introduction
Heat sealing is an important operation in packaging. Modern vertical and horizontal form fill seal
(VFFS and HFFS) machines have a need for operating at higher speeds. This requirement and the
fact that the final package integrity is ultimately dependent on the results of the sealing process
requires that the polymers used for the seal layer have superior hot-tack strength, low seal
initiation temperature and wider sealing temperatures range. Although resin suppliers provide a
wide range of resins for the seal layer, with a variety of performances and physical properties,
materials optimization is still a challenge. This challenge is even greater when the production line
aims to use biodegradable materials which still cannot provide as superior properties as
commercially available resins. Achieving sufficient adhesion upon sealing two semicrystalline
polymer films in the fully or partially molten state is mainly ascribed to chain interdiffusion
across the interface, amorphous fraction of material, and polymer chain functional groups.
Coextrusion of low density polyethylene (LDPE) and ethylene vinyl acetate copolymer (EVA)
has been used in industry to tailor a sealant layer. However, studies on correlation of physical
properties and final seal performance of LDPE/EVA blends in open literature are limited. Studies
on PE/EVA blends in a multilayer structure showed the effect of incorporating a low content
vinyl acetate EVA (9%) in seal layer and tie layer. (Poisson et al. 2006b; Poisson et al. 2006a;
Zhang et al. 2009) In this work we investigate the effect of EVA incorporation in monolayer PE
sealant for several compositions produced by the film blowing process. And the consequences of
this blending on microstructure and physical properties of the films and their correlation to the
final seal properties are established.
On the other hand, many efforts and energy are used to overcome the problems caused by plastic
wastes, particularly those produced every year by the packaging industry. Increasing costs for the
removal, incineration and landfill of municipal wastes urge the packaging industry to shift their
productions to more sustainable packages. (Brogly, Nardin, and Schultz 1997) In this study, we
also consider the applicability of biodegradable resins for multilayer packaging, and in particular
for seal layer.
129
Some bio-based resins such as Polylactides (PLA) and Polyhydroxyalkonoate (PHA) have good
moisture barrier but low flexibility, while others such as Polyvinylalcohol (PVA, PVOH) have
significantly higher oxygen barrier, but are highly sensitive to humidity. (Mittal and Pizzi 2009)
However, all these resin have a limited capability to be heat sealed at an acceptable dwell time
and low enough temperature not to deteriorate other properties of the package. This hermetic seal
property is a guaranty of the efficiency of barrier layers against oxygen permeation, odor loss and
water vapor transmission. Among bio-based and compostable and/or biodegradable polymers that
can be used as a hermetic seal layer are Polybutylene succinate (PBS) and amorphous PLA grade.
PBS lacks seal strength and PLA has low flexibility and high seal initiation temperature.
(Ichikawa and Mizukoshi 2011) In this study, another focus will be on the improvement of PLA
seal properties through blending with another more flexible biodegradable and/or compostable
resin such as polycaprolactone (PCL). This will be sought while maintaining reasonable
mechanical properties and allowing the package to seal at temperatures as low as 60-90°C.
3. Materials and Methods
For LDPE/EVA blends, low density polyethylene (LDPE, MFI of 2.3) and ethylene vinyl acetate
(EVA containing 18%VA, MFI of 8) were obtained from Dow Chemicals and Dupont
respectively. The materials studied include pure EVA and blends with weight content of 60%,
40% and 20% of EVA and are designated as EVA100, EVA60, EVA40 and EVA20 respectively.
For PLA/PCL blends, a seal grade PLA was obtained from Natureworks (grade is 4060D) and
was a copolymer of D,L lactic acid, with D-monomer content of higher than 10%. An aliphatic
polyester (polycaprolactone, PCL from Union Carbide with MW=80000 g/mole) has been used to
improve both flexibility and seal initiation temperature of the PLA sealant resin.
Melt blending of these materials needs a good understanding of melt behaviour and temperature
dependency of melt properties. A technique usually used for this purpose is rheological
characterization. Rheological properties can also be used in prediction of developed morphology
in a specific stress field. Rheological characterization of the resins in our study was carried out
using parallel-plate geometry on a constant strain rheometer (MCR 301 Anton Paar, Austria).
The experiments were performed in the dynamic mode at 180°C for PE/EVA blends and 190 °C
for PLA/PCL blends under a nitrogen atmosphere and in the frequency range of 0.1 to 100 Hz.
130
All LDPE/EVA samples have been melt blended directly into blown films using a 45 mm Killion
single-screw extruder equipped with a helical blown film die. All the films have been drawn to a
thickness of 40μm while circulating cooling air rest at room temperature.
For PLA/PCL blends, all samples have been melt blended directly into cast films using a twin-
screw extruder (Leistritz model ZSE 18 HP co-rotating) equipped with a cast film die. All the
films have been drawn to a thickness of 50μm for further analysis. The temperature profile of the
extruder along the barrel was set at 170/180/190/190 and the die at a temperature of 190°C.
Different blend compositions have been used to prepare the samples. The weight content of PCL
in the blends was 40%, 20%, and 0%. The number following the sample name is the content of
the dispersed phase (e.g PLCL80-20 has 20% PCL in the blend) and in case of pure resin the
samples have been coded as PLA or PCL.
As one of the main affecting factors in determination and control of seal properties is material’s
crystallinity before sealing; this content has to be determined precisely. Differential scanning
calorimeter (DSC) has a capability to analyze size and content of crystals in different polymeric
material both in granule form and as processed films. The TA Instruments Q1000 was used in
our study to achieve this goal. The operating window of this instrument is between 2˚C/min to
50˚C/min. The heating rate for all the samples was set at 10˚C/min and the temperature range
adjusted from -20˚C to 140˚C. The melting peaks for polyethylene and EVA are found at around
110˚C and 80˚C respectively, and for PCL melting point is around 60˚C. No melting point was
observed for amorphous PLA.
Seal strength experiments were performed using SL100 Lako-Tool hot-tack machine based on
the ASTM F88 and F2029 experimental methods. Heat seals were made with two metallic jaws
(19.1mm×25.4mm) covered by Teflon on film strips in 1 inch width × 13 inches length
dimension. Biaxially oriented polypropylene tape was used to provide the support for PE/EVA
sealant. For PLA/PCL samples, the support film was a semi-crystalline PLA with melting point
of 168°C thermally laminated on the films. All the sealing experiments were performed in a
range of jaw temperatures from 50˚C to 140˚C at a constant pressure of 0.5 (N/mm2) and dwell
time of 0.5 (s).
Seal property, mechanical and thermal properties of any type of blend, will depend strongly on its
morphology, in addition to the individual components. Scanning electron microscopy (SEM) is a
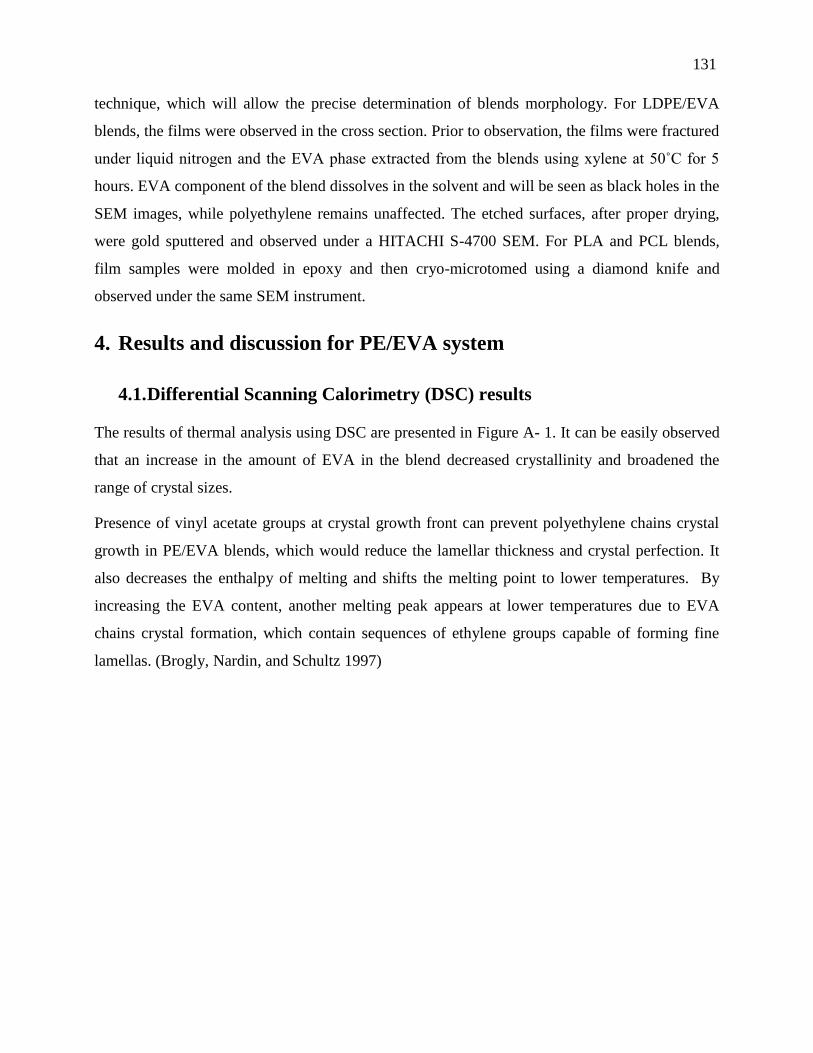
131
technique, which will allow the precise determination of blends morphology. For LDPE/EVA
blends, the films were observed in the cross section. Prior to observation, the films were fractured
under liquid nitrogen and the EVA phase extracted from the blends using xylene at 50˚C for 5
hours. EVA component of the blend dissolves in the solvent and will be seen as black holes in the
SEM images, while polyethylene remains unaffected. The etched surfaces, after proper drying,
were gold sputtered and observed under a HITACHI S-4700 SEM. For PLA and PCL blends,
film samples were molded in epoxy and then cryo-microtomed using a diamond knife and
observed under the same SEM instrument.
4. Results and discussion for PE/EVA system
4.1. Differential Scanning Calorimetry (DSC) results
The results of thermal analysis using DSC are presented in Figure A- 1. It can be easily observed
that an increase in the amount of EVA in the blend decreased crystallinity and broadened the
range of crystal sizes.
Presence of vinyl acetate groups at crystal growth front can prevent polyethylene chains crystal
growth in PE/EVA blends, which would reduce the lamellar thickness and crystal perfection. It
also decreases the enthalpy of melting and shifts the melting point to lower temperatures. By
increasing the EVA content, another melting peak appears at lower temperatures due to EVA
chains crystal formation, which contain sequences of ethylene groups capable of forming fine
lamellas. (Brogly, Nardin, and Schultz 1997)

132
Figure A- 1 DSC thermographs of melting of films
4.2. Sealability results
In the heat sealing results of the blends, it is important to evaluate the evolution of the seal
initiation temperature (Tsi), plateau initiation temperatures (Tpi), sealability temperature window
and plateau seal strengths for the various blends. The results are presented in Figure A- 2 and it
can be seen that polyethylene shows Tsi=108°C and Tpi=115°C, while for neat EVA Tsi=74°C and
Tpi=80°C were observed. The results for the blends of these two resins are located in between.
(Figure A- 2)
Incorporation of EVA in polyethylene causes a decrease in Tsi and Tpi at all concentration. But
from the results, one can observe two types of seal behaviour for the blends. Blends with lower
concentration than 40% follow similar trend in sealing as pure polyethylene. For 60 % EVA
content or more, the blends show a similar behaviour to pure EVA. The large difference in seal
strength and seal initiation temperature between 40% and 60% EVA blends might be due to the
dominance of EVA in 60% film. Vinyl acetate group polarity creates attraction force between the
two films surfaces.
Temperature (oC)
40 60 80 100 120
Exoth
erm
EVA100
EVA40
EVA20
PE
EVA60
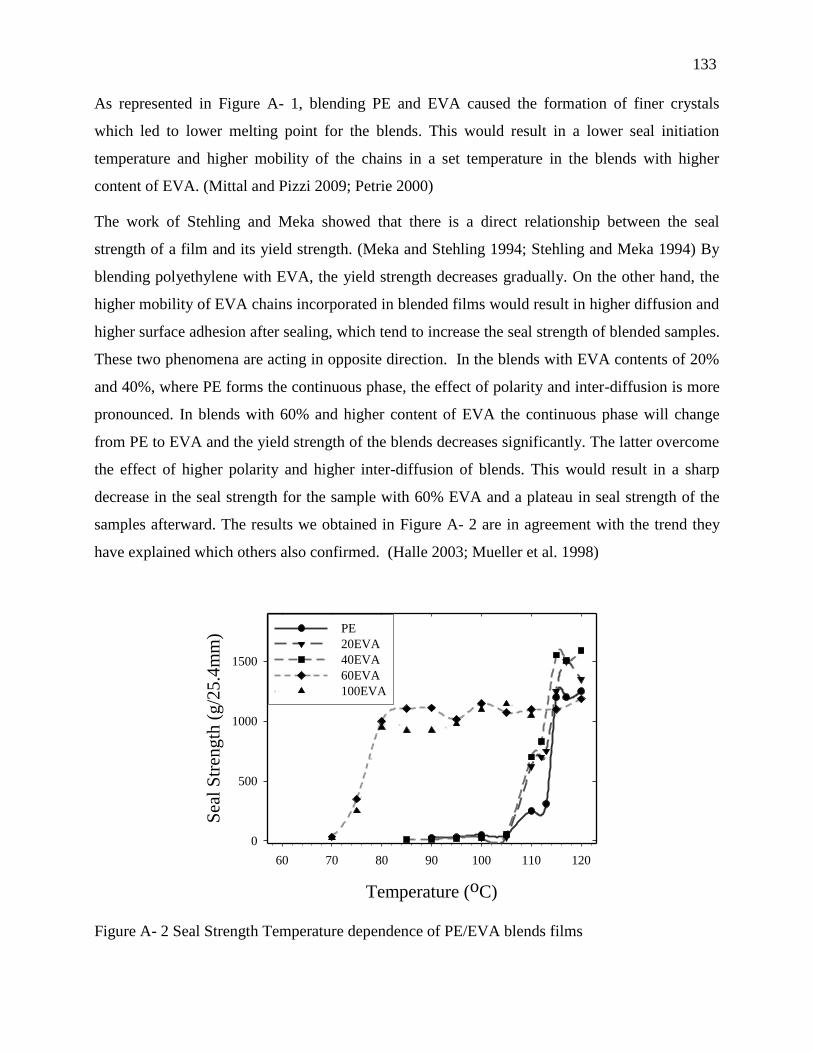
133
As represented in Figure A- 1, blending PE and EVA caused the formation of finer crystals
which led to lower melting point for the blends. This would result in a lower seal initiation
temperature and higher mobility of the chains in a set temperature in the blends with higher
content of EVA. (Mittal and Pizzi 2009; Petrie 2000)
The work of Stehling and Meka showed that there is a direct relationship between the seal
strength of a film and its yield strength. (Meka and Stehling 1994; Stehling and Meka 1994) By
blending polyethylene with EVA, the yield strength decreases gradually. On the other hand, the
higher mobility of EVA chains incorporated in blended films would result in higher diffusion and
higher surface adhesion after sealing, which tend to increase the seal strength of blended samples.
These two phenomena are acting in opposite direction. In the blends with EVA contents of 20%
and 40%, where PE forms the continuous phase, the effect of polarity and inter-diffusion is more
pronounced. In blends with 60% and higher content of EVA the continuous phase will change
from PE to EVA and the yield strength of the blends decreases significantly. The latter overcome
the effect of higher polarity and higher inter-diffusion of blends. This would result in a sharp
decrease in the seal strength for the sample with 60% EVA and a plateau in seal strength of the
samples afterward. The results we obtained in Figure A- 2 are in agreement with the trend they
have explained which others also confirmed. (Halle 2003; Mueller et al. 1998)
Figure A- 2 Seal Strength Temperature dependence of PE/EVA blends films
Temperature (oC)
60 70 80 90 100 110 120
Sea
l S
tren
gth
(g
/25
.4m
m)
0
500
1000
1500
PE
20EVA
40EVA
60EVA
100EVA
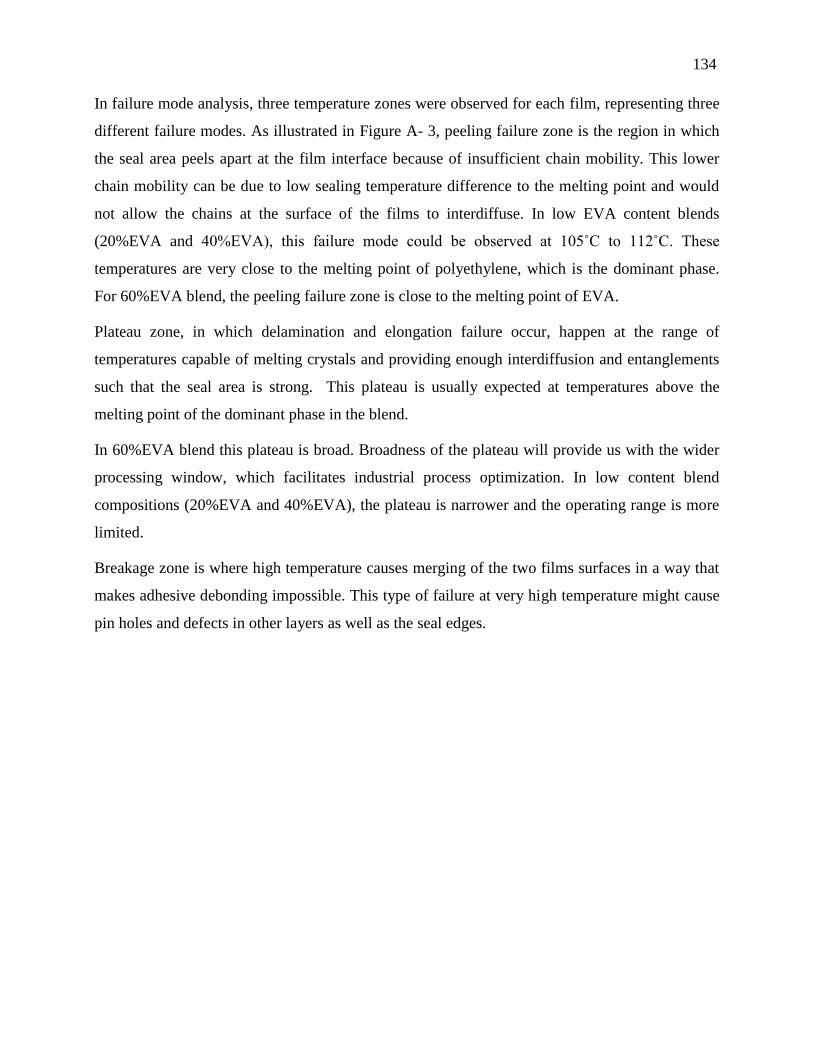
134
In failure mode analysis, three temperature zones were observed for each film, representing three
different failure modes. As illustrated in Figure A- 3, peeling failure zone is the region in which
the seal area peels apart at the film interface because of insufficient chain mobility. This lower
chain mobility can be due to low sealing temperature difference to the melting point and would
not allow the chains at the surface of the films to interdiffuse. In low EVA content blends
(20%EVA and 40%EVA), this failure mode could be observed at 105˚C to 112˚C. These
temperatures are very close to the melting point of polyethylene, which is the dominant phase.
For 60%EVA blend, the peeling failure zone is close to the melting point of EVA.
Plateau zone, in which delamination and elongation failure occur, happen at the range of
temperatures capable of melting crystals and providing enough interdiffusion and entanglements
such that the seal area is strong. This plateau is usually expected at temperatures above the
melting point of the dominant phase in the blend.
In 60%EVA blend this plateau is broad. Broadness of the plateau will provide us with the wider
processing window, which facilitates industrial process optimization. In low content blend
compositions (20%EVA and 40%EVA), the plateau is narrower and the operating range is more
limited.
Breakage zone is where high temperature causes merging of the two films surfaces in a way that
makes adhesive debonding impossible. This type of failure at very high temperature might cause
pin holes and defects in other layers as well as the seal edges.
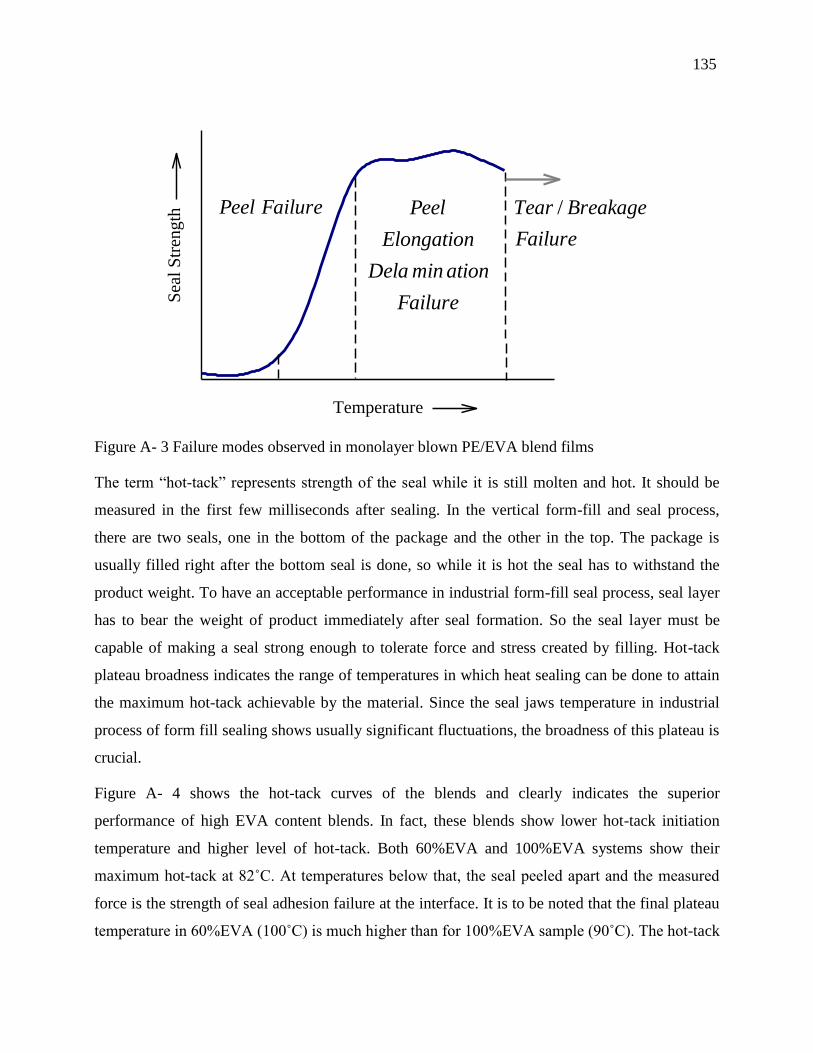
135
Figure A- 3 Failure modes observed in monolayer blown PE/EVA blend films
The term “hot-tack” represents strength of the seal while it is still molten and hot. It should be
measured in the first few milliseconds after sealing. In the vertical form-fill and seal process,
there are two seals, one in the bottom of the package and the other in the top. The package is
usually filled right after the bottom seal is done, so while it is hot the seal has to withstand the
product weight. To have an acceptable performance in industrial form-fill seal process, seal layer
has to bear the weight of product immediately after seal formation. So the seal layer must be
capable of making a seal strong enough to tolerate force and stress created by filling. Hot-tack
plateau broadness indicates the range of temperatures in which heat sealing can be done to attain
the maximum hot-tack achievable by the material. Since the seal jaws temperature in industrial
process of form fill sealing shows usually significant fluctuations, the broadness of this plateau is
crucial.
Figure A- 4 shows the hot-tack curves of the blends and clearly indicates the superior
performance of high EVA content blends. In fact, these blends show lower hot-tack initiation
temperature and higher level of hot-tack. Both 60%EVA and 100%EVA systems show their
maximum hot-tack at 82˚C. At temperatures below that, the seal peeled apart and the measured
force is the strength of seal adhesion failure at the interface. It is to be noted that the final plateau
temperature in 60%EVA (100˚C) is much higher than for 100%EVA sample (90˚C). The hot-tack
Temperature
Sea
l S
tren
gth FailurePeel
Failure
BreakageTear /
Failure
ationminDela
Elongation
Peel
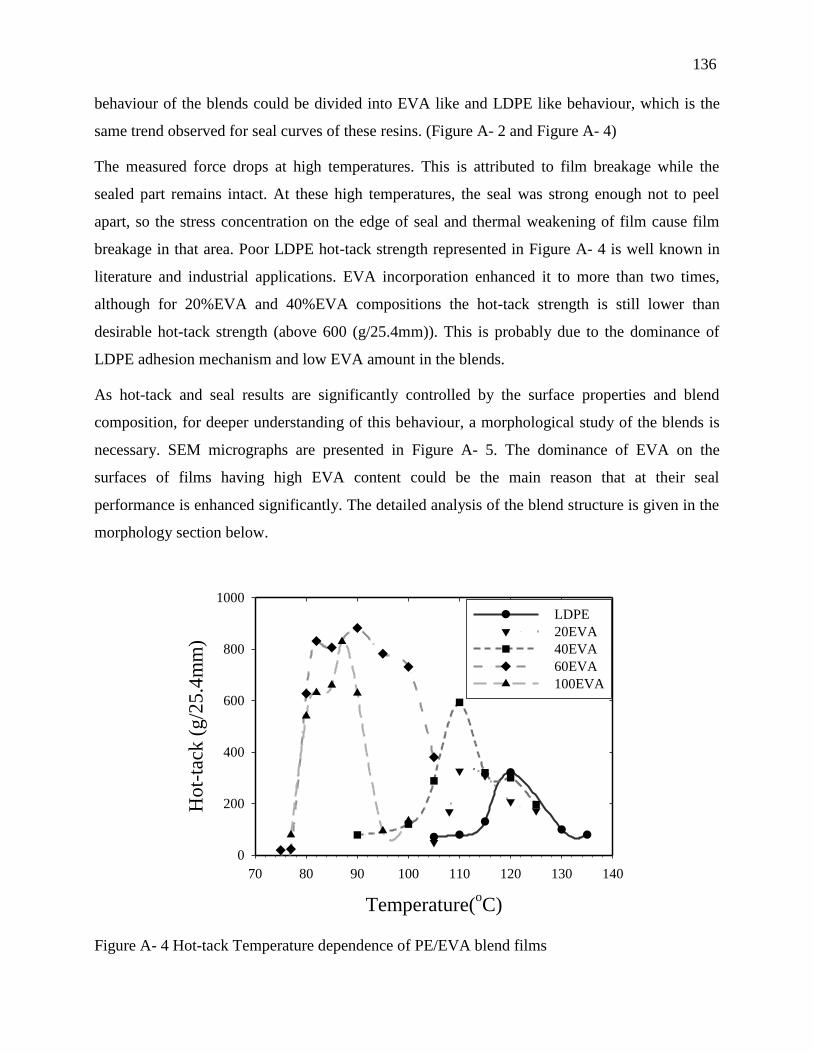
136
behaviour of the blends could be divided into EVA like and LDPE like behaviour, which is the
same trend observed for seal curves of these resins. (Figure A- 2 and Figure A- 4)
The measured force drops at high temperatures. This is attributed to film breakage while the
sealed part remains intact. At these high temperatures, the seal was strong enough not to peel
apart, so the stress concentration on the edge of seal and thermal weakening of film cause film
breakage in that area. Poor LDPE hot-tack strength represented in Figure A- 4 is well known in
literature and industrial applications. EVA incorporation enhanced it to more than two times,
although for 20%EVA and 40%EVA compositions the hot-tack strength is still lower than
desirable hot-tack strength (above 600 (g/25.4mm)). This is probably due to the dominance of
LDPE adhesion mechanism and low EVA amount in the blends.
As hot-tack and seal results are significantly controlled by the surface properties and blend
composition, for deeper understanding of this behaviour, a morphological study of the blends is
necessary. SEM micrographs are presented in Figure A- 5. The dominance of EVA on the
surfaces of films having high EVA content could be the main reason that at their seal
performance is enhanced significantly. The detailed analysis of the blend structure is given in the
morphology section below.
Figure A- 4 Hot-tack Temperature dependence of PE/EVA blend films
Temperature(oC)
70 80 90 100 110 120 130 140
Ho
t-ta
ck (
g/2
5.4
mm
)
0
200
400
600
800
1000
LDPE
20EVA
40EVA
60EVA
100EVA

137
4.3. Blend morphology
Morphology analysis can provide us with a useful tool to explain the difference in the seal results
of the two blend groups. The SEM images of etched cross section of 40%EVA and 60%EVA are
shown in Figure A- 5 along with that of LDPE. The darker domains indicate the positions of the
extracted EVA phase in both 60% and in 40%EVA. The extracted areas at the surface of the
films indicate the presence of EVA at the surface. These domains were larger for 60%EVA
compared to 40%EVA. For 60%EVA content, these domains cover most of the films surface.
Binary melt blends of several kinds of polyethylenes and EVAs with various vinyl acetate
contents were extensively investigated and known to be partially compatible, leading to matrix
disperse morphology at low contents and co-continuous morphology at high content of disperse
phase. (Jin 2010) In most of the applications, small amounts of polyethylene grafted maleic
anhydride were used as compatibilizer. (Moly et al. 2006) It should be mentioned here that it was
not possible to add the PE-g-MA compatibilizer because of FDA restrictions concerning contact
with food.
Finally, because of the large difference in viscosity of the resins, as illustrated in Figure A- 6, the
morphology developed in the film blowing die could not be of the droplet-matrix type but rather
co-continuous structure as reported in literature. (Chattopadhyay, Chaki, and Bhowmick 2001;
Peón et al. 2003) The complex viscosity (η*) of LDPE and EVA resins in Figure A- 6 shows a
large difference in their viscosities at shear rates in the range of the film blowing process. The
low molecular weight (low viscosity or high MFI) resin will go to the surface of the film in this
case. It has also been reported that, in incompatible blends, chains with higher surface free energy
or having polar groups have a preference to be located at the film surface. (Jalbert et al. 1993; H.
Lee and Archer 2001; Chen and Gardella 1994; McNally 2005a; McNally 2005b) This higher
concentration of EVA at the film surfaces causes superior hot-tack and seal strength results for
high EVA content films. Polarity of vinyl acetate group in EVA, in addition to lower
crystallinity, introduces the observed enhanced adhesion at the interface.
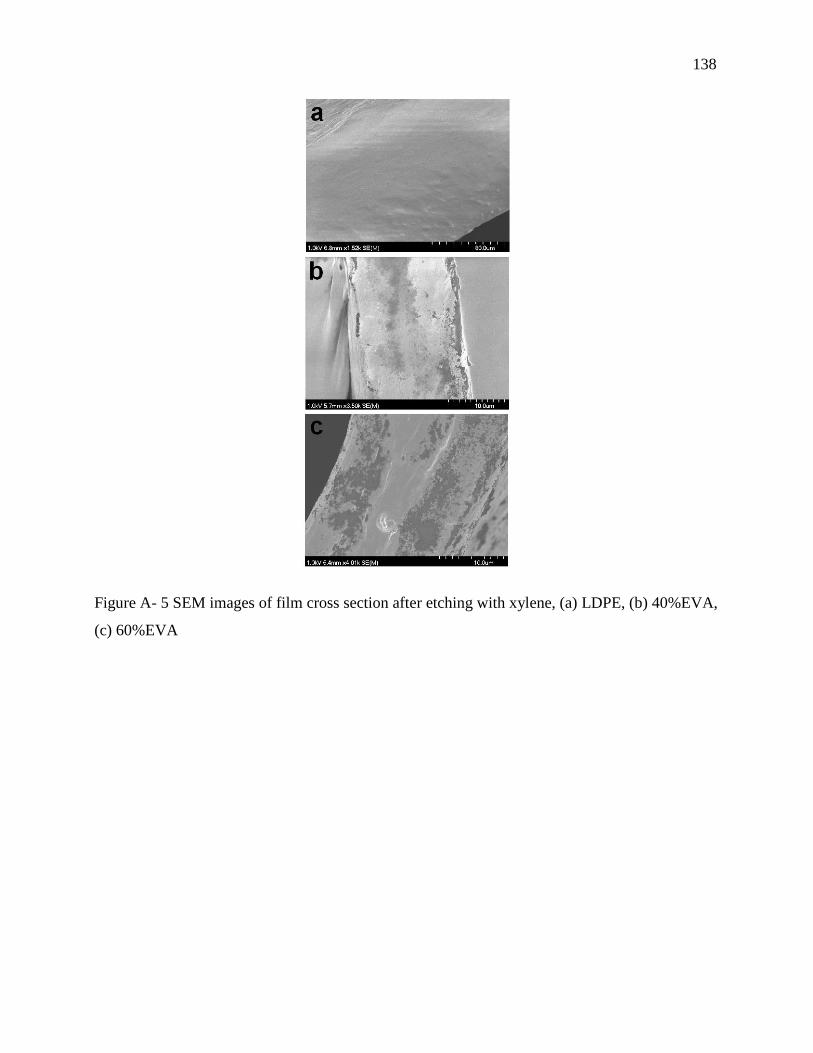
138
Figure A- 5 SEM images of film cross section after etching with xylene, (a) LDPE, (b) 40%EVA,
(c) 60%EVA
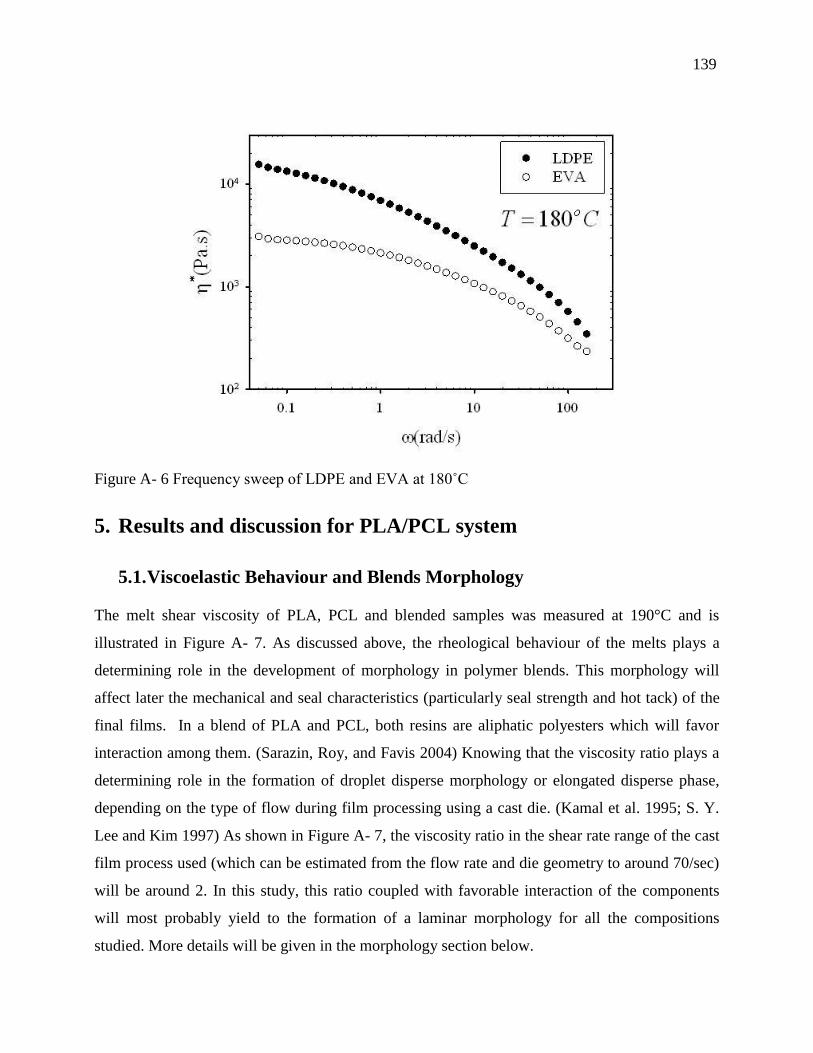
139
Figure A- 6 Frequency sweep of LDPE and EVA at 180˚C
5. Results and discussion for PLA/PCL system
5.1. Viscoelastic Behaviour and Blends Morphology
The melt shear viscosity of PLA, PCL and blended samples was measured at 190°C and is
illustrated in Figure A- 7. As discussed above, the rheological behaviour of the melts plays a
determining role in the development of morphology in polymer blends. This morphology will
affect later the mechanical and seal characteristics (particularly seal strength and hot tack) of the
final films. In a blend of PLA and PCL, both resins are aliphatic polyesters which will favor
interaction among them. (Sarazin, Roy, and Favis 2004) Knowing that the viscosity ratio plays a
determining role in the formation of droplet disperse morphology or elongated disperse phase,
depending on the type of flow during film processing using a cast die. (Kamal et al. 1995; S. Y.
Lee and Kim 1997) As shown in Figure A- 7, the viscosity ratio in the shear rate range of the cast
film process used (which can be estimated from the flow rate and die geometry to around 70/sec)
will be around 2. In this study, this ratio coupled with favorable interaction of the components
will most probably yield to the formation of a laminar morphology for all the compositions
studied. More details will be given in the morphology section below.
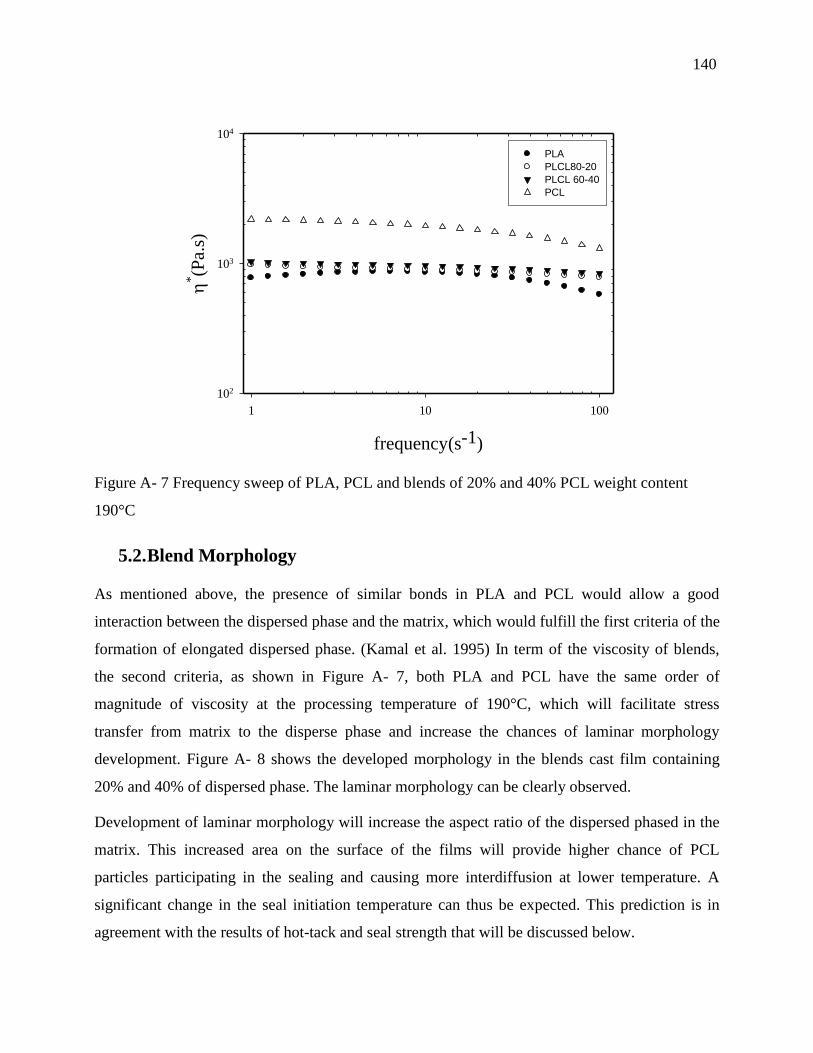
140
Figure A- 7 Frequency sweep of PLA, PCL and blends of 20% and 40% PCL weight content
190°C
5.2. Blend Morphology
As mentioned above, the presence of similar bonds in PLA and PCL would allow a good
interaction between the dispersed phase and the matrix, which would fulfill the first criteria of the
formation of elongated dispersed phase. (Kamal et al. 1995) In term of the viscosity of blends,
the second criteria, as shown in Figure A- 7, both PLA and PCL have the same order of
magnitude of viscosity at the processing temperature of 190°C, which will facilitate stress
transfer from matrix to the disperse phase and increase the chances of laminar morphology
development. Figure A- 8 shows the developed morphology in the blends cast film containing
20% and 40% of dispersed phase. The laminar morphology can be clearly observed.
Development of laminar morphology will increase the aspect ratio of the dispersed phased in the
matrix. This increased area on the surface of the films will provide higher chance of PCL
particles participating in the sealing and causing more interdiffusion at lower temperature. A
significant change in the seal initiation temperature can thus be expected. This prediction is in
agreement with the results of hot-tack and seal strength that will be discussed below.
frequency(s-1)
1 10 100
*(P
a.s)
102
103
104
PLA
PLCL80-20
PLCL 60-40
PCL
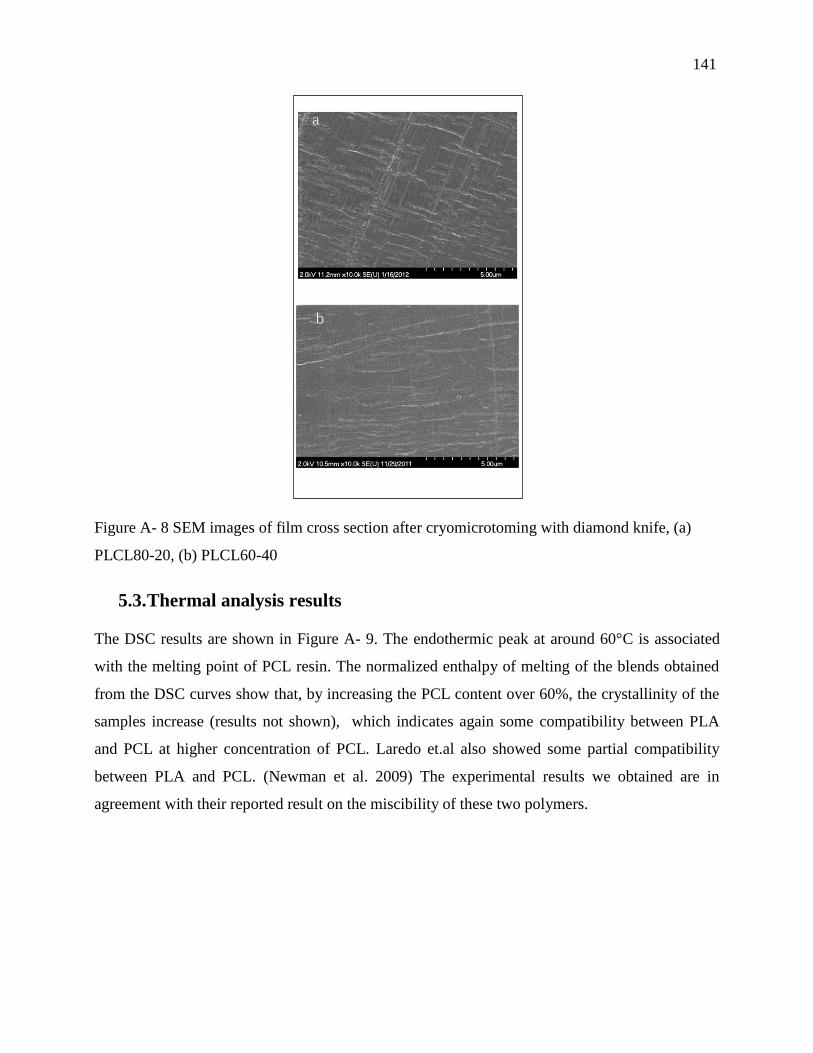
141
Figure A- 8 SEM images of film cross section after cryomicrotoming with diamond knife, (a)
PLCL80-20, (b) PLCL60-40
5.3. Thermal analysis results
The DSC results are shown in Figure A- 9. The endothermic peak at around 60°C is associated
with the melting point of PCL resin. The normalized enthalpy of melting of the blends obtained
from the DSC curves show that, by increasing the PCL content over 60%, the crystallinity of the
samples increase (results not shown), which indicates again some compatibility between PLA
and PCL at higher concentration of PCL. Laredo et.al also showed some partial compatibility
between PLA and PCL. (Newman et al. 2009) The experimental results we obtained are in
agreement with their reported result on the miscibility of these two polymers.

142
Figure A- 9 DSC thermographs of pure PCL and prepared blends
5.4. Sealability results
As mentioned above, the seal behaviour of film results from a combination of factors: seal
initiation temperature, plateau seal strength, and hot-tack maximum peak strength. In order to be
able to address the seal behaviour of any sealant film, all these characteristics need to be
determined. (Zhang et al. 2009; Mittal and Pizzi 2009; Petrie 2000) The hot-tack results for
PLA/PCL blends are presented in Figure A- 10. From the curves, it can be observed that the
maximum peak of hot-tack strength for pure PLA is around 700 (g/24.5mm) and by incorporation
of PCL, it increases gradually up to 1200 (g/24.5mm). The higher the hot-tack strength of the
blend the higher the load we can put in the package before it fails. Expected hot-tack strength of
the seal process determines the maximum hot-tack strength needed from the seal layer. Having a
seal layer with significantly higher hot-tack strength will allow its use for packaging of heavier
products.
Hot-tack initiation temperature shows a sharp decrease of 15°C by addition of 20% PCL and an
additional 10°C for 40% PCL as illustrated in Figure A- 10. The lower melting point of PCL and,
at the same time, its linear molecular chain structure are some of the reasons that cause higher
chain mobility and higher rate of diffusion in the blends. Figure A- 10 and Figure A- 11 show the
0
0.2
0.4
0.6
0.8
1
1.2
1.4
25 30 35 40 45 50 55 60 65
Hea
t Flo
w (W
/g)
Temprature (°C)
PLCL80-20
PLCL60-40
PCL
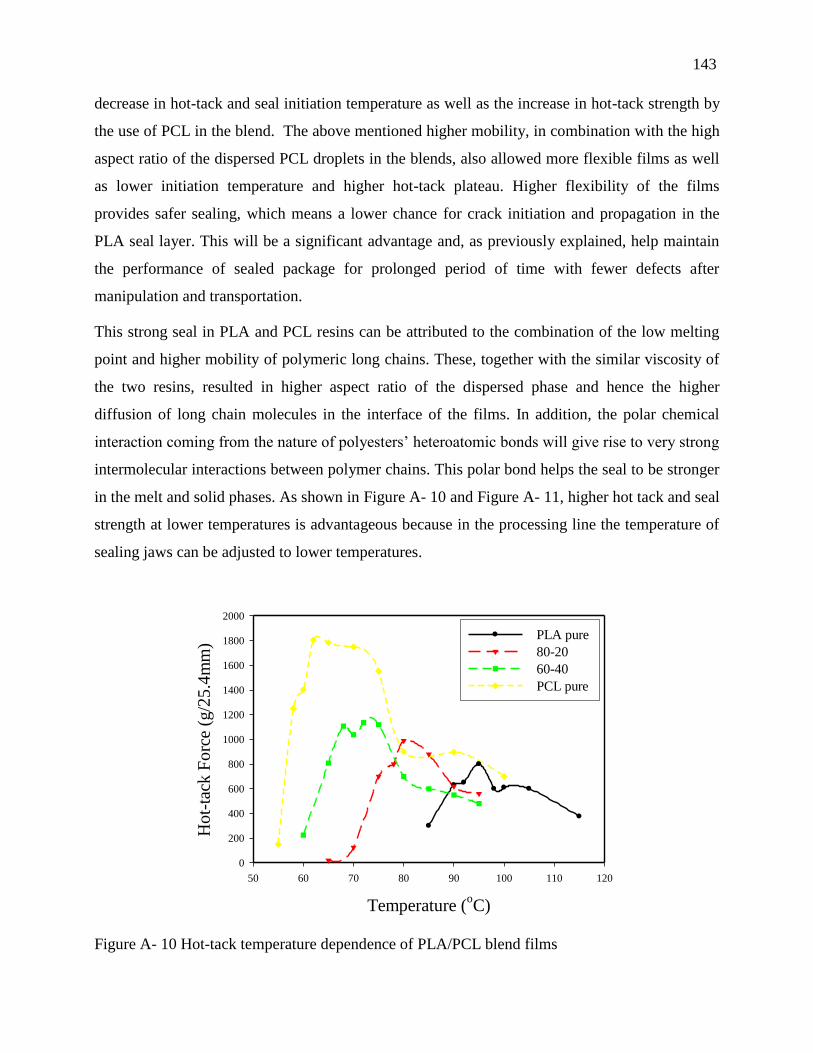
143
decrease in hot-tack and seal initiation temperature as well as the increase in hot-tack strength by
the use of PCL in the blend. The above mentioned higher mobility, in combination with the high
aspect ratio of the dispersed PCL droplets in the blends, also allowed more flexible films as well
as lower initiation temperature and higher hot-tack plateau. Higher flexibility of the films
provides safer sealing, which means a lower chance for crack initiation and propagation in the
PLA seal layer. This will be a significant advantage and, as previously explained, help maintain
the performance of sealed package for prolonged period of time with fewer defects after
manipulation and transportation.
This strong seal in PLA and PCL resins can be attributed to the combination of the low melting
point and higher mobility of polymeric long chains. These, together with the similar viscosity of
the two resins, resulted in higher aspect ratio of the dispersed phase and hence the higher
diffusion of long chain molecules in the interface of the films. In addition, the polar chemical
interaction coming from the nature of polyesters’ heteroatomic bonds will give rise to very strong
intermolecular interactions between polymer chains. This polar bond helps the seal to be stronger
in the melt and solid phases. As shown in Figure A- 10 and Figure A- 11, higher hot tack and seal
strength at lower temperatures is advantageous because in the processing line the temperature of
sealing jaws can be adjusted to lower temperatures.
Figure A- 10 Hot-tack temperature dependence of PLA/PCL blend films
Temperature (oC)
50 60 70 80 90 100 110 120
Ho
t-ta
ck F
orc
e (g
/25
.4m
m)
0
200
400
600
800
1000
1200
1400
1600
1800
2000
PLA pure
80-20
60-40
PCL pure
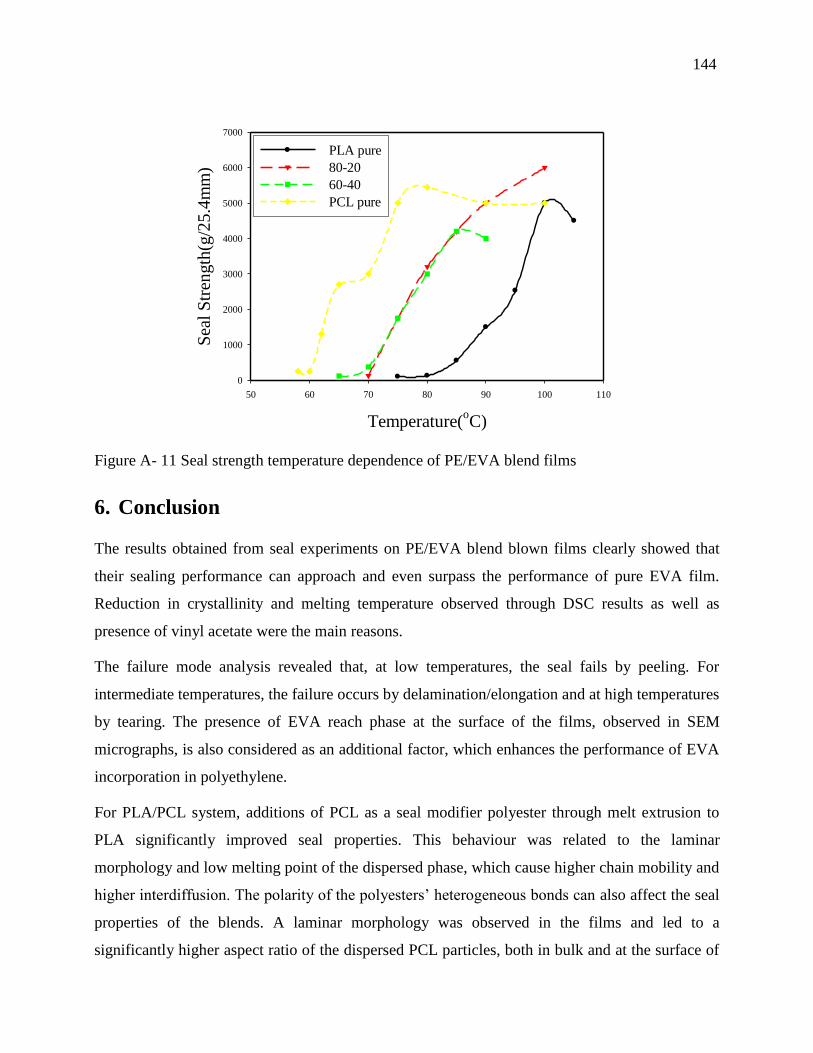
144
Figure A- 11 Seal strength temperature dependence of PE/EVA blend films
6. Conclusion
The results obtained from seal experiments on PE/EVA blend blown films clearly showed that
their sealing performance can approach and even surpass the performance of pure EVA film.
Reduction in crystallinity and melting temperature observed through DSC results as well as
presence of vinyl acetate were the main reasons.
The failure mode analysis revealed that, at low temperatures, the seal fails by peeling. For
intermediate temperatures, the failure occurs by delamination/elongation and at high temperatures
by tearing. The presence of EVA reach phase at the surface of the films, observed in SEM
micrographs, is also considered as an additional factor, which enhances the performance of EVA
incorporation in polyethylene.
For PLA/PCL system, additions of PCL as a seal modifier polyester through melt extrusion to
PLA significantly improved seal properties. This behaviour was related to the laminar
morphology and low melting point of the dispersed phase, which cause higher chain mobility and
higher interdiffusion. The polarity of the polyesters’ heterogeneous bonds can also affect the seal
properties of the blends. A laminar morphology was observed in the films and led to a
significantly higher aspect ratio of the dispersed PCL particles, both in bulk and at the surface of
Temperature(oC)
50 60 70 80 90 100 110
Sea
l S
tren
gth
(g/2
5.4
mm
)
0
1000
2000
3000
4000
5000
6000
7000
PLA pure
80-20
60-40
PCL pure
145
the film. This so called laminar morphology together with the higher mobility caused by
incorporation of low melting point PCL resin, as shown in hot-tack and seal experiment results,
have significantly improved the strength and initial hot-tack temperature as well as initial seal
temperature of the blend samples. Incorporation of PCL in PLA has also led to toughening of
PLA. This higher flexibility as discussed will provide safer and more reliable sealing process
with fewer expected defects within and after sealing process and through transportation.
7. References:
Brogly, M., M. Nardin, and J. Schultz. 1997. “Effect of Vinylacetate Content on Crystallinity and
Second‐order Transitions in Ethylene—vinylacetate Copolymers.” Journal of Applied Polymer
Science 64 (10) (June 6): 1903–1912.
Chattopadhyay, S., T. K. Chaki, and Anil K. Bhowmick. 2001. “Structural Characterization of
Electron-Beam Crosslinked Thermoplastic Elastomeric Films from Blends of Polyethylene and
Ethylene-Vinyl Acetate Copolymers.” Journal of Applied Polymer Science 81 (8): 1936–1950.
doi:10.1002/app.1626.
Chen, Xin, and Joseph A. Jr. Gardella. 1994. “Surface Modification of Polymers by Blending
Siloxane Block Copolymers.” Macromolecules 27 (12) (June 1): 3363–3369.
doi:10.1021/ma00090a034.
Halle, Richard W. 2003. “Plastomer-mVLDPE Blends for High Performance Heat Sealing
Applications.” In TAPPI 2003 Conference, 7–45. Orlando, Florida.
Ichikawa, Yasushi, and Tatsuya Mizukoshi. 2011. “Bionolle (Polybutylenesuccinate).” In
Synthetic Biodegradable Polymers, edited by Bernhard Rieger, Andreas Künkel, Geoffrey W.
Coates, Robert Reichardt, Eckhard Dinjus, and Thomas A. Zevaco, Chapter 8:285–313. Berlin,
Heidelberg: Springer Berlin Heidelberg.
Jalbert, Claire, Jeffrey T. Koberstein, Iskender Yilgor, Paula Gallagher, and Val Krukonis. 1993.
“Molecular Weight Dependence and End-Group Effects on the Surface Tension of
Poly(dimethylsiloxane).” Macromolecules 26 (12) (June 1): 3069–3074.
doi:10.1021/ma00064a012.
146
Jin, J. 2010. “Non-Isothermal Crystallization Kinetics of Partially Miscible Ethylene-Vinyl
Acetate Copolymer/low Density Polyethylene Blends.” eXPRESS Polymer Letters 4 (3)
(February 15): 141–152. doi:10.3144/expresspolymlett.2010.19.
Kamal, M. R., H. Garmabi, S. Hozhabr, and L. Arghyris. 1995. “The Development of Laminar
Morphology during Extrusion of Polymer Blends.” Polymer Engineering & Science 35 (1): 41–
51.
Lee, H., and L. Archer. 2001. “Surface Modification of Polymer via Surface-Induced Migration
of Copolymer Additives.” In ANTEC 2001 Conference Proceedings, 1472–1476.
Lee, Sang Young, and Sung Chul Kim. 1997. “Laminar Morphology Development and Oxygen
Permeability of LDPE/EVOH Blends.” Polymer Engineering & Science 37 (2): 463–475.
doi:10.1002/pen.11690.
McNally, G. M. 2005a. “The Effect of Polymer Properties on the Mechanical Behavior and
Morphological Characteristics of Cast Polyethylene Film for Stretch and Cling Film
Applications.” Journal of Plastic Film and Sheeting 21 (1) (January 1): 39–54.
doi:10.1177/8756087905052804.
McNally, G.M. 2005b. “The Effect of Vinyl Acetate Content and Polyisobutylene Concentration
on the Properties of Metallocene Polyethylene-Ethyl Vinyl Acetate Coextruded Film for Stretch
and Cling Film Applications.” Journal of Plastic Film and Sheeting 21 (1) (January 1): 69–83.
doi:10.1177/8756087905053791.
Meka, P., and F. C Stehling. 1994. “Heat Sealing of Semicrystalline Polymer Films. I.
Calculation and Measurement of Interfacial Temperatures: Effect of Process Variables on Seal
Properties.” Journal of Applied Polymer Science 51 (1): 89–103.
Mittal, K.L., and A. Pizzi. 2009. Handbook of Sealant Technology. 1st ed. Boca Raton: CRC
Press.
Moly, K. A., S. S. Bhagawan, G. Groeninckx, and S. Thomas. 2006. “Correlation between the
Morphology and Dynamic Mechanical Properties of Ethylene Vinyl Acetate/linear Low-Density
Polyethylene Blends: Effects of the Blend Ratio and Compatibilization.” Journal of Applied
Polymer Science 100 (6): 4526–4538.

147
Mueller, C., G. Capaccio, A. Hiltner, and E. Baer. 1998. “Heat Sealing of LLDPE: Relationships
to Melting and Interdiffusion.” Journal of Applied Polymer Science 70 (10): 2021–2030.
Newman, Dinorah, Estrella Laredo, Alfredo Bello, Angélica Grillo, José Luis Feijoo, and
Alejandro J. Mu ller. 2009. “Molecular Mobilities in Biodegradable Poly(dl-lactide)/Poly(ε-
Caprolactone) Blends.” Macromolecules 42 (14) (July 28): 5219–5225. doi:10.1021/ma9007303.
Peón, J, J.F Vega, B Del Amo, and J Mart nez-Salazar. 2003. “Phase Morphology and Melt
Viscoelastic Properties in Blends of Ethylene/vinyl Acetate Copolymer and Metallocene-
Catalysed Linear Polyethylene.” Polymer 44 (10) (May): 2911–2918.
Petrie, Edward M. 2000. Handbook of Adhesives and Sealants. London: McGraw-Hill
Professional.
Poisson, C., V. Hervais, M. F Lacrampe, and P. Krawczak. 2006a. “Optimization of
PE/binder/PA Extrusion Blow Molded Films. II. Adhesion Properties Improvement Using
binder/EVA Blends.” Journal of Applied Polymer Science 101 (1) (July 5): 118–127.
Poisson, V. Hervais, M. F Lacrampe, and P. Krawczak. 2006b. “Optimization of PE/Binder/PA
Extrusion Blow Molded Films. I. Heat Sealing Ability Improvement Using PE/EVA Blends.”
Journal of Applied Polymer Science 99 (3) (February 5): 974–985.
Sarazin, Pierre, Xavier Roy, and Basil D. Favis. 2004. “Controlled Preparation and Properties of
Porous Poly(l-Lactide) Obtained from a Co-Continuous Blend of Two Biodegradable Polymers.”
Biomaterials 25 (28) (December): 5965–5978.
Stehling, F. C, and P. Meka. 1994. “Heat Sealing of Semicrystalline Polymer Films. II. Effect of
Melting Distribution on Heat-Sealing Behavior of Polyolefins.” Journal of Applied Polymer
Science 51 (1): 105–119.
Zhang, Jinguo, Evangelos Manias, George Polizos, Jin-Young Huh, Amos Ophir, Ponusa
Songtipya, and Maria Jimenez-Gasco. 2009. “Tailored Polyethylene Nanocomposite Sealants:
Broad-Range Peelable Heat-Seals Through Designed Filler/Polymer Interfaces.” Journal of
Adhesion Science and Technology 23 (5): 709–737.