Embed Size (px)
Citation preview
Harvard-MIT Division of Health Sciences and Technology HST.542J: Quantitative Physiology: Organ Transport Systems Instructor: Roger Mark
c�Roger G. Mark, 2004
MASSACHUSETTS INSTITUTE OF TECHNOLOGY
Departments of Electrical Engineering, Mechanical Engineering, and the Harvard-MIT Division of Health Sciences and Technology
6.022J/2.792J/BEH.371J/HST542J: Quantitative Physiology: Organ Transport Systems
CONTROL AND INTEGRATION IN THE CARDIOVASCULAR SYSTEM
Text Reference: pages 144-166
CONTROL AND INTEGRATION IN THE CARDIOVASCULAR SYSTEM
A. Introduction
The purpose of the cardiovascular system is to deliver oxygen and other nutrients to the tissues of the body—particularly to the brain and heart. In general, the amount of blood flow to a particular organ is dynamically adjusted to meet its current metabolic need. The cardiovascular control systems operate to establish the proper cardiac output and to assure its optimal distribution to the various organs of the body. The highest priority is to assure adequate perfusion of the brain, and if necessary blood flow will be shunted from less critical organs to the brain.
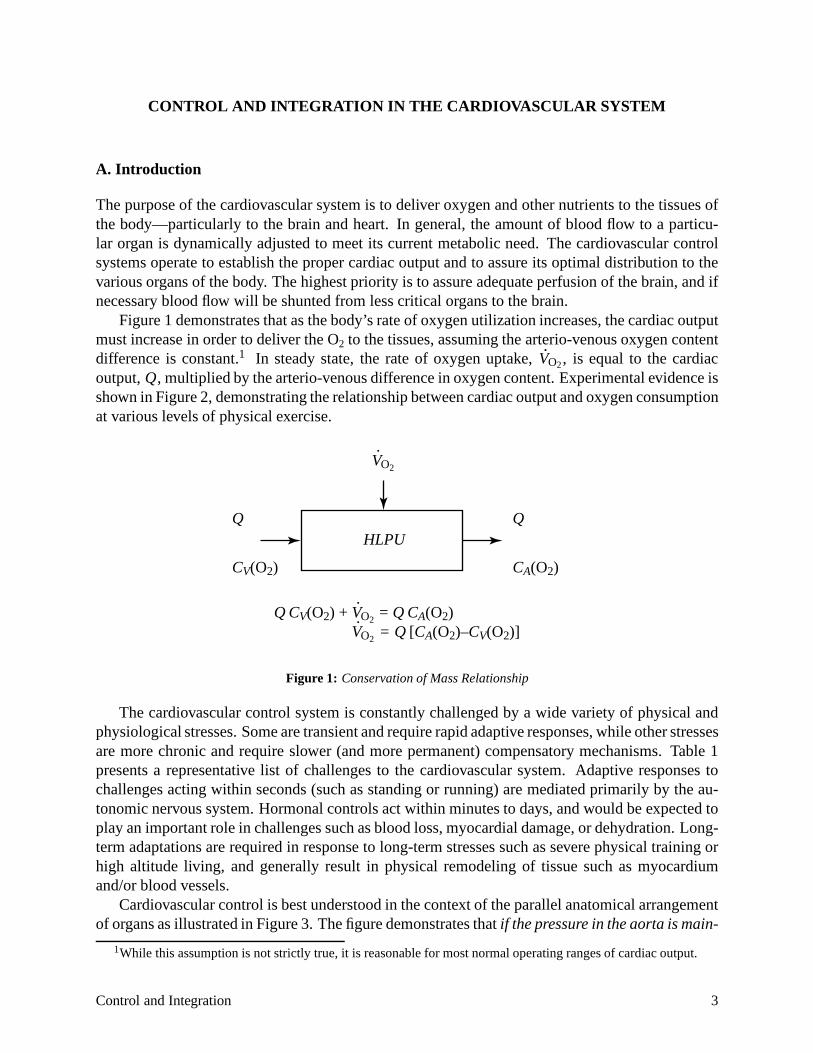
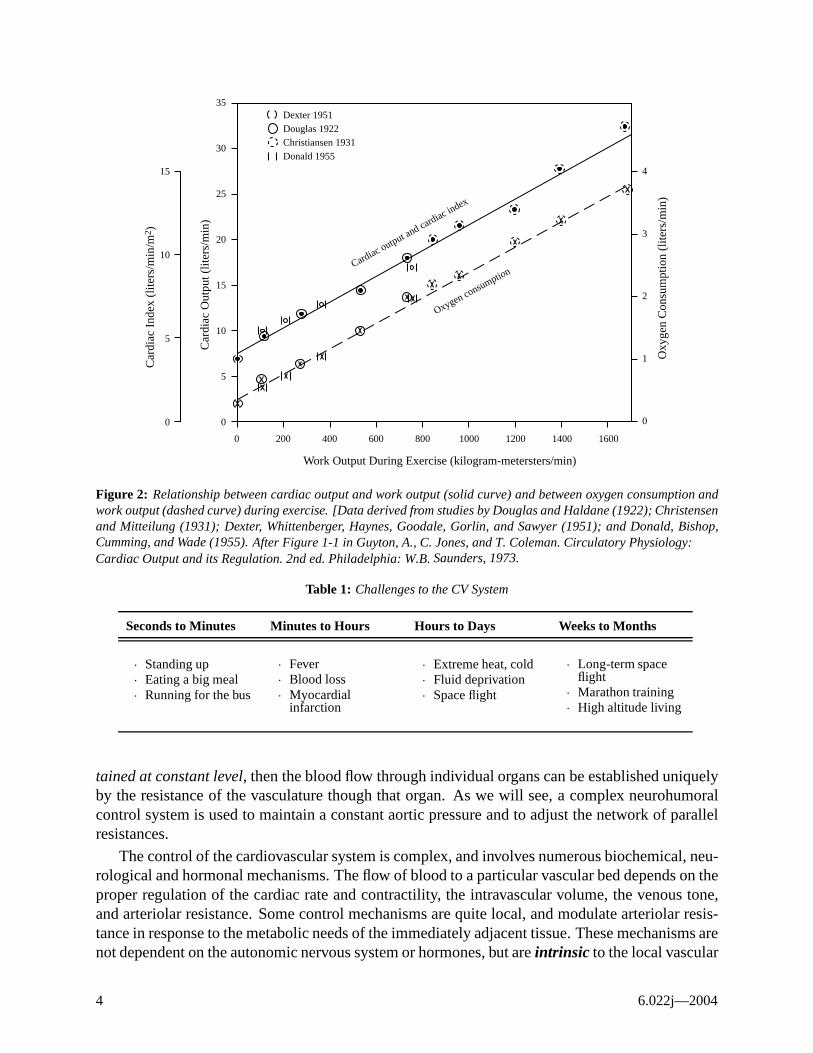
Figure 1 demonstrates that as the body’s rate of oxygen utilization increases, the cardiac output must increase in order to deliver the O2 to the tissues, assuming the arterio-venous oxygen content difference is constant.1 In steady state, the rate of oxygen uptake, V̇O2, is equal to the cardiac output, Q, multiplied by the arterio-venous difference in oxygen content. Experimental evidence is shown in Figure 2, demonstrating the relationship between cardiac output and oxygen consumption at various levels of physical exercise.
· VO2
Q HLPU
Q
CV(O2) CA(O2)
· Q CV(O2) + VO2
= Q CA(O2)·
VO2 = Q [CA(O2)–CV(O2)]
Figure 1: Conservation of Mass Relationship
The cardiovascular control system is constantly challenged by a wide variety of physical and physiological stresses. Some are transient and require rapid adaptive responses, while other stresses are more chronic and require slower (and more permanent) compensatory mechanisms. Table 1 presents a representative list of challenges to the cardiovascular system. Adaptive responses to challenges acting within seconds (such as standing or running) are mediated primarily by the autonomic nervous system. Hormonal controls act within minutes to days, and would be expected to play an important role in challenges such as blood loss, myocardial damage, or dehydration. Long-term adaptations are required in response to long-term stresses such as severe physical training or high altitude living, and generally result in physical remodeling of tissue such as myocardium and/or blood vessels.
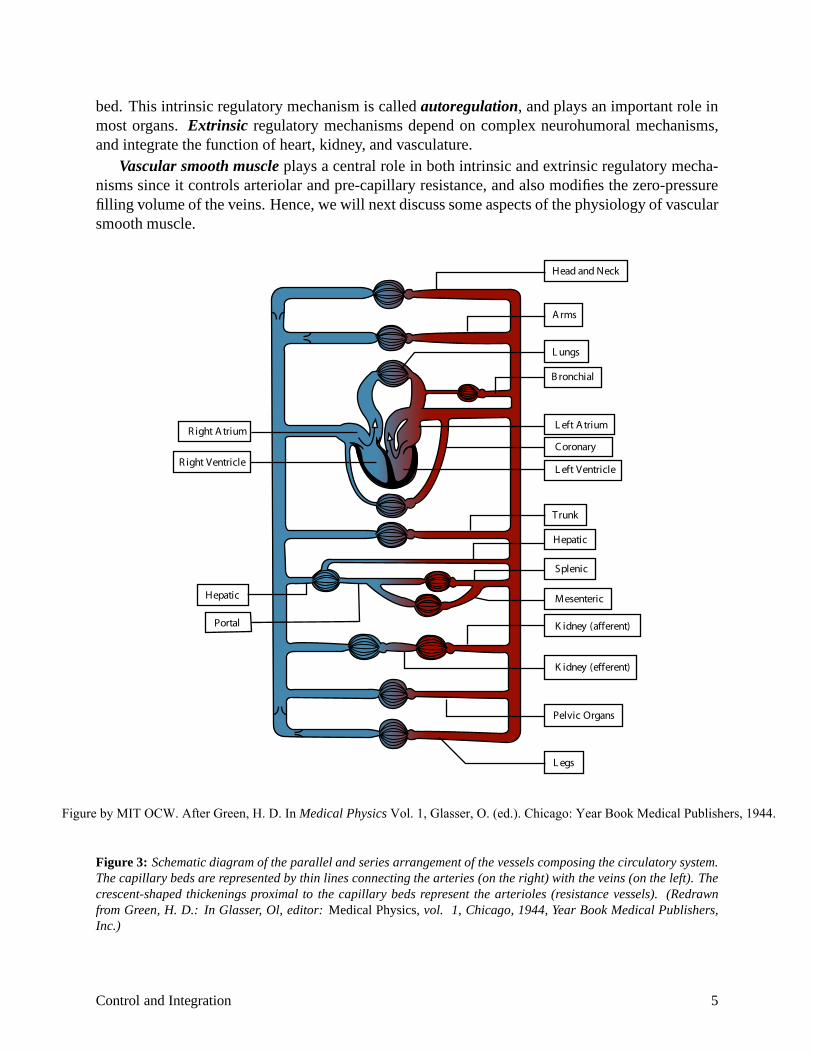
Cardiovascular control is best understood in the context of the parallel anatomical arrangement of organs as illustrated in Figure 3. The figure demonstrates that if the pressure in the aorta is main
1While this assumption is not strictly true, it is reasonable for most normal operating ranges of cardiac output.
Control and Integration 3
Dexter 1951 Douglas 1922 Christiansen 1931 Donald 1955
Oxy
gen
Con
sum
ptio
n (l
iters
/min
)
Car
diac
Out
put (
liter
s/m
in)
Car
diac
Ind
ex (
liter
s/m
in/m
2 )
Cardiac output and cardiac index
Oxygen consumption
4
3
2
1
00
5
10
15
0
5
10
15
20
25
30
35
0 200 400 600 800 1000 1200 1400 1600
Work Output During Exercise (kilogram-metersters/min)
Figure 2: Relationship between cardiac output and work output (solid curve) and between oxygen consumption and work output (dashed curve) during exercise. [Data derived from studies by Douglas and Haldane (1922); Christensen and Mitteilung (1931); Dexter, Whittenberger, Haynes, Goodale, Gorlin, and Sawyer (1951); and Donald, Bishop, Cumming, and Wade (1955). After Figure 1-1 in Guyton, A., C. Jones, and T. Coleman. Circulatory Physiology: Cardiac Output and its Regulation. 2nd ed. Philadelphia: W.B. Saunders, 1973.
Table 1: Challenges to the CV System
Seconds to Minutes Minutes to Hours Hours to Days Weeks to Months
· Standing up · Fever · Extreme heat, cold · Long-term space · Eating a big meal · Blood loss · Fluid deprivation flight · Running for the bus · Myocardial
infarction · Space flight · Marathon training
· High altitude living
tained at constant level, then the blood flow through individual organs can be established uniquely by the resistance of the vasculature though that organ. As we will see, a complex neurohumoral control system is used to maintain a constant aortic pressure and to adjust the network of parallel resistances.
The control of the cardiovascular system is complex, and involves numerous biochemical, neurological and hormonal mechanisms. The flow of blood to a particular vascular bed depends on the proper regulation of the cardiac rate and contractility, the intravascular volume, the venous tone, and arteriolar resistance. Some control mechanisms are quite local, and modulate arteriolar resistance in response to the metabolic needs of the immediately adjacent tissue. These mechanisms are not dependent on the autonomic nervous system or hormones, but are intrinsic to the local vascular
6.022j—2004 4
bed. This intrinsic regulatory mechanism is called autoregulation, and plays an important role in most organs. Extrinsic regulatory mechanisms depend on complex neurohumoral mechanisms, and integrate the function of heart, kidney, and vasculature.
Vascular smooth muscle plays a central role in both intrinsic and extrinsic regulatory mechanisms since it controls arteriolar and pre-capillary resistance, and also modifies the zero-pressure filling volume of the veins. Hence, we will next discuss some aspects of the physiology of vascular smooth muscle.
( )
( )
P
H ead and Neck
A rms
L ungs
B ronchial
L eft A trium
C oronary
L eft Ventricle
T runk
Hepatic
Splenic
M esenteric
K idney afferent
K idney efferent
Pelvic Organs
L egs
R ight A trium
R ight Ventricle
H epatic
ortal
Figure by MIT OCW. After Green, H. D. In Medical Physics Vol. 1, Glasser, O. (ed.). Chicago: Year Book Medical Publishers, 1944.
Figure 3: Schematic diagram of the parallel and series arrangement of the vessels composing the circulatory system. The capillary beds are represented by thin lines connecting the arteries (on the right) with the veins (on the left). The crescent-shaped thickenings proximal to the capillary beds represent the arterioles (resistance vessels). (Redrawn from Green, H. D.: In Glasser, Ol, editor: Medical Physics, vol. 1, Chicago, 1944, Year Book Medical Publishers, Inc.)
Control and Integration 5
B. Smooth Muscle
Introduction
Smooth muscle is present in the walls of most hollow organs of the body, such as the GI tract,bladder, uterus, gall bladder, ureters, and blood vessels (except capillaries). Smooth muscle isalso present elsewhere in the body, e.g. in the eye where it controls pupil size, or in the hair folli-cles where it causes “hair-raising”. Changes in smooth muscle tension offset changes in internalpressure, and/or control the diameter of hollow organs. In the GI tract smooth muscle coordi-nates peristalsis. In arterioles smooth muscle controls the resistance to blood flow. In venulesand veins, smooth muscle controls the amount of blood stored—the zero-pressure filling volume.Smooth muscle is, therefore, of central importance to the control of the cardiovascular system, andis central to the understanding of autoregulation.
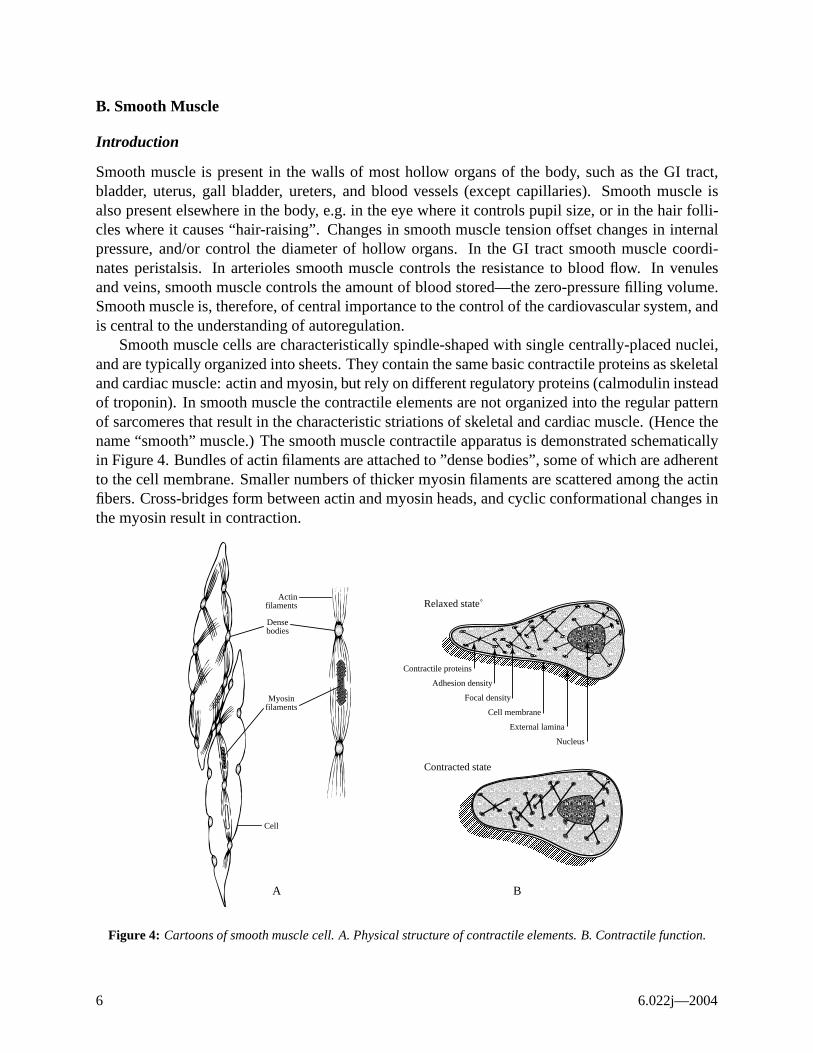
Smooth muscle cells are characteristically spindle-shaped with single centrally-placed nuclei,and are typically organized into sheets. They contain the same basic contractile proteins as skeletaland cardiac muscle: actin and myosin, but rely on different regulatory proteins (calmodulin insteadof troponin). In smooth muscle the contractile elements are not organized into the regular patternof sarcomeres that result in the characteristic striations of skeletal and cardiac muscle. (Hence thename “smooth” muscle.) The smooth muscle contractile apparatus is demonstrated schematicallyin Figure 4. Bundles of actin filaments are attached to ”dense bodies”, some of which are adherentto the cell membrane. Smaller numbers of thicker myosin filaments are scattered among the actinfibers. Cross-bridges form between actin and myosin heads, and cyclic conformational changes inthe myosin result in contraction.
Relaxed state˚
Contracted state
Contractile proteins
Focal density
Adhesion density
Cell membrane
External lamina
Nucleus
Myosin filaments
Dense bodies
Actin filaments
Cell
A B
Figure 4: Cartoons of smooth muscle cell. A. Physical structure of contractile elements. B. Contractile function.
6 6.022j—2004
Types of smooth muscle
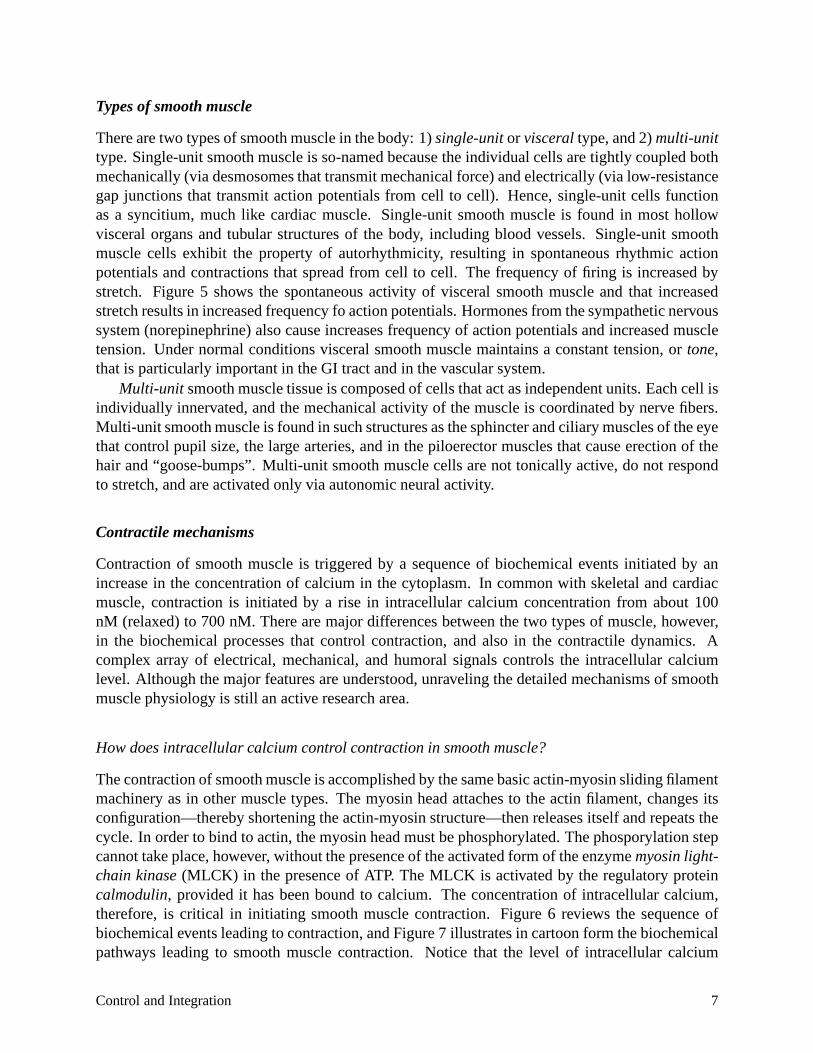
There are two types of smooth muscle in the body: 1) single-unit or visceral type, and 2) multi-unit type. Single-unit smooth muscle is so-named because the individual cells are tightly coupled both mechanically (via desmosomes that transmit mechanical force) and electrically (via low-resistance gap junctions that transmit action potentials from cell to cell). Hence, single-unit cells function as a syncitium, much like cardiac muscle. Single-unit smooth muscle is found in most hollow visceral organs and tubular structures of the body, including blood vessels. Single-unit smooth muscle cells exhibit the property of autorhythmicity, resulting in spontaneous rhythmic action potentials and contractions that spread from cell to cell. The frequency of firing is increased by stretch. Figure 5 shows the spontaneous activity of visceral smooth muscle and that increased stretch results in increased frequency fo action potentials. Hormones from the sympathetic nervous system (norepinephrine) also cause increases frequency of action potentials and increased muscle tension. Under normal conditions visceral smooth muscle maintains a constant tension, or tone, that is particularly important in the GI tract and in the vascular system.
Multi-unit smooth muscle tissue is composed of cells that act as independent units. Each cell is individually innervated, and the mechanical activity of the muscle is coordinated by nerve fibers. Multi-unit smooth muscle is found in such structures as the sphincter and ciliary muscles of the eye that control pupil size, the large arteries, and in the piloerector muscles that cause erection of the hair and “goose-bumps”. Multi-unit smooth muscle cells are not tonically active, do not respond to stretch, and are activated only via autonomic neural activity.
Contractile mechanisms
Contraction of smooth muscle is triggered by a sequence of biochemical events initiated by an increase in the concentration of calcium in the cytoplasm. In common with skeletal and cardiac muscle, contraction is initiated by a rise in intracellular calcium concentration from about 100 nM (relaxed) to 700 nM. There are major differences between the two types of muscle, however, in the biochemical processes that control contraction, and also in the contractile dynamics. A complex array of electrical, mechanical, and humoral signals controls the intracellular calcium level. Although the major features are understood, unraveling the detailed mechanisms of smooth muscle physiology is still an active research area.
How does intracellular calcium control contraction in smooth muscle?
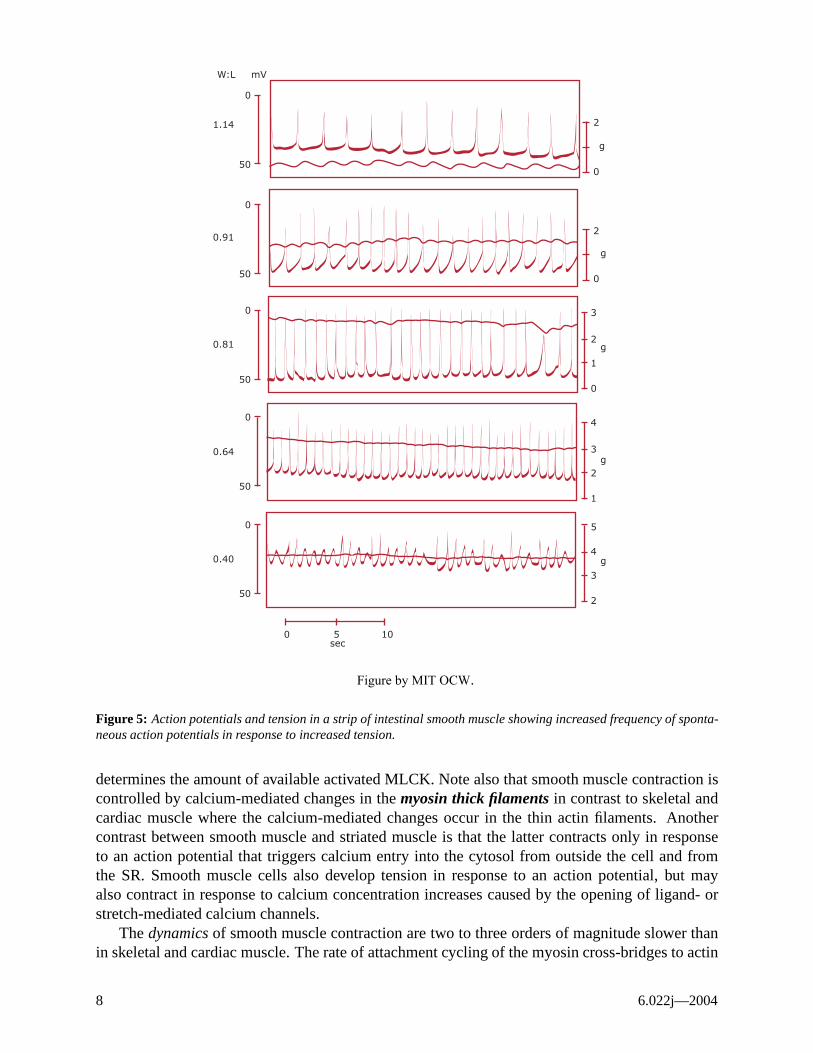
The contraction of smooth muscle is accomplished by the same basic actin-myosin sliding filament machinery as in other muscle types. The myosin head attaches to the actin filament, changes its configuration—thereby shortening the actin-myosin structure—then releases itself and repeats the cycle. In order to bind to actin, the myosin head must be phosphorylated. The phosporylation step cannot take place, however, without the presence of the activated form of the enzyme myosin light-chain kinase (MLCK) in the presence of ATP. The MLCK is activated by the regulatory protein calmodulin, provided it has been bound to calcium. The concentration of intracellular calcium, therefore, is critical in initiating smooth muscle contraction. Figure 6 reviews the sequence of biochemical events leading to contraction, and Figure 7 illustrates in cartoon form the biochemical pathways leading to smooth muscle contraction. Notice that the level of intracellular calcium
Control and Integration 7
W:L mV
5
4
3
0
0
50
0.40
0.64
0.81
0.91
1.14
50
0
50
0
50
0
50
2
g
g
g
g
g
4
3
2
1
3
2
0
2
0
2
1
0
0 5 10 sec
Figure by MIT OCW.
Figure 5: Action potentials and tension in a strip of intestinal smooth muscle showing increased frequency of spontaneous action potentials in response to increased tension.
determines the amount of available activated MLCK. Note also that smooth muscle contraction is controlled by calcium-mediated changes in the myosin thick filaments in contrast to skeletal and cardiac muscle where the calcium-mediated changes occur in the thin actin filaments. Another contrast between smooth muscle and striated muscle is that the latter contracts only in response to an action potential that triggers calcium entry into the cytosol from outside the cell and from the SR. Smooth muscle cells also develop tension in response to an action potential, but may also contract in response to calcium concentration increases caused by the opening of ligand- or stretch-mediated calcium channels.
The dynamics of smooth muscle contraction are two to three orders of magnitude slower than in skeletal and cardiac muscle. The rate of attachment cycling of the myosin cross-bridges to actin
6.022j—2004 8
]Increase in intra-cellular [Ca++
⇓
[Ca++] binds to calmodulin ⇓
[Ca++]-calmodulin binds to and activates myosin light-chain kinase ⇓
Activated MLCK uses ATP to phosphorylate myosin cross-bridges ⇓
Phosphorylated cross-bridges bind to actin filaments ⇓
Cross-bridge cycle produces tension and shortening
Figure 6: Biochemical events leading to smooth muscle contraction
ADP
P
IP
2+2+
2+
2+
3
2+
2+
Sarcolemma
Sarcoplasmic Reticulum
Myosin
Actin
ATP MLCK CaM
+ CaM-MLCK - CaM Ca Ca
Ca
Ca
Ca
Ca
Figure by MIT OCW. After Barany, M. Biochemistry of Smooth Muscle Contraction. Academic Press, 1996.
Figure 7:
is slow, and this results in slower development of shortening and tension. Significantly, however, the energy required to maintain tension in smooth muscle is much less then in striated muscle. A muscle “twitch” may last from 3 to 30 seconds in smooth muscle, and in fact the smooth muscle in many organs—including blood vessels—maintains indefinitely a continuous (or tonic) contraction with minimal energy expenditure. The ability of smooth muscle to maintain tension with minimal
Control and Integration 9
Mechanism of Smooth Muscle Contraction. Calcium enters the cytoplasm through voltage or ligand gated membrane channels, or it can be released from intracellular stores in the sarcoplasmic reticulum (SR). Intracellular store calcium release involves stimulating ligand activation of a series of second messangers to produce inositol triphosphate IP3. IP3 binds to Ca++ receptors on the SR membrane and increases cytoplasmic [Ca++]. When cytoplasmic calcium reaches a threshold, contraction is initiated. Intracellular Ca++ forms complexes with calmodulin (CaM); a regulatory protein that activates the myosin light chain kinase (MLCK), which in turn phosphorylates one of the light chains of the myosin molecule and allows the myosin head to bind the actin filament, causing muscle contraction. (From Barany, M. Biochemistry of Smooth Muscle Contraction. Academic Press, 1996).
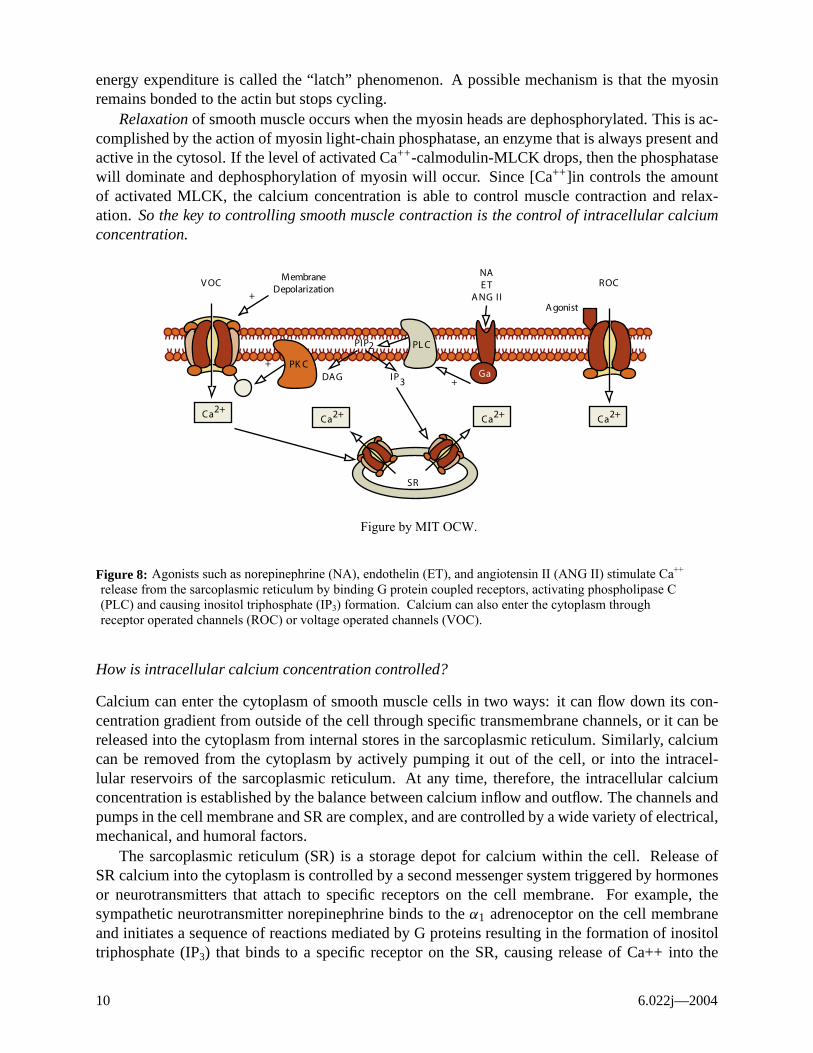
energy expenditure is called the “latch” phenomenon. A possible mechanism is that the myosinremains bonded to the actin but stops cycling.
Relaxation of smooth muscle occurs when the myosin heads are dephosphorylated. This is ac-complished by the action of myosin light-chain phosphatase, an enzyme that is always present andactive in the cytosol. If the level of activated Ca++-calmodulin-MLCK drops, then the phosphatasewill dominate and dephosphorylation of myosin will occur. Since [Ca++]in controls the amountof activated MLCK, the calcium concentration is able to control muscle contraction and relax-ation. So the key to controlling smooth muscle contraction is the control of intracellular calciumconcentration.
Figure 8:
How is intracellular calcium concentration controlled?
Calcium can enter the cytoplasm of smooth muscle cells in two ways: it can flow down its con-centration gradient from outside of the cell through specific transmembrane channels, or it can bereleased into the cytoplasm from internal stores in the sarcoplasmic reticulum. Similarly, calciumcan be removed from the cytoplasm by actively pumping it out of the cell, or into the intracel-lular reservoirs of the sarcoplasmic reticulum. At any time, therefore, the intracellular calciumconcentration is established by the balance between calcium inflow and outflow. The channels andpumps in the cell membrane and SR are complex, and are controlled by a wide variety of electrical,mechanical, and humoral factors.
The sarcoplasmic reticulum (SR) is a storage depot for calcium within the cell. Release ofSR calcium into the cytoplasm is controlled by a second messenger system triggered by hormonesor neurotransmitters that attach to specific receptors on the cell membrane. For example, thesympathetic neurotransmitter norepinephrine binds to the α1 adrenoceptor on the cell membraneand initiates a sequence of reactions mediated by G proteins resulting in the formation of inositoltriphosphate (IP3) that binds to a specific receptor on the SR, causing release of Ca++ into the
10 6.022j—2004
V OC ROCMembrane
Depolarization
A gonist
SR
PIP
PDAG
PK CIP
PL C
Ga
Ca2+Ca2+ Ca2+ Ca2+
+
+
+
2
3
NAE T
A NG I I
Figure by MIT OCW.
Agonists such as norepinephrine (NA), endothelin (ET), and angiotensin II (ANG II) stimulate Ca++ release from the sarcoplasmic reticulum by binding G protein coupled receptors, activating phospholipase C (PLC) and causing inositol triphosphate (IP3) formation. Calcium can also enter the cytoplasm through receptor operated channels (ROC) or voltage operated channels (VOC).
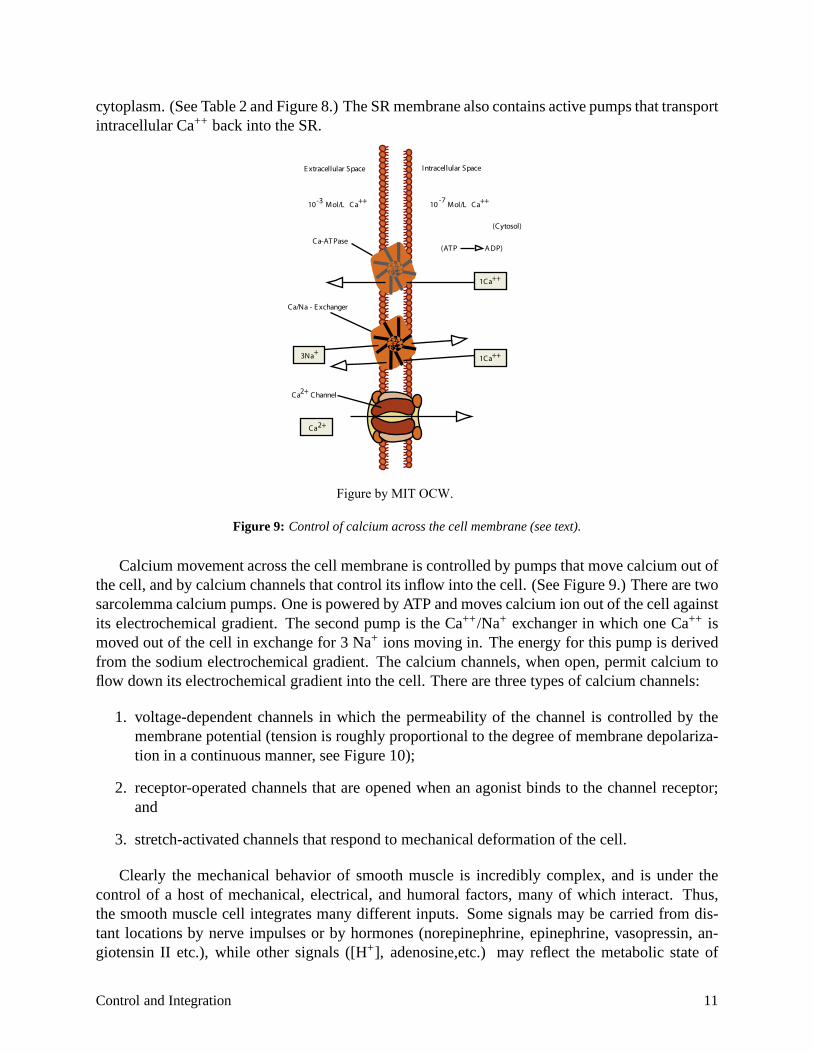
cytoplasm. (See Table 2 and Figure 8.) The SR membrane also contains active pumps that transportintracellular Ca++ back into the SR.
Figure 9: Control of calcium across the cell membrane (see text).
Calcium movement across the cell membrane is controlled by pumps that move calcium out ofthe cell, and by calcium channels that control its inflow into the cell. (See Figure 9.) There are twosarcolemma calcium pumps. One is powered by ATP and moves calcium ion out of the cell againstits electrochemical gradient. The second pump is the Ca++/Na+ exchanger in which one Ca++ ismoved out of the cell in exchange for 3 Na+ ions moving in. The energy for this pump is derivedfrom the sodium electrochemical gradient. The calcium channels, when open, permit calcium toflow down its electrochemical gradient into the cell. There are three types of calcium channels:
1. voltage-dependent channels in which the permeability of the channel is controlled by themembrane potential (tension is roughly proportional to the degree of membrane depolariza-tion in a continuous manner, see Figure 10);
2. receptor-operated channels that are opened when an agonist binds to the channel receptor;and
3. stretch-activated channels that respond to mechanical deformation of the cell.
Clearly the mechanical behavior of smooth muscle is incredibly complex, and is under thecontrol of a host of mechanical, electrical, and humoral factors, many of which interact. Thus,the smooth muscle cell integrates many different inputs. Some signals may be carried from dis-tant locations by nerve impulses or by hormones (norepinephrine, epinephrine, vasopressin, an-giotensin II etc.), while other signals ([H+], adenosine,etc.) may reflect the metabolic state of
Control and Integration 11
E xtracellular Space Intracellular Space
Ca/Na - E xchanger
(Cytosol)
3Na
Ca
1Ca
++ ++
++
1Ca
Ca
+++
2+
Channel
Ca-AT Pase(AT P A DP)
10 Mol/L Ca 10 Mol/L Ca-7-3
2+
Figure by MIT OCW.
NE 300 nM 1001200
T (
dyn
es)
10-8
c
10-7
10-6
10-5
1000
800 80
600 400 60
0 1 2 3 4 5 6 7 8 9
04010
Em
(m
V)
20 30 20 40
50 0 60
0 1 2 3 4 5 6 7 8 9 -80 -70 -60 -50 -40
Time (min.) Em (mV)
(a) (b)
Figure by MIT OCW.
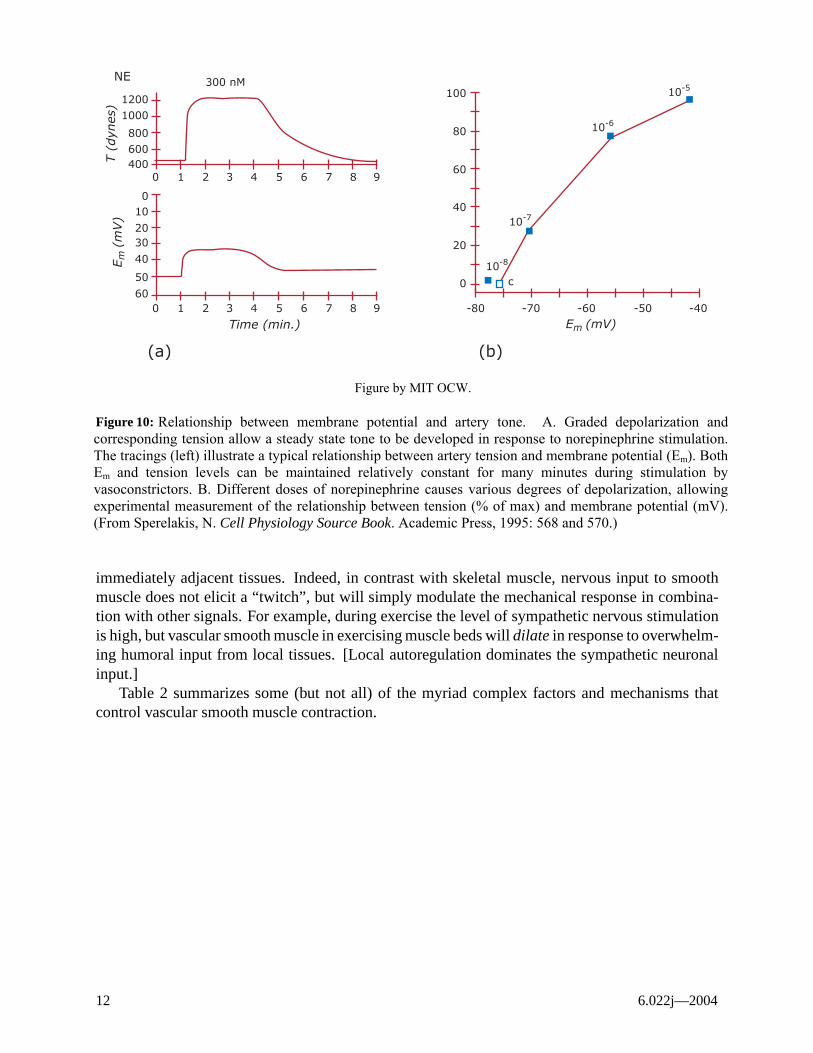
Figure 10:
immediately adjacent tissues. Indeed, in contrast with skeletal muscle, nervous input to smooth muscle does not elicit a “twitch”, but will simply modulate the mechanical response in combination with other signals. For example, during exercise the level of sympathetic nervous stimulation is high, but vascular smooth muscle in exercising muscle beds will dilate in response to overwhelming humoral input from local tissues. [Local autoregulation dominates the sympathetic neuronal input.]
Table 2 summarizes some (but not all) of the myriad complex factors and mechanisms that control vascular smooth muscle contraction.
6.022j—2004 12
Relationship between membrane potential and artery tone. A. Graded depolarization and corresponding tension allow a steady state tone to be developed in response to norepinephrine stimulation. The tracings (left) illustrate a typical relationship between artery tension and membrane potential (Em). Both Em and tension levels can be maintained relatively constant for many minutes during stimulation by vasoconstrictors. B. Different doses of norepinephrine causes various degrees of depolarization, allowing experimental measurement of the relationship between tension (% of max) and membrane potential (mV). (From Sperelakis, N. Cell Physiology Source Book. Academic Press, 1995: 568 and 570.)
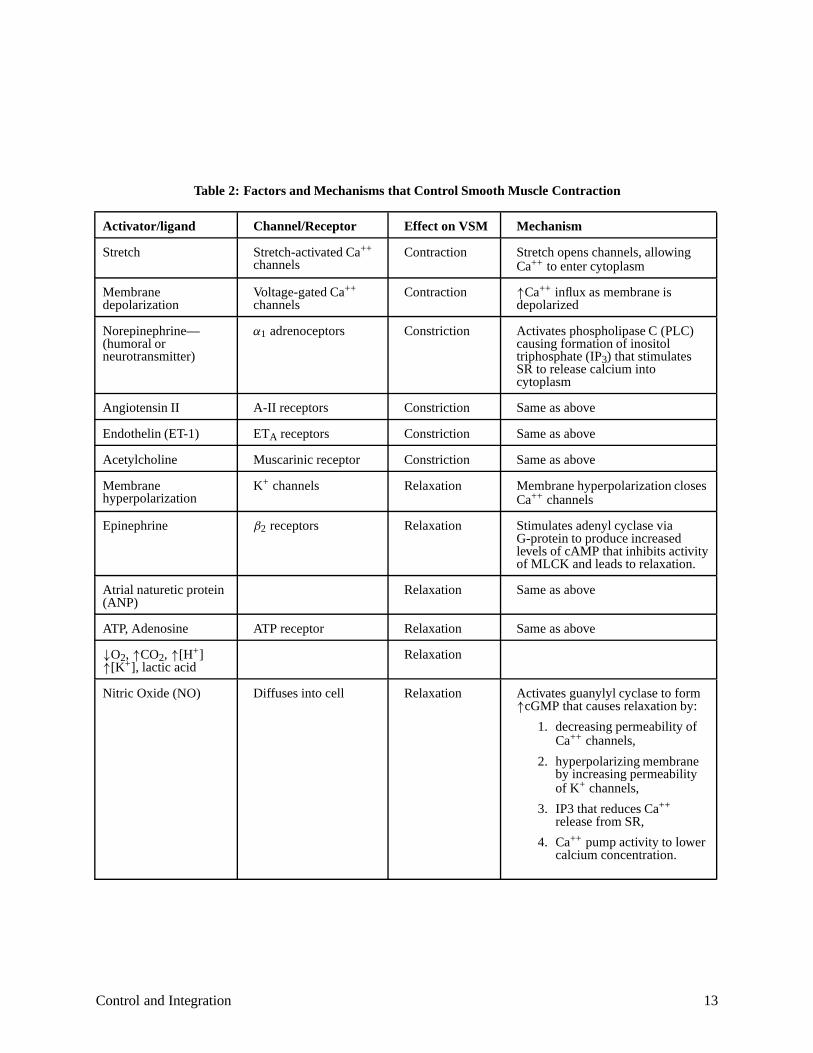
Table 2: Factors and Mechanisms that Control Smooth Muscle Contraction
/ /
↑
α1
3
A
K+
β2
↓O2, ↑ 2, ↑ +] ↑ +
↑
+
Activator ligand Channel Receptor Effect on VSM Mechanism
Stretch Stretch-activated Ca++
channels Contraction Stretch opens channels, allowing
Ca++ to enter cytoplasm
Membrane depolarization
Voltage-gated Ca++
channels Contraction Ca++ influx as membrane is
depolarized
Norepinephrine— (humoral or neurotransmitter)
adrenoceptors Constriction Activates phospholipase C (PLC) causing formation of inositol triphosphate (IP ) that stimulates SR to release calcium into cytoplasm
Angiotensin II A-II receptors Constriction Same as above
Endothelin (ET-1) ET receptors Constriction Same as above
Acetylcholine Muscarinic receptor Constriction Same as above
Membrane hyperpolarization
channels Relaxation Membrane hyperpolarization closes Ca++ channels
Epinephrine receptors Relaxation Stimulates adenyl cyclase via G-protein to produce increased levels of cAMP that inhibits activity of MLCK and leads to relaxation.
Atrial naturetic protein (ANP)
Relaxation Same as above
ATP, Adenosine ATP receptor Relaxation Same as above
CO [H[K ], lactic acid
Relaxation
Nitric Oxide (NO) Diffuses into cell Relaxation Activates guanylyl cyclase to form cGMP that causes relaxation by:
1. decreasing permeability of Ca++ channels,
2. hyperpolarizing membrane by increasing permeability of K channels,
3. IP3 that reduces Ca++
release from SR,
4. Ca++ pump activity to lower calcium concentration.
Control and Integration 13
C. Intrinsic Regulation—Autoregulation
Introduction
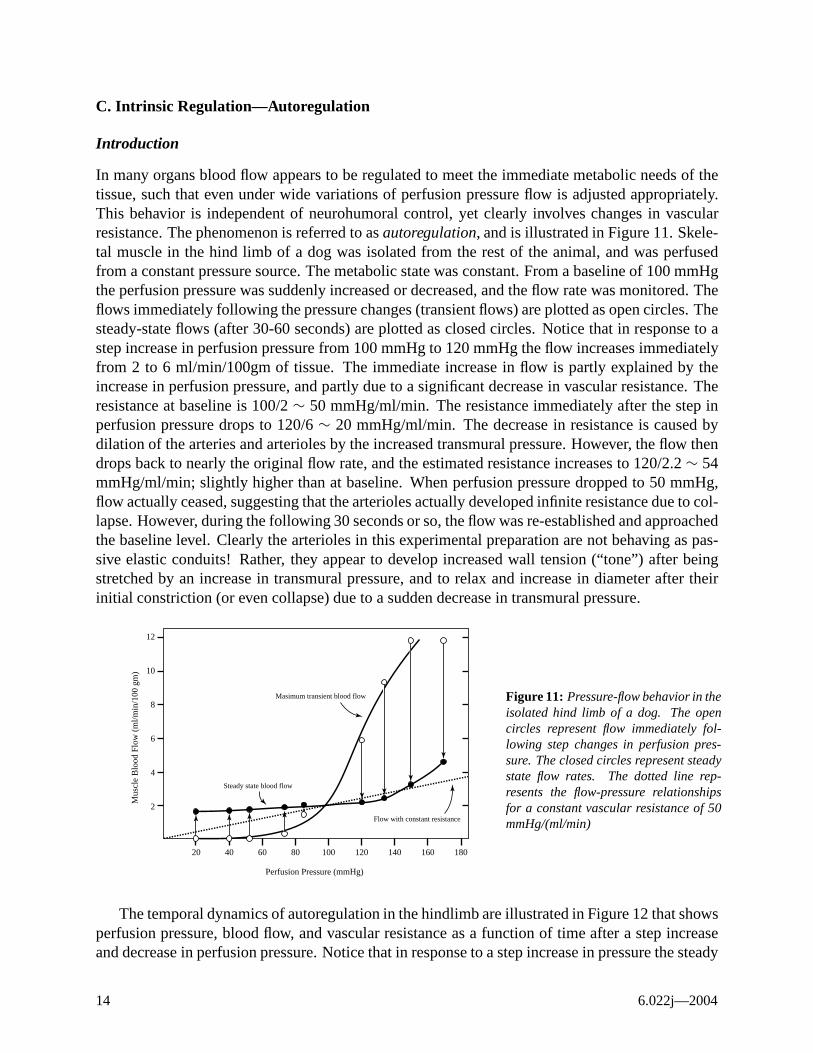
In many organs blood flow appears to be regulated to meet the immediate metabolic needs of the tissue, such that even under wide variations of perfusion pressure flow is adjusted appropriately. This behavior is independent of neurohumoral control, yet clearly involves changes in vascular resistance. The phenomenon is referred to as autoregulation, and is illustrated in Figure 11. Skeletal muscle in the hind limb of a dog was isolated from the rest of the animal, and was perfused from a constant pressure source. The metabolic state was constant. From a baseline of 100 mmHg the perfusion pressure was suddenly increased or decreased, and the flow rate was monitored. The flows immediately following the pressure changes (transient flows) are plotted as open circles. The steady-state flows (after 30-60 seconds) are plotted as closed circles. Notice that in response to a step increase in perfusion pressure from 100 mmHg to 120 mmHg the flow increases immediately from 2 to 6 ml/min/100gm of tissue. The immediate increase in flow is partly explained by the increase in perfusion pressure, and partly due to a significant decrease in vascular resistance. The resistance at baseline is 100/2 ∼ 50 mmHg/ml/min. The resistance immediately after the step in perfusion pressure drops to 120/6 ∼ 20 mmHg/ml/min. The decrease in resistance is caused by dilation of the arteries and arterioles by the increased transmural pressure. However, the flow then drops back to nearly the original flow rate, and the estimated resistance increases to 120/2.2 ∼ 54 mmHg/ml/min; slightly higher than at baseline. When perfusion pressure dropped to 50 mmHg, flow actually ceased, suggesting that the arterioles actually developed infinite resistance due to collapse. However, during the following 30 seconds or so, the flow was re-established and approached the baseline level. Clearly the arterioles in this experimental preparation are not behaving as passive elastic conduits! Rather, they appear to develop increased wall tension (“tone”) after being stretched by an increase in transmural pressure, and to relax and increase in diameter after their initial constriction (or even collapse) due to a sudden decrease in transmural pressure.
Mus
cle
Blo
od F
low
(m
l/min
/100
gm
)
12
10
8
6
4
2
Masimum transient blood flow
Steady state blood flow
Flow with constant resistance
Figure 11: Pressure-flow behavior in the isolated hind limb of a dog. The open circles represent flow immediately following step changes in perfusion pressure. The closed circles represent steady state flow rates. The dotted line represents the flow-pressure relationships for a constant vascular resistance of 50 mmHg/(ml/min)
20 40 60 80 100 120 140 160 180
Perfusion Pressure (mmHg)
The temporal dynamics of autoregulation in the hindlimb are illustrated in Figure 12 that shows perfusion pressure, blood flow, and vascular resistance as a function of time after a step increase and decrease in perfusion pressure. Notice that in response to a step increase in pressure the steady
6.022j—2004 14
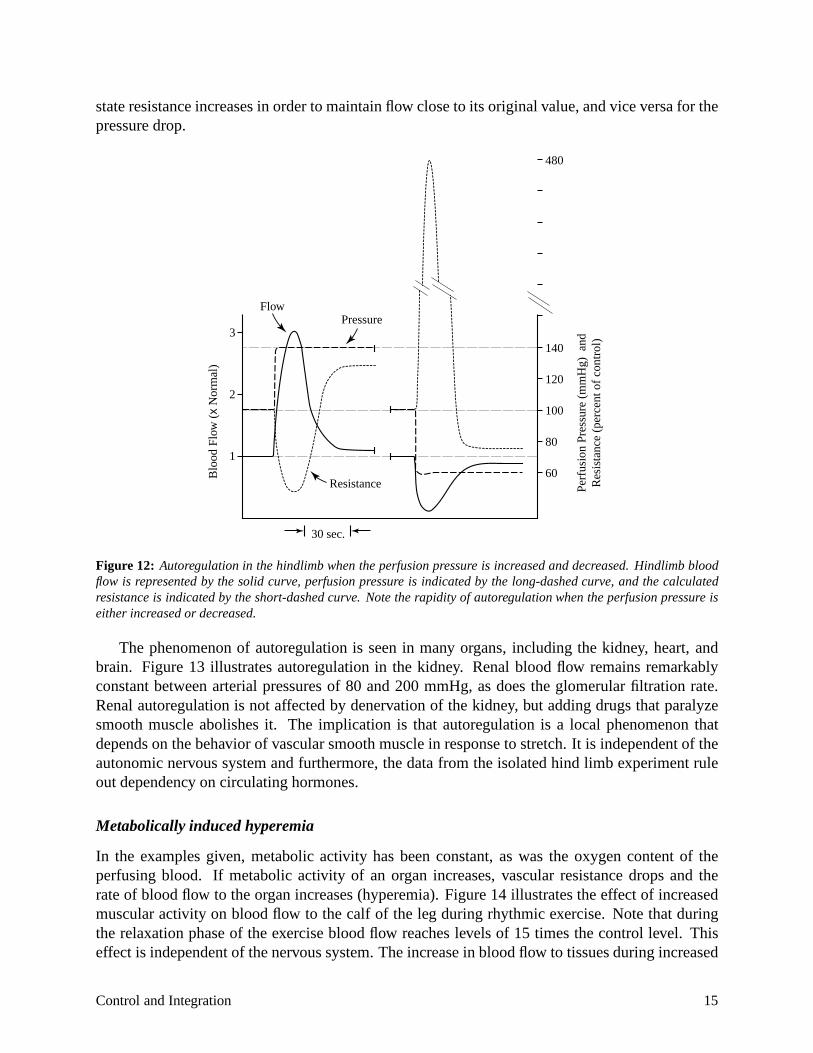
state resistance increases in order to maintain flow close to its original value, and vice versa for the pressure drop.
30 sec.
Resistance
Pressure
x N
orm
al)
Perf
usio
n Pr
essu
re (
mm
Hg)
and
Res
ista
nce
(per
cent
of
cont
rol)140
120
100
80
60
480
3
2
1
Flow
Blo
od F
low
(
Figure 12: Autoregulation in the hindlimb when the perfusion pressure is increased and decreased. Hindlimb blood flow is represented by the solid curve, perfusion pressure is indicated by the long-dashed curve, and the calculated resistance is indicated by the short-dashed curve. Note the rapidity of autoregulation when the perfusion pressure is either increased or decreased.
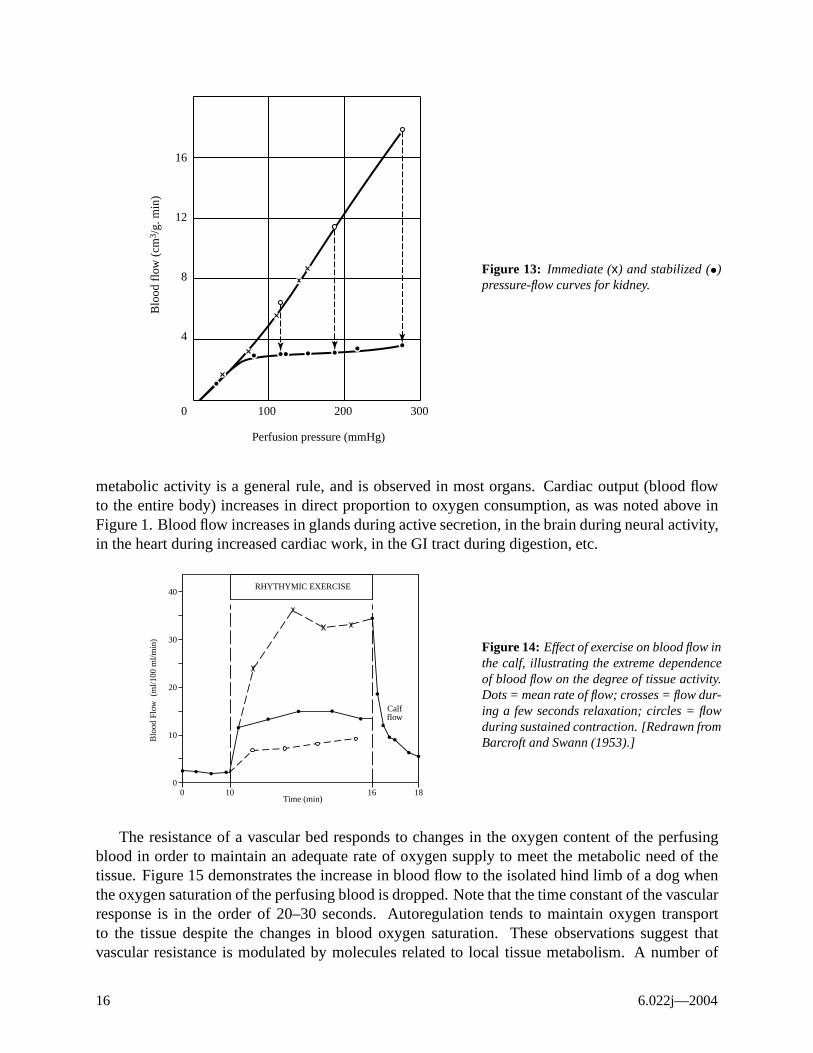
The phenomenon of autoregulation is seen in many organs, including the kidney, heart, and brain. Figure 13 illustrates autoregulation in the kidney. Renal blood flow remains remarkably constant between arterial pressures of 80 and 200 mmHg, as does the glomerular filtration rate. Renal autoregulation is not affected by denervation of the kidney, but adding drugs that paralyze smooth muscle abolishes it. The implication is that autoregulation is a local phenomenon that depends on the behavior of vascular smooth muscle in response to stretch. It is independent of the autonomic nervous system and furthermore, the data from the isolated hind limb experiment rule out dependency on circulating hormones.
Metabolically induced hyperemia
In the examples given, metabolic activity has been constant, as was the oxygen content of the perfusing blood. If metabolic activity of an organ increases, vascular resistance drops and the rate of blood flow to the organ increases (hyperemia). Figure 14 illustrates the effect of increased muscular activity on blood flow to the calf of the leg during rhythmic exercise. Note that during the relaxation phase of the exercise blood flow reaches levels of 15 times the control level. This effect is independent of the nervous system. The increase in blood flow to tissues during increased
Control and Integration 15
Blo
od f
low
(cm
3 /g.
min
) 16
12
Figure 13: Immediate (x) and stabilized (•)8
pressure-flow curves for kidney.
4
0 100 200 300
Perfusion pressure (mmHg)
metabolic activity is a general rule, and is observed in most organs. Cardiac output (blood flow to the entire body) increases in direct proportion to oxygen consumption, as was noted above in Figure 1. Blood flow increases in glands during active secretion, in the brain during neural activity, in the heart during increased cardiac work, in the GI tract during digestion, etc.
Calf
RHYTHYMIC EXERCISE
(ml/1
00 m
l/min
)
1816100 0
10
20
30
40
flow
Time (min)
Blo
od F
low
Figure 14: Effect of exercise on blood flow in the calf, illustrating the extreme dependence of blood flow on the degree of tissue activity. Dots = mean rate of flow; crosses = flow during a few seconds relaxation; circles = flow during sustained contraction. [Redrawn from Barcroft and Swann (1953).]
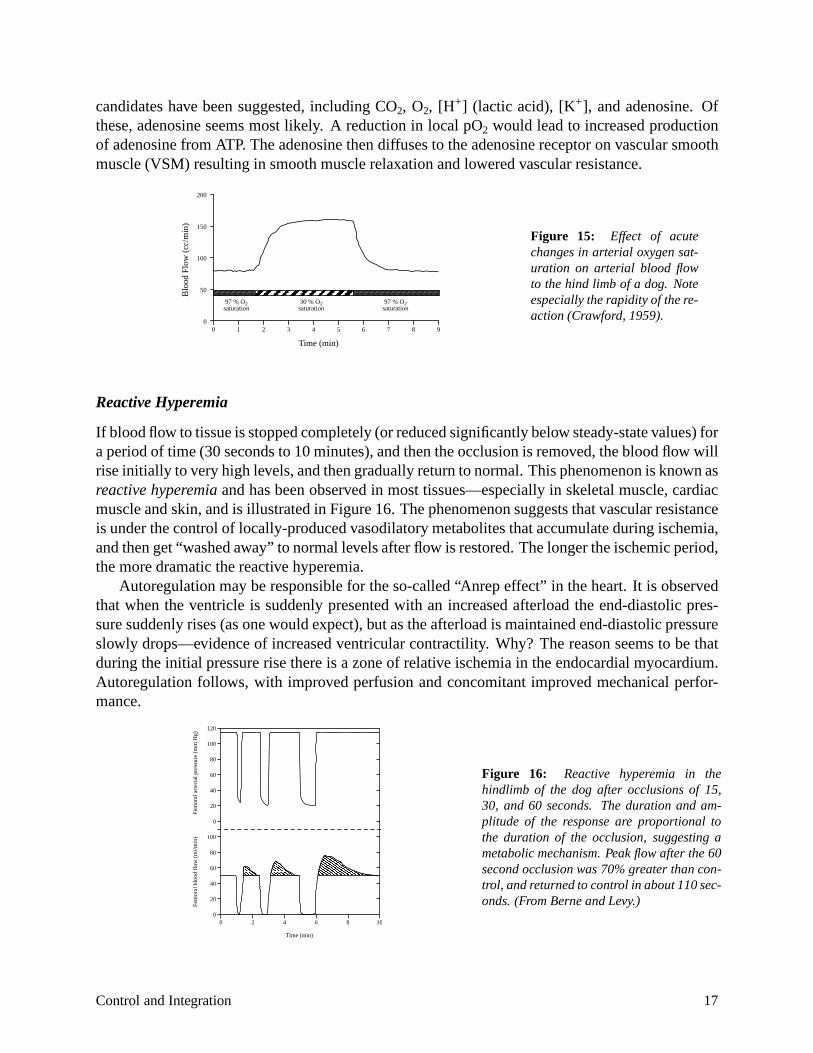
The resistance of a vascular bed responds to changes in the oxygen content of the perfusing blood in order to maintain an adequate rate of oxygen supply to meet the metabolic need of the tissue. Figure 15 demonstrates the increase in blood flow to the isolated hind limb of a dog when the oxygen saturation of the perfusing blood is dropped. Note that the time constant of the vascular response is in the order of 20–30 seconds. Autoregulation tends to maintain oxygen transport to the tissue despite the changes in blood oxygen saturation. These observations suggest that vascular resistance is modulated by molecules related to local tissue metabolism. A number of
6.022j—2004 16
candidates have been suggested, including CO2, O2, [H+] (lactic acid), [K+], and adenosine. Of these, adenosine seems most likely. A reduction in local pO2 would lead to increased production of adenosine from ATP. The adenosine then diffuses to the adenosine receptor on vascular smooth muscle (VSM) resulting in smooth muscle relaxation and lowered vascular resistance.
30 % O2 saturation
0 0
50
100
150
200
1 2 3 4 5 6 7 8 9
97 % O2 saturation
97 % O2 saturation
Blo
od F
low
(cc
/min
)
Figure 15: Effect of acute changes in arterial oxygen saturation on arterial blood flow to the hind limb of a dog. Note especially the rapidity of the reaction (Crawford, 1959).
Time (min)
Reactive Hyperemia
If blood flow to tissue is stopped completely (or reduced significantly below steady-state values) for a period of time (30 seconds to 10 minutes), and then the occlusion is removed, the blood flow will rise initially to very high levels, and then gradually return to normal. This phenomenon is known as reactive hyperemia and has been observed in most tissues—especially in skeletal muscle, cardiac muscle and skin, and is illustrated in Figure 16. The phenomenon suggests that vascular resistance is under the control of locally-produced vasodilatory metabolites that accumulate during ischemia, and then get “washed away” to normal levels after flow is restored. The longer the ischemic period, the more dramatic the reactive hyperemia.
Autoregulation may be responsible for the so-called “Anrep effect” in the heart. It is observed that when the ventricle is suddenly presented with an increased afterload the end-diastolic pressure suddenly rises (as one would expect), but as the afterload is maintained end-diastolic pressure slowly drops—evidence of increased ventricular contractility. Why? The reason seems to be that during the initial pressure rise there is a zone of relative ischemia in the endocardial myocardium. Autoregulation follows, with improved perfusion and concomitant improved mechanical performance.
1086420 0
20
40
60
80
100
0
20
40
60
80
100
120
Fem
oral
art
eria
l pre
ssur
e (m
m H
g)Fe
mor
al b
lood
flo
w (
ml/m
in)
Figure 16: Reactive hyperemia in the hindlimb of the dog after occlusions of 15, 30, and 60 seconds. The duration and amplitude of the response are proportional to the duration of the occlusion, suggesting a metabolic mechanism. Peak flow after the 60 second occlusion was 70% greater than control, and returned to control in about 110 seconds. (From Berne and Levy.)
Time (min)
Control and Integration 17
D. Extrinsic Regulation
Introduction
Autoregulation plays a significant role in the regulation of blood flow, but alone it is not sufficient. Rather, an elaborate extrinsic control system exists which involves a variety of sensors and effectors linked together via the autonomic and central nervous systems.
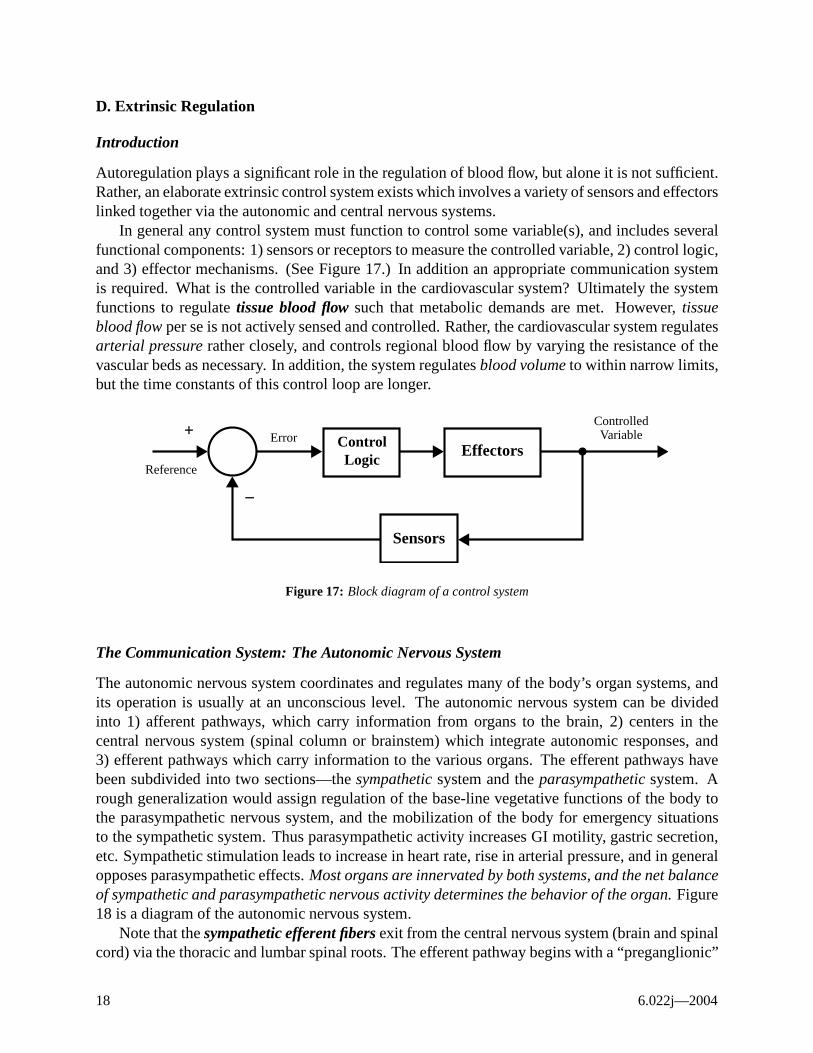
In general any control system must function to control some variable(s), and includes several functional components: 1) sensors or receptors to measure the controlled variable, 2) control logic, and 3) effector mechanisms. (See Figure 17.) In addition an appropriate communication system is required. What is the controlled variable in the cardiovascular system? Ultimately the system functions to regulate tissue blood flow such that metabolic demands are met. However, tissue blood flow per se is not actively sensed and controlled. Rather, the cardiovascular system regulates arterial pressure rather closely, and controls regional blood flow by varying the resistance of the vascular beds as necessary. In addition, the system regulates blood volume to within narrow limits, but the time constants of this control loop are longer.
Reference
Controlled Error
Logic
–
+ Effectors
Sensors
Variable Control
Figure 17: Block diagram of a control system
The Communication System: The Autonomic Nervous System
The autonomic nervous system coordinates and regulates many of the body’s organ systems, and its operation is usually at an unconscious level. The autonomic nervous system can be divided into 1) afferent pathways, which carry information from organs to the brain, 2) centers in the central nervous system (spinal column or brainstem) which integrate autonomic responses, and 3) efferent pathways which carry information to the various organs. The efferent pathways have been subdivided into two sections—the sympathetic system and the parasympathetic system. A rough generalization would assign regulation of the base-line vegetative functions of the body to the parasympathetic nervous system, and the mobilization of the body for emergency situations to the sympathetic system. Thus parasympathetic activity increases GI motility, gastric secretion, etc. Sympathetic stimulation leads to increase in heart rate, rise in arterial pressure, and in general opposes parasympathetic effects. Most organs are innervated by both systems, and the net balance of sympathetic and parasympathetic nervous activity determines the behavior of the organ. Figure 18 is a diagram of the autonomic nervous system.
Note that the sympathetic efferent fibers exit from the central nervous system (brain and spinal cord) via the thoracic and lumbar spinal roots. The efferent pathway begins with a “preganglionic”
6.022j—2004 18
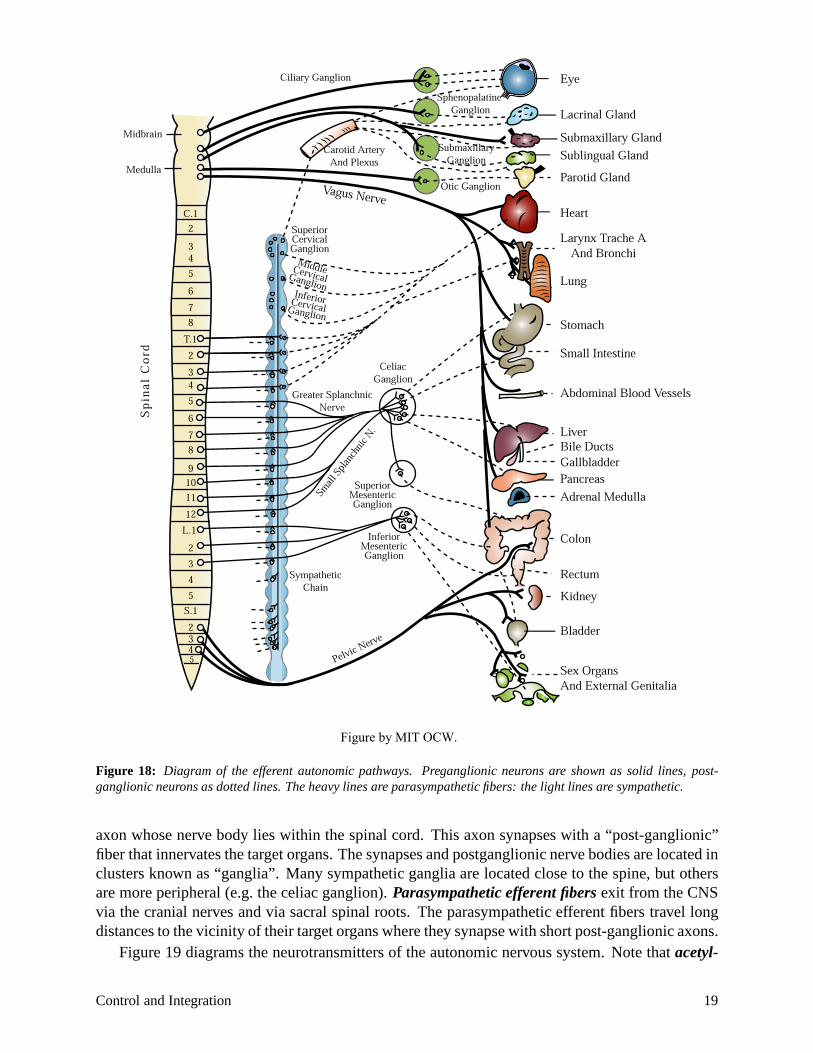
Figure 18: Diagram of the efferent autonomic pathways. Preganglionic neurons are shown as solid lines, post-ganglionic neurons as dotted lines. The heavy lines are parasympathetic fibers: the light lines are sympathetic.
axon whose nerve body lies within the spinal cord. This axon synapses with a “post-ganglionic”fiber that innervates the target organs. The synapses and postganglionic nerve bodies are located inclusters known as “ganglia”. Many sympathetic ganglia are located close to the spine, but othersare more peripheral (e.g. the celiac ganglion). Parasympathetic efferent fibersexit from the CNSvia the cranial nerves and via sacral spinal roots. The parasympathetic efferent fibers travel longdistances to the vicinity of their target organs where they synapse with short post-ganglionic axons.
Figure 19 diagrams the neurotransmitters of the autonomic nervous system. Note that acetyl-
Control and Integration 19
Figure by MIT OCW.
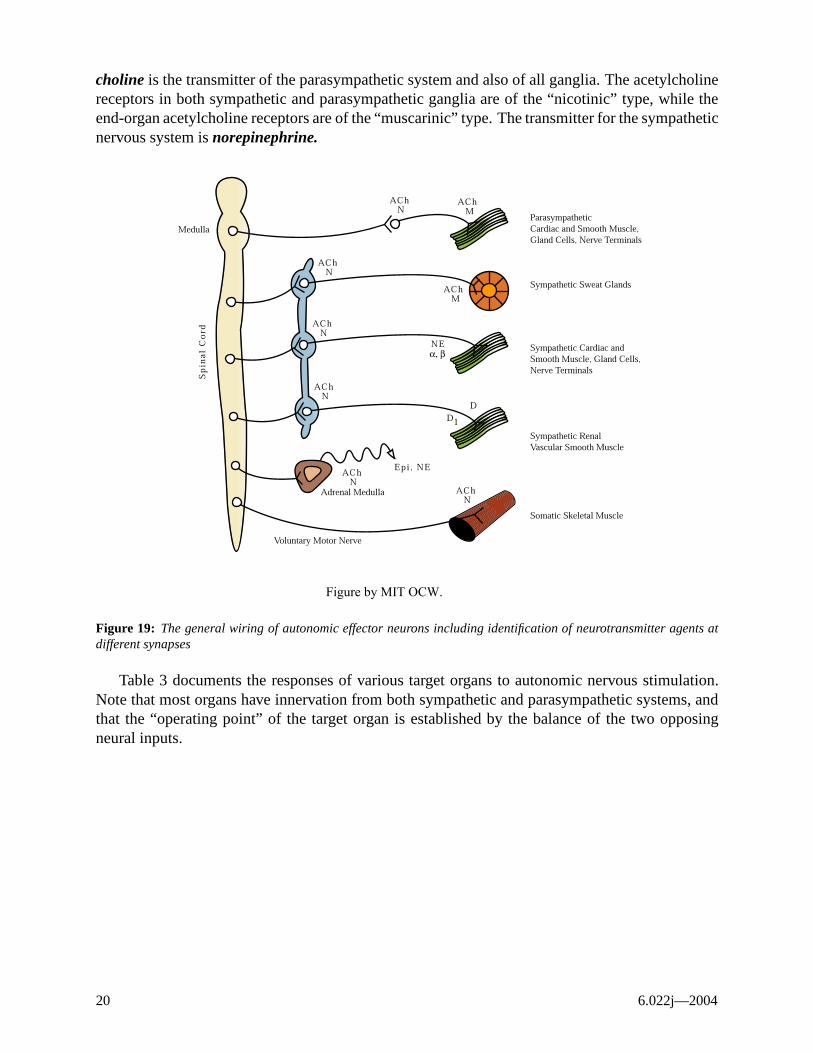
choline is the transmitter of the parasympathetic system and also of all ganglia. The acetylcholine receptors in both sympathetic and parasympathetic ganglia are of the “nicotinic” type, while the end-organ acetylcholine receptors are of the “muscarinic” type. The transmitter for the sympathetic nervous system is norepinephrine.
Figure by MIT OCW.
Figure 19: The general wiring of autonomic effector neurons including identification of neurotransmitter agents at different synapses
Table 3 documents the responses of various target organs to autonomic nervous stimulation. Note that most organs have innervation from both sympathetic and parasympathetic systems, and that the “operating point” of the target organ is established by the balance of the two opposing neural inputs.
6.022j—2004 20
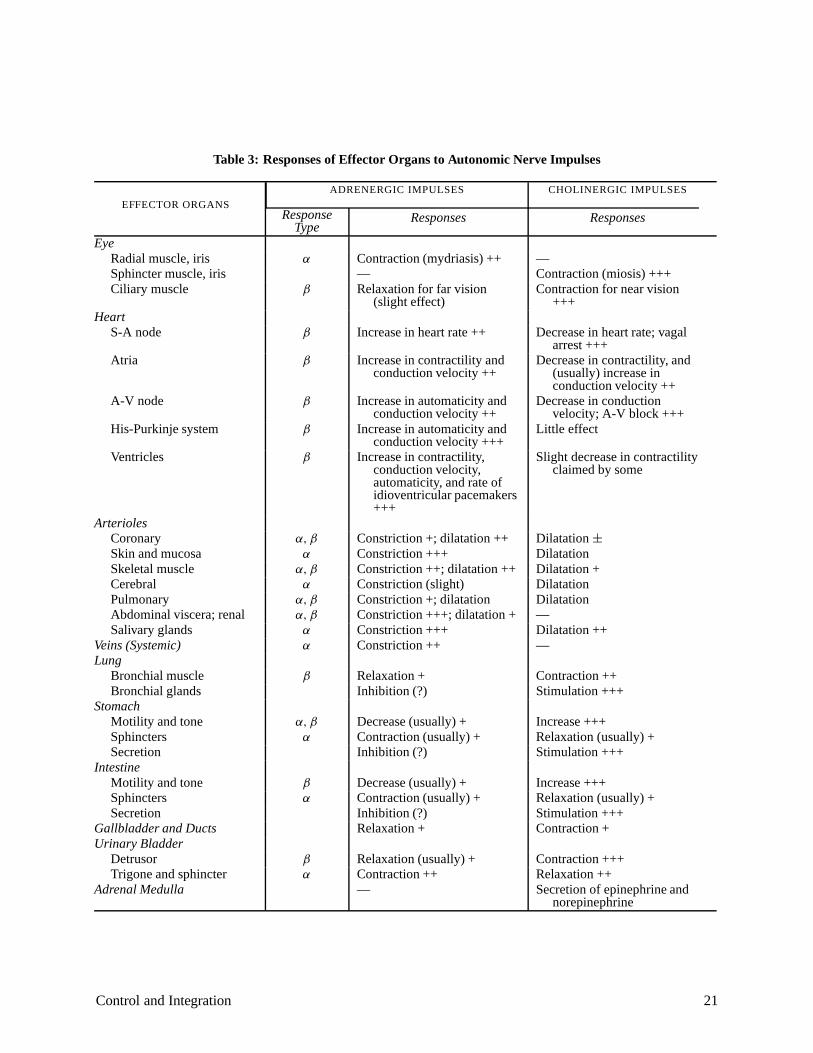
Table 3: Responses of Effector Organs to Autonomic Nerve Impulses
ADRENERGIC IMPULSES
EFFECTOR ORGANS Response Responses
Type Eye
Radial muscle, iris Sphincter muscle, iris Ciliary muscle
Heart S-A node
Atria
A-V node
His-Purkinje system
Ventricles
Arterioles Coronary Skin and mucosa Skeletal muscle Cerebral Pulmonary Abdominal viscera; renal Salivary glands
Veins (Systemic) Lung
Bronchial muscleBronchial glands
Stomach Motility and toneSphinctersSecretion
Intestine Motility and toneSphinctersSecretion
Gallbladder and Ducts Urinary Bladder
Detrusor Trigone and sphincter
Adrenal Medulla
α
β
β
β
β
β
β
α, β
α
α, β
α
α, β
α, β
α
α
β
α, β
α
β
α
β
α
Contraction (mydriasis) ++—Relaxation for far vision
(slight effect)
Increase in heart rate ++
Increase in contractility and conduction velocity ++
Increase in automaticity and conduction velocity ++
Increase in automaticity and conduction velocity +++
Increase in contractility, conduction velocity, automaticity, and rate of idioventricular pacemakers +++
Constriction +; dilatation ++Constriction +++Constriction ++; dilatation ++Constriction (slight)Constriction +; dilatationConstriction +++; dilatation +Constriction +++Constriction ++
Relaxation +Inhibition (?)
Decrease (usually) +Contraction (usually) +Inhibition (?)
Decrease (usually) +Contraction (usually) +Inhibition (?)Relaxation +
Relaxation (usually) +Contraction ++—
CHOLINERGIC IMPULSES
Responses
—Contraction (miosis) +++Contraction for near vision
+++
Decrease in heart rate; vagal arrest +++
Decrease in contractility, and (usually) increase in conduction velocity ++
Decrease in conduction velocity; A-V block +++
Little effect
Slight decrease in contractility claimed by some
Dilatation ±
DilatationDilatation +DilatationDilatation—Dilatation ++—
Contraction ++Stimulation +++
Increase +++Relaxation (usually) +Stimulation +++
Increase +++Relaxation (usually) +Stimulation +++Contraction +
Contraction +++Relaxation ++Secretion of epinephrine and
norepinephrine
Control and Integration 21
Effector Mechanisms
The extrinsic control system, acting via autonomic nervous system and hormonal pathways, can alter cardiovascular system performance via several distinct effector mechanisms:
Arteriolar Resistance
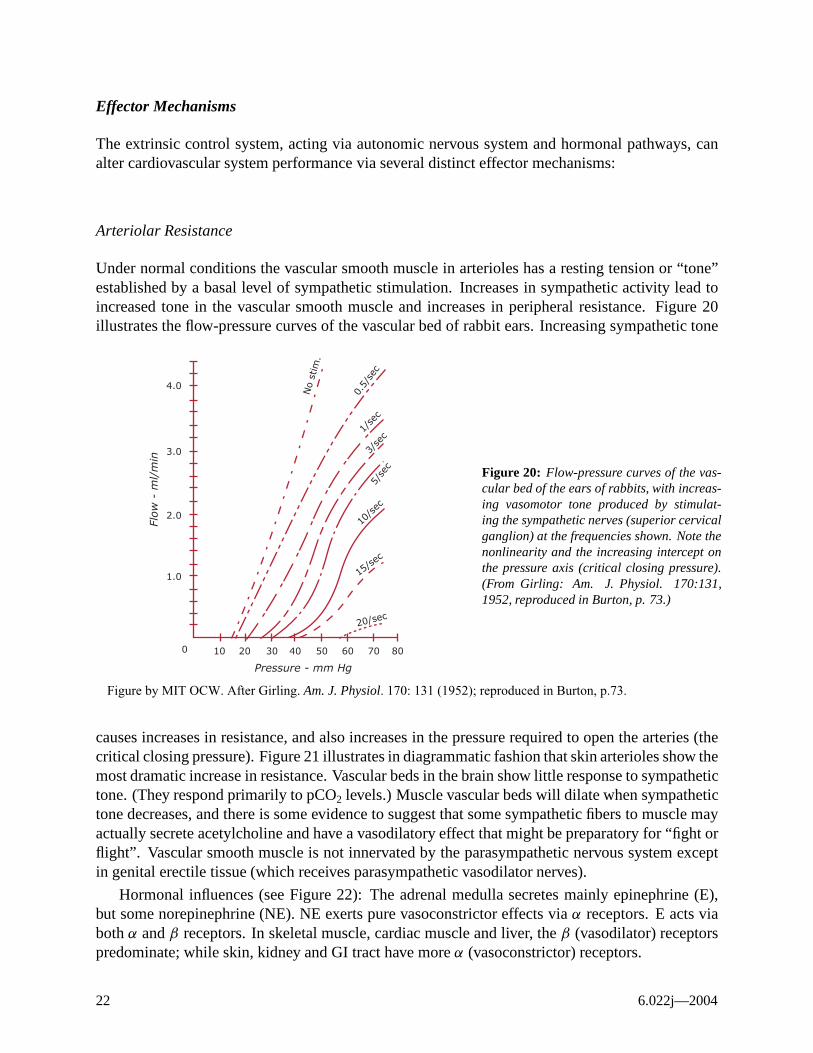
Under normal conditions the vascular smooth muscle in arterioles has a resting tension or “tone” established by a basal level of sympathetic stimulation. Increases in sympathetic activity lead to increased tone in the vascular smooth muscle and increases in peripheral resistance. Figure 20 illustrates the flow-pressure curves of the vascular bed of rabbit ears. Increasing sympathetic tone
4.0
No
stim
.
5/se
c
10/s
ec
15/se
c
20 / sec
0.5/
sec
1/se
c
3/se
c
3.0
Flow
- m
l/m
in
2.0
1.0
0 10 20 30 40 50 60 70 80
Figure 20: Flow-pressure curves of the vascular bed of the ears of rabbits, with increasing vasomotor tone produced by stimulating the sympathetic nerves (superior cervical ganglion) at the frequencies shown. Note the nonlinearity and the increasing intercept on the pressure axis (critical closing pressure). (From Girling: Am. J. Physiol. 170:131, 1952, reproduced in Burton, p. 73.)
Pressure - mm Hg
Figure by MIT OCW. After Girling. Am. J. Physiol. 170: 131 (1952); reproduced in Burton, p.73.
causes increases in resistance, and also increases in the pressure required to open the arteries (the critical closing pressure). Figure 21 illustrates in diagrammatic fashion that skin arterioles show the most dramatic increase in resistance. Vascular beds in the brain show little response to sympathetic tone. (They respond primarily to pCO2 levels.) Muscle vascular beds will dilate when sympathetic tone decreases, and there is some evidence to suggest that some sympathetic fibers to muscle may actually secrete acetylcholine and have a vasodilatory effect that might be preparatory for “fight or flight”. Vascular smooth muscle is not innervated by the parasympathetic nervous system except in genital erectile tissue (which receives parasympathetic vasodilator nerves).
Hormonal influences (see Figure 22): The adrenal medulla secretes mainly epinephrine (E), but some norepinephrine (NE). NE exerts pure vasoconstrictor effects via α receptors. E acts via both α and β receptors. In skeletal muscle, cardiac muscle and liver, the β (vasodilator) receptors predominate; while skin, kidney and GI tract have more α (vasoconstrictor) receptors.
6.022j—2004 22
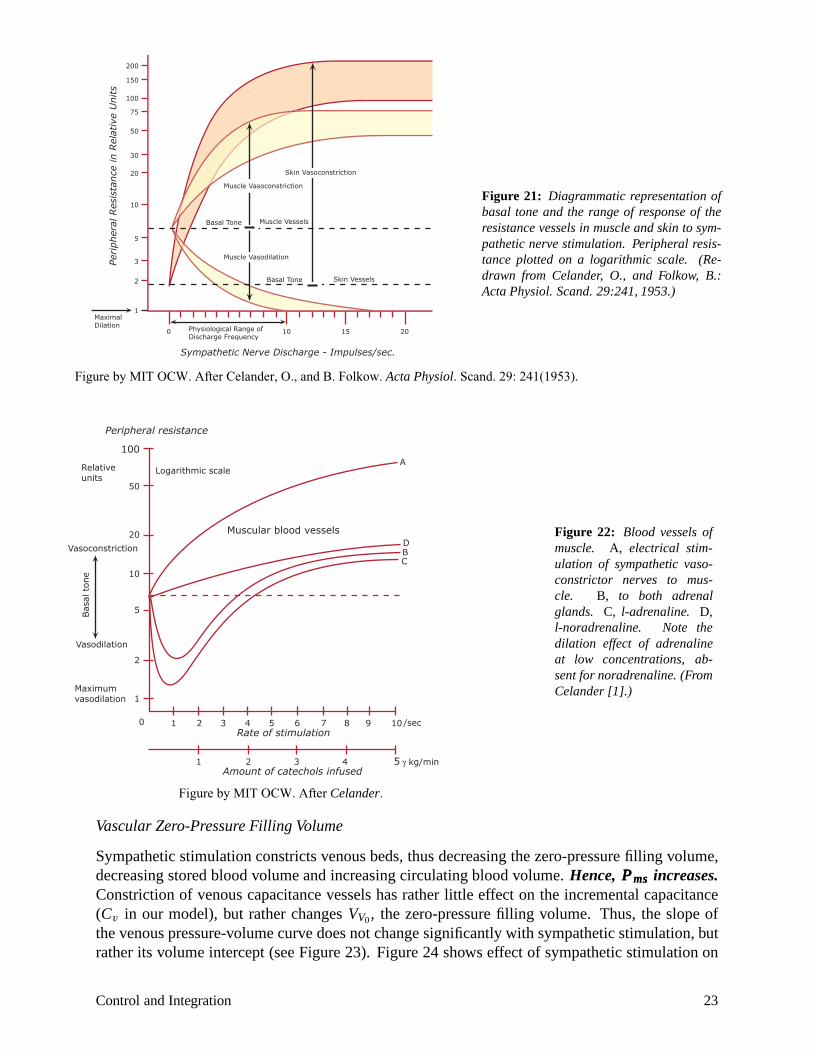
Figure 21: Diagrammatic representation of basal tone and the range of response of the resistance vessels in muscle and skin to sympathetic nerve stimulation. Peripheral resistance plotted on a logarithmic scale. (Redrawn from Celander, O., and Folkow, B.: Acta Physiol. Scand. 29:241, 1953.)
Bas
al t
one
Figure by MIT OCW. After Celander, O., and B. Folkow. Acta Physiol. Scand. 29: 241(1953).
Peripheral resistance
100
Muscular blood vessels
Logarithmic scale A
Relativeunits
50
Figure 22: Blood vessels of20 D
Vasoconstriction B muscle. A, electrical stim-C ulation of sympathetic vaso
10 constrictor nerves to muscle. B, to both adrenal
5 glands. C, l-adrenaline. D, l-noradrenaline. Note the
Vasodilation dilation effect of adrenaline 2 at low concentrations, ab
sent for noradrenaline. (From Maximum Celander [1].)vasodilation 1
0 1 2 3 4 5 6 7 8 9 10/sec Rate of stimulation
1 2 3 4 5 � kg/min Amount of catechols infused
Figure by MIT OCW. After Celander.
Vascular Zero-Pressure Filling Volume
Sympathetic stimulation constricts venous beds, thus decreasing the zero-pressure filling volume, decreasing stored blood volume and increasing circulating blood volume. Hence, PPPmsmsms increases. Constriction of venous capacitance vessels has rather little effect on the incremental capacitance (Cv in our model), but rather changes VV0, the zero-pressure filling volume. Thus, the slope of the venous pressure-volume curve does not change significantly with sympathetic stimulation, but rather its volume intercept (see Figure 23). Figure 24 shows effect of sympathetic stimulation on
Control and Integration 23
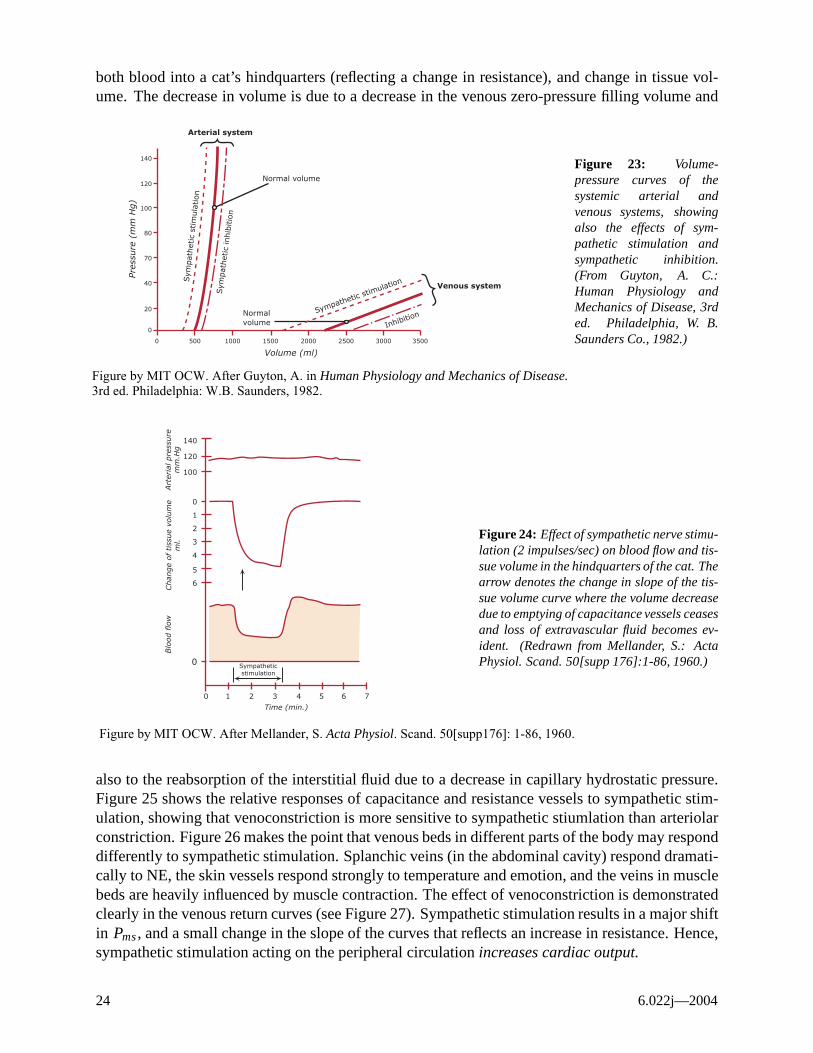
both blood into a cat’s hindquarters (reflecting a change in resistance), and change in tissue volume. The decrease in volume is due to a decrease in the venous zero-pressure filling volume and
Pres
sure
(m
m H
g)
Arterial system
140
120
100
80
70
40
20
0
Normal
Normal Sympathetic stimulationS
ympat
het
ic s
tim
ula
tion
Sym
pat
het
ic inhib
itio
n
Inhibition
v olume
v olume
Figure 23: Volume-pressure curves of the systemic arterial and venous systems, showing also the effects of sympathetic stimulation and sympathetic inhibition. (From Guyton, A. C.:
Venous system Human Physiology and Mechanics of Disease, 3rd ed. Philadelphia, W. B. Saunders Co., 1982.) 0 500 1000 1500 2000 2500 3000 3500
Volume (ml)
Figure by MIT OCW. After Guyton, A. in Human Physiology and Mechanics of Disease. 3rd�ed. Philadelphia: W.B. Saunders, 1982.
Blo
od flo
w
Chan
ge
of tiss
ue
volu
me
Art
eria
l pre
ssure
ml.
mm
.Hg 140
120
100
0
1
2
stimulation Sympathetic
Figure 24: Effect of sympathetic nerve stimu3
lation (2 impulses/sec) on blood flow and tis4
sue volume in the hindquarters of the cat. The 5
6 arrow denotes the change in slope of the tissue volume curve where the volume decrease due to emptying of capacitance vessels ceases and loss of extravascular fluid becomes evident. (Redrawn from Mellander, S.: Acta
0
0 1 2 3 4 5 6 7
Physiol. Scand. 50[supp 176]:1-86, 1960.)
Time (min.)
Figure by MIT OCW. After Mellander, S. Acta Physiol. Scand. 50[supp176]: 1-86, 1960.
also to the reabsorption of the interstitial fluid due to a decrease in capillary hydrostatic pressure. Figure 25 shows the relative responses of capacitance and resistance vessels to sympathetic stimulation, showing that venoconstriction is more sensitive to sympathetic stiumlation than arteriolar constriction. Figure 26 makes the point that venous beds in different parts of the body may respond differently to sympathetic stimulation. Splanchic veins (in the abdominal cavity) respond dramatically to NE, the skin vessels respond strongly to temperature and emotion, and the veins in muscle beds are heavily influenced by muscle contraction. The effect of venoconstriction is demonstrated clearly in the venous return curves (see Figure 27). Sympathetic stimulation results in a major shift in Pms , and a small change in the slope of the curves that reflects an increase in resistance. Hence, sympathetic stimulation acting on the peripheral circulation increases cardiac output.
6.022j—2004 24
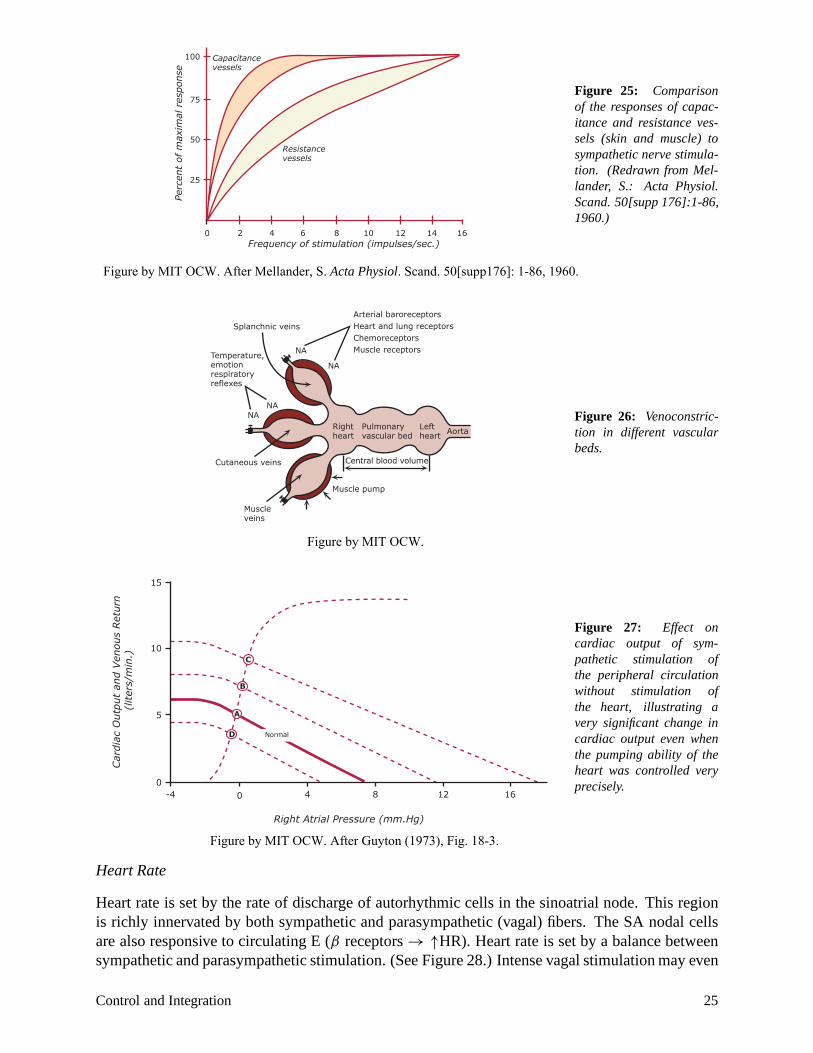
Figure 25: Comparison of the responses of capacitance and resistance vessels (skin and muscle) to
100
75
50
25
Capacitance vessels
Resistance vessels
Perc
ent
of m
axim
al r
esponse
lander, S.: Acta Physiol. Scand. 50[supp 176]:1-86, 1960.)
0 2 4 6 8 10 12 14 16 Frequency of stimulation (impulses/sec.)
sympathetic nerve stimulation. (Redrawn from Mel-
Figure by MIT OCW. After Mellander, S. Acta Physiol. Scand. 50[supp176]: 1-86, 1960.
Arterial baroreceptors
emotion
AortaLeft heart
Right heart
Muscle
Muscle pump
Chemoreceptors Muscle receptors
NA NA
NA
NA Temperature,
respiratory reflexes
Central blood volume Cutaneous veins
Pulmonary vascular bed
Heart and lung receptors Splanchnic veins
Figure 26: Venoconstriction in different vascular beds.
Car
dia
c O
utp
ut
and V
enous
Ret
urn
(l
iter
s/m
in.)
0 precisely. -4 0 4 8 12 16
Right Atrial Pressure (mm.Hg)
Figure by MIT OCW. After Guyton (1973), Fig. 18-3.
Heart Rate
Heart rate is set by the rate of discharge of autorhythmic cells in the sinoatrial node. This region is richly innervated by both sympathetic and parasympathetic (vagal) fibers. The SA nodal cells are also responsive to circulating E (β receptors → ↑HR). Heart rate is set by a balance between sympathetic and parasympathetic stimulation. (See Figure 28.) Intense vagal stimulation may even
Control and Integration
veins
Figure by MIT OCW.
5
10
15
D
A
B
C
Normal
Figure 27: Effect on cardiac output of sympathetic stimulation of the peripheral circulation without stimulation of the heart, illustrating a very significant change in cardiac output even when the pumping ability of the heart was controlled very
25
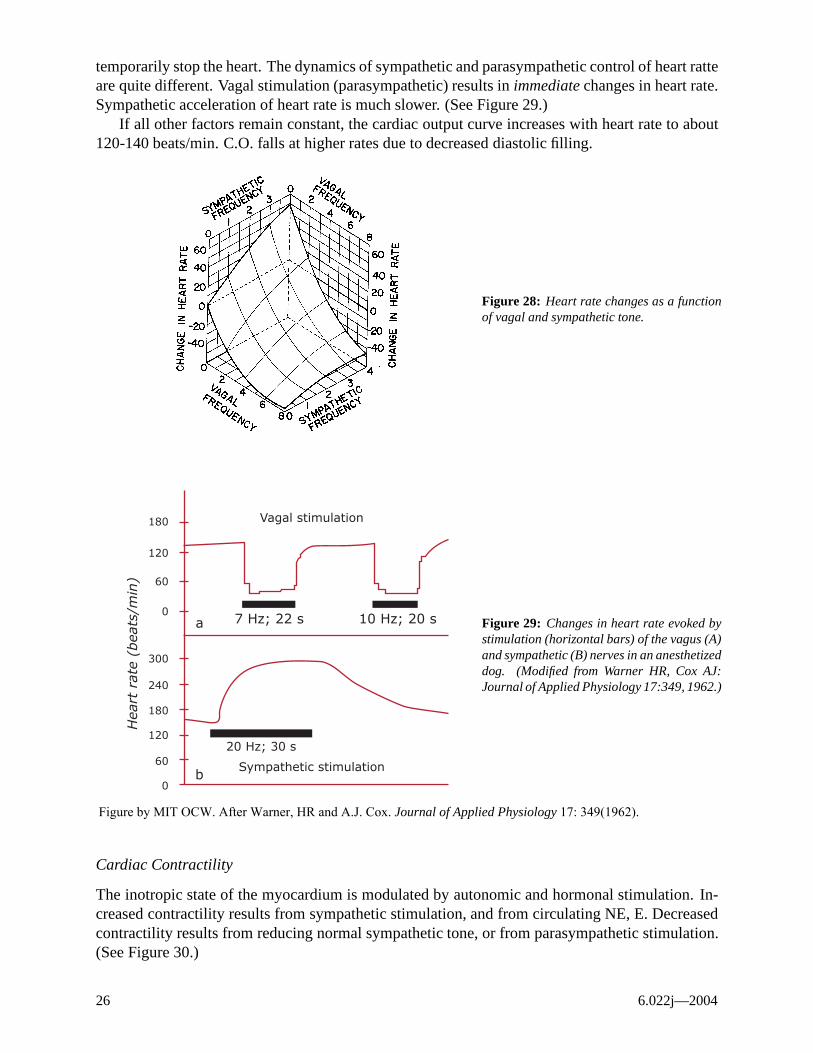
temporarily stop the heart. The dynamics of sympathetic and parasympathetic control of heart ratte are quite different. Vagal stimulation (parasympathetic) results in immediate changes in heart rate. Sympathetic acceleration of heart rate is much slower. (See Figure 29.)
If all other factors remain constant, the cardiac output curve increases with heart rate to about 120-140 beats/min. C.O. falls at higher rates due to decreased diastolic filling.
Figure 28: Heart rate changes as a function of vagal and sympathetic tone.
Hea
rt r
ate
(bea
ts/m
in)
180
120
60
0 a
b
7 Hz; 22 s
Vagal stimulation
Sympathetic stimulation
10 Hz; 20 s
20 Hz; 30 s
Figure 29: Changes in heart rate evoked by stimulation (horizontal bars) of the vagus (A) and sympathetic (B) nerves in an anesthetized 300 dog. (Modified from Warner HR, Cox AJ:
240 Journal of Applied Physiology 17:349, 1962.)
180
120
60
0
Figure by MIT OCW. After Warner, HR and A.J. Cox. Journal of Applied Physiology 17: 349(1962).
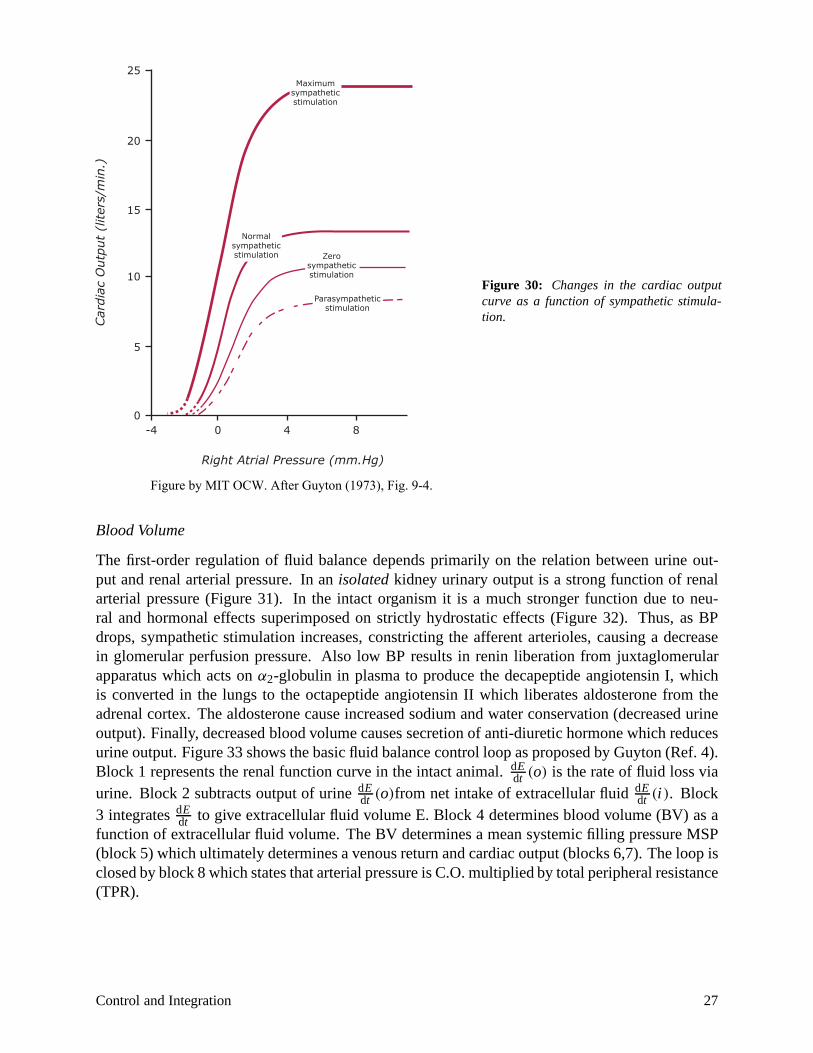
Cardiac Contractility
The inotropic state of the myocardium is modulated by autonomic and hormonal stimulation. Increased contractility results from sympathetic stimulation, and from circulating NE, E. Decreased contractility results from reducing normal sympathetic tone, or from parasympathetic stimulation. (See Figure 30.)
6.022j—2004 26
25
dE dt (o)
dE dt (o) dE
dt (i ). Block 1 represents the renal function curve in the intact animal. is the rate of fluid loss via urine. Block 2 subtracts output of urine from net intake of extracellular fluid
Car
dia
c O
utp
ut
(liter
s/m
in.)
20
15
10
Maximum sympathetic stimulation
Normal sympathetic stimulation
sympathetic stimulation
stimulation
Zero
Parasympathetic
Figure 30: Changes in the cardiac output curve as a function of sympathetic stimulation.
5
0-4 0 4 8
Right Atrial Pressure (mm.Hg)
Figure by MIT OCW. After Guyton (1973), Fig. 9-4.
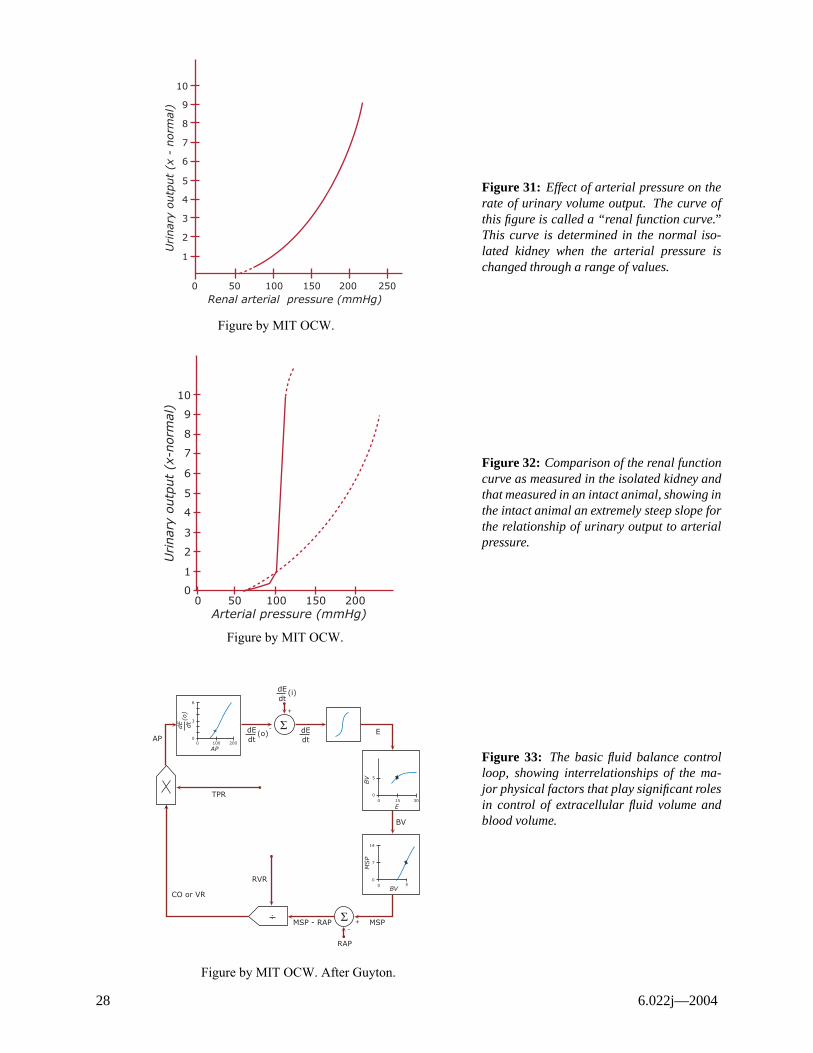
Blood Volume
The first-order regulation of fluid balance depends primarily on the relation between urine output and renal arterial pressure. In an isolated kidney urinary output is a strong function of renal arterial pressure (Figure 31). In the intact organism it is a much stronger function due to neural and hormonal effects superimposed on strictly hydrostatic effects (Figure 32). Thus, as BP drops, sympathetic stimulation increases, constricting the afferent arterioles, causing a decrease in glomerular perfusion pressure. Also low BP results in renin liberation from juxtaglomerular apparatus which acts on α2-globulin in plasma to produce the decapeptide angiotensin I, which is converted in the lungs to the octapeptide angiotensin II which liberates aldosterone from the adrenal cortex. The aldosterone cause increased sodium and water conservation (decreased urine output). Finally, decreased blood volume causes secretion of anti-diuretic hormone which reduces urine output. Figure 33 shows the basic fluid balance control loop as proposed by Guyton (Ref. 4).
Block to give extracellular fluid volume E. Block 4 determines blood volume (BV) as a dt
dE3 integrates function of extracellular fluid volume. The BV determines a mean systemic filling pressure MSP (block 5) which ultimately determines a venous return and cardiac output (blocks 6,7). The loop is closed by block 8 which states that arterial pressure is C.O. multiplied by total peripheral resistance (TPR).
Control and Integration 27
0
Urinar
y outp
ut
(x-n
orm
al)
Urinar
y outp
ut
(x -
norm
al)
10
9
8
7
6
5
4
3
2
1
50 100 150 200 250 Renal arterial pressure (mmHg)
Figure by MIT OCW.
10
9
8
7
6
5
4
3
2
1
00 50 100 150 200
Arterial pressure (mmHg)
Figure by MIT OCW.
Figure 31: Effect of arterial pressure on the rate of urinary volume output. The curve of this figure is called a “renal function curve.” This curve is determined in the normal isolated kidney when the arterial pressure is changed through a range of values.
Figure 32: Comparison of the renal function curve as measured in the isolated kidney and that measured in an intact animal, showing in the intact animal an extremely steep slope for the relationship of urinary output to arterial pressure.
6
3
0 0 100 200
�
MSP - RAP
RVR
TPR
AP
CO or VR
-
+
dE dt
(o)
dE dt (o
)
dt (i)
AP
dE
5
0 0 15 30
E
E
BV
dE dt
Figure 33: The basic fluid balance control loop, showing interrelationships of the major physical factors that play significant roles in control of extracellular fluid volume and blood volume.
7
14
0
BV
0 5
MSP
� -
BV
+ MSP
RAP
Figure by MIT OCW. After Guyton.
28 6.022j—2004
Sensors or Receptors
The cardiovascular control system includes a number of sensors which monitor several relevant variables.
Local metabolic state
As discussed above local, metabolic state is sensed by precapillary sphincters. These sphincters respond directly to local factors, and hence are part of the intrinsic rather than extrinsic control system. Nevertheless it is appropriate to note that overall cardiovascular control does, in fact, measure the state of local perfusion and responds appropriately to it, particularly in skeletal and cardiac muscle.
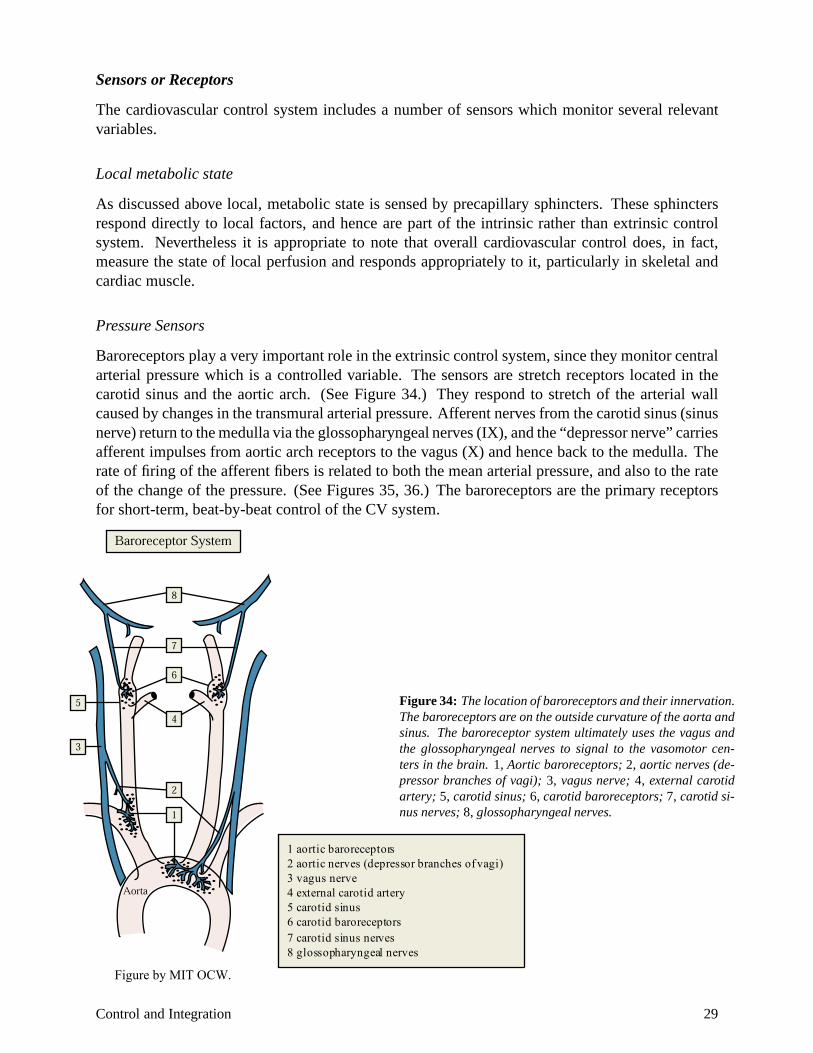
Pressure Sensors
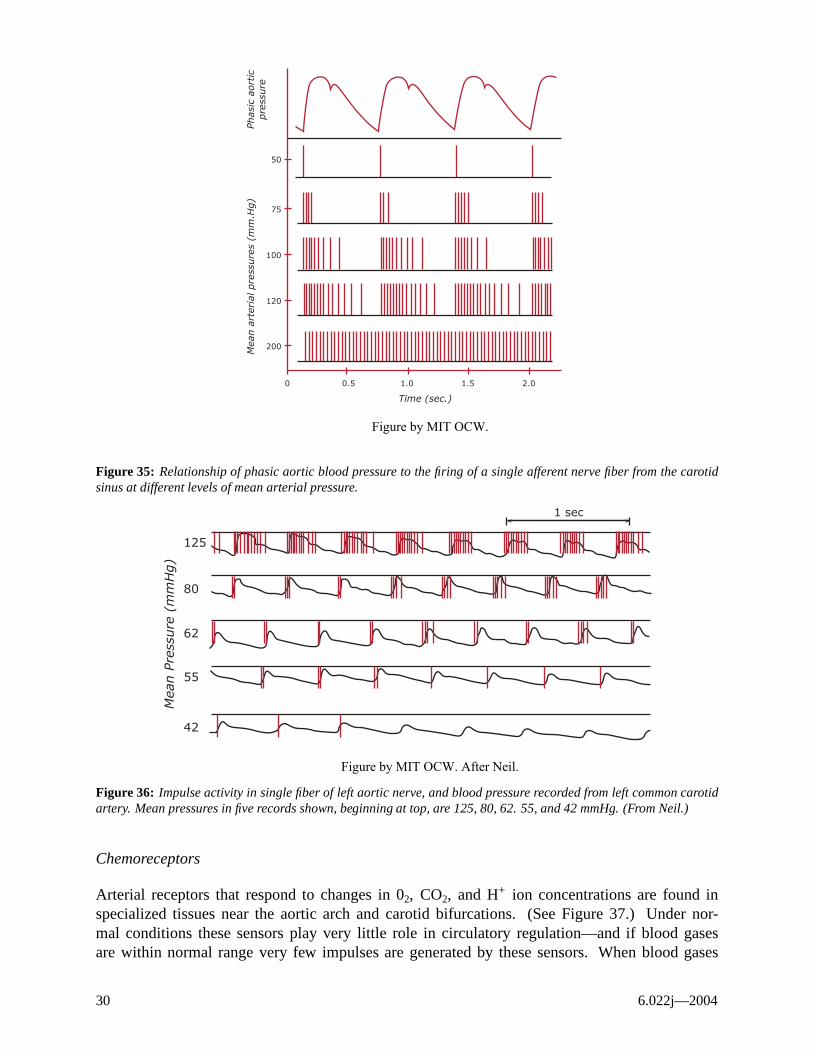
Baroreceptors play a very important role in the extrinsic control system, since they monitor central arterial pressure which is a controlled variable. The sensors are stretch receptors located in the carotid sinus and the aortic arch. (See Figure 34.) They respond to stretch of the arterial wall caused by changes in the transmural arterial pressure. Afferent nerves from the carotid sinus (sinus nerve) return to the medulla via the glossopharyngeal nerves (IX), and the “depressor nerve” carries afferent impulses from aortic arch receptors to the vagus (X) and hence back to the medulla. The rate of firing of the afferent fibers is related to both the mean arterial pressure, and also to the rate of the change of the pressure. (See Figures 35, 36.) The baroreceptors are the primary receptors for short-term, beat-by-beat control of the CV system.
Figure 34: The location of baroreceptors and their innervation. The baroreceptors are on the outside curvature of the aorta and sinus. The baroreceptor system ultimately uses the vagus and the glossopharyngeal nerves to signal to the vasomotor centers in the brain. 1, Aortic baroreceptors; 2, aortic nerves (depressor branches of vagi); 3, vagus nerve; 4, external carotid artery; 5, carotid sinus; 6, carotid baroreceptors; 7, carotid sinus nerves; 8, glossopharyngeal nerves.
Figure by MIT OCW.
Control and Integration 29
50
75
100
120
200
Phas
ic a
ort
icpre
ssure
M
ean a
rter
ial pre
ssure
s (m
m.H
g)
0 0.5 1.0 1.5 2.0
Time (sec.)
Figure by MIT OCW.
Figure 35: Relationship of phasic aortic blood pressure to the firing of a single afferent nerve fiber from the carotid sinus at different levels of mean arterial pressure.
1 sec
125
80
62
55
42
Mea
n P
ress
ure
(m
mH
g)
Figure by MIT OCW. After Neil.
Figure 36: Impulse activity in single fiber of left aortic nerve, and blood pressure recorded from left common carotid artery. Mean pressures in five records shown, beginning at top, are 125, 80, 62. 55, and 42 mmHg. (From Neil.)
Chemoreceptors
Arterial receptors that respond to changes in 02, CO2, and H+ ion concentrations are found in specialized tissues near the aortic arch and carotid bifurcations. (See Figure 37.) Under normal conditions these sensors play very little role in circulatory regulation—and if blood gases are within normal range very few impulses are generated by these sensors. When blood gases
6.022j—2004 30
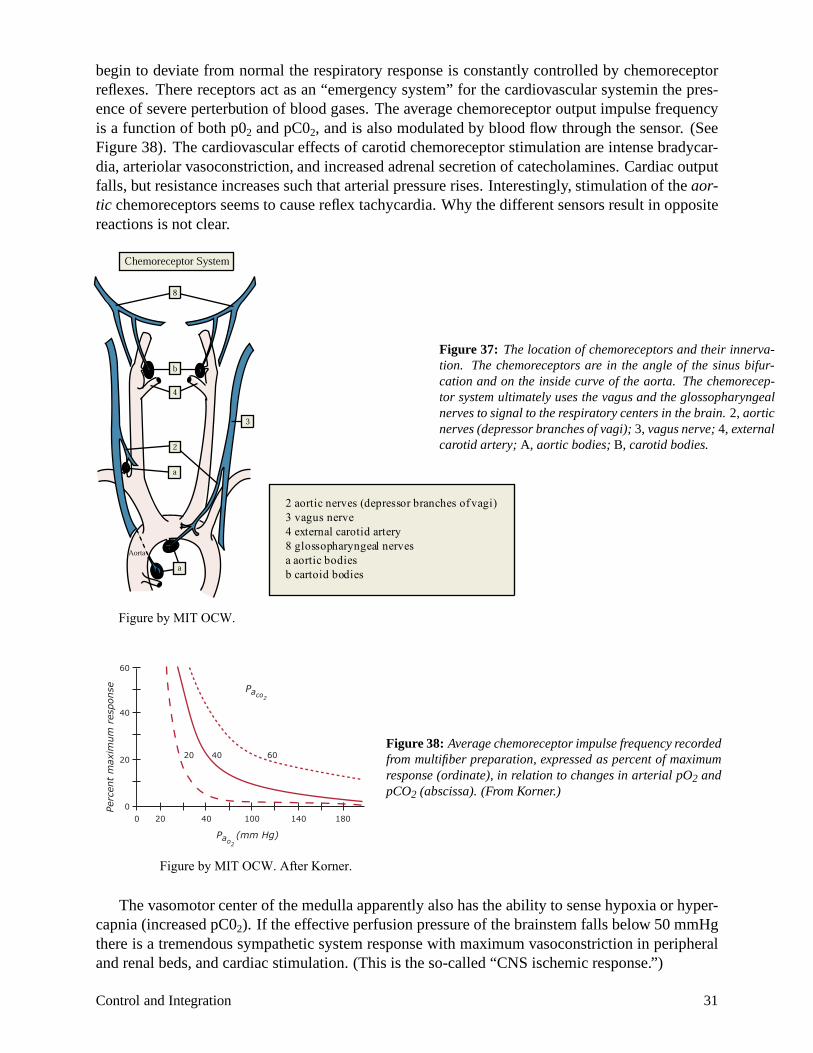
begin to deviate from normal the respiratory response is constantly controlled by chemoreceptor reflexes. There receptors act as an “emergency system” for the cardiovascular systemin the presence of severe perterbution of blood gases. The average chemoreceptor output impulse frequency is a function of both p02 and pC02, and is also modulated by blood flow through the sensor. (See Figure 38). The cardiovascular effects of carotid chemoreceptor stimulation are intense bradycardia, arteriolar vasoconstriction, and increased adrenal secretion of catecholamines. Cardiac output falls, but resistance increases such that arterial pressure rises. Interestingly, stimulation of the aortic chemoreceptors seems to cause reflex tachycardia. Why the different sensors result in opposite reactions is not clear.
Figure 37: The location of chemoreceptors and their innervation. The chemoreceptors are in the angle of the sinus bifurcation and on the inside curve of the aorta. The chemoreceptor system ultimately uses the vagus and the glossopharyngeal nerves to signal to the respiratory centers in the brain. 2, aortic nerves (depressor branches of vagi); 3, vagus nerve; 4, external carotid artery; A, aortic bodies; B, carotid bodies.
Perc
ent
max
imum
res
ponse
Figure by MIT OCW.
60
40
20 40 60
Paco2
Figure 38: Average chemoreceptor impulse frequency recorded 20 from multifiber preparation, expressed as percent of maximum
response (ordinate), in relation to changes in arterial pO2 and pCO2 (abscissa). (From Korner.)
0
0 20 40 100 140 180
Pa (mm Hg) o2
Figure by MIT OCW. After Korner.
The vasomotor center of the medulla apparently also has the ability to sense hypoxia or hypercapnia (increased pC02). If the effective perfusion pressure of the brainstem falls below 50 mmHg there is a tremendous sympathetic system response with maximum vasoconstriction in peripheral and renal beds, and cardiac stimulation. (This is the so-called “CNS ischemic response.”)
Control and Integration 31
Volume Receptors
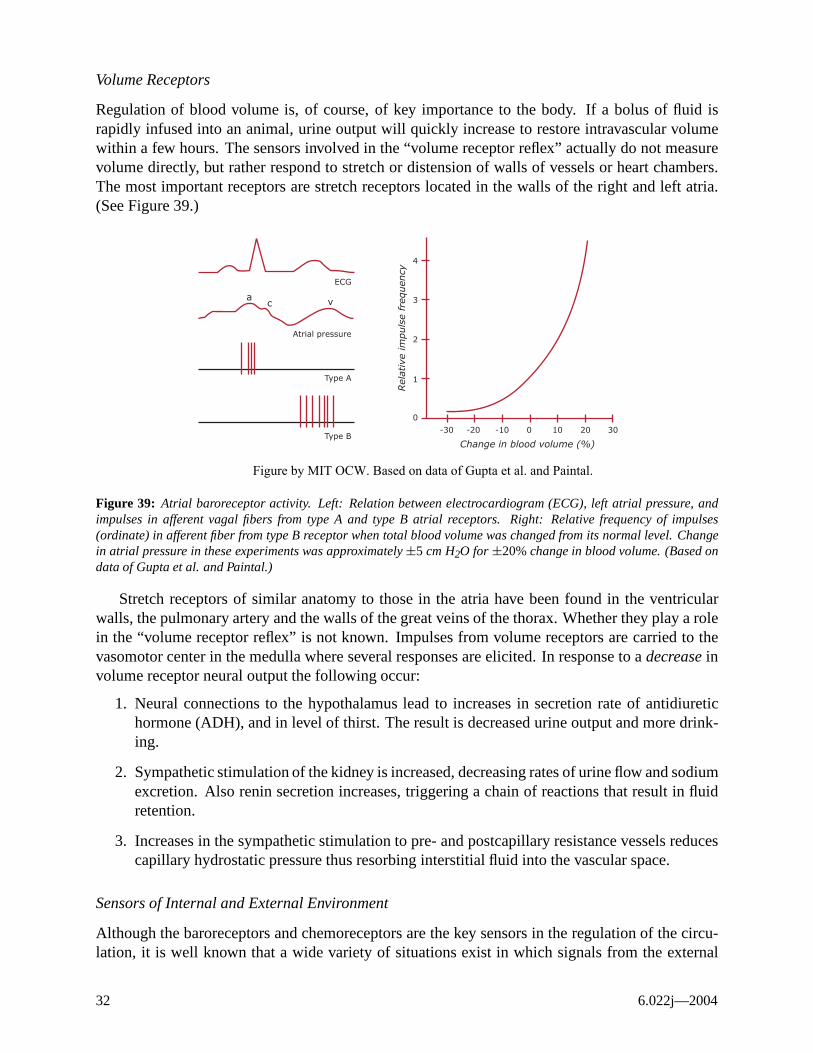
Regulation of blood volume is, of course, of key importance to the body. If a bolus of fluid is rapidly infused into an animal, urine output will quickly increase to restore intravascular volume within a few hours. The sensors involved in the “volume receptor reflex” actually do not measure volume directly, but rather respond to stretch or distension of walls of vessels or heart chambers. The most important receptors are stretch receptors located in the walls of the right and left atria. (See Figure 39.)
1
0
-30 -20 -10 0 10 20 30
Rel
ativ
e im
puls
e fr
equen
cy� 4
ECG
a c v
Atrial pressure
3
2
Type A
Type B Change in blood volume (%)
Figure by MIT OCW. Based on data of Gupta et al. and Paintal.
Figure 39: Atrial baroreceptor activity. Left: Relation between electrocardiogram (ECG), left atrial pressure, and impulses in afferent vagal fibers from type A and type B atrial receptors. Right: Relative frequency of impulses (ordinate) in afferent fiber from type B receptor when total blood volume was changed from its normal level. Change in atrial pressure in these experiments was approximately ±5 cm H2O for ±20% change in blood volume. (Based on data of Gupta et al. and Paintal.)
Stretch receptors of similar anatomy to those in the atria have been found in the ventricular walls, the pulmonary artery and the walls of the great veins of the thorax. Whether they play a role in the “volume receptor reflex” is not known. Impulses from volume receptors are carried to the vasomotor center in the medulla where several responses are elicited. In response to a decrease in volume receptor neural output the following occur:
1. Neural connections to the hypothalamus lead to increases in secretion rate of antidiuretic hormone (ADH), and in level of thirst. The result is decreased urine output and more drinking.
2. Sympathetic stimulation of the kidney is increased, decreasing rates of urine flow and sodium excretion. Also renin secretion increases, triggering a chain of reactions that result in fluid retention.
3. Increases in the sympathetic stimulation to pre- and postcapillary resistance vessels reduces capillary hydrostatic pressure thus resorbing interstitial fluid into the vascular space.
Sensors of Internal and External Environment
Although the baroreceptors and chemoreceptors are the key sensors in the regulation of the circulation, it is well known that a wide variety of situations exist in which signals from the external
6.022j—2004 32
environment or internal environment may alter cardiovascular function. “Deep pain” associated with visceral manipulation, distortion of joints, testicular trauma etc. leads to the dramatic somatic depressor response characterized by bradycardia, cold sweat, syncope, nausea, and weakness. Sensors of external temperatures exist in the skin and lead to reflex vasoconstriction. Similarly, internal body temperature is sensed by cells in the hypothalamic thermoregulatory center. We have already mentioned the ability of the medullary vasomotor center to detect and respond to ischemia of the CNS.
Finally, the cardiovascular system responds to stimuli originating in the external environment and interpreted at the cortical level. Thus, threats as perceived via sight, sound, smell, etc. will cause dramatic cardiovascular responses. Obviously, a comprehensive understanding of cortical autonomic mechanisms is still beyond our reach, but it is clear that these higher nervous centers act continuously with medullary centers in control of cardiovascular function.
Central Control Logic
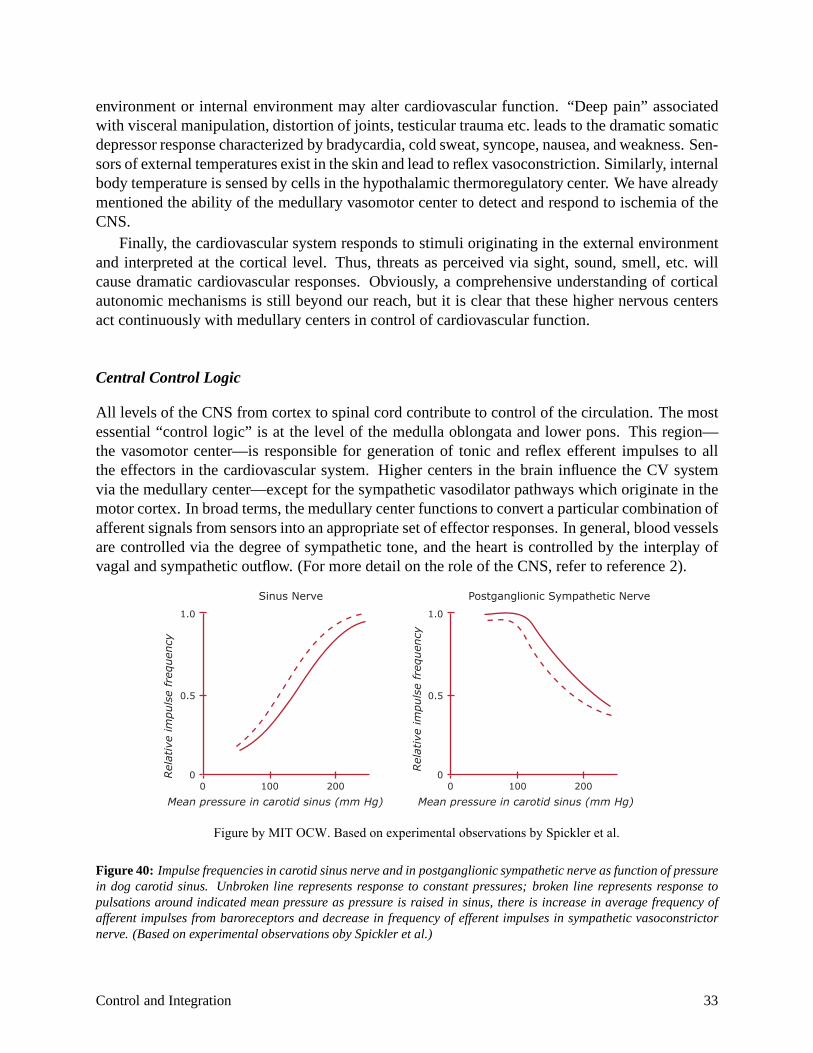
All levels of the CNS from cortex to spinal cord contribute to control of the circulation. The most essential “control logic” is at the level of the medulla oblongata and lower pons. This region— the vasomotor center—is responsible for generation of tonic and reflex efferent impulses to all the effectors in the cardiovascular system. Higher centers in the brain influence the CV system via the medullary center—except for the sympathetic vasodilator pathways which originate in the motor cortex. In broad terms, the medullary center functions to convert a particular combination of afferent signals from sensors into an appropriate set of effector responses. In general, blood vessels are controlled via the degree of sympathetic tone, and the heart is controlled by the interplay of vagal and sympathetic outflow. (For more detail on the role of the CNS, refer to reference 2).
Sinus Nerve Postganglionic Sympathetic Nerve
1.0
0.5
0
1.0
0.5
0Rel
ativ
e im
puls
e fr
equen
cy
Rel
ativ
e im
puls
e fr
equen
cy
0 100 200 0 100 200
Mean pressure in carotid sinus (mm Hg) Mean pressure in carotid sinus (mm Hg)
Figure by MIT OCW. Based on experimental observations by Spickler et al.
Figure 40: Impulse frequencies in carotid sinus nerve and in postganglionic sympathetic nerve as function of pressure in dog carotid sinus. Unbroken line represents response to constant pressures; broken line represents response to pulsations around indicated mean pressure as pressure is raised in sinus, there is increase in average frequency of afferent impulses from baroreceptors and decrease in frequency of efferent impulses in sympathetic vasoconstrictor nerve. (Based on experimental observations oby Spickler et al.)
Control and Integration 33
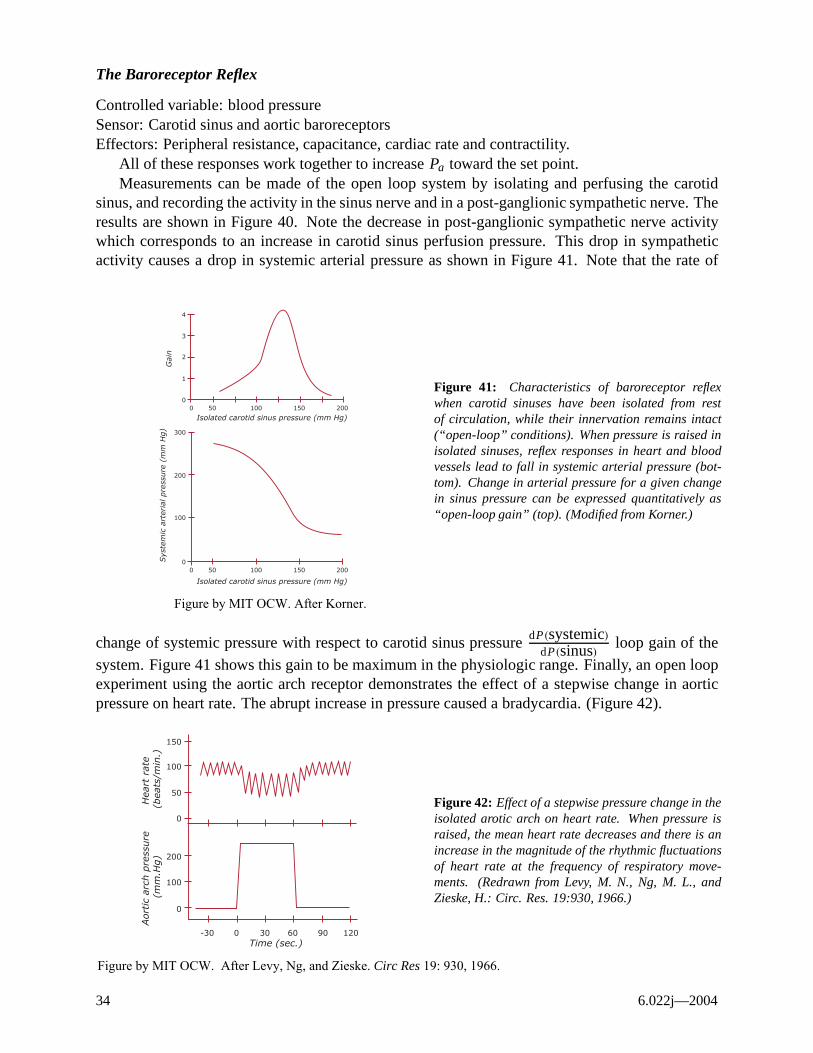
The Baroreceptor Reflex
Controlled variable: blood pressure Sensor: Carotid sinus and aortic baroreceptors Effectors: Peripheral resistance, capacitance, cardiac rate and contractility.
All of these responses work together to increase Pa toward the set point. Measurements can be made of the open loop system by isolating and perfusing the carotid
sinus, and recording the activity in the sinus nerve and in a post-ganglionic sympathetic nerve. The results are shown in Figure 40. Note the decrease in post-ganglionic sympathetic nerve activity which corresponds to an increase in carotid sinus perfusion pressure. This drop in sympathetic activity causes a drop in systemic arterial pressure as shown in Figure 41. Note that the rate of
Sys
tem
ic a
rter
ial pre
ssure
(m
m H
g)
Gai
n
4
3
2
1
Figure 41: Characteristics of baroreceptor reflex 0 when carotid sinuses have been isolated from rest 0 50 100 150 200
Isolated carotid sinus pressure (mm Hg) of circulation, while their innervation remains intact 300 (“open-loop” conditions). When pressure is raised in
isolated sinuses, reflex responses in heart and blood vessels lead to fall in systemic arterial pressure (bot
200 tom). Change in arterial pressure for a given change in sinus pressure can be expressed quantitatively as “open-loop gain” (top). (Modified from Korner.) 100
00 50 100 150 200
Isolated carotid sinus pressure (mm Hg)
Figure by MIT OCW. After Korner.
change of systemic pressure with respect to carotid sinus pressure dP(systemic) loop gain of the dP(sinus)
system. Figure 41 shows this gain to be maximum in the physiologic range. Finally, an open loop experiment using the aortic arch receptor demonstrates the effect of a stepwise change in aortic pressure on heart rate. The abrupt increase in pressure caused a bradycardia. (Figure 42).
150
Aort
ic a
rch p
ress
ure
H
eart
rat
e(m
m.H
g)
(bea
ts/m
in.)
100
50 Figure 42: Effect of a stepwise pressure change in the
0 isolated arotic arch on heart rate. When pressure is raised, the mean heart rate decreases and there is an increase in the magnitude of the rhythmic fluctuations
200 of heart rate at the frequency of respiratory move
100 ments. (Redrawn from Levy, M. N., Ng, M. L., and Zieske, H.: Circ. Res. 19:930, 1966.)
0
-30 0 30 60 90 120 Time (sec.)
Figure by MIT OCW. After Levy, Ng, and Zieske. Circ Res 19: 930, 1966.
6.022j—2004 34
32cc
/min
.
24cc
/min.
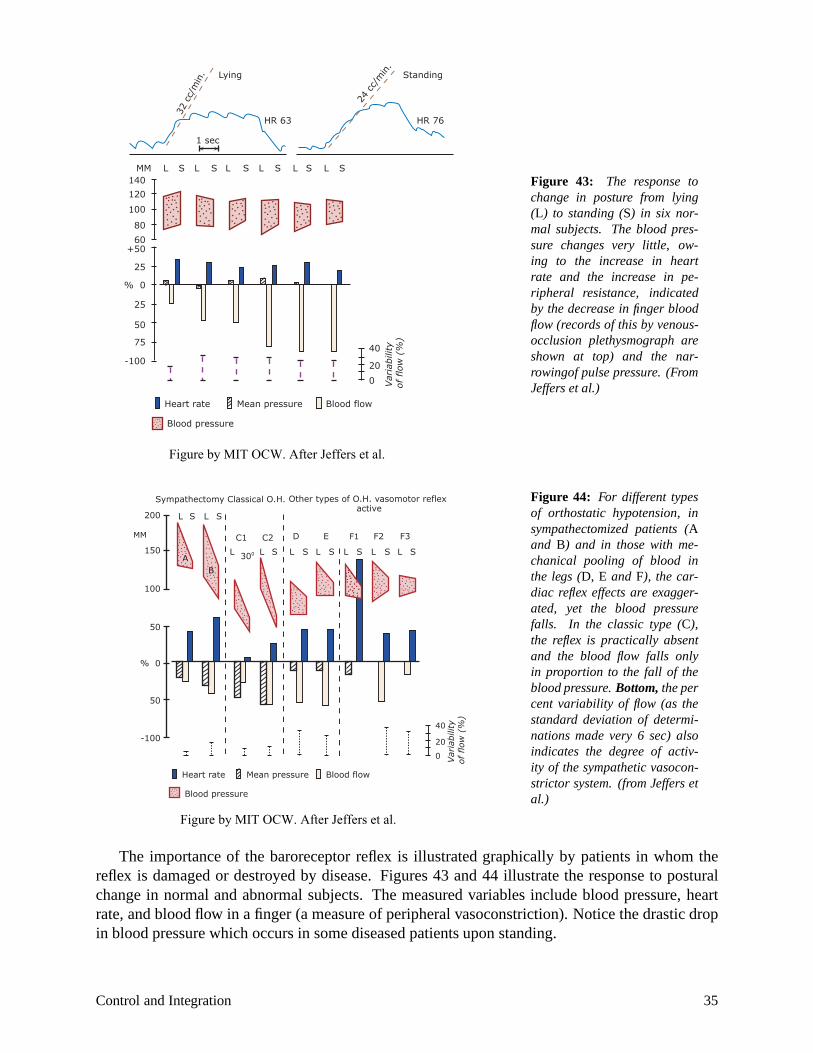
Lying Standing
HR 76 HR 63
1 sec
MM L S L S L S L S L S L S
Figure 43: The response to change in posture from lying (L) to standing (S) in six normal subjects. The blood pressure changes very little, owing to the increase in heart rate and the increase in peripheral resistance, indicated by the decrease in finger blood flow (records of this by venous-occlusion plethysmograph are shown at top) and the narrowingof pulse pressure. (From Jeffers et al.)
140
120
100
80
60 +50
25
% 0
25
50
75 40
-100 20
0 Var
iabili
ty
of flow
(%
) Heart rate Mean pressure Blood flow
Blood pressure
Figure by MIT OCW. After Jeffers et al.
Sympathectomy Classical O.H. Other types of O.H. vasomotor reflex Figure 44: For different types active of orthostatic hypotension, in 200
-100
L S L S
L L0 S L
D E
L L L LS S S S S A
B
C1 C2
30
F1 F2 F3
20
sympathectomized patients (A and B) and in those with mechanical pooling of blood in the legs (D, E and F), the cardiac reflex effects are exaggerated, yet the blood pressure falls. In the classic type (C), the reflex is practically absent and the blood flow falls only in proportion to the fall of the blood pressure. Bottom, the per cent variability of flow (as the
MM
150
100
50
% 0
50
standard deviation of determinations made very 6 sec) also indicates the degree of activity of the sympathetic vasocon-
Var
iabili
ty
of flow
(%
)
40
0
Heart rate Mean pressure Blood flow strictor system. (from Jeffers et
Blood pressure al.)
Figure by MIT OCW. After Jeffers et al.
The importance of the baroreceptor reflex is illustrated graphically by patients in whom the reflex is damaged or destroyed by disease. Figures 43 and 44 illustrate the response to postural change in normal and abnormal subjects. The measured variables include blood pressure, heart rate, and blood flow in a finger (a measure of peripheral vasoconstriction). Notice the drastic drop in blood pressure which occurs in some diseased patients upon standing.
Control and Integration 35
Summary
We have briefly reviewed some of the high points of extrinsic cardiovascular control mechanisms. Obviously both extrinsic and intrinsic factors are involved in regulation, and the balance varies depending on the tissue involved. In brain and heart, for example, the intrinsic mechanisms are predominant. On the other hand, in the skin extrinsic control is dominant. In skeletal muscle the interaction and balance between extrinsic and intrinsic mechanisms can be clearly seen. In resting muscle, neural control is dominant. In anticipation of exercise, blood flow increases due to cholinergic sympathetic stimulation. After the onset of exercise local metabolic factors result in vasodilation.
References
1. Berne and Levy, Cardiovascular Physiology, ed. 5, Mosby, 1986, Chapters 8, 9, and 12.
2. Montcastle, V., Medical Physiology, Vol. II. Edition 13. Mosby, 1974, chapters 38, 39.
3. Burton, A.C. Physiology and Biophysics of the Circulation, Ed. 2, Yearbook Medical Pub. 1972, chapters 20, 21, 22, 23, and 24.
4. Guyton, Tayler and Granger, Circulatorv Physiology II: Dynamics and Control of the Body Fluids, Saunders, 1975.
6.022j—2004 36