Embed Size (px)
Citation preview
Contrib Mineral Petrol (1981) 77:115 120 Contributions to Mineralogy and Petrology �9 Springer-Verlag 1981
An Analytical Electron Microscopic Study of a Pyroxene-Amphibole Intergrowth *
Andrew M. Isaacs, Philip E. Brown 1, John W. Valley 2, Eric J. Essene, and Donald R. Peacor Department of Geological Sciences, The University of Michigan, Ann Arbor, Michigan 48109, USA
Abstract. Samples of a garnet granulitc from the mafic border units of the Lake Chatuge, Georgia alpine peridotite body were found to contain lamellar intergrowths of a pargastic amphibole in augite having the typical appearance of an exsolution feature. Single crystal X-ray diffraction, optical, electron microprobe and conventional and analytical electron microscopic studies have provided data limiting the compositions and structures of the coexisting phases. Individual tamellae of both materials are from 0.5 to 2.0 pm in width with the lamellar interface parallel to {010}. The formulae of the minerals, as determined by a combi- nation of electron microprobe and analytical electron microsco- py, are (Nao.lCal.oMgo.6Fe 3 +0.3)(Sii.sA10.2)O6 for the pyroxene and Nao.TCal.9(Mgz.lFe 2 + 1.4Fe 3 + o.sTio.lCro.lAlo.s)(Sis.9A12.1) O22(OH)2 for the amphibole. Several other studies have described intergrowths similar to those observed in this work, in general favoring exsolution as the formation mechanism for the inter- growths. In the Lake Chatuge samples however, replacement of pyroxene by amphibole is in part indicated by continuous gradation of amphibole lamellae into amphiboles rimming the clinopyroxenes.
Introduction
Submicroscopic intergrowths of amphibole in pyroxene were re- cognized by Papike et al. (1969) using single crystal X-ray diffrac- tion techniques. These intergrowths were identified in several pyroxenes, including jadeite in glaucophane schists from Califor- nia, augites from the Sierra Nevada batholith and from the kaersutite-bearing, Sail Carlos, Arizona peridotite and ompha- cites from the Roberts Victor eclogite, South Africa. In an X-ray diffraction and electron microprobe study, Desnoyers (1975) ob- served {100} lamellae of amphibole 2-10 gm wide in orthopyrox- ene from a peridotite xenolith in lava from the Ataq volcano, Southern Arabia. Smith (1977), using transmission electron mi- croscopy (TEM), examined {010} amphibole lamellae up to 800/~ wide in augite in harzburgite from Harzburg, Germany, hypersthene gabbro from the Belhelvie intrusion, Aberdeenshire, a member of the marginal border group of the Skaergaard intru- sion, East Greenland, and gabbro from the critical series of the Bushveld intrusion, South Africa. Smith also estimated the
1 Present address." Department of Geology and Geophysics, The Uni- versity of Wisconsin, Madison, WI 53706, USA
2 Present address: Department of Geology, Rice University, P.O. Box 1892, Houston, TX 77001, USA
* Contribution No. 368 from the Mineralogical Laboratory, Depart- ment of Geological Sciences, The University of Michigan, Ann Ar- bor, Michigan
composition of the lamellae in the harzburgite augite using tech- niques of analytical electron microscopy (AEM). Yamaguchi etal. (1978) used TEM and electron microprobe analysis (EMPA) to describe two sets of clinoamphibole lamellae in diop- side in a garnet lherzolite from Alpe Arami, Switzerland. One set, 0.5-3.0 gm wide, was parallel to {010} and a second set, 1.0-10.0 gm wide, was parallel to {100} of the diopside. Most recently, Nakajima and Hafner (1980), using X-ray diffraction, noted amphibole in a Skaergaard augite, and in a TEM study Nakajima and Ribbe (1980) report lamellae up to 0.1 ~tm wide of amphibole parallel to {010} in augite in a gabbro from the Horoman ultramafic body, Hokkaido, Japan.
In each of the studies cited, the amphibole occurred in pyrox- enc as discrete lamellae greater than 200-300 ~ in width. There are also examples in the literature of narrower zones down to 18 A in width of double-chain pyriboles in pyroxenes (Veblen and Buseck 1977, 1980; Yamaguchi et al. 1978; Nakajima and Ribbe 1980). We have chosen the approximate size limit of 200- 300 A in width to differentiate between such very fine lamellae best resolvable with high-resolution TEM and the larger features discussed here, since the two types differ greatly in morphology.
In a study of the Lake Chatuge, Georgia eclogite, described by Hartley (1973) and Dallmeyer (1974), we examined garnet- pyroxene-plagioclase hornblende rocks whose pyroxenes con- tained striking lamellae of a second phase. Preliminary results of single crystal X-ray diffraction indicated that the pyroxenes contained finely intergrown amphibole lamellae. We report be- low on observations made by us combining conventional TEM, AEM, EMPA, single crystal X-ray diffraction and optical meth- ods in order to evaluate the origin of the intergrowths.
Optical and X-Ray Diffraction Observations
The Lake Chatuge alpine peridotite complex, described by Hart- ley (1973), includes lenses of an eclogitic garnet-clinopyroxene rock which are locally associated with that body (Dallmeyer 1974). Specimens of related rocks were found by us to be garnet granulites, with the assemblage garnet (PY31 Alm46 Gr18 And~ Sp2), clinopyroxene, plagioclase (An36)• pargasitic horn- blende and epidote. The most notable feature in the rocks is the pyroxene, which contains a lamellar intergrowth of two min- erals with the individual lamellae being 0.5 to 2.0 ~Lm in width. One of the sets of lamellae extends continuously into the amphi- bole replacement rims about many of the grains, as shown in Fig. 1, which is the feature that initially siggested that the two intergrown materials are an amphibole and a pyroxene, rather than a pair of coexisting exsolved pyroxenes.
0010-7999/81/0077/0115/$01.20
116
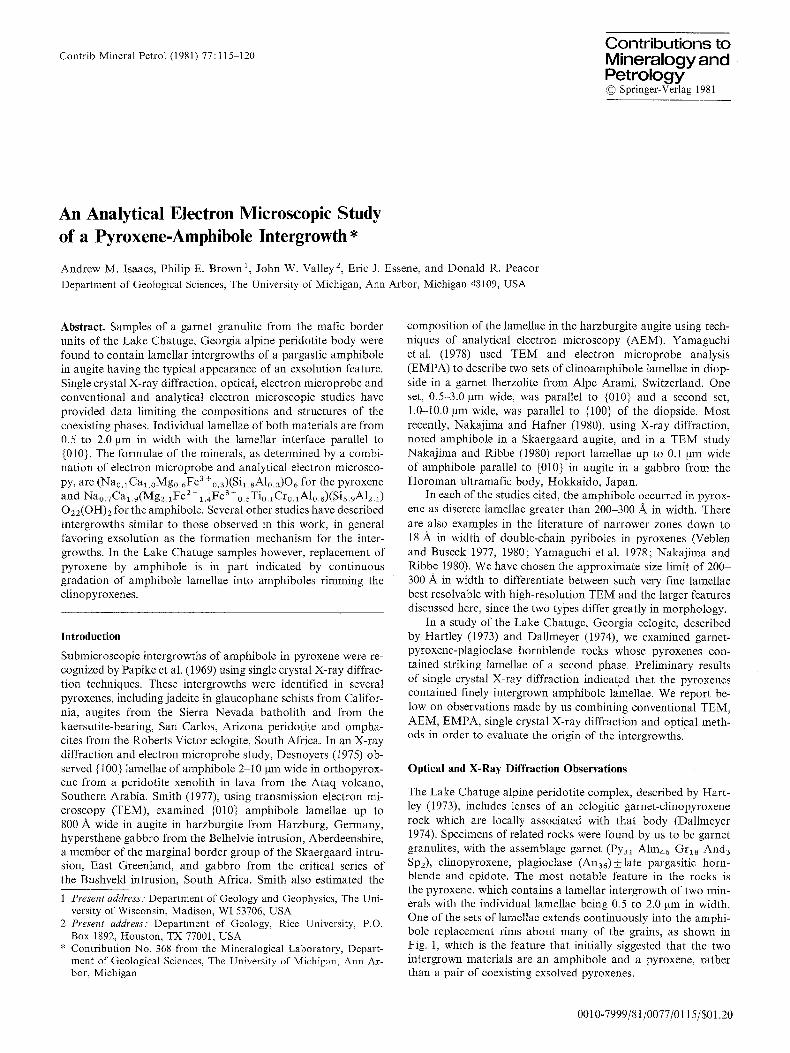
The nature of the intergrowths was confirmed by single crys- tal X-ray diffraction using a combination of precession and Weissenberg techniques, and clearly indicated an intergrown pyroxene and amphibole. The diffraction data, given in Table 1, were obtained on a grain similar to that shown in Fig. 1 which was removed from a thin section. We observed that within error of observation, the two phases have all axes in common, and consequently, /? is equal in both. Diffractions are sharp, with no observed diffuseness. The same approximate relative differ- ence in both a and b parameters is observed, with the value for the c parameters equal within measurement. Optical measure- ments using the universal stage indicate that the lamellar inter- face between the amphibole and the pyroxene is parallel to {010} and with approximately colinear c-axes.
Fig. 1. Optical micrograph showing the pyroxene-amphibole inter- growth (plane-polarized light, x 320)
Table 1. CelI parameters of the lamellar pyroxene and amphibole determined by single crystal X-ray diffraction
CPX AMPH
a 9.71• 9.8! A b 8.91 18.05 c 5.30 5.30 fl 105.30 ~ 105.30 ~
Analytical Techniques
Discs three millimeters in diameter of the amphibole-bearing pyroxene were removed from doubly-polished thin sections and mounted to brass washers using low vapor-pressure epoxy. These specimens were then thinned using a modified Technics dual Ar-beam micro ion mill and coated with about 100 A of evaporated carbon to eliminate sample charging. The thin foils were examined at 100 kV in The University of Michigan JEOL JEM 100CX scanning transmission electron micro- scope (STEM) equipped with a Princeton Gamma-Tech solid state X-ray energy-dispersive spectrometer and an on-line Nuclear Data ND6600 computer.
Low magnification TEM micrographs indicated that the average width of the lamellae is about one micron, but that individual lamellae ranged up to several microns in width. Because the size of the lamellae is near the limit of X-ray spatial resolution of the electron microprobe, analysis by this technique was thought to be inaccurate due to the lack of complete resolution of the individual lamellae. For this reason, we chose to chemically characterize the two phases both by electron microprobe and by AEM.
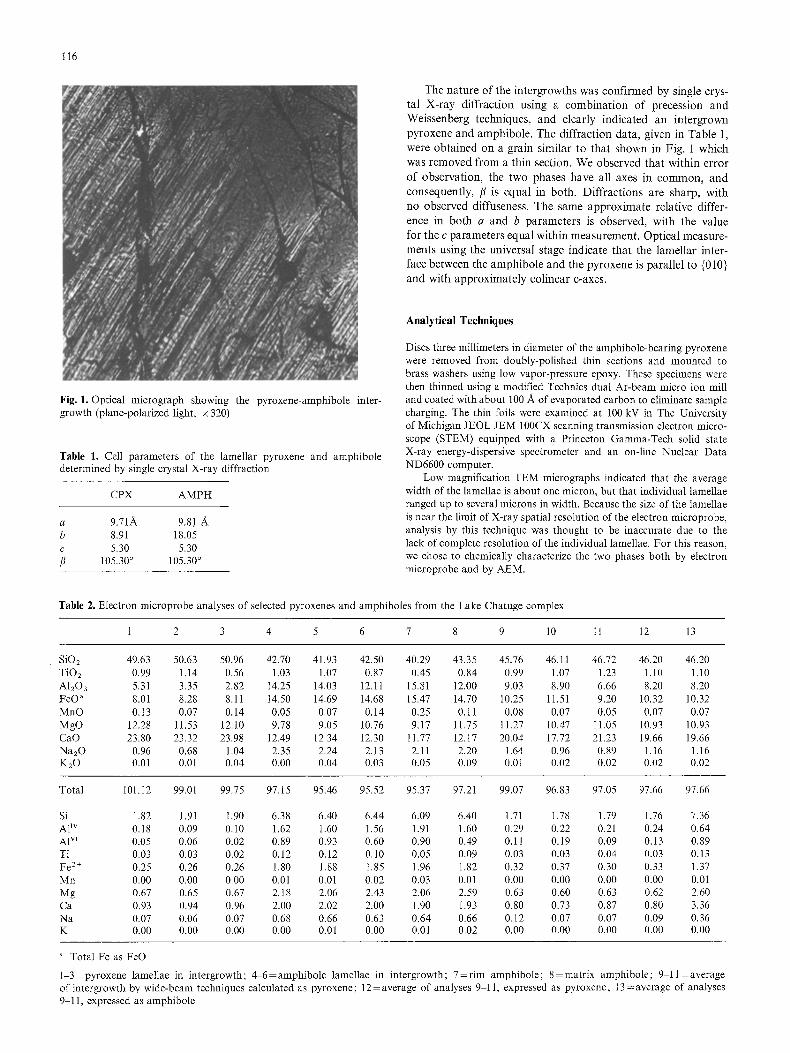
Table 2. Electron microprobe analyses of selected pyroxenes and amphiboles from the Lake Chatuge complex
i 2 3 4 5 6 7 8 9 10 ll 12 13
SiO2 49.63 50.63 50.96 42.70 41.93 42.50 40.29 43.35 45.76 46.11 46.72 46.20 46.20 TiO2 0.99 1.i4 0.56 1.03 1.07 0.87 0.45 0.84 0.99 1.07 1.23 1.10 1.10 AI203 5.31 3.35 2.82 14.25 14.03 12.I1 15.81 12.00 9.03 8.90 6.66 8.20 8.20 FeO" 8.01 8.28 8.11 14.50 14.69 14.68 15.47 14.70 10.25 11.51 9.20 10.32 10.32 MnO 0.13 0.07 0.14 0.05 0.07 0.14 0.25 0.1I 0.08 0.07 0.05 0.07 0.07 MgO 12.28 11.53 12.10 9.78 9.05 10.76 9.17 11.75 11.27 10.47 i1.05 10.93 10.93 CaO 23.80 23.32 23.98 12.49 12.34 12.30 11.77 12.17 20.04 17.72 21.23 i9.66 19.66 Na20 0.96 0.68 1.04 2.35 2.24 2.13 2.11 2.20 1.64 0.96 0.89 1.16 1.16 K20 0.01 0.01 0.04 0.00 0.04 0.03 0.05 0.09 0.01 0.02 0.02 0.02 0.02
Total 101.i2 99.01 99.75 97.15 95.46 95.52 95.37 97.21 99.07 96.83 97.05 97.66 97.66
Si 1.82 1.91 1.90 6.38 6.40 6.44 6.09 6.40 1.71 1.78 1.79 1.76 7.36 A1 Iv 0.18 0.09 0.10 1.62 1.60 1.56 1.91 1.60 0.29 0.22 0.21 0.24 0.64 A1 vl 0.05 0.06 0.02 0.89 0.93 0.60 0.90 0.49 0.11 0.19 0.09 0.13 0.89 Ti 0.03 0.03 0.02 0.12 0.12 0.10 0.05 0.09 0.03 0.03 0.04 0.03 0.13 Fe 2+ 0.25 0.26 0.26 1.80 1.88 1.85 1.96 1.82 0.32 0.37 0.30 0.33 1.37 Mn 0.00 0.00 0.00 0.01 0.01 0.02 0.03 0.01 0.00 0.00 0.00 0.00 0.01 Mg 0.67 0.65 0.67 2.18 2.06 2.43 2.06 2.59 0.63 0.60 0.63 0.62 2.60 Ca 0.93 0.94 0.96 2.00 2.02 2.00 1.90 1.93 0.80 0.73 0.87 0.80 3.36 Na 0.07 0.06 0.07 0.68 0.66 0.63 0.64 0.66 0.12 0.07 0.07 0.09 0.36 K 0.00 0.00 0.00 0.00 0.01 0.00 0.01 0.02 0.00 0.00 0.00 0.00 0.00
Total Fe as FeO
l -3-pyroxene lamellae in intergrowth; 4-6=amphibole lamellae in intergrowth; 7=rim amphibole; 8=matrix amphibole; 9-11-average of intergrowth by wide-beam techniques calculated as pyroxene; 12=average of analyses 9-11, expressed as pyroxene; 13=average of analyses 9 11, expressed as amphibole

117
Fig. 2. Low magnification scanning transmission electron micrograph of lamellae showing the contamination spots resulting from analyses (scale bar = 1.0 gm)
The microprobe analyses of the intergrown and associated phases were obtained on The University of Michigan ARL EMX-SM instru- ment with a Kevex energy-dispersive detector and three wavelength- dispersive spectrometers. Our analyses were calculated from data ob- tained using both techniques, with the final results presented here ob- tained by the latter method. Standards used were almandine for A1, Fe, Mn, clinopyroxene for Si, Ca, Mg, kaersutite for Ti, K, and jadeite for Na. The analyses were made with a 15 kV accelerating potential and a 0.02 gA sample current; drift, atomic number, absorp- tion and fluorescence corrections were applied to the raw data using the program EMPADR VII (Rucklidge and Gasparrini 1969). Analyses of individual lamellae (Table 2, Nos. 1-6) were obtained with the sec- ond condenser lens set to give the smallest possible beam spot and excitation volume. Point analyses were centered on the individual la- mellae by monitoring the counts obtained on each element. Some variation in the composition of the lamellae, consistent with observed minor heterogeneity in optical characteristics and variable overlap of adjacent lamellae, was observed. Analyses reintegrating the grains and representing a weighted average of the composition of the two inter- grown phases (Table 2, No.9-11) were made using a wide (10-20 gin) beam. In addition, an analysis of the amphibole replacement rim about a grain showing the lamellar texture is given (Table 2, No. 7), as is an analysis of matrix amphibole not spatially associated with the pyroxene-amphibole intergrowths (Table 2, No. 8). The same thin sec- tion chip which provided the sample used in the AEM/STEM observa- tions was used for the electron microprobe analyses, with the data obtained by the latter method measured on a grain morphologically identical to that used for AEM. The amphibole analyses are normalized to thirteen octahedral and tetrahedral cations, and the pyroxene to four total cations. Tetrahedral A1 is based on two tetrahedral cations per pyroxene formula unit and eight per amphibole.
Cliff and Lorimer (t972) have noted that when a specimen used for study by TEM is thin enough to be transparent to electrons, X-ray absorption and fluorescence may be neglected as a perturbation in observed X-ray emission spectra. Lorimer and Champness (1973) confirmed that for this condition, the ratio of the characteristic X-ray intensities of two elements, I~/I2, is proprotional to the atomic concen- tration ratio of the two elements, X1/X2. Whether or not an area of a given specimen is thin enough to be acceptable for the AEM was determined for this study by collecting multiple spectra from an edge of zero thickness across the sample to thicker areas, and plotting the resulting I1/I2 ratio, for the lightest and heaviest elements
A
|
i � 9 % P & t ~t ~�9 : .
~,~. :: :: •:•. ", : :
II11 �9 * *
B
�9 I
i !
�9 ! !
~1 * * * ~
--/AI I - - I - - I ~ 1 l-- Ca Ti Fe Cu
Mg Si
Fig. 3A, B. X-ray energy spectra collected on the STEM representative of those used for characterizing the materials in this study ; A amphi- bole, b pyroxene, full scale = 1,600 and 3,200 counts for the amphibole and the pyroxene, respectively. Cu X-rays are from spectral contamina- tion produced by fluorescence of a brass retaining ring in place when these spectra were collected
in the sample, against count rate. With other instrumental factors equal, count rate is a function only of excitation volume and therefore the maximum acceptable count rate for analytical work, for a given instrument and material, is that at which the I1/I2 versus count rate function becomes nonlinear. Once the maximum usable count rate has been determined for a material, regions may readily be chosen which will reliably satisfy the "thin-film criterion" of Cliff and Lorimer (1972), since count rate is easily monitored during analysis. The thin- film criterion is the basis for AEM in thin foils, although techniques of data collection and reduction vary greatly among workers. Further discussion of processes in AEM may be found in Cliff and Lorimer (1975), Lorimer et al. (1976) and Goldstein et al. (1977). The techniques we have used in the study of mineralogical materials by AEM in the STEM are discussed in detail by Blake et al. (in preparation), and the modifications which we have made on our STEM to increase reliability of the data are outlined by Blake et al. (1980) and Blake et al. (in preparation).
Figure 2 is a STEM micrograph of the intergrowths showing the contamination spots resulting from sets of analyses on a pair of adja- cent lamellae made in the STEM. The contamination spots are larger than the actual electron beam diameter by a factor of at least two. While the actual limit of X-ray spatial resolution of our instrument
118
Mont T/ 0.5- ~ ~ _
I Mg 0,2 I Si Cpx Opx �9 "~ Di
0.1
-IH~dl I 1 I 0.4 0.8
XMg
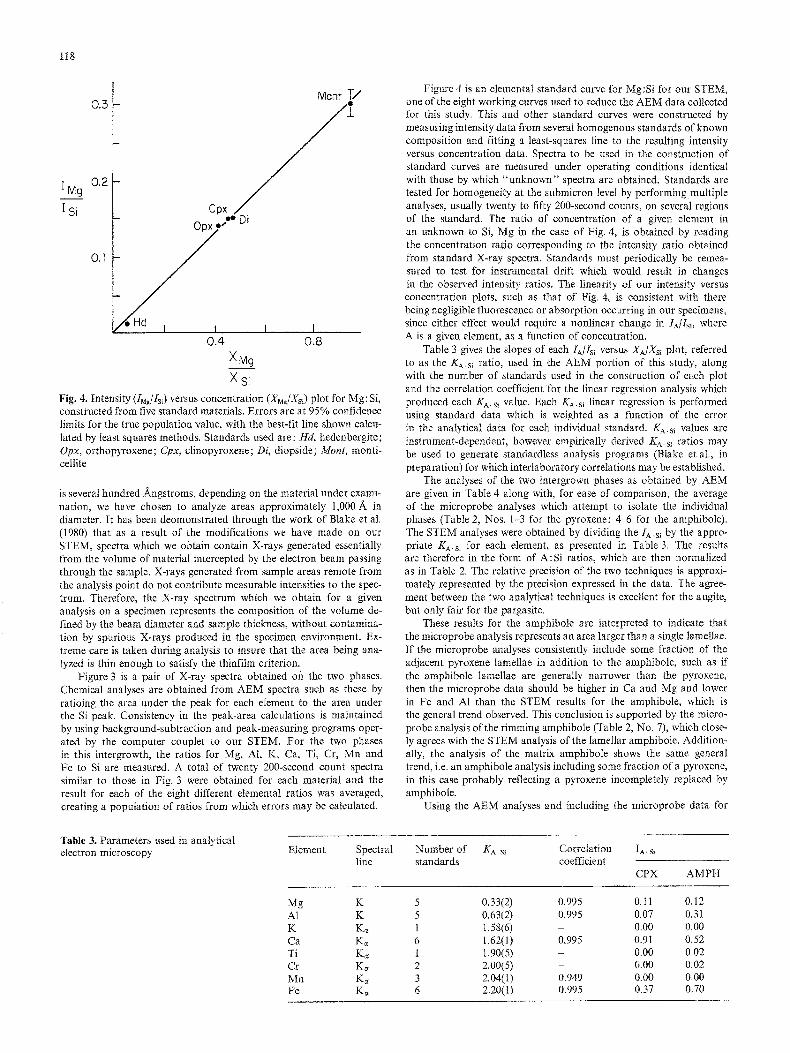
• Fig. 4. Intensity (/MJIsi) versus concentration (XMJXsl) plot for Mg: Si, constructed from five standard materials. Errors are at 95% confidence limits for the true population value, with the best-fit line shown calcu- lated by least squares methods. Standards used are: Hd, hedenbergite; Opx, orthopyroxene; Cpx, clinopyroxene; Di, diopside; Mont, monti- cellite
is several hundred Angstroms, depending on the material under exami- nation, we have chosen to analyze areas approximately 1,000 A in diameter. It has been deomonstrated through the work of Blake et al. (1980) that as a result of the modifications we have made on our STEM, spectra which we obtain contain X-rays generated essentially from the volume of material intercepted by the electron beam passing through the sample. X-rays generated from sample areas remote from the analysis point do not contribute measurable intensities to the spec- trum. Therefore, the X-ray spectrum which we obtain for a given analysis on a specimen represents the composition of the volume de- fined by the beam diameter and sample thickness, without contamina- tion by spurious X-rays produced in the specimen environment. Ex- treme care is taken during analysis to insure that the area being ana- lyzed is thin enough to satisfy the thinfilm criterion.
Figure 3 is a pair of X-ray spectra obtained on the two phases. Chemical analyses are obtained from AEM spectra such as these by ratioing the area under the peak for each element to the area under the Si peak. Consistency in the peak-area calculations is maintained by using background-subtraction and peak-measuring programs oper- ated by the computer couplet to our STEM. For the two phases in this intergrowth, the ratios for Mg, A1, K, Ca, Ti, Cr, Mn and Fe to Si are measured. A total of twenty 200-second count spectra similar to those in Fig. 3 were obtained for each material and the result for each of the eight different elemental ratios was averaged, creating a population of ratios from which errors may be calculated.
Figure 4 is an elemental standard curve for Mg:Si for our STEM, one &the eight working curves used to reduce the AEM data collected for this study. This and other standard curves were constructed by measuring intensity data from several homogenous standards of known composition and fitting a least-squares line to the resulting intensity versus concentration data. Spectra to be used in the construction of standard curves are measured under operating conditions identical with those by which "unknown" spectra are obtained. Standards are tested for homogeneity at the submicron level by performing multiple analyses, usually twenty to fifty 200-second counts, on several regions of the standard. The ratio of concentration of a given element in an unknown to Si, Mg in the case of Fig. 4, is obtained by reading the concentration ratio corresponding to the intensity ratio obtained from standard X-ray spectra. Standards must periodically be remea- sured to test for instrumental drift which would result in changes in the observed intensity ratios. The linearity of our intensity versus concentration plots, such as that of Fig. 4, is consistent with there being negligible fluorescence or absorption occurring in our specimens, since either effect would require a nonlinear change in IA/ls~, where A is a given element, as a function of concentration.
Table 3 gives the slopes of each IA/lsl versus XA/XSl plot, referred to as the K A.s~ ratio, used in the AEM portion of this study, along with the number of standards used in the construction of each plot and the correlation coefficient for the linear regression analysis which produced each KA. st value. Each KA.sl linear regression is performed using standard data which is weighted as a function of the error in the analytical data for each individual standard. KA.si values are instrument-dependent, however empirically derived KA.S~ ratios may be used to generate standardless analysis programs (Blake et al., in preparation) for which interlaboratory correlations may be established.
The analyses of the two intergrown phases as obtained by AEM are given in Table 4 along with, for ease of comparison, the average of the microprobe analyses which attempt to isolate the individual phases (Table 2, Nos. 1-3 for the pyroxene; 4-6 for the amphibole). The STEM analyses were obtained by dividing the IA.s~ by the appro- priate Ka.s~ for each element, as presented in Table 3. The results are therefore in the form of A:Si ratios, which are then normalized as in Table 2. The relative precision of the two techniques is approxi- mately represented by the precision expressed in the data. The agree- ment between the two analytical techniques is excellent for the augite, but only fair for the pargasite.
These results for the amphibole are interpreted to indicate that the microprobe analysis represents an area larger than a single lamellae. If the microprobe analyses consistently include some fraction of the adjacent pyroxene lamellae in addition to the amphibole, such as if the amphibole lamellae are generally narrower than the pyroxene, then the microprobe data should be higher in Ca and Mg and lower in Fe and A1 than the STEM results for the amphibole, which is the general trend observed. This conclusion is supported by the micro- probe analysis of the rimming amphibole (Table 2, No. 7), which close- ly agrees with the STEM analysis of the lamellar amphibole. Addition- ally, the analysis of the matrix amphibole shows the same general trend, i.e. an amphibole analysis including some fraction of a pyroxene, in this case probably reflecting a pyroxene incompletely replaced by amphibole.
Using the AEM analyses and including the microprobe data for
Table 3. Parameters used in analytical electron microscopy Element Spectral
iine Number of KA si Correlation IA. si standards coefficient
CPX AMPH
Mg K A1 K K K~ Ca K~ Ti K,: Cr Ks Mn K~ Fe K~
5 0.33(2) 0.995 0.1I 0,12 5 0,63(2) 0.995 0.07 0,31 1 1.58(6) - 0.00 0.00 6 1.62(1) 0.995 0.91 0.52 1 1.90(5) - 0.00 0.02 2 2.00(5) - 0.00 0,02 3 2,04(t) 0.949 0.00 0,00 6 2.20(1) 0.995 0.37 0.70

Table 4. Summary of STEM and microprobe (EMPA) analyses
Pyroxene Amphibole
STEM EMPA STEM EMPA
Si 1.8 1.88 5.9 6.42 A1 ~v 0.2 . 0.12 2.1 t.59 A1 vl 0.0 0.04 0.8 0.81 Ti 02 0.03 0.1 0.i1 Cr 0.0 nd 0. I nd Fe 2 v 0.3 0.26 1.9 1.84 Mn 0.0 020 0.0 0.0I Mg 0.6 0,66 2.I 2.22 Ca 1.0 0,94 1.9 2.0t Na ~ (0. I) 0.07 (0,7) 0.66 K 0.o 0.00 0.0 0.o0
STEM values for Na are those from EMPA; see text
nd =not determined
Na, which eotfld not be reliably measured by the STEM, we obtain the formulae (Nao.lCal.oMgo.6Feo.3)(Sit.sAlo.z)Os.~ for the augite and Na0.vCal,9(Mgz.,F%.gTio.lCro.,Alo.s)(Sis.gAl2,1)Ozl.~(OH)2 for the pargasite. The oxygen is calculated to balance charge with Fe z+ only and, in the amphibole, assuming two hydroxyls since F and CI were not determined by either technique, The STEM analyses are probably not of high enough accm'acy to permit the ratio Fe 2+ :Fe 3+ to be estimated. However if we require the stoichiometric number of oxygen for each phase by allowing the requisite ferric iron, the formulae (Na0.1Cal.oMgo.6Fe3+0.3)(Sil.aA10,2)O 6 and Nao.vCal.9- (Mg2aFe ~ +~.4Fe a +0.sTio.lCro.~A10.s)(Sis.gA12.i)O22(OH)2 cart be ob- tained.
Discussion
Papike et al. (t969) suggested four possible mechanisms for the formation of fine intergrmvths of amphibole in pyroxene: late- stage alteration of pyroxene, formation of pyroxene from an amphibole precursor, primary epitaxial intergrowth of the two materials, and exsolution of amphibole from a pyroxene host. Additionally, it may be possible for an originally homogenous pyroxene to exsolve to two coexisting lamellar pyroxenes with the subsequent selective replacement by amphibole of one of the sets of lamellae, as observed by Nakjima and Ribbe (1980) for {100} lamellae of orthopyroxene. Presumably it is also possi- ble to produce such an intergrowth by a process involving both exsolntion of and alteration to amphibole by pyroxene.
There is strong textural evidence in the Lake Chatuge pyrox- enes we examined for the replacement of pyroxene by" amphibole. Especially marked is the gradation of the amphibole lamellae into grains rimming the pyroxene observed to be of approximate- ly the same composition. That the amphibole could have prefer- entially replaced one set of a pair of previously exsolved and intergrown pyroxenes is unlikely since {010} exsolution has not been reported for pyroxene lamellae in a pyroxene host. The microprobe analyses obtained by integrating the intergrowths are consistent with the conclusion that the precursor may have been a pyroxene but was probably not an amphibole. This is supported by the microprobe data in which the average of the three reintegrations are recast both as pyroxene and as an amphi- bole. The resulting normalizations yield a reasonable pyroxene formula (Table 2, No. 12) especially if some iron can be recast as Fe 3+ but do not produce a reasonable amphibole formula since calcium exceeds the amount allowable in the M4 site
119
(Table 2, No. 13). However, these recalculated pyroxene formu- lae do not include the O> H2 and F,, presumably required to form amphibole. The possibility that the grains are the result of a primary intergrowth of two phases is unlikely because of the textural relationships, the microprobe data suggesting that the precursor was a pyroxene, and the demonstration that the rimming am.Naibole, which is clearly a secondary feature, is of a similar composition as the lamellar amphibole. We therefore favor a mechanism by which the pyroxene has been altered to amphibole in a Iamellar fashion as being the most Iikely mode of genesis, allowing the possibility of a concurrent period of exsolutiom
Nakajima and Ribbe (1980) also observed {010} intergrowths of amphibole which they interpreted to be a :replacement of augite, However, they observe a volume ratio of pyroxene to amphibole much greater than the approximate 1 : 1 ratio between the two phases seen in this study, and their amphibole lamellae range downward in size from about 1,000 It in width. The amphi- bole lamellae described by Smith (1977), while oriented parallel to {010} of the host, are one to two orders of magnitude smaller than those we observe; Smith interprets the intcrgrowths which he reports to be an exsotution feature. Desnoyers (1975) inter- preted the {I00} Iamellae of amphibole in orthopyroxene which he observed to be the result of exsolution, and Yama~machi et al. (1978) also suggest that exsotution of amphibole from pyroxene is the most likely formation mechanism for the complex inter- growth they observed. However, Yamaguchi et al. (t978) also note that tiny discrete amphiboles occur at the grain boundaries of the primary pyroxene crystals as alteration or reaction prod- ucts, sometimes penetrating into the pyroxene and filling the interstices of {100} partings, a feature very similar to the texture observed in the Lake Chatuge pyroxenes.
Ackno~,ledgemems. We wish to thank Drs W.C. Bigelow and L.F. Altard of The University of Michigan Electron Microbeam Analyds Laboratory for their assistance and valuable discussions. This work was supported in part by" a University of Michigan Scott Turner Award in Earth Science to AMI and by NationaI Science Foundation Grant EAR 78-..22758 to DRP.
References
Blake DF, Atlard LF, Peacor DR, Bigelow WC (1980) "Ultra-clean" X-ray spectra in the JEOL JEM-100CX. Proc 38th .Ann Mtg Elec- tron Microsc Soc Am, pp 136-137
Cliff G, Lorimer GW (I972) The quantitative anatysis of thin metal foils using EMMA-4 - the ratio technique. Proc 5th Eur Con~ Electron Microsc. Inst Physics, London, pp 140.-.I41
Chliff G, Lorimer GW (1975) The quantitative analysis of thin speci- mens. J Microse I03:203-207
Dallmeyer RD (I974) Eclogite inclusions in m~ alpine peridotite sflI, Georgia-North Carolina: their chemistry and petrogenetic evolu- tion. Am J Sci 274:356 377
Desnoyers C (1975) Exsolution d'amphibole, de grenat et de spindle dans les pyrox~nes de roches ultrabasiques: p&idotite et pyrox~no- lites. Bull Soe Fr Mineral Crystallogr 98:65-77
Goldstein JJ, Costley JL, Lorimer GW, Reed SJB (1977) Quantitative X-ray analysis in the electron microscope. Proe Workshop Analyt Electron Microsc 1. Chicago, SEM, pp 315-323
Harttey ME III (1973) Ultrammqc and related rocks in the vicinity of Lake Chatuge. Ga Dept Nat Res Bull 85:1--61
Lorimer GW, Champness PE (t973) Combined electron microscopy and analysis of an orthopyroxene. Am Mineral 58:243-248
Lorimer GW, Cliff G, Clark JN (1976) Determination of the thickness and spatial resolution for the quantitative analysis of thin foils. In: Developments in Electron Microscopy and AnaIysis. Proc Elec-

120
tron Microsc Analyt Group 75. Academic, Bristol London, pp 153- t56
Nakajima Y, Hafner SS (1980) Exsolution in augite from the Skaer- gaard intrusion. Contrib Mineral Petrol 72:101-110
NakaJima Y, Ribbe PH (1980) Alteration of pyroxenes from Hokkai- do, Japan to amphiboles, clays, and other biopyriboles. Neues Jahrb Mineral 6 : 258-268
Papike JJ, Ross M, Clark JR (1969) Crystal chemical characterization of amphiboles based on five new structure determinations. Mineral Soc Am, Spec Pap 2:117-136
Rucklidge JC, Gasparrini EL (1969) Specifications of a complete pro- gram for processing electron microprobe data: EMPADR VII. Dept Geol, Univ Toronto
Smith PPK (1977) An electron microscopic study of amphibole tamel- lae in augite. Contrib Mineral Petrol 59: 317-322
Veblen DR, Buseck PR (1977) Petrologic implications of hydrous biopyriboles intergrown with igneous pyroxene. Trans Am Geophys Union (EOS) 58:1242
Veblen DR, Busek PR (1980) Microstructures and reaction mecha- nisms in biopyriboles. Am Mineral 65:599-623
Ymaguchi Y, Akai J, Tomity K (1978) Clinoamphibole lamellae in diopside of garnet lherzolite from Alpe Arami, Bellinzona, Switzer- land. Contrib Mineral Petrol 66:263570
Accepted June 2, 1981