Embed Size (px)
Citation preview
Contributions of EPP-NOx and Solar UV Radiation toInterannual O3 Variations in the Polar Stratosphere
Lon Hood
Lunar and Planetary Laboratory, University of Arizona, Tucson, Arizona, USA
Acknowledgments: Boris Soukharev, Ellis Remsberg, Cora Randall, Charles Jackman
HEPPA09 MeetingBoulder, Colorado October 8, 2009
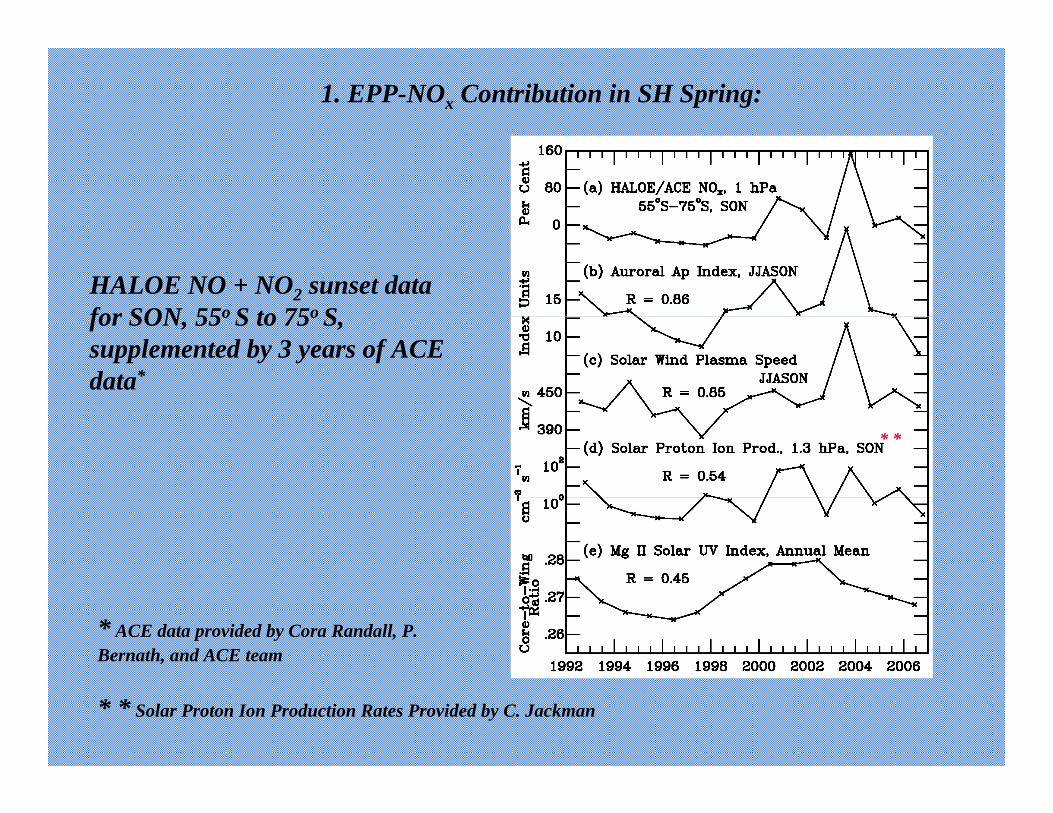
HALOE NO + NO2 sunset data for SON, 55o S to 75o S, supplemented by 3 years of ACE data*
1. EPP-NOx Contribution in SH Spring:
* *
* ACE data provided by Cora Randall, P. Bernath, and ACE team
* * Solar Proton Ion Production Rates Provided by C. Jackman
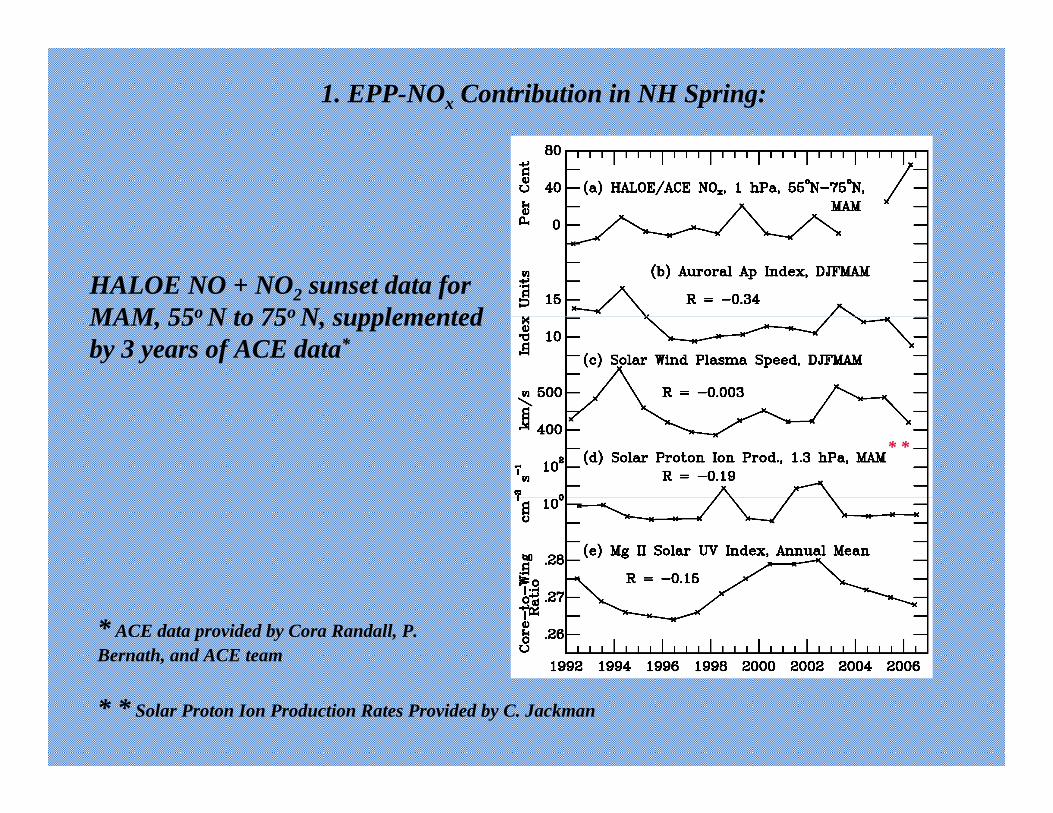
HALOE NO + NO2 sunset data for MAM, 55o N to 75o N, supplemented by 3 years of ACE data*
1. EPP-NOx Contribution in NH Spring:
* *
* ACE data provided by Cora Randall, P. Bernath, and ACE team
* * Solar Proton Ion Production Rates Provided by C. Jackman
* *
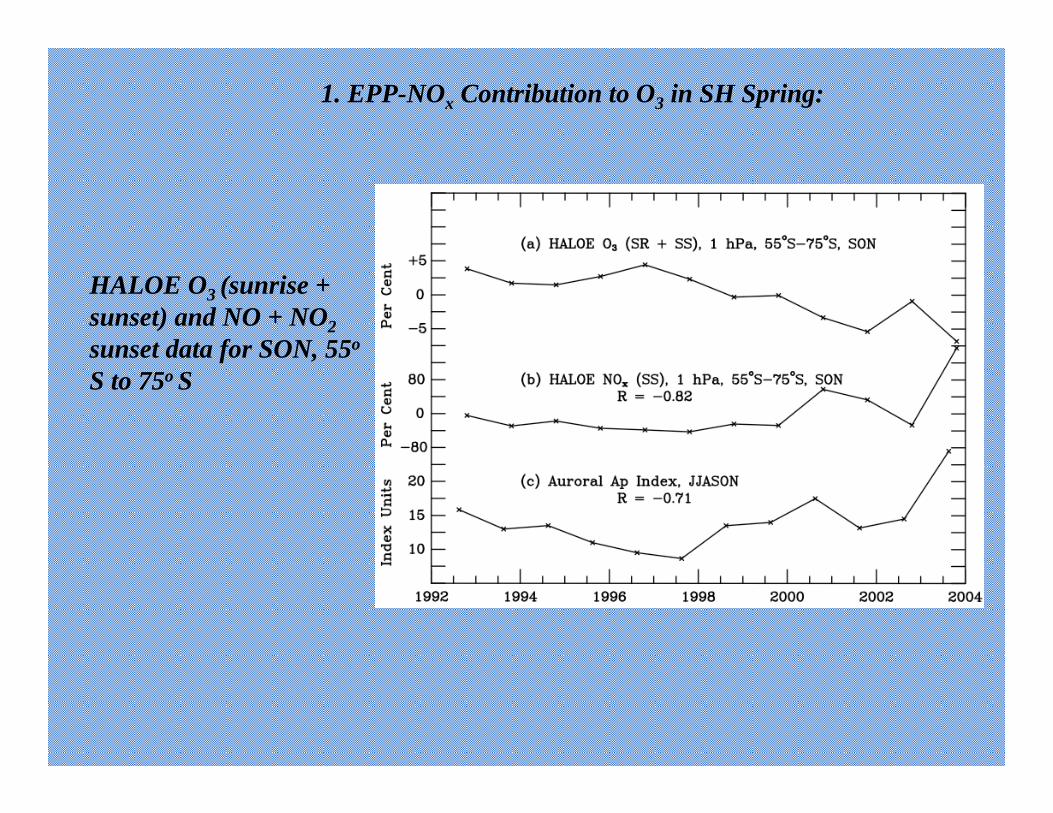
HALOE O3 (sunrise + sunset) and NO + NO2sunset data for SON, 55o
S to 75o S
1. EPP-NOx Contribution to O3 in SH Spring:
* ** *
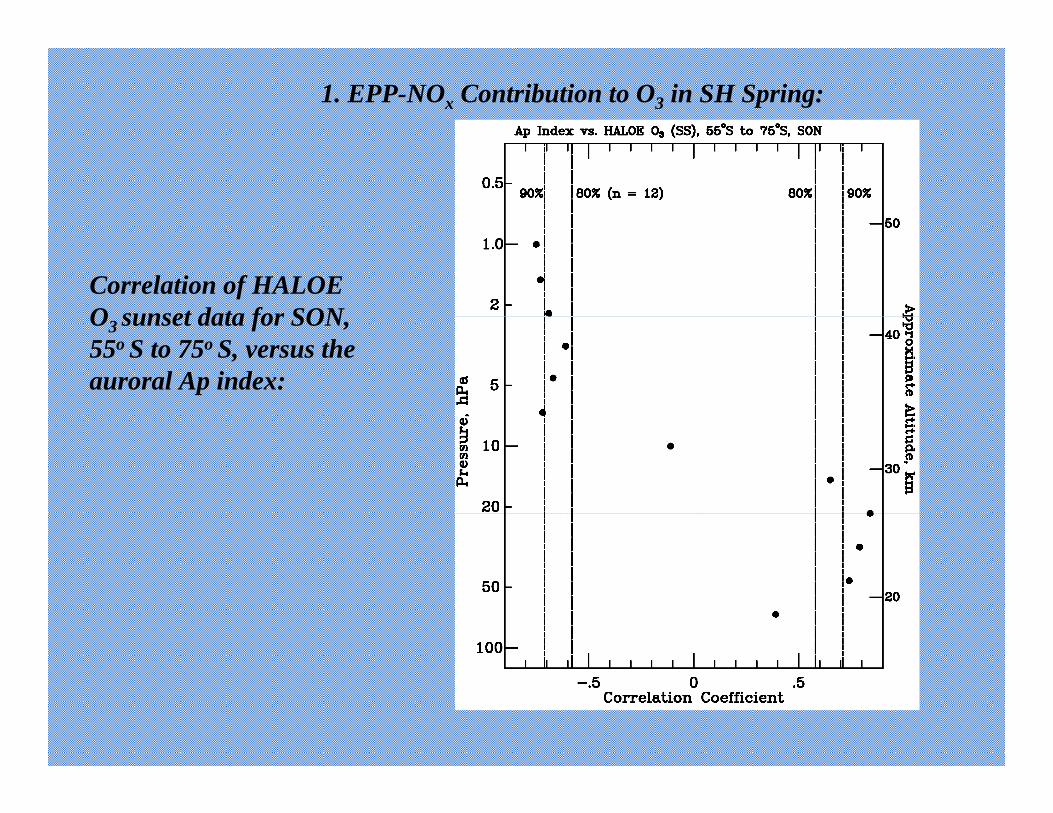
Correlation of HALOE O3 sunset data for SON, 55o S to 75o S, versus theauroral Ap index:
1. EPP-NOx Contribution to O3 in SH Spring:
* ** *
Correlation of HALOE O3 sunset data for SON, 55o S to 75o S, versus theauroral Ap index:
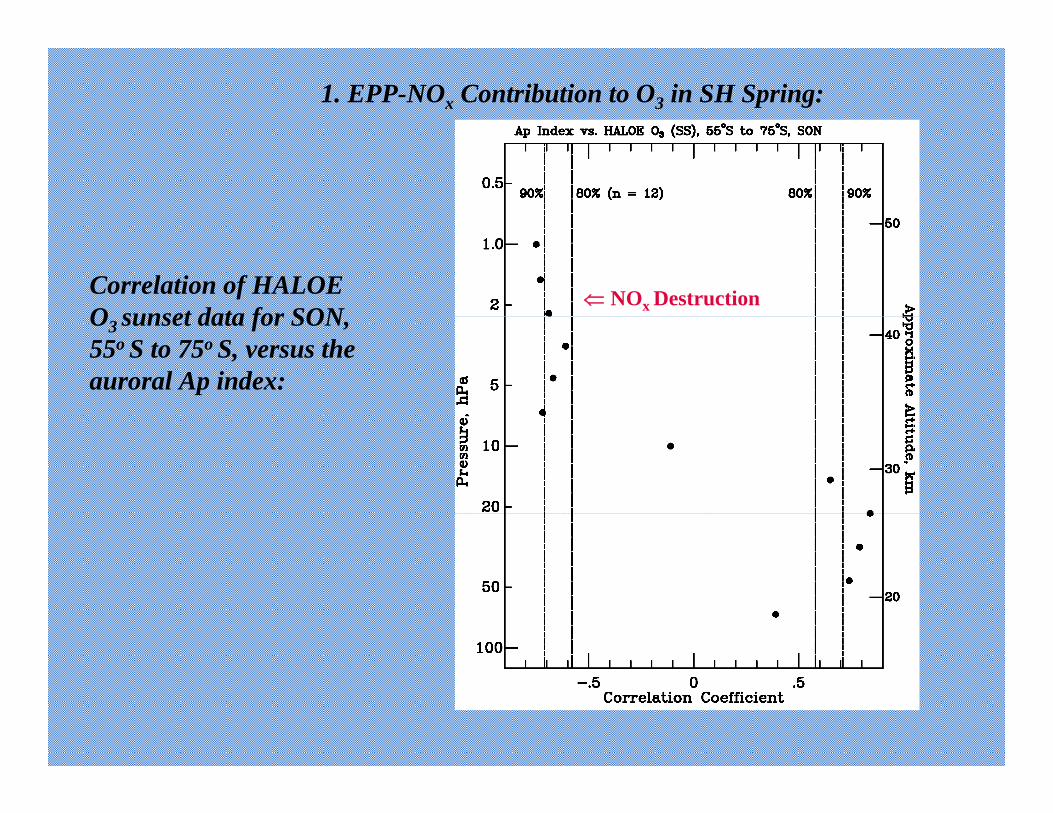
1. EPP-NOx Contribution to O3 in SH Spring:
* ** *
⇐ NOx Destruction
Correlation of HALOE O3 sunset data for SON, 55o S to 75o S, versus theauroral Ap index:
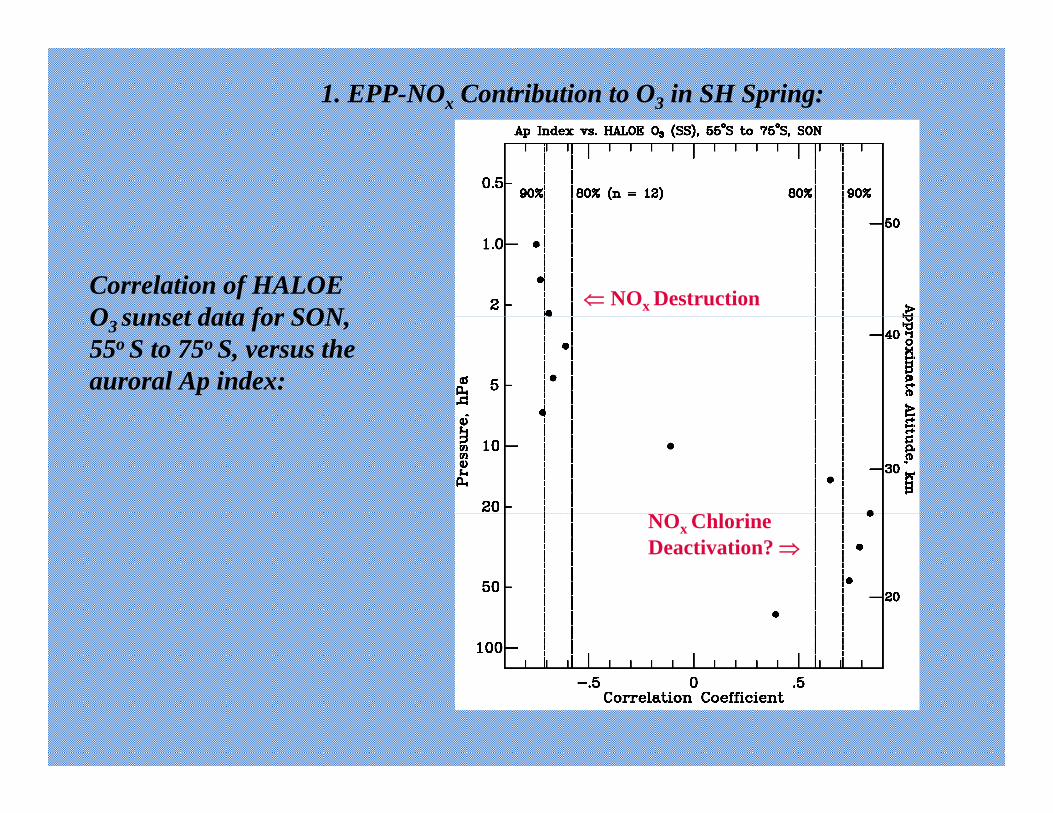
1. EPP-NOx Contribution to O3 in SH Spring:
* ** *
⇐ NOx Destruction
NOx Chlorine Deactivation? ⇒
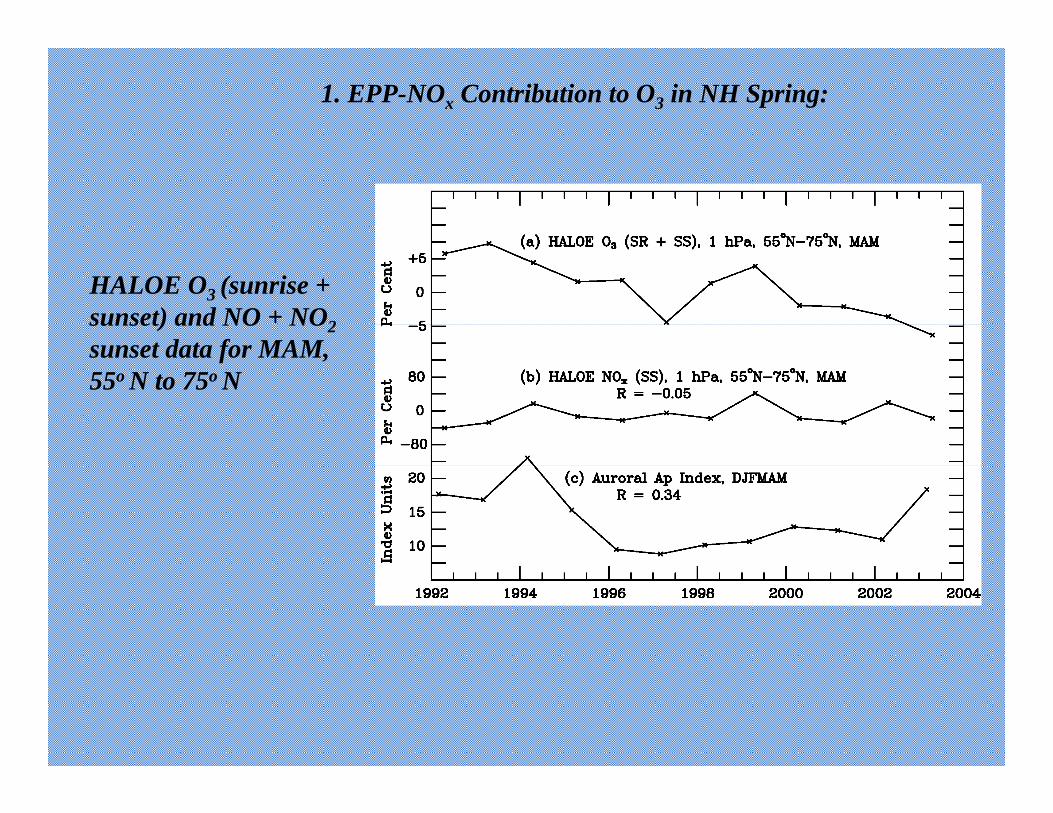
HALOE O3 (sunrise + sunset) and NO + NO2sunset data for MAM, 55o N to 75o N
1. EPP-NOx Contribution to O3 in NH Spring:
* ** *
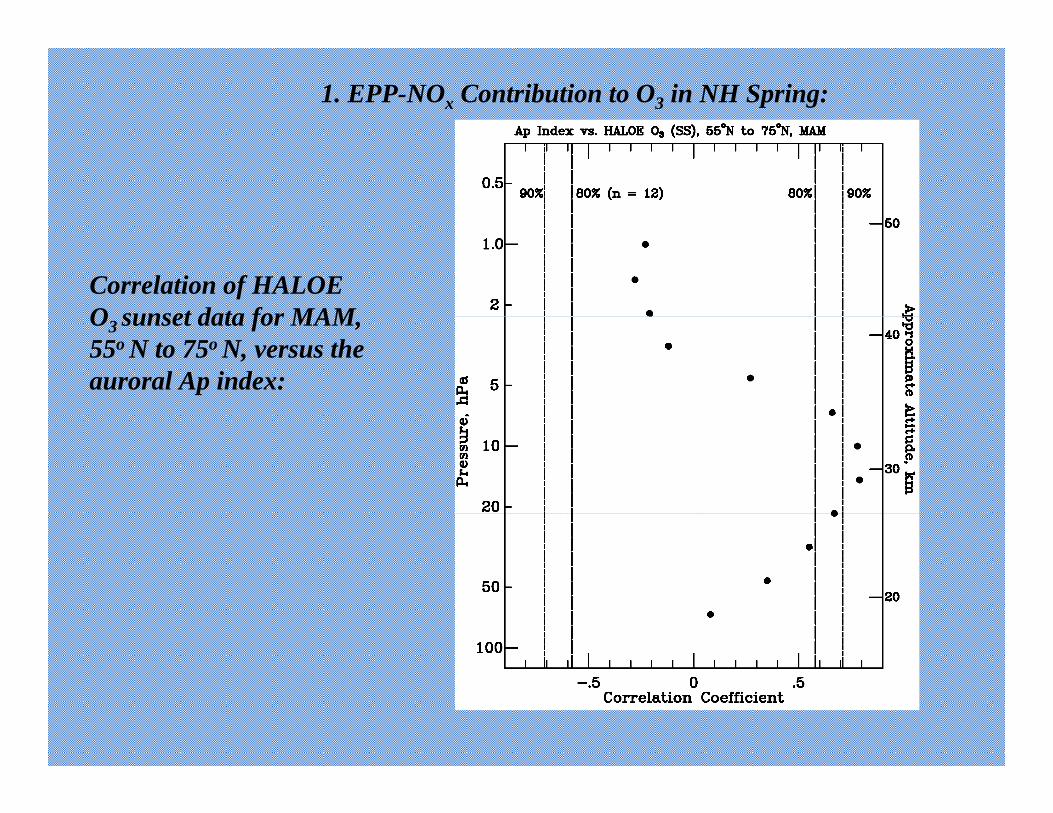
Correlation of HALOE O3 sunset data for MAM, 55o N to 75o N, versus theauroral Ap index:
1. EPP-NOx Contribution to O3 in NH Spring:
* ** *
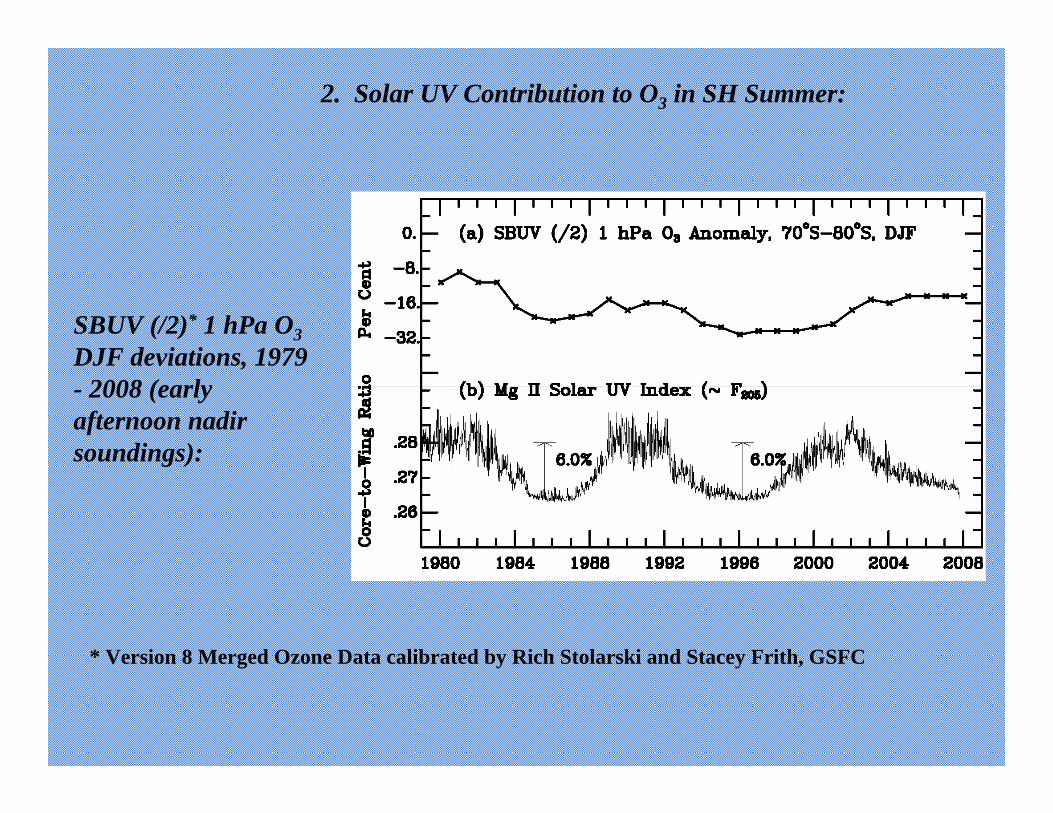
SBUV (/2)* 1 hPa O3DJF deviations, 1979 - 2008 (early afternoon nadir soundings):
2. Solar UV Contribution to O3 in SH Summer:
* ** *
* Version 8 Merged Ozone Data calibrated by Rich Stolarski and Stacey Frith, GSFC
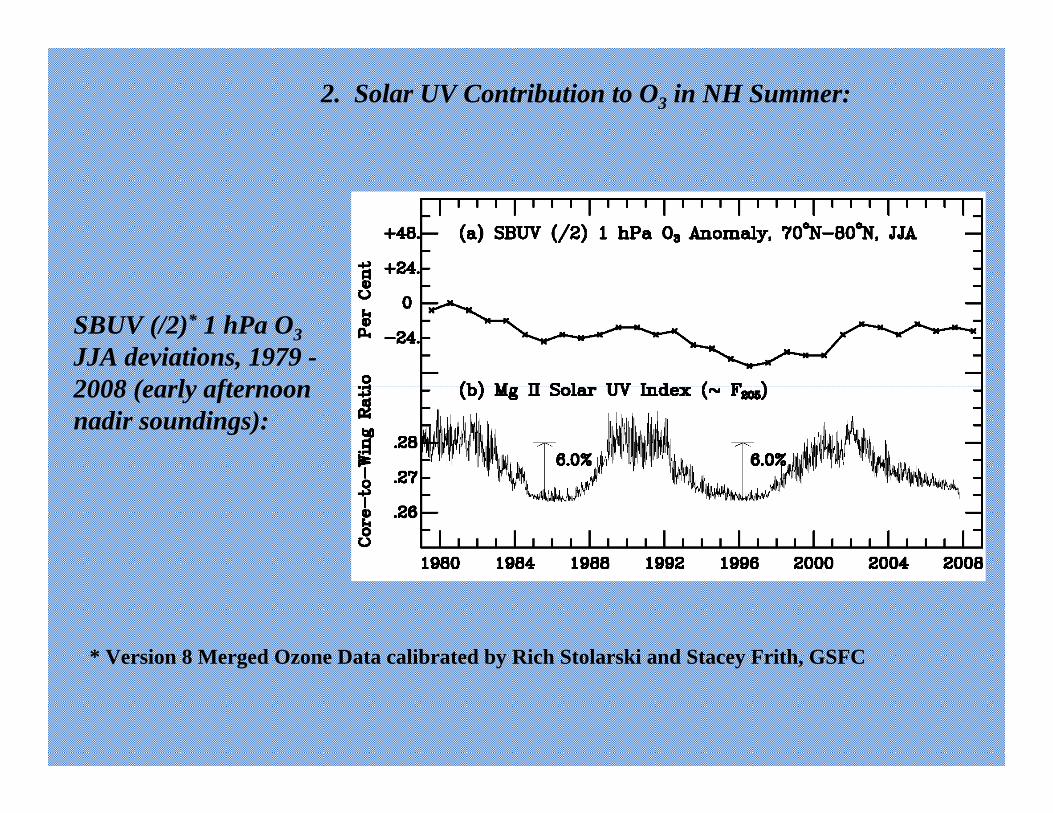
SBUV (/2)* 1 hPa O3JJA deviations, 1979 -2008 (early afternoonnadir soundings):
2. Solar UV Contribution to O3 in NH Summer:
* ** *
* Version 8 Merged Ozone Data calibrated by Rich Stolarski and Stacey Frith, GSFC
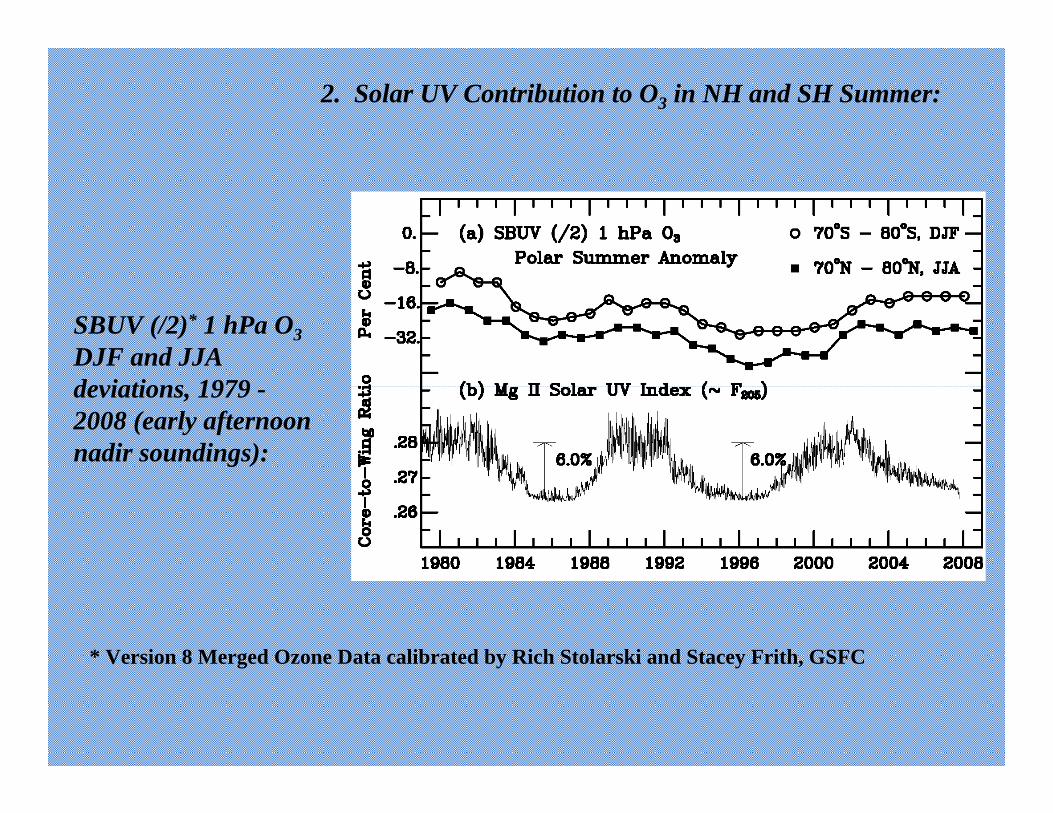
SBUV (/2)* 1 hPa O3DJF and JJA deviations, 1979 -2008 (early afternoonnadir soundings):
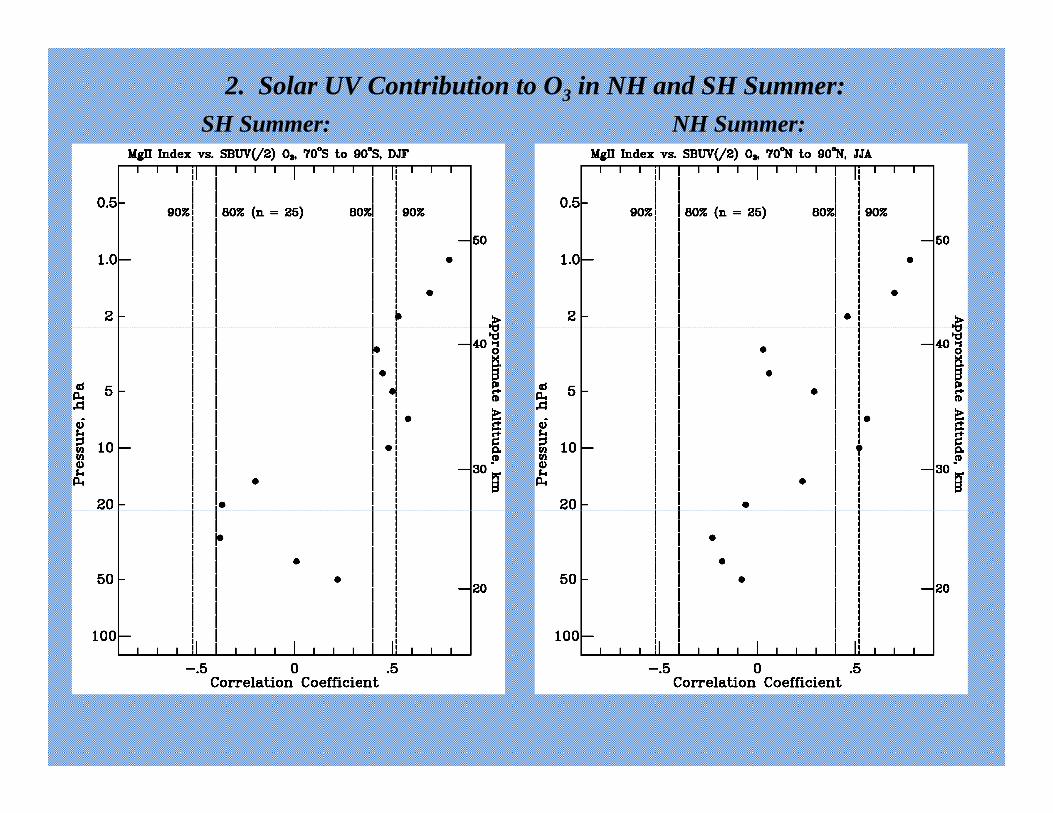
2. Solar UV Contribution to O3 in NH and SH Summer:
* ** *
* Version 8 Merged Ozone Data calibrated by Rich Stolarski and Stacey Frith, GSFC
2. Solar UV Contribution to O3 in NH and SH Summer:SH Summer: NH Summer:
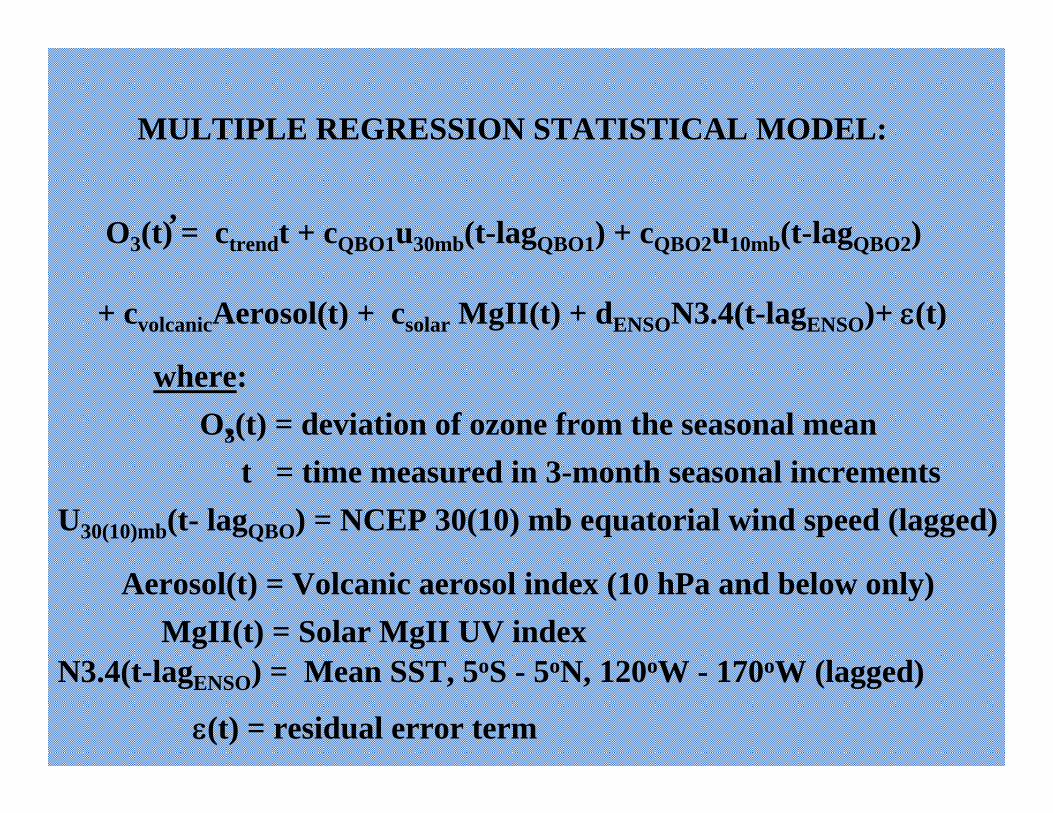
MULTIPLE REGRESSION STATISTICAL MODEL:
O3(t) = ctrendt + cQBO1u30mb(t-lagQBO1) + cQBO2u10mb(t-lagQBO2)
+ cvolcanicAerosol(t) + csolar MgII(t) + dENSON3.4(t-lagENSO)+ ε(t)
,
where:
t = time measured in 3-month seasonal incrementsO3(t) = deviation of ozone from the seasonal mean,
U30(10)mb(t- lagQBO) = NCEP 30(10) mb equatorial wind speed (lagged)
Aerosol(t) = Volcanic aerosol index (10 hPa and below only)MgII(t) = Solar MgII UV index
ε(t) = residual error term
N3.4(t-lagENSO) = Mean SST, 5oS - 5oN, 120oW - 170oW (lagged)
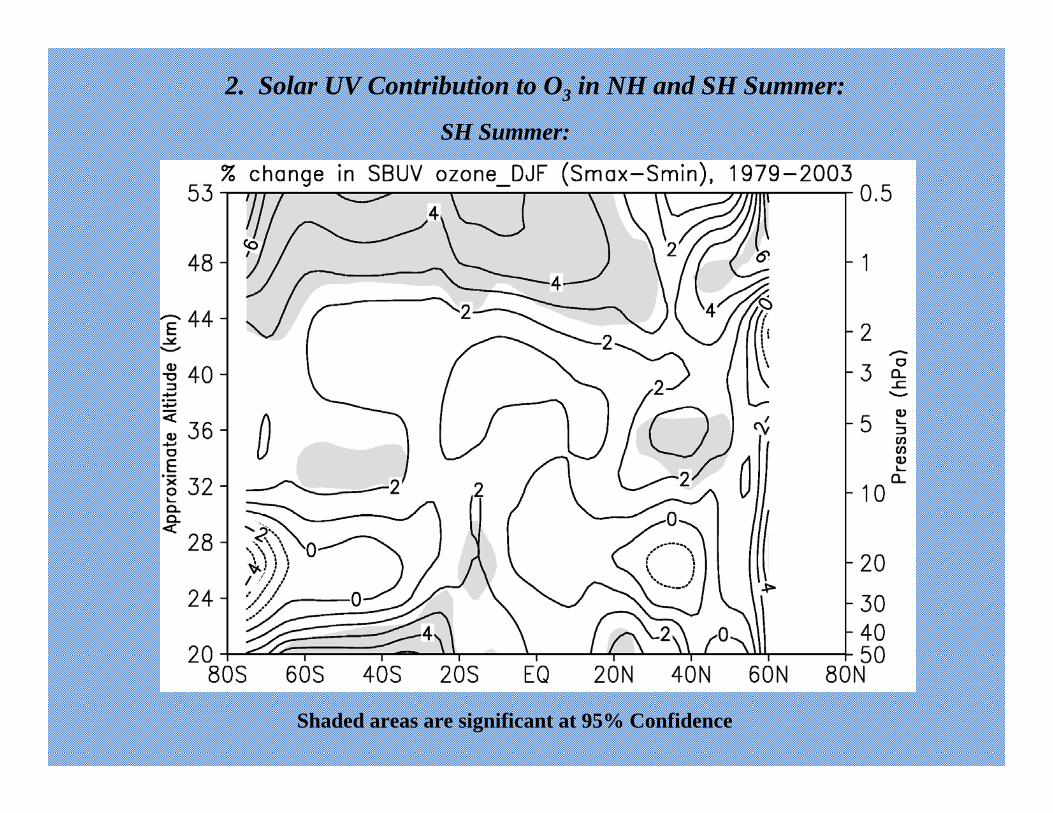
2. Solar UV Contribution to O3 in NH and SH Summer:
SH Summer:
Shaded areas are significant at 95% Confidence
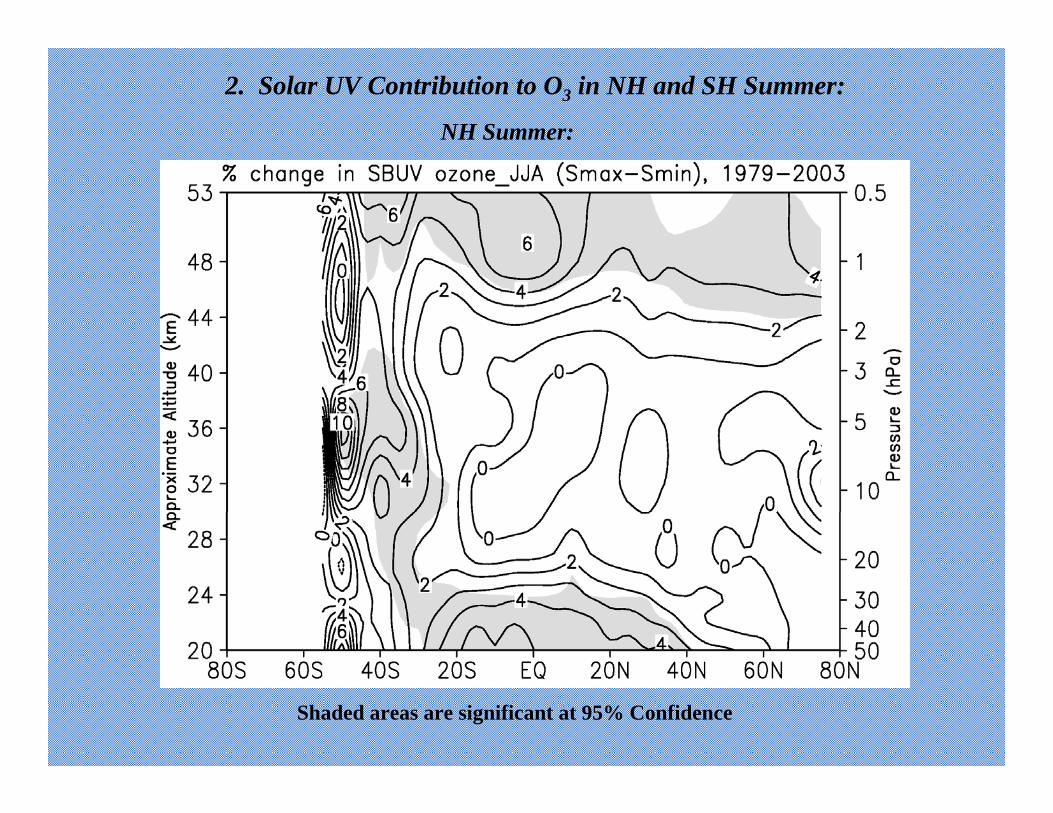
2. Solar UV Contribution to O3 in NH and SH Summer:
NH Summer:
Shaded areas are significant at 95% Confidence
1. In the SH in spring, HALOE sunset interannual O3 anomalies at polar
CONCLUSIONS
2. In both hemispheres in summer, SBUV (/2) O3 anomalies at polar latitudesin the uppermost stratosphere (1 - 2 hPa) correlate positively with the Mg II solar UV index over a 30-year period. A nearly significant positive correlation also occurs in the middle stratosphere (~ 7 hPa). The positive correlation in the uppermost stratosphere in summer is attributable to increased ozone production through O2 photolysis. Multiple regression statistical analyses confirm these correlative results.
latitudes are significantly negatively correlated with the auroral Ap index in the upper stratosphere but are significantly positivelycorrelated with Ap in the lower stratosphere. The upper stratospheric correlation is attributable to EPP-NOx chemical destruction while the lower stratospheric correlation may reflect EPP-NOx deactivation of chlorine in the ozone hole, which would reduce the O3 loss rate there.