Embed Size (px)
Citation preview
Report EUR 25856 EN
2 0 1 3
Koen Dillen, Emanuele Ferrari, Pascal Tillie, George Philippidis and Sophie Helaine
Contribution to the economic impact assessment of policy options to regulate animal cloning for food production with an economic simulation model
European Commission
Joint Research Centre
Institute for Prospective Technological Studies
Contact information
Address: Edificio Expo. c/ Inca Garcilaso, 3. E-41092 Seville (Spain)
E-mail: [email protected]
Tel.: +34 954488318
Fax: +34 954488300
http://ipts.jrc.ec.europa.eu
http://www.jrc.ec.europa.eu
Legal Notice
Neither the European Commission nor any person acting on behalf of the Commission
is responsible for the use which might be made of this publication.
Europe Direct is a service to help you find answers to your questions about the European Union
Freephone number (*): 00 800 6 7 8 9 10 11
(*) Certain mobile telephone operators do not allow access to 00 800 numbers or these calls may be billed.
A great deal of additional information on the European Union is available on the Internet.
It can be accessed through the Europa server http://europa.eu/.
JRC79995
EUR 25856 EN
ISBN 978-92-79-28941-5 (pdf)
ISSN 1831-9424 (online)
doi:10.2791/84519
Luxembourg: Publications Office of the European Union, 2013
© European Union, 2013
Reproduction is authorised provided the source is acknowledged.
Printed in Spain
JRC SCIENTIFIC AND POLICY REPORTS
Contribution to the economic impact assessment of policy options to regulate animal cloning for food production with an economic simulation model Koen Dillen, Emanuele Ferrari, Pascal Tillie, George Philippidis and Sophie Helaine 2013 EUR 25856 EN
Joint Research Centre

3
Contents Executive Summary ...................................................................................... 7
1. Introduction ......................................................................................... 9
2. Modelling approach ...........................................................................11
2.1. Economic simulation models ....................................................................11
2.2. GLOBE .....................................................................................................11
2.3. Alternative approaches for an extended impact assessment .....................13
3. Background information and data .................................................15
3.1. Production and trade statistics .................................................................15
3.1.1. Beef meat..................................................................................................15
3.1.2. Sheep and goat meat ..................................................................................16
3.1.3. Milk and dairy products ...............................................................................16
3.2. State of play regarding the use of cloning worldwide (EU partners) .........17
3.3. Policy options discussed in the EU ............................................................17
4. Preparatory work for modelling .....................................................21
4.1. Specifying the "closure rules" ...................................................................21
4.2. Construction of the baseline .....................................................................21
5. The policy options and their specifications in the model ........23
5.1. Baseline ...................................................................................................23
5.2. Scenario 1 – Cloning is allowed ................................................................23
5.3. Scenario 2................................................................................................23
5.4. Scenario 3 – Cloning forbidden in the EU .................................................23
5.5. Scenario 4 – Cloning forbidden in the EU and traceability for imports ......24
5.6. Scenario 5 – EU Import ban .....................................................................25
6. GLOBE simulation results ................................................................27
6.1. Imports ....................................................................................................27
4
6.2. Production changes ..................................................................................30
6.3. Exports from the EU .................................................................................34
6.4. The EU Domestic Market ..........................................................................34
7. How to interpret modelling results ...............................................37
8. Conclusions..........................................................................................39
9. References ...........................................................................................41
10. Annexes: Model specification and details of scenarios ............43
5
Abbreviations and Acronyms
ACP African Caribbean and Pacific
Bn billion
CAP Common Agricultural Policy
CAPRI Common Agricultural Policy Regionalized Impacts
CES constant elasticity of substitution
CET constant elasticity of transformation
CGE computable general equilibrium
EC European Commission
EFSA European Food Safety Authority
EP European Parliament
EU European Union
EU27 EU defined by its membership since 2007 (EU15 + EU12) and before the
accession of Croatia on July 1st, 2013
EFSA European Food Safety Authority
GAMS General Algebraic Modelling System (software package)
GTAP Global Trade Analysis Project
ha hectare
LDC least developed country
mn million
NPV Net Present Value
NUTS 2 Nomenclature of Territorial Units for Statistics (nomenclature d'unités
territoriales statistiques), Level 2
PE partial equilibrium
RoW ‘Rest of the World’
SAM social accounting matrix
Tec tons equivalent carcass
TFP total factor productivity
TRQ tariff rate quota
US United States of America
VA Value Added
WTO World Trade Organisation

E x e c u t i v e S u m m a r y
7
Executive Summary The European Commission is currently conducting an Impact Assessment process to evaluate
different policy options towards the use of the cloning technique for animal reproduction and the
incorporation of products derived from cloned animals in the food chain of the European Union. In
the context of this Impact Assessment, the JRC was requested to simulate via a modelling exercise
the economic impacts of selected policy options that could result in de facto trade disruptions. This
study presents a first attempt to quantify the likely effects of different policy measures for animal
cloning for food production on the international trade and the EU domestic markets particularly on
production and prices.
In the crops and livestock sector, the potential of animal cloning consists of securing the spread of
desired genetic characteristics compared to traditional breeding techniques. This translates into
increased productivity over time. Most studies available in the literature focus on the dairy sector
as the commercial potential for cloning is considered to be high for this activity. The present study
therefore focuses on specific simulations for cattle and milk production and the corresponding
downstream sectors, beef and dairy.
Based on a literature review and after considering the specific objectives of this study, the choice
was made to perform the analysis employing a Computable General Equilibrium (CGE) model called
GLOBE. Different model scenarios were constructed based on combinations of the discussed policy
options such as a ban, or traceability and labelling requirements with associated productivity
increases arising from the use of the cloning technique.
The first scenario (scenario 1 of the present study), assumes that all countries will adopt cloning
and no restrictions to trade exist. The results show that the impact of cloning on productivity, both
inside and outside of the EU, is limited. Cloning increases productivity and hence ameliorates the
competitive position of those sectors having access to the technology, leading to a slight increase
in domestic production. However, as all countries are assumed to gain from cloning, the trade
effects are small.
A further scenario (scenario 3 of the present study1) assumes that the EU prohibits the use of
cloning but not the imports of derived products, while some of its trade partners use the cloning
technique. We assume that the US, Argentina, Brazil and New Zealand adopt the technology as
they signed a joint statement on the topic. Under the assumptions of this scenario, no trade
restrictions exist and the difference lies in the productivity increase associated to the use of cloning
in some countries although not in the EU. The results show that in this case the EU would import
marginally more cattle, beef and dairy, but the effects on prices and domestic production would be
negligible as imports represent only a small part of the EU domestic use.
In a following scenario (scenario 4 of the present study), traceability and labelling are added as a
requirement for imports from countries using the cloning technology. This requirement leads to a
slight reduction in imports, as the increased costs of the traceability system offset the benefits
from the technology. Again the changes are too small to lead to any significant production or price
effects in the EU’s domestic market.
Finally, a last scenario (scenario 5 of the present study) is built on the assumption that imports of
cattle, beef, milk and dairy products from countries using the animal cloning technique come to a
halt due to express prohibitions or a de facto decision by exporters. In this scenario the effects are
more pronounced. A first direct effect is a shift in the sources of imports into the EU. If imports
1 Scenario 2 corresponds to a policy option that is not modelled in this report. It is a combination of scenarios 1 and 3 and therefore its results would have been similar to those of both scenarios.
8
from Brazil, US, Argentina and New Zealand are suspended, Canada and Australia would increase
their exports to the EU, responding to its demand. The substitution effect is, however, not
complete. The total reduction in imports would be significant with a 50%-drop in the imports of
cattle and beef compared to the baseline and a 20% decrease in dairy imports. This reduced
availability of imports for the EU would lead to an increase in import prices. For cattle and beef,
import prices would rise by approximately 10% while the price increase for dairy would be much
smaller (about 1%).
The reduction in imports under this last scenario would be partly compensated by increased EU
domestic production. Cattle production is expected to grow by about 4% while the beef sector
would grow by slightly more with 6%. These changes are small as the share of imports represents
a relative small part of EU domestic consumption. The value of this expanded domestic production
is however significant as it represents about USD 4.28 billion. The expansion in production is
accompanied by a slight increase in producer prices. A similar chain of events can be expected in
the milk and dairy sector. However, as both the reduction in imports and the share of imports in
total production are smaller, the effects on domestic production are less pronounced.
The production expansion in the EU due to the de facto ban on meat and dairy imports from some
countries has an effect on the upstream sectors. The demand for fodder increases by 4% leading to
a small price increase in other land-based production systems such as cereals and grains.
The changes in production and prices also have a downstream effect. The EU consumers will
experience a price increase as domestic production cannot fully compensate for the loss of imports.
The price effect is most pronounced in the beef sector where it amounts to about 2%. For cattle,
milk and dairy the price effects are much smaller, not surpassing 1%. The price of other meat
products, mainly poultry and pork, increases marginally through a combination of substitution and
price increases in the input markets. All these price effects combined lead to a welfare loss of about
USD 1.7 billion in the case the EU ban (or a de facto interruption) of imports from countries using
the cloning technology.
Finally, this report highlights the need for further specific analysis to understand the impacts in
certain niche markets or to investigate the response of individual countries to the EU's
requirements for traceability and labelling.
I n t r o d u c t i o n
9
1. Introduction In its report of 2010, the European Commission (EC) has proposed the following measures on
animal cloning for food production:
Suspend temporarily the use of the cloning technique in the EU for the reproduction of all
food-producing animals including the use of clones of these animals and import of clones
and marketing of food from clones.
Establish traceability of imports of semen and embryos allowing farmers and industry to set
up data banks of offspring in the EU.
The European Commission is currently carrying out an impact assessment to examine a
comprehensive set of possible measures on animal cloning for food production so that it can
propose legislation.
This JRC report, as a contribution to this impact assessment process, provides insights into the
effects of different policy scenarios on international trade and competitiveness based on an
economic simulation model.
The study focuses on four scenarios:
The assumption that all countries will adopt cloning and no restrictions to trade exist.
The assumption that the EU bans the use of cloning but not the imports of derived
products, while some of the trade partners accept cloning.
The assumption that traceability and labelling are added as a requirement for imports from
countries using the cloning technology.
Finally, the assumption that imports of cattle, beef, milk and dairy products from countries
using cloning come to a halt (due to express prohibitions or a de facto decision by
exporters).

M o d e l l i n g a p p r o a c h
11
2. Modelling approach
2.1. Economic simulation models
Quantitative analysis of policy options make an important contribution to the policy-making process
as is acknowledged in the EU’s Impact Assessment guidelines of the EU. This is particularly the
case in agricultural and rural development policies, as well as related topics such as trade, energy,
environment, and climate change.
Economic simulation is one of the tools to perform these quantitative analyses. Economic
simulation models depict the interrelationships between selected economic variables and, as such,
provide a simplified but clearly structured and quantified representation of economic reality that
can be used ex ante to analyse the impacts of policy changes. Such models are widely applied in
the analysis of the agricultural sector as provider of food, feed, fibre and now, increasingly, energy,
but also of its role in the rural economy and of the environmental effects linked to agricultural
production. Ex post analysis of policies typically demands an evidence-based assessment, and
therefore stylised economic simulation models like those described in this document are less
commonly used.
The integrated Modelling Platform for Agro-economic Commodity and Policy Analysis (iMAP) is
hosted by the European Commission's Joint Research Centre, Institute for Prospective
Technological Studies in Seville. iMAP was created to provide a scientific basis for policy decision-
making addressing a broad range of topics linked to the economic assessment of the Common
Agricultural Policy (CAP) and related topics such as trade, energy, environment, and climate
change (Mbarek et al., 2012). The platform contains selected partial equilibrium and general
equilibrium models used in stand-alone mode or in combination. Following the results from the
literature review a CGE model was chosen. The GLOBE model was chosen as the appropriate tool
for this explorative study because of its coverage of different sectors and the possibility to obtain
results in a limited timeframe.
2.2. GLOBE
GLOBE (McDonald et al., undated) is a member of the family of Computable General Equilibrium
models. A computable general equilibrium (CGE) model is a system of nonlinear simultaneous
equations representing the constrained optimising behaviour of all agents within the economy as
producers, consumers, factor suppliers, exporters, importers, taxpayers, savers, investors, or
government. This means that it depicts the production, consumption, intra-sectorial input and
trade of all economies for one country, a region or even all countries worldwide.
GLOBE is a Social Accounting Matrix (SAM)-based CGE model calibrated with data from the Global
Trade Analysis Project’s (GTAP) database version 8 (Aguiar et al., 2012)2. GLOBE incorporates
various developments in CGE modelling over the last two decades. The model owes a particular
debt to the IFPRI standard model (Löfgren et al., 2002) and the PROVIDE Project model
(McDonald, 2003), as well as to the GTAP model (Hertel, 1997). The model is written and solved
using the General Algebraic Modeling System (GAMS) software.
GLOBE consists of a set of single country CGE models linked by their trading relationships. Price
systems are linearly homogeneous and thus only changes in relative prices matter. Consequently
each region in the model has its own numéraire price, typically the consumer price index (CPI) and
2 For the underlying principles of GLOBE, see de Melo and Robinson (1989) and Devarajan et al. (1990); for earlier models that can be described as its antecedents, see Robinson et al. (1990, 1993).
12
a nominal exchange rate, while the model as a whole requires a numéraire, which is an exchange
rate index for certain reference regions3. In this implementation of GLOBE, the reference region is
the US.
The SAM on which GLOBE is based disaggregates each region’s economy according to seven
families of ‘accounts’: commodities, activities, production factors, margins, taxes, institutions and
capital investment. The neoclassical behavioural relationships are standard for global a CGE model.
Activities maximise profits using technology characterised by Constant Elasticity of Substitution
(CES) production functions over primary inputs (skilled and unskilled labour, capital, land and
natural resources) and Leontief production functions across intermediate inputs (no substitution
allowed among intermediate inputs). The household maximises a Stone-Geary utility function
(which assumes a linear expenditure system after payment of income tax and after saving a share
of post-tax income). The Armington (1969) assumption is used for trade, which implies that
domestic and imported commodities are not homogenous goods, in other words imported goods
form different regions are imperfect substitutes of each other and of domestic production. Domestic
output is distributed between the domestic market and exports according to a two-stage Constant
Elasticity of Transformation (CET) function. In the first stage, domestic producers allocate their
output between the domestic and export markets according to the relative prices for the
commodity on the domestic market and the composite export commodity (which is a CET
aggregate of the exports to different regions). The distribution of the exports between regions is
determined by the relative export prices to those regions. Hence domestic producers respond to
prices in all markets for the product. The elasticities of transformation are commodity- and region-
specific4. The typical assumption related to substitution elasiticites is that the elasticities in the
second stage are double those in the first stage. Domestic demand is satisfied by composite
commodities that are constructed by means of a three-stage CES function from domestic
production sold domestically and composite imports. All commodity and activity taxes are
expressed as ad valorem tax rates, while income taxes depend on household incomes (see
Appendix Table A1.3 for a summary of these behavioural relationships in GLOBE).
For the purpose of this study, GLOBE distinguishes 15 product categories across the whole
economy (see Annex Table A 1). All product categories are agricultural or food-related except four:
primary products5, manufacturing, services and ‘trade’6. This limited amount of product categories
makes it impossible to differentiate between cattle, sheep, goat and horses and their respective
meat production or to make the difference between different dairy products. As cattle and beef
meat take the lion’s share of production and trade for most countries, we use the classifiers cattle
and beef in the remainder of the text. The reader should however keep in mind that these
categories of product contain more than just bovine products. Where this aggregation may have an
important effect on the interpretation of the results, the analysis is deepened through the use of
secondary data sources.
The EU is treated as a single region (EU277). In addition, 12 other regions are separately identified
based on their importance for EU trade (see Annex Table A 2). GLOBE also contains an artificial
‘dummy’ area (Globe) that absorbs inter-regional trade flows where either the source or destination
is not identified (for example, some trade and transportation margins and data on remittances).
This construct provides a general method for dealing with any transactions data where full bilateral
information is missing (see McDonald et al., undated).
3 This represents a fundamentally different philosophical approach to global modelling from that of the GTAP model, which does not contain nominal exchange rates and has a single global numéraire. 4 In GTAP, the elasticities are commodity-specific only. When the CET functions across exports are switched off so that export supplies are determined by import demands, the model functions similarly to the GTAP model. 5 Which includes forestry, fishing and mining products. 6 The product category ‘trade’ includes transport costs and other trade services, and margins. 7 By the time this study was initiated, Croatia wasn’t part of the EU yet. Therefore this whole analysis was performed at EU-27 level.
M o d e l l i n g a p p r o a c h
13
The version of GLOBE employed in this report is static, and therefore when used to simulate policy
impacts in a specific future year, it is not necessary to simulate the time-path followed in the
intervening time period. In order to simulate policy outcomes in 2020, the model simply requires
exogenous input about the conditions expected to prevail in that year. GLOBE needs this
information with respect to population and technological change8. In addition, other projections
have to be supplied exogenously in order to construct its baseline (which provides the estimates for
the reference scenario) against which the policy simulations are compared.
Policy shocks are evaluated compared to a baseline for a given year in the future. Given its
assumptions on production factors and on values of elasticities, GLOBE can be defined as medium-
term time frame model. In other words, they represent expected adjustments, for example
redistribution of trade among regions, changes and adaptation of production patterns that are
likely to take around five years. In the short term, the policy options could produce changes in
import and domestic prices and changes in production which are expected to be stronger than in
the medium term. However, certain additional adjustment mechanisms may work in the medium to
long term, which are not fully considered by these models, and might reduce the impacts of a
possible trade ban. For instance, countries using the technique of cloning could expand the
segregated production of non-cloned animals for the European markets. Thus, the impacts
presented in this study might lie between possible higher short-term effects and lower medium- to
long-term effects.
2.3. Alternative approaches for an extended impact assessment
With a different time constraint (results have been requested in two-month timeline), a more
detailed analysis could have been performed with these two alternative approaches:
A first approach could be to use the GLOBE model with a modified database. A revision of the GTAP
database in order to disaggregate the products of interest of this study (e.g. beef-sheep) from
other products could be envisaged. This disaggregation could be even further extended to
differentiate between two beef products, one representing beef coming from cloned animals and
one from "clone free", on the condition that sufficient information on both products is available
(production, trade, etc.) This approach would allow taking into consideration consumer’s preference
towards cloning and modelling segregation between the two markets.
A second alternative approach could be using bilateral trade, agricultural partial equilibrium
models, e.g. CAPRI (Common Agricultural Policy Regionalized Impacts, see Witzke and Britz,
2008). Unlike GLOBE, CAPRI has both a more disaggregated breakdown of agricultural
commodities (e.g. different kinds of meat products) and a more disaggregated spatial coverage
within the EU (results can be displayed at NUTS2 level). This means that specificities of products,
regions and policy features, particularly within the EU, can be captured in more detail.
8 As explained later, in the GLOBE simulation assumptions about technological change are replaced by exogenous assumptions about GDP growth.

B a c k g r o u n d i n f o r m a t i o n a n d d a t a
15
3. Background information and data
3.1. Production and trade statistics
3.1.1. Beef meat
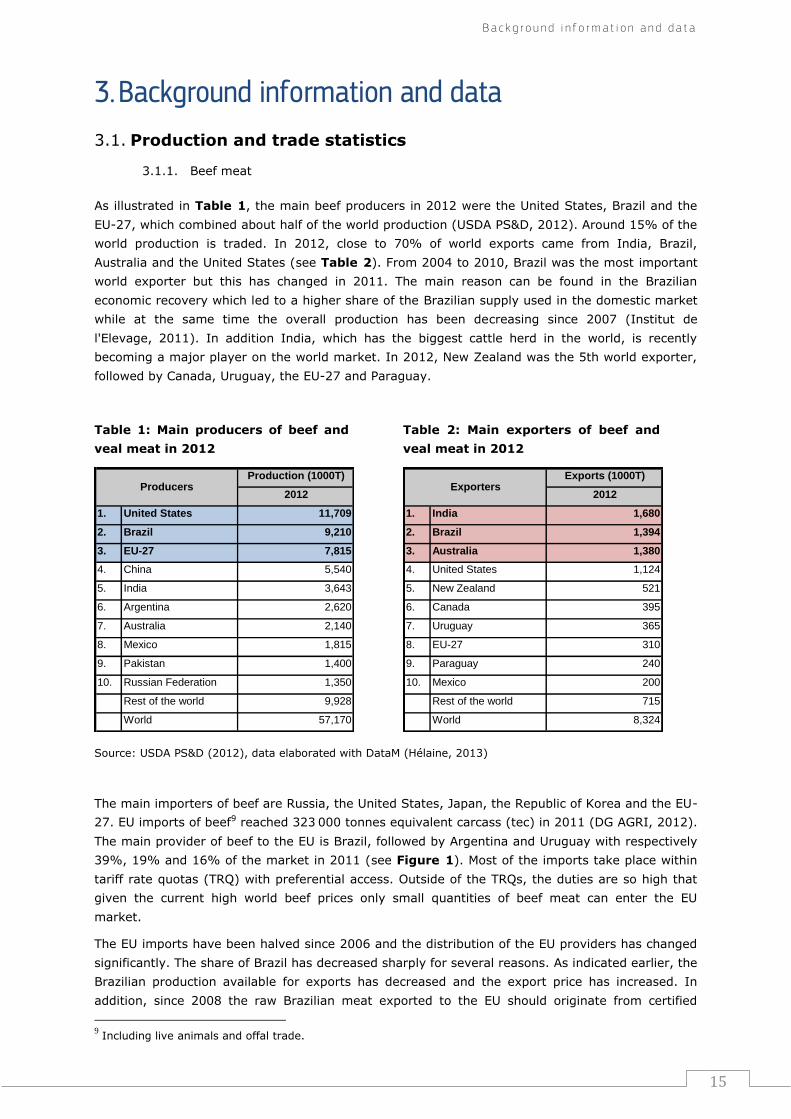
As illustrated in Table 1, the main beef producers in 2012 were the United States, Brazil and the
EU-27, which combined about half of the world production (USDA PS&D, 2012). Around 15% of the
world production is traded. In 2012, close to 70% of world exports came from India, Brazil,
Australia and the United States (see Table 2). From 2004 to 2010, Brazil was the most important
world exporter but this has changed in 2011. The main reason can be found in the Brazilian
economic recovery which led to a higher share of the Brazilian supply used in the domestic market
while at the same time the overall production has been decreasing since 2007 (Institut de
l'Elevage, 2011). In addition India, which has the biggest cattle herd in the world, is recently
becoming a major player on the world market. In 2012, New Zealand was the 5th world exporter,
followed by Canada, Uruguay, the EU-27 and Paraguay.
Table 1: Main producers of beef and
veal meat in 2012
Table 2: Main exporters of beef and
veal meat in 2012
Production (1000T)
2012
1. United States 11,709
2. Brazil 9,210
3. EU-27 7,815
4. China 5,540
5. India 3,643
6. Argentina 2,620
7. Australia 2,140
8. Mexico 1,815
9. Pakistan 1,400
10. Russian Federation 1,350
Rest of the world 9,928
World 57,170
Producers
Exports (1000T)
2012
1. India 1,680
2. Brazil 1,394
3. Australia 1,380
4. United States 1,124
5. New Zealand 521
6. Canada 395
7. Uruguay 365
8. EU-27 310
9. Paraguay 240
10. Mexico 200
Rest of the world 715
World 8,324
Exporters
Source: USDA PS&D (2012), data elaborated with DataM (Hélaine, 2013)
The main importers of beef are Russia, the United States, Japan, the Republic of Korea and the EU-
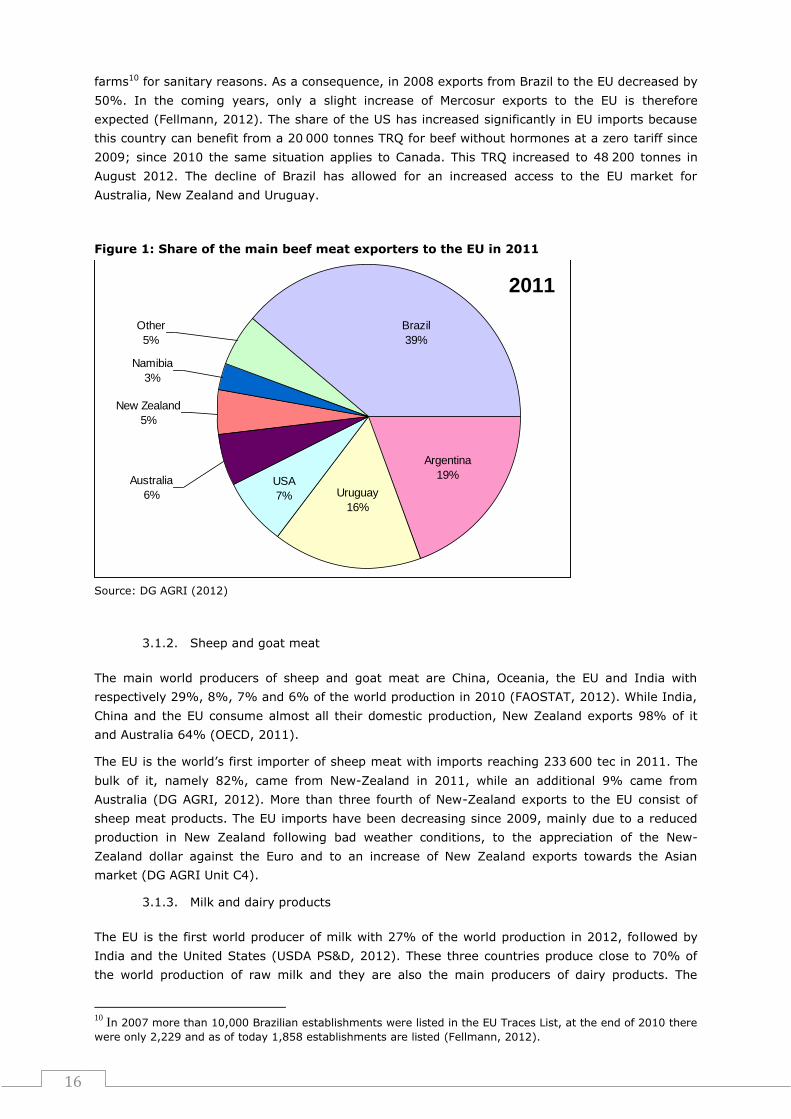
27. EU imports of beef9 reached 323 000 tonnes equivalent carcass (tec) in 2011 (DG AGRI, 2012).
The main provider of beef to the EU is Brazil, followed by Argentina and Uruguay with respectively
39%, 19% and 16% of the market in 2011 (see Figure 1). Most of the imports take place within
tariff rate quotas (TRQ) with preferential access. Outside of the TRQs, the duties are so high that
given the current high world beef prices only small quantities of beef meat can enter the EU
market.
The EU imports have been halved since 2006 and the distribution of the EU providers has changed
significantly. The share of Brazil has decreased sharply for several reasons. As indicated earlier, the
Brazilian production available for exports has decreased and the export price has increased. In
addition, since 2008 the raw Brazilian meat exported to the EU should originate from certified
9 Including live animals and offal trade.
16
farms10 for sanitary reasons. As a consequence, in 2008 exports from Brazil to the EU decreased by
50%. In the coming years, only a slight increase of Mercosur exports to the EU is therefore
expected (Fellmann, 2012). The share of the US has increased significantly in EU imports because
this country can benefit from a 20 000 tonnes TRQ for beef without hormones at a zero tariff since
2009; since 2010 the same situation applies to Canada. This TRQ increased to 48 200 tonnes in
August 2012. The decline of Brazil has allowed for an increased access to the EU market for
Australia, New Zealand and Uruguay.
Figure 1: Share of the main beef meat exporters to the EU in 2011
Source: DG AGRI (2012)
3.1.2. Sheep and goat meat
The main world producers of sheep and goat meat are China, Oceania, the EU and India with
respectively 29%, 8%, 7% and 6% of the world production in 2010 (FAOSTAT, 2012). While India,
China and the EU consume almost all their domestic production, New Zealand exports 98% of it
and Australia 64% (OECD, 2011).
The EU is the world’s first importer of sheep meat with imports reaching 233 600 tec in 2011. The
bulk of it, namely 82%, came from New-Zealand in 2011, while an additional 9% came from
Australia (DG AGRI, 2012). More than three fourth of New-Zealand exports to the EU consist of
sheep meat products. The EU imports have been decreasing since 2009, mainly due to a reduced
production in New Zealand following bad weather conditions, to the appreciation of the New-
Zealand dollar against the Euro and to an increase of New Zealand exports towards the Asian
market (DG AGRI Unit C4).
3.1.3. Milk and dairy products
The EU is the first world producer of milk with 27% of the world production in 2012, followed by
India and the United States (USDA PS&D, 2012). These three countries produce close to 70% of
the world production of raw milk and they are also the main producers of dairy products. The
10
In 2007 more than 10,000 Brazilian establishments were listed in the EU Traces List, at the end of 2010 there
were only 2,229 and as of today 1,858 establishments are listed (Fellmann, 2012).
2011
Argentina
19%
Brazil
39%
Uruguay
16%
Australia
6%
USA
7%
Namibia
3%
New Zealand
5%
Other
5%
B a c k g r o u n d i n f o r m a t i o n a n d d a t a
17
picture of the global trade is slightly different. The EU and the United States are still major players
but the Indian production is mainly meant for the domestic market while the third main actor is
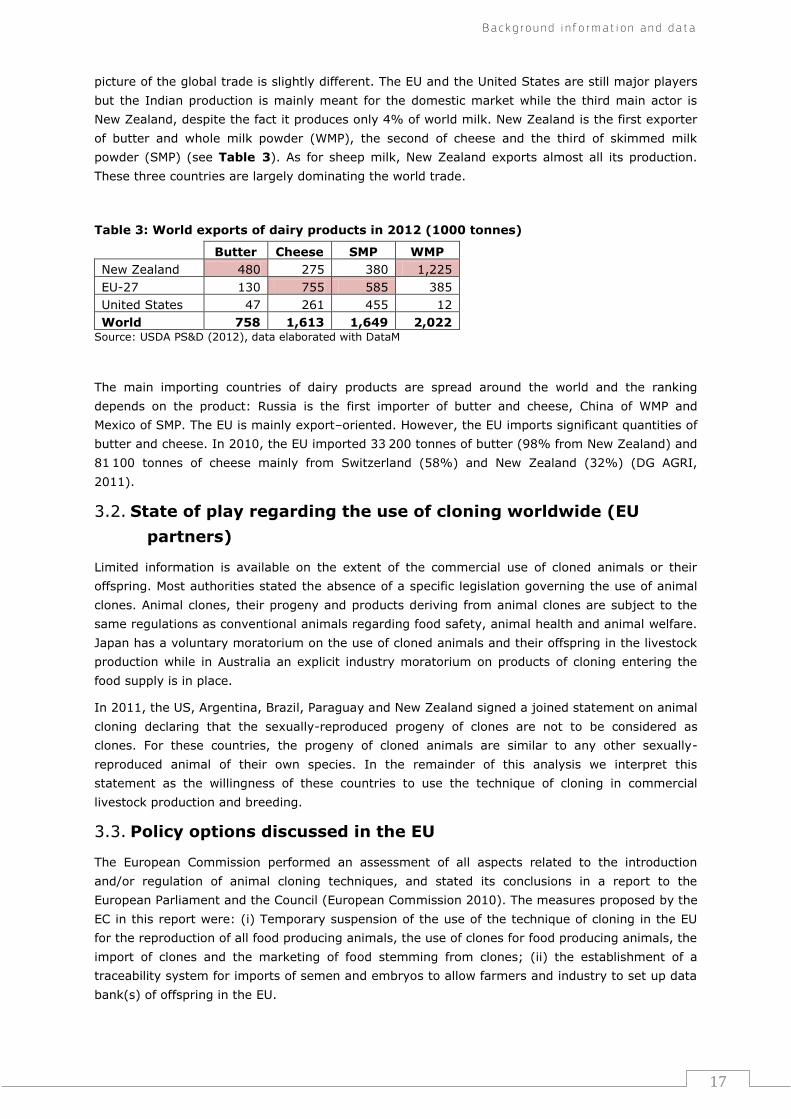
New Zealand, despite the fact it produces only 4% of world milk. New Zealand is the first exporter
of butter and whole milk powder (WMP), the second of cheese and the third of skimmed milk
powder (SMP) (see Table 3). As for sheep milk, New Zealand exports almost all its production.
These three countries are largely dominating the world trade.
Table 3: World exports of dairy products in 2012 (1000 tonnes)
Butter Cheese SMP WMP
New Zealand 480 275 380 1,225
EU-27 130 755 585 385
United States 47 261 455 12
World 758 1,613 1,649 2,022 Source: USDA PS&D (2012), data elaborated with DataM
The main importing countries of dairy products are spread around the world and the ranking
depends on the product: Russia is the first importer of butter and cheese, China of WMP and
Mexico of SMP. The EU is mainly export–oriented. However, the EU imports significant quantities of
butter and cheese. In 2010, the EU imported 33 200 tonnes of butter (98% from New Zealand) and
81 100 tonnes of cheese mainly from Switzerland (58%) and New Zealand (32%) (DG AGRI,
2011).
3.2. State of play regarding the use of cloning worldwide (EU
partners)
Limited information is available on the extent of the commercial use of cloned animals or their
offspring. Most authorities stated the absence of a specific legislation governing the use of animal
clones. Animal clones, their progeny and products deriving from animal clones are subject to the
same regulations as conventional animals regarding food safety, animal health and animal welfare.
Japan has a voluntary moratorium on the use of cloned animals and their offspring in the livestock
production while in Australia an explicit industry moratorium on products of cloning entering the
food supply is in place.
In 2011, the US, Argentina, Brazil, Paraguay and New Zealand signed a joined statement on animal
cloning declaring that the sexually-reproduced progeny of clones are not to be considered as
clones. For these countries, the progeny of cloned animals are similar to any other sexually-
reproduced animal of their own species. In the remainder of this analysis we interpret this
statement as the willingness of these countries to use the technique of cloning in commercial
livestock production and breeding.
3.3. Policy options discussed in the EU
The European Commission performed an assessment of all aspects related to the introduction
and/or regulation of animal cloning techniques, and stated its conclusions in a report to the
European Parliament and the Council (European Commission 2010). The measures proposed by the
EC in this report were: (i) Temporary suspension of the use of the technique of cloning in the EU
for the reproduction of all food producing animals, the use of clones for food producing animals, the
import of clones and the marketing of food stemming from clones; (ii) the establishment of a
traceability system for imports of semen and embryos to allow farmers and industry to set up data
bank(s) of offspring in the EU.
18
In the 2012 Roadmap called "Measures on animal cloning for food production in the EU", the
European Commission (2012) detailed five main policy options, as a basis for discussion and
analysis of their impacts in terms of costs and benefits for the various stakeholders involved in the
animal production sector (private operators, public administration and consumers). These policy
scenarios are summarized in Table 4. This study evaluates the impact of the presented policy
options on trade and production.
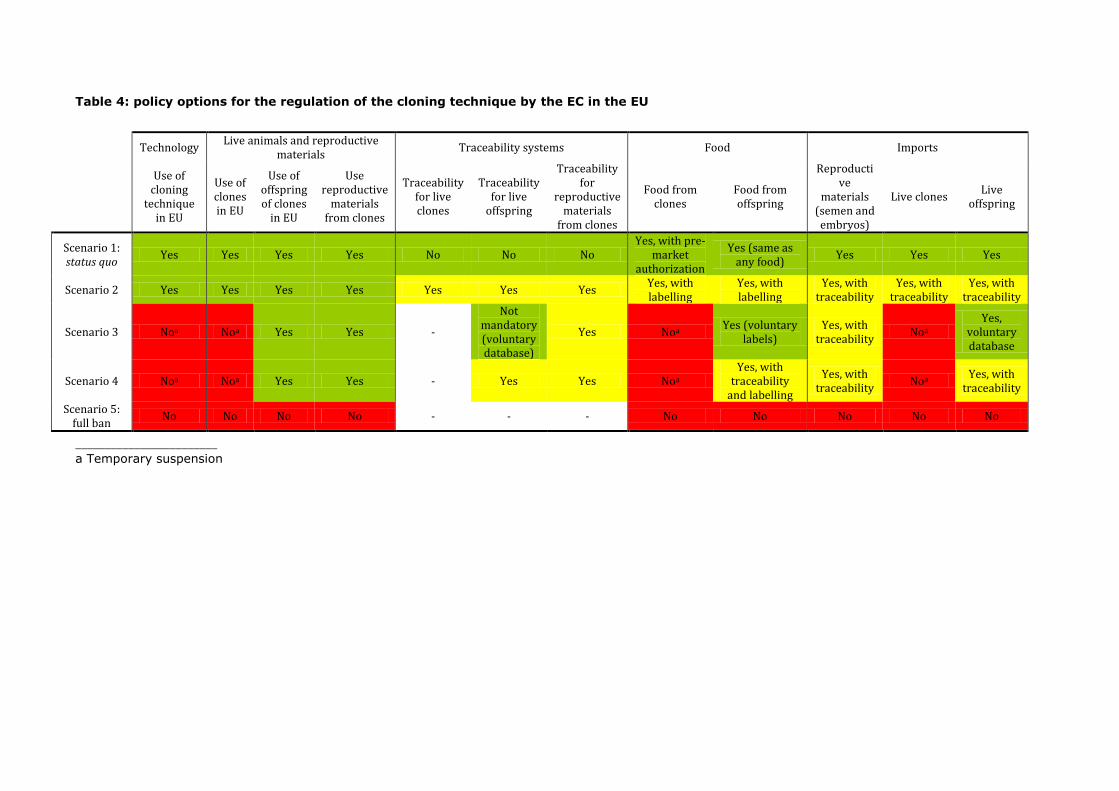
Table 4: policy options for the regulation of the cloning technique by the EC in the EU
Technology Live animals and reproductive
materials Traceability systems Food Imports
Use of cloning
technique in EU
Use of clones in EU
Use of offspring of clones
in EU
Use reproductive
materials from clones
Traceability for live clones
Traceability for live
offspring
Traceability for
reproductive materials
from clones
Food from clones
Food from offspring
Reproductive
materials (semen and embryos)
Live clones Live
offspring
Scenario 1: status quo
Yes Yes Yes Yes No No No Yes, with pre-
market authorization
Yes (same as any food)
Yes Yes Yes
Scenario 2 Yes Yes Yes Yes Yes Yes Yes Yes, with labelling
Yes, with labelling
Yes, with traceability
Yes, with traceability
Yes, with traceability
Scenario 3 Noa Noa Yes Yes -
Not mandatory (voluntary database)
Yes Noa Yes (voluntary
labels) Yes, with
traceability Noa
Yes, voluntary database
Scenario 4 Noa Noa Yes Yes - Yes Yes Noa Yes, with
traceability and labelling
Yes, with traceability
Noa Yes, with
traceability
Scenario 5: full ban
No No No No - - - No No No No No
________________________ a Temporary suspension

P r e p a r a t o r y w o r k f o r m o d e l l i n g
21
4. Preparatory work for modelling
4.1. Specifying the "closure rules"
In mathematical programming terms, the model closure conditions ensure the equality between
numbers of equations and variables. However, from an economic theoretic dimension, model
closure rules define fundamental differences in perceptions of how an economic system operates.
The closure rules relate to macroeconomic, e.g., is investment expenditure determined by the
volume of savings or the other way around, and to capture typical features of an economic system,
e.g., the degree of factor's mobility.
Simulations with models such as GLOBE typically adopt the so-called standard neo-classical
assumptions closure rules, namely: (1) trade balance fixed and exchange rate variable, (2) fixed
savings rates and investment variable ("savings-driven"), (3) government budget deficit/surplus
variable and household income tax rate fixed, (4) factors of production (land, skilled and unskilled
labour, capital and natural resources) fully mobile and (5) full employment of factors.
Our main criterion when specifying the closure rules was that assumptions should be reasonable
and realistic, given recent trends and cross-country differences in macro-management policies. For
example, regarding closure rule 1, developed country exchange rates depend not only on the trade
balance but also on foreign capital movements; when significant exchange rate adjustments take
place, it is more likely to be the result of several endogenous and exogenous (policy) factors rather
than an automatic adjustment to changes in the trade balance. Moreover specific assumptions are
made about exchange rate changes up to 2020, which would necessitate exogenous assumptions
regarding exchange rate appreciation and depreciation between currencies. However, for the least
developed countries, this assumption was felt to be unrealistic. Hence, a different decision
regarding closure rule 1 was made for these countries. Based on previous experience and evidence,
the closure regime might affect the results but the differences are minor and cannot threaten or
overturn any policy implications that emerge from the results shown in the report.
In addition, rule 3 was modified in order to take into account projections on government deficit (or
surplus) as % of the GDP in the future. In the chosen closure rule, the government budget
deficit/surplus is fixed at its projected level while household income tax rate are endogenous and
free to adjust to achieve the level of government deficit/surplus.
For simplicity, in this study the remaining closure rules (2, 4 and 5) adopt the standard neo-
classical approach.
4.2. Construction of the baseline
To reproduce the most likely future developments of the global economy in the future, several
economic variables are exogenously shocked to build a baseline for 2020. The baseline represents
the business as usual scenario to which all policy scenarios are compared.
Once exogenous projections of exchange rates, trends in the availability of the five fixed factors
(unskilled and skilled labour, capital, land and natural resources), population and GDP are
available, GLOBE solves for all other relevant variables. In order to use an exogenous projection of
GDP in the reference scenario, the model was solved assuming an endogenous technological
progress to be achieved by 2020. This value was then taken as given (exogenous) in the policy
scenarios, allowing GDP to be endogenously determined and hence different from the initial
assumption in the presence of the different policy options. In other words, GDP is exogenously
fixed in the baseline, following available projections, while it is endogenously determined by the
model in the policy scenarios.
22
Using the comparative static version of GLOBE, it is important to recognise that all differences
simulated between the base year, 2007, and the reference scenario in 2020 are due to the trends
embodied in these exogenous assumptions.
For this study, GLOBE includes the explicit modelling of bilateral TRQs (Burrell et al., 2012),
following the approach of van der Mensbrugghe (2005). Because of time and data constraints, only
bilateral TRQs offered by the EU to third countries in the beef market are modelled, and erga
omnes (multilateral non-preferential) TRQs are converted into bilateral TRQs. Implementation of
TRQs better depicts the expected movements in the beef trade market in the future.
Bilateral TRQs are modelled as a mixed complementarity problem (in this case, different solutions
depending on the size of imports of a good relative to its TRQ). Three possibilities can occur:
imports are below the quota limit: imports enter at the in-quota tariff rate,
imports are equal to the quota limit (the quota is just binding): the domestic price of imported
good is equal to the world price plus the in-quota tariff plus a premium, which is determined
endogenously by the model,
imports exceed the quota limit; the out-of-quota (MFN) tariff is applied to the quantity in
excess of the quota limit. In this case the domestic price of import is equal to the world market
price times the in-quota-tariff rate plus the premium. The premium is equal to the difference
between in- and out-of-quota tariffs (= the quota rent).
For simplicity, the quota rent is entirely assigned to the importers. The importer’s share is treated
as part of government income. In a one-household model like GLOBE, this does not create bias for
the consumer welfare analysis.
T h e p o l i c y o p t i o n s a n d t h e i r s p e c i f i c a t i o n s i n t h e m o d e l
23
5. The policy options and their specifications in the
model
5.1. Baseline
No cloning technique available anywhere, this scenario will serve as a counterfactual for
the other scenarios.
5.2. Scenario 1 – Cloning is allowed
The cloning technique is allowed in the EU. The cloning technique is available in third countries
which signed the joint statement on animal cloning for livestock production (Argentina, Brazil, New
Zealand and the US).
MODEL: Increased productivity in cattle and milk production stemming from the use of the cloning
technique is assumed. The Total Factor Productivity (TFP) is positively shocked to simulate an
increase output in the milk and cattle sector11 due to the cloning techniques.
In milk production, cloning has the potential to increase the milk output per cow over time by
increasing the spread of desired genetic characteristics. The yearly improvement of yield could be
as big as 300kg of milk per cow (Dematawewa and Berger 1998). Butler and Wolf (2010) use this
increase to estimate the percentage increase in output through a ten-year time period and
calculate the net present value of adopting the cloning technique in the US dairy farms. In their
analysis the authors account for the fact that the switch to cloning will not happen at once.
Farmers will incorporate the novel cows in their normal herd replacing regime. The slow speed
adoption results in a delayed benefit creation of the technology. Moreover they assume a price
premium of USD 50 to USD 200 for a cloned animal and the need for increased input use.
Combining the increased output with the increased input costs, they conclude that the average
annualized Net Present Value (NPV) for one cow is around USD 5 dollar. This increase in NPV can
be translated in an increase in TFP through a comparison with the input costs of milk in the US,
which are around USD 23/cwt or EUR 0.52/L milk (USDA). This leads to an estimated increase of
TFP of 0.35% for the US dairy sector.
As no further information is available for the other countries, a similar increase in TFP is assumed
for the other regions commercially applying the cloning technique in Scenario 1.
Moreover, as no information is available for the effect of cloning on the cattle sector, we assume
that the effect on TFP has the same magnitude as in the milk sector.
5.3. Scenario 2
Scenario 2 is not modelled in this version of the report. The results will be similar to scenario 1 and
4 as it is a combination of both scenarios.
5.4. Scenario 3 – Cloning forbidden in the EU
The cloning technique is forbidden in the EU. The cloning technique is available in third countries
which signed the joint statement on animal cloning for livestock production (Argentina, Brazil, New
Zealand and the US).
11 We highlight again that in this study the cattle and beef product categories are an aggregate of beef, goat, horse and sheep and respectively their meat as these commodities cannot be disentangled in the model. Where this assumption might influence the results the analysis is deepened based on secondary data sources.
24
MODEL: An increase in productivity of cattle and milk production stemming from the use of the
cloning technique is assumed. The TFP is positively shocked to simulate increased output in the
milk and cattle sector for the selected countries. The magnitude of the shock is equal to the
assumption tailored for Scenario 1.
5.5. Scenario 4 – Cloning forbidden in the EU and traceability for
imports
The cloning technique is forbidden in the EU. The cloning technique is available in third countries
which signed the joint statement on animal cloning for livestock production (Argentina, Brazil, New
Zealand and the US).
MODEL: An increase in productivity of cattle and milk production stemming from the use of the
cloning technique is assumed. The TFP is positively shocked to simulate an increase output in the
milk and cattle sector in the selected countries. The magnitude of the shock is equal to the
assumption tailored for Scenario 1.
A mandatory traceability and labelling system for food coming from offspring of cloned animals is
established.
MODEL: Traceability requirements for food coming from offspring of cloned animals lead to a direct
increase in production cost both at the farm level and further down the supply chain. Costs contain
among others:
Tags
Increased labour use
Possible animal injury
Reading costs
Software costs
However, several countries which signed the joint statement on animal cloning for livestock
production already have a traceability system in place to increase market access and secure food
and animal safety. We assume the existing traceability system can be used to trace clones and
their offspring without inducing extra costs. This assumption is conditional on the specification of
the traceability system put in place. One of the possible extra costs we did not account for is the
establishment of a DNA-register as a control mechanism. The need for such a system will increase
costs even for those countries already having a traceability system. Only in the US, where no
traceability system exists, a novel system for cloning has to be setup leading to increased
production costs. The magnitude of the cost increase has been estimated by APHIS (2009).
According to their estimates, the costs would amount to USD 139 764 000 for the US cattle sector,
while for the milk sector the costs are as high as USD 32 769 000. In order to translate these
values to model inputs we compare the cost increase to the total value of production (USDA)
(0.4% for cattle and 0.9% for milk).
In a similar way we increase the cost of services with USD 66 027 000 in the production of food
(dairy and beef) from cloned animals to take into account the increased cost of labelling and
traceability (APHIS, 2009).
It has to be noted that the model does assume there is a demand for labelled products in the EU. If
not the labelling requirement might result in a suspension of trade from the regions using cloning.
T h e p o l i c y o p t i o n s a n d t h e i r s p e c i f i c a t i o n s i n t h e m o d e l
25
5.6. Scenario 5 – EU Import ban
The cloning technique is forbidden in the EU. The cloning technique is available in third countries
which signed the joint statement on animal cloning for livestock production (Argentina, Brazil, New
Zealand and the US).
MODEL: An increase in productivity of cattle and milk production stemming the use of the cloning
technique is assumed. The TFP is positively shocked to simulate an increase output in the milk and
cattle sector due to the cloning techniques. The magnitude of the shock is equal to the assumption
tailored for Scenario 1.
Import ban on live animals, reproductive materials and food from clones and offspring coming from
cloning countries (Argentina, Brazil, New Zealand and the US). This ban can be due to express
prohibition or a de facto decision by the exporters.
MODEL: Ban of the EU imports of live animals and beef produced in countries allowing cloning by
increasing import tariffs up to an almost prohibitive tax that would impede the imports. Banned
countries can export their products to other countries but no re-exportation from these countries to
the EU is allowed. Possibilities for the EU to cope with the shortages following the import ban
include increasing domestic production or imports from third partners. However, only countries
which already have a health certificate will be allowed to export meat to the EU.

G L O B E s i m u l a t i o n r e s u l t s
27
6. GLOBE simulation results
6.1. Imports
Table 5 presents the effect of the different simulated policy scenarios on the composite import of
cattle, milk, beef and dairy in the EU 27. In general the results show only marginal changes in the
imports under the assumptions of scenario 1, 3 and 4. This indicates that the productivity increase
from cloning is not significant enough to change trade patterns. Imports of beef and dairy slightly
increase when the EU decides not to use cloning but allowing the imports stemming from cloning
(Scenario 3). At the same time, the cost of setting up traceability systems in the US (Scenario 4)
marginally reduces the imports of primary products (milk and beef) compared to the baseline. In
these three scenarios (1,3,4), price effects are negligible.
More important changes are observed under the assumptions of scenario 5 which introduces a ban
on the imports into the EU of cattle, milk, beef and dairy produced from countries expected to use
the cloning technique (US, New Zealand, Brazil and Argentina). The ban mainly affects the cattle
imports which drop over 50% and beef imports with a decrease of almost 60%. At the same time,
the reduced possibilities to import translate into an increase of the import prices of these
commodities by approximately 10%. The general trends are similar in the dairy market but the
magnitude of the impacts are smaller with a decrease of about 20% in imports of dairy leading to a
price increase for imports of 1%.
The decrease imports depicted in Table 5 is a net effect. The reduced availability from imports from
those countries using cloning is compensated by an increase of imports from other exporting
regions. This shift is shown in Table 6. Canada and Australia increase imports to the EU of cattle
(7%) and beef (12%). A further increase in imports from these countries is not only constrained by
the available inputs but also by the trade agreements with these countries. The EU could combine
its ban on imports from the specified countries with an increase of TRQs for other countries. The
model shows 12 that doubling the TRQs for Uruguay and Australia would slightly decrease the
pressure on import volumes and prices leading to a fall in beef import of only 48% compared to
58% without the change in TRQs. However, no information is available on combined policy changes
and therefore that option is not considered in detail in the remainder of this study.
The analysis of the effect of scenario 5 on the imports of cattle, beef, milk and dairy seems to
suggest that either demand for these products or domestic production will have to change in order
to balance the EU market. Therefore the next section focuses on the EU production changes under
the different scenarios.
12
For sake of simplicity the results of this additional scenario (Scenario 5 plus additional TRQs for Uruguay and
Australia) are not reported in the report but are available upon request from the authors.
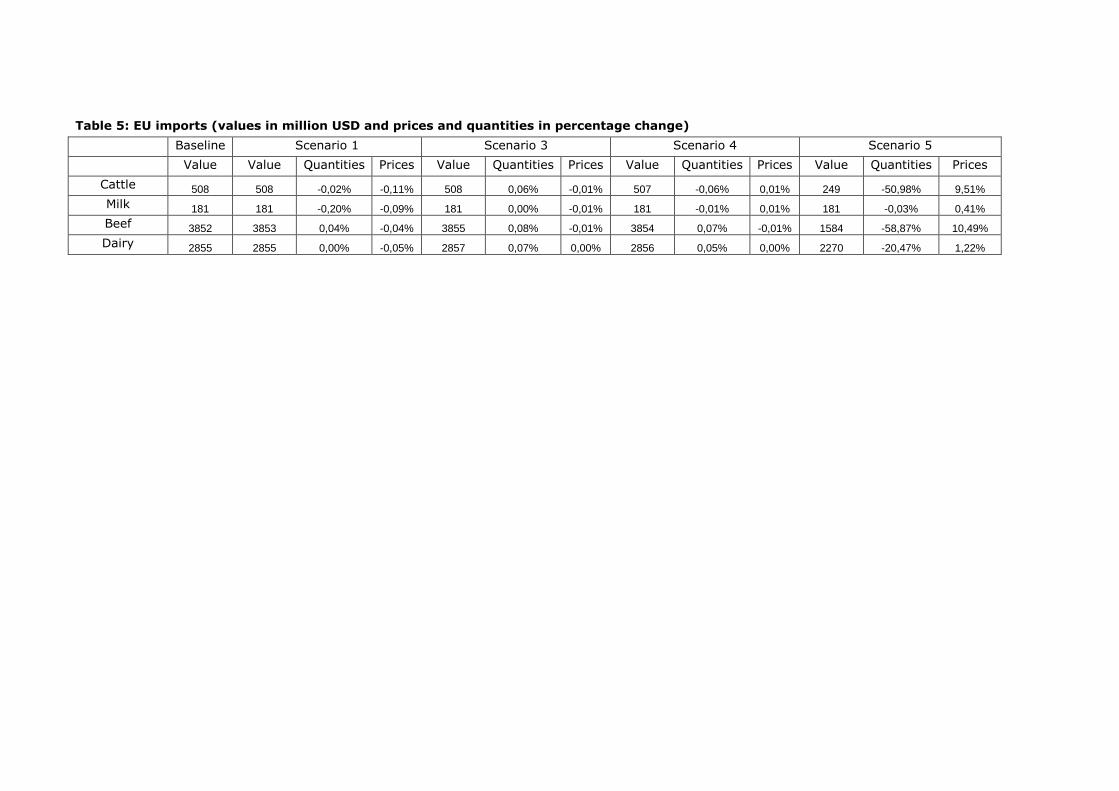
Table 5: EU imports (values in million USD and prices and quantities in percentage change) Baseline Scenario 1 Scenario 3 Scenario 4 Scenario 5
Value Value Quantities Prices Value Quantities Prices Value Quantities Prices Value Quantities Prices
Cattle 508 508 -0,02% -0,11% 508 0,06% -0,01% 507 -0,06% 0,01% 249 -50,98% 9,51%
Milk 181 181 -0,20% -0,09% 181 0,00% -0,01% 181 -0,01% 0,01% 181 -0,03% 0,41%
Beef 3852 3853 0,04% -0,04% 3855 0,08% -0,01% 3854 0,07% -0,01% 1584 -58,87% 10,49%
Dairy 2855 2855 0,00% -0,05% 2857 0,07% 0,00% 2856 0,05% 0,00% 2270 -20,47% 1,22%
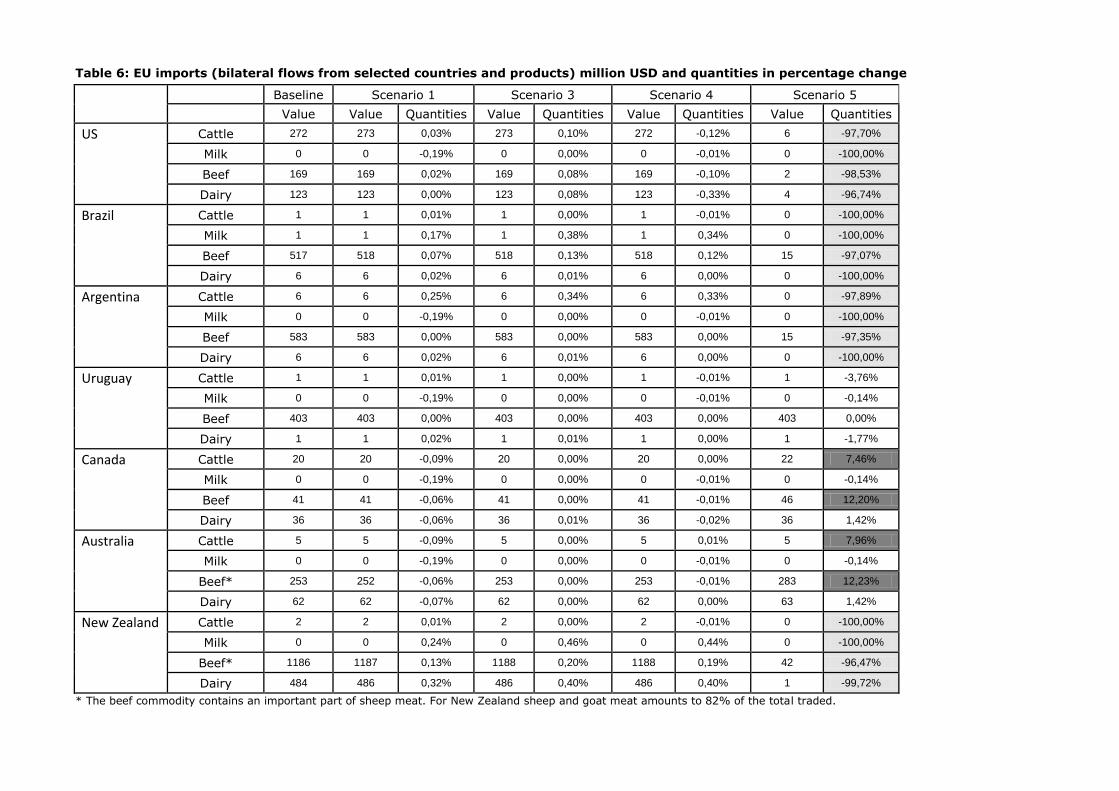
Table 6: EU imports (bilateral flows from selected countries and products) million USD and quantities in percentage change
Baseline Scenario 1 Scenario 3 Scenario 4 Scenario 5
Value Value Quantities Value Quantities Value Quantities Value Quantities
US Cattle 272 273 0,03% 273 0,10% 272 -0,12% 6 -97,70%
Milk 0 0 -0,19% 0 0,00% 0 -0,01% 0 -100,00%
Beef 169 169 0,02% 169 0,08% 169 -0,10% 2 -98,53%
Dairy 123 123 0,00% 123 0,08% 123 -0,33% 4 -96,74%
Brazil Cattle 1 1 0,01% 1 0,00% 1 -0,01% 0 -100,00%
Milk 1 1 0,17% 1 0,38% 1 0,34% 0 -100,00%
Beef 517 518 0,07% 518 0,13% 518 0,12% 15 -97,07%
Dairy 6 6 0,02% 6 0,01% 6 0,00% 0 -100,00%
Argentina Cattle 6 6 0,25% 6 0,34% 6 0,33% 0 -97,89%
Milk 0 0 -0,19% 0 0,00% 0 -0,01% 0 -100,00%
Beef 583 583 0,00% 583 0,00% 583 0,00% 15 -97,35%
Dairy 6 6 0,02% 6 0,01% 6 0,00% 0 -100,00%
Uruguay Cattle 1 1 0,01% 1 0,00% 1 -0,01% 1 -3,76%
Milk 0 0 -0,19% 0 0,00% 0 -0,01% 0 -0,14%
Beef 403 403 0,00% 403 0,00% 403 0,00% 403 0,00%
Dairy 1 1 0,02% 1 0,01% 1 0,00% 1 -1,77%
Canada Cattle 20 20 -0,09% 20 0,00% 20 0,00% 22 7,46%
Milk 0 0 -0,19% 0 0,00% 0 -0,01% 0 -0,14%
Beef 41 41 -0,06% 41 0,00% 41 -0,01% 46 12,20%
Dairy 36 36 -0,06% 36 0,01% 36 -0,02% 36 1,42%
Australia Cattle 5 5 -0,09% 5 0,00% 5 0,01% 5 7,96%
Milk 0 0 -0,19% 0 0,00% 0 -0,01% 0 -0,14%
Beef* 253 252 -0,06% 253 0,00% 253 -0,01% 283 12,23%
Dairy 62 62 -0,07% 62 0,00% 62 0,00% 63 1,42%
New Zealand Cattle 2 2 0,01% 2 0,00% 2 -0,01% 0 -100,00%
Milk 0 0 0,24% 0 0,46% 0 0,44% 0 -100,00%
Beef* 1186 1187 0,13% 1188 0,20% 1188 0,19% 42 -96,47%
Dairy 484 486 0,32% 486 0,40% 486 0,40% 1 -99,72%
* The beef commodity contains an important part of sheep meat. For New Zealand sheep and goat meat amounts to 82% of the total traded.
30
6.2. Production changes
Table 7 presents the changes in the EU’s domestic production under the different scenarios.
In scenario 1, the EU captures the productivity increase from the cloning technique, increasing the
competitiveness of the cattle/beef and milk/dairy sector vis-à-vis the other agricultural sectors.
This leads to a small increase in domestic production combined with a slight decrease in the
producer price.
Under scenario 3 and 4, no significant changes compared with the baseline are observed. This is
expected as the changes in imports were marginal under these scenarios and the competitive
position of different sectors in the EU remains stable as the cloning technique cannot be used by
EU farmers.
Under scenario 5, a ban of imports from countries allowing the technique of cloning, the effects are
more pronounced. As imports decrease significantly, EU domestic production increases in order to
match domestic demand. However, percentage changes in production are small as the volume
traded is little compared to production, especially in the milk/dairy sector.
The production of cattle increases by 4% and the production of beef by 6%. This represents a
significant increase in output value estimated at USD 4.28 billion. The increased production has
spill over effects on other agricultural sectors. The demand for fodder increases by 4%. This
increased demand leads to a higher demand for land increasing the land price by 1.35%. The
increased price for both land and fodder leads to producer price increase in beef sector (0.30%)
and in other sectors such as cereals, grains and other crops of about 0.1%. As the share of imports
and the effect on imports under scenario 5 is smaller in the milk/dairy sector, changes are marginal
with a production increase of about 0.5% and a price increase of around 0.1%.
As indicated before, the model cannot differentiate between beef, sheep, goat and horse meat.
Instead, the model relies on an aggregated commodity, which does not permit a further
disaggregation of the specific effects in the beef or the sheep meat market.
However, EU trade and production data can be used to interpret the aforementioned model results.
First, total imports of beef, sheep and goat meat represent 7% of the EU domestic production,
expressed in physical volume (Eurostat). This is consistent with the increase of production
forecasted by the model in case of an import ban. Looking more into the details, the situation is
very different for the different meat products. Whereas imports of beef meat represent less than
5% of the EU domestic production, for sheep and goat the figure climbs to more than 30%.
Banning the imports of sheep and goat meat – most of them coming from New-Zealand – would
thus represent a bigger challenge to the EU sector than the results of the model suggest especially
if this availability gap has to be filled through domestic production. The same situation depicted for
volume of meat products also apply for prices. The producer price change foreseen by the model
might also hide an important differentiation between products. Imposing a ban will likely result in a
much higher producer price increase for sheep meat than for beef meat, even if some substitution
might occur. The model results present a rather small price change as it is mainly driven by the
beef market. A more detailed analysis of these markets will be required in case cloning in sheep
and goat meat proves to be of importance.
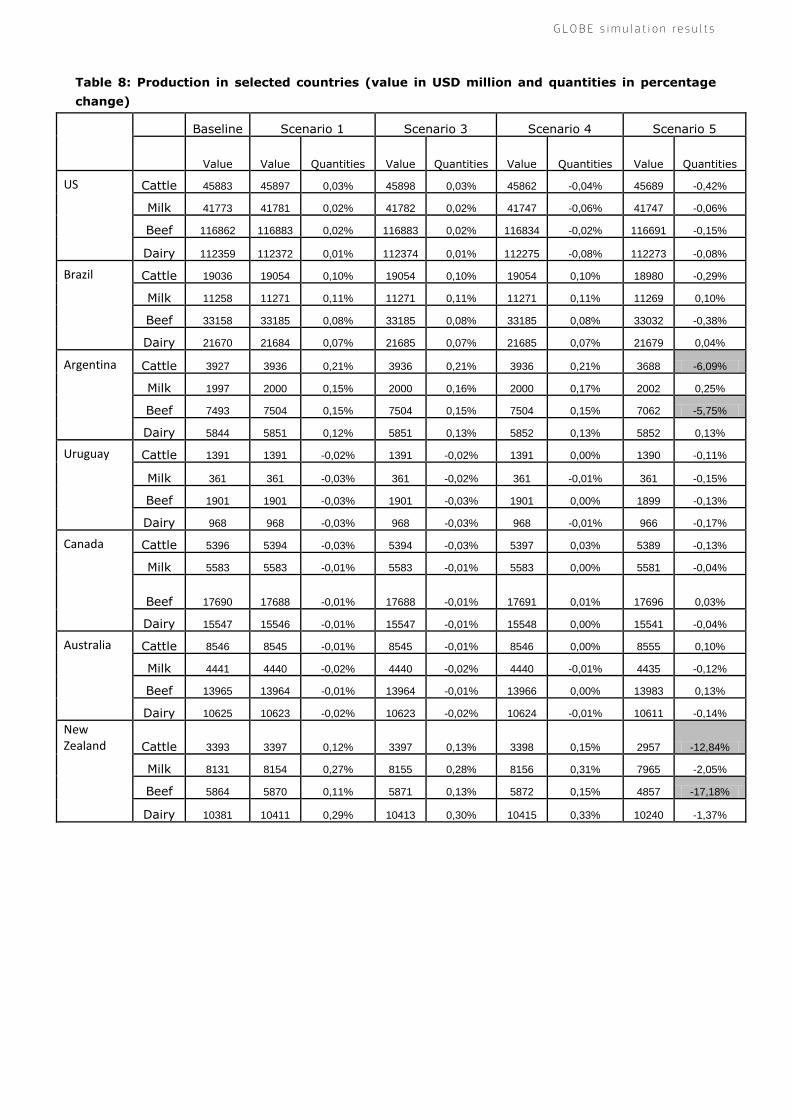
Table 8 presents the effect of the different policy scenarios on selected trade partners. Under
scenario 1 and 3 those countries that do not have access to the cloning technique (Uruguay,
Canada and Australia) experience a slight production reduction in the commodities under research
while cloning countries experience a slight increase due to the increased TFP.
Under scenario 4 a reduction in the production in the US is showed due to the cost of the
traceability system to be put in place. The fact that the US does not reap the benefits of cloning
G L O B E s i m u l a t i o n r e s u l t s
31
causes that countries not adopting cloning technique slightly increase their output (mainly
Canada).
Assuming a ban in scenario 5, a diverse range of impacts on domestic production can be observed.
The importance of these effects is determined by the ratio of exports to domestic production. For
large producers such as the US and Brazil, the loss of the EU market is not important
percentagewise. For the Argentinean beef and cattle sector the impact is of a higher magnitude,
with the model suggesting a 6% decrease in production. For New Zealand the ban could result in a
significant production loss up to 17% for beef production as they depend to a large extent on
exports, and particularly on those entering the EU. As New Zealand is mainly exporting sheep
meat, this loss will be predominantly attributed to the sheep sector.
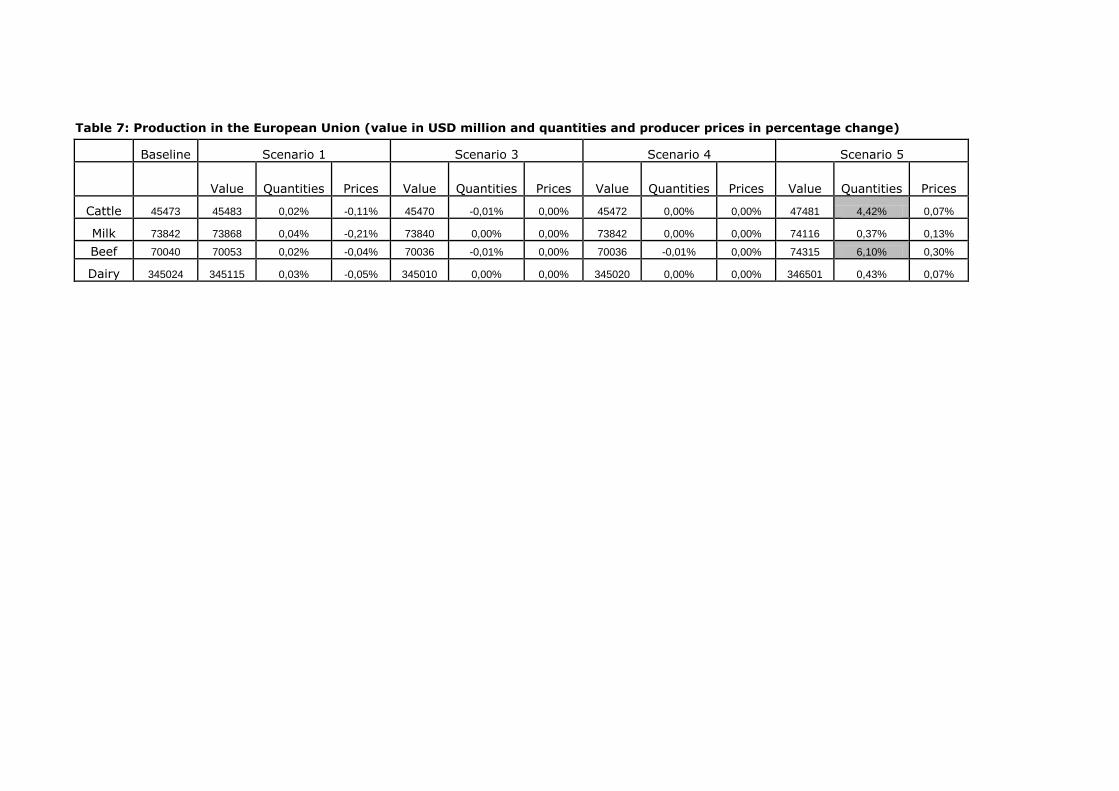
Table 7: Production in the European Union (value in USD million and quantities and producer prices in percentage change)
Baseline Scenario 1 Scenario 3 Scenario 4 Scenario 5
Value Quantities Prices Value Quantities Prices Value Quantities Prices Value Quantities Prices
Cattle 45473 45483 0,02% -0,11% 45470 -0,01% 0,00% 45472 0,00% 0,00% 47481 4,42% 0,07%
Milk 73842 73868 0,04% -0,21% 73840 0,00% 0,00% 73842 0,00% 0,00% 74116 0,37% 0,13%
Beef 70040 70053 0,02% -0,04% 70036 -0,01% 0,00% 70036 -0,01% 0,00% 74315 6,10% 0,30%
Dairy 345024 345115 0,03% -0,05% 345010 0,00% 0,00% 345020 0,00% 0,00% 346501 0,43% 0,07%
G L O B E s i m u l a t i o n r e s u l t s
Table 8: Production in selected countries (value in USD million and quantities in percentage
change)
Baseline Scenario 1 Scenario 3 Scenario 4 Scenario 5
Value Value Quantities Value Quantities Value Quantities Value Quantities
US Cattle 45883 45897 0,03% 45898 0,03% 45862 -0,04% 45689 -0,42%
Milk 41773 41781 0,02% 41782 0,02% 41747 -0,06% 41747 -0,06%
Beef 116862 116883 0,02% 116883 0,02% 116834 -0,02% 116691 -0,15%
Dairy 112359 112372 0,01% 112374 0,01% 112275 -0,08% 112273 -0,08%
Brazil Cattle 19036 19054 0,10% 19054 0,10% 19054 0,10% 18980 -0,29%
Milk 11258 11271 0,11% 11271 0,11% 11271 0,11% 11269 0,10%
Beef 33158 33185 0,08% 33185 0,08% 33185 0,08% 33032 -0,38%
Dairy 21670 21684 0,07% 21685 0,07% 21685 0,07% 21679 0,04%
Argentina Cattle 3927 3936 0,21% 3936 0,21% 3936 0,21% 3688 -6,09%
Milk 1997 2000 0,15% 2000 0,16% 2000 0,17% 2002 0,25%
Beef 7493 7504 0,15% 7504 0,15% 7504 0,15% 7062 -5,75%
Dairy 5844 5851 0,12% 5851 0,13% 5852 0,13% 5852 0,13%
Uruguay Cattle 1391 1391 -0,02% 1391 -0,02% 1391 0,00% 1390 -0,11%
Milk 361 361 -0,03% 361 -0,02% 361 -0,01% 361 -0,15%
Beef 1901 1901 -0,03% 1901 -0,03% 1901 0,00% 1899 -0,13%
Dairy 968 968 -0,03% 968 -0,03% 968 -0,01% 966 -0,17%
Canada Cattle 5396 5394 -0,03% 5394 -0,03% 5397 0,03% 5389 -0,13%
Milk 5583 5583 -0,01% 5583 -0,01% 5583 0,00% 5581 -0,04%
Beef 17690 17688 -0,01% 17688 -0,01% 17691 0,01% 17696 0,03%
Dairy 15547 15546 -0,01% 15547 -0,01% 15548 0,00% 15541 -0,04%
Australia Cattle 8546 8545 -0,01% 8545 -0,01% 8546 0,00% 8555 0,10%
Milk 4441 4440 -0,02% 4440 -0,02% 4440 -0,01% 4435 -0,12%
Beef 13965 13964 -0,01% 13964 -0,01% 13966 0,00% 13983 0,13%
Dairy 10625 10623 -0,02% 10623 -0,02% 10624 -0,01% 10611 -0,14%
New Zealand Cattle 3393 3397 0,12% 3397 0,13% 3398 0,15% 2957 -12,84%
Milk 8131 8154 0,27% 8155 0,28% 8156 0,31% 7965 -2,05%
Beef 5864 5870 0,11% 5871 0,13% 5872 0,15% 4857 -17,18%
Dairy 10381 10411 0,29% 10413 0,30% 10415 0,33% 10240 -1,37%
6.3. Exports from the EU
As a whole the EU export of the commodities under research is rather limited, with the exception of
dairy products which account for around USD 12 billion annually. Hence not drastic changes are
expected under all scenarios.
Under scenario 1, with cloning available, the EU would be able to slightly increase exports, mainly
to those countries that would not adopt cloning. Following the increased availability of products on
the world market, prices slightly decrease (Table 9).
When assuming the EU does not permit the use of cloning (Scenario 3) the export of the EU
contracts as it competes with countries benefitting from the productivity increase from cloning.
However, when traceability is required, only negligible effects can be observed in the EU exports.
Under scenario 5, the export from the EU to other countries reduces slightly as the world market is
saturated by countries that cannot export to Europe anymore and the fact that imports have
decreased making the domestic market attractive.
6.4. The EU Domestic Market
When all countries, including the EU, have access to the cloning technique the increased
productivity in the cattle and milk sector leads to slightly lower prices on the European market with
the biggest price decreased observed in the milk market, 0.2% (Table 10). In scenario 3 and 4,
where the EU does not have access to the cloning technique prices remain stable compared to the
baseline. The marginal change in imports is too small to change the price on the domestic market,
moreover because the total share of imports in the sectors under research is limited.
Again the effects are most pronounced in the case the EU would ban the imports from countries
using cloning (Scenario 5). Total consumption of cattle and beef drops by 0.7% and 1.2%
respectively. This reduced availability leads to a higher price for consumers for both products.
However, the price effect is the outcome of two opposed forces. A downwards push on the price
comes from the increased internal production which increases domestic supply. On the other hand,
an upwards push comes from the decrease in imports and the price increase of imported goods. In
the cattle market this impact remains small, 0.7%, but in the beef market this leads to a price
increase of 2.4% for European consumers. As the model cannot differentiate between beef, goat,
horse and sheep products, it might well be possible that price changes in specific markets are even
higher. For instance in the sheep meat market, where the effect of banning imports from New
Zealand might contract the market to such an extent that the domestic production cannot
adequately fill the gap, prices rise could be higher. The other meat products finally, mainly poultry
and pork, experience a slight price increase (0.07%) due to the increased input prices and small
increase in demand due to substation from beef.
The change in prices, production and trade can be summarized by a change in welfare. In CGE
models welfare effects are calculated as an equivalent variation, the amount that would lower
utility by the same amount as the change in competitiveness observed in the simulation. For the
EU households the price increases in the agricultural sector lead to a welfare loss of about USD 1.7
billion, or approximately USD 3.4 for each of the 500 million citizens in the EU 27.
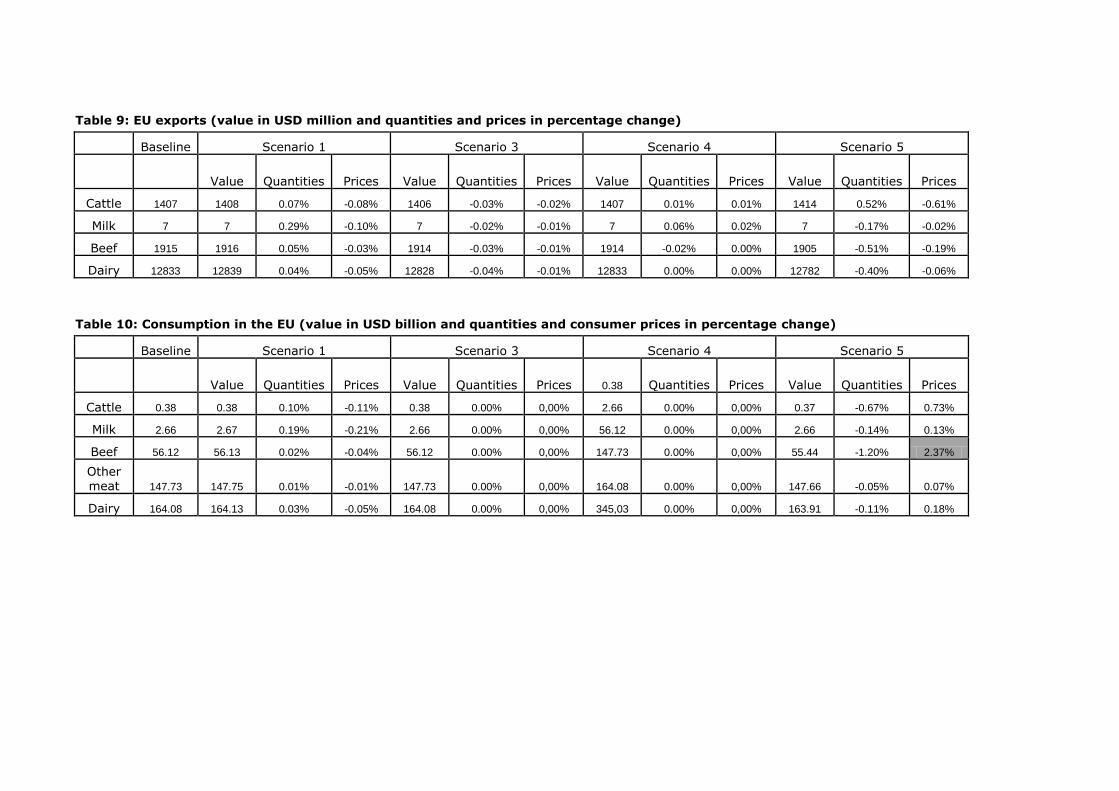
Table 9: EU exports (value in USD million and quantities and prices in percentage change)
Baseline Scenario 1 Scenario 3 Scenario 4 Scenario 5
Value Quantities Prices Value Quantities Prices Value Quantities Prices Value Quantities Prices
Cattle 1407 1408 0.07% -0.08% 1406 -0.03% -0.02% 1407 0.01% 0.01% 1414 0.52% -0.61%
Milk 7 7 0.29% -0.10% 7 -0.02% -0.01% 7 0.06% 0.02% 7 -0.17% -0.02%
Beef 1915 1916 0.05% -0.03% 1914 -0.03% -0.01% 1914 -0.02% 0.00% 1905 -0.51% -0.19%
Dairy 12833 12839 0.04% -0.05% 12828 -0.04% -0.01% 12833 0.00% 0.00% 12782 -0.40% -0.06%
Table 10: Consumption in the EU (value in USD billion and quantities and consumer prices in percentage change)
Baseline Scenario 1 Scenario 3 Scenario 4 Scenario 5
Value Quantities Prices Value Quantities Prices 0.38 Quantities Prices Value Quantities Prices
Cattle 0.38 0.38 0.10% -0.11% 0.38 0.00% 0,00% 2.66 0.00% 0,00% 0.37 -0.67% 0.73%
Milk 2.66 2.67 0.19% -0.21% 2.66 0.00% 0,00% 56.12 0.00% 0,00% 2.66 -0.14% 0.13%
Beef 56.12 56.13 0.02% -0.04% 56.12 0.00% 0,00% 147.73 0.00% 0,00% 55.44 -1.20% 2.37%
Other meat 147.73 147.75 0.01% -0.01% 147.73 0.00% 0,00% 164.08 0.00% 0,00% 147.66 -0.05% 0.07%
Dairy 164.08 164.13 0.03% -0.05% 164.08 0.00% 0,00% 345,03 0.00% 0,00% 163.91 -0.11% 0.18%

H o w t o i n t e r p r e t m o d e l l i n g r e s u l t s
37
7. How to interpret modelling results The model used in this study is designed as a tool to compare different policy options. First a
reference scenario or baseline is simulated and then, after changing the policy settings, a new
scenario is run. Comparison of the new scenario with the baseline at a given point in the simulation
period, usually in terms of percentage differences, establishes the direction and relative magnitude
of the impact of the policy shock on all the endogenous variables at that point in time. In other
words, this model is intended to allow comparisons for the same moment in time (i.e. holding time
constant) between the outcomes prevailing in several different hypothetical "states of the world".
In the context of this study, the time period of interest is the year 2020, and the alternative states
of the world correspond to different hypothetical policy options on cloning technique in the EU and
trade patterns with selected countries assumed to adopt the cloning technique.
From the above considerations we conclude that the model should not be used as a tool to predict
individual values of particular variables. However, the model is reliable in simulating the impact of
a particular policy change in 2020, relative to the baseline situation, since the influences of any
imperfections in the model and of unforeseen exogenous shocks are likely to be cancelled out
across the two scenarios being compared, leaving a deviation between the two that has a lower
component of error.
Although this type of model is calibrated so as to fit a given historic base year very closely, its
projections become less reliable the further into the future it is used to simulate outcomes. Given
the very large number of assumptions, estimated or calibrated parameters, and stylised
specification features that these models assemble, each of which is ‘correct’ only up to an
(unknown) probability, it is impossible to establish confidence intervals or margins of error around
individual projected numbers. For this reason, users should be cautious about making elaborate
interpretations of rather small changes, or rejecting overall model outcomes because a few details
of a relatively minor order of magnitude appear counter-intuitive. Such results may simply be due
to ‘noise’ in the model, and could well be revealed as not significantly different from zero if only
their true probability distribution (given the large ‘probabilistic’ content of the model) could be
calculated.

C o n c l u s i o n s
39
8. Conclusions The analysis attempts to quantify the effect of the use of animal cloning techniques within the dairy
and beef chain under a set of different EU policy options as proposed by the European Commission
in the 2012 Roadmap entitled "Measures on animal cloning for food production in the EU". The
analysis focusses on the impact of the technique and its associated EU policies on trade patterns,
production levels and the EU domestic market.
In a first scenario (scenario 1) it is assumed that the cloning technique is available and will be used
in the EU and in third countries which signed the joint statement on animal cloning for livestock
production (Argentina, Brazil, New Zealand and the US). The analysis shows that this scenario
would only have a limited effect in the beef and dairy sector. Although the use of cloning increases
productivity and hence the competitiveness of the livestock sector vis-à-vis other sectors, the
application in major trade partners limits the effects on trade as relative competitiveness is hardly
affected.
In a next scenario (scenario 3) it is assumed that the EU would ban the use of the cloning
technique on its territory but allow imports from countries that use the technology. Therefore, the
selected trade partners using the technique of cloning would increase their relative competitiveness
towards the EU leading to increased EU imports. However, as the productivity improvement that
the cloning technique is expected to bring before 2020 is considered small, the change in the EU
trade balance is marginal. The increased imports of cattle, beef and dairy have in turn a negligible
effect on EU domestic prices and production as imports only represent a small part of domestic
use.
When traceability and labelling are added as a requirement for imports from countries using the
cloning technology (as in scenario 4), overall EU imports are almost unaltered compared to the
baseline but slightly down. The bilateral trade flows indicate that the imports from countries using
the technique of cloning decrease. This is because the cost of implementing traceability and
labelling systems offsets the benefits of the productivity increase from the application of cloning.
Again the changes are too small to lead to significant production or price effects in the EU’s
domestic market.
In a final scenario (scenario 5), it is assumed that EU imports of cattle, beef, milk and dairy come
to a halt for those countries using the technique of animal cloning. The assumed trade disruption
could be a direct result from a (temporary) ban by the EU on all imports of products derived from
cloned animals or their offspring. However, it could also stem from a de facto decision by exporters
not to export to the EU because of the associated high regulatory costs. As demonstrated in a
former scenario the costs of traceability and labelling requirements might outweigh the benefits of
exporting to the EU for some trade partners. This is especially the case when other export markets
exist that do not require similar systems (e.g. Asian markets).
The analysis shows that when imports from Brazil, US, Argentina and New Zealand are suspended
due to their use of the cloning technique, the gap in EU demand is filled by both increased
domestic production and diversified sources of imports. EU cattle production is expected to grow
about 4% while the beef sector grows slightly more with 6%. Although the percentage changes are
rather small the value of this expanded domestic production is significant representing about USD
4.28 billion. The production expansion is combined with a slight increase in producer prices. A
similar chain of events is expected for the milk and dairy sector. However, as the share of imports
in total production is smaller, the effect on domestic production and prices are less pronounced.
New import sources include Canada and Australia which significantly increase their exports to the
EU taking full advantage of their non-use of the animal cloning technique under this scenario.
40
However, the import substitution effect in the EU is not complete. Total EU imports decrease
significantly, by 50 % in case of cattle and beef and by 20% for dairy imports. This leads to an
increase in imports prices. For cattle and beef, import prices would rise by about 10% while the
price increase for dairy is only about 1%.
The relative tightness on the EU market and the increased domestic production have an impact on
the wider agricultural system. The production expansion in the EU affects the upstream supply
chain through an increased demand in feed and fodder of approximately 4%. This increased
demand leads to small price increases for all other land based production systems such as cereals.
European consumers at the other end of the supply chain would experience a slight price increase
as the increase in domestic production does not fully compensate for the decrease in imports. The
effect on consumer prices is most pronounced for beef where it amounts to about 2%. For cattle,
milk and dairy the price effects are considerably smaller, not surpassing 1%. The price of other
meat products, mainly poultry and pork, increases marginally through a combined effect of
consumer substitution and price increases in their input markets.
The combined impact of the allocation, trade and price changes can be economically estimated by
the change in total welfare. The analysis suggests that in the case where EU imports of cattle, beef,
milk and dairy from those countries using the technique of cloning are halted due to a ban or a de
facto interruption of trade, the EU would face a welfare loss of USD 1.7 billion.
A general caveat to the results is that the price and production effects could well be higher in
specific small or niche markets. The reason is twofold. First of all, the model cannot differentiate
between beef, goat, sheep and horse meat which in reality are differentiated markets. For
example, imports from New Zealand represent about 80% of the EU's total imports of sheep meat.
If these imports were halted, EU domestic production would not be able to fulfil demand, leading to
price effects for specific sheep meat products that could be higher than depicted in this study.
Secondly even within one commodity, goods are not necessarily considered homogeneous by the
consumer. In some high value niche markets such as marbled beef, a trade distortion could
increase prices sharply. These specific situations should be further investigated in order to fully
understand the economic effects of a trade ban for the EU.
R e f e r e n c e s
41
9. References
Aguiar, A., R. McDougall and B. Narayanan G., Eds (2012). Global Trade, Assistance, and
Production: The GTAP 8 Data Base, Center for Global Trade Analysis, Purdue University.
Available online at: https://www.gtap.agecon.purdue.edu/databases/v8/v8_doco.asp
Aphis, USDA, (2009). Benefit cost analysis of the National Animal Identification System. Available
online at http://www.aphis.usda.gov/traceability/downloads/Benefit_Cost_Analysis.pdf
Armington, Paul S. (1969). A Theory of Demand for Products Distinguished by Place of Production.
International Monetary Fund Staff Papers 16: 159-178.
Britz, W. and Witzke, H.P. (2008). CAPRI model documentation 2008: Version 2. Available online at
at http://www.capri-model.org/docs/capri_documentation.pdf.
Burrell, A., E. Ferrari, A. Gonzalez Mellado, M. Himics, J. Michalek, S. Shrestha and B. Van
Doorslaer (2011), Potential EU-Mercosur Free Trade Agreement: Impact Assessment,
JRC Reference Report. Available online at
http://ipts.jrc.ec.europa.eu/publications/pub.cfm?id=4819
Butler, L. J., and Marianne McGarry Wolf (2010). Economic Analysis of the Impact of Cloning on
Improving Dairy Herd Composition. AgBioForum 13 (2): 194-207.
Dematawewa, C.M.B., & Berger, P.J. (1998). Break-even cost of cloning in genetic improvement of
dairy cattle. Journal of Dairy Science 81(4): 1136-1147.
de Melo, J. and Robinson, S. (1989). Product differentiation and the treatment of foreign trade in
Computable General Equilibrium models of small economies. Journal of International
Economics 27: 47-67.
de Melo, J. and Robinson, S. (1992). Productivity and externalities: models of export-led growth.
Journal of Economic Trade and Economic Development 1: 41-68.
Hélaine, S., Himics, M., M'barek, R., Caivano, A. (2013), DataM, Data on Agriculture, Trade and
Models (forthcoming)
Devarajan, S., Lewis, J.D. and Robinson, S. (1990). Policy lessons from trade-focused, two- sector
models. Journal of Policy Modeling 12: 625-657.
Directorate General for Agriculture and Rural Development (2012), Beef & veal market situation, "Single CMO" Management Committee, 20 September 2012
Directorate General for Agriculture and Rural Development (2012), EU Sheep and goat Meat market situation, "Single CMO" Management Committee, 20 September 2012
Directorate General for Agriculture and Rural Development (2011), Milk Market Situation. Available online at http://ec.europa.eu/agriculture/milk/background/jm-2011-07-06/03-agr-ic4_en.pdf
European Commission (2010). Report from the Commission to the European Parliament and the
Council on animal cloning for food production. Brussels, European Commission.
European Commission (2012). Measures on animal cloning for food production in the EU. Roadmap
Version No.2, February 2012, EC DG SANCO.
FAOSTAT, Food and Agriculture Organization of the United Nations, Statistics division. Available
online at http://faostat.fao.org/site/339/default.aspx
Fellmann, T. and Hélaine, S. (2012), Commodity Market Development in Europe – Outlook, JRC
Scientific and Policy Reports. Available online at http://ftp.jrc.es/EURdoc/JRC76028.pdf
42
Hansen, P. J. and J. Block (2004). "Towards an embryocentric world: The current and potential
uses of embryo technologies in dairy production." Reproduction, Fertility, and Development
16: 1-14.
Hertel, T.W. (1997). Global Trade Analysis: Modeling and Applications. Cambridge: Cambridge
University Press.
Institut de l'Elevage (2011), Le marché mondial de la viande bovine en 2011, Dossier de l'Elevage
n°419, December 2011.
Löfgren, H., Harris, R.L. and Robinson. S., with Thomas, M. and El-Said, M. (2002).
Microcomputers in Policy Research 5: A Standard Computable General Equilibrium (CGE)
Model in GAMS. Washington: IFPRI.
M’barek, R. W. Britz, A. Burrell and J. Delincé (Eds.), (2012), An Integrated Modelling Platform for
Agro-economic Commodity and Policy Analysis (iMAP) – a look back and the way forward,
JRC Scientific and Policy Reports. Available online at http://ftp.jrc.es/EURdoc/JRC69667.pdf
McDonald, S. (2003). A standard Computable General Equilibrium model: Technical
Documentation. PROVIDE Project Technical Paper 2003:03, Elsenburg, RSA.
McDonald, S., Thierfelder, K. and Walmsley, T. (undated). Globe v2: A SAM Based Global CGE
Model using GTAP Data. Unpublished paper. Available online at
http://www.cgemod.org.uk/globev2_2012.pdf
McDonald, S. and van Tongeren, F. W. (2003). Alternative closures in GTAP. Course material and
lecture notes presented at the Twelfth Annual Short Course of Global Trade Analysis, August
7-13, Purdue University.
OECD (2011), OECD-FAO Agricultural Outlook 2011-2020.
Robinson, S., Kilkenny, M. and Hanson, K. (1990). USDA/ERS Computable General Equilibrium
Model of the United States, Economic Research Services, USDA. Staff Report AGES 9049.
Robinson, S. and Löfgren, H., 2005. Macro Models and Poverty Analysis: Theoretical Tensions and
Empirical Practice. Development Policy Review, 23: 267-283.
Taylor, L. and Arnim, von R. (2006). Computable General Equilibrium Models of Trade
Liberalization: The Doha Debate. Discussion Paper, New School for Social Research, New
York.
USDA PS&D, United States Department of Agriculture, Production, Supply and Distribution.
Available online at http://www.fas.usda.gov/psdonline/psdDownload.aspx
Van der Mensbrugghe, D. (2005). The LINKAGE model Version 6.0. Technical Reference Document.
Development Prospects Group (DECPG), World Bank.
A n n e x e s
43
10. Annexes: Model specification and details of
scenarios Table A1.1: Sector aggregation in GLOBE
Table A1.2: Regional aggregation in GLOBE
Table A1.3: Behavioural relationships by ‘account’ in GLOBE
Table A1.4: Assumptions about exogenous trends in GLOBE, 2007-2020
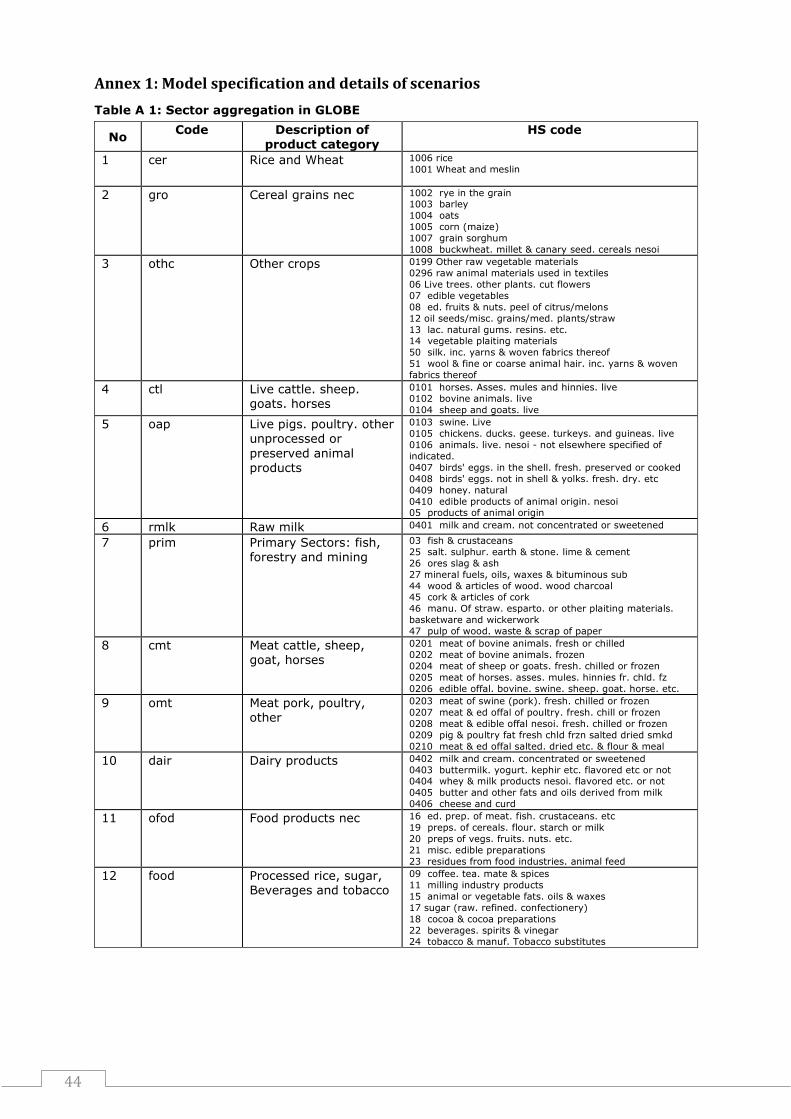
44
Annex 1: Model specification and details of scenarios
Table A 1: Sector aggregation in GLOBE
No Code Description of
product category HS code
1 cer Rice and Wheat 1006 rice
1001 Wheat and meslin
2 gro Cereal grains nec 1002 rye in the grain 1003 barley
1004 oats
1005 corn (maize)
1007 grain sorghum
1008 buckwheat. millet & canary seed. cereals nesoi
3 othc Other crops 0199 Other raw vegetable materials
0296 raw animal materials used in textiles
06 Live trees. other plants. cut flowers
07 edible vegetables
08 ed. fruits & nuts. peel of citrus/melons
12 oil seeds/misc. grains/med. plants/straw
13 lac. natural gums. resins. etc. 14 vegetable plaiting materials
50 silk. inc. yarns & woven fabrics thereof
51 wool & fine or coarse animal hair. inc. yarns & woven
fabrics thereof
4 ctl Live cattle. sheep. goats. horses
0101 horses. Asses. mules and hinnies. live
0102 bovine animals. live
0104 sheep and goats. live
5 oap Live pigs. poultry. other unprocessed or
preserved animal products
0103 swine. Live
0105 chickens. ducks. geese. turkeys. and guineas. live
0106 animals. live. nesoi - not elsewhere specified of
indicated.
0407 birds' eggs. in the shell. fresh. preserved or cooked
0408 birds' eggs. not in shell & yolks. fresh. dry. etc
0409 honey. natural
0410 edible products of animal origin. nesoi 05 products of animal origin
6 rmlk Raw milk 0401 milk and cream. not concentrated or sweetened
7 prim Primary Sectors: fish, forestry and mining
03 fish & crustaceans
25 salt. sulphur. earth & stone. lime & cement
26 ores slag & ash
27 mineral fuels, oils, waxes & bituminous sub
44 wood & articles of wood. wood charcoal 45 cork & articles of cork
46 manu. Of straw. esparto. or other plaiting materials.
basketware and wickerwork
47 pulp of wood. waste & scrap of paper
8 cmt Meat cattle, sheep, goat, horses
0201 meat of bovine animals. fresh or chilled
0202 meat of bovine animals. frozen
0204 meat of sheep or goats. fresh. chilled or frozen
0205 meat of horses. asses. mules. hinnies fr. chld. fz
0206 edible offal. bovine. swine. sheep. goat. horse. etc.
9 omt Meat pork, poultry,
other
0203 meat of swine (pork). fresh. chilled or frozen
0207 meat & ed offal of poultry. fresh. chill or frozen
0208 meat & edible offal nesoi. fresh. chilled or frozen
0209 pig & poultry fat fresh chld frzn salted dried smkd
0210 meat & ed offal salted. dried etc. & flour & meal
10 dair Dairy products 0402 milk and cream. concentrated or sweetened
0403 buttermilk. yogurt. kephir etc. flavored etc or not 0404 whey & milk products nesoi. flavored etc. or not
0405 butter and other fats and oils derived from milk
0406 cheese and curd
11 ofod Food products nec 16 ed. prep. of meat. fish. crustaceans. etc
19 preps. of cereals. flour. starch or milk
20 preps of vegs. fruits. nuts. etc.
21 misc. edible preparations
23 residues from food industries. animal feed
12 food Processed rice, sugar, Beverages and tobacco
09 coffee. tea. mate & spices
11 milling industry products
15 animal or vegetable fats. oils & waxes
17 sugar (raw. refined. confectionery)
18 cocoa & cocoa preparations
22 beverages. spirits & vinegar 24 tobacco & manuf. Tobacco substitutes
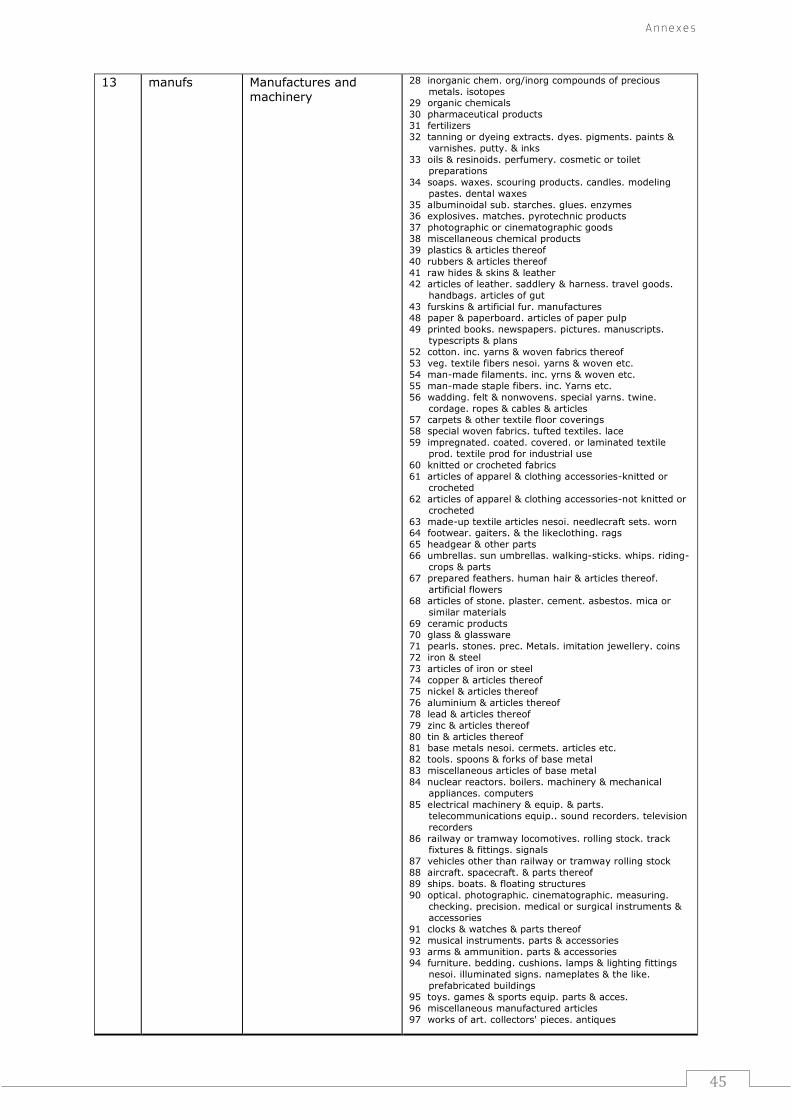
A n n e x e s
45
13 manufs Manufactures and
machinery
28 inorganic chem. org/inorg compounds of precious
metals. isotopes 29 organic chemicals
30 pharmaceutical products
31 fertilizers
32 tanning or dyeing extracts. dyes. pigments. paints &
varnishes. putty. & inks
33 oils & resinoids. perfumery. cosmetic or toilet
preparations
34 soaps. waxes. scouring products. candles. modeling
pastes. dental waxes
35 albuminoidal sub. starches. glues. enzymes 36 explosives. matches. pyrotechnic products
37 photographic or cinematographic goods
38 miscellaneous chemical products
39 plastics & articles thereof
40 rubbers & articles thereof
41 raw hides & skins & leather
42 articles of leather. saddlery & harness. travel goods.
handbags. articles of gut
43 furskins & artificial fur. manufactures 48 paper & paperboard. articles of paper pulp
49 printed books. newspapers. pictures. manuscripts.
typescripts & plans
52 cotton. inc. yarns & woven fabrics thereof
53 veg. textile fibers nesoi. yarns & woven etc.
54 man-made filaments. inc. yrns & woven etc.
55 man-made staple fibers. inc. Yarns etc.
56 wadding. felt & nonwovens. special yarns. twine.
cordage. ropes & cables & articles 57 carpets & other textile floor coverings
58 special woven fabrics. tufted textiles. lace
59 impregnated. coated. covered. or laminated textile
prod. textile prod for industrial use
60 knitted or crocheted fabrics
61 articles of apparel & clothing accessories-knitted or
crocheted
62 articles of apparel & clothing accessories-not knitted or
crocheted
63 made-up textile articles nesoi. needlecraft sets. worn 64 footwear. gaiters. & the likeclothing. rags
65 headgear & other parts
66 umbrellas. sun umbrellas. walking-sticks. whips. riding-
crops & parts
67 prepared feathers. human hair & articles thereof.
artificial flowers
68 articles of stone. plaster. cement. asbestos. mica or
similar materials
69 ceramic products 70 glass & glassware
71 pearls. stones. prec. Metals. imitation jewellery. coins
72 iron & steel
73 articles of iron or steel
74 copper & articles thereof
75 nickel & articles thereof
76 aluminium & articles thereof
78 lead & articles thereof
79 zinc & articles thereof
80 tin & articles thereof 81 base metals nesoi. cermets. articles etc.
82 tools. spoons & forks of base metal
83 miscellaneous articles of base metal
84 nuclear reactors. boilers. machinery & mechanical
appliances. computers
85 electrical machinery & equip. & parts.
telecommunications equip.. sound recorders. television
recorders
86 railway or tramway locomotives. rolling stock. track fixtures & fittings. signals
87 vehicles other than railway or tramway rolling stock
88 aircraft. spacecraft. & parts thereof
89 ships. boats. & floating structures
90 optical. photographic. cinematographic. measuring.
checking. precision. medical or surgical instruments &
accessories
91 clocks & watches & parts thereof
92 musical instruments. parts & accessories
93 arms & ammunition. parts & accessories 94 furniture. bedding. cushions. lamps & lighting fittings
nesoi. illuminated signs. nameplates & the like.
prefabricated buildings
95 toys. games & sports equip. parts & acces.
96 miscellaneous manufactured articles
97 works of art. collectors' pieces. antiques
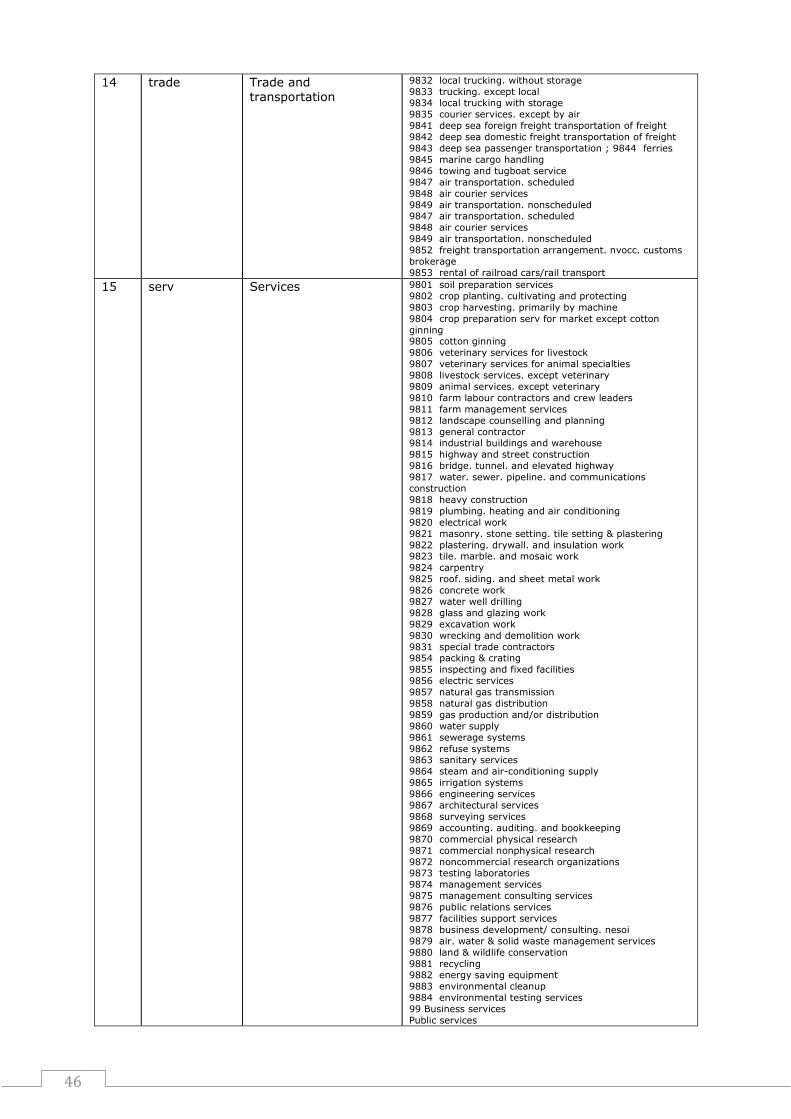
46
14 trade Trade and
transportation
9832 local trucking. without storage
9833 trucking. except local 9834 local trucking with storage
9835 courier services. except by air
9841 deep sea foreign freight transportation of freight
9842 deep sea domestic freight transportation of freight
9843 deep sea passenger transportation ; 9844 ferries
9845 marine cargo handling
9846 towing and tugboat service
9847 air transportation. scheduled
9848 air courier services
9849 air transportation. nonscheduled 9847 air transportation. scheduled
9848 air courier services
9849 air transportation. nonscheduled
9852 freight transportation arrangement. nvocc. customs
brokerage
9853 rental of railroad cars/rail transport
15 serv Services 9801 soil preparation services
9802 crop planting. cultivating and protecting
9803 crop harvesting. primarily by machine
9804 crop preparation serv for market except cotton
ginning 9805 cotton ginning
9806 veterinary services for livestock
9807 veterinary services for animal specialties
9808 livestock services. except veterinary
9809 animal services. except veterinary
9810 farm labour contractors and crew leaders
9811 farm management services
9812 landscape counselling and planning
9813 general contractor 9814 industrial buildings and warehouse
9815 highway and street construction
9816 bridge. tunnel. and elevated highway
9817 water. sewer. pipeline. and communications
construction
9818 heavy construction
9819 plumbing. heating and air conditioning
9820 electrical work
9821 masonry. stone setting. tile setting & plastering
9822 plastering. drywall. and insulation work 9823 tile. marble. and mosaic work
9824 carpentry
9825 roof. siding. and sheet metal work
9826 concrete work
9827 water well drilling
9828 glass and glazing work
9829 excavation work
9830 wrecking and demolition work
9831 special trade contractors 9854 packing & crating
9855 inspecting and fixed facilities
9856 electric services
9857 natural gas transmission
9858 natural gas distribution
9859 gas production and/or distribution
9860 water supply
9861 sewerage systems
9862 refuse systems 9863 sanitary services
9864 steam and air-conditioning supply
9865 irrigation systems
9866 engineering services
9867 architectural services
9868 surveying services
9869 accounting. auditing. and bookkeeping
9870 commercial physical research
9871 commercial nonphysical research
9872 noncommercial research organizations 9873 testing laboratories
9874 management services
9875 management consulting services
9876 public relations services
9877 facilities support services
9878 business development/ consulting. nesoi
9879 air. water & solid waste management services
9880 land & wildlife conservation
9881 recycling 9882 energy saving equipment
9883 environmental cleanup
9884 environmental testing services
99 Business services
Public services
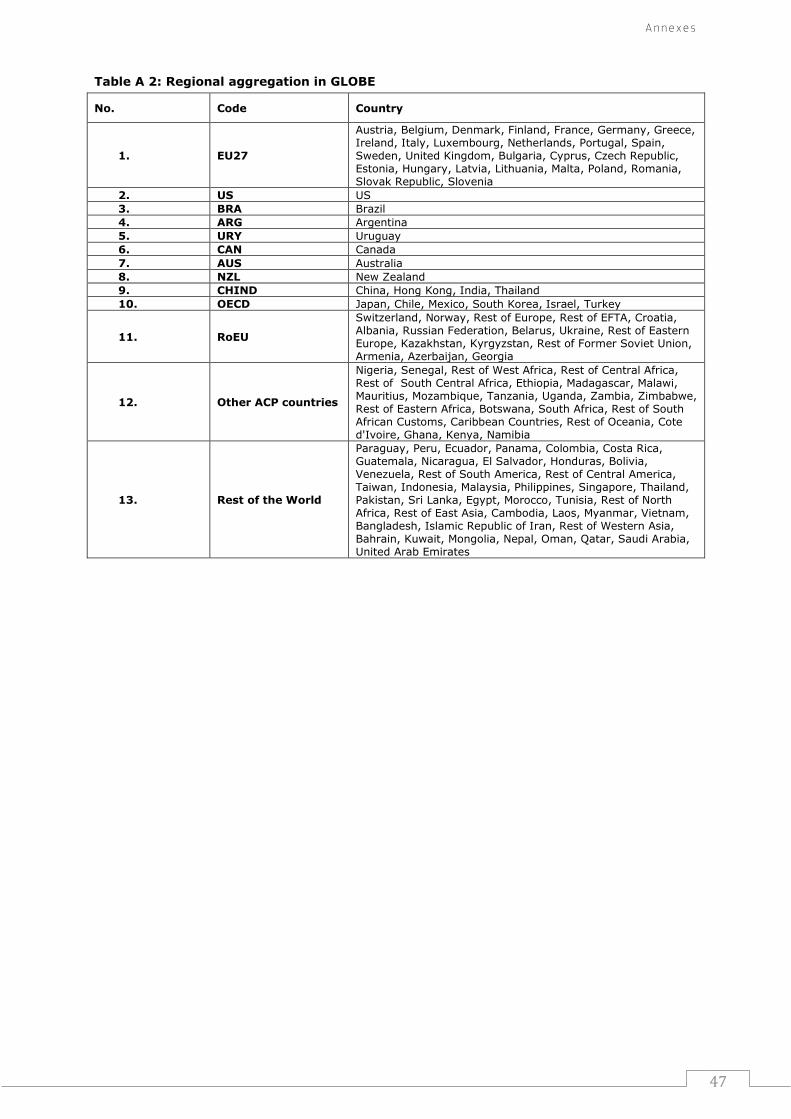
A n n e x e s
47
Table A 2: Regional aggregation in GLOBE
No. Code Country
1. EU27
Austria, Belgium, Denmark, Finland, France, Germany, Greece, Ireland, Italy, Luxembourg, Netherlands, Portugal, Spain, Sweden, United Kingdom, Bulgaria, Cyprus, Czech Republic, Estonia, Hungary, Latvia, Lithuania, Malta, Poland, Romania, Slovak Republic, Slovenia
2. US US
3. BRA Brazil
4. ARG Argentina
5. URY Uruguay
6. CAN Canada
7. AUS Australia
8. NZL New Zealand
9. CHIND China, Hong Kong, India, Thailand
10. OECD Japan, Chile, Mexico, South Korea, Israel, Turkey
11. RoEU
Switzerland, Norway, Rest of Europe, Rest of EFTA, Croatia, Albania, Russian Federation, Belarus, Ukraine, Rest of Eastern Europe, Kazakhstan, Kyrgyzstan, Rest of Former Soviet Union, Armenia, Azerbaijan, Georgia
12. Other ACP countries
Nigeria, Senegal, Rest of West Africa, Rest of Central Africa, Rest of South Central Africa, Ethiopia, Madagascar, Malawi, Mauritius, Mozambique, Tanzania, Uganda, Zambia, Zimbabwe, Rest of Eastern Africa, Botswana, South Africa, Rest of South African Customs, Caribbean Countries, Rest of Oceania, Cote d'Ivoire, Ghana, Kenya, Namibia
13. Rest of the World
Paraguay, Peru, Ecuador, Panama, Colombia, Costa Rica, Guatemala, Nicaragua, El Salvador, Honduras, Bolivia, Venezuela, Rest of South America, Rest of Central America, Taiwan, Indonesia, Malaysia, Philippines, Singapore, Thailand, Pakistan, Sri Lanka, Egypt, Morocco, Tunisia, Rest of North Africa, Rest of East Asia, Cambodia, Laos, Myanmar, Vietnam, Bangladesh, Islamic Republic of Iran, Rest of Western Asia, Bahrain, Kuwait, Mongolia, Nepal, Oman, Qatar, Saudi Arabia, United Arab Emirates
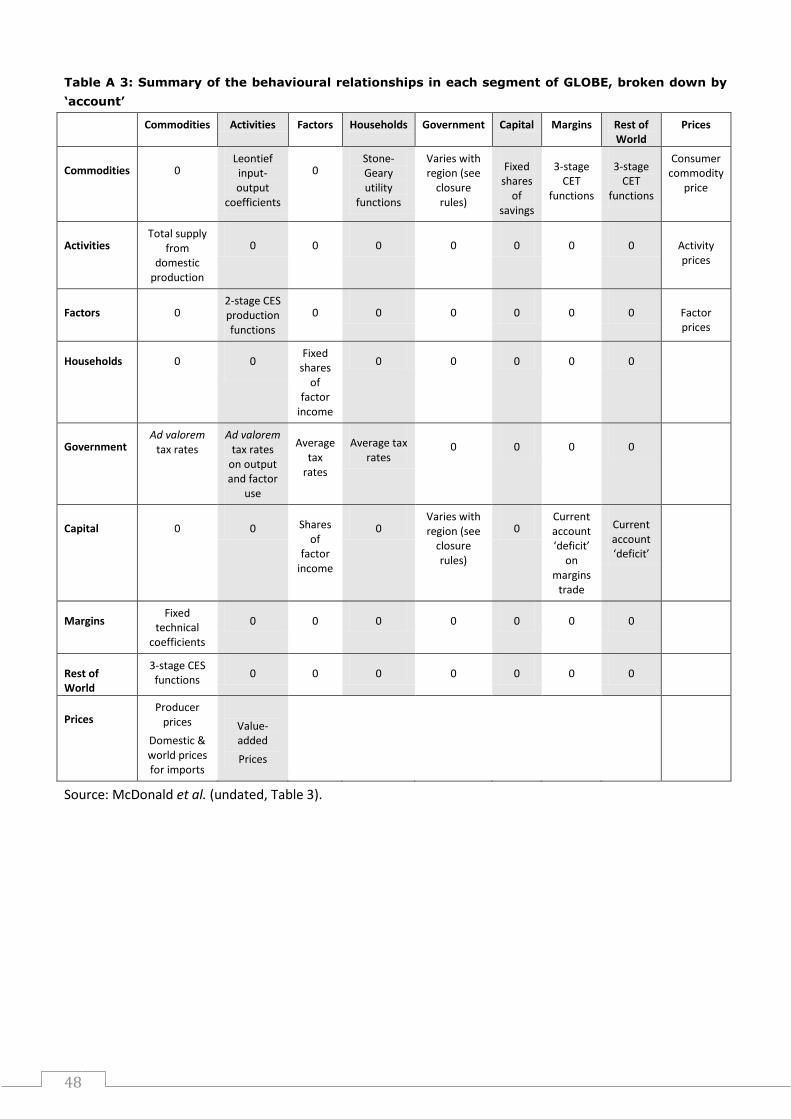
48
Table A 3: Summary of the behavioural relationships in each segment of GLOBE, broken down by
‘account’
Commodities Activities Factors Households Government Capital Margins Rest of World
Prices
Commodities 0 Leontief input-output
coefficients
0 Stone-Geary utility
functions
Varies with region (see
closure rules)
Fixed shares
of savings
3-stage CET
functions
3-stage CET
functions
Consumer commodity
price
Activities Total supply
from domestic
production
0 0 0 0 0 0 0 Activity prices
Factors 0 2-stage CES production functions
0 0 0 0 0 0 Factor prices
Households 0 0 Fixed
shares of
factor income
0 0 0 0 0
Government Ad valorem
tax rates Ad valorem
tax rates on output and factor
use
Average tax
rates
Average tax rates
0 0 0 0
Capital 0 0 Shares of
factor income
0 Varies with region (see
closure rules)
0 Current account ‘deficit’
on margins
trade
Current account ‘deficit’
Margins Fixed
technical coefficients
0 0 0 0 0 0 0
Rest of World
3-stage CES functions
0 0 0 0 0 0 0
Prices Producer
prices
Domestic & world prices for imports
Value-added
Prices
Source: McDonald et al. (undated, Table 3).
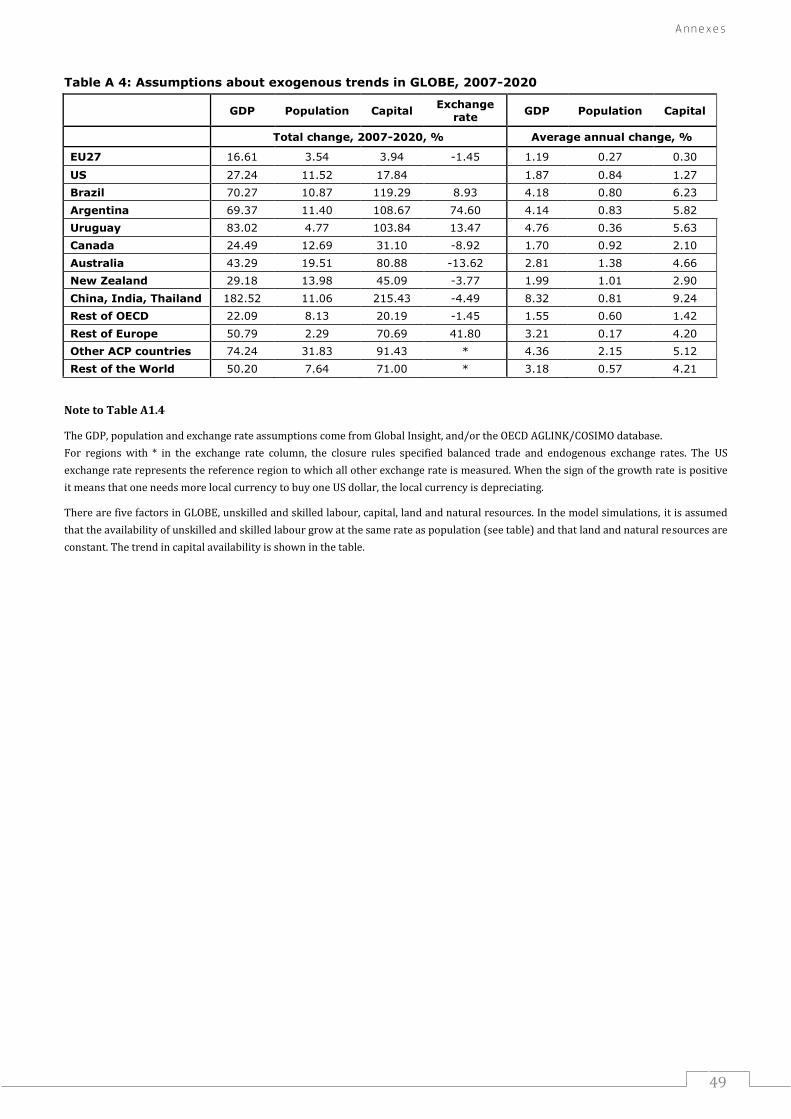
A n n e x e s
49
Table A 4: Assumptions about exogenous trends in GLOBE, 2007-2020
GDP Population Capital
Exchange rate
GDP Population Capital
Total change, 2007-2020, % Average annual change, %
EU27 16.61 3.54 3.94 -1.45 1.19 0.27 0.30
US 27.24 11.52 17.84 1.87 0.84 1.27
Brazil 70.27 10.87 119.29 8.93 4.18 0.80 6.23
Argentina 69.37 11.40 108.67 74.60 4.14 0.83 5.82
Uruguay 83.02 4.77 103.84 13.47 4.76 0.36 5.63
Canada 24.49 12.69 31.10 -8.92 1.70 0.92 2.10
Australia 43.29 19.51 80.88 -13.62 2.81 1.38 4.66
New Zealand 29.18 13.98 45.09 -3.77 1.99 1.01 2.90
China, India, Thailand 182.52 11.06 215.43 -4.49 8.32 0.81 9.24
Rest of OECD 22.09 8.13 20.19 -1.45 1.55 0.60 1.42
Rest of Europe 50.79 2.29 70.69 41.80 3.21 0.17 4.20
Other ACP countries 74.24 31.83 91.43 * 4.36 2.15 5.12
Rest of the World 50.20 7.64 71.00 * 3.18 0.57 4.21
Note to Table A1.4
The GDP, population and exchange rate assumptions come from Global Insight, and/or the OECD AGLINK/COSIMO database.
For regions with * in the exchange rate column, the closure rules specified balanced trade and endogenous exchange rates. The US
exchange rate represents the reference region to which all other exchange rate is measured. When the sign of the growth rate is positive
it means that one needs more local currency to buy one US dollar, the local currency is depreciating.
There are five factors in GLOBE, unskilled and skilled labour, capital, land and natural resources. In the model simulations, it is assumed
that the availability of unskilled and skilled labour grow at the same rate as population (see table) and that land and natural resources are
constant. The trend in capital availability is shown in the table.

European Commission
EUR 25856 – Joint Research Centre – Institute for Prospective Technological Studies
Title: Contribution to the impact assessment of policy options to regulate animal cloning for food production with an economic simulation model
Authors: Koen Dillen, Emanuele Ferrari, Pascal Tillie, George Philippidis and Sophie Helaine
Luxembourg: Publications Office of the European Union
2013- 50 pp. – 21.0 x 29.7 cm
EUR – Scientific and Technical Research series – ISSN 1831-9424 (online)
ISBN 978-92-79-28941-5 (pdf)
doi:10.2791/ 84519
Abstract
The European Commission is currently evaluating different policy options towards the use of cloning or products derived from cloned animals in the
food chain. This study presents a first attempt to quantify the likely effects of different policy scenarios on international trade and EU domestic
production. In the context of the Impact Assessment process carried out by the European Commission, the JRC was requested to simulate via a
modelling study the economic impacts of selected policy options.
Based on a literature review and after considering the specific objectives of this study, the choice was made to perform the analysis employing a
Computable General Equilibrium (CGE) model called GLOBE and to focus on the dairy and beef sectors. Different model scenarios were constructed
based on combinations of the discussed policy options such as a ban, or traceability and labelling requirements with associated productivity
increases arising from the use of the cloning technique.
The results indicate that only in the case where trade with countries employing cloning techniques is suspended, is there a noticeable effect on
competitiveness. This suspension could be due to express prohibitions or a de facto decision by exporters when traceability and labelling costs
increase. Under this scenario, imports drop significantly which is followed by a slight increase in domestic production and prices, especially for beef
and cattle.
As the Commission’s in-house science service, the Joint Research Centre’s mission is to provide EU policies with independent, evidence-based scientific and technical support throughout the whole policy cycle. Working in close cooperation with policy Directorates-General, the JRC addresses key societal challenges while stimulating innovation through developing new standards, methods and tools, and sharing and transferring its know-how to the Member States and international community. Key policy areas include: environment and climate change; energy and transport; agriculture and food security; health and consumer protection; information society and digital agenda; safety and security including nuclear; all supported through a cross-cutting and multi-disciplinary approach.
LF-NA
-25
856
-EN-N