Embed Size (px)
Citation preview
Agribusiness and Applied Economics Report No. 765 June 2017
Contribution of United Tribes Technical
College to North Dakota’s Economy in 2016
Randal C. Coon
Nancy M. Hodur
Dean A. Bangsund

Acknowledgments
The North Dakota Association of Tribal Colleges and Universities (NDATC) provided
financial support for this project. The association is a private, non-profit organization established
in 1994 and is comprised of the five Tribal Colleges and Universities (TCUs) located in North
Dakota. Member institutions and the Board of Directors are:
Cynthia Lindquist, President, Cankdeska Cikana Community College (CCCC)
Twyla Baker-Demaray, President, Nueta Hidatsa Sahnish College NHSC)
Laurel Vermillion, President, Sitting Bull College (SBC)
James Davis, President, Turtle Mountain Community College (TMCC)
Leander “Russ” McDonald, President, United Tribes Technical College (UTTC)
The North Dakota Tribal Colleges are members of the American Indian Higher Education
Consortium (AIHEC).
This research effort was based on actual expenditures data (annual audits) provided by
each of the five respective Tribal Colleges in North Dakota. Special thanks to each of the
colleges and individuals that provided requested information. This effort would not have been
possible without their participation.
Thanks are extended to Norma Ackerson for document preparation and to our colleagues
in the Department of Agribusiness and Applied Economic and the Center for Social Research for
document review.
The authors assume responsibility for any errors of omission, logic, or otherwise. Any
opinions, findings, and conclusions expressed in this publication are those of the authors and do
not necessarily reflect the view of the Department of Agribusiness and Applied Economics,
North Dakota State University (NDSU), or the study sponsors.
This publication is available electronically at this web site: http://agecon.lib.umn.edu/.
NDSU is an equal opportunity institution.
North Dakota State University does not discriminate on the basis of age, color, disability,
gender expression/identity, genetic information, marital status, national origin, public assistance
status, race, religion, sex, sexual orientation, or status as a U.S. veteran. Please address your
inquiries regarding this publication to: Department of Agribusiness & Applied Economics, P.O.
Box 6050, Fargo, ND 58108-6050, Phone: 701-231-7441, Fax: 701-231-7400, Email:
Copyright © 2017 by Coon, Hodur and Bangsund. All rights reserved. Readers may
make verbatim copies of this document for non-commercial purposes by any means, provided
this copyright notice appears on all such copies.


TABLE OF CONENTS
Page
List of Tables ................................................................................................................................................ ii
List of Figures ............................................................................................................................................... ii
Executive Summary ...................................................................................................................................... v
Introduction ................................................................................................................................................... 1
Background of United Tribes Technical College ......................................................................................... 2
Methods ........................................................................................................................................................ 3
Results........................................................................................................................................................... 4
Student Economic Impact ............................................................................................................................. 5
Value of a College Education ....................................................................................................................... 7
Conclusions ................................................................................................................................................. 16
References ................................................................................................................................................... 17
ii
LIST OF TABLES
Page
Table 1. Direct, Secondary, and Total Economic Impacts for United Tribes Technical College
Operations, FY2016 ...................................................................................................................................... 5
Table 2. Direct, Secondary, and Total Economic Impacts for United Tribes Technical College
College Student Spending, Academic Year 2015-2016 ................................................................................ 7
LIST OF FIGURES
Page
Figure 1. Unemployment Rate, by Level of Education, United States, 2015................................................ 9
Figure 2. Medium Annual Earnings, Adults Age 25 and Older, Full-time Year-round,
United States, 2015 ..................................................................................................................................... 10
Figure 3 Ratio of Expected Lifetime Earnings Relative to High School Graduates in the United States,
by Education Level, 2005 ........................................................................................................................... 12
Figure 4. Percent Average Difference, Associate’s, Bachelor’s, Master’s Degree Compared to High School
Diploma, 2005, 2008, 2011, 2015 ............................................................................................................... 13
Figure 5. Level of Educational Attainment, North Dakota and North Dakota
Native American Reservations,2015 ........................................................................................................... 14
Figure 6. Level of Educational Attainment, by Degree Type, United States, North Dakota and
North Dakota Native American Reservations, 2015 ................................................................................... 15
Figure 7. High School Graduation and Dropout Rates, North Dakota and North Dakota Native American
Reservation School Districts, 2015 ............................................................................................................. 16


v
Executive Summary
The North Dakota Association of Tribal Colleges (NDATC) is comprised of the state’s five
Tribal Colleges. Tribal Colleges are relatively new in North Dakota. Established in 1969, United Tribes
Technical College was the first of the state’s Tribal Colleges established. Tribal Colleges were
established to provide post-secondary cultural-based educational opportunities on North Dakota’s
Native American reservations and for the urban Indian population in the Bismarck-Mandan area.
Expenditure and enrollment data provided by each respective college were used to estimate the
economic impact for each of the individual colleges and the cumulative impact of the five Tribal
Colleges. The combined economic impact of the five colleges is reported in Coon et al. 2017a. This
report will focus specifically on the United Tribes Technical College in Bismarck, North Dakota.
Expenditures by tribal colleges constitute the direct, or first-round, economic effects.
United Tribes Technical College spent $20.0 million in North Dakota in Fiscal Year (FY) 2016. More
than half of these expenditures (direct effects) ($12.1 million) represent personal income consisting of
payments for wages and salaries. Total economic impact (direct plus secondary) of United Tribes
Technical College was $59.6 million in FY2016. Total business activity (direct plus secondary) in the
Households sector (economy-wide personal income) was $24.8 million, and was followed by $15.5
million in the Retail Trade sector. United Tribes Technical College employed 217 full-time and 70 part-
time workers. Levels of business activity generated by United Tribes Technical College expenditures
would support an additional 140 secondary jobs in various sectors of the North Dakota economy.
In addition to expenditures related to the college’s operations, student spending also contributes
to the economic impacts associated with the college. Expenditures by full-time and part-time students
for personal items, recreation, books, supplies, and room and board were estimated to be $5.2 million in
the 2015-2016 academic year. Total economic impact (direct plus secondary) from student spending was
$12.9 million ($5.2 million in direct impacts plus $7.7 million in secondary impacts). Student spending
would generate enough economic activity to support 23 secondary (indirect and induced) jobs in North
Dakota.
United Tribes Technical College provides valuable post-secondary educational programs which
result in both social and economic benefits. While the social value of a college degree is difficult to
quantify, the economic value can be described in terms of business activity, lower unemployment,
higher median annual earnings, and a higher total lifetime income. Social and economic benefits accrue
to individuals with higher academic achievement. Previous studies have determined that college
graduates have healthier lifestyles, healthier children, increased job satisfaction, have shown decreased
prejudice, enhanced knowledge of world affairs, and have enhanced social status. Many of these
benefits are passed onto succeeding generations. Further, college graduates have lower unemployment
rates and higher annual incomes. United Tribes Technical College and its students have substantial
impacts on their local economy.


1
Contribution of United Tribes Technical College to North Dakota’s
Economy in 2016
Randal C. Coon, Nancy M. Hodur, and Dean A. Bangsund*
Introduction
North Dakota has numerous institutions of higher education. The North Dakota University
System (NDUS) consists of 11 colleges and the North Dakota Association of Tribal Colleges (NDATC)
consists of five institutions. One of those five institutions is United Tribes Technical College (UTTC).
Located in Bismarck, UTTC serves multi-tribal members from across the United States. The Tribal
Colleges are relatively new to the state’s educational system compared to the North Dakota University
System’s Colleges and Universities. Established in 1969, United Tribes Technical College in Bismarck
was the first tribal college charted. In addition to educational opportunities for students, UTTC has an
economic impact on the state and local community. United Tribes Technical College makes
expenditures for goods and services purchased in the state, hires employees to staff their institutions,
and constructs campus buildings to deliver post-secondary, cultural-based education. The purpose of
this study is to estimate the economic impact that UTTC’s operations and student expenditures have on
North Dakota’s economy. The combined economic effects of the five Tribal Colleges are reported in
Coon et al. 2017a, while this report will focus specifically on the economic impacts of UTTC.
Consistent with other studies, an economic impact analysis will be completed for each of the other four
Tribal Colleges and presented in separate reports (Coon et al. 2017b, Coon et al. 2017c, Coon et al.
2017d, and Coon et al. 2017e). Methods, analysis, and format are consistent for each of the five colleges
and previous assessments of the colleges’ economic effects. Methods and analysis are also consistent
with an assessment of the economic contribution of the North Dakota University System. This analysis
will parallel studies conducted for the North Dakota University System.
An economic impact assessment of the North Dakota Association of Tribal Colleges was
previously completed in 2012 (Coon et al. 2013). The current study will update the previous study and
estimate the economic impact of UTTC operations in FY2016 and student spending during the 2015-
2016 academic year using similar analytic method as previous studies. Prior to the 2012 study, the
impacts of Tribal Colleges were examined individually; Cankdeska Cikana Community College for
FY2008 (Leistritz and Bangsund 2008), Sitting Bull College for FY2009 (Leistritz and Bangsund 2010),
and United Tribes Technical College for FY2010 (Gipp et al. 2011). The North Dakota University
System has sponsored several economic impact assessments beginning with FY1999 and FY2004
(Leistritz and Coon 2005), FY2006 (Leistritz and Coon 2007), FY2008 (Leistritz and Coon 2009),
FY2009 (Bangsund et al. 2010), FY2011 (Coon et al. 2012a), FY2012 and FY2013 (Coon et al. 2014),
and FY2014 and FY2015 (Coon et al. 2017).
In addition to the economic impact analysis, this study examines the value of a college
education. A comprehensive review of published literature summarizes the social and economic value
of a college education. While data on the value of a college education is not specific to North Dakota’s
*The authors are, respectively, Research Specialist, Director, Center for Social Research, and Research Scientist,
North Dakota State University, Fargo.
2
Tribal Colleges, they illustrate the value of a college education in general. Published statistics and
selected research findings highlight the social and economic value of a post-secondary education. Also
contained within this report is background information about the college including a history of the
school, campus location, academic areas of study, degrees granted, and the mission of the college.
Background of United Tribes Technical College
The United Tribes of North Dakota Development Corporation was chartered in 1968 to address
the need for training and job development for Native Americans. The United Tribes consists of the five
federally recognized tribes in the state: the Three Affiliated Tribes of the Mandan/Hidatsa/Arikara
Nation, Spirit Lake Dakota Tribe, Sisseton Wahpeton Oyate, Standing Rock Lakota Tribe, and Turtle
Mountain Band of Chippewa Indians. United Tribes of North Dakota Development Corporation
purchased Fort Lincoln, a former military post south of Bismarck, from the federal government and
converted it into a training facility. The facility was named United Tribes Employment Training Center,
and began offering classes in the fall of 1969. The federal government transferred ownership of
additional Fort Lincoln buildings and 103 acres to the United Tribes in 1973.
UTTC purchased an additional 132 acres in 2000 where a new science and technology campus
was built. UTTC student housing consists of three residence halls/dormitories, 16 solo parent
apartments, and 79 two- or three-bedroom houses. The August Little Soldier apartment complex located
on the UTTC Campus offers an additional housing option. Other services UTTC provides include on-
campus child care at the Infant/Toddler Center (birth to 2 years of age), the Arthur and Grace Link Child
Development Center (2 years to pre-school), and the Theodore Jamerson Elementary School (Pre-K to
7th grade) with after school programming. UTTC also offers adult learning programs to parents of small
children who have not completed high school, coordinated by the Family and Child Education Program.
The mission statement for UTTC states: United Tribes Technical College provides quality post-
secondary education and training to enhance knowledge, diversity, and leadership for all indigenous
nations.
In 1975, the college was renamed United Tribes Educational Technical Center, and in 1982, it
was granted accreditation as United Tribes Technical Center. Two vocational programs at the Associate
of Applied Science degree level (licensed practical nursing and medical records technology) were
approved for accreditation in 1987, while at the same time changing its name to United Tribes
Technical College. Business, clerical, and criminal justice programs were added in 1990, and three
additional programs (automotive service technology, art/art marketing, and early childhood education)
were added in 1993. Currently, UTTC offers 14 Associate of Applied Science (AAS) Degrees and four
certificate programs or vocational programs, and a diploma in Automotive Technology. UTTC offers
four on-line programs with three granting AAS degrees and one granting certificates in Medical Coding
and Billing. UTTC was accredited in 2011 for Bachelor’s Degrees in Business Administration,
Criminal Justice, and Elementary Education, and recently added Environmental Science and Research
in fall 2016. In the Fall Semester of the 2015-2016 academic year, UTTC had 422 full-time and 61
part-time students enrolled which equates to 448 full-time equivalent (FTE) students. In addition,
UTTC employed 217 full-time and 70 part-time workers in 2016.
3
Methods
In-state expenditures for United Tribes Technical College comprise the direct economic impacts,
or first-round effects. Actual total in-state expenditures for UTTC operations were used to calculate
direct effects. A brief questionnaire requesting expenditures for various expenditure categories was
distributed to each of the Tribal Colleges. Each of the colleges completed the questionnaire providing
estimates for in-state expenditures for operations expenses such as wages and salaries, benefits,
construction, utilities, repairs and maintenance, etc. Data collection efforts for this assessment resulted
in a complete and consistent data set for all Tribal Colleges. In-state expenditures were allocated to
industrial categories, or sectors, defined by the North Dakota Input-Output Model (Coon et al. 2012b).
Expenditures included both outlays for capital improvements and general campus operations. Impacts
can vary year to year based on the level of capital improvements in any given year.
The North Dakota Input-Output Model was used to estimate the secondary economic impacts
based on United Tribes Technical College expenditure data. The North Dakota Input-Output Model
consists of interdependence coefficients, or multipliers, that measure the level of business activity
generated in each economic sector from an additional dollar of expenditures in a given sector. A sector
is a group of similar economic units, (e.g., firms engaged in retail trade make up the Retail Trade
sector). For a complete description of the input-output model, see Coon et al. (1989). The model
estimates the changes in total business activity (gross receipts) for all sectors of the area economy
resulting from the direct expenditures associated with each of the five Tribal Colleges. Increased
business volumes were used to estimate secondary employment, and estimates of tax revenues were
based on historic relationships. Methods and procedures for this analysis are similar to those used in
estimating the impact of other facilities and activities in the state (Leistritz 1995; Bangsund and Leistritz
2004). The North Dakota Input-Output Model was previously used to estimate the economic impacts for
the Tribal Colleges in 2012 (Coon et al. 2013) and for several assessments of the North Dakota
University System (Coon et al. 2014). Empirical testing has confirmed the model’s accuracy in
estimating changes in levels of economic activity in North Dakota. Over the period 1958-2014,
estimates of statewide personal income derived from the model averaged within 8 percent of comparable
values reported by the U.S. Department of Commerce (Coon et al. 2016, Bureau of Economic Analysis
2016).
In addition to impacts associated with UTTC operations expenditures, the economic effects
associated with student expenditures were estimated. Previous assessments used secondary data from the
North Dakota Career Resource Network to estimate expenditures for room and board. Representatives of
the Tribal Colleges believe that tribal college students have different characteristics than students at non-
tribal institutions and that secondary data used previously may not adequately represent tribal college
student expenditures. For example, many tribal college students do not live on campus, are older, and
may have dependents. Accordingly, in order to more accurately estimate tribal college student
expenditures, financial aid cost of attendance budgets from each tribal college were used to estimate
student expenditures. The direct and total economic impact of student spending was estimated separately
from the impacts associated with United Tribes Technical College operations.
Student expenditures were estimated separately for each of the Tribal Colleges using each
college’s cost of attendance budget. Each college had several cost of attendance budgets based on
student characteristics. For example, dependent students still live at home, independents students are

4
financially independent and student with dependents are students with children. Cost of attendance
budgets were on a per semester basis. Financial aid application data was used to determine how many
students were in each of the cost of attendance budget categories. Student enrollment and enrollment
status (i.e., full-time, ¾-time, ½-time, or ¼-time) were provided by each of the Tribal Colleges and
converted to FTE students based on credit hours. Fall semester attendance was used to estimate FTE
enrollment. Spring semester attendance was assumed the same as fall semester attendance. FTE students
for the 2015-2016 fall semester and spring semester were multiplied by the estimated student living
expenses based on the various cost of attendance budgets to obtain total student spending for the
academic year. Student spending for personal items, recreation, books, supplies, and room and board
represent direct or first-round economic effects. Student spending for each enrollment type and category
was summed to calculate total student expenditures. Outlays for tuition and fees were excluded from the
estimate of student expenditures to prevent double counting. Economic effects of expenditures for
tuition and fees were captured in the assessment of college operations.
Results
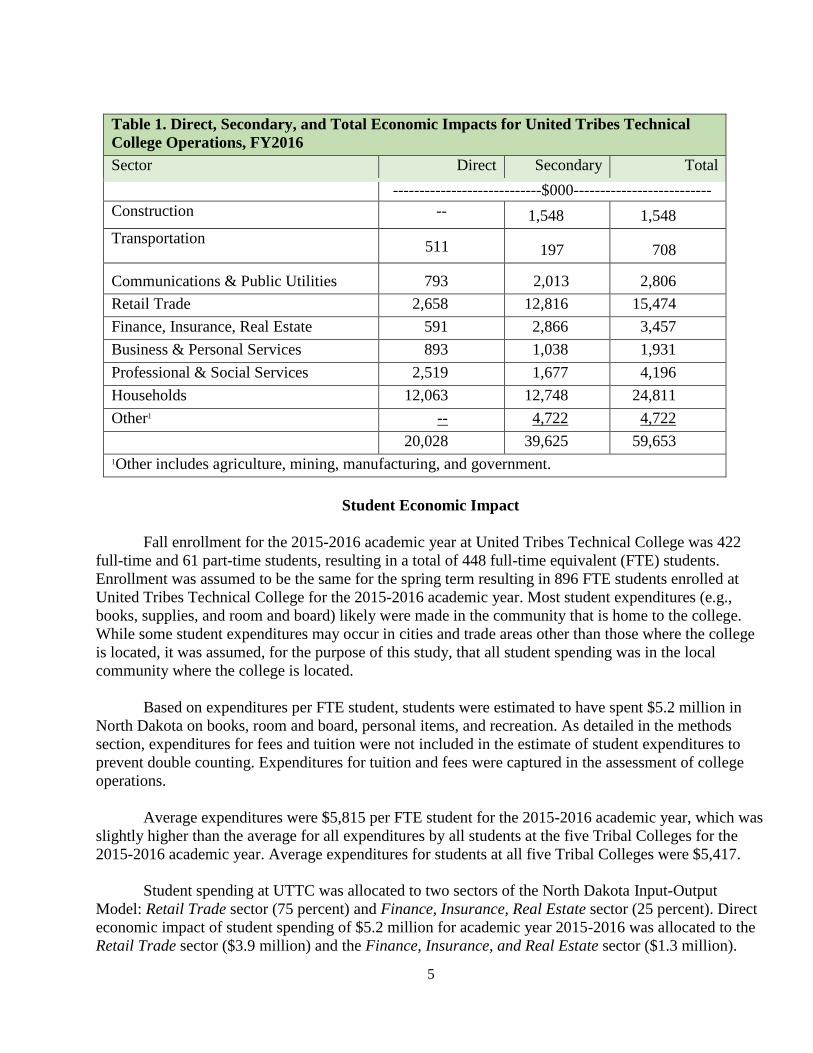
United Tribes Technical College expenditures to North Dakota entities for FY2016 totaled $20.0
million (Table 1). Direct expenditures were the greatest in the Households sector (e.g., wages and
salaries), with direct expenditures of $12.1 million. When the North Dakota Input-Output Model
coefficients (multipliers) were applied to the direct impacts, secondary impacts were estimated to be
$39.6 million in FY2016. Total (direct plus secondary) economic impacts totaled $59.6 million in
FY2016. Total economic impact was greatest in the Households sector (personal income) with $24.8
million in direct and secondary impacts followed by the Retail Trade sector with $15.5 million in direct
and secondary impacts.
In FY2016, United Tribes Technical College had a measurable impact on the local and state
economies. United Tribes Technical College employed 217 full-time and 70 part-time workers. Levels of
business activity resulting from UTTC’s spending would support an additional 140 FTE secondary
(indirect and induced) jobs in various sectors of the local and state economy. These levels of economic
activity would be expected to generate sales and use tax revenues of $716,000, personal income taxes of
$372,000, and corporate income taxes of $96,000.
5
Table 1. Direct, Secondary, and Total Economic Impacts for United Tribes Technical
College Operations, FY2016
Sector Direct Secondary Total
----------------------------$000--------------------------
Construction -- 1,548 1,548
Transportation 511 197 708
Communications & Public Utilities 793 2,013 2,806
Retail Trade 2,658 12,816 15,474
Finance, Insurance, Real Estate 591 2,866 3,457
Business & Personal Services 893 1,038 1,931
Professional & Social Services 2,519 1,677 4,196
Households 12,063 12,748 24,811
Other1 -- 4,722 4,722
20,028 39,625 59,653
1Other includes agriculture, mining, manufacturing, and government.
Student Economic Impact
Fall enrollment for the 2015-2016 academic year at United Tribes Technical College was 422
full-time and 61 part-time students, resulting in a total of 448 full-time equivalent (FTE) students.
Enrollment was assumed to be the same for the spring term resulting in 896 FTE students enrolled at
United Tribes Technical College for the 2015-2016 academic year. Most student expenditures (e.g.,
books, supplies, and room and board) likely were made in the community that is home to the college.
While some student expenditures may occur in cities and trade areas other than those where the college
is located, it was assumed, for the purpose of this study, that all student spending was in the local
community where the college is located.
Based on expenditures per FTE student, students were estimated to have spent $5.2 million in
North Dakota on books, room and board, personal items, and recreation. As detailed in the methods
section, expenditures for fees and tuition were not included in the estimate of student expenditures to
prevent double counting. Expenditures for tuition and fees were captured in the assessment of college
operations.
Average expenditures were $5,815 per FTE student for the 2015-2016 academic year, which was
slightly higher than the average for all expenditures by all students at the five Tribal Colleges for the
2015-2016 academic year. Average expenditures for students at all five Tribal Colleges were $5,417.
Student spending at UTTC was allocated to two sectors of the North Dakota Input-Output
Model: Retail Trade sector (75 percent) and Finance, Insurance, Real Estate sector (25 percent). Direct
economic impact of student spending of $5.2 million for academic year 2015-2016 was allocated to the
Retail Trade sector ($3.9 million) and the Finance, Insurance, and Real Estate sector ($1.3 million).

6
Applying these expenditures to the North Dakota Input-Output Model produced an estimate of the total
(direct and secondary) economic impact. Secondary economic impacts resulting from student spending
totaled $7.7 million and total economic impacts were estimated to be $12.9 million for academic year
2015-2016 (Table 2). The largest impacts were in the Retail Trade sector with $5.9 million in retail trade
activity and the Households sector (economy-wide personal income) with total impacts of $3.1 million.
The total level of retail trade activity generated by student spending would be expected to generate
$271,000 in sales tax revenues, assuming all purchases were made in the North Dakota economy.
Household expenditures would be expected to generate $47,000 in personal income tax. Business
activity from student spending would support 23 secondary (indirect and induced) jobs in the state.
There were some data limitations associated with student expenditures for housing and purchases
for books and educational materials. Student expenditures for room and board were based on financial
aid cost of attendance budgets. Some students would make payments for room and board to the college
for on-campus housing while other students would make rent payments and payments for living
expenses to non-campus entities. For those students that live on campus, payments for room and board
would be captured in the assessment of college operations. Payments made to off-campus entities for
rent or living expenses would be included in the estimates of economic contributions from student
expenditures. However, data were not available to suggest what portion of student room and board
expenditures were made to the college and what portion were made to non-campus entities. Further, it is
likely that even for students that live on campus, some expenditures for living expenses would be made
to off-campus entities. To maintain consistency with previous studies (Coon et al. 2013) the cost for
room and board were included in estimates of student spending. While there is likely some double
counting of expenditures for room and board related to those students who live on campus, the effect is
unlikely to be substantial.
Purchases for books and educational materials present some minor limitation. Books and
educational materials are likely largely purchased at campus-sponsored bookstores and accordingly
would be captured in the assessment of the college operations. Further, it is likely that most textbooks
and educational materials would be purchased from publishing entities outside of North Dakota, and
accordingly would not represent in-state expenditures by the colleges. Purchases of books and
educational materials from off-campus entities would represent an in-state expenditure. Data was not
available to suggest to what degree students purchase books and educational material from on-campus or
off-campus entities. To maintain consistency with previous analyses, the cost of books and educational
materials was included in the student spending analysis (Coon et. al. 2013). Although the potential for
some double counting of spending does exist, the effect on the total would be relatively small. UTTC
cost of attendance budgets estimated student expenditures for books and educational materials to be
$350 per semester.

7
Table 2. Direct, Secondary, and Total Economic Impacts for United Tribes Technical
College Student Spending, Academic Year 2015-2016
Sector Direct Secondary Total
----------------------------$000-------------------------
Construction - - 232 232
Communication & Public Utilities - - 379 379
Retail Trade 3,907 1,950 5,857
Finance, Insurance, Real Estate 1,303 411 1,714
Business & Personal Services - - 176 176
Professional & Social Services - - 214 214
Households - - 3,142 3,142
Other1 -- 1,232 1,232
Total 5,210 7,736 12,946
1Other includes agriculture, mining, transportation, manufacturing, and government.
Value of a College Education
A college education has both social and economic benefits. A review of published literature
illustrates the range of benefits associated with a college degree. While the monetary value of higher
education has been studied extensively, social benefits have been more difficult to quantify. While an
analysis of the value of a college education for graduates of the Tribal Colleges was beyond the scope of
this study, a review of published findings on the value of a college education will provide insight into
how a college education can benefit both students and communities.
One obvious advantage of a college degree is better wages, but benefits extend beyond increased
salaries. Adults with a college degree are shown to be healthier, more active citizens, and are more likely
to read to their children than those without a college degree (Baum et al. 2010). College graduates are
14 percent less likely to be obese than high school graduates and nearly twice as likely to exercise
vigorously. Only 9 percent of college graduates smoke compared to 27 percent of those with, at most, a
high school diploma. A higher percentage of college-educated parents (68 percent) read to their children
daily than do high school graduates (27 percent) (Baum et al 2010) and people with a college degree
donate their time to community organizations at a higher rate than any other group. Rawley and Hurtado
(2002) contend that benefits of a college degree are also passed along to succeeding generations.
Additionally, “college attendance has been shown to decrease prejudice, enhance knowledge of world
affairs, and enhance social status while increasing economic and job security” (Rawley and Hurtado,
2002).
The Alliance for Excellent Education (2012) published a report stressing the importance of
providing a quality education to all children, regardless of race or socioeconomic status. This report
states that in order to maintain the economic strength of the United States, it is imperative to provide all
students with a quality education. In addition to the economic benefits individuals receive from
increased education, communities, states, and the nation also benefit. For example, if the 2011 high
8
school graduation rate nationwide would have been 90 percent, an additional 750,000 students would
have earned a diploma, which would have resulted in an additional $9 billion earned each year and
increased tax collections of $2 billion per year at the federal, state, and local levels (Balfanz et al. 2012).
The actual U.S. graduation rate in 2010-2011 was 79 percent and 86 percent in North Dakota (U.S.
Department of Education, 2017). Although the study did not report statistics specifically for Native
American students, it stated that 31 percent of whites aged 25 and older held a Bachelor’s degree in
2011, compared to 20 percent for blacks and 14 percent for Hispanics (Alliance for Excellent Education
2012).
The Alliance for Excellent Education (2012) study concluded that improving education levels in
the United States could save tens of billions of taxpayer dollars annually on social costs, such as health
care, unemployment, and incarceration. Improving education for traditionally underserved and under-
represented groups is a major factor in breaking the cycle of poverty and disenfranchisement. Low
education levels are closely associated with increased rates of homelessness, teen pregnancy, and
community violence.
Research by Hardy (2010) compiled seven benefits associated with higher education. Benefits
are categorized as either economic or social. Economic benefits include higher earnings potential,
employer-provided health care coverage, and job stability. Social benefits were lower stress, healthier
lifestyle choices, job satisfaction, and future children benefits. Job satisfaction is a benefit that might be
overlooked, but because people spend most of their lives working, how they feel about their work can
greatly affect them. Salient observations regarding future benefits for children included correlation
between mother’s education and the health of her children. Child mortality rates decreased as the
mother’s education attainment levels increased, and parents with a higher education had higher
expectations for their children to earn a college degree. In addition, parents with college degrees were
more likely to pay for their children’s college education. In a report released by Cankdeska Cikana
Community College (2010), the social benefits particular to Native American reservations were listed as
mitigation of social problems, centers for preservation of culture, language and traditions, provision for
further educational opportunities, technology transfer, and community programs.
Numerous studies have examined the earnings advantage for a college graduate compared to a
high school graduate. However, the lifetime earnings advantage for a college degree varies by study.
Lifetime earnings advantage ranged from a low of $150,000 (Robinson 2010), to a middle range of
$650,000 (Pew Research Center 2011), with the highest of $1,000,000 (Longley 2010). The wide range
of values for a college degree were due to assumptions regarding unemployment and underemployment.
Robinson (2010) assumed that 29 percent of college graduates are underemployed (i.e., working at high
school-level jobs). Current national unemployment rates remain in the 5 percent range, and many
college graduates may be underemployed based on the level of education. However, these workers will
move into jobs in their career field as they become available. Robinson (2010) also acknowledged that
the value of a college education could range from $150,000 to $500,000 over the course of a lifetime.
An estimated $1 million earnings advantage for a college degree was the highest reported. People with
less than a high school degree are at a distinct disadvantage to those with high school or college degrees.
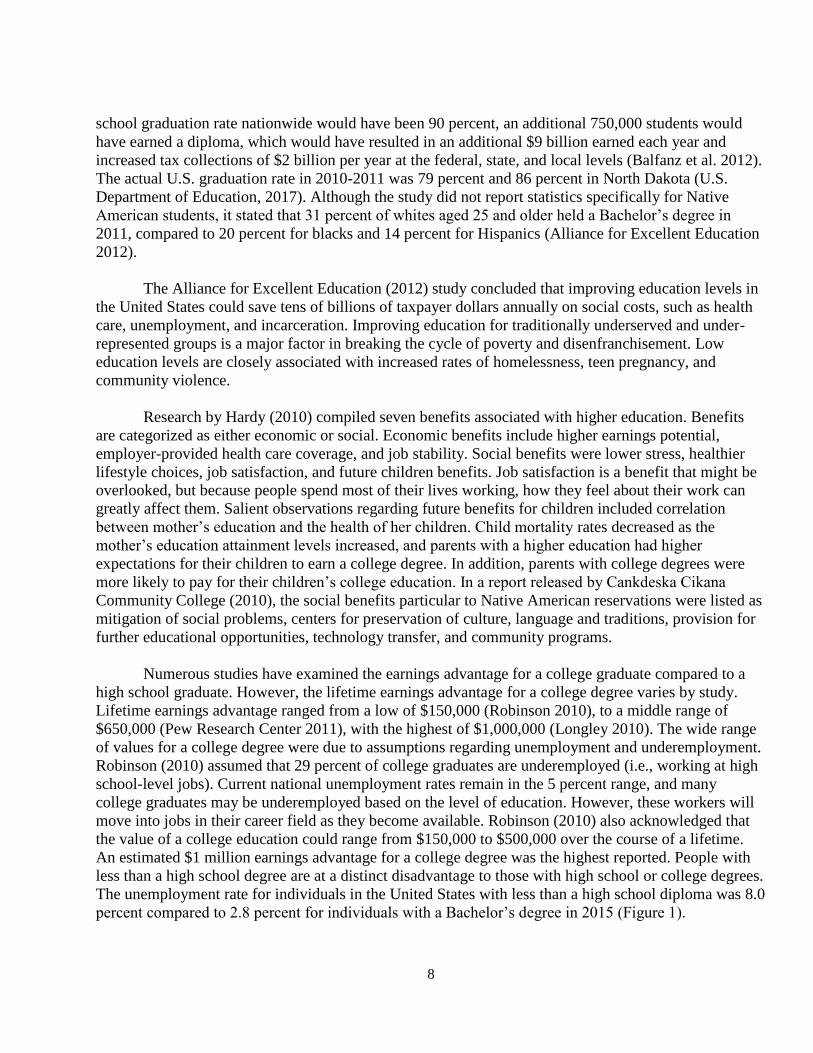
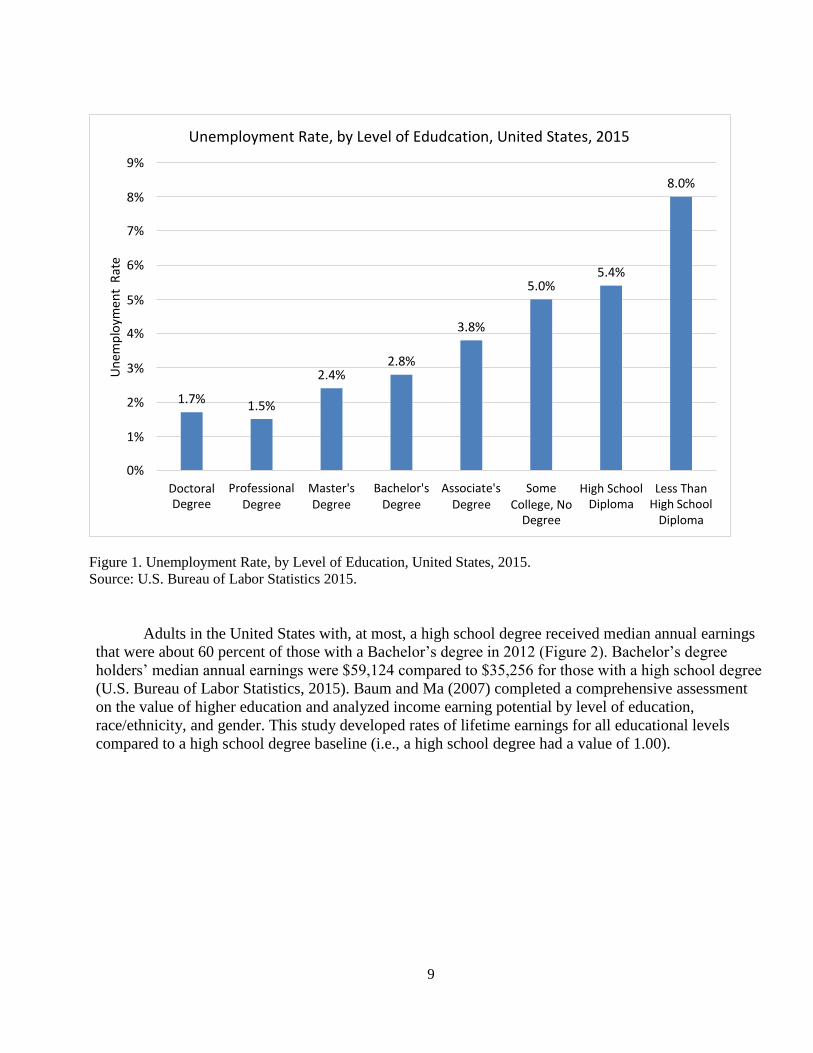
The unemployment rate for individuals in the United States with less than a high school diploma was 8.0
percent compared to 2.8 percent for individuals with a Bachelor’s degree in 2015 (Figure 1).
9
Figure 1. Unemployment Rate, by Level of Education, United States, 2015.
Source: U.S. Bureau of Labor Statistics 2015.
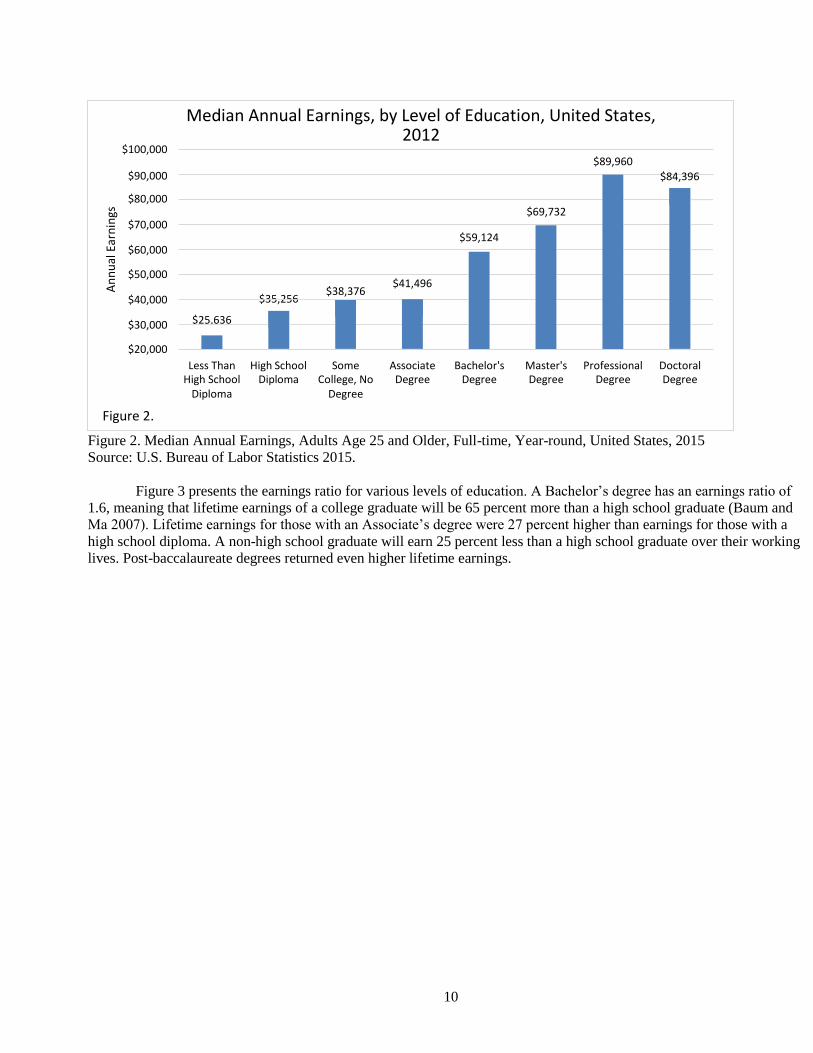
Adults in the United States with, at most, a high school degree received median annual earnings
that were about 60 percent of those with a Bachelor’s degree in 2012 (Figure 2). Bachelor’s degree
holders’ median annual earnings were $59,124 compared to $35,256 for those with a high school degree
(U.S. Bureau of Labor Statistics, 2015). Baum and Ma (2007) completed a comprehensive assessment
on the value of higher education and analyzed income earning potential by level of education,
race/ethnicity, and gender. This study developed rates of lifetime earnings for all educational levels
compared to a high school degree baseline (i.e., a high school degree had a value of 1.00).
Unemployment Rate, by Level of Edudcation, United States, 2015
9%
8.0% 8%
7%
6% 5.4%
5.0% 5% 4% 3.8%
3% 2.8% 2.4%
2% 1.7% 1.5%
1%
0%
Doctoral Degree
Professional Master's Bachelor's Associate's Some Degree Degree Degree Degree College, No
Degree
High School Less Than Diploma High School
Diploma
Un
emp
loym
ent
Rat
e
10
Median Annual Earnings, by Level of Education, United States, 2012
$100,000 $89,960
$90,000 $84,396
$80,000 $69,732
$70,000 $59,124
$60,000
$50,000
$40,000 $35,256 $38,376
$41,496
$30,000
$20,000
Less Than High School High School Diploma
Diploma
Some College, No
Degree
Associate Bachelor's Master's Professional Doctoral Degree Degree Degree Degree Degree
Figure 2.
Figure 2. Median Annual Earnings, Adults Age 25 and Older, Full-time, Year-round, United States, 2015
Source: U.S. Bureau of Labor Statistics 2015.
Figure 3 presents the earnings ratio for various levels of education. A Bachelor’s degree has an earnings ratio of
1.6, meaning that lifetime earnings of a college graduate will be 65 percent more than a high school graduate (Baum and
Ma 2007). Lifetime earnings for those with an Associate’s degree were 27 percent higher than earnings for those with a
high school diploma. A non-high school graduate will earn 25 percent less than a high school graduate over their working
lives. Post-baccalaureate degrees returned even higher lifetime earnings.
$25,636
An
nu
al E
arn
ings

11
United Tribes Technical College direct expenditures into the North Dakota economy were $20.0
million in FY2016. The college employed 217 full-time workers and 70 part-time workers. Total
economic impact for UTTC was $59.6 million in FY2016, which included $39.6 million of secondary
impacts. Business activity in the Households sector, which measures economy-wide personal income,
was estimated to be $24.8 million in FY2016. Considering the largest expenditure category for the
college was for wages and salaries, this result was not unexpected. Retail trade activity attributed to
UTTC expenditures were estimated to be $15.5 million in FY2016. Business activity generated by
UTTC expenditures would produces $716,000 in sales and use taxes and $372,000 in personal income
taxes. In addition to the 217 full-time and 70 part-time jobs at United Tribes Technical College, the level
of business activity associated with college expenditures would supports 140 secondary (indirect and
induced) jobs.
Student expenditures for living expenses also have economic effects. There were 483 students
enrolled at United Tribes Technical College on a full-time or part-time basis during the 2015-2016
academic year, which translates to 448 full-time equivalent (FTE) students. Expenditures by the 448
FTE students at United Tribes Technical College for personal items, recreation, books, supplies, and
room and board was estimated to be $5.2 million for the 2015-2016 academic year. Total economic
impacts (direct plus secondary) from student spending was $12.9 million; secondary effects totaled $7.7
million. Impacts were the greatest in the Retail Trade sector ($5.9 million) due to the high percentage of
student spending for retail trade items. The next highest level of business activity was in the Households
sector (economy-wide personal income) with $3.1 million in direct impacts. This level of business
activity would support 23 secondary jobs in various sectors of the North Dakota economy. Economic
effects from student expenditures are in addition to those of United Tribes Technical College operations.
In addition to local economic impacts, social and economic benefits accrue to individuals with
higher academic achievement. Previous studies have determined that college graduates have healthier
life styles, healthier children, increased job satisfaction, have shown decreased prejudice, enhanced
knowledge of world affairs, and enhanced social status. Many of these benefits are passed onto
succeeding generations. Further, college graduates have lower unemployment rates and higher annual
incomes than those without a college degree. The national unemployment rate for high school graduates
was 5.4 percent in 2015, nearly double the 2.8 percent rate for those with a Bachelor’s degree. Higher
income is also associated with educational attainment. In 2015, the median annual earnings in the United
States for a college degree was $59,124, while median annual earnings for a high school degree was
$35,256, approximately 60 percent of earnings associated with a Bachelor’s degree.
Currently in North Dakota there is considerable education disparity between Native American
populations and the state population overall. Educational attainment is lower on Native American
reservations than in North Dakota overall. Across nearly every level of education, equational attainment
is lower on the state’s Native American reservations. Published research and statistics clearly illustrate
positive social and economic benefits of higher education. The Tribal Colleges and UTTC serve an
important role in improving economic and social conditions for people and communities on North
Dakota Native American reservations and throughout North Dakota through the delivery of post-
secondary higher education.

12
Figure 3. Ratio of Expected Lifetime Earnings Relative to High School Graduates in the United States, by Education Level, 2005.
Source: Baum et al. 2013.
The percentage difference in median wages associated with level of education clearly shows the wage
effects associated with education. The median income for individuals with an Associate’s degree was 25 percent
higher than the median income for an individual with a High School diploma in 2015. Median earnings associated
with a Bachelor’s degree were 67 percent higher earnings associated with a High School diploma and median
earning for a Master’s Degree were 104 times that of a High School diploma. The differences in median wages
between a High School Diploma and higher levels of education have remained relatively constant since 2005
(Figure 4).
Expected Full-time Lifefitme Earnings Ration, By Level of Education, 2011
3.50
3.00 2.92
2.50 2.43
2.00 1.96
1.65
1.50
1.00 1.13
1.27
1.00 0.72
0.50
0.00
Less Than High School High School Diploma
Diploma
Some Associate's Bachelor's Master's Doctoral Professional Degree College, No
Degree Degree Degree Degree Degree

13
Figure 4. Percent Average Difference, Associate’s, Bachelor’s, Master’s Degree Compared to High School
Diploma, 2005, 2008, 2011, 2015 Source: Baum and Ma 2007, Baum et al. 2010, Baum et al. 2013, Ma et al. 2016
Zaback et al. (2012) also developed earnings ratios for education levels relative to a high school degree and
developed the ratios for different academic areas (i.e., arts and humanities, business) and for each state. This
analysis also found that a college degree results in a higher median income, even though the variation across states
and disciplines is substantial. Almost without exception, each successive level of higher education attainment
results in additional economic benefits. Clearly, education achievement at every level is associated with greater
lifetime earnings.
Despite well-documented benefits of higher educational attainment, educational attainment was lower on
Native American reservations than for North Dakota overall (U.S. Census, 2015). Statewide, four percent of the
state’s population age 25 or older have at most, some high school but no diploma. On the state’s Native American
reservations, the percentages of the population with some high school education but no diploma are higher, ranging
from 6 percent on Fort Berthold to 15 percent on Spirit Lake (Figure 5). Attainment is similar for a high school
diploma with roughly a third of both the Native American and state-wide population with a high school diploma.
The exception is Turtle Mountain where only 18 percent of the population age 25 or older has a high school
diploma. (Figure 6). Statewide 20 percent of the population 25 years and older has a Bachelor’s degree compared to
10 percent on the Spirit Lake reservation, 13 percent on Standing Rock, 14 percent on Fort Berthold, and 16 percent
on Turtle Mountain. Nationally, in 2015, 42.3 percent of the population 25 years and older had a two-year degree
and 32.5 percent had a four-year college degree (Ryan and Baum 2016). Women were slightly more likely to be
college-educated than men, with 32.7 percent having at least a Bachelor’s degree compared to 32.3 percent for men
(Ryan and Baum 2016). Across nearly every level of education, educational attainment is lower on the state’s
Percent Wage Difference, Associate's, Bachelor's, Master's Degree Compared to High School Diploma, United States, 2005, 2008,
2011, 2015
120%
104% 99%
100% 95% 98%
80%
62% 65% 67%
60% 60%
40% 29%
24% 27% 25%
20%
0%
2005 2008 2011 2015
Associate's Degree Bachelor's Degree Master's Degree

14
Level of Educational Attainment, United States, North Dakota and North Dakota Native American Reservations, 2015
25.0%
20.0%
15.0%
10.0%
5.0%
0.0%
United States
North Dakota
Fort Berthold
Spirit Lake
Standing Rock
Native American Indian reservations than in North Dakota and the United States on average (Figure 5 and Figure
6).
9th to 12 Grade, No Diploma Bachelor's Degree Turtle Mountian
United States 7.6% 18.5% North Dakota 4.4% 20.1%
Fort Berthold 6.1% 13.8%
Spirit Lake 15.2% 9.7%
Standing Rock 12.7% 13.1%
Turtle Mountian 13.3% 16.1%
Figure 5. Level of Educational Attainment, North Dakota and North Dakota Native American Reservations, 2015
Source: 2011-2015 U.S. Census American Community Survey, 2015

15
Level of Educational Attainment, by Degree Type, United States, North Dakota and North Dakota Native American Reservations,
2015
35%
30%
25%
20%
15%
10%
5%
0%
Less then High High School Some College, Associate's School Diploma Diploma No Degree Degree
Bachelor's Degree
Graduate or Professional
Degree
United States 13.3% 27.8% 21.1% 8.1% 18.5% 11.2%
North Dakota 8.3% 27.4% 23.4% 13.2% 20.1% 7.6%
Fort Berthold 10.4% 27.2% 28.2% 15.8% 13.8% 4.5%
Spirit Lake 21.1% 29.9% 20.5% 16.4% 9.7% 2.5%
Standing Rock 16.9% 33.1% 20.1% 13.3% 13.1% 3.6%
Turtle Mountian 18.6% 18.8% 25.4% 16.9% 16.1% 4.2%
Figure 6. Level of Educational Attainment, by Degree Type, United States, North Dakota and North Dakota Native
American Reservations, 2015 Source: 2011-2015 U.S. Census American Community Survey, 2015
High school graduation rates are lower on Native American reservations as well. The high school
graduation rate for all Native American students in North Dakota in 2014-2015 was 60 percent compared to the
overall statewide graduation rate of 87 percent (Figure 7) (North Dakota Department of Public Instruction, 2015).
Graduation rates at school districts home to the state’s tribal colleges range from 50 percent in Fort Totten and New
Town school districts to 66 percent in the Belcourt school district. Dropout rates ranged from 30 percent in the
Belcourt school district to 42 percent in the Fort Totten and Fort Yates school districts. (Figure 7) (ND Department
of Public Instruction, 2015).

16
Figure 7. High School Graduation and Dropout Rates, North Dakota and North Dakota Native American
Reservation School Districts, 2015
Source: North Dakota Department of Public Instruction, 2015
The social and economic benefits that result from educational attainment are well-documented. Higher
education results in increased earnings and improved social conditions. Improved economic and social conditions
from post-secondary education enhance quality of life and the social and economic benefits of a college education
are often passed onto subsequent generations. While the value of a post-secondary degree specific to UTTC was
beyond the scope of this study, published research and statistics clearly illustrate positive social and economic
benefits of higher education. The state’s Tribal Colleges and UTTC serve an important role in improving economic
and social conditions on Native American reservations and in North Dakota communities through the delivery of
post-secondary higher education.
Conclusions
The North Dakota Association of Tribal Colleges (NDATC) consists of five colleges located in North
Dakota. One of those five colleges is the United Tribes Technical College located in Bismarck which serves multi-
tribal members from across the United States. In addition to providing cultural-based educational opportunities for
Native Americans, Tribal Colleges also have an economic impact as a result of college operations, spending for
goods and services, and wages and salaries. Student spending also contributes to the economic effects related to the
Tribal Colleges. In addition to economic impacts, the higher education opportunities provided by UTTC have both
positive social and economic benefits.
High School Graduation and Dropout Rates, North Dakota and North Dakota Native American Reservation School Districts, 2015
Graduation Rate Dropout Rate
100
90 86.3
80
70 65.8 59.6
60 50.0 52.4 50.0
50 41.7 42.3 41.3
40 34.2 29.6
30
20 10.3
10
0
North Dakota, All North Dakota, Ft. Totten, Native Belcourt, Native Ft. Yates, Native New Town, Native Students Native American Ameican Students American Students American Students AmericanStudents
Students
School Districts
Per
cen
t
17
References
Alliance For Excellent Education. 2012. Inseparable Imperatives: Equity in Education and the Future of
the American Economy. http://all4ed.org/wpcontent/uploads/2013/06/InseparableImperatives.pdf
Washington, D.C.
Balfanz, Robert, John M. Bridgeland, Mary Bruce, and Joanna Hornig Fox. 2012. Building a Grad
Nation: Progress and Challenge in Ending the High School Dropout Epidemic. Annual Update.
A Report to AT&T and Pearson Foundation. Washington, D.C.: Civic Enterprises, Everyone
Graduates Center at John Hopkins University, America’s Promise Alliance, and Alliance for
Excellent Education.
Bangsund, Dean A., F. Larry Leistritz, and Randal C. Coon. 2010. Economic Impact of the North
Dakota University System in 2010. AAEA Report No. 672. Fargo: North Dakota State
University, Department of Agribusiness and Applied Economics.
Bangsund, Dean A., and F. Larry Leistritz. 2004. Economic Contributions of the Sugarbeet Industry to
Minnesota, North Dakota, and Eastern Montana. AAE Report No. 532. Fargo: North Dakota
State University, Department of Agribusiness and Applied Economics.
Baum, Sandy, Jennifer Ma, and Kathleen Payea. 2013. Education Pays: The Benefits of Higher
Education for Individuals and Society. Trends in Higher Education Series.
https://trends.collegeboard.org/education.New York, New York.
Baum, Sandy, Jennifer Ma, and Kathleen Payea. 2010. Education Pays: The Benefits of Higher
Education for Individuals and Society. Trends in Higher Education Series.
https://trends.collegeboard.org/education-pays.New York, New York.
Baum, Sandy and Jennifer Ma. 2007. Education Pays: The Benefits of Higher Education for Individuals
and Society. Trends in Higher Education Series. https://trends.collegeboard.org/education. New
York, New York.
Bureau of Economic Analysis. 2016. Personal Income by Major Sources and Earning by Industry.
Table SA05. Internet Website Interactive Tables. www.bea.gov. Washington, D.C.: U.S.
Department of Commerce.
Cankdeska Cikana Community College. 2010. 2009 Economic Impact & Return on Investment Report:
Our Story. Fort Totten, ND: Spirit Lake Dakota Nation, Cankdeska Cikana Community College.
Cankdeska Cikana Community College. 2012. Cankdeska Cikana Community College History: College
Namesake. Cankdeska Cikana Community College Internet Website. www.littlehoop.edu. Fort
Totten, ND.
Coon, Randal C., Dean A. Bangsund, Nancy M. Hodur. 2017. Economic Contribution of the North
Dakota University System in 2015. AAE Report No. 729. Fargo: North Dakota State University,
Department of Agribusiness and Applied Economics.
18
Coon, Randal C., Dean A. Bangsund, Nancy M. Hodur. 2017a. Economic Contribution of North
Dakota’s Tribal Colleges in 2016. AAE Report No. 760. Fargo: North Dakota State University,
Department of Agribusiness and Applied Economics.
Coon, Randal C., Dean A. Bangsund, Nancy M. Hodur. 2017b. Economic Contribution of Nueta
Hidatsa Sahnish College in 2016. AAE Report No. 762. Fargo: North Dakota State University,
Department of Agribusiness and Applied Economics.
Coon, Randal C., Dean A. Bangsund, Nancy M. Hodur. 2017c. Economic Contribution of Sitting Bull
College in 2016. AAE Report No. 763. Fargo: North Dakota State University, Department of
Agribusiness and Applied Economics.
Coon, Randal C., Dean A. Bangsund, Nancy M. Hodur. 2017d. Economic Contribution of Turtle
Mountain Community College in 2016. AAE Report No. 764. Fargo: North Dakota State
University, Department of Agribusiness and Applied Economics.
Coon, Randal C., Dean A. Bangsund, Nancy M. Hodur. 2017e. Economic Contribution of Cankdeska
Cikana Community College in 2016. AAE Report No. 761. Fargo: North Dakota State
University, Department of Agribusiness and Applied Economics.
Coon, Randal C., Dean A. Bangsund, and Nancy M. Hodur. 2016. North Dakota Input-Output Model
Data Base. Fargo: North Dakota State University, Department of Agribusiness and Applied
Economics.
Coon, Randal C., Dean A. Bangsund, Nancy M. Hodur. 2014. Economic Impact of the North Dakota
University System in 2013. AAE Report No. 729. Fargo: North Dakota State University,
Department of Agribusiness and Applied Economics
Coon, Randal C., Dean A. Bangsund, Nancy M. Hodur. 2013. Economic Contribution of North Dakota’s
Tribal Colleges in 2012. AAE Report No. 709. Fargo: North Dakota State University,
Department of Agribusiness and Applied Economics.
Coon, Randal C., Dean A. Bangsund, Nancy M. Hodur. 2012a. Economic Impact of the North Dakota
University System in 2011. AAE Report No. 690. Fargo: North Dakota State University,
Department of Agribusiness and Applied Economics.
Coon, Randal C., Dean A. Bangsund, and Nancy M. Hodur. 2012b. The Economic Base of North
Dakota. AAE Staff Paper 12002. Fargo: North Dakota State University, Department of
Agribusiness and Applied Economics.
Coon, Randal C., F. Larry Leistritz, Thor A. Hertsgaard, and Arlen G. Leholm. 1989. The North Dakota
Input-Output Model: A Tool for Analyzing Economic Linkages. AE Report No. 187. Fargo:
North Dakota State University, Department of Agricultural Economics.
19
Gipp, David M., Tom Katus, and Michael Madden. 2011. The Economic Impact of United Tribes
Technical College on the Economy of the Bismarck/Mandan, ND Area. Bismarck: United Tribes
Technical College with the assistance of TK Associate International.
Hardy, Marcelina. 2010. 7 Benefits of Earning a College Degree. Yahoo! Education Internet Website.
http://edughoni.blogspot.com/2011/09/7-benefits-earning-college-degree.html
Ma, Jennifer, Matea Pender and Meredith Welch. 2016. Education Pays: The Benefits of Higher
Education for Individuals and Society. Trends in Higher Education Series.
https://trends.collegeboard.org/education-pays New York, New York.
Leistritz, F. Larry. 1995. Potential Local Socioeconomic Impacts of the Proposed ProGold Processing
Plant. Agr. Econ. Rpt. No. 328. Fargo: North Dakota State University, Department of
Agribusiness and Applied Economics.
Leistritz, F. Larry, and Randal C. Coon. 2005. Economic Impact of the North Dakota University System.
Fargo: North Dakota State University, Department of Agribusiness and Applied Economics.
Leistritz, F. Larry, and Randal C. Coon. 2007. Economic Impact of the North Dakota University System.
Fargo: North Dakota State University, Department of Agribusiness and Applied Economics.
Leistritz, F. Larry, and Dean A. Bangsund. 2008. Economic Impact of Cankdeska Cikana Community
College. Fargo: North Dakota State University, Department of Agribusiness and Applied
Economics.
Leistritz, F. Larry, and Dean A. Bangsund. 2010. Economic Impact of Sitting Bull College on the
Regional Economy. AAE10002. Fargo: North Dakota State University, Department of
Agribusiness and Applied Economics.
Leistritz, F. Larry, and Randal C. Coon. 2009. Economic Impact of the North Dakota University System.
Fargo: North Dakota State University, Department of Agribusiness and Applied Economics.
Longly, Robert. 2010. Lifetime Earnings Soar with Education. About.Com Internet Website.
www.usgovinfo.about.com. Washington, D.C.: About.Com, US Government Info.
North Dakota Department of Public Instruction. 2015. North Dakota Cohort Graduation and Dropout
Rates for School Year 2014-2015. Internet Website. www.nd.gov/dpi/data/graduate. Bismarck:
North Dakota Department of Public Instruction.
Pew Research Center. 2011. $650,000 - The Monetary Value & College Education. Pew Research
Center Internet Website. www.pewresearch.org. Washington, D.C.: Pew Research Center.
Rawley, L. And S. Hurtado. 2002. The Non-monetary Benefits of an Undergraduate Education. Ann
Arbor: University of Michigan, Center for Study of Higher and Post-secondary Education.

20
Robinson, Jenna. 2010. Lifetime Earnings: Bachelor’s Degree vs. High School Graduate. Intellectual
Takeout Internet Website. www.intellectualtakeout.org. Raleigh, N.C.: The John William Pope
Center for Higher Education Policy.
Ryan, Camille J., and Kurt Bauman. 2016. Educational Attainment in the United States: 2015. P20-578.
Washington, D.C.: U.S. Census Bureau, Department of Commerce, Economics and Statistics
Administration.
U.S. Bureau of Labor Statistics. 2015. Employment Projections: Earnings and Unemployment Rates by
Educational Attainment. Internet Website. www.bls.gov/emp/ep_chart_001.htm. Washington,
D.C.: U.S. Bureau of Labor Statistics, Office of Occupational Statistics and Employment
Projections.
U.S. Bureau of Census. 2015. American Community Survey. Bureau of Census Factfinder Website.
www.factfinder.census.gov. Washington, D.C.: U.S. Department of Commerce, U.S. Census
Bureau.
U.S. Bureau of Census. 2015a. American Community Survey, Bureau of Census Factfinder,
https://factfinder.census.gov/.Washington, D.C., U.S. Department of Commerce, U.S. Census
Bureau.
Zaback, Katie, Andy Carlson, and Matt Crellin. 2012. The Economic Benefit of Post Secondary Degree:
A State and National Level Analysis.
http://www.sheeo.org/sites/default/files/publications/Econ%20Benefit%20of%20Degrees%20Re
port%20with%20Appendices.pdf Boulder, Colorado: State Higher Education Executive Officers
and National Center for Higher Education Management Systems.