Embed Size (px)
Citation preview
CONTRIBUTION OF THE MOTOR VEHICLE SUPPLIER SECTOR TO THE ECONOMIES OF THE UNITED STATES
AND ITS 50 STATES
PREPARED FOR THE MOTOR & EQUIPMENT MANUFACTURERS ASSOCIATION
BY
ECONOMICS AND BUSINESS GROUP CENTER FOR AUTOMOTIVE RESEARCH
JANUARY 2007
The statements, findings, and conclusions herein are those of the authors and do not necessarily reflect the views of the project sponsor


© Center for Automotive Research 2007 i
Acknowledgements
This study is the result of a group effort. The authors would like to thank Patrick Miller for his
assistance with content. The authors would also like to acknowledge the significant efforts of
Diana Douglass. Diana contributed greatly to the production of the document.
At REMI, the authors would like to thank Fred Treyz and Adam Cooper for their input, and
assistance with the economic model.
Finally, the authors would like to thank the Motor & Equipment Manufacturers Association for
the opportunity to carry out this study.
Kim Hill, MPP
Associate Director, Economics and Business Group
Director, Automotive Communities Program
Debbie Menk
Project Manager, Economics and Business Group
Steven Szakaly
Economist, Economics and Business Group
© Center for Automotive Research 2005 ii
Executive Summary
Over the course of the last few decades, the motor vehicle industry has undergone a massive
transformation. The motor vehicle assembly companies were once highly integrated, designing
and building thousands of parts that (when assembled) became an automobile. By the
beginning of the 21st century, most parts-making operations moved out of the assembly
companies into independent stand-alone parts supplier operations─selling products to multiple
customers. Moreover, these supplier companies are given the responsibility of designing the
parts and integrating them into systems that are delivered fully assembled to a motor vehicle
assembly plant. By 2004, the supplier companies that became the backbone of the motor
vehicle industry employed more than 780,000 people.
In 2004, motor vehicle assembly operations were located in fewer than half of the states,
whereas the suppliers’ direct parts-making operations (or support operations) existed in all 50
states and the District of Columbia. This report, undertaken at the request of the Motor &
Equipment Manufacturers Association (MEMA), will provide an analysis of where and to what
extent these jobs are located.
This study’s purpose is to estimate the employment and economic contributions of the motor
vehicle supplier operations. The companies (classified as automotive suppliers for the purposes
of this study) include: parts and systems manufacturing operations; service companies that
provide consulting on market trends, financial matters, engineering designs, and more; and
companies that supply multiple industries —not just automotive —such as tire, battery, plastics,
and rubber companies.
The estimates of jobs’ impact were derived using the latest version of a state-of-the-art
economic model with direct employment and compensation inputs (as of December 31, 2004)
as acquired from BLS, the Census Bureau, and other government databases.
• From the direct motor vehicle supplier-related employment of over 780,000, an
estimated 4.5 million private sector jobs are generated by the supplier’s total U.S.
operations, including new product development and production. This total includes
direct employment at the supplier companies in the United States. The total also
includes indirect employment (the many tiers of suppliers to the suppliers) and
expenditure-induced employment (jobs that are created as a result of the spending of
the suppliers’ employees and the suppliers to the suppliers’ employees in the United
States).

© Center for Automotive Research 2005 iii
Table of Contents
Acknowledgements........................................................................................................................ i Executive Summary ...................................................................................................................... ii Table of Contents......................................................................................................................... iii List of Figures .............................................................................................................................. iv List of Tables................................................................................................................................. v Introduction ...................................................................................................................................1 Section I: The Motor Vehicle Suppliers........................................................................................5 Section II: Estimates of the Economic Contribution of the Motor Vehicle Parts Industry to the
United States and its Fifty States................................................................................................15 Section III: Methods ....................................................................................................................33 APPENDIX A: Determination of Direct Employment in Each NAICS Industry ............................35 APPENDIX B ..............................................................................................................................39 References..................................................................................................................................40

© Center for Automotive Research 2005 iv
List of Figures
Figure 1.........................................................................................................................................5
Figure 2.........................................................................................................................................5
Figure 3.........................................................................................................................................7
Figure 4.........................................................................................................................................9
Figure 5.......................................................................................................................................10
Figure 6.......................................................................................................................................11
Figure 7.......................................................................................................................................12
Figure 8.......................................................................................................................................13
Figure 9.......................................................................................................................................29
© Center for Automotive Research 2007 v
List of Tables
Table 1 ..........................................................................................................................................8
Table 2 ........................................................................................................................................19
Table 3 ........................................................................................................................................20
Table 4 ........................................................................................................................................21
Table 5 ........................................................................................................................................22
Table 6 ........................................................................................................................................23
Table 7 ........................................................................................................................................24
Table 8 ........................................................................................................................................25
Table 9 ........................................................................................................................................27
Table 10 ......................................................................................................................................28
Table 11 ......................................................................................................................................30
Table 12 ......................................................................................................................................31
Table 13 ......................................................................................................................................35
Table 14 ......................................................................................................................................36
Table 15 ......................................................................................................................................36
Table 16 ......................................................................................................................................37
Table 17 ......................................................................................................................................38
Table 18 ......................................................................................................................................39

1 © Center for Automotive Research 2007

1 © Center for Automotive Research 2007
Introduction
The motor vehicle industry is the largest manufacturing industry in the United States. No other
single industry is linked so closely to the U.S. manufacturing sector or directly generates so
much retail business and employment. When people think of the automobile industry, they most
likely picture a very large assembly plant staffed with thousands of people, equipped with
conveyor belts and robots as far as the eye can see and producing many hundreds of
thousands of motor vehicles year after year. What these same people probably don’t see are
the many supplier companies that design and manufacture the parts needed by the
manufacturers to assemble motor vehicles. Whereas parts-making operations were an integral
function of the large motor vehicle assembly companies in years past; that is no longer the case
today.
With a growing share of the annual sales coming from automobiles built by foreign-based
companies and an increasing foreign direct investment in U.S.-based assembly and support
operations, supplier companies have been in upheaval for the past two decades. Many
suppliers to U.S.-based motor vehicle companies have seen their businesses shrink as their
customers’ market share has decreased. Conversely, other suppliers have seen their
businesses grow as their motor vehicle company customers claim a larger share of the U.S.
market. This shift has led to the movement of many jobs away from the traditional locations for
automotive employment to other regions of the country where there is new investment from
growing international companies. While it may, at first blush, look like the automobile industry
and its supplier sector is shrinking in the United States due to the movement of many basic
parts operations to low-wage regions of the globe, the true story is one of continuing operations
in a dynamic, hugely successful industry─with some companies shrinking as other companies
grow.
The motor vehicle supplier sector has become the backbone of the motor vehicle assembly
industry, employing approximately 783,000 people in 2004 —substantially more than the
number of people employed by the assemblers. The supplier companies design, engineer and
manufacture the vast majority of the parts that go into a modern-day motor vehicle.
This report, undertaken at the request of the Motor & Equipment Manufacturers Association
(MEMA), will provide an estimation and analysis of the employment and economic contribution
of the supplier-related jobs in all of the fifty states and the District of Columbia.

2 © Center for Automotive Research 2007
In a number of past studies, the Center for Automotive Research (CAR) has estimated the
motor vehicle industry’s economic contribution to the U.S. economy. The most recent estimate
of economic contribution was completed by CAR and the Institute of Labor and Industrial
Relations at the University of Michigan for the Alliance of Automobile Manufacturers (AAM) in
20041, and was an important update of a prior study (also performed by ILIR-UM and CAR) for
the AAM and the Association of International Automobile Manufacturers (AIAM) in 20012. The
most recent employment and economic contribution study was undertaken by CAR for Toyota
Motor Company, and examined Toyota’s operations in fourteen states (individually) and the
United States as a whole3.
This current report, however, is a first estimate by CAR of the economic contribution associated
with the entire motor vehicle parts manufacturing sector in the United States. The importance of
this study is directly related to the changing dynamic of the U.S. automotive industry. The
relatively high number of jobs impacted by the supplier sector in each of the fifty states and the
District of Columbia, their broad dispersion across industries, and the contribution these jobs
make to the national economy comprise the most important findings of this study.
1 Institute of Labor and Industrial Relations, University of Michigan and the Center for Automotive Research. Contribution of the U.S. Motor Vehicle Industry to the Economies of the United States, California, New York, and New Jersey in 2003. Prepared for the Alliance of Automobile Manufacturers, Inc., Ann Arbor, May, 2004. 2 Institute of Labor and Industrial Relations and the Office for the Study of Automotive Transportation, University of Michigan and the Center for Automotive Research. Contribution of the Automotive Industry to the U.S. Economy in 1998: The Nation and Its Fifty States. A Study Prepared for the Alliance of Automobile Manufacturers, Inc. and the Association of International Automobile Manufacturers, Inc. Ann Arbor, Winter 2001. 3 Kim Hill, Contribution of Toyota to the Economies of Fourteen States and the United States in 2003, Center for Automotive Research, June 2005

3 © Center for Automotive Research 2007
The Study
The study describes the economic contribution of supplier operations in the United States and is
divided into two sections. In the first section of the study, we present a short overview of
supplier operations in the United States.
The second section of our study estimates the 2004 contribution of the suppliers’ U.S.
operations to employment and income in the economies of the fifty states, the District of
Columbia, and the United States as a whole. The suppliers’ economic contribution has been
analyzed using an economic model provided by the Regional Economic Modeling, Inc. (REMI).
The data used to perform the research —supplier employment and other data on the U.S.
economy and the automotive industry —were collected by CAR from a wide variety of publicly
available sources.
The companies (classified as motor vehicle suppliers for the purposes of this study) include light
vehicle and heavy duty vehicle original equipment and aftermarket parts and systems
manufacturing operations; service companies that provide consulting on market trends, financial
matters, engineering designs, and more; and companies that supply multiple industries —not
just automotive —such as tire, battery, plastics, and other rubber product companies.

4 © Center for Automotive Research 2007

5 © Center for Automotive Research 2007
Section I: The Motor Vehicle Suppliers
In the automobile industry, U.S. sales of light vehicles have held steady since the late 1990s,
hovering above or near 17 million vehicles annually (see Figure 1). U.S. production has also
held steady, at approximately 12 million units annually since 1994 (see Figure 2).
Figure 1 Annual U.S. Light Vehicle Sales
Source: CAR Research
Figure 2 Annual U.S. Light Vehicle Production

6 © Center for Automotive Research 2007
The heavy duty vehicle market in the United States consists primarily of on-road interstate
trucks in the Class 8 category. The annual production and sales of this class of vehicle are
highly cyclical. The heavy duty vehicle sector, similar to that of light duty vehicles, is affected by
the economic forces of the general economy, but their cycles are also affected by governmental
regulation. Most recently, Class 8 sales have been on an upward trend, led by both a need to
replace the current fleet of Class 8 rigs as they age and by operators who want to purchase
vehicles before new EPA pollution regulations on diesel engines take effect.
U.S. production of Class 8 vehicles ranges from 200,000 to 300,000 units annually with
assembly facilities employing approximately 37,000 individuals.4 In addition to manufacturing
Class 8 rigs, a further 36,900 individuals are employed manufacturing trailers.5 This, of course,
does not include the considerable number of individuals who work as suppliers to the Class 8
OEMs. These suppliers, in many cases, supply both heavy duty and light duty motor vehicle
manufacturers.
The aftermarket manufacturing supply sector provides parts and equipment for the
maintenance, repair, and enhancement of the more than 240 million light duty vehicles currently
on the road in the United States. As with the heavy duty sector, many parts suppliers in the light
duty vehicle manufacturing segment also provide parts and components to the aftermarket
sector. Combined, the suppliers to the light vehicle, heavy duty, and aftermarket sectors
employ approximately 783,000 people.
In 2004, motor vehicle assembly operations were located in just 21 states, whereas the
suppliers’ direct parts-making operations existed in all 50 states and the District of Columbia. In
many states, motor vehicle suppliers represent a significant portion of the labor force (see
Figure 3 and Table 1 below).
4 Bureau of Labor Statistic, Employment Statistics Survey www.bls.gov Series 33612 5 Bureau of Labor Statistic, Employment Statistics Survey www.bls.gov Series 336212

7 © Center for Automotive Research 2007
Figure 3
Direct Employment of Motor Vehicle Parts Supplier Operations by State Ranked Compared to Other Industries in State

8 © Center for Automotive Research 2007
Table 1 Direct Motor Vehicle Employment, Ranked by State
State Direct Employment
TOTAL 783,061Michigan 145,818Ohio 97,323Indiana 86,934Tennessee 45,749Illinois 40,063Kentucky 35,102New York 31,017California 28,596North Carolina 27,589Pennsylvania 22,917Georgia 22,701Wisconsin 21,502South Carolina 20,943Texas 20,175Missouri 18,888Alabama 15,965Mississippi 13,179Florida 9,273Arkansas 7,922Virginia 7,796Kansas 7,508Oklahoma 6,986Iowa 6,680Minnesota 6,671Connecticut 4,109Utah 4,047Nebraska 4,041Arizona 3,369New Jersey 3,356Maryland 2,413Washington 1,918Louisiana 1,868Oregon 1,783Colorado 1,756Massachusetts 1,589West Virginia 912Rhode Island 822Nevada 747New Hampshire 747South Dakota 378Vermont 370North Dakota 363Delaware 313Maine 290Wyoming 150Hawaii 125New Mexico 100District of Columbia 70Idaho 68Montana 50Alaska 9

9 © Center for Automotive Research 2007
As can be seen in Figures 4 and 5, employment─after having steadily increased throughout the
decade of the 1990s─has declined among motor vehicle manufacturers and motor vehicle
suppliers since 2000. It is important to note that, from just after the 1991 Gulf War until 2000,
the U.S. automotive industry experienced unprecedented growth in profitability and a post-war
period of historically low prices for commodity goods. During most of the 1990s, capacity
utilization remained high, and cost containment was of secondary importance as profits were
plentiful for most suppliers. This situation has changed drastically over the past five and a half
years as profit margins, particularly among those supplying domestic producers (Ford, GM, and
Chrysler Group), have been reduced due to production reductions, commodity price increases,
and foreign competition.
Figure 4 Motor Vehicles and Motor Vehicle Bodies (NAICS 3361 plus 3362)
Annual Employment
Sources: Ward’s Automotive Yearbooks 1998 – 2004; Automotive News 100 Year Almanac and the 1996 Market Data Book, Automotive News January 10, 2005 U.S. Light Vehicle Sales by Make p. 49 – 51.

10 © Center for Automotive Research 2007
Figure 5 Motor Vehicle Parts Manufacturing (NAICS3363) Annual Employment
Sources: Automotive News January 10, 2005 North America Car and Truck Production p. 54, Automotive News 100 Year Almanac and the 1996 Market Data Book, Ward’s Yearbooks 1986 – 1990.
The North American motor vehicle parts supplier industry has undergone significant changes
during the last decade. The continued efforts by original equipment manufacturers (OEMs) to
reduce costs has led to an ever-increasing amount of manufacturing, sub-assembly, and R&D
work being shifted to suppliers. This is especially true for the domestic OEMs (Ford, GM,
Chrysler Group), who have been under tremendous pressure to become more efficient and
reduce costs. One solution has been to outsource the production of parts. What was once a
highly vertically integrated industry has become ever more dependent on supplier companies to
fulfill increasingly complex piece and module design and production.
For the most part, domestic OEMs have merely outsourced design and production to suppliers
in order to gain efficiencies, leaving the responsibility to suppliers to innovate ways to make
productivity improvements. Until 2000, efforts to improve productivity by the OEMs or suppliers
were not paramount, as steady profits from SUVs─along with low commodity prices─helped
support a buoyant market. However, in 2000, a small recession caused a decline in demand for
light trucks; and in 2001, commodity prices began a steady climb. Both of these factors placed
enormous pressure on suppliers’ profitabilities, with the result being an increase in the number
of bankruptcies, consolidations, and closures in the supplier sector. In addition to these factors,
11 © Center for Automotive Research 2007
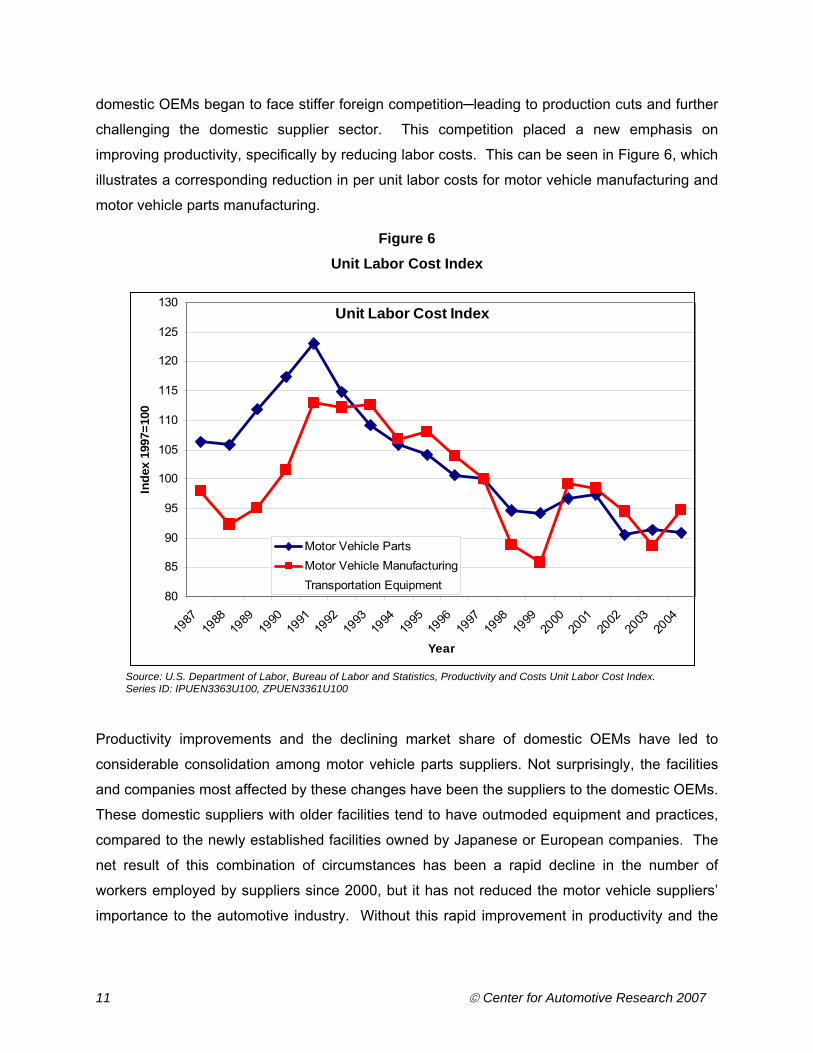
domestic OEMs began to face stiffer foreign competition─leading to production cuts and further
challenging the domestic supplier sector. This competition placed a new emphasis on
improving productivity, specifically by reducing labor costs. This can be seen in Figure 6, which
illustrates a corresponding reduction in per unit labor costs for motor vehicle manufacturing and
motor vehicle parts manufacturing.
Figure 6 Unit Labor Cost Index
Unit Labor Cost Index
80
85
90
95
100
105
110
115
120
125
130
1987
1988
1989
1990
1991
1992
1993
1994
1995
1996
1997
1998
1999
2000
2001
2002
2003
2004
Year
Inde
x 19
97=1
00
Motor Vehicle PartsMotor Vehicle ManufacturingTransportation Equipment
Source: U.S. Department of Labor, Bureau of Labor and Statistics, Productivity and Costs Unit Labor Cost Index. Series ID: IPUEN3363U100, ZPUEN3361U100
Productivity improvements and the declining market share of domestic OEMs have led to
considerable consolidation among motor vehicle parts suppliers. Not surprisingly, the facilities
and companies most affected by these changes have been the suppliers to the domestic OEMs.
These domestic suppliers with older facilities tend to have outmoded equipment and practices,
compared to the newly established facilities owned by Japanese or European companies. The
net result of this combination of circumstances has been a rapid decline in the number of
workers employed by suppliers since 2000, but it has not reduced the motor vehicle suppliers’
importance to the automotive industry. Without this rapid improvement in productivity and the

12 © Center for Automotive Research 2007
arrival of new foreign investment in the United States, the motor vehicle sector would be far less
competitive and efficient.
An alternative way to examine the importance of the supplier sector is to look at the value of
shipments by motor vehicle parts manufacturers (see Figure 7). This further illustrates not only
the productivity improvements, but also the growing reliance on suppliers to provide new vehicle
components. In 1997, shipments by motor vehicle suppliers totaled $178.5 billion and, with the
exception of a recession in 2001, shipments have grown steadily to over $203.5 billion in 2004.
This increase has occurred even while suppliers have reduced jobs in the supplier sector.
Figure 7 Dollar Value of Shipments
"$ Value of Shipments"
165,000,000
170,000,000
175,000,000
180,000,000
185,000,000
190,000,000
195,000,000
200,000,000
205,000,000
210,000,000
1997 1998 1999 2000 2001 2002 2003 2004
$1,0
00s
"$ Value of Shipments"
Source: U.S. Census Bureau Annual Survey of Manufacturers
As competition has increased, the pressure to produce a motor vehicle at the least possible cost
has resulted in parts-making operations moving away from the assembly companies and
becoming stand-alone companies. The present-day parts suppliers not only provide parts to
assemblers, they increasingly are designing and developing the parts from the ground up ─all
while becoming much more proficient and cost-efficient than companies in the past.

13 © Center for Automotive Research 2007
As can be seen in the following chart (Figure 8), the suppliers to the light vehicle manufacturers
have taken on a large share of the R&D associated with designing, engineering, and producing
a modern automobile. Beginning in 2000 —the earliest year that suppliers are listed
separately─$6.6 billion was spent by the supplier sector on research and product development.
This represented 36% of total automotive-related R&D spending. Industry R&D spending
increased in 2003, after a couple of years of downturn (as a result of the recession in the early
part of the decade). However, the bulk of the spending increase was borne by the supplier
sector, increasing slightly to $6.8 billion. Although this is a somewhat modest increase in R&D
spending over 2000 levels, it represents 40% of total automotive R&D spending in 2003.
Clearly, considering the percentage of total auto industry R&D spending, the suppliers are
taking on much more of the intellectual responsibility of designing, testing, and engineering the
new parts and sub-systems.
Figure 8 Automotive-related R&D Annual Spending by OEMs and Suppliers
Company and other funds for R&D
02,0004,0006,000
8,00010,00012,00014,000
2000 2001 2002 2003
Mill
ions
$
30%
32%
34%
36%
38%
40%
42%Motor Vehicle OEM R&DSpending
Motor Vehicle Parts R&DSpending
Spending on Parts R&D asPercent of Motor VehicleR&D Spending
Source: National Science Foundation, 2003

14 © Center for Automotive Research 2007
15 © Center for Automotive Research 2007
Section II: Estimates of the Economic Contribution of the Motor Vehicle Parts Industry to the United States and its Fifty States
The purpose of Section II of this report is to provide the first comprehensive analysis of the
estimated economic contribution associated with the activities of the motor vehicle supplier
industry in the United States. The motor vehicle parts industry has been thoroughly analyzed in
this report; the data used represents the most up-to-date information available. This economic
and employment impact analysis focuses on the motor vehicle parts manufacturing industry in
the United States and each of its fifty states. The motor vehicle parts manufacturing industry is
a combination of three segments: light vehicle original equipment parts manufacturers, heavy
duty original equipment parts manufacturers, and aftermarket parts manufacturers (NAICS
3363). Many of the suppliers in this industry group manufacture parts for all three segments.
The aftermarket manufacturers’ direct employment data have been included in this analysis only
if the industry group supplied parts necessary for the maintenance of the motor vehicle, or the
replacement of original equipment on the motor vehicle. The suppliers of tools and other related
equipment needed to maintain motor vehicles were not included in the aftermarket segment for
this analysis.
At the request of the Motor and Equipment Manufacturers Association, a portion of eight other
industries was also included in the analysis. After a thorough examination, it was determined
that these eight industry groups would be included because these industries also supply directly
to the original equipment manufacturers (light and heavy duty) or to the equipment replacement
aftermarket. These industries are:
• tire manufacturing (NAICS 32621);
• hose manufacturing for on- and off-highway motor vehicles (made of rubber and other
materials —including plastics and nylon) (NAICS 3262203);
• transportation fabricated plastics products manufacturing (excluding foam and reinforced
plastics) (NAICS 3261991);
• motor vehicle hardware manufacturing (lock units, door and window handles, window
regulators, hinges, license plate brackets, etc.) (NAICS 3325106);
• motor vehicle instruments manufacturing (NAICS 3345145);
• motor vehicle light bulbs manufacturing (NAICS 3351101);

16 © Center for Automotive Research 2007
• motor vehicle batteries manufacturing (NAICS 3359111); and
• other truck and vehicle bodies for sale (including dumptruck mechanisms and kit cars)
(NAICS 3362115).
This aggregation of industries —for the purposes of this report —will be referred to henceforth
as motor vehicle suppliers.
The aggregate direct employment in this motor vehicle suppliers’ industry group in 2004─the
most recent year that data was available─was 783,061 people. Employees in the various
industries used to compile the industry group are as follows:
• 599,249 in motor vehicle parts manufacturing,
• 72,845 in motor vehicle plastics manufacturing,
• 57,450 in motor vehicle tires manufacturing,
• 14,626 in motor vehicle instrument manufacturing,
• 12,602 in motor vehicle manufacturing,
• 10,907 in other motor vehicle bodies manufacturing,
• 7,552 in motor vehicle instruments manufacturing,
• 5,905 in motor vehicle hose manufacturing,
• and 1,925 in motor vehicle light bulb manufacturing.
A great deal of attention was given to determining the direct employment numbers for each of
the eight additional industries to avoid the possibility of double counting, (one job being counted
twice in the final employment estimates).6 (For a source and description of how these individual
motor vehicle supplier employment levels were calculated, see Appendix A.7)
6 Indirect and expenditure-induced employment results in model simulations are determined by two key relations:
• the interaction of various industries with each other based on input-output tables developed by the U.S. Department of Commerce Bureau of Economic Analysis, and
• the inter-state flow of trade. To isolate the possible effects of double-counting (that is, the impact of one job being counted twice – as a direct job and as an indirect job), we first examined the underlying data tables in the model that support model algorithms. Secondly, we ran numerous iterations to see actual model behavior relative to incrementally changing direct job inputs to the model. After exhaustive analysis, including consulting with the model developer, REMI, we adjusted our input numbers to offset the possibility of double-counting that results from multiple model iterations during a simulation. We also limited the number of iterations the model used to reduce the impact of the above discussed relations. Direct jobs were input from 8 NAICS categories beyond the primary focus of our study, NAICS 3363, auto parts manufacturing. The direct jobs from six of the ancillary categories were negligible both in absolute number and as a percent of that NAICS category employment numbers. Of

17 © Center for Automotive Research 2007
Results
The tables in this section of the report show the estimates of the economic contribution
associated with the motor vehicle parts manufacturing industry in the United States. These
estimates are derived from the direct employment associated with motor vehicle parts
manufacturing. In addition to estimating the direct employment, this report also estimates
indirect and expenditure-induced employment as a result of the parts manufacturing operations
in the United States. Indirect employment refers to people who work at the goods and services
suppliers who supply the motor vehicle parts manufacturers. Expenditure-induced employment
is the employment resulting from consumer spending by the direct and indirect employees who
earn an income as a result of the motor vehicle parts manufacturing activities.
Employment and income estimates are derived from analyses using a regional economic
software model. (The model and methodology used will be further discussed in a later section.)
Data on direct employment and compensation for the manufacturing component of the industry
are from the BLS Employment, Hours, and Earnings State and Metro report using the Current
Employment Statistics Survey, 20058, with indirect and expenditure-induced effects generated
by the model. Direct employment data includes salaried and hourly employment.
Contribution of Motor Vehicle Parts Manufacturing
Summary estimates of the employment contributions of automotive manufacturing to the private
sector of the U.S. economy are shown in Table 2. Both production and non-production workers
employed by the manufacturing firms are included in the direct effect. In 2004, the motor
vehicle parts manufacturing industry directly employed over 783,000 workers nationwide. This
is shown as direct employment in Table 2. (Henceforth, in the body of this report, employment
figures will be rounded to the nearest 100 workers. Therefore, direct employment is shown as
783,100).
the two remaining categories, the employment numbers for one, NAICS 3261 for Plastics, were about 10% of all direct jobs and about 12% of that industry’s total, and it was determined that the model results were not compromised and no adjustment was required. For NAICS 3262, Rubber, model inputs were adjusted at a level of about 10% to account for possible interaction effects inherent in the model’s method of calculating results. 7 The aggregate employment number for the this motor vehicle suppliers’ industry group does not include any captive parts suppliers within the automotive manufacturing operations —such as stamping, transmissions, and engines manufacturing —at original equipment manufacturers (OEMs). These parts manufacturing employees at the OEMs are considered —for the purposes of this study —to be motor vehicle manufacturing employees. 8 See Appendix A

18 © Center for Automotive Research 2007
Based on the 783,100 direct employees, indirect employment associated with the motor vehicle
parts manufacturing activities is estimated to be 1,972,100 jobs. Summing direct and indirect
jobs together equals 2,755,100 private sector jobs. The resulting number of jobs, both direct
and indirect, created as a result of every direct job can be expressed as an “employment
multiplier”9. In this case, the employment multiplier is 3.5 ((783,100 + 1,972,100) / 783,100 =
3.5). This employment multiplier can be interpreted two ways: (1) there are 3.5 times as many
total jobs generated as there are direct jobs, or (2) there are 2.5 indirect jobs in the U.S.
economy for every one direct job at a supplier facility (1 direct job + 2.5 indirect jobs).
The bottom of Table 2 shows the estimate for expenditure-induced employment contribution to
be 1,704,600 jobs. Adding the 783,100 direct jobs plus the 1,972,000 indirect jobs to the
expenditure-induced jobs brings the total employment impact of the motor vehicle industry to
4,459,700 total jobs. The corresponding employment multiplier equals 5.7 ((783,100 +
1,972,100 + 1,704,600) / 783,100 = 5.7), or 4.7 additional jobs in the U.S. economy for every
one job in a motor vehicle supplier plant.
The contribution of motor vehicle parts manufacturing to compensation in the private sector
economy, calculated as the direct plus indirect and expenditure-induced effects, is estimated to
be about $252.3 billion, measured in 2004 dollars. This estimate of compensation is prior to
deductions for personal income taxes and contributions to social insurance programs.
To put the employment and compensation contributions in some context, these contributions
are represented in Table 2 as a share of the total private sector economy for the United States.
The economic contribution of direct, indirect and expenditure-induced automotive manufacturing
activities in 2004 represents 2.9 percent of the private sector jobs and 2.2 percent of the private
sector compensation in the U.S. economy.
As mentioned earlier, the estimate of compensation is prior to deductions for personal income
taxes and contributions to social insurance programs, and does not include transfer payments.
A reduction in transfer payments of over $17.0 billion is associated with automotive parts
manufacturing activity in 2004, and personal income tax revenues are increased by over $28.0
billion. The implication for disposable personal income, or personal income after taxes and
including transfers, is an increase of over $204.2 billion in the domestic economy for 2004.
In summary, the employment contribution associated with motor vehicle parts manufacturing
activity in the United States is estimated to be about 2.8 million jobs in the private sector 9 The employment multipliers apply to the national economy and are not applicable to, nor can be derived from, any one state’s economy. For a further explanation of multipliers, see page 33.

19 © Center for Automotive Research 2007
attributed to direct and indirect jobs, and 4.5 million when the expenditure-induced effects are
included. The compensation contribution is estimated at about $252 billion for all 4.5 million
jobs.
Table 2 Total Employment Contribution of Motor Vehicle Parts Supplier Manufacturing
Operations to the Private Sector Economy in the United States, 2004
Employment (1000s)Direct 783Indirect 1,972Total (Direct + Indirect) 2,755Multiplier 3.5
Activities including expenditure-induced effect
EmploymentExpenditure-induced 1,705Total (direct + indirect + expenditure-induced) 4,460
Contribution as % of total U.S. economyEmployment 2.9%Compensation (Personal income) 2.2%
Due to the demands of one industry on other industries, many jobs are created across the
economy by the motor vehicle parts suppliers. An estimate of how these jobs are dispersed
across five major sectors is shown in Table 3. Not surprisingly, 32 percent of the estimated jobs
are in manufacturing. However, it is estimated that there are a substantial number of jobs
estimated to be in three other sectors. An estimated 21 percent of the jobs are located in the
business and professional services sector, 21 percent in the education, health and personal
services sector, 19 percent in the retail or wholesale trade, warehousing, and transportation
sector, and the remaining 7 percent of the jobs are in the raw materials, construction sector.

20 © Center for Automotive Research 2007
Table 3 Total Employment Contribution of Motor Vehicle Parts Supplier Operations
(direct, indirect and expenditure-induced) by Major Sector
TOTAL EMPLOYMENT 4,459,700
Major Sector EmploymentManufacturing 1,435,500 32%
Business & Professional Services 928,700 21%Retail or Wholesale Trade, Warehousing, Transportation 850,600 19%
Education, Health and Personal Services 926,800 21%Raw Material Supply, Construction 318,100 7%
As shown in Table 4 below, a substantial number of the estimated indirect jobs are in the
manufacturing sector. Within durable manufacturing, major suppliers to motor vehicle parts
manufacturers are: plastics and rubber companies, computer, electrical and instrumentation
producers, metal fabricators, foundries, and iron and steel suppliers. Within nondurable
manufacturing, key suppliers are chemical companies, paper and printing services.

21 © Center for Automotive Research 2007
Table 4 Indirect and Expenditure-induced Manufacturing and Non-manufacturing Employment
Contribution for the United States, 2004 Note: Due to rounding, columns or rows may not sum exactly
INTERMEDIATEEXPENDITURE-
INDUCEDManufacturing 539,735 112,664Iron, steel mills, steel or ferroalloy products mfg 34,640 4,310Alumina, aluminum prod, nonferrous metals process 18,473 1,990Foundries 39,649 4,750Fabricated metal prod mfg 105,302 12,010Motor vehicle mfg 53,924 8,673Plastics, rubber prod mfg 44,558 5,541Electrical or computer products 49,176 12,009Other Manufacturing 194,013 63,381
Non-Manufacturing 1,432,332 1,591,897Profess, Tech Services 257,669 33,822Mngmt of Co, Enter 64,323 29,104Admin, Waste Services 231,792 18,232Wholesale Trade 164,857 45,507Retail Trade 69,064 391,113Transp, Warehousing 153,987 26,054Finance, Insurance 119,602 84,486Other Services (excl Gov) 284,299 923,214Other Non-Manufacturing 86,739 40,363
TOTAL 1,972,067 1,704,561
The high level of indirect employment in the non-manufacturing sector is less well known.
Activities such as professional and technical services, wholesale trade, trucking and finance are
linked much more closely to the supplier network for motor vehicle parts manufacturing than is
often recognized. In fact, it is estimated that the number of indirect non-manufacturing jobs are
almost three times as high as those in the indirect manufacturing sector. The industrial sector,
in this sense, extends well beyond the official designations for manufacturing activity.
Most of the expenditure-induced activity is in the private non-manufacturing sector, particularly
in industries such as services and retail trade, due to household purchasing activity. A complete
breakout of the total estimated job impact by manufacturing and non-manufacturing industries is
shown here in Table 5.

22 © Center for Automotive Research 2007
Table 5 Total Employment Contribution (direct, indirect and expenditure-induced) of Motor
Vehicle Parts Supplier Operations by Industry
The following three Tables: 6, 7, and 8, show job impacts for the top 17 states, broken out by
indirect jobs (Table 6), expenditure-induced jobs (Table 7), and total jobs (Table 8). Each of
these tables shows the states ranked by the number of jobs in each of the three categories.
TOTAL 4,459,700Manufacturing Wood product mfg 15,600Nonmetallic mineral prod mfg 18,600Iron, steel or ferroalloy products mfg 39,000Aluminum prod, nonferrous metals mfg 20,500Foundries 44,400Fabricated metal prod mfg 131,900Machinery mfg 23,500Computer, electronic prod mfg 53,700Electrical equip, appliance mfg 29,600Motor vehicle mfg 664,900Transp equip mfg. exc. motor veh 3,700Furniture, related prod mfg 11,800Miscellaneous mfg 14,800Food mfg 33,400Beverage, tobacco prod mfg 4,600Textile mills 19,600Textile prod mills 7,100Apparel mfg 20,200Leather, allied prod mfg 12,300Paper mfg 18,700Printing, rel supp act 18,600Petroleum, coal prod mfg 3,300Chemical mfg 31,500Plastics, rubber prod mfg 194,200Total Manufacturing 1,435,500
Non-ManufacturingForestry, Fishing, Other 16,000Mining 7,600Utilities 13,800Construction 280,700Wholesale Trade 210,400Retail Trade 460,200Transp, Warehousing 180,000Information 89,700Finance, Insurance 204,100Real Estate, Rental, Leasing 68,700Profess, Tech Services 291,500Mngmt of Co, Enter 93,400Administrative and General Business Svc 250,000Educational Services 65,000Health Care, Social Asst 148,000Arts, Enter, Rec 81,100Accom, Food Services 285,000Other Services (excl Gov) 279,000Total Non-Manufacturing 3,024,200

23 © Center for Automotive Research 2005
Table 6 Indirect Employment Contribution by 17 States and Nationally, 2004
Note: Due to rounding, columns or rows may not sum exactly
INTERMEDIATE U.S. MI OH IN IL TX CA NY TN PA NC GA KY WI FL MO SC AL Balance of U.S.
Manufacturing 539,735 56,036 59,190 42,929 31,675 22,047 24,155 18,573 19,780 28,111 23,255 15,085 16,208 23,161 6,607 10,565 14,199 15,298 112,859Iron, steel mills, steel or ferroalloy products mfg 34,640 3,321 5,316 4,817 1,769 1,053 1,103 768 1,025 2,755 564 623 1,300 1,655 216 646 480 1,608 5,619Alumina, aluminum prod, nonferrous metals process 18,473 1,771 2,835 2,569 944 562 588 410 546 1,469 301 332 693 883 115 345 256 858 2,996Foundries 39,649 3,802 6,085 5,513 2,025 1,206 1,262 879 1,173 3,154 646 714 1,488 1,894 247 740 550 1,841 6,431Fabricated metal prod mfg 105,302 14,458 13,757 8,103 8,945 4,253 4,592 3,470 3,819 5,574 2,731 1,727 2,354 5,338 1,193 2,058 2,109 2,336 18,484Motor vehicle mfg 53,924 15,634 7,845 7,373 2,009 626 969 1,625 1,955 868 1,142 731 2,619 1,310 302 1,063 990 1,025 5,839Plastics, rubber prod mfg 44,558 5,475 6,670 4,261 2,954 1,471 1,347 1,107 2,039 1,662 1,874 1,283 1,370 1,837 329 937 1,447 951 7,546Electrical or computer products 49,176 1,856 2,575 2,015 3,055 3,077 6,113 2,574 1,324 2,273 2,160 895 725 1,771 1,064 783 828 674 15,413Other Manufacturing 194,013 9,718 14,106 8,280 9,974 9,800 8,180 7,741 7,899 10,356 13,836 8,779 5,660 8,473 3,142 3,993 7,539 6,005 50,532
Non-Manufacturing 1,432,332 136,697 124,798 76,926 91,590 88,396 86,395 75,240 50,074 54,897 43,263 49,445 34,905 33,392 49,756 30,237 24,381 25,085 356,855
Profess, Tech Services 257,669 26,506 21,811 12,086 16,680 14,505 18,152 16,896 8,223 10,472 6,918 7,747 5,053 5,095 7,122 4,713 3,715 4,427 67,550Mngmt of Co, Enter 64,323 9,582 7,960 3,885 3,662 2,379 5,032 2,617 2,310 2,231 2,361 2,341 1,227 1,795 1,291 1,561 887 759 12,443Admin, Waste Services 231,792 22,556 21,059 13,115 15,906 13,869 14,069 10,028 8,788 7,906 7,339 8,560 5,413 4,720 13,313 4,372 4,728 4,249 51,802Wholesale Trade 164,857 18,999 17,054 11,370 11,208 8,628 8,574 7,754 6,776 6,411 5,657 6,232 4,712 4,499 3,773 3,588 2,977 3,362 33,282Retail Trade 69,064 8,381 7,032 5,229 3,835 3,727 2,781 2,426 2,795 2,639 2,195 2,177 2,296 1,953 1,696 1,769 1,588 1,428 15,114Transp, Warehousing 153,987 9,640 12,152 8,514 10,710 9,627 6,937 6,197 7,005 7,060 5,011 6,172 5,139 4,568 5,102 3,996 2,526 2,791 40,841Finance, Insurance 119,602 9,369 9,222 4,949 9,861 8,713 6,623 9,503 3,318 4,545 3,006 3,512 2,367 2,876 3,883 2,457 1,591 1,634 32,174Other Services (excl Gov) 284,299 26,776 23,916 14,840 16,856 15,421 20,460 17,211 9,106 10,799 8,457 9,973 6,720 6,536 10,675 6,621 4,722 4,269 70,939Other Non-Manufacturing 86,739 4,888 4,592 2,936 2,871 11,529 3,769 2,608 1,752 2,832 2,319 2,732 1,979 1,350 2,901 1,161 1,646 2,166 32,709
TOTAL INTERMEDIATE 1,972,067 192,732 183,988 119,855 123,265 110,443 110,550 93,813 69,854 83,008 66,518 64,530 51,113 56,553 56,363 40,802 38,580 40,384 469,714

24 © Center for Automotive Research 2007
Table 7 Expenditure-induced Employment Contribution by 17 States and Nationally, 2004
Note: Due to rounding, columns or rows may not sum exactly
Expenditure-induced U.S. MI OH IN IL TX CA NY TN PA NC GA KY WI FL MO SC AL Balance of U.S.
Manufacturing 112,664 6,687 8,606 5,457 7,308 8,500 6,921 5,047 5,015 5,536 5,268 4,485 2,960 3,514 2,379 2,390 2,378 2,969 27,243Iron, steel mills, steel or ferroalloy products mfg 4,310 115 461 384 249 305 51 109 175 417 86 129 178 210 53 106 57 254 970Alumina, aluminum prod, nonferrous metals process 1,990 53 213 177 115 141 23 50 81 192 40 60 82 97 25 49 26 117 448Foundries 4,750 126 508 423 275 336 56 120 192 459 95 142 196 231 59 117 63 280 1,069Fabricated metal prod mfg 12,010 610 1,109 544 1,326 761 276 425 572 765 386 296 268 604 245 293 244 291 2,994Motor vehicle mfg 8,673 1,472 1,067 926 455 281 187 363 459 178 263 223 463 203 109 250 158 200 1,417Plastics, rubber prod mfg 5,541 302 680 385 400 240 111 144 347 225 302 242 174 197 57 131 197 148 1,258Electrical or computer products 12,009 400 493 306 726 1,106 1,475 675 423 472 478 323 176 259 365 178 178 148 3,828Other Manufacturing 63,381 3,610 4,075 2,312 3,761 5,330 4,741 3,159 2,766 2,828 3,618 3,070 1,423 1,713 1,467 1,266 1,454 1,529 15,260
Non-Manufacturing 1,591,897 178,476 150,625 108,804 96,976 90,024 76,552 75,458 62,059 61,336 49,259 50,485 41,973 39,160 40,854 37,202 30,691 29,569 372,392
Profess, Tech Services 33,822 3,560 2,989 1,791 2,161 1,905 2,183 1,813 1,287 1,295 878 1,041 792 624 950 585 578 747 8,645Mngmt of Co, Enter 29,104 1,510 2,794 503 1,911 26 867 2,580 317 1,032 1,827 933 444 910 249 2,408 143 115 10,534Admin, Waste Services 18,232 2,092 1,848 1,245 1,005 1,052 867 629 809 601 577 613 467 376 901 368 460 344 3,978Wholesale Trade 45,507 4,405 4,187 2,518 3,603 3,112 1,983 2,333 1,896 1,626 1,324 2,092 1,045 1,017 1,556 1,002 724 818 10,268Retail Trade 391,113 49,379 40,522 31,226 21,837 22,228 16,078 14,797 17,332 14,381 12,267 12,685 11,695 9,798 8,885 8,316 8,478 8,495 82,714Transp, Warehousing 26,054 1,612 1,740 1,183 2,051 2,153 1,391 1,469 1,108 1,065 763 1,054 602 650 957 678 304 339 6,935Finance, Insurance 84,486 8,719 7,838 4,865 6,122 5,027 3,826 4,171 3,109 3,383 2,477 2,606 1,999 2,260 2,288 1,914 1,518 1,624 20,741Other Services (excl Gov) 923,214 104,993 86,949 63,311 54,137 52,441 46,640 45,910 35,607 36,150 28,226 28,420 23,722 22,209 23,847 20,615 17,836 16,537 215,666Other Non-Manufacturing 40,363 2,206 1,758 2,162 4,150 2,079 2,717 1,757 595 1,803 920 1,042 1,207 1,316 1,223 1,317 650 552 12,910
TOTAL EXPENDITURE-INDUCED 1,704,561 185,164 159,231 114,261 104,284 98,524 83,473 80,506 67,075 66,872 54,527 54,970 44,933 42,674 43,233 39,593 33,069 32,537 399,635

25 © Center for Automotive Research 2005
Table 8 Total Employment Contribution by the top 17 States and Nationally, 2004
Note: Due to rounding, columns or rows may not sum exactly
U.S. MI OH IN IL TX CA NY TN PA NC GA KY WI FL MO SC AL Balance of U.S.
DIRECT 783,061 145,818 97,323 86,934 40,063 20,175 28,596 31,017 45,749 22,917 27,589 22,701 35,102 21,502 9,273 18,888 20,943 15,965 92,506
INTERMEDIATE 1,972,067 192,732 183,988 119,855 123,265 110,443 110,550 93,813 69,854 83,008 66,518 64,530 51,113 56,553 56,363 40,802 38,580 40,384 469,714
EXPENDITURE-INDUCED 1,704,561 185,164 159,231 114,261 104,284 98,524 83,473 80,506 67,075 66,872 54,527 54,970 44,933 42,674 43,233 39,593 33,069 32,537 399,635
TOTAL EMPLOYMENT CONTRIBUTION 4,459,689 523,714 440,542 321,050 267,612 229,143 222,620 205,336 182,677 172,797 148,635 142,201 131,148 120,729 108,870 99,283 92,593 88,886 961,856
National Multiplier 5.7
26 © Center for Automotive Research 2007
Estimates of motor vehicle parts manufacturing’s contributions to each of the fifty states
and the District of Columbia are shown in Tables 9 and 10. In each state, the estimated
employment contributions are shown for direct, indirect and expenditure-induced effects.
As shown in Table 9, states with little direct employment (such as Alaska, Idaho, and
Montana), as well as the District of Columbia, still benefit from motor vehicle supplier
manufacturing activities through indirect employment (as a result of supplying the
automotive suppliers) and expenditure-induced jobs.
The direct employment contributions among states ranges from a high of 145,800 direct
jobs in Michigan to a low of 9 direct jobs in Alaska, with the respective totals climbing to
523,700 and 1,500 when indirect and expenditure-induced effects are included. As a
share of total state employment, the employment contributions associated with
automotive parts manufacturing are again highest in Michigan at 10 percent and are
lowest in Washington and Hawaii with less than 1 percent each, when including total
direct, indirect and expenditure-induced effects (see Table 9). A number of states (e.g.,
Ohio, Kentucky, Tennessee and Indiana) would be expected to have high shares of
employment related to motor vehicle parts manufacturing. However, due to trade with
other states, there are states with relatively little direct motor vehicle parts manufacturing
activity that nevertheless have a considerable share of auto-related employment (e.g.,
West Virginia, Louisiana and Delaware).

27 © Center for Automotive Research 2007
Table 9 Total Employment Contribution of Motor Vehicle Parts Supplier Operations by
State and as Percent of Labor Force, 2004
State State Total Contribution
State Total Labor Force April 2005
All Contribution as % Labor Force
AL 88,885 2,146,300 4.1%AK 4,593 337,700 1.4%AZ 31,976 2,830,500 1.1%AR 42,955 1,354,100 3.2%CA 223,412 17,640,300 1.3%CO 34,967 2,544,600 1.4%CT 38,486 1,814,200 2.1%DE 8,265 435,400 1.9%DC 9,467 297,600 3.2%FL 108,870 8,611,700 1.3%GA 142,201 4,561,500 3.1%HI 5,000 630,100 0.8%ID 8,376 735,100 1.1%IL 267,612 6,463,700 4.1%IN 321,051 3,196,100 10.0%IA 44,032 1,657,300 2.7%KS 50,668 1,473,300 3.4%KY 131,148 1,993,100 6.6%LA 42,269 2,108,200 2.0%ME 11,522 708,400 1.6%MD 45,875 2,920,900 1.6%MA 58,933 3,362,900 1.8%MI 523,715 5,105,900 10.3%MN 69,441 2,962,600 2.3%MS 49,349 1,348,100 3.7%MO 99,283 3,021,500 3.3%MT 5,892 491,100 1.2%NE 23,499 985,900 2.4%NV 17,715 1,210,500 1.5%NH 12,325 730,400 1.7%NJ 79,029 4,408,700 1.8%NM 10,102 933,400 1.1%NY 205,335 9,397,200 2.2%NC 148,635 4,311,800 3.4%ND 4,613 357,900 1.3%OH 440,543 5,892,200 7.5%OK 41,299 1,735,300 2.4%OR 21,929 1,857,300 1.2%PA 172,797 6,295,800 2.7%RI 8,122 567,500 1.4%SC 92,592 2,067,400 4.5%SD 6,176 431,100 1.4%TN 182,677 2,912,700 6.3%TX 229,142 11,176,300 2.1%UT 26,387 1,261,400 2.1%VT 6,558 354,100 1.9%VA 86,391 3,919,900 2.2%WA 25,850 3,275,500 0.8%WV 23,189 796,500 2.9%WI 121,915 3,036,700 4.0%WY 4,627 282,800 1.6%
TOTAL US 4,459,689 148,950,500

28 © Center for Automotive Research 2007
Table 10 Total Employment Contribution of Motor Vehicle Parts Supplier Operations
Ranked by State
Rank State Direct Employment
Indirect Employment
Expenditure-Induced
Employment
Total Employment Contribution
TOTAL 783,061 1,972,067 1,704,561 4,459,6871 Michigan 145,818 192,732 185,164 523,7142 Ohio 97,323 183,988 159,231 440,5423 Indiana 86,934 119,855 114,261 321,0504 Illinois 40,063 123,265 104,284 267,6125 Texas 20,175 110,443 98,524 229,1426 California 28,596 110,550 83,473 222,6207 New York 31,017 93,813 80,506 205,3368 Tennessee 45,749 69,854 67,075 182,6779 Pennsylvania 22,917 83,008 66,872 172,797
10 North Carolina 27,589 66,518 54,527 148,63511 Georgia 22,701 64,530 54,970 142,20112 Kentucky 35,102 51,113 44,933 131,14813 Wisconsin 21,502 56,553 42,674 120,72914 Florida 9,273 56,363 43,233 108,87015 Missouri 18,888 40,802 39,593 99,28316 South Carolina 20,943 38,580 33,069 92,59217 Alabama 15,965 40,384 32,537 88,88518 Virginia 7,796 42,138 34,605 84,53919 New Jersey 3,356 40,028 35,918 79,30320 Minnesota 6,671 33,350 28,889 68,91021 Massachusetts 1,589 30,165 27,281 59,03522 Kansas 7,508 18,699 23,136 49,34323 Mississippi 13,179 18,221 17,758 49,15924 Maryland 2,413 23,046 20,639 46,09825 Iowa 6,680 22,260 15,324 44,26326 Arkansas 7,922 19,984 15,117 43,02427 Louisiana 1,868 23,034 17,300 42,20228 Oklahoma 6,986 19,074 15,529 41,58929 Connecticut 4,109 17,940 16,470 38,51930 Colorado 1,756 17,206 16,112 35,07331 Arizona 3,369 15,965 13,306 32,64032 Utah 4,047 11,382 10,625 26,05433 Washington 1,918 13,618 10,146 25,68234 Nebraska 4,041 10,696 8,813 23,55035 West Virginia 912 13,642 8,692 23,24636 Oregon 1,783 12,110 8,189 22,08237 Nevada 747 8,008 9,657 18,41238 New Hampshire 747 6,289 5,976 13,01239 Maine 290 6,505 4,992 11,78740 New Mexico 100 5,582 4,483 10,16541 District of Columbia 70 6,272 3,190 9,53242 Rhode Island 822 4,330 3,709 8,86043 Delaware 313 4,477 3,768 8,55844 Idaho 68 4,829 3,543 8,44045 Vermont 370 3,338 3,180 6,88846 South Dakota 378 3,416 2,732 6,52547 Montana 50 3,187 2,700 5,93748 Hawaii 125 2,611 2,386 5,12249 North Dakota 363 2,604 1,978 4,94550 Wyoming 150 2,624 1,986 4,76051 Alaska 9 3,086 1,506 4,601
The map in Figure 9 shows the employment impact of the industry on a state’s
workforce, by highlighting the contribution of the total motor vehicle parts manufacturing-
related jobs as a percentage of the state’s total workforce. This map shows a broad
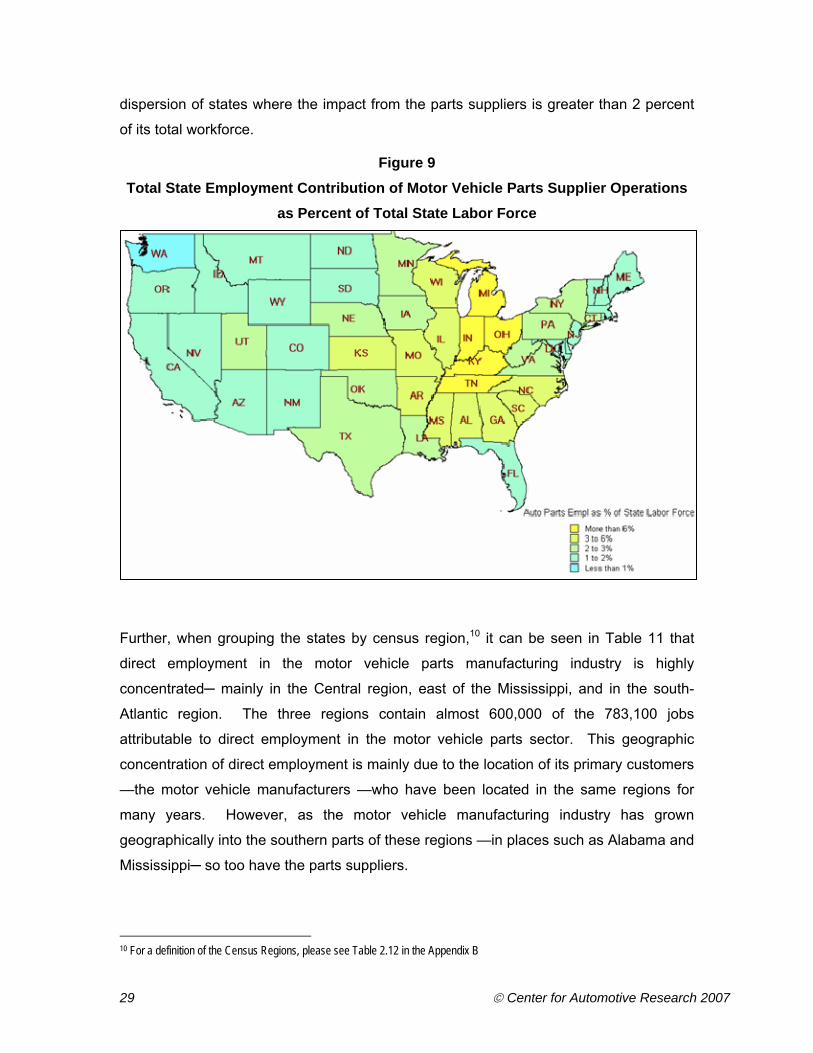
29 © Center for Automotive Research 2007
dispersion of states where the impact from the parts suppliers is greater than 2 percent
of its total workforce.
Figure 9 Total State Employment Contribution of Motor Vehicle Parts Supplier Operations
as Percent of Total State Labor Force
Further, when grouping the states by census region,10 it can be seen in Table 11 that
direct employment in the motor vehicle parts manufacturing industry is highly
concentrated─ mainly in the Central region, east of the Mississippi, and in the south-
Atlantic region. The three regions contain almost 600,000 of the 783,100 jobs
attributable to direct employment in the motor vehicle parts sector. This geographic
concentration of direct employment is mainly due to the location of its primary customers
—the motor vehicle manufacturers —who have been located in the same regions for
many years. However, as the motor vehicle manufacturing industry has grown
geographically into the southern parts of these regions —in places such as Alabama and
Mississippi─ so too have the parts suppliers.
10 For a definition of the Census Regions, please see Table 2.12 in the Appendix B

30 © Center for Automotive Research 2007
Table 11 Direct Employment Contribution of Automotive Parts Supplier Operations by
Census Region, 2004
Region Name 2004 Direct Employment
Rank of Parts Industry in Region's Economy
East North Central 391,649 1East South Central 109,995 1South Atlantic 92,010 4West North Central 44,530 4Middle Atlantic 57,290 5West South Central 36,951 8Mountain 10,287 15Pacific 32,422 18New England 7,927 25
In conclusion, the motor vehicle parts manufacturing industry appears to be highly
concentrated within three census regions, as a result of direct employment of the
industry and the region’s close proximity to the motor vehicle manufacturers. However,
when factoring in the goods and services demands of the motor vehicle industry from its
suppliers and their many tiers of suppliers, along with the expenditure-induced
employment effects, the industry contributes to employment in all fifty states and the
District of Columbia. In fact, as can be seen in Table 12, the three regions that contain
almost 77 percent of direct employment in the industry group, account for only 63
percent of 4.5 million total jobs attributable to the motor vehicle parts manufacturing
industry, indicating a broad dispersion of the economic and employment benefits
attributable to the industry.

31 © Center for Automotive Research 2007
Table 12 Total Employment Contribution of Motor Vehicle Parts Supplier Operations by
Census Region, 2004
Census RegionAll Parts
Direct Employment
Region % of Total
Parts Direct Empl
All employment
contributed by Parts sector,
incl direct employment
Region % of Total
Empl Contribut
ion
All Manufacturing Employment,
BLS
East North Central 391,640 50% 1,674,834 38% 3,259,000East South Central 109,995 14% 452,059 10% 1,146,400South Atlantic 92,010 12% 665,484 15% 2,211,200West North Central 44,530 6% 297,712 7% 1,230,500Middle Atlantic 57,290 7% 457,162 10% 1,590,700West South Central 36,951 5% 355,667 8% 1,394,500Mountain 10,287 1% 140,041 3% 625,500Pacific 32,431 4% 280,785 6% 2,016,800New England 7,927 1% 135,946 3% 733,800US Total 783,061 100% 4,459,689 100% 14,208,400

32 © Center for Automotive Research 2007

33 © Center for Automotive Research 2007
Section III: Methods
The basic approach in these analyses has been to use a specially constructed regional
economic impact model, input parts manufacturing industry-specific data, and generate
estimates of the economic contribution associated with the sector on state and national
levels.
The Macroeconomic Model
For the estimation of employment and compensation associated with the automotive
parts supply sector in the United States, we use an economic model supplied and
constructed specifically for this study by Regional Economic Models, Inc. (REMI) of
Amherst, Massachusetts. We then make adjustments to the model to reflect the general
characteristics of the motor vehicle parts manufacturing industry. The REMI model,
which has been fully documented and peer-reviewed, was designed for the type of
analyses employed in this current study and has been used by CAR and other
organizations for over two decades for these types of analyses.
The version of the model used in this study represents the economies of all 50 states
(individually) and the District of Columbia, in addition to the U.S. national economy. This
model allowed for simulating all the state economies and the national economy,
providing for an accounting of interregional trade and migration. The model can simulate
economic impacts that may occur in any one state, resulting from changing the
manufacturers’ level of activities in any or all of the other states.
The data input into this model included employment (at the end of 2004) for each state.
Before the data was input, it was coded according to the North American Industry
Classification System (NAICS). We then made adjustments in the data to accurately
reflect manufacturer employment by netting out non-motor vehicle parts manufacturing-
related workers that were not included in the general NAICS 3363 classification.
The general methodology in the analyses is to run baseline simulations for each state’s
economy, then subtract the parts manufacturer activities in each of the states and run
another set of simulations. The difference between the simulations represents the
impact the parts manufacture sector has on each state.
This study should not be interpreted as representing the economic activity that would be
lost if the automotive industry did not operate in the United States. That scenario would

34 © Center for Automotive Research 2007
generate significant compensating adjustments over time in the economy, and is not
examined in this study. Our purpose is to dissect the industry’s current presence in the
domestic economy. This study only represents a snapshot at a particular time (the end
of 2004) of the total employment impact of the nation’s economy.
To benchmark the results of the regional simulations, comparative runs were made
using the same model at the national level, with no state-level detail in the inputs or
outputs of the simulation. Both a baseline case and a simulation with motor vehicle
parts employment were run. The corresponding results for the nation, when compared
to the state-level results, were used to isolate the inter-state trade flow effects within the
regional model results. These inter-state trade flow effects vary from state to state. The
economies of some states are more isolated than others, and hence, less affected by
inter-state trade flows. Therefore, the employment multipliers discussed earlier in the
study (beginning on page 18) apply to the national economy and are not applicable to,
nor can they be derived from, any one state’s economy.
The model used for this study is a multi-regional US (MRUS) model comprised of the 50
U.S. States and the District of Columbia. The multi-regional property of the model allows
the user to “shock” a regional economy by causing a change in the level of employment
or output for a given sector in any one or all of the regions. When this activity is
performed the model calculates the indirect and induced impact of the change within the
region of impact as well as the total amount of inter-state trade affected. When you
observe the shock on exports as an aggregate value across all regions, it encompasses
the total change to trade activity, acknowledging that this trade was done for many
purposes.

35 © Center for Automotive Research 2007
APPENDIX A: Determination of Direct Employment in Each NAICS Industry
Data for this study were collected using the NAICS system of classifying employment,
compensation and output. A total of 9 subsectors, or industry groups, were selected for
inclusion in the analysis. These are shown in Table 13.
Table 13
Sectors Comprising Auto Parts Manufacturing Industry
NAICS, Sector.Subsector Category Description
Employees in sector,
Census data, 2002
Employees attributable to
auto parts subsector
Sources
3261.991 Transportation fabricated plastics products (excluding foam and reinforced plastics) 109,638 72,845Ohio Plastics Study. BEA I/O Matrices. Census data at the 7-digit NAICS level, 2002.
3262.1 Tires 68,300 57,450 Rubber Manufacturers Association
3262.203 Hoses for on and off highway motor vehicles, made of rubber and other materials 5,905 5,905Use entire sector. Census data at the 7 digit NAICS level, 2002
3325.106 Motor vehicle hardware - lock units, handles, hinges, license plate brackets, etc. 14,626 14,626Use entire sector. Census data at the 7 digit NAICS level, 2002
3345.145 Motor vehicle instruments 7,552 7,552Use entire sector. Census data at the 7 digit NAICS level, 2002
3351.101 Electric lamp bulbs and tubes 9,947 1,925websites applied to 2004 BLS Current Employment Estimates
3359.111 Storage batteries, lead acid type 11,282 12,602 Battery Council International
3362.115 Other truck and vehicle bodies for sale 10,907 10,907Use entire sector. Census data at the 7 digit NAICS level, 2002
3363 Motor Vehicle Parts 678,000 599,249 Harbour Report 2005 Before running the economic estimation model, it was first necessary to determine the
number of jobs in each subsector or industry group, as some of these contain
companies that do not produce parts exclusively for motor vehicles. For instance, tire
manufacturers also produce tires for airplanes, and light bulb manufacturers produce for
a variety of applications besides motor vehicles. Details of the determination of
employment in each of the nine categories that make up the motor vehicle parts
manufacturing industry group are discussed below.
Automotive Parts Supply: The data were compiled at a 4-digit NAICS Code level. The
appropriate code is 3363. For this code, parts manufacturing employment engaged by
Original Equipment Manufacturers (OEMs) within OEM assembly, powertrain or
stamping operations was excluded from the study. These jobs comprise slightly over
10% of the total sector. All other jobs within this sector, approximately 600,000, were
considered direct employment inputs for the model. (Please see Table 14)

36 © Center for Automotive Research 2007
Table 14 OEM parts employment excluded from parts sector, NAICS 3363
US DATA # Establishments Total EmploymentTransmission 12 24,178Engine 20 20,434Stamping 35 34,055
TOTALS 67 78,667
Source: CAR Research Battery manufacturing: Employment in this category was taken from forecasts of battery
shipments by type of battery, prepared by the Battery Council International. Motor
vehicle-related employment was estimated based on actual historical employment and
shipments, compared to forecasts by type of battery. Only batteries destined for motor
vehicle use were considered. As noted in Table 15, approximately 70 percent of all
battery production in the U.S. is for light motor vehicle use.
Table 15 Determination of auto-related employment in battery manufacture
33591 BATTERIES
2004 Data
Shipments of Storage
Batteries $ # BatteriesValue
per unit
All Employe
esAll Employee
Payroll, 2004 $Production
Workers
Production Payroll, 2004 $
Percent of Total
Storage Battery Market
Light Vehicle for OE 476,762,790 15,900,000 30 2,336 93,355,011 1,783 61,714,158 13.88% Light Vehicle for Replacement 1,925,042,210 64,200,000 30 9,434 376,942,875 7,197 249,185,470 56.06%Light Vehicle Total 2,401,805,000 80,100,000 30 11,770 470,297,886 8,980 310,899,628 69.95%
12602 Number to use to match 2004 REMI data from County Business Patterns.
SourcesAnnual Survey of Manufacturers 2004, U.S. Census BureauBattery Shipment Review and Three-Year Forecast. By Jim Jelin. The Battery Man magazine. July/August, 2005. Battery Council International.North American Industrial Battery Forecast Report. By Bob Cullen. The Battery Man magazine. September, 2005. Battery Council International.
Tire manufacturing: U.S. government data for this industry is at a 4-digit NAICS code
level, which includes tires made for aircraft and non-motorized vehicles (wheelbarrows,
etc.). Employment in this category was taken from forecasts of tire shipments prepared
by the Rubber Manufacturers Association. Employment was estimated based on actual
historical employment and shipments compared to forecasts by type of tire. Only tires
destined for motor vehicle use were considered. As noted in Table 16, approximately 93
percent of all tire production in the U.S. is for light motor vehicle use.

37 © Center for Automotive Research 2007
Table 16 Determination of auto-related employment in tire manufacture
32621 Tires
2004 Data Shipments of Tires $Thousands of
Tires All EmployeesAll Employee
Payroll, 2004 $Production
Workers Production
Payroll, 2004 $Percent of Total
Tire Market Light Vehicle for OE 2,818,322,060 57,400 11,100 552,693 8,949 428,380 17.87% Light Vehicle for Replacement 11,768,924,180 239,400 46,350 2,307,968 37,370 1,788,855 74.64%Light Vehicle Total 14,587,246,240 296,800 57,450 2,860,661 46,320 2,217,235 92.51%
SourcesAnnual Survey of Manufacturers 2004, U.S. Census BureauPress Release, March 13, 2006: Tire Shipments Forecasted to Increase in 2006. Rubber Manufacturers Association
Light bulb manufacture: U.S. government data for this industry is at a 4-digit NAICS
code level, which includes all types of light bulbs. Several major international light bulb
manufacturers provide a breakdown of production or sales by type of light bulb. This
information was used to develop a production profile of auto light bulb manufacturing as
a component of the entire industry. Furthermore, many of the major producers provide
detailed information on their manufacturing operations. When available, employment at
facilities specifically identified as motor vehicle-related manufacturing was used.
Approximately 17 percent of all bulbs produced are for the motor vehicle industry. When
specific site-related employment was not available, employment was estimated using the
percent of motor vehicle bulbs produced within the entire industry production.
Transportation fabricated plastics products: According to 1999 SIC statistics, which
break this industrial class into specific transportation sectors, plastics for motor vehicles
accounted for approximately two-thirds of total transportation plastics. This percentage
was then applied to current employment data to estimate the motor vehicle-related
employment contribution from the plastics products manufacturing.

38 © Center for Automotive Research 2007
Table 17 Motor Vehicle Parts Supplier Manufacturing Employment by Industry, by State
Automotive Batteries
Light Bulbs for
Automotive Use
Automotive Instrumentat
ion
Automotive Hardware Auto Bodies Auto Parts
Rubber Hoses & Belting
Tires Plastics Total Direct Employment
Alabama 191 360 220 511 11,150 47 2,622 864 15,965Alaska 9 9Arizona 3,346 13 10 3,369Arkansas 86 115 92 4,379 213 2,437 600 7,922California 525 55 670 1,998 1,257 23,315 187 589 28,596Colorado 196 0 264 1,283 3 10 1,756Connecticut 50 126 596 12 3,322 3 4,109Delaware 300 13 313District of Columbia 70 70Florida 50 215 344 576 6,200 189 948 751 9,273Georgia 600 157 260 293 17,100 101 2,590 1,600 22,701Hawaii 125 125Idaho 65 3 68Illinois 856 615 360 1,279 424 26,500 205 3,223 6,601 40,063Indiana 700 500 182 981 1,033 70,900 47 3,705 8,886 86,934Iowa 400 86 185 292 4,100 213 1,404 6,680Kansas 600 7 28 200 5,800 213 661 7,509Kentucky 86 579 252 25,350 101 1,227 7,507 35,102Louisiana 401 24 7 92 520 213 611 1,868Maine 290 290Maryland 2,400 13 2,413Massachusetts 65 86 167 44 1,180 47 1,589Michigan 400 1,577 1,543 265 124,345 387 2,402 14,899 145,818Minnesota 182 328 353 3,730 67 511 1,500 6,671Mississippi 2 423 66 11,240 13 1,235 200 13,179Missouri 700 7 28 236 14,010 370 1,503 2,034 18,888Montana 50 50Nebraska 446 109 179 2,800 507 4,041Nevada 700 47 747New Hampshire 700 47 747New Jersey 600 60 24 115 81 1,400 103 973 3,356New Mexico 100 100New York 70 224 568 362 26,300 101 1,579 1,813 31,017North Carolina 1,300 233 709 806 18,500 340 4,272 1,429 27,589North Dakota 350 13 363Ohio 1,100 290 379 952 518 77,140 663 9,322 6,959 97,323Oklahoma 27 348 92 4,600 3 1,916 6,986Oregon 1,750 3 30 1,783Pennsylvania 1,200 110 913 721 1,055 11,900 208 1,741 5,069 22,917Rhode Island 800 22 822South Carolina 86 141 230 16,500 399 2,589 998 20,943South Dakota 375 3 378Tennessee 1,200 86 909 97 32,740 514 6,590 3,613 45,749Texas 700 60 341 286 315 12,500 129 2,413 3,431 20,175Utah 4,000 47 4,047Vermont 370 370Virginia 24 107 97 7,265 3 300 7,796Washington 1,900 13 5 1,918West Virginia 28 49 830 5 912Wisconsin 1,129 360 552 764 14,500 101 5 4,091 21,502Wyoming 150 150
12,602 1,925 7,552 14,626 10,907 599,249 5,905 57,450 72,845 783,061

39 © Center for Automotive Research 2007
APPENDIX B
Table 18 Census Regions of the United States
Region 1 New England Region 2 Middle Atlantic Region 3 East North CentralConnecticut New Jersey IllinoisMaine New York IndianaMassachusetts Pennsylvania MichiganNew Hampshire OhioRhode Island WisconsinVermont
Region 4 West North Central Region 5 South Atlantic Region 6 East South CentralIowa Delaware AlabamaKansas DC KentuckyMinnesota Florida MississippiMissouri Georgia TennesseeNebraska MarylandNorth Dakota North CarolinaSouth Dakota South Carolina
VirginiaWest Virginia
Region 7 West South Central Region 8 Mountain Region 9 PacificArkansas Arizona AlaskaLouisiana Colorado CaliforniaOklahoma Idaho HawaiiTexas Montana Oregon
Nevada WashingtonNew MexicoUtahWyoming

40 © Center for Automotive Research 2007
References
American Automobile Manufacturers Association. “Auto and Truck Output.” Economic Indicators (1st Quarter 1997):15.
Automotive News. 2004 Market Data Book. Detroit: Automotive News, 1997.
Campbell, Harrison Jr. “State and Regional Economic Impact of Diamond-Star Motors.” Illinois Business Review, 45, no 4. (August 1998).
CSM Worldwide. North American Light Vehicle Forecast, October 2004.
DesRosiers Automotive Consultants Inc. AIAM: A Report Examining Member Company Contributions to the U.S. Economy. Richmond Hill, Ontario: DesRosiers Automotive Consultants Inc., 1997.
Harbour and Associates. The Harbour Report 2003. Troy, MI.
Harbour Consulting. The Harbour Report, North America 2004, Troy, MI.
Institute of Labor and Industrial Relations and the Office for the Study of Automotive Transportation, University of Michigan and the Center for Automotive Research. “Contribution of the Automotive Industry to the U.S. Economy in 1998: The Nation and Its 50 States.” A Study Prepared for the Alliance of Automobile Manufacturers, Inc. and the Association of International Automobile Manufacturers, Inc. Ann Arbor, Winter 2001.
Institute of Labor and Industrial Relations, University of Michigan and the Center for Automotive Research. “Contribution of the U.S. Motor Vehicle Industry to the Economies of the United States, California, New York, and New Jersey in 2003.” Prepared for the Alliance of Automobile Manufacturers, Inc., Ann Arbor, May, 2004.
Office for the Study of Automotive Transportation, Transportation Research Institute, and the Institute of Labor and Industrial Relations, University of Michigan. “The Contribution of the International Auto Sector to the U.S. Economy.” A study prepared for the Association of International Automobile Manufacturers, Inc., Ann Arbor, March, 1998.
Office for the Study of Automotive Transportation, Transportation Research Institute, University of Michigan. “Competitive Survival: Private Initiatives, Public Policy, and the North American Automotive Industry.” A study prepared for the US-Canada Automotive Select Panel, Ann Arbor, June, 1992.
Pindyck, Robert S. and Rubinfeld, Daniel L. Econometric Models and Economic Forecasts. Second Edition. McGraw-Hill Book Company, 1981.
Treyz, George I. “Regional Economic Modeling: A Systematic Approach to Economic Forecasting and Policy Analysis.” Boston: Kluwer Academic Publishers, 1993.
Treyz, George I. “Policy Analysis Applications of REMI Economic Forecasting and Simulation Models.” International Journal of Public Administration 18, no. 1 (1995): 13-42.
Treyz, George I., Dan S. Rickman, and Gang Shao. “The REMI Economic-Demographic Forecasting and Simulation Model.” International Regional Science Review 14, no. 3 (1992):221-53.
U.S. Department of Commerce, Bureau of Economic Analysis, “Foreign Direct Investment in the U.S.: Financial and Operating Data for U.S. Affiliates of Foreign

41 © Center for Automotive Research 2007
Multinational Companies,” (online). Available: http://www.bea.doc.gov/bea/di/di1fdiop.htm (2004).
U.S. Department of Commerce, Bureau of the Census. ASM: 2004 Annual Survey of Manufacturers, Statistics for Industry Groups and Industries. Washington, DC: Government Printing Office.
U.S. Department of Commerce, International Trade Administration 2003, http://ita.doc.gov/td/auto/qfact.html
U.S. Department of Commerce, International Trade Administration, Office of Automotive Affairs, www.ita.doc.gov/td/auto/
U.S. Department of Labor Bureau of Labor Statistics, http://data.bls.gov/
Ward’s Automotive Yearbooks 1998-2003.