Embed Size (px)
Citation preview
Contribution of restricted and widespread species to diversity: theeffect of range cohesion
Hector T. Arita and Gerardo Rodrıguez-Tapia
H. T. Arita ([email protected]), Inst. de Ecologıa and Centro de Investigaciones en Ecosistemas, Univ. Nacional Autonoma de Mexico,Apartado Postal 27-3, CP 58090, Morelia, Michoacan, Mexico. � G. Rodrıguez-Tapia, Inst. de Ecologıa, Univ. Nacional Autonoma deMexico, CP 04510, Mexico, D. F., Mexico.
One of the most noticeable patterns in biogeography is thenon-uniform distribution of species richness across con-tinents. This pattern is ultimately determined by the size,shape, and location of species ranges and the concomitantway in which they overlap to set the number of speciespotentially occurring in a site. Several recent papers haveshown a relationship between the size of a species range andits contribution to the geographic patterns of diversity(reviewed in Gaston 2008). For the birds of sub-SaharanAfrica, the correlation between overall species richness andthe richness of narrow-ranging taxa was found to berelatively low, but to increase when the comparison wasmade with widespread species (Jetz and Rahbek 2002).Similar patterns have been shown for African and Britishbirds (Lennon et al. 2004), Mexican mammals (Vazquezand Gaston 2004), Pacific fish (Mora and Robertson 2005),Neotropical palms (Kreft et al. 2006), and several taxa inSwitzerland (Pearman and Weber 2007). These findingshave been extended to the species richness-energy relation-ship (Evans et al. (2005), and have been considered inoptimization algorithms for the prioritization of areas forconservation purposes (Wilhere et al. 2008).
Lennon et al. (2004) examined the relative contributionof restricted and widespread African and British birds topatterns of diversity by correlating, site by site, overallrichness with richness values generated by subsets of taxaranked in range size order. Subsets including the mostwidespread species showed stronger correlations with overallrichness than subsets of the most restricted species. Lennonet al. (2004) demonstrated this tendency by plottingcorrelation values against cumulative numbers of speciesfor sequences starting with the most widespread or with themost restricted species, finding that in most cases the linefor the former were above the line for the latter. Theyconcluded that widespread species exert a stronger influencethan restricted taxa do on overall patterns of diversity, and
proposed the search for mechanistic explanations for thisgeneral tendency.
Here we show that the correlative patterns discovered byLennon et al. (2004) are, under some circumstances,statistical consequences of two traits of natural geographicranges: 1) their cohesiveness, and 2) the shape of thefrequency distribution of their sizes.
A one-dimensional case
Lennon et al. (2004) measured the information content ofsubsets of species using the cumulative binomial variance.The variance in species richness for a set of sites generatedby the presence�absence pattern of a given species isVar(i)�pi(1�pi) where pi is the proportion of sites inwhich species i occurs. Lennon et al. (2004) described thedistribution of ten species among ten sites with a 10�10presence�absence matrix. A species occurring in five of thesites would generate the maximum variance in speciesrichness among sites (0.5�0.5�0.25), whilst a speciesfound in the ten sites would have the lowest variance (0.0).As pointed out by Lennon et al. (2004), a species occurringin only one of the sites would generate the same amount ofvariance as one occurring in nine (0.1�0.9�0.9�0.1�0.09). This pattern is mirrored by the number of ways inwhich a range can be accommodated among the ten sites.There is only one configuration for a range size equal to ten:all sites occupied. There are 10!/(5!�(10�5)!)�252possible configurations for a five-celled range, but only 10combinations for a one-celled or a nine-celled range. Thus,more information is needed to define the position of a non-cohesive five-celled range (log2 252�7.98 bits) than todescribe the configuration of a one-celled or a nine-celledrange (log210�3.32 bits). A bit is the amount ofinformation contained in one binary digit, that is, a choicebetween 0 and 1 (Shannon and Weaver 1949, Pierce 1980).
Ecography 32: 210�214, 2009
doi: 10.1111/j.1600-0587.2008.05715.x
# 2009 The Authors. Journal compilation # 2009 Ecography
Subject Editor: Carsten Rahbek. Accepted 18 November 2008
210
Figures so far correspond to non-cohesive ranges, that is,sets of sites that can be scattered across the continent, withno restriction in regards of their closeness between eachother.
Now imagine that the ten cells are arranged linearly,forming a one-dimensional domain and that ranges arecohesive. In this case, sites constituting the range must forma continuous line, as in mid-domain models of speciesrichness (Colwell and Lees 2000). Because of this spatialrestriction, there are only 10�(ri�1)�11�ri ways ofaccommodating a range of size ri. Thus, there are still 10possible configurations for a one-celled range (3.32 bits),but only six for a five-celled range (2.58 bits) and two (1.0bits) for a nine-celled range. Modelled as cohesive extents,larger ranges show less uncertainty, so they require lessinformation to define their position. Notice that the metricof information proposed by Lennon et al. (2004) isinvariant to cohesiveness, as the binomial variance for agiven range size is the same in both cases.
Lennon et al. (2004) presented a simple example inwhich overall species richness correlated stronger withsubsets of restricted species than with subsets of widespreadones (their Fig. 3). They contrasted this single example totheir empirical results, in which overall richness showedhigher correlations with widespread species than withrestricted taxa. However, they did not perform a statisticalanalysis of how representative was their example. To exploresuch a question, we developed a null model to examine thepatterns of richness correlation among sets of species thatare randomly distributed.
We defined a ‘‘continent’’ as a ten-cell linear domain,and created sets of 10 species with range sizes correspondingto those in the example of Lennon et al. (2004): 1, 2, 3, 4,5, 6, 7, 8, 9, and 9 cells. First we modelled non-cohesiveranges, assigning occurrences by sampling (with no replace-ment) from the pool of ten cells until reaching thecorresponding range size for each species. Then, wecorrelated the overall species richness with the patternsgenerated by each species alone. We then subtracted thecoefficient corresponding to the most restricted species(occurring in one cell) from the coefficient corresponding tothe most widespread species (occurring in nine cells), to seewhich of the correlation coefficients was higher (a positivedifference in coefficients meaning that the correlation isstronger for the widespread species). We repeated theprocedure 20 000 times to sample the universe of 3.2�1017 possible permutations. We repeated the procedure forcohesive ranges; in this case, each simulation sampledrandomly from the pool of possible arrangements corre-sponding to each range size: 10 continuous lines for theone-celled range, 9 for the two-celled range, and so on. Weran 20 000 simulations to sample from the universe of 36.3million possible permutations.
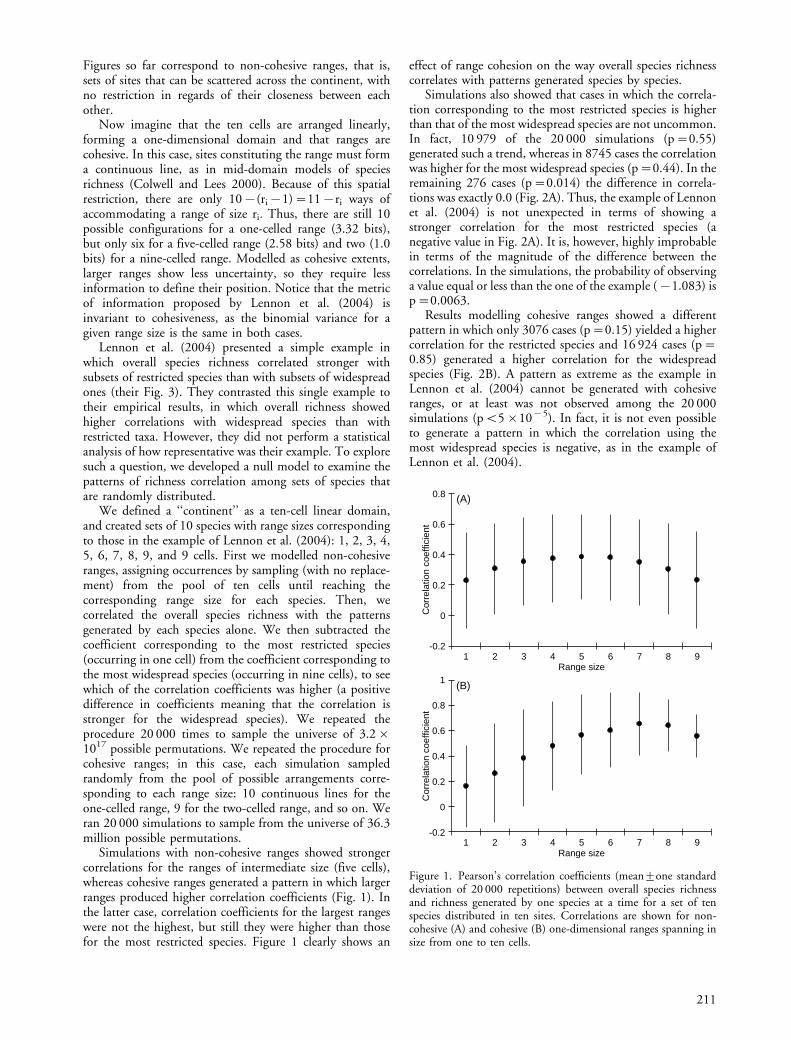
Simulations with non-cohesive ranges showed strongercorrelations for the ranges of intermediate size (five cells),whereas cohesive ranges generated a pattern in which largerranges produced higher correlation coefficients (Fig. 1). Inthe latter case, correlation coefficients for the largest rangeswere not the highest, but still they were higher than thosefor the most restricted species. Figure 1 clearly shows an
effect of range cohesion on the way overall species richnesscorrelates with patterns generated species by species.
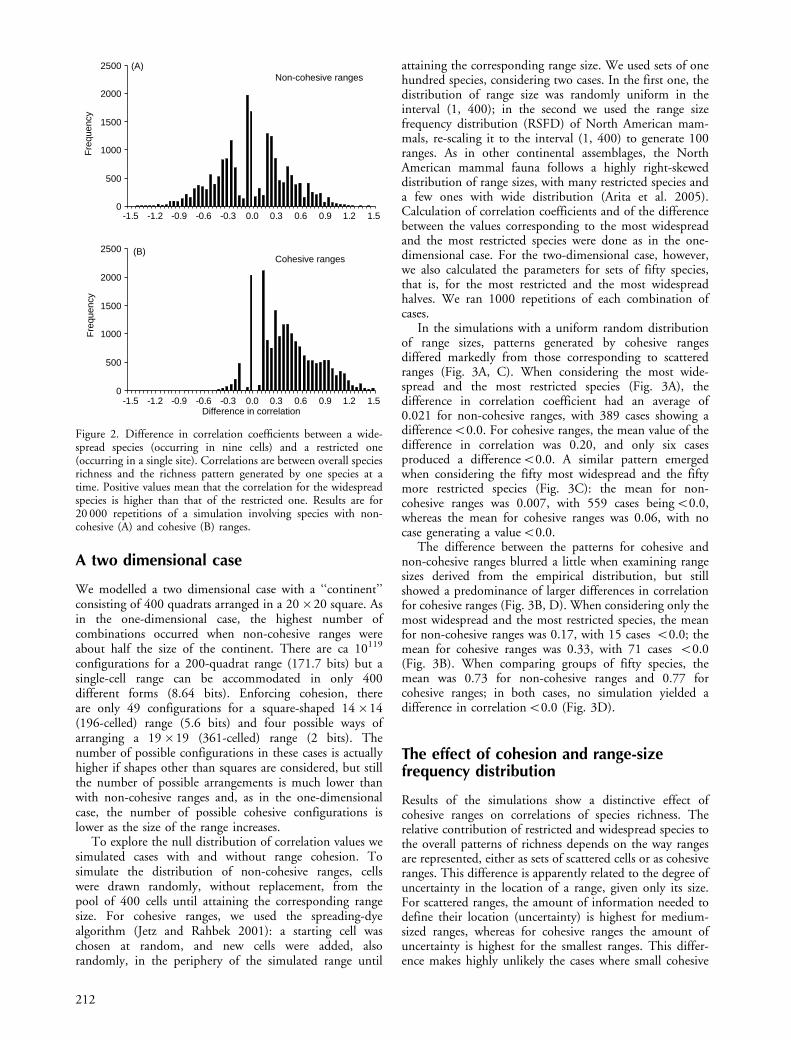
Simulations also showed that cases in which the correla-tion corresponding to the most restricted species is higherthan that of the most widespread species are not uncommon.In fact, 10 979 of the 20 000 simulations (p�0.55)generated such a trend, whereas in 8745 cases the correlationwas higher for the most widespread species (p�0.44). In theremaining 276 cases (p�0.014) the difference in correla-tions was exactly 0.0 (Fig. 2A). Thus, the example of Lennonet al. (2004) is not unexpected in terms of showing astronger correlation for the most restricted species (anegative value in Fig. 2A). It is, however, highly improbablein terms of the magnitude of the difference between thecorrelations. In the simulations, the probability of observinga value equal or less than the one of the example (�1.083) isp�0.0063.
Results modelling cohesive ranges showed a differentpattern in which only 3076 cases (p�0.15) yielded a highercorrelation for the restricted species and 16 924 cases (p�0.85) generated a higher correlation for the widespreadspecies (Fig. 2B). A pattern as extreme as the example inLennon et al. (2004) cannot be generated with cohesiveranges, or at least was not observed among the 20 000simulations (pB5�10�5). In fact, it is not even possibleto generate a pattern in which the correlation using themost widespread species is negative, as in the example ofLennon et al. (2004).
-0.2
0
0.2
0.4
0.6
0.8
1 2 3 4 5 6 7 8 9
-0.2
0
0.2
0.4
0.6
0.8
1
1 2 3 4 5 6 7 8 9
Cor
rela
tion
coef
ficie
ntC
orre
latio
n co
effic
ient
Range size
Range size
(A)
(B)
Figure 1. Pearson’s correlation coefficients (mean9one standarddeviation of 20 000 repetitions) between overall species richnessand richness generated by one species at a time for a set of tenspecies distributed in ten sites. Correlations are shown for non-cohesive (A) and cohesive (B) one-dimensional ranges spanning insize from one to ten cells.
211
A two dimensional case
We modelled a two dimensional case with a ‘‘continent’’consisting of 400 quadrats arranged in a 20�20 square. Asin the one-dimensional case, the highest number ofcombinations occurred when non-cohesive ranges wereabout half the size of the continent. There are ca 10119
configurations for a 200-quadrat range (171.7 bits) but asingle-cell range can be accommodated in only 400different forms (8.64 bits). Enforcing cohesion, thereare only 49 configurations for a square-shaped 14�14(196-celled) range (5.6 bits) and four possible ways ofarranging a 19�19 (361-celled) range (2 bits). Thenumber of possible configurations in these cases is actuallyhigher if shapes other than squares are considered, but stillthe number of possible arrangements is much lower thanwith non-cohesive ranges and, as in the one-dimensionalcase, the number of possible cohesive configurations islower as the size of the range increases.
To explore the null distribution of correlation values wesimulated cases with and without range cohesion. Tosimulate the distribution of non-cohesive ranges, cellswere drawn randomly, without replacement, from thepool of 400 cells until attaining the corresponding rangesize. For cohesive ranges, we used the spreading-dyealgorithm (Jetz and Rahbek 2001): a starting cell waschosen at random, and new cells were added, alsorandomly, in the periphery of the simulated range until
attaining the corresponding range size. We used sets of onehundred species, considering two cases. In the first one, thedistribution of range size was randomly uniform in theinterval (1, 400); in the second we used the range sizefrequency distribution (RSFD) of North American mam-mals, re-scaling it to the interval (1, 400) to generate 100ranges. As in other continental assemblages, the NorthAmerican mammal fauna follows a highly right-skeweddistribution of range sizes, with many restricted species anda few ones with wide distribution (Arita et al. 2005).Calculation of correlation coefficients and of the differencebetween the values corresponding to the most widespreadand the most restricted species were done as in the one-dimensional case. For the two-dimensional case, however,we also calculated the parameters for sets of fifty species,that is, for the most restricted and the most widespreadhalves. We ran 1000 repetitions of each combination ofcases.
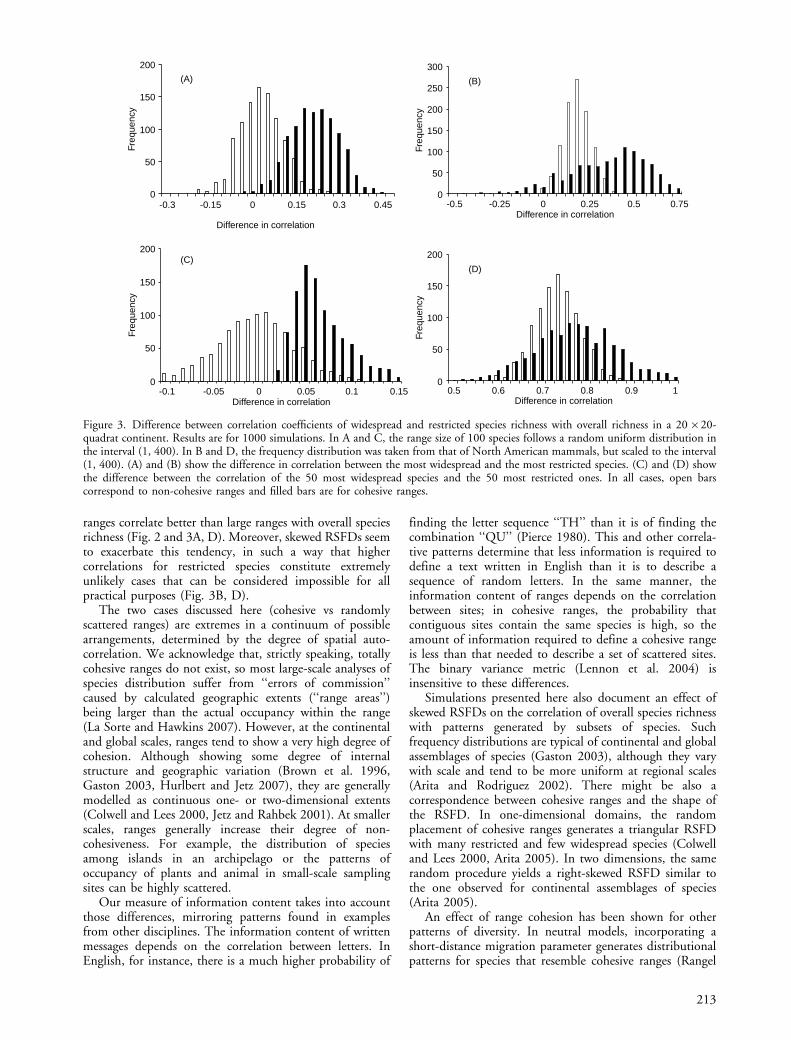
In the simulations with a uniform random distributionof range sizes, patterns generated by cohesive rangesdiffered markedly from those corresponding to scatteredranges (Fig. 3A, C). When considering the most wide-spread and the most restricted species (Fig. 3A), thedifference in correlation coefficient had an average of0.021 for non-cohesive ranges, with 389 cases showing adifferenceB0.0. For cohesive ranges, the mean value of thedifference in correlation was 0.20, and only six casesproduced a differenceB0.0. A similar pattern emergedwhen considering the fifty most widespread and the fiftymore restricted species (Fig. 3C): the mean for non-cohesive ranges was 0.007, with 559 cases beingB0.0,whereas the mean for cohesive ranges was 0.06, with nocase generating a valueB0.0.
The difference between the patterns for cohesive andnon-cohesive ranges blurred a little when examining rangesizes derived from the empirical distribution, but stillshowed a predominance of larger differences in correlationfor cohesive ranges (Fig. 3B, D). When considering only themost widespread and the most restricted species, the meanfor non-cohesive ranges was 0.17, with 15 cases B0.0; themean for cohesive ranges was 0.33, with 71 cases B0.0(Fig. 3B). When comparing groups of fifty species, themean was 0.73 for non-cohesive ranges and 0.77 forcohesive ranges; in both cases, no simulation yielded adifference in correlationB0.0 (Fig. 3D).
The effect of cohesion and range-sizefrequency distribution
Results of the simulations show a distinctive effect ofcohesive ranges on correlations of species richness. Therelative contribution of restricted and widespread species tothe overall patterns of richness depends on the way rangesare represented, either as sets of scattered cells or as cohesiveranges. This difference is apparently related to the degree ofuncertainty in the location of a range, given only its size.For scattered ranges, the amount of information needed todefine their location (uncertainty) is highest for medium-sized ranges, whereas for cohesive ranges the amount ofuncertainty is highest for the smallest ranges. This differ-ence makes highly unlikely the cases where small cohesive
0
500
1000
1500
2000
2500
-1.5 -1.2 -0.9 -0.6 -0.3 0.0 0.3 0.6 0.9 1.2 1.5
0
500
1000
1500
2000
2500
-1.5 -1.2 -0.9 -0.6 -0.3 0.0 0.3 0.6 0.9 1.2 1.5Difference in correlation
Fre
quen
cyF
requ
ency
Non-cohesive ranges
Cohesive ranges
(A)
(B)
Figure 2. Difference in correlation coefficients between a wide-spread species (occurring in nine cells) and a restricted one(occurring in a single site). Correlations are between overall speciesrichness and the richness pattern generated by one species at atime. Positive values mean that the correlation for the widespreadspecies is higher than that of the restricted one. Results are for20 000 repetitions of a simulation involving species with non-cohesive (A) and cohesive (B) ranges.
212
ranges correlate better than large ranges with overall speciesrichness (Fig. 2 and 3A, D). Moreover, skewed RSFDs seemto exacerbate this tendency, in such a way that highercorrelations for restricted species constitute extremelyunlikely cases that can be considered impossible for allpractical purposes (Fig. 3B, D).
The two cases discussed here (cohesive vs randomlyscattered ranges) are extremes in a continuum of possiblearrangements, determined by the degree of spatial auto-correlation. We acknowledge that, strictly speaking, totallycohesive ranges do not exist, so most large-scale analyses ofspecies distribution suffer from ‘‘errors of commission’’caused by calculated geographic extents (‘‘range areas’’)being larger than the actual occupancy within the range(La Sorte and Hawkins 2007). However, at the continentaland global scales, ranges tend to show a very high degree ofcohesion. Although showing some degree of internalstructure and geographic variation (Brown et al. 1996,Gaston 2003, Hurlbert and Jetz 2007), they are generallymodelled as continuous one- or two-dimensional extents(Colwell and Lees 2000, Jetz and Rahbek 2001). At smallerscales, ranges generally increase their degree of non-cohesiveness. For example, the distribution of speciesamong islands in an archipelago or the patterns ofoccupancy of plants and animal in small-scale samplingsites can be highly scattered.
Our measure of information content takes into accountthose differences, mirroring patterns found in examplesfrom other disciplines. The information content of writtenmessages depends on the correlation between letters. InEnglish, for instance, there is a much higher probability of
finding the letter sequence ‘‘TH’’ than it is of finding thecombination ‘‘QU’’ (Pierce 1980). This and other correla-tive patterns determine that less information is required todefine a text written in English than it is to describe asequence of random letters. In the same manner, theinformation content of ranges depends on the correlationbetween sites; in cohesive ranges, the probability thatcontiguous sites contain the same species is high, so theamount of information required to define a cohesive rangeis less than that needed to describe a set of scattered sites.The binary variance metric (Lennon et al. 2004) isinsensitive to these differences.
Simulations presented here also document an effect ofskewed RSFDs on the correlation of overall species richnesswith patterns generated by subsets of species. Suchfrequency distributions are typical of continental and globalassemblages of species (Gaston 2003), although they varywith scale and tend to be more uniform at regional scales(Arita and Rodriguez 2002). There might be also acorrespondence between cohesive ranges and the shape ofthe RSFD. In one-dimensional domains, the randomplacement of cohesive ranges generates a triangular RSFDwith many restricted and few widespread species (Colwelland Lees 2000, Arita 2005). In two dimensions, the samerandom procedure yields a right-skewed RSFD similar tothe one observed for continental assemblages of species(Arita 2005).
An effect of range cohesion has been shown for otherpatterns of diversity. In neutral models, incorporating ashort-distance migration parameter generates distributionalpatterns for species that resemble cohesive ranges (Rangel
0
50
100
150
200
-0.3 -0.15 0 0.15 0.3 0.45
0
50
100
150
200
-0.1 -0.05 0 0.05 0.1 0.15
0
50
100
150
200
250
300
-0.5 -0.25 0 0.25 0.5 0.75
0
50
100
150
200
0.5 0.6 0.7 0.8 0.9 1
Difference in correlationDifference in correlation
Difference in correlation Difference in correlation
Freq
uenc
y
Freq
uenc
y
Freq
uenc
y
Freq
uenc
y
(A) (B)
(C)(D)
Figure 3. Difference between correlation coefficients of widespread and restricted species richness with overall richness in a 20�20-quadrat continent. Results are for 1000 simulations. In A and C, the range size of 100 species follows a random uniform distribution inthe interval (1, 400). In B and D, the frequency distribution was taken from that of North American mammals, but scaled to the interval(1, 400). (A) and (B) show the difference in correlation between the most widespread and the most restricted species. (C) and (D) showthe difference between the correlation of the 50 most widespread species and the 50 most restricted ones. In all cases, open barscorrespond to non-cohesive ranges and filled bars are for cohesive ranges.
213
and Diniz-Filho 2005). Cohesive ranges, in turn, generatespecies richness patterns similar to those predicted by two-dimensional mid-domain effect model, whereas scatteredranges generated by long-distance dispersal produce nodiscernible geographic pattern of species richness (Rangeland Diniz-Filho 2005). The correlation of species richnesspatterns with environmental variables has been shown to behigher for widespread species than for restricted ones, bothin static (Jetz and Rahbek 2002, Mora and Robertson 2005)and dynamic models (Rahbek et al. 2007) of range location.Null models in these studies corroborate the tendency ofwidespread species to show stronger correlations thanrestricted species, suggesting the existence of statisticalconstraints similar to those documented here.
In conclusion, for large-scale sets of species, a highercorrelation between overall species richness and richnessgenerated by widespread species is the null expectation,generated by the cohesion of species ranges and the shape ofthe RSFD. This fact has to be taken into account in the searchfor mechanistic explanations for the patterns recentlyreported in the literature (Vazquez and Gaston 2004, Lennonet al. 2004, Kreft et al. 2006, Pearman and Weber 2007).Similar patterns have been also found for non-cohesivedistributions (Lennon et al. 2004), and reversed patterns havebeen documented for continental sets (Vazquez and Gaston2004), which highlights the relevance of the continuingsearch for the biological mechanisms that determine therelationship between diversity and distributions.
Acknowledgements � We thank J. Navarro, P. Rodrıguez, E.Vazquez-Domınguez, and F. Villalobos for comments on an earlyversion of the manuscript. Valuable comments and suggestions byH. Kreft, J. J. Lennon, and one anonymous reviewer helped toimprove this work. Support for this project was provided by theInst. of Ecology, National Autonomous Univ. of Mexico(UNAM).
References
Arita, H. T. 2005. Range size in mid-domain models of speciesdiversity. � J. Theor. Biol. 232: 119�126.
Arita, H. T. and Rodriguez, P. 2002. Geographic range, turnoverrate and the scaling of species diversity. � Ecography 25:541�550.
Arita, H. T. et al. 2005. Continental and regional ranges of NorthAmerican mammals: Rapoport’s rule in real and null worlds.� J. Biogeogr. 32: 961�971.
Brown, J. H. et al. 1996. The geographic range: size, shape,boundaries, and internal structure. � Annu. Rev. Ecol. Syst.27: 597�623.
Colwell, R. K. and Lees, D. C. 2000. The mid-domain effect:geometric constraints on the geography of species richness.� Trends Ecol. Evol. 15: 70�76.
Evans, K. L. et al. 2005. Relative contribution of abundantand rare species to species-energy relationships. � Biol. Lett. 1:87�90.
Gaston, K. J. 2003. Structure and dynamics of geographic ranges.� Oxford Univ. Press.
Gaston, K. J. 2008. Biodiversity and extinction: the importance ofbeing common. � Prog. Phys. Geogr. 32: 73�79.
Hurlbert, A. H. and Jetz, W. 2007. Species richness, hotspots, andthe scale dependence of range maps in ecology and conserva-tion. � Proc. Nat. Acad. Sci. USA 104: 13384�13389.
Jetz, W. and Rahbek, C. 2001. Geometric constraints explainmuch of the species richness pattern in African birds. � Proc.Nat. Acad. Sci. USA 98: 5661�5666.
Jetz, W. and Rahbek, C. 2002. Geographic range sizeand determinants of avian species richness. � Science 297:1548�1551.
Kreft, H. et al. 2006. The significance of geographic range size forspatial diversity patterns in Neotropical palms. � Ecography29: 21�30.
La Sorte, F. A. and Hawkins, B. A. 2007. Range maps and speciesrichness patterns: errors of commission and estimates ofuncertainty. � Ecography 30: 649�662.
Lennon, J. J. et al. 2004. Contribution of rarity and commonnessto patterns of species richness. � Ecol. Lett. 7: 81�87.
Mora, C. and Robertson, D. R. 2005. Causes of latitudinalgradients in species richness: a test with fishes of the TropicalEastern Pacific. � Ecology 86: 1771�1782.
Pearman, P. B. and Weber, D. 2007. Common species determinerichness patterns in biodiversity indicator taxa. � Biol.Conserv. 138: 109�119.
Pierce, J. R. 1980. An introduction to information theory� Dover.
Rahbek, C. et al. 2007. Predicting continental-scale patterns ofbird species richness with spatially explicit models. � Proc. R.Soc. B 274: 165�174.
Rangel, T. F. L. V. B. and Diniz-Filho, J. A. F. 2005. Neutralcommunity dynamics, the mid-domain effect and spatialpatterns in species richness. � Ecol. Lett. 8: 783�790.
Shannon, C. E. and Weaver, W. 1949. The mathematical theoryof communication. � The Univ. of Illinois Press.
Vazquez, L. B. and Gaston, K. J. 2004. Rarity, commonness, andpatterns of species richness: the mammals of Mexico. � GlobalEcol. Biogeogr. 13: 535�542.
Wilhere, G. F. et al. 2008. Average optimacity: an index to guidesite prioritization for biodiversity conservation. � Biol.Conserv. 141: 770�781.
214