Embed Size (px)
Citation preview
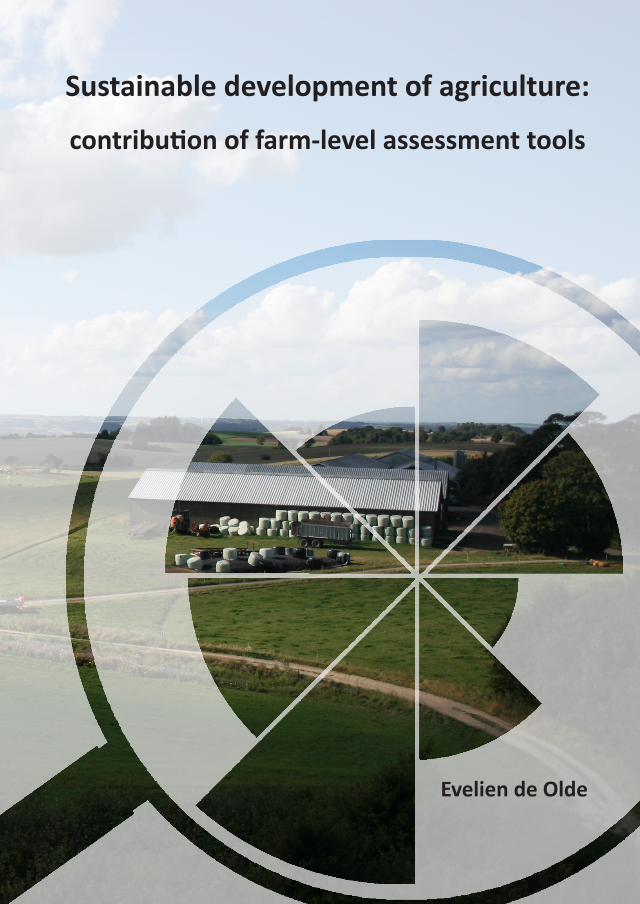
Sustainable development of agriculture:
contribution of farm-level assessment tools
Evelien de Olde
Sustainable development of agriculture: contribution of farm
-level assessment tools
Evelien de O
lde 2017
Propositions
1. Current sustainability assessment tools give a false impression of objectiveness. (this thesis)
2. Instead of an end, sustainability assessment tools are only a start towards sustainability. (this thesis)
3. Precision livestock farming cannot replace farmers’ observations. 4. With the increasing focus on quantity, science risks becoming a
modern version of the ‘Wasserbombe’. 5. Discussing your research with the general public makes you a better
researcher. 6. An art exhibition at a scientific conference stimulates creativity and
reflection.
Propositions belonging to the thesis, entitled‘Sustainable development of agriculture: contribution of farm-level assessment tools.’
Evelien de OldeWageningen, 28 April 2017
Sustainable development of agriculture: contribution of farm-level assessment tools
Evelien de Olde
Thesis committee
PromotorProf. Dr I.J.M. de BoerProfessor of Animal Production SystemsWageningen University & Research
Co-promotorsDr E.A.M. BokkersAssociate professor, Animal Production Systems GroupWageningen University & Research
Dr F.W. OudshoornSenior scientist, Department of EngineeringAarhus University, Denmark
Other members Prof. Dr C. Kroeze, Wageningen University & ResearchProf. Dr P.J.M. Oosterveer, Wageningen University & ResearchProf. T. Dalgaard, Aarhus University, DenmarkDr S. Van Passel, University of Antwerp, Belgium
This research was conducted under the auspices of the Graduate School of Science and Technology, Aarhus University, and the Graduate School of Wageningen Institute of Animal Sciences (WIAS), and as part of a Double Degree PhD programme.
Sustainable development of agriculture: contribution of farm-level assessment tools
Evelien de Olde
Thesissubmitted in fulfilment of the requirements for the degree of doctor
at Wageningen Universityby the authority of the Rector Magnificus,
Prof. Dr A.P.J. Mol,in the presence of the
Thesis Committee appointed by the Academic Boardto be defended in publicon Friday 28 April 2017at 1.30 p.m. in the Aula.
De Olde, EvelienSustainable development of agriculture: contribution of farm-level assessment tools160 pages.
Double Degree PhD thesis, Aarhus University, Aarhus, Denmark, and Wageningen University, Wageningen, the Netherlands (2017)With references, with summaries in English, Dutch and Danish
ISBN 978-94-6343-068-5DOI 10.18174/403334
AbstractCurrent environmental, economic and social challenges urge agriculture to change to more sustainable modes of production. Insight in the impact of a system or a potential innovation on sustainability could support decision makers in identifying actions towards sustainable development. Over the past decade, therefore, a large number of tools have been developed to assess sustainability performance at farm level. Several concerns, however, have been raised whether assessment results provide reliable and valid conclusions about the sustainability performance of farms, and whether these conclusions can be implemented in practice. To evaluate the contribution of farm-level assessment tools to sustainable development of agriculture, this thesis analyzed current approaches to assessing sustainability. One of these approaches is the sustainability assessment tool RISE 2.0, which was used to assess the sustainability performance of 37 organic farms in Denmark. Analysis of the assessment results showed the impact of decisions, made during the development of a tool (e.g. selection of themes, indicators, reference values, scoring and aggregation method), on the assessment results. This emphasizes the importance of transparency in sustainability assessment tools to understand assessment results and identify actions to improve. Subsequently, a comparison of sustainability assessment tools in practice was made to gain insight into practical requirements, procedures and relevance perceived by farmers. Of 48 indicator-based sustainability assessment tools, only four tools (RISE, SAFA, PG and IDEA) complied to the selection criteria and were applied to assess the sustainability performance of five Danish farms. Characteristics including data requirements, assessment time, complexity, transparency and output accuracy varied between tools. Critical factors in farmers’ perception of tool relevance were context specificity, user-friendliness, complexity of the tool, language use, and a match between value judgements of tool developers and farmers. Farmers, moreover, indicated that implementing conclusions derived from sustainability assessments is challenging given the complex organization of agricultural systems. A more in-depth analysis of the four tools revealed a high diversity in selected indicators, themes, reference values, and scoring and aggregation methods. This results in different conclusions on the sustainability performance of farms, which does not only cause confusion but also affects the trust in, and reliability and implementation of, sustainability assessments. Variability in tools is caused by different perspectives on how to assess sustainability and is related to differences in context, priorities and value judgements of tool developers. These differences also play a role in the prioritization of criteria for indicator selection. To explore whether sustainability experts agreed on which criteria are most important in the selection of indicators and indicators sets for sustainability assessments, two ranking surveys were carried out. Both surveys showed a lack of consensus amongst experts about how best to measure agricultural sustainability. This thesis revealed variability in approaches to assess sustainability at farm level. This makes current assessment tools less suitable for functions that require a high reliability and validity, such as certification. Instead, current assessment tools present a useful starting point for discussion, reflection and learning on sustainable development of farming. To enhance the contribution of tools towards sustainable development of agriculture, more attention should be paid to increasing reliability and validity of tools, and improving transparency, harmonization, participation and implementation of assessments.
Abstract in DanishDe aktuelle miljømæssige, økonomiske og sociale udfordringer kalder på, at landbruget skifter til mere bæredygtige former for produktion. Beslutningsprocessen vedrørende bæredygtig udvikling af landbrugssystemer kræver indblik i, hvordan et system eller en potentiel innovation påvirker bæredygtigheden. I de seneste årtier er et stort antal bæredygtighedsanalysemetoder derfor blevet udviklet til at vurdere bæredygtigheden på bedriftsniveau. Der er imidlertid rejst tvivl om bæredygtighedsanalysernes pålidelighed og gyldighed og om, hvorvidt konklusionerne kan gennemføres i praksis. Formålet med denne afhandling har været at evaluere bidraget fra bæredygtighedsanalysemetoder til en bæredygtig udvikling af landbruget. En af disse bæredygtighedsanalysemetoder er RISE 2.0, som blev brugt til at analysere 37 økologiske landbrugsbedrifter i Danmark. En analyse af resultaterne viste, at de er påvirket af de metoderelaterede valg, der træffes under udviklingen af en metode såsom udvælgelse af temaer, indikatorer, referenceværdier og beregningsmetoder. Resultaterne understreger vigtigheden af transparente bæredygtighedsanalysemetoder, så analyseresultaterne er forståelige og der kan identificeres konkrete handlinger mod en bæredygtig udvikling. Denne afhandling sammenligner desuden forskellige bæredygtighedsanalysemetoder for at få indsigt i praktiske krav, procedurer og hvordan landmændene oplever relevansen af metoderne. Kun fire ud af 48 bæredygtighedsanalysemetoder (RISE, SAFA, PG og RISE) levede op til vores udvælgelseskriterier og blev derfor anvendt til at vurdere bæredygtigheden på fem danske landbrugsbedrifter. En sammenligning af de fire metoder viste, at metodernes datakrav, analysetid, kompleksitet, transparens og resultaternes præcision varierede. Kritiske faktorer i landmændenes vurdering af relevansen var kontekst-specificitet, brugervenlighed, kompleksitet, ordvalg og overensstemmelse mellem landmændenes og metodeudviklernes definition af bæredygtighed. Derudover anførte landmændene, at det er en udfordring at implementere konklusionerne af bæredygtighedsanalyserne på grund af landbrugssystemernes kompleksitet. En mere indgående analyse af de fire metoder viste en stor forskellighed i udvalgte (sub)temaer, indikatorer og beregningsmetoder. Dette resulterer ikke kun i forskellige metoder, men begrænser også muligheden for at opnå sammenlignelige konklusioner om bæredygtighed på den samme landbrugsbedrift, hvilket påvirker pålideligheden af metoderne. Denne forskellighed skyldes forskelle i kontekst og værdisæt hos metodeudviklerne. De samme forskelle påvirker også prioritering af kriterier for valg af indikatorer og indikatorsæt. To grupper af bæredygtighedseksperter blev bedt om at prioritere kriterier for udvælgelse af de enkelte indikatorer og indikatorsæt. Resultaterne viste mangel på konsensus blandt eksperterne om, hvordan man bedst analyserer bæredygtighed i landbruget. Resultaterne i denne afhandling viser således en stor forskellighed i metoder til at vurdere bæredygtigheden på bedriftsniveau. Dette gør de nuværende analysemetoder mindre egnede til funktioner, der kræver en høj grad af pålidelighed og gyldighed såsom certificering. I stedet er de nuværende bæredygtighedsanalysemetoder et nyttigt udgangspunkt for diskussion, refleksion og læring om bæredygtig udvikling i landbruget. Hvis konklusionerne fra bæredygtighedsanalyserne fremover skal styrke bidraget til en bæredygtig landbrugsudvikling, bør der lægges mere vægt på at øge pålideligheden og gyldigheden af metoderne samt på at forbedre gennemsigtighed, harmonisering, medbestemmelse og implementering af bæredygtighedsanalyserne.
Table of contents
Chapter 1 General introduction 1 Chapter 2 Assessing the sustainability performance of 11 organic farms in Denmark
Chapter 3 Assessing sustainability at farm level: Lessons 39 learned from a comparison of tools in practice
Chapter 4 The choice of the sustainability assessment tool 65 matters: differences in thematic scope and assessment results
Chapter 5 When experts disagree: the need to rethink indicator 85 selection for assessing sustainability of agriculture
Chapter 6 General discussion 103
References 119 Summary 131
Samenvatting 135
Sammenfatning 139
Acknowledgements 143
About the author 147 Publications 149
Colophon 152


1
Chapter 1
General introduction

2
3
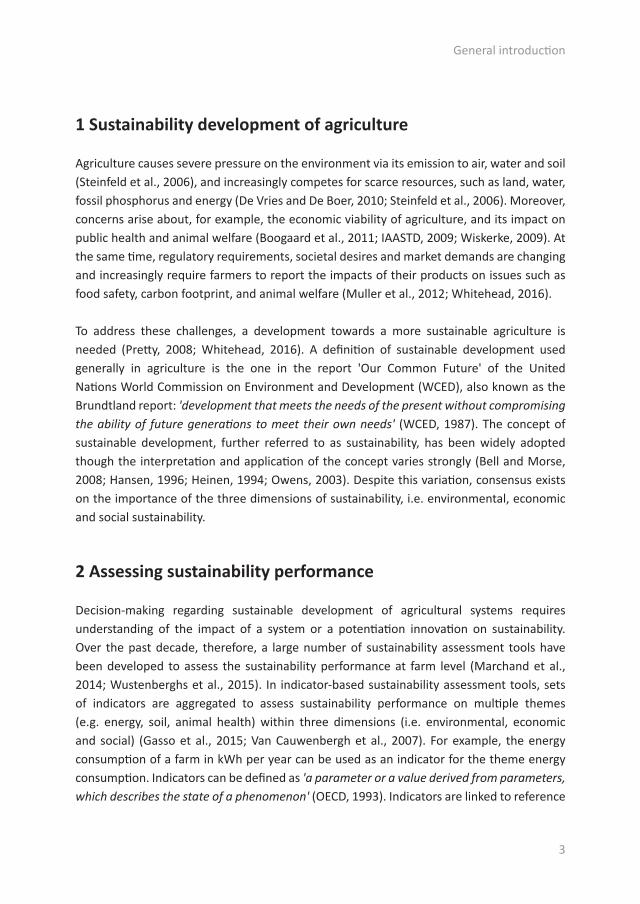
1 Sustainability development of agriculture
Agriculture causes severe pressure on the environment via its emission to air, water and soil (Steinfeld et al., 2006), and increasingly competes for scarce resources, such as land, water, fossil phosphorus and energy (De Vries and De Boer, 2010; Steinfeld et al., 2006). Moreover, concerns arise about, for example, the economic viability of agriculture, and its impact on public health and animal welfare (Boogaard et al., 2011; IAASTD, 2009; Wiskerke, 2009). At the same time, regulatory requirements, societal desires and market demands are changing and increasingly require farmers to report the impacts of their products on issues such as food safety, carbon footprint, and animal welfare (Muller et al., 2012; Whitehead, 2016).
To address these challenges, a development towards a more sustainable agriculture is needed (Pretty, 2008; Whitehead, 2016). A definition of sustainable development used generally in agriculture is the one in the report 'Our Common Future' of the United Nations World Commission on Environment and Development (WCED), also known as the Brundtland report: 'development that meets the needs of the present without compromising the ability of future generations to meet their own needs' (WCED, 1987). The concept of sustainable development, further referred to as sustainability, has been widely adopted though the interpretation and application of the concept varies strongly (Bell and Morse, 2008; Hansen, 1996; Heinen, 1994; Owens, 2003). Despite this variation, consensus exists on the importance of the three dimensions of sustainability, i.e. environmental, economic and social sustainability.
2 Assessing sustainability performance
Decision-making regarding sustainable development of agricultural systems requires understanding of the impact of a system or a potentiation innovation on sustainability. Over the past decade, therefore, a large number of sustainability assessment tools have been developed to assess the sustainability performance at farm level (Marchand et al., 2014; Wustenberghs et al., 2015). In indicator-based sustainability assessment tools, sets of indicators are aggregated to assess sustainability performance on multiple themes (e.g. energy, soil, animal health) within three dimensions (i.e. environmental, economic and social) (Gasso et al., 2015; Van Cauwenbergh et al., 2007). For example, the energy consumption of a farm in kWh per year can be used as an indicator for the theme energy consumption. Indicators can be defined as 'a parameter or a value derived from parameters, which describes the state of a phenomenon' (OECD, 1993). Indicators are linked to reference
General introduction
4
values which can be absolute, based on a scientific or legal norms, or relative, based on a regional averages or comparison between sectors (Van Cauwenbergh et al., 2007).
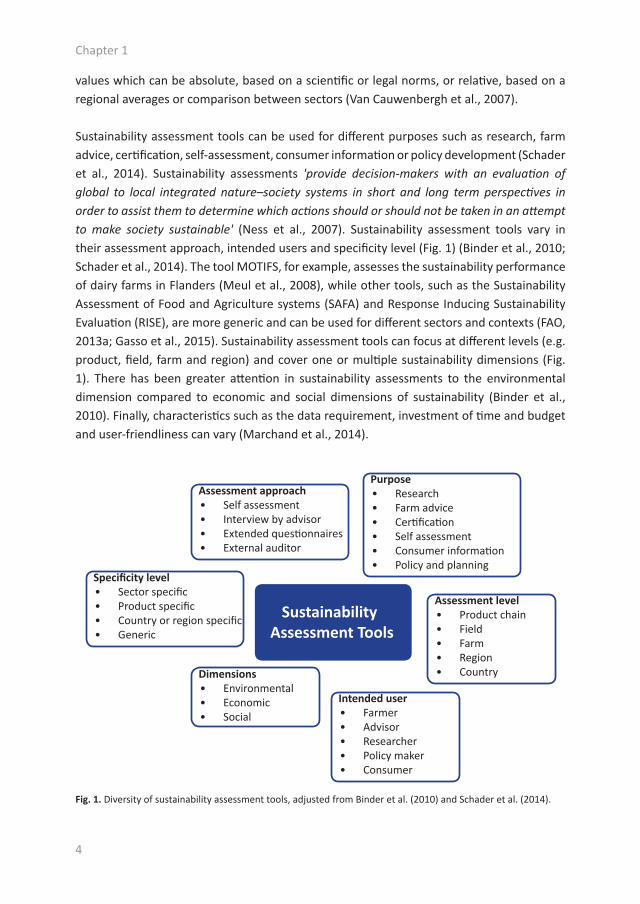
Sustainability assessment tools can be used for different purposes such as research, farm advice, certification, self-assessment, consumer information or policy development (Schader et al., 2014). Sustainability assessments 'provide decision-makers with an evaluation of global to local integrated nature–society systems in short and long term perspectives in order to assist them to determine which actions should or should not be taken in an attempt to make society sustainable' (Ness et al., 2007). Sustainability assessment tools vary in their assessment approach, intended users and specificity level (Fig. 1) (Binder et al., 2010; Schader et al., 2014). The tool MOTIFS, for example, assesses the sustainability performance of dairy farms in Flanders (Meul et al., 2008), while other tools, such as the Sustainability Assessment of Food and Agriculture systems (SAFA) and Response Inducing Sustainability Evaluation (RISE), are more generic and can be used for different sectors and contexts (FAO, 2013a; Gasso et al., 2015). Sustainability assessment tools can focus at different levels (e.g. product, field, farm and region) and cover one or multiple sustainability dimensions (Fig. 1). There has been greater attention in sustainability assessments to the environmental dimension compared to economic and social dimensions of sustainability (Binder et al., 2010). Finally, characteristics such as the data requirement, investment of time and budget and user-friendliness can vary (Marchand et al., 2014).
Fig. 1. Diversity of sustainability assessment tools, adjusted from Binder et al. (2010) and Schader et al. (2014).
Sustainability Assessment Tools
Purpose• Research • Farm advice • Certi fi cati on • Self assessment • Consumer informati on • Policy and planning
Assessment level• Product chain • Field • Farm • Region • Country
Intended user• Farmer • Advisor • Researcher • Policy maker • Consumer
Dimensions• Environmental• Economic• Social
Specifi city level • Sector specifi c• Product specifi c• Country or region specifi c• Generic
Assessment approach• Self assessment• Interview by advisor • Extended questi onnaires • External auditor
Chapter 1
5
3 Challenges in sustainability assessment tools
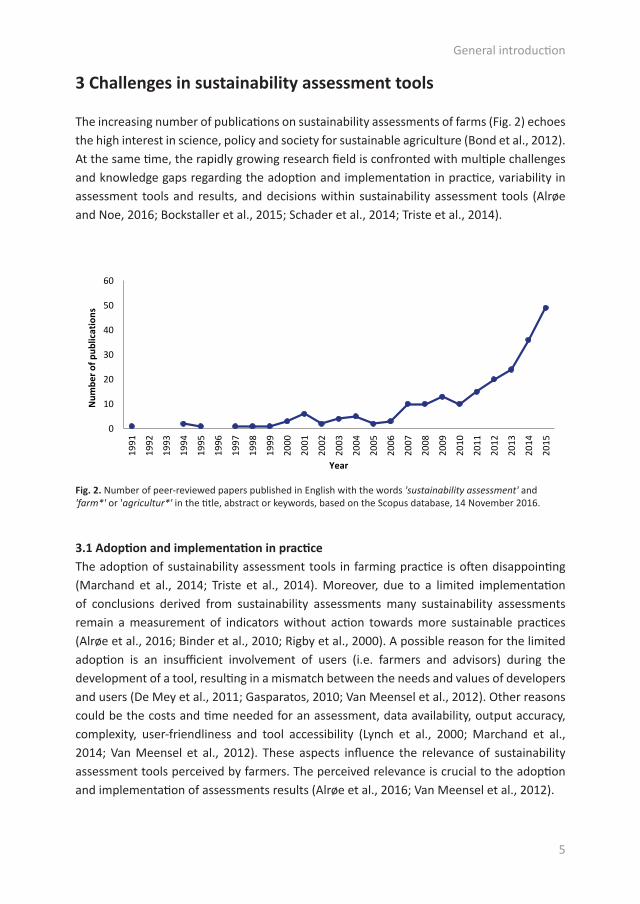
The increasing number of publications on sustainability assessments of farms (Fig. 2) echoes the high interest in science, policy and society for sustainable agriculture (Bond et al., 2012). At the same time, the rapidly growing research field is confronted with multiple challenges and knowledge gaps regarding the adoption and implementation in practice, variability in assessment tools and results, and decisions within sustainability assessment tools (Alrøe and Noe, 2016; Bockstaller et al., 2015; Schader et al., 2014; Triste et al., 2014).
3.1 Adoption and implementation in practiceThe adoption of sustainability assessment tools in farming practice is often disappointing (Marchand et al., 2014; Triste et al., 2014). Moreover, due to a limited implementation of conclusions derived from sustainability assessments many sustainability assessments remain a measurement of indicators without action towards more sustainable practices (Alrøe et al., 2016; Binder et al., 2010; Rigby et al., 2000). A possible reason for the limited adoption is an insufficient involvement of users (i.e. farmers and advisors) during the development of a tool, resulting in a mismatch between the needs and values of developers and users (De Mey et al., 2011; Gasparatos, 2010; Van Meensel et al., 2012). Other reasons could be the costs and time needed for an assessment, data availability, output accuracy, complexity, user-friendliness and tool accessibility (Lynch et al., 2000; Marchand et al., 2014; Van Meensel et al., 2012). These aspects influence the relevance of sustainability assessment tools perceived by farmers. The perceived relevance is crucial to the adoption and implementation of assessments results (Alrøe et al., 2016; Van Meensel et al., 2012).
Fig. 2. Number of peer-reviewed papers published in English with the words 'sustainability assessment' and 'farm*' or 'agricultur*' in the title, abstract or keywords, based on the Scopus database, 14 November 2016.
Scopus search 14-11-16TITLE-ABS-KEY ( "sustainability assessment" AND "farm*" OR "agricultur*" ) AND ( LIMIT-TO ( SRCTYPE , "j" ) ) AND ( LIMIT-TO ( LANGUAGE , "English" ) ) 1991 1 1
199219931994 2 21995 1 119961997 1 11998 1 11999 2 12000 3 32001 7 62002 3 22003 6 42004 5 52005 5 22006 4 32007 13 102008 13 102009 17 132010 13 102011 19 152012 25 202013 28 242014 45 362015 57 49
0
10
20
30
40
50
60
1991
1992
1993
1994
1995
1996
1997
1998
1999
2000
2001
2002
2003
2004
2005
2006
2007
2008
2009
2010
2011
2012
2013
2014
2015
Num
ber o
f pub
licat
ions
Year
General introduction
6
Insight is needed in the relevance of tools as perceived by its end-user (i.e. farmer and advisor) (Bockstaller and Girardin, 2003; Prost et al., 2012). Comparative studies on sustainability assessment tools are limited and primarily compare tools on a theoretical basis. A study on how sustainability assessment tools work in practice (i.e. assessment procedures and practical requirements) can shed light on aspects important for the adoption of tools in farming practice. Moreover, a comprehensive overview of available sustainability assessment tools and their characteristics is lacking. Such an overview will give insight in the characteristics of the available tools (e.g. sector, context, purpose) and can support users in selecting a relevant sustainability assessment tool.
3.2 Variability in assessment tools and resultsThe large number of tools presents a wide diversity of approaches to assess sustainability and includes diverse sets of sustainability indicators and themes. This plurality adds to the existing concerns regarding the scientific validity (i.e. the extent to which the indicators provide relevant information about the performance of a system) and the ability of tools to present similar conclusions on the sustainability performance of a farm (Bockstaller et al., 2009; Schader et al., 2014). In other words, different sustainability assessment tools might present contradictory results (Schader et al., 2014). This would not only cause confusion and false expectations but also affects the trust in, and implementation of, sustainability assessment results (Schader et al., 2014).
Whereas several studies compared and evaluated the scientific validity of indicators related to specific themes or dimensions (e.g. animal welfare, pesticides and environment) (Bockstaller et al., 2009; De Vries et al., 2013a; Galan et al., 2007; Thomassen and De Boer, 2005) little attention has been paid to the comparability of integrated farm-level sustainability assessment tools. To address the above-mentioned concerns, an analysis of the comparability of sustainability assessment tools is needed and should evaluate whether tools assess a similar content (i.e. indicators and themes) and provide similar conclusions on the performance of a farm (i.e. assessment results).
3.3 Decisions in sustainability assessment toolsTool developers make decisions regarding the purpose of the tool, its intended users, stakeholder involvement as well as the selection of themes, indicators and reference values. Their decisions are based on what they, and other stakeholders involved in the process, consider as important to include when assessing sustainability. Their decisions therefore are affecting the final results considerably. Moreover, to assess the performance of a farm on a specific theme, different indicators can be used. Criteria such as scientific relevance, precision, ease of measurement, and affordability, are generally used to select sustainability indicators (Niemeijer and De Groot, 2008; Reed et al., 2006). These criteria, however, involve trade-offs; a precise indicator might involve complex measurement or high costs.
Chapter 1
7
Assessment tools lack transparency in how selection criteria are prioritized and trade-offs are considered (Dale and Beyeler, 2001).
Similar to indicators, sustainability assessment tools '… arise from values (we measure what we care about), and they create values (we care about what we measure)' (Meadows, 1998). A sustainability assessment tool as a collection of value judgements and assumptions on what is sustainable and how it should be measured, frames the sustainability performance of a farm (Gasparatos, 2010; Gasparatos and Scolobig, 2012). The results of sustainability assessments inherently present one of many possible perspectives on the sustainability performance of a farm. If the values and assumptions embedded in the tool are not shared by the users of the tool, the assessment results can be perceived as distorted and might not be accepted by the users (Gasparatos, 2010).
The influence of decisions made in the development of sustainability assessments is widely acknowledged and has led to a call for transparency in sustainability assessment tools. Little is known, however, on how these decisions and value judgements influence the tool and assessment results in practice and how they can be exposed to develop more transparent tools. To increase the transparency in sustainability assessment tools, robust well-defined procedures for the selection of sustainability indicators are needed (Bockstaller et al., 2009; Dale and Beyeler, 2001; Lebacq et al., 2013).
4 Objective and outline of the thesis
A transition towards a more sustainable agriculture is needed and requires reliable sustainability assessment tools to measure the sustainability performance of farms and support decision makers (i.e. farmers, advisors) in identifying pathways for improvement. The main objective of this thesis is to evaluate the contribution of farm-level assessment tools to sustainable development of agriculture.
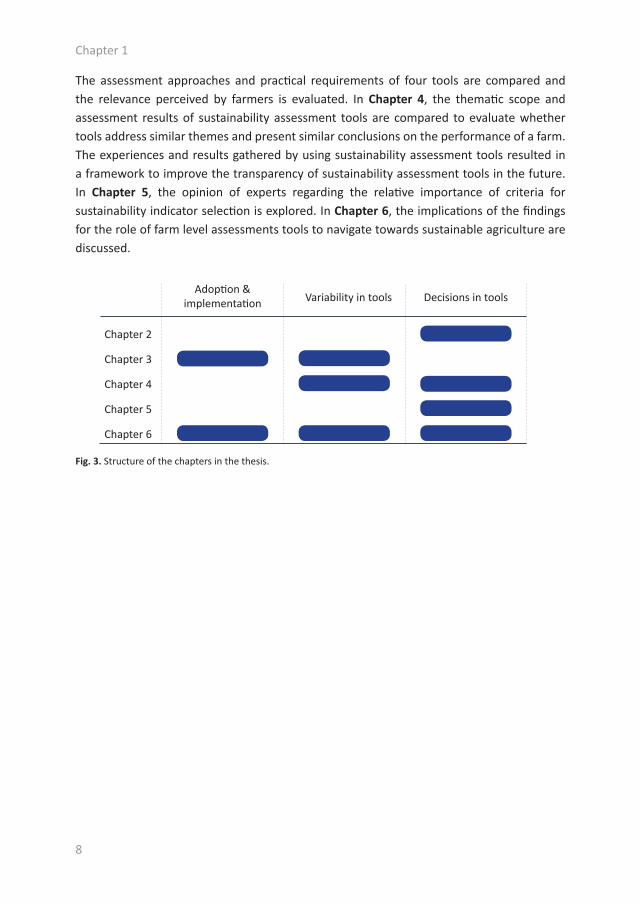
To use sustainability assessment tools in practice and compare their characteristics and results, the tools were applied on conventional and organic farms in Denmark. Even though the assessment results would be different in another context, the characteristics of the tools, which is the focus of this thesis, would remain the same. The structure of the chapters included in the thesis is shown in Fig. 3. In Chapter 2, the sustainability assessment tool RISE 2.0 is described based on assessments conducted at organic farms in Denmark. The study discusses the impact of decisions made in the development of the tool on the assessment results. In Chapter 3, scientific literature is reviewed to develop an overview of indicator-based sustainability assessment tools.
General introduction
8
The assessment approaches and practical requirements of four tools are compared and the relevance perceived by farmers is evaluated. In Chapter 4, the thematic scope and assessment results of sustainability assessment tools are compared to evaluate whether tools address similar themes and present similar conclusions on the performance of a farm. The experiences and results gathered by using sustainability assessment tools resulted in a framework to improve the transparency of sustainability assessment tools in the future. In Chapter 5, the opinion of experts regarding the relative importance of criteria for sustainability indicator selection is explored. In Chapter 6, the implications of the findings for the role of farm level assessments tools to navigate towards sustainable agriculture are discussed.
Fig. 3. Structure of the chapters in the thesis.
Chapter 2
Adopti on &implementati on Variability in tools Decisions in tools
Chapter 3
Chapter 4
Chapter 5
Chapter 6
Chapter 1

9

10
11
Chapter 2
Assessing the sustainability performance of organic farms in DenmarkE.M. de Olde a,b, F.W. Oudshoorn a,c, E.A.M. Bokkers b, A. Stubsgaard c, C.A.G. Sørensen a, and I.J.M. de Boer b
a Department of Engineering, Aarhus University, Aarhus, Denmarkb Animal Production Systems Group, Wageningen University, Wageningen, the Netherlands c SEGES, Aarhus, Denmark
Published in Sustainability 8 (9) (2016), 957DOI:10.3390/su8090957
12
Abstract
The growth of organic agriculture in Denmark raises the interest of both producers and consumers in the sustainability performance of organic production. The aim of this study was to examine the sustainability performance of farms in four agricultural sectors (vegetable, dairy, pig and poultry) using the sustainability assessment tool RISE 2.0. Thirty seven organic farms were assessed on 10 themes, including 51 subthemes. For one theme (water use) and 17 subthemes, a difference between sectors was found. Using the thresholds of RISE, the vegetable, dairy and pig sector performed positively for seven themes and the poultry sector for eight themes. The performance on the nutrient flows and energy and climate themes, however, was critical for all sectors. Moreover, the performance on the economic viability theme was critical for vegetable, dairy and pig farms. The development of a tool, including decisions, such as the selection of themes and indicators, reference values, weights and aggregation methods, influences the assessment results. This emphasizes the need for transparency and reflection on decisions made in sustainability assessment tools. The results of RISE present a starting point to discuss sustainability at the farm-level and contribute to an increase in awareness and learning about sustainability.
Chapter 2
13
1 Introduction
A large number of sustainability assessment tools have been developed to gain insight into the sustainability performance of farms (De Olde et al., 2016f; FAO, 2013a). These tools generally integrate a wide range of themes and indicators to develop a holistic view on farm-level sustainability and are used for different purposes, such as monitoring, certification, consumer information, farm advice and research (Schader et al., 2014). Applying sustainability assessment tools can help to identify challenges, related to environmental, economic and social impact, in the development of sustainable food production systems in conventional and organic agriculture (Pope et al., 2004; Schader et al., 2016; Waas et al., 2014). On-farm assessment tools, however, show a large diversity in, for example, data, time and budget requirements, measurement and aggregation methods, output accuracy and complexity (De Olde et al., 2016f; Marchand et al., 2014). These differences should become more explicit when choosing a tool (Coteur et al., 2016; Marchand et al., 2014). Moreover, after a sustainability assessment, additional efforts are needed to discuss the assessment outcomes with farmers and other stakeholders and translate them into meaningful decisions for change (De Olde et al., 2016f; Häni et al., 2006).
Studies on organic agriculture provide divergent views on its sustainability and potential to contribute to global food security (Badgley et al., 2007; IAASTD, 2009; Seufert et al., 2012; Sundrum, 2001). Especially yield differences between conventional and organic agriculture are a topic of discussion (Badgley et al., 2007; Connor, 2008; De Ponti et al., 2012; Reganold and Wachter, 2016). Differences in yields are highly dependent on system and site characteristics (e.g., available nutrients and technology) (De Ponti et al., 2012; Seufert et al., 2012). Yields in organic farming are generally lower compared to conventional yields. Lower yields, on the one hand, are associated with a higher land use and, for example, higher global warming potential per kg live weight of pigs (Dourmad et al., 2014). On the other hand, the restricted use of pesticides and mineral fertilizers in organic agriculture can have a positive effect on biodiversity and enhance ecosystem services services (Bengtsson et al., 2005; Merfield et al., 2015). From an economic and social perspective, organic agriculture is often associated with the use of local resources (i.e., local seed varieties, manure), benefits for animal welfare and opportunities to increase farmers’ income and livelihood (Castellini et al., 2006; IAASTD, 2009; MacRae et al., 2007; Sundrum, 2001).
Organic agriculture in the European Union has increased over the past decades and currently accounts for about 5.7% of the agricultural area (Willer and Lernoud, 2016). The consumption of organic products is increasing as well, and is worldwide the highest per capita in Switzerland, Luxembourg and Denmark (Willer and Lernoud, 2016). Market shares
Assessing the sustainability performance of organic farms in Denmark
14
of organic retail sales are highest in Denmark (7.6%), Switzerland (7.1%) and Austria (6.5%) (Willer and Lernoud, 2016). Denmark, therefore, can be considered a pioneer in organic food production, with an expected ongoing growth in organic food consumption (Wier et al., 2008). At the same time, producers and consumers are increasingly interested in getting insight in, and the development of, the sustainability performance of organic production (IFOAM, 2015; Ministeriet for Fødevarer, 2015).
The sustainability assessment tool RISE (Response-Inducing Sustainability Evaluation) (Häni et al., 2003) is used in Denmark to assess the sustainability performance of organic farms and to guide farmers in producing more sustainably (LF, 2015; Ministeriet for Fødevarer, 2015; Terkelsen, 2016). This tool was selected based on the European project STOAS (Sustainability Training for Organic Advisors), in which experiences with different sustainability assessment tools were gathered (ORC, 2014b). The objectives of the present study were to analyze the sustainability performance of organic farms in Denmark using the RISE 2.0 tool and to analyze differences in the performance among a diversity of agricultural sectors (i.e., vegetable, dairy, pigs and poultry production). First, we describe the RISE tool and elaborate on the methods for data collection and assessment. Second, we present the RISE assessment results of Danish organic farms and discuss differences between sectors. Third, we reflect on the approaches in RISE to assess sustainability performance and discuss the implications of our findings for organic agriculture in Denmark and, more generally, for assessing sustainability at the farm level.
2 Materials and Methods
2.1 RISE 2.0RISE is an indicator-based sustainability assessment tool developed at the Bern University of Applied Sciences (School of Agricultural, Forest and Food Sciences, HAFL) (Grenz, 2016c). The aim of the tool developers is to provide a holistic evaluation of sustainability at the farm level and support the dissemination of sustainable practices (Grenz, 2016c). Since its start in 1999, RISE has been applied in over 2500 farms in 56 countries (Grenz, 2016a). Experiences with RISE 1.0 have been extensively described in the literature (Grenz et al., 2009; Häni et al., 2003; Häni et al., 2006; Thalmann and Grenz, 2013; Urutyan and Thalmann, 2011). Studies describing the application of the updated Version 2.0, launched in 2011, however, are limited (De Olde et al., 2016f).
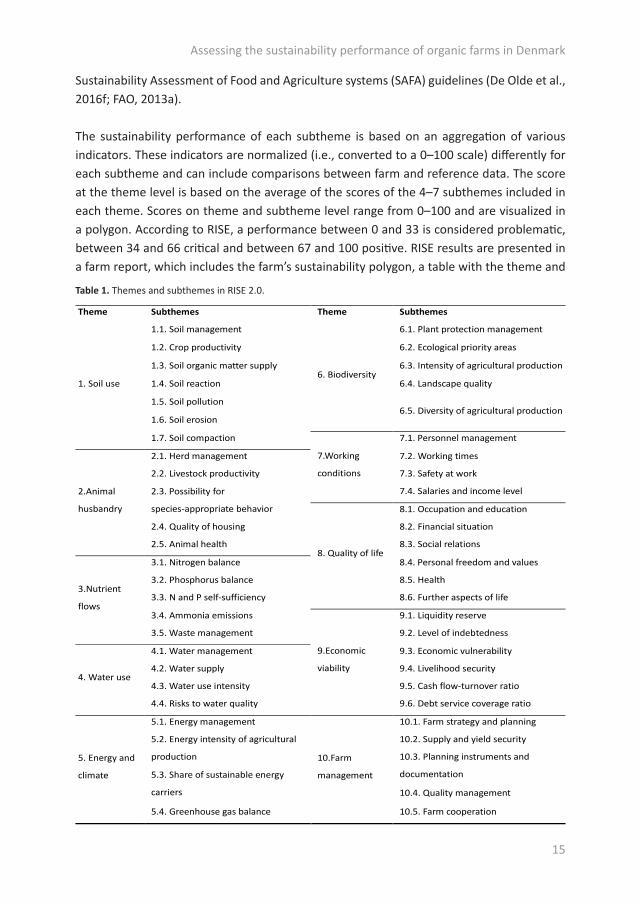
RISE 2.0 assesses the sustainability performance of a farm for 10 themes and 51 subthemes (Table 1). Although RISE defines the subthemes as indicators, we prefer to call them subthemes as they include the evaluation of various indicators and align the terminology with other sustainability assessment tools and publications, such as, for example, the
Chapter 2
15
Sustainability Assessment of Food and Agriculture systems (SAFA) guidelines (De Olde et al., 2016f; FAO, 2013a).
The sustainability performance of each subtheme is based on an aggregation of various indicators. These indicators are normalized (i.e., converted to a 0–100 scale) differently for each subtheme and can include comparisons between farm and reference data. The score at the theme level is based on the average of the scores of the 4–7 subthemes included in each theme. Scores on theme and subtheme level range from 0–100 and are visualized in a polygon. According to RISE, a performance between 0 and 33 is considered problematic, between 34 and 66 critical and between 67 and 100 positive. RISE results are presented in a farm report, which includes the farm’s sustainability polygon, a table with the theme and
Theme Subthemes Theme Subthemes
1. Soil use
1.1. Soil management
6. Biodiversity
6.1. Plant protection management
1.2. Crop productivity 6.2. Ecological priority areas
1.3. Soil organic matter supply 6.3. Intensity of agricultural production
1.4. Soil reaction 6.4. Landscape quality
1.5. Soil pollution 6.5. Diversity of agricultural production
1.6. Soil erosion
1.7. Soil compaction
7.Working
conditions
7.1. Personnel management
2.Animal
husbandry
2.1. Herd management 7.2. Working times
2.2. Livestock productivity 7.3. Safety at work
2.3. Possibility for
species-appropriate behavior
7.4. Salaries and income level
8. Quality of life
8.1. Occupation and education
2.4. Quality of housing 8.2. Financial situation
2.5. Animal health 8.3. Social relations
3.Nutrient
flows
3.1. Nitrogen balance 8.4. Personal freedom and values
3.2. Phosphorus balance 8.5. Health
3.3. N and P self-sufficiency 8.6. Further aspects of life
3.4. Ammonia emissions
9.Economic
viability
9.1. Liquidity reserve
3.5. Waste management 9.2. Level of indebtedness
4. Water use
4.1. Water management 9.3. Economic vulnerability
4.2. Water supply 9.4. Livelihood security
4.3. Water use intensity 9.5. Cash flow-turnover ratio
4.4. Risks to water quality 9.6. Debt service coverage ratio
5. Energy and
climate
5.1. Energy management
10.Farm
management
10.1. Farm strategy and planning
5.2. Energy intensity of agricultural
production
10.2. Supply and yield security
10.3. Planning instruments and
documentation 5.3. Share of sustainable energy
carriers 10.4. Quality management
5.4. Greenhouse gas balance 10.5. Farm cooperation
Table 1. Themes and subthemes in RISE 2.0.
Assessing the sustainability performance of organic farms in Denmark

16
subtheme scores and an explanation of the calculation and scores. Based on this report, a farmer and auditor define the measures for improvement. The RISE software is available on a license and requires training.
To compute the sustainability performance of a farm, four types of data are used: points allocated to farm practices, quantitative farm data, regional data and master data (global reference data). Information on farm practices and quantitative farm data are gathered through a questionnaire-based interview with the farmer and farm workers, conducted by a trained auditor. For the themes working conditions and quality of life, the farmer decides whether the employees may be interviewed, and if so, who. A certain amount of points (positive or negative) are given based on the answers of the farmer, farm worker and/or auditor to questions on farm management, activities and the on-farm situation (e.g., animal welfare conditions). This way, qualitative information is translated into a quantitative score (see Box 1). The majority of subthemes (40) integrate this type of data to compute the performance of the farm on the subtheme. Of these subthemes, 19 subthemes are exclusively based on points allocated to certain measures, activities or situations on-farm. These subthemes are related to quality of life (6), farm management (5), animal husbandry (3), soil use (2), water use (1), nutrient flows (1) and working conditions (1). For the remaining 21 subthemes, this type of data is combined with one or more of the other data types.
Box 1. Example points-based subtheme: farm strategy and planning (10.1).
Box 2. Example of a subtheme combining points, quantitative farm data, regional data and regional reference values: livestock productivity (2.2).
The score on this subtheme is based on the average score on four questions:1. Is there a clear long-term farm development strategy?2. Are there any short to medium-term measures for improvement on economy, social or ecology?
(answered seperately for each dimension) Each question can be anwered with yes (100 points), partly (50 points) or no (0 points).
The subtheme is calculated in four steps:1. The livestock units, per animal category (i) and in total (t), are calculated and corrected for temporarily
absent or present animals. The livestock units are derived from regional data (livestock unit factors).2. The productivity of each animal category (e.g., annual milk yield, growth rate, egg production)
is compared to regional reference values. The score on the productivity for each animal category is calculated using this formula: productivity/regional productivity x 100 − 33.
3. For each animal category, the farmer is asked to give an estimation of the product quality (q1) and of the development of the performance and quality over the last 5 years (q2). For both questions, the farmer can select the answer from five options: significantly above average/improvement (20 points), slightly above average/improvement (10 points), average/stagnation (0 points), slightly below average/decline (−10 points), significantly below average/decline (−20 points).
4. The results of Steps 2 and 3 are added and corrected for the share of the animal category in the total livestock units on the farm: sum ((result step 2i + q1i + q2i) x (LUi/LUt)).
Chapter 2
17
Quantitative farm data (e.g., energy consumption, crop yields and income) are used in 28 subthemes, especially in combination with other types of data (23 subthemes) (see Box 2). In five subthemes, quantitative farm data are used exclusively and compared to regional reference values. These subthemes are related to economic viability (4) and biodiversity (1).
Regional data are specific to the respective region, but are not assessed or available at the farm level e.g., nitrogen losses from farm and storage facilities, livestock unit factors and water demand of crops. The regional data can be from a country, in this study Denmark, or from a smaller region. Master data are provided by RISE and cover, for example, the composition of feedstuffs, the toxicity and persistency of pesticides, the energy consumption of machine work, energy density (i.e., energy contained in MJ), the emissions of energy carriers (e.g., coal, wood, natural gas, petroleum) the and nutrient contents of organic fertilizers. Regional and master data are integrated in the calculations of 11 and 14 subthemes, respectively, always in combination with points and/or quantitative farm data. Five subthemes integrate all four data types.
Next to farm, regional and master data, regional reference values are used in 11 subthemes to compare the performance of the farm to the regional average or target (e.g., crop yields, livestock production, share of ecological priority areas, working hours and days per week). In the RISE software, a standard set of crops (i.e., yields, water content and cultivation period) and livestock (i.e., productivity and livestock units) is given that can be adjusted to the region and extended. What should be considered as 0 and 100 points is defined by the tool, except for six subthemes in which a regional reference value is used. In each subtheme, different calculations are used to aggregate data and compute a score. Decisions regarding these calculations, for example on indicators, units (i.e., hectares, MJ), weights and the use of an average or minimum score of the indicators, influence the result on the subtheme. These calculations are mostly fixed within RISE, except for quality of life-related subthemes, in which the interviewee determines the weight of each indicator within the subtheme and can include an additional subtheme.
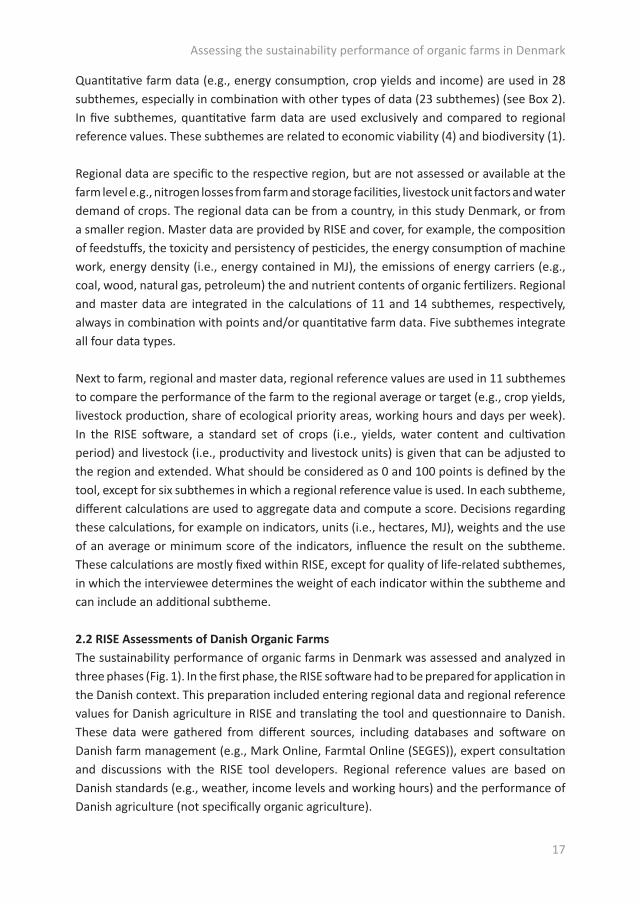
2.2 RISE Assessments of Danish Organic FarmsThe sustainability performance of organic farms in Denmark was assessed and analyzed in three phases (Fig. 1). In the first phase, the RISE software had to be prepared for application in the Danish context. This preparation included entering regional data and regional reference values for Danish agriculture in RISE and translating the tool and questionnaire to Danish. These data were gathered from different sources, including databases and software on Danish farm management (e.g., Mark Online, Farmtal Online (SEGES)), expert consultation and discussions with the RISE tool developers. Regional reference values are based on Danish standards (e.g., weather, income levels and working hours) and the performance of Danish agriculture (not specifically organic agriculture).
Assessing the sustainability performance of organic farms in Denmark
18
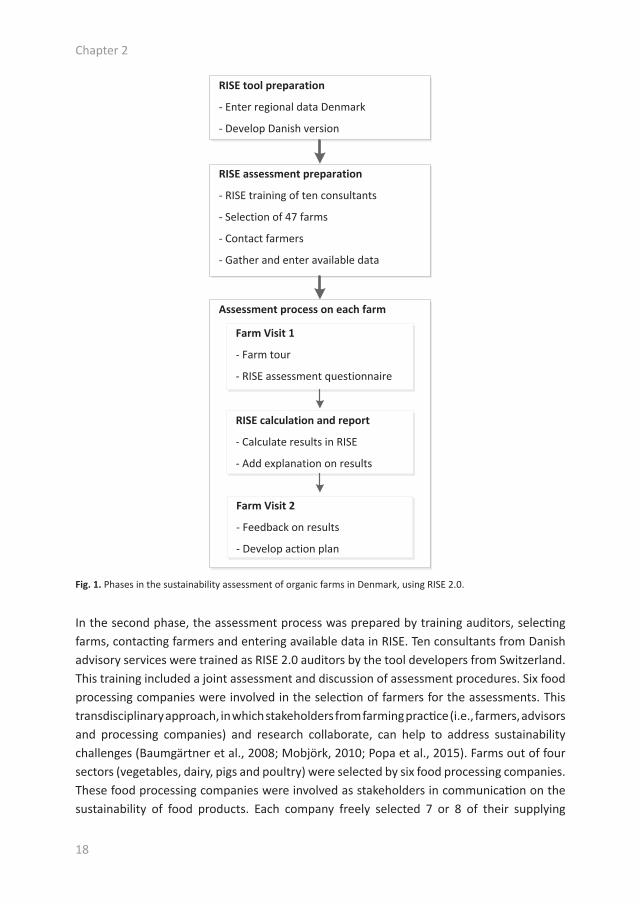
In the second phase, the assessment process was prepared by training auditors, selecting farms, contacting farmers and entering available data in RISE. Ten consultants from Danish advisory services were trained as RISE 2.0 auditors by the tool developers from Switzerland. This training included a joint assessment and discussion of assessment procedures. Six food processing companies were involved in the selection of farmers for the assessments. This transdisciplinary approach, in which stakeholders from farming practice (i.e., farmers, advisors and processing companies) and research collaborate, can help to address sustainability challenges (Baumgärtner et al., 2008; Mobjörk, 2010; Popa et al., 2015). Farms out of four sectors (vegetables, dairy, pigs and poultry) were selected by six food processing companies. These food processing companies were involved as stakeholders in communication on the sustainability of food products. Each company freely selected 7 or 8 of their supplying
Fig. 1. Phases in the sustainability assessment of organic farms in Denmark, using RISE 2.0.
Assessment process on each farm
RISE tool preparation
- Enter regional data Denmark
- Develop Danish version
RISE assessment preparation
- RISE training of ten consultants
- Selection of 47 farms
- Contact farmers
- Gather and enter available data
Farm Visit 1
- Farm tour
- RISE assessment questionnaire
RISE calculation and report
- Calculate results in RISE
- Add explanation on results
Farm Visit 2
- Feedback on results
- Develop action plan
Chapter 2
19
farmers to participate voluntarily in the sustainability assessment. Although this selection of farms is not a representative sample of the Danish organic farmers, an analysis of the results might give insight into generic sustainability challenges in Danish organic farming and differences in the sustainability performance of four agricultural sectors.
Before the actual assessment, each farmer was contacted and asked to provide available data (i.e., farm accounts, crop rotation plan, fertilization plan). These data were entered in RISE beforehand to reduce on-farm assessment time.
Finally, assessments of organic farms were carried out and involved two farm visits, calculation and reporting. Each farm assessment started with a short farm tour. After this introduction, the questionnaire-based interview with the farmer was carried out by one or two auditors. In case a farmer did not have all data needed available at the moment of assessment, these data were emailed later to the auditor and entered in the RISE software. When all data needed for the assessment were gathered, the outcomes were calculated in RISE, and a report was made. This report included an explanation given by the auditor(s) on the outcomes and was discussed with the farmer during a second farm visit. Based on the outcomes of the tool and priorities of the farmer, a brief action plan for improvement was made.
2.3 Analysis of RISE Assessment ResultsIn total, 47 farms were assessed in the period 2013–2014. Six assessments had to be excluded from the data analysis due to insufficient data and errors in data storage. To compare the sectors, a farm was considered specialized in a particular sector if more than 50% of the total output and coupled subsidies resulted from that sector. Although the food processing companies selected supplying farmers, this branch was not in all cases the most important output of the farm. Four farms that were initially selected as poultry farms appeared specialized in other sectors and therefore were excluded from the analysis.
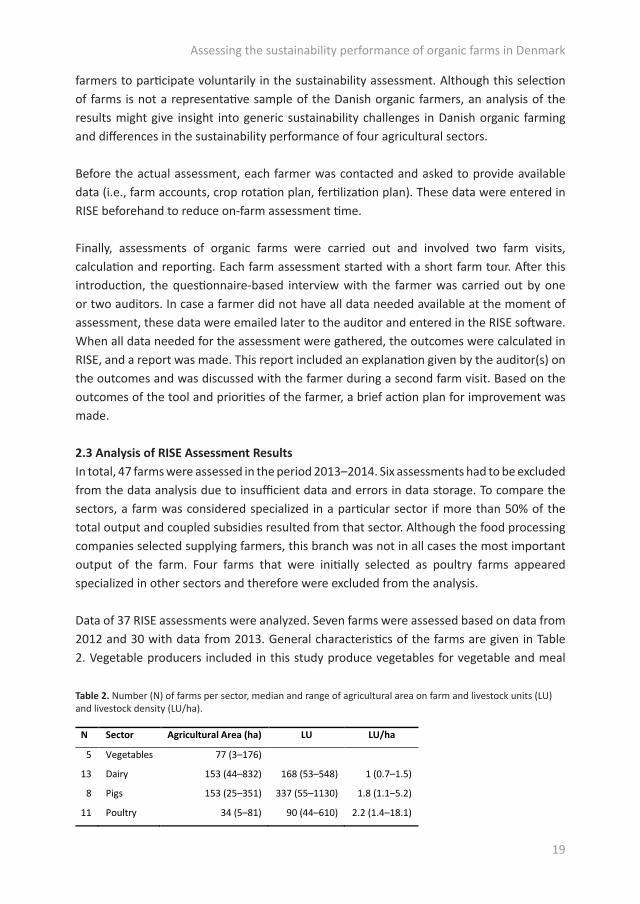
Data of 37 RISE assessments were analyzed. Seven farms were assessed based on data from 2012 and 30 with data from 2013. General characteristics of the farms are given in Table 2. Vegetable producers included in this study produce vegetables for vegetable and meal
Table 2. Number (N) of farms per sector, median and range of agricultural area on farm and livestock units (LU) and livestock density (LU/ha).
N Sector Agricultural Area (ha) LU LU/ha
5 Vegetables 77 (3–176)
13 Dairy 153 (44–832) 168 (53–548) 1 (0.7–1.5)
8 Pigs 153 (25–351) 337 (55–1130) 1.8 (1.1–5.2)
11 Poultry 34 (5–81) 90 (44–610) 2.2 (1.4–18.1)
Assessing the sustainability performance of organic farms in Denmark
20
boxes. To compare farms with different species and ages of animals, livestock units (LU) are used as a reference unit. A dairy cow, for example, represents 1 LU; a heifer between 1 and 2 years old is 0.4 LU; while a fattening pig is 0.17 LU; and a laying hen is 0.01 LU (ADEME, 2010).
Assessment outcomes of the individual farms were analyzed in SPSS 22 to identify significant differences (p < 0.05) using nonparametric tests. Differences between sectors for themes and subthemes were analyzed using the Kruskal–Wallis test. In case of significant differences, additional analysis was carried out using the Mann–Whitney U test for pairwise comparisons (Baarda et al., 2004; Ott and Longnecker, 2015).
3 Results
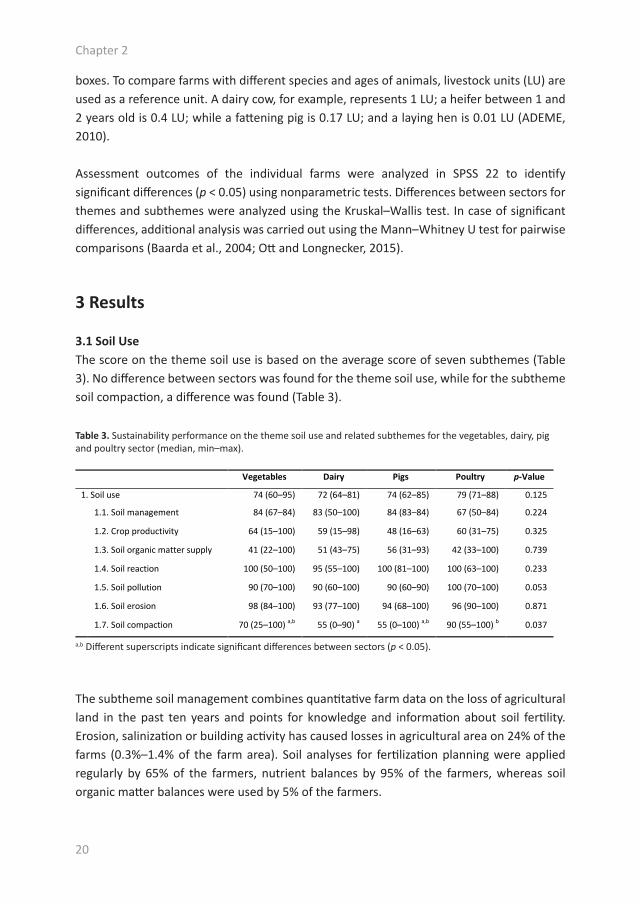
3.1 Soil UseThe score on the theme soil use is based on the average score of seven subthemes (Table 3). No difference between sectors was found for the theme soil use, while for the subtheme soil compaction, a difference was found (Table 3).
The subtheme soil management combines quantitative farm data on the loss of agricultural land in the past ten years and points for knowledge and information about soil fertility. Erosion, salinization or building activity has caused losses in agricultural area on 24% of the farms (0.3%–1.4% of the farm area). Soil analyses for fertilization planning were applied regularly by 65% of the farmers, nutrient balances by 95% of the farmers, whereas soil organic matter balances were used by 5% of the farmers.
Table 3. Sustainability performance on the theme soil use and related subthemes for the vegetables, dairy, pig and poultry sector (median, min–max).
a,b Different superscripts indicate significant differences between sectors (p < 0.05).
Vegetables Dairy Pigs Poultry p-Value
1. Soil use 74 (60–95) 72 (64–81) 74 (62–85) 79 (71–88) 0.125
1.1. Soil management 84 (67–84) 83 (50–100) 84 (83–84) 67 (50–84) 0.224
1.2. Crop productivity 64 (15–100) 59 (15–98) 48 (16–63) 60 (31–75) 0.325
1.3. Soil organic matter supply 41 (22–100) 51 (43–75) 56 (31–93) 42 (33–100) 0.739
1.4. Soil reaction 100 (50–100) 95 (55–100) 100 (81–100) 100 (63–100) 0.233
1.5. Soil pollution 90 (70–100) 90 (60–100) 90 (60–90) 100 (70–100) 0.053
1.6. Soil erosion 98 (84–100) 93 (77–100) 94 (68–100) 96 (90–100) 0.871
1.7. Soil compaction 70 (25–100) a,b 55 (0–90) a 55 (0–100) a,b 90 (55–100) b 0.037
Chapter 2
21
Crop productivity compares the farm yield of each crop per hectare to regional reference values. In addition, points are allocated based on the farmer’s perception of product quality compared to the regional quality and the development of the quality over the past five years. The productivity differed strongly between farms and per crop, but was generally lower than the Danish reference values, which were not specifically for organic farms.
Soil organic matter supply determines the share of farm area with a high humus content and the soil organic matter balance in arable crops. It includes the share of permanent grassland and crops, removal and burning of crop residues and the use of organic fertilizer. The median share of farm area with a high humus content was 19%, with a range from 0%–100%.
Soil reaction focuses on the chemical condition and management of the soil (i.e., pH level, use of acidifying fertilizers, liming, irrigated soils without adequate drainage). Acidifying fertilizers were used by 14% of the farms, 80% of which apply liming.
The subtheme soil pollution evaluates farm practices to reduce the risk of chemical soil pollution. Organic fertilizers that may contain heavy metals were used by 11% of the farmers; residues (e.g., compost) without pollutant analyses were used by 3% of the farmers; and a risk of pollution from highways or industry was recognized by 8% of the farmers. The majority of farmers (60%) used farm manure (either from conventional or organic farms) that may contain antibiotic residues.
The subtheme soil erosion assesses the wind and water erosion risks and evaluates measures implemented to reduce soil erosion (e.g., ploughing, ground cover, hedges). Farmers observed water erosion on 5% of the farms and affected 1%–5% of the agricultural land. Wind erosion was observed by farmers on 16% of the farms and affected 1%–15% of their land.
Soil compaction evaluates practices that can positively or negatively affect soil compaction. Harmful soil compaction was observed by farmers on 35% of the farms. Heavy machines (i.e., machines with a wheel load above 2.5 tons) were used on 78% of the farms. Of the farms using heavy machines 22% also used them on arable land with clayey soils; 22% used them on wet soils; and 60% applied intensive cultivation of such soils (e.g., plowing, root crops). Soil conservation measures (e.g., dual tires, low tire pressure or controlled traffic farming) when using heavy machines were implemented by 65% of the farms, and 70% implemented measures to improve soil stability (e.g., liming, interim greening or reduced tillage). The score on soil compaction was higher for poultry farms compared to dairy farms. Of the poultry farms, 64% used heavy machines, compared to 92% of dairy farms. Moreover, poultry farmers did not observe harmful soil compaction at all, while 54% of the dairy farmers did observe harmful soil compaction.
Assessing the sustainability performance of organic farms in Denmark
22
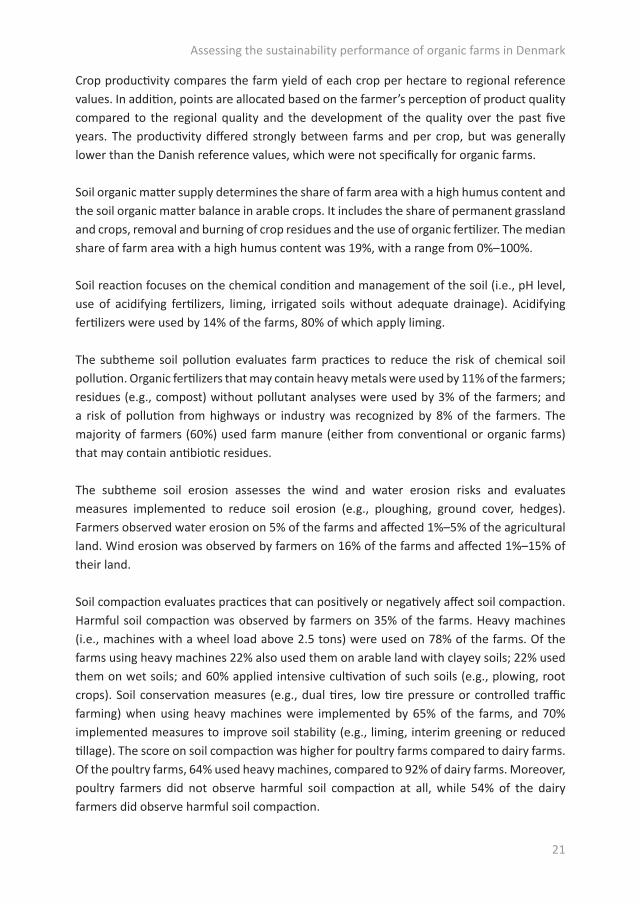
3.2 Animal HusbandryThe theme animal husbandry consists of five subthemes (Table 4). Vegetable farmers included in this study did not have livestock; the scores are therefore based on 32 farms with livestock. No difference between sectors was found for this theme, while for the subthemes livestock productivity and quality of housing, a difference between sectors was found (Table 4).
Table 4. Sustainability performance on the theme animal husbandry and related subthemes for the dairy, pig and poultry sector (median, min–max).
a,b Different superscripts indicate significant differences between sectors (p < 0.05).
Dairy Pigs Poultry p-Value
2. Animal husbandry 89 (73–95) 90 (84–96) 92 (84–95) 0.374
2.1. Herd management 100 (67–100) 100 (83–100) 100 (83–100) 0.612
2.2. Livestock productivity 65 (33–94) a 94 (75–100) b 98 (82–100) b 0.001
2.3. Possibilities for species-appropriate behavior 100 (58–100) 100 (100–100) 100 (100–100) 0.482
2.4. Quality of housing 100 (92–100) a 98 (91–100) a 90 (90–100) b 0.007
2.5. Animal health 75 (48–89) 67 (43–97) 73 (50–83) 0.287
In the subtheme herd management, a farmer receives points for answers on questions related to information about livestock, health management and criteria for the selection of breeding animals. Of the farmers, 97% answered that they regularly observe the animals and information about the animals is documented and used for management. On health management, all farmers answered that they cleaned the barns properly, frequently and thoroughly and used preventive measures, such as separating animals with infectious diseases and regular claw trimming. Selection of breeding animals was generally made consciously considering robustness, adaptedness and expected life performance (78%).
The score on livestock productivity is computed by comparing the productivity of the animal category to the regional average and by taking into account farmers’ perception of product quality and developments in performance and quality over the last five years (Box 2). Livestock productivity, without the scores on the perception of quality (development), was lower for dairy farms compared to pig and poultry farms (Table 4). The median livestock productivity at dairy farms (of all animal categories) was 90% of the regional reference values, while the productivity at pig and poultry farms was 108% and 105%.
The subtheme possibilities for species-appropriate behavior combines points for the possibility for the animal to express behavioral needs and the livestock density on the farm. Both aspects are evaluated by the auditor for each animal category separately. For each species, RISE defined certain behavioral needs to be scored on-farm (e.g., outdoor access, free moving space, clean floors).
Chapter 2
23
Scores on the subtheme quality of housing are based on the auditor’s observation of the cleanliness and amount of drinking places, protection from heat, light, air quality and protection from noise, for each animal category. Poultry farms had a lower score compared to dairy and pig farms on this subtheme. This difference is mainly due to an ammonia odor in the barns observed at 67% of the poultry farms.
The score on the subtheme animal health is based on the farm data of each animal category on animal treatment products used (i.e., share of animals treated curatively), mortality and mutilation (e.g., dehorning in cattle, debeaking in laying hens, castration in pigs).
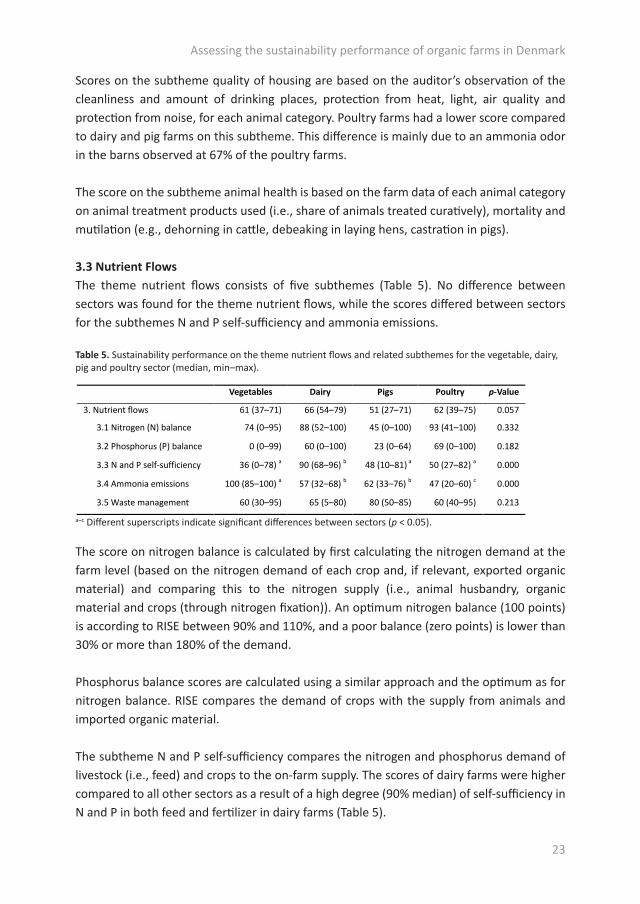
3.3 Nutrient FlowsThe theme nutrient flows consists of five subthemes (Table 5). No difference between sectors was found for the theme nutrient flows, while the scores differed between sectors for the subthemes N and P self-sufficiency and ammonia emissions.
Table 5. Sustainability performance on the theme nutrient flows and related subthemes for the vegetable, dairy, pig and poultry sector (median, min–max).
a–c Different superscripts indicate significant differences between sectors (p < 0.05).
Vegetables Dairy Pigs Poultry p-Value
3. Nutrient flows 61 (37–71) 66 (54–79) 51 (27–71) 62 (39–75) 0.057
3.1 Nitrogen (N) balance 74 (0–95) 88 (52–100) 45 (0–100) 93 (41–100) 0.332
3.2 Phosphorus (P) balance 0 (0–99) 60 (0–100) 23 (0–64) 69 (0–100) 0.182
3.3 N and P self-sufficiency 36 (0–78) a 90 (68–96) b 48 (10–81) a 50 (27–82) a 0.000
3.4 Ammonia emissions 100 (85–100) a 57 (32–68) b 62 (33–76) b 47 (20–60) c 0.000
3.5 Waste management 60 (30–95) 65 (5–80) 80 (50–85) 60 (40–95) 0.213
The score on nitrogen balance is calculated by first calculating the nitrogen demand at the farm level (based on the nitrogen demand of each crop and, if relevant, exported organic material) and comparing this to the nitrogen supply (i.e., animal husbandry, organic material and crops (through nitrogen fixation)). An optimum nitrogen balance (100 points) is according to RISE between 90% and 110%, and a poor balance (zero points) is lower than 30% or more than 180% of the demand.
Phosphorus balance scores are calculated using a similar approach and the optimum as for nitrogen balance. RISE compares the demand of crops with the supply from animals and imported organic material.
The subtheme N and P self-sufficiency compares the nitrogen and phosphorus demand of livestock (i.e., feed) and crops to the on-farm supply. The scores of dairy farms were higher compared to all other sectors as a result of a high degree (90% median) of self-sufficiency in N and P in both feed and fertilizer in dairy farms (Table 5).
Assessing the sustainability performance of organic farms in Denmark
24
The subtheme ammonia emissions calculates emissions from animal husbandry, imported organic fertilizers and includes points for farm practices related to manure storage, manure spreading and slurry injection. The absence of livestock on vegetable farms resulted in lower ammonia emissions, hence a higher score compared to dairy, pig and poultry farms (Table 5). In addition, dairy and pig farms scored higher compared to poultry farms, which is related to a lower livestock density in dairy farms (Table 2).
In the subtheme waste management, the environmental risks of the disposal of twelve types of waste are assessed. Points are allocated to the different ways of disposing waste. The scores varied between farms indicating different approaches to dispose the various types of waste.
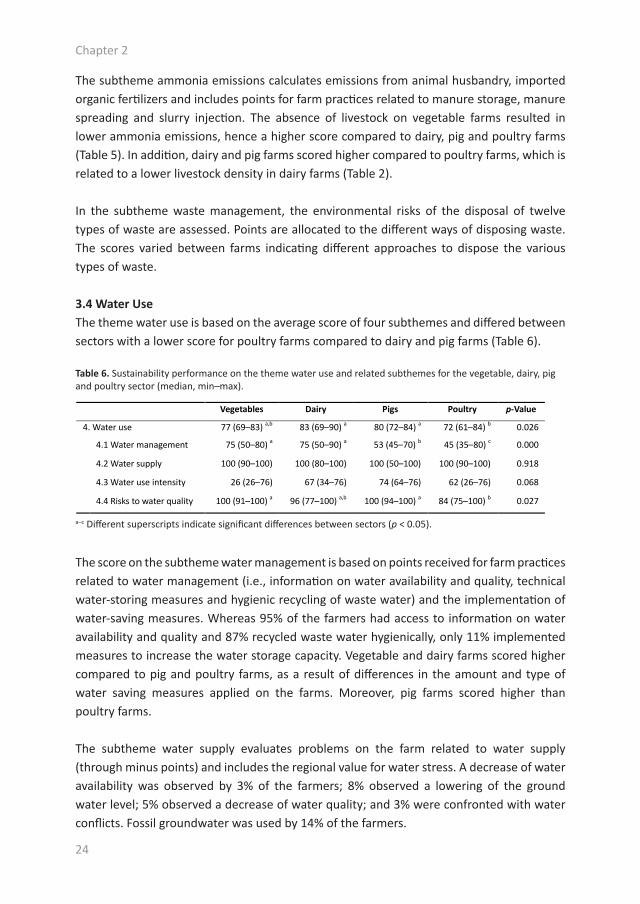
3.4 Water UseThe theme water use is based on the average score of four subthemes and differed between sectors with a lower score for poultry farms compared to dairy and pig farms (Table 6).
Table 6. Sustainability performance on the theme water use and related subthemes for the vegetable, dairy, pig and poultry sector (median, min–max).
a–c Different superscripts indicate significant differences between sectors (p < 0.05).
Vegetables Dairy Pigs Poultry p-Value
4. Water use 77 (69–83) a,b 83 (69–90) a 80 (72–84) a 72 (61–84) b 0.026
4.1 Water management 75 (50–80) a 75 (50–90) a 53 (45–70) b 45 (35–80) c 0.000
4.2 Water supply 100 (90–100) 100 (80–100) 100 (50–100) 100 (90–100) 0.918
4.3 Water use intensity 26 (26–76) 67 (34–76) 74 (64–76) 62 (26–76) 0.068
4.4 Risks to water quality 100 (91–100) a 96 (77–100) a,b 100 (94–100) a 84 (75–100) b 0.027
The score on the subtheme water management is based on points received for farm practices related to water management (i.e., information on water availability and quality, technical water-storing measures and hygienic recycling of waste water) and the implementation of water-saving measures. Whereas 95% of the farmers had access to information on water availability and quality and 87% recycled waste water hygienically, only 11% implemented measures to increase the water storage capacity. Vegetable and dairy farms scored higher compared to pig and poultry farms, as a result of differences in the amount and type of water saving measures applied on the farms. Moreover, pig farms scored higher than poultry farms.
The subtheme water supply evaluates problems on the farm related to water supply (through minus points) and includes the regional value for water stress. A decrease of water availability was observed by 3% of the farmers; 8% observed a lowering of the ground water level; 5% observed a decrease of water quality; and 3% were confronted with water conflicts. Fossil groundwater was used by 14% of the farmers.
Chapter 2
25
Water use intensity compares the water demand for agricultural production (i.e., crops, livestock and service) per hectare (in m3/year) with the regional moisture index (a regional value for the availability of water, calculated from the FAO Moisture Index (Zomer et al., 2008)). The median water use intensity was 82 (0–100), and the regional value for the moisture index was 51.
The subtheme risk to water quality evaluates risks to water quality caused by storage facilities and effluent disposal and risks of nutrient input into the water. Scores were lower for poultry farms compared to vegetable and pig farms (Table 6). Of the poultry farmers, 45% indicated that areas with high nutrient input (e.g., as a result of the outdoor run) are present, compared to 0% of farmers in the other sectors. Moreover, 82% of the poultry farms had buffer strips along open water, compared to 92% of dairy farms and 100% of vegetable and pig farms. Frequent (at least once a week) access of livestock to open water occurred on 9% of the poultry farms, 15% of the dairy farms and 0% on pig farms and could cause local eutrophication or water contamination.
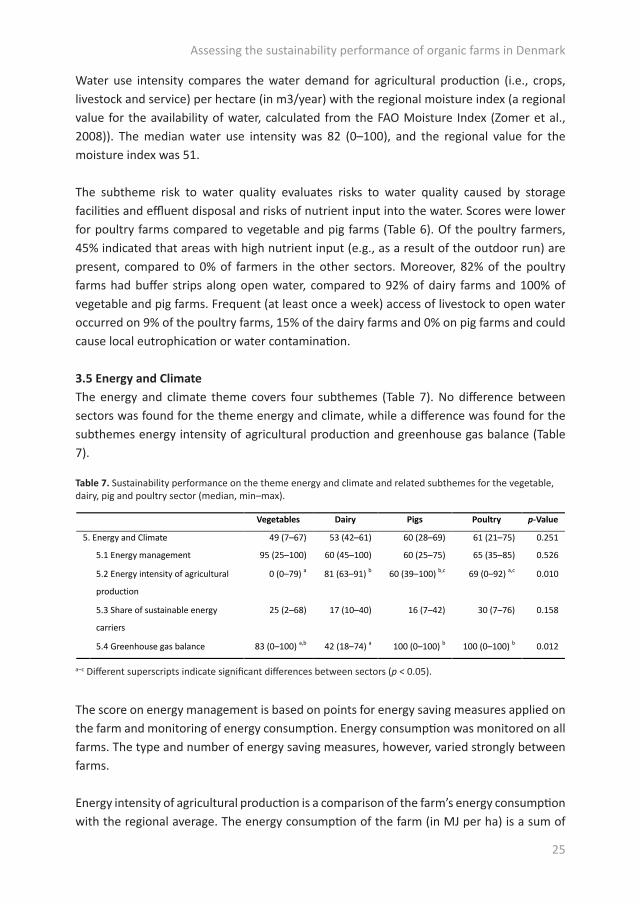
3.5 Energy and ClimateThe energy and climate theme covers four subthemes (Table 7). No difference between sectors was found for the theme energy and climate, while a difference was found for the subthemes energy intensity of agricultural production and greenhouse gas balance (Table 7).
Table 7. Sustainability performance on the theme energy and climate and related subthemes for the vegetable, dairy, pig and poultry sector (median, min–max).
a–c Different superscripts indicate significant differences between sectors (p < 0.05).
Vegetables Dairy Pigs Poultry p-Value
5. Energy and Climate 49 (7–67) 53 (42–61) 60 (28–69) 61 (21–75) 0.251
5.1 Energy management 95 (25–100) 60 (45–100) 60 (25–75) 65 (35–85) 0.526
5.2 Energy intensity of agricultural
production
0 (0–79) a 81 (63–91) b 60 (39–100) b,c 69 (0–92) a,c 0.010
5.3 Share of sustainable energy
carriers
25 (2–68) 17 (10–40) 16 (7–42) 30 (7–76) 0.158
5.4 Greenhouse gas balance 83 (0–100) a,b 42 (18–74) a 100 (0–100) b 100 (0–100) b 0.012
The score on energy management is based on points for energy saving measures applied on the farm and monitoring of energy consumption. Energy consumption was monitored on all farms. The type and number of energy saving measures, however, varied strongly between farms.
Energy intensity of agricultural production is a comparison of the farm’s energy consumption with the regional average. The energy consumption of the farm (in MJ per ha) is a sum of
Assessing the sustainability performance of organic farms in Denmark

26
all energy carriers multiplied with the energy density in MJ given in the master data and is corrected for imported or exported contract machinery work. Farm energy consumption of 25% or less of the regional average results in a score of 100; a consumption of 175% or more results in a score of zero points. The Danish reference value was 11,000 MJ per hectare. The score of vegetable farms was lower compared to dairy farms and pig farms. In addition, poultry farms scored lower compared to dairy farms (Table 7).
The subtheme share of sustainable energy carriers determines the share of energy from renewable sources in comparison to the total energy consumption of the farm (in MJ). On average, 25% of the energy consumption on the farms was renewable. Although 44% of the electricity in Denmark is from renewable sources, non-renewable energy from diesel and gas represented a large share of the energy used on farms.
The greenhouse gas balance is calculated per hectare and includes emissions from livestock, fuel and fertilizer use (i.e., energy consumed, imported and exported machine work, N mineralization), carbon sequestration and afforestation and forest clearing. Greenhouse gas emissions were higher for dairy farms compared to pig and poultry farms, as a result of higher livestock related emissions in dairy farms (Table 7).
3.6 BiodiversityThe theme biodiversity consists of five subthemes (Table 8). No difference between sectors was found for score on theme-level, while for the subthemes intensity of agricultural production and diversity of agricultural production, differences were found (Table 8).
Table 8. Sustainability performance on the theme biodiversity and related subthemes for the vegetable, dairy, pig and poultry sector (median, min–max).
a–c Different superscripts indicate significant differences between sectors (p < 0.05).
Vegetables Dairy Pigs Poultry p-Value
6. Biodiversity 76 (69–91) 76 (56–92) 72 (57–85) 67 (49–82) 0.468
6.1 Plant protection management 100 (82–100) 100 (90–100) 100 (100–100) 100 (83–100) 0.142
6.2 Ecological priority areas 100 (45–100) 100 (23–100) 100 (41–100) 100 (40–100) 0.943
6.3 Intensity of agricultural production 81 (51–93) a,b 88 (81–95) a 69 (59–82) b 64 (47–72) b 0.000
6.4 Landscape quality 70 (50–90) 65 (20–100) 60 (10–100) 63 (15–100) 0.812
6.5 Diversity of agricultural production 68 (48–90) a 46 (29–71) b,c 48 (35–57) b 32 (18–52) b,c 0.005
Plant protection management aggregates points for implemented biodiversity conservation practices and the degree of toxicity and persistency of plant protection products used. Crop rotation and selection of varieties based on resistance to pests were implemented on all farms. Of the farms, 73% participated in biodiversity programs. Plant protection products permitted in organic agriculture were used by 5% of the farmers.
Chapter 2
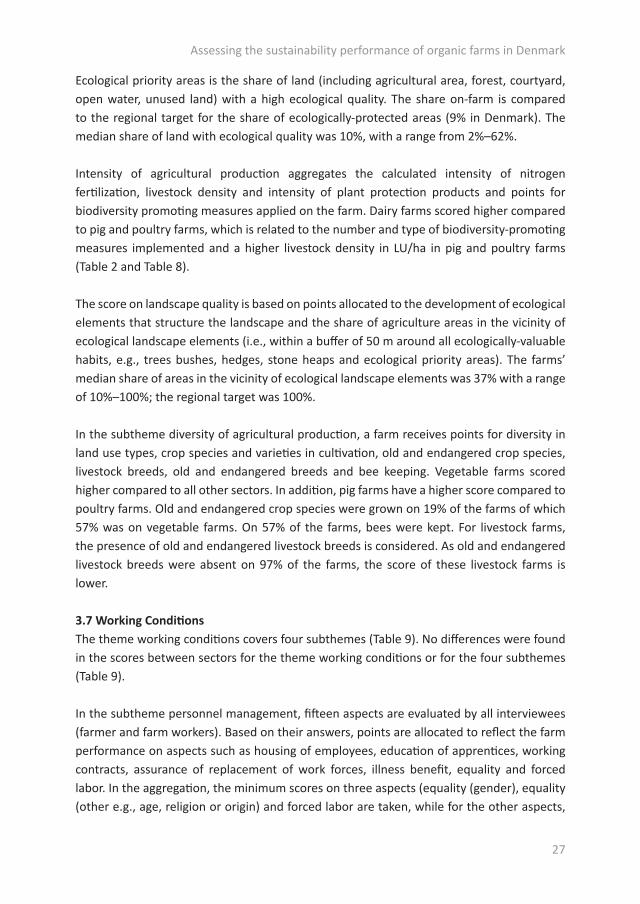
27
Ecological priority areas is the share of land (including agricultural area, forest, courtyard, open water, unused land) with a high ecological quality. The share on-farm is compared to the regional target for the share of ecologically-protected areas (9% in Denmark). The median share of land with ecological quality was 10%, with a range from 2%–62%.
Intensity of agricultural production aggregates the calculated intensity of nitrogen fertilization, livestock density and intensity of plant protection products and points for biodiversity promoting measures applied on the farm. Dairy farms scored higher compared to pig and poultry farms, which is related to the number and type of biodiversity-promoting measures implemented and a higher livestock density in LU/ha in pig and poultry farms (Table 2 and Table 8).
The score on landscape quality is based on points allocated to the development of ecological elements that structure the landscape and the share of agriculture areas in the vicinity of ecological landscape elements (i.e., within a buffer of 50 m around all ecologically-valuable habits, e.g., trees bushes, hedges, stone heaps and ecological priority areas). The farms’ median share of areas in the vicinity of ecological landscape elements was 37% with a range of 10%–100%; the regional target was 100%.
In the subtheme diversity of agricultural production, a farm receives points for diversity in land use types, crop species and varieties in cultivation, old and endangered crop species, livestock breeds, old and endangered breeds and bee keeping. Vegetable farms scored higher compared to all other sectors. In addition, pig farms have a higher score compared to poultry farms. Old and endangered crop species were grown on 19% of the farms of which 57% was on vegetable farms. On 57% of the farms, bees were kept. For livestock farms, the presence of old and endangered livestock breeds is considered. As old and endangered livestock breeds were absent on 97% of the farms, the score of these livestock farms is lower.
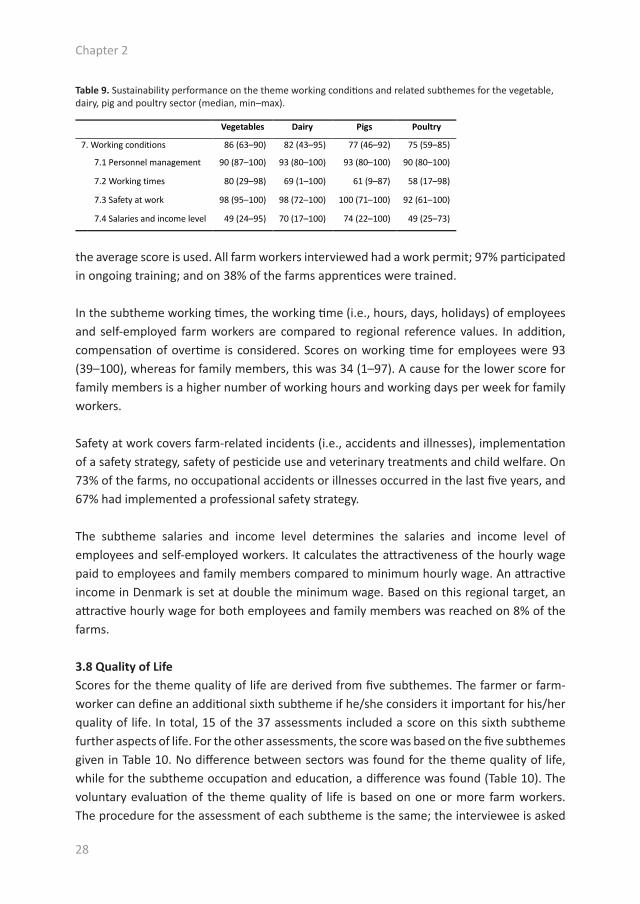
3.7 Working ConditionsThe theme working conditions covers four subthemes (Table 9). No differences were found in the scores between sectors for the theme working conditions or for the four subthemes (Table 9).
In the subtheme personnel management, fifteen aspects are evaluated by all interviewees (farmer and farm workers). Based on their answers, points are allocated to reflect the farm performance on aspects such as housing of employees, education of apprentices, working contracts, assurance of replacement of work forces, illness benefit, equality and forced labor. In the aggregation, the minimum scores on three aspects (equality (gender), equality (other e.g., age, religion or origin) and forced labor are taken, while for the other aspects,
Assessing the sustainability performance of organic farms in Denmark
28
the average score is used. All farm workers interviewed had a work permit; 97% participated in ongoing training; and on 38% of the farms apprentices were trained.
In the subtheme working times, the working time (i.e., hours, days, holidays) of employees and self-employed farm workers are compared to regional reference values. In addition, compensation of overtime is considered. Scores on working time for employees were 93 (39–100), whereas for family members, this was 34 (1–97). A cause for the lower score for family members is a higher number of working hours and working days per week for family workers.
Safety at work covers farm-related incidents (i.e., accidents and illnesses), implementation of a safety strategy, safety of pesticide use and veterinary treatments and child welfare. On 73% of the farms, no occupational accidents or illnesses occurred in the last five years, and 67% had implemented a professional safety strategy.
The subtheme salaries and income level determines the salaries and income level of employees and self-employed workers. It calculates the attractiveness of the hourly wage paid to employees and family members compared to minimum hourly wage. An attractive income in Denmark is set at double the minimum wage. Based on this regional target, an attractive hourly wage for both employees and family members was reached on 8% of the farms.
3.8 Quality of LifeScores for the theme quality of life are derived from five subthemes. The farmer or farm-worker can define an additional sixth subtheme if he/she considers it important for his/her quality of life. In total, 15 of the 37 assessments included a score on this sixth subtheme further aspects of life. For the other assessments, the score was based on the five subthemes given in Table 10. No difference between sectors was found for the theme quality of life, while for the subtheme occupation and education, a difference was found (Table 10). The voluntary evaluation of the theme quality of life is based on one or more farm workers. The procedure for the assessment of each subtheme is the same; the interviewee is asked
Table 9. Sustainability performance on the theme working conditions and related subthemes for the vegetable, dairy, pig and poultry sector (median, min–max).
Vegetables Dairy Pigs Poultry
7. Working conditions 86 (63–90) 82 (43–95) 77 (46–92) 75 (59–85)
7.1 Personnel management 90 (87–100) 93 (80–100) 93 (80–100) 90 (80–100)
7.2 Working times 80 (29–98) 69 (1–100) 61 (9–87) 58 (17–98)
7.3 Safety at work 98 (95–100) 98 (72–100) 100 (71–100) 92 (61–100)
7.4 Salaries and income level 49 (24–95) 70 (17–100) 74 (22–100) 49 (25–73)
Chapter 2

29
to rate the importance (i.e., weight) and his or her satisfaction on aspects related to the subtheme. The importance and satisfaction are both evaluated on a five-level Likert scale. The procedure for each subtheme is similar; therefore, we do not discuss all subthemes in detail, except for the one in which differences were found.
The subtheme occupation and education covers the importance and satisfaction on occupation, education and ongoing training. Scores were lower for vegetable farms compared to dairy and poultry farms. Vegetable farmers were less satisfied with regard to their ongoing training.
3.9 Economic ViabilityThe theme economic viability covers six subthemes (Table 11). No difference was found between sectors for the theme; however, a difference was found between sectors for four out of six subthemes (Table 11). As not all farmers were able or willing to share their economic results, assessment results of 32 farms were included (Table 11).
Table 10. Sustainability performance on the theme quality of life and related subthemes for the vegetable, dairy, pig and poultry sector (median, min–max).
Vegetables Dairy Pigs Poultry p-Value
8. Quality of life 70 (64–91) 83 (32–96) 81 (52–89) 81 (71–92) 0.351
8.1 Occupation and education 71 (54–83) a 85 (38–100) b 82 (63–88) a,b 89 (72–100) b 0.047
8.2 Financial situation 81 (71–100) 75 (25–89) 84 (11–89) 75 (55–100) 0.633
8.3 Social relations 88 (64–100) 89 (25–100) 88 (38–100) 89 (70–100) 0.662
8.4 Personal freedom and values 71 (54–83) 78 (38–100) 75 (45–96) 75 (66–100) 0.549
8.5 Health 65 (62–88) 80 (38–89) 84 (63–100) 75 (55–100) 0.304
8.6 Further aspects of life 88 (75–100) 88 (25–100) 88 (60–100) 75 (50–100) 0.981
a,b Different superscripts indicate significant differences between sectors (p < 0.05).
Table 11. Sustainability performance on the theme economic viability and related subthemes for the vegetable, dairy, pig and poultry sector (median, min–max).
Vegetables (n = 3) Dairy (n = 12) Pigs (n = 8) Poultry (n = 11) p-Value
9. Economic viability 65 (57–88) 47 (26–78) 55 (44–71) 69 (31–88) 0.093
9.1 Liquidity reserve 55 (30–100) a 62 (13–100) a 18 (7–31) b 47 (10–100) a 0.039
9.2 Level of indebtedness 98 (89–100) a 47 (0–97) b 75 (58–100) a,b 85 (29–99) a,b 0.037
9.3 Economic vulnerability 76 (68–76) a 76 (55–82) a 62 (52–71) b 69 (51–77) a 0.018
9.4 Livelihood security 13 (0–100) 63 (37–100) 81 (32–100) 50 (24–98) 0.479
9.5 Cash flow–turnover ratio 61 (23–100) a 7 (0–46) b 34 (0–100) a 48 (11–100) a 0.010
9.6 Debt service coverage ratio 91 (80–98) 29 (0–100) 66 (0–100) 85 (0–99) 0.131
a,b Different superscripts indicate significant differences between sectors (p < 0.05).
Assessing the sustainability performance of organic farms in Denmark
30
The score on the subtheme liquidity reserve is calculated by comparing the liquid assets to the total farm expenditure (including private expenditure) and is the average of the examined financial year. The liquidity reserve that can be used to meet financial obligations is expressed in weeks and compared to regional reference values. In Denmark, a minimum liquidity reserve is 15 weeks (33 points); optimal is 25 weeks (66 points); and ideal is 40 weeks (100 points). The liquidity reserve was lower for pig farms compared to vegetables, dairy and poultry farms (Table 11). This could be related to the generally lower economic results for pig farms in 2013 (DST, 2014).
In the subtheme level of indebtedness, the total borrowed capital (short and long debts) and liquid assets are compared to the operational cash flow to determine the number of years required to pay off debts with the current cash flow. The Danish reference values consider a low level of indebtedness of 10 years (66 points); medium is 20 years (33 points); and a high level is 50 years (zero points). Dairy farms had a higher level of indebtedness (median 16 years) resulting in a lower score compared to vegetable farms (median one year).
Economic vulnerability evaluates the vulnerability of each revenue source (i.e., secondary activities, direct payments and operation branches) based on the farmers’ perception of market trends, infrastructure condition and income security. In addition, the main income source (percentage of total business value) is determined to evaluate the concentration risk. Pig farmers evaluated the market trends, infrastructure condition and income security less positive, resulting in lower scores on economic vulnerability compared to vegetable, dairy and poultry farms.
The subtheme livelihood security compares the private household expenditure to the household expenditure target (poverty threshold; basic household needs of a single person or family in Denmark (e.g., food, clothes, health, housing, transport costs)). An income sufficient to meet the basic needs (100%) is awarded 34 points. An attractive income of 200% or more than the basic needs is awarded 100 points. Based on these reference values, 13% of the farmers did not have an income sufficient to meet the basic needs, while 28% of the farmers had an attractive income.
The subtheme cash flow-turnover ratio evaluates the profitability of the farm. It compares the operational cash flow to the business turnover (i.e., farming income, secondary activities and success of financial investments). A cash flow-turnover ratio of 20% results in a score of 33 points, 35% in 66 points and 55% in 100 points. The scores were lower for dairy farms compared to vegetable, pig and poultry farms.
The debt service coverage ratio compares the debt service (interest and mandatory amortization) to the operational cash flow. If the short-term debt service exceeds the
Chapter 2
31
operational cash flow (110%) zero points are awarded; a medium debt service ratio of 85% results in 33 points; and a low ratio of 50% in 66 points. On 16% of the farms, the short-term debt service exceeded the operational cash flow.
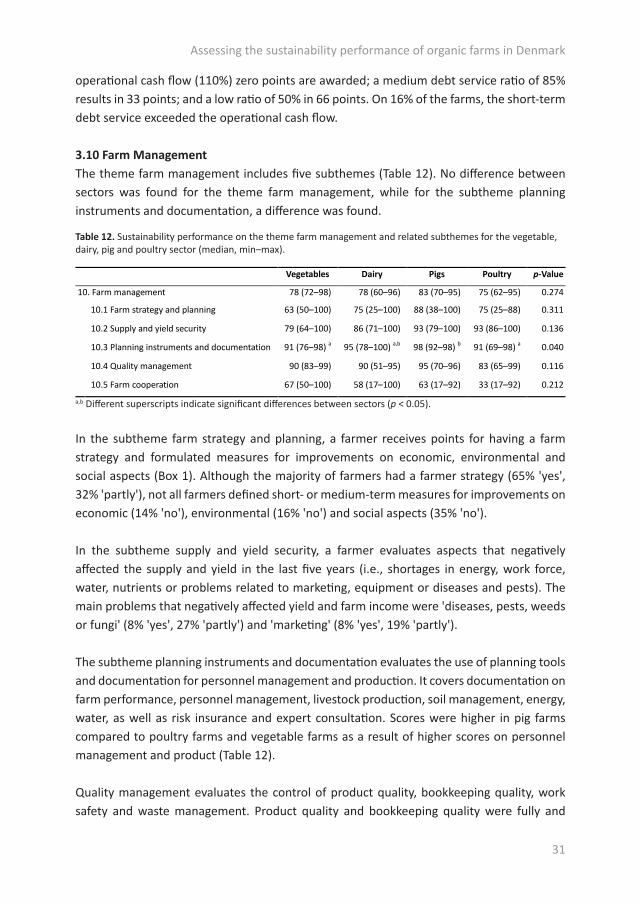
3.10 Farm ManagementThe theme farm management includes five subthemes (Table 12). No difference between sectors was found for the theme farm management, while for the subtheme planning instruments and documentation, a difference was found.
Table 12. Sustainability performance on the theme farm management and related subthemes for the vegetable, dairy, pig and poultry sector (median, min–max).
Vegetables Dairy Pigs Poultry p-Value
10. Farm management 78 (72–98) 78 (60–96) 83 (70–95) 75 (62–95) 0.274
10.1 Farm strategy and planning 63 (50–100) 75 (25–100) 88 (38–100) 75 (25–88) 0.311
10.2 Supply and yield security 79 (64–100) 86 (71–100) 93 (79–100) 93 (86–100) 0.136
10.3 Planning instruments and documentation 91 (76–98) a 95 (78–100) a,b 98 (92–98) b 91 (69–98) a 0.040
10.4 Quality management 90 (83–99) 90 (51–95) 95 (70–96) 83 (65–99) 0.116
10.5 Farm cooperation 67 (50–100) 58 (17–100) 63 (17–92) 33 (17–92) 0.212
a,b Different superscripts indicate significant differences between sectors (p < 0.05).
In the subtheme farm strategy and planning, a farmer receives points for having a farm strategy and formulated measures for improvements on economic, environmental and social aspects (Box 1). Although the majority of farmers had a farmer strategy (65% 'yes', 32% 'partly'), not all farmers defined short- or medium-term measures for improvements on economic (14% 'no'), environmental (16% 'no') and social aspects (35% 'no').
In the subtheme supply and yield security, a farmer evaluates aspects that negatively affected the supply and yield in the last five years (i.e., shortages in energy, work force, water, nutrients or problems related to marketing, equipment or diseases and pests). The main problems that negatively affected yield and farm income were 'diseases, pests, weeds or fungi' (8% 'yes', 27% 'partly') and 'marketing' (8% 'yes', 19% 'partly').
The subtheme planning instruments and documentation evaluates the use of planning tools and documentation for personnel management and production. It covers documentation on farm performance, personnel management, livestock production, soil management, energy, water, as well as risk insurance and expert consultation. Scores were higher in pig farms compared to poultry farms and vegetable farms as a result of higher scores on personnel management and product (Table 12).
Quality management evaluates the control of product quality, bookkeeping quality, work safety and waste management. Product quality and bookkeeping quality were fully and
Assessing the sustainability performance of organic farms in Denmark
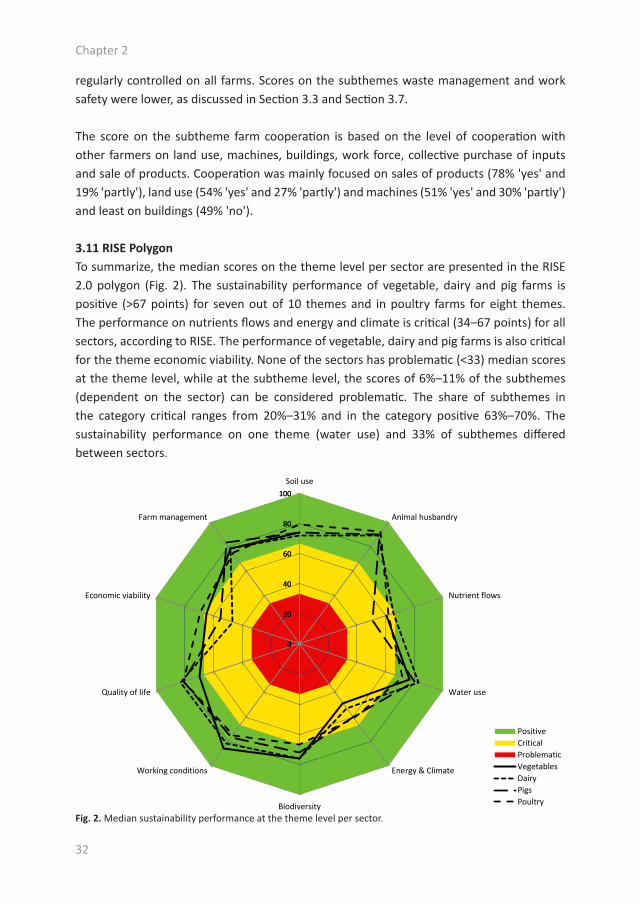
32
regularly controlled on all farms. Scores on the subthemes waste management and work safety were lower, as discussed in Section 3.3 and Section 3.7.
The score on the subtheme farm cooperation is based on the level of cooperation with other farmers on land use, machines, buildings, work force, collective purchase of inputs and sale of products. Cooperation was mainly focused on sales of products (78% 'yes' and 19% 'partly'), land use (54% 'yes' and 27% 'partly') and machines (51% 'yes' and 30% 'partly') and least on buildings (49% 'no').
3.11 RISE PolygonTo summarize, the median scores on the theme level per sector are presented in the RISE 2.0 polygon (Fig. 2). The sustainability performance of vegetable, dairy and pig farms is positive (>67 points) for seven out of 10 themes and in poultry farms for eight themes. The performance on nutrients flows and energy and climate is critical (34–67 points) for all sectors, according to RISE. The performance of vegetable, dairy and pig farms is also critical for the theme economic viability. None of the sectors has problematic (<33) median scores at the theme level, while at the subtheme level, the scores of 6%–11% of the subthemes (dependent on the sector) can be considered problematic. The share of subthemes in the category critical ranges from 20%–31% and in the category positive 63%–70%. The sustainability performance on one theme (water use) and 33% of subthemes differed between sectors.
Fig. 2. Median sustainability performance at the theme level per sector.
0
20
40
60
80
100
0
20
40
60
80
100Soil use
Animal husbandry
Nutrient flows
Water use
Energy & Climate
Biodiversity
Working conditions
Quality of life
Economic viability
Farm management
PositiveCriticalProblematicVegetablesDairyPigsPoultry
Chapter 2

33
4 Discussion
We used RISE 2.0 to analyze the sustainability performance of organic farms in Denmark and to analyze differences in the performance between sectors. Participation of farms was based on a selection by processing companies and voluntary participation. Generalizations based on this not necessarily representative sample should be taken with care. Next to the sustainability performance of the farms, the results provided insight into the assessment approach of RISE. RISE facilitates the assessment of a wide variety of themes and subthemes and aggregates different types of data: points, quantitative farm data, regional and master data. By allocating points to possible answers, the tool facilitates qualitative data to be included in the assessment. This normalization process is needed to transform the data into units (e.g., 0–100) that can be integrated in the tool and aggregated with other indicators (Andreoli and Tellarini, 2000; Gómez-Limón and Sanchez-Fernandez, 2010). This procedure enables the assessment of issues that tend to be left out of sustainability assessments due to the challenge in assessing and quantifying such information (Binder et al., 2012). Transforming such qualitative data into scores, however, requires decisions on the number of answers and the allocation of points to each answer. In the example mentioned in Box 1, the farmer has three possible answers: yes, partly or no, with 100, 50 and 0 points, respectively. This has an influence on the possible score a farmer can obtain. Moreover, for an auditor, it can be challenging to decide when an answer corresponds to, for example, yes or partly (De Olde et al., 2016f). In RISE, 37% of the subthemes are exclusively based on points, and an additional 41% of subthemes use points in addition to other data types. In the interpretation and communication of the results, the role of decisions made in the development of a tool, such as the number of possible answers and allocated points, needs to be acknowledged (De Olde et al., 2016c).
The analysis of the assessment results showed differences in the sustainability performance between sectors on subthemes, such as N and P self-sufficiency, ammonia emissions, greenhouse gas emissions, energy intensity and diversity of agricultural production related to differences in farming systems (e.g., presence/absence of livestock). This raises the question of whether the use of a generic approach, without sector-specific comparisons, is valid. A sector-specific comparison would, however, disable a comparison between the performances of sectors. Differences in the performance on the subthemes water management, occupation and education and planning instruments and documentation could not be explained and might be related to the selection of farms and/or auditors involved in the assessment. Due to the relatively high number of auditors involved in this study, their role could not be assessed. Experiences with other tools, however, indicate that the auditor plays a role in the assessment result (De Olde et al., 2016f; Gerrard et al., 2012).
Assessing the sustainability performance of organic farms in Denmark
34
Next to decisions related to the point-based data and the assessment approach, also decisions made in the selection of indicators, reference values, weights and aggregation methods have an impact on the assessment results. In the selection of reference values, for example, we used Danish reference values that were not specific for organic farming. This had an impact on the scores because of the generally lower productivity in organic farming, as shown by results on crop productivity (De Ponti et al., 2012; Seufert et al., 2012). Whereas the comparison of farm productivity to regional reference values makes the tool more context specific, it also increases the dependency on the quality of regional reference values and reduces the possibility to compare the performance between regions (Gasso et al., 2015).
To summarize the datasets and clarify the assessment results, different aggregation functions are used in sustainability assessment tools (Pollesch and Dale, 2015). In RISE, the score at the theme level is determined by the average score (arithmetic mean) of the subthemes; as a result, all subthemes become equally important. Although this aggregation allows a quick overview of the sustainability performance, it can result in the compensation of poor scores. For example, in the subtheme crop productivity, the median scores of all sectors are considered as critical, whereas the scores at the theme level (soil use) are positive. Without the consideration of the underlying data, the aggregated scores can lead to simplistic conclusions (Gómez-Limón and Sanchez-Fernandez, 2010). At the subtheme level, this type of aggregation is used, as well; however, in several subthemes, a ‘risk-based approach’ is used, for example in the subtheme personnel management; instead of the average, the minimum score on indicators related to equality and forced labor is taken to reduce the compensation of poor scores.
To select indicators, different criteria can be used, such as sensitivity, precision, affordability and time demand (De Olde et al., 2016c; Niemeijer and De Groot, 2008). How these criteria are prioritized is dependent on the context and perspectives of those involved in developing the tool (De Olde et al., 2016c). A recent study showed that even amongst sustainability experts, a lack of consensus on what is most important in selecting sustainability indicators can be observed (De Olde et al., 2016c). Once indicators are selected, methods for data collection and calculation are defined. Again, these decisions, for example to express greenhouse gas emissions per hectare instead of per kg product, have an influence and can lead to different conclusions (De Boer, 2003). In addition, the assessment of indicators related to, for example, the subthemes farm management, working conditions and quality of life, farm size is not taken into account, whereas this might play a role. This emphasizes the need for transparency and reflection on the role of decisions and value judgements in sustainability assessment tools and is important to be able to explain their implications for the assessment results (Bell and Morse, 2001; De Olde et al., 2016c; Thorsøe et al., 2014; Triste et al., 2014).
Chapter 2
35
As the concept of sustainable development is evolving, so are sustainability assessment tools. Some of the comments made in this paper may therefore already be addressed in new versions of the tool and reference values. For example, in the new version of RISE (RISE 3.0, available since 2016), direct input of data from other tools, such as greenhouse gas calculations, is enabled. This could allow more precise data to be entered and reduce time investments; yet, also here, transparency in how these data were calculated and what has been included and excluded is crucial.
Marchand et al. (2014) identified a continuum from rapid to full sustainability assessments. Rapid sustainability assessment tools are, for example, self-evaluations of farmers based on their knowledge and can be characterized by a limited time investment, low costs, low complexity, high subjectivity, transparency and user-friendliness. Full sustainability assessments are expert-based assessments with high time investment and costs, high complexity and scientifically underpinned output accuracy, with lower transparency and user-friendliness. Given these characteristics, rapid sustainability assessment tools are particularly applicable to raise awareness and interest in sustainability among larger groups of farmers (Marchand et al., 2014). Full sustainability assessment tools are more focused on monitoring and support farmers interested in sustainability and willing to invest time and money (Marchand et al., 2014). RISE can be positioned in between these extremes and is confronted with the challenge of balancing in between the characteristics of a rapid and full sustainability assessment tool, for example by combining subjective and more scientifically underpinned data, and combining precise and accurate measurements with user-friendliness and transparency. Similarly, Marchand et al. (2014) indicated that combining functions (i.e., learning and monitoring) in a sustainability assessment tool can cause tensions.
In a recent study comparing different sustainability assessment tools, RISE was considered by farmers as a relevant tool to gain insight into their sustainability performance (De Olde et al., 2016f). The use of a context-specific approach using regional reference values, the input of quantitative farm data and the user-friendliness were aspects contributing to the perceived relevance. Additional efforts, however, are needed to support farmers in translating the sustainability assessment results into sustainable development at the farm level (Binder et al., 2010; De Olde et al., 2016f). Further research is needed to evaluate the implementation of the sustainability assessment results and to reflect on the contribution of RISE to the learning and monitoring of sustainability at the farm level.
5 Conclusions
The sustainability performance of 37 organic farms in Denmark was assessed using RISE 2.0. RISE contributes to the diversity of sustainability assessment tools by providing its
Assessing the sustainability performance of organic farms in Denmark

36
own perspective on how to assess sustainability. Decisions made in the development of a tool like RISE, such as the selection of themes and indicators, reference values, weights and aggregation methods, influence the assessment results. This emphasizes the need for transparency and reflection on decisions made in sustainability assessment tools. Although all decisions made in the development of RISE can be debated, the outcomes of RISE are a starting point to discuss sustainability at the farm level and to contribute to awareness and learning about sustainability.
Acknowledgments
The sustainability assessments were part of the KØB project (Kompetenceudvikling til Økologisk Bæredygtighed (in English: competence development for organic sustainability) funded by the Danish 'Okologifremmeordning', which is an EU-funded scheme aimed at promoting the production and sale of organic products. We would like to thank the farmers and auditors for their participation in the sustainability assessments. We would like to acknowledge Jan Grenz (HAFL) for his constructive feedback on an earlier version of this paper.
Chapter 2

37

38
39
Chapter 3
Assessing sustainability at farm level: Lessons learned from a comparison of tools in practiceE.M. de Olde a,b, F.W. Oudshoorn a,c, C.A.G. Sørensen a, E.A.M. Bokkers b and I.J.M. de Boer b
a Department of Engineering, Aarhus University, Aarhus, Denmarkb Animal Production Systems Group, Wageningen University, Wageningen, the Netherlands c SEGES, Aarhus, Denmark
Published in Ecological Indicators 66 (2016), 391-404DOI:10.1016/j.ecolind.2016.01.047
40
Abstract
In the past decades a wide variety of tools have been developed to assess the sustainability performance of farms. Although multiple studies have compared tools on a theoretical basis, little attention has been paid to the comparing tools in practice. This research compared indicator-based sustainability assessment tools to gain insight in practical requirements, procedures and complexity involved in applying sustainability assessment tools. In addition, the relevance of the tools, as perceived by farmers, was evaluated. An overview of 48 indicator-based sustainability assessment tools was developed to, subsequently, select tools that address the environmental, social and economic dimension of sustainability, are issued in a scientific publication and suitable for assessing the sustainability performance of livestock and arable farms in Denmark. Only four tools (RISE, SAFA, PG and IDEA) complied with the selection criteria and were used to assess the sustainability performance of five Danish farms. The tools vary widely in their scoring and aggregation method, time requirement and data input. The farmers perceived RISE as the most relevant tool to gain insight in the sustainability performance of their farm. The findings emphasize the importance of context specificity, user-friendliness, complexity of the tool, language use, and a match between value judgements of tool developers and farmers. Even though RISE was considered as the most relevant tool, the farmers expressed a hesitation to apply the outcomes of the four tools in their decision making and management. Furthermore, they identified limitations in their options to improve their sustainability performance. Additional efforts are needed to support farmers in using the outcomes in their decision making. The outcomes of sustainability assessment tools should therefore be considered as a starting point for discussion, reflection and learning.
Chapter 3
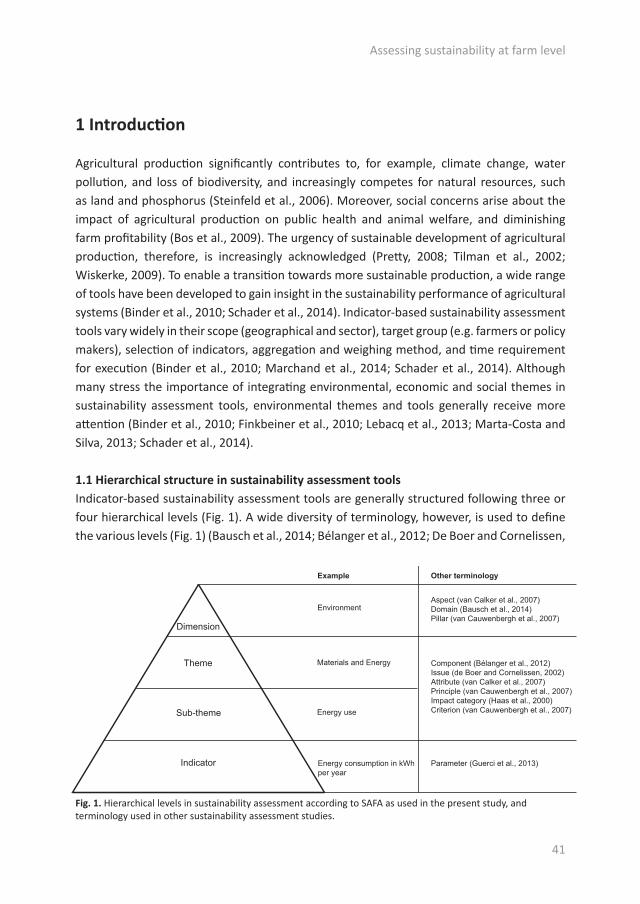
41
1 Introduction
Agricultural production significantly contributes to, for example, climate change, water pollution, and loss of biodiversity, and increasingly competes for natural resources, such as land and phosphorus (Steinfeld et al., 2006). Moreover, social concerns arise about the impact of agricultural production on public health and animal welfare, and diminishing farm profitability (Bos et al., 2009). The urgency of sustainable development of agricultural production, therefore, is increasingly acknowledged (Pretty, 2008; Tilman et al., 2002; Wiskerke, 2009). To enable a transition towards more sustainable production, a wide range of tools have been developed to gain insight in the sustainability performance of agricultural systems (Binder et al., 2010; Schader et al., 2014). Indicator-based sustainability assessment tools vary widely in their scope (geographical and sector), target group (e.g. farmers or policy makers), selection of indicators, aggregation and weighing method, and time requirement for execution (Binder et al., 2010; Marchand et al., 2014; Schader et al., 2014). Although many stress the importance of integrating environmental, economic and social themes in sustainability assessment tools, environmental themes and tools generally receive more attention (Binder et al., 2010; Finkbeiner et al., 2010; Lebacq et al., 2013; Marta-Costa and Silva, 2013; Schader et al., 2014).
1.1 Hierarchical structure in sustainability assessment toolsIndicator-based sustainability assessment tools are generally structured following three or four hierarchical levels (Fig. 1). A wide diversity of terminology, however, is used to define the various levels (Fig. 1) (Bausch et al., 2014; Bélanger et al., 2012; De Boer and Cornelissen,
Dimension
Theme
Sub-theme
Indicator Energy consumption in kWh per year
Energy use
Materials and Energy
Environment
Example Other terminology
Aspect (van Calker et al., 2007)Domain (Bausch et al., 2014)Pillar (van Cauwenbergh et al., 2007)
Parameter (Guerci et al., 2013)
Component (Bélanger et al., 2012)Issue (de Boer and Cornelissen, 2002)Attribute (van Calker et al., 2007)Principle (van Cauwenbergh et al., 2007)Impact category (Haas et al., 2000)Criterion (van Cauwenbergh et al., 2007)
Fig. 1. Hierarchical levels in sustainability assessment according to SAFA as used in the present study, and terminology used in other sustainability assessment studies.
Assessing sustainability at farm level

42
2002; Guerci et al., 2013; Haas et al., 2000; Van Calker et al., 2007; Van Cauwenbergh et al., 2007). This paper follows the structure suggested in the SAFA guidelines (FAO, 2013a). A dimension is a pillar of sustainability and is the highest and most general level in the structure of a tool. On the intermediate level, universal sustainability goals are translated into themes and, in some cases, made more explicit in subthemes. Finally, indicators are measurable variables to evaluate the sustainability performance for the (sub) theme (FAO, 2013a). The indicator value can be derived in different ways, e.g. through measurement, expert opinion or model estimates (Van Cauwenbergh et al., 2007). To evaluate the indicator value, a desired level for each indicator is described by means of a reference value (Acosta-Alba and Van Der Werf, 2011; Van Cauwenbergh et al., 2007). Reference values can be absolute or relative values. Absolute values can be divided into target values identifying a desirable condition (e.g. legal norm), and threshold values defining a minimum or maximum acceptable level (e.g. political interpretation of scientific findings) (Van Cauwenbergh et al., 2007). Relative reference values compare indicator values with an initial value, regional or sample average or desirable trend (Lebacq et al., 2013; Van Cauwenbergh et al., 2007).
1.2 The adoption of sustainability assessment tools in practiceSustainability assessment tools can provide support to on-farm decision making and hereby may have a significant impact on a sustainable development of farms (Le Gal et al., 2011; Marchand et al., 2014). So far, however, the actual adoption of sustainability assessment tools by agricultural practice is relatively limited (Binder et al., 2010; Triste et al., 2014). In the development of a sustainability tool, tool developers make value judgements and assumptions, for example, on what is sustainability, what is a sustainable level of production, which indicators to select, and how to measure, weigh and aggregate the indicators (Gasparatos, 2010). A mismatch between these value judgements and assumptions of tool developers and its users (i.e. farmers and advisors) can result from insufficient involvement of these users during the development of a tool, and is considered as a reason for the limited adoption of sustainability assessment tools in farming practice (De Mey et al., 2011; Gasparatos, 2010; Triste et al., 2014; Van Meensel et al., 2012). Furthermore, data availability and quality, time and budget requirements as well as factors related to unfamiliar terminology, user-friendliness, and tool accessibility influence the farmers’ perception of the tool's relevance and, consequently, the adoption of tools (Lynch et al., 2000; Marchand et al., 2014; Van Meensel et al., 2012).
Farmers’ adoption of sustainability assessment tools and their outcomes is a key issue when considering to use sustainability assessment tools to contribute to the sustainable development of farms (Triste et al., 2014). Literature on the adoption of tools by farmers emphasizes the importance of the perceived relevance of the tool which is determined by a combination of factors mentioned above (Van Meensel et al., 2012). Relevance can be defined as: 'Something is relevant to a task if it increases the likelihood of accomplishing the
Chapter 3
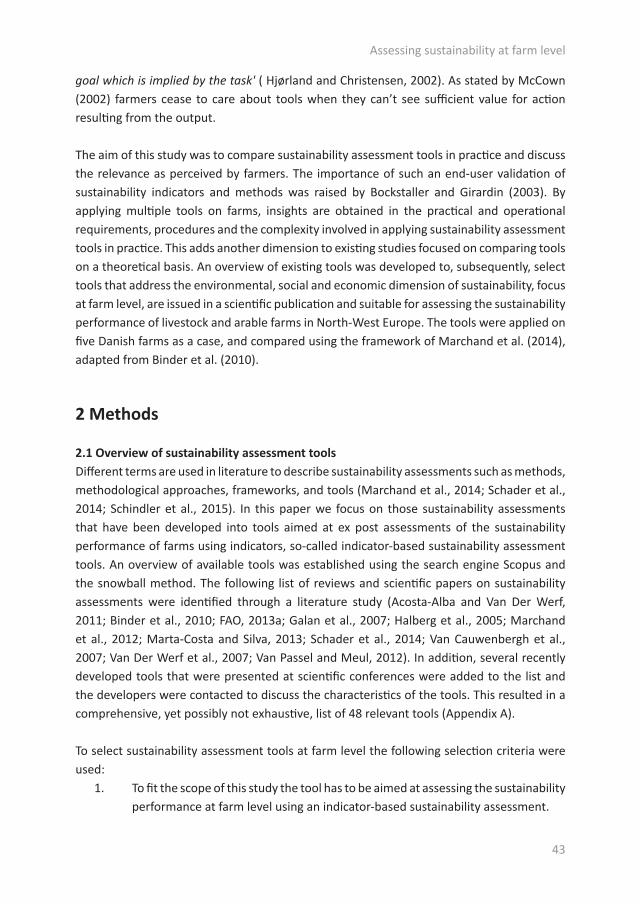
43
goal which is implied by the task' ( Hjørland and Christensen, 2002). As stated by McCown (2002) farmers cease to care about tools when they can’t see sufficient value for action resulting from the output.
The aim of this study was to compare sustainability assessment tools in practice and discuss the relevance as perceived by farmers. The importance of such an end-user validation of sustainability indicators and methods was raised by Bockstaller and Girardin (2003). By applying multiple tools on farms, insights are obtained in the practical and operational requirements, procedures and the complexity involved in applying sustainability assessment tools in practice. This adds another dimension to existing studies focused on comparing tools on a theoretical basis. An overview of existing tools was developed to, subsequently, select tools that address the environmental, social and economic dimension of sustainability, focus at farm level, are issued in a scientific publication and suitable for assessing the sustainability performance of livestock and arable farms in North-West Europe. The tools were applied on five Danish farms as a case, and compared using the framework of Marchand et al. (2014), adapted from Binder et al. (2010).
2 Methods
2.1 Overview of sustainability assessment toolsDifferent terms are used in literature to describe sustainability assessments such as methods, methodological approaches, frameworks, and tools (Marchand et al., 2014; Schader et al., 2014; Schindler et al., 2015). In this paper we focus on those sustainability assessments that have been developed into tools aimed at ex post assessments of the sustainability performance of farms using indicators, so-called indicator-based sustainability assessment tools. An overview of available tools was established using the search engine Scopus and the snowball method. The following list of reviews and scientific papers on sustainability assessments were identified through a literature study (Acosta-Alba and Van Der Werf, 2011; Binder et al., 2010; FAO, 2013a; Galan et al., 2007; Halberg et al., 2005; Marchand et al., 2012; Marta-Costa and Silva, 2013; Schader et al., 2014; Van Cauwenbergh et al., 2007; Van Der Werf et al., 2007; Van Passel and Meul, 2012). In addition, several recently developed tools that were presented at scientific conferences were added to the list and the developers were contacted to discuss the characteristics of the tools. This resulted in a comprehensive, yet possibly not exhaustive, list of 48 relevant tools (Appendix A).
To select sustainability assessment tools at farm level the following selection criteria were used:
1. To fit the scope of this study the tool has to be aimed at assessing the sustainability performance at farm level using an indicator-based sustainability assessment.
Assessing sustainability at farm level
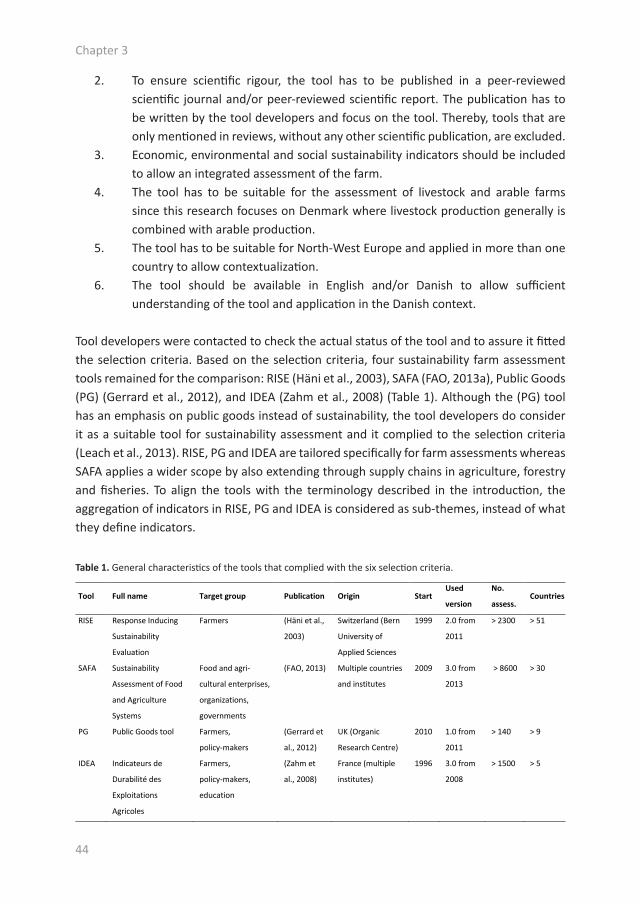
44
2. To ensure scientific rigour, the tool has to be published in a peer-reviewed scientific journal and/or peer-reviewed scientific report. The publication has to be written by the tool developers and focus on the tool. Thereby, tools that are only mentioned in reviews, without any other scientific publication, are excluded.
3. Economic, environmental and social sustainability indicators should be included to allow an integrated assessment of the farm.
4. The tool has to be suitable for the assessment of livestock and arable farms since this research focuses on Denmark where livestock production generally is combined with arable production.
5. The tool has to be suitable for North-West Europe and applied in more than one country to allow contextualization.
6. The tool should be available in English and/or Danish to allow sufficient understanding of the tool and application in the Danish context.
Tool developers were contacted to check the actual status of the tool and to assure it fitted the selection criteria. Based on the selection criteria, four sustainability farm assessment tools remained for the comparison: RISE (Häni et al., 2003), SAFA (FAO, 2013a), Public Goods (PG) (Gerrard et al., 2012), and IDEA (Zahm et al., 2008) (Table 1). Although the (PG) tool has an emphasis on public goods instead of sustainability, the tool developers do consider it as a suitable tool for sustainability assessment and it complied to the selection criteria (Leach et al., 2013). RISE, PG and IDEA are tailored specifically for farm assessments whereas SAFA applies a wider scope by also extending through supply chains in agriculture, forestry and fisheries. To align the tools with the terminology described in the introduction, the aggregation of indicators in RISE, PG and IDEA is considered as sub-themes, instead of what they define indicators.
Tool Full name Target group Publication Origin Start
Used
version
No.
assess. Countries
RISE Response Inducing
Sustainability
Evaluation
Farmers (Häni et al.,
2003)
Switzerland (Bern
University of
Applied Sciences
1999 2.0 from
2011
> 2300 > 51
SAFA Sustainability
Assessment of Food
and Agriculture
Systems
Food and agri-
cultural enterprises,
organizations,
governments
(FAO, 2013) Multiple countries
and institutes
2009 3.0 from
2013
> 8600 > 30
PG Public Goods tool Farmers,
policy-makers
(Gerrard et
al., 2012)
UK (Organic
Research Centre)
2010 1.0 from
2011
> 140 > 9
IDEA Indicateurs de
Durabilité des
Exploitations
Agricoles
Farmers,
policy-makers,
education
(Zahm et
al., 2008)
France (multiple
institutes)
1996 3.0 from
2008
> 1500 > 5
Table 1. General characteristics of the tools that complied with the six selection criteria.
Chapter 3
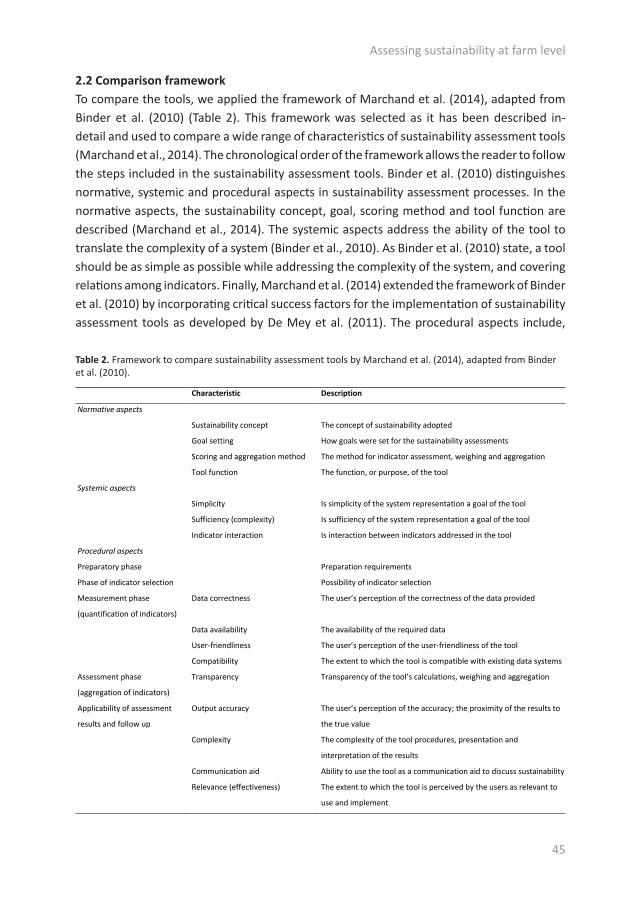
45
2.2 Comparison frameworkTo compare the tools, we applied the framework of Marchand et al. (2014), adapted from Binder et al. (2010) (Table 2). This framework was selected as it has been described in-detail and used to compare a wide range of characteristics of sustainability assessment tools (Marchand et al., 2014). The chronological order of the framework allows the reader to follow the steps included in the sustainability assessment tools. Binder et al. (2010) distinguishes normative, systemic and procedural aspects in sustainability assessment processes. In the normative aspects, the sustainability concept, goal, scoring method and tool function are described (Marchand et al., 2014). The systemic aspects address the ability of the tool to translate the complexity of a system (Binder et al., 2010). As Binder et al. (2010) state, a tool should be as simple as possible while addressing the complexity of the system, and covering relations among indicators. Finally, Marchand et al. (2014) extended the framework of Binder et al. (2010) by incorporating critical success factors for the implementation of sustainability assessment tools as developed by De Mey et al. (2011). The procedural aspects include,
Characteristic Description
Normative aspects
Sustainability concept The concept of sustainability adopted
Goal setting How goals were set for the sustainability assessments
Scoring and aggregation method The method for indicator assessment, weighing and aggregation
Tool function The function, or purpose, of the tool
Systemic aspects
Simplicity Is simplicity of the system representation a goal of the tool
Sufficiency (complexity) Is sufficiency of the system representation a goal of the tool
Indicator interaction Is interaction between indicators addressed in the tool
Procedural aspects
Preparatory phase Preparation requirements
Phase of indicator selection Possibility of indicator selection
Measurement phase
(quantification of indicators)
Data correctness The user’s perception of the correctness of the data provided
Data availability The availability of the required data
User-friendliness The user’s perception of the user-friendliness of the tool
Compatibility The extent to which the tool is compatible with existing data systems
Assessment phase
(aggregation of indicators)
Transparency Transparency of the tool’s calculations, weighing and aggregation
Applicability of assessment
results and follow up
Output accuracy The user’s perception of the accuracy; the proximity of the results to
the true value
Complexity The complexity of the tool procedures, presentation and
interpretation of the results
Communication aid Ability to use the tool as a communication aid to discuss sustainability
Relevance (effectiveness) The extent to which the tool is perceived by the users as relevant to
use and implement
Table 2. Framework to compare sustainability assessment tools by Marchand et al. (2014), adapted from Binder et al. (2010).
Assessing sustainability at farm level
46
amongst others, user-friendliness, data availability and effectiveness. The description of the characteristic 'effectiveness' given by Marchand et al. (2014), however, focuses on relevance. We, therefore, changed the characteristic's name effectiveness into relevance accordingly. This concept is considered more appropriate as it evaluates the contribution to reaching a goal (i.e. sustainable development of agriculture), instead of effectiveness which can be defined as producing a desired result. To compare multiple aspects of user-friendliness, we divided the aspect user-friendliness into four aspects: (1) understanding the tool, (2) working with the tool, (3) usability for the farmer and (4) time requirement. The time and effort to get to know and learn to work with the tool as an assessor (first author) is included as an aspect of the user-friendliness of the tool. Altogether, the normative, systemic and procedural aspects provide a comprehensive insight in the tools.
The comparison of the normative and systemic aspects of the tools is based on information gathered from the tools’ publications and manuals. The tools were applied on Danish farms to compare the procedural aspects of the tools. The experiences of the first author, who carried out the assessments, and the experiences of the farmers, collected through a questionnaire, provided the input for the comparison of the procedural aspects. These findings are described in Appendix C (Table C.3). Although this research puts emphasis on the application of the tools (procedural aspects), in-depth understanding of the tools requires a complete overview using the entire framework of Marchand et al. (2014).
2.3 Farm assessmentsThe manuals of the four selected tools were consulted: RISE (Grenz et al., 2012), SAFA (FAO, 2013a), PG (Gerrard et al., 2012) and IDEA (Vilain, 2008). To ensure a good understanding and fluent application of the assessment tools, the assessor (first author) first tested each tool in a pilot study on a Danish farm. This pilot study indicated that data for RISE, IDEA and PG is accessible through farm data and interviews with farmers. SAFA, however, distinguishes different levels of data collecting, depending on their required quality, ranging from high (e.g. data collected for SAFA) to low (e.g. assessor's estimates, based on available farm data and farmer interview). Farm interviews and existing farm data were used as an input for SAFA to ensure a similar assessment procedure for each tool and each farm. No additional measurements (e.g. air emission analysis) or stakeholder interviews were carried out, consequently, some of the data input for SAFA is based on estimates with limited contextualization. To ensure a similar approach in SAFA, compared to the other tools, the assessment focused on the farm level and on data of 1 year. No sub-themes and indicators were excluded from the analysis. RISE involves an elaborate contextualization process in which a large set of regional data is entered in the database of the software. Also for the other tools, Danish reference values were collected to ensure a comparable approach of the tools. For the contextualization of SAFA, PG and IDEA information such as Danish wage levels, prices for agricultural products, income levels, red list species, rare livestock breeds
Chapter 3
47
and plant species, was gathered. Where possible, questions of PG and IDEA were specified to the Danish situation by giving examples from Denmark (e.g. Danish energy audits, agri-environmental schemes, rare breeds).
To compare the sustainability assessment tools in practice, the network of an agricultural consultancy was used to select five farmers (not the pilot farm) based on their interest in sustainability and willingness to cooperate. Selected farms involved two dairy farms and three pig farms, with 230 up to 550 hectares of land for crop production (Appendix D). The four tools selected were applied on these five Danish farms, resulting in a total of 20 assessments. Farm assessments were carried out in January and February 2015. To enable inclusion of the most recent annual financial report, assessments covered farm data of 2013. To prepare the assessments, not only this financial report, but also the fertilizer, pesticide and crop rotation plan of 2013 were obtained through the agricultural consultant.
Each assessment tool was scheduled on a different day and the order of the assessments was randomized across farms. All assessments were carried out by the same assessor (first author). Farmers’ comments on the tools were registered as well. The time needed for the preparation, the assessment, and reporting was monitored. Preparation time includes time allocated to prepare the assessment in advance using farm data (including farm accounts, feeding compositions, crop rotation plan, fertilization plan) provided by the agricultural consultant and the farmer. These farm data provided answers to part of the questions, which were checked with the farmer during the interview. The assessment time includes the on-farm time in which the remaining questions were answered by the farmer during the interview. The reporting time includes time spent on filling in additional data, data quality control, calculations and developing the report. In case additional information had to be looked up in the farm management system, this data was processed after the interview. All the assessments were checked for their completeness and coherency before calculating the results and making the report.
2.4 Farmer's evaluation of the toolsResults of the assessments were discussed during a fifth meeting on-farm. The results of each tool were discussed for 20–30 min whereupon the farmer's perception of each tool was assessed using a questionnaire of ten questions (Appendix B). This procedure was chosen to prevent confusion regarding the characteristics of – and experiences with – the tools during the farmers’ evaluation. The farmers were asked to respond to each question using the Likert scale scoring from 1 to 5, (1 means strongly disagree, and 5 strongly agree). The individual scores are presented in Appendix C (Table C.3). This approach was taken to allow for comparison of the responses. This questionnaire was developed following the framework of Marchand et al. (2014) and included the procedural phases the farmers were involved and had insight in: the measurement and application phase. The questionnaire focused
Assessing sustainability at farm level

48
on the procedural aspects that can play a role in the relevance of the tool as perceived by the farmer. The last five questions evaluated the perceived relevance more in detail by focusing on the contribution of sustainability assessment tools to support the farmer in the sustainable development of their farm (Appendix B). Additional comments of the farmers were collected by the first author and quoted in the paper, where relevant, to elaborate on the findings of the questionnaire. At the end of this meeting, farmers were asked to rank tools according to the relevance for their decision-making regarding sustainability.
3 Results
Results follow the structure of the framework of Marchand et al. (2014), as explained in Table 2. Detailed answers for the normative, systemic and procedural aspects can be found in Appendix C.
3.1 Normative aspectsThe sustainability concept adopted by RISE, IDEA and SAFA is similar and follows the concept of sustainable development as introduced by Brundtland (1987) (Appendix C, Table C.1). The three tools provide a definition of sustainable agriculture that is economically viable, environmentally sound and socially just. The PG tool does not adopt a sustainability concept, but uses public goods (services and goods provided by agriculture) as a lens to assess farm performance. The goal setting of PG and RISE occurred through stakeholder consultation as well as through experts and literature review. For SAFA and IDEA, the goals were defined through a top-down procedure following literature and experts.
Scoring methodologies of tools differ, even though all tools apply a similar structure and ‘weight-and-sum’ aggregation on theme and/or sub-theme level. RISE uses a complex set of calculations to determine the score of each sub-theme. In addition, references to regional data (e.g. regional crop yields) and so-called master data (e.g. toxicity of pesticides) are included. SAFA provides an extensive manual to evaluate the performance of each indicator through several measurements. In addition, performance-, practice-, and target-based indicators are distinguished, and connected to a hierarchy in weighting. In PG and IDEA, indicator scores are derived directly from answers given by the farmer and farm data. The function of the tool is similar for all the tools studied; to assess the sustainability performance of farms. An important secondary function of the tools is to stimulate learning and dissemination of sustainability, and for PG the dissemination of public goods provided by agriculture.
3.2 Systemic aspectThe systemic aspects within an assessment tool give insight in the translation of the
Chapter 3

49
complexity of the system into indicators and addresses the simplicity, sufficiency and indicator interaction (Binder et al., 2010). The simplicity of system representation is mentioned only in the PG manual as an explicit goal (Appendix C, Table C.2). For the other tools, simplicity is not mentioned, but is an implicit goal, as they aim to develop an understandable tool that can contribute to awareness and education on sustainable agriculture.
Sufficiency of a tool is defined as the provision of a complete representation of the elements of an agricultural system (Binder et al., 2010). RISE, SAFA, and IDEA explicitly mention the importance of an integrative approach to farm sustainability. In PG, sufficiency is an implicit goal as it aims to embrace a wide scope of public goods delivered by agriculture. Finally, the possibility to identify interactions between indicators is not explicitly addressed in any of the tools; they all consider the indicators independently.
3.3.Procedural aspects3.3.1 Preparatory phaseIn the preparation of an assessment, SAFA requires a description of the assessment boundaries and supply chain stakeholders. In this study, the preparation time needed for SAFA was 15 min on average as a similar assessment boundary, scope and time frame were applied (Table 3). In addition, SAFA does not require direct input of quantitative farm data in the software. The preparatory phase of the other tools is focused on planning the visit and informing the farmer and advisor about the required data. Data available beforehand (e.g. data on crop production, nutrient balance, energy consumption and economics) was used to prepare the assessments. Consequently, the preparation time of the other tools was higher (Table 3).
3.3.2 Phase of indicator selectionIndicator selection is only possible in SAFA; the other tools provide a standard set of indicators.
3.3.3 Measurement phaseThe correctness of the farm data and interview answers used in the tool was perceived positively by the farmers (Appendix C, Table C.3, Question 1). Nevertheless, they also stated that the qualitative questions in the tools allowed them to influence their assessment results and possibly affect the correctness. Furthermore, the assessor considered it difficult
Min. and max. time requirements RISE SAFA PG IDEA
Preparation time 105 - 180 min 10 - 25 min 30 - 60 min 60 - 75 min
Assessment time 120 - 165 min 105 - 140 min 75 - 120 min 45 - 90 min
Calculation and reporting time 105 - 180 min 15 min 30 - 60 min 45 - 60 min
Total assessment time 330 - 525 min 125 - 185 min 135 - 240 min 150 - 225 min
Table 3. Minimum and maximum time requirements.
Assessing sustainability at farm level
50
to determine the level of austerity to be applied in SAFA: 'Although the underlying data and answers were provided, the decision whether to allocate, for example, a score of 3 or 4 was in some cases difficult.' In SAFA, the translation of qualitative information into quantitative scores is made by the assessor and puts him or her in a critical position.
All farmers and the assessor perceived data availability as high (Appendix C, Table C.3, Question 2). The assessor experienced that data required for RISE, PG and IDEA was relatively easy to access due to the availability of farm accounts, farm management systems and farmers’ knowledge and overview of farm operations. In SAFA, however, data-availability was scored as moderate as different types of data need to be collected for the assessor to make an evaluation, and high quality data requires additional analysis and interviews with stakeholders.
Learning to work with the tools as an assessor, i.e. understand the questions and the software, requires time. Working with RISE requires training given by the tool developers to understand the intention of the questions asked, gain insight in the underlying calculations that are used to aggregate indicators into sub-themes and themes, and to get familiar with the software. Furthermore, reference data for the region, in this case Denmark, has to be put in the database. The assessor, therefore, considered that the time required learning RISE was higher compared with other tools. SAFA requires a moderate time investment, as it includes extensive manuals to be studied to understand all indicators and their way of measurement. IDEA and PG require a relative limited time investment, as manuals are more concise, and questions and calculations are relatively easy.
Four out of five farmers, as well as the assessor, indicated that RISE and IDEA provided the clearest questions, whereas SAFA includes long questions with complex wording (Appendix C, Table C.3, Question 3). During the assessments, the assessor noticed that several questions related to nature conservation in PG included unfamiliar terminology to farmers.
Time needed for on-farm assessment varied widely among the tools (Table 3). When adding the preparation, assessment and reporting time, RISE requires the largest time investment compared with the other tools (Table 3).
The assessor perceived RISE, PG and IDEA as compatible with existing data systems, since all data required for these assessments can be retrieved from the farm management system, economic accounts and the farm interview. Compared to the other tools where data needs to be entered into the tool, data for SAFA needs to be collected and is evaluated by the assessor. The compatibility of SAFA depends on the desired data quality; for high data quality, additional analysis and stakeholder interviews are required. Therefore, the assessor perceived this tool as partly compatible.
Chapter 3
51
3.3.4 Assessment phaseTransparency, defined as the ease to understand how tool results are computed, was evaluated by the assessor. Transparency is relatively high in PG and IDEA due to their simple aggregation, calculation and scoring method. In SAFA, the aggregation and calculation method is transparent, whereas the scoring method is less transparent due to translation of qualitative information into scores by the assessor. Transparency of RISE is lower compared with other tools; although all calculations are provided, their complexity makes it less transparent to understand how results are computed.
3.3.5 Applicability of assessment results and follow-upThe output accuracy, defined by the proximity of the measurement result to the true value, was evaluated by the farmers and assessor. The assessor perceived the output accuracy of RISE as high due to involvement of experts and use of scientific literature in tool development, and the quantitative approach using farm data. Although the development of SAFA involved a high number of experts, the scoring procedure is rather qualitative and depends on the assessor, and, therefore, could result in less accurate outcomes. Also in IDEA and PG, a wide range of experts were involved, but the more qualitative approach of the tools may lower the accuracy. Furthermore, noticeable assumptions and value judgements on what is considered sustainable, in PG and IDEA, e.g. being organic certified contributes to the farm sustainability, negatively affected the farmers’ perception of the accuracy of these tools.
Results of SAFA were considered by the farmers as too positive. One of the farmers indicated that he considered his farm's economic vulnerability as problematic, whereas SAFA presented a very positive score on this topic. Another farmer came to a similar conclusion and added: 'Perhaps that is the Danish context; the basic level is rather green already.'
The assessor perceived the complexity of RISE and SAFA as high compared with PG and IDEA. Complexity for RISE resulted from the complex set of calculations and the high data input in RISE. For SAFA it resulted from the extensive manuals and approaches to measure each indicator. PG and IDEA provide more simple calculation methods with lower data input. The farmers evaluated the complexity of understanding the tool, and considered RISE as relatively easy to understand, and SAFA as least easy (Appendix C, Table C.3, Question 5). The assessor observed that the wording used in RISE is more recognizable for farmers compared with the more abstract wording applied in the themes of SAFA (e.g. rule of law) and IDEA (e.g. organization of space).
All tools present results of the assessment in a polygon on theme level, and tables on sub-theme or indicator level. RISE, SAFA and PG use a similar style and colour in their visual presentation, comprising a categorization from red (negative sustainability performance),
Assessing sustainability at farm level
52
orange, to green (positive sustainability performance). IDEA uses a more basic style of polygon and tables which is perceived as a less strong visual aid, as one farmer said: 'IDEA is compared to RISE less pedagogic, it is less easy to read the score due to the absence of colours as evaluation.'
3.3.6 RelevanceFarmers recognized to a high degree the results of RISE as a reflection of the strengths and weaknesses of their farm. The results of IDEA were least recognized by all farmers (Appendix C, Table C.3, Question 6). The relevance of the tools to gain insight in the level of sustainability of the farm scored highest for RISE, followed by SAFA and PG, and lowest for IDEA (Question 7). The farmers were more skeptical about applying the tool outcomes in the decision making and management of the farm. RISE scored relatively highest followed by SAFA, and PG and IDEA (Question 8). Moreover, the farmers indicated that the tools provided limited new knowledge and insights to them (Question 9). The farmers were asked whether they saw aspects in the farm to improve or change, based on the tool outcomes. The scores were moderate, as the farmers indicated that they felt restricted in their opportunities to improve their sustainability due to the complexity of the system they are part of (Question 10).
Overall, farmers considered RISE as the most relevant tool to get insight into their sustainability performance. One of the farmers stated: 'The results are specified in the separate sub-themes; it enables you to see more specific results.' In the discussions with farmers about the relevance of tools, the assessor observed that farmers strongly emphasized the relevance to the Danish context. They want to know how they perform compared to their colleagues, and on themes relevant in the Danish context.
The relevance of the PG tool was scored as second best by the farmers. Nevertheless, the farmers raised the possible influence of their answers on the questions and the underlying value judgements of the tool developers. Questions on landscape, heritage and nature conservation, for example, were considered as strongly oriented on the British context. Similarly, several themes and questions in IDEA were experienced as typically French and can be due to differences in the thematic scope of the tools. Also a limited visual presentation, in IDEA, and complex language use, in SAFA, had its influence on the farmers’ perception of the relevance. Moreover, certain assumptions made by the tools, like organic is more sustainable, were strongly criticized by the farmers and referred to in their evaluation of the tools’ relevance.
Chapter 3
53
4 Discussion
The comparison of the four sustainability assessment tools indicated differences in various characteristics of the tools including their scoring and aggregation method, time requirements, transparency, output accuracy, and complexity. In the development of sustainability assessment tools aspects as time requirement, output accuracy, and complexity need to be balanced in relation to the user and tool function (Marchand et al., 2014). Marchand et al. (2014) present two extremes within sustainability assessment tools: full sustainability assessments (FSA) and rapid sustainability assessments (RSA). RSA tools require a limited time investment, with a high transparency of the tool, yet, the output-accuracy is considered lower. FSA tools would require a higher time investment, up to weeks, with a more scientifically underpinned output, however, with a low transparency, higher complexity and accuracy. Based on the comparison, RISE could be positioned in between RSA and FSA, whereas IDEA and PG would tend more towards a RSA tool. The position of SAFA in this continuum depends on the approach taken and desired data quality. Both extremes of FSA and RSA, and the four tools situated within, however, present strengths and weaknesses (Marchand et al., 2014).
Despite a higher time investment, and lower transparency, farmers considered RISE as the most relevant tool. Compared to the other tools they perceived the results as more precise, and the outcomes as understandable and recognizable. In addition, the more subjective character of IDEA and PG, noticeable from value judgement and assumptions of the tool developers (e.g. the assumption that organic farming is more sustainable) negatively affected the perceived relevance. Results of this research show that when the value judgements embedded in a tool do not reflect those of the farmers, results may become irrelevant for the farmer and the knowledge produced is not considered useful for them (Gasparatos and Scolobig, 2012; Vatn, 2005). This stresses the importance of the selection of an appropriate tool in which a fit between the value judgements of the tool developers and the users (i.e. farmers) is found (Gasparatos, 2010; Marchand et al., 2014).
Farmers in this study raised the importance of a context-specific (e.g. Denmark-specific) approach to farm level sustainability assessments. They are interested in comparing their results to their colleagues, using a tool that is based on the regional context. A context-specific approach allows inclusion of context specific characteristics, like regional sustainability challenges and norms (Gasso et al., 2015). Context-specific approaches will provide outcomes that are more likely to fit to the context in which the farmer is operating, and as such may stimulate farmers in taking action to improve the sustainability of their farm. At the same time, a context specific approach can reduce the possibility to compare the sustainable performance of different sectors and countries and risks neglecting global sustainability issues (Mascarenhas et al., 2010). This highlights the dilemma between generic
Assessing sustainability at farm level
54
and specific approaches (Gasso et al., 2015). The specificity level of the assessment should, therefore, be aligned with the assessment purpose (Gasso et al., 2015). Consequently, different sustainability assessment tools are needed to reflect the various contexts and value judgements (De Ridder et al., 2007; Gasso et al., 2015; Schader et al., 2014).
By assessing the sustainability performance of farms, tool developers aim to support farmers in their decision making towards a more sustainable development of the farm. Sustainability assessment tools can have different functions including monitoring, policy advice and certification, as described by (Schader et al., 2014). The tools manuals used in this study mention stimulating dissemination and learning as an additional function of sustainability assessment tools. Although the assessment of sustainability performance may result in discussions regarding reference values, selection of indicators and value-loaded assumptions, the tools succeed in fulfilling their secondary aim. Through sustainability assessments, farmers are triggered to discuss a wide range of sustainability themes and reflect upon their practices. The assessment outcomes function hereby as a starting point for discussion, reflection and learning.
In the evaluation of the relevance of the tools, the farmers were rather skeptical about using the knowledge produced by the tools in the decision making and management of their farm. Moreover, the farmers experienced restricted possibilities to improve or change their sustainability performance due to the complexity of the agricultural system they are part of. This emphasizes the need for additional support to utilize and implement the knowledge developed in a sustainability assessment (Binder et al., 2010). Support from advisors in constructing a farm development plan, or discussion groups of farmers can stimulate learning and reflection on the results (Marchand et al., 2014). Constructing a farm development plan, supported by outcomes of the tools, may contribute substantially to the relevance and adoption of the tools (De Mey et al., 2011). Moreover, development plans can facilitate integration of different knowledge types (i.e. practical, theoretical, transdisciplinary) and contextual information important for farm-level decision making (Darnhofer, 2010).
From a list of 48 sustainability assessment tools, only four tools complied with our set of selection criteria. This procedure may have excluded valuable tools that, for example, focus only on one dimension of sustainability, on one agricultural sector, or were developed for one specific country. None of the tools was excluded for the language criterion. Nevertheless, the selection of the four tools allowed assessments of multiple dimensions of sustainability, in the Danish context. RISE required a large input of Danish reference data; this input of data is relatively limited for the other tools. The high degree of contextualization of RISE may have positively influenced the farmers’ perception of the relevance of RISE. Besides differences in the degree of contextualization allowed in the design of a tool, differences in thematic scope may have influenced the farmers’ perception of relevance. Themes
Chapter 3
55
selected in each tool may be considered more relevant in one context to the other and may have played a role in the perceived relevance of the tools. Additional efforts to allow contextualization of tools, reduce complex language use, and improve user-friendliness may add to the perceived relevance and adoption of tools (Gasso et al., 2015; Van Meensel et al., 2012). At the same time, the adoption of tools is not primarily dependent on farmers but also depends on policy structures, research projects, and awareness of the users. Involving other stakeholders in the development of sustainability assessment tools is often suggested to enhance dialogue and understanding on sustainable development (Bell and Morse, 2008; Schindler et al., 2015; Triste et al., 2014).
Sustainability is an evolving concept; implying that sustainability assessment tools will evolve as well. The authors recognize that some of the comments in this paper might already be addressed in upcoming versions of the tools. One of the limitations of the study entails the high investment of time required to learn the tools and carry out twenty assessments. As a consequence, the high time investment per tool allowed for a limited number of farmers to be included in this study. However, the more an assessor is using a tool, the better it is trained to use it and to work with it efficiently. This research compared four sustainability assessment tools, and applied the tools in practice to evaluate the relevance as perceived by farmers, as an example of end-user validation. In addition, the framework of Marchand et al. (2014) and Binder et al. (2010) demonstrated to be useful to compare tools and can contribute to the selection of relevant tools. Additional research efforts are needed to evaluate the design validation and output validation of the tools and discuss their ability to draw evidence based conclusions on the sustainability performance of farms. Moreover, research efforts could focus on developing approaches to use sustainability assessment tools as a starting point for developing strategic farm choices, and monitor their long term performance.
5 Conclusion
Four out of 48 identified sustainability assessment tools met the criteria to be able to assess Danish farms for their sustainability performance. The four tools (RISE, SAFA, PG and IDEA) vary widely in their scoring and aggregation method, time investment, and data requirements. The farmers perceived RISE as the most relevant tool to gain insight in the sustainability performance of their farm, because this tool is based on the input of quantitative farm data and uses a context specific approach using regional data. Other factors contributing to the perceived relevance of the four tools were user-friendliness, complexity of the tool, language use and value judgements of tool developers and users (i.e. farmers). Alignment of the value judgements embedded in tools is essential for the acceptance of the assessment outcomes and the application in improving the sustainability of the farm.
Assessing sustainability at farm level
56
Even though RISE was considered as the most relevant tool, the farmers expressed hesitation to apply the outcomes of the four tools in their decision making and management. Furthermore, they identified limitations in the options to improve their sustainability performance. Additional efforts are needed to support farmers in using the outcomes in their decision making on the local level. The outcomes of sustainability assessment tools should therefore be considered as a starting point for discussion, reflection and learning.
Acknowledgements
This research has received funding from the European Community under the Seventh Framework Programme for the project Autograssmilk under grant agreement SME-2012-2-314879. We thank the agricultural consultancy JYSK Landbrugsrådgivning for their support in finding five farmers. We are very grateful for the willingness of the farmers to go through four different sustainability assessments and discuss the results and their perception. Thanks also to the developers of the four sustainability tools for providing assistance for using the tools, and to SEGES, in particular Anke Stubsgaard, for developing a Danish version of RISE and support during the test phase. Finally, we would like to thank the anonymous reviewers for providing valuable suggestions to improve the paper.
Chapter 3
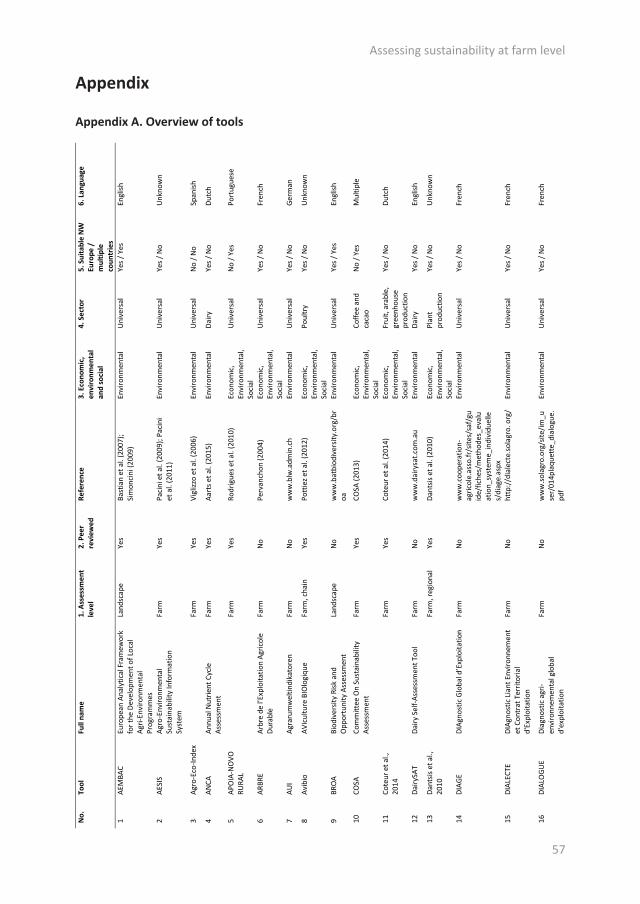
57
No.
To
ol
Full
nam
e 1.
Ass
essm
ent
leve
l 2.
Pee
r re
view
ed
Refe
renc
e
3. E
cono
mic
, en
viro
nmen
tal
and
soci
al
4. S
ecto
r 5.
Sui
tabl
e N
W
Euro
pe /
m
ultip
le
coun
trie
s
6. L
angu
age
1 AE
MBA
C Eu
rope
an A
naly
tical
Fra
mew
ork
for t
he D
evel
opm
ent o
f Loc
al
Agri-
Envi
ronm
enta
l Pr
ogra
mm
es
Land
scap
e Ye
s Ba
stia
n et
al.
(200
7);
Sim
onci
ni (2
009)
En
viro
nmen
tal
Uni
vers
al
Yes /
Yes
En
glish
2 AE
SIS
Agro
-Env
ironm
enta
l Su
stai
nabi
lity
Info
rmat
ion
Syst
em
Farm
Ye
s Pa
cini
et a
l. (2
009)
; Pac
ini
et a
l. (2
011)
En
viro
nmen
tal
Uni
vers
al
Yes /
No
Unk
now
n
3 Ag
ro-E
co-In
dex
Fa
rm
Yes
Vigl
izzo
et a
l. (2
006)
En
viro
nmen
tal
Uni
vers
al
No
/ No
Span
ish
4 AN
CA
Annu
al N
utrie
nt C
ycle
As
sess
men
t Fa
rm
Yes
Aart
s et a
l. (2
015)
En
viro
nmen
tal
Dairy
Ye
s / N
o Du
tch
5 AP
OIA
-NO
VO
RURA
L
Farm
Ye
s Ro
drig
ues e
t al.
(201
0)
Econ
omic
, En
viro
nmen
tal,
Soci
al
Uni
vers
al
No
/ Yes
Po
rtug
uese
6 AR
BRE
Arbr
e de
l’Ex
ploi
tatio
n Ag
ricol
e Du
rabl
e Fa
rm
No
Perv
anch
on (2
004)
Ec
onom
ic,
Envi
ronm
enta
l, So
cial
Uni
vers
al
Yes /
No
Fren
ch
7 AU
I Ag
raru
mw
eltin
dika
tore
n Fa
rm
No
ww
w.b
lw.a
dmin
.ch
Envi
ronm
enta
l U
nive
rsal
Ye
s / N
o Ge
rman
8 Av
ibio
AV
Icul
ture
BIO
logi
que
Farm
, cha
in
Yes
Pott
iez e
t al.
(201
2)
Econ
omic
, En
viro
nmen
tal,
Soci
al
Poul
try
Yes /
No
Unk
now
n
9 BR
OA
Biod
iver
sity
Risk
and
O
ppor
tuni
ty A
sses
smen
t La
ndsc
ape
No
ww
w.b
atbi
odiv
ersit
y.or
g/br
oa
Envi
ronm
enta
l U
nive
rsal
Ye
s / Y
es
Engl
ish
10
COSA
Co
mm
ittee
On
Sust
aina
bilit
y As
sess
men
t Fa
rm
Yes
COSA
(201
3)
Econ
omic
, En
viro
nmen
tal,
Soci
al
Coffe
e an
d ca
cao
No
/ Yes
M
ultip
le
11
Cote
ur e
t al.,
20
14
Fa
rm
Yes
Cote
ur e
t al.
(201
4)
Econ
omic
, En
viro
nmen
tal,
Soci
al
Frui
t, ar
able
, gr
eenh
ouse
pr
oduc
tion
Yes /
No
Dutc
h
12
Dairy
SAT
Dairy
Sel
f-Ass
essm
ent T
ool
Farm
N
o w
ww
.dai
rysa
t.com
.au
Envi
ronm
enta
l Da
iry
Yes /
No
Engl
ish
13
Dant
sis e
t al.,
20
10
Fa
rm, r
egio
nal
Yes
Dant
sis e
t al.
(201
0)
Econ
omic
, En
viro
nmen
tal,
Soci
al
Plan
t pr
oduc
tion
Yes /
No
Unk
now
n
14
DIAG
E DI
Agno
stic
Glo
bal d
’Exp
loita
tion
Farm
N
o w
ww
.coo
pera
tion-
agric
ole.
asso
.fr/s
ites/
saf/
guid
e/fic
hes/
met
hode
s_ev
alu
atio
n_sy
stem
e_in
divi
duel
les/
diag
e.as
px
Envi
ronm
enta
l U
nive
rsal
Ye
s / N
o Fr
ench
15
DIAL
ECTE
DI
Agno
stic
Lia
nt E
nviro
nnem
ent
et C
ontr
at T
errit
oria
l d'
Expl
oita
tion
Farm
N
o ht
tp:/
/dia
lect
e.so
lagr
o. o
rg/
Envi
ronm
enta
l U
nive
rsal
Ye
s / N
o Fr
ench
16
DIAL
OGU
E Di
agno
stic
agr
i-en
viro
nnem
enta
l glo
bal
d'ex
ploi
tatio
n
Farm
N
o w
ww
.sol
agro
.org
/site
/im_u
ser/
014p
laqu
ette
_dia
logu
e.pd
f
Envi
ronm
enta
l U
nive
rsal
Ye
s / N
o Fr
ench
Appendix
Appendix A. Overview of tools
Assessing sustainability at farm level
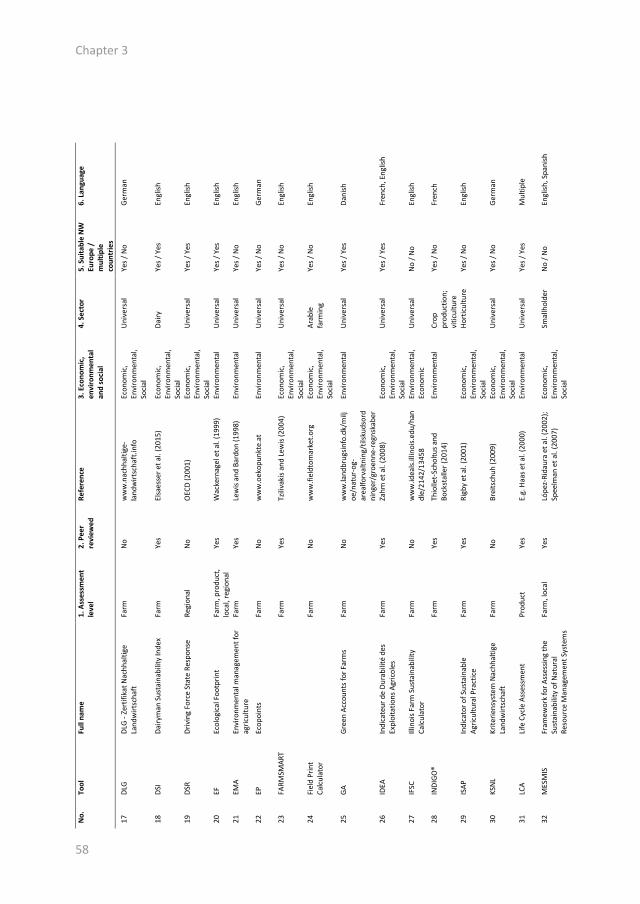
58
No.
To
ol
Full
nam
e 1.
Ass
essm
ent
leve
l 2.
Pee
r re
view
ed
Refe
renc
e
3. E
cono
mic
, en
viro
nmen
tal
and
soci
al
4. S
ecto
r 5.
Sui
tabl
e N
W
Euro
pe /
m
ultip
le
coun
trie
s
6. L
angu
age
1 AE
MBA
C Eu
rope
an A
naly
tical
Fra
mew
ork
for t
he D
evel
opm
ent o
f Loc
al
Agri-
Envi
ronm
enta
l Pr
ogra
mm
es
Land
scap
e Ye
s Ba
stia
n et
al.
(200
7);
Sim
onci
ni (2
009)
En
viro
nmen
tal
Uni
vers
al
Yes /
Yes
En
glish
2 AE
SIS
Agro
-Env
ironm
enta
l Su
stai
nabi
lity
Info
rmat
ion
Syst
em
Farm
Ye
s Pa
cini
et a
l. (2
009)
; Pac
ini
et a
l. (2
011)
En
viro
nmen
tal
Uni
vers
al
Yes /
No
Unk
now
n
3 Ag
ro-E
co-In
dex
Fa
rm
Yes
Vigl
izzo
et a
l. (2
006)
En
viro
nmen
tal
Uni
vers
al
No
/ No
Span
ish
4 AN
CA
Annu
al N
utrie
nt C
ycle
As
sess
men
t Fa
rm
Yes
Aart
s et a
l. (2
015)
En
viro
nmen
tal
Dairy
Ye
s / N
o Du
tch
5 AP
OIA
-NO
VO
RURA
L
Farm
Ye
s Ro
drig
ues e
t al.
(201
0)
Econ
omic
, En
viro
nmen
tal,
Soci
al
Uni
vers
al
No
/ Yes
Po
rtug
uese
6 AR
BRE
Arbr
e de
l’Ex
ploi
tatio
n Ag
ricol
e Du
rabl
e Fa
rm
No
Perv
anch
on (2
004)
Ec
onom
ic,
Envi
ronm
enta
l, So
cial
Uni
vers
al
Yes /
No
Fren
ch
7 AU
I Ag
raru
mw
eltin
dika
tore
n Fa
rm
No
ww
w.b
lw.a
dmin
.ch
Envi
ronm
enta
l U
nive
rsal
Ye
s / N
o Ge
rman
8 Av
ibio
AV
Icul
ture
BIO
logi
que
Farm
, cha
in
Yes
Pott
iez e
t al.
(201
2)
Econ
omic
, En
viro
nmen
tal,
Soci
al
Poul
try
Yes /
No
Unk
now
n
9 BR
OA
Biod
iver
sity
Risk
and
O
ppor
tuni
ty A
sses
smen
t La
ndsc
ape
No
ww
w.b
atbi
odiv
ersit
y.or
g/br
oa
Envi
ronm
enta
l U
nive
rsal
Ye
s / Y
es
Engl
ish
10
COSA
Co
mm
ittee
On
Sust
aina
bilit
y As
sess
men
t Fa
rm
Yes
COSA
(201
3)
Econ
omic
, En
viro
nmen
tal,
Soci
al
Coffe
e an
d ca
cao
No
/ Yes
M
ultip
le
11
Cote
ur e
t al.,
20
14
Fa
rm
Yes
Cote
ur e
t al.
(201
4)
Econ
omic
, En
viro
nmen
tal,
Soci
al
Frui
t, ar
able
, gr
eenh
ouse
pr
oduc
tion
Yes /
No
Dutc
h
12
Dairy
SAT
Dairy
Sel
f-Ass
essm
ent T
ool
Farm
N
o w
ww
.dai
rysa
t.com
.au
Envi
ronm
enta
l Da
iry
Yes /
No
Engl
ish
13
Dant
sis e
t al.,
20
10
Fa
rm, r
egio
nal
Yes
Dant
sis e
t al.
(201
0)
Econ
omic
, En
viro
nmen
tal,
Soci
al
Plan
t pr
oduc
tion
Yes /
No
Unk
now
n
14
DIAG
E DI
Agno
stic
Glo
bal d
’Exp
loita
tion
Farm
N
o w
ww
.coo
pera
tion-
agric
ole.
asso
.fr/s
ites/
saf/
guid
e/fic
hes/
met
hode
s_ev
alu
atio
n_sy
stem
e_in
divi
duel
les/
diag
e.as
px
Envi
ronm
enta
l U
nive
rsal
Ye
s / N
o Fr
ench
15
DIAL
ECTE
DI
Agno
stic
Lia
nt E
nviro
nnem
ent
et C
ontr
at T
errit
oria
l d'
Expl
oita
tion
Farm
N
o ht
tp:/
/dia
lect
e.so
lagr
o. o
rg/
Envi
ronm
enta
l U
nive
rsal
Ye
s / N
o Fr
ench
16
DIAL
OGU
E Di
agno
stic
agr
i-en
viro
nnem
enta
l glo
bal
d'ex
ploi
tatio
n
Farm
N
o w
ww
.sol
agro
.org
/site
/im_u
ser/
014p
laqu
ette
_dia
logu
e.pd
f
Envi
ronm
enta
l U
nive
rsal
Ye
s / N
o Fr
ench
17
DLG
DLG
- Zer
tifik
at N
achh
altig
e La
ndw
irtsc
haft
Fa
rm
No
ww
w.n
achh
altig
e-la
ndw
irtsc
haft
.info
Ec
onom
ic,
Envi
ronm
enta
l, So
cial
Uni
vers
al
Yes /
No
Germ
an
18
DSI
Dairy
man
Sus
tain
abili
ty In
dex
Farm
Ye
s El
saes
ser e
t al.
(201
5)
Econ
omic
, En
viro
nmen
tal,
Soci
al
Dairy
Ye
s / Y
es
Engl
ish
19
DSR
Driv
ing
Forc
e St
ate
Resp
onse
Re
gion
al
No
OEC
D (2
001)
Ec
onom
ic,
Envi
ronm
enta
l, So
cial
Uni
vers
al
Yes /
Yes
En
glish
20
EF
Ecol
ogic
al F
ootp
rint
Farm
, pro
duct
, lo
cal,
regi
onal
Ye
s W
acke
rnag
el e
t al.
(199
9)
Envi
ronm
enta
l U
nive
rsal
Ye
s / Y
es
Engl
ish
21
EMA
Envi
ronm
enta
l man
agem
ent f
or
agric
ultu
re
Farm
Ye
s Le
wis
and
Bard
on (1
998)
En
viro
nmen
tal
Uni
vers
al
Yes /
No
Engl
ish
22
EP
Ecop
oint
s Fa
rm
No
ww
w.o
ekop
unkt
e.at
En
viro
nmen
tal
Uni
vers
al
Yes /
No
Germ
an
23
FARM
SMAR
T
Farm
Ye
s Tz
iliva
kis a
nd L
ewis
(200
4)
Econ
omic
, En
viro
nmen
tal,
Soci
al
Uni
vers
al
Yes /
No
Engl
ish
24
Fiel
d Pr
int
Calc
ulat
or
Fa
rm
No
ww
w.fi
eldt
omar
ket.o
rg
Econ
omic
, En
viro
nmen
tal,
Soci
al
Arab
le
farm
ing
Yes /
No
Engl
ish
25
GA
Gree
n Ac
coun
ts fo
r Far
ms
Farm
N
o w
ww
.land
brug
sinfo
.dk/
milj
oe/n
atur
-og-
area
lforv
altn
ing/
tilsk
udso
rdni
nger
/gro
enne
-reg
nska
ber
Envi
ronm
enta
l U
nive
rsal
Ye
s / Y
es
Dani
sh
26
IDEA
In
dica
teur
de
Dura
bilit
é de
s Ex
ploi
tatio
ns A
gric
oles
Fa
rm
Yes
Zahm
et a
l. (2
008)
Ec
onom
ic,
Envi
ronm
enta
l, So
cial
Uni
vers
al
Yes /
Yes
Fr
ench
, Eng
lish
27
IFSC
Ill
inoi
s Far
m S
usta
inab
ility
Ca
lcul
ator
Fa
rm
No
ww
w.id
eals.
illin
ois.
edu/
han
dle/
2142
/134
58
Envi
ronm
enta
l, Ec
onom
ic
Uni
vers
al
No
/ No
Engl
ish
28
INDI
GO®
Fa
rm
Yes
Thio
llet-
Scho
ltus a
nd
Bock
stal
ler (
2014
) En
viro
nmen
tal
Crop
pr
oduc
tion;
vi
ticul
ture
Yes /
No
Fren
ch
29
ISAP
In
dica
tor o
f Sus
tain
able
Ag
ricul
tura
l Pra
ctic
e Fa
rm
Yes
Rigb
y et
al.
(200
1)
Econ
omic
, En
viro
nmen
tal,
Soci
al
Hort
icul
ture
Ye
s / N
o En
glish
30
KSN
L Kr
iterie
nsys
tem
Nac
hhal
tige
Land
wirt
scha
ft
Farm
N
o Br
eits
chuh
(200
9)
Econ
omic
, En
viro
nmen
tal,
Soci
al
Uni
vers
al
Yes /
No
Germ
an
31
LCA
Life
Cyc
le A
sses
smen
t Pr
oduc
t Ye
s E.
g. H
aas e
t al.
(200
0)
Envi
ronm
enta
l U
nive
rsal
Ye
s / Y
es
Mul
tiple
32
MES
MIS
Fr
amew
ork
for A
sses
sing
the
Sust
aina
bilit
y of
Nat
ural
Re
sour
ce M
anag
emen
t Sys
tem
s
Farm
, loc
al
Yes
Lópe
z-Ri
daur
a et
al.
(200
2);
Spee
lman
et a
l. (2
007)
Ec
onom
ic,
Envi
ronm
enta
l, So
cial
Smal
lhol
der
No
/ No
Engl
ish, S
pani
sh
33
MM
F M
ultis
cale
Met
hodo
logi
cal
Fram
ewor
k Fa
rm, l
ocal
, re
gion
al
Yes
Lopé
z-Ri
daur
a et
al.
(200
5)
Econ
omic
, En
viro
nmen
tal,
Soci
al
Smal
lhol
der
No
/ No
Unk
now
n
Chapter 3
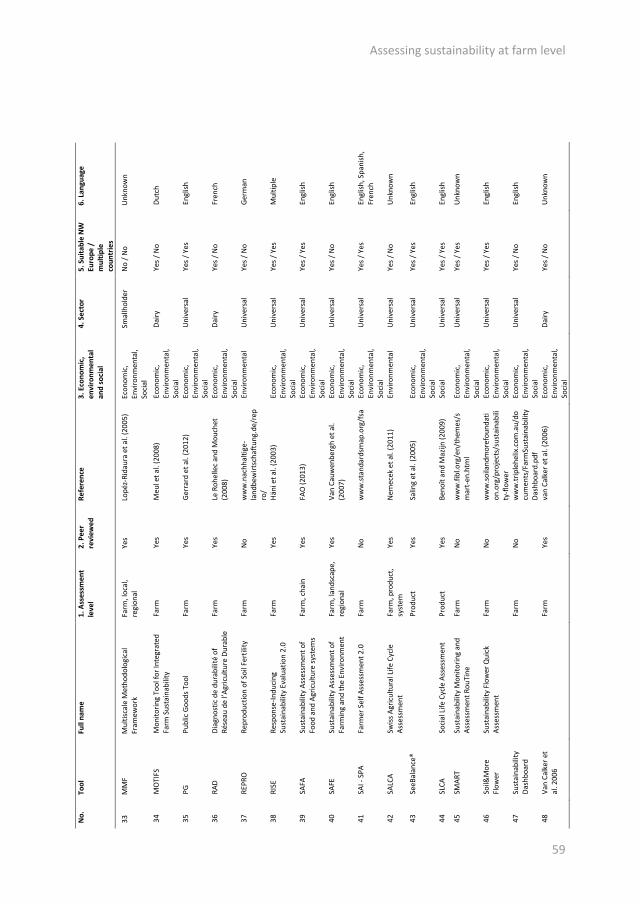
59
34
MO
TIFS
M
onito
ring
Tool
for I
nteg
rate
d Fa
rm S
usta
inab
ility
Fa
rm
Yes
Meu
l et a
l. (2
008)
Ec
onom
ic,
Envi
ronm
enta
l, So
cial
Dairy
Ye
s / N
o Du
tch
35
PG
Publ
ic G
oods
Too
l Fa
rm
Yes
Gerr
ard
et a
l. (2
012)
Ec
onom
ic,
Envi
ronm
enta
l, So
cial
Uni
vers
al
Yes /
Yes
En
glish
36
RAD
Diag
nost
ic d
e du
rabi
lité
of
Rése
au d
e l’A
gric
ultu
re D
urab
le
Farm
Ye
s Le
Roh
elle
c an
d M
ouch
et
(200
8)
Econ
omic
, En
viro
nmen
tal,
Soci
al
Dairy
Ye
s / N
o Fr
ench
37
REPR
O
Repr
oduc
tion
of S
oil F
ertil
ity
Farm
N
o w
ww
.nac
hhal
tige-
land
bew
irtsc
haftu
ng.d
e/re
pro
/
Envi
ronm
enta
l U
nive
rsal
Ye
s / N
o Ge
rman
38
RISE
Re
spon
se-In
duci
ng
Sust
aina
bilit
y Ev
alua
tion
2.0
Farm
Ye
s Hä
ni e
t al.
(200
3)
Econ
omic
, En
viro
nmen
tal,
Soci
al
Uni
vers
al
Yes /
Yes
M
ultip
le
39
SAFA
Su
stai
nabi
lity
Asse
ssm
ent o
f Fo
od a
nd A
gric
ultu
re sy
stem
s Fa
rm, c
hain
Ye
s FA
O (2
013)
Ec
onom
ic,
Envi
ronm
enta
l, So
cial
Uni
vers
al
Yes /
Yes
En
glish
40
SAFE
Su
stai
nabi
lity
Asse
ssm
ent o
f Fa
rmin
g an
d th
e En
viro
nmen
t Fa
rm, l
ands
cape
, re
gion
al
Yes
Van
Cauw
enbe
rgh
et a
l. (2
007)
Ec
onom
ic,
Envi
ronm
enta
l, So
cial
Uni
vers
al
Yes /
No
Engl
ish
41
SAI -
SPA
Fa
rmer
Sel
f Ass
essm
ent 2
.0
Farm
N
o w
ww
.sta
ndar
dsm
ap.o
rg/f
sa
Econ
omic
, En
viro
nmen
tal,
Soci
al
Uni
vers
al
Yes /
Yes
En
glish
, Spa
nish
, Fr
ench
42
SALC
A Sw
iss A
gric
ultu
ral L
ife C
ycle
As
sess
men
t Fa
rm, p
rodu
ct,
syst
em
Yes
Nem
ecek
et a
l. (2
011)
En
viro
nmen
tal
Uni
vers
al
Yes /
No
Unk
now
n
43
SeeB
alan
ce®
Pr
oduc
t Ye
s Sa
ling
et a
l. (2
005)
Ec
onom
ic,
Envi
ronm
enta
l, So
cial
Uni
vers
al
Yes /
Yes
En
glish
44
SLCA
So
cial
Life
Cyc
le A
sses
smen
t Pr
oduc
t Ye
s Be
noît
and
Maz
ijn (2
009)
So
cial
U
nive
rsal
Ye
s / Y
es
Engl
ish
45
SMAR
T Su
stai
nabi
lity
Mon
itorin
g an
d As
sess
men
t Rou
Tine
Fa
rm
No
ww
w.fi
bl.o
rg/e
n/th
emes
/sm
art-
en.h
tml
Econ
omic
, En
viro
nmen
tal,
Soci
al
Uni
vers
al
Yes /
Yes
U
nkno
wn
46
Soil&
Mor
e Fl
ower
Su
stai
nabi
lity
Flow
er Q
uick
As
sess
men
t Fa
rm
No
ww
w.s
oila
ndm
oref
ound
ati
on.o
rg/p
roje
cts/
sust
aina
bili
ty-fl
ower
Econ
omic
, En
viro
nmen
tal,
Soci
al
Uni
vers
al
Yes /
Yes
En
glish
47
Sust
aina
bilit
y Da
shbo
ard
Fa
rm
No
ww
w.tr
iple
helix
.com
.au/
docu
men
ts/F
arm
Sust
aina
bilit
yDa
shbo
ard.
Econ
omic
, En
viro
nmen
tal,
Soci
al
Uni
vers
al
Yes /
No
Engl
ish
48
Van
Calk
er e
t al
. 200
6
Farm
Ye
s va
n Ca
lker
et a
l. (2
006)
Ec
onom
ic,
Envi
ronm
enta
l, So
cial
Dairy
Ye
s / N
o U
nkno
wn
No.
To
ol
Full
nam
e 1.
Ass
essm
ent
leve
l 2.
Pee
r re
view
ed
Refe
renc
e
3. E
cono
mic
, en
viro
nmen
tal
and
soci
al
4. S
ecto
r 5.
Sui
tabl
e N
W
Euro
pe /
m
ultip
le
coun
trie
s
6. L
angu
age
1 AE
MBA
C Eu
rope
an A
naly
tical
Fra
mew
ork
for t
he D
evel
opm
ent o
f Loc
al
Agri-
Envi
ronm
enta
l Pr
ogra
mm
es
Land
scap
e Ye
s Ba
stia
n et
al.
(200
7);
Sim
onci
ni (2
009)
En
viro
nmen
tal
Uni
vers
al
Yes /
Yes
En
glish
2 AE
SIS
Agro
-Env
ironm
enta
l Su
stai
nabi
lity
Info
rmat
ion
Syst
em
Farm
Ye
s Pa
cini
et a
l. (2
009)
; Pac
ini
et a
l. (2
011)
En
viro
nmen
tal
Uni
vers
al
Yes /
No
Unk
now
n
3 Ag
ro-E
co-In
dex
Fa
rm
Yes
Vigl
izzo
et a
l. (2
006)
En
viro
nmen
tal
Uni
vers
al
No
/ No
Span
ish
4 AN
CA
Annu
al N
utrie
nt C
ycle
As
sess
men
t Fa
rm
Yes
Aart
s et a
l. (2
015)
En
viro
nmen
tal
Dairy
Ye
s / N
o Du
tch
5 AP
OIA
-NO
VO
RURA
L
Farm
Ye
s Ro
drig
ues e
t al.
(201
0)
Econ
omic
, En
viro
nmen
tal,
Soci
al
Uni
vers
al
No
/ Yes
Po
rtug
uese
6 AR
BRE
Arbr
e de
l’Ex
ploi
tatio
n Ag
ricol
e Du
rabl
e Fa
rm
No
Perv
anch
on (2
004)
Ec
onom
ic,
Envi
ronm
enta
l, So
cial
Uni
vers
al
Yes /
No
Fren
ch
7 AU
I Ag
raru
mw
eltin
dika
tore
n Fa
rm
No
ww
w.b
lw.a
dmin
.ch
Envi
ronm
enta
l U
nive
rsal
Ye
s / N
o Ge
rman
8 Av
ibio
AV
Icul
ture
BIO
logi
que
Farm
, cha
in
Yes
Pott
iez e
t al.
(201
2)
Econ
omic
, En
viro
nmen
tal,
Soci
al
Poul
try
Yes /
No
Unk
now
n
9 BR
OA
Biod
iver
sity
Risk
and
O
ppor
tuni
ty A
sses
smen
t La
ndsc
ape
No
ww
w.b
atbi
odiv
ersit
y.or
g/br
oa
Envi
ronm
enta
l U
nive
rsal
Ye
s / Y
es
Engl
ish
10
COSA
Co
mm
ittee
On
Sust
aina
bilit
y As
sess
men
t Fa
rm
Yes
COSA
(201
3)
Econ
omic
, En
viro
nmen
tal,
Soci
al
Coffe
e an
d ca
cao
No
/ Yes
M
ultip
le
11
Cote
ur e
t al.,
20
14
Fa
rm
Yes
Cote
ur e
t al.
(201
4)
Econ
omic
, En
viro
nmen
tal,
Soci
al
Frui
t, ar
able
, gr
eenh
ouse
pr
oduc
tion
Yes /
No
Dutc
h
12
Dairy
SAT
Dairy
Sel
f-Ass
essm
ent T
ool
Farm
N
o w
ww
.dai
rysa
t.com
.au
Envi
ronm
enta
l Da
iry
Yes /
No
Engl
ish
13
Dant
sis e
t al.,
20
10
Fa
rm, r
egio
nal
Yes
Dant
sis e
t al.
(201
0)
Econ
omic
, En
viro
nmen
tal,
Soci
al
Plan
t pr
oduc
tion
Yes /
No
Unk
now
n
14
DIAG
E DI
Agno
stic
Glo
bal d
’Exp
loita
tion
Farm
N
o w
ww
.coo
pera
tion-
agric
ole.
asso
.fr/s
ites/
saf/
guid
e/fic
hes/
met
hode
s_ev
alu
atio
n_sy
stem
e_in
divi
duel
les/
diag
e.as
px
Envi
ronm
enta
l U
nive
rsal
Ye
s / N
o Fr
ench
15
DIAL
ECTE
DI
Agno
stic
Lia
nt E
nviro
nnem
ent
et C
ontr
at T
errit
oria
l d'
Expl
oita
tion
Farm
N
o ht
tp:/
/dia
lect
e.so
lagr
o. o
rg/
Envi
ronm
enta
l U
nive
rsal
Ye
s / N
o Fr
ench
16
DIAL
OGU
E Di
agno
stic
agr
i-en
viro
nnem
enta
l glo
bal
d'ex
ploi
tatio
n
Farm
N
o w
ww
.sol
agro
.org
/site
/im_u
ser/
014p
laqu
ette
_dia
logu
e.pd
f
Envi
ronm
enta
l U
nive
rsal
Ye
s / N
o Fr
ench
17
DLG
DLG
- Zer
tifik
at N
achh
altig
e La
ndw
irtsc
haft
Fa
rm
No
ww
w.n
achh
altig
e-la
ndw
irtsc
haft
.info
Ec
onom
ic,
Envi
ronm
enta
l, So
cial
Uni
vers
al
Yes /
No
Germ
an
18
DSI
Dairy
man
Sus
tain
abili
ty In
dex
Farm
Ye
s El
saes
ser e
t al.
(201
5)
Econ
omic
, En
viro
nmen
tal,
Soci
al
Dairy
Ye
s / Y
es
Engl
ish
19
DSR
Driv
ing
Forc
e St
ate
Resp
onse
Re
gion
al
No
OEC
D (2
001)
Ec
onom
ic,
Envi
ronm
enta
l, So
cial
Uni
vers
al
Yes /
Yes
En
glish
20
EF
Ecol
ogic
al F
ootp
rint
Farm
, pro
duct
, lo
cal,
regi
onal
Ye
s W
acke
rnag
el e
t al.
(199
9)
Envi
ronm
enta
l U
nive
rsal
Ye
s / Y
es
Engl
ish
21
EMA
Envi
ronm
enta
l man
agem
ent f
or
agric
ultu
re
Farm
Ye
s Le
wis
and
Bard
on (1
998)
En
viro
nmen
tal
Uni
vers
al
Yes /
No
Engl
ish
22
EP
Ecop
oint
s Fa
rm
No
ww
w.o
ekop
unkt
e.at
En
viro
nmen
tal
Uni
vers
al
Yes /
No
Germ
an
23
FARM
SMAR
T
Farm
Ye
s Tz
iliva
kis a
nd L
ewis
(200
4)
Econ
omic
, En
viro
nmen
tal,
Soci
al
Uni
vers
al
Yes /
No
Engl
ish
24
Fiel
d Pr
int
Calc
ulat
or
Fa
rm
No
ww
w.fi
eldt
omar
ket.o
rg
Econ
omic
, En
viro
nmen
tal,
Soci
al
Arab
le
farm
ing
Yes /
No
Engl
ish
25
GA
Gree
n Ac
coun
ts fo
r Far
ms
Farm
N
o w
ww
.land
brug
sinfo
.dk/
milj
oe/n
atur
-og-
area
lforv
altn
ing/
tilsk
udso
rdni
nger
/gro
enne
-reg
nska
ber
Envi
ronm
enta
l U
nive
rsal
Ye
s / Y
es
Dani
sh
26
IDEA
In
dica
teur
de
Dura
bilit
é de
s Ex
ploi
tatio
ns A
gric
oles
Fa
rm
Yes
Zahm
et a
l. (2
008)
Ec
onom
ic,
Envi
ronm
enta
l, So
cial
Uni
vers
al
Yes /
Yes
Fr
ench
, Eng
lish
27
IFSC
Ill
inoi
s Far
m S
usta
inab
ility
Ca
lcul
ator
Fa
rm
No
ww
w.id
eals.
illin
ois.
edu/
han
dle/
2142
/134
58
Envi
ronm
enta
l, Ec
onom
ic
Uni
vers
al
No
/ No
Engl
ish
28
INDI
GO®
Fa
rm
Yes
Thio
llet-
Scho
ltus a
nd
Bock
stal
ler (
2014
) En
viro
nmen
tal
Crop
pr
oduc
tion;
vi
ticul
ture
Yes /
No
Fren
ch
29
ISAP
In
dica
tor o
f Sus
tain
able
Ag
ricul
tura
l Pra
ctic
e Fa
rm
Yes
Rigb
y et
al.
(200
1)
Econ
omic
, En
viro
nmen
tal,
Soci
al
Hort
icul
ture
Ye
s / N
o En
glish
30
KSN
L Kr
iterie
nsys
tem
Nac
hhal
tige
Land
wirt
scha
ft
Farm
N
o Br
eits
chuh
(200
9)
Econ
omic
, En
viro
nmen
tal,
Soci
al
Uni
vers
al
Yes /
No
Germ
an
31
LCA
Life
Cyc
le A
sses
smen
t Pr
oduc
t Ye
s E.
g. H
aas e
t al.
(200
0)
Envi
ronm
enta
l U
nive
rsal
Ye
s / Y
es
Mul
tiple
32
MES
MIS
Fr
amew
ork
for A
sses
sing
the
Sust
aina
bilit
y of
Nat
ural
Re
sour
ce M
anag
emen
t Sys
tem
s
Farm
, loc
al
Yes
Lópe
z-Ri
daur
a et
al.
(200
2);
Spee
lman
et a
l. (2
007)
Ec
onom
ic,
Envi
ronm
enta
l, So
cial
Smal
lhol
der
No
/ No
Engl
ish, S
pani
sh
33
MM
F M
ultis
cale
Met
hodo
logi
cal
Fram
ewor
k Fa
rm, l
ocal
, re
gion
al
Yes
Lopé
z-Ri
daur
a et
al.
(200
5)
Econ
omic
, En
viro
nmen
tal,
Soci
al
Smal
lhol
der
No
/ No
Unk
now
n
Assessing sustainability at farm level
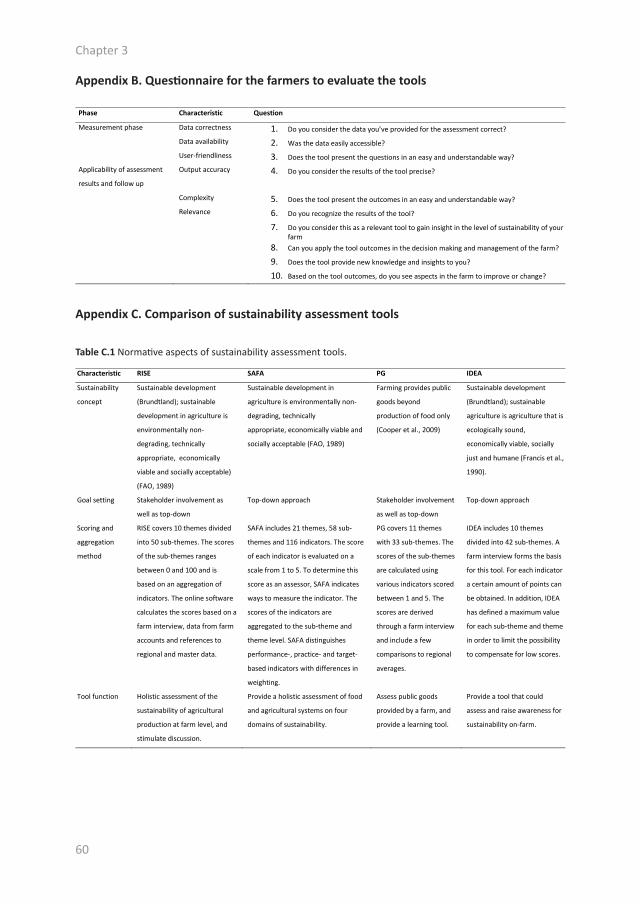
60
Appendix B. Questionnaire for the farmers to evaluate the tools
Phase Characteristic Question
Measurement phase Data correctness 1. Do you consider the data you’ve provided for the assessment correct? Data availability 2. Was the data easily accessible? User-friendliness 3. Does the tool present the questions in an easy and understandable way? Applicability of assessment
results and follow up
Output accuracy 4. Do you consider the results of the tool precise?
Complexity 5. Does the tool present the outcomes in an easy and understandable way? Relevance 6. Do you recognize the results of the tool? 7. Do you consider this as a relevant tool to gain insight in the level of sustainability of your
farm 8. Can you apply the tool outcomes in the decision making and management of the farm? 9. Does the tool provide new knowledge and insights to you? 10. Based on the tool outcomes, do you see aspects in the farm to improve or change?
Appendix C. Comparison of sustainability assessment tools
Table C.1 Normative aspects of sustainability assessment tools.
Characteristic RISE SAFA PG IDEA
Sustainability
concept
Sustainable development
(Brundtland); sustainable
development in agriculture is
environmentally non-
degrading, technically
appropriate, economically
viable and socially acceptable)
(FAO, 1989)
Sustainable development in
agriculture is environmentally non-
degrading, technically
appropriate, economically viable and
socially acceptable (FAO, 1989)
Farming provides public
goods beyond
production of food only
(Cooper et al., 2009)
Sustainable development
(Brundtland); sustainable
agriculture is agriculture that is
ecologically sound,
economically viable, socially
just and humane (Francis et al.,
1990).
Goal setting Stakeholder involvement as
well as top-down
Top-down approach Stakeholder involvement
as well as top-down
Top-down approach
Scoring and
aggregation
method
RISE covers 10 themes divided
into 50 sub-themes. The scores
of the sub-themes ranges
between 0 and 100 and is
based on an aggregation of
indicators. The online software
calculates the scores based on a
farm interview, data from farm
accounts and references to
regional and master data.
SAFA includes 21 themes, 58 sub-
themes and 116 indicators. The score
of each indicator is evaluated on a
scale from 1 to 5. To determine this
score as an assessor, SAFA indicates
ways to measure the indicator. The
scores of the indicators are
aggregated to the sub-theme and
theme level. SAFA distinguishes
performance-, practice- and target-
based indicators with differences in
weighting.
PG covers 11 themes
with 33 sub-themes. The
scores of the sub-themes
are calculated using
various indicators scored
between 1 and 5. The
scores are derived
through a farm interview
and include a few
comparisons to regional
averages.
IDEA includes 10 themes
divided into 42 sub-themes. A
farm interview forms the basis
for this tool. For each indicator
a certain amount of points can
be obtained. In addition, IDEA
has defined a maximum value
for each sub-theme and theme
in order to limit the possibility
to compensate for low scores.
Tool function Holistic assessment of the
sustainability of agricultural
production at farm level, and
stimulate discussion.
Provide a holistic assessment of food
and agricultural systems on four
domains of sustainability.
Assess public goods
provided by a farm, and
provide a learning tool.
Provide a tool that could
assess and raise awareness for
sustainability on-farm.
Chapter 3

61
Table C.2 Systemic aspects of sustainability assessment tools.
Table C.3 Procedural aspects of sustainability assessment tools. The comparison of the procedural aspects is based on the experiences of the assessor and the results of the questionnaire. The results of the questionnaire are presented in Likert scores given by the farmers for each question (farmer 1-2-3-4-5).
Characteristic RISE SAFA PG IDEA
Simplicity Implicit goal, as it aims
to support farmers and
advisors in sustainable
development
Implicit goal, as it aims to
develop a shared and
understandable way to
communicate about
sustainability in agriculture
Explicit goal mentioned in
Gerrard et al. (2011)
Implicit goal from the
commissioner as it should
be accessible to many
Sufficiency (complexity) Explicit goal as the tool
aims to provide a
holistic approach
Explicit goal to address the
complexity and relationships
of all dimensions of
sustainability
Implicit goal as the tool aims
to cover a wide range of public
goods
Explicit goal as the tool
aims to provide a holistic
approach
Indicator interaction Not explicit Not explicit Not explicit Not explicit
Phase Characteristic RISE SAFA PG IDEA
Preparatory phase Plan farm visit and
discuss required data,
start filling in farm data
in software
Plan visit, describe the
assessed entities,
boundaries and supply
chain
Plan farm visit Plan farm visit and
prepare necessary
documentation
Preparation time 02:10 00:15 00:50 01:10
Phase of indicator
selection
Not included: A standard
set of indicators is used
Included:
Contextualization of
the tool involves
listing relevant sub-
themes and indicators
Not included: A
standard set of
indicators is used
Not included: A standard
set of indicators is used
Measurement
phase
Data correctness High, due to data input
from accountancy and
management system
Moderate, due to
influence of farmers'
perception and the
austerity of the
assessor
Moderate, due to
influence of farmers'
perception
Moderate, due to
influence of farmers'
perception
1. Do you consider the
data you’ve provided for
the assessment correct?
4-4-4-5-4 5-4-4-5-4 4-4-4-5-3 4-5-4-5-4
Data availability Good, data is available
from farm accounts,
management system
and through interviews
Moderate, depending
on the desired level of
data quality. Part of
the data can be
retrieved from farm
accounts, analysis and
through interviews.
Yet, high quality data
requires additional
analyses.
Good, data is available
from farm accounts,
management system
and through
interviews
Good, data is available
from farm accounts,
management system
and through interviews
2. Is the data easily
accessible?
5-4-4-5-4 5-4-4-5-4 4-4-4-5-3 5-4-4-5-4
User-friendliness
Understanding the tool High time investment
due to required training,
and time needed to get
familiar with the
questions and to
understand the
calculations. In addition,
regional reference data
has to be put in the
database.
Moderate time
investment due
comprehensive
assessment guidelines
and time needed to
get familiar with the
questions
Limited time
investment to
understand the tool.
Limited time investment
to understand the tool
and manual
Assessing sustainability at farm level
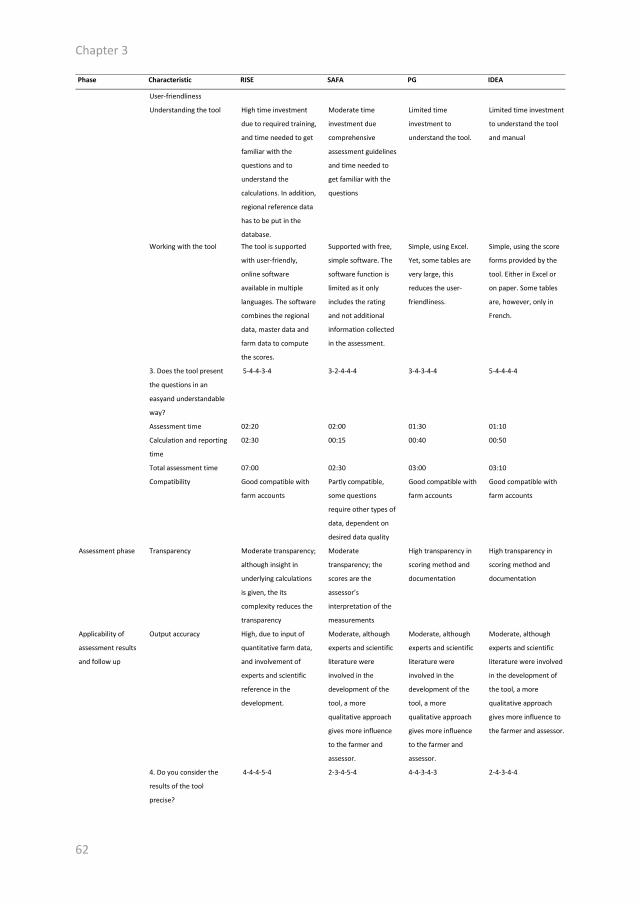
62
Phase Characteristic RISE SAFA PG IDEA
Preparatory phase Plan farm visit and
discuss required data,
start filling in farm data
in software
Plan visit, describe the
assessed entities,
boundaries and supply
chain
Plan farm visit Plan farm visit and
prepare necessary
documentation
Preparation time 02:10 00:15 00:50 01:10
Phase of indicator
selection
Not included: A standard
set of indicators is used
Included:
Contextualization of
the tool involves
listing relevant sub-
themes and indicators
Not included: A
standard set of
indicators is used
Not included: A standard
set of indicators is used
Measurement
phase
Data correctness High, due to data input
from accountancy and
management system
Moderate, due to
influence of farmers'
perception and the
austerity of the
assessor
Moderate, due to
influence of farmers'
perception
Moderate, due to
influence of farmers'
perception
1. Do you consider the
data you’ve provided for
the assessment correct?
4-4-4-5-4 5-4-4-5-4 4-4-4-5-3 4-5-4-5-4
Data availability Good, data is available
from farm accounts,
management system
and through interviews
Moderate, depending
on the desired level of
data quality. Part of
the data can be
retrieved from farm
accounts, analysis and
through interviews.
Yet, high quality data
requires additional
analyses.
Good, data is available
from farm accounts,
management system
and through
interviews
Good, data is available
from farm accounts,
management system
and through interviews
2. Is the data easily
accessible?
5-4-4-5-4 5-4-4-5-4 4-4-4-5-3 5-4-4-5-4
User-friendliness
Understanding the tool High time investment
due to required training,
and time needed to get
familiar with the
questions and to
understand the
calculations. In addition,
regional reference data
has to be put in the
database.
Moderate time
investment due
comprehensive
assessment guidelines
and time needed to
get familiar with the
questions
Limited time
investment to
understand the tool.
Limited time investment
to understand the tool
and manual
Working with the tool The tool is supported
with user-friendly,
online software
available in multiple
languages. The software
combines the regional
data, master data and
farm data to compute
the scores.
Supported with free,
simple software. The
software function is
limited as it only
includes the rating
and not additional
information collected
in the assessment.
Simple, using Excel.
Yet, some tables are
very large, this
reduces the user-
friendliness.
Simple, using the score
forms provided by the
tool. Either in Excel or
on paper. Some tables
are, however, only in
French.
3. Does the tool present
the questions in an
easyand understandable
way?
5-4-4-3-4 3-2-4-4-4 3-4-3-4-4 5-4-4-4-4
Assessment time 02:20 02:00 01:30 01:10
Calculation and reporting
time
02:30 00:15 00:40 00:50
Total assessment time 07:00 02:30 03:00 03:10
Compatibility Good compatible with
farm accounts
Partly compatible,
some questions
require other types of
data, dependent on
desired data quality
Good compatible with
farm accounts
Good compatible with
farm accounts
Assessment phase Transparency Moderate transparency;
although insight in
underlying calculations
is given, the its
complexity reduces the
transparency
Moderate
transparency; the
scores are the
assessor’s
interpretation of the
measurements
High transparency in
scoring method and
documentation
High transparency in
scoring method and
documentation
Applicability of
assessment results
and follow up
Output accuracy High, due to input of
quantitative farm data,
and involvement of
experts and scientific
reference in the
development.
Moderate, although
experts and scientific
literature were
involved in the
development of the
tool, a more
qualitative approach
gives more influence
to the farmer and
assessor.
Moderate, although
experts and scientific
literature were
involved in the
development of the
tool, a more
qualitative approach
gives more influence
to the farmer and
assessor.
Moderate, although
experts and scientific
literature were involved
in the development of
the tool, a more
qualitative approach
gives more influence to
the farmer and assessor.
4. Do you consider the
results of the tool
precise?
4-4-4-5-4 2-3-4-5-4 4-4-3-4-3 2-4-3-4-4
Chapter 3
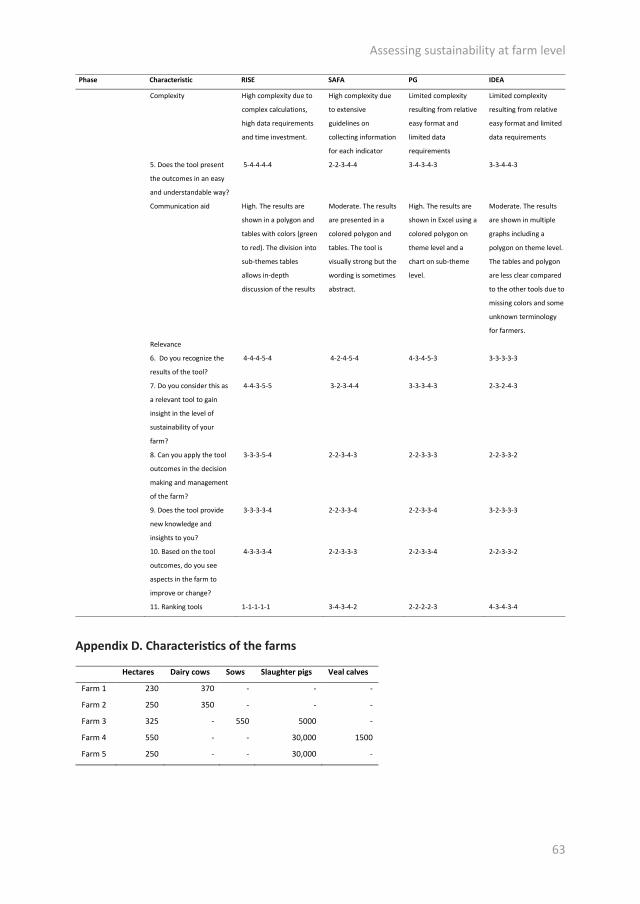
63
Hectares Dairy cows Sows Slaughter pigs Veal calves
Farm 1 230 370 - - -
Farm 2 250 350 - - -
Farm 3 325 - 550 5000 -
Farm 4 550 - - 30,000 1500
Farm 5 250 - - 30,000 -
Appendix D. Characteristics of the farms
Phase Characteristic RISE SAFA PG IDEA
Preparatory phase Plan farm visit and
discuss required data,
start filling in farm data
in software
Plan visit, describe the
assessed entities,
boundaries and supply
chain
Plan farm visit Plan farm visit and
prepare necessary
documentation
Preparation time 02:10 00:15 00:50 01:10
Phase of indicator
selection
Not included: A standard
set of indicators is used
Included:
Contextualization of
the tool involves
listing relevant sub-
themes and indicators
Not included: A
standard set of
indicators is used
Not included: A standard
set of indicators is used
Measurement
phase
Data correctness High, due to data input
from accountancy and
management system
Moderate, due to
influence of farmers'
perception and the
austerity of the
assessor
Moderate, due to
influence of farmers'
perception
Moderate, due to
influence of farmers'
perception
1. Do you consider the
data you’ve provided for
the assessment correct?
4-4-4-5-4 5-4-4-5-4 4-4-4-5-3 4-5-4-5-4
Data availability Good, data is available
from farm accounts,
management system
and through interviews
Moderate, depending
on the desired level of
data quality. Part of
the data can be
retrieved from farm
accounts, analysis and
through interviews.
Yet, high quality data
requires additional
analyses.
Good, data is available
from farm accounts,
management system
and through
interviews
Good, data is available
from farm accounts,
management system
and through interviews
2. Is the data easily
accessible?
5-4-4-5-4 5-4-4-5-4 4-4-4-5-3 5-4-4-5-4
User-friendliness
Understanding the tool High time investment
due to required training,
and time needed to get
familiar with the
questions and to
understand the
calculations. In addition,
regional reference data
has to be put in the
database.
Moderate time
investment due
comprehensive
assessment guidelines
and time needed to
get familiar with the
questions
Limited time
investment to
understand the tool.
Limited time investment
to understand the tool
and manual
Complexity High complexity due to
complex calculations,
high data requirements
and time investment.
High complexity due
to extensive
guidelines on
collecting information
for each indicator
Limited complexity
resulting from relative
easy format and
limited data
requirements
Limited complexity
resulting from relative
easy format and limited
data requirements
5. Does the tool present
the outcomes in an easy
and understandable way?
5-4-4-4-4 2-2-3-4-4 3-4-3-4-3 3-3-4-4-3
Communication aid High. The results are
shown in a polygon and
tables with colors (green
to red). The division into
sub-themes tables
allows in-depth
discussion of the results
Moderate. The results
are presented in a
colored polygon and
tables. The tool is
visually strong but the
wording is sometimes
abstract.
High. The results are
shown in Excel using a
colored polygon on
theme level and a
chart on sub-theme
level.
Moderate. The results
are shown in multiple
graphs including a
polygon on theme level.
The tables and polygon
are less clear compared
to the other tools due to
missing colors and some
unknown terminology
for farmers.
Relevance
6. Do you recognize the
results of the tool?
4-4-4-5-4 4-2-4-5-4 4-3-4-5-3 3-3-3-3-3
7. Do you consider this as
a relevant tool to gain
insight in the level of
sustainability of your
farm?
4-4-3-5-5 3-2-3-4-4 3-3-3-4-3 2-3-2-4-3
8. Can you apply the tool
outcomes in the decision
making and management
of the farm?
3-3-3-5-4 2-2-3-4-3 2-2-3-3-3 2-2-3-3-2
9. Does the tool provide
new knowledge and
insights to you?
3-3-3-3-4 2-2-3-3-4 2-2-3-3-4 3-2-3-3-3
10. Based on the tool
outcomes, do you see
aspects in the farm to
improve or change?
4-3-3-3-4 2-2-3-3-3 2-2-3-3-4 2-2-3-3-2
11. Ranking tools 1-1-1-1-1 3-4-3-4-2 2-2-2-2-3 4-3-4-3-4
Assessing sustainability at farm level

64
65
Chapter 4
The choice of the sustainability assessment tool matters: differences in thematic scope and assessment resultsE.M. de Olde a,b, E.A.M. Bokkers b and I.J.M. de Boer b
a Department of Engineering, Aarhus University, Aarhus, Denmarkb Animal Production Systems Group, Wageningen University, Wageningen, the Netherlands
Published in Ecological Economics 136 (2017), 77-85DOI:10.1016/j.ecolecon.2017.02.015
66
Abstract
While the number of farm-level sustainability assessment tools is growing rapidly, concerns are raised on whether the assessment results of different tools present similar and valid conclusions about the sustainability performance of farms. In this paper we analysed the thematic scope of sustainability assessment tools, and compared assessment results from sustainability assessment tools. A coverage analysis of four tools (RISE, SAFA, PG and IDEA) demonstrated the diversity in approaches to assess sustainability at farm level. Tool developers select different (sub) themes and indicators, and apply different methods for measurement and aggregation of scores. This variability in approaches results not only in different tools, but can also result in different conclusions on the sustainability performance of farms. Decisions made in the development of a sustainability assessment tool need to be transparent to understand and explain the results of a tool and support farmers in a sustainable development of their farm. To improve the transparency in sustainability assessment tools we presented a framework describing decisions made in the development of a tool. An increased transparency in sustainability assessment tools can reduce the risk on distorted assessment results and actions, and contribute to the trust and relevance of future sustainability assessments.
Chapter 4
67
1 Introduction
A growing number of sustainability assessment tools have been created to support farmers and policy makers in developing agriculture in a sustainable way (Binder et al., 2010). Sustainability assessments are increasingly seen as an important tool toward more sustainable production. Next to the sustainability assessment of the farm’s performance, assessments tools can be used to discuss and learn, and to identify obstacles in the development toward farm sustainability (Marchand et al., 2014). Indicator-based sustainability assessment tools are generally structured using three or four hierarchical levels (Gasso et al., 2015). On the highest, most abstract level the dimensions of sustainability are presented, followed by more specific themes and subthemes, and finally, indicators. Indicators provide information on the status of a (sub)theme.
In developing sustainability assessment tools, decisions concerning what is relevant to assess, and how to assess, are based on value judgements of those involved (Gasparatos, 2010; Gasso et al., 2015; Lélé and Norgaard, 1996). Sustainability assessment tools and the indicators included (thematic scope) vary widely due to differences in value judgements, prioritizations in the selection of indicators (i.e. using selection criteria such as budget, time and data availability), spatial and temporal scales, system boundary, and target groups (Binder et al., 2010; Bockstaller et al., 2009; Schader et al., 2014). This diversity in tools results in concerns on whether the results of different tools present similar and valid conclusions about the sustainability performance of farms (Bockstaller et al., 2009). So far, comparative studies have predominantly focused on the validity of individual environmental indicators included in tools (Bockstaller et al., 2009; Galan et al., 2007; Thomassen and De Boer, 2005). Little attention has been paid to comparing the assessment results and conclusions derived from sustainability assessment tools or to similarities and differences in the thematic scope of sustainability assessment tools. If sustainability assessment tools with a similar purpose and scope (i.e. dimensions, geographical, sectoral) provide different conclusions on the sustainability performance of farms, the validity of the tools could be questioned (Bockstaller et al., 2009). This can result in a lack of trust and action to improve the sustainability at farm level (De Olde et al., 2016c). The objective of this paper is to analyse the thematic scope of sustainability assessment tools at farm level, and to compare assessment results and conclusions derived from such sustainability assessment tools. To this end, we selected sustainability assessment tools for comparison and analysed their characteristics and structure. A coverage analysis was used to compare the thematic scope of the tools and the coverage on dimension level. Next, a comparison of assessment procedures and sustainability assessment results was made. The methods used to study the different aspects of sustainability assessment tools are introduced at the start of each
The choice of the sustainability assessment tool matters
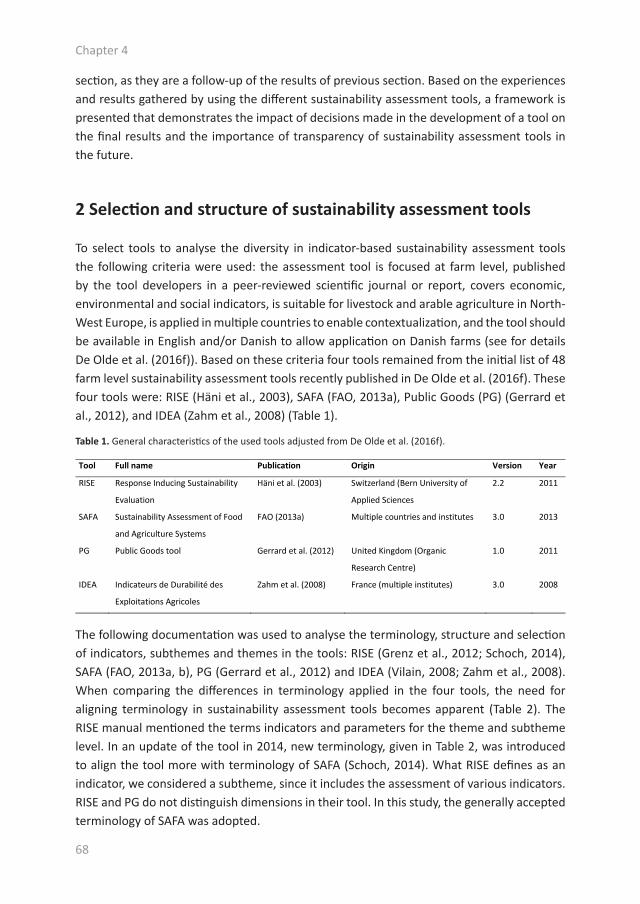
68
section, as they are a follow-up of the results of previous section. Based on the experiences and results gathered by using the different sustainability assessment tools, a framework is presented that demonstrates the impact of decisions made in the development of a tool on the final results and the importance of transparency of sustainability assessment tools in the future.
2 Selection and structure of sustainability assessment tools
To select tools to analyse the diversity in indicator-based sustainability assessment tools the following criteria were used: the assessment tool is focused at farm level, published by the tool developers in a peer-reviewed scientific journal or report, covers economic, environmental and social indicators, is suitable for livestock and arable agriculture in North-West Europe, is applied in multiple countries to enable contextualization, and the tool should be available in English and/or Danish to allow application on Danish farms (see for details De Olde et al. (2016f)). Based on these criteria four tools remained from the initial list of 48 farm level sustainability assessment tools recently published in De Olde et al. (2016f). These four tools were: RISE (Häni et al., 2003), SAFA (FAO, 2013a), Public Goods (PG) (Gerrard et al., 2012), and IDEA (Zahm et al., 2008) (Table 1).
The following documentation was used to analyse the terminology, structure and selection of indicators, subthemes and themes in the tools: RISE (Grenz et al., 2012; Schoch, 2014), SAFA (FAO, 2013a, b), PG (Gerrard et al., 2012) and IDEA (Vilain, 2008; Zahm et al., 2008). When comparing the differences in terminology applied in the four tools, the need for aligning terminology in sustainability assessment tools becomes apparent (Table 2). The RISE manual mentioned the terms indicators and parameters for the theme and subtheme level. In an update of the tool in 2014, new terminology, given in Table 2, was introduced to align the tool more with terminology of SAFA (Schoch, 2014). What RISE defines as an indicator, we considered a subtheme, since it includes the assessment of various indicators. RISE and PG do not distinguish dimensions in their tool. In this study, the generally accepted terminology of SAFA was adopted.
Tool Full name Publication Origin Version Year
RISE Response Inducing Sustainability
Evaluation
Häni et al. (2003) Switzerland (Bern University of
Applied Sciences
2.2 2011
SAFA Sustainability Assessment of Food
and Agriculture Systems
FAO (2013a) Multiple countries and institutes 3.0 2013
PG Public Goods tool Gerrard et al. (2012) United Kingdom (Organic
Research Centre)
1.0 2011
IDEA Indicateurs de Durabilité des
Exploitations Agricoles
Zahm et al. (2008) France (multiple institutes) 3.0 2008
Table 1. General characteristics of the used tools adjusted from De Olde et al. (2016f).
Chapter 4
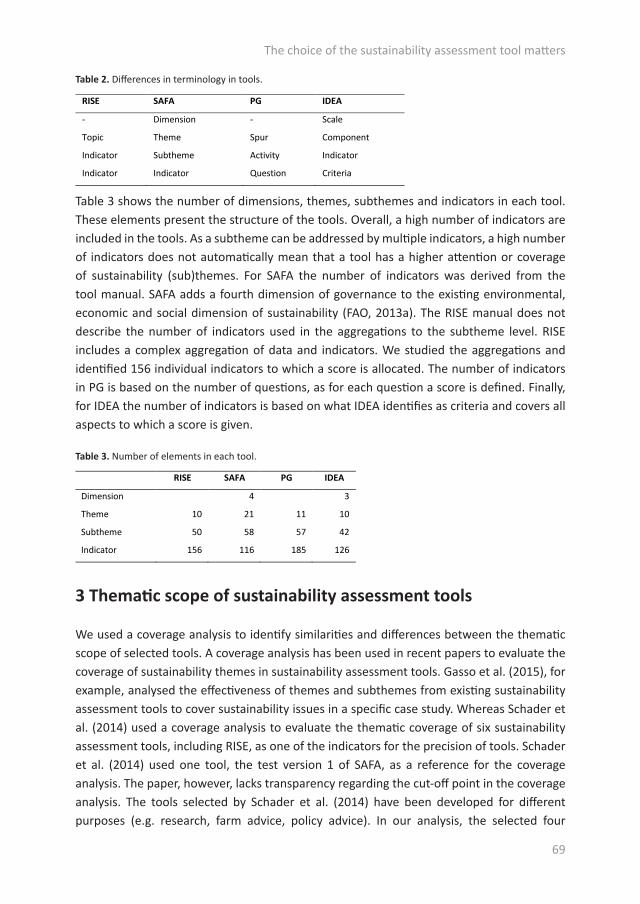
69
RISE SAFA PG IDEA
- Dimension - Scale
Topic Theme Spur Component
Indicator Subtheme Activity Indicator
Indicator Indicator Question Criteria
RISE SAFA PG IDEA
Dimension 4 3
Theme 10 21 11 10
Subtheme 50 58 57 42
Indicator 156 116 185 126
Table 2. Differences in terminology in tools.
Table 3. Number of elements in each tool.
Table 3 shows the number of dimensions, themes, subthemes and indicators in each tool. These elements present the structure of the tools. Overall, a high number of indicators are included in the tools. As a subtheme can be addressed by multiple indicators, a high number of indicators does not automatically mean that a tool has a higher attention or coverage of sustainability (sub)themes. For SAFA the number of indicators was derived from the tool manual. SAFA adds a fourth dimension of governance to the existing environmental, economic and social dimension of sustainability (FAO, 2013a). The RISE manual does not describe the number of indicators used in the aggregations to the subtheme level. RISE includes a complex aggregation of data and indicators. We studied the aggregations and identified 156 individual indicators to which a score is allocated. The number of indicators in PG is based on the number of questions, as for each question a score is defined. Finally, for IDEA the number of indicators is based on what IDEA identifies as criteria and covers all aspects to which a score is given.
3 Thematic scope of sustainability assessment tools
We used a coverage analysis to identify similarities and differences between the thematic scope of selected tools. A coverage analysis has been used in recent papers to evaluate the coverage of sustainability themes in sustainability assessment tools. Gasso et al. (2015), for example, analysed the effectiveness of themes and subthemes from existing sustainability assessment tools to cover sustainability issues in a specific case study. Whereas Schader et al. (2014) used a coverage analysis to evaluate the thematic coverage of six sustainability assessment tools, including RISE, as one of the indicators for the precision of tools. Schader et al. (2014) used one tool, the test version 1 of SAFA, as a reference for the coverage analysis. The paper, however, lacks transparency regarding the cut-off point in the coverage analysis. The tools selected by Schader et al. (2014) have been developed for different purposes (e.g. research, farm advice, policy advice). In our analysis, the selected four
The choice of the sustainability assessment tool matters
70
tools have similar characteristics (purpose, level of assessment and scope (i.e. covering environmental, economic and social dimensions) and compared all subthemes included in the four tools with each other. Similar to Schader et al. (2014) the coverage analysis focused on the subtheme level. This approach also enables a comparison of assessment results, since all tools include an aggregation of indicator scores to the subtheme level. The coverage analysis evaluated whether the content of the subthemes of one tool is also addressed in subthemes of the other tools. First, the content of a subtheme was determined based on the description of the subtheme in the tool manuals and the indicators included. For example, the subtheme ‘soil management’ in RISE includes two aspects: the loss of agricultural area in the past 10 years, and knowledge collected about soil fertility (through soil analysis, humus balance and nutrient balances). Second, the subthemes of SAFA, PG and IDEA are studied to see if these aspects are also covered in one or more subthemes in these tools. The judgement whether something is covered is qualitative. After having explored coverages of several subthemes, we decided to have three levels of coverages. A high level of coverage (++) indicated that equal to and more than 75% of the content of a subtheme was found in one or more subthemes in the other tool. A coverage below 75% of the content was considered as intermediate coverage (+). No coverage (0) indicated that 0% of the content of a subtheme was found in any of the other tools (0). For example, when both aspects of the RISE theme soil management are covered in subthemes of SAFA, the coverage is considered to be high (++). When only one aspect is covered it is considered to be an intermediate coverage (+). As a result, each subtheme of each tool received three scores to represent the coverage of the content of that subtheme in the other three tools.
3.1 Subtheme coverage of the toolsTo compare the coverage of subthemes between the tools (Table 4), the number of subthemes of tool a with a high, intermediate and no coverage in tool b were divided by the total number of subthemes of tool a (given in Table 3). For example, 80% of the subthemes used in RISE have a high coverage in SAFA, whereas 36% of the subthemes in SAFA have a high coverage in RISE. Overall, SAFA has a high coverage for the majority of subthemes included in RISE (80%), PG (58%) and IDEA (55%). The summarized coverage analysis of each subtheme is given in the supplementary material 1.
3.1.1 RISE Subthemes included in RISE are to a high degree covered by SAFA, compared to PG and IDEA. Moreover, RISE has the highest coverage of SAFA subthemes and a high level of coverage of subthemes included in PG and IDEA. RISE includes one subtheme that is not covered by any of the other tools: N and P self-sufficiency.
Chapter 4
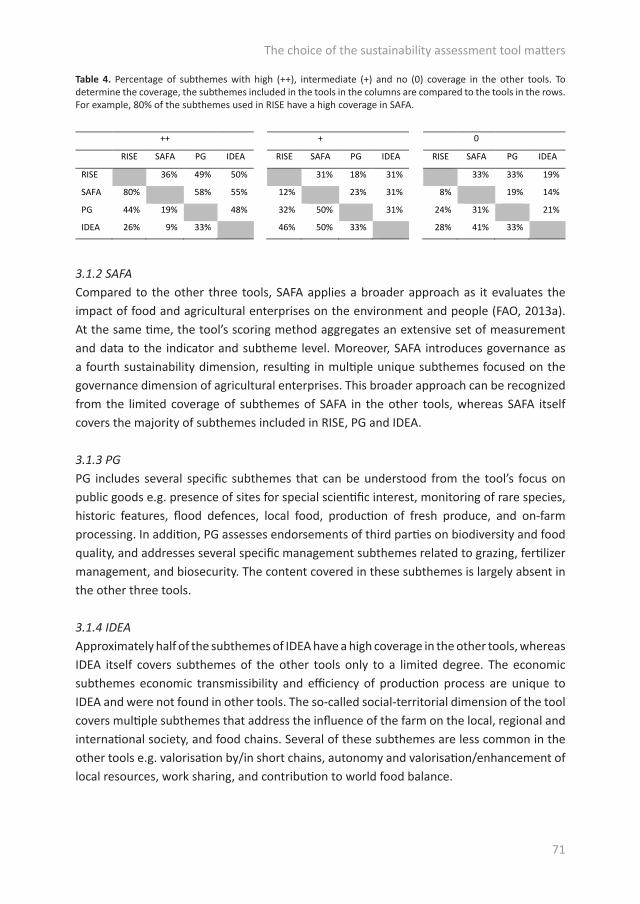
71
3.1.2 SAFACompared to the other three tools, SAFA applies a broader approach as it evaluates the impact of food and agricultural enterprises on the environment and people (FAO, 2013a). At the same time, the tool’s scoring method aggregates an extensive set of measurement and data to the indicator and subtheme level. Moreover, SAFA introduces governance as a fourth sustainability dimension, resulting in multiple unique subthemes focused on the governance dimension of agricultural enterprises. This broader approach can be recognized from the limited coverage of subthemes of SAFA in the other tools, whereas SAFA itself covers the majority of subthemes included in RISE, PG and IDEA.
3.1.3 PGPG includes several specific subthemes that can be understood from the tool’s focus on public goods e.g. presence of sites for special scientific interest, monitoring of rare species, historic features, flood defences, local food, production of fresh produce, and on-farm processing. In addition, PG assesses endorsements of third parties on biodiversity and food quality, and addresses several specific management subthemes related to grazing, fertilizer management, and biosecurity. The content covered in these subthemes is largely absent in the other three tools.
3.1.4 IDEA Approximately half of the subthemes of IDEA have a high coverage in the other tools, whereas IDEA itself covers subthemes of the other tools only to a limited degree. The economic subthemes economic transmissibility and efficiency of production process are unique to IDEA and were not found in other tools. The so-called social-territorial dimension of the tool covers multiple subthemes that address the influence of the farm on the local, regional and international society, and food chains. Several of these subthemes are less common in the other tools e.g. valorisation by/in short chains, autonomy and valorisation/enhancement of local resources, work sharing, and contribution to world food balance.
++ + 0
RISE SAFA PG IDEA RISE SAFA PG IDEA RISE SAFA PG IDEA
RISE
36% 49% 50%
31% 18% 31% 33% 33% 19%
SAFA 80%
58% 55% 12%
23% 31% 8% 19% 14%
PG 44% 19%
48% 32% 50%
31% 24% 31% 21%
IDEA 26% 9% 33%
46% 50% 33%
28% 41% 33%
Table 4. Percentage of subthemes with high (++), intermediate (+) and no (0) coverage in the other tools. To determine the coverage, the subthemes included in the tools in the columns are compared to the tools in the rows. For example, 80% of the subthemes used in RISE have a high coverage in SAFA.
The choice of the sustainability assessment tool matters

72
3.2 Subtheme coverage per dimensionThe coverage of each subtheme can be used to analyse the coverage in relation to the sustainability dimensions. This gives insight in the thematic scope of the tools and answers whether subthemes related to one dimension have a higher coverage compared to subthemes in other dimensions. Consequently, all subthemes were divided into the sustainability dimensions economic, environmental, social and governance (Table 5). Whereas subthemes in IDEA and SAFA are already divided into dimensions, PG and RISE are not. Therefore, we made a division for these two tools, following SAFA as an example. In RISE, PG and IDEA, a high variation in the number of subthemes per dimension can be observed. This, however, does not mean that the tool prioritizes one dimension over the other.
Number of subthemes per dimension RISE SAFA PG IDEA
Environmental 30 14 43 18
Economic 6 14 2 6
Social 9 16 12 18
Governance 5 14 0 0
++ + 0
RISE SAFA PG IDEA RISE SAFA PG IDEA RISE SAFA PG IDEA
Environmental 61% 45% 53% 65% 23% 48% 21% 28% 16% 7% 26% 7%
Economic 33% 7% 0% 28% 28% 76% 100% 22% 39% 17% 0% 50%
Social 37% 27% 33% 44% 48% 29% 25% 37% 15% 44% 42% 19%
Governance 27% 5% n/a n/a 40% 24% n/a n/a 33% 71% n/a n/a
Table 5. Number of subthemes per dimension
Table 6. Average coverage of subthemes per dimension with high (++), intermediate (+) and no (0) coverage per tool. For example, on average 61% of the environmental subthemes in RISE, has a high coverage in SAFA, PG and IDEA.
To compare the coverage of subthemes related to a certain sustainability dimension, the number of subthemes per dimension in tool a (Table 5) with high, intermediate and no coverage in tools b, c and d were divided by the number of subthemes per dimension of tool a. Table 6 cannot be used to draw conclusions on the quality of the tools but demonstrates differences in coverage per dimension. Table 6 presents the average coverage (i.e. average of tools b, c and d) for subthemes per dimension, per tool (i.e. tool a). For example, for the environmental subthemes included in RISE, the percentage of subthemes with high coverage was 80% in SAFA, 70% in PG and 33% in IDEA, which resulted in an average of 61% high coverage (see Table 6). Due to the aggregation, the contribution of each individual tool to the degree of coverage cannot be identified, the conclusion, however, remains the same. Overall, subthemes on the environmental dimension show the highest coverage, whereas the majority of economic subthemes have only limited coverage. The coverage of social subthemes varies for all four tools from high to no coverage. The majority of governance subthemes have a limited or no coverage.
Chapter 4

73
4 Comparison of assessment procedures and results
To compare whether the sustainability assessment tools provide similar conclusions on the sustainability performance of a farm, we focused on the assessment results at subtheme level. A comparison of tool results on indicator level was not feasible as the large differences in indicators and scoring systems result in a lack of comparable indicators with a similar unit (e.g. kg CO2 per kg product) present in all four tools. Moreover, RISE presents the assessment results only at subtheme and theme level.
4.1 Selecting a subthemeThe subthemes that can be used for comparison are limited. For example, the topic profitability is included in all tools to some degree. However, comparing the results of the subtheme of SAFA on profitability, which includes net income, cost of production and price determination, is troublesome since this content is only addressed to a limited extent in the other tools. Moreover, the related subthemes in the other tools include aspects related to profitability that are not included in SAFA. Consequently, to evaluate the degree to which assessment tools provide similar conclusions on the basis of the tool results, subthemes included in all four tools and with a high coverage had to be selected.
The coverage analysis resulted in a list of forty subthemes with a high coverage. We compared the forty subthemes to find a topic present in each of the four tools. The content of a subtheme in one tool is often divided over multiple subthemes in another tool; these subthemes, however, are not always fully covered in the other tools. As a consequence many subthemes were not suitable for comparison. Only animal welfare related subthemes were present in each tool, and with a high coverage. Although animal welfare often also includes animal health, animal health related subthemes were not fully covered in all tools, making comparison troublesome. Consequently, we selected six subthemes from the four tools related to animal welfare for comparison. A description of the subthemes, indicators and the scoring system is given in Table 7.
It is important to stress that this comparison covers only one or two subthemes of the wide variety of subthemes included in the sustainability assessment tools. A subtheme in the assessment may function as a quick check to reveal major shortcomings whereas a full assessment of, for example animal welfare, would require careful and prolonged observation of the animals (Grenz, 2016d).
The description of animal welfare related subthemes and scoring methods in Table 7 shows the diversity in approaches in sustainability assessment tools. The tools vary in the number of indicators, the aggregation of the results, assessment approach (e.g. assessment of individual animal categories versus herd level), and the explicitness of the criteria for
The choice of the sustainability assessment tool matters
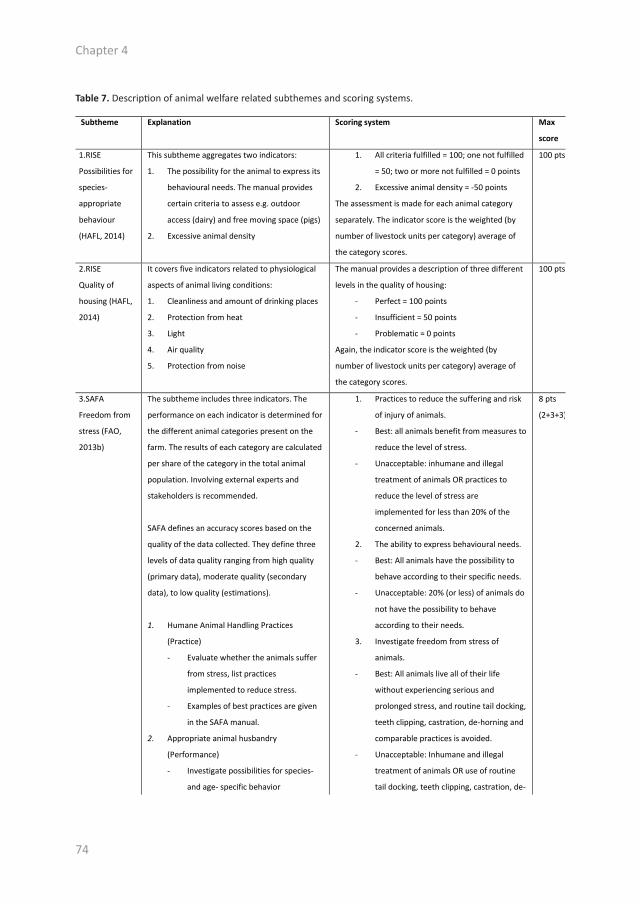
74
Subtheme Explanation Scoring system Max
score
1.RISE
Possibilities for
species-
appropriate
behaviour
(HAFL, 2014)
This subtheme aggregates two indicators:
1. The possibility for the animal to express its
behavioural needs. The manual provides
certain criteria to assess e.g. outdoor
access (dairy) and free moving space (pigs)
2. Excessive animal density
1. All criteria fulfilled = 100; one not fulfilled
= 50; two or more not fulfilled = 0 points
2. Excessive animal density = -50 points
The assessment is made for each animal category
separately. The indicator score is the weighted (by
number of livestock units per category) average of
the category scores.
100 pts
2.RISE
Quality of
housing (HAFL,
2014)
It covers five indicators related to physiological
aspects of animal living conditions:
1. Cleanliness and amount of drinking places
2. Protection from heat
3. Light
4. Air quality
5. Protection from noise
The manual provides a description of three different
levels in the quality of housing:
- Perfect = 100 points
- Insufficient = 50 points
- Problematic = 0 points
Again, the indicator score is the weighted (by
number of livestock units per category) average of
the category scores.
100 pts
3.SAFA
Freedom from
stress (FAO,
2013b)
The subtheme includes three indicators. The
performance on each indicator is determined for
the different animal categories present on the
farm. The results of each category are calculated
per share of the category in the total animal
population. Involving external experts and
stakeholders is recommended.
SAFA defines an accuracy scores based on the
quality of the data collected. They define three
levels of data quality ranging from high quality
(primary data), moderate quality (secondary
data), to low quality (estimations).
1. Humane Animal Handling Practices
(Practice)
- Evaluate whether the animals suffer
from stress, list practices
implemented to reduce stress.
- Examples of best practices are given
in the SAFA manual.
2. Appropriate animal husbandry
(Performance)
- Investigate possibilities for species-
and age- specific behavior
1. Practices to reduce the suffering and risk
of injury of animals.
- Best: all animals benefit from measures to
reduce the level of stress.
- Unacceptable: inhumane and illegal
treatment of animals OR practices to
reduce the level of stress are
implemented for less than 20% of the
concerned animals.
2. The ability to express behavioural needs.
- Best: All animals have the possibility to
behave according to their specific needs.
- Unacceptable: 20% (or less) of animals do
not have the possibility to behave
according to their needs.
3. Investigate freedom from stress of
animals.
- Best: All animals live all of their life
without experiencing serious and
prolonged stress, and routine tail docking,
teeth clipping, castration, de-horning and
comparable practices is avoided.
- Unacceptable: Inhumane and illegal
treatment of animals OR use of routine
tail docking, teeth clipping, castration, de-
8 pts
(2+3+3)
Table 7. Description of animal welfare related subthemes and scoring systems.
Chapter 4
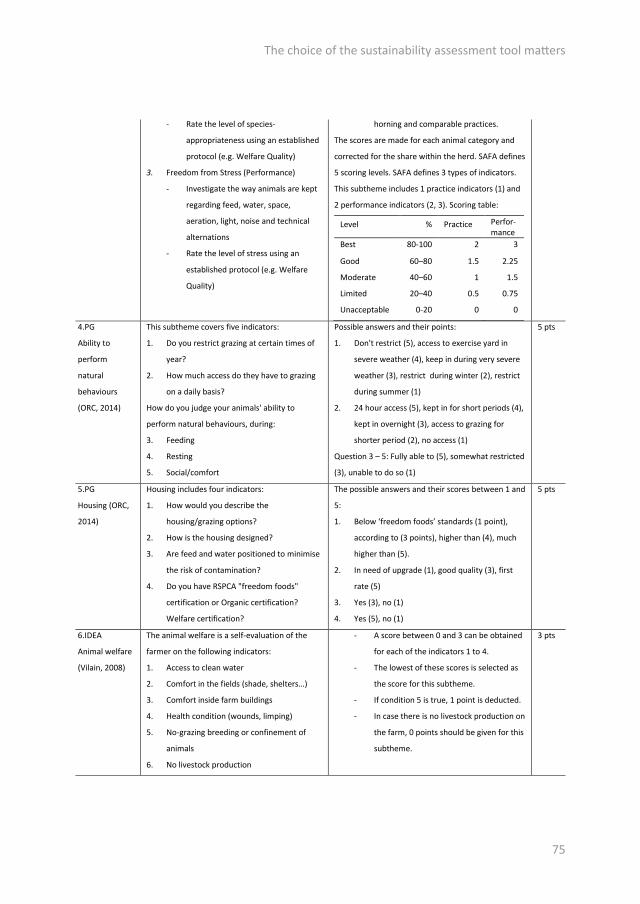
75
- Rate the level of species-
appropriateness using an established
protocol (e.g. Welfare Quality)
3. Freedom from Stress (Performance)
- Investigate the way animals are kept
regarding feed, water, space,
aeration, light, noise and technical
alternations
- Rate the level of stress using an
established protocol (e.g. Welfare
Quality)
horning and comparable practices.
The scores are made for each animal category and
corrected for the share within the herd. SAFA defines
5 scoring levels. SAFA defines 3 types of indicators.
This subtheme includes 1 practice indicators (1) and
2 performance indicators (2, 3). Scoring table:
Level % Practice Perfor-mance
Best 80-100 2 3
Good 60–80 1.5 2.25
Moderate 40–60 1 1.5
Limited 20–40 0.5 0.75
Unacceptable 0-20 0 0
4.PG
Ability to
perform
natural
behaviours
(ORC, 2014)
This subtheme covers five indicators:
1. Do you restrict grazing at certain times of
year?
2. How much access do they have to grazing
on a daily basis?
How do you judge your animals' ability to
perform natural behaviours, during:
3. Feeding
4. Resting
5. Social/comfort
Possible answers and their points:
1. Don't restrict (5), access to exercise yard in
severe weather (4), keep in during very severe
weather (3), restrict during winter (2), restrict
during summer (1)
2. 24 hour access (5), kept in for short periods (4),
kept in overnight (3), access to grazing for
shorter period (2), no access (1)
Question 3 – 5: Fully able to (5), somewhat restricted
(3), unable to do so (1)
5 pts
5.PG
Housing (ORC,
2014)
Housing includes four indicators:
1. How would you describe the
housing/grazing options?
2. How is the housing designed?
3. Are feed and water positioned to minimise
the risk of contamination?
4. Do you have RSPCA "freedom foods"
certification or Organic certification?
Welfare certification?
The possible answers and their scores between 1 and
5:
1. Below ‘freedom foods’ standards (1 point),
according to (3 points), higher than (4), much
higher than (5).
2. In need of upgrade (1), good quality (3), first
rate (5)
3. Yes (3), no (1)
4. Yes (5), no (1)
5 pts
6.IDEA
Animal welfare
(Vilain, 2008)
The animal welfare is a self-evaluation of the
farmer on the following indicators:
1. Access to clean water
2. Comfort in the fields (shade, shelters…)
3. Comfort inside farm buildings
4. Health condition (wounds, limping)
5. No-grazing breeding or confinement of
animals
6. No livestock production
- A score between 0 and 3 can be obtained
for each of the indicators 1 to 4.
- The lowest of these scores is selected as
the score for this subtheme.
- If condition 5 is true, 1 point is deducted.
- In case there is no livestock production on
the farm, 0 points should be given for this
subtheme.
3 pts
The choice of the sustainability assessment tool matters
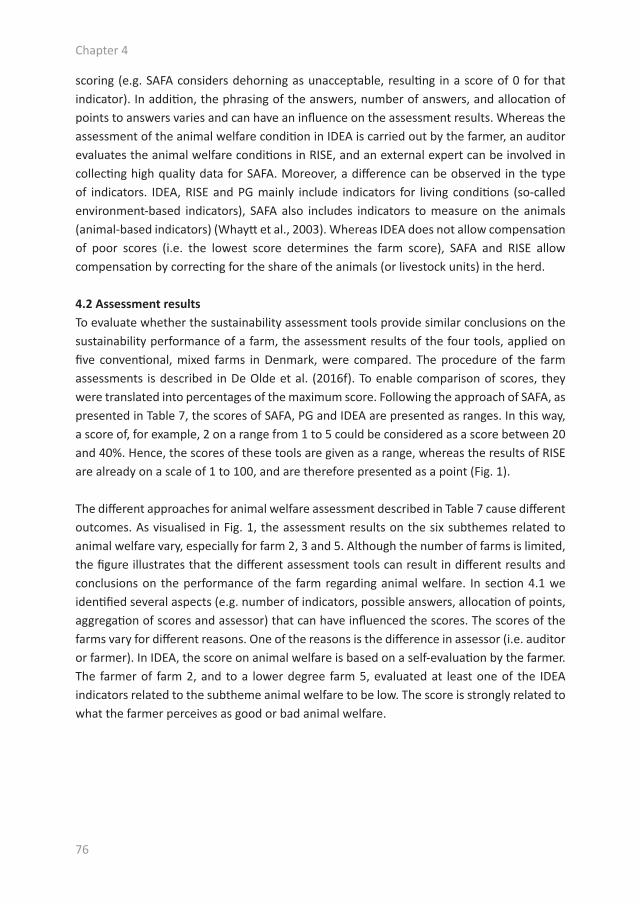
76
scoring (e.g. SAFA considers dehorning as unacceptable, resulting in a score of 0 for that indicator). In addition, the phrasing of the answers, number of answers, and allocation of points to answers varies and can have an influence on the assessment results. Whereas the assessment of the animal welfare condition in IDEA is carried out by the farmer, an auditor evaluates the animal welfare conditions in RISE, and an external expert can be involved in collecting high quality data for SAFA. Moreover, a difference can be observed in the type of indicators. IDEA, RISE and PG mainly include indicators for living conditions (so-called environment-based indicators), SAFA also includes indicators to measure on the animals (animal-based indicators) (Whaytt et al., 2003). Whereas IDEA does not allow compensation of poor scores (i.e. the lowest score determines the farm score), SAFA and RISE allow compensation by correcting for the share of the animals (or livestock units) in the herd.
4.2 Assessment resultsTo evaluate whether the sustainability assessment tools provide similar conclusions on the sustainability performance of a farm, the assessment results of the four tools, applied on five conventional, mixed farms in Denmark, were compared. The procedure of the farm assessments is described in De Olde et al. (2016f). To enable comparison of scores, they were translated into percentages of the maximum score. Following the approach of SAFA, as presented in Table 7, the scores of SAFA, PG and IDEA are presented as ranges. In this way, a score of, for example, 2 on a range from 1 to 5 could be considered as a score between 20 and 40%. Hence, the scores of these tools are given as a range, whereas the results of RISE are already on a scale of 1 to 100, and are therefore presented as a point (Fig. 1).
The different approaches for animal welfare assessment described in Table 7 cause different outcomes. As visualised in Fig. 1, the assessment results on the six subthemes related to animal welfare vary, especially for farm 2, 3 and 5. Although the number of farms is limited, the figure illustrates that the different assessment tools can result in different results and conclusions on the performance of the farm regarding animal welfare. In section 4.1 we identified several aspects (e.g. number of indicators, possible answers, allocation of points, aggregation of scores and assessor) that can have influenced the scores. The scores of the farms vary for different reasons. One of the reasons is the difference in assessor (i.e. auditor or farmer). In IDEA, the score on animal welfare is based on a self-evaluation by the farmer. The farmer of farm 2, and to a lower degree farm 5, evaluated at least one of the IDEA indicators related to the subtheme animal welfare to be low. The score is strongly related to what the farmer perceives as good or bad animal welfare.
Chapter 4
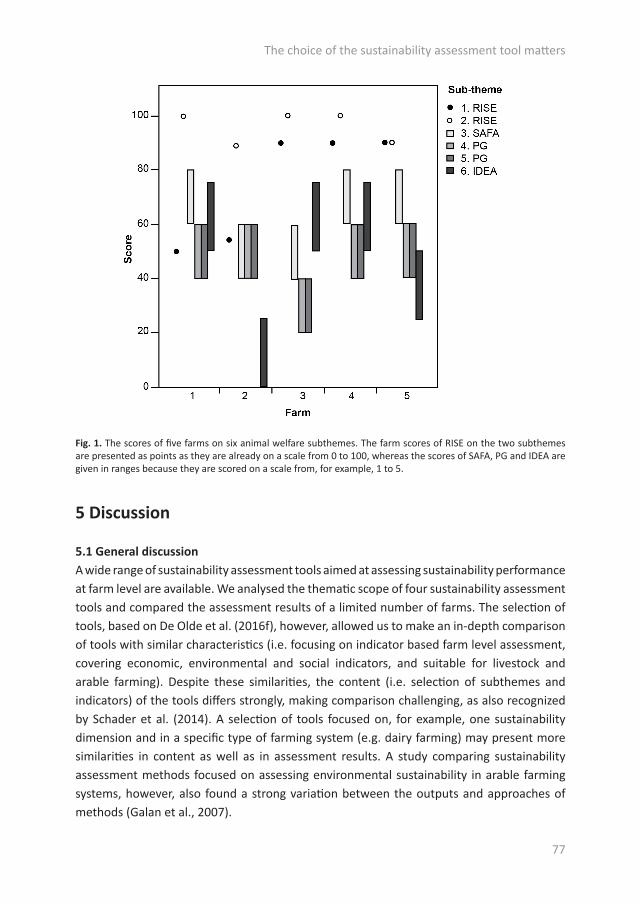
77
Fig. 1. The scores of five farms on six animal welfare subthemes. The farm scores of RISE on the two subthemes are presented as points as they are already on a scale from 0 to 100, whereas the scores of SAFA, PG and IDEA are given in ranges because they are scored on a scale from, for example, 1 to 5.
5 Discussion
5.1 General discussionA wide range of sustainability assessment tools aimed at assessing sustainability performance at farm level are available. We analysed the thematic scope of four sustainability assessment tools and compared the assessment results of a limited number of farms. The selection of tools, based on De Olde et al. (2016f), however, allowed us to make an in-depth comparison of tools with similar characteristics (i.e. focusing on indicator based farm level assessment, covering economic, environmental and social indicators, and suitable for livestock and arable farming). Despite these similarities, the content (i.e. selection of subthemes and indicators) of the tools differs strongly, making comparison challenging, as also recognized by Schader et al. (2014). A selection of tools focused on, for example, one sustainability dimension and in a specific type of farming system (e.g. dairy farming) may present more similarities in content as well as in assessment results. A study comparing sustainability assessment methods focused on assessing environmental sustainability in arable farming systems, however, also found a strong variation between the outputs and approaches of methods (Galan et al., 2007).
The choice of the sustainability assessment tool matters

78
The coverage analysis enabled us to make an in-depth analysis of the content of sustainability assessment tools. The coverage analysis demonstrated differences in what is assessed in each tool, and how the content of a subtheme in one tool can be represented across multiple subthemes in another tool. In the coverage analysis, we distinguished three levels of coverage. Nonetheless, the degree of coverage level of each subtheme is not clear-cut and can be subject to discussion.
The results of the coverage per dimension indicated that the coverage of environmental subthemes is relatively high compared to the other dimensions. In other words, there is a higher consensus on which environmental subthemes and indicators to use in farm level sustainability assessment tools compared to the other dimensions. This does not mean that the tools included in this study prioritize environmental subthemes over the other. The higher consensus on environmental subthemes could be due to the higher level of attention in literature and farm level assessment tools for environmental indicators compared to social and economic indicators (Binder et al., 2010; Gasso et al., 2015).
Following our coverage analysis approach, only one topic, animal welfare, was suitable for comparison of assessment results. Yet, even within this topic, the tools present different indicators (e.g. environment- or animal-based), scoring methods and type of assessors (farmer, trained advisor or professional assessor). This diversity in assessment tools can result in different conclusions on the sustainability performance of the farm, as illustrated by the assessment results of subthemes on animal welfare. This does not only raise concerns regarding the validity of the tools (Bockstaller et al., 2009) but can also affect the trust of users (i.e. farmers and advisors) to use the assessment results to improve sustainability at farm level (De Olde et al., 2016c). Harmonizing assessment approaches is needed to increase the comparability (Schader et al., 2014). In the meantime, the sustainability assessment tools used in this study are evolving. RISE has aligned its terminology and themes to SAFA, and both RISE and PG refer to more generally accepted tools such as the Welfare Quality protocol for animal welfare (Grenz, 2016b; Padel, 2016). This development can contribute to consensus, robustness and transparency in sustainability assessment tools.
5.2 The need for transparency in sustainability assessment toolsThe variability in assessment approaches and results emphasises the need for transparency in decisions made during the development of sustainability assessment tools (Bockstaller et al., 2008). After all, the choice of the assessment tool and decisions made in the development of an assessment tool (e.g. reference values, indicators, measurement) can turn an unsustainable practice into a sustainable practice and vice versa (Bell and Morse, 2001). The results of a sustainability assessment tool, therefore, present one out of many possible perspectives on the sustainability performance of a farm. When adopting an existing tool, such as IDEA, PG and RISE, one enters at the point where sustainability themes, indicators
Chapter 4
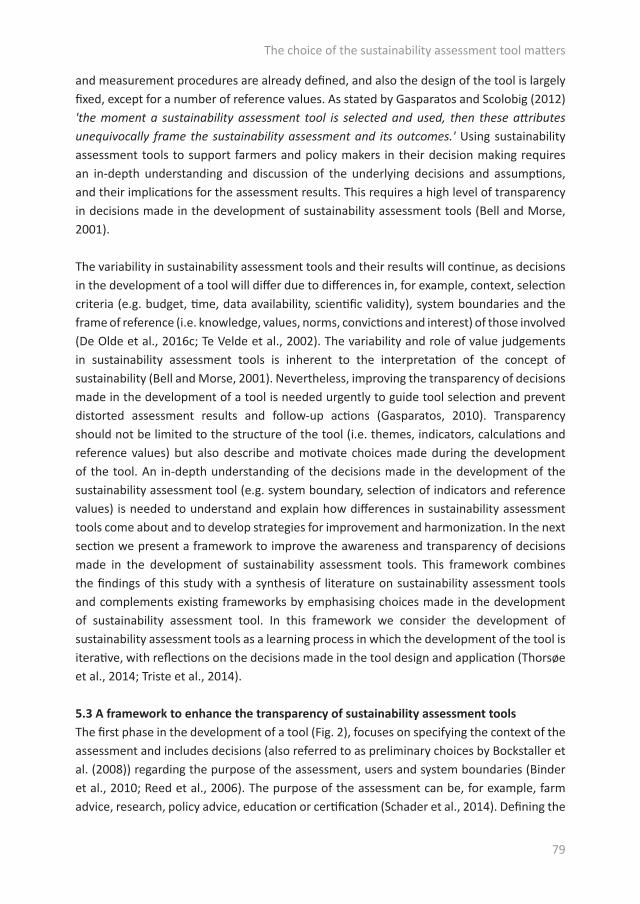
79
and measurement procedures are already defined, and also the design of the tool is largely fixed, except for a number of reference values. As stated by Gasparatos and Scolobig (2012) 'the moment a sustainability assessment tool is selected and used, then these attributes unequivocally frame the sustainability assessment and its outcomes.' Using sustainability assessment tools to support farmers and policy makers in their decision making requires an in-depth understanding and discussion of the underlying decisions and assumptions, and their implications for the assessment results. This requires a high level of transparency in decisions made in the development of sustainability assessment tools (Bell and Morse, 2001).
The variability in sustainability assessment tools and their results will continue, as decisions in the development of a tool will differ due to differences in, for example, context, selection criteria (e.g. budget, time, data availability, scientific validity), system boundaries and the frame of reference (i.e. knowledge, values, norms, convictions and interest) of those involved (De Olde et al., 2016c; Te Velde et al., 2002). The variability and role of value judgements in sustainability assessment tools is inherent to the interpretation of the concept of sustainability (Bell and Morse, 2001). Nevertheless, improving the transparency of decisions made in the development of a tool is needed urgently to guide tool selection and prevent distorted assessment results and follow-up actions (Gasparatos, 2010). Transparency should not be limited to the structure of the tool (i.e. themes, indicators, calculations and reference values) but also describe and motivate choices made during the development of the tool. An in-depth understanding of the decisions made in the development of the sustainability assessment tool (e.g. system boundary, selection of indicators and reference values) is needed to understand and explain how differences in sustainability assessment tools come about and to develop strategies for improvement and harmonization. In the next section we present a framework to improve the awareness and transparency of decisions made in the development of sustainability assessment tools. This framework combines the findings of this study with a synthesis of literature on sustainability assessment tools and complements existing frameworks by emphasising choices made in the development of sustainability assessment tool. In this framework we consider the development of sustainability assessment tools as a learning process in which the development of the tool is iterative, with reflections on the decisions made in the tool design and application (Thorsøe et al., 2014; Triste et al., 2014).
5.3 A framework to enhance the transparency of sustainability assessment toolsThe first phase in the development of a tool (Fig. 2), focuses on specifying the context of the assessment and includes decisions (also referred to as preliminary choices by Bockstaller et al. (2008)) regarding the purpose of the assessment, users and system boundaries (Binder et al., 2010; Reed et al., 2006). The purpose of the assessment can be, for example, farm advice, research, policy advice, education or certification (Schader et al., 2014). Defining the
The choice of the sustainability assessment tool matters

80
system boundaries of the assessed entity is necessary to specify the impact (i.e. on-farm/off-farm) to be considered in the assessment (FAO, 2013a). For example, are greenhouse gas emissions resulting from off-farm feed production included in the sustainability assessment of a farm? In addition, choices regarding the spatial (e.g. field, farm, region) and temporal scope (e.g. month, year), and the production level (e.g. farm, sector) need to be made (Bockstaller et al., 2015; Schader et al., 2014). Involving stakeholders in this process can enhance learning and engagement in sustainable development (Bell and Morse, 2001). Moreover, it can enhance the feeling of ownership, and add to the acceptance and use of the results (Bell and Morse, 2001; Sala et al., 2015; Triste et al., 2014). Therefore, stakeholders affecting and influencing the systems’ sustainability should be analysed, the degree of their involvement defined and the relevant stakeholders need to be involved in the development process (Bell and Morse, 2008; Sala et al., 2015).
In the second phase, the understanding of the concept of sustainability should be specified as a wide variety of definitions is available (e.g. resource sufficiency or functional integrity) (Binder et al., 2010; Hansen, 1996; Thompson, 1992). Following this definition, sustainability goals can be identified, followed by a selection of sustainability themes and subthemes to assess the performance of a farm. PG, for example, assesses the sustainability of farms through the provision of public goods and covers a wide range of environmental subthemes related to landscape services and nature conservation.
In the third phase, indicators are defined to assess the sustainability performance of a farm on sustainability themes. A list of potential indicators can be collected through literature review, databases or expert consultation (Lebacq et al., 2013). To select indicators, criteria for indicator selection should be defined (Bockstaller et al., 2009; Lebacq et al., 2013; Meul et al., 2008; Niemeijer and De Groot, 2008). Moreover, criteria for developing a coherent set of indicators can be specified (Niemeijer and De Groot, 2008). As these selection criteria can involve trade-offs (e.g. scientific validity versus easily communicated), prioritizations in the selection criteria are generally made on the basis of the context (e.g. available resources, data availability) and the frame of reference of those involved (Bockstaller et al., 2015; De Olde et al., 2016c; Marchand et al., 2014). Trade-offs between the depth of the assessment and available resources may result in the decision to use a quick scan approach, like in the example of animal welfare, while for more in-depth assessment the Welfare Quality protocol could be suggested as a reference point.
As discussed by Bell and Morse (2001) the methodology to assess sustainability indicators can be explicit or implicit (i.e. not clearly articulated but suggested), the indicators quantitative or qualitative, and defined by experts or by the local community. The different types of indicators present different perspectives on the sustainability indicator studied. After the selection of indicators, they should be evaluated with the users to determine their
Chapter 4
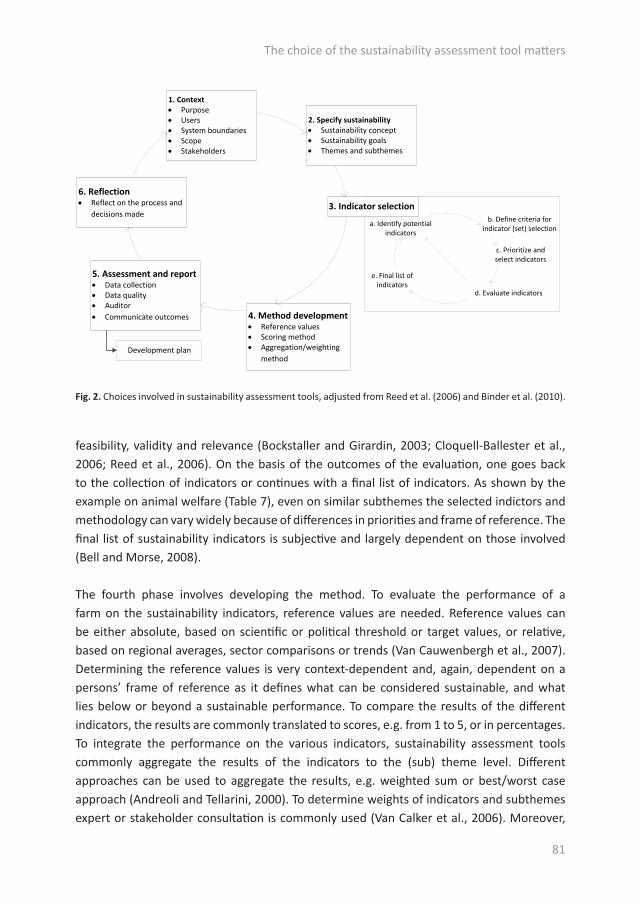
81
feasibility, validity and relevance (Bockstaller and Girardin, 2003; Cloquell-Ballester et al., 2006; Reed et al., 2006). On the basis of the outcomes of the evaluation, one goes back to the collection of indicators or continues with a final list of indicators. As shown by the example on animal welfare (Table 7), even on similar subthemes the selected indictors and methodology can vary widely because of differences in priorities and frame of reference. The final list of sustainability indicators is subjective and largely dependent on those involved (Bell and Morse, 2008).
The fourth phase involves developing the method. To evaluate the performance of a farm on the sustainability indicators, reference values are needed. Reference values can be either absolute, based on scientific or political threshold or target values, or relative, based on regional averages, sector comparisons or trends (Van Cauwenbergh et al., 2007). Determining the reference values is very context-dependent and, again, dependent on a persons’ frame of reference as it defines what can be considered sustainable, and what lies below or beyond a sustainable performance. To compare the results of the different indicators, the results are commonly translated to scores, e.g. from 1 to 5, or in percentages. To integrate the performance on the various indicators, sustainability assessment tools commonly aggregate the results of the indicators to the (sub) theme level. Different approaches can be used to aggregate the results, e.g. weighted sum or best/worst case approach (Andreoli and Tellarini, 2000). To determine weights of indicators and subthemes expert or stakeholder consultation is commonly used (Van Calker et al., 2006). Moreover,
Fig. 2. Choices involved in sustainability assessment tools, adjusted from Reed et al. (2006) and Binder et al. (2010).
1. Context· Purpose· Users· System boundaries· Scope· Stakeholders
2. Specify sustainability· Sustainability concept· Sustainability goals· Themes and subthemes
6. Reflection· Reflect on the process and
decisions made
5. Assessment and report· Data collection· Data quality· Auditor· Communicate outcomes 4. Method development
· Reference values· Scoring method· Aggregation/weighting
method
3. Indicator selection
a. Identify potential indicators
b. Define criteria for indicator (set) selection
c. Prioritize and select indicators
d. Evaluate indicators
e. Final list of indicators
Development plan
The choice of the sustainability assessment tool matters
82
compensation factors can be considered (Martinez-Alier et al., 1998; Munda, 1996). In IDEA, for example, the lowest score on the indicators on animal welfare is selected as the final score for the subtheme animal welfare to prevent compensation of poor scores. In RISE, animal welfare is evaluated for each animal category separately and the score on the indicators is the weighted (by the number of livestock units per category) average of the category scores, allowing a certain level of compensation.
As a fifth step, the sustainability of the system is assessed using the selected indicators. Dependent on the level of explicitness of the method, decisions are made on the method of data collection, the desired data quality and the auditor. Also during the assessments an auditor plays a role, for example through the level of austerity applied in determining the score based on the information and data collected (De Olde et al., 2016f). The assessments are carried out and the results are calculated and reported to the users. The results of the assessment are a starting point for discussing sustainability at farm level to enhance learning and awareness of sustainability (De Olde et al., 2016d).
Finally, the experiences with the tool should be used to reflect on the development of the tool (Triste et al., 2014). The reflection should focus on decisions made in the development, for example the delineation of the system boundary, assessment method and reference values. Dialogue between tool developers, users and stakeholders can improve the understanding of interactions in the system, trade-offs and synergies between sustainability indicators and subthemes, and gives insight in the complexity and restrictions in improving farm level sustainability. This also has implications for the role of researchers and our relation to society (Triste et al., 2014; Wittmayer and Schäpke, 2014).
The framework reveals the large number of choices involved in the development of a sustainability assessment tool and clarifies how differences between sustainability assessment tools come about. The framework emphasises the importance of a reflexive attitude and questioning the implications of the choices made in the development of a tool as well as influence of one’s context, values, assumptions and understandings. As such, reflexivity can contribute to the acknowledgement, debate and mutual learning on the role of values inherent to the operationalisation of the concept of sustainability.
6 Conclusion
This study shows that four assessment tools aimed at assessing sustainability at farm level (RISE, SAFA, PG and IDEA) have a high variation in the selection of (sub)themes and indicators, assessment approach, and aggregation and scoring method, despite their similar scope and purpose. Consequently, these sustainability assessment tools lead to differences
Chapter 4
83
in assessment results and conclusions on the sustainability performance of farms. To gain insight into the reasons behind differences in assessment results, a framework was presented that enhances transparency of sustainability assessment tools, reduces the risk on distorted assessment results and actions, and can contribute to the trust and relevance of future sustainability assessment.
Acknowledgements
This research was financially supported by the European Community under the Seventh Framework Programme for the project Autograssmilk under grant agreement SME-2012-2-314879. The authors would like to thank the developers of the four sustainability tools for their support and information on the development of the tools.
The choice of the sustainability assessment tool matters

84

85
Chapter 5
When experts disagree: the need to rethink indicator selection for assessing sustainability of agriculture E.M. de Olde a,b , H. Moller c, F. Marchand d,e, R.W. McDowell f,g, C.J. MacLeod h, M. Sautier c,i, S. Halloy j,k, A. Barber l, J. Benge l, C. Bockstaller m,n, E.A.M. Bokkers b, I.J.M. de Boer b, K.A. Legun o, I. Le Quellec l, C. Merfield p, F.W. Oudshoorn a,q, J. Reid r, C. Schader s, E. Szymanski t, C.A.G. Sørensen a, J. Whitehead u, J. Manhire l
a Department of Engineering, Aarhus University, Aarhus, Denmarkb Animal Production Systems Group, Wageningen University, Wageningen, The Netherlandsc Centre for Sustainability: Agriculture, Food, Energy, Environment University of Otago, New Zealandd Social Sciences Unit, Institute for Agricultural and Fisheries Research (ILVO), Merelbeke, Belgiume Ecosystem Management Research Group and IMDO, University of Antwerp, Wilrijk, Belgiumf Invermay Agricultural Centre, AgResearch, Mosgiel, New Zealandg Agriculture and Life Sciences, Lincoln University, Lincoln, New Zealandh Landcare Research, Dunedin, New Zealandi INRA, UMR 1248 AGIR, Castanet-Tolosan, Francej Universidad Nacional de Chilecito, La Rioja, Argentinak Ministry for Primary Industries, Wellington, New Zealandl The Agribusiness Group, Lincoln University, Lincoln, New Zealandm INRA, UMR 1121 Agronomie et Environnement, INRA-Université de Lorraine, Colmar Cedex, Francen UMR 1121, Agronomie et Environnement, Université de Lorraine, BP20507, Colmar Cedex, Franceo Department of Sociology, Gender & Social Work, University of Otago, Dunedin, New Zealandp The BHU Future Farming Centre, Lincoln, New Zealandq SEGES, Aarhus N., Denmarkr Ngai Tahu Research Centre, University of Canterbury, Christchurch, New Zealands Research Institute of Organic Agriculture (FiBL), Frick, Switzerlandt Centre for Science Communication, University of Otago, Dunedin, New Zealandu Agribusiness and Economics Research Unit, Lincoln University, Lincoln, New Zealand
Published in Environment, Development and Sustainability (2016), 1-16DOI:10.1007/s10668-016-9803-x
86
Abstract
Sustainability indicators are well recognized for their potential to assess and monitor sustainable development of agricultural systems. A large number of indicators are proposed in various sustainability assessment frameworks, which raises concerns regarding the validity of approaches, usefulness and trust in such frameworks. Selecting indicators requires transparent and well-defined procedures to ensure the relevance and validity of sustainability assessments. The objective of this study, therefore, was to determine whether experts agree on which criteria are most important in the selection of indicators and indicator sets for robust sustainability assessments. Two groups of experts (Temperate Agriculture Research Network and New Zealand Sustainability Dashboard) were asked to rank the relative importance of eleven criteria for selecting individual indicators and of nine criteria for balancing a collective set of indicators. Both ranking surveys reveal a startling lack of consensus amongst experts about how best to measure agricultural sustainability and call for a radical rethink about how complementary approaches to sustainability assessments are used alongside each other to ensure a plurality of views and maximum collaboration and trust amongst stakeholders. To improve the transparency, relevance and robustness of sustainable assessments, the context of the sustainability assessment, including prioritizations of selection criteria for indicator selection, must be accounted for. A collaborative design process will enhance the acceptance of diverse values and prioritizations embedded in sustainability assessments. The process by which indicators and sustainability frameworks are established may be a much more important determinant of their success than the final shape of the assessment tools. Such an emphasis on process would make assessments more transparent, transformative and enduring.
Chapter 5
87
1 Introduction
Current concerns regarding global food security, climate change, animal welfare, biodiversity and availability of natural resources emphasize the need for sustainable development of agriculture (OECD, 2001; Steinfeld et al., 2006; IAASTD, 2009; Pretty et al., 2010). Although interpretation of the concept of sustainable development (i.e. further referred to as sustainability) varies widely, a consensus exists on the need to use relevant sustainability indicators to assess change (Hansen, 1996; Bell and Morse, 2008; Bockstaller et al., 2015). Sustainability indicators measure the current status of a system to identify trends, forewarning the breach of critical thresholds and monitoring the success of interventions to build sustainability.
A wide range of indicator-based tools for sustainability assessment have been developed to assess the sustainability performance of agricultural systems (FAO, 2013a; Keulen et al., 2005; De Olde et al., 2016f; Marchand et al., 2014). These tools vary in their assessment objective, spatial and temporal scope and level of stakeholder involvement (Binder et al., 2010; Schader et al., 2014). Consensus on which sustainability indicators to include is lacking and contributes to a wide diversity of approaches (Bockstaller et al., 2009; Bell and Morse, 2008; Parris and Kates, 2003). This multiplicity can add cost, impair the ability to focus on the most salient sustainability indicators and raise concerns regarding the validity of approaches, usefulness and trust in the concept of sustainability (Hansen, 1996; Bockstaller et al., 2009; Schader et al., 2014). As a solution, several have raised the importance of transparent and well-defined procedures and criteria for selecting individual indicators and balancing indicator sets to develop relevant, trusted, comprehensible and meaningful sustainability assessments (Dale and Beyeler, 2001; Bockstaller et al., 2009; Niemeijer and De Groot, 2008; Lebacq et al., 2013). This paper, therefore, focuses on the general criteria for indicator selection as an overarching issue in the design of sustainability assessments and as a key step before defining individual indicators and assessment methods (Reed et al., 2006; Dale and Beyeler, 2001).
The selection of sustainability indicators is made using a list of criteria (Dale and Beyeler, 2001). Criteria for the selection of individual sustainability indicators discussed in the scientific literature commonly cover relevance, validity, measurability, sensitivity and comprehensibility by stakeholders and decision-makers (Dale and Beyeler, 2001; Lebacq et al., 2013). Together, the collective set of indicators should comprehensively represent the agricultural system (Niemeijer and De Groot, 2008; Binder et al., 2010; Marchand et al., 2014). The definition, selection and prioritization of selection criteria used to select indicators vary widely between sustainability assessment tools (Niemeijer and De Groot, 2008; Bell
When experts disagree: the need to rethink indicator selection

88
and Morse, 2008; Reed et al., 2006). Describing criteria used for selecting indicators is, therefore, important for the transparency and reliability of sustainability assessments (Dale and Beyeler, 2001; Niemeijer and De Groot, 2008).
This paper discusses the results of a ranking survey amongst experts on sustainability assessment of agricultural systems, regarding the relative importance of criteria to select individual indicators and balance a collective set of indicators. The objective was to determine whether these experts agree on which criteria are most important, and if not, discuss the implications for building reliable sustainability assessments in the future.
2 Methods
To get insight into criteria, principles and processes to build a reliable sustainability assessment, we started with an overview of eleven criteria for individual indicator selection (Table 1) and nine criteria for balancing the collective set of indicators (Table 2) to assess the sustainability performance of agricultural systems. These criteria were judged to be the most important (based on their emphasis in the sustainability monitoring literature) by Moller and MacLeod (2013) from their review of international and New Zealand sustainability assessment initiatives in agriculture and ecology (Lee et al., 2005; OECD, 2001; Sommerville et al., 2011; Herzog et al., 2012; Jones et al., 2012). To make the ranking process tractable, we selected and summarized the broad spectrum of criteria used to define indicators. Many criteria are listed in the sustainability literature, and elements of those we chose are grouped and framed in different ways (Moller and MacLeod, 2013). Accordingly, our survey should not be perceived as a definitive list of all the potential criteria to be considered. Tables 1 and 2 present the criteria and descriptions exactly as described to the participants in the survey. The two groups were:
1. Invited members of Pilot Activity 1 (Resilient Agriculture Production Systems) in the recently launched international Temperate Agriculture Research Network (TempAg). TempAg participants were all experts in sustainability assessment of agricultural systems and consisted of researchers or agricultural policy analysts. Participants were selected based on their expertise in temperate agriculture and sustainability assessments and representation of different geographical areas and disciplines (i.e. economy, ecology, policy and social science). Eighteen respondents ranked the criteria according to the goals of the TempAg network to support sustainable agriculture over a wide range of production sectors, temperate biomes and sociopolitical systems. Panel members were from Argentina, Australia, Austria, Belgium, Canada, Denmark, France, Italy, Japan, the Netherlands, New Zealand, Sweden, Switzerland and the USA.
Chapter 5

89
1
Table 1. Possible criteria for selecting individual agricultural sustainability indicators, after Moller and MacLeod (2013). Criterion Description
Sustainability relevance Indicators should measure key properties of environment, economy, society or governance that
affect sustainability (e.g. state, pressure, response, use or capability).
Clearly defined & standardised Indicators must be based on clearly defined, verifiable and scientifically acceptable data
collected using standardised methods so that they can be reliably repeated and compared
against each other.
Easily communicated &
understood
Easily communicated and understood.
Broad acceptance The strength of an indicator depends on its broad acceptance by major stakeholders (e.g.
growers, policymakers, scientists, customers).
Affordable measurement Affordable measurement increases participation and regularity of monitoring or broadens the
scope of what can be measured for overall sustainability assessment.
Performance rather than
practice based
It is better to measure actual performance and outcomes rather than just practices that are
expected to promote sustainability and resilience.
Sensitivity Indicators should be sensitive (change immediately and a lot if agricultural systems status
changes). This helps detect trends or breaches of thresholds within the time frames and on the
scales that are relevant to the management decisions, and before it is too late to correct any
problems.
Quantification Indicators should be fully quantified whenever practicable. Counts and continuous variables
(interval and ratio scales) are more favoured than ranks (ordinal scales) or ‘yes/no’ scores
(binary); any form of quantification is preferable to a fully qualitative assessment.
Specificity for interpretability Indicators should be affected only by a few key drivers (risks, opportunities, causes) of
sustainability rather than being affected by many things (local context, multiple stressors, etc.) in
order for any change in the indicator to be interpretable for sustainability.
High precision & statistical
power
Indicators must have sufficient precision and accuracy and sufficiently low natural variance for
monitoring to detect trends and probability that some limit or threshold has been breached.
Capacity to upscale Indicators should be designed and measured in a way that allows their aggregation at multiple
spatial and temporal scales for different purposes.
Table 1. Possible criteria for selecting individual agricultural sustainability indicators, after Moller and MacLeod (2013).
2. Twenty members of the New Zealand Sustainability Dashboard (NZSD) research team. This team, a coalition of researchers and consultants, was asked to complete the same ranking surveys while focusing on the specific needs of the NZSD. The dashboard is a package of tools that deploys an industry-led approach to measuring and reporting sustainability at the farm level in New Zealand. It uses a participatory approach in which the involvement of stakeholders is contractual. It allows farmers to log self-assessed sustainability measures into an online database (Merfield et al., 2015). The NZSD panel, therefore, assessed the criteria in terms of a narrower defined context than that of the newly formed and as yet not fully defined TempAg agenda and team. The panel included agronomists, farm advisors, ecologists, rural sociologists and economists. Half of the NZSD team are researchers based in universities, and half are professional agricultural consultants.
When experts disagree: the need to rethink indicator selection
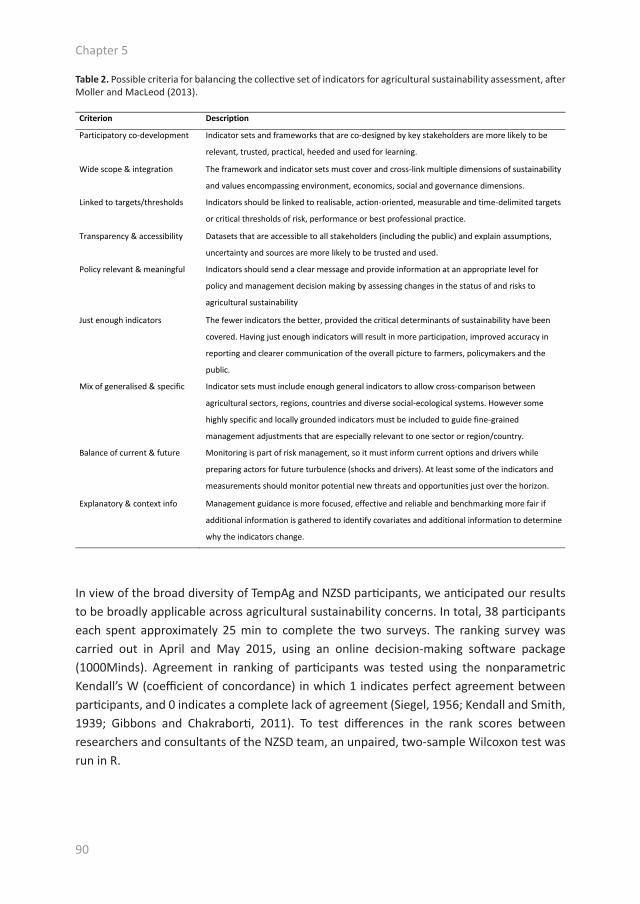
90
1
Table 2. Possible criteria for balancing the collective set of indicators for agricultural sustainability assessment, after Moller and MacLeod (2013). Criterion Description
Participatory co-development Indicator sets and frameworks that are co-designed by key stakeholders are more likely to be
relevant, trusted, practical, heeded and used for learning.
Wide scope & integration The framework and indicator sets must cover and cross-link multiple dimensions of sustainability
and values encompassing environment, economics, social and governance dimensions.
Linked to targets/thresholds Indicators should be linked to realisable, action-oriented, measurable and time-delimited targets
or critical thresholds of risk, performance or best professional practice.
Transparency & accessibility Datasets that are accessible to all stakeholders (including the public) and explain assumptions,
uncertainty and sources are more likely to be trusted and used.
Policy relevant & meaningful Indicators should send a clear message and provide information at an appropriate level for
policy and management decision making by assessing changes in the status of and risks to
agricultural sustainability
Just enough indicators The fewer indicators the better, provided the critical determinants of sustainability have been
covered. Having just enough indicators will result in more participation, improved accuracy in
reporting and clearer communication of the overall picture to farmers, policymakers and the
public.
Mix of generalised & specific Indicator sets must include enough general indicators to allow cross-comparison between
agricultural sectors, regions, countries and diverse social-ecological systems. However some
highly specific and locally grounded indicators must be included to guide fine-grained
management adjustments that are especially relevant to one sector or region/country.
Balance of current & future Monitoring is part of risk management, so it must inform current options and drivers while
preparing actors for future turbulence (shocks and drivers). At least some of the indicators and
measurements should monitor potential new threats and opportunities just over the horizon.
Explanatory & context info Management guidance is more focused, effective and reliable and benchmarking more fair if
additional information is gathered to identify covariates and additional information to determine
why the indicators change.
Table 2. Possible criteria for balancing the collective set of indicators for agricultural sustainability assessment, after Moller and MacLeod (2013).
In view of the broad diversity of TempAg and NZSD participants, we anticipated our results to be broadly applicable across agricultural sustainability concerns. In total, 38 participants each spent approximately 25 min to complete the two surveys. The ranking survey was carried out in April and May 2015, using an online decision-making software package (1000Minds). Agreement in ranking of participants was tested using the nonparametric Kendall’s W (coefficient of concordance) in which 1 indicates perfect agreement between participants, and 0 indicates a complete lack of agreement (Siegel, 1956; Kendall and Smith, 1939; Gibbons and Chakraborti, 2011). To test differences in the rank scores between researchers and consultants of the NZSD team, an unpaired, two-sample Wilcoxon test was run in R.
Chapter 5
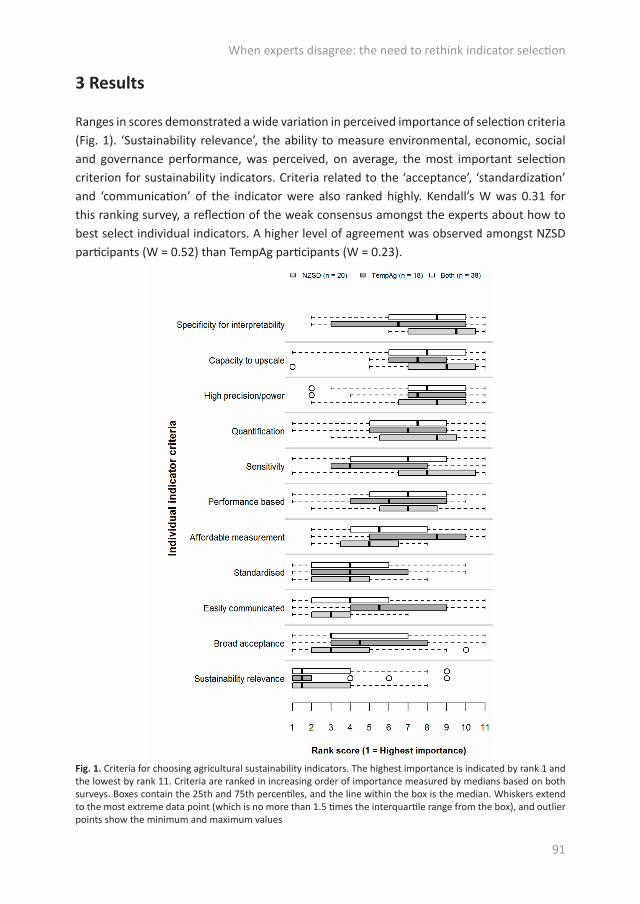
91
3 Results
Ranges in scores demonstrated a wide variation in perceived importance of selection criteria (Fig. 1). ‘Sustainability relevance’, the ability to measure environmental, economic, social and governance performance, was perceived, on average, the most important selection criterion for sustainability indicators. Criteria related to the ‘acceptance’, ‘standardization’ and ‘communication’ of the indicator were also ranked highly. Kendall’s W was 0.31 for this ranking survey, a reflection of the weak consensus amongst the experts about how to best select individual indicators. A higher level of agreement was observed amongst NZSD participants (W = 0.52) than TempAg participants (W = 0.23).
Fig. 1. Criteria for choosing agricultural sustainability indicators. The highest importance is indicated by rank 1 and the lowest by rank 11. Criteria are ranked in increasing order of importance measured by medians based on both surveys. Boxes contain the 25th and 75th percentiles, and the line within the box is the median. Whiskers extend to the most extreme data point (which is no more than 1.5 times the interquartile range from the box), and outlier points show the minimum and maximum values
When experts disagree: the need to rethink indicator selection

92
Whereas the criteria ‘specificity for interpretability’ and ‘sensitivity’ received a substantially higher median rank by TempAg participants, the criteria ‘affordable measurement’ and ‘easily communicated’ were considered more important by NZSD (Fig. 1).
In the second ranking survey, on balancing a collective set of indicators, ‘participatory co-development’ achieving a ‘wide scope and integration’ and establishing ‘links to targets and critical thresholds’ were considered as the three most important criteria (Fig. 2).
Similar to the first survey, the results demonstrated a wide variation in the perceived importance of selection criteria for indicator sets. Each criterion received the full range of possible ranks (1–9) across the participants, indicating a lack of agreement amongst participants (Kendall’s W = 0.09, with W-values for TempAg and NZSD of 0.10, and 0.15, respectively). As a result, median ranks of criteria remain between rank 3 and 6. This relatively flat trajectory of the median ranks illustrates the absence of consensus on priorities in balancing indicator sets (Fig. 2).
Fig. 2. Criteria for balancing indicator sets for agricultural sustainability assessment. Criteria are ranked in increasing order of importance measured by medians based on both surveys. Boxes contain the 25th and 75th percentiles, and the line within the box is the median. Whiskers extend to the most extreme data point (which is no more than 1.5 times the interquartile range from the box), and outlier points show the minimum and maximum values
Chapter 5
93
TempAg and NZSD participants ranked criteria for balancing indicators sets quite differently (Fig. 2). NZSD participants tended to prioritize participatory co-development and keeping the number of indicators to a minimum, whereas TempAg participants emphasized the need for a wide scope and integration of indicator sets to cover multiple dimensions of sustainability.
Within the NZSD team, median rank scores for ‘sensitivity’ and, to a lesser extent, ‘sustainability relevance’ were higher for the researchers than for the consultants (Wilcoxon rank test; sensitivity: W = 66, P = 0.002; relevance: W = 69.5, P = 0.046). No other differences emerged between researchers and consultants in individual indicator selection criteria, nor in any of the criteria for balancing indicator sets.
4 Discussion
4.1 Lack of consensus, even amongst expertsThe most remarkable feature of both ranking surveys is the lack of consensus amongst participants about what matters most in indicator selection criteria. This is shown by the low values of Kendall’s W, the wide range of scores and the relatively flat trajectory of the median ranks, especially for the survey on indicator sets. A possible explanation could be that experts were targeting different types of indicators for different social and economic contexts, farming systems (e.g. confined vs. pasture-based livestock systems) and user groups (e.g. farmers or policy-makers). The first survey focusing on individual indicator selection had a greater level of agreement (based on the Kendall’s W value) amongst NZSD participants compared to TempAg participants. Within the TempAg participants, researchers represented a wider variety of disciplines, from more diverse contexts. Findings for the NZSD participants, however, show that even in a team with a shared goal, the rankings vary strongly.
Differences in TempAg and NZSD prioritizations could be explained by their distinctive agendas. The high dependence of NZSD on farmers and industrial partners along with their commercial focus and participatory approach could explain their higher ranking of ‘affordability’ and ‘easily communicated’ criteria. By contrast, TempAg’s goal to provide highly robust and technically derived indicators for comparison of agricultural performance between temperate countries in the OECD could explain their higher ranking of ‘specificity’ and ‘sensitivity’.
Other factors that could have contributed to the apparent lack of consensus include the limitation of the ranking process to allow equal importance of criteria. Many of the participants may have judged some criteria to be about equally important, and the resulting
When experts disagree: the need to rethink indicator selection
94
ranking therefore forced artificial and inconsistent ordering of priorities. Other potential reasons for the lack of consensus include use of relatively broad descriptions for selection criteria and the diversity of nationalities and disciplinary backgrounds of the participants involved. The latter may have influenced the interpretation and understanding of the criteria (Lupia, 2013).
As experts operating with different training and access to different knowledge sources, participants in the survey would be likely to weigh the importance of criteria differently (Dovers, 2005). As a narrow focus may allow for greater vision in some areas, it may preclude us from fully seeing the importance of other indicator criteria. From this perspective, the divergence in the evaluation could be seen as an asset, as a range of expertise can generate a more rigorous exploration of indicators and sounder assessment development as multiple types of expertise are brought together. These differences in knowledge systems preface the call for interdisciplinarity and transdisciplinarity in sustainability research (Kates et al., 2001; Komiyama and Takeuchi, 2006; Ostrom, 2009; Popa et al., 2015). Not only can integration of diverse knowledge domains improve our understanding of sustainability issues, but it also can aid governance of those issues and the enhancement of democratic processes (Bäckstrand, 2004). The persistent variation in prioritization of criteria used to define indicators can attest to the maintenance of specialized knowledge, even in interdisciplinary environments, and yet it presents challenges for implementing actionable sustainability programs.
Divergent views may reflect differences in world views, for example reductionist versus more holistic or system-oriented approaches to understanding a complex social-ecological activity like agriculture. A lack of consensus is perhaps expected when asking experts what is more important to monitor within a complex and interconnected set of processes. Therefore, we emphasize the need to include a plurality of world views in a flexible framework for the selection of indicators. Participatory approaches which incorporate diverse views in the form of broad patterns, co-development of scenarios and use of adaptive planning approaches are all useful tools to build flexibility and inclusivity (Seimon et al., 2009, 2012; Yager et al., 2009).
4.2 Selecting indicators: the importance of context, plurality and flexibilityIn our study, we have defined criteria for the selection of individual indicators and indicator sets based on a review of criteria used in agriculture and ecology (Moller and MacLeod, 2013). The selection criteria are, however, generic and could be applied in other disciplines. We expect, however, that any complex adaptive system that demands management of human society, ecology and biology, will be confronted with similar findings and trade-offs as we highlighted for agriculture.
Chapter 5

95
In each context, a person’s frame of reference, consisting of assumptions, values, norms, knowledge and interests, will be balanced differently, resulting in different prioritizations and selections of indicators and indicator sets (Te Velde et al., 2002). To build reliable sustainability assessments in the future, we have to recognize that definitions of sustainability, as well as the selection of indicators, vary with individual differences in context and perceptions (Bell and Morse, 2008; Gasparatos, 2010). Although each criterion could be considered valuable in its own sense, personal context may lead individuals to prioritize criteria differently. For example, one might value quantification but be willing to compromise that value for affordability purposes. This is not because affordability is considered more valuable than quantification, but results from a given context. The current ranking exercise deliberately asked respondents to order the criteria according to ‘importance’ for the sustainability assessments, knowing that ‘importance’ inevitably conflates practical constraints, systems understanding (i.e. what is most likely to affect sustainability outcomes) and, most of all, values of the assessors or subjects. This very conglomeration of multiple criteria is embedded in sustainability assessments and presents a challenge for achieving consensus, trust and collective action to transform agricultural systems to more sustainable practice.
Indicator selection is, however, not the only consideration in the design of sustainability assessment tools. Decisions on the purpose, assessment process (i.e. who measures and how), reporting and evaluation also influence the sustainability assessment (Binder et al., 2010). We urge sustainability researchers to more explicitly acknowledge that priorities and values play an important role in science, especially in sustainability assessments (Alrøe and Kristensen, 2002; Alrøe et al., 2016). Describing and reflecting on the context of sustainability assessments, including prioritization of selection criteria, selection of indicators, methods and reference values, is crucial to improve the transparency and relevance of sustainable assessment tools.
4.3 Collaborative processes and participation as an answer to context specificity, plurality and flexibilityDialogue is an important tool to improve transparency of prioritization and selection procedures to develop sustainability assessment tools. Stakeholder collaboration can support the development and dissemination of more robust conceptions of sustainability (De Mey et al., 2011; Bell and Morse, 2008). Furthermore, selecting indicators can be seen as a process of joint learning and knowledge development to help those involved to make decisions that enhance sustainable development of agriculture (Pretty, 2008). The selection process stimulates stakeholders to recognize and accept their role and responsibility for achieving a more sustainable practice (Triste et al., 2014). Including all stakeholders may lead to wide-ranging goals, a broader focus and even inconclusiveness, which some professionals may find unsettling. It will also take much longer to establish monitoring and research because co-design and relationship building must occur first (Moller et al.,
When experts disagree: the need to rethink indicator selection
96
2009). Participatory co-development should, however, be seen as a crucial process for the interpretation and operationalization of sustainability (Owens, 2003). Agrawal (2005) showed how involvement in monitoring itself has crucial roles in triggering individual transformation of the values and actions of environmental citizens. Mindful facilitation of such processes is considered necessary to create commitment, shared understanding and trust and to acknowledge and manage power asymmetries (Ansell and Gash, 2008; Moller et al., 2009; Barnaud and Van Paassen, 2013).
In summary, selection of indicators should be a process in which the stakeholders affected are involved, not just for the sake of participation (Bell and Morse, 2008), but also to create relevant and context-specific assessments to improve sustainability performance (Binder et al., 2010; Gasso et al., 2015). Co-design and self-monitoring of indicators does much more than securing agreement and cooperation or reducing cost—it also requires a trigger for changing the orientations and actions of the participants, in this case mainly farmers, towards more environmentally caring outcomes. However, adoption of additional sustainability criteria from new participatory processes may be more difficult where market accreditation initiatives have already codified what must be included, especially by stipulating standards that must be met for gaining market access.
4.4 Future approaches and research for selecting sustainability indicatorsAs suggested by Bell and Morse (2008): ‘Rapid and participatory tools for developing our thinking and modelling concerning measures of sustainability are of value to a wide range of stakeholders within development policy'. The ranking surveys provided such a tool and provoked discussions regarding the selection criteria for indicator selection within a broad group of sustainability experts. The results can be used to discuss ways to develop consensus with time through evolving views and concepts. The higher consensus score found in the NZSD ranking of selection criteria of individual indicators could be seen as an example of improved consensus resulting from close collaboration over years.
We hypothesized that experts with experience in researching agricultural sustainability and measuring the pressures, states and responses of agricultural systems would be more likely to find consensus on criteria for indicator selection than a group of more diverse stakeholders like growers, industry representatives, regulators and land use policy analysts, marketers and consumers. Our results need to be tested further to reveal if the apparent dilemma uncovered in our preliminary surveys can be generalized to other sustainability assessment frameworks. It would be particularly useful to deploy qualitative research methods to discover why experts prefer different types of indicators and indicator sets. Moreover, case studies of research and stakeholder collaborations within a defined context (e.g. region, assessment goal, end-users and priorities) could provide insight into how consensus develops.
Chapter 5
97
To incorporate context specificity and flexibility, selection criteria as well as indicators and their reference values can be made context-specific. Furthermore, different sets of weights can be used to aggregate indicators in sustainability assessment tools. The same indicators can then be measured by all decision-makers and subsequently (post hoc) aggregated and filtered to match different contexts and applications, i.e. each indicator is multiplied by a ‘weight’ ascribed by a given context or stakeholder (Cloquell-Ballester et al., 2006; Sadok et al., 2009; Elsaesser et al., 2015). There is a need to develop, test and cross-calibrate methods to measure weights ascribed by different participants to different indicators and sustainability dimensions.
Interactions between agricultural systems and their environment require thinking through different factors such as spatial and temporal scales, institutional behaviours, and knowledge types (Belt and Blake, 2015). This requires the development of techniques for combining very different types of indicators (Alrøe et al., 2016). Different indicator types also relate to different functions of the sustainability assessment tools (Marchand et al., 2014). A possible solution to address context-specific needs is the development of modular tools through which end-users can select subsets of indicators within the sustainability assessment depending on the goal of the project and local conditions related, for example related to data availability (Marchand et al., 2014). Clearly, metrological research (the science of measurement) on what gets included and left out of multi-criteria sustainability assessments is an urgent priority. In this process, we can learn from other fields. For example, large-scale multi-criteria evaluation is used in biodiversity conservation to develop transparent traceability indicators (Ferraro and Pattanayak, 2006).
Answers to several more overarching research questions could improve collaboration, trust and usability of future sustainability assessments and identify important features of the way they are designed and promulgated to accommodate widely different contexts, goals and values of the stakeholders. We here present useful research questions on the main themes of this paper:
Defining the sustainability construct:• How important is it to define sustainability itself?• Does a single definition lock in or exclude some participants, or does it provide clarity and unity of action?
Metrics of assessments:• Do sound indicators recorded by farmers actually deliver the better farming outcomes they promise?• How is a practice-based indicator system coherent with traditional farm management tools employed at the farm and is it possible to link these
When experts disagree: the need to rethink indicator selection
98
two ‘entities’ in an efficient way?• What are robust scaling methods to reliably combine divergent indicators and measurement types at domain, outcome, objective and indicators levels?
Link between sustainability constructs and the metrics:• Do we need to reach consensus on the importance of criteria for indicator selection?• How much does our apparent divergence in what is important to measure in sustainability assessment reflect differences in values or in practical constraints?• Might stakeholders find much stronger consensus and comparability around the higher-order goals, outcomes and objectives in the sustainability framework even if they differ sharply on how to measure performance at the base indicator levels?• What would success look like (i.e. what difference does any sustainability assessment actually make to land, society, economy and governance and how would this be measured)?
Organizing the process in function of legitimacy, integrity, trust and outcomes:• Does participation in designing the sustainability assessment tool, selecting indicators and design of their measures lead to substantive benefits for learning and transformation of values of farmers, or does it precipitate threats to the completeness, integrity and trust of the assessment by others?• Does the very act of codifying sustainable practice and measuring it lead to participants focussing on the assessment itself rather than the ultimate goal of seeking more sustainable farming solutions?• Do sustainability standards and market accreditation schemes provide adequate scope and rigour for whole systems assessment, or is there a need for complementary and supplementary assessments by independent civil agencies?• Must such processes always be initiated from within a community of practice and, if so, should the sustainability assessment only aim for legitimacy within that same community?• How can farmers’ local knowledge be given legitimacy and voice alongside less situated knowledge of the type favoured by external experts and process professionals like policy makers, regulators and scientists?• What are the most effective cross-scale bridging institutions and processes for linking distant stakeholders in food systems when opinions differ on the best way to measure it?
The TempAg research network seeks to compare sustainability performance of diverse OECD countries and agricultural sectors throughout temperate regions. The NZSD tools are largely designed to meet market verification needs, but also to become learning tools for farmers. Our initial survey warns that achieving consensus around sustainability assessment
Chapter 5
99
tools requires methods to account for participant variation. A single, universal sustainability assessment tool cannot be applied as a universal gold standard across communities and contexts. Harmonization of the overarching sustainability assessment framework, as done recently by FAO’s SAFA programme (FAO, 2013a), is a huge step forward to drive consensus around criteria and procedures for sustainability assessments. However, what is left out of a sustainability assessment may be just as crucial as what is included or how it is measured. Our study suggests that considerable flexibility is needed in prioritizing indicators, that the stakeholders need to run their own process of selection and design of the indicators, and that this process be well documented so that robust analysis and comparisons can be made.
Finally, we wish to emphasize that although sustainability indicators are relevant to monitor sustainability performance, indicators reduce the complexity of a system into simplified measures. In-depth understanding of the sustainability of a system should therefore embrace a systems approach by addressing the context and interactions of systems (Schiere et al., 1999).
5 Conclusion
In this study, we found a lack of consensus amongst experts about what constitutes reliable knowledge and useable datasets for assessing sustainability. Although divergence of opinion in design criteria has been widely discussed, this first quantification of the degree of difference in opinion is startling and calls for a radical rethink about how complementary approaches to sustainability assessments are used alongside each other to ensure a plurality of views and maximum collaboration and trust amongst stakeholders. We have to accept that people have different ways of assessing what is reliable knowledge and do so in a collaborative learning process. A useful start to a collaborative learning process is to recognize how sustainability is operationalized through scales and in different contexts. The process by which indicators and sustainability assessment tools are established may be a much more important determinant of their success than the final shape of the assessment tools. Such an emphasis on process would make assessments more transparent, transformative and enduring.
Acknowledgments
We would like to thank all the participants from TempAg and NZSD for their participation. We were also grateful for guidance and permission from Paul Hansen and Franz Ombler for deploying the 1000Minds software. We would like to acknowledge Peter Groffman and the anonymous reviewers for their constructive suggestions on an earlier version of this paper.
When experts disagree: the need to rethink indicator selection
100
This is the first paper of the Resilient Agricultural Production Systems team of the Temperate Agriculture Research Network and international collaboration initiated by OECD’s Global Science Forum. NZSD’s participation is funded by New Zealand’s Ministry for Business, Innovation and Employment (contract AGRB1201).
Chapter 5

101

102

103
Chapter 6
General discussion

104
105
1 Introduction
Sustainability assessment tools are seen as an important aid in the transition towards a more sustainable agriculture (Ness et al., 2007; Pope et al., 2004). Assessment results should give insight into the sustainability performance of farms and could support farmers, advisors and policy-makers in their decision making. The objective of this thesis was to evaluate the contribution of farm-level assessment tools to sustainable development of agriculture. The contribution of assessment tools to sustainable development depends on factors including the implementation of conclusions in practice (Chapter 3), and the scientific validity and reliability of assessment tools (Chapter 4). These factors are linked to decisions made in the development of these tools (e.g. prioritization of criteria for indicator selection) that have an influence on the assessment tool and results (Chapter 2 and 5). In this chapter, the implications of the findings of Chapter 2-5 for the contribution of assessment tools to sustainable development of agriculture are discussed.
2 Synthesis
Before discussing the contribution of farm-level assessment tools to sustainable development, I would like to address once more the functions of the tools as identified in Chapter 3. In Chapter 3, we compared the characteristics of four sustainability assessment tools. These tools aim to provide a holistic sustainability assessment at farm level (Table C.1, Chapter 3). The assessment results could be used by farmers to identify sustainability challenges and take actions towards sustainable development. Also the operationalization of the concept of sustainable development at farm level, and stimulating dialogue and awareness on sustainable development, were mentioned as tool functions.
To provide relevant assessment results that can be used to define actions towards sustainable development at farm level, tools need to be reliable (i.e. give repeatable outcomes) and valid (i.e. providing relevant information about the performance of a system) (Bockstaller et al., 2015; Schader et al., 2014). A holistic sustainability assessment should cover economic, environmental and social dimensions of sustainability (Bond et al., 2012). Moreover, when farmers are end-users, their perception of the relevance of the tools is critical for the adoption of tools and implementation of conclusions in practice (Chapter 3) (De Mey et al., 2011). The perceived relevance is dependent on factors including data availability, compatibility, output accuracy, complexity, transparency and user-friendliness (De Mey et al., 2011; Marchand et al., 2014). Ideally, a tool would combine all these aspects. The next sections describe how these different aspects are currently addressed in sustainability assessment tools.
General discussion
106
2.1 Reliability and validityIn Chapter 3, an overview of 48 sustainability assessment tools was presented. Four sustainability assessment tools complied with the selection criteria: focused at farm-level, published in a peer-reviewed journal or report, covering economic, environmental and social dimensions, suitable for application on livestock and arable farms, suitable for North-West Europe and allowing contextualization, and available in English and or Danish (for more details see Chapter 3). The four tools (RISE, SAFA, PG and IDEA) were applied in practice to analyze their characteristics and relevance for farmers (Chapter 3). The tools have many similarities (i.e. assessment level, intended user, sustainability dimensions, specificity level and purpose) but vary in their selection of indicators and themes, scoring and aggregation methods, time requirements, transparency, complexity and output accuracy (Chapter 3). Thus, even within these four tools there is a high variation in how each (sub)theme is assessed, scored and aggregated (Chapter 2 and 3).
The thematic scope and assessment results of these four sustainability assessment tools were compared in Chapter 4. The comparison revealed that the comparability of the tools was low due to the high diversity of indicators and (sub)themes, scoring and aggregation methods. This diversity is limiting possibilities to compare the assessment results and reliability of tools (Alrøe and Noe, 2016; Schader et al., 2014). In Chapter 4, we compared assessment results on the most similar subthemes being animal welfare, and showed that even then the four tools presented different results and conclusions with respect to the animal welfare performance of the farms in the study. These differences were related to variation in selected indicators, scoring and aggregation methods (e.g. number of answers, allocation of points to answers), and the auditor (i.e. farmer or external auditor). This diversity limits the ability of the tools to present similar conclusions on the sustainability performance of a farm, hence the reliability of tools. Differences in the conclusions about the sustainability performance of a farm do not only cause confusion, but also affect the trust in, and implementation of, sustainability assessments (Schader et al., 2014).
Analyzing the scientific validity of the four tools (i.e. the extent to which the indicators provide relevant information about the performance of a system) was found to be complex given the high diversity and large number of indicators (Chapter 4). The detailed description of animal welfare related subthemes (Chapter 4), however, gives insight in the diversity of indicators used to assess animal welfare. RISE, PG and IDEA predominantly include resource-based observations, whereas the use of animal-based indicators to assess animal welfare is increasingly preferred (De Vries et al., 2013a; Whay et al., 2003; Whaytt et al., 2003). Animal-based observations 'can measure the actual state of animals, regardless of how they are housed or managed' (De Vries et al., 2013a), but is time-consuming (De Vries et al., 2016; De Vries et al., 2013b). As animal welfare is only one of many topics included in sustainability assessments, time reserved to assess each topic is limited in the tools: 'A
Chapter 6
107
subtheme in the assessment may function as a quick check to reveal major shortcoming whereas a full assessment of, for example animal welfare, would require careful and prolonged observation of the animals (Grenz, 2016d)' (Chapter 4).
Decisions in the development of a tool, such as the selection of indicators, reference values and aggregation method, affect the assessment results (Chapter 2 and 4). These decisions are based on the frame of reference of those involved (i.e. norms, values, knowledge, interest and convictions), the tool function and context-related priorities (Chapter 5). Practice-based indicators (i.e. based on practices applied at farm level, e.g. measures to protect surface water from pesticides) are commonly included in sustainability assessment tools as these are easier and quicker to assess compared to performance-based indicators (i.e. effects of these practices, e.g. analysis of surface water quality) (Whitehead et al., 2016) (Chapter 2). Moreover, practice-based indicators enable the assessment of more qualitative issues that are otherwise difficult to measure (Chapter 2). The use of practice-based indicators, however, is criticized; as it is based on the assumption that when a given practice is in place the sustainability performance improves (Van Der Werf and Petit, 2002; Whitehead et al., 2016). Performance-based indicators are generally preferred when aiming for a high scientific validity, however, feasibility constraints such as data availability, time and costs can result in compromises on the scientific validity (Bockstaller et al., 2008).
2.2 RelevanceIn Chapter 3, we applied four sustainability assessment tools on five farms to evaluate the relevance of assessment tools perceived by farmers. Farmers in this study raised the importance of a context-specific approach, in which they can recognize the issues relevant in the context they are operating in. In addition, a match between the value judgements embedded in the tool and the farmers was critical for the acceptation of the tool and results. Also the accuracy (e.g. use of quantitative farm data), the way the results were communicated (i.e. graphs and tables) and the language use of the tool (i.e. phrasing of questions) played a role in the relevance perception of farmers (Chapter 3). The costs and time required for the assessment did not play a role in this study as the farmers did not have to pay for the assessment and auditor hours. This, however, might play a role when the tools are used commercially.
Farmers generally considered the sustainability assessment tools included in this study as relevant to gain insight into the sustainability performance of their farm. They were more skeptical about the possibilities to translate assessment results into action, given the complex organization of agricultural systems (Chapter 3). As a result, sustainability assessments may remain a measurement of indicators without actual change (Alrøe and Noe, 2016; Rigby et al., 2000). Without the implementation of conclusions derived from sustainability assessments the relevance of the assessments can be questioned.
General discussion

108
2.3 Trade-offs in sustainability assessment toolsThe use of practice-based indicators to make sustainability assessments quicker and easier, could reduce the scientific validity of assessment results. Trade-offs like these need to be addressed in sustainability assessment tools and often result in compromises (Morrison-Saunders and Pope, 2013; Schader et al., 2014). For example, whereas a context-specific approach was preferred by farmers, it limits the possibility to compare between farming systems in different countries (Chapter 2 and 3) (Gasso et al., 2015). Similarly, Schader et al. (2014) showed how tools with a limited thematic scope can provide a more in-depth analysis, while tools with a wide thematic scope present a less in-depth assessment. The use of indicators in itself already presents a trade-off. Sustainability indicators simplify to allow a better understanding of systems and reduce complexity to a level we can handle (Meadows, 1998). Indicators are at the same time criticized as they attempt to embrace the complexity of the world into a limited number of measures (Bell and Morse, 2008). These trade-offs have implications for the functions tools can fulfill (Gasso et al., 2015; Marchand et al., 2014). How these trade-offs are balanced is dependent on the function of the tool, the context, and frame of reference of the developers (i.e. assumptions, values, norms, knowledge and interest) (Te Velde et al., 2002). In Chapter 5, we discussed how each aspect can be considered valuable in itself, but the context in which a person operates often requires a certain prioritization of aspects.
Marchand et al. (2014) identified two extremes in sustainability assessments: full and rapid tools. Full assessments based on expert information and expert visits present a more scientifically underpinned data input and output accuracy. Such an assessment, however, generally requires more time (up to weeks) and budget, are complex, and have a low data availability, user friendliness, compatibility and transparency (Marchand et al., 2014). A rapid sustainability assessment tool is based on farmer’s knowledge and an auto-audit by a farmer, requires less time (several hours) and budget, and has a more subjective data input and output accuracy. These rapid tools have a low complexity and high data availability, user friendliness, compatibility and transparency (Marchand et al., 2014). Marchand et al. (2014) links full- and rapid sustainability assessment tools to different functions. The high accuracy in full assessments makes them suitable for monitoring and comparing the sustainability performance of farms (i.e. benchmarking). A full assessment could also be used for certification purposes. Rapid sustainability assessments could contribute to learning and can be used to initiate a dialogue with farmers regarding farm-level sustainability. Rapid tools as a learning tool could motivate farmers to monitor specific aspects more in-depth using a full assessment. Learning and monitoring functions of sustainability assessment tools have different requirements as Marchand et al. (2014) experienced in the development of the MOTIFS tool 'The objective of monitoring resulted in the development of indicators with a high-precision measurement. However, to be suited for learning purposes, indicators need to be understandable and transparent.' Distinguishing a specific function for the tool is
Chapter 6

109
important therefore as combining functions can cause tensions and negatively affect the quality of the assessment result (De Olde et al., 2016b; Triste et al., 2014).
In Chapter 3, we compared the characteristics of four tools and concluded that these can be considered as rapid, or in case of RISE, in between rapid and full tools. The position of the tools on the continuum between rapid and full, varies for the different characteristics. Time requirements of the assessments, for example, ranged from 2.5 hour for SAFA, which can be considered as rapid, to 7 hours for RISE which is in between rapid and full (Chapter 3). Compatibility and user-friendliness was evaluated as high (in line with rapid tools) for RISE, IDEA and PG, and moderate for SAFA (in between rapid and full). Moreover, all four tools combine data associated to rapid tools (i.e. farmer’s knowledge) with those associated to full tools (i.e. detailed farm data and expert information) (Marchand et al., 2014). Current sustainability assessments do not provide the validity and reliability needed for full tools (Chapter 4), but are instead suitable for functions associated to rapid tools such as learning and dialogue.
3 Contribution of sustainability assessment tools to sustainable development of agriculture
The next question that should be addressed is: What are the implications of the findings for the function of sustainability assessment tools and their contribution to sustainable development? By assessing the sustainability performance of farms using a broad set of themes and indicators, the concept of sustainable development is operationalized at farm level. Tools compared in this thesis contribute to the understanding and dissemination of the concept of sustainable development. The assessment process facilitates a reflection and discussion with farmers on the impact of the farm on environmental, economic and social themes. As such, the tools are successful in their aim to provide a holistic sustainability assessment at farm level and present a valuable method to encourage learning and raise awareness on sustainability challenges at farm level. The assessment can motivate farmers to address sustainability challenges (i.e. implementation) (Marchand et al., 2014). In that sense, as ascertained previously, the tools fulfill the function of a rapid sustainability assessment tool, as a starting point for discussing sustainability. They, however, are less suitable for full assessment tool functions of monitoring, certification or comparing sustainability performance between farms, given the limited reliability and scientific validity in current sustainability assessment tools.
Underlying the idea of assessing sustainability is the assumption that assessment results could be used to support decision making and identify actions towards sustainable development of agriculture (Binder et al., 2010). This step, however, is still a challenge. In Chapter 3, farmers
General discussion

110
indicated that implementing conclusions derived from sustainability assessments is hard given the complex organization of agricultural systems. Binder et al. (2010) also indicated that the implementation of assessment results in decision making is difficult due to conflicting goals and indicator interaction. Moreover, variability in assessment results between tools can cause confusion and hesitation to take action (Schader et al., 2014) (Chapter 4). The current reliability and validity of tools could raise doubts regarding their ability to identify sustainability challenges, and whether actions based on assessment results would actually contribute to sustainable development. This raises the need to improve the reliability and validity of assessment tools. Simultaneously, efforts to support and encourage farmers in translating assessment results into action towards sustainable development are needed. Moreover, insight in the process after the assessment, and possible implementation, is lacking. Broadening the research scope to include the implementation is needed to identify challenges in practice and feedback into improvements in the development of tools.
4 Recommendations to improve the contribution of sustainability assessments tools
Although raising awareness and learning is an important first step, implementation is critical for a sustainable development of agriculture. In addition to improving the relevance for farmers and reliability and scientific validity of assessment tools, increasing transparency, harmonization, participation and implementation of conclusions derived from sustainability assessment tools could advance the contribution of sustainability assessment tools to sustainable development.
4.1 TransparencyThe need for transparency in sustainability assessment tools is a reoccurring issue in this thesis (Chapter 2-5) and in literature (Lebacq et al., 2013; Niemeijer and De Groot, 2008; Schader et al., 2014; Thorsøe et al., 2014). Transparency is needed to understand on what perspectives, assumptions, and values, tool results are based and computed. Without this insight, sustainability assessment tools function as a black box, in which farm data is entered and a performance result comes out. This might not only give a false impression of objectiveness, as if all aspects are fixed and non-negotiable, but also limits the possibility to understand and explain the results and identify actions for improvement (Whitehead et al., 2016). This could be a reason for current challenges in implementing assessment results (Binder et al., 2010; Triste et al., 2014), and the need for additional efforts to translate assessment results into action (Chapter 3).
It is important to recognize that transparency also introduces new challenges (Boström et al., 2015; Mol, 2015). Transparency in the structure and elements of tools (i.e. selection
Chapter 6
111
of themes, indicators, reference values, aggregation method) will give insight in how the assessment results are computed. This transparency is focused on the tool itself and can be considered as an observation separate from its context (i.e. first-order observation) (Bell and Morse, 2008). Such transparency will help to explain the assessment results and identify opportunities for improvement. Detailed transparency in how a tool works, however, can be challenging for commercial assessment tools that may rather keep their tool and calculations confidential.
A sustainability assessment tool is a reflection of priorities of, and decisions made by the tool developers, in some cases in collaboration with other stakeholders. These decisions have an impact on the assessment results (Chapter 2 and 4). To understand why the assessment tool and results are what they are, sustainability assessment tools should be considered in the context of their development (i.e. second-order observation) (Bell and Morse, 2008). This includes perspectives, assumptions, and values of the tool developers. Decisions on how to assess sustainability and what is sustainable, result from discussions between the people involved in the tool development and are influenced by the individual (unconscious) tuning of frame of reference elements (i.e. knowledge, values, norms, convictions and interest) (Te Velde et al., 2002) (Chapter 5). This makes full transparency on the perspectives, values and assumptions embedded in sustainability assessments very complex and raises the need for identifying a relevant level of transparency and detail about the development of a tool.
4.2 HarmonizationAnother option to improve transparency, user-friendliness and comparability of sustainability assessments would be to harmonize approaches in assessment tools. Harmonization could be focused on terminology, content (i.e. indicators and themes), or data collection (e.g. enabling direct input from other tools). In Chapter 3 and 4, we described the diversity of terminology used to indicate the hierarchical levels in sustainability assessments. A start with harmonizing approaches in sustainability assessments was made in the SAFA guidelines developed by the FAO (FAO, 2013a) and has been adopted in literature and some tools. The recently published version of RISE (RISE 3.0, 2016), for example, is now more aligned with SAFA, both in terminology and content.
In Chapter 4, we observed a higher degree of consensus among tool developers as to which environmental subthemes and indicators to include. As sustainability assessment tools increasingly embrace all three dimensions of sustainability, more consensus on social and economic subthemes should be developed. Reviews on social and economic indicators for sustainability assessments could contribute to this process. As discussed in Chapter 4, existing tools are increasingly aligning with generally accepted tools such as the Welfare Quality® protocols for animal welfare (Grenz, 2016b; Padel, 2016). This could contribute to the harmonization, consensus and robustness of sustainability assessments.
General discussion
112
Another approach would be to focus on the harmonization of data collection. For example, harmonizing tools to enable a direct import of data that is already collected or computed on a farm (e.g. economic accounts or greenhouse gas calculations) could reduce the time required for assessments and increase the accuracy of both the input and output. This option has been introduced in RISE 3.0 (Chapter 2).
Although harmonization can contribute to the comparability of sustainability assessments, full harmonization of sustainability assessments is undesirable as it may not reflect context-specific values (e.g. on landscape quality) (Gasparatos and Scolobig, 2012; Gasso et al., 2015; Schader et al., 2014). 'Sustainability must be made operational in each specific context (e.g. forestry, agriculture), at scales relevant for its achievement, and appropriate methods must be designed for its long-term measurement' (Heinen, 1994). One-size-fits-all approaches are not suitable to address the diversity of perceptions on sustainability and variation in agricultural systems (De Boer et al., 2011; Gasso et al., 2015; Schader et al., 2014).
4.3 ParticipationA third central issue in this thesis relates to participation of stakeholders and users in the development of sustainability assessment tools. Addressing sustainability challenges requires new approaches to research and decision-making (Lang et al., 2012). The importance of a transdisciplinary approach to sustainability is increasingly recognized as it aims to 'reach out beyond science and to include aspects of practical contexts and values or normative judgements (sustainability, good-practice), as well as to feed back results into practical actions (politics, management)' (Baumgärtner et al., 2008). Studies on the development of tools raised the value of engaging stakeholders in the development of a tool to enhance dialogue and learning on sustainable development (De Mey et al., 2011; De Olde et al., 2016e; Triste et al., 2014) (Chapter 5). Involving stakeholders in the development of tools can contribute to an exchange of perspectives and values on sustainability, and bring forward sustainability issues that are important in a specific context (De Olde et al., 2016e; Gasso et al., 2015; Reed et al., 2006).
Collaborative development of tools can contribute to more robust conceptions of sustainable development and to a feeling of ownership and responsibility to sustainable development (Triste et al., 2014). Such processes, however, are confronted with differences between individual’s frame of reference (norms, values, knowledge, interest and convictions) resulting in discussions on how to balance, for example, criteria for indicator selection such as precision, efficiency and user-friendliness (Triste et al., 2014). 'Vigorous debate, argument, challenge and counter-critique, even if at times they seem futile and inconclusive, should be seen in a positive light, as part of the vital process of interpreting the concept of sustainable development in terms of workable conceptions' (Owens, 2003). Moreover, collaborative processes are often confronted with a higher investment of time and money,
Chapter 6
113
and challenges resulting from power and knowledge asymmetries (Ansell and Gash, 2008). Collaborations therefore require facilitation to develop constructive outcomes (Ansell and Gash, 2008).
Sustainability assessments are commonly developed using a top-down approach in which experts identify the indicators that are generally accepted by the scientific community (Bell and Morse, 2001; Binder et al., 2010; Reed et al., 2006). Involving stakeholders using a bottom-up approach can help to identify local sustainability issues and indicators (Reed et al., 2006). Participation can contribute to finding a shared understanding of sustainable development at farm level. The importance of finding a match between value judgements of tool developers and farmers was demonstrated in Chapter 3. In case of a mismatch of values, the results of a tool can become irrelevant for the farmer and left unused (Gasparatos and Scolobig, 2012; Vatn, 2005). Bell and Morse (2001) therefore state that 'if one is to really make SIs [sustainability indicators] effective then one should include the views of the stakeholders who are ultimately intended to benefit from them. As well as the moral side to this, there is the realistic view that if these groups are involved and engaged in SI conceptualization and development then it is far more likely that they will use and appreciate the results.' Distinctions between expert (top-down) and community-based (bottom-up) approaches, and context-specific and generic sustainability assessments, are reoccurring discussions (Gasso et al., 2015; Waas et al., 2014). The level of participation and specificity should be aligned to the function of the tool (Gasso et al., 2015). Not one unique assessment tool, but various context-specific assessment tools are needed for sustainable development of farms. The key challenge is to collaboratively identify reliable and valid sustainability issues that resonate the context, values of the involved stakeholders, and the function of the tool.
4.4 ImplementationSustainability assessments alone will not be sufficient to address current environmental, economic and social challenges. The implementation phase of sustainability assessments requires more attention in research and practice, and should be supported by internal and external drivers such as farmers’ motivation and market demand.
A lack of attention to the implementation of assessment results in decision making is a main shortcoming in research on sustainability assessments (Bell and Morse, 2001; Binder et al., 2010). A possible explanation is a scientific and historical emphasis on (improvement of) the measurement of sustainability rather than on the use of the outcomes in practice (Bell and Morse, 2001). Papers predominantly focus on describing the structure of a developed tool (i.e. themes, indicators, and aggregation method) and results of a specific case study. The process after the assessment (and possible implementation) should be included in the research scope to identify challenges in practice, evaluate the impact of actions and monitor development over a longer period of time.
General discussion
114
Although tools can identify strengths and weaknesses in the sustainability performance of a farm, additional efforts are needed to identify actions towards sustainable development (Chapter 3). Without such efforts, assessments are likely to remain a measurement without actual change (Alrøe and Noe, 2016). A follow-up of the farm assessment, for example, by developing a farm strategy together with a farm advisor, or participation in discussion groups, could help to identify such actions (Coteur et al., 2016; Marchand et al., 2014). Moreover, a modular approach in which the rapid assessment is followed by a monitoring of specific challenges using a more full assessment tool could provide a more in-depth insight in possible causes and solutions (Coteur et al., 2016; Marchand et al., 2014).
Whether indeed actions are taken towards sustainable development of agriculture depends on internal and external drivers of sustainability. Internal drivers arise from within the organization (or farm) and include personal attitudes (e.g. costs, product quality, reputation) and norms (Gabzdylova et al., 2009; Marshall et al., 2005). Farmer’s awareness, motivation and attitude towards sustainability are critical for action (Marshall et al., 2005). De Olde et al. (2016b), therefore, raise the importance of defining actions for sustainable development in relation to farmer’s intrinsic motivation. Moreover, sharing best practices in knowledge networks can further learning and awareness and support actions towards sustainable development (Hermans et al., 2013; Marshall et al., 2005).
External drivers of sustainability include market demand and regulatory requirements (Whitehead, 2016). Market demand for sustainable food products could present an incentive to change towards more sustainable practices. In case of additional costs involved in changing towards more sustainable practices, compensation is necessary to ensure economic viability of sustainable farming practices (De Greef and Casabianca, 2009; De Olde et al., 2016a). Niche products (Klerkx et al., 2012) or labels and certification schemes, which guarantee a higher price for the producer, can provide such a compensation. The assessment tools analyzed in this thesis are, as discussed previously, not suitable for certification. Certification requires a more full assessment in which the reliability and validity of the assessment results is guaranteed (Marchand et al., 2014). If one was to use the tools compared in this thesis for certification it would not only raise doubts whether having a sustainability assessment on itself qualifies as sustainable practice, or what score would be good enough (requiring an arbitrary decision), but could pressure both the auditor and interviewee towards socially desirable answers, hereby affecting the quality of the assessment, and eliminate incentives to move beyond what is needed for certification (De Olde et al., 2016b).
The popularity of labels and certification schemes (e.g. GLOBAL G.A.P.) is growing as consumers increasingly expect reporting on the impact of primary products on sustainability issues such as climate change, water, animal welfare and biodiversity (Boström et al., 2015; Vermeulen, 2015; Whitehead, 2016). Translating these complex issues into simple
Chapter 6
115
indicators to inform consumers is challenging and involves many value judgements (Röös et al., 2014). This is one of the challenges in sustainable supply chain governance (Boström et al., 2015). In addition, the development of sustainable and responsible supply chain governance is challenged by gaps related to the availability of reliable information, ensuring implementation, power relations, and credibility and legitimacy of certification (Boström et al., 2015). Limited monitoring of certification schemes and a low transparency raises concerns whether a continual improvement towards sustainable development occurs (Boström et al., 2015; Dieterich and Auld, 2015; Egels-Zandén and Lindholm, 2015).
Regulatory requirements could present a second incentive to move towards more sustainable practices. Already certain issues related to sustainability, such as labor rights, animal welfare, food quality and environmental impact, are regulated in countries including Denmark and the Netherlands (Marshall et al., 2005). Similar to certification, regulatory requirements can be criticized for not stimulating farmers to do more than the minimum. Moreover, given the globalized nature of the food system, regulatory requirements on the regional, national or even European level, can present a competitive disadvantage for farmers. Regulations are not the only institutional driver; tax benefits, research funding, and permits for farm expansion can be determined based on the implementation of sustainable practices (SER, 2016; Trujillo-Barrera et al., 2016). Such an approach, however, will raise questions on what are sustainable practices, according to who, based on what criteria, and on which time and spatial scale.
5 Towards sustainable development of agriculture
The high variability in the content and results of tools and challenging implementation of assessment results might cause skepticism about the current contribution of assessment tools to sustainable development of agriculture. Instead of turning to skepticism, this thesis should be considered as a call for reflection on current functions of, and approaches to sustainability assessments at farm level. Current sustainability assessment tools stimulate dialogue and learning and thereby provide a valuable first step towards a sustainable development of agriculture.
6 Conclusions
Current environmental, economic and social challenges urge agriculture to change to more sustainable modes of production. A large number of assessment tools have been developed to gain insight into sustainability performance at farm level. To evaluate the contribution of farm-level assessment tools to sustainable development of agriculture, this thesis analyzed
General discussion

116
current approaches to assessing sustainability. The following conclusions can be drawn from the research presented in this thesis:
Applying four sustainability assessment tools (RISE, SAFA, PG and IDEA) on Danish farms showed that context specificity, user-friendliness, complexity of the tool, language use, and a match between value judgements of tool developers and farmers, were critical factors for farmers’ perception of the relevance of tools. Moreover, farmers indicated that implementing conclusions derived from sustainability assessments is challenging given the complex organization of agricultural systems.
The four studied tools (RISE, SAFA, PG and IDEA) varied strongly in selected themes, indicators, reference values, and scoring and aggregation methods. This variability results from differences in value judgements, context and prioritizations of those involved in the development of a tool. A tool, as a collection of decisions, presents hereby a specific perspective, or lens, on sustainability at farm level.
Variability in assessment tools also results in different assessment results and conclusions on the sustainability performance of farms. This makes current assessment tools less suitable for functions that require a high reliability and validity, such as certification or benchmarking. Instead, current assessment tools present a useful starting point for discussion, reflection and learning on sustainable development of farming.
To implement conclusions derived from sustainability assessments in decision making, and enhance the contribution of tools towards sustainable development of agriculture, more attention must be paid to improving the relevance, reliability and validity of tools, and increasing transparency, harmonization, participation and implementation of assessments.
Chapter 6

117

118
119
ReferencesAcosta-Alba, I., Van Der Werf, H.M.G., 2011. The use of reference values in indicator-based methods
for the environmental assessment of agricultural systems. Sustainability 3, 424-442.ADEME, 2010. Guide des valeurs Dia’terre®. Version 1.1. Agence de l’Environnement et de la Maîtrise
de l’Energie Paris, p. 130.Agrawal, A., 2005. Environmentality. Technologies of government and the making of subjects. Duke
University Press, Durham and London, UK.Alrøe, H.F., Kristensen, E.S., 2002. Towards a systemic research methodology in agriculture: Rethinking
the role of values in science. Agriculture and Human Values 19, 3-23.Alrøe, H.F., Moller, H., Læssøe, J., Noe, E., 2016. Opportunities and challenges for multicriteria
assessment of food system sustainability. Ecology and Society 21.Alrøe, H.F., Noe, E., 2016. Sustainability assessment and complementarity. Ecology and Society 21.Andreoli, M., Tellarini, V., 2000. Farm sustainability evaluation: methodology and practice. Agriculture,
Ecosystems & Environment 77, 43-52.Ansell, C., Gash, A., 2008. Collaborative Governance in Theory and Practice. Journal of Public
Administration Research and Theory 18, 543-571.Badgley, C., Moghtader, J., Quintero, E., Zakem, E., Chappell, M.J., Avilés-Vázquez, K., Samulon, A.,
Perfecto, I., 2007. Organic agriculture and the global food supply. Renewable Agriculture and Food Systems 22, 86-108.
Barnaud, C., Van Paassen, A., 2013. Equity, Power Games, and Legitimacy: Dilemmas of Participatory Natural Resource Management. Ecology and Society 18.
Baumgärtner, S., Becker, C., Frank, K., Müller, B., Quaas, M., 2008. Relating the philosophy and practice of ecological economics: The role of concepts, models, and case studies in inter-and transdisciplinary sustainability research. Ecological Economics 67, 384-393.
Bausch, J.C., Bojórquez-Tapia, L., Eakin, H., 2014. Agro-environmental sustainability assessment using multicriteria decision analysis and system analysis. Sustainability Science, 1-17.
Bélanger, V., Vanasse, A., Parent, D., Allard, G., Pellerin, D., 2012. Development of agri-environmental indicators to assess dairy farm sustainability in Quebec, Eastern Canada. Ecological Indicators 23, 421-430.
Bell, S., Morse, S., 2001. Breaking through the glass ceiling: Who really cares about sustainability indicators? Local Environment 6, 291-309.
Bell, S., Morse, S., 2008. Sustainability Indicators: Measuring the Immeasurable? Earthscan, London, UK.
Belt, M., Blake, D., 2015. Mediated Modeling in Water Resource Dialogues Connecting Multiple Scales. JAWRA Journal of the American Water Resources Association 51, 1581-1159.
Bengtsson, J., Ahnström, J., Weibull, A.C., 2005. The effects of organic agriculture on biodiversity and abundance: A meta-analysis. Journal of Applied Ecology 42, 261-269.
Binder, C.R., Feola, G., Steinberger, J.K., 2010. Considering the normative, systemic and procedural dimensions in indicator-based sustainability assessments in agriculture. Environmental Impact Assessment Review 30, 71-81.
Binder, C.R., Schmid, A., Steinberger, J.K., 2012. Sustainability solution space of the Swiss milk value added chain. Ecological Economics 83, 210-220.
Bockstaller, C., Feschet, P., Angevin, F., 2015. Issues in evaluating sustainability of farming systems with indicators. OCL - Oilseeds and fats, crops and lipids 22, 1-12.
Bockstaller, C., Girardin, P., 2003. How to validate environmental indicators. Agricultural Systems 76, 639-653.
References
120
Bockstaller, C., Guichard, L., Keichinger, O., Girardin, P., Galan, M.B., Gaillard, G., 2009. Comparison of methods to assess the sustainability of agricultural systems. A review. Agronomy for Sustainable Development 29, 223-235.
Bockstaller, C., Guichard, L., Makowski, D., Aveline, A., Girardin, P., Plantureux, S., 2008. Agri-environmental indicators to assess cropping and farming systems. A review. Agronomy for Sustainable Development 28, 139-149.
Bond, A., Morrison-Saunders, A., Pope, J., 2012. Sustainability assessment: the state of the art. Impact Assessment and Project Appraisal 30, 53-62.
Boogaard, B.K., Boekhorst, L.J.S., Oosting, S.J., Sørensen, J.T., 2011. Socio-cultural sustainability of pig production: Citizen perceptions in the Netherlands and Denmark. Livestock Science 140, 189-200.
Bos, A.P., Groot Koerkamp, P.W.G., Gosselink, J.M.J., Bokma, S., 2009. Reflexive interactive design and its application in a project on sustainable dairy husbandry systems. Outlook on Agriculture 38, 137-145.
Boström, M., Jönsson, A.M., Lockie, S., Mol, A.P.J., Oosterveer, P., 2015. Sustainable and responsible supply chain governance: challenges and opportunities. Journal of Cleaner Production 107, 1-7.
Brundtland, G.H., 1987. Report of the World Commission on environment and development: our common future. United Nations, Oslo, Norway.
Bäckstrand, K., 2004. Scientisation vs. civic expertise in environmental governance: Eco-feminist, eco-modern and post-modern responses. Environmental Politics 13, 695-714.
Baarda, D.B., De Goede, M.P., Van Dijkum, C., 2004. Introduction to Statistics with SPSS: A Guide to the Processing, Analysing and Reporting of (research) Data. Wolters-Noordhoff, Groningen, the Netherlands.
Castellini, C., Bastianoni, S., Granai, C., Bosco, A.D., Brunetti, M., 2006. Sustainability of poultry production using the emergy approach: Comparison of conventional and organic rearing systems. Agriculture, Ecosystems & Environment 114, 343-350.
Cloquell-Ballester, V.-A., Cloquell-Ballester, V.-A., Monterde-Díaz, R., Santamarina-Siurana, M.-C., 2006. Indicators validation for the improvement of environmental and social impact quantitative assessment. Environmental Impact Assessment Review 26, 79-105.
Connor, D.J., 2008. Organic agriculture cannot feed the world. Field Crops Research 106, 187-190.Cooper, T., Hart, K., Baldock, D., 2009. The provision of public goods through agriculture in the
European Union. Report prepared for DG Agriculture and Rural Development, Contract No 30-CE-023309/00-28. Institute for European Environmental Policy, London, UK.
Coteur, I., Marchand, F., Debruyne, L., Dalemans, F., Lauwers, L., 2016. A framework for guiding sustainability assessment and on-farm strategic decision making. Environmental Impact Assessment Review 60, 16-23.
Dale, V.H., Beyeler, S.C., 2001. Challenges in the development and use of ecological indicators. Ecological indicators 1, 3-10.
Darnhofer, I., 2010. Strategies of family farms to strengthen their resilience. Environmental Policy and Governance 20, 212-222.
De Boer, I.J.M., 2003. Environmental impact assessment of conventional and organic milk production. Livestock Production Science 80, 69-77.
De Boer, I.J.M., Cederberg, C., Eady, S., Gollnow, S., Kristensen, T., Macleod, M., Meul, M., Nemecek, T., Phong, L.T., Thoma, G., Van Der Werf, H.M.G., Williams, A.G., Zonderland-Thomassen, M.A., 2011. Greenhouse gas mitigation in animal production: Towards an integrated life cycle sustainability assessment. Current Opinion in Environmental Sustainability 3, 423-431.
De Boer, I.J.M., Cornelissen, A.M.G., 2002. A method using sustainability indicators to compare conventional and animal-friendly egg production systems. Poultry Science 81, 173-181.
De Greef, K.H., Casabianca, F., 2009. The Dutch pork chain: a commodity system resisting threats from the market and society. Outlook on Agriculture 38, 167-174.
De Mey, K., D'Haene, K., Marchand, F., Meul, M., Lauwers, L., 2011. Learning through stakeholder involvement in the implementation of MOTIFS: An integrated assessment model for sustainable farming in Flanders. International Journal of Agricultural Sustainability 9, 350-363.
References
121
De Olde, E.M., Carsjens, G.J., Eilers, C.H.A.M., 2016a. The role of collaborations in the development and implementation of sustainable livestock concepts in The Netherlands. International Journal of Agricultural Sustainability, 1-16.
De Olde, E.M., Derkzen, P., Oudshoorn, F., Sørensen, C.A.G., 2016b. Lessons learned from a qualitative sustainability assessment method “Farm Talks”, 12th European IFSA Symposium, 12 – 15 July 2016, Harper Adams University, UK.
De Olde, E.M., Moller, H., Marchand, F., McDowell, R.W., MacLeod, C.J., Sautier, M., Halloy, S., Barber, A., Benge, J., Bockstaller, C., Bokkers, E.A.M., De Boer, I.J.M., Legun, K.A., Le Quellec, I., Merfield, C., Oudshoorn, F.W., Reid, J., Schader, C., Szymanski, E., Sørensen, C.A.G., Whitehead, J., Manhire, J., 2016c. When experts disagree: the need to rethink indicator selection for assessing sustainability of agriculture. Environment, Development and Sustainability, 1-16.
De Olde, E.M., Oudshoorn, F.W., Bokkers, E.A.M., Stubsgaard, A., Sørensen, C.A.G., De Boer, I.J.M., 2016d. Assessing the Sustainability Performance of Organic Farms in Denmark. Sustainability 8, 957.
De Olde, E.M., Oudshoorn, F.W., Sørensen, C.A.G., 2016e. The role of sustainability assessment tools in enhancing dialogue and joint learning in transdisciplinary research on dairy farming, 12th European IFSA Symposium, 12 – 15 July 2016, Harper Adams University, UK.
De Olde, E.M., Oudshoorn, F.W., Sørensen, C.A.G., Bokkers, E.A.M., De Boer, I.J.M., 2016f. Assessing sustainability at farm-level: Lessons learned from a comparison of tools in practice. Ecological Indicators 66, 391-404.
De Ponti, T., Rijk, B., Van Ittersum, M.K., 2012. The crop yield gap between organic and conventional agriculture. Agricultural Systems 108, 1-9.
De Ridder, W., Turnpenny, J., Nilsson, M., Von Raggamby, A., 2007. A framework for tool selection and use in integrated assessment for sustainable development. Journal of Environmental Assessment Policy and Management 9, 423-441.
De Vries, M., Bokkers, E.A.M., Van Schaik, G., Botreau, R., Engel, B., Dijkstra, T., De Boer, I.J.M., 2013a. Evaluating results of the Welfare Quality multi-criteria evaluation model for classification of dairy cattle welfare at the herd level. Journal of Dairy Science 96, 6264-6273.
De Vries, M., Bokkers, E.A.M., Van Schaik, G., Engel, B., Dijkstra, T., De Boer, I.J.M., 2016. Improving the time efficiency of identifying dairy herds with poorer welfare in a population. Journal of Dairy Science 99, 8282-8296.
De Vries, M., De Boer, I.J.M., 2010. Comparing environmental impacts for livestock products: A review of life cycle assessments. Livestock Science 128, 1-11.
De Vries, M., Engel, B., Den Uijl, I., Van Schaik, G., Dijkstra, T., De Boer, I.J.M., Bokkers, E.A.M., 2013b. Assessment time of the Welfare Quality® protocol for dairy cattle. Animal Welfare 22, 85-93.
Dieterich, U., Auld, G., 2015. Moving beyond commitments: creating durable change through the implementation of Asia Pulp and Paper's forest conservation policy. Journal of Cleaner Production 107, 54-63.
Dourmad, J.Y., Ryschawy, J., Trousson, T., Bonneau, M., Gonzàlez, J., Houwers, H.W.J., Hviid, M., Zimmer, C., Nguyen, T.L.T., Morgensen, L., 2014. Evaluating environmental impacts of contrasting pig farming systems with life cycle assessment. Animal 8, 2027-2037.
Dovers, S., 2005. Clarifying the imperative of integration research for sustainable environmental management. Journal of Research Practice 1, M1.
DST, 2014. Regnskabsstatistik for økologisk jordbrug. Danmarks Statistik, Copenhagen, Denmark.Egels-Zandén, N., Lindholm, H., 2015. Do codes of conduct improve worker rights in supply chains? A
study of Fair Wear Foundation. Journal of Cleaner Production 107, 31-40.Elsaesser, M., Jilg, T., Herrmann, K., Boonen, J., Debruyne, L., Laidlaw, A.S., Aarts, F., 2015. Quantifying
sustainability of dairy farms with the DAIRYMAN sustainability-index, European Grassland Federation. Grassland Science in Europe, Wageningen, the Netherlands, pp. 367-376.
FAO, 1989. Sustainable development and natural resources management. Paper C 89/2 - Sup. 2. Food and Agriculture Organization, Rome, Italy.
References
122
FAO, 2013a. Sustainability assessment of food and agriculture systems (SAFA): guidelines, version 3.0. Food and Agricultural Organization of the United Nations, Rome, Italy.
FAO, 2013b. Sustainability assessment of food and agriculture systems (SAFA): indicators. Food and Agricultural Organization of the United Nations, Rome, Italy.
Ferraro, P.J., Pattanayak, S.K., 2006. Money for Nothing? A Call for Empirical Evaluation of Biodiversity Conservation Investments. PLoS Biology 4, e105.
Finkbeiner, M., Schau, E.M., Lehmann, A., Traverso, M., 2010. Towards life cycle sustainability assessment. Sustainability 2, 3309-3322.
Francis, C.A., Flora, C.B., King, L.D., 1990. Sustainable agriculture in temperate zones. John Wiley & Sons, New York, USA.
Gabzdylova, B., Raffensperger, J.F., Castka, P., 2009. Sustainability in the New Zealand wine industry: drivers, stakeholders and practices. Journal of Cleaner Production 17, 992-998.
Galan, M.B., Peschard, D., Boizard, H., 2007. ISO 14 001 at the farm level: Analysis of five methods for evaluating the environmental impact of agricultural practices. Journal of Environmental Management 82, 341-352.
Gasparatos, A., 2010. Embedded value systems in sustainability assessment tools and their implications. Journal of Environmental Management 91, 1613-1622.
Gasparatos, A., Scolobig, A., 2012. Choosing the most appropriate sustainability assessment tool. Ecological Economics 80, 1-7.
Gasso, V., Oudshoorn, F.W., De Olde, E., Sørensen, C.A.G., 2015. Generic sustainability assessment themes and the role of context: The case of Danish maize for German biogas. Ecological Indicators 49, 143-153.
Gerrard, C.L., Smith, L.G., Pearce, B., Padel, S., Hitchings, R., Measures, M., Cooper, N., 2012. Public goods and farming, in: Lichtfouse, E. (Ed.), Farming for Food and Water Security. Springer, Dordrecht, 1-22.
Gibbons, J.D., Chakraborti, S., 2011. Nonparametric statistical inference. Springer, Berlin Heidelberg.Gómez-Limón, J.A., Sanchez-Fernandez, G., 2010. Empirical evaluation of agricultural sustainability
using composite indicators. Ecological Economics 69, 1062-1075.Grenz, J., 2016a. Paper on RISE. Personal Communication.Grenz, J., 2016b. RISE 3.0 Workshop SEGES. Personal communication.Grenz, J., 2016c. RISE (Response-Inducing Sustainability Evaluation). Version 2.0. HAFL, Zollikofen,
Switzerland. Available online: https://www.hafl.bfh.ch/en/research-consulting-services/agricultural-science/sustainability-and-ecosystems/sustainability-assessment/rise.html (accessed on 4 April 2016).
Grenz, J., 2016d. RISE table animal welfare. Personal communication. .Grenz, J., Schoch, M., Stämpfli, A., Thalmann, C., 2012. RISE 2.0 Field Manual. School of Agricultural,
Forest and Food Sciences (Bern University of Applied Sciences), Zollikofen, Switzerland.Grenz, J., Thalmann, C., Stämpfli, A., Studer, C., Häni, F., 2009. RISE–a method for assessing the
sustainability of agricultural production at farm level. Rural Development News 1, 5-9.Guerci, M., Knudsen, M.T., Bava, L., Zucali, M., Schönbach, P., Kristensen, T., 2013. Parameters affecting
the environmental impact of a range of dairy farming systems in Denmark, Germany and Italy. Journal of Cleaner Production 54, 133-141.
HAFL, 2014. RISE 2.0 Berechnungsformeln Version 1.1.1348.1, HAFL, Zollikofen, Switzerland.Halberg, N., Van Der Werf, H.M.G., Basset-Mens, C., Dalgaard, R., De Boer, I.J.M., 2005. Environmental
assessment tools for the evaluation and improvement of European livestock production systems. Livestock Production Science 96, 33-50.
Hansen, J., 1996. Is agricultural sustainability a useful concept? Agricultural systems 50, 117-143.Heinen, J.T., 1994. Emerging, diverging and converging paradigms on sustainable development.
International Journal of Sustainable Development & World Ecology 1, 22-33.Hermans, F.L.P., Stuiver, M., Beers, P.J., Kok, K., 2013. The distribution of roles and functions for
upscaling and outscaling innovations in agricultural innovation systems. Agricultural Systems 115, 117-128.
References
123
Herzog, F., Balázs, K., Dennis, P., Friedel, J., Geijzendorffer, I., Jeanneret, P., Kainz, M., Pointereau, P., 2012. Biodiversity indicators for European farming systems: a guidebook. Forschungsanstalt Agroscope Reckenholz-Tänikon (ART), Zürich, Switzerland.
Hjørland, B., Christensen, F.S., 2002. Work tasks and socio-cognitive relevance: A specific example. Journal of the American Society for Information Science and Technology 53, 960-965.
Häni, F., Braga, F., Stämpfli, A., Keller, T., Fischer, M., Porsche, H., 2003. RISE, a tool for holistic sustainability assessment at the farm level. International Food and Agribusiness Management Review 6, 78-90.
Häni, F., Gerber, T., Stämpfli, A., Porsche, H., Thalmann, C., Studer, C., 2006. An evaluation of tea farms in southern India with the sustainability assessment tool RISE. International Forum on Assessing Sustainability in Agriculture (INFASA), Bern, Switzerland.
Haas, G., Wetterich, F., Geier, U., 2000. Life cycle assessment framework in agriculture on the farm level. Int J Life Cycle Assessment 5, 345-348.
IFOAM, 2015. ORGANIC 3.0 for truly sustainable farming & consumption, in: Arbenz, M., Gould, D., Stopes, C. (Eds.). SOAAN & IFOAM - Organics International, ISOFAR International Organic EXPO 2015, Goesan County, South Korea.
IAASTD, 2009. Agriculture at a Crossroads: Synthesis Report, in: McIntyre, B.D. (Ed.). International Assessment of Agricultural Knowledge, Science and Technology for Development (IAASTD), Washington, USA.
Jones, C., Cowan, P., Allen, W., 2012. Setting outcomes, and measuring and reporting performance of regional council pest and weed management programmes. Guidelines and resource materials, Landcare Research Contract Report LC144. Landcare Research New Zealand Ltd, Lincoln, New Zealand.
Kates, R.W., Clark, W.C., Corell, R., Hall, J.M., Jaeger, C.C., Lowe, I., McCarthy, J.J., Schellnhuber, H.J., Bolin, B., Dickson, N.M., Faucheux, S., Gallopin, G.C., Grübler, A., Huntley, B., Jäger, J., Jodha, N.S., Kasperson, R.E., Mabogunje, A., Matson, P., Mooney, H., Moore Iii, B., O'Riordan, T., Svedin, U., 2001. Environment and development: Sustainability science. Science 292, 641-642.
Kendall, M.G., Smith, B.B., 1939. The problem of m rankings. The Annals of Mathematical Statistics 10, 275-287.
Keulen, H.V., Van Ittersum, M., Leffelaar, P., 2005. Multiscale methodological framework to derive criteria and indicators for sustainability evaluation of peasant natural resource management systems. Environment, Development and Sustainability 7, 51-69.
Klerkx, L., Van Bommel, S., Bos, A.P., Holster, H., Zwartkruis, J.V., Aarts, N., 2012. Design process outputs as boundary objects in agricultural innovation projects: Functions and limitations. Agricultural Systems 113, 39-49.
Komiyama, H., Takeuchi, K., 2006. Sustainability science: building a new discipline. Sustainability Science 1, 1-6.
Lang, D.J., Wiek, A., Bergmann, M., Stauffacher, M., Martens, P., Moll, P., Swilling, M., Thomas, C.J., 2012. Transdisciplinary research in sustainability science: practice, principles, and challenges. Sustainability Science 7, 25-43.
Le Gal, P.Y., Dugué, P., Faure, G., Novak, S., 2011. How does research address the design of innovative agricultural production systems at the farm level? A review. Agricultural Systems 104, 714-728.
Leach, K., Gerrard, C.L., Padel, S., 2013. Rapid sustainability assessment of organic and low-input farming across Europe and identification of research needs Deliverable 1.1, no. EU- SOLID project. ORC, Hamstead Marshall, Newbury, UK.
Lebacq, T., Baret, P.V., Stilmant, D., 2013. Sustainability indicators for livestock farming. A review. Agronomy for Sustainable Development 33, 311-327.
Lee, W., McGlone, M., Wright, E., 2005. Biodiversity inventory and monitoring: a review of national and international systems and a proposed framework for future biodiversity monitoring by the Department of Conservation, Landcare Research Contract Report LC0405/122, Lincoln, New Zealand.
References
124
Lélé, S., Norgaard, R.B., 1996. Sustainability and the scientist’s burden. Conservation biology 10, 354-365.
LF, 2015. Danske økologer får papir på bæredygtighed. Landbrug & Fødevarer, Copenhagen, Denmark.Lupia, A., 2013. Communicating science in politicized environments. Proceedings of the National
Academy of Sciences 110, 14048-14054.Lynch, T., Gregor, S., Midmore, D., 2000. Intelligent support systems in agriculture: how can we do
better? Animal Production Science 40, 609-620.MacRae, R.J., Frick, B., Martin, R.C., 2007. Economic and social impacts of organic production systems.
Canadian Journal of Plant Science 87, 1037-1044.Marchand, F., Debruyne, L., Lauwers, L., 2012. A comparison of complex expert-based assessment
versus quickscan assessment, International Farming Systems Association, Aarhus, Denmark.Marchand, F., Debruyne, L., Triste, L., Gerrard, C., Padel, S., Lauwers, L., 2014. Key characteristics for
tool choice in indicator-based sustainability assessment at farm level. Ecology and Society 19.Marshall, R.S., Cordano, M., Silverman, M., 2005. Exploring individual and institutional drivers of
proactive environmentalism in the US Wine industry. Business Strategy and the Environment 14, 92-109.
Marta-Costa, A.A., Silva, E., 2013. Approaches for Sustainable Farming Systems Assessment, in: Marta-Costa, A.A., Soares da Silva, E.L.D.G. (Ed.), Methods and Procedures for Building Sustainable Farming Systems. Springer, pp. 21-29.
Martinez-Alier, J., Munda, G., O'Neill, J., 1998. Weak comparability of values as a foundation for ecological economics. Ecological Economics 26, 277-286.
Mascarenhas, A., Coelho, P., Subtil, E., Ramos, T.B., 2010. The role of common local indicators in regional sustainability assessment. Ecological Indicators 10, 646-656.
McCown, R.L., 2002. Changing systems for supporting farmers' decisions: problems, paradigms, and prospects. Agricultural Systems 74, 179-220.
Meadows, D.H., 1998. Indicators and information systems for sustainable development. The Sustainability Institute, Hartland, Vermont.
Merfield, C., Manhire, J., Moller, H., Rosin, C., Norton, S., Carey, P., Hunt, L., Reid, J., Fairweather, J., Benge, J., Le Quellec, I., Campbell, H., Lucock, D., Saunders, C., MacLeod, C., Barber, A., McCarthy, A., 2015. Are organic standards sufficient to ensure sustainable agriculture? Lessons from New Zealand’s ARGOS and Sustainability Dashboard projects Sustainable Agriculture Research 4, 158-172.
Meul, M., Van Passel, S., Nevens, F., Dessein, J., Rogge, E., Mulier, A., Hauwermeiren, A.V., 2008. MOTIFS: A monitoring tool for integrated farm sustainability. Agronomy for Sustainable Development 28, 321-332.
Ministeriet for Fødevarer, 2015. Økologiplan Danmark. Sammen om mere økologi. Ministeriet for Fødevarer, Landbrug og Fiskeri, Copenhagen.
Mobjörk, M., 2010. Consulting versus participatory transdisciplinarity: A refined classification of transdisciplinary research. Futures 42, 866-873.
Mol, A.P.J., 2015. Transparency and value chain sustainability. Journal of Cleaner Production 107, 154-161.
Moller, H., MacLeod, C.J., 2013. Design criteria for effective assessment of sustainability in New Zealand’s production landscapes. NZ Sustainability Dashboard Research Report, p. 73.
Moller, H., O'Blyver, P., Bragg, C., Newman, J., Clucas, R., Fletcher, D., Kitson, J., McKechnie, S., Scott, D., Rakiura Titi Islands Administering, B., 2009. Guidelines for cross-cultural Participatory Action Research partnerships: A case study of a customary seabird harvest in New Zealand. New Zealand Journal of Zoology 36, 211-241.
Morrison-Saunders, A., Pope, J., 2013. Conceptualising and managing trade-offs in sustainability assessment. Environmental Impact Assessment Review 38, 54-63.
Muller, C., Vermeulen, W.J.V., Glasbergen, P., 2012. Pushing or Sharing as Value-driven Strategies for Societal Change in Global Supply Chains: Two Case Studies in the British–South African Fresh Fruit Supply Chain. Business Strategy and the Environment 21, 127-140.
References
125
Munda, G., 1996. Cost-benefit analysis in integrated environmental assessment: some methodological issues. Ecological Economics 19, 157-168.
Ness, B., Urbel-Piirsalu, E., Anderberg, S., Olsson, L., 2007. Categorising tools for sustainability assessment. Ecological Economics 60, 498-508.
Niemeijer, D., De Groot, R.S., 2008. A conceptual framework for selecting environmental indicator sets. Ecological Indicators 8, 14-25.
OECD, 1993. Core Set of Indicators for Environmental Performance Reviews: A Synthesis Report. OECD, Group on the State of the Environment, Paris.
OECD, 2001. Environmental indicators for agriculture. Methods and results. Organisation for Economic Co-operation and Development, Paris.
ORC, 2014a. Public Goods Tool. Organic Research Centre, Newbury, UK.ORC, 2014b. STOAS. The Organic Research Centre, Newbury, UK. Avaliable online: http://www.
organicresearchcentre.com/?go=IOTA&page=STOAS (accessed on 13 April 2016).Ostrom, E., 2009. A General Framework for Analyzing Sustainability of Social-Ecological Systems.
Science 325, 419-422.Ott, R., Longnecker, M., 2015. An introduction to statistical methods and data analysis. Cengage
Learning, Boston, USA.Owens, S., 2003. Is there a meaningful definition of sustainability? Plant Genetic Resources:
Characterization and Utilization 1, 5-9.Padel, S., 2016. PG table animal welfare. Personal communication.Parris, T.M., Kates, R.W., 2003. Characterizing and measuring sustainable development. Annual Review
of Environment and Resources 28, 559-586.Pollesch, N., Dale, V.H., 2015. Applications of aggregation theory to sustainability assessment.
Ecological Economics 114, 117-127.Popa, F., Guillermin, M., Dedeurwaerdere, T., 2015. A pragmatist approach to transdisciplinarity in
sustainability research: From complex systems theory to reflexive science. Futures 65, 45–56.Pope, J., Annandale, D., Morrison-Saunders, A., 2004. Conceptualising sustainability assessment.
Environmental Impact Assessment Review 24, 595-616.Pretty, J., 2008. Agricultural sustainability: concepts, principles and evidence. Philosophical Transactions
of the Royal Society B: Biological Sciences 363, 447-465.Pretty, J., Sutherland, W.J., Ashby, J., Auburn, J., Baulcombe, D., Bell, M., Bentley, J., Bickersteth, S.,
Brown, K., Burke, J., 2010. The top 100 questions of importance to the future of global agriculture. International journal of agricultural sustainability 8, 219-236.
Prost, L., Cerf, M., Jeuffroy, M.-H., 2012. Lack of consideration for end-users during the design of agronomic models. A review. Agronomy for Sustainable Development 32, 581-594.
Reed, M.S., Fraser, E.D.G., Dougill, A.J., 2006. An adaptive learning process for developing and applying sustainability indicators with local communities. Ecological Economics 59, 406-418.
Reganold, J.P., Wachter, J.M., 2016. Organic agriculture in the twenty-first century. Nature Plants 2, 15221.
Rigby, D., Howlett, D., Woodhouse, P., 2000. Sustainability Indicators for Natural Resource Management & Policy. Working paper 1. A Review of Indicators of Agricultural and Rural Livelihood Sustainability. Department for International Development Research, p. 29.
Röös, E., Ekelund, L., Tjärnemo, H., 2014. Communicating the environmental impact of meat production: Challenges in the development of a Swedish meat guide. Journal of Cleaner Production 73, 154-164.
Sadok, W., Angevin, F., Bergez, J.-E., Bockstaller, C., Colomb, B., Guichard, L., Reau, R., Messéan, A., Doré, T., 2009. MASC, a qualitative multi-attribute decision model for ex ante assessment of the sustainability of cropping systems. Agronomy for Sustainable Development 29, 447-461.
Sala, S., Ciuffo, B., Nijkamp, P., 2015. A systemic framework for sustainability assessment. Ecological Economics 119, 314-325.
References
126
Schader, C., Baumgart, L., Landert, J., Muller, A., Ssebunya, B., Blockeel, J., Weisshaidinger, R., Petrasek, R., Mészáros, D., Padel, S., Gerrard, C., Smith, L., Lindenthal, T., Niggli, U., Stolze, M., 2016. Using the Sustainability Monitoring and Assessment Routine (SMART) for the Systematic Analysis of Trade-Offs and Synergies between Sustainability Dimensions and Themes at Farm Level. Sustainability 8, 274.
Schader, C., Grenz, J., Meier, M.S., Stolze, M., 2014. Scope and precision of sustainability assessment approaches to food systems. Ecology and Society 19.
Schiere, J.B., Lyklema, J., Schakel, J., Rickert, K.G., 1999. Evolution of farming systems and system philosophy. Systems Research and Behavioral Science 16, 375-390.
Schindler, J., Graef, F., König, H., 2015. Methods to assess farming sustainability in developing countries. A review. Agronomy for Sustainable Development 35, 1043-1057.
Schoch, M., 2014. RISE version 2.2. Personal communication.Seimon, A., Plumptre, A.J., Watson, J.E.M., 2012. Building consensus on Albertine Rift climate change
adaptation for conservation: a report on 2011-12 workshops in Uganda and Rwanda, WCS Workshop Report. Wildlife Conservation Society (WCS), New York, USA.
Seimon, A., Yager, K., Seimon, T., Schmidt, S., Grau, A., Beck, S., García, C., Tupayachi, A., Sowell, P., Touval, J., Halloy, S., 2009. Changes in Biodiversity Patterns in the High Andes - Understanding the Consequences and Seeking Adaptation to Global Change. Mountain Forum Bulletin 9, 25-27.
SER, 2016. Versnelling van verduurzaming van de veehouderij. Sociaal-Economische Raad, Den Haag, The Netherlands.
Seufert, V., Ramankutty, N., Foley, J.A., 2012. Comparing the yields of organic and conventional agriculture. Nature 484, 229-232.
Siegel, S., 1956. Nonparametric statistics for the behavioral sciences. McGraw Hill, New York, USA.Sommerville, M.M., Milner-Gulland, E., Jones, J.P., 2011. The challenge of monitoring biodiversity in
payment for environmental service interventions. Biological Conservation 144, 2832-2841.Steinfeld, H., Gerber, P., Wassenaar, T., Castel, V., Rosales, M., De Haan, C., 2006. Livestock's long
shadow: environmental issues and options. Food and Agriculture Organization of the United Nations (FAO), Rome, Italy.
Sundrum, A., 2001. Organic livestock farming: A critical review. Livestock Production Science 67, 207-215.
Te Velde, H., Aarts, N., Van Woerkum, C., 2002. Dealing with Ambivalence: Farmers' and Consumers' Perceptions of Animal Welfare in Livestock Breeding. Journal of Agricultural and Environmental Ethics 15, 203-219.
Terkelsen, M., 2016. Medlemsbaseret landbrug inddrager bæredygtighed. 04-03-2016, Økologi & Erhverv.
Thalmann, C., Grenz, J., 2013. Factors Affecting the Implementation of Measures for Improving Sustainability on Farms Following the RISE Sustainability Evaluation, in: Marta-Costa, A.A., Soares da Silva, E.L.D.G. (Eds.), Methods and Procedures for Building Sustainable Farming Systems: Application in the European Context. Springer Netherlands, Dordrecht, pp. 107-121.
Thomassen, M.A., De Boer, I.J.M., 2005. Evaluation of indicators to assess the environmental impact of dairy production systems. Agriculture, Ecosystems and Environment 111, 185-199.
Thompson, P.B., 1992. The varieties of sustainability. Agriculture and Human Values 9, 11-19.Thorsøe, M.H., Alrøe, H.F., Noe, E., 2014. Observing the observers: uncovering the role of values in
research assessments of organic food systems. Ecology and Society 19.Tilman, D., Cassman, K.G., Matson, P.A., Naylor, R., Polasky, S., 2002. Agricultural sustainability and
intensive production practices. Nature 418, 671-677.Triste, L., Marchand, F., Debruyne, L., Meul, M., Lauwers, L., 2014. Reflection on the development
process of a sustainability assessment tool: learning from a Flemish case. Ecology and Society 19.Trujillo-Barrera, A., Pennings, J.M.E., Hofenk, D., 2016. Understanding producers' motives for adopting
sustainable practices: the role of expected rewards, risk perception and risk tolerance. European Review of Agricultural Economics.
References
127
Urutyan, V., Thalmann, C., 2011. Assessing sustainability at farm level using RISE tool: results from armenia, 2011 International Congress, August 30-September 2, 2011, Zurich, Switzerland. European Association of Agricultural Economists.
Van Calker, K.J., Berentsen, P.B.M., De Boer, I.J.M., Giesen, G.W.J., Huirne, R.B.M., 2007. Modelling worker physical health and societal sustainability at farm level: An application to conventional and organic dairy farming. Agricultural Systems 94, 205-219.
Van Calker, K.J., Berentsen, P.B.M., Romero, C., Giesen, G.W.J., Huirne, R.B.M., 2006. Development and application of a multi-attribute sustainability function for Dutch dairy farming systems. Ecological Economics 57, 640-658.
Van Cauwenbergh, N., Biala, K., Bielders, C., Brouckaert, V., Franchois, L., Garcia Cidad, V., Hermy, M., Mathijs, E., Muys, B., Reijnders, J., Sauvenier, X., Valckx, J., Vanclooster, M., Van Der Veken, B., Wauters, E., Peeters, A., 2007. SAFE-A hierarchical framework for assessing the sustainability of agricultural systems. Agriculture, Ecosystems and Environment 120, 229-242.
Van Der Werf, H.M.G., Petit, J., 2002. Evaluation of the environmental impact of agriculture at the farm level: A comparison and analysis of 12 indicator-based methods. Agriculture, Ecosystems and Environment 93, 131-145.
Van Der Werf, H.M.G., Tzilivakis, J., Lewis, K., Basset-Mens, C., 2007. Environmental impacts of farm scenarios according to five assessment methods. Agriculture, Ecosystems and Environment 118, 327-338.
Van Meensel, J., Lauwers, L., Kempen, I., Dessein, J., Van Huylenbroeck, G., 2012. Effect of a participatory approach on the successful development of agricultural decision support systems: The case of Pigs2win. Decision Support Systems 54, 164-172.
Van Passel, S., Meul, M., 2012. Multilevel and multi-user sustainability assessment of farming systems. Environmental Impact Assessment Review 32, 170-180.
Vatn, A., 2005. Rationality, institutions and environmental policy. Ecological Economics 55, 203-217.Vermeulen, W.J.V., 2015. Self-Governance for Sustainable Global Supply Chains: Can it Deliver the
Impacts Needed? Business Strategy and the Environment 24, 73-85.Vilain, L., 2008. La méthode IDEA: indicateurs de durabilité des exploitations agricoles. Educagri
éditions, Dijon, France.WCED, 1987. Our Common Future. World Commission on Environment and Development. Oxford
University Press, Oxford, UK. Whay, H.R., Main, D.C.J., Green, L.E., Webster, A.J.F., 2003. Assessment of the welfare of dairy cattle
using animal-based measurements: Direct observations and investigation of farm records. Veterinary Record 153, 197-202.
Whaytt, H.R., Main, D.C.J., Greent, L.E., Webster, A.J.F., 2003. Animal-based measures for the assessment of welfare state of dairy cattle, pigs and laying hens: consensus of expert opinion. Animal Welfare 12, 205-217.
Whitehead, J., 2016. Prioritizing Sustainability Indicators: Using Materiality Analysis to Guide Sustainability Assessment and Strategy. Business Strategy and the Environment, 1-14.
Whitehead, J., Lu, Y., Still, H., Wallis, J., Gentle, H., Moller, H., 2016. Target Setting and Burden Sharing in Sustainability Assessment beyond the Farm Level, 12th European IFSA Symposium, 12 – 15 July 2016, Harper Adams University, UK.
Wier, M., O’Doherty Jensen, K., Andersen, L.M., Millock, K., 2008. The character of demand in mature organic food markets: Great Britain and Denmark compared. Food Policy 33, 406-421.
Willer, H., Lernoud, J., 2016. The World of Organic Agriculture. Statistics and Emerging Trends 2016. Research Institute of Organic Agriculture (FIBL), Frick; IFOAM - Organics International, Bonn, Germany.
Wiskerke, J.S.C., 2009. On Places Lost and Places Regained: Reflections on the Alternative Food Geography and Sustainable Regional Development. International Planning Studies 14, 369-387.
Wittmayer, J.M., Schäpke, N., 2014. Action, research and participation: roles of researchers in sustainability transitions. Sustainability Science 9, 483–496.
References

128
Wustenberghs, H., Coteur, I., Debruyne, L., Marchand, F., 2015. Survey of Sustainability Assessment Methods. TempAg Pilot Activity 1.1.1. Institute for Agricultural and Fisheries Research (ILVO), Merelbeke, Belgium.
Waas, T., Hugé, J., Block, T., Wright, T., Benitez-Capistros, F., Verbruggen, A., 2014. Sustainability assessment and indicators: Tools in a decision-making strategy for sustainable development. Sustainability 6, 5512-5534.
Yager, K., Ulloa, D., Halloy, S., 2009. Chapter 16. Conducting an interdisciplinary workshop on climate change: facilitating awareness and adaptation in Sajama National Park, Bolivia. Hamburg University of Applied Sciences, Hamburg, Germany.
Zahm, F., Viaux, P., Vilain, L., Girardin, P., Mouchet, C., 2008. Assessing farm sustainability with the IDEA method–from the concept of agriculture sustainability to case studies on farms. Sustainable Development 16, 271-281.
Zomer, R.J., Trabucco, A., Bossio, D.A., Verchot, L.V., 2008. Climate change mitigation: A spatial analysis of global land suitability for clean development mechanism afforestation and reforestation. Agriculture, Ecosystems & Environment 126, 67-80.
References

129

130

131
SummaryAgriculture contributes significantly to the emission of greenhouse gases and increasingly competes for natural resources such as water, land and fossil energy. Moreover, concerns are raised regarding the economic viability of agriculture, and the impact on public health and animal welfare. To address these challenges, a development towards a more sustainable agriculture is needed. Decision-making regarding sustainable development of agricultural systems requires understanding of the impact of a system or of a potential innovation on sustainability. Over the past decades, therefore, a large number of sustainability assessment tools have been developed to assess the sustainability performance at farm level. Several concerns, however, are raised whether assessment results provide reliable and valid conclusions about the sustainability performance of farms, and whether these conclusions can be implemented in practice. To examine these concerns and evaluate the contribution of farm-level assessment tools to sustainable development of agriculture, this thesis analysed current approaches to assessing sustainability.
In Chapter 2, the sustainability assessment tool RISE 2.0 is described based on assessments conducted at organic farms in Denmark. The sustainability performance of 37 farms, covering four agricultural sectors (vegetable, dairy, pig and poultry), was assessed on 10 themes and 51 subthemes. Given the thresholds of RISE, the vegetable, dairy and pig sector performed positively (between 67 and 100 points) for seven themes and the poultry sector for eight themes. The performance on the nutrient flows and energy and climate themes, however, was critical (between 34 and 66 points) for all sectors. Moreover, the performance on the economic viability theme was critical for vegetable, dairy and pig farms. Analysis of the assessment results demonstrated the impact of decisions made during the development of a tool (e.g. selection of themes, indicators, reference values, scoring and aggregation method) on the assessment results. The findings emphasize the need for transparency and reflection on decisions made in sustainability assessment tools.
Although multiple studies have compared tools on a theoretical basis, little attention has been paid to comparing sustainability assessment tools in practice. In Chapter 3, we, therefore, applied four sustainability assessment tools in practice to gain insight into practical requirements, procedures and complexity involved in applying sustainability assessment tools at farm level. In addition, the relevance of the tools, as perceived by farmers, was evaluated. An overview of 48 indicator-based sustainability assessment tools was developed to, subsequently, select tools that address the environmental, social and economic dimension of sustainability, and were issued in a scientific publication and suitable for assessing the sustainability performance of livestock and arable farms in Denmark. Only
Summary
132
four tools (RISE, SAFA, PG and IDEA) complied with these selection criteria and were used to assess the sustainability performance of five Danish farms. Data requirements, assessment time, complexity, transparency and output accuracy varied between tools. Farmers perceived RISE as the most relevant tool to gain insight into the sustainability performance of their farm. Context specificity, user-friendliness, complexity of the tool, language use, and a match between value judgements of tool developers and farmers were critical factors for farmers’ perception of the relevance of tools. Farmers, moreover, indicated that implementing conclusions derived from sustainability assessments is challenging given the complex organization of agricultural systems.
Whether sustainability assessment tools assess a similar content (i.e. (sub)themes and indicators) and provide comparable assessment results, was analyzed in Chapter 4. A coverage analysis of the four tools that were selected in Chapter 3 (RISE, SAFA, PG and IDEA) revealed a high diversity in approaches to assess sustainability at farm level. Tool developers select different (sub)themes and indicators, and apply different methods for measurement and aggregation of scores. This variability in tools is caused by different perspectives on how to assess sustainability and is related to differences in context, prioritizations and value judgements of tool developers. This results not only in different tools, but limits the ability of the tools to present similar conclusions on the sustainability performance of a farm, hence the reliability of tools. Differences in conclusions about the sustainability performance of a farm do not only cause confusion, but also affect the trust in, and implementation of, sustainability assessments. Decisions made in the development of a sustainability assessment tool need to be transparent to understand and explain the results of a tool and support farmers in a sustainable development of their farm. To improve the transparency in sustainability assessment tools, we presented a framework for identifying decisions made in the different phases of developing a tool, from establishing the context, to indicator selection, and assessment and reporting. The framework describes the large number of choices involved in the development of a sustainability assessment tool and clarifies how differences between sustainability assessment tools come about.
After demonstrating the role of decisions made in the development of tools, Chapter 5 explores whether sustainability experts agreed on which criteria are most important in the selection of indicators and indicators sets for sustainability assessments. Two groups of experts (from the Temperate Agriculture Research Network and the New Zealand Sustainability Dashboard) were asked to rank the relative importance of eleven criteria for selecting individual indicators and of nine criteria for balancing a collective set of indicators. Both ranking surveys revealed a lack of consensus amongst experts about how best to measure agricultural sustainability. The findings call for a radical rethink about how complementary approaches to sustainability assessments are used alongside each other to ensure a plurality of views and maximum collaboration and trust amongst stakeholders. The
Summary
133
findings emphasise the need to account for the context of the sustainability assessment, including prioritizations of selection criteria for indicator selection, to improve transparency, relevance and robustness of sustainable assessments.
Finally, the contribution of sustainability assessment tools to sustainable development is discussed in Chapter 6. By assessing the sustainability performance of farms using a broad set of themes and indicators, the concept of sustainable development is operationalized at farm level. Tools compared in this thesis contribute to the understanding and dissemination of the concept of sustainable development. The findings in this thesis, however, also revealed a high diversity between tools in selected indicators, themes, reference values, and scoring and aggregation methods. This diversity reflects differences in context, prioritizations and value judgements of tool developers. Variability in assessment tools results in different conclusions on the sustainability performance of farms. This makes current assessment tools less suitable for functions that require a high reliability and validity, such as certification or benchmarking. Instead, current assessment tools present a useful starting point for discussion, reflection and learning on sustainable development of farming. To implement conclusions derived from sustainability assessments in decision making, and enhance the contribution of tools towards sustainable development of agriculture, more attention should be paid to increasing reliability and validity of tools, and improving transparency, harmonization, participation and implementation of assessments.
Summary

134

135
SamenvattingDe landbouw draagt bij aan de uitstoot van broeikasgassen en concurreert in toenemende mate om natuurlijke grondstoffen zoals water, land en fossiele brandstoffen. Naast de impact van de landbouw op het milieu, zijn ook de economische levensvatbaarheid van de landbouw en haar invloed op volksgezondheid en dierenwelzijn, punten van zorg. Een ontwikkeling richting een meer duurzame landbouw is nodig om deze problemen aan te pakken. Besluitvorming voor een duurzame ontwikkeling van landbouwsystemen vraagt om inzicht in de effecten van een systeem of een potentiële innovatie op duurzaamheid. In de afgelopen decennia zijn daarom een groot aantal duurzaamheidsanalysemethoden ontwikkeld om de duurzaamheidsprestatie van landbouwbedrijven te bepalen. Tegelijkertijd worden er vraagtekens geplaatst bij de betrouwbaarheid, validiteit en implementatie van conclusies van deze duurzaamheidsanalyses. Het doel van dit proefschrift is deze zorgen nader te bestuderen en de bijdrage van duurzaamheidsanalysemethoden aan duurzame ontwikkeling van de landbouw te evalueren.
Hoofdstuk 2 beschrijft de duurzaamheidsanalysemethode RISE 2.0 aan de hand van analyses van biologische landbouwbedrijven in Denemarken. De duurzaamheidsprestaties van 37 bedrijven, verdeeld over vier landbouwsectoren (groenteteelt, melkveehouderij, varkenshouderij en pluimveehouderij), zijn geanalyseerd naar 10 thema’s en 51 subthema’s. Op basis van de grenswaarden van RISE, scoorde de groente-, melkvee- en varkensbedrijven positief (tussen 67 en 100 punten) op zeven thema’s en de pluimveebedrijven op acht thema’s. De prestaties op de thema’s nutriëntenstromen en energie en klimaat waren kritisch (tussen 34 en 66 punten) voor alle sectoren. Voor groente-, melkvee- en varkensbedrijven waren de prestaties op economische levensvatbaarheid eveneens kritisch. Analyse van de resultaten wees uit dat de duurzaamheidsprestaties van een landbouwbedrijf sterk beïnvloed worden door de keuzes die gemaakt zijn tijdens het ontwikkelen van een methode, zoals de selectie van thema’s, indicatoren, referentiewaarden en score- en aggregatiemethoden. De bevindingen benadrukken daarmee het belang van transparantie en reflectie op keuzes die gemaakt worden in de ontwikkeling van duurzaamheidsanalysemethoden.
Hoewel in meerdere studies een vergelijking is gemaakt van duurzaamheidsanalysemethoden op theoretische basis, is er weinig aandacht besteed aan het vergelijken van methoden in de praktijk. In hoofdstuk 3 zijn daarom vier methoden in de praktijk toegepast om inzicht te krijgen in de eigenschappen, procedures en complexiteit van duurzaamheidsanalyses op bedrijfsniveau. Daarnaast is de relevantie van de methoden vanuit de beleving van boeren geëvalueerd. Allereerst is een overzicht gemaakt van 48 duurzaamheidsanalysemethoden. Vervolgens zijn methoden geselecteerd die: milieu, sociale en economische dimensies
Samenvatting
136
Samenvatting
van duurzaamheid omvatten, zijn gepubliceerd in een wetenschappelijke publicatie en geschikt zijn voor het beoordelen van de duurzaamheidsprestaties van veehouderij- en akkerbouwbedrijven in Denemarken. Slechts vier methoden (RISE, SAFA, PG en IDEA) voldeden aan deze selectiecriteria en werden gebruikt om de duurzaamheidsprestaties van vijf Deense landbouwbedrijven te beoordelen. De vergelijking wees uit dat data-eisen, analysetijd, complexiteit, transparantie en accuraatheid van de resultaten, varieerden tussen de methoden. Boeren beoordeelden RISE als de meest relevante methode om inzicht te krijgen in de duurzaamheidsprestatie van hun bedrijf. Kritische factoren in deze beoordeling waren de context specificiteit, gebruiksvriendelijkheid, complexiteit van de methode, taalgebruik en overeenkomsten tussen waardeoordelen van methode ontwikkelaars en boeren. Daarnaast gaven de betrokken boeren aan dat het implementeren van conclusies van een duurzaamheidsanalyse een uitdaging is door de complexe organisatie van landbouwsystemen.
Of duurzaamheidsanalysemethoden dezelfde inhoud (dat wil zeggen (sub)thema’s en indicatoren) beoordelen en tot vergelijkbare analyseresultaten komen, is geanalyseerd in hoofdstuk 4. Dezelfde vier methoden als in hoofdstuk 3 werden gebruikt om een vergelijking te maken van de inhoud van de methoden. Uit deze vergelijking bleek dat de methoden een grote diversiteit vertonen in hun aanpak om duurzaamheid te analyseren. Methode-ontwikkelaars selecteren verschillende (sub)thema’s en indicatoren en passen verschillende methoden toe om de duurzaamheidsprestaties te meten en te aggregeren. Deze diversiteit wordt veroorzaakt door verschillen in perspectieven op het analyseren van duurzaamheid en is gerelateerd aan verschillen in context, prioriteringen en waardeoordelen van methode-ontwikkelaars. Dit resulteert niet alleen in verschillende methoden, maar beperkt ook de mogelijkheid om tot vergelijkbare conclusies te komen over de duurzaamheidsprestaties van een bedrijf en heeft invloed op de betrouwbaarheid van de methoden. Verschillen in conclusies over de duurzaamheidsprestaties van een bedrijf zorgen niet alleen voor verwarring, maar hebben ook effect op het vertrouwen in, en de toepassing van, duurzaamheidsanalyses. Beslissingen in de ontwikkeling van een duurzaamheidsanalysemethode moeten daarom transparant zijn om de resultaten van een analyse te kunnen begrijpen, uit te leggen en om boeren te ondersteunen in de duurzame ontwikkeling van hun bedrijf. Om de transparantie te verbeteren is een raamwerk ontwikkeld waarin de keuzes die gemaakt worden in de ontwikkeling van methoden zijn geïdentificeerd. Het raamwerk beschrijft deze keuzes en verduidelijkt hoe verschillen tussen methoden tot stand komen.
Na het bespreken van de rol van keuzes in de ontwikkeling van duurzaamheidsanalyse-methoden, richt hoofdstuk 5 zich op één van deze keuzes, namelijk de selectie van indicatoren. In hoofdstuk 5 is verkend of duurzaamheidsexperts het eens zijn over welke criteria het meest belangrijk zijn in de selectie van (een set van) indicatoren voor duurzaamheidsanalyse. Twee groepen van experts (van de Temperate Agriculture Research Network en de New
137
Samenvatting
Zealand Sustainability Dashboard) werden gevraagd om elf criteria voor de selectie van individuele indicatoren en negen criteria voor het balanceren van een gemeenschappelijke set van indicatoren, in volgorde van belangrijkheid te zetten. De uitkomsten wezen uit dat er een gebrek is aan consensus onder experts over hoe het beste duurzaamheid in de landbouw te beoordelen. Dit vraagt om het heroverwegen van huidige benaderingen in het beoordelen van duurzaamheid om pluraliteit van perspectieven, samenwerking en vertrouwen tussen actoren te bevorderen. De resultaten benadrukken het belang van het toelichten van de context van de duurzaamheidsanalyse, inclusief prioriteringen van criteria voor het selecteren van indicatoren, om de transparantie, relevantie en robuustheid van duurzaamheidsanalyses te verbeteren.
Tenslotte wordt in hoofdstuk 6 de bijdrage van duurzaamheidsanalysemethoden aan duurzame ontwikkeling besproken. Door het analyseren van de duurzaamheidsprestaties van landbouwbedrijven middels het gebruik van een uitgebreide set van thema’s en indicatoren, wordt het concept van duurzame ontwikkeling geoperationaliseerd op bedrijfsniveau. De methoden vergeleken in dit proefschrift dragen bij aan het begrip en de verspreiding van het concept duurzame ontwikkeling. Tegelijkertijd lieten de bevindingen zien dat de duurzaamheidsmethoden sterk uiteenlopen in de selectie van thema’s, indicatoren, referentiewaarden en score- en aggregatiemethoden. Deze diversiteit is een reflectie van verschillen in de context, prioriteringen en waardeoordelen van methode-ontwikkelaars. Hierdoor kunnen analysemethoden tot verschillende conclusies komen over de duurzaamheidsprestaties van landbouwbedrijven. Dit maakt huidige duurzaamheidsanalysemethoden minder geschikt voor functies waarvoor een hoge betrouwbaarheid en validiteit vereist is, zoals in certificering. In plaats daarvan zijn ze wel geschikt als uitgangspunt voor discussie, reflectie en kennisuitwisseling over duurzame ontwikkeling in de landbouw. Om conclusies van duurzaamheidsanalyses toe te kunnen passen en de bijdrage van de methoden aan duurzame ontwikkeling van de landbouw te verbeteren, moet meer aandacht besteed worden aan het verhogen van de betrouwbaarheid en validiteit van methoden en het verbeteren van transparantie, harmonisatie, participatie en implementatie van duurzaamheidsanalyses.

138
139
Sammenfatning Landbruget bidrager væsentligt til udledningen af drivhusgasser og konkurrerer i stigende grad om naturressourcer som vand, jord og fossil energi. Ud over landbrugets indvirkning på miljøet er der også bekymringer omkring landbrugets økonomiske levedygtighed, samt indflydelse på folkesundheden og dyrevelfærd. For at imødegå disse udfordringer er der behov for udvikling mod et mere bæredygtigt landbrug. Beslutningsprocessen vedrørende bæredygtig udvikling af landbrugssystemer kræver indblik i, hvordan et system eller en potentiel innovation påvirker bæredygtigheden. I de seneste årtier er et stort antal bæredygtighedsanalysemetoder derfor udviklet til at vurdere bæredygtigheden på bedriftsniveau. Der er imidlertid rejst tvivl om bæredygtighedsanalysernes pålidelighed og gyldighed, og om hvorvidt konklusionerne kan gennemføres i praksis. Formålet med denne afhandling er at undersøge denne tvivl og evaluere bidraget fra bæredygtighedsanalysemetoder til en bæredygtig udvikling af landbruget.
Kapitel 2 beskriver bæredygtighedsanalysemetoden RISE 2.0 ud fra bæredygtighedsanalyser af økologiske landbrugsbedrifter i Danmark. Bæredygtighedsresultater fra 37 bedrifter, omfattende fire landbrugssektorer (grøntsager, kvæg, svin og fjerkræ), er blevet analyseret indenfor 10 temaer og 51 subtemaer. Baseret på referenceværdier fra RISE scorede grøntsags-, kvæg- og svineproducenter positivt (mellem 67 og 100 point) i syv temaer og fjerkræproducenter i otte temaer. Resultaterne i temaerne næringsstoffer og energi og klima var kritiske (mellem 34 og 66 point) for alle sektorer. For grøntsags-, kvæg- og svinebedrifter var resultaterne også kritiske i temaet økonomisk levedygtighed. En analyse af resultaterne viste, at de er påvirket af de metoderelaterede valg, der træffes under udviklingen af en metode, så som udvælgelse af temaer, indikatorer, referenceværdier og beregningsmetoder. Resultaterne understreger vigtigheden af transparens og refleksion over de valg taget i udviklingen af bæredygtighedsanalysemetoder.
Selvom flere studier har sammenlignet bæredygtighedsmetoder på et teoretisk grundlag, har der ikke været meget vægt på sammenligning af metoder i praksis. I kapitel 3 har vi derfor anvendt fire bæredygtighedsanalysemetoder i praksis, for at få indsigt i de praktiske krav, procedurer og den kompleksitet, det medfører at anvende metoderne på bedriftsniveau. Derudover har landmændene evalueret relevansen af metoderne fra deres perspektiv. Først lavede vi en oversigt over 48 bæredygtighedsanalysemetoder. Derefter udvalgte vi metoder, som dels omfatter miljømæssige, sociale og økonomiske dimensioner af bæredygtighed, dels er blevet offentliggjort i en videnskabelig publikation og er egnede til at vurdere bæredygtigheden af husdyr- og planteproduktion i Danmark. Kun fire metoder (RISE, SAFA, PG og IDEA) levede op til disse udvælgelseskriterier og blev derfor anvendt til at vurdere
Sammenfatning

140
bæredygtigheden på fem danske landbrugsbedrifter. En sammenligning af de fire metoder viste, at metodernes datakrav, analysetid, kompleksitet, transparens og resultaternes præcision varierede. Landmændene bedømte RISE som den mest relevante metode til at få indsigt i bæredygtigheden på deres bedrift. Kritiske faktorer i denne vurdering var kontekst specificitet, brugervenlighed, kompleksitet, ordvalg og overensstemmelse mellem landmændenes og metodeudviklernes værdisæt. Derudover anførte landmændene, at det er en udfordring at implementere konklusionerne af bæredygtighedsanalyserne på grund af landbrugssystemerne kompleksitet.
Hvorvidt bæredygtighedsanalysemetoder vurderer de samme emner (dvs. (sub)temaer og indikatorer) og har sammenlignelige resultater, er analyseret i kapitel 4. En sammenligning af de fire metoder udvalgt i kapitel 3 viste forskellige tilgange til at vurdere bæredygtigheden på bedriftsniveau. Metodeudviklere udvælger forskellige (sub)temaer og indikatorer, prioriteringer og anvender forskellige beregningsmetoder. Denne forskellighed er forårsaget af forskelle i perspektiver på bæredygtighedsanalyser og er relateret til forskelle i kontekst og værdisæt hos metodeudviklerne. Dette resulterer ikke kun i forskellige metoder, men begrænser også muligheden for at opnå sammenlignelige konklusioner om bæredygtighed på den samme landbrugsbedrift, hvilket påvirker pålideligheden af metoderne. Forskelle i konklusioner om bæredygtighed på en bedrift skaber ikke kun forvirring, men har også en indvirkning på tilliden til, og brugen af, bæredygtighedsanalyser. Beslutninger taget i udviklingen af en bæredygtighedsanalysemetode skal være transparente for at kunne forstå og forklare resultaterne af en analyse, samt støtte landmændene i en bæredygtig udvikling af deres bedrift. For at forbedre transparens har vi udviklet en struktur, som identificerer afgørelser i de forskellige faser af metodeudviklingen. Strukturen beskriver det store antal valg, som er involveret i udviklingen af en bæredygtighedsanalysemetode og forklarer, hvordan forskelle mellem metoder er opstået.
Efter at have vist betydningen af valg i udviklingen af bæredygtighedsanalysemetoder, fokuserer kapitel 5 på et af disse valg, nemlig valget af indikatorer. Kapitel 5 undersøger, om bæredygtighedseksperterne er enige om hvilke kriterier, der er de vigtigste for valg af indikatorer og indikatorsæt. To grupper af eksperter (fra Temperate Agriculture Research Network og New Zealand Sustainability Dashboard) blev bedt om at prioritere elleve kriterier for udvælgelsen af de enkelte indikatorer og ni kriterier for at afbalancere et sæt af indikatorer. Resultaterne viste mangel på konsensus blandt eksperterne om hvordan man bedst analyserer bæredygtighed i landbruget. Der er således behov for en radikal ændring i vore metoder til analyse af bæredygtighed, hvis vi skal sikre forskellighed i perspektiver, samarbejde og tillid mellem aktørerne. Resultaterne understreger behovet for at tage højde for bæredygtighedsanalysernes kontekst, herunder prioritering af kriterier for udvælgelse af indikatorer, samt øget transparens, relevans og robusthed.
Sammenfatning

141
Endelig er bæredygtighedsanalysemetodernes bidrag til bæredygtig udvikling diskuteret i kapitel 6. Ved at analysere bæredygtighed i landbruget ved hjælp af et omfattende sæt af temaer og indikatorer, er begrebet bæredygtig udvikling operationaliseret på bedriftsniveau. De metoder, der er sammenlignet i denne afhandling, bidrager til forståelsen og formidlingen af begrebet bæredygtig udvikling. Samtidig viser resultaterne, at bæredygtighedsanalysemetoder varierer meget i udvælgelsen af temaer, indikatorer, referenceværdier og beregningsmetoder. Denne forskellighed afspejler forskellen i kontekst, prioriteringer og værdisæt hos metodeudviklerne. Variationen i bæredygtighedsanalysemetoder resulterer i forskellige konklusioner om bæredygtighed på landbrugsbedrifter. Dette gør de nuværende analysemetoder mindre egnede til funktioner, der kræver en høj pålidelighed og gyldighed, såsom certificering. I stedet er de nuværende bæredygtighedsanalysemetoder et nyttigt udgangspunkt for diskussion, refleksion og læring om bæredygtig udvikling i landbruget. For at anvende konklusionerne fra bæredygtighedsanalyser og forbedre bidraget til bæredygtig landbrugsudvikling, bør der lægges mere vægt på at øge pålideligheden og gyldigheden af metoderne, samt forbedre transparens, harmonisering, medbestemmelse og implementering af bæredygtighedsanalyser.
Sammenfatning

142
143
AcknowledgementsIt has been a privilege to spend three years discussing, thinking and reading about sustainable agriculture. Discussing my research with others has been extremely valuable to get inspiration, insights and reflections. I would like to take the opportunity to thank all of you for your contributions, support and a very inspiring time.
In particular, I would like to express my gratitude to my supervisors Frank Oudshoorn, Claus Aage Grøn Sørensen, Eddie Bokkers and Imke de Boer. Frank and Claus, thank you for introducing me to Danish agriculture, for your mentorship and encouragement. Frank, thank you for your personal support and hospitality, for involving me in various projects and activities, and for joining me on my first farm visits in Denmark. Claus, I would like to thank you for giving me the valuable opportunity to explore the academic world through courses, conferences and meetings in different countries. Imke and Eddie, I really enjoyed our discussions, and I hope we will have many more in the future. Thank you for your support, openness and constructive feedback. Eddie, you are a great ‘sparringspartner’ and I really appreciate your critical perspective. Imke, your commitment to science, education and the societal debate is a great inspiration to me.
I am very thankful for the great discussions I have had with my fellow co-authors. In particular, I want to thank Henrik Moller, emeritus professor of the University of Otago, New Zealand, for his encouragement and support in the process of writing Chapter 5. It was a great adventure to coordinate the writing process and I couldn’t have done this without you. I am very grateful for the support of my dear friend and co-author, Anke Stubgaard. You taught me everything about RISE in Denmark (Chapter 2) and together we explored and discussed opportunities for sustainability assessments in Denmark. Thanks also for taking me and Hanne on trips to explore Danish (agri)culture.
My research would not have been possible without the willingness of Danish farmers and consultants to work with sustainability assessments in practice. Tusind tak!
I would like to thank my dear colleagues at the Department of Engineering at Aarhus University for their kind support and interest in my work. In particular, I want to thank the guys of Mechanical Engineering for adopting me, a female non-mechanical engineer from the Netherlands. Thanks for the fun time and for your patience with me learning Danish. Tak for en rigtig hyggelig tid med lækre kager og rundstykker.
Acknowledgements

144
I would also like to thank colleagues at the Animal Production Systems group at Wageningen University for providing a warm and inspiring environment, for valuable comments and ideas, and nice dinners.
Stays in the Netherlands were always filled with visits to friends and family. Lieve vrienden en familie, bedankt voor de fijne en gezellige tijd! Bedankt ook voor de leuke kaartjes, telefoontjes en bezoekjes aan Aarhus. Thanks also to my dear friends in Denmark, for many relaxing moments (hygge) with board games, dinners, walks, coffee and cake.
A special thanks to my paranymphs, my good friend Kawire and dear sister Marieke. Kawire, het is altijd fijn om met je af te spreken, of het nu gaat om vakinhoudelijke en politieke discussies, bordspellen, fijn eten of gewoon een kopje thee. Heel erg bedankt daarvoor! Marieke en Kendreth, het was heel bijzonder om getuige te zijn op jullie bruiloft en ik ben heel trots om peettante te mogen zijn van Aybeline. Lieve zus, ik vind het dan ook super dat je m’n paranimf bent!
Ik wil graag mijn ouders bedanken voor de geweldige steun en interesse in mijn werk en de gezellige bezoekjes aan Aarhus. Papa, ik vond het super leuk dat je regelmatig langs kwam om samen te vissen. Mama, bedankt voor de fijne telefoongesprekken en voor je nauwkeurige selectie van krantenartikelen waardoor ik goed op de hoogte bleef van ontwikkelingen in Nederland op landbouw en filosofisch gebied.
Lieve Hanne, ik ben heel bij dat je dit Deense avontuur samen aan wilde gaan. Bedankt voor je onvoorwaardelijke steun, kritische blik, goede ideeën en zo veel meer. Ik heb je lief!
Acknowledgements

145

146

147
About the authorEvelien de Olde was born in Vroomshoop in the Netherlands on April 27th 1987. In 2009, she obtained her BSc degree in Animal Husbandry with a major in Applied Animal Science from Larenstein, Wageningen. During her BSc internship at the Province of Overijssel, she became interested in the interaction between agriculture and spatial planning. This motivated her to complete two MSc studies at Wageningen University, in Animal Science and in Landscape Architecture and Planning (2013). Her first master’s thesis was carried out at the Land Use Planning Group and focused on the role of spatial planning in the development of urban agriculture. With co-author Peter Davids, she has given multiple presentations on her findings, including at the conference of the Council of Educators in Landscape Architecture in 2014, in Baltimore, USA. The conference included a juried exhibition where Evelien received an Honor Award for her artwork. Her second thesis, carried out at the Land Use Planning Group and Animal Production Systems Group, studied collaborative approaches in the development of innovative pig farms and resulted in a scientific publication (De Olde et al., 2016a). Her third thesis investigated whether serious games could be used to facilitate multi-stakeholder decision-making concerning future livestock production. After graduation, Evelien worked for half a year at the Land Use Planning Group. In March 2014, she began her PhD in the Operations Management group at the Department of Engineering at Aarhus University in Denmark. Her PhD project focused on the contribution of farm-level assessment tools to the sustainable development of agriculture. The project was carried out in collaboration with the Animal Production Systems Group at Wageningen University, as a Double Degree PhD. Her PhD thesis work was awarded the IDELLA Foundation travel grant in 2015. Evelien was member of the PhD committee at the Department of Engineering at Aarhus University and active in the International Temperate Agriculture Network (TempAg).
About the author

148
149
PublicationsRefereed scientific journalsDe Olde, E.M., Bokkers, E.A.M., De Boer, I.J.M., 2017. The choice of the sustainability assessment tool matters: differences in thematic scope and assessment results. Ecological Economics 136, 77-85.
De Olde, E.M., Oudshoorn, F.W., Bokkers, E.A.M., Stubsgaard, A., Sørensen, C.A.G., De Boer, I.J.M., 2016. Assessing the Sustainability Performance of Organic Farms in Denmark. Sustainability 8, 95.
De Olde, E.M., Carsjens, G.J., Eilers, C.H.A.M., 2016. The role of collaborations in the development and implementation of sustainable livestock concepts in The Netherlands. International Journal of Agricultural Sustainability, 1-16.
De Olde, E.M., Moller, H., Marchand, F., McDowell, R.W., MacLeod, C.J., Sautier, M., Halloy, S., Barber, A., Benge, J., Bockstaller, C., Bokkers, E.A.M., De Boer, I.J.M., Legun, K.A., Le Quellec, I., Merfield, C., Oudshoorn, F.W., Reid, J., Schader, C., Szymanski, E., Sørensen, C.A.G., Whitehead, J., Manhire, J., 2016. When experts disagree: the need to rethink indicator selection for assessing sustainability of agriculture. Environment, Development and Sustainability, 1-16.
De Olde, E.M., Oudshoorn, F.W., Sørensen, C.A.G., Bokkers, E.A.M., De Boer, I.J.M., 2016. Assessing sustainability at farm-level: Lessons learned from a comparison of tools in practice. Ecological Indicators 66, 391-404.
Gasso, V., Oudshoorn, F.W., De Olde, E.M., Sørensen, C.A.G., 2015. Generic sustainability assessment themes and the role of context: The case of Danish maize for German biogas. Ecological Indicators 49, 143–153.
Refereed conference papersDe Olde, E.M., Derkzen, P., Oudshoorn, F.W., Sørensen, C.A.G., 2016. Lessons learned from a qualitative sustainability assessment method “Farm Talks”. 12th European IFSA Symposium, 12-15 July 2016. Session 2.2 Sustainability Assessments at Farm Level for catalyzing practical change. Harper Adams University, UK. Available at: http://www.harper-adams.ac.uk/events/ifsa-conference/papers/2/2.2%20de%20Olde.pdf
Publications

150
De Olde, E.M., Oudshoorn, F.W., Sørensen, C.A.G., 2016. The role of sustainability assessment tools in enhancing dialogue and joint learning in transdisciplinary research on dairy farming. 12th European IFSA Symposium, 12-15 July 2016. Session 2.6 Management of interdisciplinary research processes. Harper Adams University, UK. Available at: http://www.harper-adams.ac.uk/events/ifsa-conference/papers/2/2.6%20Olde.pdf
De Olde, E.M., De Boer, I.J.M., 2016. Using games to support multi-stakeholder decision-making for sustainable development of livestock production. In: Aenis, T., Knierim, A., Riecher, M.C., Ridder, R., Schobert, H., Fischer, H. (eds.) Proceedings of the 11th European IFSA Symposium, 1-4 April 2014 in Berlin, Germany. Farming Systems Facing Global Challenges: Capacities and Strategies. IFSA Europe, Leibniz-Centre for Agricultural Landscape Research (ZALF), Humboldt-Universität, Berlin, Vol. 1, 24-37.
Abstracts in conference proceedingsDe Olde, E.M., Oudshoorn, F.W., Sørensen, C.A.G., 2016. Developing a tool to assess the sustainability of farms with automatic milking systems and grazing. In: Online Abstracts of the International Conference on Agricultural Engineering, CIGR - AgEng, 26-29 June 2016. Session 5.5 Sustainability of farming technologies. Aarhus, Denmark.
De Olde, E.M., Jensen, A.L., Oudshoorn, F.W., Sørensen, C.A.G., 2016. Are dairy farmers willing to invest in technology to detect lameness? In: Online Abstracts of the International Conference on Agricultural Engineering, CIGR – AgEng, 26-29 June 2016. Session 2.6 Precision Livestock Farming, animal production, health and welfare. Aarhus, Denmark.
Oudshoorn, F.W., De Olde, E.M., Stubsgaard, A., Sørensen, C.A.G., 2014. Pursue Applied Sustainability in Agriculture. In: Book of Abstracts of the IARU Sustainability Science Congress, 22-24 October 2014, Copenhagen, Denmark, p 120.
De Olde, E.M., Davids, P.R., 2014. Identity Through Food: Food Sensitive Planning in the Municipality of Ridderkerk, The Netherlands. In: Conference Proceedings Council of Educators in Landscape Architecture, 26–29 March 2014, Baltimore, Maryland, USA, p 197.
Davids, P.R., De Olde, E.M., 2014. Urban Landscape Transitions: Analyzing Urban Agriculture Initiatives in Four European Cities. In: Conference Proceedings Council of Educators in Landscape Architecture, 26–29 March 2014, Baltimore, Maryland, USA, p 226.
De Olde, E.M., Davids, P.R., Carsjens, G.J., Van Der Valk, A.J.J. 2012. Planning for urban agriculture: four European cases. In: Book of Abstracts Agriculture in an Urbanizing Society, International Conference on Multifunctional Agriculture and Urban - Rural Relations, 1-4 April 2012, Wageningen, The Netherlands, p 55.
Publications
151
OtherOudshoorn, F.W., Andersen, J.T., De Olde, E.M., 2016. Tjek bedriftens bæredygtighed - menneskeligt, økonomisk og miljømæssigt. Kvæg 4: 14-15.
De Olde, E.M., Derkzen, P., 2016. Inspired by peers: Farm Talks in biodynamic agriculture. Farming Matters 32 (1): 34-36.
De Olde, E.M., 2014. Konsulenter og landbrugslærere om bæredygtighed på bedrifterne. Økologisk Nyhedsbrev - Dansk Landbrugsrådgivning: 9-10.
De Olde, E.M., 2014. Layers in Our Landscape. Artwork presented at juried exhibit. Abstract in conference proceedings: Council of Educators in Landscape Architecture, 26-29 March 2014, Baltimore, Maryland, USA, p 335.
Van Der Lee, J., Schiere, H., Bosma, R., De Olde, E.M., Bol, S., Cornelissen, J., 2013. Aid and Trade for Livestock Development and Food Security in West Africa. Report 745, Wageningen UR Livestock Research, Lelystad.
Davids, P.R., De Olde, E.M., 2012. Chickens on the roofs and parties in the greenhouse. Urban agriculture and the facilitation of spatial planning. TOPOS 22 (2): 34-37.
Publications
152
Colophon
The research described in this thesis was financially supported by the European Union’s Seventh Framework Programme (FP7) project entitled Autograssmilk, grant number SME-2012-2-314879.
Cover design by Evelien de Olde
Printed by ProefschriftMaken

Sustainable development of agriculture:
contribution of farm-level assessment tools
Evelien de Olde
Sustainable development of agriculture: contribution of farm
-level assessment tools
Evelien de O
lde 2017