Embed Size (px)
Citation preview
CONTRIBUTION OF BORON COMPOUNDS AND NANOCLAYS ON THE
FLAME RETARDANCY OF ALUMINIUM DIETHYLPHOSPHINATE IN NEAT
AND FIBER REINFORCED POLYAMIDE-6
A THESIS SUBMITTED TO
THE GRADUATE SCHOOL OF NATURAL AND APPLIED SCIENCES
OF
MIDDLE EAST TECHNICAL UNIVERSITY
BY
OSMAN POLAT
IN PARTIAL FULFILMENT OF THE REQUIREMENTS
FOR
THE DEGREE OF DOCTOR OF PHILOSOPHY
IN
POLYMER SCIENCE AND TECHNOLOGY
DECEMBER 2014

Approval of the thesis:
CONTRIBUTION OF BORON COMPOUNDS AND NANOCLAYS ON THE
FLAME RETARDANCY OF ALUMINIUM DIETHYLPHOSPHINATE IN
NEAT AND FIBER REINFORCED POLYAMIDE-6
submitted by OSMAN POLAT in partial fulfillment of the requirements for the
degree of Doctor of Philosophy in Polymer Science and Technology Department,
Middle East Technical University by,
Prof. Dr. M. Gülbin Dural Ünver
Dean, Graduate School of Natural and Applied Sciences
Prof. Dr. Necati Özkan
Head of Department, Polymer Science and Technology
Prof. Dr. Cevdet Kaynak
Supervisor, Metalurgical and Materials Eng. Dept., METU
Examining Committee Members
Prof. Dr. Teoman Tinçer
Chemistry Dept., METU
Prof. Dr. Cevdet Kaynak
Metalurgical and Materials Eng. Dept., METU
Prof. Dr. Necati Özkan
Polymer Science and Technology Dept., METU
Assoc. Prof. Dr. H. Emrah Ünalan
Metalurgical and Materials Eng. Dept., METU
Assist. Prof. Dr. Seha Tirkeş
Chemical Eng. and Applied Chem. Dept., Atılım Univ.
Date :
iv
I hereby declare that all information in this document has been obtained and
presented in accordance with academic rules and ethical conduct. I also declare
that, as required by these rules and conduct, I have fully cited and referenced
all material and results that are not original to this work.
Name, Last name : Osman Polat
Signature :
v
ABSTRACT
CONTRIBUTION OF BORON COMPOUNDS AND NANOCLAYS ON THE
FLAME RETARDANCY OF ALUMINIUM DIETHYLPHOSPHINATE IN
NEAT AND FIBER REINFORCED POLYAMIDE-6
Polat, Osman
Ph.D., Department of Polymer Science and Technology
Supervisor : Prof. Dr. Cevdet Kaynak
December 2014, 133 pages
The main objective of this dissertation was to investigate contribution of three
different boron compounds and nanoclays to the flame retardancy of polyamide-6
and its 15 wt% short glass fiber reinforced composite with and without
an organophosphorus flame retardant aluminum diethylphosphinate. All material
combinations and nanocomposites were compounded by melt mixing method via
twin-screw extruder and the specimens for testing and analyses were shaped by
injection and compression molding.
In the first part of the thesis, effects of zinc borate (ZB) were investigated. UL-94
vertical burning, limiting oxygen index (LOI) and mass loss cone calorimetry (MLC)
analyses indicated that replacement of certain amount of aluminum
diethylphosphinate (ADP) with ZB could lead to significant improvements in many
flame retardancy parameters. For instance, the suppression in peak heat release rate
(PHRR) value of polyamide-6 could be as much as 82%, while it was only 32%
when ADP was used alone. Char microscopy, thermogravimetric analyses, X-ray
diffraction and evolved gas analyses revealed that the main contribution of ZB to the
vi
barrier mechanism of ADP was the formation of additional boron phosphate layers
together with aluminum phosphate layers.
In the second part of the thesis, effects of both boron oxide (BO) and boric acid (BA)
were investigated. In this case, there were no improvements in the values of UL-94
and LOI, but significant improvements in many MLC flame retardancy parameters of
especially the neat polyamide-6 specimens. For example, replacement of certain
amount of ADP with BO or BA resulted in PHRR suppression of polyamide-6 as
much as 84% or 86% respectively, which was only 32% when ADP was used alone.
Various analyses indicated that the main contribution of BO and BA to the barrier
mechanism of ADP was the formation of additional glassy boron oxide layers and
boron phosphate layers.
In the third part of the thesis, effects of organically modified montmorillonite type
nanoclays (NC) were investigated. Transmission electron microscopy and X-ray
diffraction analyses indicated that NC layers had intercalated/exfoliated morphology
in the polyamide-6 matrix. UL-94, LOI and MLC analyses revealed that use of only
5 wt% NC could improve many flammability parameters. Contributions of NC
silicate layers were much more significant when 5 wt% NC were used together with
15 wt% ADP. Various analyses clarified that the basic flame retardancy mechanism
of NC was the formation of insulative barrier via tortuous pathway of silicate layers
preventing the underlying polymer from heat and mass transfer during fire. It was
also found that, all the mechanical properties lost due to the use of ADP could be
compensated when its 5 wt% was replaced with NC.
Keywords: zinc borate, boron oxide, boric acid, aluminum diethylphosphinate,
nanoclays, flame retardancy, polyamide-6.
vii
ÖZ
ALÜMİNYUM DİETİLFOSFİNATIN SAF VE ELYAF TAKVİYELİ
POLİAMİD-6’DAKİ ALEVLENME DAYANIMINA BOR BİLEŞİKLERİ
VE NANOKİLİN KATKILARI
Polat, Osman
Doktora, Polimer Bilimi ve Teknolojisi Bölümü
Tez Yöneticisi : Prof. Dr. Cevdet Kaynak
Aralık 2014, 133 sayfa
Bu tezin ana amacı üç farklı bor bileşiği ve nanokilin, poliamid-6 ve onun ağırlıça
%15 kısa cam elyaf takviyeli kompozitinin alevlenme dayanımına katkılarını, alev
geciktirici bir organofosfor olan alüminyum dietilfosfinatın varlığında ve yokluğunda
incelemektir. Tüm malzeme kombinasyonları ve nanokompozitler çift vidalı
ekstrüder ile eriyik halde karıştırma yöntemi ile hazırlanmış, testler ve analizler için
gereken numuneler ise enjeksiyon ve basınçlı kalıplama yöntemleri ile
şekillendirilmiştir.
Tezin ilk bölümünde çinko boratın (ZB) etkileri araştırılmıştır. UL-94 dikey yanma,
oksijen limiti indeksi (LOI) ve kütle kaybı konik kalorimetre (MLC) analizleri belirli
miktarda alüminyum dietilfosfinatın (ADP) yerine ZB kullanımının pek çok
alevlenme dayanımı parametrelerini önemli ölçüde iyileştirdiğini göstermiştir.
Örneğin, poliamid-6’nın ısı açığa çıkma hızı tavan (PHRR) değerindeki azalma tek
başına ADP kullanıldığı zaman sadece %32 iken, ZB eklentisi ile %82’ye kadar
yükselmiştir. Küllerin morfolojik analizleri, termogravimetrik analiz (TGA), X-ışını
kırınımı (XRD) ve çıkan gaz analizleri (EGA), ZB’nin ana katkısının ADP’nin
viii
alüminyum fosfinat tabakaları ile oluşan bariyer mekanizmasına bor fosfat
tabakalarının eklenmesi yoluyla olduğunu açığa çıkarmıştır.
Tezin ikinci bölümünde bor oksit (BO) ve borik asitin (BA) etkileri araştırılmıştır.
Bu bölümde, UL-94 ve LOI değerlerinde iyileşmeler görülmemiştir, ancak özellikle
poliamid-6 numunelerinin pek çok MLC alevlenme dayanımı parametrelerinde
önemli iyileşmeler kaydedilmiştir. Örneğin belirli bir miktar ADP’nin BO veya BA
ile yer değiştirmesi paliamid-6 numunelerinin PHRR değerini sırası ile %84 ve %86
bastırmıştır, oysa bu değer tek başına ADP kullanıldığı durumda yalnızca %32’dir.
Çeşitli analizler BO ve BA’nın ana katkılarının ADP’nin bariyer mekanizmasına ek
olarak oluşan camsı bor oksit tabakaları ve bor fosfat tabakaları ile olduğunu,
göstermiştir.
Tezin üçüncü bölümünde ise organik olarak modifiye edilmiş montmorillonit türü
nanokilin (NC) etkileri araştırılmıştır. Geçirimli electron mikroskopu ve x-ışını
kırınımı analizleri NC tabakalarının polyamide-6 matrisi içerisinde interkale/exfoliye
morfolojiye sahip olduklarını göstermiştir. UL-94, LOI ve MLC analizleri yalnızca
ağ. %5 NC kullanımının pek çok alevlenme dayanımı parametrelerini iyileştirdiğini
açığa çıkarmıştır. NC silikat tabakalarının katkıları ağ. %5 NC ile ağ. %15 ADP
birlikte kullanıldığında çok daha önemli olmaktadır. Yapılan çeşitli analizler NC’nin
temel alevlenme dayanımı mekanizmasının silika tabakalarının oluşturduğu
dolambaçlı yalıtkan yollar içeren bariyer olduğunu böylece yangın sırasında alttaki
polimer tabakasını ısı ve kütle transferinden koruduğunu göstermiştir. Ayrıca, ADP
kullanımı ile düşen tüm mekanik özelliklerin ağ. %5’nin NC ile yer değiştirmesi ile
tamamen telafi edildiği gözlemlenmiştir.
Anahtar sözcükler: çinko borat, bor oksit, borik asit, alüminyum dietilfosfinat,
nanokil, alevlenme dayanımı, poliamid-6.

ix
to my mother, brother and sister
to the memory of my father
x
ACKNOWLEDGMENTS
I express my sincere appreciation to Prof. Dr. Cevdet Kaynak for his guidance,
support and encouragement throughout this study.
I would also like to express my gratitude to my thesis supervising committee
members Prof. Dr. Necati Özkan and Assoc. Prof. Dr. H. Emrah Ünalan for their
valuable discussions and contributions to this thesis.
I would like to thank BOREN National Boron Research Institute for the grant with
the project number 2009-Ç-0236, and Eti Mine Works Inc. for providing boron
compounds.
I would like to thank all the technical staff and administrative board of the
Metallurgical and Materials Engineering Department for supplying all the research
facilities required in this thesis. I would also like to thank to METU Central
Laboratory for TEM analyses and METU Wind Energy Center for supplying
TGA-FTIR coupled system.
I specially thank to my laboratory mates, N. Ali Işıtman, A. Çağıl Özkaraca,
B. Melike Sipahioğlu, Esin İbibikcan, Seçil Şankal, İlker Kaygusuz, Yelda Meyva
and A. Rıza Erdoğan for their kindly friendship and helps.
And my deep thanks are to my mother Nursabah Polat, my younger brother
Ahmet Polat and my sister Özlem Polat for their understanding, encouragement and
patience.
xi
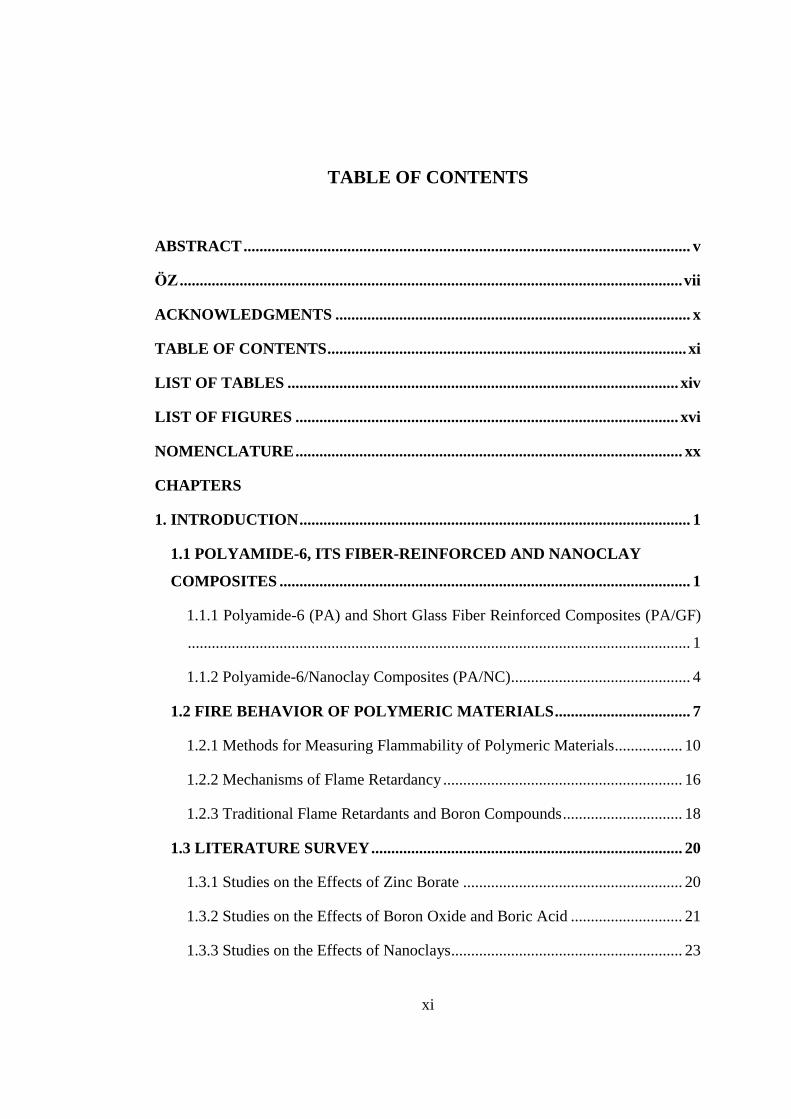
TABLE OF CONTENTS
ABSTRACT ................................................................................................................ v
ÖZ .............................................................................................................................. vii
ACKNOWLEDGMENTS ......................................................................................... x
TABLE OF CONTENTS .......................................................................................... xi
LIST OF TABLES .................................................................................................. xiv
LIST OF FIGURES ................................................................................................ xvi
NOMENCLATURE ................................................................................................. xx
CHAPTERS
1. INTRODUCTION .................................................................................................. 1
1.1 POLYAMIDE-6, ITS FIBER-REINFORCED AND NANOCLAY
COMPOSITES ....................................................................................................... 1
1.1.1 Polyamide-6 (PA) and Short Glass Fiber Reinforced Composites (PA/GF)
.............................................................................................................................. 1
1.1.2 Polyamide-6/Nanoclay Composites (PA/NC) ............................................. 4
1.2 FIRE BEHAVIOR OF POLYMERIC MATERIALS .................................. 7
1.2.1 Methods for Measuring Flammability of Polymeric Materials ................. 10
1.2.2 Mechanisms of Flame Retardancy ............................................................ 16
1.2.3 Traditional Flame Retardants and Boron Compounds .............................. 18
1.3 LITERATURE SURVEY .............................................................................. 20
1.3.1 Studies on the Effects of Zinc Borate ....................................................... 20
1.3.2 Studies on the Effects of Boron Oxide and Boric Acid ............................ 21
1.3.3 Studies on the Effects of Nanoclays.......................................................... 23
xii
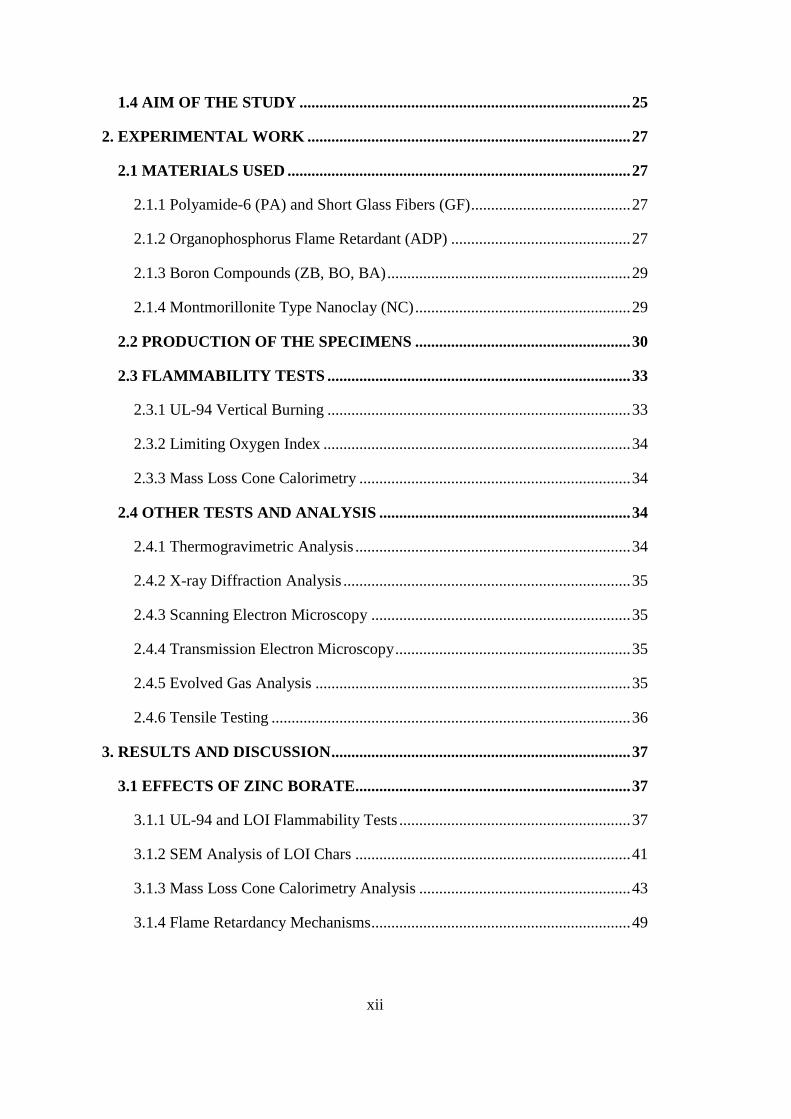
1.4 AIM OF THE STUDY ................................................................................... 25
2. EXPERIMENTAL WORK ................................................................................. 27
2.1 MATERIALS USED ...................................................................................... 27
2.1.1 Polyamide-6 (PA) and Short Glass Fibers (GF) ........................................ 27
2.1.2 Organophosphorus Flame Retardant (ADP) ............................................. 27
2.1.3 Boron Compounds (ZB, BO, BA) ............................................................. 29
2.1.4 Montmorillonite Type Nanoclay (NC) ...................................................... 29
2.2 PRODUCTION OF THE SPECIMENS ...................................................... 30
2.3 FLAMMABILITY TESTS ............................................................................ 33
2.3.1 UL-94 Vertical Burning ............................................................................ 33
2.3.2 Limiting Oxygen Index ............................................................................. 34
2.3.3 Mass Loss Cone Calorimetry .................................................................... 34
2.4 OTHER TESTS AND ANALYSIS ............................................................... 34
2.4.1 Thermogravimetric Analysis ..................................................................... 34
2.4.2 X-ray Diffraction Analysis ........................................................................ 35
2.4.3 Scanning Electron Microscopy ................................................................. 35
2.4.4 Transmission Electron Microscopy ........................................................... 35
2.4.5 Evolved Gas Analysis ............................................................................... 35
2.4.6 Tensile Testing .......................................................................................... 36
3. RESULTS AND DISCUSSION ........................................................................... 37
3.1 EFFECTS OF ZINC BORATE..................................................................... 37
3.1.1 UL-94 and LOI Flammability Tests .......................................................... 37
3.1.2 SEM Analysis of LOI Chars ..................................................................... 41
3.1.3 Mass Loss Cone Calorimetry Analysis ..................................................... 43
3.1.4 Flame Retardancy Mechanisms ................................................................. 49
xiii
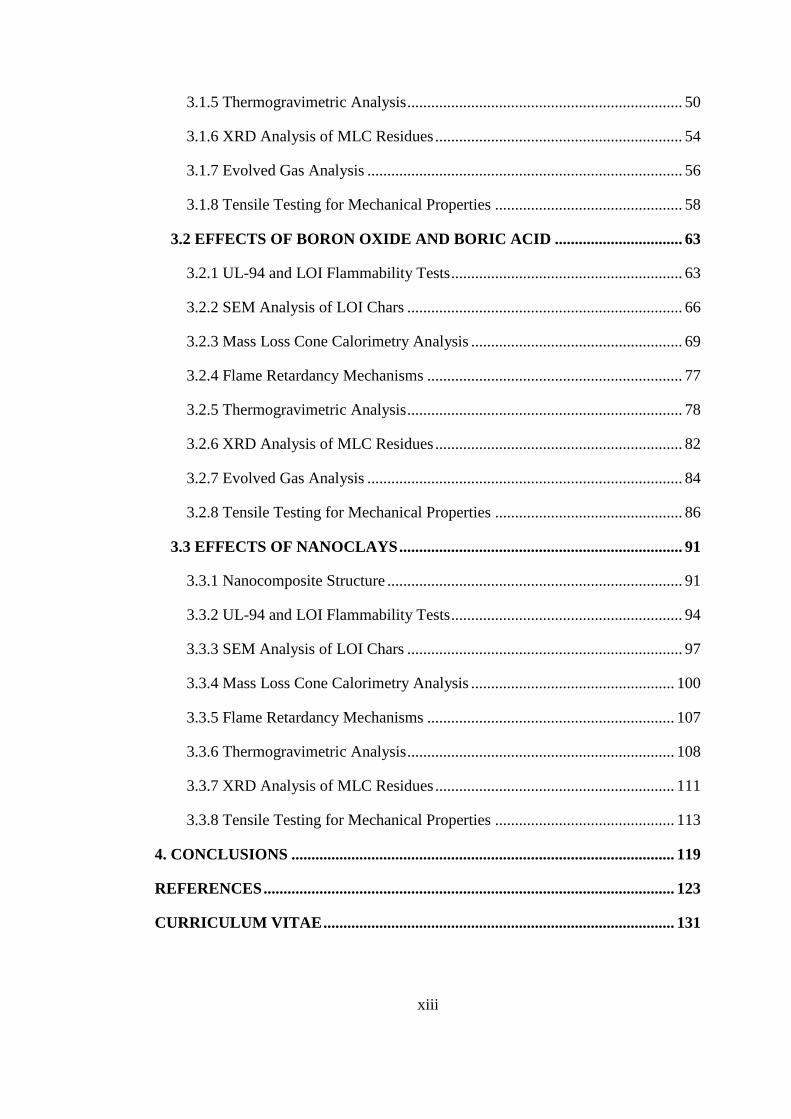
3.1.5 Thermogravimetric Analysis ..................................................................... 50
3.1.6 XRD Analysis of MLC Residues .............................................................. 54
3.1.7 Evolved Gas Analysis ............................................................................... 56
3.1.8 Tensile Testing for Mechanical Properties ............................................... 58
3.2 EFFECTS OF BORON OXIDE AND BORIC ACID ................................ 63
3.2.1 UL-94 and LOI Flammability Tests .......................................................... 63
3.2.2 SEM Analysis of LOI Chars ..................................................................... 66
3.2.3 Mass Loss Cone Calorimetry Analysis ..................................................... 69
3.2.4 Flame Retardancy Mechanisms ................................................................ 77
3.2.5 Thermogravimetric Analysis ..................................................................... 78
3.2.6 XRD Analysis of MLC Residues .............................................................. 82
3.2.7 Evolved Gas Analysis ............................................................................... 84
3.2.8 Tensile Testing for Mechanical Properties ............................................... 86
3.3 EFFECTS OF NANOCLAYS ....................................................................... 91
3.3.1 Nanocomposite Structure .......................................................................... 91
3.3.2 UL-94 and LOI Flammability Tests .......................................................... 94
3.3.3 SEM Analysis of LOI Chars ..................................................................... 97
3.3.4 Mass Loss Cone Calorimetry Analysis ................................................... 100
3.3.5 Flame Retardancy Mechanisms .............................................................. 107
3.3.6 Thermogravimetric Analysis ................................................................... 108
3.3.7 XRD Analysis of MLC Residues ............................................................ 111
3.3.8 Tensile Testing for Mechanical Properties ............................................. 113
4. CONCLUSIONS ................................................................................................ 119
REFERENCES ....................................................................................................... 123
CURRICULUM VITAE ........................................................................................ 131
xiv
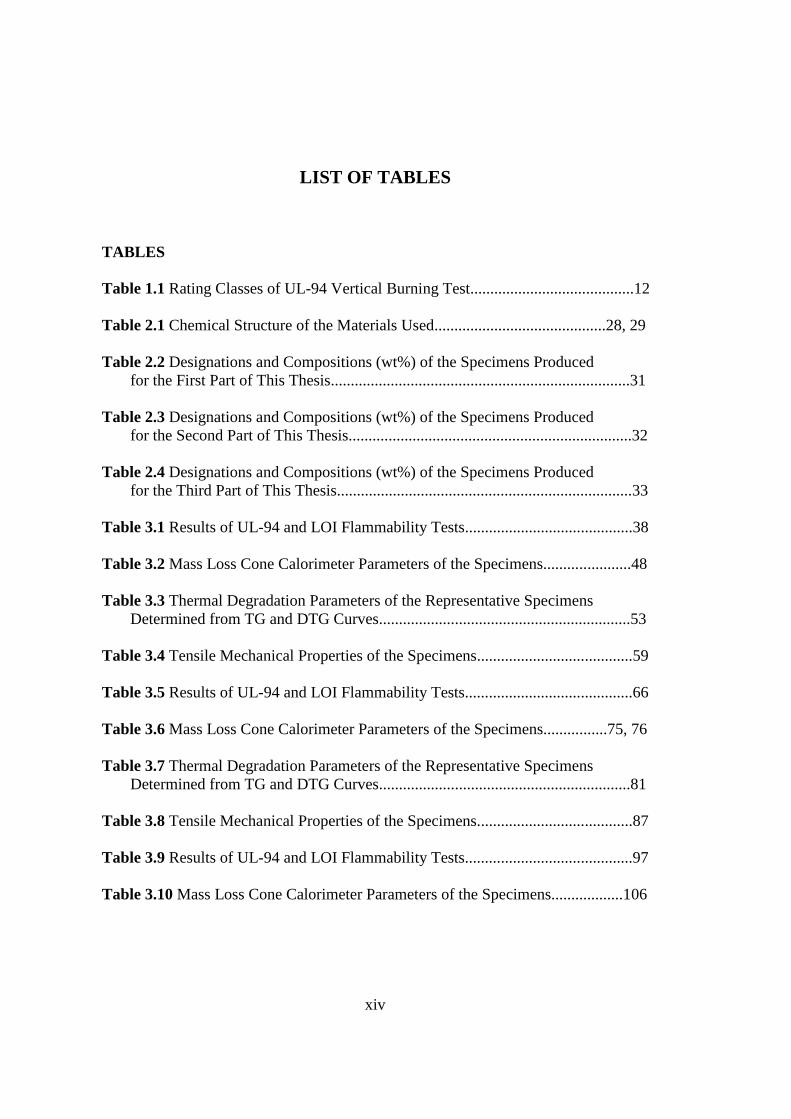
LIST OF TABLES
TABLES
Table 1.1 Rating Classes of UL-94 Vertical Burning Test.........................................12
Table 2.1 Chemical Structure of the Materials Used...........................................28, 29
Table 2.2 Designations and Compositions (wt%) of the Specimens Produced
for the First Part of This Thesis...........................................................................31
Table 2.3 Designations and Compositions (wt%) of the Specimens Produced
for the Second Part of This Thesis.......................................................................32
Table 2.4 Designations and Compositions (wt%) of the Specimens Produced
for the Third Part of This Thesis..........................................................................33
Table 3.1 Results of UL-94 and LOI Flammability Tests..........................................38
Table 3.2 Mass Loss Cone Calorimeter Parameters of the Specimens......................48
Table 3.3 Thermal Degradation Parameters of the Representative Specimens
Determined from TG and DTG Curves...............................................................53
Table 3.4 Tensile Mechanical Properties of the Specimens.......................................59
Table 3.5 Results of UL-94 and LOI Flammability Tests..........................................66
Table 3.6 Mass Loss Cone Calorimeter Parameters of the Specimens................75, 76
Table 3.7 Thermal Degradation Parameters of the Representative Specimens
Determined from TG and DTG Curves...............................................................81
Table 3.8 Tensile Mechanical Properties of the Specimens.......................................87
Table 3.9 Results of UL-94 and LOI Flammability Tests..........................................97
Table 3.10 Mass Loss Cone Calorimeter Parameters of the Specimens..................106
xv
Table 3.11 Thermal Degradation Parameters of the Specimens Determined
from TG and DTG Curves.................................................................................110
Table 3.12 Tensile Mechanical Properties of the Specimens...................................114
xvi
LIST OF FIGURES
FIGURES
Figure 1.1 Synthesis of Polyamide-6 by Hydrolytic Polymerization..........................2
Figure 1.2 Synthesis of Polyamide-6 by Anionic Polymerization...............................3
Figure 1.3 Two Different Thermal Degradation Mechanisms of Polyamide-6...........4
Figure 1.4 Layered Structure of Montmorillonite Clays.............................................5
Figure 1.5 Formation of Micro- and Nanocomposite Structures.................................7
Figure 1.6 Three Ingredients of Polymer Combustion................................................8
Figure 1.7 Stages of Polymer Combustion................................................................10
Figure 1.8 UL-94 Vertical Burning Test Setup.........................................................11
Figure 1.9 Limiting Oxygen Index Test Setup..........................................................13
Figure 1.10 Mass Loss Cone Calorimetry Test Setup...............................................14
Figure 1.11 Structure of Some Organophosphorus Flame Retardants......................19
Figure 3.1 Photographs of the Representative Specimens after UL-94 Test.............39
Figure 3.2 Photographs of the Representative Specimens after LOI Test.................40
Figure 3.3 SEM Images Showing Surface Char Barriers of the Representative
PA Based Materials.............................................................................................41
Figure 3.4 SEM Images Showing Surface Char Barriers of the Representative
PA/GF Based Materials.......................................................................................42
Figure 3.5 Photographs of the Remaining Char Structure of MLC Specimens
of the Representative PA Based Materials..........................................................44
xvii
Figure 3.6 Photographs of the Remaining Char Structure of MLC Specimens
of the Representative PA/GF Based Materials....................................................45
Figure 3.7 Heat Release Rate and Mass Loss Rate Curves for the PA Based
Materials..............................................................................................................46
Figure 3.8 Heat Release Rate and Mass Loss Rate Curves for the PA/GF Based
Materials..............................................................................................................47
Figure 3.9 Thermogravimetric (TG) and Differential Thermogravimetric
(DTG) Curves for the Representative PA Based Materials.................................52
Figure 3.10 XRD Patterns of the MLC Residues of the Representative
PA Based Materials.............................................................................................55
Figure 3.11 Evolved Gas Analysis Spectra of the Representative PA Based
Materials..............................................................................................................57
Figure 3.12 Tensile Stress-Strain Curves of the (a) PA and (b) PA/GF Based
Materials..............................................................................................................60
Figure 3.13 SEM Fractographs of the Representative PA Based Materials..............61
Figure 3.14 SEM Fractographs of the Representative PA/GF Based Materials........62
Figure 3.15 Photographs of the Representative Specimens after UL-94 Test...........64
Figure 3.16 Photographs of the Representative Specimens after LOI Test...............65
Figure 3.17 SEM Images Showing Surface Char Barriers of the Representative
PA Based Materials.............................................................................................67
Figure 3.18 SEM Images Showing Surface Char Barriers of the Representative
PA/GF Based Materials.......................................................................................68
Figure 3.19 Photographs of the Remaining Char Structure of MLC Specimens
of the Representative PA Based Materials..........................................................71
Figure 3.20 Photographs of the Remaining Char Structure of MLC Specimens
of the Representative PA/GF Based Materials....................................................72
Figure 3.21 Heat Release Rate and Mass Loss Rate Curves for the PA Based
Materials..............................................................................................................73
xviii
Figure 3.22 Heat Release Rate and Mass Loss Rate Curves for the PA/GF
Based Materials...................................................................................................74
Figure 3.23 Thermogravimetric (TG) and Differential Thermogravimetric
(DTG) Curves for the Representative PA Based Materials.................................80
Figure 3.24 XRD Patterns of the MLC Residues of the Representative
PA Based Materials.............................................................................................83
Figure 3.25 Evolved Gas Analysis Spectra of the Representative PA Based
Materials..............................................................................................................85
Figure 3.26 Tensile Stress-Strain Curves of the (a) PA and (b) PA/GF Based
Materials..............................................................................................................88
Figure 3.27 SEM Fractographs of the Representative PA Based Materials..............89
Figure 3.28 SEM Fractographs of the Representative PA/GF Based Materials........90
Figure 3.29 XRD Patterns of the Nanoclay and Nanocomposite Specimens............92
Figure 3.30 TEM Images Showing (i) and (ii) Uniform Distribution, (iii) and (iv)
Intercalated and Partly Exfoliated Structure of NC Silicate Layers in
PA Matrix............................................................................................................93
Figure 3.31 Photographs of the Specimens after UL-94 Test....................................95
Figure 3.32 Photographs of the Specimens after LOI Test........................................96
Figure 3.33 SEM Images Showing Surface Char Barriers of the PA Based
Materials..............................................................................................................98
Figure 3.34 SEM Images Showing Surface Char Barriers of the PA/GF Based
Materials..............................................................................................................99
Figure 3.35 Photographs of the Remaining Char Structure of MLC Specimens
of the PA Based Materials.................................................................................102
Figure 3.36 Photographs of the Remaining Char Structure of MLC Specimens
of the PA/GF Based Materials...........................................................................103
Figure 3.37 Heat Release Rate and Mass Loss Rate Curves for the PA Based
Materials............................................................................................................104
xix
Figure 3.38 Heat Release Rate and Mass Loss Rate Curves for the PA/GF
Based Materials..................................................................................................105
Figure 3.39 Thermogravimetric (TG) and Differential Thermogravimetric
(DTG) Curves for the PA Based Materials........................................................109
Figure 3.40 XRD Patterns of the MLC Residues of the PA Based Materials.........112
Figure 3.41 Tensile Stress-Strain Curves of the (a) PA and (b) PA/GF Based
Materials............................................................................................................115
Figure 3.42 SEM Fractographs of the PA Based Materials.....................................116
Figure 3.43 SEM Fractographs of the PA/GF Based Materials...............................117
xx
NOMENCLATURE
ADP aluminum diethylphosphinate
BA boric acid
BO boron oxide
DTG differential thermogravimetry
FGI fire growth index
FIGRA fire growth rate
FTIR Fourier-transform infrared spectroscopy
GF glass fiber
HRR heat release rate
LOI limiting oxygen index
MLR mass loss rate
NC nanoclays
OP organophosphorus compounds
PA polyamide-6
PHRR peak heat release rate
SEM scanning electron microscopy
TBT total burning time
TEM transmission electron microscopy
THE total heat evolved
TGA thermogravimetric analysis
TML total mass loss
TPHRR time to peak heat release rate
TTI time to ignition
XRD X-ray diffraction
ZB zinc borate
1
CHAPTER 1
INTRODUCTION
1.1 POLYAMIDE-6, ITS FIBER-REINFORCED AND NANOCLAY
COMPOSITES
1.1.1 Polyamide-6 (PA) and Short Glass Fiber Reinforced Composites (PA/GF)
Polyamide-6 (PA) is a member of large polyamide family which is characterized
with -(C=ONH)- structure in the backbone of the chain. It is a widely used
engineering polymer with sufficient performance in terms of melting point, physical
properties, resistance to chemicals and solvents, electrical insulation and dimensional
stability. Moreover, PA can be reinforced with short glass fibers and other additives
to produce its composites for those applications requiring higher engineering
performance. Therefore, PA and its composites are used in many sectors including
electrical-electronics, automotive and textile industry.
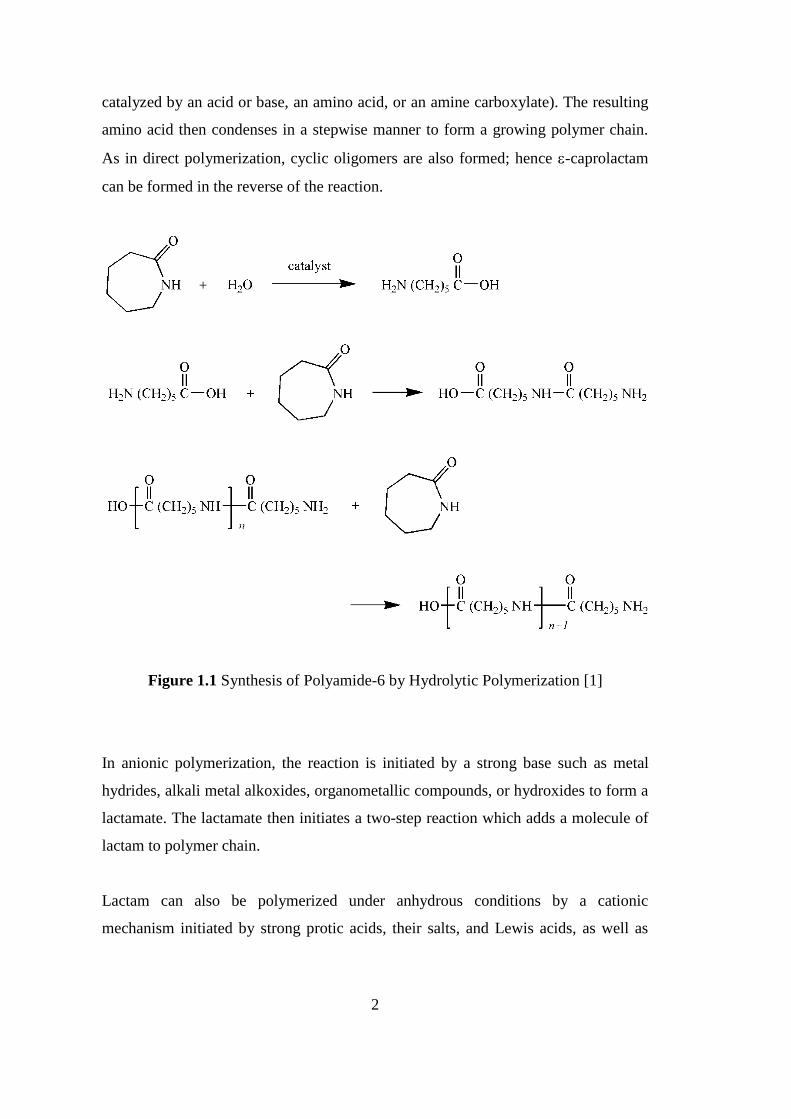
PA can be synthesized from lactams (cyclic monomer e.g. -caprolactam) via ring-
opening polymerization. This polymerization can be achieved by several ways such
as hydrolytic and anionic polymerization, where the second one is especially
preferred in industry. The mechanisms of hydrolytic and anionic polymerization are
shown in Figures 1.1 and 1.2, respectively [1].
In the hydrolytic polymerization, lactams containing six or more carbons in the ring
are heated in the presence of water above the melting point of polyamide. The
reaction begins with the hydrolytic ring opening of the lactam (the reaction can be
2
catalyzed by an acid or base, an amino acid, or an amine carboxylate). The resulting
amino acid then condenses in a stepwise manner to form a growing polymer chain.
As in direct polymerization, cyclic oligomers are also formed; hence -caprolactam
can be formed in the reverse of the reaction.
Figure 1.1 Synthesis of Polyamide-6 by Hydrolytic Polymerization [1]
In anionic polymerization, the reaction is initiated by a strong base such as metal
hydrides, alkali metal alkoxides, organometallic compounds, or hydroxides to form a
lactamate. The lactamate then initiates a two-step reaction which adds a molecule of
lactam to polymer chain.
Lactam can also be polymerized under anhydrous conditions by a cationic
mechanism initiated by strong protic acids, their salts, and Lewis acids, as well as
3
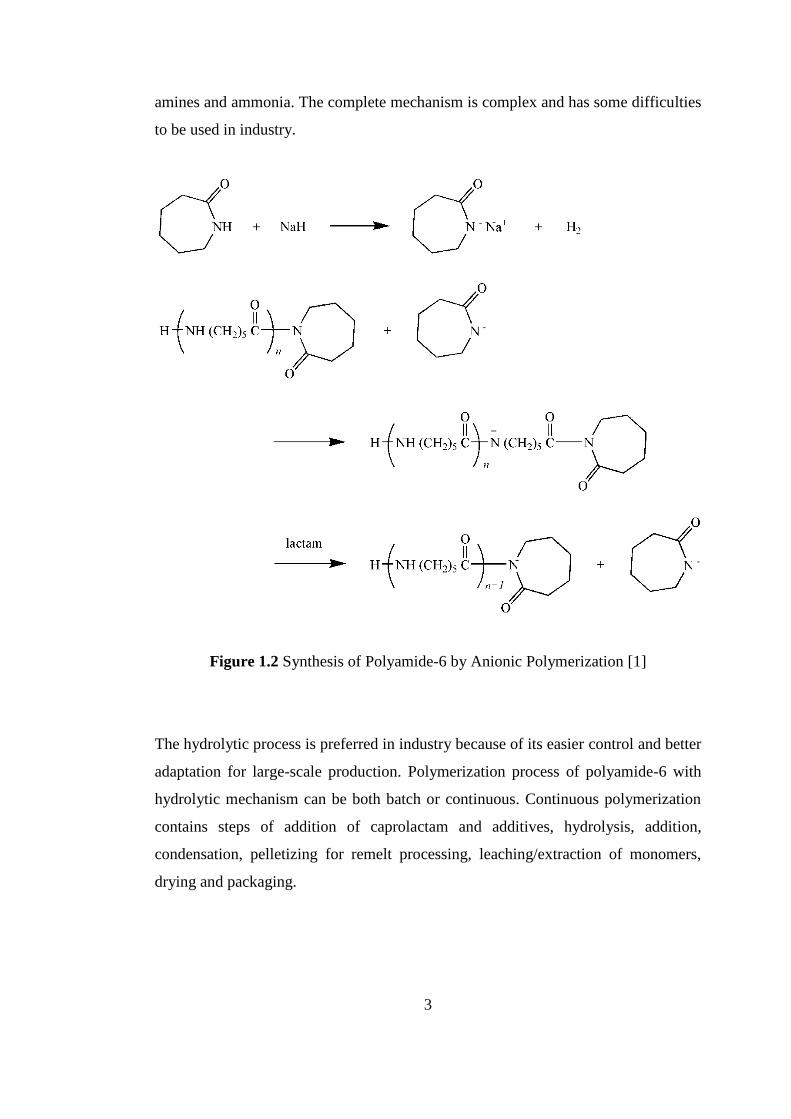
amines and ammonia. The complete mechanism is complex and has some difficulties
to be used in industry.
Figure 1.2 Synthesis of Polyamide-6 by Anionic Polymerization [1]
The hydrolytic process is preferred in industry because of its easier control and better
adaptation for large-scale production. Polymerization process of polyamide-6 with
hydrolytic mechanism can be both batch or continuous. Continuous polymerization
contains steps of addition of caprolactam and additives, hydrolysis, addition,
condensation, pelletizing for remelt processing, leaching/extraction of monomers,
drying and packaging.
4
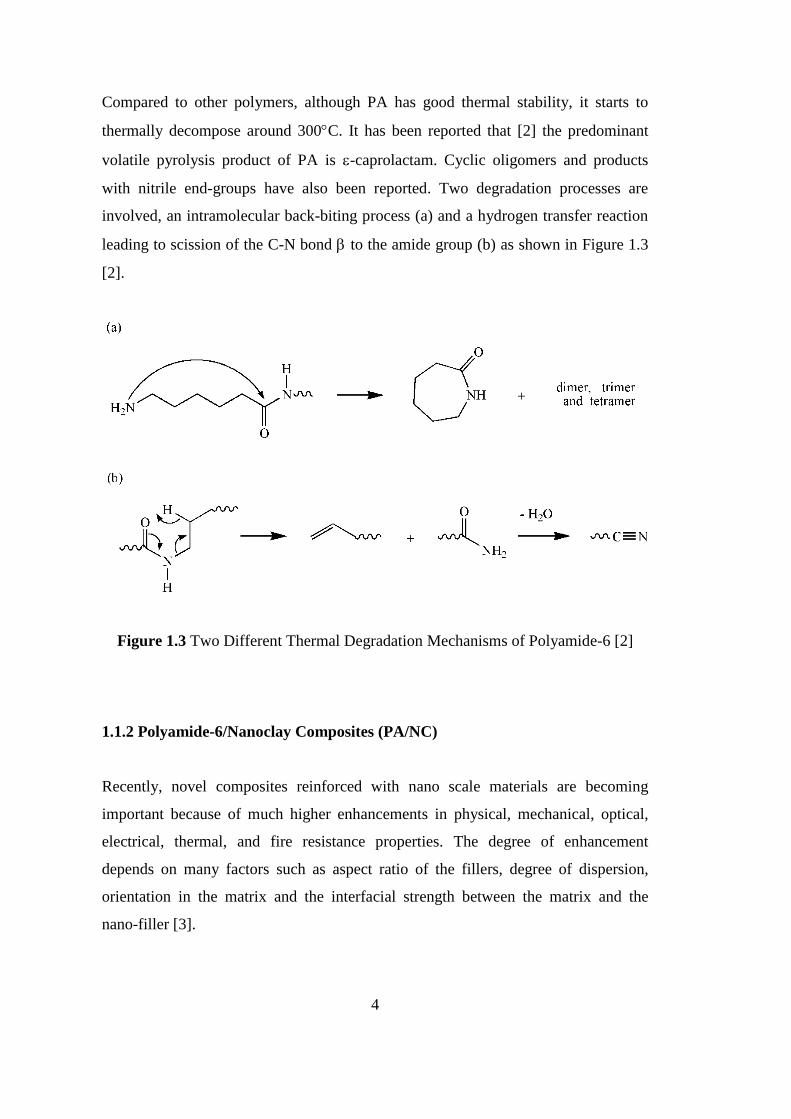
Compared to other polymers, although PA has good thermal stability, it starts to
thermally decompose around 300C. It has been reported that [2] the predominant
volatile pyrolysis product of PA is -caprolactam. Cyclic oligomers and products
with nitrile end-groups have also been reported. Two degradation processes are
involved, an intramolecular back-biting process (a) and a hydrogen transfer reaction
leading to scission of the C-N bond to the amide group (b) as shown in Figure 1.3
[2].
Figure 1.3 Two Different Thermal Degradation Mechanisms of Polyamide-6 [2]
1.1.2 Polyamide-6/Nanoclay Composites (PA/NC)
Recently, novel composites reinforced with nano scale materials are becoming
important because of much higher enhancements in physical, mechanical, optical,
electrical, thermal, and fire resistance properties. The degree of enhancement
depends on many factors such as aspect ratio of the fillers, degree of dispersion,
orientation in the matrix and the interfacial strength between the matrix and the
nano-filler [3].
5
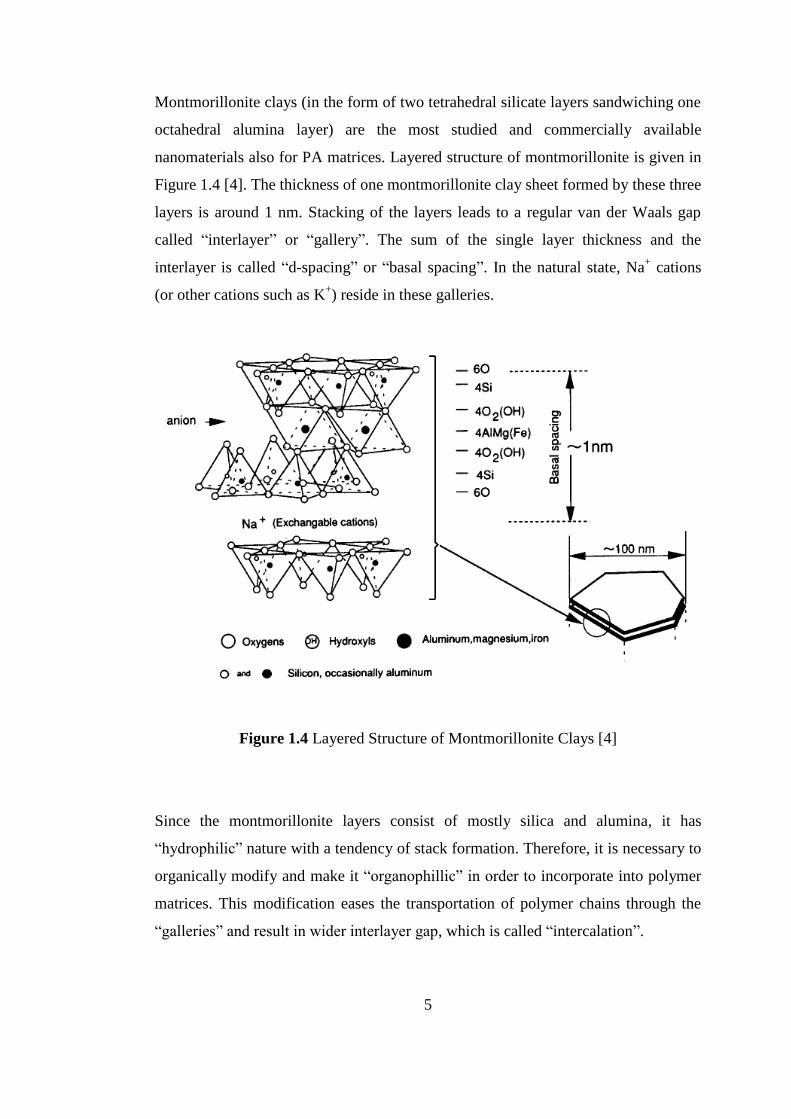
Montmorillonite clays (in the form of two tetrahedral silicate layers sandwiching one
octahedral alumina layer) are the most studied and commercially available
nanomaterials also for PA matrices. Layered structure of montmorillonite is given in
Figure 1.4 [4]. The thickness of one montmorillonite clay sheet formed by these three
layers is around 1 nm. Stacking of the layers leads to a regular van der Waals gap
called “interlayer” or “gallery”. The sum of the single layer thickness and the
interlayer is called “d-spacing” or “basal spacing”. In the natural state, Na+ cations
(or other cations such as K+) reside in these galleries.
Figure 1.4 Layered Structure of Montmorillonite Clays [4]
Since the montmorillonite layers consist of mostly silica and alumina, it has
“hydrophilic” nature with a tendency of stack formation. Therefore, it is necessary to
organically modify and make it “organophillic” in order to incorporate into polymer
matrices. This modification eases the transportation of polymer chains through the
“galleries” and result in wider interlayer gap, which is called “intercalation”.
6
Organic modification of layered silicates is generally done by cation exchange
reaction. That is, inorganic cations (typically sodium) on the surface of the
montmorillonite to balance the negative charge of aluminum/magnesium silicate
layer, are replaced with the organic cations (typically alkyl ammonium ions) so that
the clay become organophilic.
Three methods (solution mixing, in-situ polymerization and melt mixing) can be
used to produce nanocomposites. In solution mixing; nanoclays dispersed and
exfoliated into single layers in solvent, then polymer is added to this mixture.
Polymer chains transfer into galleries and delaminate the sheets. After removal of the
solvent, sheets reassemble in which the polymer chain in, and multilayer structure is
performed. In in-situ polymerization; nanoclay is swollen in liquid monomer or
monomer solution. Polymerization occurs in between the intercalated clay layers,
resulting in a structure that is kinetically trapped in a well dispersed structure. In melt
mixing; polymers and nanoclays are mixed and heated just above the melting point
of the polymer used. In this process, polymer chains move into clay galleries and
increase the interlayer distance forming intercalated and/or exfoliated structure.
When clay particles are incorporated into polymer matrix, depending on the
preparation methods used and strength of interfacial interactions between polymer
and nanoclays, three forms of nanocomposites can be obtained (Figure 1.5).
When polymer chains are unable to transfer through clay galleries due to poor
polymer and clay interaction “phase separated (micro) composite” is obtained
(Figure 1.5 (a)). In this case, no further enhancement is achieved in the performance
compared to conventional composites.
“Intercalated nanocomposite” structure (Figure 1.5 (b)) is obtained when one or more
polymer chains diffuse between clay layers, leading to a well ordered multilayer
structure of alternating polymeric and inorganic layers. Repeating distance of these
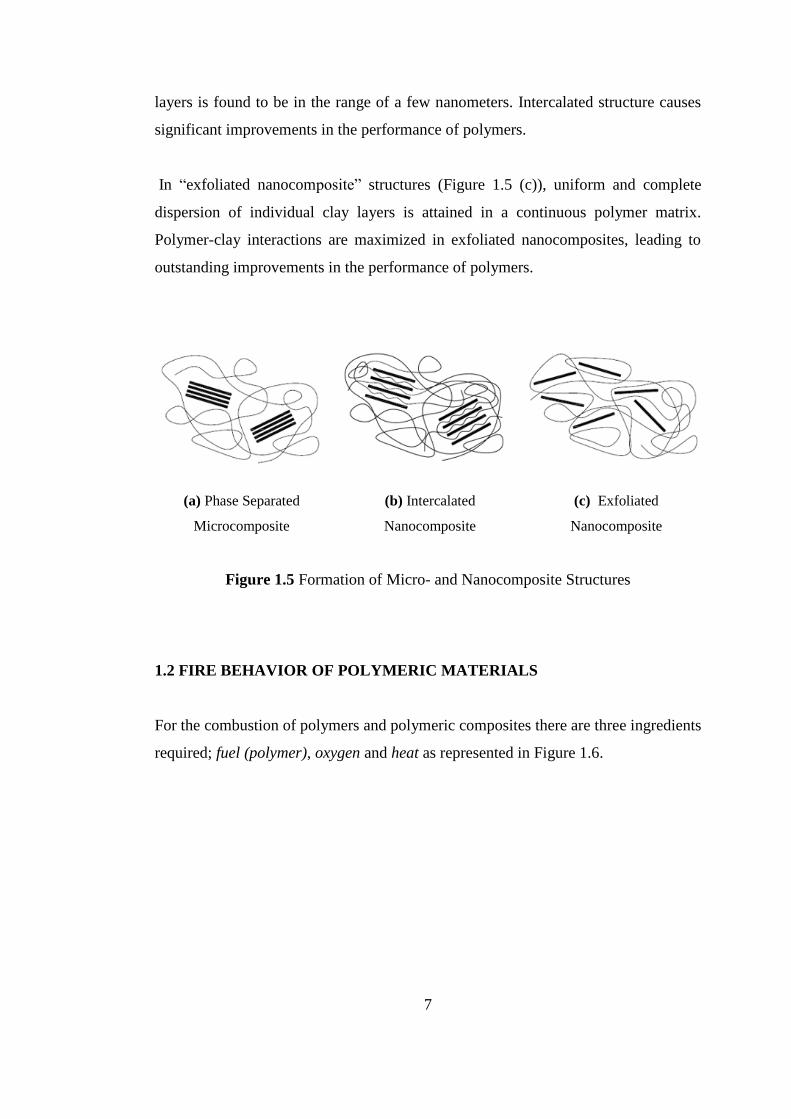
7
layers is found to be in the range of a few nanometers. Intercalated structure causes
significant improvements in the performance of polymers.
In “exfoliated nanocomposite” structures (Figure 1.5 (c)), uniform and complete
dispersion of individual clay layers is attained in a continuous polymer matrix.
Polymer-clay interactions are maximized in exfoliated nanocomposites, leading to
outstanding improvements in the performance of polymers.
(a) Phase Separated
Microcomposite
(b) Intercalated
Nanocomposite
(c) Exfoliated
Nanocomposite
Figure 1.5 Formation of Micro- and Nanocomposite Structures
1.2 FIRE BEHAVIOR OF POLYMERIC MATERIALS
For the combustion of polymers and polymeric composites there are three ingredients
required; fuel (polymer), oxygen and heat as represented in Figure 1.6.
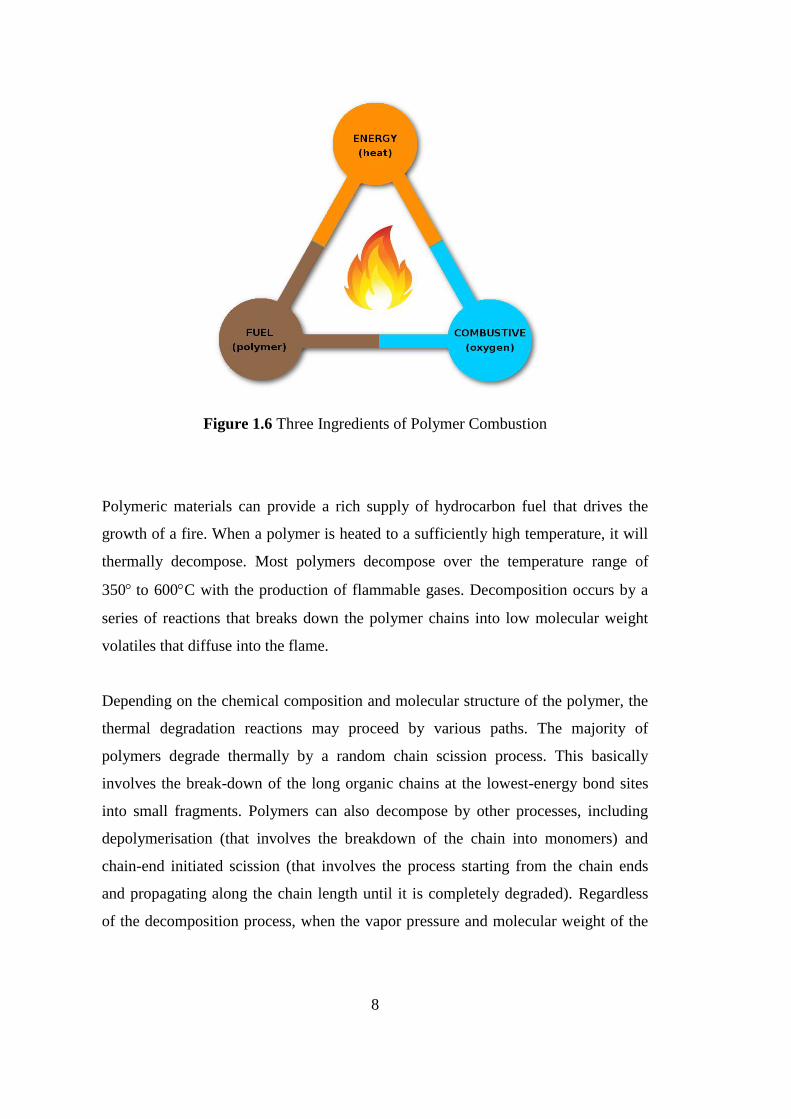
8
Figure 1.6 Three Ingredients of Polymer Combustion
Polymeric materials can provide a rich supply of hydrocarbon fuel that drives the
growth of a fire. When a polymer is heated to a sufficiently high temperature, it will
thermally decompose. Most polymers decompose over the temperature range of
350 to 600C with the production of flammable gases. Decomposition occurs by a
series of reactions that breaks down the polymer chains into low molecular weight
volatiles that diffuse into the flame.
Depending on the chemical composition and molecular structure of the polymer, the
thermal degradation reactions may proceed by various paths. The majority of
polymers degrade thermally by a random chain scission process. This basically
involves the break-down of the long organic chains at the lowest-energy bond sites
into small fragments. Polymers can also decompose by other processes, including
depolymerisation (that involves the breakdown of the chain into monomers) and
chain-end initiated scission (that involves the process starting from the chain ends
and propagating along the chain length until it is completely degraded). Regardless
of the decomposition process, when the vapor pressure and molecular weight of the
9
fragments from the polymer chain become sufficiently small they diffuse into the
flame and become fuel to sustain the fire [5].
Combustion of the gases occurs in the solid and (to a lesser extent) intermittent zones
of the flame with the formation of highly active H radicals when polymer chain
starts to degrade under high temperature. This radical combines with oxygen in the
flame (or air) to produce hydroxyl radicals (OH) according to reactions below [5].
RH + O2 x CO + y CO2 + z H2O (1.1)
R-CH2-CH2-R’ + O2 R-CH2 + R’= CH + OH (1.2)
OH + CO CO2 + H (1.3)
H + O2 OH + H (1.4)
The H radicals produced in the reactions feed back into the reactions, and thereby
the combustion process becomes a self-sustaining process when sufficient oxygen is
available. This is known as the combustion cycle of organic polymers. The cycle
stops only when the fuel source has been exhausted, which is usually when the
organic components in a composite have been completely degraded [5].
The combustion process can be divided into certain stages as shown in Figure 1.7
[5]. Ignition is the point when the fuel source ignites and undergoes sustained
flaming combustion. The initial growth of a fire is dependent mainly on the fuel
itself. The fire will grow and the temperature will continue to rise (350-500C) if
sufficient fuel and oxygen are available. Flashover occurs when all combustible
items are involved in the fire and average upper gas temperature exceeds 600C.
Fully developed fire occurs when the heat release rate and temperature of a fire are at
their greatest. The peak temperature of a typical post-flashover is 900-1000C,
although it can reach as high as 1200C. The final decay stage occurs as the fuel and
combustible materials become consumed (or by active fire suppression systems),
causing the temperature to fall [5].
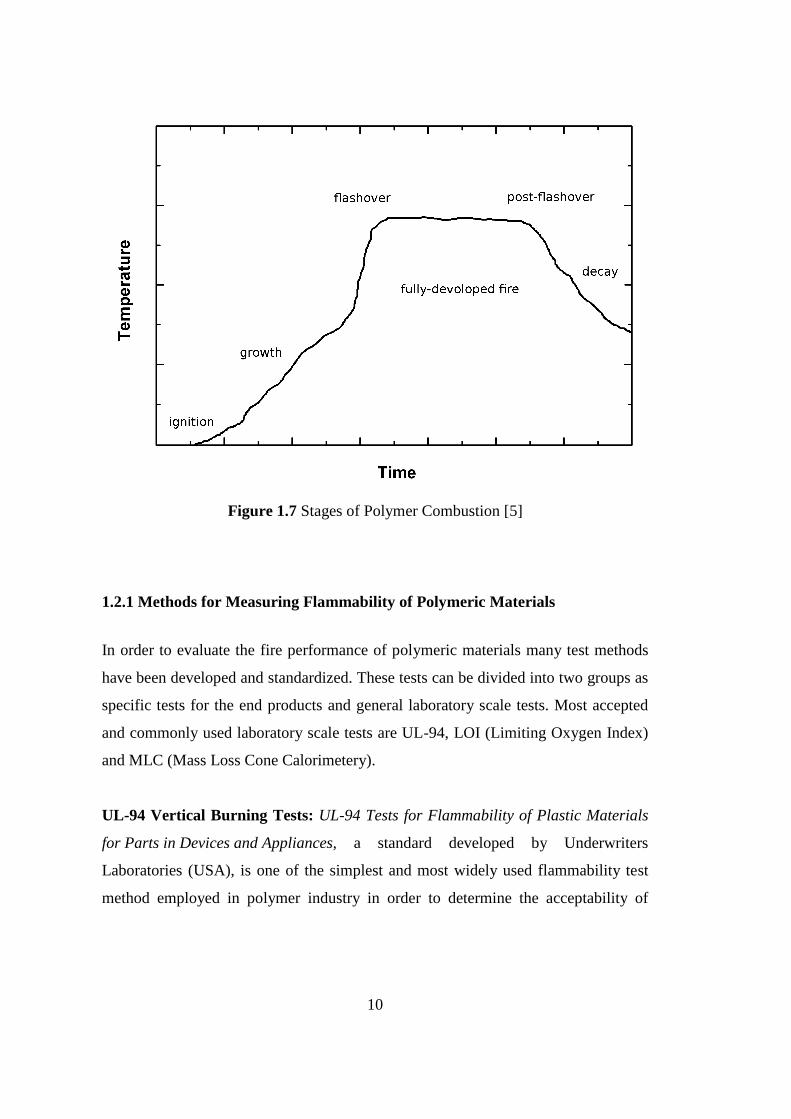
10
Figure 1.7 Stages of Polymer Combustion [5]
1.2.1 Methods for Measuring Flammability of Polymeric Materials
In order to evaluate the fire performance of polymeric materials many test methods
have been developed and standardized. These tests can be divided into two groups as
specific tests for the end products and general laboratory scale tests. Most accepted
and commonly used laboratory scale tests are UL-94, LOI (Limiting Oxygen Index)
and MLC (Mass Loss Cone Calorimetery).
UL-94 Vertical Burning Tests: UL-94 Tests for Flammability of Plastic Materials
for Parts in Devices and Appliances, a standard developed by Underwriters
Laboratories (USA), is one of the simplest and most widely used flammability test
method employed in polymer industry in order to determine the acceptability of
11
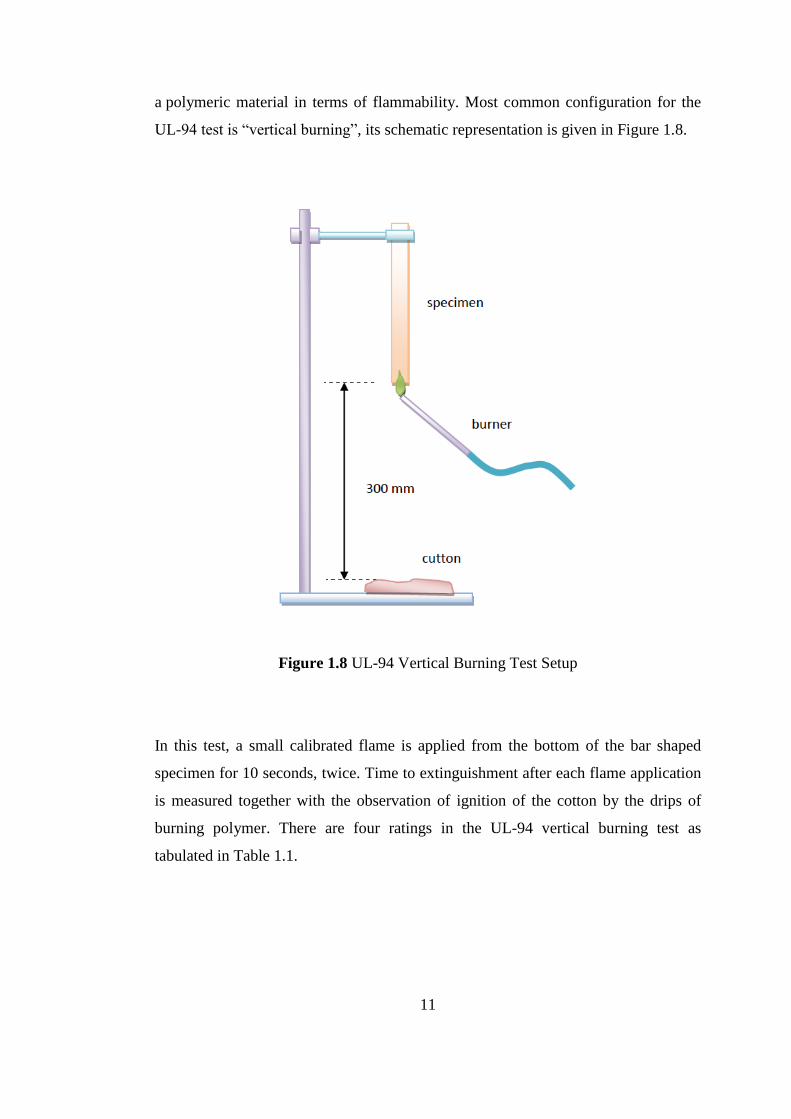
a polymeric material in terms of flammability. Most common configuration for the
UL-94 test is “vertical burning”, its schematic representation is given in Figure 1.8.
Figure 1.8 UL-94 Vertical Burning Test Setup
In this test, a small calibrated flame is applied from the bottom of the bar shaped
specimen for 10 seconds, twice. Time to extinguishment after each flame application
is measured together with the observation of ignition of the cotton by the drips of
burning polymer. There are four ratings in the UL-94 vertical burning test as
tabulated in Table 1.1.
12
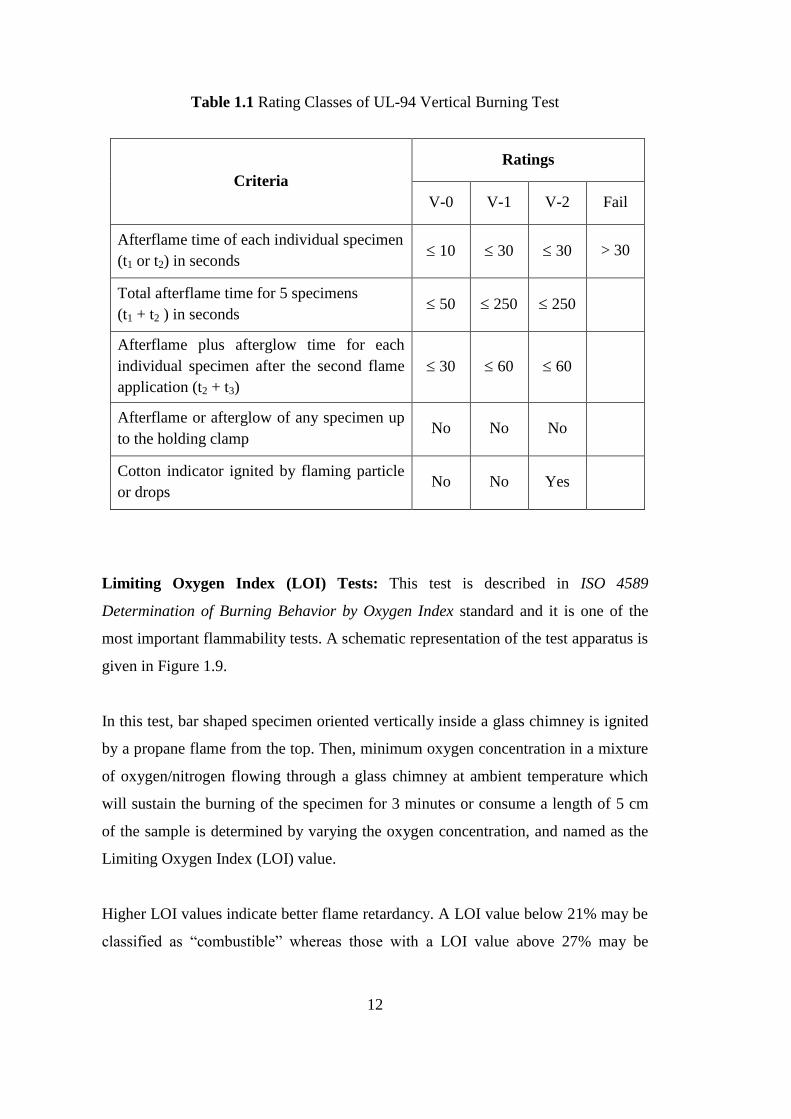
Table 1.1 Rating Classes of UL-94 Vertical Burning Test
Criteria
Ratings
V-0 V-1 V-2 Fail
Afterflame time of each individual specimen
(t1 or t2) in seconds 10 30 30 > 30
Total afterflame time for 5 specimens
(t1 + t2 ) in seconds 50 250 250
Afterflame plus afterglow time for each
individual specimen after the second flame
application (t2 + t3)
30 60 60
Afterflame or afterglow of any specimen up
to the holding clamp No No No
Cotton indicator ignited by flaming particle
or drops No No Yes
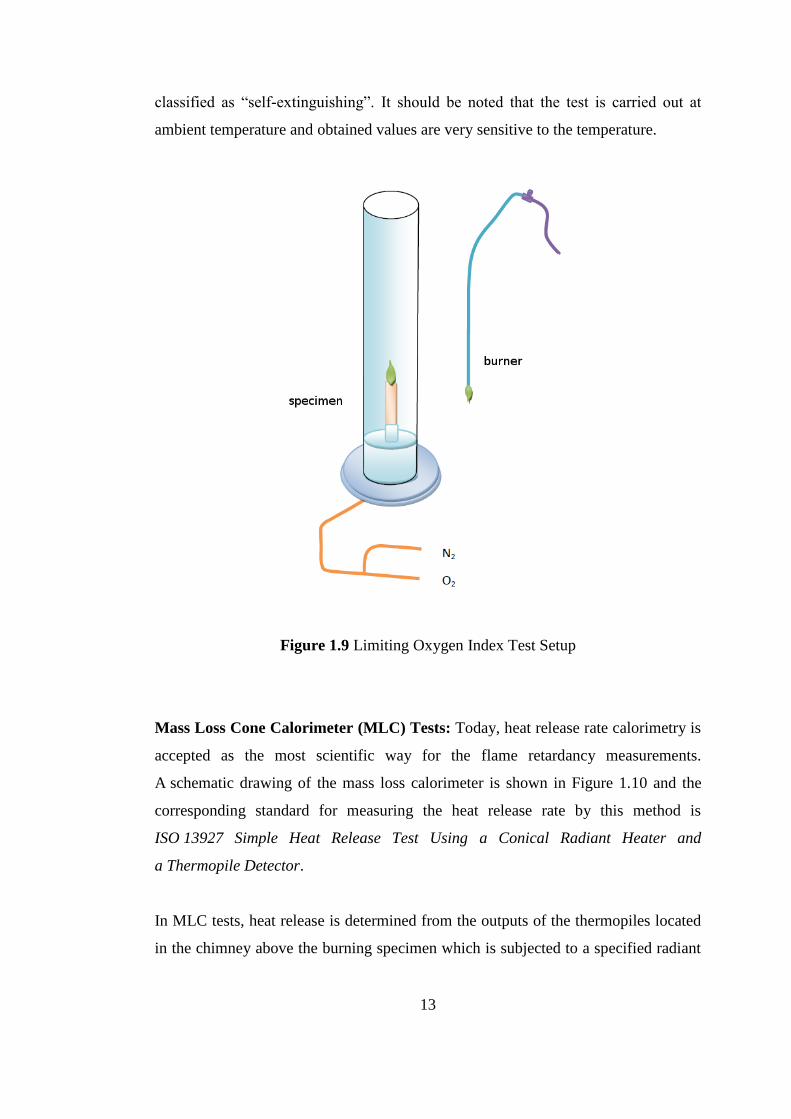
Limiting Oxygen Index (LOI) Tests: This test is described in ISO 4589
Determination of Burning Behavior by Oxygen Index standard and it is one of the
most important flammability tests. A schematic representation of the test apparatus is
given in Figure 1.9.
In this test, bar shaped specimen oriented vertically inside a glass chimney is ignited
by a propane flame from the top. Then, minimum oxygen concentration in a mixture
of oxygen/nitrogen flowing through a glass chimney at ambient temperature which
will sustain the burning of the specimen for 3 minutes or consume a length of 5 cm
of the sample is determined by varying the oxygen concentration, and named as the
Limiting Oxygen Index (LOI) value.
Higher LOI values indicate better flame retardancy. A LOI value below 21% may be
classified as “combustible” whereas those with a LOI value above 27% may be
13
classified as “self-extinguishing”. It should be noted that the test is carried out at
ambient temperature and obtained values are very sensitive to the temperature.
Figure 1.9 Limiting Oxygen Index Test Setup
Mass Loss Cone Calorimeter (MLC) Tests: Today, heat release rate calorimetry is
accepted as the most scientific way for the flame retardancy measurements.
A schematic drawing of the mass loss calorimeter is shown in Figure 1.10 and the
corresponding standard for measuring the heat release rate by this method is
ISO 13927 Simple Heat Release Test Using a Conical Radiant Heater and
a Thermopile Detector.
In MLC tests, heat release is determined from the outputs of the thermopiles located
in the chimney above the burning specimen which is subjected to a specified radiant
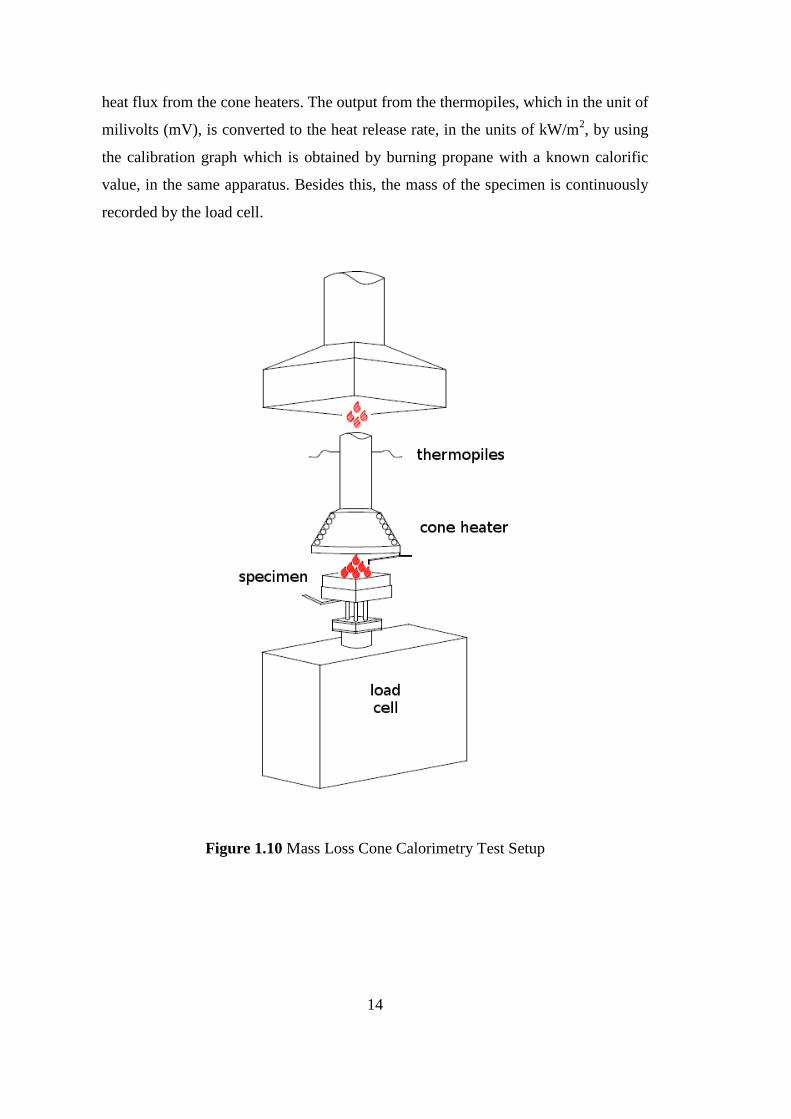
14
heat flux from the cone heaters. The output from the thermopiles, which in the unit of
milivolts (mV), is converted to the heat release rate, in the units of kW/m2, by using
the calibration graph which is obtained by burning propane with a known calorific
value, in the same apparatus. Besides this, the mass of the specimen is continuously
recorded by the load cell.
Figure 1.10 Mass Loss Cone Calorimetry Test Setup
15
A rigid specimen with a smooth surface (with 100x100x4 mm3 dimensions) is placed
in the holder above the load cell in order to measure the evaluation of mass loss
during the experiment. Conic Heaters, set to the corresponding temperature for the
preferred external heat flux, continuously radiates the sample from above. The
combustion is triggered by an electric spark.
There are several parameters that can be obtained from the curves of MLC test which
give information about flammability of the materials such as:
Peak Heat Release Rate (PHRR) (kW/m2): the maximum quantity of heat released
from the specimen.
Total Heat Evolved (THE) (MJ/m2): the area under the Heat Release Rate vs. Time
curve.
Time to Ignition (TTI) (s): the time between sparking and ignition of a material
under external irradiation.
Time to Peak Heat Release Rate (TPHRR) (s): the time elapsed up to peak heat
release rate.
FGI (Fire Growth Index): contribution of a material to fire propagation; ratio of
PHRR to TTI.
FIGRA (Fire Growth Rate Index): contribution of a material to fire propagation
rate; ratio of PHRR to TPHRR.
Char yield (wt%): weight percent of solid fire residue of a material measured
at flame-out.
16
1.2.2 Mechanisms of Flame Retardancy
Although the mechanisms of flame retardancy are not totally well understood, some
classification may be done. There are two main classes of mechanisms available
(condensed phase action and gas phase action) and can be further subdivided.
(i) Condensed Phase Actions
The “condensed phase” refers to the polymer, whether in the solid or molten state.
Condensed phase activity includes several flame retardancy mechanisms as given
below:
Insulative Barrier Formation: By addition of certain compounds (especially
phosphorous and nitrogen containing), insulative barrier layers (generally
carbonaceous char or glassy vitreous) form just over the polymer surface, and they
prevent or reduce transfer of heat, oxygen and combustible gases which are
mandatory to sustain fire.
Endothermic Heat Sink: Reducing the temperature by the addition of filler
(generally metal hydroxides like aluminum hydroxide and magnesium hydroxide)
that acts as a heat sink while decompose endothermically to yield water or other non-
combustible products (the reactions given below) with a high specific heat capacity.
Those products also absorb large amount of heat while changing their state like
evaporation.
2 Al(OH)3 Al2O3 + 3 H2O (1.5)
2 Mg(OH)2 2 MgO + 2 H2O (1.6)
Polymer Dilution: Diluting the amount of combustible organic material by the
addition of inert filler particles to the polymer.
17
(ii) Gas Phase Actions
The “gas phase” refers to the mixture of gas just above the condensed phase
Gas phase activity includes several flame retardancy mechanisms as given below:
Flame Inhibition: Halogens like bromine or phosphorus based radicals terminate the
exothermic combustion reactions by removing H and OH radicals from the flame.
As a result, both flame propagation and the amount of heat returned from the fire to
the material are reducing.
The termination of the exothermic combustion reactions can be summarized as
follows. The H radicals produced in the combustion reactions (Reactions 1.3 and
1.4) react with bromine and form hydrogen bromide (HBr) product. HBr combines
with oxygen and hydroxyl radicals and forms bromine radicals which react with
hydrocarbon radicals and terminate it.
O + HBr OH + Br (1.7)
OH + HBr H2O + Br (1.8)
R-CH2 + Br R-CH2 Br (1.9)
Fuel Gas Dilution: Another common mechanism is the release of noncombustible
vapors to dilute the concentration of oxygen or H and OH radicals in the flame,
which also lowers the temperature.
Insulative Gas Barrier Formation: If the concentration of noncombustible gases is
high enough, it forms a gas blanket over condensed phase and reduces the transfer of
heat, oxygen and fuel.
18
1.2.3 Traditional Flame Retardants and Boron Compounds
Halogen Containing Additives: Generally they are Cl and Br containing
compounds, but recently the use of all Cl and some Br compounds are restricted or
banned in many countries. They can be used in combination with synergistic metal
oxides, metal salts, and phosphorus containing products. The main advantage of
halogen-based flame retardants are their very high level of effectiveness in polymers.
Three basic mechanisms suggested for these compounds are: (i) Generation of
free-radical chain-terminating agents. (ii) Promotion of char formation through
dehydrogenation reactions. (iii) Formation of a blanket of hydrogen halides which
acts as a gas barrier between the fuel gas and condensed phases.
Metal Hydroxides: In this group especially aluminum hydroxide “Al(OH)3” and
magnesium hydroxide “Mg(OH)2” are used. In order to be effective they need to be
used in large quantities leading to some mixing problems and decreases in
mechanical properties.
Basic mechanisms suggested were: (i) They decompose endothermically and absorb
heat. (ii) Formed H2O during decomposition dilutes the flame with vapors.
(iii) Formed ceramic layer “Al2O3 or MgO” over the polymer acts as a barrier
preventing the heat and mass transfer.
Nitrogen-containing Additives: These are melamine, melamine derivatives and
related heterocyclic compounds. They have a simple structure and compatible with
many polymers.
Basic mechanisms suggested were: (i) They promote dripping of the polymer.
(ii) They sublime endothermically, dilute the flame with vapor and can dissociate
endothermically in the flame, even further to cyanamide. (iii) In the condensed phase
melamine undergoes endothermic self-condensation with release of ammonia and
formation of highly thermostable solid residues.
19
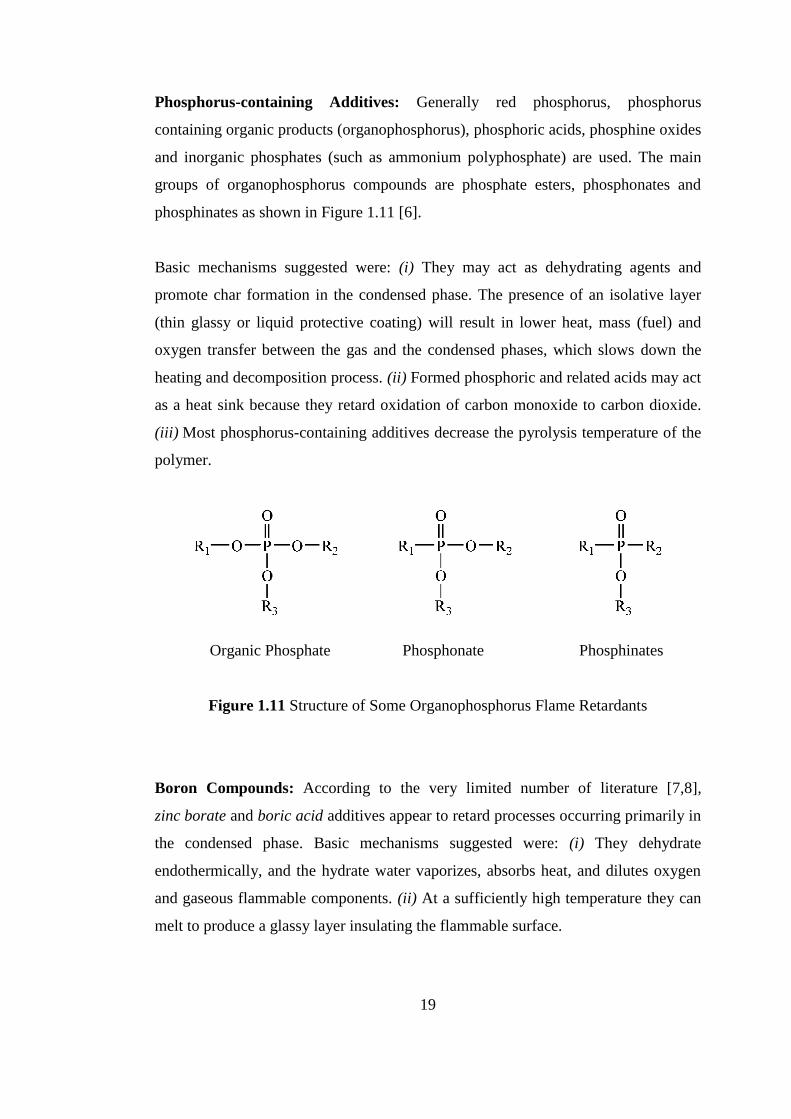
Phosphorus-containing Additives: Generally red phosphorus, phosphorus
containing organic products (organophosphorus), phosphoric acids, phosphine oxides
and inorganic phosphates (such as ammonium polyphosphate) are used. The main
groups of organophosphorus compounds are phosphate esters, phosphonates and
phosphinates as shown in Figure 1.11 [6].
Basic mechanisms suggested were: (i) They may act as dehydrating agents and
promote char formation in the condensed phase. The presence of an isolative layer
(thin glassy or liquid protective coating) will result in lower heat, mass (fuel) and
oxygen transfer between the gas and the condensed phases, which slows down the
heating and decomposition process. (ii) Formed phosphoric and related acids may act
as a heat sink because they retard oxidation of carbon monoxide to carbon dioxide.
(iii) Most phosphorus-containing additives decrease the pyrolysis temperature of the
polymer.
Organic Phosphate Phosphonate Phosphinates
Figure 1.11 Structure of Some Organophosphorus Flame Retardants
Boron Compounds: According to the very limited number of literature [7,8],
zinc borate and boric acid additives appear to retard processes occurring primarily in
the condensed phase. Basic mechanisms suggested were: (i) They dehydrate
endothermically, and the hydrate water vaporizes, absorbs heat, and dilutes oxygen
and gaseous flammable components. (ii) At a sufficiently high temperature they can
melt to produce a glassy layer insulating the flammable surface.
20
1.3 LITERATURE SURVEY
1.3.1 Studies on the Effects of Zinc Borate
In the literature, there are several studies revealing the effects of halogenated
compounds [6,9-12], metal hydroxides [6,11,13-15], nitrogen-containing [16-21]
and phosphorus-containing [11,22-28] compounds. Recent studies are concerned on
the non-halogenated novel type “organophosphorus compounds” especially
“aluminum phosphinate” based compounds. Limited number of these studies [29-34]
investigating the use of aluminum phosphinate based organocompounds for neat and
fiber reinforced polyamides can be summarized as fallows;
The first comprehensive work on the use of aluminum phosphinate based
organophosphorus compound for polamide-6,6 reinforced with 30 wt% short glass
fibers was conducted by Braun, Schartel and their coworkers [29]. They revealed that
using 18 wt% aluminum diethylphosphinate has no improvements in the “fail” grade
of UL-94, while limiting oxygen index (LOI) value increased from 21.5 to 37.9 O2%,
and peak heat release rate (PHRR) value (under irradiation of 35 kW/m2) suppressed
from 323 down to 157 kW/m2. They alsoindicated that the main flame retardancy
mechanism of aluminum diethylphosphinate was flame inhibition.
In their next study [30], Braun, Bahr and Schartel again used 18 wt% aluminum
diethylphosphinate, this time for polyamide-6 with 30 wt% short glass fibers. Again,
there was no improvement in the UL-94 fail grade, but LOI increased from 22.8 to
34.8 O2%, while PHRR (under irradiation of 50 kW/m2) suppressed from 478 to
326 kW/m2.
Apart from aluminum diethylphosphinate, other forms of aluminum phosphinate
were investigated. For example, Hu et.al. [31] used 30 wt% aluminum phenyl-
phosphinate to improve flame retardancy of polyamide-6 composites with 30 wt%
glass fibers. They indicated that there is no improvement in UL-94 fail rating, but
21
PHRR value (under a heat flux of 50 kW/m2) can be suppressed from 461 to
301 kW/m2.
Zhao et.al. [32] studied effects of three different amounts (15, 20, 25 wt%) of
aluminum isobutylphosphinate on the flammability behavior of neat polyamide-6.
They found that using 25 wt% aluminum isobutylphosphinate can lead to UL-94 V-0
rating, and also a suppression of PHRR from 789 to 218 kW/m2 under 50 kW/m
2
heat flux.
Braun et.al. [29] also indicated that replacement of certain amount of aluminum
diethylphosphinate with melamine polyphosphate and zinc borate may lead to more
significant flame retardancy due to their additional mechanisms. For instance, they
revealed that using these three compounds together lead to UL-94 V-0 rating which
was not possible when aluminum diethylphosphinate was used alone.
Similarly, Isitman et.al. [33] studied effects of using aluminum diethylphosphinate in
combination with melamine polyphosphate and zinc borate. They used a total of
15 wt% commercial compound containing these three ingredients in certain amount
for polyamide-6 reinforced with 15 wt% short glass fibers. They revealed that UL-94
V-2 rating could be upgraded to V-0 rating, while LOI values can increase from
22.4 to 29.3 %O2, and PHRR value can be suppress from 611 down to 228 kW/m2
under external heat flux of 35 kW/m2.
1.3.2 Studies on the Effects of Boron Oxide and Boric Acid
One of the first study conducted by Gao et.al. [35] was not for a polymeric material,
but it was for wood. Wood specimens were impregnated with aqueous solutions of
gucinyl urea phosphate (GUP) and boric acid (BA). Their cone calorimetry studies
under 35 kW/m2 heat flux indicated that, peak heat release rate (PHRR) of wood
22
can be suppressed from 135 kW/m2 to 81 kW/m
2 when GUP was used alone, but the
suppression was down to 50 kW/m2 when GUP was mixed with BA.
A comprehensive work by Nyambo, Kandare, Wilkie [36] revealed effects of boric
acid (BA) together with layered double hydroxide (LDH) and melamine
polyphosphate (MP) in the copolymeric matrix material of ethylene vinyl acetate
(EVA). Cone calorimetry measurements indicated that incorporation of BA resulted
in significant reductions in time to ignition (TTI) and PHRR values. For instance,
PHRR of EVA decreases from 1680 to 715 kW/m2 when only 10 wt% traditional MP
was used, while the reduction was to 671 kW/m2 when 6 wt% MP was replaced by
BA and LDH.
Demirel et.al. [37] studied effects of boric acid amount on the flammability behavior
of unsaturated polyester by conducting only limiting oxygen index (LOI) tests. They
showed that when used together with 5 wt% short glass fibers, increasing the BA
amount increases the LOI value from 19.5 O2% to 25.3, 27.5 and 34.5 O2% for the
15, 20 and 30 wt% BA contents, respectively.
Xie et.al. [38] investigated use of boric acid and a nitrogen containing compounds as
a finishing material for cotton fabrics. They impregnated cotton fabrics with the
aqueous solutions of boric acid (BA) and 2,4,6-tri[(2-hydroxy-3-trimethyl-
ammonium)propyl]-1,3,5-triazine chloride (Tri-HTAC) having different concentra-
tions. Their LOI measurements revealed that when the cotton fabrics were treated
with only Tri-HTAC solution, LOI value of cotton fabrics increases from 17.5 to
22 O2%, on the other hand, when BA was added with a concentrations of 40 g/l, the
LOI value increases further to 27.5 O2%.
Use of boron oxide (BO) was studied by Mulazim et.al. [39] for a high performance
polymeric material polyimide (PI). Aminosilane treated BO particles were
incorporated in PI matrix with various amounts. Due to the inherent high temperature
stability LOI value of PI was 33 O2%, much higher compared to many other
23
polymeric materials. They showed that when only 5 wt% BO was added, LOI value
increases up to 46 O2%.
Recently, Ibibikcan and Kaynak [40] revealed usability of boron oxide (BO) and
boric acid (BA) for the flame retardancy enhancements of polyethylene-based cable
insulation materials LDPE and LDPE/EVA. It is known that for the production of
halogen-free cable insulation materials, very high amounts of traditional metal
hydroxide flame retardants such as 65 wt% aluminum hydroxide (ATH) are required
to fulfill cable directives. They indicated that when only 10 wt% of ATH was
replaced with BO or BA, many flammability parameters could be improved. For
instance with 10 wt% BO replacement, the best rating of UL-94 standard which is
V-0 can be obtained, LOI values can be increased from 30 to 36 O2%, PHRR can be
suppressed from 82 down to 51 kW/m2. They claimed that these improvements were
basically due to further contribution of BO or BA to the physical barrier mechanism
of ATH in both gas and condensed phases.
1.3.3 Studies on the Effects of Nanoclays
Investigations on the effects of organically modified montmorillonite type nanoclays
on the flammability behavior of many polymeric materials [41-50] including
engineering thermoplastic polyamide-6 [51-54] revealed that nanoclays could
improve certain flame retardancy parameters. These studies for instance indicated
that peak heat release rate (PHRR) values of polymers could be significantly
suppressed by the addition of only 1-5 wt% nanoclays.
The main flame retardancy mechanism ascribed for nanoclays in the literature
[41,42,44,45,47-50,55] is the formation of effective physical barrier of silicate layers
preventing mass and heat transfer.
24
On the other hand, although there are certain levels of improvements in some of the
flame retardancy parameters of cone calorimetry analysis such as PHRR values,
improvements via nanoclays alone are far from the required levels of industrial
standards such as limiting oxygen index (LOI) values and UL-94 ratings.
Therefore, studies especially try to reach synergistic improvements by replacing
certain amount of traditional flame retardants with very low amount of nanoclays,
rather than using nanoclays alone.
In this respect, for many polymeric materials, there are various investigations
revealing synergistic effect of nanoclays when used together with traditional flame
retardants such as metal hydroxides [56-58], brominated compounds [59,60],
phosphorous and nitrogen containing compounds [61-63], etc.
Polyamide-6 (PA) and its short-glass-fibers-reinforced composites (PA/GF) find a
wide range of engineering applications in various industrial sectors including
electrical-electronic equipment, automotive parts, etc., where high level of flame
retardancy is required. The most effective flame retardants used for PA and PA/GF
today especially belongs to phosphorous based compounds.
In the literature for PA and/or PA/GF based matrices, there seems to be very limited
number of studies [64-66] investigating the synergistic contribution of nanoclays
when used together with traditional phosphorous based flame retardants. In these
studies, contribution of nanoclays (NC) when used together with red phosphorus
(RP) and melamine polyphosphate (MPP) were reported indicating the improved
flammability parameters (LOI, UL-94, PHRR, etc.) of PA and PA/GF.
In industry for PA and PA/GF based materials, recently use of non-halogenated
novel type “organophosphorus” flame retardants, particularly “aluminum
diethylphosphinate” (ADP) type compounds are on the rise. On the other hand, to the
25
best of our knowledge, only four works [67-70] were reported investigating the
contribution of NC to ADP based compounds.
For the matrix of PA, Bourbigot et.al. [67] and Dahiya et.al. [69] indicated that using
5 wt% NC alone results in significant suppressions in PHRR values, but almost no
improvements in LOI values and UL-94 rating. They revealed that, when 5 wt% NC
was used together with ADP, both LOI values and UL-94 ratings were also
improved. Isitman et.al. [68] also indicated that all these synergistic contribution of
5 wt% NC was valid not only for PA matrix, but also for PA/GF based materials.
Later on, Dogan et.al. [70] reported that, for the matrix of PA, these synergistic
contributions could be obtained even with only 1 wt% NC.
1.4 AIM OF THE STUDY
Polyamide-6 (PA6) is today one of the most widely used engineering thermoplastic
in many industrial applications including electrical and electronic equipment parts
mainly due to its good strength and toughness, high glass transition temperature,
good electrical insulating property, ease of processability and excellent resistance to
solvents and abrasion. Additionally, for the structural applications such as
automotive components, higher mechanical properties and dimensional stability are
required; then, PA6 is usually reinforced with 15-30 wt% short glass fibers.
However, in many of these industrial applications especially for the certain parts of
electrical and electronic equipment, high levels of flame retardancy is mandatory.
In the academia and industry, there are various investigations on the use of
traditional flame retardants to sustain required levels of fire resistance for neat
polyamide-6 and its composites with short fiber reinforcements.
On the other hand, to the best of our knowledge there is no work reported on the
effects of using zinc borate and metal phosphinate organocompounds together for
any polymeric material. Therefore, the first purpose of this thesis was to explore
26
flame retardancy of aluminum diethylphosphinate when its certain amount was
replaced by different levels of zinc borate in neat and 15 wt% short fiber reinforced
polyamide-6.
Today, researchers are trying to improve flame retardancy performance of traditional
flame retardants by adding certain synergistic materials. In the literature, there are
numerous publications investigating the synergistic flame retardancy enhancements
by the incorporation of zinc borate, antimony oxide, nanoclays, and many other
materials.
However, to the best of our knowledge, there is no work reported on the effects of
using boron oxide or boric acid together with any metal phosphinate
organocompounds for PA and/or PA/GF based materials. In fact, there is no
publication studying the flammability behavior of any polymeric material when any
organophosphorus compound was used together with BO or BA, yet. Therefore, the
second aim of this thesis was to investigate flame retardancy of aluminum
diethylphosphinate type organophosphorus compound when its certain amount was
replaced by different levels of boron oxide or boric acid in neat and 15 wt% short
glass fiber reinforced polyamide-6.
After the discovery of polymer/clay nanocomposites at Toyota research center
almost two decades ago, numerous studies were conducted in academia and industry
on the effects of nanoclays to improve mechanical, thermal, barrier and flame
retardancy properties of polymers.
However, there are extremely limited number of literature studying the effects of
nanoclays (NC) on the flammability of the material systems used in this research.
Therefore, the third purpose of this thesis was, for both PA and PA/GF based
materials, to investigate flame retardancy contribution of NC, first of all when NC
was used alone, then when certain amount of ADP was replaced with NC, and then
the effects of replacement with NC-ZB (nanoclay - zinc borate) couple.
27
CHAPTER 2
EXPERIMENTAL WORK
2.1 MATERIALS USED
Chemical structures of the materials used in this study are given in Table 2.1, while
other properties are given below.
2.1.1 Polyamide-6 (PA) and Short Glass Fibers (GF)
Polyamide-6 (PA) (Biesterfeld, Orbimid® B27) used as a matrix material had a
density of 1.14 g/cm3, mold shrinkage of 1.1-1.6%, and water absorption of
10% (w/w). Silane treated short glass fibers (GF) (Camelyaf, PA-2) used had initial
length of 3 mm and diameter of 10.5 μm. Aminosilane sizing was applied with
γ-aminopropyltrimethoxysilane (APS).
2.1.2 Organophosphorus Flame Retardant (ADP)
Organophosphorus type novel flame retardant used was aluminum
diethylphosphinate (ADP) (Clariant, Exolit OP 1230) with the chemical formula of
Al[OP(O)(C2H5)2]3, density of 1.35 g/cm3, decomposition temperature of 350C
(TGA 2% weight loss), and average particle size of 42.3 μm (D[4,3]) and its
phosphorous content was approximately 23-24% (w/w).
28
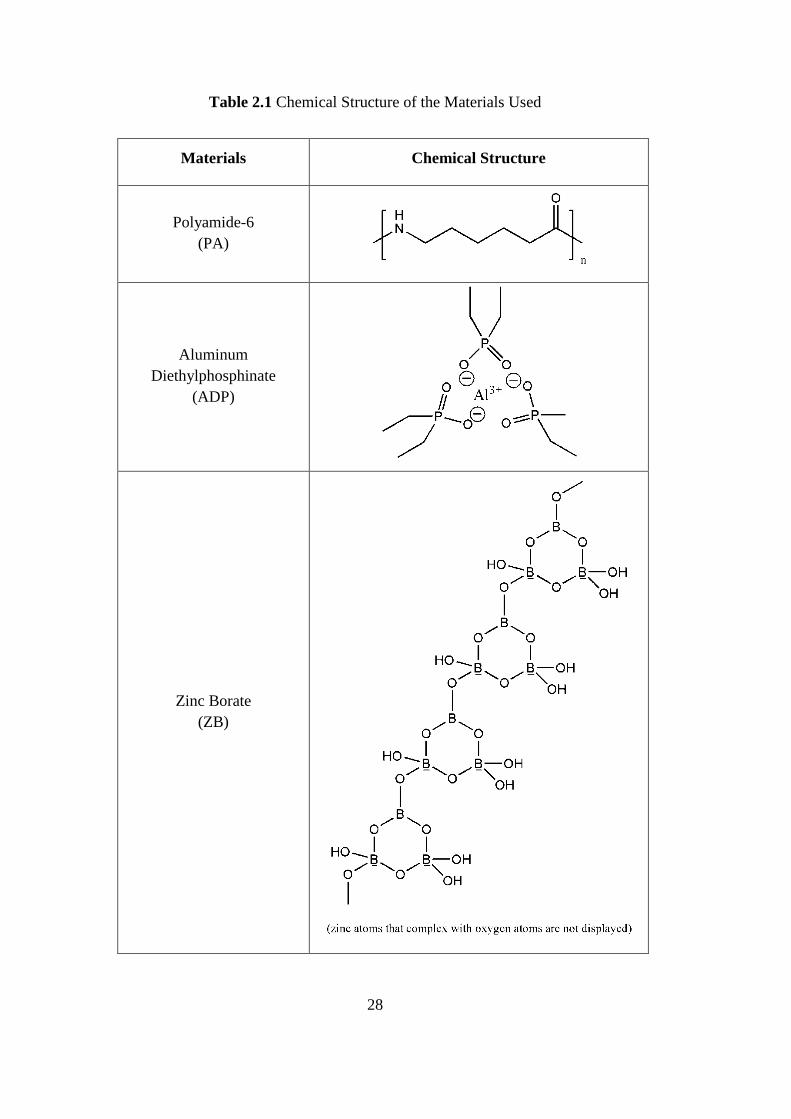
Table 2.1 Chemical Structure of the Materials Used
Materials Chemical Structure
Polyamide-6
(PA)
Aluminum
Diethylphosphinate
(ADP)
Zinc Borate
(ZB)
29
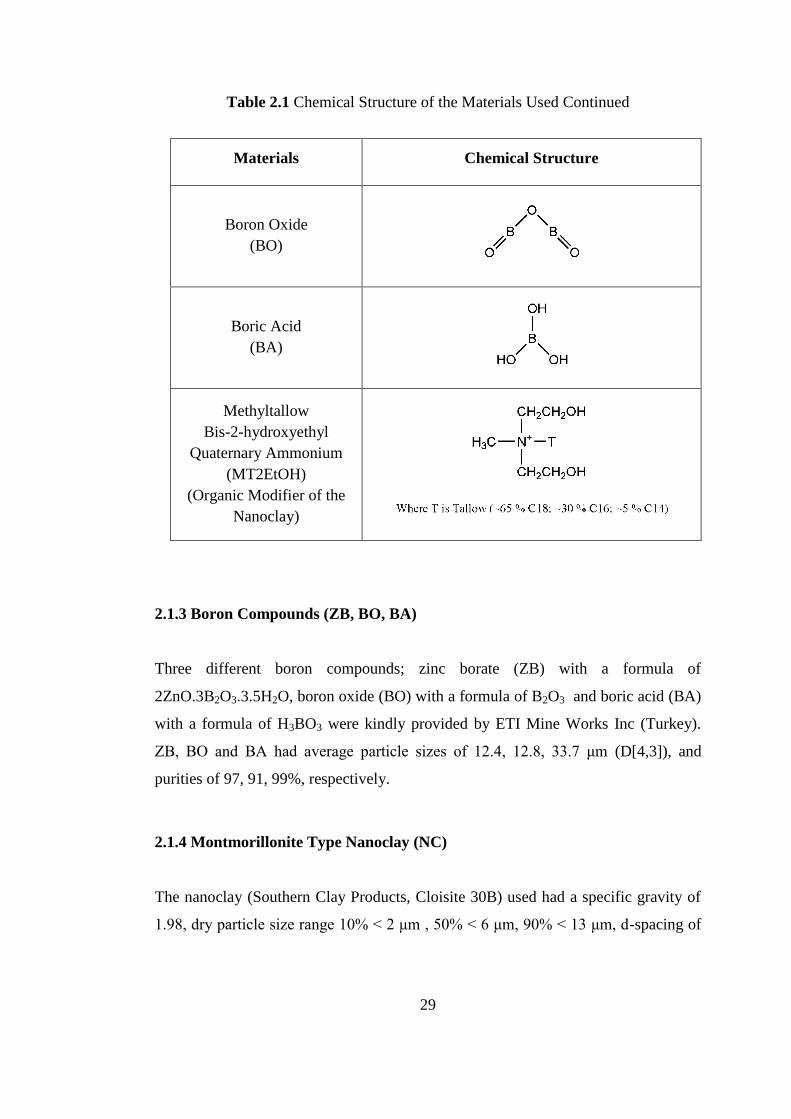
Table 2.1 Chemical Structure of the Materials Used Continued
Materials Chemical Structure
Boron Oxide
(BO)
Boric Acid
(BA)
Methyltallow
Bis-2-hydroxyethyl
Quaternary Ammonium
(MT2EtOH)
(Organic Modifier of the
Nanoclay)
2.1.3 Boron Compounds (ZB, BO, BA)
Three different boron compounds; zinc borate (ZB) with a formula of
2ZnO.3B2O3.3.5H2O, boron oxide (BO) with a formula of B2O3 and boric acid (BA)
with a formula of H3BO3 were kindly provided by ETI Mine Works Inc (Turkey).
ZB, BO and BA had average particle sizes of 12.4, 12.8, 33.7 μm (D[4,3]), and
purities of 97, 91, 99%, respectively.
2.1.4 Montmorillonite Type Nanoclay (NC)
The nanoclay (Southern Clay Products, Cloisite 30B) used had a specific gravity of
1.98, dry particle size range 10% < 2 μm , 50% < 6 μm, 90% < 13 μm, d-spacing of
30
18.5 Å, organic content of 30% (w/w), and modifier concentration of 90 meq/100 g
clay.
It is a montmorillonite type organoclay produced by the cation exchange reaction of
sodium with methyl, tallow, bis-2-hydroxyethyl quaternary ammonium (MT2EtOH).
The chemical structure of this organic modifier is given in Table 2.1. (T stands for
hydrogenated tallow; long organic molecules having ~65% C18
; ~30% C16
;
~5% C14
).
2.2 PRODUCTION OF THE SPECIMENS
In this thesis compounding was done for two groups of materials; the first group was
based on neat PA and the second one was based on PA reinforced with 15 wt% short
glass fibers (PA/GF). In order to evaluate effects of boron compounds (ZB, BO, BA)
and nanoclays (NC), the control sample material was chosen as PA or PA/GF with
20 wt% ADP type organophosphorus compound.
After pre-drying of PA granules in a vacuum oven at 80C for 24 h; PA, GF, ADP,
ZB, BO, BA and NC were compounded by melt mixing method in a laboratory size
twin-screw extruder (Rondol Microlab 10 mm, L/D=20). Although there were slight
changes for each compound composition, in general, the temperature profile during
extrusion for the PA based compounds was 180-200-225-230-196C with 70 rpm
screw speed, while for the PA/GF based compounds it was 180-205-225-230-
195C with 75 rpm screw speed.
After drying operation of compounds, specimens were shaped by two methods;
compression and injection molding. Square plates for cone calorimeter tests were
compression molded at 240C with 4 minutes preheating followed by 100 bar
pressure for 1 minute. Injection Molding (DSM Xplore Micro) for the flammability
31
and mechanical test specimens were done with barrel and mold temperatures of
240C and 70C, respectively, under three step pressure of 13 bar for 4-5 minutes.
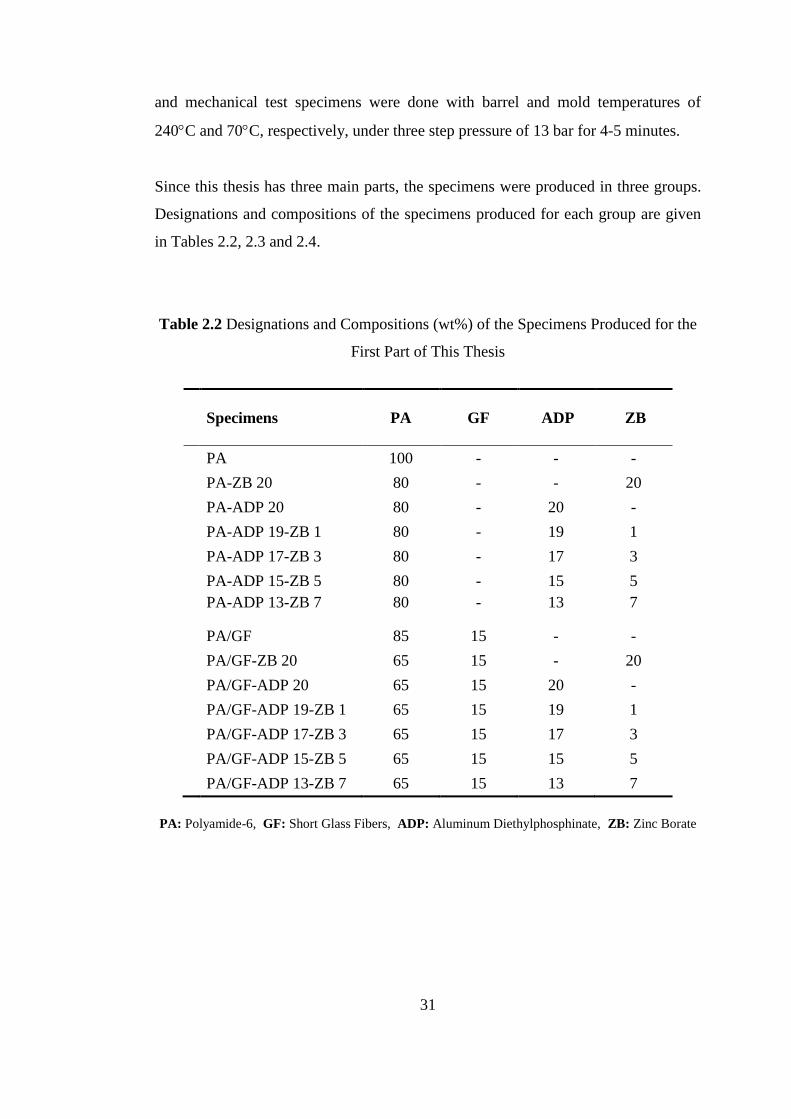
Since this thesis has three main parts, the specimens were produced in three groups.
Designations and compositions of the specimens produced for each group are given
in Tables 2.2, 2.3 and 2.4.
Table 2.2 Designations and Compositions (wt%) of the Specimens Produced for the
First Part of This Thesis
Specimens PA GF ADP ZB
PA 100 - - -
PA-ZB 20 80 - - 20
PA-ADP 20 80 - 20 -
PA-ADP 19-ZB 1 80 - 19 1
PA-ADP 17-ZB 3 80 - 17 3
PA-ADP 15-ZB 5 80 - 15 5
PA-ADP 13-ZB 7 80 - 13 7
PA/GF 85 15 - -
PA/GF-ZB 20 65 15 - 20
PA/GF-ADP 20 65 15 20 -
PA/GF-ADP 19-ZB 1 65 15 19 1
PA/GF-ADP 17-ZB 3 65 15 17 3
PA/GF-ADP 15-ZB 5 65 15 15 5
PA/GF-ADP 13-ZB 7 65 15 13 7
PA: Polyamide-6, GF: Short Glass Fibers, ADP: Aluminum Diethylphosphinate, ZB: Zinc Borate
32
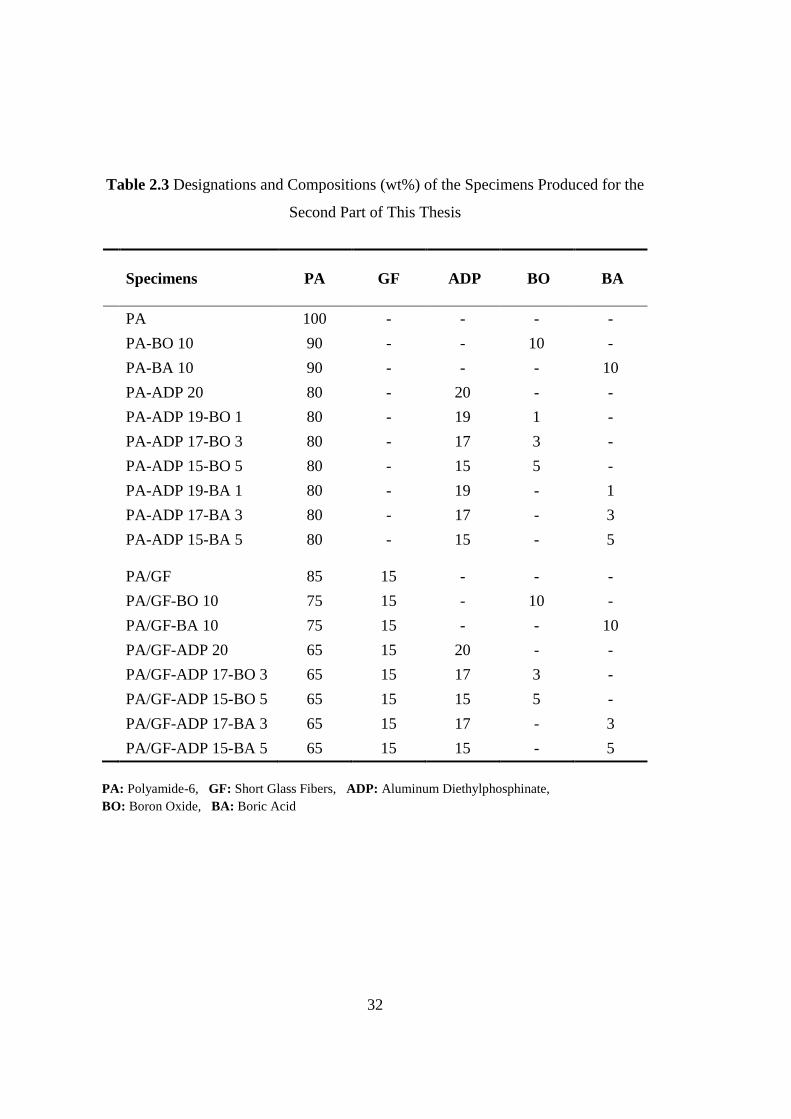
Table 2.3 Designations and Compositions (wt%) of the Specimens Produced for the
Second Part of This Thesis
Specimens PA GF ADP BO BA
PA 100 - - - -
PA-BO 10 90 - - 10 -
PA-BA 10 90 - - - 10
PA-ADP 20 80 - 20 - -
PA-ADP 19-BO 1 80 - 19 1 -
PA-ADP 17-BO 3 80 - 17 3 -
PA-ADP 15-BO 5 80 - 15 5 -
PA-ADP 19-BA 1 80 - 19 - 1
PA-ADP 17-BA 3 80 - 17 - 3
PA-ADP 15-BA 5 80 - 15 - 5
PA/GF 85 15 - - -
PA/GF-BO 10 75 15 - 10 -
PA/GF-BA 10 75 15 - - 10
PA/GF-ADP 20 65 15 20 - -
PA/GF-ADP 17-BO 3 65 15 17 3 -
PA/GF-ADP 15-BO 5 65 15 15 5 -
PA/GF-ADP 17-BA 3 65 15 17 - 3
PA/GF-ADP 15-BA 5 65 15 15 - 5
PA: Polyamide-6, GF: Short Glass Fibers, ADP: Aluminum Diethylphosphinate,
BO: Boron Oxide, BA: Boric Acid
33
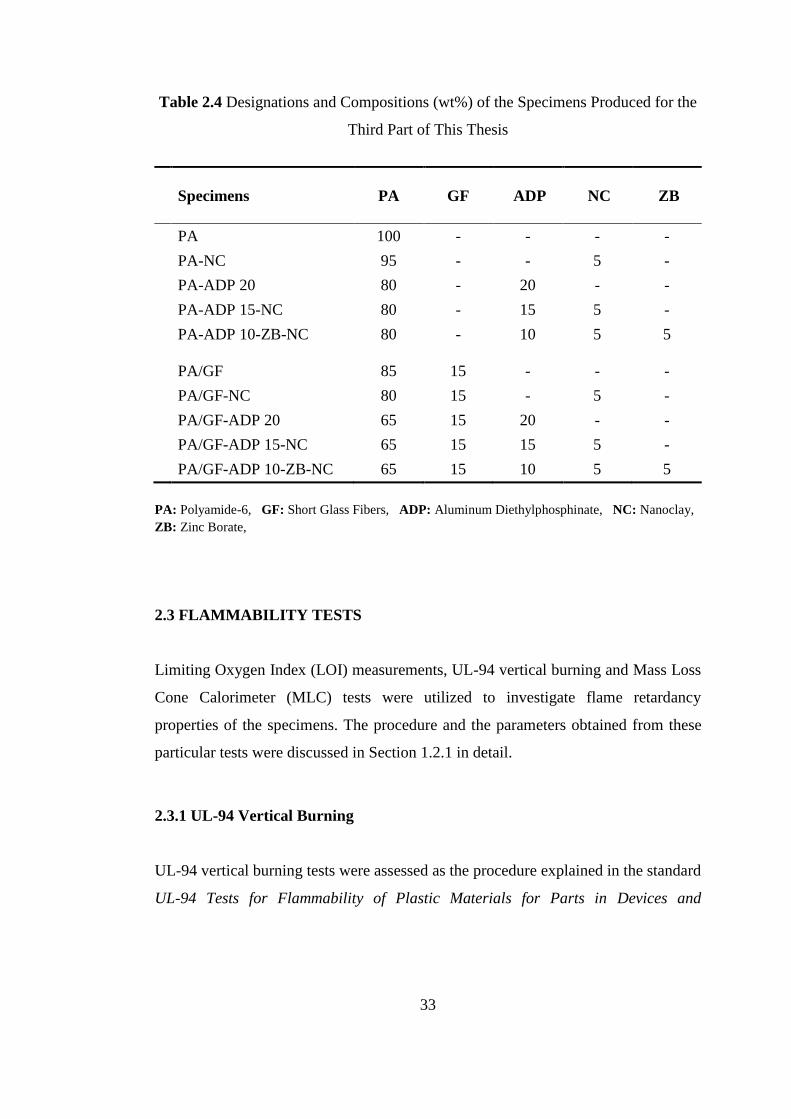
Table 2.4 Designations and Compositions (wt%) of the Specimens Produced for the
Third Part of This Thesis
Specimens PA GF ADP NC ZB
PA 100 - - - -
PA-NC 95 - - 5 -
PA-ADP 20 80 - 20 - -
PA-ADP 15-NC 80 - 15 5 -
PA-ADP 10-ZB-NC 80 - 10 5 5
PA/GF 85 15 - - -
PA/GF-NC 80 15 - 5 -
PA/GF-ADP 20 65 15 20 - -
PA/GF-ADP 15-NC 65 15 15 5 -
PA/GF-ADP 10-ZB-NC 65 15 10 5 5
PA: Polyamide-6, GF: Short Glass Fibers, ADP: Aluminum Diethylphosphinate, NC: Nanoclay,
ZB: Zinc Borate,
2.3 FLAMMABILITY TESTS
Limiting Oxygen Index (LOI) measurements, UL-94 vertical burning and Mass Loss
Cone Calorimeter (MLC) tests were utilized to investigate flame retardancy
properties of the specimens. The procedure and the parameters obtained from these
particular tests were discussed in Section 1.2.1 in detail.
2.3.1 UL-94 Vertical Burning
UL-94 vertical burning tests were assessed as the procedure explained in the standard
UL-94 Tests for Flammability of Plastic Materials for Parts in Devices and
34
Appliances developed by Underwriters Laboratories. Tests were performed for the
3.2 mm thick specimens.
2.3.2 Limiting Oxygen Index
Limiting Oxygen Index (LOI) measurements were conducted by an oxygen index
apparatus (Fire Testing Technology Inc.) having a paramagnetic oxygen analyzer
according to the standard of ISO 4589 Determination of Burning Behavior by
Oxygen Index.
2.3.3 Mass Loss Cone Calorimetry
Mass Loss Cone Calorimeter (Fire Testing Technology Inc.) was utilized to measure
heat release rates and mass loss rates of the burning specimens having the
dimensions of 100x100x4 mm3 according to the procedure given in the standard
ISO 13927 Simple Heat Release Test Using a Conical Radiant Heater and
a Thermopile Detector. During the test, external heat flux was kept as 35 kW/m2.
Data were recorded using a data-acquisition system and the outcomes of the test
indicated that measured heat release rates are reproducible with ±10% deviation.
2.4 OTHER TESTS AND ANALYSIS
2.4.1 Thermogravimetric Analysis
In order to investigate thermal degradation of the specimens, thermogravimetric
analysis (TGA) (Netzsch STA 449 F3 Jupiter) was carried out under nitrogen at
a flow rate of 20 ml/min and a heating rate of 10C/min.
35
2.4.2 X-ray Diffraction Analysis
Wide angle X-ray diffraction analysis (XRD) (Rigaku D-Max 2200) with Cu Kα
radiation (40 kV, 40 mA) was first utilized for MLC chars over a scanning range of
5-80. Then, it was also conducted in order to evaluate dispersibility and
intercalation/exfoliation state of NC silicate layers in PA and PA/GF matrices over
the continuous range of 1-10.
2.4.3 Scanning Electron Microscopy
Morphological studies of the LOI specimen chars and fracture surfaces of tensile test
specimens were conducted under scanning electron microscopy (SEM) (FEI Nova
Nano 430). Sample surfaces were coated with a thin layer of gold to avoid
electrostatic charging and provide conductive surfaces.
2.4.4 Transmission Electron Microscopy
For the visual evidence of intercalation/exfoliation of nanoclay layers in the matrix,
transmission electron microscopy (TEM) (FEI Tecnai G2 Spirit Bio TWIN) was
conducted at an acceleration voltage of 80 kV. To prepare samples for TEM, an
ultra-microtome (Leica EM UC6) with a diamond knife was utilized. Sections having
less than 100 nm thicknesses were sliced and transferred to 400 mesh copper grids.
2.4.5 Evolved Gas Analysis
In order to support flame retardancy mechanism of the compounds, evolved gas
analysis (EGA) was also conducted by a TGA-FTIR coupled system (Perkin Elmer
TGA 4000- Spectrum Two). TGA was run from 20 to 900C under nitrogen flow
(20 ml/min) with a heating rate of 10C/min, while FTIR scanning was from 4000 to
400 cm-1
with a resolution of 4 cm-1
.
36
2.4.6 Tensile Testing
Mechanical behavior of the specimens were evaluated by tensile tests on at least five
ISO 527 Type 1A samples using a universal testing machine (Instron 5565A, 5 kN).
Tests were conducted at least for five specimens of each formulation, and the data
were evaluated as the average values with standard deviations.
37
CHAPTER 3
RESULTS AND DISCUSSION
As stated before, since this dissertation has three main purposes and consequently
three basic experimental stages, their results are presented and discussed successively
in the following three subsections.
3.1 EFFECTS OF ZINC BORATE
In order to evaluate flame retardancy enhancement of ZB, the control sample
material was chosen as PA or PA/GF with 20 wt% ADP type organophosphorus
compound. Then, for each compound group, the amount of ADP was replaced with
1, 3, 5, and 7 wt% ZB. In order to observe effects of ZB alone, specimens having
only 20 wt% ZB were also produced. Designations and compositions of the
specimens produced for this first part of the thesis are given in Table 2.2 and the
results are discussed below.
3.1.1 UL-94 and LOI Flammability Tests
Results of UL-94 and LOI flammability tests are tabulated in Table 3.1, while
appearances of the representative specimens after these two tests are given in
Figure 3.1 and 3.2 respectively. It is seen that both PA and PA/GF specimens have
V-2 rating from UL-94 tests, and LOI values of 26.1 and 23.3 O2%, respectively.
When 20 wt% ZB was added alone, there was almost no enhancement in the
flammability values, except a slight increase of LOI (from 23.3 to 25.1) in the
specimen of PA/GF-ZB 20, which should be due to formation of certain level of
charring as shown in Figure 3.2(b)(ii).
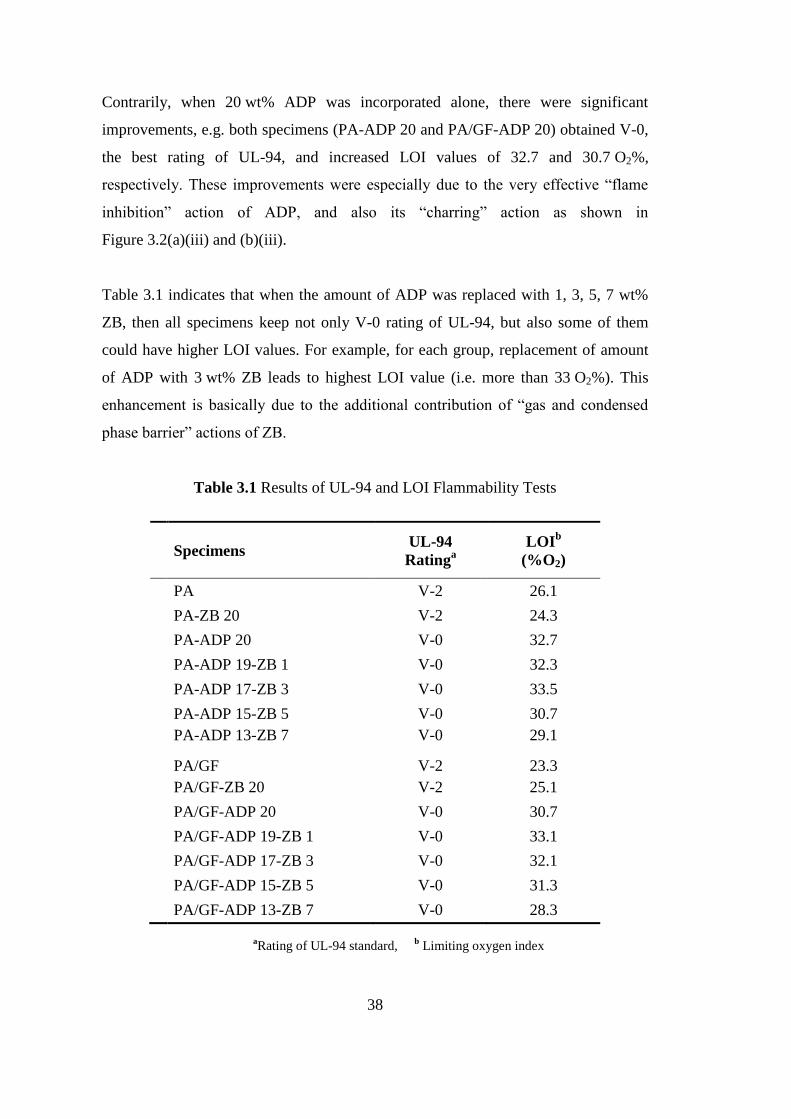
38
Contrarily, when 20 wt% ADP was incorporated alone, there were significant
improvements, e.g. both specimens (PA-ADP 20 and PA/GF-ADP 20) obtained V-0,
the best rating of UL-94, and increased LOI values of 32.7 and 30.7 O2%,
respectively. These improvements were especially due to the very effective “flame
inhibition” action of ADP, and also its “charring” action as shown in
Figure 3.2(a)(iii) and (b)(iii).
Table 3.1 indicates that when the amount of ADP was replaced with 1, 3, 5, 7 wt%
ZB, then all specimens keep not only V-0 rating of UL-94, but also some of them
could have higher LOI values. For example, for each group, replacement of amount
of ADP with 3 wt% ZB leads to highest LOI value (i.e. more than 33 O2%). This
enhancement is basically due to the additional contribution of “gas and condensed
phase barrier” actions of ZB.
Table 3.1 Results of UL-94 and LOI Flammability Tests
Specimens UL-94
Ratinga
LOIb
(%O2)
PA V-2 26.1
PA-ZB 20 V-2 24.3
PA-ADP 20 V-0 32.7
PA-ADP 19-ZB 1 V-0 32.3
PA-ADP 17-ZB 3 V-0 33.5
PA-ADP 15-ZB 5 V-0 30.7
PA-ADP 13-ZB 7 V-0 29.1
PA/GF V-2 23.3
PA/GF-ZB 20 V-2 25.1
PA/GF-ADP 20 V-0 30.7
PA/GF-ADP 19-ZB 1 V-0 33.1
PA/GF-ADP 17-ZB 3 V-0 32.1
PA/GF-ADP 15-ZB 5 V-0 31.3
PA/GF-ADP 13-ZB 7 V-0 28.3
aRating of UL-94 standard,
b Limiting oxygen index
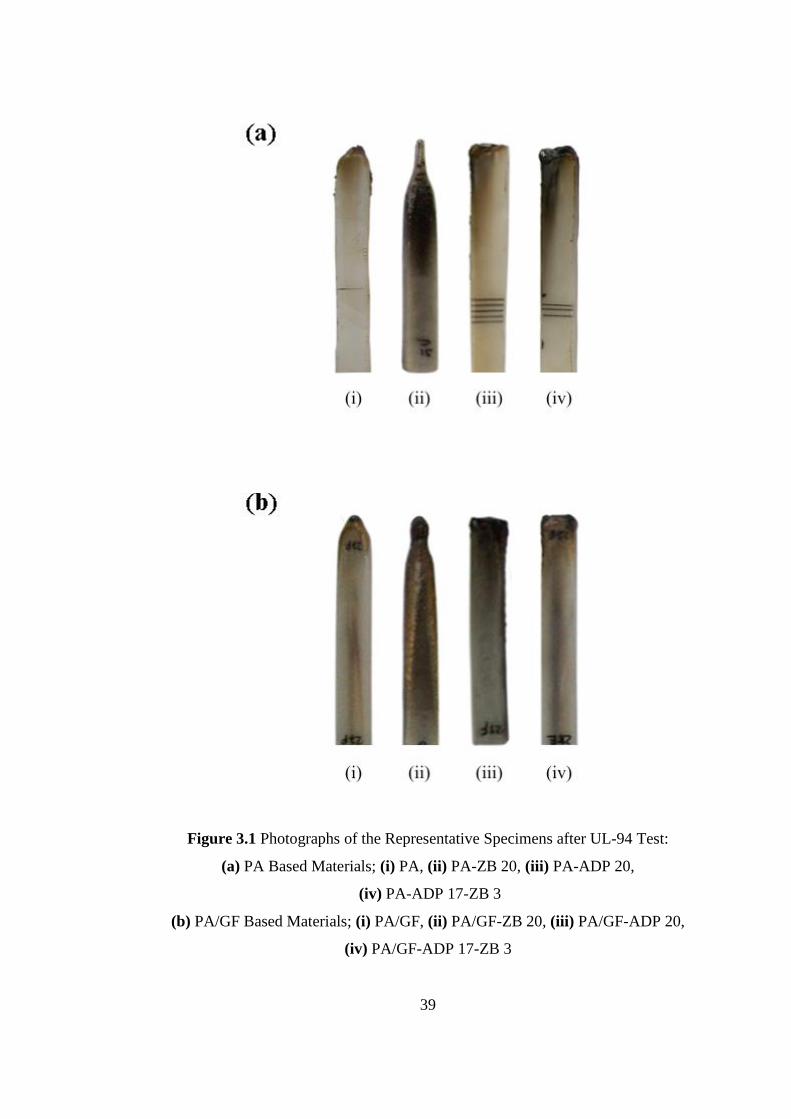
39
Figure 3.1 Photographs of the Representative Specimens after UL-94 Test:
(a) PA Based Materials; (i) PA, (ii) PA-ZB 20, (iii) PA-ADP 20,
(iv) PA-ADP 17-ZB 3
(b) PA/GF Based Materials; (i) PA/GF, (ii) PA/GF-ZB 20, (iii) PA/GF-ADP 20,
(iv) PA/GF-ADP 17-ZB 3
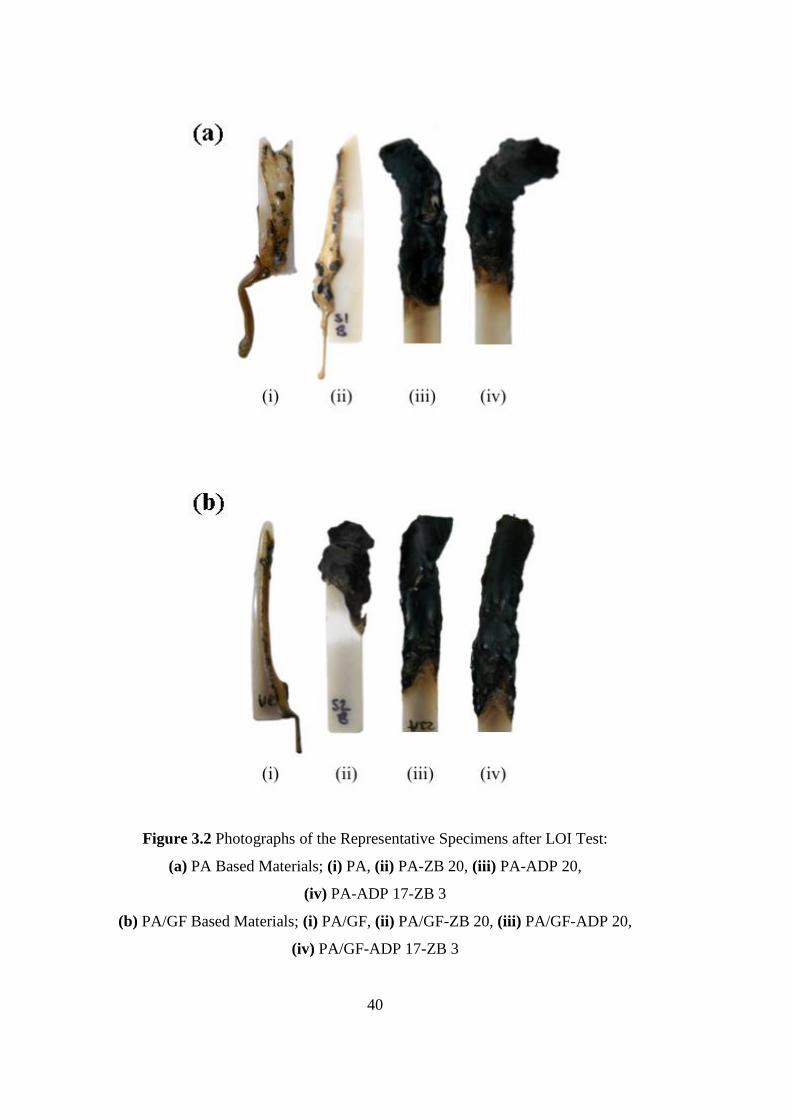
40
Figure 3.2 Photographs of the Representative Specimens after LOI Test:
(a) PA Based Materials; (i) PA, (ii) PA-ZB 20, (iii) PA-ADP 20,
(iv) PA-ADP 17-ZB 3
(b) PA/GF Based Materials; (i) PA/GF, (ii) PA/GF-ZB 20, (iii) PA/GF-ADP 20,
(iv) PA/GF-ADP 17-ZB 3
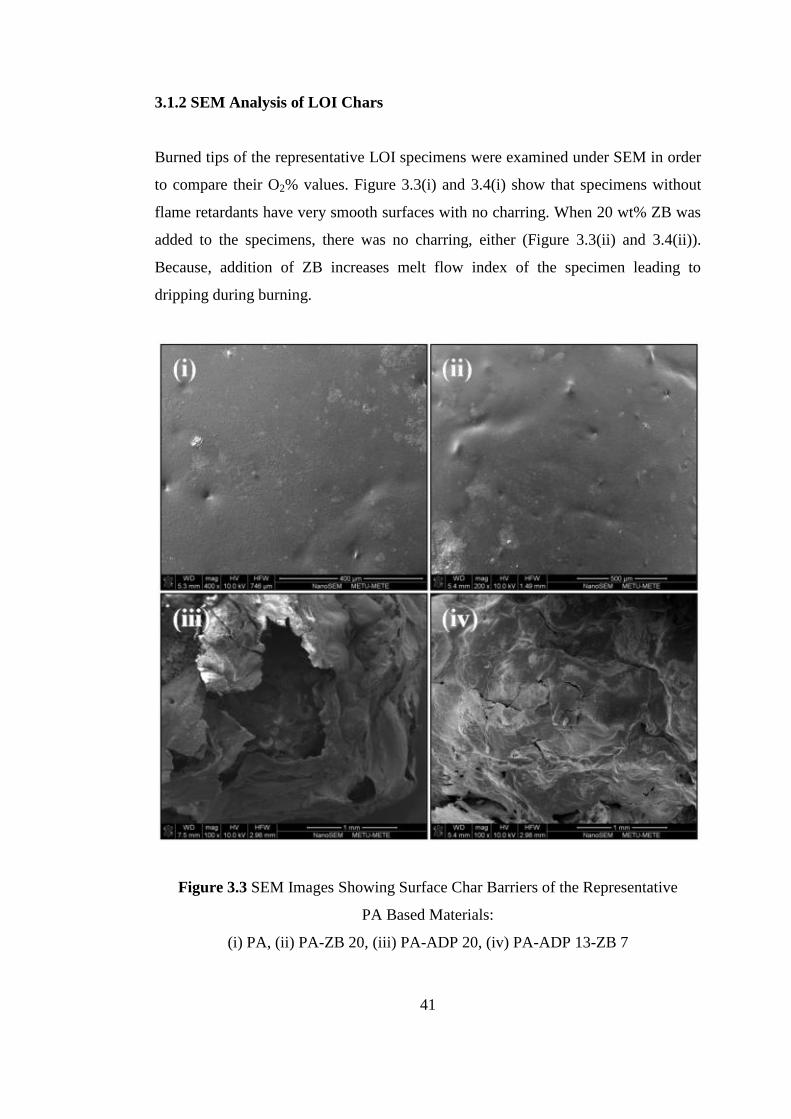
41
3.1.2 SEM Analysis of LOI Chars
Burned tips of the representative LOI specimens were examined under SEM in order
to compare their O2% values. Figure 3.3(i) and 3.4(i) show that specimens without
flame retardants have very smooth surfaces with no charring. When 20 wt% ZB was
added to the specimens, there was no charring, either (Figure 3.3(ii) and 3.4(ii)).
Because, addition of ZB increases melt flow index of the specimen leading to
dripping during burning.
Figure 3.3 SEM Images Showing Surface Char Barriers of the Representative
PA Based Materials:
(i) PA, (ii) PA-ZB 20, (iii) PA-ADP 20, (iv) PA-ADP 13-ZB 7
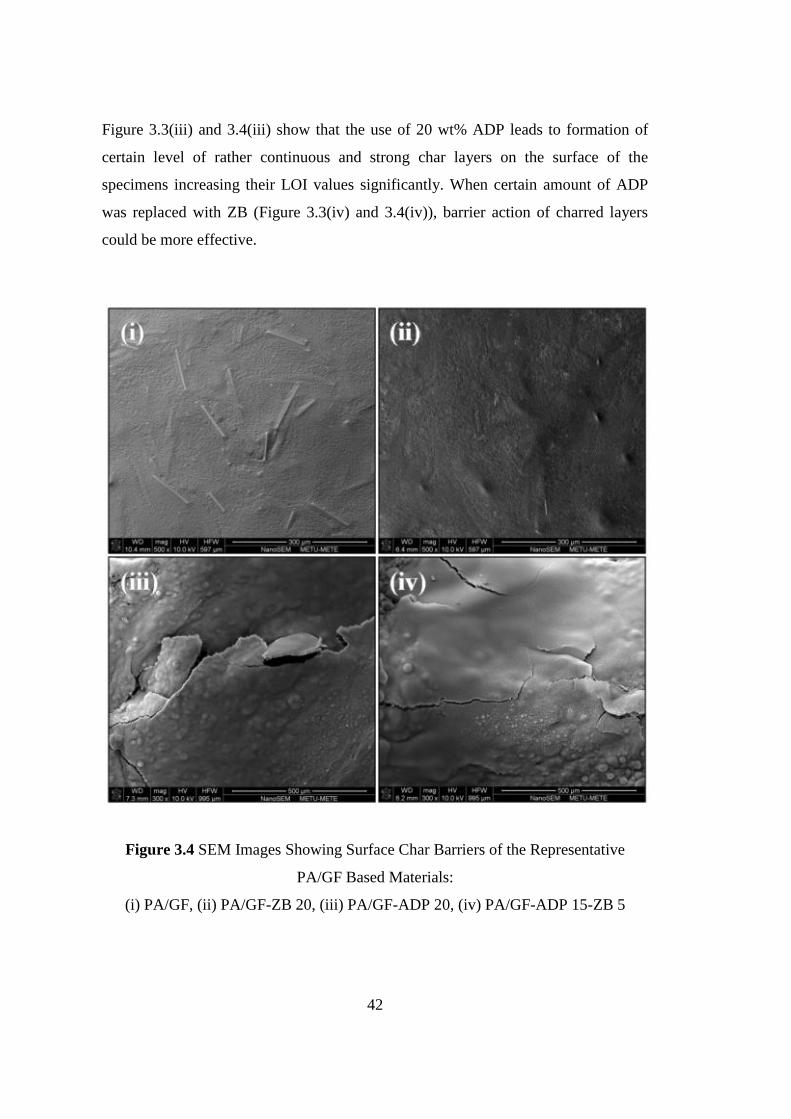
42
Figure 3.3(iii) and 3.4(iii) show that the use of 20 wt% ADP leads to formation of
certain level of rather continuous and strong char layers on the surface of the
specimens increasing their LOI values significantly. When certain amount of ADP
was replaced with ZB (Figure 3.3(iv) and 3.4(iv)), barrier action of charred layers
could be more effective.
Figure 3.4 SEM Images Showing Surface Char Barriers of the Representative
PA/GF Based Materials:
(i) PA/GF, (ii) PA/GF-ZB 20, (iii) PA/GF-ADP 20, (iv) PA/GF-ADP 15-ZB 5
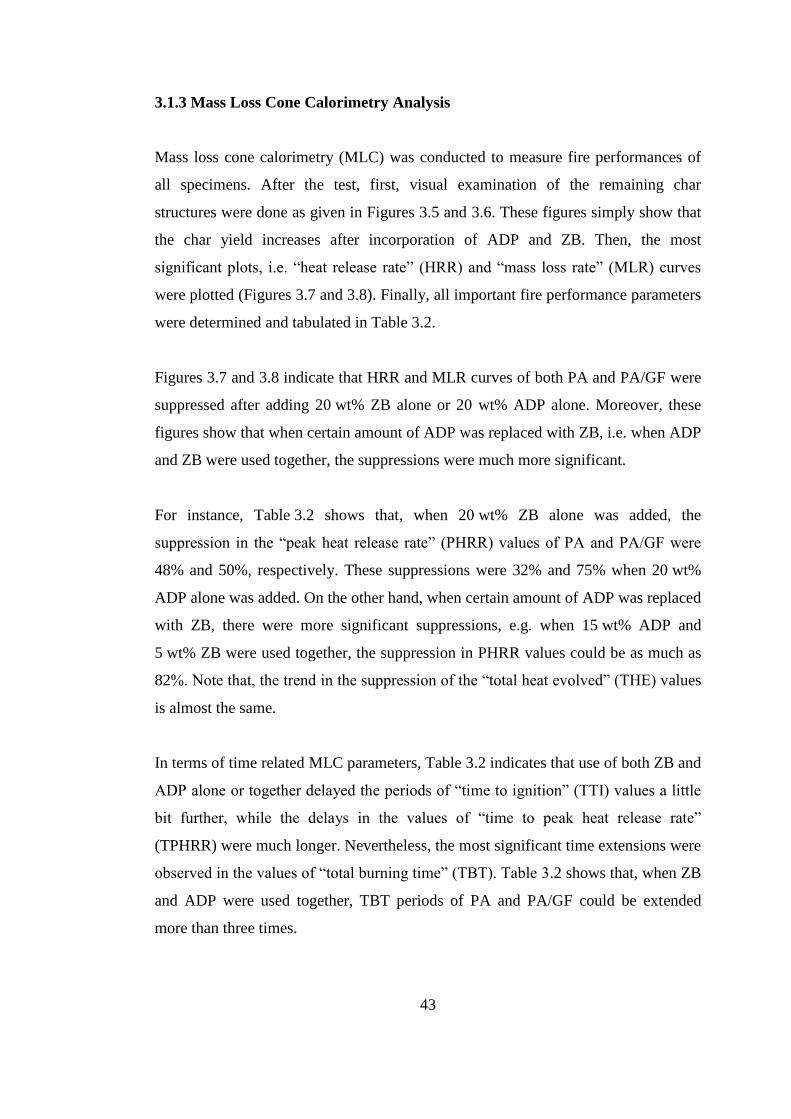
43
3.1.3 Mass Loss Cone Calorimetry Analysis
Mass loss cone calorimetry (MLC) was conducted to measure fire performances of
all specimens. After the test, first, visual examination of the remaining char
structures were done as given in Figures 3.5 and 3.6. These figures simply show that
the char yield increases after incorporation of ADP and ZB. Then, the most
significant plots, i.e. “heat release rate” (HRR) and “mass loss rate” (MLR) curves
were plotted (Figures 3.7 and 3.8). Finally, all important fire performance parameters
were determined and tabulated in Table 3.2.
Figures 3.7 and 3.8 indicate that HRR and MLR curves of both PA and PA/GF were
suppressed after adding 20 wt% ZB alone or 20 wt% ADP alone. Moreover, these
figures show that when certain amount of ADP was replaced with ZB, i.e. when ADP
and ZB were used together, the suppressions were much more significant.
For instance, Table 3.2 shows that, when 20 wt% ZB alone was added, the
suppression in the “peak heat release rate” (PHRR) values of PA and PA/GF were
48% and 50%, respectively. These suppressions were 32% and 75% when 20 wt%
ADP alone was added. On the other hand, when certain amount of ADP was replaced
with ZB, there were more significant suppressions, e.g. when 15 wt% ADP and
5 wt% ZB were used together, the suppression in PHRR values could be as much as
82%. Note that, the trend in the suppression of the “total heat evolved” (THE) values
is almost the same.
In terms of time related MLC parameters, Table 3.2 indicates that use of both ZB and
ADP alone or together delayed the periods of “time to ignition” (TTI) values a little
bit further, while the delays in the values of “time to peak heat release rate”
(TPHRR) were much longer. Nevertheless, the most significant time extensions were
observed in the values of “total burning time” (TBT). Table 3.2 shows that, when ZB
and ADP were used together, TBT periods of PA and PA/GF could be extended
more than three times.
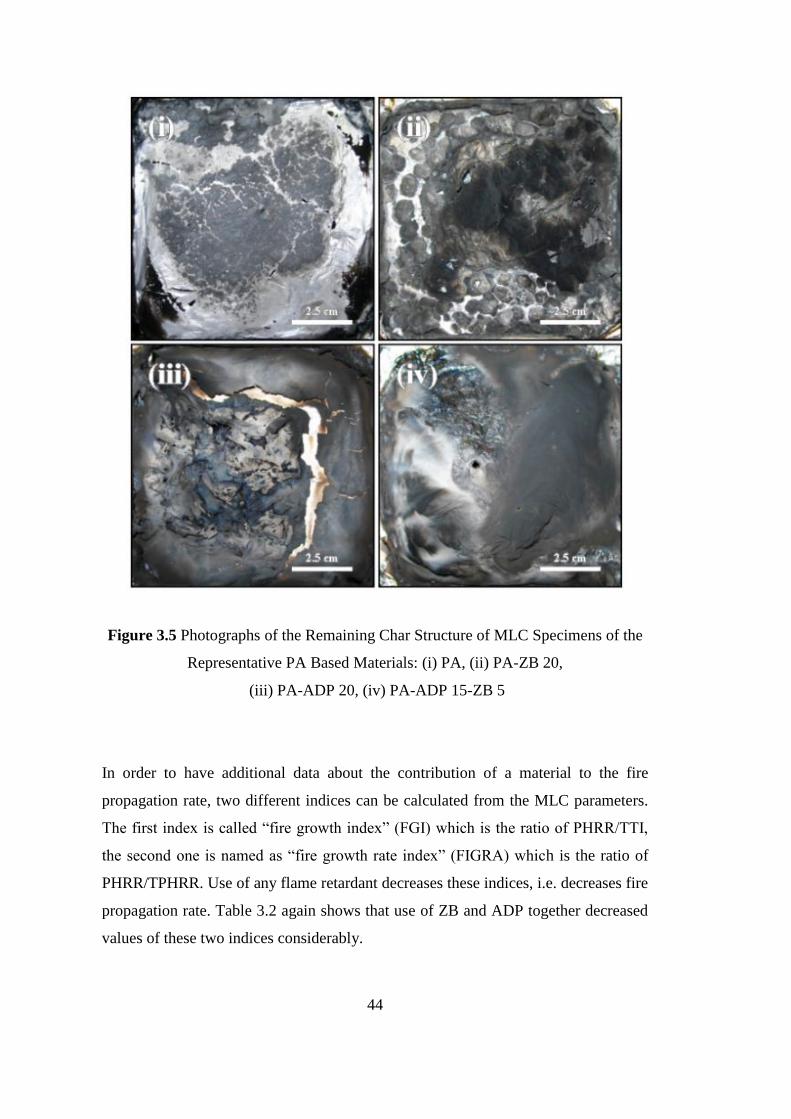
44
Figure 3.5 Photographs of the Remaining Char Structure of MLC Specimens of the
Representative PA Based Materials: (i) PA, (ii) PA-ZB 20,
(iii) PA-ADP 20, (iv) PA-ADP 15-ZB 5
In order to have additional data about the contribution of a material to the fire
propagation rate, two different indices can be calculated from the MLC parameters.
The first index is called “fire growth index” (FGI) which is the ratio of PHRR/TTI,
the second one is named as “fire growth rate index” (FIGRA) which is the ratio of
PHRR/TPHRR. Use of any flame retardant decreases these indices, i.e. decreases fire
propagation rate. Table 3.2 again shows that use of ZB and ADP together decreased
values of these two indices considerably.
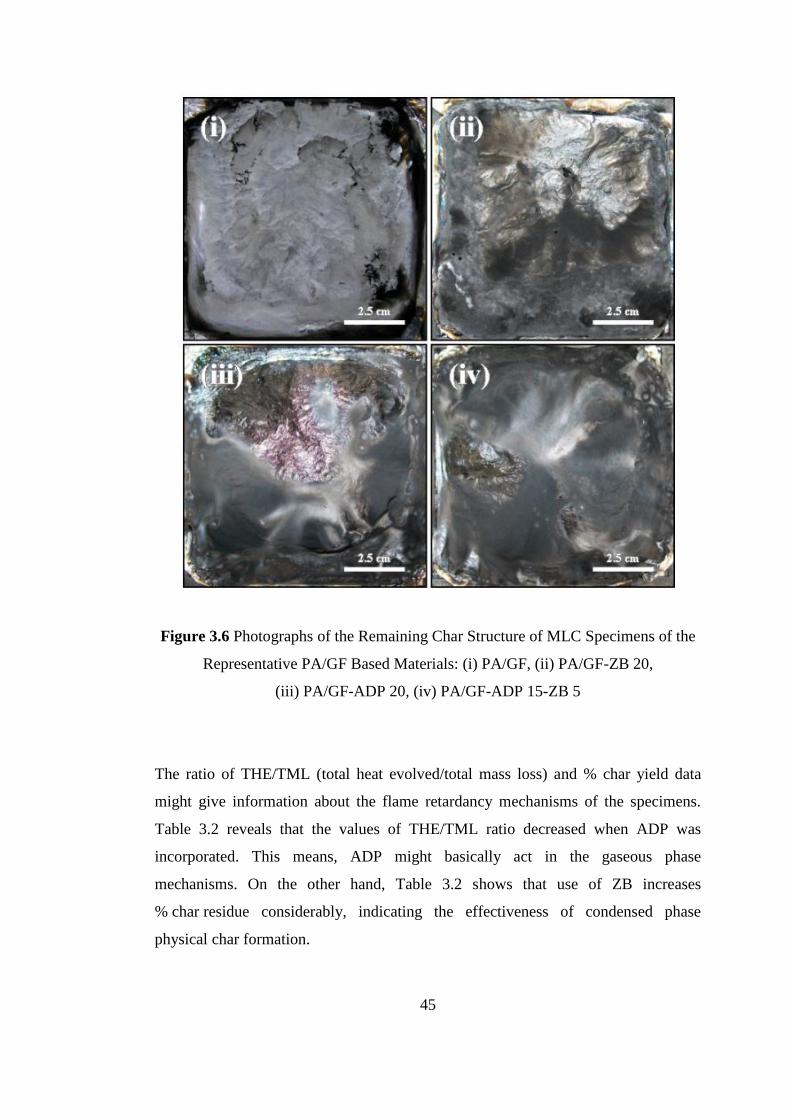
45
Figure 3.6 Photographs of the Remaining Char Structure of MLC Specimens of the
Representative PA/GF Based Materials: (i) PA/GF, (ii) PA/GF-ZB 20,
(iii) PA/GF-ADP 20, (iv) PA/GF-ADP 15-ZB 5
The ratio of THE/TML (total heat evolved/total mass loss) and % char yield data
might give information about the flame retardancy mechanisms of the specimens.
Table 3.2 reveals that the values of THE/TML ratio decreased when ADP was
incorporated. This means, ADP might basically act in the gaseous phase
mechanisms. On the other hand, Table 3.2 shows that use of ZB increases
% char residue considerably, indicating the effectiveness of condensed phase
physical char formation.
46
Figure 3.7 Heat Release Rate and Mass Loss Rate Curves for the PA Based
Materials
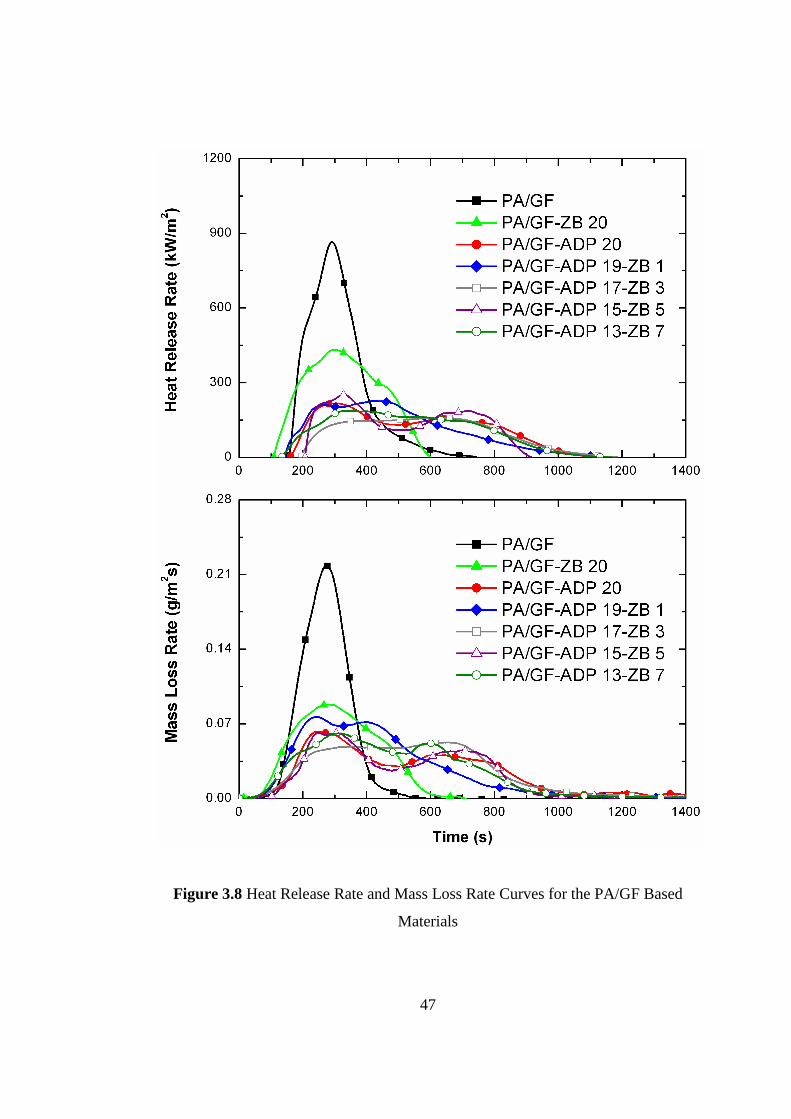
47
Figure 3.8 Heat Release Rate and Mass Loss Rate Curves for the PA/GF Based
Materials
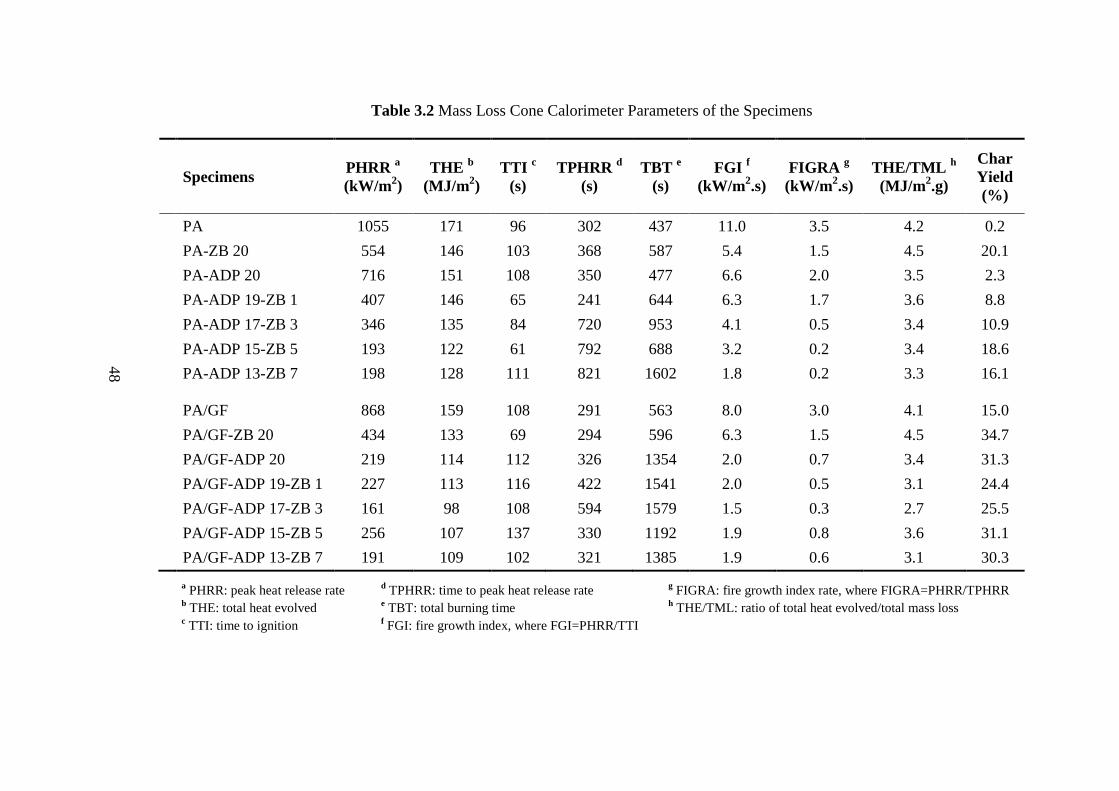
48
Table 3.2 Mass Loss Cone Calorimeter Parameters of the Specimens
Specimens PHRR
a
(kW/m2)
THE b
(MJ/m2)
TTI c
(s)
TPHRR d
(s)
TBT e
(s)
FGI f
(kW/m2.s)
FIGRA g
(kW/m2.s)
THE/TML h
(MJ/m2.g)
Char
Yield
(%)
PA 1055 171 96 302 437 11.0 3.5 4.2 0.2
PA-ZB 20 554 146 103 368 587 5.4 1.5 4.5 20.1
PA-ADP 20 716 151 108 350 477 6.6 2.0 3.5 2.3
PA-ADP 19-ZB 1 407 146 65 241 644 6.3 1.7 3.6 8.8
PA-ADP 17-ZB 3 346 135 84 720 953 4.1 0.5 3.4 10.9
PA-ADP 15-ZB 5 193 122 61 792 688 3.2 0.2 3.4 18.6
PA-ADP 13-ZB 7 198 128 111 821 1602 1.8 0.2 3.3 16.1
PA/GF 868 159 108 291 563 8.0 3.0 4.1 15.0
PA/GF-ZB 20 434 133 69 294 596 6.3 1.5 4.5 34.7
PA/GF-ADP 20 219 114 112 326 1354 2.0 0.7 3.4 31.3
PA/GF-ADP 19-ZB 1 227 113 116 422 1541 2.0 0.5 3.1 24.4
PA/GF-ADP 17-ZB 3 161 98 108 594 1579 1.5 0.3 2.7 25.5
PA/GF-ADP 15-ZB 5 256 107 137 330 1192 1.9 0.8 3.6 31.1
PA/GF-ADP 13-ZB 7 191 109 102 321 1385 1.9 0.6 3.1 30.3
a PHRR: peak heat release rate
d TPHRR: time to peak heat release rate
g FIGRA: fire growth index rate, where FIGRA=PHRR/TPHRR
b THE: total heat evolved
e TBT: total burning time
h THE/TML: ratio of total heat evolved/total mass loss
c TTI: time to ignition
f FGI: fire growth index, where FGI=PHRR/TTI
49
3.1.4 Flame Retardancy Mechanisms
It is known that phosphorus based flame retardants can function effectively when
incorporated into polymers containing oxygen in pendant groups or in the backbone.
It is also generally accepted that phosphorus compounds either react with the
polymer during decomposition, or get oxidized to phosphoric acid to promote
charring in the condensed phase. Phosphorus compounds can also volatilize into gas
phase and get oxidized to HPO2, PO, PO2, and HPO radicals acting as H and
OH scavengers to suppress combustion chain reaction.
Therefore, since polyamide-6 is an oxygen containing polymer, ADP may act both
in the “condensed” phase and the “gaseous” phase [29,30,34]. When ADP was
vaporized during fire, it might get oxidized to radicals mentioned above which would
scavenge very harmful H and OH hot radicals. This gaseous phase action, which is
called “flame inhibition”, is considered to be the dominant mechanism of ADP
suppressing the combustion reactions effectively.
When ADP was oxidized to phosphoric acid during fire, it might lead to formation of
char layers which would insulate the material from fire and oxygen. ADP could form
two-layer protective barrier; a carbon based char and an inorganic residue layer such
as aluminum phosphate. This condensed phase action, which is called “barrier
effect”, can be considered as a secondary mechanism enhancing the flame
retardancy.
It should be noted that ADP vaporization would be improved when lower external
heat fluxes were applied, e.g. during LOI tests. Then, “gas phase action” of ADP
would be dominant. On the other hand, when higher external heat fluxes were
applied, e.g. during MLC tests, decomposition of ADP would be improved. Then,
decomposed phosphinate ions would induce formation of carbon char layers and
aluminum phosphate residue, i.e. “condensed phase action” of ADP would be also
operative.
50
The main mechanism of ZB is also barrier formation which could take place both
in the condensed phase and the gas phase. ZB dehydrates endothermically which
absorb the heat of combustion, and the released water vapor dilutes oxygen and
gaseous flammable components. This mechanism is considered as the gas phase
barrier action. During fire, ZB also produces a glassy layer over the polymer surface,
which is considered as the condensed phase barrier action.
When ZB and ADP were used together, those mechanisms mentioned above would
be also operative. The main contribution of ZB to ADP would be again in the
formation of barrier layers. It is believed that, when they are used together, an
additional inorganic barrier, i.e. boron phosphate /aluminum phosphate layers would
form, as also discussed by Braun et.al. [29]. Another advantage of ZB would be its
well-known ability of smoke and afterglow suppression.
Of course, another contribution to the condensed phase barrier mechanism would
take place by the short glass fibers used in the PA/GF based specimens which would
increase the effectiveness of char barriers via reinforcing or stabilizing their
structure.
In order to clarify these flame retardancy mechanisms further, three additional
analyses (thermogravimetric analysis, X-ray diffraction and evolved gas analysis)
were conducted and discussed in the following sections.
3.1.5 Thermogravimetric Analysis
Since results of each group were very similar, thermogravimetric (TG) and
differential thermogravimetric (DTG) curves are given in Figure 3.9 only for the
representative compositions of the PA based materials, while the thermal degradation
parameters derived from these curves are tabulated in Table 3.3 for neat ZB, ADP
and the representative compositions of the both PA and PA/GF based materials.
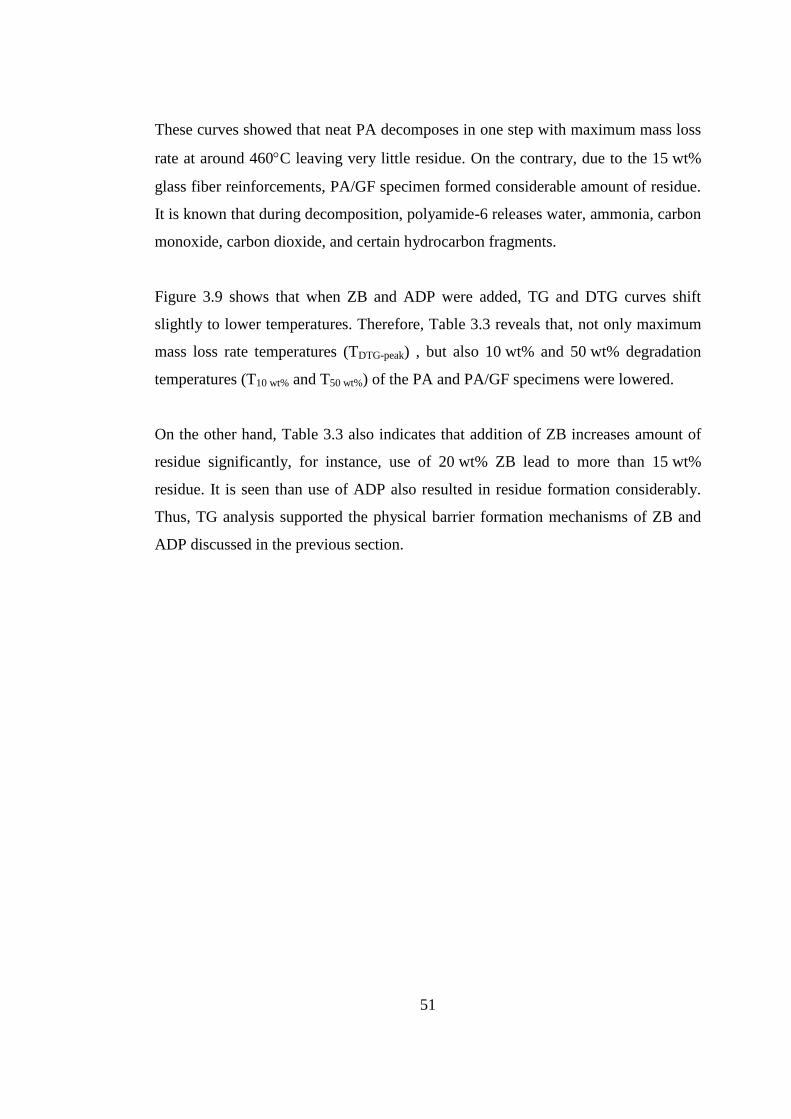
51
These curves showed that neat PA decomposes in one step with maximum mass loss
rate at around 460C leaving very little residue. On the contrary, due to the 15 wt%
glass fiber reinforcements, PA/GF specimen formed considerable amount of residue.
It is known that during decomposition, polyamide-6 releases water, ammonia, carbon
monoxide, carbon dioxide, and certain hydrocarbon fragments.
Figure 3.9 shows that when ZB and ADP were added, TG and DTG curves shift
slightly to lower temperatures. Therefore, Table 3.3 reveals that, not only maximum
mass loss rate temperatures (TDTG-peak) , but also 10 wt% and 50 wt% degradation
temperatures (T10 wt% and T50 wt%) of the PA and PA/GF specimens were lowered.
On the other hand, Table 3.3 also indicates that addition of ZB increases amount of
residue significantly, for instance, use of 20 wt% ZB lead to more than 15 wt%
residue. It is seen than use of ADP also resulted in residue formation considerably.
Thus, TG analysis supported the physical barrier formation mechanisms of ZB and
ADP discussed in the previous section.
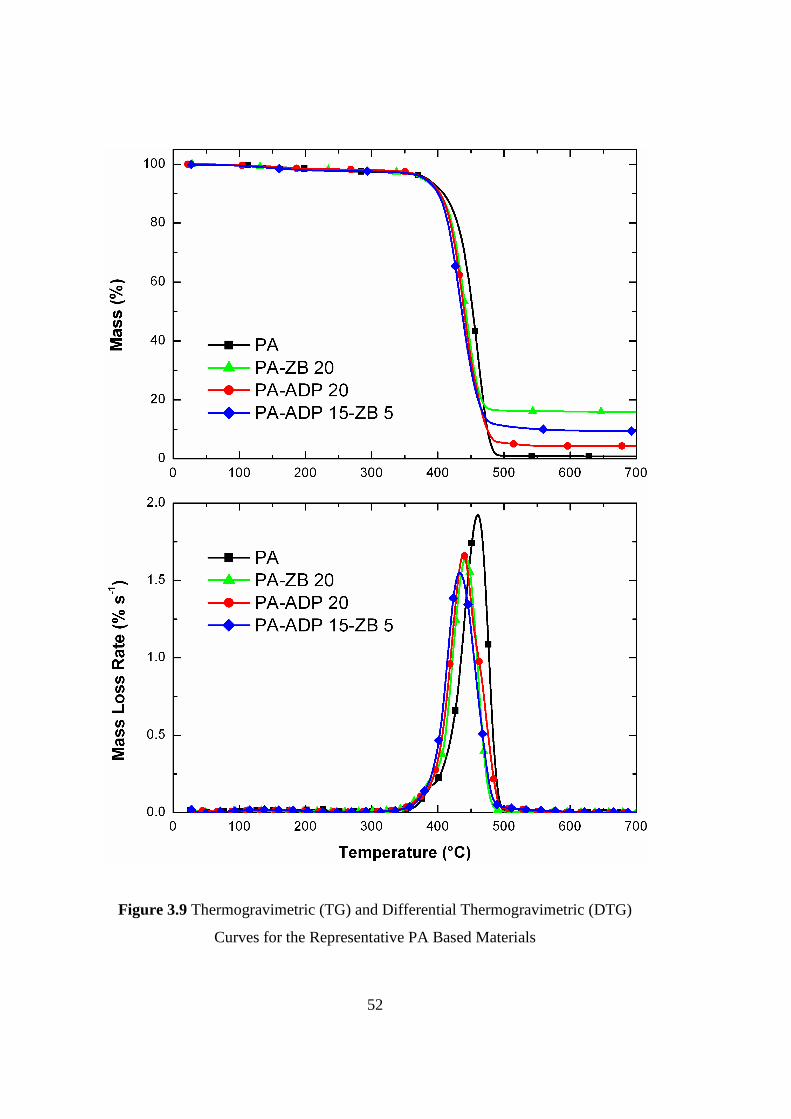
52
Figure 3.9 Thermogravimetric (TG) and Differential Thermogravimetric (DTG)
Curves for the Representative PA Based Materials

53
Table 3.3 Thermal Degradation Parameters of the Representative Specimens Determined from TG and DTG Curves
Specimens TDTG-Peak 1
a
(C)
TDTG-Peak 2 b
(C)
T10 wt% c
(C)
T50 wt% d
(C)
% Residue at
600 C
ZB 242 415 428 - 85.8
ADP 496 459 494 15.8
PA - 460 408 452 0.9
PA-ZB 20 - 442 403 443 16.1
PA-ADP 20 - 436 404 439 4.4
PA-ADP 15-ZB 5 - 426 401 437 9.6
PA/GF 465 416 455 14.8
PA/GF-ZB 20 - 435 409 443 31.5
PA/GF-ADP 20 430 395 436 18.2
PA/GF-ADP 15-ZB 5 - 438 408 443 21.6
a
TDTG-Peak 1: first peak temperature in DTG curve c
T10 wt %: thermal degradation temperature for 10% mass loss
b TDTG-Peak 2: second peak temperature in DTG curve
d T50 wt %: thermal degradation temperature for 50% mass loss
54
3.1.6 XRD Analysis of MLC Residues
In order to reveal crystal structure of the phases in the char layers, XRD analyses
were conducted on the MLC chars of the representative specimens of each group.
Since results of each group were very similar, XRD diffractograms are provided in
Figure 3.10 only for the PA based materials.
Figure 3.10 shows that when ZB was added alone, three forms of dehydrated zinc
borate (Zn(BO2)2, ZnB4O7 and Zn4B6O13) peaks were seen. When ADP was used
alone, peaks of its main decompositions phase, i.e. peaks of aluminum phosphate
(AlPO4) were seen. When ZB and ADP were added together, apart from their
decomposition phases of dehydrated zinc borate and aluminum phosphate, additional
peaks for boron phosphate (BPO4) could be observed.
Thus, it can be stated that, apart from the expected decomposition byproducts,
no other phases were formed in the chars of the MLC specimens. This could be
interpreted as another confirmation of the physical barrier mechanism of especially
ZB, and also partly for ADP.
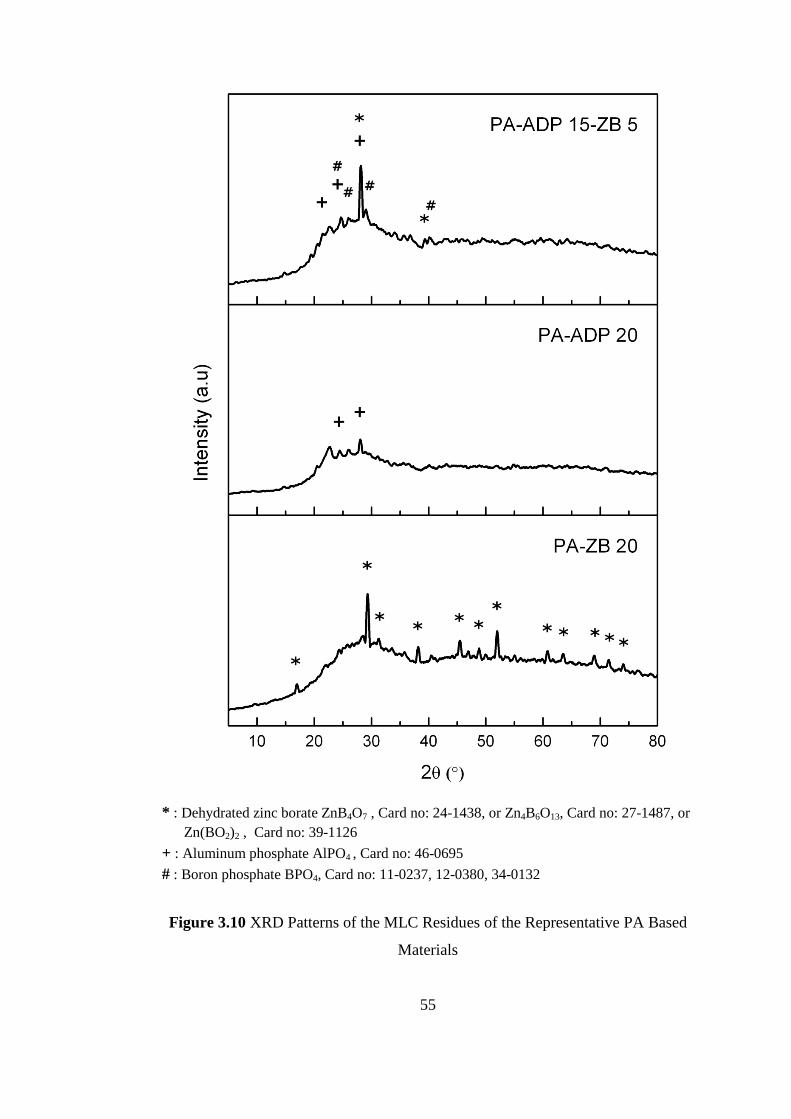
55
* : Dehydrated zinc borate ZnB4O7 , Card no: 24-1438, or Zn4B6O13, Card no: 27-1487, or
Zn(BO2)2 , Card no: 39-1126
+ : Aluminum phosphate AlPO4 , Card no: 46-0695
# : Boron phosphate BPO4, Card no: 11-0237, 12-0380, 34-0132
Figure 3.10 XRD Patterns of the MLC Residues of the Representative PA Based
Materials
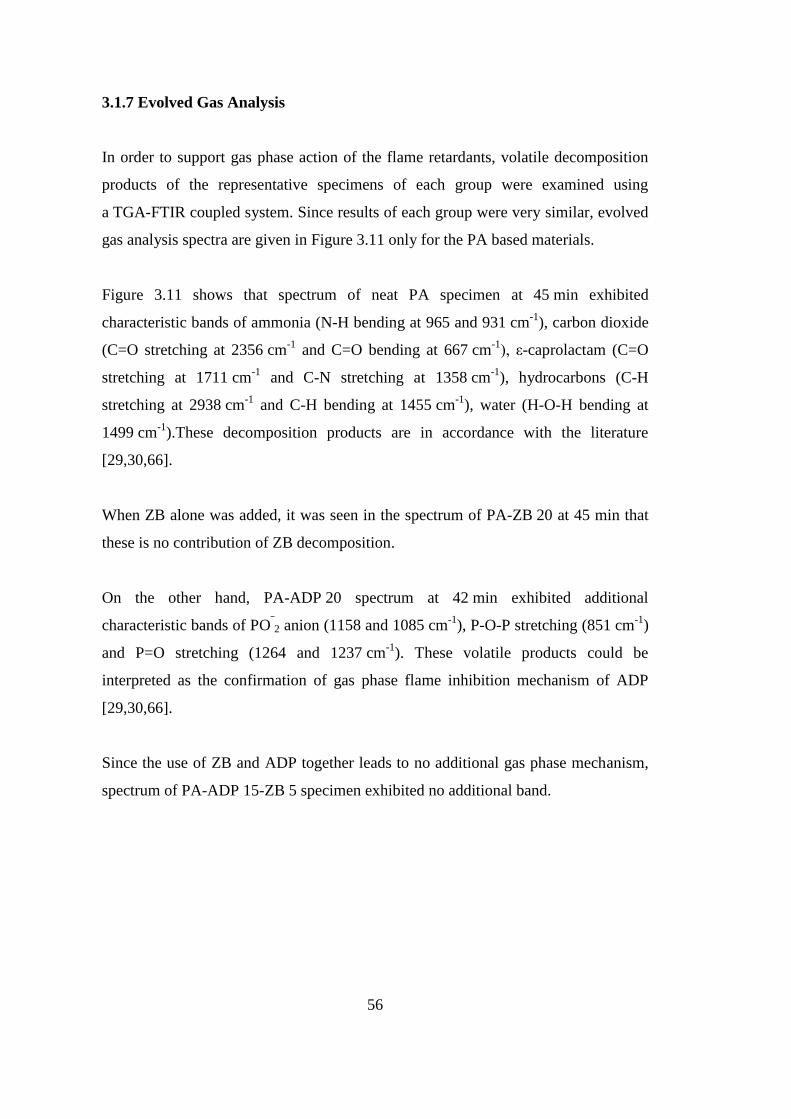
56
3.1.7 Evolved Gas Analysis
In order to support gas phase action of the flame retardants, volatile decomposition
products of the representative specimens of each group were examined using
a TGA-FTIR coupled system. Since results of each group were very similar, evolved
gas analysis spectra are given in Figure 3.11 only for the PA based materials.
Figure 3.11 shows that spectrum of neat PA specimen at 45 min exhibited
characteristic bands of ammonia (N-H bending at 965 and 931 cm-1
), carbon dioxide
(C=O stretching at 2356 cm-1
and C=O bending at 667 cm-1
), ε-caprolactam (C=O
stretching at 1711 cm-1
and C-N stretching at 1358 cm-1
), hydrocarbons (C-H
stretching at 2938 cm-1
and C-H bending at 1455 cm-1
), water (H-O-H bending at
1499 cm-1
).These decomposition products are in accordance with the literature
[29,30,66].
When ZB alone was added, it was seen in the spectrum of PA-ZB 20 at 45 min that
these is no contribution of ZB decomposition.
On the other hand, PA-ADP 20 spectrum at 42 min exhibited additional
characteristic bands of PO‾2 anion (1158 and 1085 cm
-1), P-O-P stretching (851 cm
-1)
and P=O stretching (1264 and 1237 cm-1
). These volatile products could be
interpreted as the confirmation of gas phase flame inhibition mechanism of ADP
[29,30,66].
Since the use of ZB and ADP together leads to no additional gas phase mechanism,
spectrum of PA-ADP 15-ZB 5 specimen exhibited no additional band.
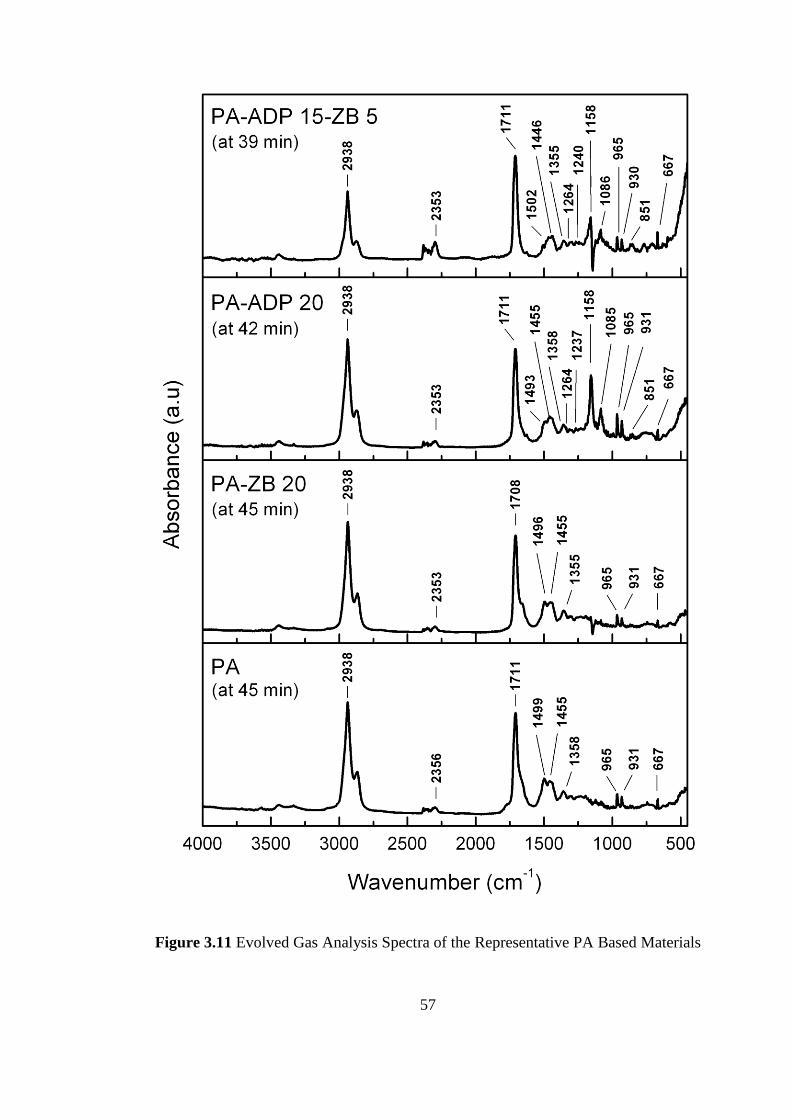
57
Figure 3.11 Evolved Gas Analysis Spectra of the Representative PA Based Materials
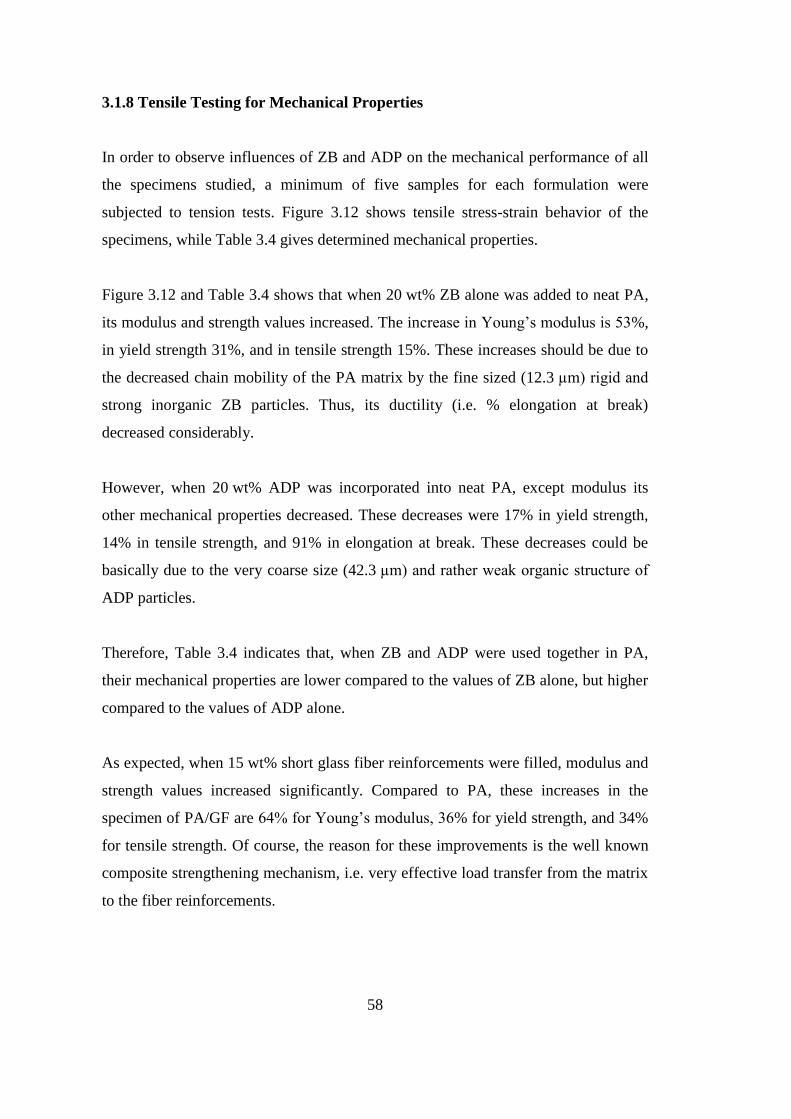
58
3.1.8 Tensile Testing for Mechanical Properties
In order to observe influences of ZB and ADP on the mechanical performance of all
the specimens studied, a minimum of five samples for each formulation were
subjected to tension tests. Figure 3.12 shows tensile stress-strain behavior of the
specimens, while Table 3.4 gives determined mechanical properties.
Figure 3.12 and Table 3.4 shows that when 20 wt% ZB alone was added to neat PA,
its modulus and strength values increased. The increase in Young’s modulus is 53%,
in yield strength 31%, and in tensile strength 15%. These increases should be due to
the decreased chain mobility of the PA matrix by the fine sized (12.3 µm) rigid and
strong inorganic ZB particles. Thus, its ductility (i.e. % elongation at break)
decreased considerably.
However, when 20 wt% ADP was incorporated into neat PA, except modulus its
other mechanical properties decreased. These decreases were 17% in yield strength,
14% in tensile strength, and 91% in elongation at break. These decreases could be
basically due to the very coarse size (42.3 µm) and rather weak organic structure of
ADP particles.
Therefore, Table 3.4 indicates that, when ZB and ADP were used together in PA,
their mechanical properties are lower compared to the values of ZB alone, but higher
compared to the values of ADP alone.
As expected, when 15 wt% short glass fiber reinforcements were filled, modulus and
strength values increased significantly. Compared to PA, these increases in the
specimen of PA/GF are 64% for Young’s modulus, 36% for yield strength, and 34%
for tensile strength. Of course, the reason for these improvements is the well known
composite strengthening mechanism, i.e. very effective load transfer from the matrix
to the fiber reinforcements.
59
In this PA/GF based group, Table 3.4 shows that, use of ZB and ADP, alone or
together, lead to no decrease in Young’s modulus values; but there are substantial
decreases in the strength and ductility values. These decreases should be due to the
lowered efficiency of load transfer mechanism.
Fracture surfaces of the tensile test specimens were also examined via SEM in order
to reveal morphology of the fracture surfaces and distribution of the flame retardants.
Figures 3.13 and 3.14 show that very smooth fracture surfaces of PA and PA/GF
specimens transformed into very rough morphology when ZB and ADP were
incorporated. It is also seen that flame retardants ZB and ADP, and the fiber
reinforcement GF were all distributed rather uniformly having certain level of
interfacial bonding with the PA matrix.
Table 3.4 Tensile Mechanical Properties of the Specimens
Specimens
Young’s
Modulus
(GPa)
Yield
Strength
(MPa)
Tensile
Strength
(MPa)
Elongation
at break
(%)
PA 1.96 ± 0.08 40.3 ± 3.4 54.2 ± 0.7 58.3 ± 3.5
PA-ZB 20 2.99 ± 0.06 52.9 ± 0.4 62.1 ± 1.6 18.0 ± 1.3
PA-ADP 20 2.43 ± 0.17 33.3 ± 3.9 46.6 ± 0.3 9.0 ± 0.4
PA-ADP 19-ZB 1 2.62 ± 0.06 39.6 ± 1.2 45.3 ± 0.4 12.8 ± 1.1
PA-ADP 17-ZB 3 2.49 ± 0.12 36.5 ± 3.5 44.3 ± 1.6 8.8 ± 0.6
PA-ADP 15-ZB 5 2.34 ± 0.18 30.3 ± 3.8 46.3 ± 1.2 6.6 ± 0.7
PA-ADP 13-ZB 7 2.52 ± 0.06 38.1 ± 1.2 46.6 ± 0.4 6.2 ± 1.1
PA/GF 3.22 ± 0.04 54.8 ± 2.9 72.5 ± 0.6 8.8 ± 0.4
PA/GF-ZB 20 3.89 ± 0.03 54.6 ± 1.8 61.3 ± 0.7 4.6 ± 0.4
PA/GF-ADP 20 3.46 ± 0.08 42.8 ± 3.4 57.7 ± 0.3 5.1 ± 0.1
PA/GF-ADP 19-ZB 1 3.89 ± 0.04 51.5 ± 0.2 56.0 ± 0.2 4.1 ± 0.2
PA/GF-ADP 17-ZB 3 3.93 ± 0.03 53.0 ± 1.3 59.0 ± 0.3 4.0 ± 0.2
PA/GF-ADP 15-ZB 5 3.89 ± 0.04 50.7 ± 0.5 55.0 ± 0.2 3.8 ± 0.1
PA/GF-ADP 13-ZB 7 3.63 ± 0.06 47.4 ± 0.8 50.1 ± 0.7 4.0 ± 0.2
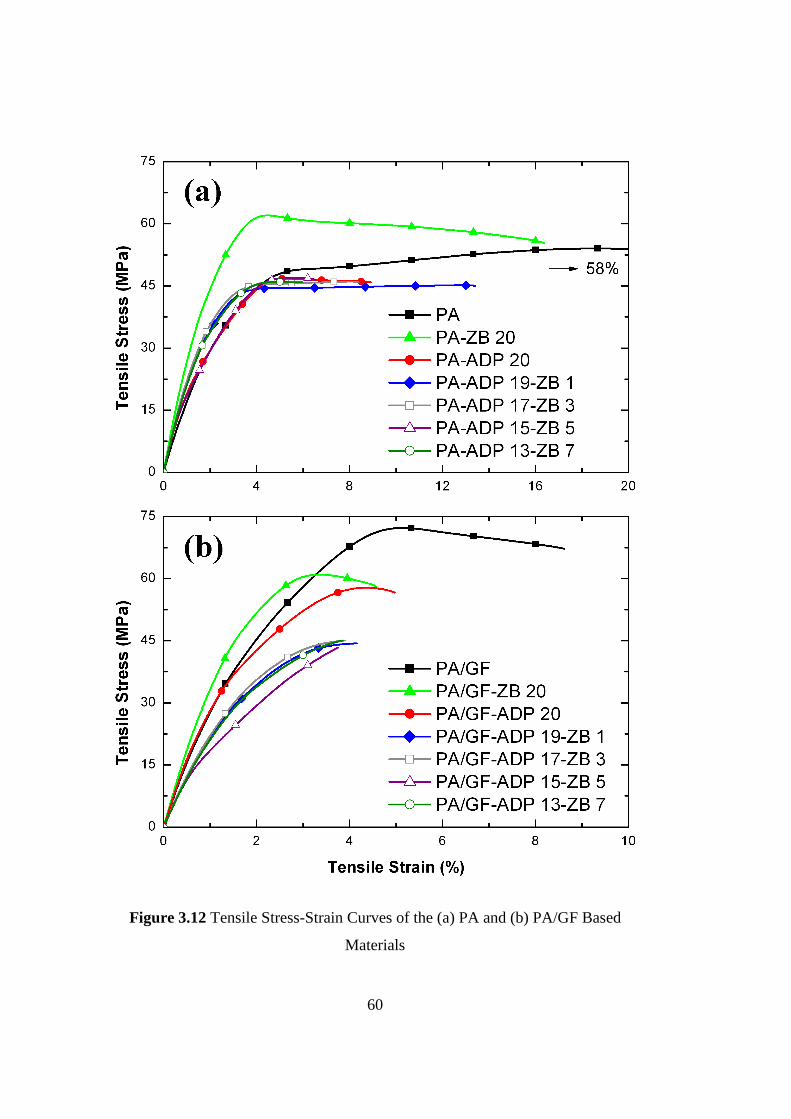
60
Figure 3.12 Tensile Stress-Strain Curves of the (a) PA and (b) PA/GF Based
Materials
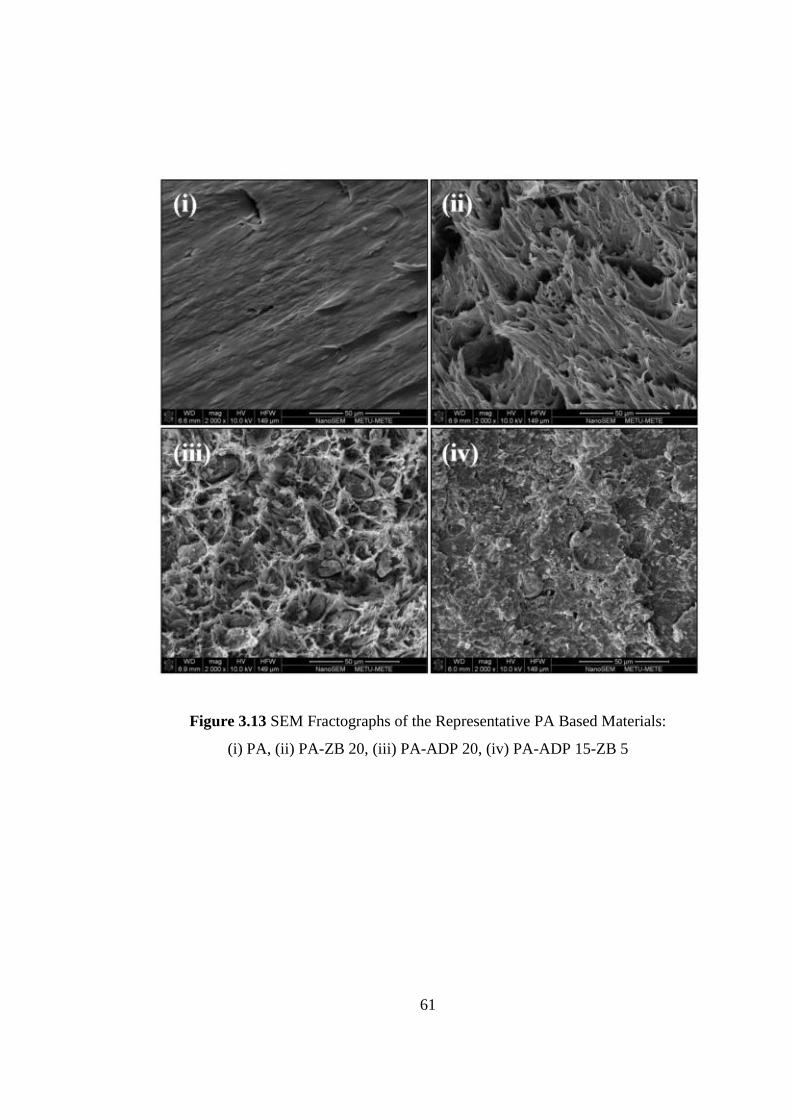
61
Figure 3.13 SEM Fractographs of the Representative PA Based Materials:
(i) PA, (ii) PA-ZB 20, (iii) PA-ADP 20, (iv) PA-ADP 15-ZB 5
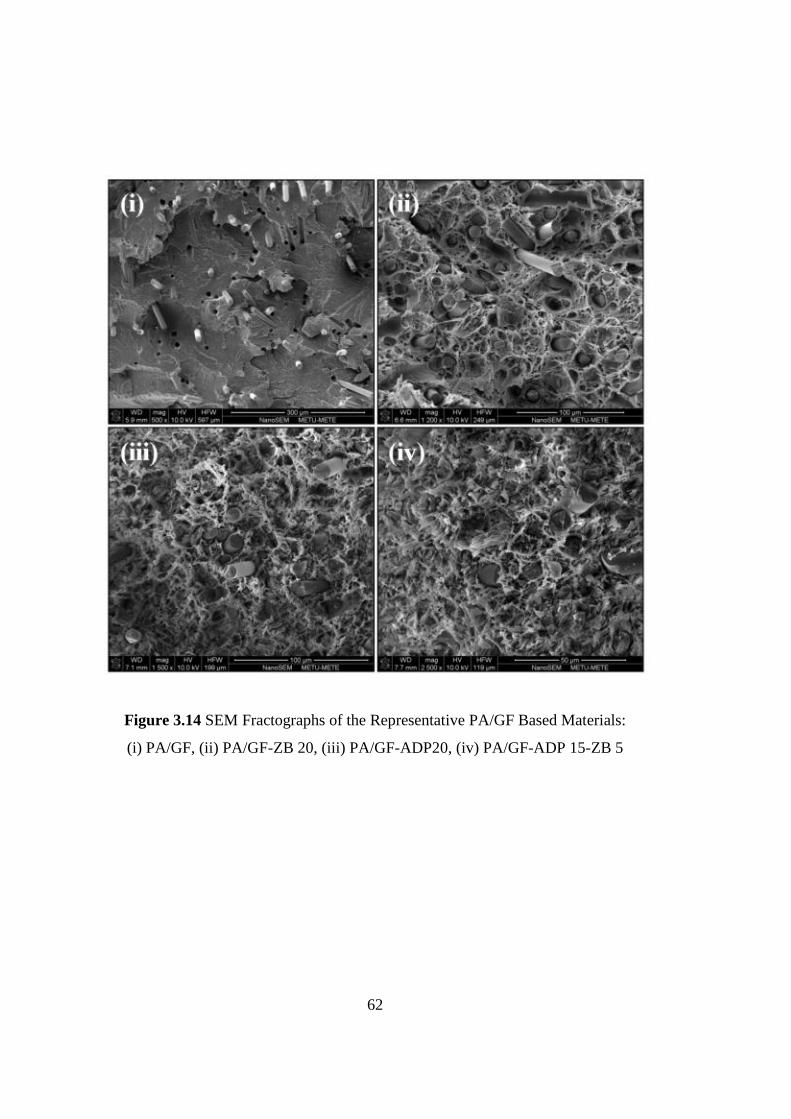
62
Figure 3.14 SEM Fractographs of the Representative PA/GF Based Materials:
(i) PA/GF, (ii) PA/GF-ZB 20, (iii) PA/GF-ADP20, (iv) PA/GF-ADP 15-ZB 5
63
3.2 EFFECTS OF BORON OXIDE AND BORIC ACID
To evaluate flame retardancy enhancement of BO and BA, the control sample
material was chosen as PA or PA/GF with 20 wt% ADP type organophosphorus
compound. Then, amount of ADP was replaced with certain amounts of BO or BA.
These replacements were 1, 3 and 5 wt% for the PA based group, while only 3 and
5 wt% for the PA/GF based group. In order to observe effects of BO or BA alone,
specimens having only 10 wt% BO or BA were also produced. Unfortunately, due to
the compounding problems in the laboratory size twin-screw extruder, production of
specimens with 20 wt% BO or BA were not possible. Designations and compositions
of the specimens produced for this second part of the thesis are given in Table 2.3
and the results are discussed below.
3.2.1 UL-94 and LOI Flammability Tests
Results of UL-94 and LOI flammability tests are tabulated in Table 3.5, while
appearances of the representative specimens after these two tests are given in
Figure 3.15 and 3.16, respectively. It is seen that both PA and PA/GF specimens
have V-2 rating from UL-94 tests, and LOI values of 26.1 and 23.3 O2%,
respectively.
Due to its very high efficiency, when 20 wt% ADP was incorporated alone, there
were significant improvements, e.g. both specimens (PA-ADP 20 and
PA/GF-ADP 20) obtained V-0, the best rating of UL-94, and increased LOI values of
32.7 and 30.7 O2%, respectively. These improvements were especially due to the
very effective “flame inhibition” action of ADP, and also its “charring” action as
shown in Figure 3.16(a)(iv) and (b)(iv).
When BO or BA was used alone or when certain amount of ADP was replaced with
BO or BA, Table 3.5 indicates that UL-94 ratings were kept, but there were no
further improvements in the LOI values.
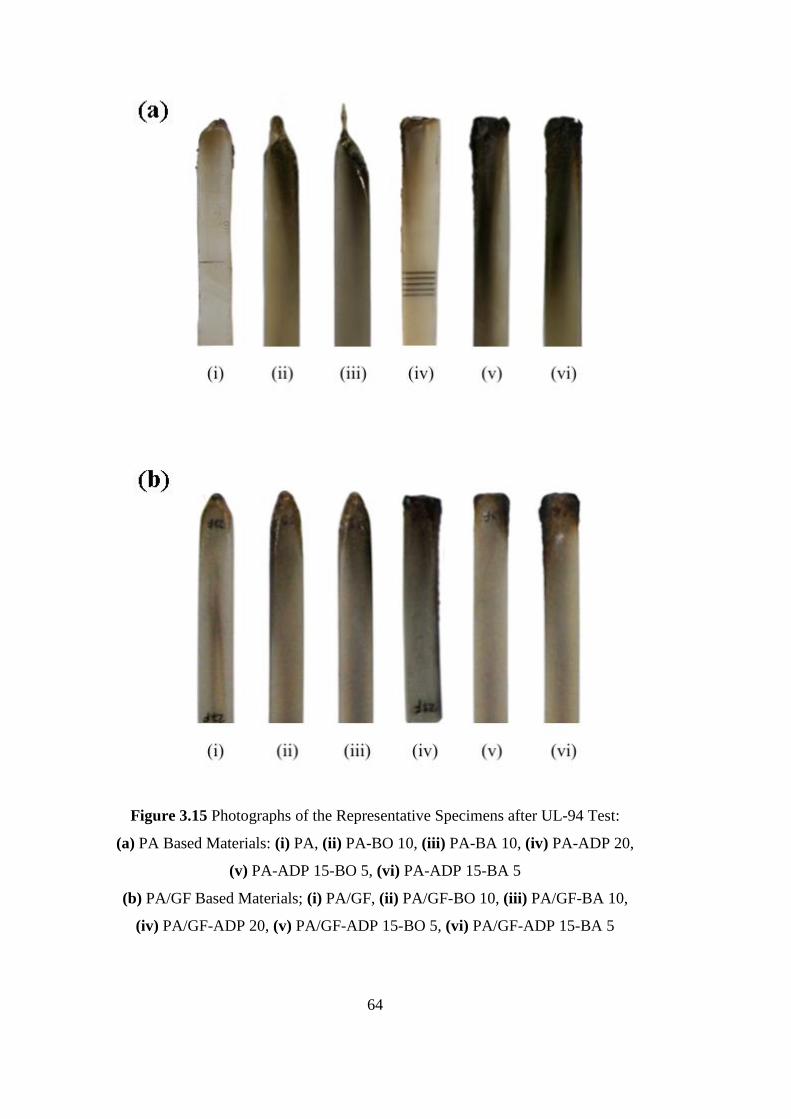
64
Figure 3.15 Photographs of the Representative Specimens after UL-94 Test:
(a) PA Based Materials: (i) PA, (ii) PA-BO 10, (iii) PA-BA 10, (iv) PA-ADP 20,
(v) PA-ADP 15-BO 5, (vi) PA-ADP 15-BA 5
(b) PA/GF Based Materials; (i) PA/GF, (ii) PA/GF-BO 10, (iii) PA/GF-BA 10,
(iv) PA/GF-ADP 20, (v) PA/GF-ADP 15-BO 5, (vi) PA/GF-ADP 15-BA 5
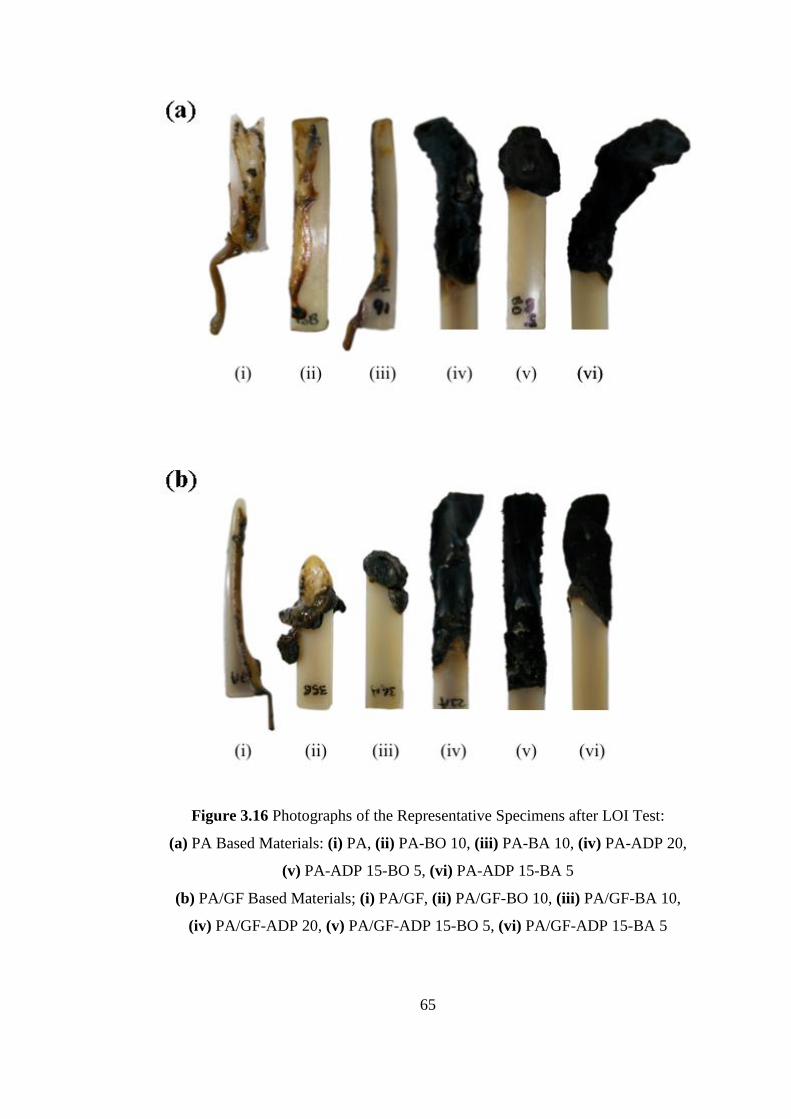
65
Figure 3.16 Photographs of the Representative Specimens after LOI Test:
(a) PA Based Materials: (i) PA, (ii) PA-BO 10, (iii) PA-BA 10, (iv) PA-ADP 20,
(v) PA-ADP 15-BO 5, (vi) PA-ADP 15-BA 5
(b) PA/GF Based Materials; (i) PA/GF, (ii) PA/GF-BO 10, (iii) PA/GF-BA 10,
(iv) PA/GF-ADP 20, (v) PA/GF-ADP 15-BO 5, (vi) PA/GF-ADP 15-BA 5
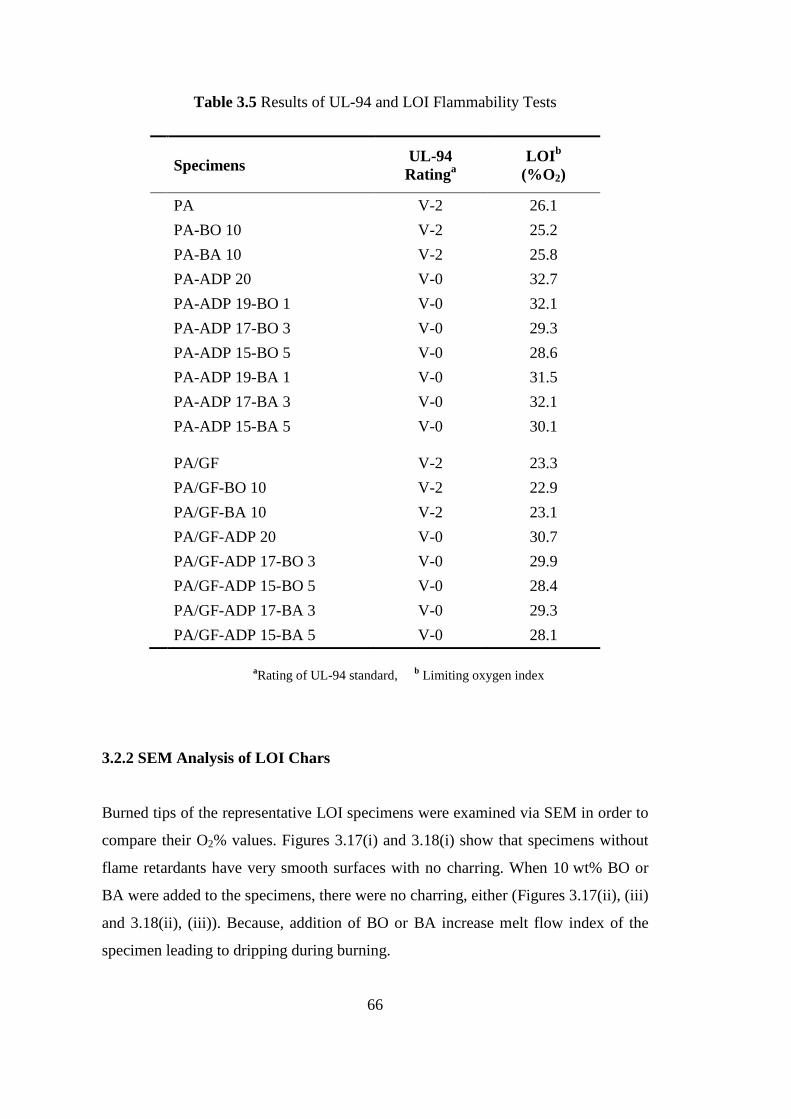
66
Table 3.5 Results of UL-94 and LOI Flammability Tests
Specimens UL-94
Ratinga
LOIb
(%O2)
PA V-2 26.1
PA-BO 10 V-2 25.2
PA-BA 10 V-2 25.8
PA-ADP 20 V-0 32.7
PA-ADP 19-BO 1 V-0 32.1
PA-ADP 17-BO 3 V-0 29.3
PA-ADP 15-BO 5 V-0 28.6
PA-ADP 19-BA 1 V-0 31.5
PA-ADP 17-BA 3 V-0 32.1
PA-ADP 15-BA 5 V-0 30.1
PA/GF V-2 23.3
PA/GF-BO 10 V-2 22.9
PA/GF-BA 10 V-2 23.1
PA/GF-ADP 20 V-0 30.7
PA/GF-ADP 17-BO 3 V-0 29.9
PA/GF-ADP 15-BO 5 V-0 28.4
PA/GF-ADP 17-BA 3 V-0 29.3
PA/GF-ADP 15-BA 5 V-0 28.1
aRating of UL-94 standard,
b Limiting oxygen index
3.2.2 SEM Analysis of LOI Chars
Burned tips of the representative LOI specimens were examined via SEM in order to
compare their O2% values. Figures 3.17(i) and 3.18(i) show that specimens without
flame retardants have very smooth surfaces with no charring. When 10 wt% BO or
BA were added to the specimens, there were no charring, either (Figures 3.17(ii), (iii)
and 3.18(ii), (iii)). Because, addition of BO or BA increase melt flow index of the
specimen leading to dripping during burning.
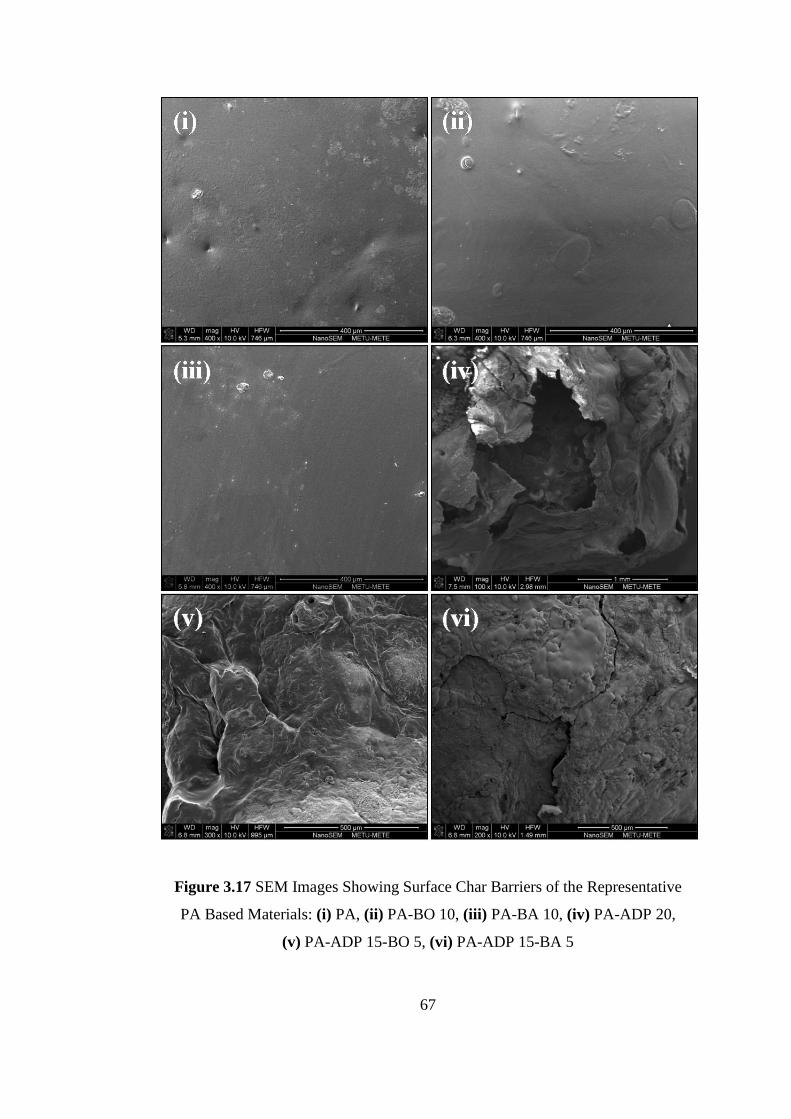
67
Figure 3.17 SEM Images Showing Surface Char Barriers of the Representative
PA Based Materials: (i) PA, (ii) PA-BO 10, (iii) PA-BA 10, (iv) PA-ADP 20,
(v) PA-ADP 15-BO 5, (vi) PA-ADP 15-BA 5
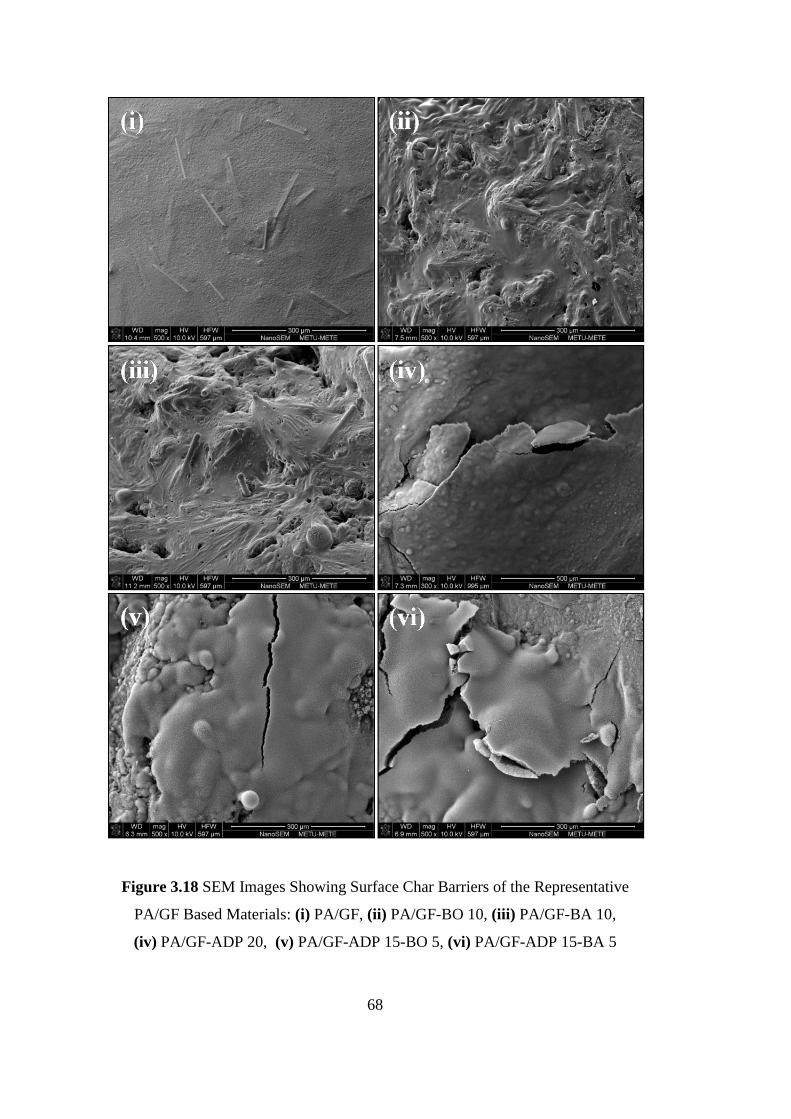
68
Figure 3.18 SEM Images Showing Surface Char Barriers of the Representative
PA/GF Based Materials: (i) PA/GF, (ii) PA/GF-BO 10, (iii) PA/GF-BA 10,
(iv) PA/GF-ADP 20, (v) PA/GF-ADP 15-BO 5, (vi) PA/GF-ADP 15-BA 5
69
Figures 3.17(iv) and 3.18(iv) show that the use of 20 wt% ADP leads to formation of
certain level of char layers on the surface of the specimens increasing their LOI
values significantly. When certain amount of ADP was replaced with BO or BA
(Figures 3.17(v), (vi) and 3.18(v), (vi)), there were slight contributions to the char
formation; however, this was not sufficient to further increase LOI values.
3.2.3 Mass Loss Cone Calorimetry Analysis
Mass loss cone calorimetry (MLC) was conducted to measure fire performances of
all specimens. After the test, first, visual examination of the remaining char
structures were done as given in Figures 3.19 and 3.20. These figures simply show
that the char yield increases after incorporation of ADP, BO and BA. Then, the most
significant plots, i.e. heat release rate (HRR) and mass loss rate (MLR) curves were
plotted (Figures 3.21 and 3.22). Finally, all the important fire performance
parameters were determined and tabulated in Table 3.6.
Figures 3.21 and 3.22 indicated that HRR and MLR curves of both PA and PA/GF
were suppressed after adding 10 wt% BO or BA alone, or 20 wt% ADP alone.
Figure 3.21 also shows that when certain amount of ADP was replaced by BO or BA,
i.e. when ADP and BO or BA were used together, the suppressions were much more
significant in the PA based materials; but, as shown in Figure 3.22, this was not the
case for the PA/GF based materials.
For instance, Table 3.6 shows that, when 10 wt% BO alone were added, the
suppression in the “peak heat release rate” (PHRR) values of PA and PA/GF were
30% and 42%, respectively, when 10 wt% BA alone were added suppressions were
22% and 50%, respectively. PHRR suppressions in each group were 32% and 75%,
respectively, when 20 wt% ADP alone was added. On the other hand, when certain
amount of ADP was replaced with BO or BA in the PA based materials, there were
more significant suppressions, e.g. when 17 wt% ADP and 3 wt% BO were used
70
together, the suppression in PHRR values could be as much as 84%, while this
suppression was as much as 86% when 17 wt% ADP and 3 wt% BA were used
together. Note that, the trend in the suppression of the total heat evolved (THE)
values were almost the same, for the PA based materials. Unfortunately, for the
PA/GF based materials, due to the high efficiency of glass fibers, replacement of
ADP with BO or BA resulted in no further suppressions in PHRR and THE values.
In terms of time related MLC parameters, Table 3.6 indicates that in each group use
of BO, BA or ADP alone or together resulted in no significant delays in “time to
ignition” (TTI) periods, or “time to peak heat release rate” (TPHRR) periods.
However, there were significant time extensions in the values of “total burning time”
(TBT). Table 3.6 shows that, when BO and ADP or BA and ADP were used
together, TBT periods of PA and PA/GF could be extended more than two times.
In order to have additional data about the contribution of material to the fire
propagation rate, two different indices can be calculated from the MLC parameters.
The first index is called “fire growth index” (FGI) which is the ratio of PHRR/TTI,
the second one is named as “fire growth rate index” (FIGRA) which is the ratio of
PHRR/TPHRR. Use of any flame retardant decreases these indices, i.e. decreases fire
propagation rate. Table 3.6 shows that use of BO and ADP or BA and ADP together
decreased values of these two indices considerably especially for the PA based
materials.
The ratio of THE/TML (total heat evolved/total mass loss) and % char yield data
might give information about the flame retardancy mechanism of the specimens.
Table 3.6 reveals that the value of THE/TML ratio decreased when ADP was
incorporated. This means, ADP might basically act in the gaseous phase
mechanisms. On the other hand, Table 3.6 shows that again especially in the
PA based materials, use of BO or BA increases % char residue considerably,
indicating the effectiveness of condensed phase physical char formation.
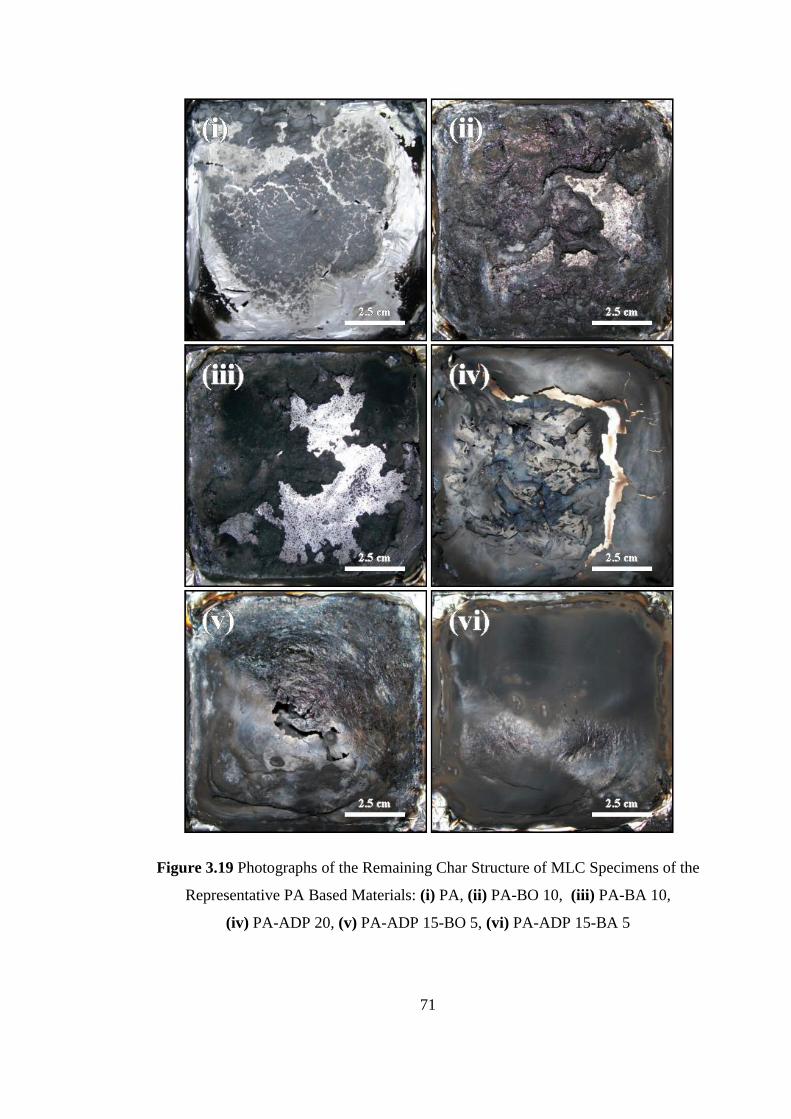
71
Figure 3.19 Photographs of the Remaining Char Structure of MLC Specimens of the
Representative PA Based Materials: (i) PA, (ii) PA-BO 10, (iii) PA-BA 10,
(iv) PA-ADP 20, (v) PA-ADP 15-BO 5, (vi) PA-ADP 15-BA 5
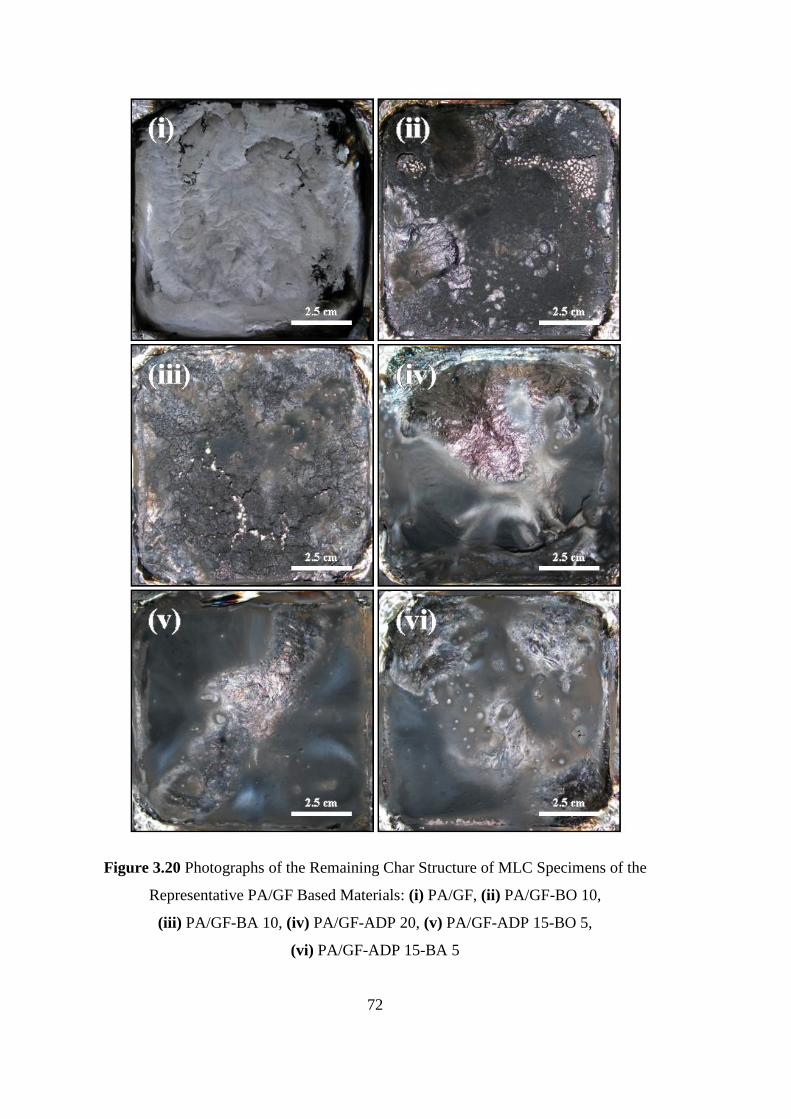
72
Figure 3.20 Photographs of the Remaining Char Structure of MLC Specimens of the
Representative PA/GF Based Materials: (i) PA/GF, (ii) PA/GF-BO 10,
(iii) PA/GF-BA 10, (iv) PA/GF-ADP 20, (v) PA/GF-ADP 15-BO 5,
(vi) PA/GF-ADP 15-BA 5
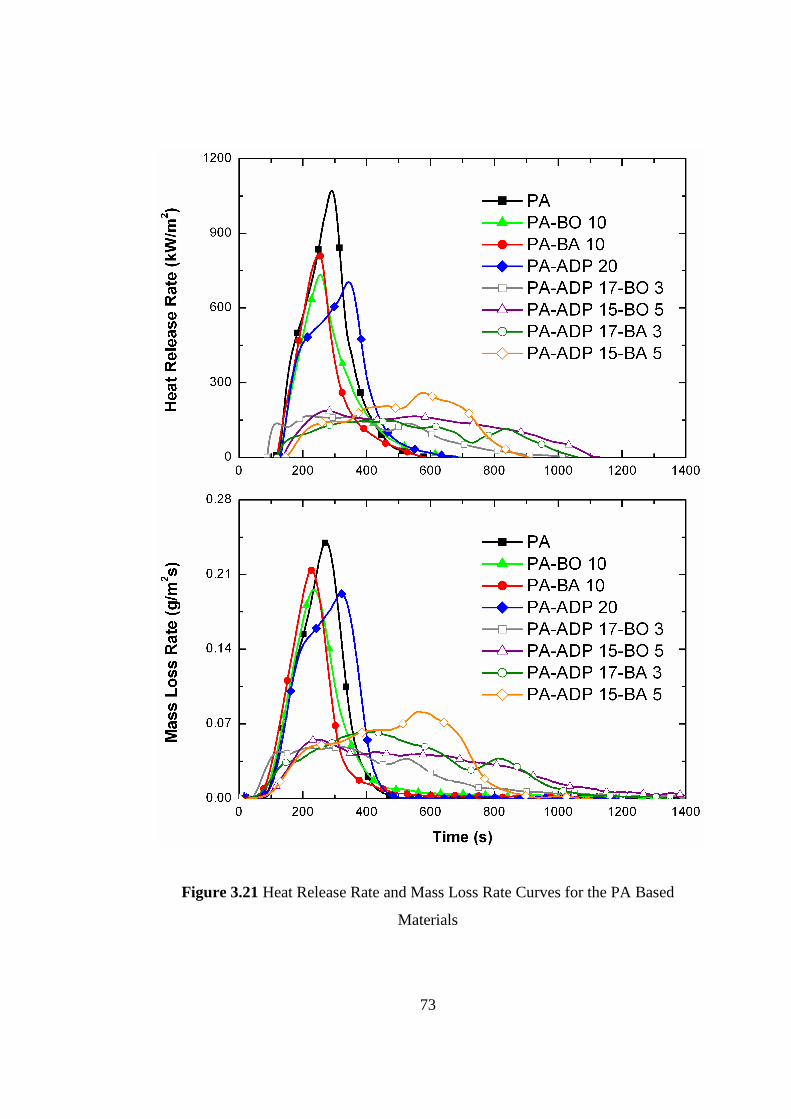
73
Figure 3.21 Heat Release Rate and Mass Loss Rate Curves for the PA Based
Materials
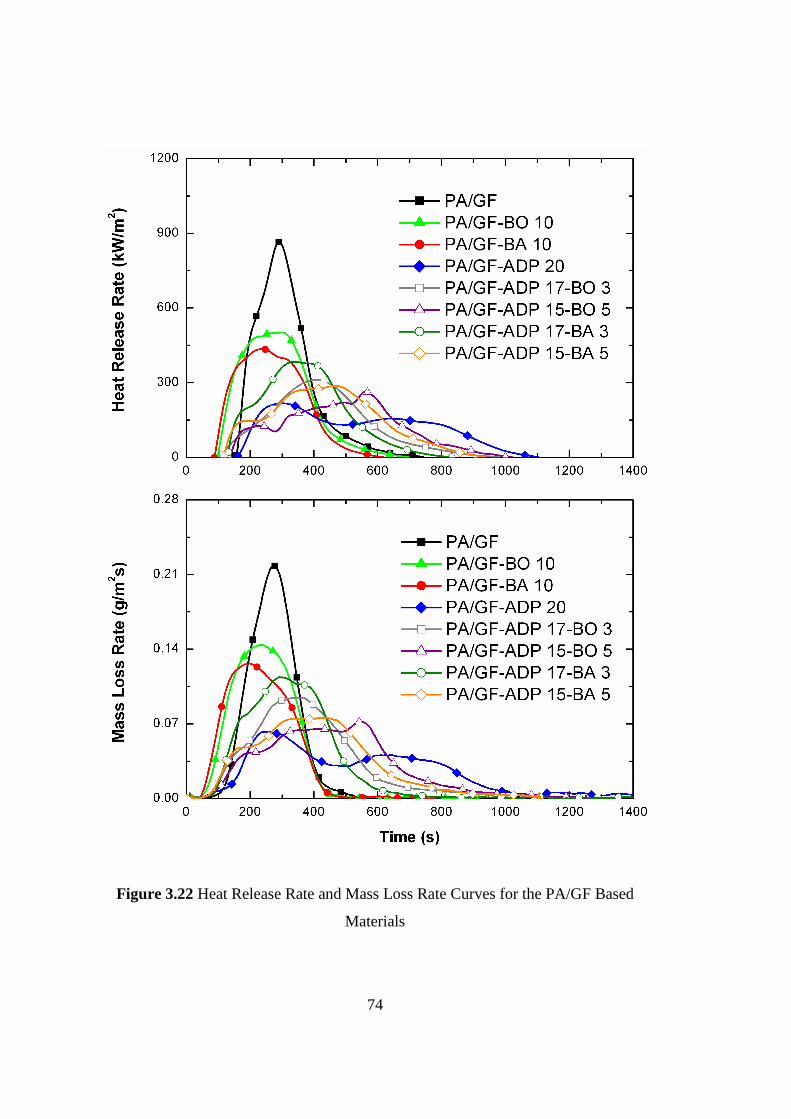
74
Figure 3.22 Heat Release Rate and Mass Loss Rate Curves for the PA/GF Based
Materials
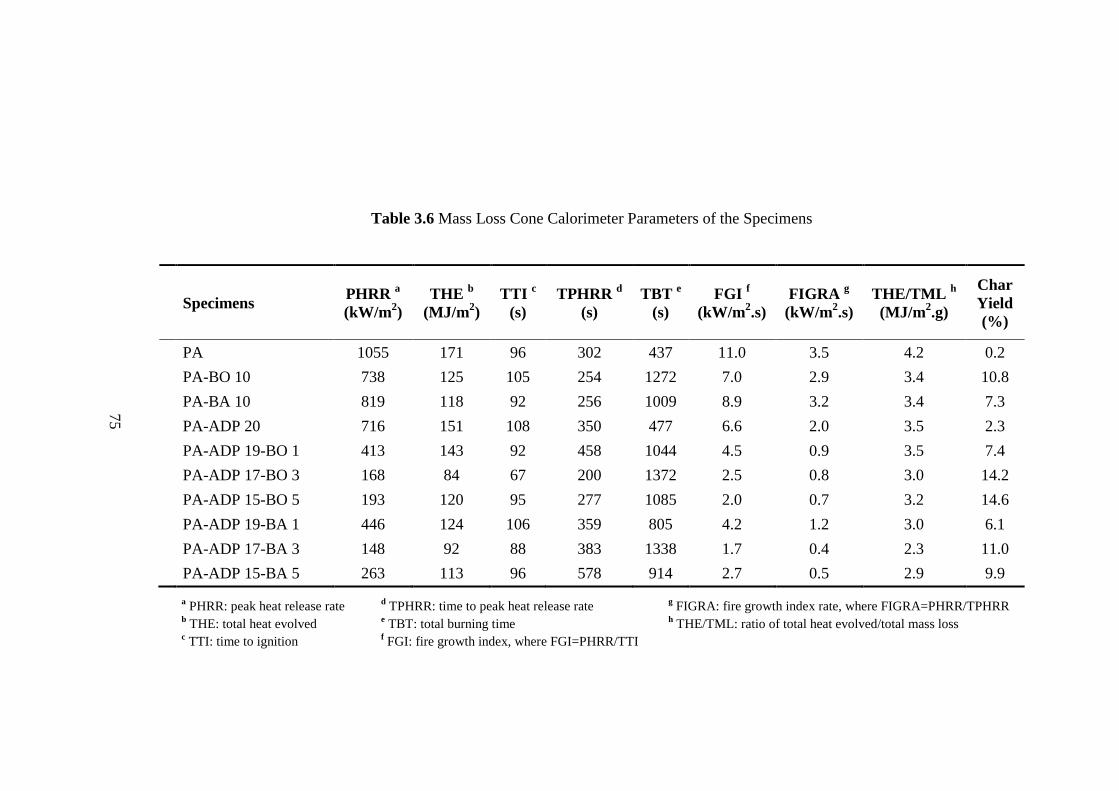
75
Table 3.6 Mass Loss Cone Calorimeter Parameters of the Specimens
Specimens PHRR
a
(kW/m2)
THE b
(MJ/m2)
TTI c
(s)
TPHRR d
(s)
TBT e
(s)
FGI f
(kW/m2.s)
FIGRA g
(kW/m2.s)
THE/TML h
(MJ/m2.g)
Char
Yield
(%)
PA 1055 171 96 302 437 11.0 3.5 4.2 0.2
PA-BO 10 738 125 105 254 1272 7.0 2.9 3.4 10.8
PA-BA 10 819 118 92 256 1009 8.9 3.2 3.4 7.3
PA-ADP 20 716 151 108 350 477 6.6 2.0 3.5 2.3
PA-ADP 19-BO 1 413 143 92 458 1044 4.5 0.9 3.5 7.4
PA-ADP 17-BO 3 168 84 67 200 1372 2.5 0.8 3.0 14.2
PA-ADP 15-BO 5 193 120 95 277 1085 2.0 0.7 3.2 14.6
PA-ADP 19-BA 1 446 124 106 359 805 4.2 1.2 3.0 6.1
PA-ADP 17-BA 3 148 92 88 383 1338 1.7 0.4 2.3 11.0
PA-ADP 15-BA 5 263 113 96 578 914 2.7 0.5 2.9 9.9
a PHRR: peak heat release rate
d TPHRR: time to peak heat release rate
g FIGRA: fire growth index rate, where FIGRA=PHRR/TPHRR
b THE: total heat evolved
e TBT: total burning time
h THE/TML: ratio of total heat evolved/total mass loss
c TTI: time to ignition
f FGI: fire growth index, where FGI=PHRR/TTI
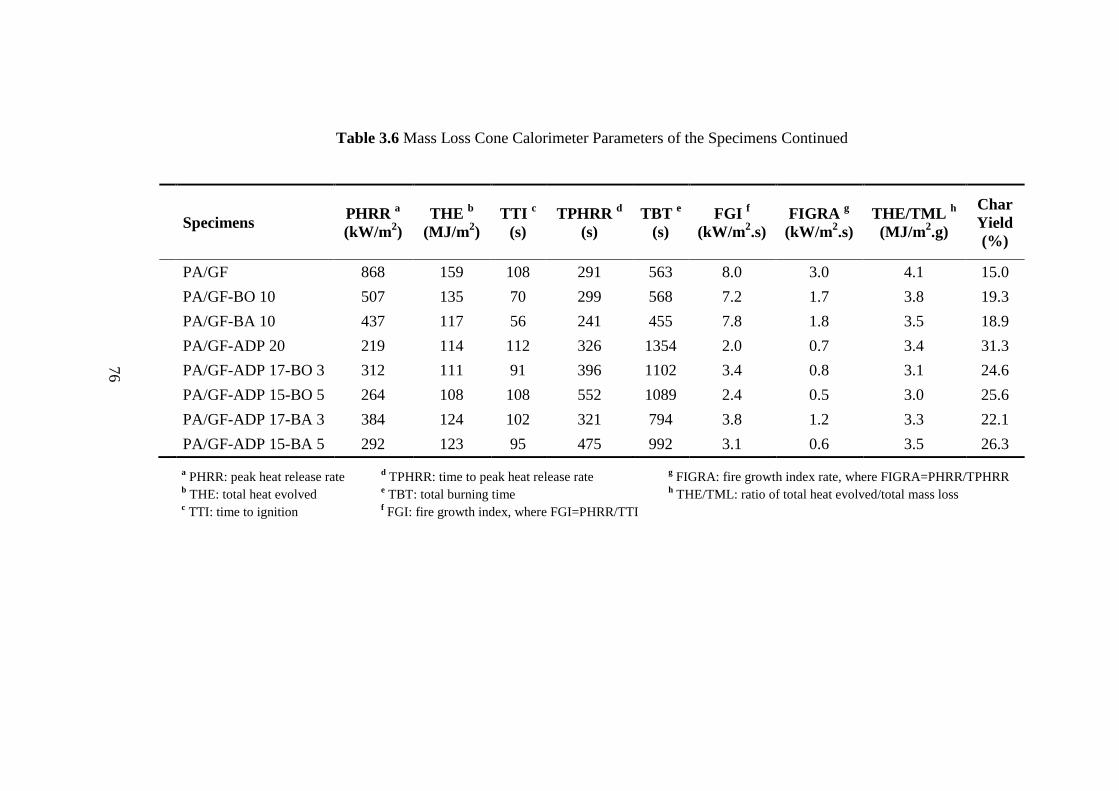
76
Table 3.6 Mass Loss Cone Calorimeter Parameters of the Specimens Continued
Specimens PHRR
a
(kW/m2)
THE b
(MJ/m2)
TTI c
(s)
TPHRR d
(s)
TBT e
(s)
FGI f
(kW/m2.s)
FIGRA g
(kW/m2.s)
THE/TML h
(MJ/m2.g)
Char
Yield
(%)
PA/GF 868 159 108 291 563 8.0 3.0 4.1 15.0
PA/GF-BO 10 507 135 70 299 568 7.2 1.7 3.8 19.3
PA/GF-BA 10 437 117 56 241 455 7.8 1.8 3.5 18.9
PA/GF-ADP 20 219 114 112 326 1354 2.0 0.7 3.4 31.3
PA/GF-ADP 17-BO 3 312 111 91 396 1102 3.4 0.8 3.1 24.6
PA/GF-ADP 15-BO 5 264 108 108 552 1089 2.4 0.5 3.0 25.6
PA/GF-ADP 17-BA 3 384 124 102 321 794 3.8 1.2 3.3 22.1
PA/GF-ADP 15-BA 5 292 123 95 475 992 3.1 0.6 3.5 26.3
a PHRR: peak heat release rate
d TPHRR: time to peak heat release rate
g FIGRA: fire growth index rate, where FIGRA=PHRR/TPHRR
b THE: total heat evolved
e TBT: total burning time
h THE/TML: ratio of total heat evolved/total mass loss
c TTI: time to ignition
f FGI: fire growth index, where FGI=PHRR/TTI
77
3.2.4 Flame Retardancy Mechanisms
As discussed in Section 3.1.4 before, flame retardancy mechanism of ADP may be
in the “condensed” and “gaseous” phase. When ADP was vaporized during fire,
it might get oxidized to HPO2, PO, PO2, and HPO radicals which would
scavenge very harmful H and OH hot radicals. This gaseous phase action is called
“flame inhibition”. When ADP was oxidized to phosphoric acid during fire, it might
lead to formation of two-layer protective barrier; a carbon based char and
an inorganic residue layer of aluminum phosphate. This condensed phase action is
called as the “barrier effect”.
Due to the extremely limited number of literature in any polymeric matrix material,
flame retardancy mechanism of BO and BA are not well-established. As discussed
by Ibibikcan and Kaynak [40], the main mechanism of BO is “condensed” phase
barrier formation, while for BA, barrier mechanism could be both in the “condensed”
and “gaseous” phase.
During fire, BO softens around 350C and flows above 450C forming a protective
vitreous glassy layer thereby insulating the underlying material from heat and
oxygen.
On the other hand, BA releases water at around 150C and produces metaboric acid
according to the Reaction 3.1, and then another water release takes place at around
265C, this time with the formation of BO (Reaction 3.2);
2 H3BO3 2 HBO2 + 2 H2O (3.1)
2 HBO2 B2O3 + H2O (3.2)
Thus, these two-steps endothermic dehydration reactions of BA will absorb the heat
of combustion, and the released water vapor will dilute the oxygen and the gaseous
flammable compounds during fire. This mechanism could be considered as the
78
“gas phase barrier” action. Of course, BO formed after Reaction 3.2 would contribute
as the “condensed phase barrier” action.
When ADP was used together with BO and BA, all these mechanisms discussed
above would cooperate. Moreover, there could be an additional physical char layer
contribution when BA and ADP were used together. Because, according to the
Reaction 3.3;
H3BO3 + H3PO4 BPO4 + 3 H2O (3.3)
BA could react with phosphoric acid (a combustion byproduct of ADP) to form
boron phosphate, i.e. an additional inorganic barrier layer.
Of course, another contribution to the condensed phase barrier mechanism would
take place by the short glass fibers used in the PA/GF based specimens which would
increase the effectiveness of char barriers via reinforcing or stabilizing their
structure. In this PA/GF group, since effectiveness of fiber reinforcement were very
high, additional contribution of BO and BA were not observed.
In order to clarify these flame retardancy mechanisms further, three additional
analyses (thermogravimetric analysis, X-ray diffraction and evolved gas analysis)
were conducted and discussed in the following sections.
3.2.5 Thermogravimetric Analysis
Since results of each group were very similar, thermogravimetric (TG) and
differential thermogravimetric (DTG) curves are given in Figure 3.23 only for the
representative PA based materials, while the thermal degradation parameters derived
from these curves are tabulated in Table 3.7 for neat BO, BA, ADP and the
representative specimens of both PA and PA/GF based materials.
79
These curves showed that neat PA decomposes in one step with maximum mass loss
rate at around 460C leaving very little residue. On the contrary, due to the 15 wt%
glass fiber reinforcements, PA/GF specimen formed considerable amount of residue.
It is known that during decomposition, polyamide-6 releases water, ammonia, carbon
monoxide, carbon dioxide, and certain hydrocarbon fragments.
Figure 3.23 shows that when BO, BA and ADP were added, TG and DTG curves
shift slightly to lower temperatures. Therefore, Table 3.7 reveals that, not only
maximum mass loss rate temperatures (TDTG-peak) , but also 10 wt% and 50 wt%
degradation temperatures (T10 wt% and T50 wt%) of the PA and PA/GF specimens were
lowered.
On the other hand, Table 3.7 also indicates that addition of BO or BA increases
amount of residue significantly, for instance, use of 10 wt% BO leads to more than
12 wt% residue, while use of 10 wt% BA lead to more than 8 wt% residue. It is seen
than use of ADP also resulted in residue formation considerably. Thus, TG analysis
supported the physical barrier formation mechanisms of BO, BA and ADP discussed
in the previous section.
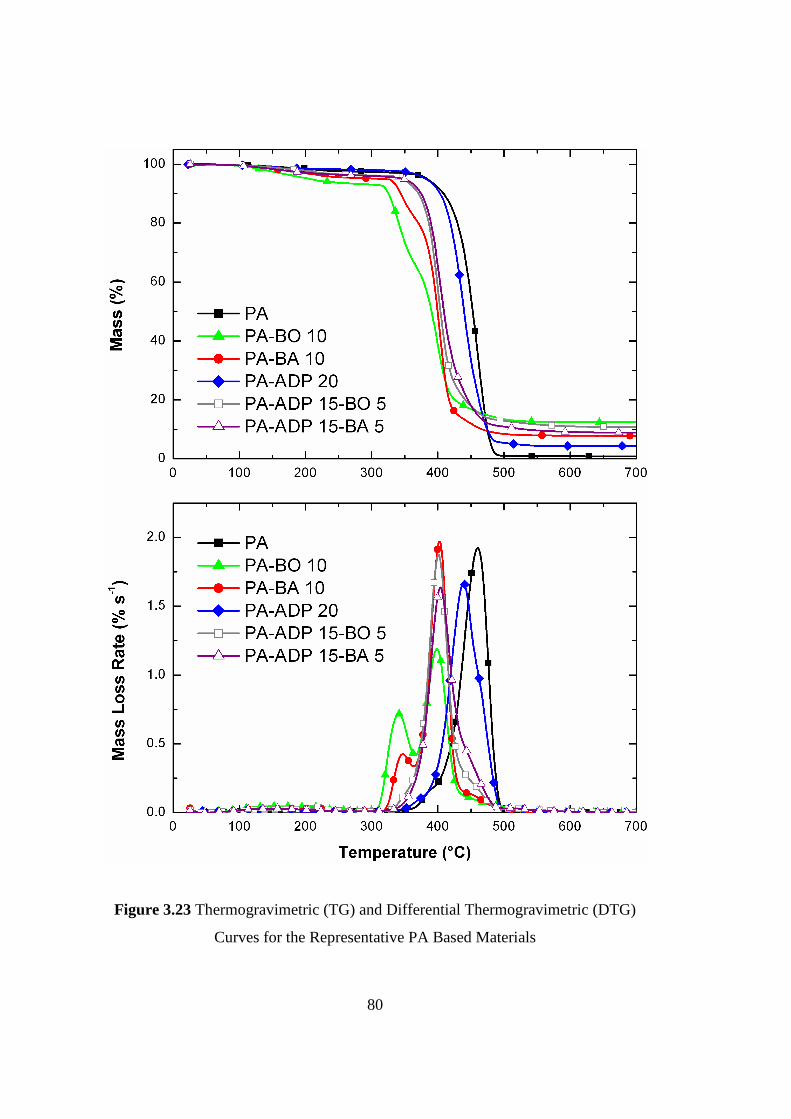
80
Figure 3.23 Thermogravimetric (TG) and Differential Thermogravimetric (DTG)
Curves for the Representative PA Based Materials
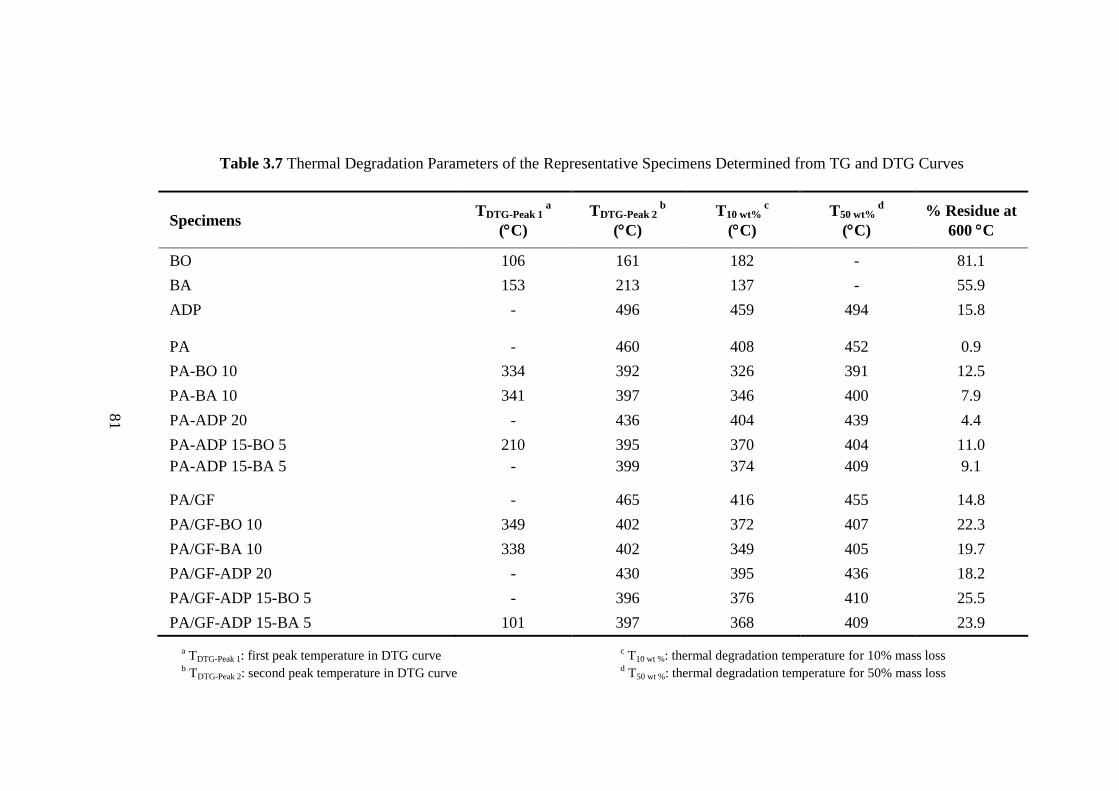
81
Table 3.7 Thermal Degradation Parameters of the Representative Specimens Determined from TG and DTG Curves
Specimens TDTG-Peak 1
a
(C)
TDTG-Peak 2 b
(C)
T10 wt% c
(C)
T50 wt% d
(C)
% Residue at
600 C
BO 106 161 182 - 81.1
BA 153 213 137 - 55.9
ADP - 496 459 494 15.8
PA - 460 408 452 0.9
PA-BO 10 334 392 326 391 12.5
PA-BA 10 341 397 346 400 7.9
PA-ADP 20 - 436 404 439 4.4
PA-ADP 15-BO 5 210 395 370 404 11.0
PA-ADP 15-BA 5 - 399 374 409 9.1
PA/GF - 465 416 455 14.8
PA/GF-BO 10 349 402 372 407 22.3
PA/GF-BA 10 338 402 349 405 19.7
PA/GF-ADP 20 - 430 395 436 18.2
PA/GF-ADP 15-BO 5 - 396 376 410 25.5
PA/GF-ADP 15-BA 5 101 397 368 409 23.9
a TDTG-Peak 1: first peak temperature in DTG curve
c T10 wt %: thermal degradation temperature for 10% mass loss
b TDTG-Peak 2: second peak temperature in DTG curve
d T50 wt %: thermal degradation temperature for 50% mass loss
82
3.2.6 XRD Analysis of MLC Residues
In order to reveal crystal structure of the phases in the char layers, XRD analyses
were conducted on the MLC chars of representative specimens of each group. Since
results of each group were very similar, XRD diffractograms are provided in
Figure 3.24 only for the PA based materials.
Figure 3.24 shows that when BO or BA was added alone, their only decomposition
product boron oxide (B2O3) peaks were seen. When ADP was used alone, peaks of
its main decomposition phase, i.e. peaks of aluminum phosphate (AlPO4) were seen.
When BO and ADP were added together, no additional peaks were observed. But,
when BA and ADP were used together, apart from their decomposition phases,
additional peaks for boron phosphate (BPO4) could be observed.
Thus, it can be stated that, apart from the expected decomposition byproducts,
no other phases were formed in the chars of the MLC specimens. This could be
interpreted as another confirmation of the physical barrier mechanism of especially
BO and BA, and also partly for ADP.
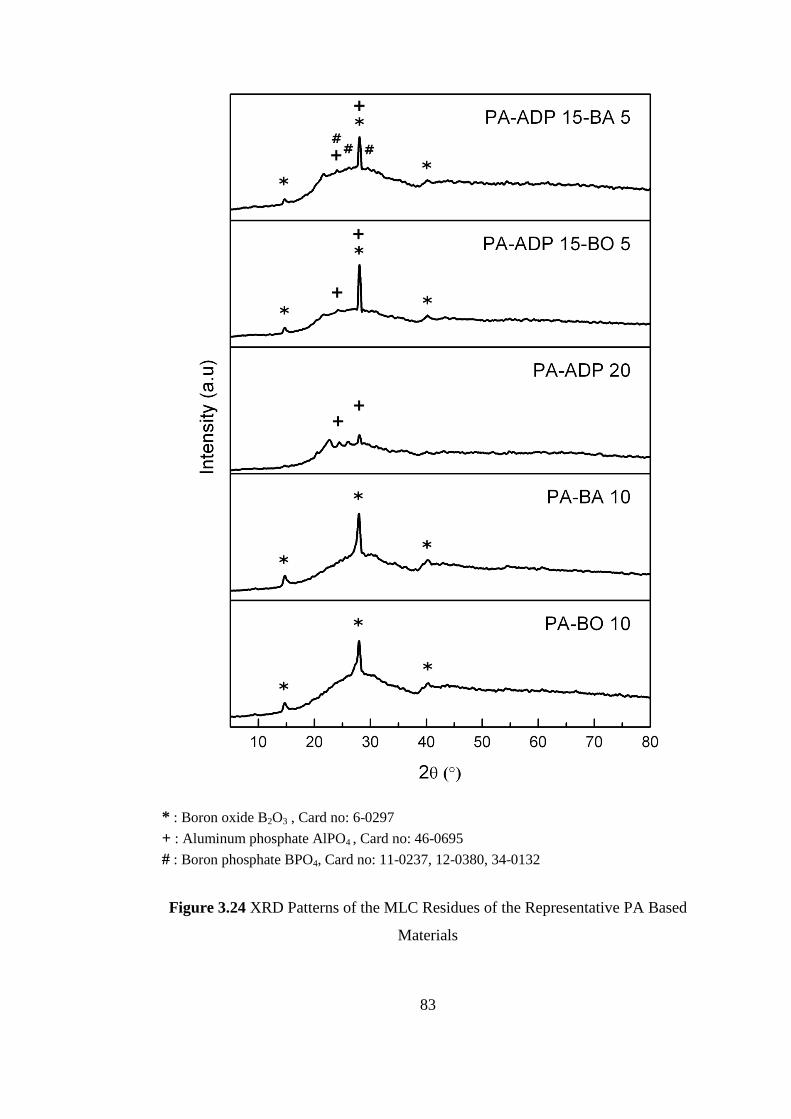
83
* : Boron oxide B2O3 , Card no: 6-0297
+ : Aluminum phosphate AlPO4 , Card no: 46-0695
# : Boron phosphate BPO4, Card no: 11-0237, 12-0380, 34-0132
Figure 3.24 XRD Patterns of the MLC Residues of the Representative PA Based
Materials
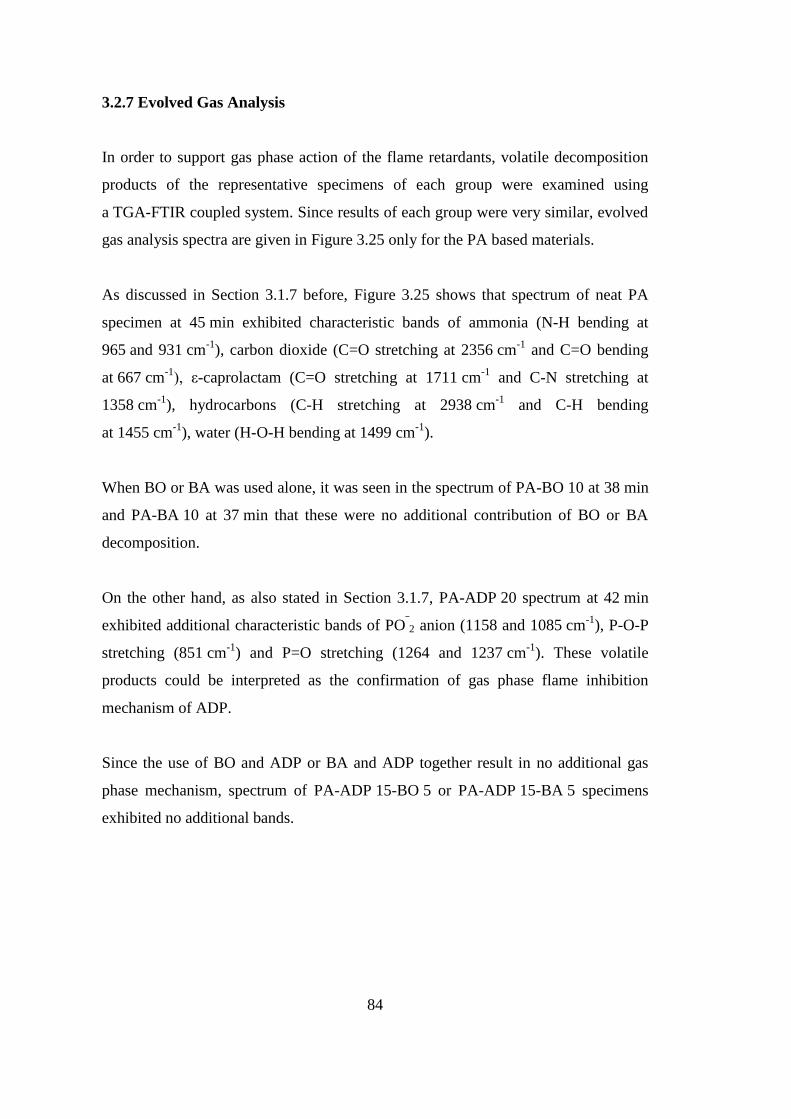
84
3.2.7 Evolved Gas Analysis
In order to support gas phase action of the flame retardants, volatile decomposition
products of the representative specimens of each group were examined using
a TGA-FTIR coupled system. Since results of each group were very similar, evolved
gas analysis spectra are given in Figure 3.25 only for the PA based materials.
As discussed in Section 3.1.7 before, Figure 3.25 shows that spectrum of neat PA
specimen at 45 min exhibited characteristic bands of ammonia (N-H bending at
965 and 931 cm-1
), carbon dioxide (C=O stretching at 2356 cm-1
and C=O bending
at 667 cm-1
), ε-caprolactam (C=O stretching at 1711 cm-1
and C-N stretching at
1358 cm-1
), hydrocarbons (C-H stretching at 2938 cm-1
and C-H bending
at 1455 cm-1
), water (H-O-H bending at 1499 cm-1
).
When BO or BA was used alone, it was seen in the spectrum of PA-BO 10 at 38 min
and PA-BA 10 at 37 min that these were no additional contribution of BO or BA
decomposition.
On the other hand, as also stated in Section 3.1.7, PA-ADP 20 spectrum at 42 min
exhibited additional characteristic bands of PO‾2 anion (1158 and 1085 cm
-1), P-O-P
stretching (851 cm-1
) and P=O stretching (1264 and 1237 cm-1
). These volatile
products could be interpreted as the confirmation of gas phase flame inhibition
mechanism of ADP.
Since the use of BO and ADP or BA and ADP together result in no additional gas
phase mechanism, spectrum of PA-ADP 15-BO 5 or PA-ADP 15-BA 5 specimens
exhibited no additional bands.
85
Figure 3.25 Evolved Gas Analysis Spectra of the Representative PA Based Materials
86
3.2.8 Tensile Testing for Mechanical Properties
In order to observe influences of BO, BA and ADP on the mechanical performance
of all the studied specimens, a minimum of five samples for each formulation were
subjected to tension tests. Figure 3.26 shows tensile stress-strain behavior of the
specimens, while Table 3.8 gives determined mechanical properties.
Figure 3.26 and Table 3.8 shows that use of each of BO, BA, and ADP alone, or
in combinations of ADP-BO or ADP-BA, all increases elastic modulus of both base
materials PA and PA/GF significantly. For example use of 10 wt% BO increases
modulus of PA by 57%; use of 15 wt% ADP with 5 wt% BA increases modulus of
PA/GF by 37%. These increases should be due to the decreased chain mobility of the
PA matrix by rigid inorganic structures of BO and BA and organometallic structure
of ADP particles. Consequently, decreased chain mobility also resulted in significant
reduction in the ductility levels, i.e. % elongation at break values of the matrix.
As discussed in Section 3.1.8 before, when 15 wt% short glass fiber reinforcements
were filled, not only elastic modulus but also strength values increased significantly.
Compared to PA, these increases in the specimen of PA/GF were 64% for Young’s
modulus and 34% for tensile strength. Of course, the reason for these improvements
is the well known composite strengthening mechanism, i.e. very effective load
transfer from the matrix to the silane sized fiber reinforcements.
Table 3.8 shows that, use of BO, BA and ADP, alone or together, all resulted in
substantial decreases in the tensile strength values. These decreases should be
especially due to the lowered efficiency of load transfer mechanism from the matrix
to non-surface treated particles of BO, BA, or ADP, having very low aspect ratio
either.
Fracture surfaces of the tensile test specimens were also examined via SEM in order
to reveal morphology of the fracture surfaces and distribution of the flame retardants.
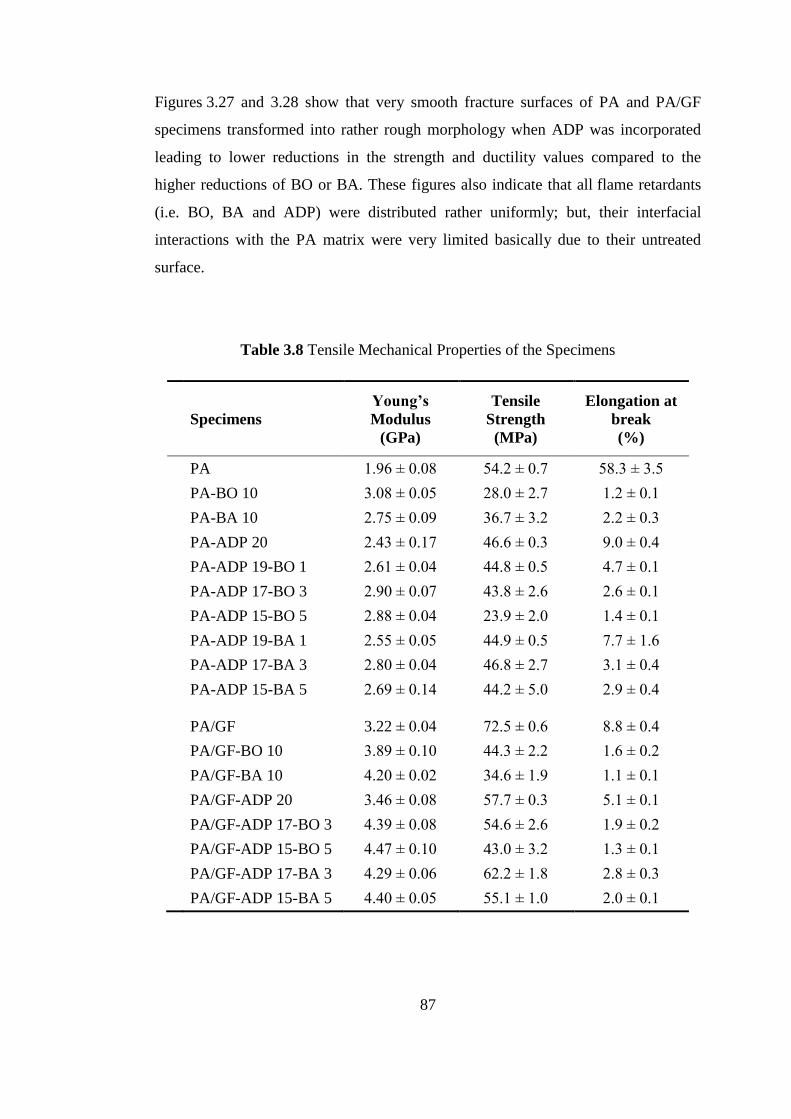
87
Figures 3.27 and 3.28 show that very smooth fracture surfaces of PA and PA/GF
specimens transformed into rather rough morphology when ADP was incorporated
leading to lower reductions in the strength and ductility values compared to the
higher reductions of BO or BA. These figures also indicate that all flame retardants
(i.e. BO, BA and ADP) were distributed rather uniformly; but, their interfacial
interactions with the PA matrix were very limited basically due to their untreated
surface.
Table 3.8 Tensile Mechanical Properties of the Specimens
Specimens
Young’s
Modulus
(GPa)
Tensile
Strength
(MPa)
Elongation at
break
(%)
PA 1.96 ± 0.08 54.2 ± 0.7 58.3 ± 3.5
PA-BO 10 3.08 ± 0.05 28.0 ± 2.7 1.2 ± 0.1
PA-BA 10 2.75 ± 0.09 36.7 ± 3.2 2.2 ± 0.3
PA-ADP 20 2.43 ± 0.17 46.6 ± 0.3 9.0 ± 0.4
PA-ADP 19-BO 1 2.61 ± 0.04 44.8 ± 0.5 4.7 ± 0.1
PA-ADP 17-BO 3 2.90 ± 0.07 43.8 ± 2.6 2.6 ± 0.1
PA-ADP 15-BO 5 2.88 ± 0.04 23.9 ± 2.0 1.4 ± 0.1
PA-ADP 19-BA 1 2.55 ± 0.05 44.9 ± 0.5 7.7 ± 1.6
PA-ADP 17-BA 3 2.80 ± 0.04 46.8 ± 2.7 3.1 ± 0.4
PA-ADP 15-BA 5 2.69 ± 0.14 44.2 ± 5.0 2.9 ± 0.4
PA/GF 3.22 ± 0.04 72.5 ± 0.6 8.8 ± 0.4
PA/GF-BO 10 3.89 ± 0.10 44.3 ± 2.2 1.6 ± 0.2
PA/GF-BA 10 4.20 ± 0.02 34.6 ± 1.9 1.1 ± 0.1
PA/GF-ADP 20 3.46 ± 0.08 57.7 ± 0.3 5.1 ± 0.1
PA/GF-ADP 17-BO 3 4.39 ± 0.08 54.6 ± 2.6 1.9 ± 0.2
PA/GF-ADP 15-BO 5 4.47 ± 0.10 43.0 ± 3.2 1.3 ± 0.1
PA/GF-ADP 17-BA 3 4.29 ± 0.06 62.2 ± 1.8 2.8 ± 0.3
PA/GF-ADP 15-BA 5 4.40 ± 0.05 55.1 ± 1.0 2.0 ± 0.1
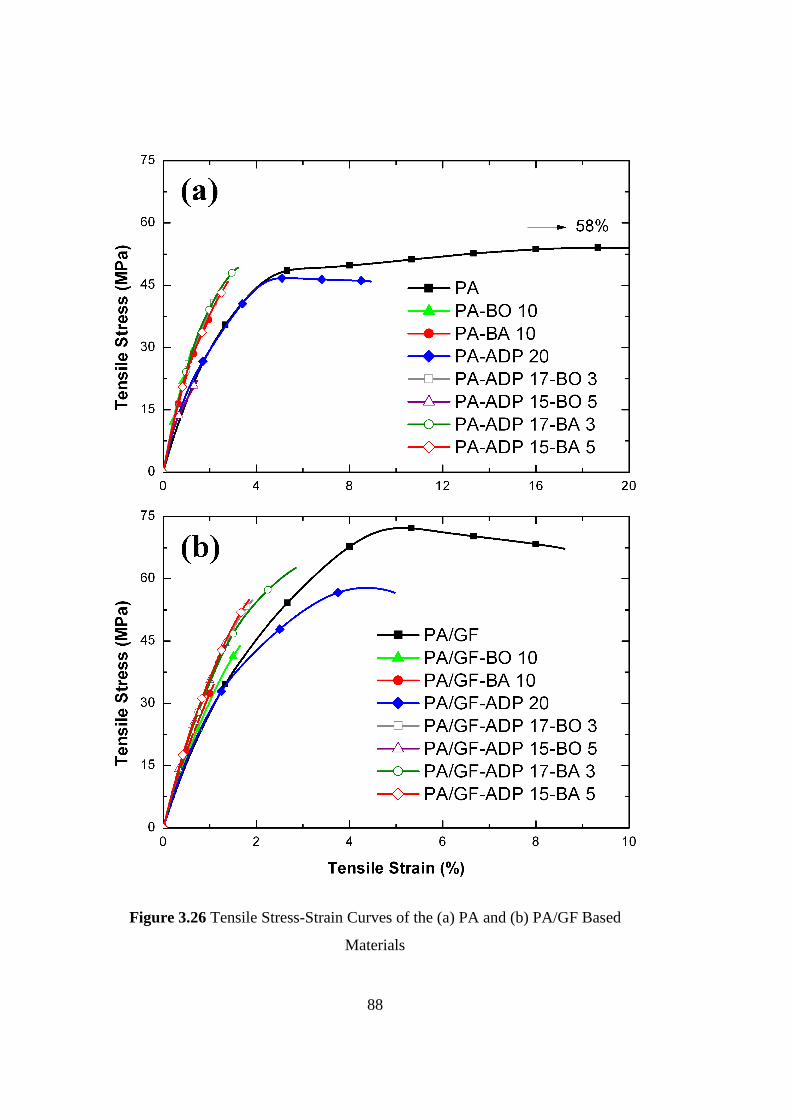
88
Figure 3.26 Tensile Stress-Strain Curves of the (a) PA and (b) PA/GF Based
Materials
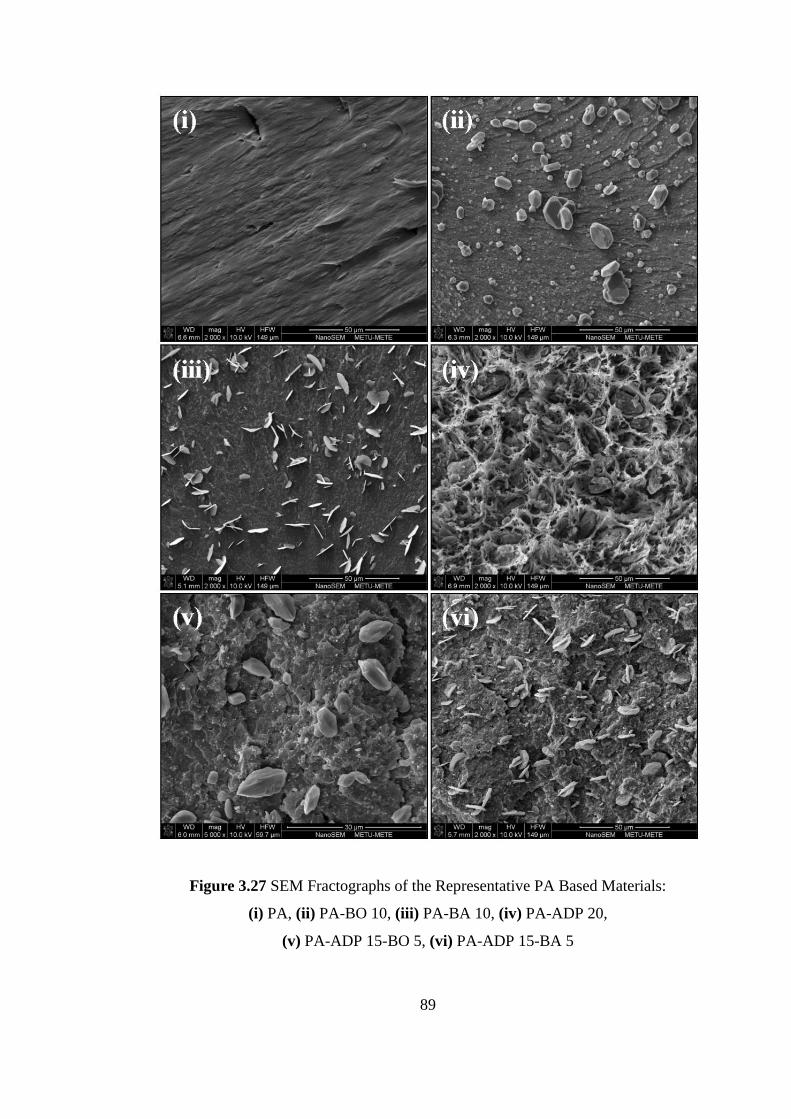
89
Figure 3.27 SEM Fractographs of the Representative PA Based Materials:
(i) PA, (ii) PA-BO 10, (iii) PA-BA 10, (iv) PA-ADP 20,
(v) PA-ADP 15-BO 5, (vi) PA-ADP 15-BA 5
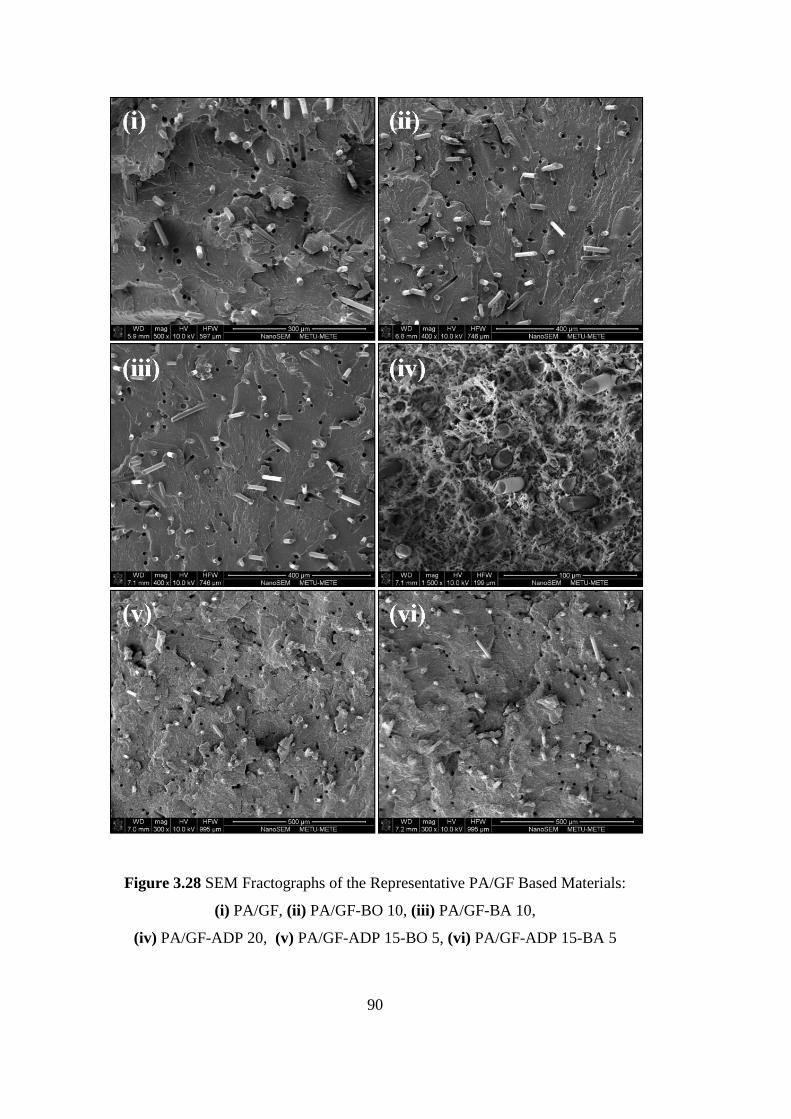
90
Figure 3.28 SEM Fractographs of the Representative PA/GF Based Materials:
(i) PA/GF, (ii) PA/GF-BO 10, (iii) PA/GF-BA 10,
(iv) PA/GF-ADP 20, (v) PA/GF-ADP 15-BO 5, (vi) PA/GF-ADP 15-BA 5
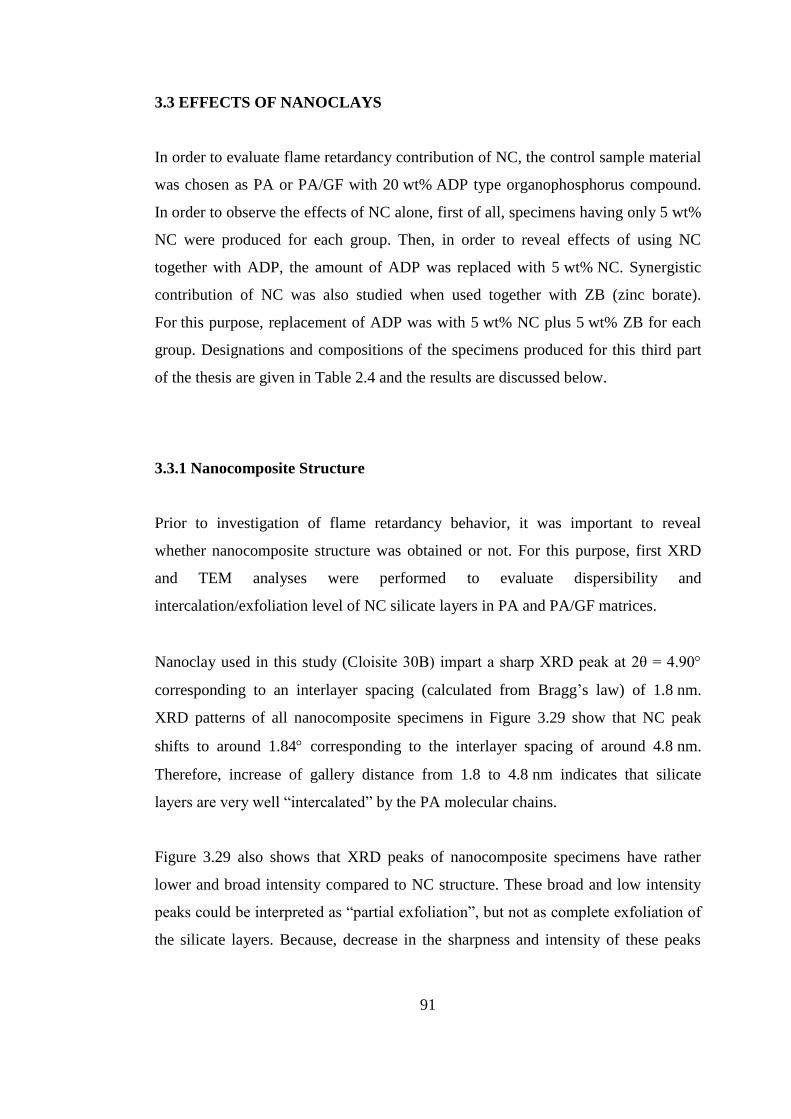
91
3.3 EFFECTS OF NANOCLAYS
In order to evaluate flame retardancy contribution of NC, the control sample material
was chosen as PA or PA/GF with 20 wt% ADP type organophosphorus compound.
In order to observe the effects of NC alone, first of all, specimens having only 5 wt%
NC were produced for each group. Then, in order to reveal effects of using NC
together with ADP, the amount of ADP was replaced with 5 wt% NC. Synergistic
contribution of NC was also studied when used together with ZB (zinc borate).
For this purpose, replacement of ADP was with 5 wt% NC plus 5 wt% ZB for each
group. Designations and compositions of the specimens produced for this third part
of the thesis are given in Table 2.4 and the results are discussed below.
3.3.1 Nanocomposite Structure
Prior to investigation of flame retardancy behavior, it was important to reveal
whether nanocomposite structure was obtained or not. For this purpose, first XRD
and TEM analyses were performed to evaluate dispersibility and
intercalation/exfoliation level of NC silicate layers in PA and PA/GF matrices.
Nanoclay used in this study (Cloisite 30B) impart a sharp XRD peak at 2θ = 4.90
corresponding to an interlayer spacing (calculated from Bragg’s law) of 1.8 nm.
XRD patterns of all nanocomposite specimens in Figure 3.29 show that NC peak
shifts to around 1.84 corresponding to the interlayer spacing of around 4.8 nm.
Therefore, increase of gallery distance from 1.8 to 4.8 nm indicates that silicate
layers are very well “intercalated” by the PA molecular chains.
Figure 3.29 also shows that XRD peaks of nanocomposite specimens have rather
lower and broad intensity compared to NC structure. These broad and low intensity
peaks could be interpreted as “partial exfoliation”, but not as complete exfoliation of
the silicate layers. Because, decrease in the sharpness and intensity of these peaks
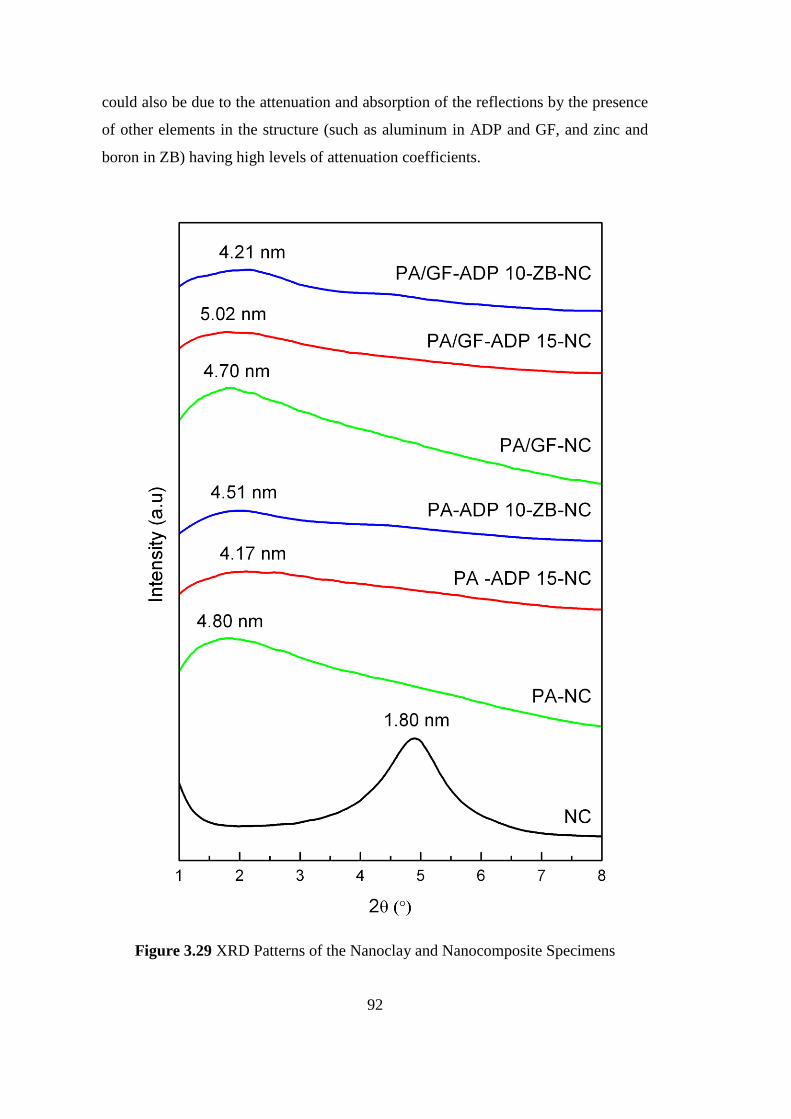
92
could also be due to the attenuation and absorption of the reflections by the presence
of other elements in the structure (such as aluminum in ADP and GF, and zinc and
boron in ZB) having high levels of attenuation coefficients.
Figure 3.29 XRD Patterns of the Nanoclay and Nanocomposite Specimens
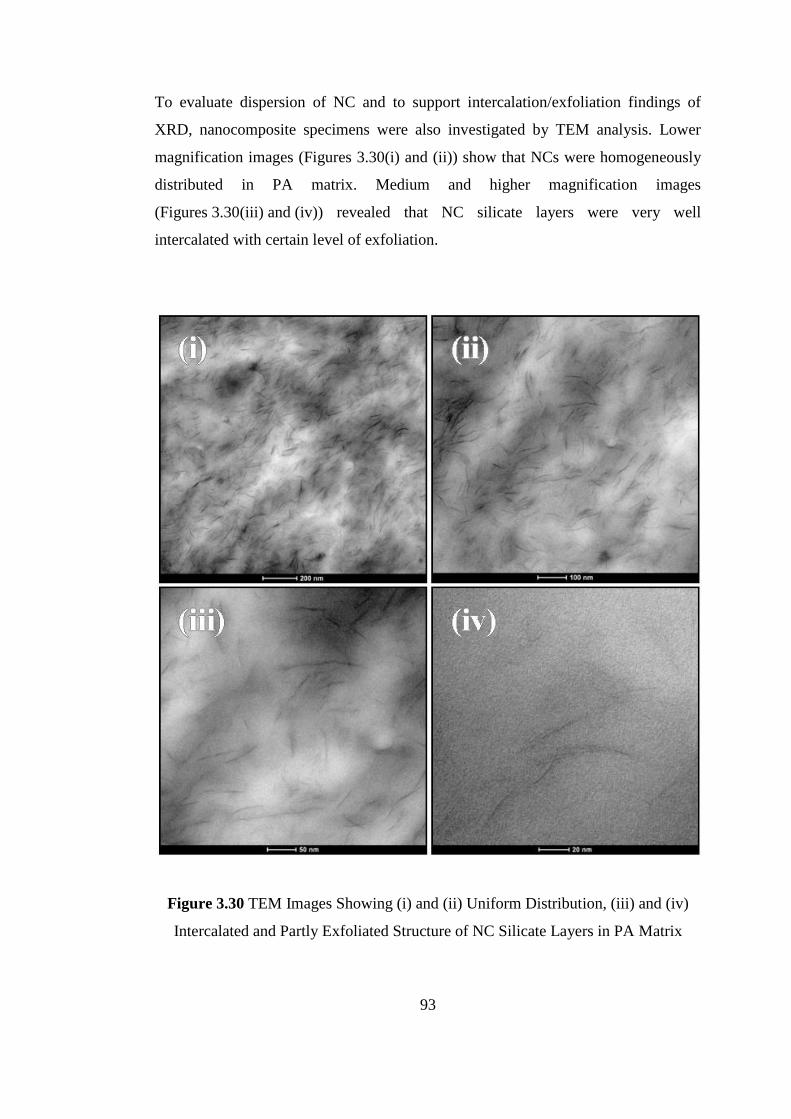
93
To evaluate dispersion of NC and to support intercalation/exfoliation findings of
XRD, nanocomposite specimens were also investigated by TEM analysis. Lower
magnification images (Figures 3.30(i) and (ii)) show that NCs were homogeneously
distributed in PA matrix. Medium and higher magnification images
(Figures 3.30(iii) and (iv)) revealed that NC silicate layers were very well
intercalated with certain level of exfoliation.
Figure 3.30 TEM Images Showing (i) and (ii) Uniform Distribution, (iii) and (iv)
Intercalated and Partly Exfoliated Structure of NC Silicate Layers in PA Matrix
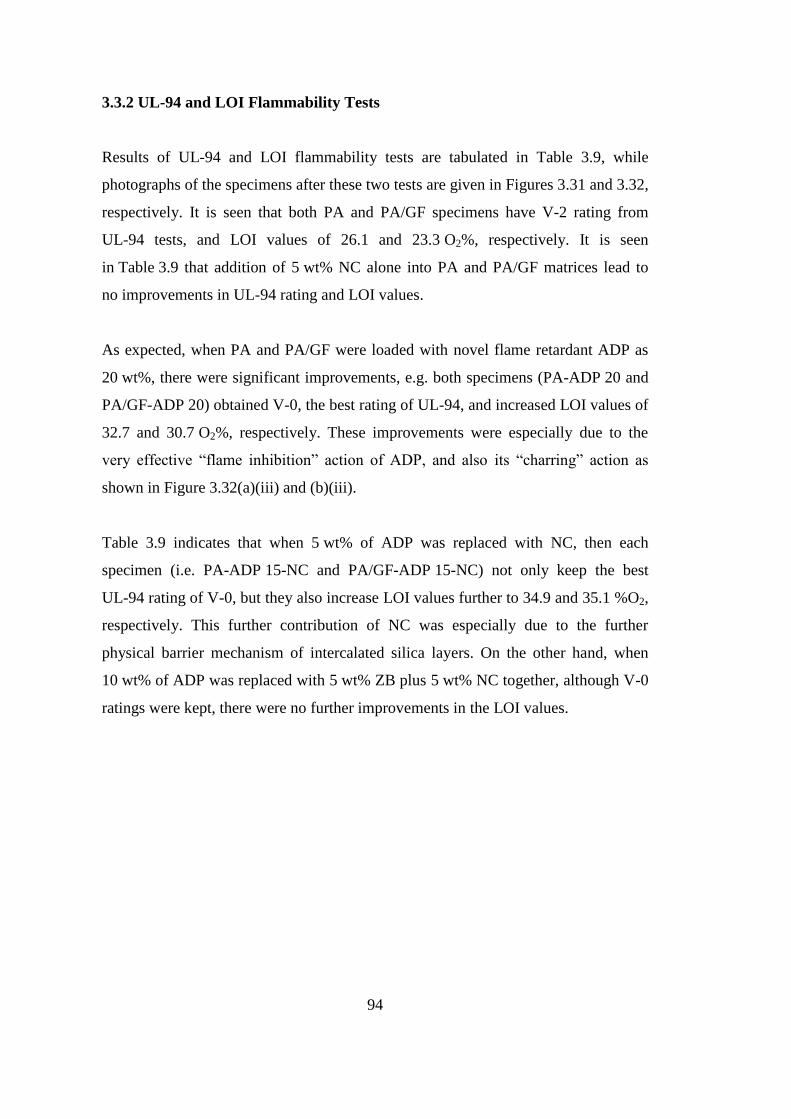
94
3.3.2 UL-94 and LOI Flammability Tests
Results of UL-94 and LOI flammability tests are tabulated in Table 3.9, while
photographs of the specimens after these two tests are given in Figures 3.31 and 3.32,
respectively. It is seen that both PA and PA/GF specimens have V-2 rating from
UL-94 tests, and LOI values of 26.1 and 23.3 O2%, respectively. It is seen
in Table 3.9 that addition of 5 wt% NC alone into PA and PA/GF matrices lead to
no improvements in UL-94 rating and LOI values.
As expected, when PA and PA/GF were loaded with novel flame retardant ADP as
20 wt%, there were significant improvements, e.g. both specimens (PA-ADP 20 and
PA/GF-ADP 20) obtained V-0, the best rating of UL-94, and increased LOI values of
32.7 and 30.7 O2%, respectively. These improvements were especially due to the
very effective “flame inhibition” action of ADP, and also its “charring” action as
shown in Figure 3.32(a)(iii) and (b)(iii).
Table 3.9 indicates that when 5 wt% of ADP was replaced with NC, then each
specimen (i.e. PA-ADP 15-NC and PA/GF-ADP 15-NC) not only keep the best
UL-94 rating of V-0, but they also increase LOI values further to 34.9 and 35.1 %O2,
respectively. This further contribution of NC was especially due to the further
physical barrier mechanism of intercalated silica layers. On the other hand, when
10 wt% of ADP was replaced with 5 wt% ZB plus 5 wt% NC together, although V-0
ratings were kept, there were no further improvements in the LOI values.
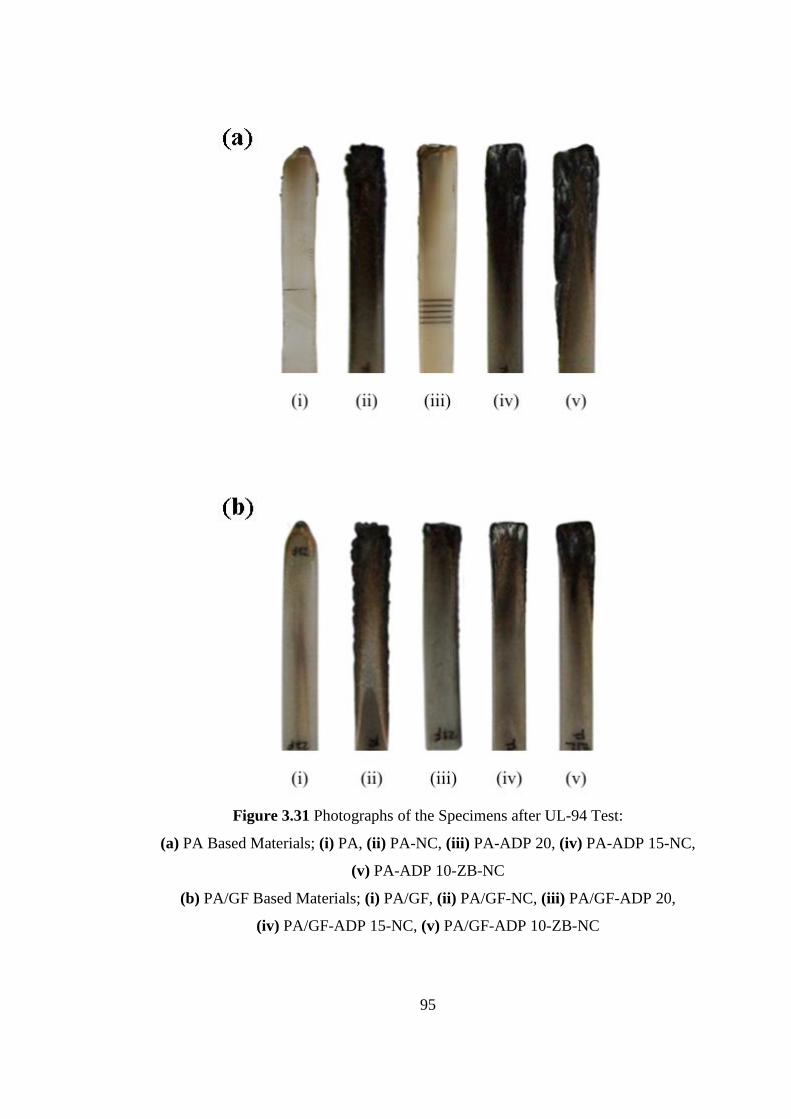
95
Figure 3.31 Photographs of the Specimens after UL-94 Test:
(a) PA Based Materials; (i) PA, (ii) PA-NC, (iii) PA-ADP 20, (iv) PA-ADP 15-NC,
(v) PA-ADP 10-ZB-NC
(b) PA/GF Based Materials; (i) PA/GF, (ii) PA/GF-NC, (iii) PA/GF-ADP 20,
(iv) PA/GF-ADP 15-NC, (v) PA/GF-ADP 10-ZB-NC
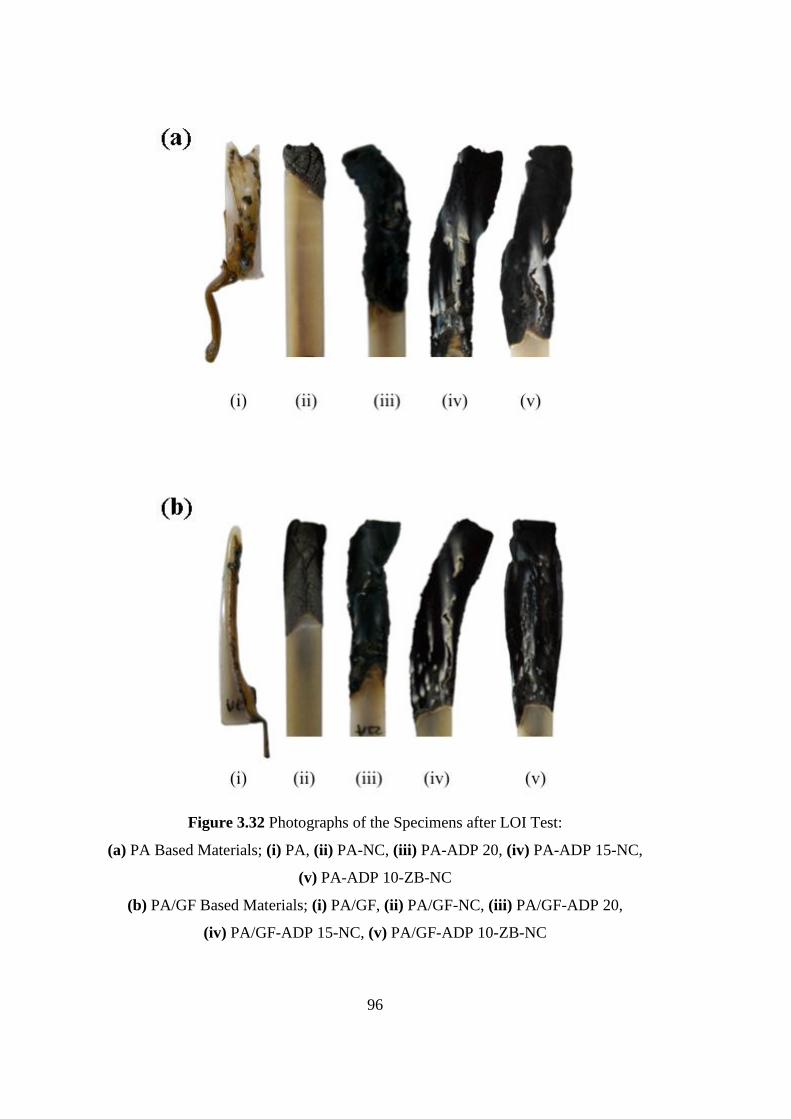
96
Figure 3.32 Photographs of the Specimens after LOI Test:
(a) PA Based Materials; (i) PA, (ii) PA-NC, (iii) PA-ADP 20, (iv) PA-ADP 15-NC,
(v) PA-ADP 10-ZB-NC
(b) PA/GF Based Materials; (i) PA/GF, (ii) PA/GF-NC, (iii) PA/GF-ADP 20,
(iv) PA/GF-ADP 15-NC, (v) PA/GF-ADP 10-ZB-NC
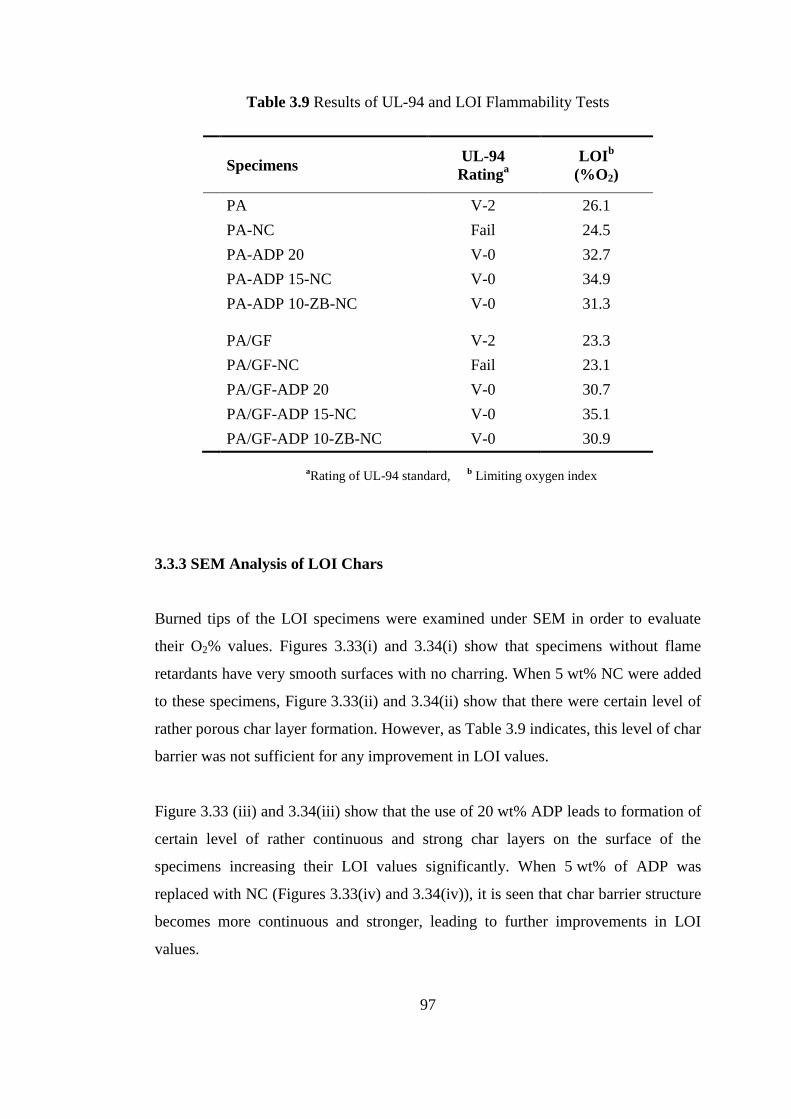
97
Table 3.9 Results of UL-94 and LOI Flammability Tests
Specimens UL-94
Ratinga
LOIb
(%O2)
PA V-2 26.1
PA-NC Fail 24.5
PA-ADP 20 V-0 32.7
PA-ADP 15-NC V-0 34.9
PA-ADP 10-ZB-NC V-0 31.3
PA/GF V-2 23.3
PA/GF-NC Fail 23.1
PA/GF-ADP 20 V-0 30.7
PA/GF-ADP 15-NC V-0 35.1
PA/GF-ADP 10-ZB-NC V-0 30.9
aRating of UL-94 standard,
b Limiting oxygen index
3.3.3 SEM Analysis of LOI Chars
Burned tips of the LOI specimens were examined under SEM in order to evaluate
their O2% values. Figures 3.33(i) and 3.34(i) show that specimens without flame
retardants have very smooth surfaces with no charring. When 5 wt% NC were added
to these specimens, Figure 3.33(ii) and 3.34(ii) show that there were certain level of
rather porous char layer formation. However, as Table 3.9 indicates, this level of char
barrier was not sufficient for any improvement in LOI values.
Figure 3.33 (iii) and 3.34(iii) show that the use of 20 wt% ADP leads to formation of
certain level of rather continuous and strong char layers on the surface of the
specimens increasing their LOI values significantly. When 5 wt% of ADP was
replaced with NC (Figures 3.33(iv) and 3.34(iv)), it is seen that char barrier structure
becomes more continuous and stronger, leading to further improvements in LOI
values.
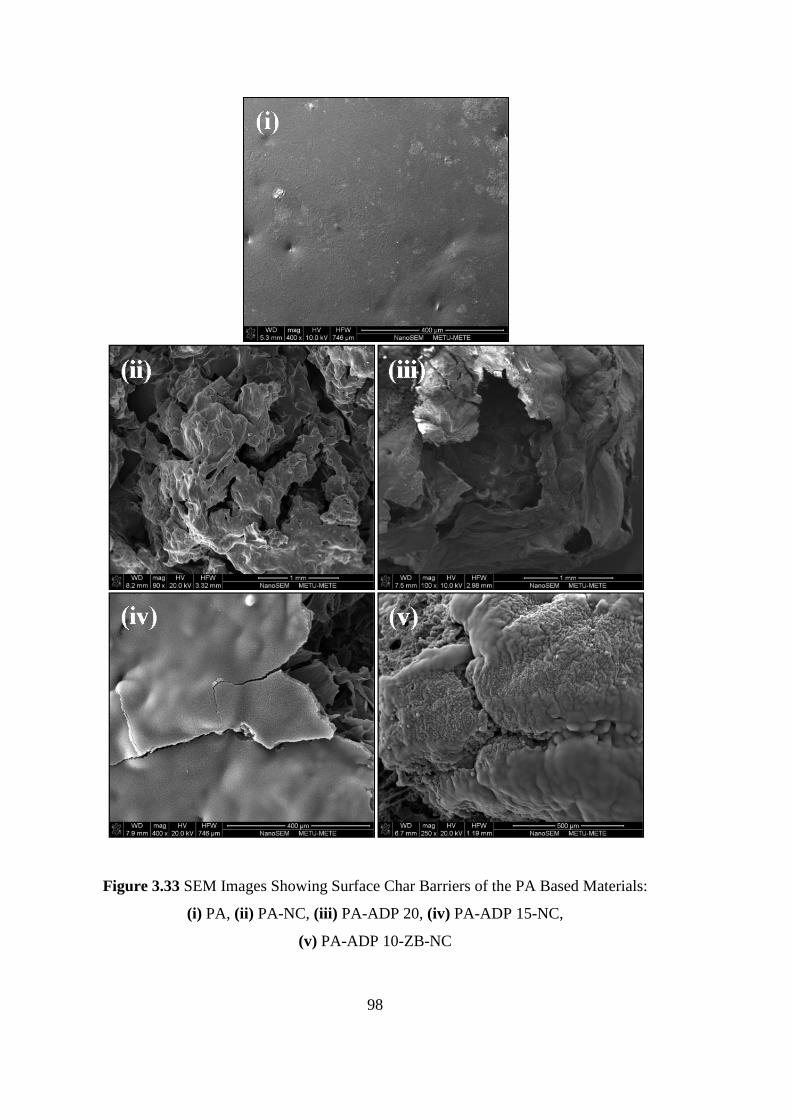
98
Figure 3.33 SEM Images Showing Surface Char Barriers of the PA Based Materials:
(i) PA, (ii) PA-NC, (iii) PA-ADP 20, (iv) PA-ADP 15-NC,
(v) PA-ADP 10-ZB-NC
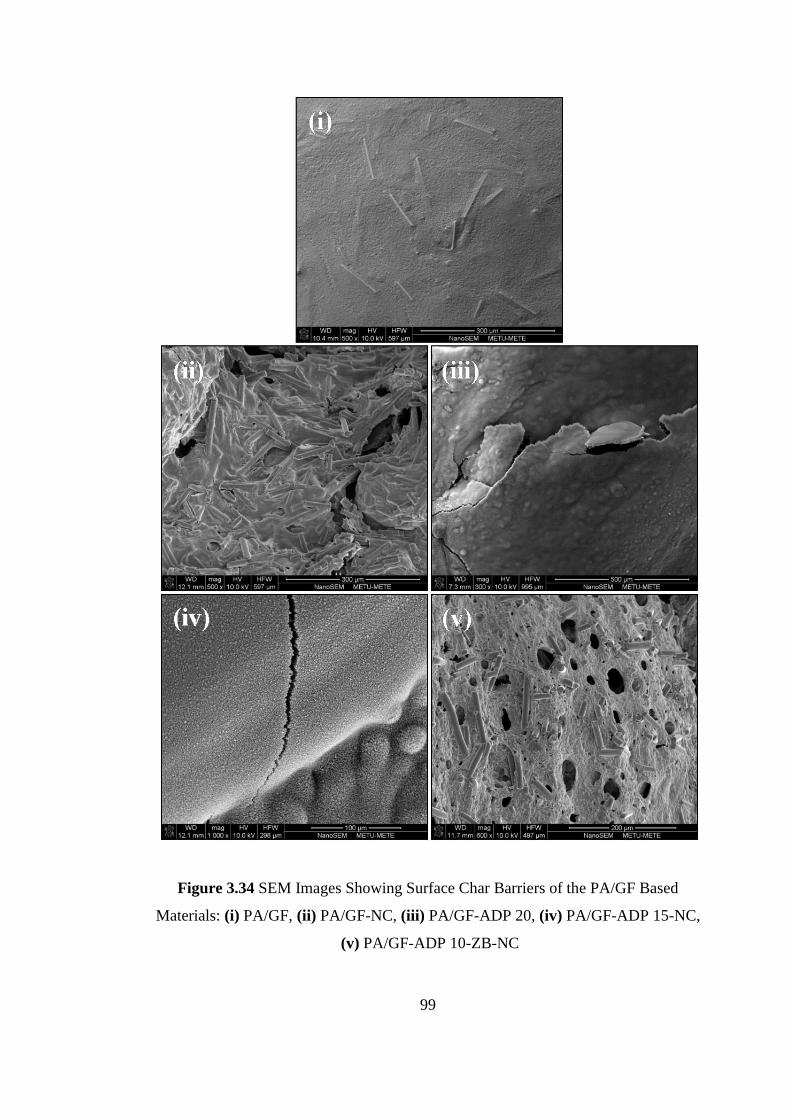
99
Figure 3.34 SEM Images Showing Surface Char Barriers of the PA/GF Based
Materials: (i) PA/GF, (ii) PA/GF-NC, (iii) PA/GF-ADP 20, (iv) PA/GF-ADP 15-NC,
(v) PA/GF-ADP 10-ZB-NC
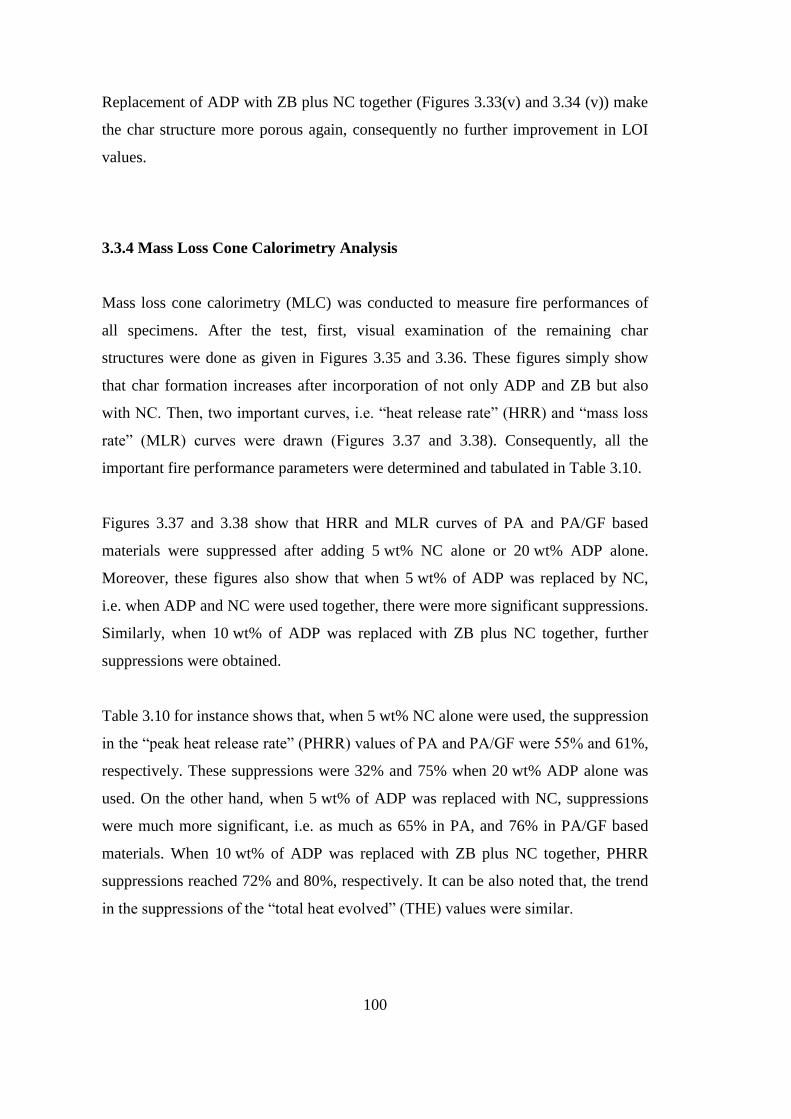
100
Replacement of ADP with ZB plus NC together (Figures 3.33(v) and 3.34 (v)) make
the char structure more porous again, consequently no further improvement in LOI
values.
3.3.4 Mass Loss Cone Calorimetry Analysis
Mass loss cone calorimetry (MLC) was conducted to measure fire performances of
all specimens. After the test, first, visual examination of the remaining char
structures were done as given in Figures 3.35 and 3.36. These figures simply show
that char formation increases after incorporation of not only ADP and ZB but also
with NC. Then, two important curves, i.e. “heat release rate” (HRR) and “mass loss
rate” (MLR) curves were drawn (Figures 3.37 and 3.38). Consequently, all the
important fire performance parameters were determined and tabulated in Table 3.10.
Figures 3.37 and 3.38 show that HRR and MLR curves of PA and PA/GF based
materials were suppressed after adding 5 wt% NC alone or 20 wt% ADP alone.
Moreover, these figures also show that when 5 wt% of ADP was replaced by NC,
i.e. when ADP and NC were used together, there were more significant suppressions.
Similarly, when 10 wt% of ADP was replaced with ZB plus NC together, further
suppressions were obtained.
Table 3.10 for instance shows that, when 5 wt% NC alone were used, the suppression
in the “peak heat release rate” (PHRR) values of PA and PA/GF were 55% and 61%,
respectively. These suppressions were 32% and 75% when 20 wt% ADP alone was
used. On the other hand, when 5 wt% of ADP was replaced with NC, suppressions
were much more significant, i.e. as much as 65% in PA, and 76% in PA/GF based
materials. When 10 wt% of ADP was replaced with ZB plus NC together, PHRR
suppressions reached 72% and 80%, respectively. It can be also noted that, the trend
in the suppressions of the “total heat evolved” (THE) values were similar.
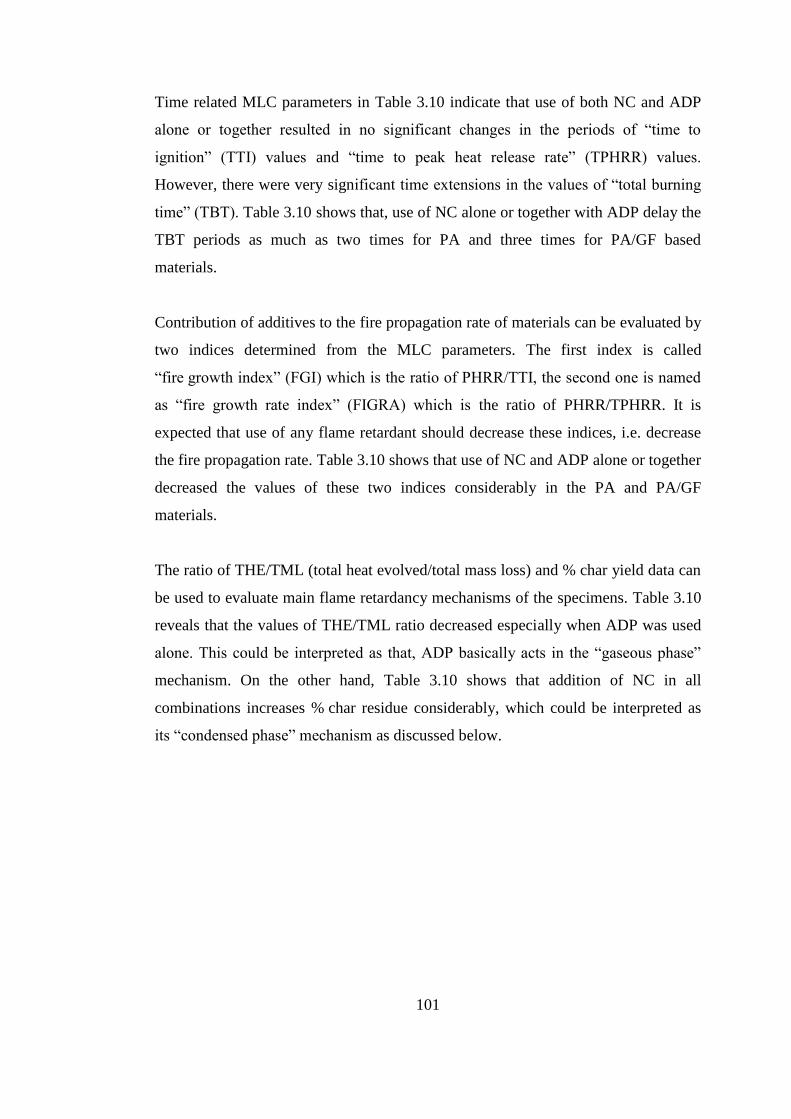
101
Time related MLC parameters in Table 3.10 indicate that use of both NC and ADP
alone or together resulted in no significant changes in the periods of “time to
ignition” (TTI) values and “time to peak heat release rate” (TPHRR) values.
However, there were very significant time extensions in the values of “total burning
time” (TBT). Table 3.10 shows that, use of NC alone or together with ADP delay the
TBT periods as much as two times for PA and three times for PA/GF based
materials.
Contribution of additives to the fire propagation rate of materials can be evaluated by
two indices determined from the MLC parameters. The first index is called
“fire growth index” (FGI) which is the ratio of PHRR/TTI, the second one is named
as “fire growth rate index” (FIGRA) which is the ratio of PHRR/TPHRR. It is
expected that use of any flame retardant should decrease these indices, i.e. decrease
the fire propagation rate. Table 3.10 shows that use of NC and ADP alone or together
decreased the values of these two indices considerably in the PA and PA/GF
materials.
The ratio of THE/TML (total heat evolved/total mass loss) and % char yield data can
be used to evaluate main flame retardancy mechanisms of the specimens. Table 3.10
reveals that the values of THE/TML ratio decreased especially when ADP was used
alone. This could be interpreted as that, ADP basically acts in the “gaseous phase”
mechanism. On the other hand, Table 3.10 shows that addition of NC in all
combinations increases % char residue considerably, which could be interpreted as
its “condensed phase” mechanism as discussed below.
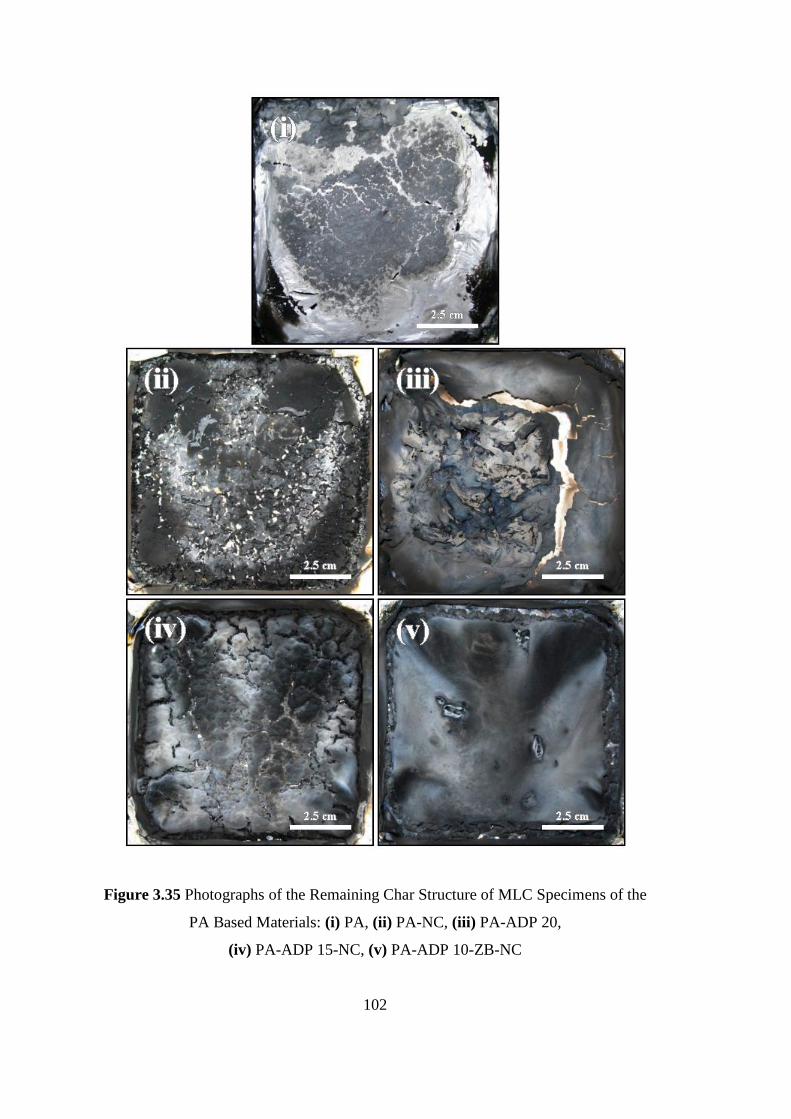
102
Figure 3.35 Photographs of the Remaining Char Structure of MLC Specimens of the
PA Based Materials: (i) PA, (ii) PA-NC, (iii) PA-ADP 20,
(iv) PA-ADP 15-NC, (v) PA-ADP 10-ZB-NC
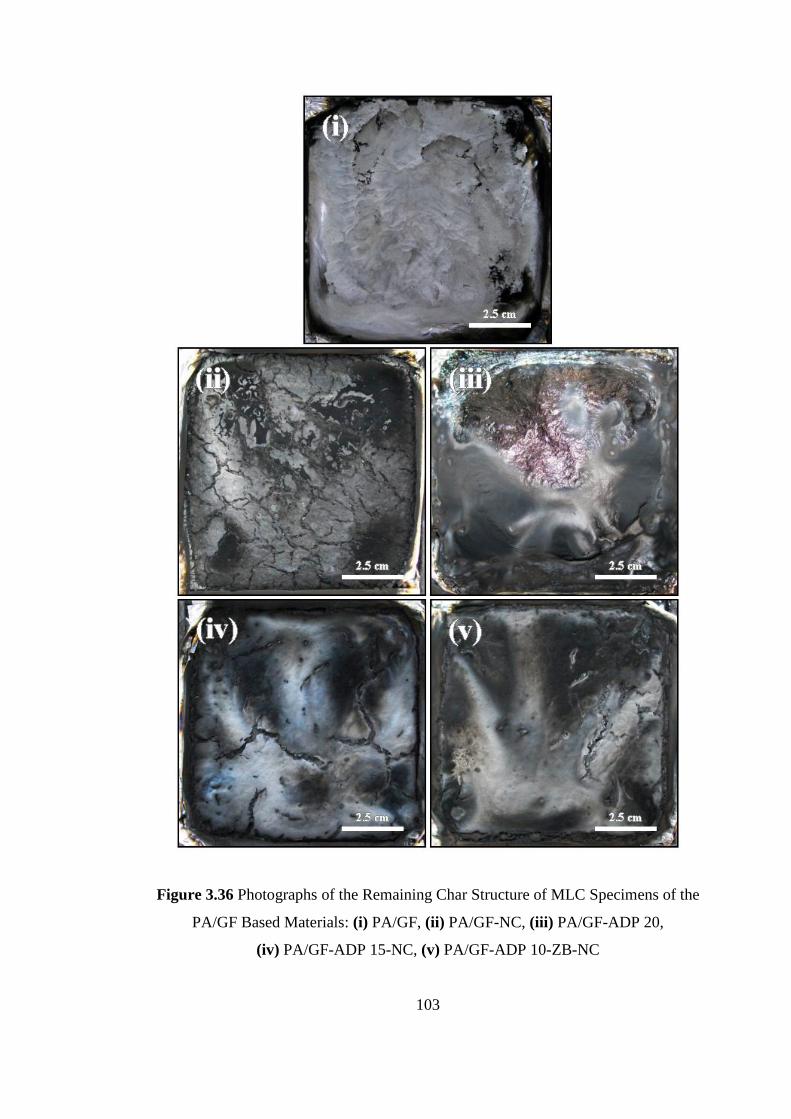
103
Figure 3.36 Photographs of the Remaining Char Structure of MLC Specimens of the
PA/GF Based Materials: (i) PA/GF, (ii) PA/GF-NC, (iii) PA/GF-ADP 20,
(iv) PA/GF-ADP 15-NC, (v) PA/GF-ADP 10-ZB-NC
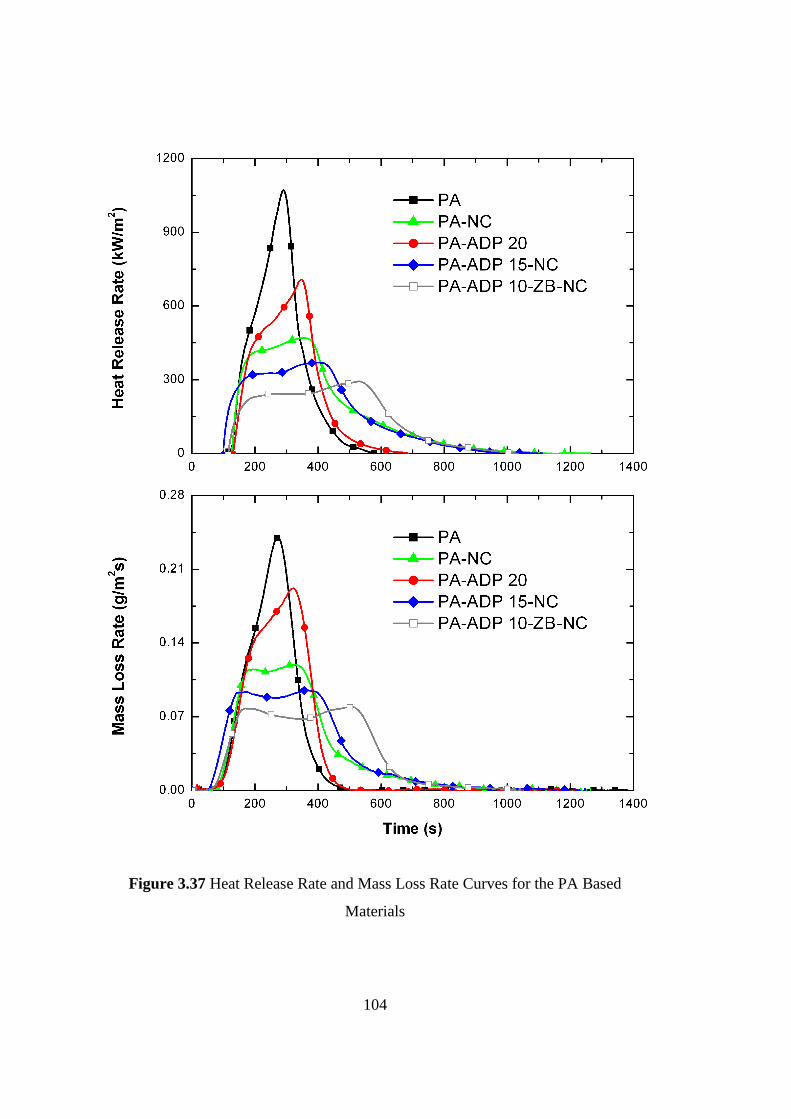
104
Figure 3.37 Heat Release Rate and Mass Loss Rate Curves for the PA Based
Materials
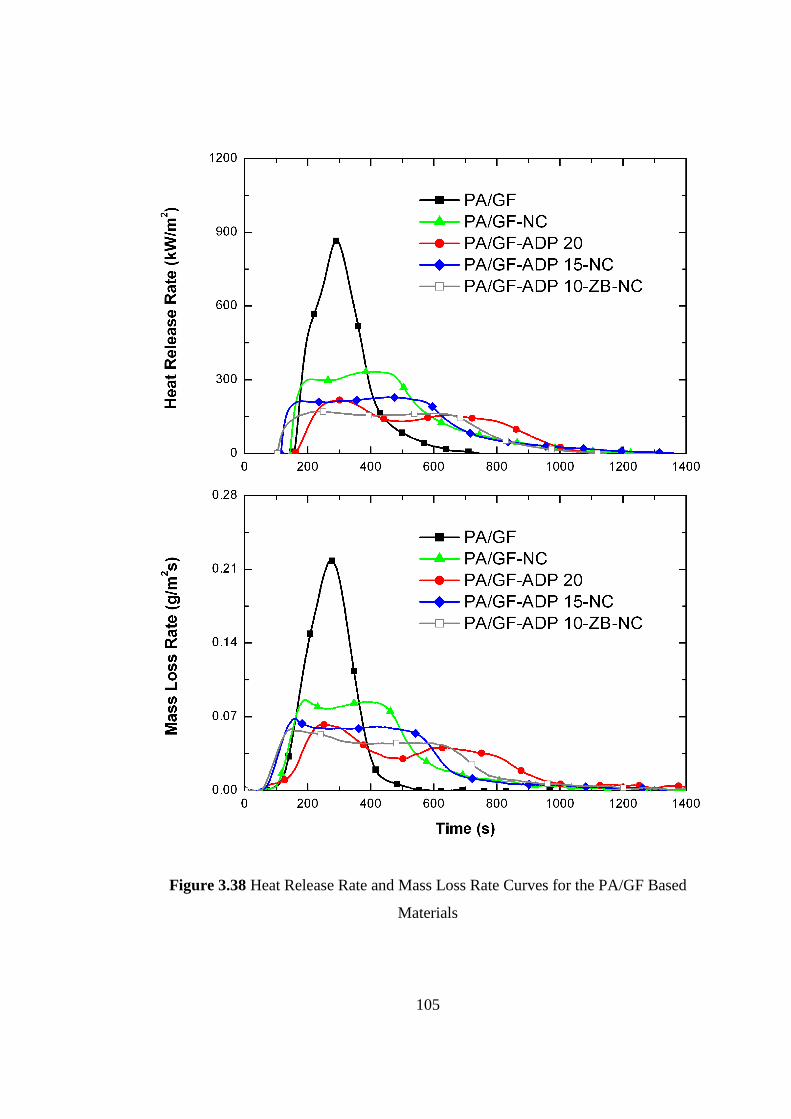
105
Figure 3.38 Heat Release Rate and Mass Loss Rate Curves for the PA/GF Based
Materials
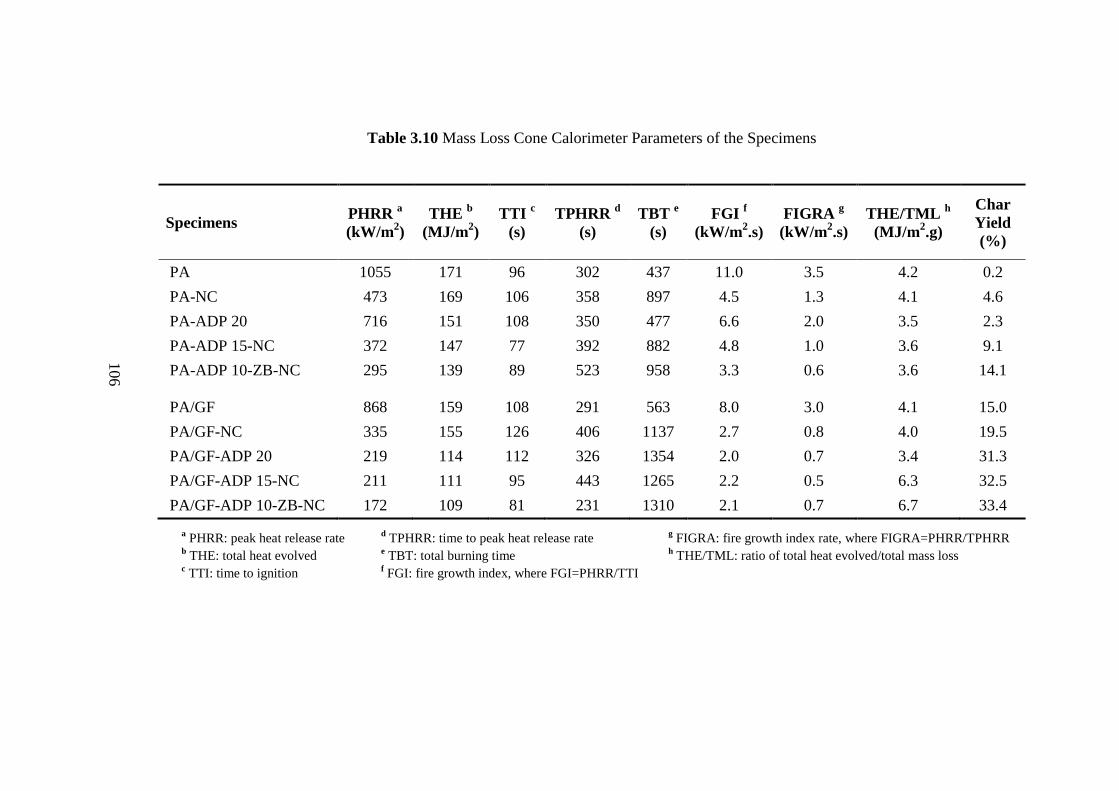
106
Table 3.10 Mass Loss Cone Calorimeter Parameters of the Specimens
Specimens PHRR
a
(kW/m2)
THE b
(MJ/m2)
TTI c
(s)
TPHRR d
(s)
TBT e
(s)
FGI f
(kW/m2.s)
FIGRA g
(kW/m2.s)
THE/TML h
(MJ/m2.g)
Char
Yield
(%)
PA 1055 171 96 302 437 11.0 3.5 4.2 0.2
PA-NC 473 169 106 358 897 4.5 1.3 4.1 4.6
PA-ADP 20 716 151 108 350 477 6.6 2.0 3.5 2.3
PA-ADP 15-NC 372 147 77 392 882 4.8 1.0 3.6 9.1
PA-ADP 10-ZB-NC 295 139 89 523 958 3.3 0.6 3.6 14.1
PA/GF 868 159 108 291 563 8.0 3.0 4.1 15.0
PA/GF-NC 335 155 126 406 1137 2.7 0.8 4.0 19.5
PA/GF-ADP 20 219 114 112 326 1354 2.0 0.7 3.4 31.3
PA/GF-ADP 15-NC 211 111 95 443 1265 2.2 0.5 6.3 32.5
PA/GF-ADP 10-ZB-NC 172 109 81 231 1310 2.1 0.7 6.7 33.4
a PHRR: peak heat release rate
d TPHRR: time to peak heat release rate
g FIGRA: fire growth index rate, where FIGRA=PHRR/TPHRR
b THE: total heat evolved
e TBT: total burning time
h THE/TML: ratio of total heat evolved/total mass loss
c TTI: time to ignition
f FGI: fire growth index, where FGI=PHRR/TTI
107
3.3.5 Flame Retardancy Mechanisms
As investigated by various studies [41,42,44,45,47-50,55], the main flame retardancy
mechanism of nanoclays is the “condense phase action”, that is, formation of
an “insulative barrier” preventing the underlying polymeric material from heat and
mass transfer during fire. When NC silicate layers were very-well intercalated and/or
exfoliated in the polymeric matrix, then physical barrier formation mechanism would
be more effective. Diffusion of volatile species generated during fire would be
restricted by the “tortuous pathway” formed via intercalated/exfoliated NC layers,
which is also called “labyrinth effect”. In this study, when NC was added alone,
Table 3.10 indicated that there were very significant suppressions in the values of
PHRR, due to the insulative barriers of NC layers with tortuous pathway.
It was indicated in Section 3.1.4 that as the primary mechanism, ADP acts in the
“gaseous” phase, while its secondary mechanism could be in the “condensed” phase.
When ADP was vaporized during fire, it might get oxidized to HPO2, PO, PO2,
and HPO radicals, which would scavenge very harmful H and OH hot radicals.
This gaseous phase action is called “flame inhibition”. When ADP was oxidized to
phosphoric acid during fire, it might lead to the formation of two-layer protective
barrier; a carbon based char and an inorganic residue layer of aluminum phosphate.
This condensed phase action is called “barrier effect”. In this study, due to the very
high efficiency of these mechanisms, use of ADP alone resulted in very significant
improvements in all flammability parameters including UL-94, LOI, PHRR, etc.
values as tabulated in Table 3.9 and 3.10.
When ADP was used together with NC, those mechanisms mentioned above would
continue to operate. In this study, the synergistic contribution of NC to ADP would
be retardation of gaseous aluminum phosphinate evolution by means of the labyrinth
effect of intercalated/exfoliated NC layers leading to the formation of larger amount
of aluminum phosphates in the char residue.
108
The main contribution of ZB when used together with ADP and NC would be in the
formation of additional inorganic barriers, i.e. boron phosphate /aluminum phosphate
layers as also stated by Braun et.al. [29,34]. Certainly, another contribution to the
condensed phase barrier mechanism would take place by the short glass fibers used
in the PA/GF based specimens, which would increase the effectiveness of char
barriers via reinforcing or stabilizing their structure.
For further clarification of these flame retardancy mechanisms, two additional
analyses namely; thermogravimetry and X-ray diffraction were conducted and
discussed in the following sections.
3.3.6 Thermogravimetric Analysis
Since results of each group were very similar, thermogravimetric (TG) and
differential thermogravimetric (DTG) curves are given in Figure 3.39 only for the
PA based materials, while the thermal degradation parameters derived from these
curves are tabulated in Table 3.11 for both PA and PA/GF based materials.
These curves showed that neat PA decomposes in one step with a maximum mass
loss rate at around 460C, leaving very little organic residue. On the contrary, due to
the 15 wt% glass fiber reinforcements, PA/GF specimen formed considerable amount
of residue. It is known that during decomposition, polyamide-6 releases water,
ammonia, carbon monoxide, carbon dioxide and certain hydrocarbon fragments.
Figure 3.39 shows that when NC was added, TG and DTG curves shift slightly to
higher temperatures. Therefore, Table 3.11 reveals that, not only maximum mass loss
rate temperatures (TDTG-peak) , but also 10 wt% and 50 wt% degradation temperatures
(T10 wt% and T50 wt%) of the PA and PA/GF specimens were increased.
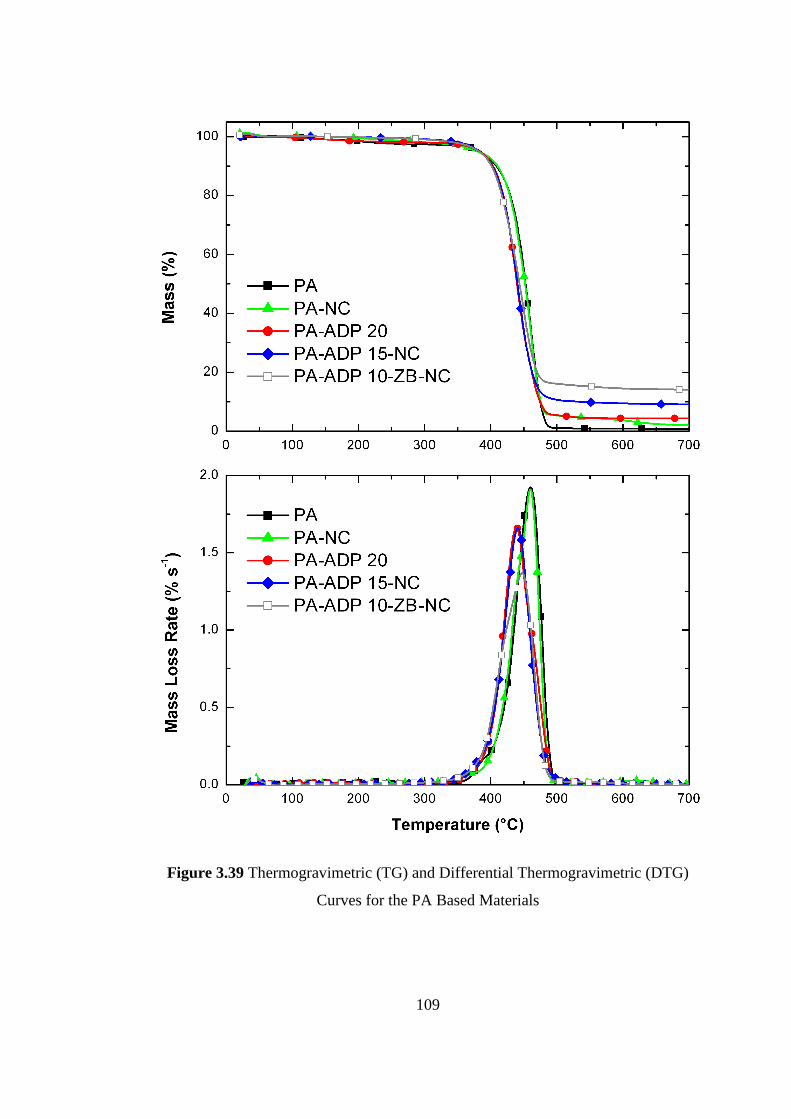
109
Figure 3.39 Thermogravimetric (TG) and Differential Thermogravimetric (DTG)
Curves for the PA Based Materials
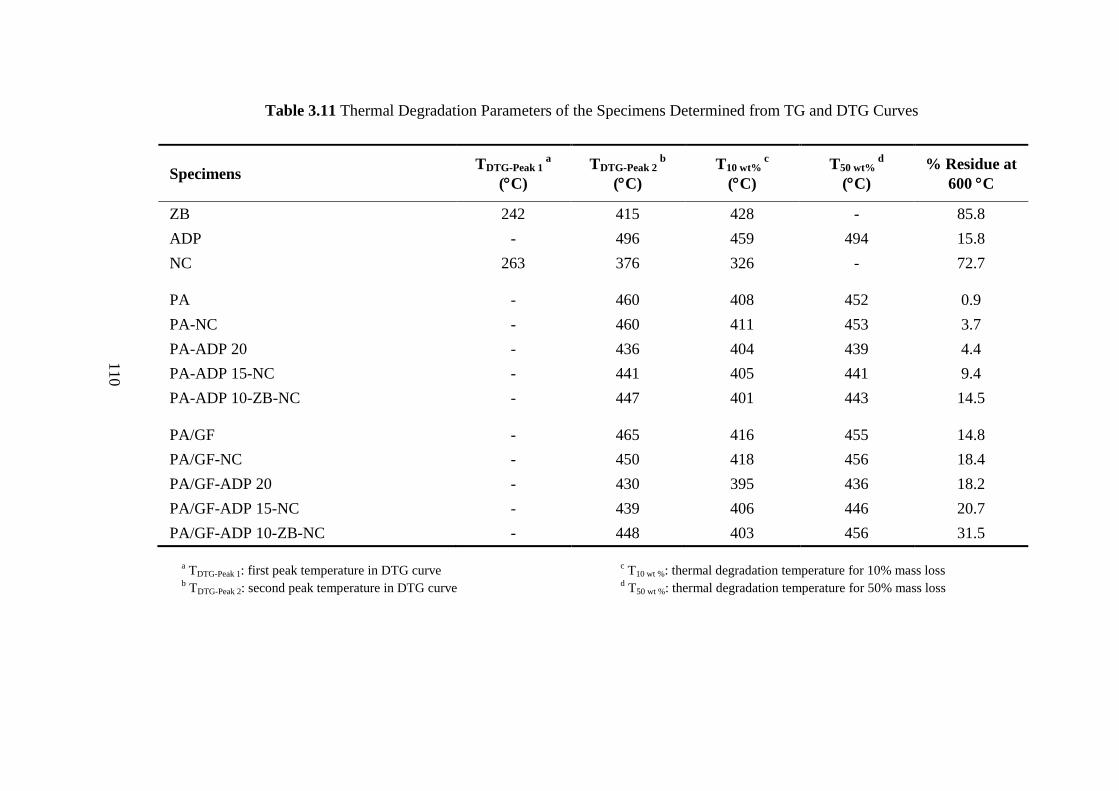
110
Table 3.11 Thermal Degradation Parameters of the Specimens Determined from TG and DTG Curves
Specimens TDTG-Peak 1
a
(C)
TDTG-Peak 2 b
(C)
T10 wt% c
(C)
T50 wt% d
(C)
% Residue at
600 C
ZB 242 415 428 - 85.8
ADP - 496 459 494 15.8
NC 263 376 326 - 72.7
PA - 460 408 452 0.9
PA-NC - 460 411 453 3.7
PA-ADP 20 - 436 404 439 4.4
PA-ADP 15-NC - 441 405 441 9.4
PA-ADP 10-ZB-NC - 447 401 443 14.5
PA/GF - 465 416 455 14.8
PA/GF-NC - 450 418 456 18.4
PA/GF-ADP 20 - 430 395 436 18.2
PA/GF-ADP 15-NC - 439 406 446 20.7
PA/GF-ADP 10-ZB-NC - 448 403 456 31.5
a
TDTG-Peak 1: first peak temperature in DTG curve c
T10 wt %: thermal degradation temperature for 10% mass loss
b TDTG-Peak 2: second peak temperature in DTG curve
d T50 wt %: thermal degradation temperature for 50% mass loss
111
Table 3.11 also indicates that addition of NC in all compositions increases the
amount of residue significantly, for instance, use of only 5 wt% NC leads to more
than 3.5 wt% residue. It is seen that the use of NC together with ADP and ZB leads
to even more significant increases in the amount of residue. Thus, TG analysis
supported the physical barrier formation mechanisms of NC, ADP and ZB as
discussed in the previous section.
3.3.7 XRD Analysis of MLC Residues
To reveal the crystal structure of the phases in the char layers, XRD analyses were
conducted on the MLC chars of representative specimens of each group. Since
results of each group were very similar, XRD diffractograms are provided in
Figure 3.40 only for the PA based materials.
Figure 3.40 shows that when NC was used alone, typical peaks of the
crystallographic planes of montmorillonite (MMT) clay mineral were seen. When
ADP was used alone, peaks of its main decompositions phase, i.e. peaks of
aluminum phosphate (AlPO4) were seen. When NC and ADP were used together, no
additional peaks formed. When NC was used together with ADP and ZB, additional
peaks of the decomposition phases of ADP and ZB were also observed, which were
boron phosphate (BPO4) and dehydrated zinc borates (Zn(BO2)2, ZnB4O7 and
Zn4B6O13).
Thus, it can be stated that, apart from the MMT structure of NC and the expected
decomposition byproducts of ADP and ZB, no other phases were formed in the chars
of the MLC specimens. This could be interpreted as another confirmation of the
physical barrier mechanism of especially NC, ZB, and also partly for ADP.
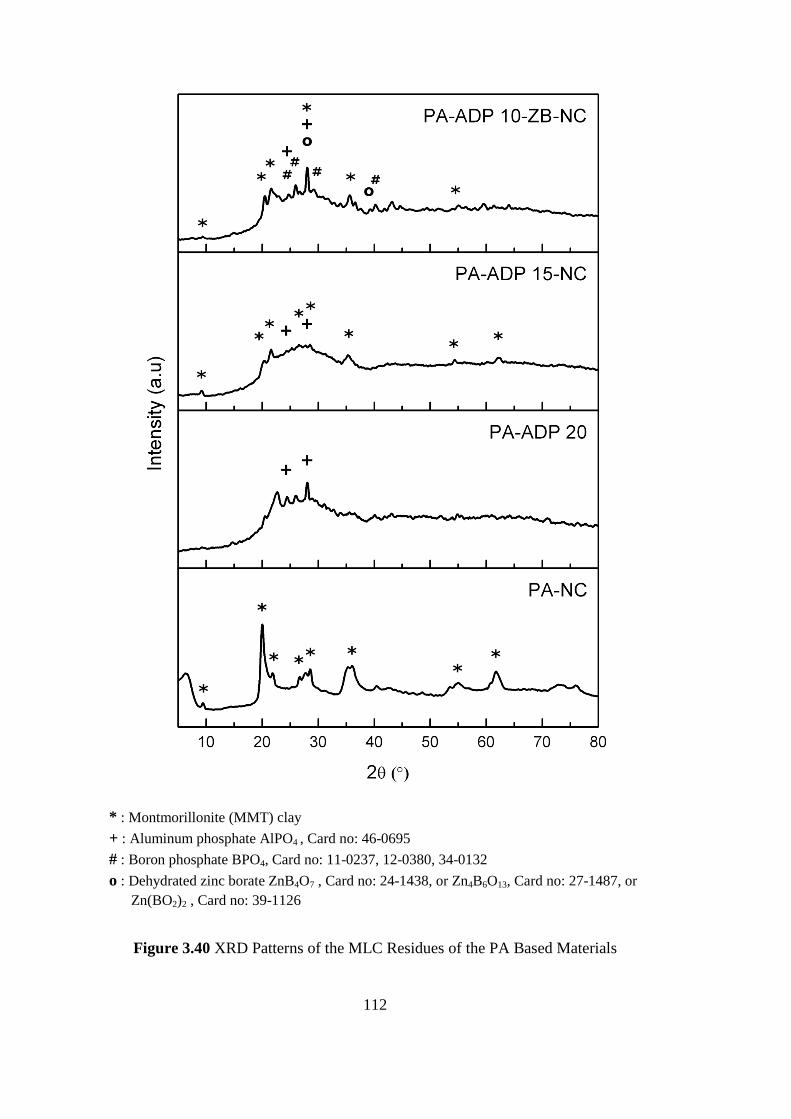
112
* : Montmorillonite (MMT) clay
+ : Aluminum phosphate AlPO4 , Card no: 46-0695
# : Boron phosphate BPO4, Card no: 11-0237, 12-0380, 34-0132
o : Dehydrated zinc borate ZnB4O7 , Card no: 24-1438, or Zn4B6O13, Card no: 27-1487, or
Zn(BO2)2 , Card no: 39-1126
Figure 3.40 XRD Patterns of the MLC Residues of the PA Based Materials
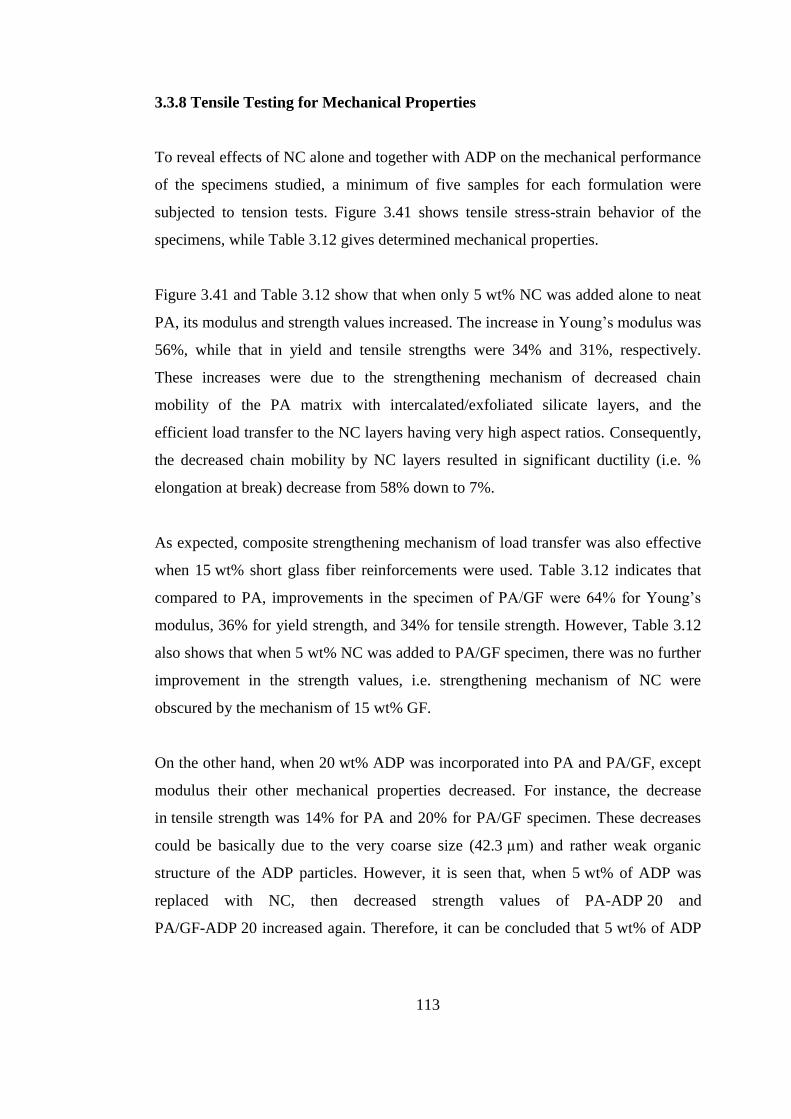
113
3.3.8 Tensile Testing for Mechanical Properties
To reveal effects of NC alone and together with ADP on the mechanical performance
of the specimens studied, a minimum of five samples for each formulation were
subjected to tension tests. Figure 3.41 shows tensile stress-strain behavior of the
specimens, while Table 3.12 gives determined mechanical properties.
Figure 3.41 and Table 3.12 show that when only 5 wt% NC was added alone to neat
PA, its modulus and strength values increased. The increase in Young’s modulus was
56%, while that in yield and tensile strengths were 34% and 31%, respectively.
These increases were due to the strengthening mechanism of decreased chain
mobility of the PA matrix with intercalated/exfoliated silicate layers, and the
efficient load transfer to the NC layers having very high aspect ratios. Consequently,
the decreased chain mobility by NC layers resulted in significant ductility (i.e. %
elongation at break) decrease from 58% down to 7%.
As expected, composite strengthening mechanism of load transfer was also effective
when 15 wt% short glass fiber reinforcements were used. Table 3.12 indicates that
compared to PA, improvements in the specimen of PA/GF were 64% for Young’s
modulus, 36% for yield strength, and 34% for tensile strength. However, Table 3.12
also shows that when 5 wt% NC was added to PA/GF specimen, there was no further
improvement in the strength values, i.e. strengthening mechanism of NC were
obscured by the mechanism of 15 wt% GF.
On the other hand, when 20 wt% ADP was incorporated into PA and PA/GF, except
modulus their other mechanical properties decreased. For instance, the decrease
in tensile strength was 14% for PA and 20% for PA/GF specimen. These decreases
could be basically due to the very coarse size (42.3 µm) and rather weak organic
structure of the ADP particles. However, it is seen that, when 5 wt% of ADP was
replaced with NC, then decreased strength values of PA-ADP 20 and
PA/GF-ADP 20 increased again. Therefore, it can be concluded that 5 wt% of ADP
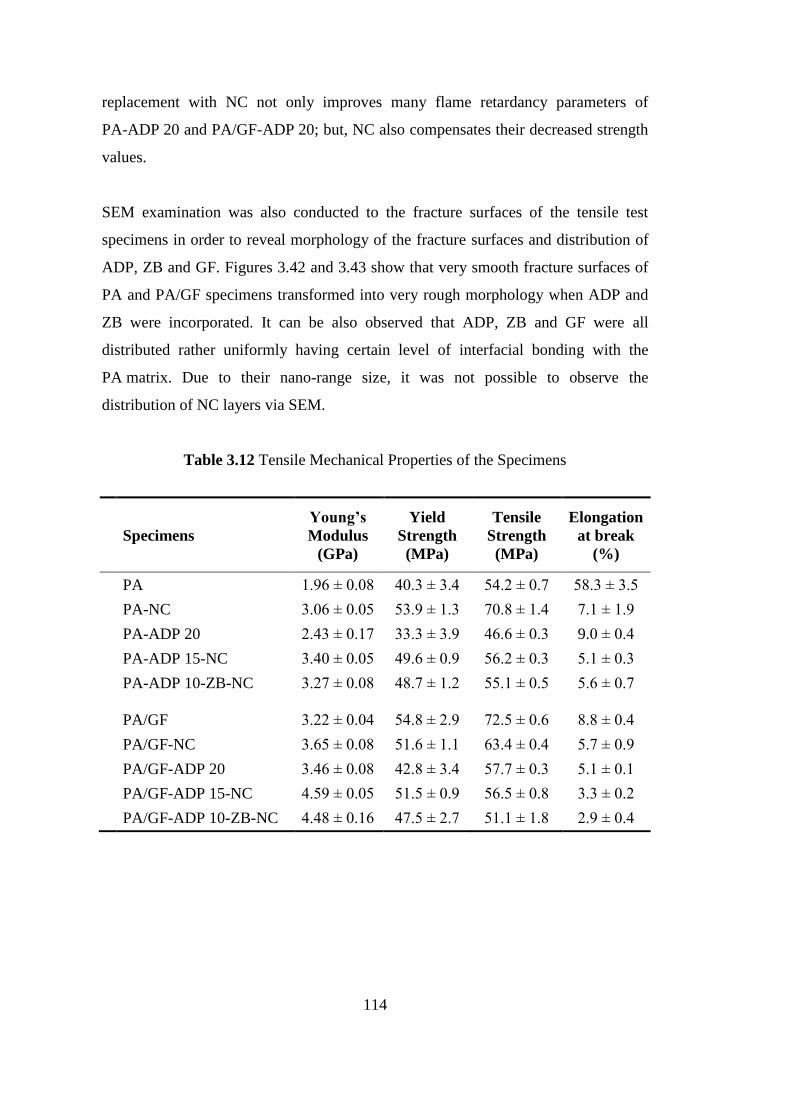
114
replacement with NC not only improves many flame retardancy parameters of
PA-ADP 20 and PA/GF-ADP 20; but, NC also compensates their decreased strength
values.
SEM examination was also conducted to the fracture surfaces of the tensile test
specimens in order to reveal morphology of the fracture surfaces and distribution of
ADP, ZB and GF. Figures 3.42 and 3.43 show that very smooth fracture surfaces of
PA and PA/GF specimens transformed into very rough morphology when ADP and
ZB were incorporated. It can be also observed that ADP, ZB and GF were all
distributed rather uniformly having certain level of interfacial bonding with the
PA matrix. Due to their nano-range size, it was not possible to observe the
distribution of NC layers via SEM.
Table 3.12 Tensile Mechanical Properties of the Specimens
Specimens
Young’s
Modulus
(GPa)
Yield
Strength
(MPa)
Tensile
Strength
(MPa)
Elongation
at break
(%)
PA 1.96 ± 0.08 40.3 ± 3.4 54.2 ± 0.7 58.3 ± 3.5
PA-NC 3.06 ± 0.05 53.9 ± 1.3 70.8 ± 1.4 7.1 ± 1.9
PA-ADP 20 2.43 ± 0.17 33.3 ± 3.9 46.6 ± 0.3 9.0 ± 0.4
PA-ADP 15-NC 3.40 ± 0.05 49.6 ± 0.9 56.2 ± 0.3 5.1 ± 0.3
PA-ADP 10-ZB-NC 3.27 ± 0.08 48.7 ± 1.2 55.1 ± 0.5 5.6 ± 0.7
PA/GF 3.22 ± 0.04 54.8 ± 2.9 72.5 ± 0.6 8.8 ± 0.4
PA/GF-NC 3.65 ± 0.08 51.6 ± 1.1 63.4 ± 0.4 5.7 ± 0.9
PA/GF-ADP 20 3.46 ± 0.08 42.8 ± 3.4 57.7 ± 0.3 5.1 ± 0.1
PA/GF-ADP 15-NC 4.59 ± 0.05 51.5 ± 0.9 56.5 ± 0.8 3.3 ± 0.2
PA/GF-ADP 10-ZB-NC 4.48 ± 0.16 47.5 ± 2.7 51.1 ± 1.8 2.9 ± 0.4
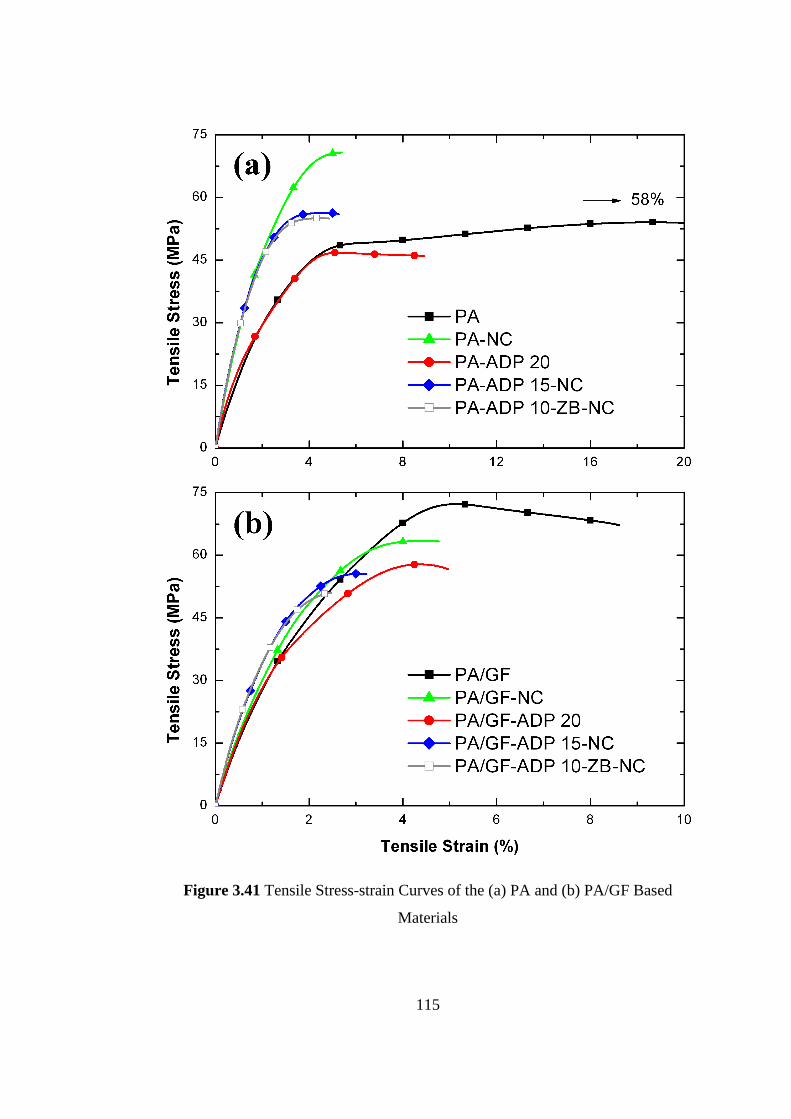
115
Figure 3.41 Tensile Stress-strain Curves of the (a) PA and (b) PA/GF Based
Materials
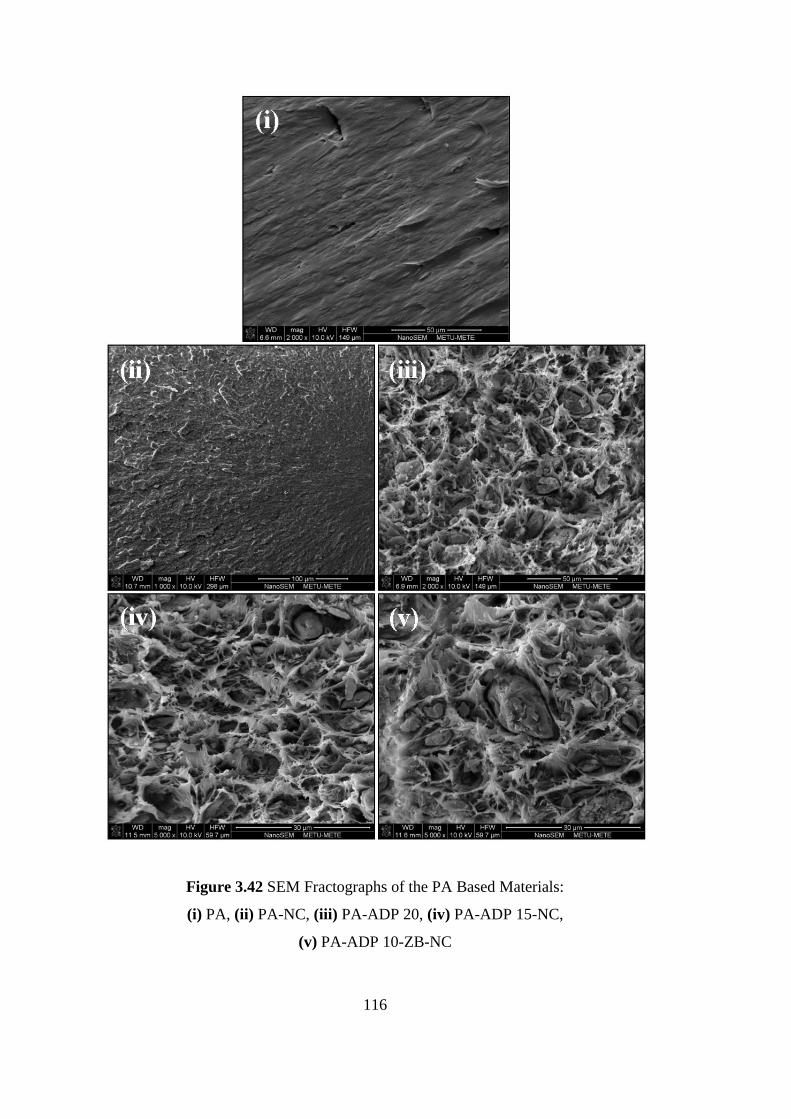
116
Figure 3.42 SEM Fractographs of the PA Based Materials:
(i) PA, (ii) PA-NC, (iii) PA-ADP 20, (iv) PA-ADP 15-NC,
(v) PA-ADP 10-ZB-NC
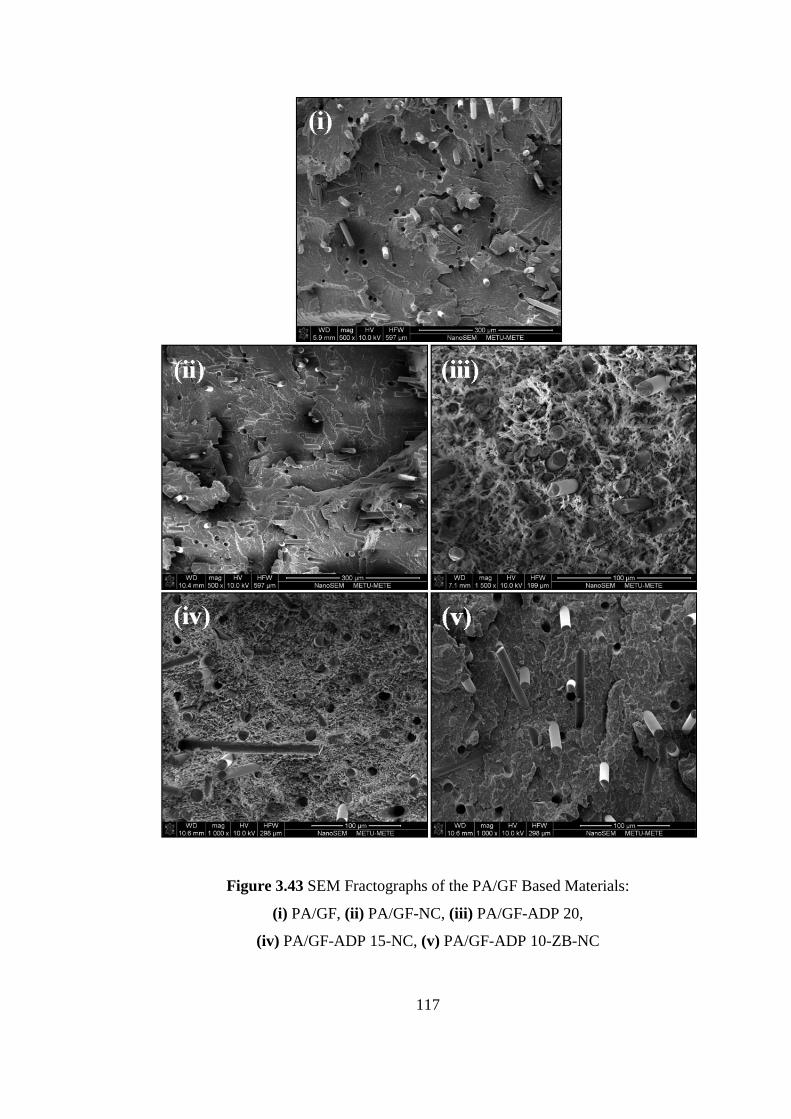
117
Figure 3.43 SEM Fractographs of the PA/GF Based Materials:
(i) PA/GF, (ii) PA/GF-NC, (iii) PA/GF-ADP 20,
(iv) PA/GF-ADP 15-NC, (v) PA/GF-ADP 10-ZB-NC

118
119
CHAPTER 4
CONCLUSIONS
The main conclusions drawn from the three different parts of this dissertation can be
summarized as follows:
(i) Effects of Zinc Borate
UL-94 vertical burning and LOI tests indicated that both in PA and PA/GF
based materials replacement of ADP with 1, 3, 5, 7 wt% ZB kept not only the
best UL-94 V-0 rating, but also resulted in slight increases in LOI values. The
highest increase in LOI value was achieved with 3 wt% ZB replacement.
MLC analyses revealed that use of ZB together with ADP resulted in
significant improvements in many cone calorimetry parameters such as
PHRR, THE, TBT, FGI, FIGRA, Char Yield, etc. For instance, when 15 wt%
ADP and 5 wt% ZB were used together, the suppression in PHRR (peak heat
release rate) value of polyamide-6 could be as much as 82%, while this
suppression was only 32% when 20 wt% ADP was used alone.
The main flame retardancy mechanism of ADP is its gaseous phase action
called “flame inhibition”, while the secondary mechanism is its condensed
phase action called “barrier effect”. The main contribution of ZB to the
barrier mechanism of ADP was the formation of additional boron phosphate
layers together with aluminum phosphate layers. Certainly, endothermic
dehydration of ZB also contributed with an additional fuel dilution
120
mechanism. These mechanisms were clarified with char examination, TGA,
XRD and evolved gas analyses.
Tensile test indicated that due to its coarse size and weaker organic structure,
ADP decreased both yield and tensile strength of the specimens. On the other
hand, due to its fine size and stronger inorganic structure, addition of ZB
resulted in improvements in the yield and tensile strength of the materials.
(ii) Effects of Boron Oxide and Boric Acid
UL-94 vertical burning and LOI tests indicated that when BO or BA were
used alone, or when certain amount of ADP was replaced with BO or BA,
UL-94 ratings were kept, but there were no further improvements in LOI
values.
MLC analyses revealed that for the PA based materials use of BO or BA
together with ADP resulted in significant improvements in many cone
calorimetry parameters such as PHRR, THE, TBT, FGI, FIGRA, Char Yield,
etc. For instance, when 17 wt% ADP were used together with 3 wt% BO or
BA, the suppression in PHRR (peak heat release rate) value of PA could be as
much as 84% or 86%, while this suppression was only 32% when 20 wt%
ADP was used alone.
On the other hand, for the PA/GF based materials, due to the high efficiency
of glass fiber reinforcements, replacements of certain amount of ADP with
BO or BA resulted in no further improvements in many cone calorimetry
parameters.
The main contribution of BO and BA to the barrier mechanism of ADP was
the formation of additional glassy boron oxide layers. Moreover, BA also has
121
the ability of formation of another additional barrier layer, i.e. boron
phosphate layers together with aluminum phosphate layers of ADP.
Certainly, endothermic dehydration reactions of BA also contributed with
an additional fuel dilution mechanism. These mechanisms were clarified with
char examination, TGA, XRD and evolved gas analyses.
Tensile tests indicated that due to the decreased chain mobility of the PA
matrix by BO, BA or ADP, elastic modulus of the specimens increased
significantly when these flame retardant were used alone or together.
However, they all resulted in substantial decreases in the tensile strength
values, especially due to the lowered efficiency of load transfer mechanism
from the matrix to these non-surface treated particles, having very low aspect
ratio, either.
(iii) Effects of Nanoclays
XRD and TEM analyses revealed that mainly intercalated and partially
exfoliated NC silicate layers can be homogeneously distributed in the PA and
PA/GF matrices.
UL-94 vertical burning and LOI tests indicated that both in PA and PA/GF
based materials, addition of 5 wt% NC alone led to no enhancements,
however, when 5 wt% of ADP was replaced with NC, then each specimen not
only kept the best UL-94 rating of V-0, but their LOI values increased by
3 %O2 further.
MLC analyses revealed that use of only 5 wt% NC alone, resulted in
significant improvements in many cone calorimetry parameters such as
PHRR, THE, TBT, FGI, FIGRA, Char Yield, etc. For instance,
the suppression in PHRR values of PA and PA/GF were 55% and 61%,
122
respectively. These suppressions were 32% and 75% when 20 wt% ADP
alone was used.
Contribution of NC silicate layers were much more significant when 5 wt%
of ADP was replaced with NC. In this case, PHRR suppressions were
as much as 65% in PA and 76% in PA/GF based materials.
Various analyses to reveal the flame retardancy mechanism of NC indicated
the formation of insulative barrier via tortuous pathway of
intercalated/exfoliated silicate layers preventing the underlying polymer from
heat and mass transfer during fire.
Tensile tests indicated that increases in the modulus and strength values of
PA by adding only 5 wt% NC were as good as by adding 15 wt% GF. It was
also seen that, all the mechanical properties lost due to the use of 20 wt%
ADP could be compensated when 15 wt% ADP was used together with
5 wt% NC.
123
REFERENCES
[1] Kroschwitz JI. "Kirk-Othmer concise encyclopedia of chemical technology".
Wiley, New York 1999.
[2] Holland BJ, Hay JN. "Thermal degradation of nylon polymers". Polymer
International 2000; (49): 943-948.
[3] Cho JW, Paul DR. "Nylon 6 nanocomposites by melt compounding". Polymer
2001; (42): 1083-1094.
[4] Kawasumi M. "The discovery of polymer-clay hybrids". Journal of Polymer
Science Part a-Polymer Chemistry 2004; (42): 819-824.
[5] Mouritz AP, Gibson AG. "Fire properties of polymer composite materials".
Springer, Dordrecht 2006.
[6] Laoutid F, Bonnaud L, Alexandre M, Lopez-Cuesta JM, Dubois P. "New
prospects in flame retardant polymer materials: From fundamentals to
nanocomposites". Materials Science & Engineering R-Reports 2009; (63): 100-125.
[7] Yang YM, Shi XC, Zhao RR. "Flame retardancy behavior of zinc borate".
Journal of Fire Sciences 1999; (17): 355-361.
[8] Wilkie CA, Morgan AB. "Fire retardancy of polymeric materials". CRC Press,
Boca Raton 2010.
[9] Gilleo KB. "Nylon flammability - effects of thiourea, ammonium sulfamate, and
halogen compounds". Industrial & Engineering Chemistry Product Research and
Development 1974; (13): 139-143.
[10] Mailhoslefievre V, Sallet D, Martel B. "Thermal-degradation of pure and flame-
retarded polyamide-11 and polyamide-12". Polymer Degradation and Stability 1989;
(23): 327-336.
124
[11] Levchik SV, Weil ED. "Combustion and fire retardancy of aliphatic nylons".
Polymer International 2000; (49): 1033-1073.
[12] Sallet D, Mailhoslefievre V, Martel B. "Flame retardancy of polyamide 11 wıth
a decabromodiphenyl-antimony trioxide mixture - a bromine-antimony-nitrogen
synergism". Polymer Degradation and Stability 1990; (30): 29-39.
[13] Fei GX, Wang Q, Liu YA. "Synthesis of novolac-based char former: Silicon-
containing phenolic resin and its synergistic action with magnesium hydroxide in
polyamide-6". Fire and Materials 2010; (34): 407-419.
[14] Fei GX, Liu Y, Wang Q. "Synergistic effects of novolac-based char former with
magnesium hydroxide in flame retardant polyamide-6". Polymer Degradation and
Stability 2008; (93): 1351-1356.
[15] Braun U, Schartel B. "Flame retardant mechanisms of red phosphorus and
magnesium hydroxide in high impact polystyrene". Macromolecular Chemistry and
Physics 2004; (205): 2185-2196.
[16] Dogan M, Yilmaz A, Bayramli E. "Effect of boron containing materials on
flammability and thermal degradation of polyamide-6 composites containing
melamine cyanurate". Polymers for Advanced Technologies 2011; (22): 560-566.
[17] Chen YH, Wang Q, Yan W, Tang HM. "Preparation of flame retardant
polyamide 6 composite with melamine cyanurate nanoparticles in situ formed in
extrusion process". Polymer Degradation and Stability 2006; (91): 2632-2643.
[18] Liu Y, Wang Q, Fei GX, Chen YH. "Preparation of polyamide resin-
encapsulated melamine cyanurate/melamine phosphate composite flame retardants
and the fire-resistance to glass fiber-reinforced polyamide 6". Journal of Applied
Polymer Science 2006; (102): 1773-1779.
[19] Levchik SV, Levchik GF, Balabanovich AI, Camino G, Costa L. "Mechanistic
study of combustion performance and thermal decomposition behaviour of nylon 6
with added halogen-free fire retardants". Polymer Degradation and Stability 1996;
(54): 217-222.
[20] Weil ED, Choudhary V. "Flame-retarding plastics and elastomers with
melamine". Journal of Fire Sciences 1995; (13): 104-126.
125
[21] Gijsman P, Steenbakkers R, Furst C, Kersjes J. "Differences in the flame
retardant mechanism of melamine cyanurate in polyamide 6 and polyamide 66".
Polymer Degradation and Stability 2002; (78): 219-224.
[22] Levchik SV, Costa L, Camino G. "Effect of the fire-retardant, ammonium
polyphosphate, on the thermal-decomposition of aliphatic polyamides: part II
polyamide 6". Polymer Degradation and Stability 1992; (36): 229-237.
[23] Levchik SV, Levchik GF, Camino G, Costa L. "Mechanism of action of
phosphorus-based flame retardants in nylon 6. II. Ammonium polyphosphate/talc".
Journal of Fire Sciences 1995; (13): 43-58.
[24] Siat C, Bourbigot S, Le Bras M. "Thermal behaviour of polyamide-6-based
intumescent formulations - a kinetic study". Polymer Degradation and Stability
1997; (58): 303-313.
[25] Levchik GF, Vorobyova SA, Gorbarenko VV, Levchik SV, Weil ED. "Some
mechanistic aspects of the fire retardant action of red phosphorus in aliphatic
nylons". Journal of Fire Sciences 2000; (18): 172-182.
[26] Chen YH, Wang Q. "Preparation, properties and characterizations of halogen-
free nitrogen-phosphorous flame-retarded glass fiber reinforced polyamide 6
composite". Polymer Degradation and Stability 2006; (91): 2003-2013.
[27] Balabanovich AI, Levchik GF, Levchik SV, Schnabel W. "Fire retardance in
polyamide-6. The effects of red phosphorus and radiation-induced cross-links". Fire
and Materials 2001; (25): 179-184.
[28] Schartel B, Kunze R, Neubert D. "Red phosphorus-control led decomposition
for fire retardant PA 66". Journal of Applied Polymer Science 2002; (83): 2060-
2071.
[29] Braun U, Schartel B, Fichera MA, Jager C. "Flame retardancy mechanisms of
aluminium phosphinate in combination with melamine polyphosphate and zinc
borate in glass-fibre reinforced polyamide 6,6". Polymer Degradation and Stability
2007; (92): 1528-1545.
[30] Braun U, Bahr H, Schartel B. "Fire retardancy effect of aluminium phosphinate
and melamine polyphosphate in glass fibre reinforced polyamide 6". E-Polymers
2010.
126
[31] Hu Z, Lin GP, Chen L, Wang YZ. "Flame retardation of glass-fiber-reinforced
polyamide 6 by combination of aluminum phenylphosphinate with melamine
pyrophosphate". Polymers for Advanced Technologies 2011; (22): 1166-1173.
[32] Zhao B, Chen L, Long JW, Chen HB, Wang YZ. "Aluminum hypophosphite
versus alkyl-substituted phosphinate in polyamide 6: Flame retardance, thermal
degradation, and pyrolysis behavior". Industrial & Engineering Chemistry Research
2013; (52): 2875-2886.
[33] Isitman NA, Gunduz HO, Kaynak C. "Halogen-free flame retardants that
outperform halogenated counterparts in glass fiber reinforced polyamides". Journal
of Fire Sciences 2010; (28): 87-100.
[34] Braun U, Schartel B. "Flame retardancy mechanisms of aluminium phosphinate
in combination with melamine cyanurate in glass-fibre-reinforced poly(1,4-butylene
terephthalate)". Macromolecular Materials and Engineering 2008; (293): 206-217.
[35] Gao M, Nyu JC, Yang RJ. "Synergism of GUP and boric acid characterized by
cone calorimetry and thermogravimetry". Journal of Fire Sciences 2006; (24): 499-
511.
[36] Nyambo C, Kandare E, Wilkie CA. "Thermal stability and flammability
characteristics of ethylene vinyl acetate (EVA) composites blended with a phenyl
phosphonate-intercalated layered double hydroxide (LDH), melamine polyphosphate
and/or boric acid". Polymer Degradation and Stability 2009; (94): 513-520.
[37] Demirel M, Pamuk V, Dilsiz N. "Investigation of flame retardancy and physical-
mechanical properties of zinc borate/boric acid polyester composites". Journal of
Applied Polymer Science 2010; (115): 2550-2555.
[38] Xie KL, Gao AQ, Zhang YS. "Flame retardant finishing of cotton fabric based
on synergistic compounds containing boron and nitrogen". Carbohydrate Polymers
2013; (98): 706-710.
[39] Mulazim Y, Kizilkaya C, Kahraman MV. "Thermal and neutron shielding
properties of (B2O3)-B-10/polyimide hybrid materials". Polymer Bulletin 2011; (67):
1741-1750.
127
[40] Ibibikcan E, Kaynak C. "Usability of three boron compounds for enhancement
of flame retardancy in polyethylene-based cable insulation materials". Journal of
Fire Sciences 2014; (32): 99-120.
[41] Manias E, Touny A, Wu L, Strawhecker K, Lu B, Chung TC.
"Polypropylene/montmorillonite nanocomposites. Review of the synthetic routes and
materials properties". Chemistry of Materials 2001; (13): 3516-3523.
[42] Morgan AB. "Flame retarded polymer layered silicate nanocomposites: A
review of commercial and open literature systems". Polymers for Advanced
Technologies 2006; (17): 206-217.
[43] Zhu J, Start P, Mauritz KA, Wilkie CA. "Thermal stability and flame retardancy
of poly(methyl methacrylate)-clay nanocomposites". Polymer Degradation and
Stability 2002; (77): 253-258.
[44] Ahmadi SJ, Huang YD, Li W. "Synthetic routes, properties and future
applications of polymer-layered silicate nanocomposites". Journal of Materials
Science 2004; (39): 1919-1925.
[45] Qin HL, Su QS, Zhang SM, Zhao B, Yang MS. "Thermal stability and
flammability of polyamide 66/montmorillonite nanocomposltes". Polymer 2003;
(44): 7533-7538.
[46] Devaux E, Rochery M, Bourbigot S. "Polyurethane/clay and polyurethane/POSS
nanocomposites as flame retarded coating for polyester and cotton fabrics". Fire and
Materials 2002; (26): 149-154.
[47] Camino G, Tartaglione G, Frache A, Manferti C, Costa G. "Thermal and
combustion behaviour of layered silicate-epoxy nanocomposites". Polymer
Degradation and Stability 2005; (90): 354-362.
[48] Shi Y, Kashiwagi T, Walters RN, Gilman JW, Lyon RE, Sogah DY. "Ethylene
vinyl acetate/layered silicate nanocomposites prepared by a surfactant-free method:
Enhanced flame retardant and mechanical properties". Polymer 2009; (50): 3478-
3487.
[49] Zhang HF, Wang YQ, Wu YP, Zhang LQ, Yang J. "Study on flammability of
montmorillonite/styrene-butadiene rubber (SBR) nanocomposites". Journal of
Applied Polymer Science 2005; (97): 844-849.
128
[50] Pereira CMC, Herrero M, Labajos FM, Marques AT, Rives V. "Preparation and
properties of new flame retardant unsaturated polyester nanocomposites based on
layered double hydroxides". Polymer Degradation and Stability 2009; (94): 939-946.
[51] Kashiwagi T, Harris RH, Zhang X, Briber RM, Cipriano BH, Raghavan SR,
Awad WH, Shields JR. "Flame retardant mechanism of polyamide 6-clay
nanocomposites". Polymer 2004; (45): 881-891.
[52] Shanmuganathan K, Deodhar S, Dembsey N, Fan QG, Calvert PD, Warner SB,
Patra PK. "Flame retardancy and char microstructure of nylon-6/layered silicate
nanocomposites". Journal of Applied Polymer Science 2007; (104): 1540-1550.
[53] Samyn F, Bourbigot S, Jama C, Bellayer S. "Fire retardancy of polymer clay
nanocomposites: Is there an influence of the nanomorphology?". Polymer
Degradation and Stability 2008; (93): 2019-2024.
[54] Jang BN, Wilkie CA. "The effect of clay on the thermal degradation of
polyamide 6 in polyamide 6/clay nanocomposites". Polymer 2005; (46): 3264-3274.
[55] Bourbigot S, Samyn F, Turf T, Duquesne S. "Nanomorphology and reaction to
fire of polyurethane and polyamide nanocomposites containing flame retardants".
Polymer Degradation and Stability 2010; (95): 320-326.
[56] Beyer G. "Flame retardant properties of EVA-nanocomposites and
improvements by combination of nanofillers with aluminium trihydrate". Fire and
Materials 2001; (25): 193-197.
[57] Yen YY, Wang HT, Guo WJ. "Synergistic flame retardant effect of metal
hydroxide and nanoclay in EVA composites". Polymer Degradation and Stability
2012; (97): 863-869.
[58] Kaynak C, Ibibikcan E. "Contribution of nanoclays to the flame retardancy of
polyethylene-based cable insulation materials with aluminum hydroxide and zinc
borate". Journal of Fire Sciences 2014; (32): 121-144.
[59] Isitman NA, Sipahioglu BM, Kaynak C. "Nanomorphology and fire behavior of
polystyrene/organoclay nanocomposites containing brominated epoxy and antimony
oxide". Polymers for Advanced Technologies 2012; (23): 984-991.
129
[60] Chang LN, Jaafar M, Chow WS. "Thermal behavior and flammability of
epoxy/glass fiber composites containing clay and decabromodiphenyl oxide".
Journal of Thermal Analysis and Calorimetry 2013; (112): 1157-1164.
[61] Ma HY, Tong LF, Xu ZB, Fang ZP. "Intumescent flame retardant-
montmorillonite synergism in ABS nanocomposites". Applied Clay Science 2008;
(42): 238-245.
[62] Zhang J, Lewin M, Pearce E, Zammarano M, Gilman JW. "Flame retarding
polyamide 6 with melamine cyanurate and layered silicates". Polymers for Advanced
Technologies 2008; (19): 928-936.
[63] Yang W, Kan YC, Song L, Hu Y, Lu HD, Yuen RKK. "Effect of organo-
modified montmorillonite on flame retardant poly(1,4-butylene terephthalate)
composites". Polymers for Advanced Technologies 2011; (22): 2564-2570.
[64] Lei S, Yuan H, Lin ZH, Xuan SY, Wang SF, Chen ZY, Fan WC. "Preparation
and properties of halogen-free flame-retarded polyamide 6/organoclay
nanocomposite". Polymer Degradation and Stability 2004; (86): 535-540.
[65] Fang KY, Li JA, Ke CH, Hu QL, Tao K, Zhu J, Yan Q. "Intumescent flame
retardation of melamine-modified montmorillonite on polyamide 6: Enhancement of
condense phase and flame retardance". Polymer Engineering and Science 2011; (51):
377-385.
[66] Tai QL, Yuen RKK, Yang W, Qiao ZH, Song L, Hu Y. "Iron-montmorillonite
and zinc borate as synergistic agents in flame-retardant glass fiber reinforced
polyamide 6 composites in combination with melamine polyphosphate". Composites
Part a-Applied Science and Manufacturing 2012; (43): 415-422.
[67] Bourbigot S, Duquesne S, Fontaine G, Bellayer S, Turf T, Samyn F.
"Characterization and reaction to fire of polymer nanocomposites with and without
conventional flame retardants". Molecular Crystals and Liquid Crystals 2008; (486):
1367-1381.
[68] Isitman NA, Gunduz HO, Kaynak C. "Nanoclay synergy in flame retarded/glass
fibre reinforced polyamide 6". Polymer Degradation and Stability 2009; (94): 2241-
2250.
130
[69] Dahiya JB, Rathi S, Bockhorn H, Haussmann M, Kandola BK. "The combined
effect of organic phoshphinate/ammonium polyphosphate and pentaerythritol on
thermal and fire properties of polyamide 6-clay nanocomposites". Polymer
Degradation and Stability 2012; (97): 1458-1465.
[70] Dogan M, Bayramli E. "The flame retardant effect of aluminum phosphinate in
combination with zinc borate, borophosphate, and nanoclay in polyamide-6". Fire
and Materials 2014; (38): 92-99.
131
CURRICULUM VITAE
Osman POLAT
Ankara / Turkey
E-mail : [email protected] or [email protected]
EDUCATION
2008-2014 Ph.D. Polymer Science and Technology,
Middle East Technical University
Thesis title: “Contribution Of Boron Compounds And Nanoclays
On The Flame Retardancy Of Aluminium Diethylphosphinate In
Neat And Fiber Reinforced Polyamide-6”
Thesis advisor: Prof. Dr. Cevdet KAYNAK
2004-2007 MBA
İstanbul Bilgi University
“Risk Management in Manufacturing : An Analysis of Managing the
Investment Projects”
Thesis advisor: Dr. Murat YÜCELEN
1996-1999 M.Sc. Polymer Science and Technology,
Middle East Technical University
Thesis title: “Flame Retardant and Water Dispersed Polyurethane
Paints”
Thesis advisor: Prof. Dr. Leyla ARAS, Prof. Dr. Güngör GÜNDÜZ
1986-1992 B.S. Chemical Engineering,
Hacettepe University
132
EXPERIENCES
2012-2013 Quality Manager
Pakpen A.Ş.
2009-2011 Project Assistant
“Widespread Utilization of Turkish Boron Compounds as Flame
Retardant Additives in Plastic and Composites”
National Boron Research Institute (Boren) and
Middle East Technical University Research Project
(Proje No : 2009-Ç-0236)
2007-2008 World Class Manufacturing (WCM) Department Responsible
Saint-Gobain Rigips
2000-2005 Specialist Researcher and Process Engineer at R&D
Aksa Akrilik Kimya San. A.Ş.
PUBLICATIONS
(a) SCI Articles
1. Polat O. and Kaynak C., “Effects of zinc borate on the flame retardancy
performance of aluminum diethylphosphinate in polyamide-6 and its fiber reinforced
composite”, Fire Safety Journal, (2014 , under review).
2. Polat O. and Kaynak C., “Use of boron oxide and boric acid to improve flame
retardancy of an organophosphorus compound in neat and fiber reinforced
polyamide-6”, Journal of Vinyl and Additive Technology, (accepted in August 2014,
available online, DOI: 10.1002/vnl.21445).
133
3. Kaynak C. and Polat O. “Influences of nanoclays on the flame retardancy of fiber
filled and unfilled polyamide-6 with and without aluminum diethylphosphinate”,
Journal of Fire Sciences, (accepted in September 2014, available online,
DOI: 10.1177/0734904114555961).
4. Çelebi F., Polat O., Aras L., Gündüz G., and Akhmedov İ.M., “Synthesis and
characterization of water-dispersed flame-retardant polyurethane resin using
phosphorous-containing chain extender,” Journal of Applied Polymer Science, 2004
(91), 1314-1321.
(b) Conference Proceeding
1. Polat O., Kaynak C., “Synergistic Effects of Boron Compounds on the
Flammability of Polyamide 6 with Organic Phosphorous Flame Retardant”,
17 th International Symposium on Boron, Borides and Related Materials, Sep. 11-17,
2011, İstanbul, pp.131.
2. Polat O., Aras L., Gündüz G. and Mecidoğlu İ., “Flame-retardant water dispersed
polyurethane paint production”, Proceeds of 3 th International Paint, Varnish, Ink,
and Auxiliary Products Industry Conference and Exhibit, Nov. 11-13, 1999, İstanbul,
pp.153-167.
3. Polat O., Aras L., Gündüz G. and Mecidoğlu İ., “Flame Retardant Paint-Synthesis
and Characterization”. SCI Fire Chemistry Discussion Group, 1, 1999, pp.40.