Embed Size (px)
Citation preview

Contrasting Essay Scoring 1
Running head: CONTRASTING ESSAY SCORING
Contrasting State-of-the-Art Automated Scoring of Essays: Analysis
Mark D. Shermis
The University of Akron
Ben Hamner
Kaggle

Contrasting Essay Scoring 2
Abstract
This study compared the results from nine automated essay scoring engines on eight
essay scoring prompts drawn from six states that annually administer high-stakes writing
assessments. Student essays from each state were randomly divided into three sets: a training set
(used for modeling the essay prompt responses and consisting of text and ratings from two
human raters along with a final or resolved score), a second test set used for a blind test of the
vendor-developed model (consisting of text responses only), and a validation set that was not
employed in this study. The essays encompassed writing assessment items from three grade
levels (7, 8, 10) and were evenly divided between source-based prompts (i.e., essay prompts
developed on the basis of provided source material) or those drawn from traditional writing
genre (i.e., narrative, descriptive, persuasive). The total sample size was N = 22,029.
Six of the eight essays were transcribed from their original handwritten responses using
two transcription vendors. Transcription accuracy rates were computed at 98.70% for 17,502
essays. The remaining essays were typed in by students during the actual assessment and
provided in ASCII form. Seven of the eight essays were holistically scored and one employed
score assignments for two traits. Scale ranges, rubrics, and scoring adjudications for the essay
sets were quite variable. Results were presented on distributional properties of the data (mean
and standard deviation) along with traditional measures used in automated essay scoring: exact
agreement, exact+adjacent agreement, kappa, quadratic-weighted kappa, and the Pearson r. The
results demonstrated that overall, automated essay scoring was capable of producing scores
similar to human scores for extended-response writing items with equal performance for both
source-based and traditional writing genre. Because this study incorporated already existing data

Contrasting Essay Scoring 3
(and the limitations associated with them), it is highly likely that the estimates provided represent
a floor for what automated essay scoring can do under operational conditions.
A Wordle for Essay Set #1 Used in this Study (Source: www.wordle.net)

Contrasting Essay Scoring 4
Contrasting State-of-the-Art Automated Scoring of Essays: Analysis
Introduction
With the press for developing innovative assessments that can accommodate higher-order
thinking and performances associated with the Common Core Standards, there is a need to
systematically evaluate the benefits and features of automated essay scoring (AES). While the
developers of AES engines have published an impressive body of literature to suggest that the
measurement technology can produce reliable and valid essay scores [when compared with
trained human raters; (Attali & Burstein, 2006; Shermis, Burstein, Higgins, & Zechner, 2010)],
comparisons across the multiple platforms have been informal, involved less-than-ideal sample
essays, and were often associated with an incomplete criterion set.
The purpose of this paper is to present the results of a comparison of nine AES engines
on responses to a range of prompts, with some targeting content and others relatively content-
free, from multiple grades. The AES engines were compared on the basis of scores from
independent raters using state-developed writing assessment rubrics. This study was shaped by
the two major consortia associated with implementing the Common Core Standards, the
Partnership for Assessment of Readiness for College and Careers (PARCC) and SMARTER
Balanced Assessment Consortium (SMARTER Balanced), as part of their investigation into the
viability of using AES for their new generation of assessments.
Comprehensive independent studies of automated essay scoring platforms have been rare.
Rudner, Garcia, & Welch (2006) conducted a two-part independent evaluation of one vendor of
automated essays scoring, Intellimetric by Vantage Learning. After reviewing data drawn from
the Graduate Management Admission Test™, the investigators concluded, “the IntelliMetric
system is a consistent, reliable system for scoring AWA (Analytic Writing Assessment) essays.”
While such individual endorsements are heartening, there has yet to be a comprehensive look at
Contrasting Essay Scoring 5
machine scoring technology. This is particularly important as the assessments for the Common Core
Standards are under development. In part, this vendor demonstration was designed to evaluate the
degree to which current high-stakes writing assessments, and those envisioned under the Common
Core Standards, might be scored through automated methods.
This study was the first phase of a three-part evaluation. Phase I examines the machine
scoring capabilities for extended-response essays, and consists of two parts. The first part reports on
the capabilities of already existing commercial machine scoring systems. Running concurrently with
the vendor demonstration is a public competition in which the study sponsor (The William and Flora
Hewlett Foundation) provides cash prizes for newly-developed scoring engines created by
individuals or teams. Phase II will do the same thing for short-answer constructed responses followed
with an evaluation of math items (i.e., proofs, graphs, formulas) for Phase III.
Participants
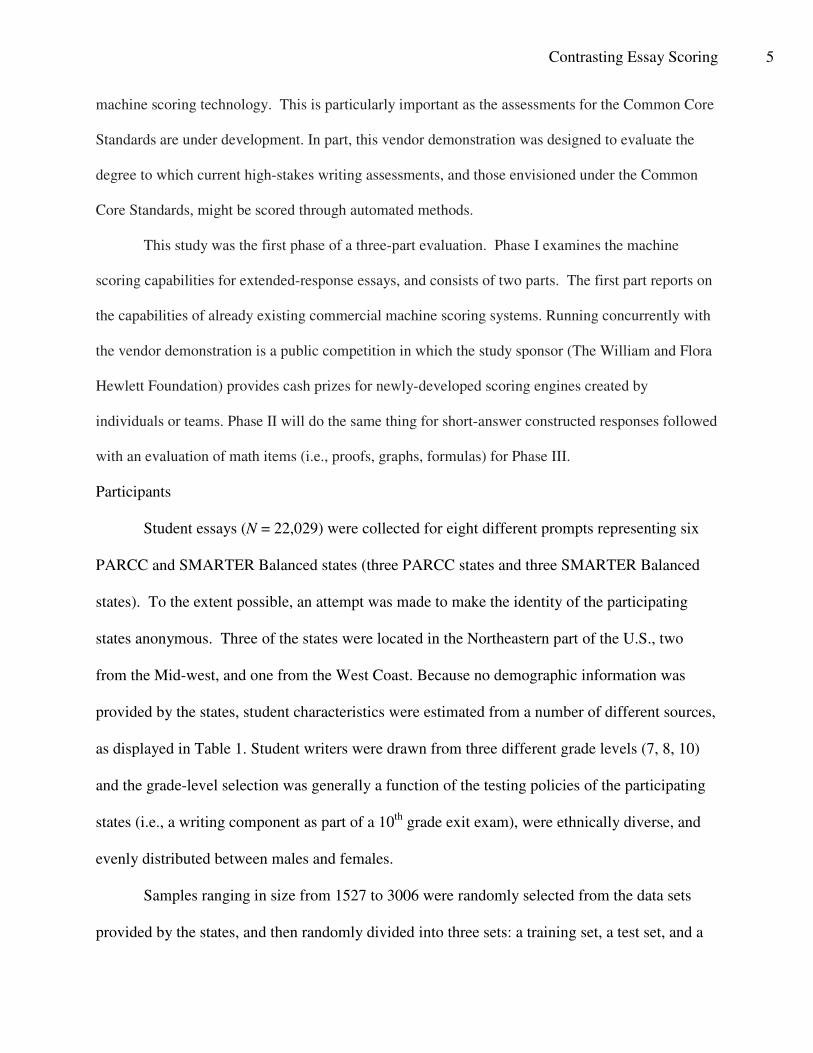
Student essays (N = 22,029) were collected for eight different prompts representing six
PARCC and SMARTER Balanced states (three PARCC states and three SMARTER Balanced
states). To the extent possible, an attempt was made to make the identity of the participating
states anonymous. Three of the states were located in the Northeastern part of the U.S., two
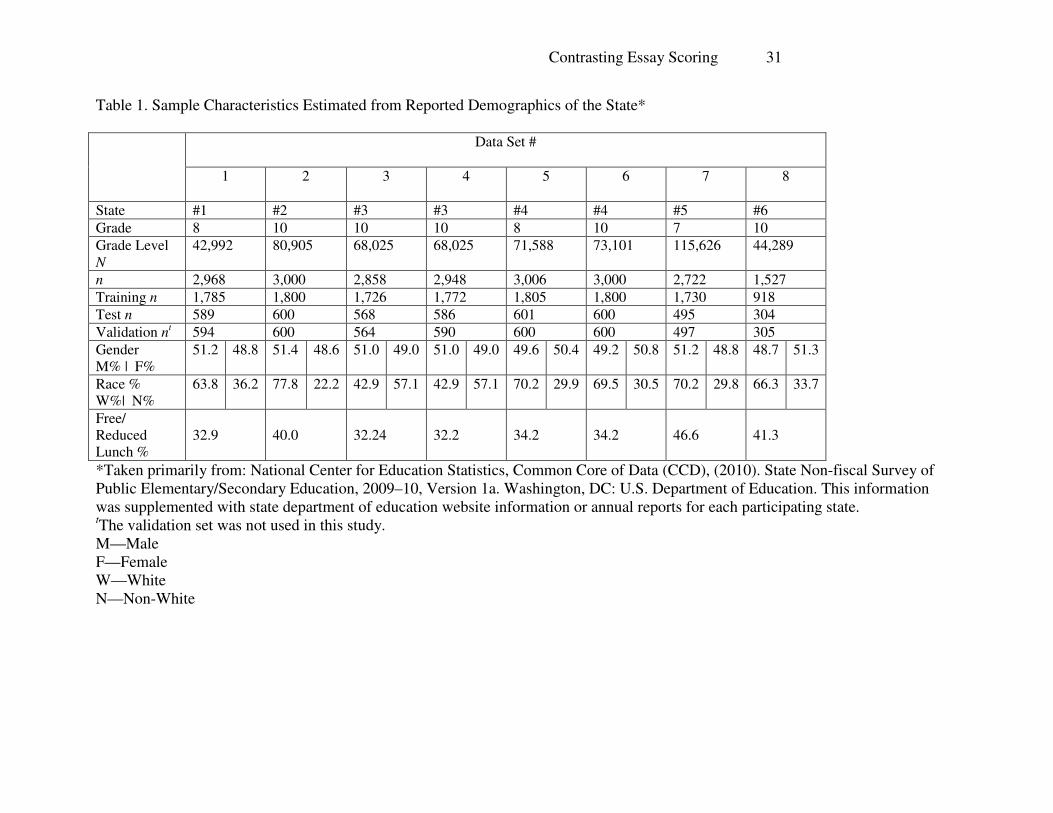
from the Mid-west, and one from the West Coast. Because no demographic information was
provided by the states, student characteristics were estimated from a number of different sources,
as displayed in Table 1. Student writers were drawn from three different grade levels (7, 8, 10)
and the grade-level selection was generally a function of the testing policies of the participating
states (i.e., a writing component as part of a 10th
grade exit exam), were ethnically diverse, and
evenly distributed between males and females.
Samples ranging in size from 1527 to 3006 were randomly selected from the data sets
provided by the states, and then randomly divided into three sets: a training set, a test set, and a

Contrasting Essay Scoring 6
validation set. The training set was used by the vendors to create their scoring models, and
consisted of scores assigned by at least two human raters, a final or adjudicated score, and the
text of the essay. The test set consisted of essay text only and was used as part of a blind test for
the score model predictions. The purpose of the second test set was to calculate scoring engine
performance for a public competition that was launched at approximately the same time as the
vendor demonstration. It was also to be used as a test set for any of the commercial vendors who
might have subsequently elected to participate in the public competition. The second test set
consisted of essay text only. The distribution of the samples was split in the following
proportions: 60% training sample, 20% test sample, 20% second test sample. The actual
proportions vary slightly due to the elimination of cases containing either data errors or text
anomalies. The distribution of the samples is displayed in Table 1.
Instruments
Four of the essays were drawn from traditional writing genre (persuasive, expository,
narrative) and four essays were “source-based”, that is, the questions asked in the prompt
referred to a source document that students read as part of the assessment. Appendix A lists the
prompts, scoring rubrics for raters, adjudication guidelines, and reading material for the source-
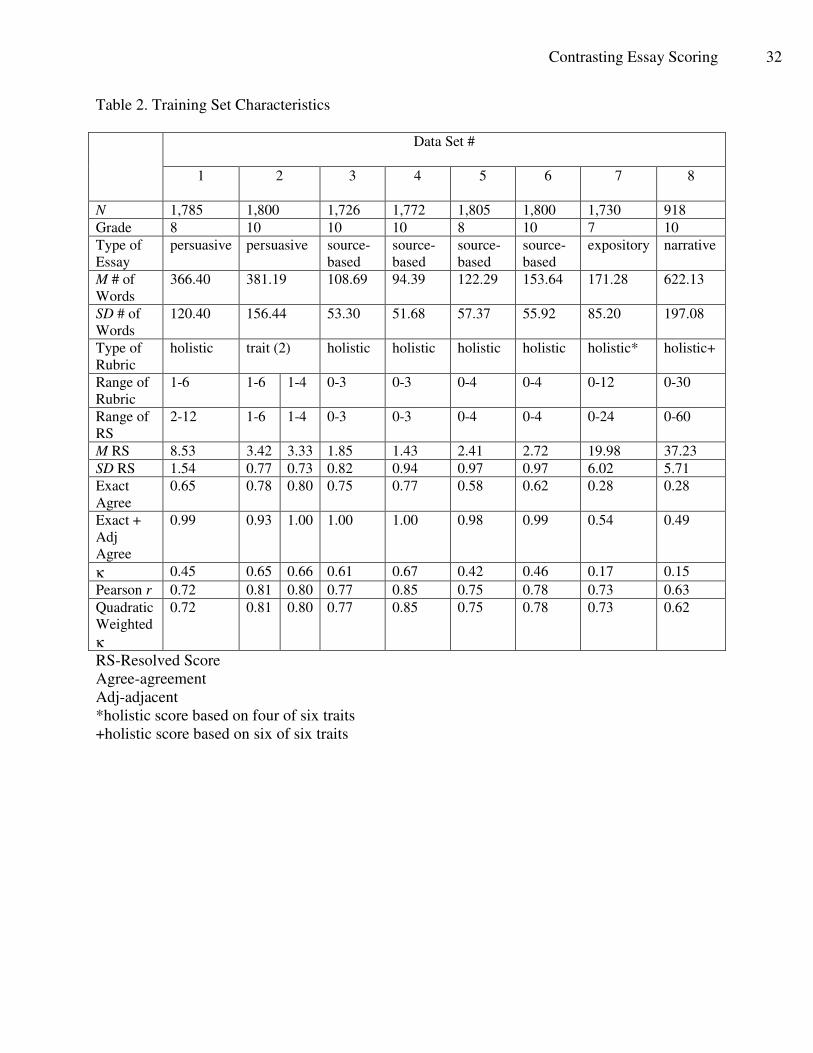
based essays. In the training set, average essay lengths varied from M = 94.39 (SD = 51.68) to M
= 622.24 (SD =197.08), Traditional essays were significantly longer (M = 354.18, SD 197.63)
than source-based essays (M = 119.97, SD = 58.88; t (13334) = 95.18, p < .05).
Five of the prompts employed a holistic scoring rubric, one prompt was scored with a
two-trait rubric, and two prompts were scored with a multi-trait rubric, but reported as a holistic
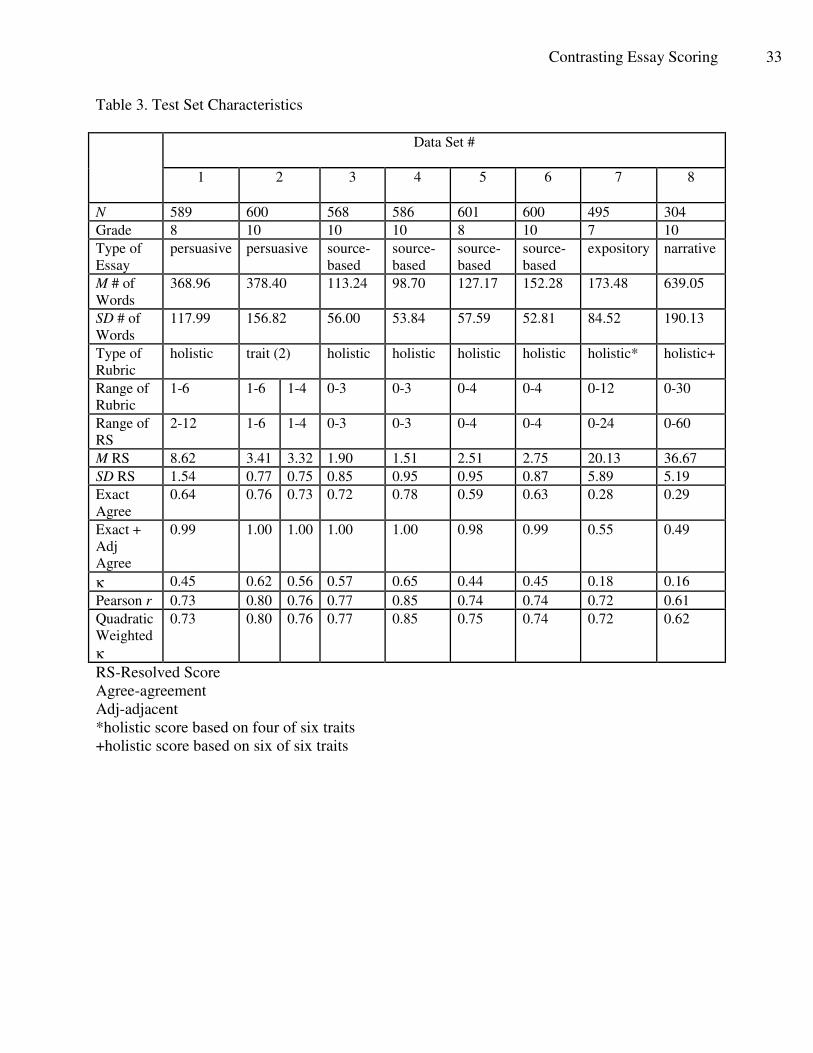
score. The type of rubric, scale ranges, scale means and standard deviations, are reported in
Tables 2 and 3. Table 2 shows the characteristics of the training set and Table 3 shows the

Contrasting Essay Scoring 7
characteristics of the test set. Human rater agreement information is reported in Tables 2 and 3
with associated data for exact agreement, exact+adjacent agreement, kappa, Pearson r, and
quadratic-weighted kappa. Quadratic-weighted kappas ranged from 0.66 to 0.85, a typical range
for human rater performance in statewide high-stakes testing programs.
Procedure
Six of the essays sets were transcribed from their original paper-form administration in
order to prepare them for processing by automated essay scoring engines. At a minimum, the
scoring engines require the essays to be in ASCII format. This process involved retrieving the
scanned copies of essays from the state or a vendor serving the state, randomly selecting a
sample of essays for inclusion in the study, and then sending the selected documents out for
transcription.
Both the scanning and transcription steps had the potential to introduce errors into the
data that would have been minimized had the essays been directly typed into the computer by the
student, the normal procedure for automated essay scoring. Essays were scanned on high quality
digital scanners, but occasionally student writing was illegible because the original paper
document was written with an instrument that was too light to reproduce well, was smudged, or
included handwriting that was undecipherable. In such cases, or if the essay could not be scored
by human raters (i.e., essay was off-topic or inappropriate), the essay was eliminated from the
analyses. Transcribers were instructed to be as faithful to the written document as possible
keeping in mind the extended computer capabilities had they been employed. For example, more
than a few students hand-wrote their essays using a print style in which all letters were
capitalized. To address this challenge, we instructed the transcribers to capitalize beginning of
sentences, proper names, etc. This modification may have corrected errors that would have

Contrasting Essay Scoring 8
otherwise been made, but limited the over-identification of capitalization errors that might have
been made otherwise by the automated essay scoring engines.
The first transcription company serviced four prompts from three states and included
11,496 essays. In order to assess the potential impact of transcription errors, a random sample of
588 essays was re-transcribed and compared on the basis of punctuation, capitalization,
misspellings, and skipped data. Accuracy was calculated on the basis of the number of
characters and the number of words with an average rate of 98.12%. The second transcription
company was evaluated using similar metrics. From a pool of 6006 essays, a random sample of
300 essays was selected for re-transcription. Accuracy for this set of essays was calculated to be
99.82%.
Two of the essays were provided in ASCII format by their respective states. The 10th
grade students in those states had typed their responses directly into the computer using web-
based software that emulated a basic word processor. Except that the test had been administered
by a computer, the conditions for testing were similar to those in states where the essays had
been transcribed.
One of the key challenges to both sets of data, those that were transcribed and those that
were directly typed, was that carriage returns and paragraph formatting meta-tags were missing
from the ASCII text. For some of the scoring engines, this omission could have introduced a
significant impediment in the engine’s ability to accurately evaluate the underlying structure of
the writing, one component in their statistical prediction models. Other than asking each student
to retype their original answers into the data sets, there was no way to ameliorate this.
Vendors were provided a training set for each of the eight essay prompts. Up to four
weeks were allowed to statistically model the data during the “training” phase of the

Contrasting Essay Scoring 9
demonstration. In addition, vendors were provided with cut-score information along with any
scoring guides that were used in the training of human raters. This supplemental information was
employed by some of the vendors to better model score differences for the score points along the
state rubric continuum. Two of the essay prompts used trait rubrics to formulate a holistic score
by summing some or all of the trait scores. For these two essays, both the holistic and trait scores
were provided to the vendors.
During the training period, a series of conference calls, with detailed questions and
answers, were conducted to clarify the nature of the data sets or to address data problems that
arose while modeling the data. For example, the guidelines from one state indicated that the
final or resolved score was to be the higher of the two rater scores, but in several cases this was
not the case. Rather than modify the resolved score, the vendors were instructed to use it in their
prediction models even though it was apparently inconsistent with the state’s guidelines.
This operational decision had the potential to negatively impact the scoring engines’
reported capacity to adequately model what the state was trying to accomplish in assigning
scores to essays. However, it is acceptable, adding to the robustness of whatever results were
obtained, since the study was designed to test how vendors would perform when applying their
scoring engines to state-generated data under pragmatic conditions. Stated somewhat differently
the consideration of these inconsistencies provided a representation of the typical contextual
conditions within which the scoring engines were actually employed.
In the “test” phase of the evaluation, vendors were provided data sets that had only the
text of essays associated with them, and were asked to make integer score predictions for each
essay. They were given a 59-hour period in which to make their predictions and were permitted
to eliminate up to 2% of the essay score predications in each data set in case their scoring engine

Contrasting Essay Scoring 10
classified the essay as “unscorable”. Even though human raters had successfully rated all the
essays in the test set, there were a variety of reasons that any one essay might prove problematic
for machine scoring. For example, an essay might have addressed the prompt in a unique
enough way to receive a low human score, but be deemed as “off topic” for machine scoring. In
real-life situations provisions would be made for these to be scored by human raters.
Procedure-Scoring Engines
Eight of the nine automated essay scoring engines that were evaluated in the
demonstration represented commercial entities and captured over 97% of the current automated
scoring market in the United States. The lone non-commercial scoring engine was invited into
the demonstration because it was an already existing open-source package that was publicly
available on their web site. Below are short descriptions of each engine. A more extensive
description can be found in a report to the William and Flora Hewlett Foundation.
AutoScore, American Institutes for Research (AIR)
Autoscore is an essay scoring engine developed by the American Institutes for Research.
The engine is designed to create a statistical proxy for prompt-specific rubrics. The rubrics may
be single or multiple trait rubrics. A training set, including known, valid scores, is required to
train the engine.
The system takes a series of measures on each essay in the remaining training set. These
measures include:
• semantic measures based on the concepts that discriminate between high- and low-
scoring papers,
• other semantic measures that indicate the coherence of concepts within and across
paragraphs, and
Contrasting Essay Scoring 11
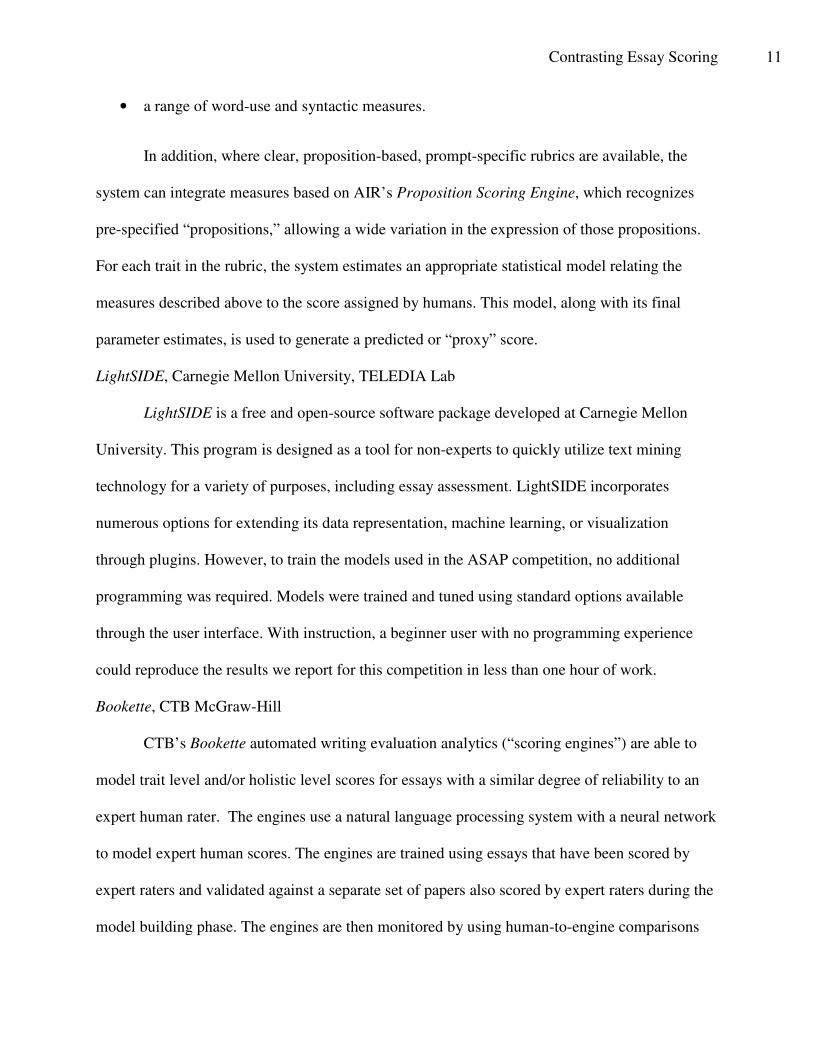
• a range of word-use and syntactic measures.
In addition, where clear, proposition-based, prompt-specific rubrics are available, the
system can integrate measures based on AIR’s Proposition Scoring Engine, which recognizes
pre-specified “propositions,” allowing a wide variation in the expression of those propositions.
For each trait in the rubric, the system estimates an appropriate statistical model relating the
measures described above to the score assigned by humans. This model, along with its final
parameter estimates, is used to generate a predicted or “proxy” score.
LightSIDE, Carnegie Mellon University, TELEDIA Lab
LightSIDE is a free and open-source software package developed at Carnegie Mellon
University. This program is designed as a tool for non-experts to quickly utilize text mining
technology for a variety of purposes, including essay assessment. LightSIDE incorporates
numerous options for extending its data representation, machine learning, or visualization
through plugins. However, to train the models used in the ASAP competition, no additional
programming was required. Models were trained and tuned using standard options available
through the user interface. With instruction, a beginner user with no programming experience
could reproduce the results we report for this competition in less than one hour of work.
Bookette, CTB McGraw-Hill
CTB’s Bookette automated writing evaluation analytics (“scoring engines”) are able to
model trait level and/or holistic level scores for essays with a similar degree of reliability to an
expert human rater. The engines use a natural language processing system with a neural network
to model expert human scores. The engines are trained using essays that have been scored by
expert raters and validated against a separate set of papers also scored by expert raters during the
model building phase. The engines are then monitored by using human-to-engine comparisons

Contrasting Essay Scoring 12
during the implementation phase for uses in which students are scored “live’” for accountability
purposes.
CTB has been using automated writing evaluation in large scale accountability testing
contexts since 2009 and in classroom settings since 2005. CTB has expertise in building prompt-
specific and generic engines. Prompt-specific engines have demonstrated high fidelity to human
scoring on a prompt-by-prompt basis, but they may only be reliably used with the particular
prompt for which they have been trained. Generic engines, on the other hand, are not quite as
reliable as prompt-specific engines, but they generalize to a variety of prompts, thereby allowing
them to be more flexibly used in the classroom. Their technology when applied in the classroom
for formative purposes provides both holistically and trait level performance feedback through
the use of the information found in the scoring rubric and through feedback on grammar,
spelling, and conventions at the sentence level.
CTB’s Bookette engines operate on approximately 90 text-features classified as
structural-, syntactic-, semantic-, and mechanics-based. Most commonly, the features are used to
model trait level scores which may be reported separately and/or combined to produce a total
writing score. The analytic scoring guide underlies the CTB system produces integer scores
(ranging from 1 to 6 points) based on well-recognized traits of effective writing: Organization,
Development, Sentence Structure, Word Choice/Grammar Usage, Mechanics.
e-rater®
, Educational Testing Service
The e-rater®
scoring engine is an automated scoring system designed to evaluate essay
quality. The system scores essays based on dozens of features, each of which is designed to
measure specific aspects of essay quality. These features are derived using a variety of
techniques from a subfield of artificial intelligence called natural language processing. Some
Contrasting Essay Scoring 13
of these techniques are based on linguistic analysis and others from empirical modeling using
statistical techniques from several fields of study, while others are developed on the basis of
hybrid approaches. These features form the basis for performance feedback to students in
learning environments through products such as Criterion, a learning tool for writing in a
classroom setting (www.ets.org/criterion). These features are grouped together into conceptually
similar sets to comprise blocks of features covering major areas of writing, including grammar,
usage, mechanics, style, organization and development, lexical complexity and content
relevance. These feature sets are the basis for the production of essay scores and are typically
calibrated on a provided set of human scores to produce statistically optimal weights for score
production.
The scores from e-rater are not only used in learning environments, but also for scoring
practice tests, placement tests and in high-stakes assessment. In 1999 the scores from e-rater
were the first to be deployed operationally in high-stakes assessment as one of two scores for the
GMAT and have since been used in the GRE and TOEFL assessments following similar models
of providing one of the two scores on each essay.
Lexile® Writing Analyzer, MetaMetrics
Lexile® Writing Analyzer is a grade‐, genre‐, prompt‐, and punctuation‐independent
automatic essay scoring engine for establishing Lexile writer measures. A vertical scale is
employed to measure the writing construct and, as such, training is not necessary to evaluate an
essay.
A Lexile writer measure refers to an underlying individual trait, which is defined as the
power to compose written text, with writing ability embedded in a complex web of cognitive and
sociocultural processes. Individuals with higher‐level writing ability are more facile with at least

Contrasting Essay Scoring 14
some of the aspects of a writer‐composition‐reader transaction than are individuals with lower‐
level writing ability. Facets of a writer‐composition‐reader transaction may be related to,
reflected in, or reflective of, an individual’s writing ability, but they are not, in themselves
“writing ability”. Rather, writing ability is an individual trait that is brought to bear to a greater
or lesser extent within each transaction occasion.
Through a research study to examine the relationship between text complexity, text
features, and writing ability, a parsimonious set of significant predictors emerged—predictors
consistent with the hypothesis that selected kinds of composition surface text features may be
proxies for a degree of executive functioning and working memory capacity and efficiency. The
resulting combination consisted of lexical representations alone—without syntax signifiers.
Specifically, a combination of a small number of variables—degree of diverse use of vocabulary
and greater vocabulary density, controlling for production fluency—predicted 90% of the true
variance in rater judgments of essays.
The “training” phase of the study involved the categorization of Lexile essay scores into
distinct groups corresponding to teacher ratings (similar to changing actual temperature
measurements into categories of “very hot,” “hot,” cool,” and “cold”).
Project Essay Grade (PEG), Measurement, Inc.
MI’s automated essay scoring engine, Project Essay Grade (PEG), has undergone 40
years of study and enhancement. Replication studies for a number of state departments of
education have indicated that PEG demonstrates accuracy that is very similar to that of trained
human scorers. It has been used to score millions of essays in formative and summative
assessments, including statewide formative assessments, online writing improvement systems for
a network of international schools, and the Utah Direct Writing Assessment, the state’s census

Contrasting Essay Scoring 15
assessment in grades 5 and 8. PEG utilizes training sets of human-scored student constructed
responses to build models with which to assess the quality of unscored responses. The training
responses are analyzed across multiple dimensions, and from this analysis, features are
calculated, including various measures of structure, mechanics, organization, semantics and
syntax. Once the features have been calculated, PEG uses them to build statistical models for the
accurate prediction of scores, holistically or by trait. In order to create these features, MI has
custom-crafted a number of tools that respond well to student error. One such tool is a custom
search language that allows our linguists to locate complex structures within a text quickly and
accurately. More recently, MI has devoted time and attention to the development of tools that
evaluate text on a deeper semantic level, generating high-dimensional data. To handle this data
adequately, we have drawn on recent advances in statistical machine learning, including
prediction algorithms specifically designed to deal with noisy, high-dimensional data.
Intelligent Essay Assessor (IEA), Pearson Knowledge Technologies
The Intelligent Essay Assessor (IEA) evaluates the structure, style, and content of writing
using a range of AI-based technologies. It derives some of its measures through using semantic
models of English (or any other language) from an analysis of large volumes of text equivalent to
all the reading a student may have done through high school (about 12 million words). The IEA
combines background knowledge about English in general and the subject area of the assessment
in particular along with prompt-specific algorithms to learn how to match student responses to
human scores. Using a representative sample of responses that are double-scored by humans, the
computer compares the content and relevant qualities of the writing of each student response,
along with the scores given to the responses by the human scorers. From these comparisons, a
prompt-specific algorithm is derived to predict the scores that the same scorers would assign to

Contrasting Essay Scoring 16
new responses. IEA can be trained and ready to score in a matter of days.
IEA provides an immediate overall evaluation of a response as well as feedback on
specific traits, spelling, grammar errors, and on content categories. IEA can be tuned to
understand and evaluate text in any language (Spanish, Arabic, Hindi, etc.) or in any subject
area. It includes built-in detectors for off-topic responses, highly unusual essays and other special
situations that may need to be referred to human readers. In addition, products based on the
technology provide feedback that is easy to understand. IEA has been used in situations
including scoring ELA and science responses for grade schools, assessing and giving feedback
on reading comprehension and summarization skills, assessing scenario-based learning for
college-students and for assessing military leadership skills. It has been used for scoring millions
of essays in high-stakes testing as a second score or in formative evaluations.
CRASETM
, Pacific Metrics
Pacific Metrics automated scoring engine, CRASETM
, scores responses to items typically
appearing in large-scale assessments: (a) essay length writing prompts; (b) short answer
constructed response items in mathematics, English Language Arts, and science; (c) math items
eliciting formulae or numeric answers; and, (d) technology-enhanced items (e.g., Drag and Drop,
Graphing). It has been used in both formative and high-stakes summative assessments,
providing rapid turnaround and delivering real cost savings over traditional hand scoring
methods. The system is highly customizable, both in terms of the configurations used to build
machine scoring models and in terms of the how the system can blend human scoring and
machine scoring (i.e., hybrid models). CRASE is a fully integrated JAVA-based application that
runs as a web service. By integrated, this refers to its ability to: (a) score any of several different
item types as a single software application, (b) interface with web-based assessment delivery

Contrasting Essay Scoring 17
platforms for immediate turnaround of scores, and (c) integrate with vendor-based electronic
hand scoring systems for monitoring or dual scoring.
At its most basic level, categorization is critical to the scoring process. Using experience,
along with training materials, scoring guides, etc., a human rater classifies a student’s response
into one of several defined categories or scores. CRASE analyzes a sample of already-scored
student responses to produce a model of the raters’ scoring behavior. In general, the system will
score as reliably as the sample from which the scoring models are built. By emulating human
scoring behavior, CRASE essentially predicts the score that a human rater would assign to a
given student response. CRASE uses a sequential process to first analyze and then score
students’ responses. When a response is received from an online test administration system, it
moves through three phases in the scoring process: (a) identifying non-attempts, (b) feature
extraction, and (c) scoring.
• Identifying Non-Attempts. The response is first reviewed to determine whether it is a
valid attempt at the item. If it is not a valid attempt (e.g., it is blank or gibberish), the
response is flagged and removed from the remaining feature extraction and scoring
process.
• Extraction of Features. If it is a valid attempt, the response is submitted to one of the
feature extraction engines. In this phase, a vector of values is generated that
represents both the scoring rubric and the construct the item is intended to assess.
• Predicting a Score. The vector of values is submitted to a scoring engine that uses a
statistical model and/or a series of computational linguistic procedures to classify the
response into a score category. It is at this stage that the model derived from the rater
Contrasting Essay Scoring 18
sample is applied to predict the score a rater would provide. The predicted score and
any non-attempt flags are then returned to the test administration system.
For the scoring of writing prompts, the feature extraction step is organized around the
6+1 Trait® Model, a product of Education Northwest (http://educationnorthwest.org/traits) that
is used in some form by most states for K-12 writing applications. The 6+1 Trait model
conceptualizes six traits of writing (ideas, sentence fluency, organization, voice, word choice,
and conventions) along with the ‘+1’ which is “written presentation”. For writing prompts and
essays, the feature extraction stage first preprocesses student responses by tokenizing elements in
the response, counting and correcting misspellings, computing part-of-speech tags, and conducts
stemming. One or more functions are associated with each of the six traits, and these functions
are applied to the processed response to produce one or more variables that represent the
trait. Examples of functions are: identifying usage and mechanics errors typically seen in student
essays, measuring variation in sentence type, calculating extent of personal engagement, and idea
development in phrasing. This step also produces text-based and numeric-based feedback that
can be used to improve the essay (e.g., too-common words or sentence beginnings, spelling
errors, grammar errors). CRASE can be customized to score each of the six traits, or
combinations of the traits. It can also be customized to score a number of points (e.g., 1 to 4, 1 to
6). The scoring step uses statistical modeling methods to produce a score using the variables
produced in the feature extraction step. Bayesian methods can also be employed to incorporate
priors into the scoring model.
IntelliMetric, Vantage Learning
IntelliMetric is an intelligent machine scoring system that emulates the processes carried
out by human scorers. IntelliMetric draws its theoretical underpinnings from a variety of areas,
Contrasting Essay Scoring 19
including cognitive processing, artificial intelligence, natural language understanding and
computational linguistics in the process of evaluating the quality of written text. IntelliMetric
learns to score essays in much the same manner as human raters are trained. In the typical
human scoring scenario, expert raters develop anchor papers for each score point thereby
becoming the basis for training human scorers on the proposed protocol. Human scorers use
these anchor papers as reference points, and learn to distinguish the features embedded in the
anchor papers that translate to their respective scores. Similarly, IntelliMetric is trained to score
test-taker essays. Each prompt (essay) is first scored by expert human scorers, who develop
anchor papers for each score point. A number of papers for each score point are loaded into
IntelliMetric, which runs multiple algorithms to determine the specific writing features that
translate to various score points.
Evaluation Criteria
In the field of performance assessment there are few “gold standards” and occasionally
there is disagreement about the objectivity of the standards that are in place. So for instance, in a
shooting competition one can obtain an “objective” score based on how well one hits the areas of
a stationary target, but the debate among enthusiasts centers on how realistic the conditions for
shooting on a target range actually are (i.e., the lack of variables such as target motion, weather,
wind that might impact shooting accuracy) compared to, say, hunting in the wild.
Essay assessment, which has no gold standard, often employs rubrics (quantifiable
declarations of what human raters are instructed to score as being important, typically on a scale
ranging from “poor” to “excellent”) to guide the assignment of a score that reflects writing
standards. Trained human raters, as with subject-matter or writing experts, can read the same
paper and assign the same or different scores for different reasons. To compensate for possible

Contrasting Essay Scoring 20
differences, most states use the scores from two trained human raters as the criterion measure.
Human raters are generally hired with some writing background, given extensive training,
provided scoring guides to help standardize their score assignments, and periodically compare
their assessments with essays that have been previously scored by writing experts (i.e., “training
sets”). The higher the agreement among human raters, the more reliable the assessment is
thought to be. However, the metrics used to assess agreement are sometimes impacted or
modified by the rubric scales that have been adopted or by the way in which a final score is
resolved. So for example, some states simply add the equally weighted scores from human raters
to determine a final score assignment rather than employ a third rater or supervisor to resolve a
score discrepancy between them, and thereby preserve the original rating score values.
Scoring
Rather than try to evaluate machine scoring on the basis of one metric, this study will
evaluate scoring performance on the basis of a set of measures that are standard in the field,
including:
• Distributional differences – correspondence in mean and variance of the distributions of
human scores to that of automated scores.
• Agreement – measured by correlation, weighted kappa and percent agreement (exact and
exact + adjacent).
• Agreement delta – degree of difference between human-human agreement and
automated-human agreement by the same agreement metrics as above.
Results
Eight of the nine vendors provided predictions for 100% of the test set. The one vendor
who did not resulted in the elimination of 10 essays from their predictions. The proportion is so

Contrasting Essay Scoring 21
small (10/4343 = .002) that for comparison purposes, the results will be treated as if they had
reported at the 100% rate.
By and large, the scoring engines did a good of replicating the mean scores for all of the
data sets. Figure 1 illustrates these in graphic form. Table 5 shows the deviation scores (deltas)
from the means of each data set. Accuracy was most likely influenced by the size of the scale.
For example, all vendor engines generated predicted means within 0.10 of the human mean for
Data Set #3 which had a rubric range of 0-3. However, even when the range was much larger as
in Data Set #8 (range of 0-60), mean estimates were generally within 1 point, and usually
smaller.
Table 4 shows the mean distributions across all nine vendors for the eight data sets. For
comparison purposes, three additional calculations are provided. H1 refers to the mean
calculations based on the scores assigned by the first human rater and H2 shows the same
calculations based on the score assignments for the second human rater. In the three data sets (1,
7, and 8) where the final or resolved score was the equally weighted sum of the two human
raters, the scores for HR1 and HR2 were doubled to be on the same scale.
The results for data set #2 were a bit of an anomaly. In addition to being scored on two
traits, this data set differed from the others in how scores were assigned. While two raters
evaluated the essays, only the rating from the first rater determined the score assignment. The
second rater was used as a “read behind” to monitor rating quality. However, the second rater
had no influence on the actual score assignment. Because of this unique situation, only the means
for the second human rater are listed in Table 4.
RS refers to the final or resolved score. This was the score that was provided by the state.
As mentioned previously, determining the resolved score was accomplished differently by the

Contrasting Essay Scoring 22
different states, but is a function of human ratings. So where one state might have used the
equally weighted sum of the raters to determine the resolved score, another state might have
issued the guideline to use the higher of the two human rater scores. The H1 and H2 metrics
(H1H2) are provided throughout the results section for comparison purposes.
By and large, the scoring engines did a good job of replicating the mean scores for all of
the data sets. Figure 1 illustrates these in graphic form. Table 5 shows the deviation scores
(deltas) from the means of each data set. Accuracy was most likely influenced by the size of the
scale. For example, all vendor engines generated predicted means within 0.10 of the human
mean for Data Set #3 which had a rubric range of 0-3. However, even when the range was much
larger as in Data Set #8 (0-60), mean estimates were generally within 1 point, and usually
smaller.
Table 6 shows analogous information for the standard deviations for each of the data sets
with Table 7 illustrating the deltas. With the exception of data sets 1, 7, and 8, where the two
rater scores were summed to get a resolved score, most of the predicted scores had standard
deviations within 0.10 of the resolved scores. Figure 2 graphically depicts this and shows some
scatter for data sets 7 and 8 where the scale ranges were much wider than with some of the
earlier data sets.
Table 8 begins the sequence of agreement statistics for the data sets. The human exact
agreements ranged from 0.28 on data set #8 to .76 for data set #2. Machine scoring exact
agreements ran from 0.07 on data set #2 to 0.72 on data sets 3 and 4. An inspection of the deltas
on Table 9 shows that machines performed particularly well on data sets #5 and 6, two of the
source-based essays. Figure 3 illustrates the exact agreement statistics in line graph form. With
one exception most of the lines hover around the resolved score exact agreements.

Contrasting Essay Scoring 23
Adjacent agreements refer to the combined exact and adjacent score agreements. This
calculation is based on the generally accepted convention of considering rater score assignments
within one score point as being a “match”. If the scores differ by more than one point, many
states will ask a third rater to evaluate the essay or they may have some other rule about how to
handle the score difference. For data sets 1, 7, and 8, the calculation for adjacent agreement was
slightly different than for the other data sets. These data sets came from states where the
resolved score was the unweighted sum of the two human raters. While the calculation of
adjacent agreement could be based on the original scale for the two human raters, the machine
score predictions were on the unweighted summed (i.e., doubled) scale. In order to compensate
for this scaling difference, the calculation of adjacent agreement for the machine scores were
predicated on an adjacent score difference of two points, not one. Adjacent agreements are
shown on Table 10, and for data sets 1-6, they range in the mid-high 90s. Data sets 7 and 8 are
lower, but are in line with human rater performance. Table 11 shows that the differences are
generally minor. Figure 4 displays these differences.
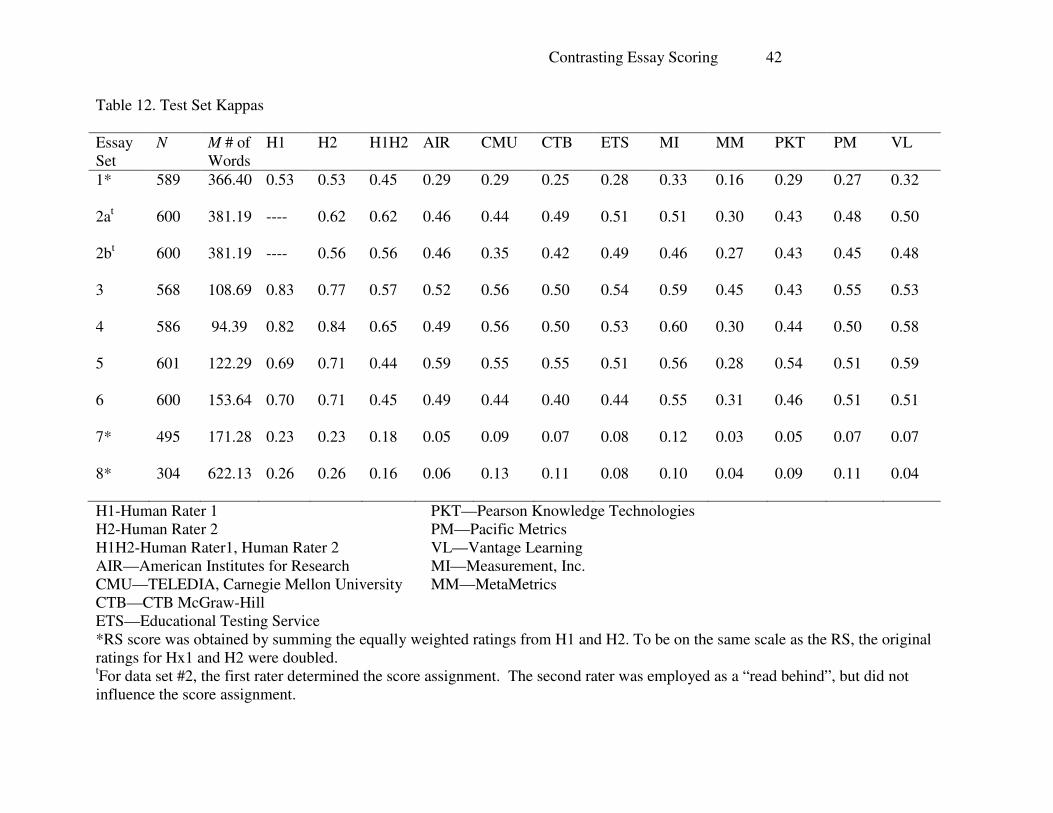
Kappa is a measure of agreement that takes into consideration agreement by chance
alone. For the resolved score, based on human ratings, the ranges ran from 0.16 on data set #8 to
0.65 on data set #4. Overall machine performance ran from 0.04 on data set #8 to 0.59 on several
data sets. These are given in Table 12 and graphically represented in Figure 5. Table 13 shows
the deltas for the kappa statistics. In general, performance on kappa was slightly less with the
exception of essay prompts #5 & #6. On these data sets, the AES engines, as a group, matched
or exceeded human performance.
Kappa is typically applied as an agreement measure when the scoring categories have no
ordinality associated with them. Quadratic-weighted kappa is appropriate when the categories

Contrasting Essay Scoring 24
have some underlying trait that increases as the scale associated with the categories increase.
These assumptions are met for the scoring rubrics applied to the data for this demonstration.
Human quadratic-weighted kappas ranged from 0.61 to 0.85 and were closely followed by the
machine ranges which went from 0.60 to 0.84 (see Table 14 where these data are organized).
Table 15 displays the delta values for quadratic-weighted kappa. Of particular interest are the
delta values for data sets #5 and #6 which are generally positive. These two data sets were
drawn from source-based essays and were shorter than the other data sets. Figure 6 illustrates
the quadratic-weighted kappas in graphic form.
Finally the values for the correlation coefficients are given in Table 16. The values for
the correlation coefficients generally mirror that of quadratic weighted kappa. These values
might have been higher except that the vendors were asked to predict integer values only. Had
they been given leeway to predict values containing decimal places, the correlation might have
been higher. The correlation values are graphically represented in Figure 7. The deltas are
provided in Table 17.
Discussion
The findings clearly show that in replicating the distributions of the eight essays, the
scores of the automated essay scoring engines performed quite well. Most of the mean
predictions were within 0.10 of the means of the resolved score. Not unexpectedly, the mean
estimates deviated where the scales of the essays were large. So for example, in data set #8, the
range of scores ran from 0-60 whereas in data set #3, the range only ran from 0-3. The range in
data set #8 was an artifact of the way the state scored the essay by summing the two equally
weighted rater scores (based on a trait rubric). Had they employed some other approach which
utilized a more restricted range, it is quite likely that the performance of the machines would

Contrasting Essay Scoring 25
have been improved further. Figure 1, however, suggests that with regard to the mean estimates,
the machines scores were very close to the resolved score. The same is true for the estimates of
the standard deviations (see Figure 2).
With the exception of data sets #5 and #6, the pattern of exact agreements was slightly
lower with the predicted machine scores than with the actual scores assigned by human raters.
On data sets #1, #7, and #8 where the scores reflected the equally weighted sums of the two
human raters, most of the deviation scores averaged less than 0.10 from the human raters. Even
with the scaling issues associated with these three data sets, the average performance of most of
the vendors closely mirrors that of the human raters. The same pattern was observed for the
calculations of the kappas which corrected for chance agreement. On data sets #5 and #6, most
of the vendors obtained exact agreements that matched or exceeded that of the human raters.
This was a bit surprising because the conventional wisdom was that the machine scoring engines
would likely do better with essays drawn from the traditional writing genre where the scoring of
content was less important. With regard to the adjacent agreements, vendor performance was
very close to that of human raters.
Overall vendor performance on quadratic-weighted kappa was particularly impressive.
This measure of agreement takes into account the ordinality of the scales developed for each
prompt. It is numerically equivalent to the intra-class correlation coefficient. Even on data sets
#1, #7, and #8 where the exact agreements and kappas had been lower, the pattern included
quadratic-weighted kappas that were higher than with human raters. Data sets #5 and #6 also
showed similar patterns. Because the values of the correlation coefficient were similar to that of
quadratic-weighted kappa, the same pattern was observed on this measure as with quadratic
weighted kappa.

Contrasting Essay Scoring 26
The premise of this demonstration was to illustrate the general capacity of machine
scoring to evaluate extended response essays, and not to single out any one vendor. However, as
with human scorers there is some vendor variability in performance. A few vendors scored
impressively well across all of the essay metrics while others performed better with certain types
of essays (i.e., source-based essays). We view this variability as a strength rather than as a
limitation. Exploring the reasons as to why there might be better performance on certain types of
essays may lead to programming that better optimizes the scoring for any new assessments
developed by the two major Race-to-the-Top consortia. If one were to simply focus on the
performance of the majority of vendors across all the measures described in this demonstration,
the results meet or exceed that of the human raters.
In the procedures section of this paper, there were several limitations of this study which
likely restricted the performance of the automated scoring engines. For example, six of the
essays sets had to be transcribed into machine form in order to be processed by automated essay
scoring. This step had the possibility of introducing transcription and formatting errors. In
addition, the rubrics and scoring rules applied by the different states likely resulted in scaling
artifacts which impacted on the optimal scoring for both human raters and machine scoring
engines. With all of these challenges, the performance of the automated essay scoring engines
should be viewed as a “floor” rather than a ceiling for what the automated essay scoring engines
can do under operational conditions. Moreover, we acknowledge some of the limitations from
the current study:
• Agreement with human ratings is not necessarily the best or only measure of students’
writing proficiency (or the evidence of proficiency in an essay). We can look at other
measures as well, including alternate-form reliabilities, and correlations with external

Contrasting Essay Scoring 27
measures such as state assessment scores or course grades (and some of our studies have
done so). The limitation of human scoring as a yardstick for automated scoring is
underscored by the human ratings used for some of the tasks in this study, which
displayed strange statistical properties and in some cases were in conflict with
documented adjudication procedures (Williamson et al, 2012).
• Another issue not addressed by this study is the question of construct validity. A
predictive model may do a good job of matching human scoring behavior, but do this by
means of features and methods which do not bear any plausible relationship to the
competencies and construct that the item aims to assess. To the extent that such models
are used, this will limit the validity argument for the assessment as a whole.
• A related issue is that of potential washback on test-taking behavior and
instruction. Before using a system operationally, some consideration will need to be
given to the question of how the measures used in scoring might be subject to
manipulation by test-takers and coaches with an interest in maximizing scores. This
study does not conduct any evaluations relevant to this question.
• An important aspect of system performance to evaluate before operational use is fairness
– whether subgroups of interest are treated differentially by the scoring
methodology. This study does not conduct any evaluations relevant to this question.
As a general scoring approach, automated essay scoring appears to have developed to the
point where it can be reliably applied in both low-stakes assessment (e.g., instructional
evaluation of essays) and perhaps as a second scorer for high-stakes testing. Many of the vendors
have software that integrates automated essay scoring as part of an instructional package (e.g.,
MyAccess, Criterion). Moreover, they have developed generic models that can be used to score

Contrasting Essay Scoring 28
essay prompts developed by teachers. Automated essay scoring is also used as second reader for
high stakes assessment in several general tests (e.g., TOEFL, GMAT) and in a similar fashion for
some licensing exams (e.g., AICPA). And automated essay scoring is used in large-scale k-12
summative assessment programs either as the only score with human read-behind for monitoring
(e.g., Utah) or as a 100% read-behind for reader monitoring (e.g., Louisiana).
Finally, the results of this demonstration apply to commercial vendors who cover most of
the extended response machine scoring market. As of this writing, there is a pubic competition
underway that will demonstrate the programming skill of individuals or teams with regard to the
established capacities of the commercial vendors. So far, the best aggregate (though unverified)
performance of a public competitor suggests that these systems may be comparable to the
performance of commercial systems with respect to agreement between human and automated
scores. The hope is to link the public competitors with the commercial vendors to get the best
possible product available for use in scoring the new assessments.
Contrasting Essay Scoring 29
References
Attali, Y., & Burstein, J. (2006). Automated essay scoring With e-rater V.2. Journal of
Technology, Learning, and Assessment, 4(3), Available from http://www.jtla.org.
Rudner, L. M., Garcia, V., & Welch, C. (2006). An Evaluation of the IntelliMetric Essay Scoring
System. Journal of Technology, Learning, and Assessment, 4(4). Retrieved from
http://www.jtla.org.
Williamson, D. M., Xi, X., Breyer, F. J. (2012). A framework for the evaluation and use of
automated essay scoring. Educational Measurement: Issues and Practice, 31(1), 2-13.
Shermis, M. D., Burstein, J., Higgins, D., & Zechner, K. (2010). Automated essay scoring:
Writing assessment and instruction. In E. Baker, B. McGaw & N. S. Petersen (Eds.),
International Encyclopedia of Education (Vol. 4, pp. 20-26). Oxford, UK: Elsevier.

Contrasting Essay Scoring 30
Author Notes
Mark D. Shermis, Department of Educational Foundations and Leadership, The
University of Akron; Ben Hamner, Kaggle, Inc.
This work was supported through funding from the William and Flora Hewlett
Foundation. The opinions expressed in this paper are those of the authors and do not necessarily
represent the policy or views of the William and Flora Hewlett Foundation or their Board of
Directors. The authors would like to thank Jaison Morgan (The Common Pool), Tom Vander
Ark and Lynn Van Deventer (OpenEd Solutions), Tony Albert (SBAC), and Jeff Nellhouse
(PARCC) for their tireless efforts in executing this study. Correspondence concerning this article
should be addressed to Mark D. Shermis, 217 Zook Hall, The University of Akron, Akron, OH
44325. Electronic mail may be sent via Internet to [email protected].
Contrasting Essay Scoring 31
Table 1. Sample Characteristics Estimated from Reported Demographics of the State*
Data Set #
1 2 3 4 5 6 7 8
State #1 #2 #3 #3 #4 #4 #5 #6
Grade 8 10 10 10 8 10 7 10
Grade Level
N
42,992 80,905 68,025 68,025 71,588 73,101 115,626 44,289
n 2,968 3,000 2,858 2,948 3,006 3,000 2,722 1,527
Training n 1,785 1,800 1,726 1,772 1,805 1,800 1,730 918
Test n 589 600 568 586 601 600 495 304
Validation nt 594 600 564 590 600 600 497 305
Gender
M% | F%
51.2 48.8 51.4 48.6 51.0 49.0 51.0 49.0 49.6 50.4 49.2 50.8 51.2 48.8 48.7 51.3
Race %
W%| N%
63.8 36.2 77.8 22.2 42.9 57.1 42.9 57.1 70.2 29.9 69.5 30.5 70.2 29.8 66.3 33.7
Free/
Reduced
Lunch %
32.9
40.0
32.24
32.2
34.2
34.2
46.6
41.3
*Taken primarily from: National Center for Education Statistics, Common Core of Data (CCD), (2010). State Non-fiscal Survey of
Public Elementary/Secondary Education, 2009–10, Version 1a. Washington, DC: U.S. Department of Education. This information
was supplemented with state department of education website information or annual reports for each participating state. tThe validation set was not used in this study.
M—Male
F—Female
W—White
N—Non-White
Contrasting Essay Scoring 32
Table 2. Training Set Characteristics
Data Set #
1 2 3 4 5 6 7 8
N 1,785 1,800 1,726 1,772 1,805 1,800 1,730 918
Grade 8 10 10 10 8 10 7 10
Type of
Essay
persuasive persuasive source-
based
source-
based
source-
based
source-
based
expository narrative
M # of
Words
366.40 381.19 108.69 94.39 122.29 153.64 171.28 622.13
SD # of
Words
120.40 156.44 53.30 51.68 57.37 55.92 85.20 197.08
Type of
Rubric
holistic trait (2) holistic holistic holistic holistic holistic* holistic+
Range of
Rubric
1-6 1-6 1-4 0-3 0-3 0-4 0-4 0-12 0-30
Range of
RS
2-12 1-6 1-4 0-3 0-3 0-4 0-4 0-24 0-60
M RS 8.53 3.42 3.33 1.85 1.43 2.41 2.72 19.98 37.23
SD RS 1.54 0.77 0.73 0.82 0.94 0.97 0.97 6.02 5.71
Exact
Agree
0.65 0.78 0.80 0.75 0.77 0.58 0.62 0.28 0.28
Exact +
Adj
Agree
0.99 0.93 1.00 1.00 1.00 0.98 0.99 0.54 0.49
κ 0.45 0.65 0.66 0.61 0.67 0.42 0.46 0.17 0.15
Pearson r 0.72 0.81 0.80 0.77 0.85 0.75 0.78 0.73 0.63
Quadratic
Weighted
κ
0.72 0.81 0.80 0.77 0.85 0.75 0.78 0.73 0.62
RS-Resolved Score
Agree-agreement
Adj-adjacent
*holistic score based on four of six traits
+holistic score based on six of six traits
Contrasting Essay Scoring 33
Table 3. Test Set Characteristics
Data Set #
1 2 3 4 5 6 7 8
N 589 600 568 586 601 600 495 304
Grade 8 10 10 10 8 10 7 10
Type of
Essay
persuasive persuasive source-
based
source-
based
source-
based
source-
based
expository narrative
M # of
Words
368.96 378.40 113.24 98.70 127.17 152.28 173.48 639.05
SD # of
Words
117.99 156.82 56.00 53.84 57.59 52.81 84.52 190.13
Type of
Rubric
holistic trait (2) holistic holistic holistic holistic holistic* holistic+
Range of
Rubric
1-6 1-6 1-4 0-3 0-3 0-4 0-4 0-12 0-30
Range of
RS
2-12 1-6 1-4 0-3 0-3 0-4 0-4 0-24 0-60
M RS 8.62 3.41 3.32 1.90 1.51 2.51 2.75 20.13 36.67
SD RS 1.54 0.77 0.75 0.85 0.95 0.95 0.87 5.89 5.19
Exact
Agree
0.64 0.76 0.73 0.72 0.78 0.59 0.63 0.28 0.29
Exact +
Adj
Agree
0.99 1.00 1.00 1.00 1.00 0.98 0.99 0.55 0.49
κ 0.45 0.62 0.56 0.57 0.65 0.44 0.45 0.18 0.16
Pearson r 0.73 0.80 0.76 0.77 0.85 0.74 0.74 0.72 0.61
Quadratic
Weighted
κ
0.73 0.80 0.76 0.77 0.85 0.75 0.74 0.72 0.62
RS-Resolved Score
Agree-agreement
Adj-adjacent
*holistic score based on four of six traits
+holistic score based on six of six traits

Contrasting Essay Scoring 34
Table 4. Test Set Means
Essay
Set
N M # of
Words
H1 H2 RS AIR CMU CTB ETS MI MM PKT PM VL
1* 589 366.40 8.61 8.62 8.62 8.54 8.51 8.56 8.57 8.53 8.56 8.57 8.49 8.80
2at 600 381.19 ---- 3.39 3.41 3.41 3.36 3.39 3.39 3.37 3.33 3.41 3.36 3.40
2bt 600 381.19 ---- 3.34 3.32 3.37 3.18 3.35 3.32 3.21 3.26 3.29 3.32 3.34
3 568 108.69 1.79 1.73 1.90 1.90 1.90 1.92 1.88 1.95 1.91 1.84 1.89 1.92
4 586 94.39 1.38 1.40 1.51 1.50 1.47 1.50 1.34 1.48 1.46 1.39 1.47 1.57
5 601 122.29 2.31 2.35 2.51 2.49 2.51 2.49 2.47 2.51 2.44 2.49 2.50 2.54
6 600 153.64 2.57 2.58 2.75 2.79 2.71 2.83 2.54 2.76 2.74 2.76 2.74 2.83
7* 495 171.28 20.02 20.24 20.13 20.05 19.63 19.46 19.61 19.80 19.63 19.58 19.52 19.91
8* 304 622.13 36.45 36.70 36.67 37.32 37.43 37.18 37.24 37.23 37.54 37.51 37.04 37.79
H1-Human Rater 1 PKT—Pearson Knowledge Technologies
H2-Human Rater 2 PM—Pacific Metrics
RS-Resolved Score (based on human ratings) VL—Vantage Learning
AIR—American Institutes for Research MI—Measurement, Inc.
CMU—TELEDIA, Carnegie Mellon University MM—MetaMetrics
CTB—CTB McGraw-Hill
ETS—Educational Testing Service
*RS score was obtained by summing the equally weighted ratings from H1 and H2. To be on the same scale as the RS, the original
ratings for H1 and H2 were doubled. tFor data set #2, the first rater determined the score assignment. The second rater was employed as a “read behind”, but did not
influence the score assignment.

Contrasting Essay Scoring 35
Table 5. Test Set Mean Deltas (M – M(RS))
Essay
Set
N M # of
Words
H1 H2 RS AIR CMU CTB ETS MI MM PKT PM VL
1* 589 366.40 -0.01 0.00 ---- -0.08 -0.11 -0.06 -0.05 -0.09 -0.06 -0.05 -0.13 0.18
2at 600 381.19 ---- -0.02 ---- 0.00 -0.05 -0.02 -0.02 -0.04 -0.08 0.00 -0.05 -0.01
2bt 600 381.19 ---- 0.02 ---- 0.05 -0.14 0.03 0.00 -0.11 -0.06 -0.03 0.00 0.02
3 568 108.69 -0.11 -0.17 ---- 0.00 0.00 0.02 -0.02 0.05 0.01 -0.06 -0.01 0.00
4 586 94.39 -0.13 -0.09 ---- -0.01 -0.04 -0.01 -0.17 -0.03 -0.05 -0.12 -0.04 0.06
5 601 122.29 -0.20 -0.16 ---- -0.02 0.00 -0.02 -0.04 0.00 -0.07 -0.02 -0.01 0.03
6 600 153.64 -0.18 -0.17 ---- 0.04 -0.04 0.08 -0.21 0.01 -0.01 0.01 -0.01 0.08
7* 495 171.28 -0.11 0.11 ---- -0.08 -0.50 -0.67 -0.52 -0.33 -0.50 -0.55 -0.61 -0.22
8* 304 622.13 -0.22 0.03 ---- 0.65 0.76 0.51 0.57 0.56 0.87 0.84 0.37 1.12
H1-Human Rater 1 PKT—Pearson Knowledge Technologies
H2-Human Rater 2 PM—Pacific Metrics
RS-Resolved Score (based on human ratings) VL—Vantage Learning
AIR—American Institutes for Research MI—Measurement, Inc.
CMU—TELEDIA, Carnegie Mellon University MM—MetaMetrics
CTB—CTB McGraw-Hill
ETS—Educational Testing Service
*RS score was obtained by summing the equally weighted ratings from H1 and H2. To be on the same scale as the RS, the original
ratings for H1 and H2 were doubled. tFor data set #2, the first rater determined the score assignment. The second rater was employed as a “read behind”, but did not
influence the score assignment.

Contrasting Essay Scoring 36
Table 6. Test Set Standard Deviations
Essay
Set
N M # of
Words
H1 H2 RS AIR CMU CTB ETS MI MM PKT PM VL
1* 589 366.40 1.64 1.68 1.54 1.23 1.45 1.26 1.54 1.51 1.57 1.34 1.44 1.29
2at 600 381.19 ---- 0.78 0.77 0.67 0.84 0.65 0.79 0.69 0.83 0.83 0.78 0.64
2bt 600 381.19 ---- 0.73 0.75 0.68 0.83 0.67 0.69 0.84 0.80 0.68 0.72 0.65
3 568 108.69 0.79 0.78 0.85 0.76 0.91 0.75 0.79 0.89 0.81 0.72 0.83 0.77
4 586 94.39 0.89 0.90 0.95 0.83 0.97 0.88 1.00 0.86 1.12 0.88 0.95 0.82
5 601 122.29 0.96 0.97 0.95 0.89 1.00 0.89 1.02 1.08 1.08 0.88 0.94 0.93
6 600 153.64 0.90 0.86 0.87 0.82 1.01 0.73 0.95 0.95 1.06 0.85 0.88 0.78
7* 495 171.28 6.40 6.31 5.89 4.17 6.37 5.30 6.27 6.43 6.51 5.17 5.71 4.99
8* 304 622.13 5.93 5.68 5.19 4.11 4.44 3.83 4.52 5.38 5.91 4.63 5.16 4.21
H1-Human Rater 1 PKT—Pearson Knowledge Technologies
H2-Human Rater 2 PM—Pacific Metrics
RS-Resolved Score (based on human ratings) VL—Vantage Learning
AIR—American Institutes for Research MI—Measurement, Inc.
CMU—TELEDIA, Carnegie Mellon University MM—MetaMetrics
CTB—CTB McGraw-Hill
ETS—Educational Testing Service
*RS score was obtained by summing the equally weighted ratings from H1 and H2. To be on the same scale as the RS, the original
ratings for H1 and H2 were doubled. tFor data set #2, the first rater determined the score assignment. The second rater was employed as a “read behind”, but did not
influence the score assignment.

Contrasting Essay Scoring 37
Table 7. Test Set Standard Deviation Deltas (SD – SD(RS))
Essay
Set
N M # of
Words
H1 H2 RS AIR CMU CTB ETS MI MM PKT PM VL
1* 589 366.40 0.10 0.14 ---- -0.31 -0.09 -0.28 0.00 -0.03 0.03 -0.20 -0.10 -0.25
2at 600 381.19 ---- 0.01 ---- -0.10 0.07 -0.12 0.02 -0.08 0.06 0.06 0.01 -0.14
2bt 600 381.19 ---- -0.02 ---- -0.07 0.08 -0.08 -0.06 0.09 0.05 -0.07 -0.03 -0.10
3 568 108.69 -0.06 -0.07 ---- -0.09 0.06 -0.10 -0.06 0.04 -0.04 -0.13 -0.02 -0.08
4 586 94.39 -0.06 -0.05 ---- -0.12 0.02 -0.07 0.05 -0.09 0.17 -0.07 0.00 -0.13
5 601 122.29 0.01 0.02 ---- -0.06 0.05 -0.06 0.07 0.13 0.13 -0.07 -0.01 -0.02
6 600 153.64 0.03 -0.01 ---- -0.05 0.14 -0.14 0.08 0.08 0.19 -0.02 0.01 -0.09
7* 495 171.28 0.51 0.42 ---- -1.72 0.48 -0.59 0.38 0.84 0.62 -0.72 -0.18 -0.90
8* 304 622.13 0.74 0.49 ---- -1.08 -0.75 -1.36 -0.67 0.19 0.00 -0.56 -0.03 -0.98
H1-Human Rater 1 PKT—Pearson Knowledge Technologies
H2-Human Rater 2 PM—Pacific Metrics
RS-Resolved Score (based on human ratings) VL—Vantage Learning
AIR—American Institutes for Research MI—Measurement, Inc.
CMU—TELEDIA, Carnegie Mellon University MM—MetaMetrics
CTB—CTB McGraw-Hill
ETS—Educational Testing Service
*RS score was obtained by summing the equally weighted ratings from H1 and H2. To be on the same scale as the RS, the original
ratings for H1 and H2 were doubled. tFor data set #2, the first rater determined the score assignment. The second rater was employed as a “read behind”, but did not
influence the score assignment.

Contrasting Essay Scoring 38
Table 8. Test Set Exact Agreements
Essay
Set
N M # of
Words
H1 H2 H1H2 AIR CMU CTB ETS MI MM PKT PM VL
1* 589 366.40 0.64 0.64 0.64 0.44 0.44 0.44 0.42 0.46 0.31 0.43 0.43 0.47
2at 600 381.19 ---- 0.76 0.76 0.68 0.64 0.70 0.69 0.70 0.55 0.64 0.68 0.70
2bt 600 381.19 ---- 0.73 0.73 0.68 0.59 0.66 0.69 0.66 0.55 0.66 0.67 0.69
3 568 108.69 0.89 0.83 0.72 0.68 0.70 0.66 0.69 0.72 0.63 0.61 0.69 0.69
4 586 94.39 0.87 0.89 0.76 0.65 0.68 0.64 0.66 0.72 0.47 0.60 0.64 0.70
5 601 122.29 0.77 0.79 0.59 0.71 0.67 0.68 0.65 0.68 0.47 0.68 0.65 0.71
6 600 153.64 0.80 0.81 0.63 0.67 0.61 0.63 0.62 0.69 0.51 0.64 0.68 0.69
7* 495 171.28 0.28 0.28 0.28 0.10 0.15 0.12 0.12 0.17 0.07 0.09 0.12 0.12
8* 304 622.13 0.35 0.35 0.29 0.12 0.26 0.23 0.17 0.16 0.08 0.14 0.20 0.10
H1-Human Rater 1 PKT—Pearson Knowledge Technologies
H2-Human Rater 2 PM—Pacific Metrics
H1H2-Human Rater1, Human Rater 2 VL—Vantage Learning
AIR—American Institutes for Research MI—Measurement, Inc.
CMU—TELEDIA, Carnegie Mellon University MM—MetaMetrics
CTB—CTB McGraw-Hill
ETS—Educational Testing Service
*RS score was obtained by summing the equally weighted ratings from H1 and H2. To be on the same scale as the RS, the original
ratings for H1 and H2 were doubled. tFor data set #2, the first rater determined the score assignment. The second rater was employed as a “read behind”, but did not
influence the score assignment.

Contrasting Essay Scoring 39
Table 9. Test Set Exact Agreement Deltas (Exact – Exact(RS))
Essay
Set
N M # of
Words
H1 H2 H1H2 AIR CMU CTB ETS MI MM PKT PM VL
1* 589 366.40 0.00 0.00 ---- -0.20 -0.20 -0.20 -0.22 -0.18 -0.33 -0.21 -0.21 -0.17
2at 600 381.19 ---- 0.00 ---- -0.08 -0.12 -0.06 -0.07 -0.06 -0.21 -0.12 -0.08 -0.06
2bt 600 381.19 ---- 0.00 ---- -0.05 -0.14 -0.07 -0.04 -0.07 -0.18 -0.07 -0.06 -0.04
3 568 108.69 0.17 0.11 ---- -0.04 -0.02 -0.06 -0.03 0.00 -0.09 -0.11 -0.03 -0.03
4 586 94.39 0.11 0.13 ---- -0.11 -0.08 -0.12 -0.1 -0.04 -0.28 -0.16 -0.12 -0.05
5 601 122.29 0.18 0.20 ---- 0.12 0.08 0.09 0.06 0.09 -0.12 0.09 0.06 0.12
6 600 153.64 0.17 0.18 ---- 0.04 -0.02 0.00 -0.01 0.06 -0.12 0.01 0.05 0.06
7* 495 171.28 0.00 0.00 ---- -0.18 -0.13 -0.16 -0.16 -0.11 -0.21 -0.19 -0.16 -0.16
8* 304 622.13 0.06 0.06 ---- -0.17 -0.03 -0.06 -0.11 -0.12 -0.20 -0.14 -0.09 -0.19
H1-Human Rater 1 PKT—Pearson Knowledge Technologies
H2-Human Rater 2 PM—Pacific Metrics
H1H2-Human Rater1, Human Rater 2 VL—Vantage Learning
AIR—American Institutes for Research MI—Measurement, Inc.
CMU—TELEDIA, Carnegie Mellon University MM—MetaMetrics
CTB—CTB McGraw-Hill
ETS—Educational Testing Service
*RS score was obtained by summing the equally weighted ratings from H1 and H2. To be on the same scale as the RS, the original
ratings for H1 and H2 were doubled. tFor data set #2, the first rater determined the score assignment. The second rater was employed as a “read behind”, but did not
influence the score assignment.

Contrasting Essay Scoring 40
Table 10. Test Set Exact and Adjacent Agreements
Essay
Set
N M # of
Words
H1 H2 H1H2 AIR CMU CTB ETS MI MM PKT PM VL
1* 589 366.40 0.99 0.99 0.99 0.99 0.99 0.98 0.99 0.99 0.95 0.99 0.99 0.99
2at 600 381.19 ---- 1.00 1.00 1.00 0.99 1.00 1.00 1.00 0.99 0.99 1.00 1.00
2bt 600 381.19 ---- 1.00 1.00 0.99 0.98 0.99 1.00 0.99 0.97 0.99 1.00 1.00
3 568 108.69 1.00 1.00 1.00 0.98 0.97 0.98 0.98 0.97 0.97 0.98 0.97 0.99
4 586 94.39 1.00 1.00 1.00 0.99 0.99 0.98 0.99 0.99 0.96 0.99 0.98 0.99
5 601 122.29 1.00 1.00 0.98 0.99 0.99 0.99 0.99 0.99 0.93 0.99 0.99 1.00
6 600 153.64 1.00 1.00 0.99 0.99 0.99 0.97 0.99 1.00 0.95 1.00 1.00 1.00
7* 495 171.28 0.55 0.55 0.55 0.47 0.52 0.50 0.52 0.56 0.38 0.50 0.52 0.56
8* 304 622.13 0.53 0.52 0.49 0.52 0.51 0.51 0.52 0.52 0.41 0.52 0.48 0.53
H1-Human Rater 1 PKT—Pearson Knowledge Technologies
H2-Human Rater 2 PM—Pacific Metrics
H1H2-Human Rater1, Human Rater 2 VL—Vantage Learning
AIR—American Institutes for Research MI—Measurement, Inc.
CMU—TELEDIA, Carnegie Mellon University MM—MetaMetrics
CTB—CTB McGraw-Hill
ETS—Educational Testing Service
*RS score was obtained by summing the equally weighted ratings from H1 and H2. To be on the same scale as the RS, the original
ratings for H1 and H2 were doubled. tFor data set #2, the first rater determined the score assignment. The second rater was employed as a “read behind”, but did not
influence the score assignment.

Contrasting Essay Scoring 41
Table 11. Test Set Exact and Adjacent Agreement Deltas (Exact+Adjacent – Exact+Adjacent(RS))
Essay
Set
N M # of
Words
H1 H2 H1H2 AIR CMU CTB ETS MI MM PKT PM VL
1* 589 366.40 0.00 0.00 ---- 0.00 0.00 -0.02 0.00 0.00 -0.05 0.00 -0.01 0.00
2at 600 381.19 ---- 0.00 ---- 0.00 -0.01 0.00 0.00 0.00 -0.01 -0.01 0.00 0.00
2bt 600 381.19 ---- 0.00 ---- -0.01 -0.02 -0.01 0.00 -0.01 -0.03 -0.01 0.00 0.00
3 568 108.69 0.00 0.00 ---- -0.02 -0.03 -0.02 -0.02 -0.03 -0.03 -0.02 -0.03 -0.01
4 586 94.39 0.00 0.00 ---- -0.01 -0.01 -0.02 -0.01 -0.01 -0.04 -0.01 -0.02 -0.01
5 601 122.29 0.02 0.02 ---- 0.01 0.01 0.01 0.01 0.01 -0.05 0.01 0.01 0.02
6 600 153.64 0.01 0.01 ---- 0.00 0.00 -0.02 0.00 0.01 -0.04 0.01 0.01 0.01
7* 495 171.28 0.00 0.00 ---- -0.08 -0.03 -0.05 -0.03 0.01 -0.17 -0.05 -0.03 0.01
8* 304 622.13 0.04 0.03 ---- 0.03 0.01 0.02 0.03 0.02 -0.08 0.02 -0.02 0.04
H1-Human Rater 1 PKT—Pearson Knowledge Technologies
H2-Human Rater 2 PM—Pacific Metrics
H1H2-Human Rater1, Human Rater 2 VL—Vantage Learning
AIR—American Institutes for Research MI—Measurement, Inc.
CMU—TELEDIA, Carnegie Mellon University MM—MetaMetrics
CTB—CTB McGraw-Hill
ETS—Educational Testing Service
*RS score was obtained by summing the equally weighted ratings from H1 and H2. To be on the same scale as the RS, the original
ratings for Hx1 and H2 were doubled. tFor data set #2, the first rater determined the score assignment. The second rater was employed as a “read behind”, but did not
influence the score assignment.
Contrasting Essay Scoring 42
Table 12. Test Set Kappas
Essay
Set
N M # of
Words
H1 H2 H1H2 AIR CMU CTB ETS MI MM PKT PM VL
1* 589 366.40 0.53 0.53 0.45 0.29 0.29 0.25 0.28 0.33 0.16 0.29 0.27 0.32
2at 600 381.19 ---- 0.62 0.62 0.46 0.44 0.49 0.51 0.51 0.30 0.43 0.48 0.50
2bt 600 381.19 ---- 0.56 0.56 0.46 0.35 0.42 0.49 0.46 0.27 0.43 0.45 0.48
3 568 108.69 0.83 0.77 0.57 0.52 0.56 0.50 0.54 0.59 0.45 0.43 0.55 0.53
4 586 94.39 0.82 0.84 0.65 0.49 0.56 0.50 0.53 0.60 0.30 0.44 0.50 0.58
5 601 122.29 0.69 0.71 0.44 0.59 0.55 0.55 0.51 0.56 0.28 0.54 0.51 0.59
6 600 153.64 0.70 0.71 0.45 0.49 0.44 0.40 0.44 0.55 0.31 0.46 0.51 0.51
7* 495 171.28 0.23 0.23 0.18 0.05 0.09 0.07 0.08 0.12 0.03 0.05 0.07 0.07
8* 304 622.13 0.26 0.26 0.16 0.06 0.13 0.11 0.08 0.10 0.04 0.09 0.11 0.04
H1-Human Rater 1 PKT—Pearson Knowledge Technologies
H2-Human Rater 2 PM—Pacific Metrics
H1H2-Human Rater1, Human Rater 2 VL—Vantage Learning
AIR—American Institutes for Research MI—Measurement, Inc.
CMU—TELEDIA, Carnegie Mellon University MM—MetaMetrics
CTB—CTB McGraw-Hill
ETS—Educational Testing Service
*RS score was obtained by summing the equally weighted ratings from H1 and H2. To be on the same scale as the RS, the original
ratings for Hx1 and H2 were doubled. tFor data set #2, the first rater determined the score assignment. The second rater was employed as a “read behind”, but did not
influence the score assignment.

Contrasting Essay Scoring 43
Table 13. Test Set Kappa Deltas (κ – κ (RS))
Essay
Set
N M # of
Words
H1 H2 H1H2 AIR CMU CTB ETS MI MM PKT PM VL
1* 589 366.40 0.08 0.08 ---- -0.16 -0.16 -0.20 -0.17 -0.12 -0.29 -0.16 -0.18 -0.13
2at 600 381.19 ---- 0.00 ---- -0.16 -0.18 -0.13 -0.11 -0.11 -0.32 -0.19 -0.14 -0.12
2bt 600 381.19 ---- 0.00 ---- -0.10 -0.21 -0.14 -0.07 -0.10 -0.29 -0.13 -0.11 -0.08
3 568 108.69 0.26 0.20 ---- -0.05 -0.01 -0.07 -0.03 0.02 -0.12 -0.14 -0.02 -0.04
4 586 94.39 0.17 0.19 ---- -0.16 -0.09 -0.15 -0.12 -0.05 -0.35 -0.21 -0.15 -0.07
5 601 122.29 0.25 0.27 ---- 0.15 0.11 0.11 0.07 0.12 -0.16 0.10 0.07 0.15
6 600 153.64 0.25 0.26 ---- 0.04 -0.01 -0.05 -0.01 0.10 -0.14 0.02 0.06 0.06
7* 495 171.28 0.05 0.05 ---- -0.13 -0.09 -0.11 -0.10 -0.06 -0.15 -0.13 -0.11 -0.11
8* 304 622.13 0.10 0.10 ---- -0.10 -0.03 -0.05 -0.08 -0.06 -0.12 -0.07 -0.05 -0.12
H1-Human Rater 1 PKT—Pearson Knowledge Technologies
H2-Human Rater 2 PM—Pacific Metrics
H1H2-Human Rater1, Human Rater 2 VL—Vantage Learning
AIR—American Institutes for Research MI—Measurement, Inc.
CMU—TELEDIA, Carnegie Mellon University MM—MetaMetrics
CTB—CTB McGraw-Hill
ETS—Educational Testing Service
*RS score was obtained by summing the equally weighted ratings from H1 and H2. To be on the same scale as the RS, the original
ratings for Hx1 and H2 were doubled. tFor data set #2, the first rater determined the score assignment. The second rater was employed as a “read behind”, but did not
influence the score assignment.

Contrasting Essay Scoring 44
Table 14. Test Set Quadratic Weighted Kappas
Essay
Set
N M # of
Words
H1 H2 H1H2 AIR CMU CTB ETS MI MM PKT PM VL
1 589 366.40 0.77 0.78 0.73 0.78 0.79 0.70 0.82 0.82 0.66 0.79 0.76 0.78
2a 600 381.19 ---- 0.80 0.80 0.68 0.70 0.68 0.74 0.72 0.62 0.70 0.72 0.70
2b 600 381.19 ---- 0.76 0.76 0.66 0.63 0.63 0.69 0.70 0.55 0.65 0.69 0.68
3 568 108.69 0.92 0.89 0.77 0.72 0.74 0.69 0.72 0.75 0.65 0.65 0.73 0.73
4 586 94.39 0.93 0.94 0.85 0.75 0.81 0.76 0.80 0.82 0.67 0.74 0.76 0.79
5 601 122.29 0.89 0.90 0.74 0.82 0.81 0.80 0.81 0.83 0.64 0.80 0.78 0.83
6 600 153.64 0.89 0.89 0.74 0.76 0.76 0.64 0.75 0.81 0.65 0.75 0.78 0.76
7 495 171.28 0.78 0.77 0.72 0.67 0.77 0.74 0.81 0.84 0.58 0.77 0.80 0.81
8 304 622.13 0.75 0.74 0.61 0.69 0.65 0.60 0.70 0.73 0.63 0.69 0.68 0.68
H1-Human Rater 1 PKT—Pearson Knowledge Technologies
H2-Human Rater 2 PM—Pacific Metrics
H1H2-Human Rater1, Human Rater 2 VL—Vantage Learning
AIR—American Institutes for Research MI—Measurement, Inc.
CMU—TELEDIA, Carnegie Mellon University MM—MetaMetrics
CTB—CTB McGraw-Hill
ETS—Educational Testing Service
*RS score was obtained by summing the equally weighted ratings from H1 and H2. To be on the same scale as the RS, the original
ratings for Hx1 and H2 were doubled. tFor data set #2, the first rater determined the score assignment. The second rater was employed as a “read behind”, but did not
influence the score assignment.

Contrasting Essay Scoring 45
Table 15. Test Set Quadratic Weighted Kappa Deltas (κw – κ w (RS))
Essay
Set
N M # of
Words
H1 H2 H1H2 AIR CMU CTB ETS MI MM PKT PM VL
1 589 366.40 0.04 0.05 ---- 0.05 0.06 -0.03 0.09 0.09 -0.07 0.07 0.03 0.06
2a 600 381.19 ---- 0.00 ---- -0.12 -0.10 -0.11 -0.06 -0.08 -0.18 -0.10 -0.08 -0.10
2b 600 381.19 ---- 0.00 ---- -0.09 -0.13 -0.12 -0.06 -0.06 -0.21 -0.11 -0.07 -0.08
3 568 108.69 0.15 0.12 ---- -0.05 -0.03 -0.08 -0.05 -0.02 -0.12 -0.12 -0.04 -0.04
4 586 94.39 0.08 0.09 ---- -0.1 -0.04 -0.09 -0.04 -0.03 -0.18 -0.1 -0.08 -0.05
5 601 122.29 0.15 0.16 ---- 0.07 0.07 0.05 0.06 0.09 -0.1 0.05 0.03 0.08
6 600 153.64 0.15 0.15 ---- 0.02 0.03 -0.1 0.01 0.07 -0.09 0.01 0.04 0.02
7 495 171.28 0.06 0.05 ---- -0.05 0.06 0.03 0.09 0.12 -0.14 0.05 0.08 0.09
8 304 622.13 0.14 0.13 ---- 0.07 0.03 -0.01 0.09 0.12 0 0.08 0.07 0.07
H1-Human Rater 1 PKT—Pearson Knowledge Technologies
H2-Human Rater 2 PM—Pacific Metrics
H1H2-Human Rater1, Human Rater 2 VL—Vantage Learning
AIR—American Institutes for Research MI—Measurement, Inc.
CMU—TELEDIA, Carnegie Mellon University MM—MetaMetrics
CTB—CTB McGraw-Hill
ETS—Educational Testing Service
*RS score was obtained by summing the equally weighted ratings from H1 and H2. To be on the same scale as the RS, the original
ratings for Hx1 and H2 were doubled. tFor data set #2, the first rater determined the score assignment. The second rater was employed as a “read behind”, but did not
influence the score assignment.

Contrasting Essay Scoring 46
Table 16. Test Set Pearson Moment Product Correlation Coefficient, r
Essay
Set
N M # of
Words
H1 H2 H1H2 AIR CMU CTB ETS MI MM PKT PM VL
1* 589 366.40 0.93 0.93 0.73 0.80 0.79 0.71 0.82 0.82 0.66 0.80 0.76 0.80
2at 600 381.19 ---- 0.80 0.80 0.68 0.71 0.69 0.74 0.72 0.62 0.70 0.72 0.71
2bt 600 381.19 ---- 0.76 0.76 0.67 0.64 0.64 0.70 0.71 0.55 0.65 0.69 0.69
3 568 108.69 0.92 0.89 0.77 0.72 0.74 0.69 0.72 0.75 0.65 0.66 0.73 0.73
4 586 94.39 0.94 0.94 0.85 0.76 0.81 0.76 0.82 0.82 0.68 0.75 0.76 0.80
5 601 122.29 0.89 0.90 0.75 0.82 0.81 0.80 0.81 0.84 0.65 0.80 0.78 0.83
6 600 153.64 0.89 0.89 0.74 0.76 0.77 0.65 0.77 0.81 0.66 0.75 0.78 0.77
7* 495 171.28 0.93 0.93 0.72 0.71 0.78 0.75 0.81 0.84 0.58 0.78 0.80 0.82
8* 304 622.13 0.87 0.88 0.61 0.71 0.66 0.63 0.71 0.73 0.62 0.70 0.68 0.72
H1-Human Rater 1 PKT—Pearson Knowledge Technologies
H2-Human Rater 2 PM—Pacific Metrics
H1H2-Human Rater1, Human Rater 2 VL—Vantage Learning
AIR—American Institutes for Research MI—Measurement, Inc.
CMU—TELEDIA, Carnegie Mellon University MM—MetaMetrics
CTB—CTB McGraw-Hill
ETS—Educational Testing Service
*RS score was obtained by summing the equally weighted ratings from H1 and H2. To be on the same scale as the RS, the original
ratings for Hx1 and H2 were doubled. tFor data set #2, the first rater determined the score assignment. The second rater was employed as a “read behind”, but did not
influence the score assignment.
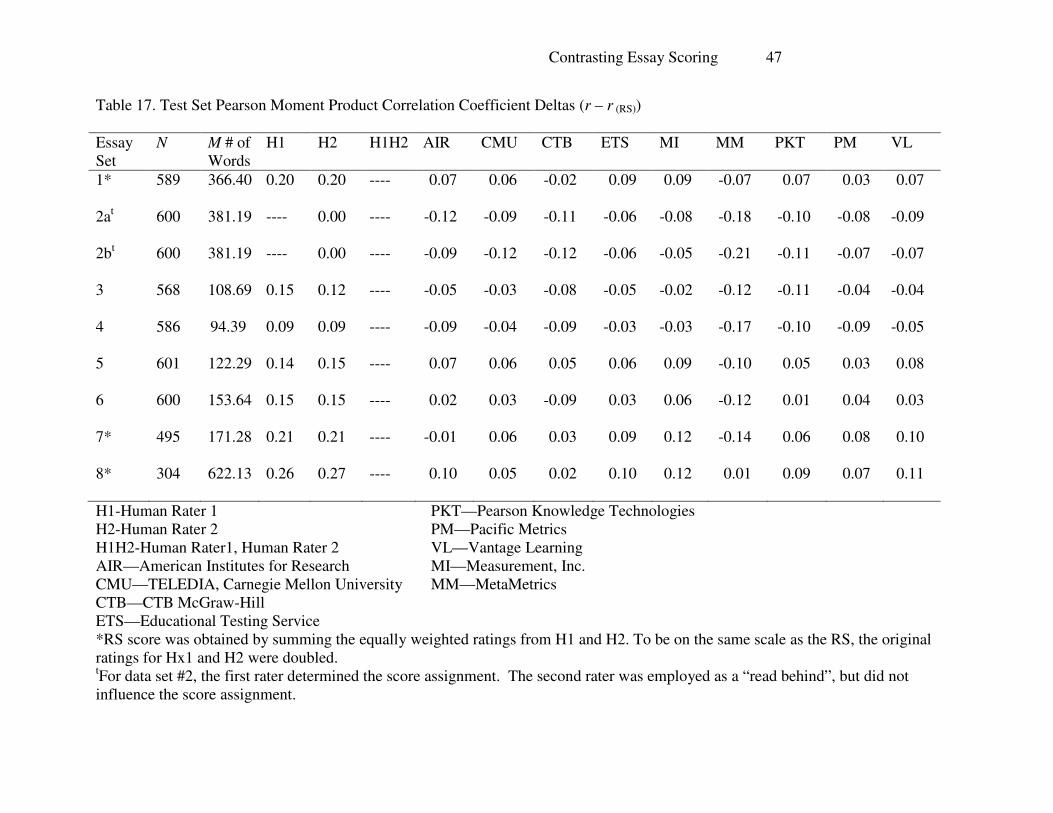
Contrasting Essay Scoring 47
Table 17. Test Set Pearson Moment Product Correlation Coefficient Deltas (r – r (RS))
Essay
Set
N M # of
Words
H1 H2 H1H2 AIR CMU CTB ETS MI MM PKT PM VL
1* 589 366.40 0.20 0.20 ---- 0.07 0.06 -0.02 0.09 0.09 -0.07 0.07 0.03 0.07
2at 600 381.19 ---- 0.00 ---- -0.12 -0.09 -0.11 -0.06 -0.08 -0.18 -0.10 -0.08 -0.09
2bt 600 381.19 ---- 0.00 ---- -0.09 -0.12 -0.12 -0.06 -0.05 -0.21 -0.11 -0.07 -0.07
3 568 108.69 0.15 0.12 ---- -0.05 -0.03 -0.08 -0.05 -0.02 -0.12 -0.11 -0.04 -0.04
4 586 94.39 0.09 0.09 ---- -0.09 -0.04 -0.09 -0.03 -0.03 -0.17 -0.10 -0.09 -0.05
5 601 122.29 0.14 0.15 ---- 0.07 0.06 0.05 0.06 0.09 -0.10 0.05 0.03 0.08
6 600 153.64 0.15 0.15 ---- 0.02 0.03 -0.09 0.03 0.06 -0.12 0.01 0.04 0.03
7* 495 171.28 0.21 0.21 ---- -0.01 0.06 0.03 0.09 0.12 -0.14 0.06 0.08 0.10
8* 304 622.13 0.26 0.27 ---- 0.10 0.05 0.02 0.10 0.12 0.01 0.09 0.07 0.11
H1-Human Rater 1 PKT—Pearson Knowledge Technologies
H2-Human Rater 2 PM—Pacific Metrics
H1H2-Human Rater1, Human Rater 2 VL—Vantage Learning
AIR—American Institutes for Research MI—Measurement, Inc.
CMU—TELEDIA, Carnegie Mellon University MM—MetaMetrics
CTB—CTB McGraw-Hill
ETS—Educational Testing Service
*RS score was obtained by summing the equally weighted ratings from H1 and H2. To be on the same scale as the RS, the original
ratings for Hx1 and H2 were doubled. tFor data set #2, the first rater determined the score assignment. The second rater was employed as a “read behind”, but did not
influence the score assignment.
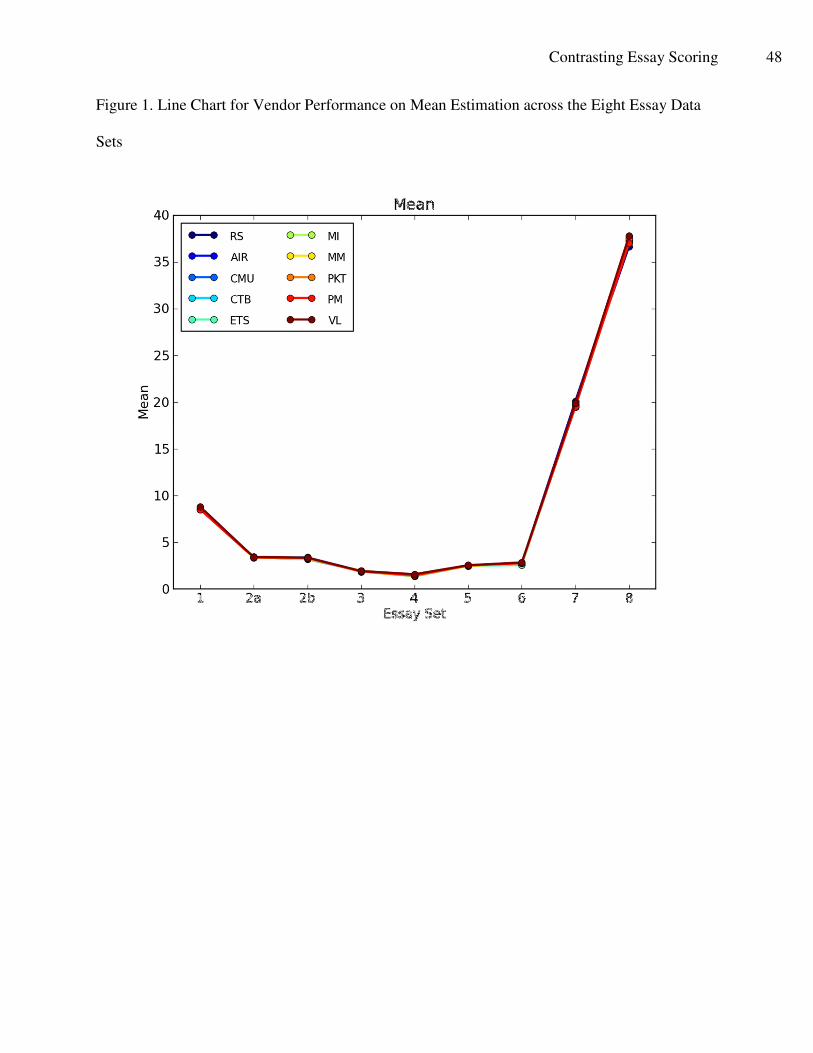
Contrasting Essay Scoring 48
Figure 1. Line Chart for Vendor Performance on Mean Estimation across the Eight Essay Data
Sets

Contrasting Essay Scoring 49
Figure 2. Line Chart for Vendor Performance on Standard Deviation Estimation across the Eight
Essay Data Sets

Contrasting Essay Scoring 50
Figure 3. Line Chart for Vendor Performance on Exact Agreements across the Eight Essay Data
Sets

Contrasting Essay Scoring 51
Figure 4. Line Chart for Vendor Performance on Exact+Adjacent Agreements across the Eight
Essay Data Sets

Contrasting Essay Scoring 52
Figure 5. Line Chart for Vendor Performance on Kappas across the Eight Essay Data Sets

Contrasting Essay Scoring 53
Figure 6. Line Chart for Vendor Performance on Quadratic Weighted Kappas across the Eight
Essay Data Sets

Contrasting Essay Scoring 54
Figure 7. Line Chart for Vendor Performance on the Pearson Product Moment Correlation across
the Eight Essay Data Sets