Embed Size (px)
DESCRIPTION
Contracting-out Development Aid to Nonprofit and Forprofit Firms: A Case study Preliminary look February 28, 2005. Contracting-out Development Aid to Nonprofit and Forprofit Firms: A Case study Preliminary look. Key Questions Selection procedure and Contract design Data Results - PowerPoint PPT Presentation
Citation preview
Contracting-out Development Aid to Nonprofit and Forprofit Firms: A Case study
Preliminary look
February 28, 2005
Contracting-out Development Aid to Nonprofit and Forprofit Firms: A Case study
Preliminary look
Key Questions Selection procedure and Contract designDataResults
1. Type of Bidders and Success Rates2. Competitive advantage of nonprofits vs forprofits3. Acquisition of Contracts and its Determinants
Key Questions
Many donor agencies are committed to increasing aid flows to speed up progress towards the MDGs in low-income countries. How are these businesss opportunities currently managed and negotiated?
� Selection procedures
Blurry division between nonprofit and forprofit sectors (health care, R&D, education) What do we find when we look at the implementation of aid projects?
� Interaction between nonprofits and forprofits
We would like to test a number of empirical predications about the nonprofit tenderers and their relative competitive advantage when competing against forprofit candidate consultants.
� Comparative institutional behavior in the acquisition of aid contracts
Selection procedure and Contract design
Contracts are awarded after a tendering process on the basis of projects identified by DfID in conjunction with beneficiary countries.
Focus on DfID as a case study, but same instrument is utilised by EuropeAid; IDA (investment loans and credits); other bilateral aid programmes such as AusAid and USAID.
Contract specifies a Financial limit or guaranteed maximum and the Services set out in the Terms of Reference.
Residual rights of control rest with with the DfID.
Personnel fees and project expenses are reimbursed via invoices. (Second step in this project)
Incomplete contracts: Any cost overruns or changes to the project's TOR need
to be renegotiated.
Why competitive bidding? Achieve efficient and effective use of public monies
Contracting Process
1.Announcement of Project (tender or business opportunity)/Contract advertised: Terms of reference
2.(Expressions of Interest -- only for large projects)
3.Shortlisted candidates are invited to submit a full proposal
4.Preferred tenderer selected
Data
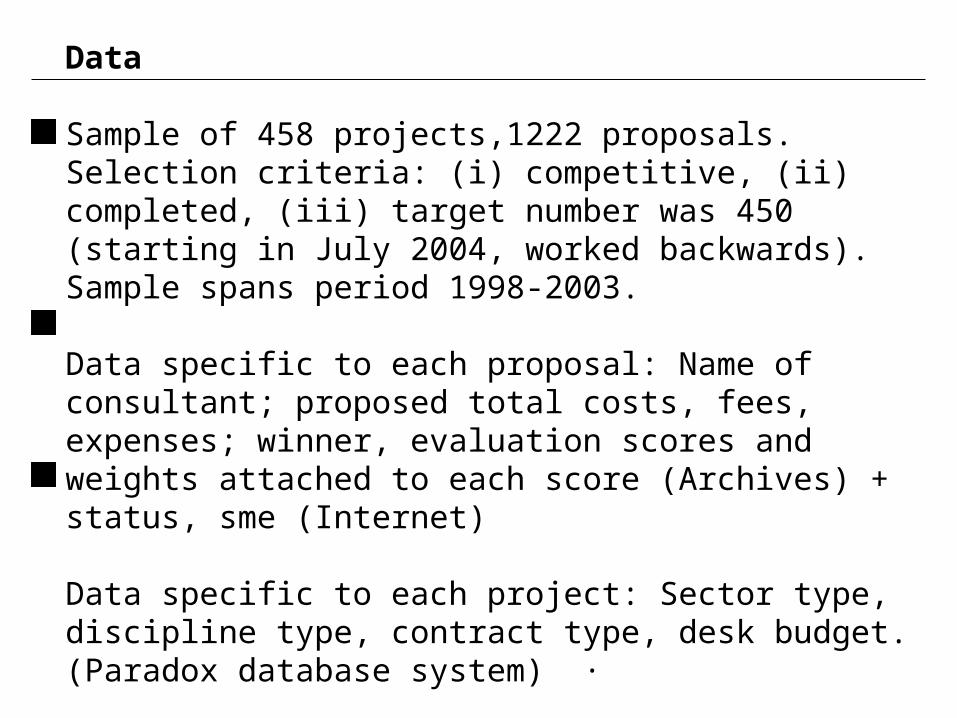
Sample of 458 projects,1222 proposals.Selection criteria: (i) competitive, (ii) completed, (iii) target number was 450 (starting in July 2004, worked backwards). Sample spans period 1998-2003.
Data specific to each proposal: Name of consultant; proposed total costs, fees, expenses; winner, evaluation scores and weights attached to each score (Archives) + status, sme (Internet)
Data specific to each project: Sector type, discipline type, contract type, desk budget.(Paradox database system) ∙
1. Type of Bidders and Success Rates
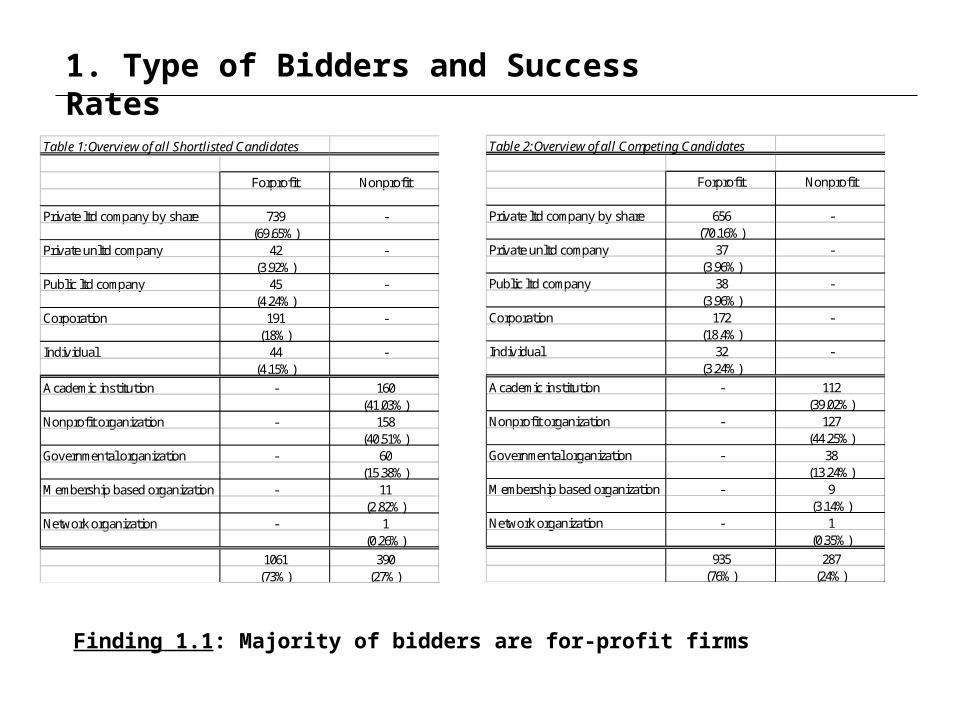
Table 1:Overview of all Shortlisted Candidates
Forprofit Nonprofit
Private ltd company by share 739 -(69.65%)
Private unltd company 42 -(3.92%)
Public ltd company 45 -(4.24%)
Corporation 191 -(18%)
Individual 44 -(4.15%)
Academic institution - 160(41.03%)
Nonprofit organization - 158(40.51%)
Governmental organization - 60(15.38%)
Membership based organization - 11(2.82%)
Network organization - 1(0.26%)
1061 390(73%) (27%)
Table 2:Overview of all Competing Candidates
Forprofit Nonprofit
Private ltd company by share 656 -(70.16%)
Private unltd company 37 -(3.96%)
Public ltd company 38 -(3.96%)
Corporation 172 -(18.4%)
Individual 32 -(3.24%)
Academic institution - 112(39.02%)
Nonprofit organization - 127(44.25%)
Governmental organization - 38(13.24%)
Membership based organization - 9(3.14%)
Network organization - 1(0.35%)
935 287(76%) (24%)
Finding 1.1: Majority of bidders are for-profit firms
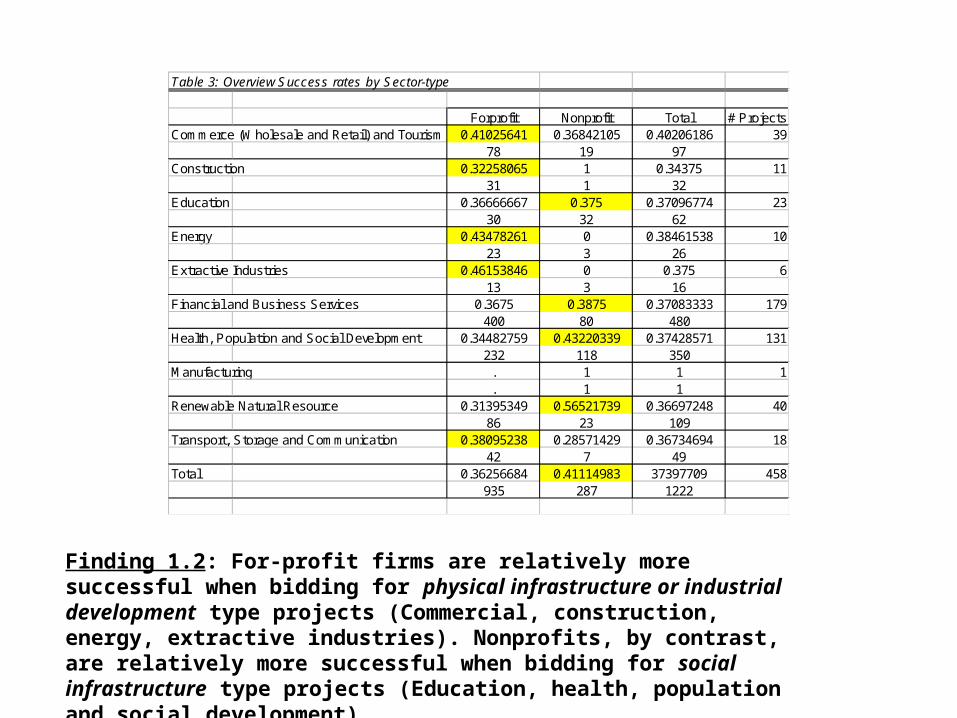
Table 3: Overview Success rates by Sector-type
Forprofit Nonprofit Total # ProjectsCommerce (Wholesale and Retail) and Tourism 0.41025641 0.36842105 0.40206186 39
78 19 97Construction 0.32258065 1 0.34375 11
31 1 32Education 0.36666667 0.375 0.37096774 23
30 32 62Energy 0.43478261 0 0.38461538 10
23 3 26Extractive Industries 0.46153846 0 0.375 6
13 3 16Financial and Business Services 0.3675 0.3875 0.37083333 179
400 80 480Health, Population and Social Development 0.34482759 0.43220339 0.37428571 131
232 118 350Manufacturing . 1 1 1
. 1 1Renewable Natural Resource 0.31395349 0.56521739 0.36697248 40
86 23 109Transport, Storage and Communication 0.38095238 0.28571429 0.36734694 18
42 7 49Total 0.36256684 0.41114983 37397709 458
935 287 1222
Finding 1.2: For-profit firms are relatively more successful when bidding for physical infrastructure or industrial development type projects (Commercial, construction, energy, extractive industries). Nonprofits, by contrast, are relatively more successful when bidding for social infrastructure type projects (Education, health, population and social development)
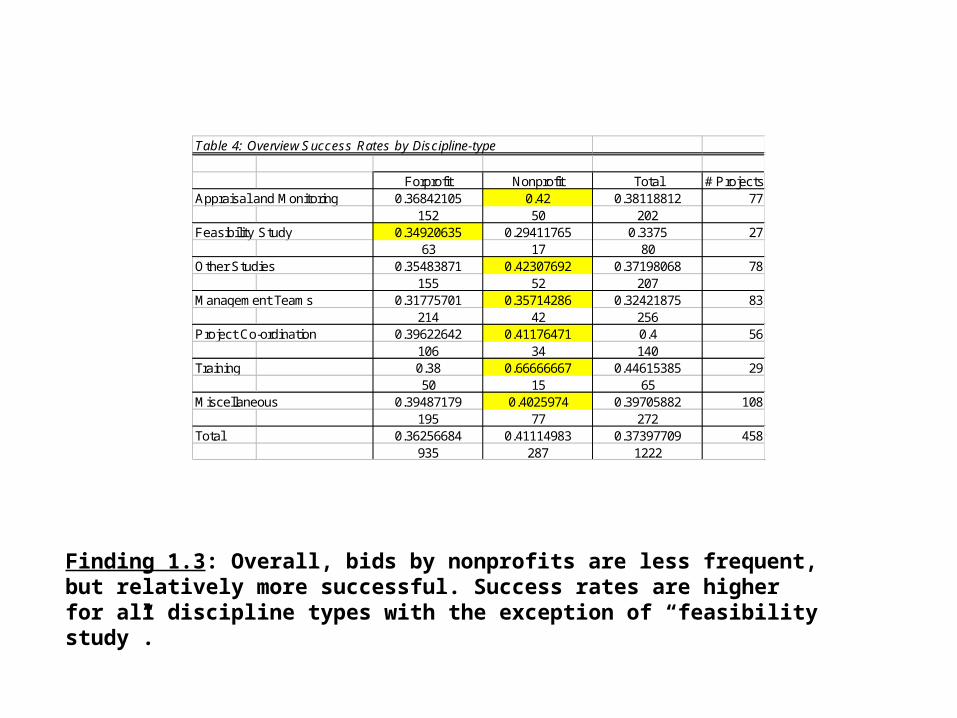
Table 4: Overview Success Rates by Discipline-type
Forprofit Nonprofit Total # ProjectsAppraisal and Monitoring 0.36842105 0.42 0.38118812 77
152 50 202Feasibility Study 0.34920635 0.29411765 0.3375 27
63 17 80Other Studies 0.35483871 0.42307692 0.37198068 78
155 52 207Management Teams 0.31775701 0.35714286 0.32421875 83
214 42 256Project Co-ordination 0.39622642 0.41176471 0.4 56
106 34 140Training 0.38 0.66666667 0.44615385 29
50 15 65Miscellaneous 0.39487179 0.4025974 0.39705882 108
195 77 272Total 0.36256684 0.41114983 0.37397709 458
935 287 1222
Finding 1.3: Overall, bids by nonprofits are less frequent, but relatively more successful. Success rates are higher for all discipline types with the exception of “feasibility study”.
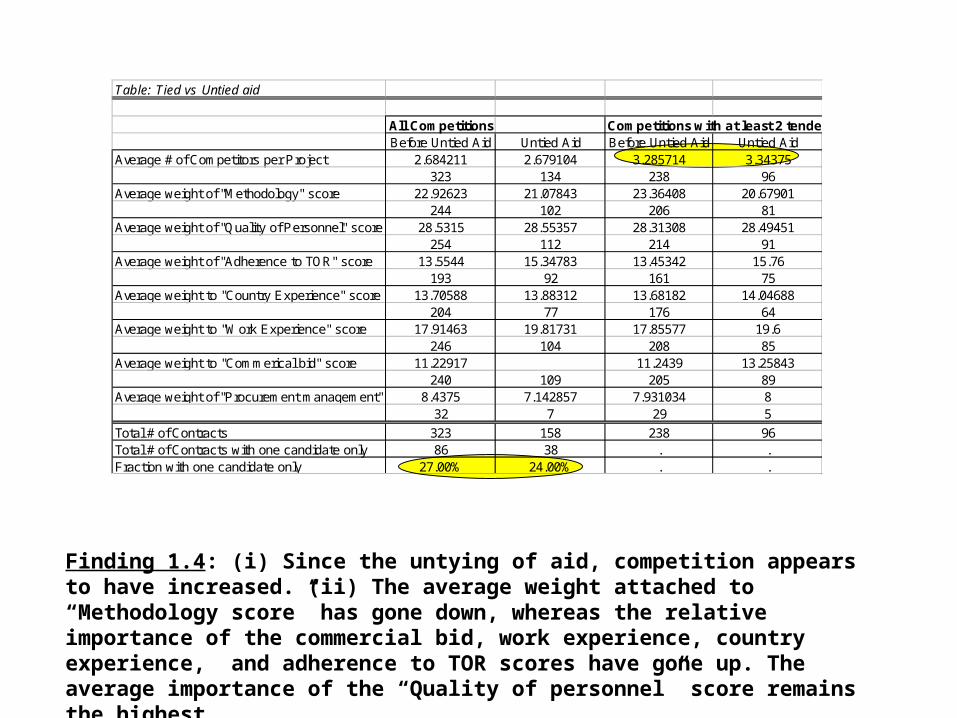
Table: Tied vs Untied aid
All Competitions Competitions with at least 2 tenderersBefore Untied Aid Untied Aid Before Untied Aid Untied Aid
Average # of Competitors per Project 2.684211 2.679104 3.285714 3.34375323 134 238 96
Average weight of "Methodology" score 22.92623 21.07843 23.36408 20.67901244 102 206 81
Average weight of "Quality of Personnel" score 28.5315 28.55357 28.31308 28.49451254 112 214 91
Average weight of "Adherence to TOR" score 13.5544 15.34783 13.45342 15.76193 92 161 75
Average weight to "Country Experience" score 13.70588 13.88312 13.68182 14.04688204 77 176 64
Average weight to "Work Experience" score 17.91463 19.81731 17.85577 19.6246 104 208 85
Average weight to "Commerical bid" score 11.22917 11.2439 13.25843240 109 205 89
Average weight of "Procurement management" score 8.4375 7.142857 7.931034 832 7 29 5
Total # of Contracts 323 158 238 96Total # of Contracts with one candidate only 86 38 . .Fraction with one candidate only 27.00% 24.00% . .
Finding 1.4: (i) Since the untying of aid, competition appears to have increased. (ii) The average weight attached to “Methodology score” has gone down, whereas the relative importance of the commercial bid, work experience, country experience, and adherence to TOR scores have gone up. The average importance of the “Quality of personnel” score remains the highest.
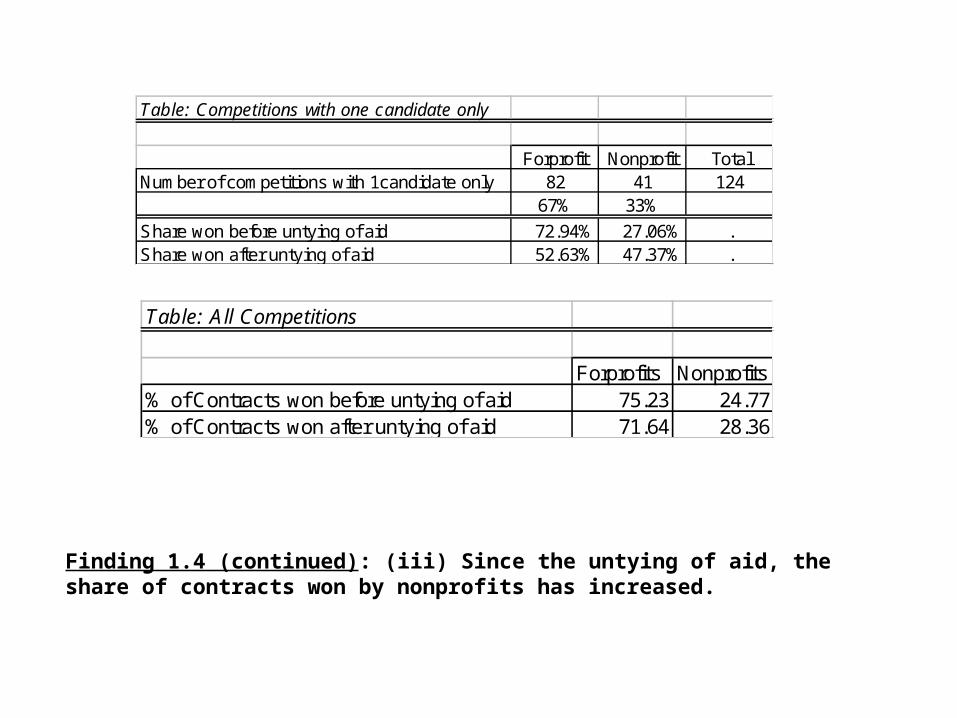
Table: Competitions with one candidate only
Forprofit Nonprofit TotalNumber of competitions with 1candidate only 82 41 124
67% 33%
Share won before untying of aid 72.94% 27.06% .Share won after untying of aid 52.63% 47.37% .
Table: All Competitions
Forprofits Nonprofits% of Contracts won before untying of aid 75.23 24.77% of Contracts won after untying of aid 71.64 28.36
Finding 1.4 (continued): (iii) Since the untying of aid, the share of contracts won by nonprofits has increased.
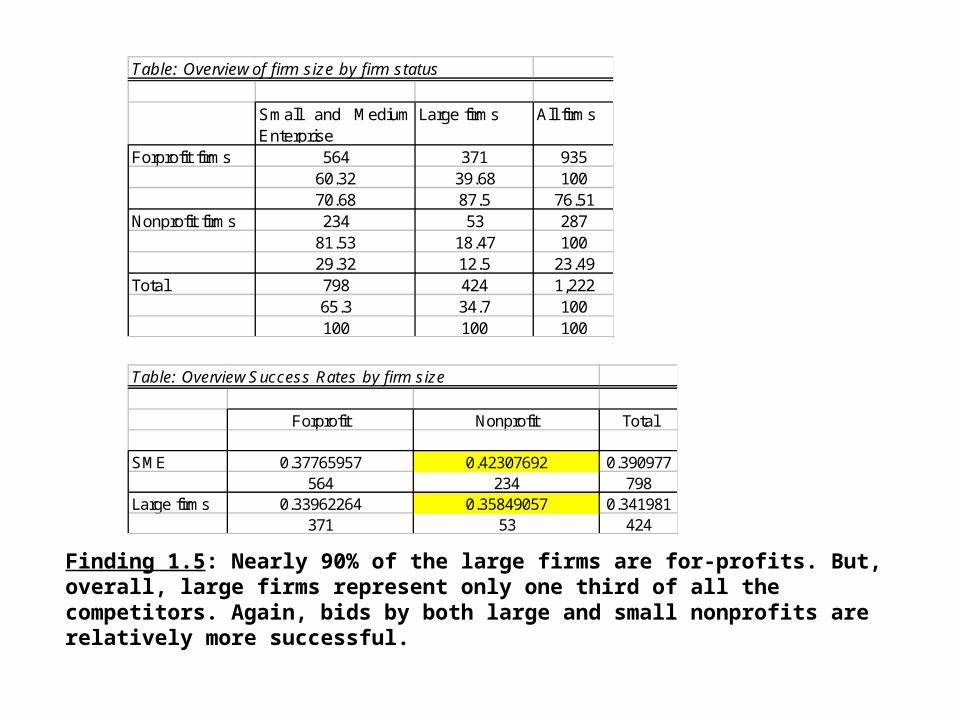
Table: Overview of firm size by firm status
Small and MediumEnterprise
Large firms All firms
Forprofit firms 564 371 93560.32 39.68 10070.68 87.5 76.51
Nonprofit firms 234 53 28781.53 18.47 10029.32 12.5 23.49
Total 798 424 1,22265.3 34.7 100100 100 100
Table: Overview Success Rates by firm size
Forprofit Nonprofit Total
SME 0.37765957 0.42307692 0.390977564 234 798
Large firms 0.33962264 0.35849057 0.341981371 53 424
Finding 1.5: Nearly 90% of the large firms are for-profits. But, overall, large firms represent only one third of all the competitors. Again, bids by both large and small nonprofits are relatively more successful.
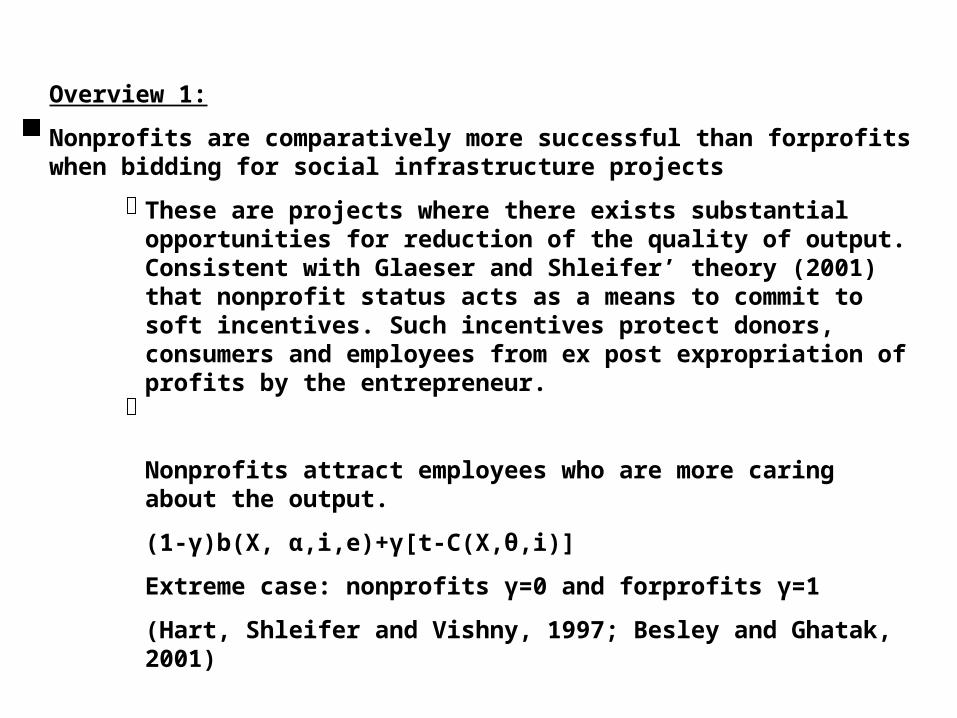
Overview 1:
Nonprofits are comparatively more successful than forprofits when bidding for social infrastructure projects
These are projects where there exists substantial opportunities for reduction of the quality of output. Consistent with Glaeser and Shleifer’ theory (2001) that nonprofit status acts as a means to commit to soft incentives. Such incentives protect donors, consumers and employees from ex post expropriation of profits by the entrepreneur.
Nonprofits attract employees who are more caring about the output.
(1-γ)b(X, α,i,e)+γ[t-C(X,θ,i)]
Extreme case: nonprofits γ=0 and forprofits γ=1
(Hart, Shleifer and Vishny, 1997; Besley and Ghatak, 2001)
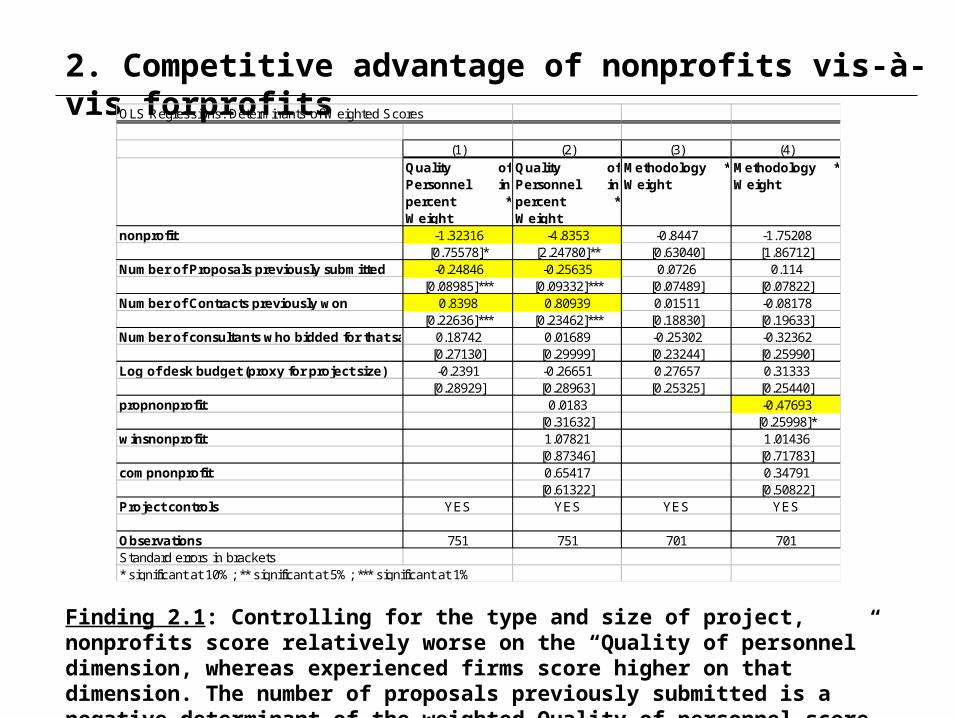
2. Competitive advantage of nonprofits vis-à-vis forprofitsOLS Regressions: Determinants of Weighted Scores
(1) (2) (3) (4)Quality ofPersonnel inpercent *Weight
Quality ofPersonnel inpercent *Weight
Methodology *Weight
Methodology *Weight
nonprofit -1.32316 -4.8353 -0.8447 -1.75208[0.75578]* [2.24780]** [0.63040] [1.86712]
Number of Proposals previously submitted -0.24846 -0.25635 0.0726 0.114[0.08985]*** [0.09332]*** [0.07489] [0.07822]
Number of Contracts previously won 0.8398 0.80939 0.01511 -0.08178[0.22636]*** [0.23462]*** [0.18830] [0.19633]
Number of consultants who bidded for that same contract0.18742 0.01689 -0.25302 -0.32362[0.27130] [0.29999] [0.23244] [0.25990]
Log of desk budget (proxy for project size) -0.2391 -0.26651 0.27657 0.31333[0.28929] [0.28963] [0.25325] [0.25440]
propnonprofit 0.0183 -0.47693[0.31632] [0.25998]*
winsnonprofit 1.07821 1.01436[0.87346] [0.71783]
compnonprofit 0.65417 0.34791[0.61322] [0.50822]
Project controls YES YES YES YES
Observations 751 751 701 701Standard errors in brackets* significant at 10%; ** significant at 5%; *** significant at 1%
Finding 2.1: Controlling for the type and size of project, nonprofits score relatively worse on the “Quality of personnel” dimension, whereas experienced firms score higher on that dimension. The number of proposals previously submitted is a negative determinant of the weighted Quality of personnel score.
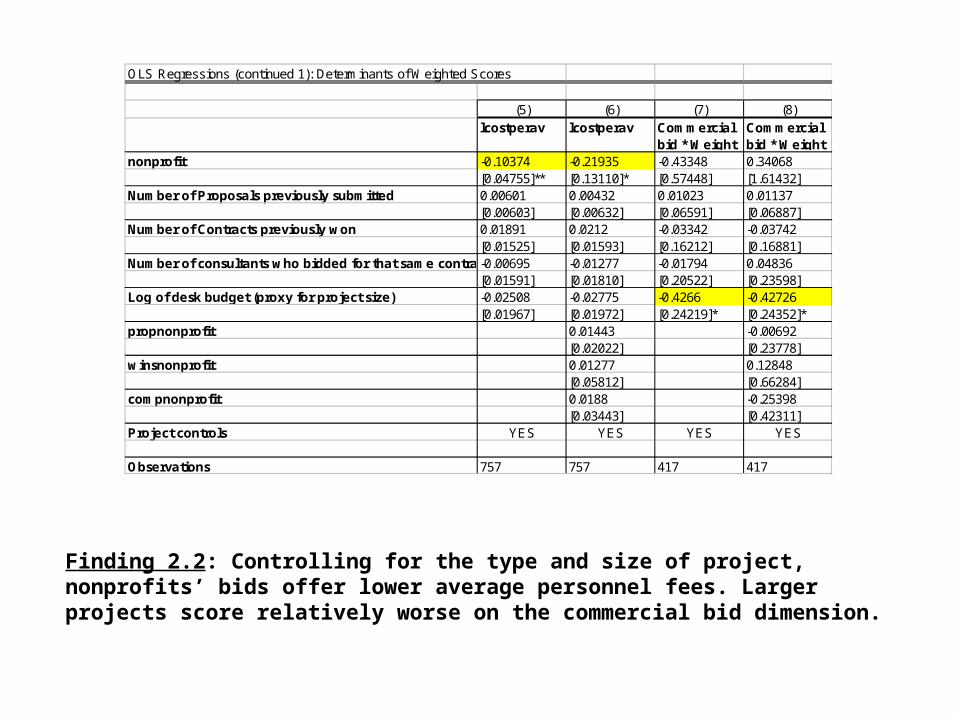
Finding 2.2: Controlling for the type and size of project, nonprofits’ bids offer lower average personnel fees. Larger projects score relatively worse on the commercial bid dimension.
OLS Regressions (continued 1): Determinants of Weighted Scores
(5) (6) (7) (8)lcostperav lcostperav Commercial
bid * WeightCommercial bid * Weight
nonprofit -0.10374 -0.21935 -0.43348 0.34068[0.04755]** [0.13110]* [0.57448] [1.61432]
Number of Proposals previously submitted 0.00601 0.00432 0.01023 0.01137[0.00603] [0.00632] [0.06591] [0.06887]
Number of Contracts previously won 0.01891 0.0212 -0.03342 -0.03742[0.01525] [0.01593] [0.16212] [0.16881]
Number of consultants who bidded for that same contract-0.00695 -0.01277 -0.01794 0.04836[0.01591] [0.01810] [0.20522] [0.23598]
Log of desk budget (proxy for project size) -0.02508 -0.02775 -0.4266 -0.42726[0.01967] [0.01972] [0.24219]* [0.24352]*
propnonprofit 0.01443 -0.00692[0.02022] [0.23778]
winsnonprofit 0.01277 0.12848[0.05812] [0.66284]
compnonprofit 0.0188 -0.25398[0.03443] [0.42311]
Project controls YES YES YES YES
Observations 757 757 417 417
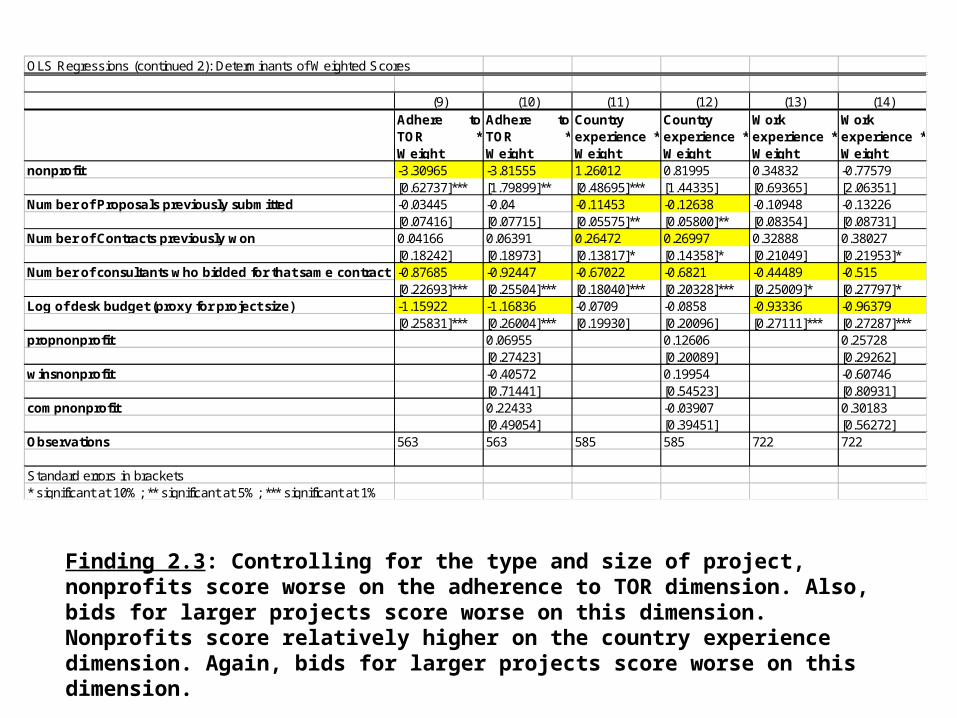
OLS Regressions (continued 2): Determinants of Weighted Scores
(9) (10) (11) (12) (13) (14)Adhere toTOR *Weight
Adhere toTOR *Weight
Country experience *Weight
Country experience *Weight
Work experience *Weight
Work experience *Weight
nonprofit -3.30965 -3.81555 1.26012 0.81995 0.34832 -0.77579[0.62737]*** [1.79899]** [0.48695]*** [1.44335] [0.69365] [2.06351]
Number of Proposals previously submitted -0.03445 -0.04 -0.11453 -0.12638 -0.10948 -0.13226[0.07416] [0.07715] [0.05575]** [0.05800]** [0.08354] [0.08731]
Number of Contracts previously won 0.04166 0.06391 0.26472 0.26997 0.32888 0.38027[0.18242] [0.18973] [0.13817]* [0.14358]* [0.21049] [0.21953]*
Number of consultants who bidded for that same contract -0.87685 -0.92447 -0.67022 -0.6821 -0.44489 -0.515[0.22693]*** [0.25504]*** [0.18040]*** [0.20328]*** [0.25009]* [0.27797]*
Log of desk budget (proxy for project size) -1.15922 -1.16836 -0.0709 -0.0858 -0.93336 -0.96379[0.25831]*** [0.26004]*** [0.19930] [0.20096] [0.27111]*** [0.27287]***
propnonprofit 0.06955 0.12606 0.25728[0.27423] [0.20089] [0.29262]
winsnonprofit -0.40572 0.19954 -0.60746[0.71441] [0.54523] [0.80931]
compnonprofit 0.22433 -0.03907 0.30183[0.49054] [0.39451] [0.56272]
Observations 563 563 585 585 722 722
Standard errors in brackets* significant at 10%; ** significant at 5%; *** significant at 1%
Finding 2.3: Controlling for the type and size of project, nonprofits score worse on the adherence to TOR dimension. Also, bids for larger projects score worse on this dimension. Nonprofits score relatively higher on the country experience dimension. Again, bids for larger projects score worse on this dimension.
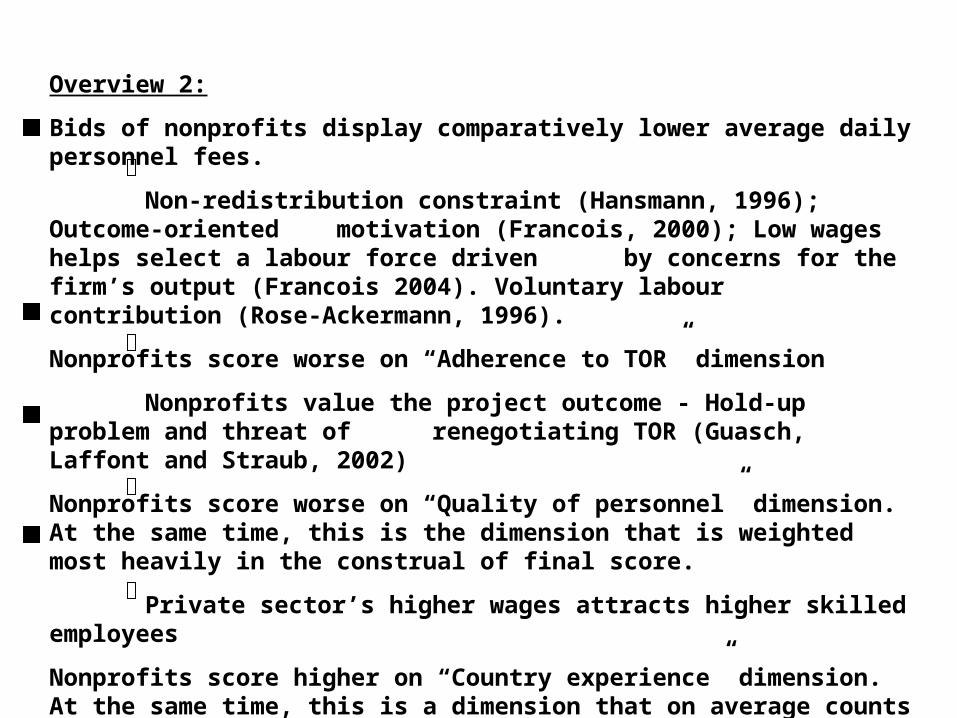
Overview 2:
Bids of nonprofits display comparatively lower average daily personnel fees.
Non-redistribution constraint (Hansmann, 1996); Outcome-oriented motivation (Francois, 2000); Low wages helps select a labour force driven by concerns for the firm’s output (Francois 2004). Voluntary labour contribution (Rose-Ackermann, 1996).
Nonprofits score worse on “Adherence to TOR” dimension
Nonprofits value the project outcome - Hold-up problem and threat of renegotiating TOR (Guasch, Laffont and Straub, 2002)
Nonprofits score worse on “Quality of personnel” dimension. At the same time, this is the dimension that is weighted most heavily in the construal of final score.
Private sector’s higher wages attracts higher skilled employees
Nonprofits score higher on “Country experience” dimension. At the same time, this is a dimension that on average counts for only 13% of the final score. Nonprofits on average exhibit greater local knowledge

3. Acquisition of Contracts and its Determinants
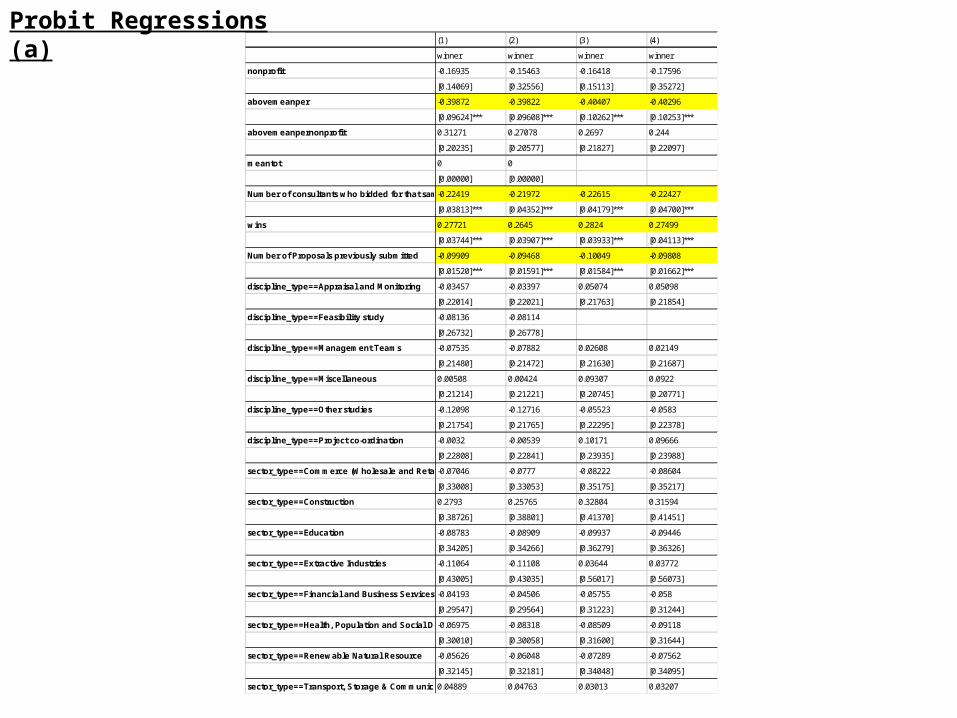
(1) (2) (3) (4)
winner winner winner winner
nonprofit -0.16935 -0.15463 -0.16418 -0.17596
[0.14069] [0.32556] [0.15113] [0.35272]
abovemeanper -0.39872 -0.39822 -0.40407 -0.40296
[0.09624]*** [0.09608]*** [0.10262]*** [0.10253]***
abovemeanpernonprofit 0.31271 0.27078 0.2697 0.244
[0.20235] [0.20577] [0.21827] [0.22097]
meantot 0 0
[0.00000] [0.00000]
Number of consultants who bidded for that same contract-0.22419 -0.21972 -0.22615 -0.22427
[0.03813]*** [0.04352]*** [0.04179]*** [0.04700]***
wins 0.27721 0.2645 0.2824 0.27499
[0.03744]*** [0.03907]*** [0.03933]*** [0.04113]***
Number of Proposals previously submitted -0.09909 -0.09468 -0.10049 -0.09808
[0.01520]*** [0.01591]*** [0.01584]*** [0.01662]***
discipline_type==Appraisal and Monitoring -0.03457 -0.03397 0.05074 0.05098
[0.22014] [0.22021] [0.21763] [0.21854]
discipline_type==Feasibility study -0.08136 -0.08114
[0.26732] [0.26778]
discipline_type==Management Teams -0.07535 -0.07882 0.02608 0.02149
[0.21480] [0.21472] [0.21630] [0.21687]
discipline_type==Miscellaneous 0.00508 0.00424 0.09307 0.0922
[0.21214] [0.21221] [0.20745] [0.20771]
discipline_type==Other studies -0.12098 -0.12716 -0.05523 -0.0583
[0.21754] [0.21765] [0.22295] [0.22378]
discipline_type==Project co-ordination -0.0032 -0.00539 0.10171 0.09666
[0.22808] [0.22841] [0.23935] [0.23988]
sector_type==Commerce (Wholesale and Retail Trade) & Tourism-0.07046 -0.0777 -0.08222 -0.08604
[0.33008] [0.33053] [0.35175] [0.35217]
sector_type==Construction 0.2793 0.25765 0.32804 0.31594
[0.38726] [0.38801] [0.41370] [0.41451]
sector_type==Education -0.08783 -0.08909 -0.09937 -0.09446
[0.34205] [0.34266] [0.36279] [0.36326]
sector_type==Extractive Industries -0.11064 -0.11108 0.03644 0.03772
[0.43005] [0.43035] [0.56017] [0.56073]
sector_type==Financial and Business Services -0.04193 -0.04506 -0.05755 -0.058
[0.29547] [0.29564] [0.31223] [0.31244]
sector_type==Health, Population and Social Development-0.06975 -0.08318 -0.08509 -0.09118
[0.30010] [0.30058] [0.31600] [0.31644]
sector_type==Renewable Natural Resource -0.05626 -0.06048 -0.07289 -0.07562
[0.32145] [0.32181] [0.34048] [0.34095]
sector_type==Transport, Storage & Communication0.04889 0.04763 0.03013 0.03207
Probit Regressions (a)
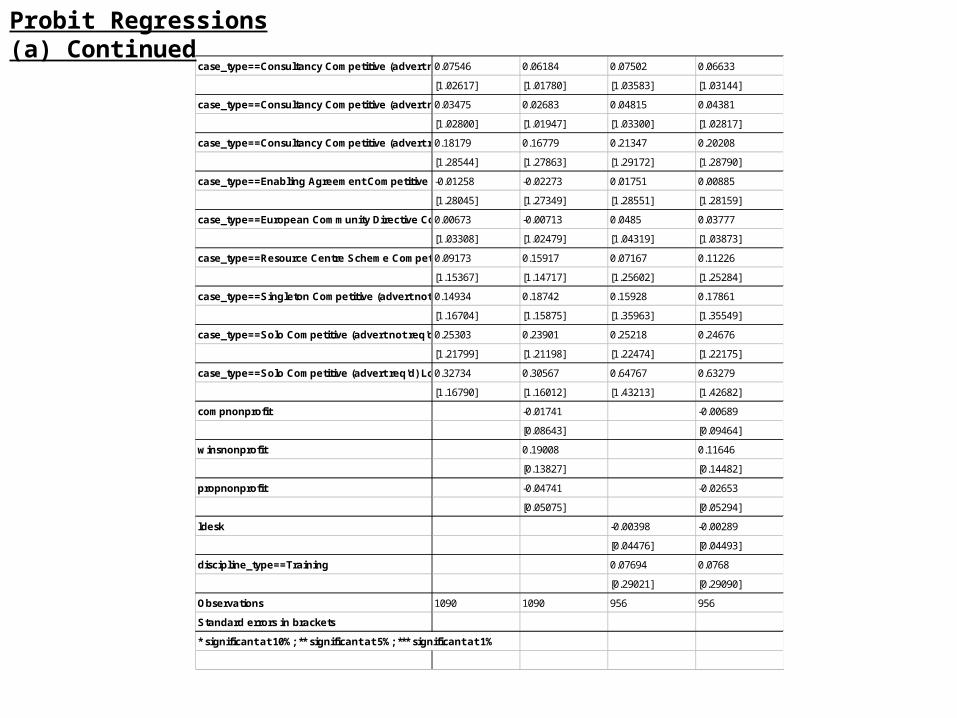
case_type==Consultancy Competitive (advert not req'd) Long Term0.07546 0.06184 0.07502 0.06633
[1.02617] [1.01780] [1.03583] [1.03144]
case_type==Consultancy Competitive (advert not req'd) Short Term0.03475 0.02683 0.04815 0.04381
[1.02800] [1.01947] [1.03300] [1.02817]
case_type==Consultancy Competitive (advert req'd) Long Term0.18179 0.16779 0.21347 0.20208
[1.28544] [1.27863] [1.29172] [1.28790]
case_type==Enabling Agreement Competitive (advert not req'd) Long Term-0.01258 -0.02273 0.01751 0.00885
[1.28045] [1.27349] [1.28551] [1.28159]
case_type==European Community Directive Competitive (advert req'd) Long Term0.00673 -0.00713 0.0485 0.03777
[1.03308] [1.02479] [1.04319] [1.03873]
case_type==Resource Centre Scheme Competitive (advert not req'd) Long Term0.09173 0.15917 0.07167 0.11226
[1.15367] [1.14717] [1.25602] [1.25284]
case_type==Singleton Competitive (advert not req'd) Long Term0.14934 0.18742 0.15928 0.17861
[1.16704] [1.15875] [1.35963] [1.35549]
case_type==Solo Competitive (advert not req'd) Long Term0.25303 0.23901 0.25218 0.24676
[1.21799] [1.21198] [1.22474] [1.22175]
case_type==Solo Competitive (advert req'd) Long Term0.32734 0.30567 0.64767 0.63279
[1.16790] [1.16012] [1.43213] [1.42682]
compnonprofit -0.01741 -0.00689
[0.08643] [0.09464]
winsnonprofit 0.19008 0.11646
[0.13827] [0.14482]
propnonprofit -0.04741 -0.02653
[0.05075] [0.05294]
ldesk -0.00398 -0.00289
[0.04476] [0.04493]
discipline_type==Training 0.07694 0.0768
[0.29021] [0.29090]
Observations 1090 1090 956 956
Standard errors in brackets
* significant at 10%; ** significant at 5%; *** significant at 1%
Probit Regressions (a) Continued
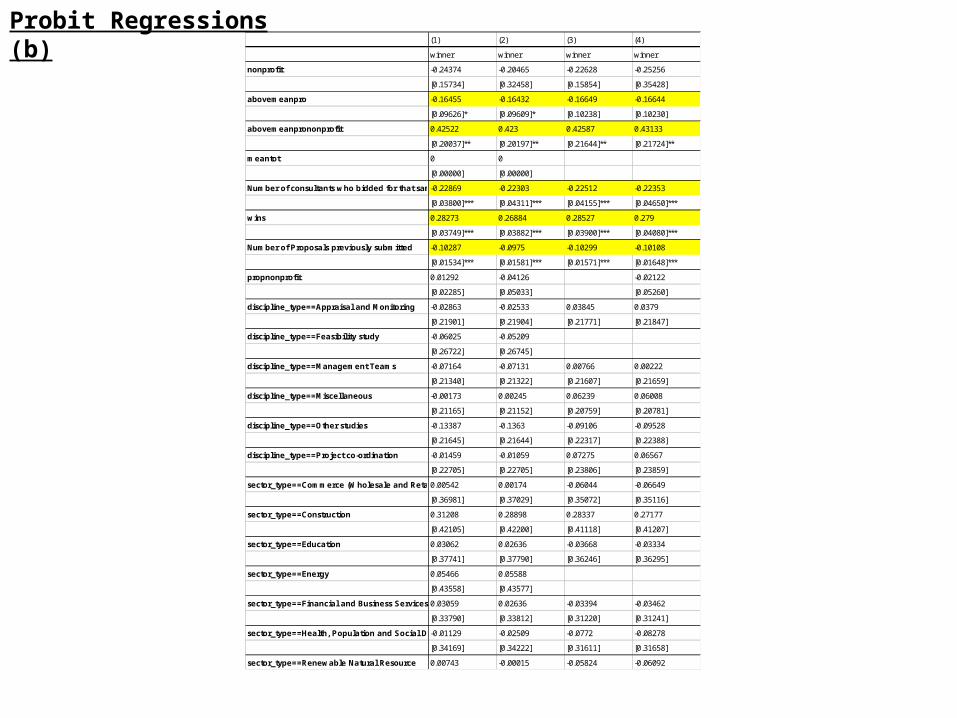
(1) (2) (3) (4)
winner winner winner winner
nonprofit -0.24374 -0.20465 -0.22628 -0.25256
[0.15734] [0.32458] [0.15854] [0.35428]
abovemeanpro -0.16455 -0.16432 -0.16649 -0.16644
[0.09626]* [0.09609]* [0.10238] [0.10230]
abovemeanprononprofit 0.42522 0.423 0.42587 0.43133
[0.20037]** [0.20197]** [0.21644]** [0.21724]**
meantot 0 0
[0.00000] [0.00000]
Number of consultants who bidded for that same contract-0.22869 -0.22303 -0.22512 -0.22353
[0.03800]*** [0.04311]*** [0.04155]*** [0.04650]***
wins 0.28273 0.26884 0.28527 0.279
[0.03749]*** [0.03882]*** [0.03900]*** [0.04080]***
Number of Proposals previously submitted -0.10287 -0.0975 -0.10299 -0.10108
[0.01534]*** [0.01581]*** [0.01571]*** [0.01648]***
propnonprofit 0.01292 -0.04126 -0.02122
[0.02285] [0.05033] [0.05260]
discipline_type==Appraisal and Monitoring -0.02863 -0.02533 0.03845 0.0379
[0.21901] [0.21904] [0.21771] [0.21847]
discipline_type==Feasibility study -0.06025 -0.05209
[0.26722] [0.26745]
discipline_type==Management Teams -0.07164 -0.07131 0.00766 0.00222
[0.21340] [0.21322] [0.21607] [0.21659]
discipline_type==Miscellaneous -0.00173 0.00245 0.06239 0.06008
[0.21165] [0.21152] [0.20759] [0.20781]
discipline_type==Other studies -0.13387 -0.1363 -0.09106 -0.09528
[0.21645] [0.21644] [0.22317] [0.22388]
discipline_type==Project co-ordination -0.01459 -0.01059 0.07275 0.06567
[0.22705] [0.22705] [0.23806] [0.23859]
sector_type==Commerce (Wholesale and Retail Trade) & Tourism0.00542 0.00174 -0.06044 -0.06649
[0.36981] [0.37029] [0.35072] [0.35116]
sector_type==Construction 0.31208 0.28898 0.28337 0.27177
[0.42105] [0.42200] [0.41118] [0.41207]
sector_type==Education 0.03062 0.02636 -0.03668 -0.03334
[0.37741] [0.37790] [0.36246] [0.36295]
sector_type==Energy 0.05466 0.05588
[0.43558] [0.43577]
sector_type==Financial and Business Services 0.03059 0.02636 -0.03394 -0.03462
[0.33790] [0.33812] [0.31220] [0.31241]
sector_type==Health, Population and Social Development-0.01129 -0.02509 -0.0772 -0.08278
[0.34169] [0.34222] [0.31611] [0.31658]
sector_type==Renewable Natural Resource 0.00743 -0.00015 -0.05824 -0.06092
Probit Regressions (b)
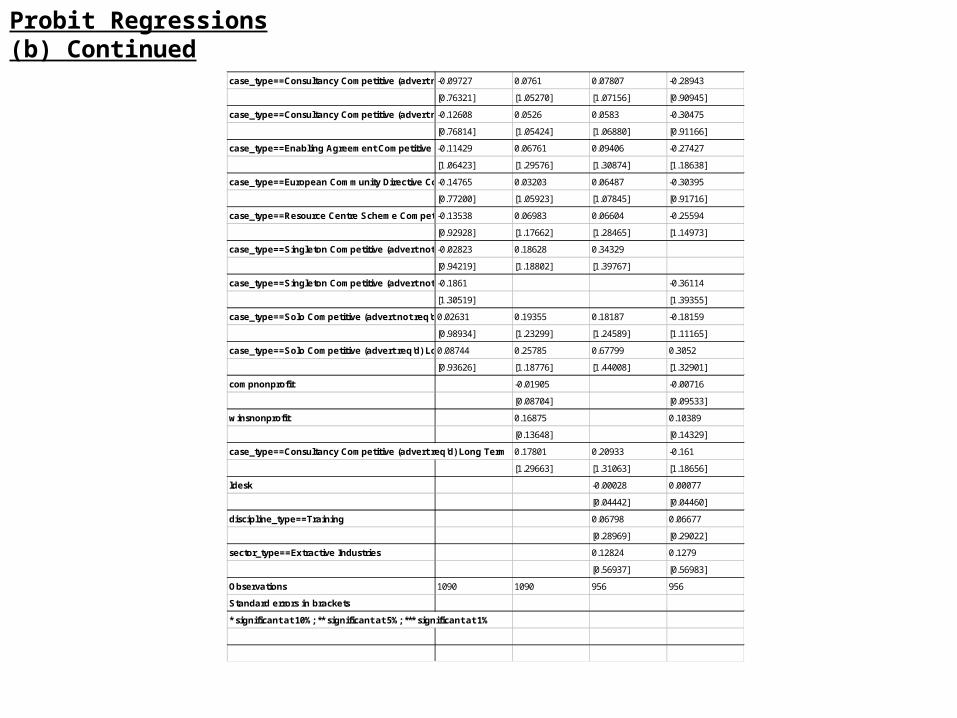
case_type==Consultancy Competitive (advert not req'd) Long Term-0.09727 0.0761 0.07807 -0.28943
[0.76321] [1.05270] [1.07156] [0.90945]
case_type==Consultancy Competitive (advert not req'd) Short Term-0.12608 0.0526 0.0583 -0.30475
[0.76814] [1.05424] [1.06880] [0.91166]
case_type==Enabling Agreement Competitive (advert not req'd) Long Term-0.11429 0.06761 0.09406 -0.27427
[1.06423] [1.29576] [1.30874] [1.18638]
case_type==European Community Directive Competitive (advert req'd) Long Term-0.14765 0.03203 0.06487 -0.30395
[0.77200] [1.05923] [1.07845] [0.91716]
case_type==Resource Centre Scheme Competitive (advert not req'd) Long Term-0.13538 0.06983 0.06604 -0.25594
[0.92928] [1.17662] [1.28465] [1.14973]
case_type==Singleton Competitive (advert not req'd) Long Term-0.02823 0.18628 0.34329
[0.94219] [1.18802] [1.39767]
case_type==Singleton Competitive (advert not req'd) Short Term-0.1861 -0.36114
[1.30519] [1.39355]
case_type==Solo Competitive (advert not req'd) Long Term0.02631 0.19355 0.18187 -0.18159
[0.98934] [1.23299] [1.24589] [1.11165]
case_type==Solo Competitive (advert req'd) Long Term0.08744 0.25785 0.67799 0.3052
[0.93626] [1.18776] [1.44008] [1.32901]
compnonprofit -0.01905 -0.00716
[0.08704] [0.09533]
winsnonprofit 0.16875 0.10389
[0.13648] [0.14329]
case_type==Consultancy Competitive (advert req'd) Long Term 0.17801 0.20933 -0.161
[1.29663] [1.31063] [1.18656]
ldesk -0.00028 0.00077
[0.04442] [0.04460]
discipline_type==Training 0.06798 0.06677
[0.28969] [0.29022]
sector_type==Extractive Industries 0.12824 0.1279
[0.56937] [0.56983]
Observations 1090 1090 956 956
Standard errors in brackets
* significant at 10%; ** significant at 5%; *** significant at 1%
Probit Regressions (b) Continued
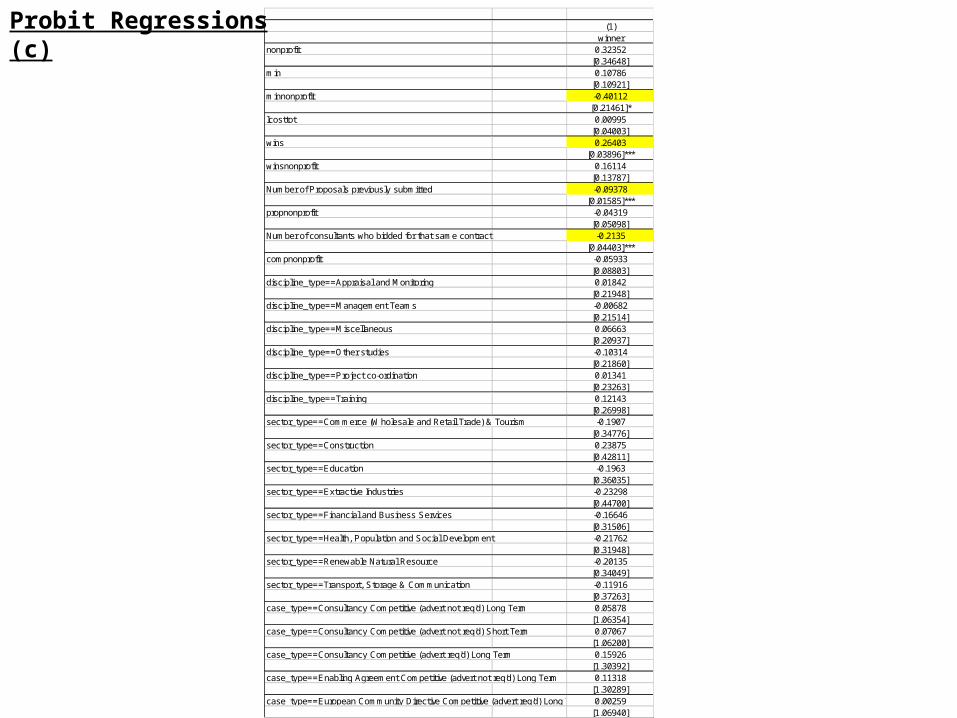
(1)winner
nonprofit 0.32352[0.34648]
min 0.10786[0.10921]
minnonprofit -0.40112[0.21461]*
lcosttot 0.00995[0.04003]
wins 0.26403[0.03896]***
winsnonprofit 0.16114[0.13787]
Number of Proposals previously submitted -0.09378[0.01585]***
propnonprofit -0.04319[0.05098]
Number of consultants who bidded for that same contract -0.2135[0.04403]***
compnonprofit -0.05933[0.08803]
discipline_type==Appraisal and Monitoring 0.01842[0.21948]
discipline_type==Management Teams -0.00682[0.21514]
discipline_type==Miscellaneous 0.06663[0.20937]
discipline_type==Other studies -0.10314[0.21860]
discipline_type==Project co-ordination 0.01341[0.23263]
discipline_type==Training 0.12143[0.26998]
sector_type==Commerce (Wholesale and Retail Trade) & Tourism -0.1907[0.34776]
sector_type==Construction 0.23875[0.42811]
sector_type==Education -0.1963[0.36035]
sector_type==Extractive Industries -0.23298[0.44700]
sector_type==Financial and Business Services -0.16646[0.31506]
sector_type==Health, Population and Social Development -0.21762[0.31948]
sector_type==Renewable Natural Resource -0.20135[0.34049]
sector_type==Transport, Storage & Communication -0.11916[0.37263]
case_type==Consultancy Competitive (advert not req'd) Long Term 0.05878[1.06354]
case_type==Consultancy Competitive (advert not req'd) Short Term 0.07067[1.06200]
case_type==Consultancy Competitive (advert req'd) Long Term 0.15926[1.30392]
case_type==Enabling Agreement Competitive (advert not req'd) Long Term 0.11318[1.30289]
case_type==European Community Directive Competitive (advert req'd) Long Term 0.00259[1.06940]
Probit Regressions (c)
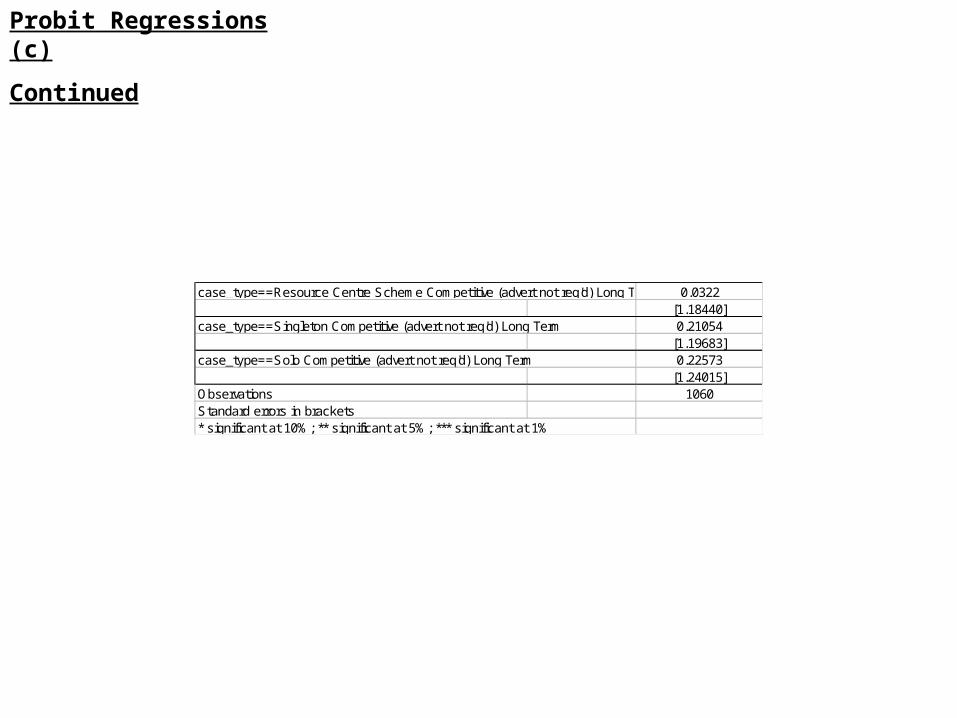
case_type==Resource Centre Scheme Competitive (advert not req'd) Long Term 0.0322[1.18440]
case_type==Singleton Competitive (advert not req'd) Long Term 0.21054[1.19683]
case_type==Solo Competitive (advert not req'd) Long Term 0.22573[1.24015]
Observations 1060Standard errors in brackets* significant at 10%; ** significant at 5%; *** significant at 1%
Probit Regressions (c)
Continued
Overview 3:
Reputation matters! At the same time, submitting many proposals lowers the likelihood of winning.
Incomplete contracts and asymmetric information
Fits well with DFID staff’s frustration that consultants are often too little specialised, tend to apply for everything
Overall, submitting bids with low project costs increases the likelihood of winning but submitting bids with below average project costs backfires for nonprofits only! If nonprofits submit the lowest cost bid, they are significantly less likely to win the project.
Trade-off between signalling high quality and exploiting cost advantage