Embed Size (px)
Citation preview
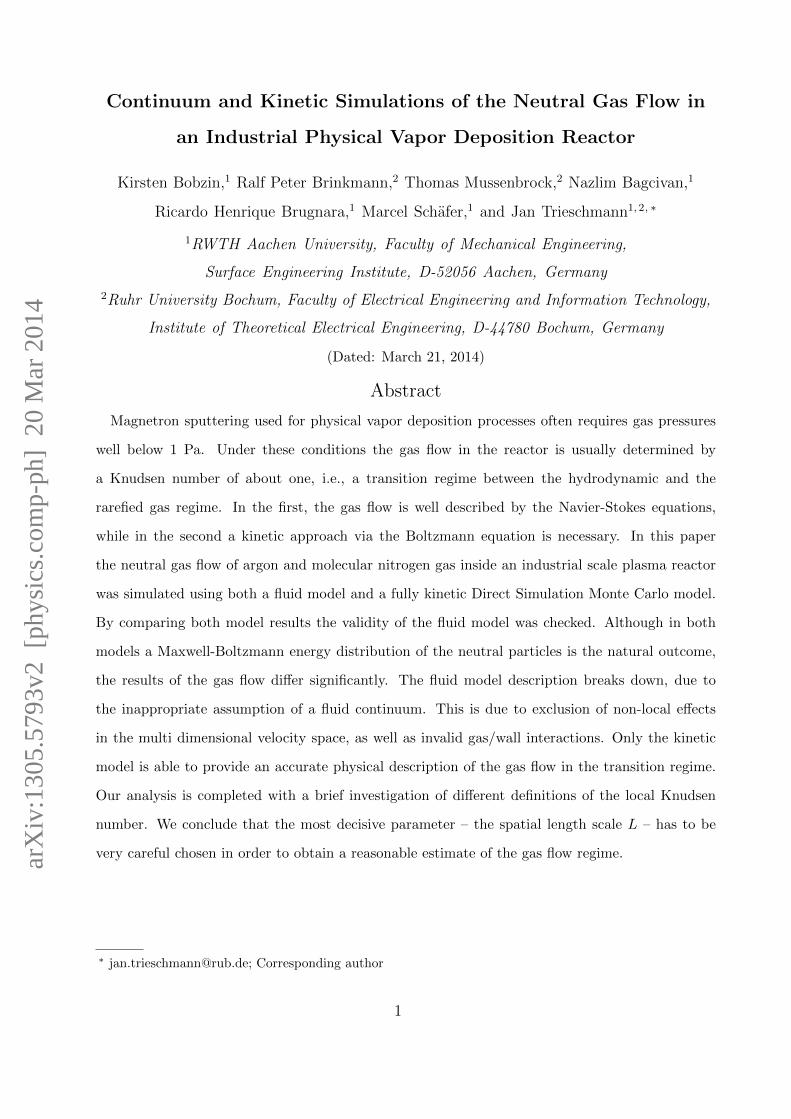
Continuum and Kinetic Simulations of the Neutral Gas Flow in
an Industrial Physical Vapor Deposition Reactor
Kirsten Bobzin,1 Ralf Peter Brinkmann,2 Thomas Mussenbrock,2 Nazlim Bagcivan,1
Ricardo Henrique Brugnara,1 Marcel Schafer,1 and Jan Trieschmann1, 2, ∗
1RWTH Aachen University, Faculty of Mechanical Engineering,
Surface Engineering Institute, D-52056 Aachen, Germany
2Ruhr University Bochum, Faculty of Electrical Engineering and Information Technology,
Institute of Theoretical Electrical Engineering, D-44780 Bochum, Germany
(Dated: March 21, 2014)
Abstract
Magnetron sputtering used for physical vapor deposition processes often requires gas pressures
well below 1 Pa. Under these conditions the gas flow in the reactor is usually determined by
a Knudsen number of about one, i.e., a transition regime between the hydrodynamic and the
rarefied gas regime. In the first, the gas flow is well described by the Navier-Stokes equations,
while in the second a kinetic approach via the Boltzmann equation is necessary. In this paper
the neutral gas flow of argon and molecular nitrogen gas inside an industrial scale plasma reactor
was simulated using both a fluid model and a fully kinetic Direct Simulation Monte Carlo model.
By comparing both model results the validity of the fluid model was checked. Although in both
models a Maxwell-Boltzmann energy distribution of the neutral particles is the natural outcome,
the results of the gas flow differ significantly. The fluid model description breaks down, due to
the inappropriate assumption of a fluid continuum. This is due to exclusion of non-local effects
in the multi dimensional velocity space, as well as invalid gas/wall interactions. Only the kinetic
model is able to provide an accurate physical description of the gas flow in the transition regime.
Our analysis is completed with a brief investigation of different definitions of the local Knudsen
number. We conclude that the most decisive parameter – the spatial length scale L – has to be
very careful chosen in order to obtain a reasonable estimate of the gas flow regime.
∗ [email protected]; Corresponding author
1
arX
iv:1
305.
5793
v2 [
phys
ics.
com
p-ph
] 2
0 M
ar 2
014
I. INTRODUCTION
Physical Vapor Deposition (PVD) processes, such as the well established cathodic arc
evaporation (CAE) and DC Magnetron Sputtering (DC-MS), as well as the promising High
Power Pulsed Magnetron Sputtering (HPPMS, often referred to as HiPIMS) technology can
be used for the production of hard protective coatings in corrosion and wear resistance appli-
cations [1–3]. In this context a uniform layer of coating material is an essential requirement.
To optimize industrial PVD processes in terms of the quality of the obtained coatings, it is
important to understand not only the discharge characteristics, but moreover to obtain a
detailed picture of the neutral gas flow inside the reactor chamber.
The governing parameter commonly used for the analysis and the characterization of the
gas flow regime is the Knudsen number Kn [4, 5]. Kn allows to approximately estimate the
flow regime in a given setup by specifying the degree of gas rarefaction [5]. It is commonly
defined as the ratio of the mean free path λ to a representative (but local) spatial scale L,
Kn =λ
L. (1)
In a gas in an equilibrium state with number density n, the mean free path can be estimated
by λ =(nσ√
2)−1
, where the hard sphere collision cross section σ = πd2 may be used. A
representative length scale L can be chosen based on geometric considerations. Moreover,
following Boyd et al. [6] it can be defined through the normalized gradient of a local flow
property Q by L = |Q|/|∇Q|. Bird suggests a choice of Q based on the mass density
Q = ρ = mn [4]. This is unfeasible for incompressible flows, which can be assumed in the
case investigated (with a low Mach number of at maximum M = |~v|/c ≈ 0.15). Thus we
choose the momentum as the characteristic flow property Q = ρ~v. This choice of Kn based
on either the geometric or the gradient approach is addressed in a later context.
Regarding the analysis of the flow regime based on Kn, the following distinctions can
be made: for Kn ≤ 0.1, continuum models based on the Navier-Stokes equations – usually
implemented in computational fluid dynamic (CFD) simulations – allow for a precise descrip-
tion of the gas flow. Such CFD models have found widespread applications in manifold areas
of aerospace and automotive engineering [7, 8]. In contrast, in situations where Kn > 0.1
the Navier-Stokes equations prove inadequate for the description of rarefied gas flows, e.g.,
in micro/nano scale gas flows [9, 10], or in gas flows commonly used in low pressure PVD
applications. This is due to non-local effects in the multi dimensional velocity space, as
2
well as inappropriate treatment of gas/wall interactions. Moreover, in plasma processing a
continuum representation (implying a Maxwell-Boltzmann energy distribution) is likely not
valid, due to the interaction of neutral gas particles with non-equilibrium species (heavy
particle, or electrons), leading to an overall non-equilibrium situation. Under rarefied condi-
tions, in general, only kinetic models based on the Boltzmann equation provide an accurate
description. Such scenarios are often solved by means of the Direct Simulation Monte Carlo
(DSMC) method proposed by Bird [4]. At very low pressures where a stochastic descrip-
tion of the particle interaction with the background gas is justified, the Test Particle Monte
Carlo (TPMC) method [11] is most commonly used. When using the DSMC method the
Boltzmann equation is directly solved by means of following the trajectory of a sufficiently
large number of pseudo-particles subject to collisions among themselves, as well as with the
surrounding walls. It is interesting to note that, although hydrodynamic and Monte Carlo
methods have been studied extensively [12–16], generalized limitations for the validity of the
different models in the transition regime 0.01 < Kn < 2 are not given.
The aim of this work is to discuss the validity of a conventional continuum model in the
transition regime. For the analysis we apply the commercially available continuum fluid
solver FLUENT [17]. In order to allow for a detailed comparison, we have modified –
with respect to boundary conditions – the DSMC solver dsmcFoam [18–20]. In this work we
analyze the neutral gas flow inside a reactor chamber used for DC-MS and HPPMS processes.
We present a brief description of the investigated reactor system and motivate our analysis
of the two different numerical algorithms. We give a short review of both numerical models.
A detailed discussion of simulation results of the identical vacuum setup obtained via the
two models is provided. Finally, the results are summarized and a conclusion is drawn. We
provide suggestions on the validity of either continuum solution based CFD simulations and
kinetic models.
II. SETUP
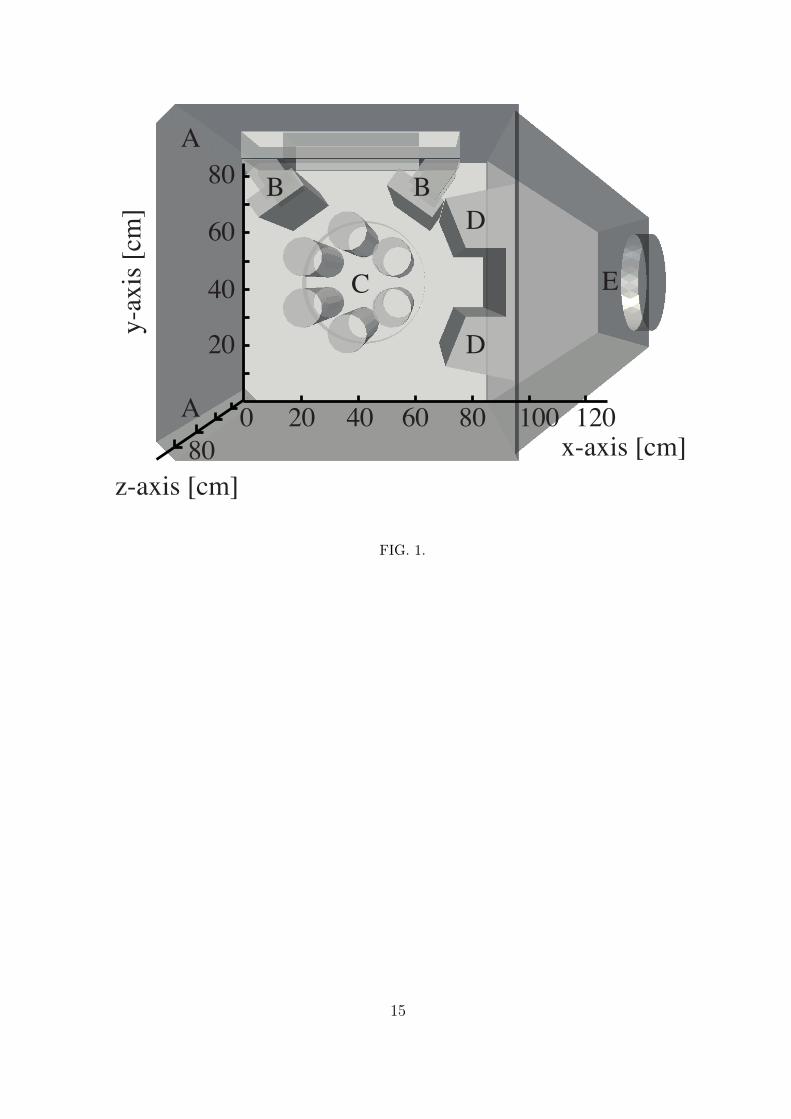
The CemeCon CC800/9 Custom coating unit, investigated in this work, is typically used
for DC-MS and HPPMS processes. As illustrated in figure 1, the main processing chamber
has a floor space of 85 × 85 cm2. Additionally, the main chamber is extended towards the
pump by a narrowing pump chamber. While the gas inlets (A) are along two of the corners
3
of the main chamber at the left side, the pump (E) is mounted at the large flange at the right
side. Inside the main chamber there are six sample holders (C). These sample holders can
be static or rotating using a planetary gearing. Behind the sample holders two magnetron
cathodes (B) are mounted. The main chamber and the pump chamber are separated by
a heater (D). The coating unit is typically operated at pressures around 0.5 Pa. For this
study we assume that argon is used as process gas at a flow rate of FAr = 200 sccm, while
(molecular) nitrogen is used as reactive gas at a flow rate of FN2 = 40 sccm. All walls are
assumed to have a constant temperature of T = 300 K.
From geometric considerations, the typical geometric dimension L ranges from about
one centimeter (e.g., at small features, the substrates and cathodes) up to a few tens of
centimeters (at open space in the vacuum chamber). Additionally, for the pressure of 500
mPa, a mean free path of λ ≈ 1.39 cm can be approximated for an equilibrium gas assuming
a molecular diameter of d = 3.664 A for argon [21]. In consequence, one finds the Knudsen
number Kn = λ/L in the limits 0.05 < Kn < 1.5. While the lower limit suggests that
continuum models can be readily used for a numerical analysis, the upper limit enforces
that only a kinetic treatment of particles is valid for a description of the gas flow. In the
transition regime, however, no definite statement can be made. Therefore, to gain insight in
the gas flow – and the models – an investigation of results from a continuum model based
on the Navier-Stokes equations, as well as a kinetic DSMC simulation model, is desired.
III. NUMERICAL MODELS
The modeling of magnetron sputtering processes, involving the interaction of plasma with
neutral background gas (in this work argon and molecular nitrogen), as well as the interaction
of heavy particles with target materials (sputtering) and walls/substrates (deposition) is
of very complex nature. Several authors have investigated the theoretical background of
sputtering processes in terms of the plasma/wall interaction [22–24], the description of the
deposition of sputtered material on substrates and walls (including the chemical interaction
with gas phase species) [25–27], as well as the analysis of the plasma, particularly for HPPMS
processes [28–31]. The numerical investigations are often based on particle based models [32–
39]. In this work, we concentrate on the neutral gas flow; the interaction of the neutral gas
with charged particles from the plasma, energetic heavy particles sputtered off the targets
4
(e.g., gas rarefaction effects) [40], as well as the resulting interaction with the walls (i.e., the
deposition process) are intentionally left for a later analysis. For our analysis we employ the
CFD software FLUENT and a modified version of the DSMC implementation dsmcFoam
provided with the freely available OpenFOAM simulation package [20].
For the CFD simulations, the FLUENT software release 14 [17] is used. We simulate the
gas flow using a pressure based fluid model using the PISO method [8]. Additional we use
a RNG k-epsilon turbulence model [41] for robust convergence. For further improvement
of the numerical solution scheme, two neighbor and two skewness correction iterations are
applied, respectively. The ideal gas law is used to obtain the gas density from the pressure
and the gas temperature. The walls are described by slip boundary conditions. As for the
parameters, we set a mass flux and the wall temperature corresponding to the flow rate and
temperature specified in the setup description. We further set the boundary condition at
the pump to p = 430 mPa.
The DSMC method is based on the idea that a sufficiently large number of pseudo-
particles (also referred to as simulators) is kinetically simulated, interacting among each
other by means of a given set of collision processes [4]. In this ensemble (here in the
converged state approximately 8 million simulators), each pseudo-particle represents a large
number of physical particles, in our case 1013. By the original authors of dsmcFoam, the
solver was benchmarked against a number of examples from the literature [18] and was
used for various studies of rarefied gas flow [9, 10]. In version 2.1.1 used for this analysis,
the implementation provides a simulation tool with the capabilities for arbitrary 2D/3D
geometries, an arbitrary number of gas species, variable hard sphere (VHS) collisions, Larsen-
Borgnakke internal energy redistribution, and it allows for unlimited parallel processing
[4, 18]. The original code has been modified to allow for appropriate boundary conditions
for both gas species in the present problem: at the gas inlets mass flow rates are specified
and at the outlet/pump an absorption probability allows to indirectly assign the pressure
inside the vacuum chamber. If a particle hits the pump surface, with a probability αabs it is
removed from the simulation domain; otherwise it is thermally re-emitted into the volume.
This procedure is performed for both species, argon and molecular nitrogen, respectively.
In consequence, the modified version of dsmcFoam allows to simulate the neutral gas flow
inside arbitrary bounded geometries. Regarding the specified parameters, we again assume
a mass flux and wall temperature as presented above. Further we set the absorption rate at
5
the pump to a pressure-fitted value of αabs = 17.25%. For the VHS collision cross sections we
use the values suggested by [4]. The Larsen-Borgnakke scheme for redistribution of internal
energies is applied only to species with internal degrees of freedom available, which in our
case – due to its diatomic nature – does affect only the molecular nitrogen. In addition,
we assume complete thermalization of the particles once they impinge on the walls. To
accurately describe the temporal and spatial dynamics, we apply a time-step size of ∆t = 25
µs (a fraction of the mean collision time) and a typical cell size of about ∆x ≈ 1− 2 cm (at
maximum approximately the mean free path).
Due to the fundamental “ab-initio” treatment a DSMC model describes the gas flow in
the transition regime more accurately compared to CFD models. This holds particularly
for particle/wall interactions. This hypothesis will be verified in the next section, where we
present 3D simulation results for the CC800/9 Custom coating unit. For both numerical
approaches the same geometry has been used.
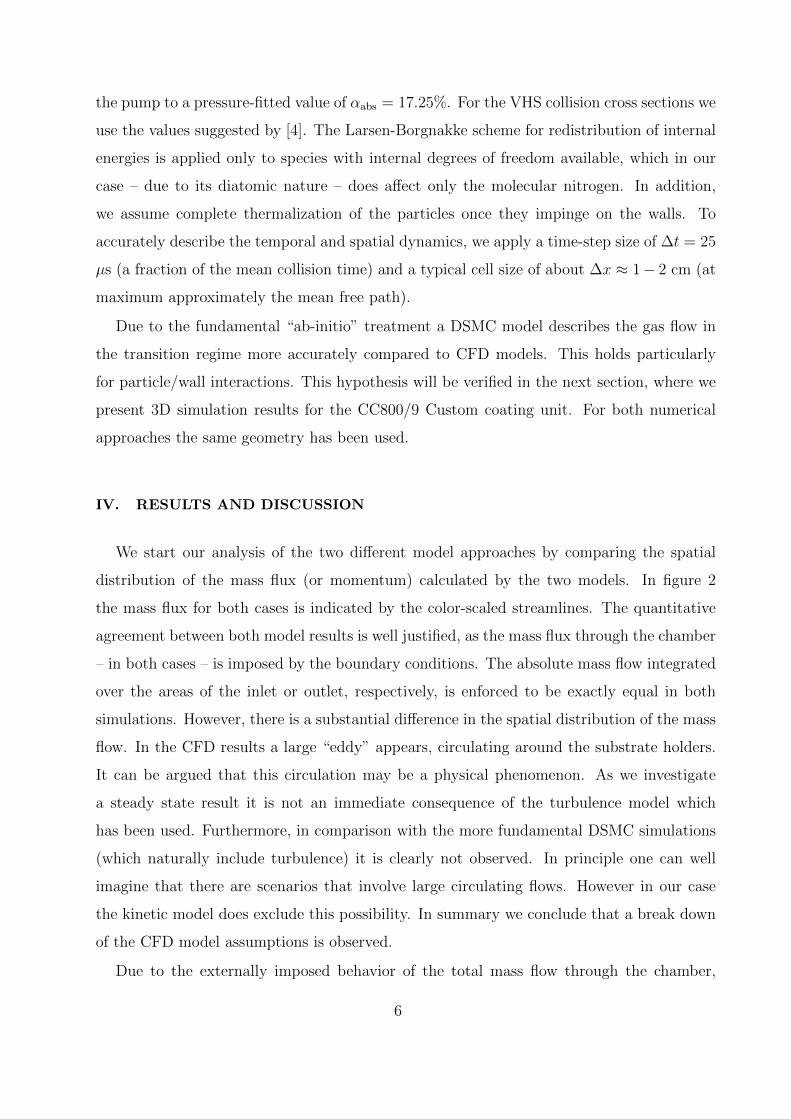
IV. RESULTS AND DISCUSSION
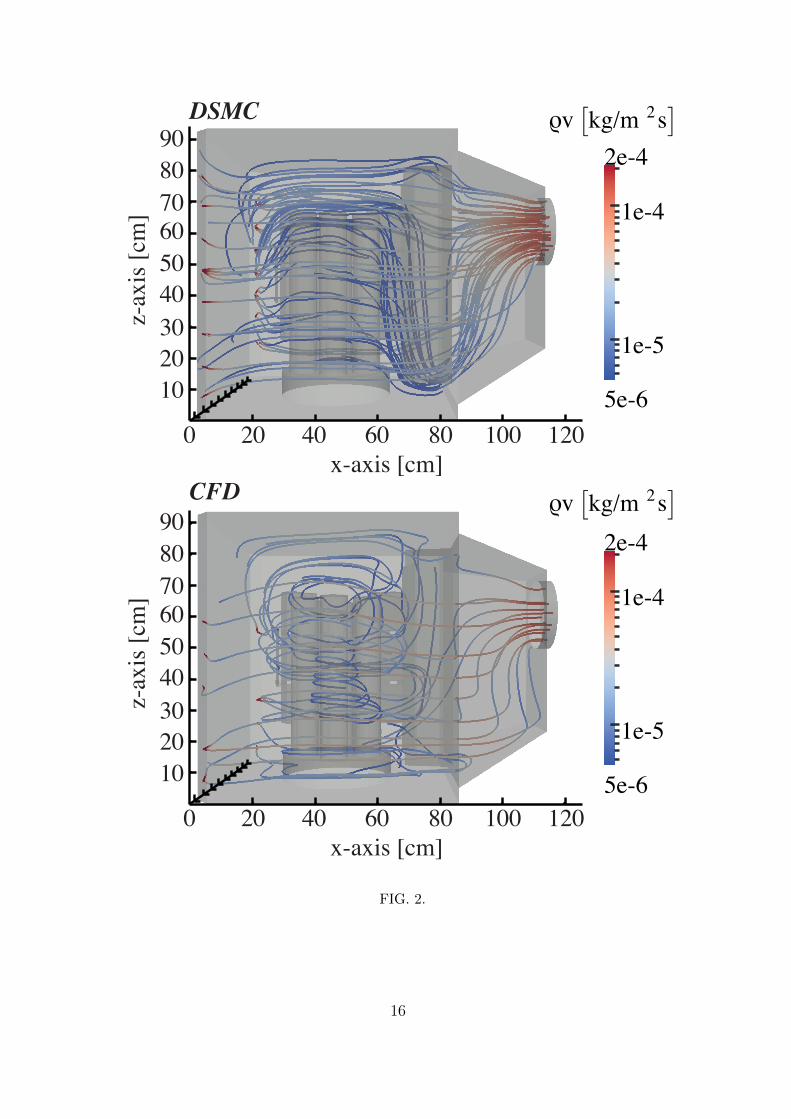
We start our analysis of the two different model approaches by comparing the spatial
distribution of the mass flux (or momentum) calculated by the two models. In figure 2
the mass flux for both cases is indicated by the color-scaled streamlines. The quantitative
agreement between both model results is well justified, as the mass flux through the chamber
– in both cases – is imposed by the boundary conditions. The absolute mass flow integrated
over the areas of the inlet or outlet, respectively, is enforced to be exactly equal in both
simulations. However, there is a substantial difference in the spatial distribution of the mass
flow. In the CFD results a large “eddy” appears, circulating around the substrate holders.
It can be argued that this circulation may be a physical phenomenon. As we investigate
a steady state result it is not an immediate consequence of the turbulence model which
has been used. Furthermore, in comparison with the more fundamental DSMC simulations
(which naturally include turbulence) it is clearly not observed. In principle one can well
imagine that there are scenarios that involve large circulating flows. However in our case
the kinetic model does exclude this possibility. In summary we conclude that a break down
of the CFD model assumptions is observed.
Due to the externally imposed behavior of the total mass flow through the chamber,
6
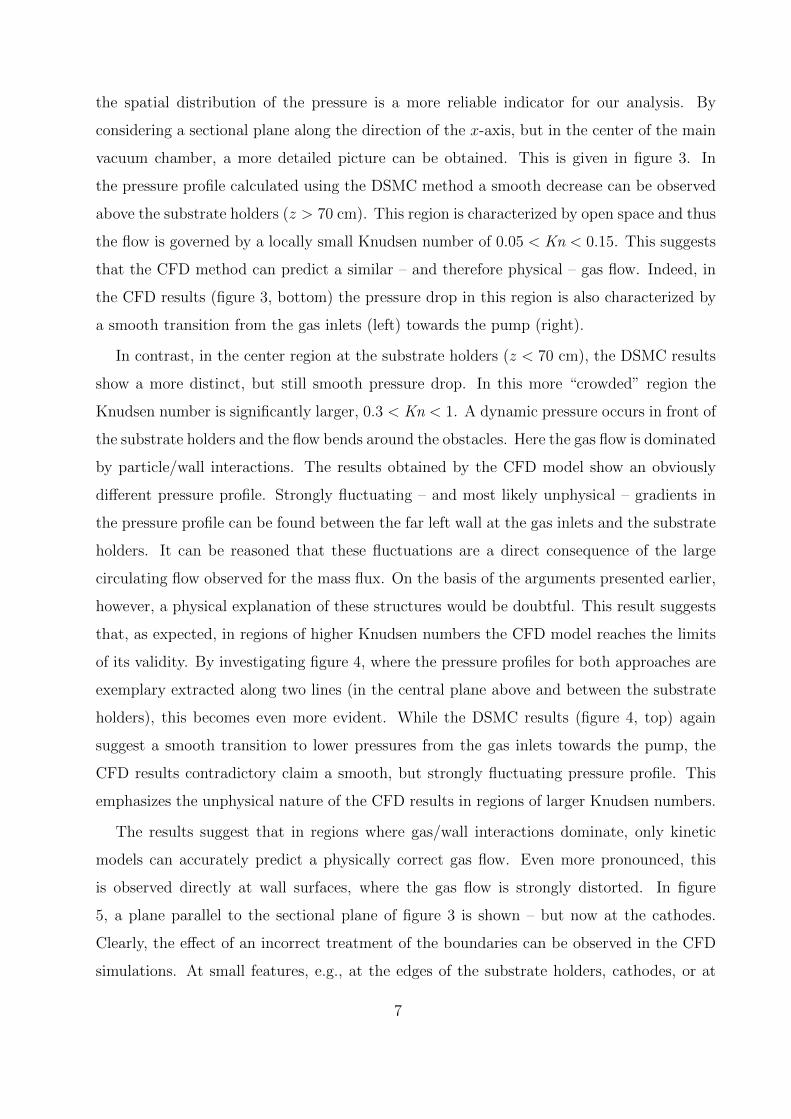
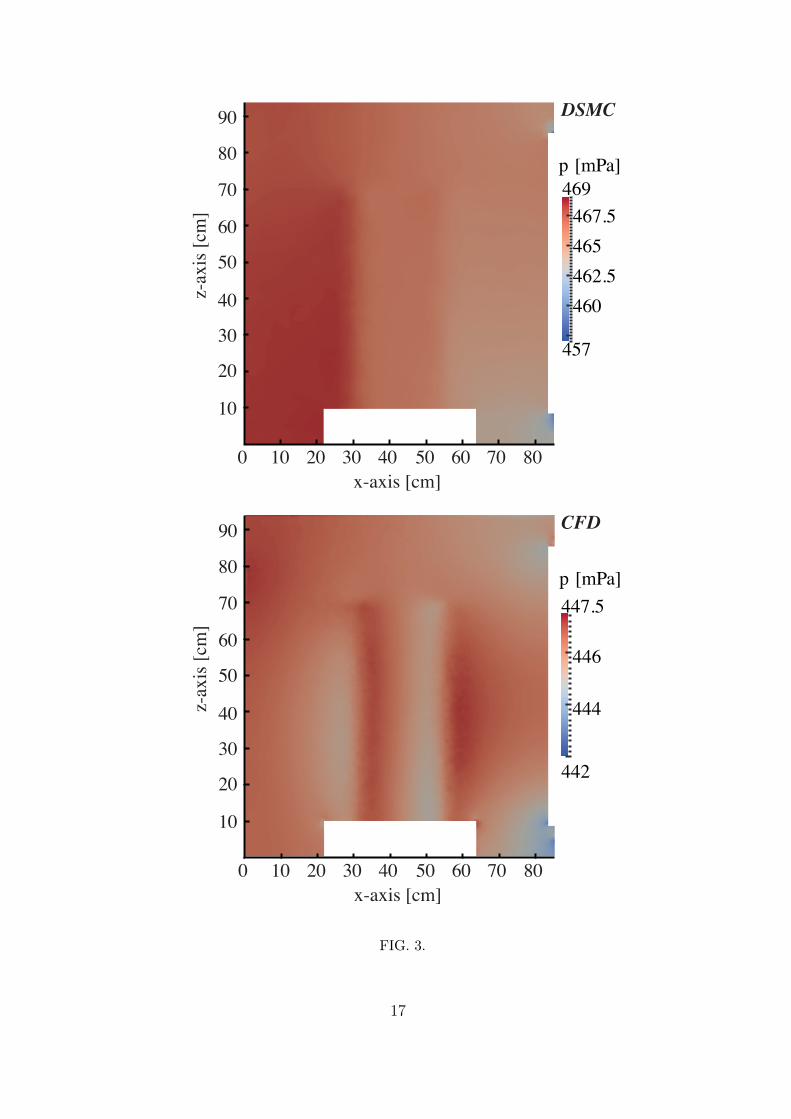
the spatial distribution of the pressure is a more reliable indicator for our analysis. By
considering a sectional plane along the direction of the x-axis, but in the center of the main
vacuum chamber, a more detailed picture can be obtained. This is given in figure 3. In
the pressure profile calculated using the DSMC method a smooth decrease can be observed
above the substrate holders (z > 70 cm). This region is characterized by open space and thus
the flow is governed by a locally small Knudsen number of 0.05 < Kn < 0.15. This suggests
that the CFD method can predict a similar – and therefore physical – gas flow. Indeed, in
the CFD results (figure 3, bottom) the pressure drop in this region is also characterized by
a smooth transition from the gas inlets (left) towards the pump (right).
In contrast, in the center region at the substrate holders (z < 70 cm), the DSMC results
show a more distinct, but still smooth pressure drop. In this more “crowded” region the
Knudsen number is significantly larger, 0.3 < Kn < 1. A dynamic pressure occurs in front of
the substrate holders and the flow bends around the obstacles. Here the gas flow is dominated
by particle/wall interactions. The results obtained by the CFD model show an obviously
different pressure profile. Strongly fluctuating – and most likely unphysical – gradients in
the pressure profile can be found between the far left wall at the gas inlets and the substrate
holders. It can be reasoned that these fluctuations are a direct consequence of the large
circulating flow observed for the mass flux. On the basis of the arguments presented earlier,
however, a physical explanation of these structures would be doubtful. This result suggests
that, as expected, in regions of higher Knudsen numbers the CFD model reaches the limits
of its validity. By investigating figure 4, where the pressure profiles for both approaches are
exemplary extracted along two lines (in the central plane above and between the substrate
holders), this becomes even more evident. While the DSMC results (figure 4, top) again
suggest a smooth transition to lower pressures from the gas inlets towards the pump, the
CFD results contradictory claim a smooth, but strongly fluctuating pressure profile. This
emphasizes the unphysical nature of the CFD results in regions of larger Knudsen numbers.
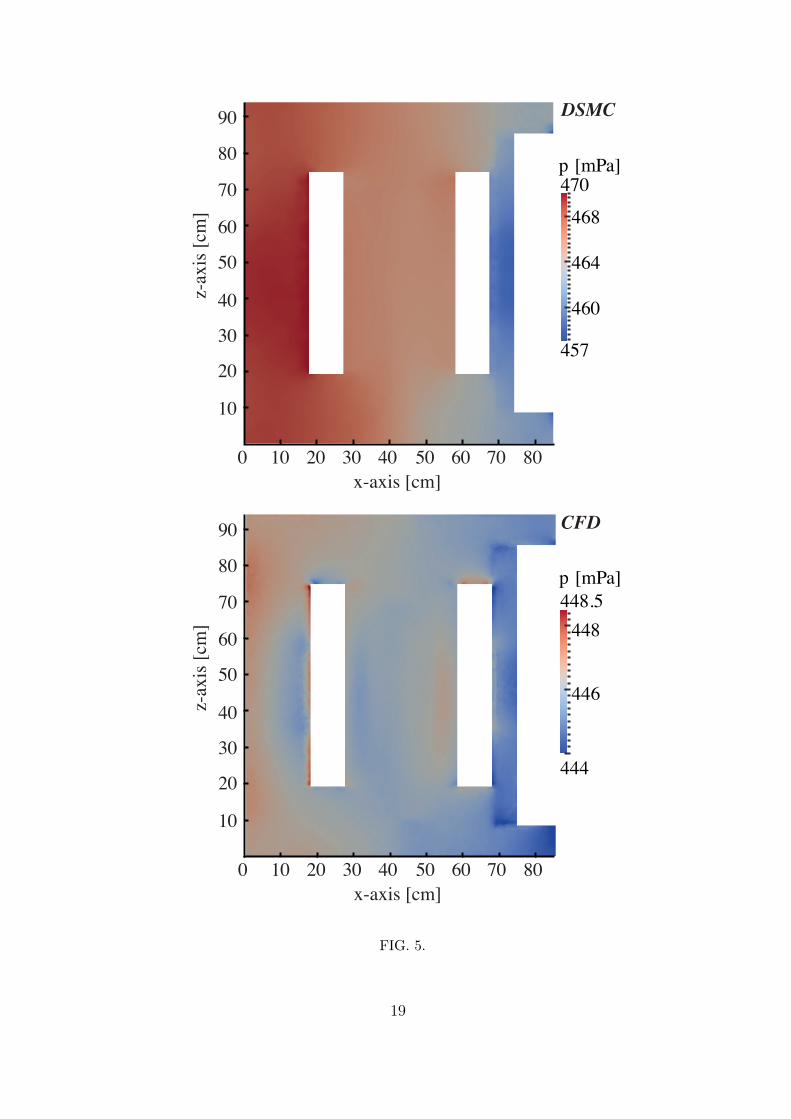
The results suggest that in regions where gas/wall interactions dominate, only kinetic
models can accurately predict a physically correct gas flow. Even more pronounced, this
is observed directly at wall surfaces, where the gas flow is strongly distorted. In figure
5, a plane parallel to the sectional plane of figure 3 is shown – but now at the cathodes.
Clearly, the effect of an incorrect treatment of the boundaries can be observed in the CFD
simulations. At small features, e.g., at the edges of the substrate holders, cathodes, or at
7
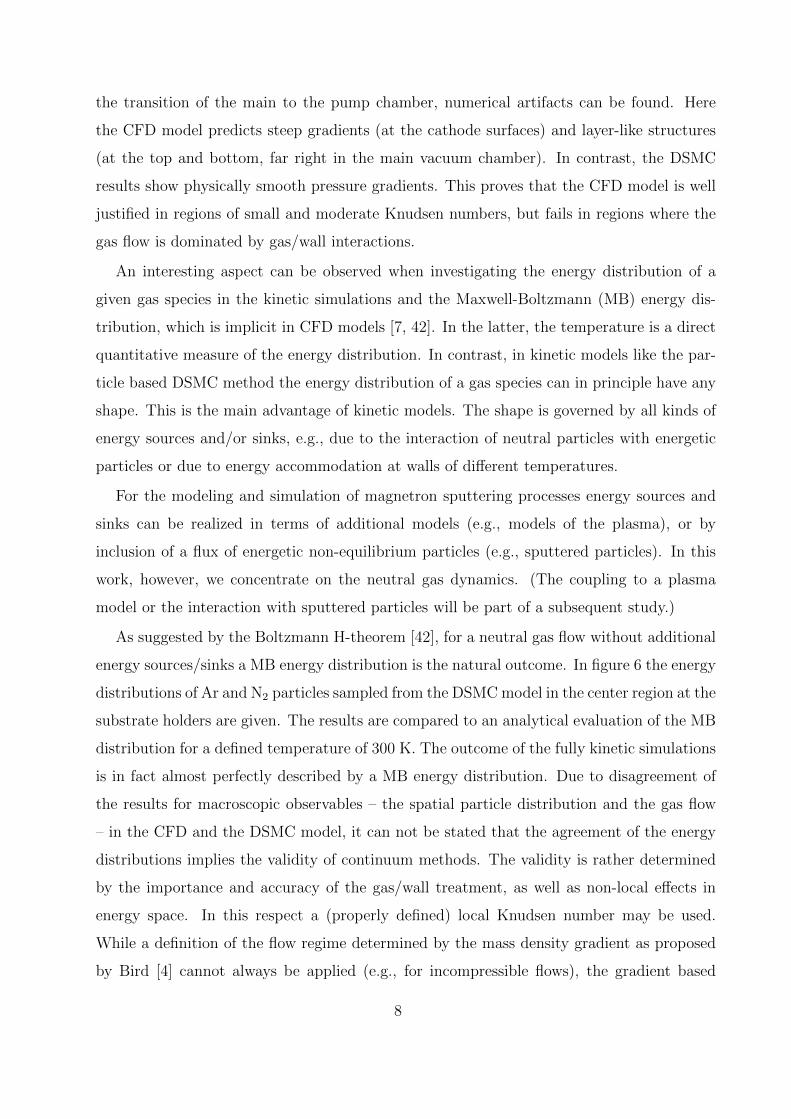
the transition of the main to the pump chamber, numerical artifacts can be found. Here
the CFD model predicts steep gradients (at the cathode surfaces) and layer-like structures
(at the top and bottom, far right in the main vacuum chamber). In contrast, the DSMC
results show physically smooth pressure gradients. This proves that the CFD model is well
justified in regions of small and moderate Knudsen numbers, but fails in regions where the
gas flow is dominated by gas/wall interactions.
An interesting aspect can be observed when investigating the energy distribution of a
given gas species in the kinetic simulations and the Maxwell-Boltzmann (MB) energy dis-
tribution, which is implicit in CFD models [7, 42]. In the latter, the temperature is a direct
quantitative measure of the energy distribution. In contrast, in kinetic models like the par-
ticle based DSMC method the energy distribution of a gas species can in principle have any
shape. This is the main advantage of kinetic models. The shape is governed by all kinds of
energy sources and/or sinks, e.g., due to the interaction of neutral particles with energetic
particles or due to energy accommodation at walls of different temperatures.
For the modeling and simulation of magnetron sputtering processes energy sources and
sinks can be realized in terms of additional models (e.g., models of the plasma), or by
inclusion of a flux of energetic non-equilibrium particles (e.g., sputtered particles). In this
work, however, we concentrate on the neutral gas dynamics. (The coupling to a plasma
model or the interaction with sputtered particles will be part of a subsequent study.)
As suggested by the Boltzmann H-theorem [42], for a neutral gas flow without additional
energy sources/sinks a MB energy distribution is the natural outcome. In figure 6 the energy
distributions of Ar and N2 particles sampled from the DSMC model in the center region at the
substrate holders are given. The results are compared to an analytical evaluation of the MB
distribution for a defined temperature of 300 K. The outcome of the fully kinetic simulations
is in fact almost perfectly described by a MB energy distribution. Due to disagreement of
the results for macroscopic observables – the spatial particle distribution and the gas flow
– in the CFD and the DSMC model, it can not be stated that the agreement of the energy
distributions implies the validity of continuum methods. The validity is rather determined
by the importance and accuracy of the gas/wall treatment, as well as non-local effects in
energy space. In this respect a (properly defined) local Knudsen number may be used.
While a definition of the flow regime determined by the mass density gradient as proposed
by Bird [4] cannot always be applied (e.g., for incompressible flows), the gradient based
8
definition with an appropriate choice of flow property (e.g., momentum), or a definition
based on geometric considerations are reliable measures of the flow regime. Both definitions
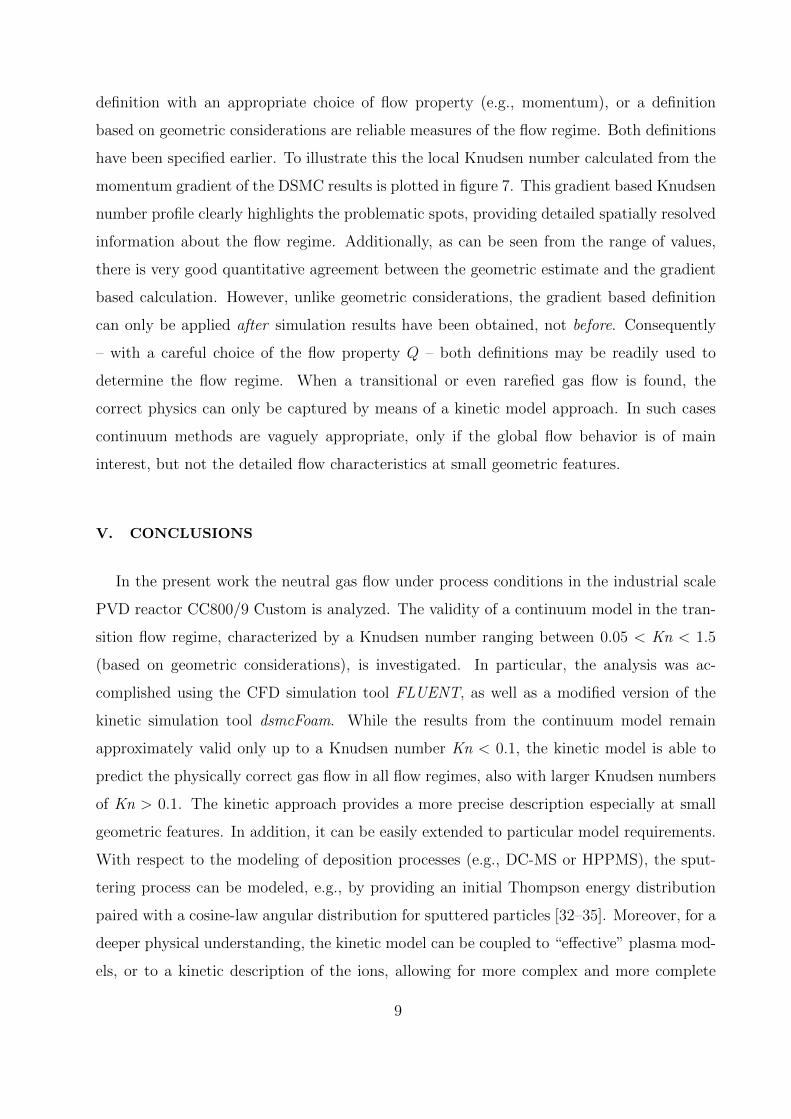
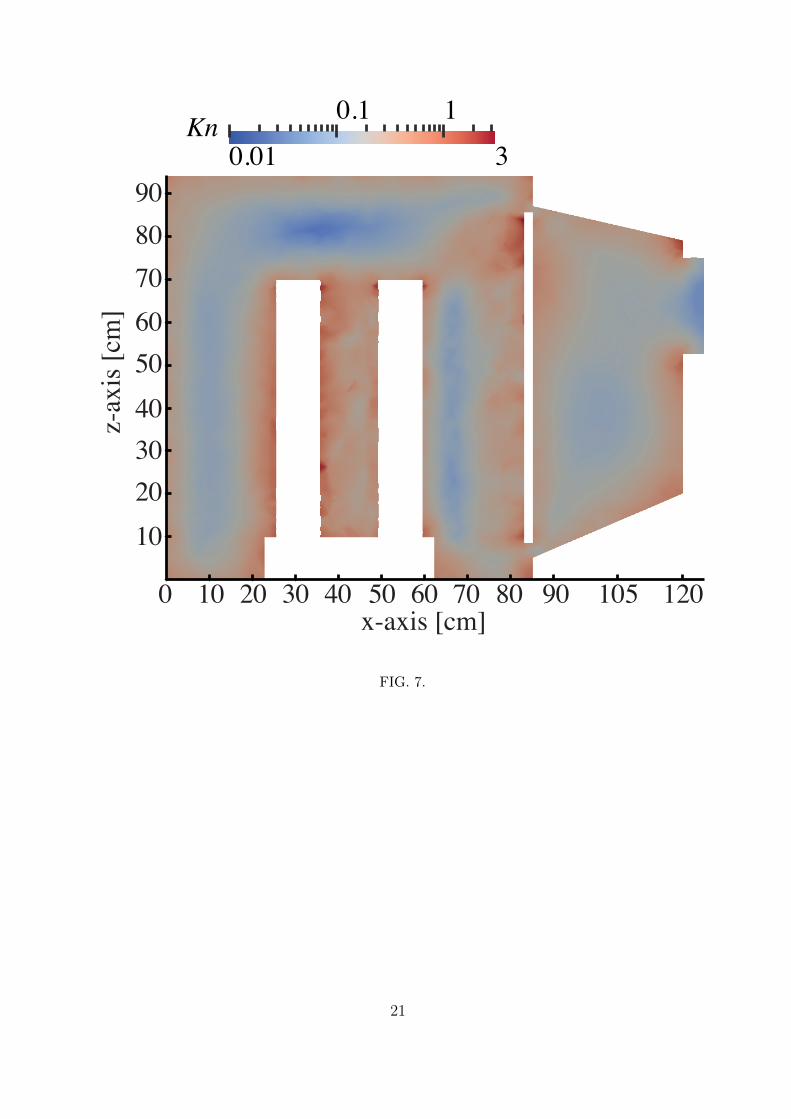
have been specified earlier. To illustrate this the local Knudsen number calculated from the
momentum gradient of the DSMC results is plotted in figure 7. This gradient based Knudsen
number profile clearly highlights the problematic spots, providing detailed spatially resolved
information about the flow regime. Additionally, as can be seen from the range of values,
there is very good quantitative agreement between the geometric estimate and the gradient
based calculation. However, unlike geometric considerations, the gradient based definition
can only be applied after simulation results have been obtained, not before. Consequently
– with a careful choice of the flow property Q – both definitions may be readily used to
determine the flow regime. When a transitional or even rarefied gas flow is found, the
correct physics can only be captured by means of a kinetic model approach. In such cases
continuum methods are vaguely appropriate, only if the global flow behavior is of main
interest, but not the detailed flow characteristics at small geometric features.
V. CONCLUSIONS
In the present work the neutral gas flow under process conditions in the industrial scale
PVD reactor CC800/9 Custom is analyzed. The validity of a continuum model in the tran-
sition flow regime, characterized by a Knudsen number ranging between 0.05 < Kn < 1.5
(based on geometric considerations), is investigated. In particular, the analysis was ac-
complished using the CFD simulation tool FLUENT, as well as a modified version of the
kinetic simulation tool dsmcFoam. While the results from the continuum model remain
approximately valid only up to a Knudsen number Kn < 0.1, the kinetic model is able to
predict the physically correct gas flow in all flow regimes, also with larger Knudsen numbers
of Kn > 0.1. The kinetic approach provides a more precise description especially at small
geometric features. In addition, it can be easily extended to particular model requirements.
With respect to the modeling of deposition processes (e.g., DC-MS or HPPMS), the sput-
tering process can be modeled, e.g., by providing an initial Thompson energy distribution
paired with a cosine-law angular distribution for sputtered particles [32–35]. Moreover, for a
deeper physical understanding, the kinetic model can be coupled to “effective” plasma mod-
els, or to a kinetic description of the ions, allowing for more complex and more complete
9

energy exchange processes and chemical reactions. Consequently, it allows for a detailed
analysis of the coating formation on the substrates in industrial, as well as research PVD
processes. It can be stated that only kinetic simulations are able to appropriately merge the
physics of the gas flow, the particle/wall interactions and the particle/particle interactions
in sputtering processes. The development of a particle based kinetic simulation of all heavy
particles – neutrals and ions – similar to the particle in cell (PIC) method [43, 44] will be
the topic of a later study.
ACKNOWLEDGMENTS
The authors acknowledge the work of the OpenFOAM community and in particular the
authors of dsmcFoam. This work is supported by the German Research Foundation (DFG)
within the Collaborative Research Centre TRR 87 “Pulsed High Power Plasmas for the
Synthesis of Nanostructured Functional Layers” subproject C6.
10
[1] S. Theiß, N. Bibinov, N. Bagcivan, M. Ewering, P. Awakowicz, K. Bobzin, J. Phys. D: Appl.
Phys 43 (2010) 075205.
[2] K. Bobzin, N. Bagcivan, P. Immich, S. Bolz, R. Cremer, T. Leyendecker, Thin Solid Films
517 (2008) 1251.
[3] D.M. Sanders, A. Anders, Surf. Coat. Tech. 133-134 (2000) 78.
[4] G.A. Bird, “Molecular Gas Dynamics and the Direct Simulation of Gas Flows”, Oxford Uni-
versity Press, New York, USA, 1994.
[5] G.A. Bird, Phys. Fluids 26 (1983) 3222.
[6] I.D. Boyd, G. Chen, G.V. Candler, Phys. Fluids 7 (1995) 210.
[7] J.D. Anderson, “Computational Fluid Dynamics: The Basics With Applications”, McGraw-
Hill Science, New York, USA, 1995.
[8] J.H. Ferziger, M. Peric, “Computational Methods for Fluid Dynamics”, 3rd edition, Springer,
Berlin, Germany, 2002.
[9] C. White, M.K. Borg, T.J. Scanlon, J.M. Reese, Computers and Fluids 71 (2013) 261.
[10] M. Darbandi, E. Roohi, Microfluid Nanofluid 10 (2011) 321.
[11] G.A. Bird, Ann. Rev. Fluid Mech. 10 (1978) 11.
[12] S.S. Sazhin, V.V. Serikov, Planet. Space Sci. 45 (1997) 361.
[13] Q. Sun, I.D. Boyd, G.V. Chandler, J. Comp. Phys 194 (2004) 256.
[14] Y. Zheng, J.M. Reese, H. Struchtrup, J. Comp. Phys 218 (2006) 748.
[15] J.-S. Wu, Y.-Y. Lian G. Cheng, R.P. Koomullil K.-C. Tseng, J. Comp. Phys. 219 (2006) 579.
[16] V.I. Kolobov, R.R. Arslanbekov, V.V. Aristov, A.A. Frolova, S.A. Zabelok, J. Comp. Phys.
223 (2007) 589.
[17] ANSYS R© Academic Research, Release 14.0, 2012.
[18] T.J. Scanlon, E. Roohi, C. White, M. Darbandi, J.M. Reese, Computers and Fluids 39 (2010)
2078.
[19] G.B. Macpherson, N. Nordin, H.G. Weller, Commun. Numer. Meth. Engng. 25 (2009) 263.
[20] OpenFOAM: the open source CFD Toolbox, User Guide version 2.1.1, 2012.
[21] S. Chapman, T.G. Cowling, “The Mathematical Theory of Non-Uniform Gases”, 2nd edition,
Cambridge University Press, Cambridge, UK, 1952.
11
[22] M.W. Thompson, A.E.R.E Harwell, Phil. Mag. 18 (1968) 377.
[23] P. Sigmund, Phys. Rev. 184 (1969) 383.
[24] T. Mussenbrock, Contrib. Plasma Phys. 52 (2012) 571.
[25] S. Berg, T. Nyberg, Thin Solid Films 476 (2005) 215.
[26] S. Berg, H.-O. Blom, T. Larsson, C. Nender, J. Vac. Sci. Technol. A 5 (1987) 202.
[27] D. Depla, S. Heirwegh, S. Mahieu and R. De Gryse, J. Phys D: Appl. Phys. 40 (2007) 1957.
[28] V. Kouznetsov, K. Macak, J.M. Schneider, U. Helmersson, I. Pretrov, Surf. Coat. Tech. 122
(1999) 290.
[29] D. Lundin, N. Brenning, D. Jadernas, P. Larsson, E. Wallin, M. Lattemann, M.A. Raadu, U.
Helmersson, Plasma Sources Sci. Technol. 18 (2009) 045008.
[30] J.T. Gudmundsson, N. Brenning, D. Lundin, U. Helmersson, J. Vac. Sci. Technol. A 30 (2012)
030801.
[31] K. Sarakinos, J. Alami, S. Konstantinidis, Surf. Coat. Tech. 204 (2010) 1661.
[32] A. Kersch, W. Morokoff, Chr. Werner, J. Appl. Phys 75 (1994) 2278.
[33] V.V. Serikov, K. Nanbu, J. Vac. Sci. Technol. A 14 (1996) 3108.
[34] A. Malaurie, A. Bessaudou, Thin Solid Films 286 (1996) 305.
[35] S. Kadlec, Plasma Process. Polym. 4 (2007) S419.
[36] D. Lundin, C. Vitelaru, L. de Poucques, N. Brenning, T. Minea, J. Phys. D: Appl. Phys. 46
(2013) 175201.
[37] S. Mahieu, G. Buyle, D. Depla, S. Heirwegh, P. Ghekiere, R. De Gryse, Nucl. Instr. and Meth.
in Phys. Res. B. 243 (2006) 313.
[38] K. Van Aeken, S. Mahieu, D. Depla, J. Phys D: Appl. Phys. 41 (2008) 205307.
[39] E. Lugscheider, K. Bobzin, N. Papenfuß-Janzen, D. Parkot, Surf. Coat. Tech. 200 (2005) 913.
[40] C. Huo, M.A. Raadu, D. Lundin, J.T. Gudmundsson, A. Anders, N. Brenning, Plasma Sources
Sci. Technol. 21 (2012) 045004.
[41] V. Yakhot, S.A. Orszag, S. Thangam, T.B. Gatski, C.G. Speziale, Phys. Fluids A 4 (1992)
1510.
[42] F. Reif, “Fundamentals of Statistical and Thermal Physics”, McGraw-Hill, New York, USA,
1965.
[43] C.K. Birdsall, IEEE Trans. Plasma Sci. 19 (1991) 65.
12

[44] M.M. Turner, A. Derzsi, Z. Donko, D. Eremin, S.J. Kelly, T. Lafleur, T. Mussenbrock, Phys.
Plasmas 20 (2013) 013507.
13
LIST OF FIGURES
1 3D top view of the PVD coating unit CC800/9 Custom. Gas inlets (A) in both
corners at the far left side, pump flange (E) at far right side. Two cathodes
(B) on one side of the substrate holders (C). The heater (D) separates the
main from the pump chamber. . . . . . . . . . . . . . . . . . . . . . . . . . . . . . . . . . . . . . . . . 15
2 Streamlines of the mass flux (or momentum) ρ~v inside the coating unit (top:
DSMC, bottom: CFD). Here, ρ is the mass density and ~v is the average velocity. 16
3 Pressure profile of a cut along the x-axis through the center of the main
vacuum chamber (top: DSMC, bottom: CFD). . . . . . . . . . . . . . . . . . . . . . . . . . . 17
4 Pressure inside the main chamber plotted along lines at different altitudes in
direction of the x-axis (solid black: z = 45 cm, dashed red: z = 80 cm). . . . . . 18
5 Pressure profile of a cut in direction of the x-axis through the main chamber
in the cathode plane (top: DSMC, bottom: CFD). . . . . . . . . . . . . . . . . . . . . . . . 19
6 Energy distribution function of argon and nitrogen gas species extracted from
the DSMC simulations, as well as a plot of the Maxwell-Boltzmann distribu-
tion function for T = 300 K. (The maximum is expected at Emax = kBT/2 ≈
12.9 meV). . . . . . . . . . . . . . . . . . . . . . . . . . . . . . . . . . . . . . . . . . . . . . . . . . . . . . . . . . 20
7 Local Knudsen number based on equation (1) plotted along a cut through the
main chamber in the plane of the substrate holders in direction of the x-axis.
λ = 1.39 cm is assumed. L is given by the local momentum gradient as stated
in section I. . . . . . . . . . . . . . . . . . . . . . . . . . . . . . . . . . . . . . . . . . . . . . . . . . . . . . . . . . 21
14
x-axis [cm]
y-ax
is [c
m]
z-axis [cm]
0 604020 80
80
60
40
20
100 120
C
DB
A
E
A
B
D
80
FIG. 1.
15
0 604020 80
8070605040302010
90
x-axis [cm]
z-ax
is [c
m]
100 120
ρv kg/m 2s
1e-4
1e-5
2e-4
5e-6
0 604020 80
8070605040302010
90
x-axis [cm]
z-ax
is [c
m]
100 120
ρv kg/m 2s
1e-4
1e-5
2e-4
5e-6
DSMC
CFD
FIG. 2.
16
0 10 706050403020 80
80
70
60
50
40
30
20
10
90
x-axis [cm]
z-ax
is [c
m]
p [mPa]
446
444
447.5
442
0 10 706050403020 80
80
70
60
50
40
30
20
10
90
x-axis [cm]
z-ax
is [c
m]
p [mPa]469
457
465467.5
462.5460
DSMC
CFD
FIG. 3.
17
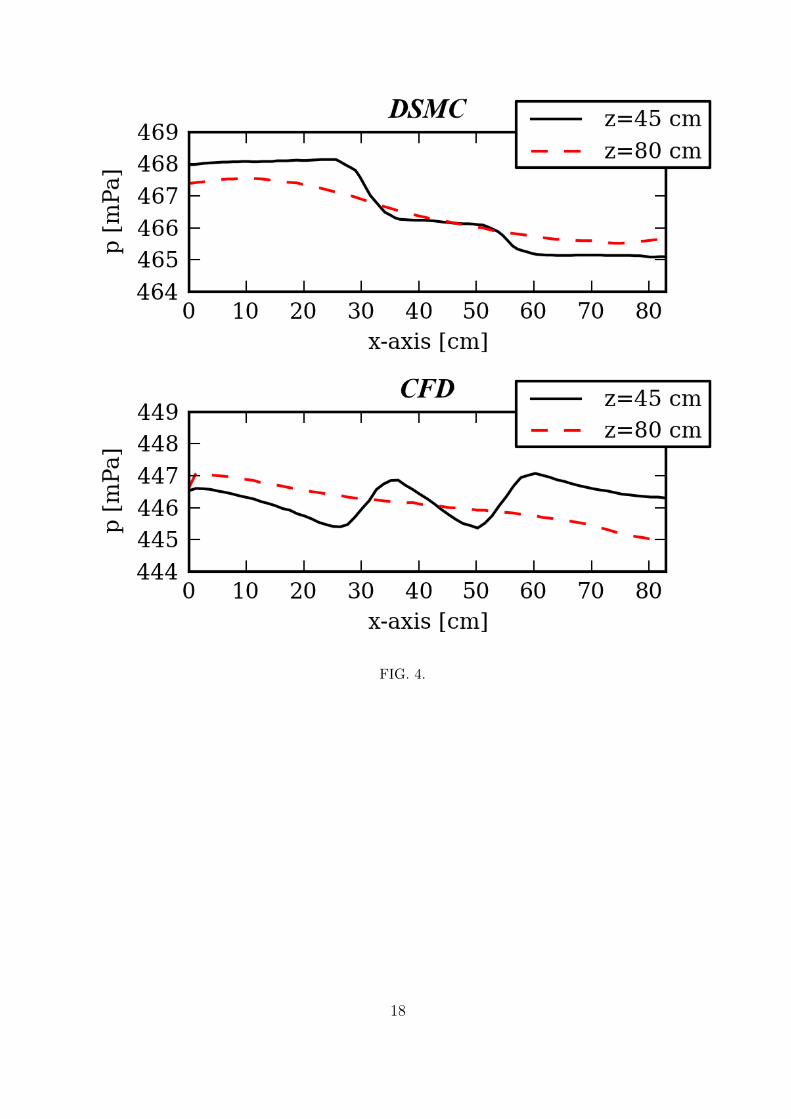
FIG. 4.
18
0 10 706050403020 80
80
70
60
50
40
30
20
10
90
x-axis [cm]
z-ax
is [c
m]
p [mPa]
448
446
448.5
444
0 10 706050403020 80
80
70
60
50
40
30
20
10
90
x-axis [cm]
z-ax
is [c
m]
p [mPa]
468
464
470
457
460
DSMC
CFD
FIG. 5.
19
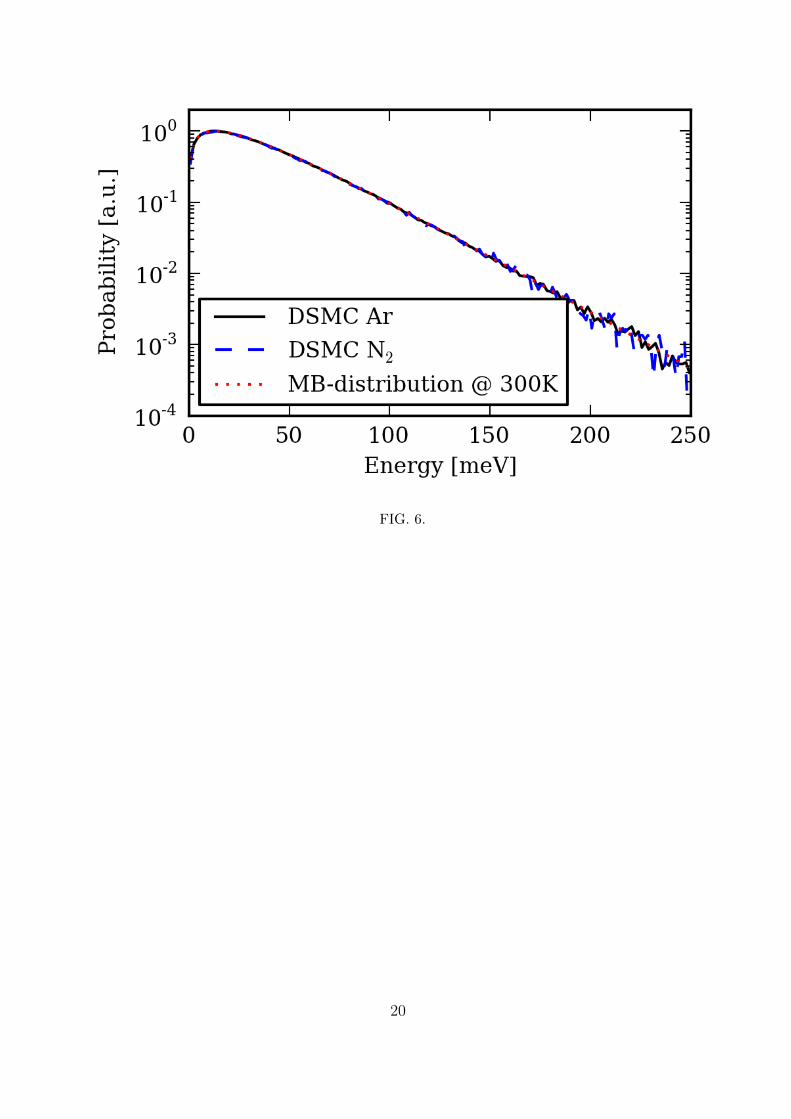
FIG. 6.
20
0 10 706050403020 80 90 105 120
8070605040302010
90
x-axis [cm]
z-ax
is [c
m]
Kn 10.1
30.01
FIG. 7.
21