Embed Size (px)
Citation preview
RESEARCH ARTICLE
Continuous selection pressure to improve
temperature acclimation of Tisochrysis lutea
Hubert Bonnefond1, Ghjuvan Grimaud2, Judith Rumin3, Gael Bougaran3, Amelie Talec1,
Manon Gachelin1, Marc Boutoute1, Eric Pruvost1, Olivier Bernard2*, Antoine Sciandra1
1 Sorbonne Universites, UPMC Univ Paris 06, CNRS-INSU, Laboratoire d’Oceanographie de Villefranche-
sur-mer (LOV), Villefranche-sur-mer, France, 2 INRIA BIOCORE, Sophia Antipolis Cedex, France,
3 IFREMER, PBA, Nantes, France
Abstract
Temperature plays a key role in outdoor industrial cultivation of microalgae. Improving the
thermal tolerance of microalgae to both daily and seasonal temperature fluctuations can
thus contribute to increase their annual productivity. A long term selection experiment was
carried out to increase the thermal niche (temperature range for which the growth is possi-
ble) of a neutral lipid overproducing strain of Tisochrysis lutea. The experimental protocol
consisted to submit cells to daily variations of temperature for 7 months. The stress intensity,
defined as the amplitude of daily temperature variations, was progressively increased along
successive selection cycles. Only the amplitude of the temperature variations were
increased, the daily average temperature was kept constant along the experiment. This pro-
tocol resulted in a thermal niche increase by 3˚C (+16.5%), with an enhancement by 9% of
the maximal growth rate. The selection process also affected T. lutea physiology, with a fea-
ture generally observed for ‘cold-temperature’ type of adaptation. The amount of total and
neutral lipids was significantly increased, and eventually productivity was increased by 34%.
This seven month selection experiment, carried out in a highly dynamic environment, chal-
lenges some of the hypotheses classically advanced to explain the temperature response of
microalgae.
Introduction
Microalgae are a promising source of resources and bulk chemicals for various applications
such as nutrition, aquaculture, cosmetics and, at a longer time scale, biofuels or green chemis-
try. However, the wild type strains commonly cultivated offer poor industrial yields, limiting
their profitability. These wild species adapted to natural conditions do not tolerate extreme
temperatures reached by artificial culturing systems (photobioreactors or greenhouse cultures)
with a low thermal inertia [1][2]. Moreover, in temperate climates, microalgae production
throughout the year is limited by the low winter temperatures. This sensitivity to temperature
therefore restricts production, unless temperature is regulated with a high cooling/heating sys-
tem involving high financial and environmental costs [1]. The need to select new strains
PLOS ONE | https://doi.org/10.1371/journal.pone.0183547 September 13, 2017 1 / 19
a1111111111
a1111111111
a1111111111
a1111111111
a1111111111
OPENACCESS
Citation: Bonnefond H, Grimaud G, Rumin J,
Bougaran G, Talec A, Gachelin M, et al. (2017)
Continuous selection pressure to improve
temperature acclimation of Tisochrysis lutea. PLoS
ONE 12(9): e0183547. https://doi.org/10.1371/
journal.pone.0183547
Editor: Shashi Kumar, International Centre for
Genetic Engineering and Biotechnology, INDIA
Received: October 4, 2016
Accepted: August 7, 2017
Published: September 13, 2017
Copyright: © 2017 Bonnefond et al. This is an open
access article distributed under the terms of the
Creative Commons Attribution License, which
permits unrestricted use, distribution, and
reproduction in any medium, provided the original
author and source are credited.
Data Availability Statement: All relevant data are
within the paper.
Funding: This work was supported by grant
income pre-graduated pHd, ADEME (https://
appelsaprojets.ademe.fr/aap/AAC%20Th%C3%
A8ses2016-10); and ANR Facteur 4 ANR-12-BIME-
0004 (http://wwz.ifremer.fr/facteur4/Presentation).
Competing interests: The authors have declared
that no competing interests exist.
adapted to a wider range of temperature is thus crucial for increasing productivity and reduc-
ing cultivation costs.
The steady state growth response of microalgae to temperature, i.e. the growth rate as a
function of temperature in acclimated and non-limiting conditions, also called the thermal
reaction norm, has been extensively studied [2][3], and can be accurately predicted by the
model of [4]. This model is parameterized by three cardinal temperatures: Tmin and Tmax, cor-
responding respectively to the temperatures below and above which growth is not possible.
Topt, the optimum growth temperature, was defined as the temperature leading to the highest
growth rate (all other parameters being kept constant). The temperature values ranging
between Tmin and Tmax represent the thermal niche. The selection of strains with a larger ther-
mal niche and thus lower temperature sensitivity is a promising approach to increase outdoor
productivity.
Microalgal strains acclimate to temperature in a process similar to photoacclimation [5].
Under weak thermal perturbation and on short term exposition (less than 10 generations),
acclimation enhances ecological fitness by modulating the flux of energy produced by photo-
synthesis to carbon fixation rate through the Calvin cycle in a more efficient way [6]. However,
when the thermal stress exceeds its physiological tolerance, adaptation mechanisms are trig-
gered. The genetic modifications triggered during the adaptation process result from the selec-
tion of individuals with highest fitness in the new thermal stressing conditions. Adaptation
occurs by two different mechanisms: selection of the most adapted individuals among the pre-
existing genetic diversity of a non-monoclonal population (pre-selective mutations), and denovo genetic mutations induced by environmental stress (adaptive mutation) [7]. In this paper
“adapted strain” was defined as the resulting strain supporting temperature stresses that the
simply “acclimated strain” do not tolerate. As it is shown later, adaption also results in a differ-
ent lipid profile, compared to the initial strain, when submitted to the same environment. Lit-
tle information exists on physiological temperature adaptation in microalgae. The only
available studies are for extremophile strains, resulting of a million year evolutionary process
of thermal adaptation. Life at low temperatures has selected individuals that could mitigate the
lowering of their metabolic activities and growth by synthetizing psychrophilic enzymes with
higher activity at cold temperatures [8][9] or stimulating enzyme production [10][11], and can
preserve the fluidity of their membranes by increasing the synthesis of unsaturated fatty acids
[12][13][3]. Conversely, under high temperature conditions that tend to denature proteins
and membranes [10][14], extremophile adapted microalgal species produce more Heat Shock
Proteins [15] or saturated fatty acids, allowing them to resist these lethal effects [14]. This
study therefore investigated the possibility of changing the temperature response (growth rate
and physiology) of a non-extremophile strain of Tisochrysis lutea, keeping this species for sev-
eral months in continuous cultures, under increasing stressful thermal conditions consisting
in daily temperature shifts. This species is well-used in aquaculture and mollusk hatcheries for
fish larva and bivalve nutrition especially because of its high content in essential polyunsatu-
rated fatty acids. It is a fast growing microalgae (μmax about 2 d-1), easy to cultivate under tem-
perate climate, requiring a pH about 7, a solar irradiance of 780 μmol photons.m-2.s-1 at about
30˚C [16].
Materials and methods
Microalgae strain
The Tisochrysis lutea strain (CCAP 927/17) used in this experiment, named W2X, was
obtained by a selection/mutation process from the original strain CCAP 926/14. This strain is
characterized by a doubled triglyceride productivity [17][18]. Note that the strain used was
Continuous selection pressure to improve temperature acclimation of Tisochrysis lutea
PLOS ONE | https://doi.org/10.1371/journal.pone.0183547 September 13, 2017 2 / 19
non-monoclonal and thus contained a pre-existing genetic diversity supposed to facilitate the
emergence of new traits.
Culturing system
The culturing system was specifically designed to maintain long-term continuous cultures of
microalgae in computer-controlled growing conditions. The enrichment medium was pre-
pared in several 20 L tanks (Nalgene) filled with 3 weeks-matured natural seawater, previously
filtered on 0.1 μm, and autoclaved at 120˚C for 40 min. After cooling, f/2 medium [19] was
added through a 0.22 μm sterile filter. The culture vessels consisted of water jacketed, 1.9-liter
plane photobioreactors (thereafter named “selectiostat”) connected to a circulating program-
mable water bath (Lauda Proline RP845). 30 to 40 min were necessary to vary the temperature
from 10 to 40˚C inside the selectiostats. Cultures were continuously and gently homogenized
by a magnetic stirrer and bubbling air. They were illuminated with LEDs (Nichia NVSL219BT
2 700˚K) placed on one side of the photobioreactors. The light intensity, continuously mea-
sured with a probe (SKY, SKL2620) placed on the opposed side of the reactor was maintained
at Iin = 250 μmol photons.m-2.s-1. pH was maintained constant at 8.2 by computer-controlled
microinjections of CO2. Turbidity was measured on-line using a red LED (Rodan HIRL5010)
at 800 nm on one side of the reactor and a photodiode (Optek OP993) on the other side. Light,
pH, temperature, turbidity, and dilution rate were continuously monitored by ODIN1 soft-
ware [20].
Cleaning procedure
As the selection experiment lasted about 260 days in stressing conditions, algae biofilm was
removed monthly. After saving 1 liter of culture in an autoclaved Schott bottle, the different
pieces of the selectiostats were dismounted and washed with milliQ water then 70% ethanol.
Once dried and reassembled, the photobioreactors were sterilized with 10% HCl and then
rinsed with fresh sterile medium filtered through 0.22 μm (SpiralCap, Gelman). Selectiostats
were then inoculated with the preserved culture, and complemented with sterile medium fil-
tered through 0.22 μm with a Stepdos pump (KNF) to readjust the culture volume.
Turbidostats vs fedbatch modes
Two selectiostats were processed in parallel, each of them using a different culturing mode. In
the selectiostat named STurb (turbidostat mode), the dilution rate was dynamically changed
by the ODIN1 software through a PID control algorithm to maintained turbidity at a constant
level corresponding approximately to a cell concentration of 9 105 cell.mL-1.
The biomass set point was chosen as the maximal value permitting to avoid marked light
shading. The nitrogen concentration in the inflowing medium permitted a biomass concentra-
tion of 3.3 106 cell.mL-1. Moreover for cell concentration higher than 5 106 cell.mL-1, light limi-
tation was observed in the selectiostat. To be conservative, a biomass concentration below 106
cell.mL-1 was chosen to fulfill these conditions.
In the selectiostat named SFb (fed-batch mode), a fraction of the culture volume was
replaced with fresh sterile medium every 7 days. Only 5 to 10% of the initial volume was kept,
in order to restart cultures with an initial cell density of 5 105 cell.L-1.
Continuous selection procedure, the “ratchet” protocol
Our selection method was inspired from the original protocols proposed by [16] and [17], but
instead of gradually increasing the culture temperature, the daily average temperature was
Continuous selection pressure to improve temperature acclimation of Tisochrysis lutea
PLOS ONE | https://doi.org/10.1371/journal.pone.0183547 September 13, 2017 3 / 19
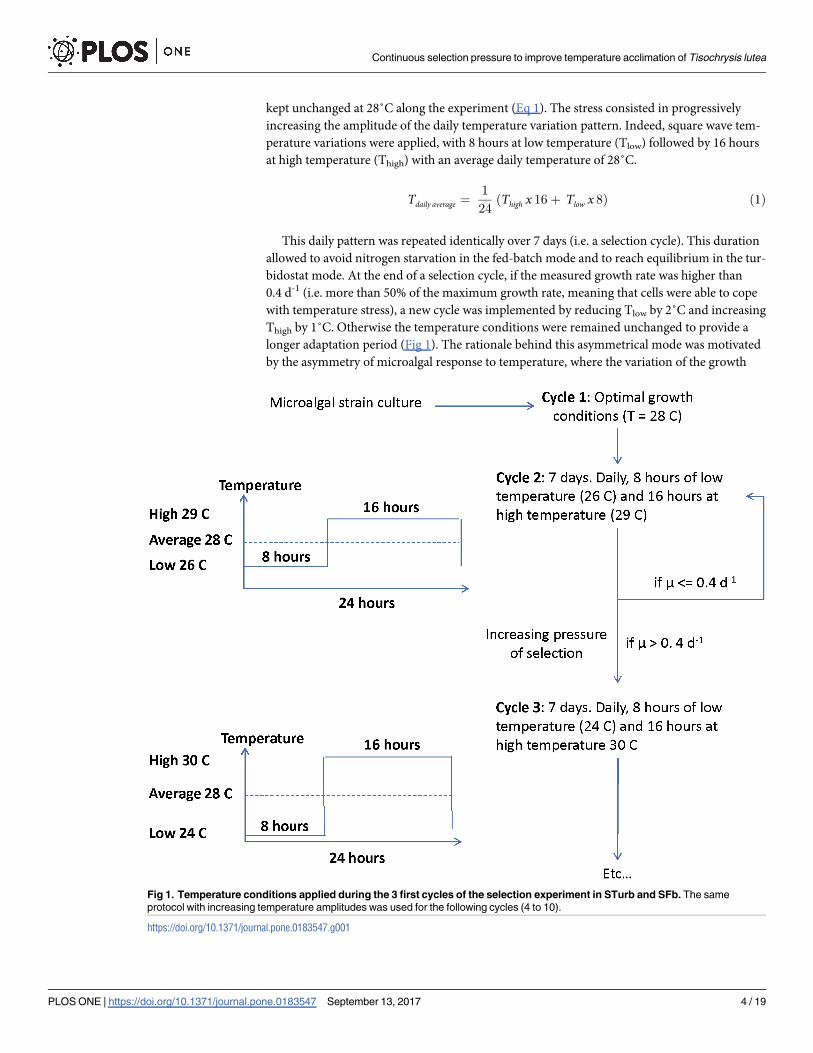
kept unchanged at 28˚C along the experiment (Eq 1). The stress consisted in progressively
increasing the amplitude of the daily temperature variation pattern. Indeed, square wave tem-
perature variations were applied, with 8 hours at low temperature (Tlow) followed by 16 hours
at high temperature (Thigh) with an average daily temperature of 28˚C.
Tdaily average ¼1
24ðThigh x 16þ Tlow x 8Þ ð1Þ
This daily pattern was repeated identically over 7 days (i.e. a selection cycle). This duration
allowed to avoid nitrogen starvation in the fed-batch mode and to reach equilibrium in the tur-
bidostat mode. At the end of a selection cycle, if the measured growth rate was higher than
0.4 d-1 (i.e. more than 50% of the maximum growth rate, meaning that cells were able to cope
with temperature stress), a new cycle was implemented by reducing Tlow by 2˚C and increasing
Thigh by 1˚C. Otherwise the temperature conditions were remained unchanged to provide a
longer adaptation period (Fig 1). The rationale behind this asymmetrical mode was motivated
by the asymmetry of microalgal response to temperature, where the variation of the growth
Fig 1. Temperature conditions applied during the 3 first cycles of the selection experiment in STurb and SFb. The same
protocol with increasing temperature amplitudes was used for the following cycles (4 to 10).
https://doi.org/10.1371/journal.pone.0183547.g001
Continuous selection pressure to improve temperature acclimation of Tisochrysis lutea
PLOS ONE | https://doi.org/10.1371/journal.pone.0183547 September 13, 2017 4 / 19
rate observed for temperatures higher than Topt is generally steeper than below Topt (Fig 2) [4].
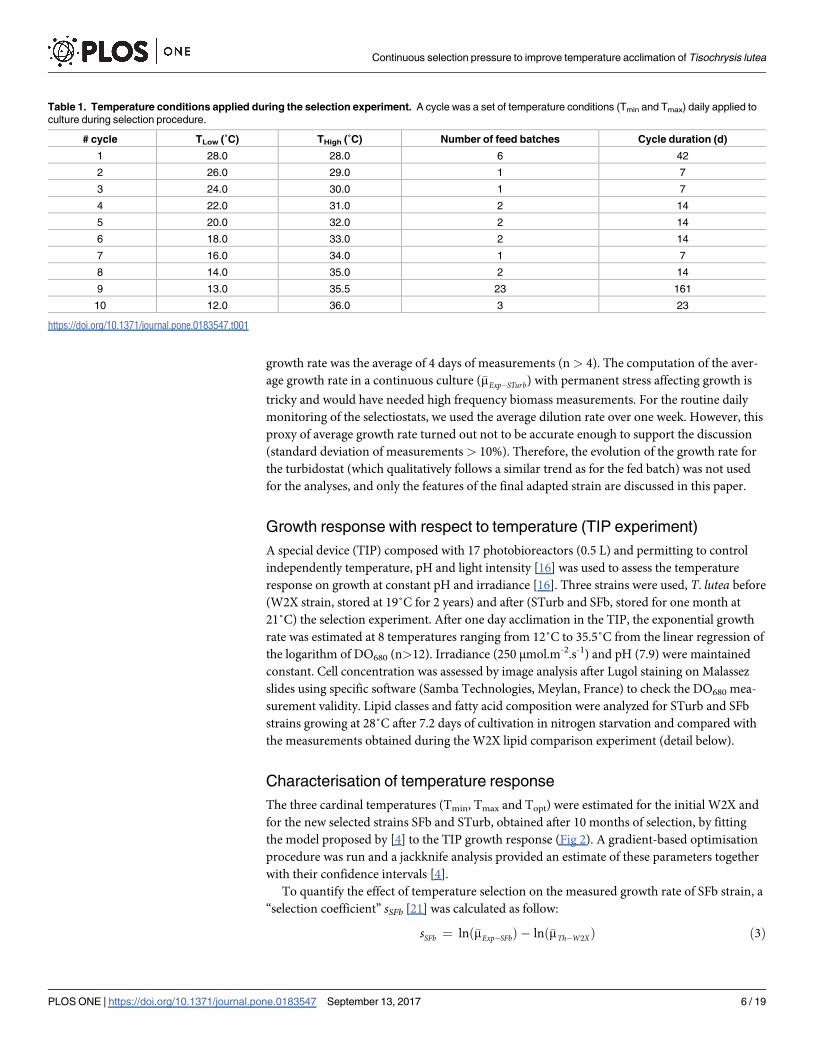
For the two last selection cycles 9 and 10, Thigh was increased by only 0.5˚C and Tlow decreased
by only 1˚C in order to reduce the mortality resulting from the very large daily variations of
temperature at the end of the experiment (Table 1).
Cell population
Size distribution of the cell population was monitored once or twice a day with an optical par-
ticle counter (HIAC—Royco; Pacific Scientific Instruments). Mean cell diameter and biovo-
lume were calculated from the size distribution. The variability between triplicate samples was
routinely lower than 5%. The first and the second counting were performed at the beginning
of the low and high temperature periods, respectively. Measurements were performed at least
once per cycle.
The average growth rate, experimentally measured for a cycle of selection �mExp� SFb (d-1) of
the SFb culture was calculated using the following equation:
�mExp� SFb ¼Ln BV2
BV1
� �
t2 � t1
ð2Þ
where BV1 and BV2 were the biovolume (μm3.mL-1) at time t1 and t2 (d), respectively. The
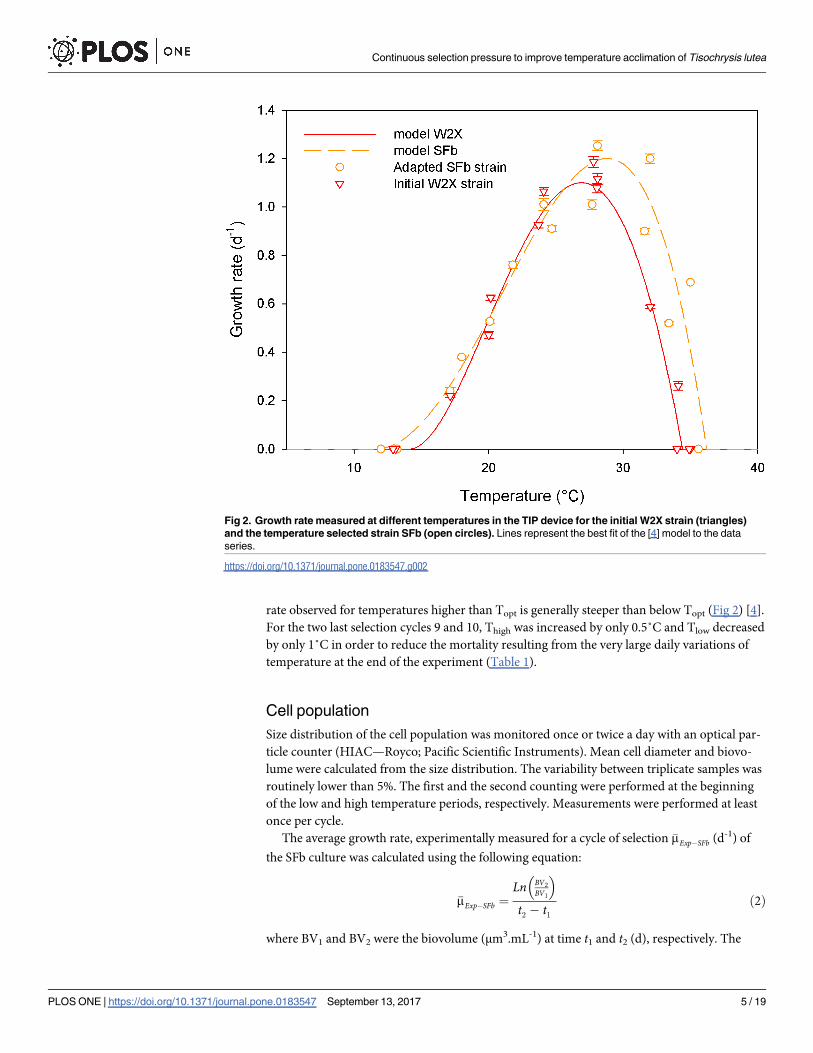
Fig 2. Growth rate measured at different temperatures in the TIP device for the initial W2X strain (triangles)
and the temperature selected strain SFb (open circles). Lines represent the best fit of the [4] model to the data
series.
https://doi.org/10.1371/journal.pone.0183547.g002
Continuous selection pressure to improve temperature acclimation of Tisochrysis lutea
PLOS ONE | https://doi.org/10.1371/journal.pone.0183547 September 13, 2017 5 / 19
growth rate was the average of 4 days of measurements (n > 4). The computation of the aver-
age growth rate in a continuous culture (�mExp� STurb) with permanent stress affecting growth is
tricky and would have needed high frequency biomass measurements. For the routine daily
monitoring of the selectiostats, we used the average dilution rate over one week. However, this
proxy of average growth rate turned out not to be accurate enough to support the discussion
(standard deviation of measurements > 10%). Therefore, the evolution of the growth rate for
the turbidostat (which qualitatively follows a similar trend as for the fed batch) was not used
for the analyses, and only the features of the final adapted strain are discussed in this paper.
Growth response with respect to temperature (TIP experiment)
A special device (TIP) composed with 17 photobioreactors (0.5 L) and permitting to control
independently temperature, pH and light intensity [16] was used to assess the temperature
response on growth at constant pH and irradiance [16]. Three strains were used, T. lutea before
(W2X strain, stored at 19˚C for 2 years) and after (STurb and SFb, stored for one month at
21˚C) the selection experiment. After one day acclimation in the TIP, the exponential growth
rate was estimated at 8 temperatures ranging from 12˚C to 35.5˚C from the linear regression of
the logarithm of DO680 (n>12). Irradiance (250 μmol.m-2.s-1) and pH (7.9) were maintained
constant. Cell concentration was assessed by image analysis after Lugol staining on Malassez
slides using specific software (Samba Technologies, Meylan, France) to check the DO680 mea-
surement validity. Lipid classes and fatty acid composition were analyzed for STurb and SFb
strains growing at 28˚C after 7.2 days of cultivation in nitrogen starvation and compared with
the measurements obtained during the W2X lipid comparison experiment (detail below).
Characterisation of temperature response
The three cardinal temperatures (Tmin, Tmax and Topt) were estimated for the initial W2X and
for the new selected strains SFb and STurb, obtained after 10 months of selection, by fitting
the model proposed by [4] to the TIP growth response (Fig 2). A gradient-based optimisation
procedure was run and a jackknife analysis provided an estimate of these parameters together
with their confidence intervals [4].
To quantify the effect of temperature selection on the measured growth rate of SFb strain, a
“selection coefficient” sSFb [21] was calculated as follow:
sSFb ¼ lnð�mExp� SFbÞ � lnð�mTh� W2XÞ ð3Þ
Table 1. Temperature conditions applied during the selection experiment. A cycle was a set of temperature conditions (Tmin and Tmax) daily applied to
culture during selection procedure.
# cycle TLow (˚C) THigh (˚C) Number of feed batches Cycle duration (d)
1 28.0 28.0 6 42
2 26.0 29.0 1 7
3 24.0 30.0 1 7
4 22.0 31.0 2 14
5 20.0 32.0 2 14
6 18.0 33.0 2 14
7 16.0 34.0 1 7
8 14.0 35.0 2 14
9 13.0 35.5 23 161
10 12.0 36.0 3 23
https://doi.org/10.1371/journal.pone.0183547.t001
Continuous selection pressure to improve temperature acclimation of Tisochrysis lutea
PLOS ONE | https://doi.org/10.1371/journal.pone.0183547 September 13, 2017 6 / 19
where �mTh� W2X is the theoretical growth rate of the strain W2X calculated for the same temper-
ature conditions as experienced by the culture SFb during each selection cycle, with the cardi-
nal parameter of the W2X strain:
�mTh� W2XðTlow;ThighÞ ¼7:5
24mW2XðTlowÞ þ
15:5
24mW2XðThighÞ þ
1
24mW2XðTaverageÞ ð4Þ
where Tlow and Thigh are the low and high temperature values set during the selection cycles,
and Taverage the mean temperature experienced during the 1h transition time between low and
high temperatures. Selection occurs if the frequency of adapted strains in the population
increases (s> 0) [21].
W2X lipid comparison experiment (benchmark experiment)
To compare the lipid content of the initial W2X strain with the new adapted strains, a bench-
marking experiment in similar conditions than the TIP experiment was performed. Three
cylindrical glass photobioreactors of 2 L were used as triplicates. Temperature was controlled
at 28˚C and pH maintained constant at 7.9 by micro-additions of CO2 in the bubbling air.
Continuous light was provided by fluorescent tubes (Dulux11, 2G11, 55W/12-950, lumilux de
lux, daylight, OsramSylvania) at 250 μmol.m-2.s-1 and measured in the center of the empty
photobioreactors as in the TIP device. Cultures were gently homogenized by magnetic stirring.
The enrichment medium was prepared in several 20 L tanks (Nalgene) filled with 3 weeks-
matured natural seawater, previously filtered on 0.1 μm, and autoclaved at 120˚C for 40 min.
After cooling, f/2 medium was added through a 0.22 μm sterile filter [19]. Nitrogen concentra-
tion was lowered at f/4 concentration to reach N starvation. Lipid sampling (400 mL of cul-
ture) was realized at the end of the experiment during the starvation phase.
Cellular content analysis
6.65 mL triplicates of culture were sampled weekly, 3 days after the beginning of the selec-
tion cycle and just after the temperature shift from Thigh to TLow, and filtered onto glass-
fiber filters (Whatman GF/C, threshold 1.2 μm) precombusted at 450˚C for 12h. For particu-
late carbon and nitrogen measurement, samples were kept at 60˚C until analyses were per-
formed with a CHN analyzer (2400 Series II CHNS/O, Perkin Elmer). For pigments,
samples were kept at -80˚C, and extracted in acetone (3 ml) for 1 hour at 4˚C in the dark
with frequent and gentle stirring. After 5 min of centrifugation (JOUAN G 412) at 2000
rpm, supernatant was analyzed with a spectrophotometer (Perkin Elmer UV/Vis Spectro-
photometer Lambda2). Chlorophyll a, b and total carotenoid were determined using the
equations of Lichtenthaler and absorbance at 470.0, 644.8 and 661.6 nm [22]. The variability
between triplicates was lower than 7%.
For adapted strains, lipid samplings were made at the end of the TIP experiment, after 7.7
days of cultivation in nitrogen starved conditions at 28˚C. For the W2X, lipids were sampled
at the end of the lipid comparison experiment (6.9 days) in N-starved conditions. Known vol-
umes of culture were centrifuged (JOUAN G 412) for 10 min at 2000 rpm, after the addition of
100 μL of Cl3Fe (50 mg.mL-1) as flocculate. The lipid extraction protocol was derived from
Bligh and Dyer [23]. Total lipids were determined gravimetrically. Neutral lipids, glycolipids
and phospholipids were separated on Extract-Clean SPE Silica 500 mg/8 mL (Alltech) and
eluted respectively with 6 column volumes of chloroform, 4 column volumes of acetone and 6
column volumes of methanol completed with 2 volumes of methanol–10% ammonia. Total
lipids were placed on top of the column in chloroform. All fractions were dried under vacuum
and weighted to provide an estimate of each class of lipids.
Continuous selection pressure to improve temperature acclimation of Tisochrysis lutea
PLOS ONE | https://doi.org/10.1371/journal.pone.0183547 September 13, 2017 7 / 19
The lipid productivity (μgLipid.mL-1.d-1) of the different strains during the benchmarking
experiment was calculated as follows:
Plipid ¼Lipidf � Lipidi
tf � tið5Þ
where Lipidf and Lipidi are the total lipid concentration (μg.mL-1) at final and initial time
respectively. Note that, the initial lipid concentration was not measured (not enough matter
for our lipid protocol). Initial lipid content per gram carbon was thus assumed to be the
same as the final content. This hypothesis provides a slightly underestimated productivity,
but has limited impact since initial biomass is very low. Fatty acid analysis began by convert-
ing saponifiable lipids into methyl esters with 7% boron trifluoride in methanol [24]. Gas
chromatography (GC) of fatty acid methyl esters (FAME) was carried out on a 30 m length
0.32 mm internal diameter quartz capillary column coated with famewax (Restek) in a Per-
kin-Elmer XL autolab GC, equipped with a flame ionization detector (FID). The column
operated isothermally at 185˚C. Helium was used as carrier gas at 7 psig. Injector and detec-
tor were maintained at 250˚C. The variability was routinely 3% for major components,
1–9% for intermediate components and 25% for minor components (<0.5% of total fatty
acids). Measurements were relative and expressed as percentage of total fatty acid, no inter-
nal standard was needed.
Results and discussion
From acclimation to adaptation
Fig 3A shows that the theoretical growth rate of the initial strain W2X calculated for the
experimental temperature conditions (Eq 4), decreased with the amplitude of temperature
variations. Fig 3A also shows that, except for the very first 2 cycles, the growth rates mea-
sured in the SFb selectiostat were significantly higher than the theoretical growth rate com-
puted for the parameters of the initial strain. It is also noticeable that, for the temperature
conditions of cycles 8, 9 and 10, the growth is still possible in the SFb selectiostat, while no
growth could be observed at these temperatures for the initial strain. The reason why the
growth rates in the SFb selectiostat measured during the two first cycles were lower than the
theoretical growth rate for the initial W2X strain might be due to an initial acclimation
phase to the variable temperature conditions. It is likely that, by maintaining the cells for a
longer time in the temperature conditions of cycles 1 and 2, the growth rate would have pro-
gressively increased as a result of a combination of acclimation and adaptation. This
increase in average growth can indeed clearly be observed for the last cycles which were
repeated several weeks. As a matter of illustration, the average growth rate during the cycle
9 was multiplied by 5 when comparing the first and the last week of the cycle (Fig 3A). The
selection coefficient s (Fig 3B) was positive after cycle 3; this means that the frequency of
new thermally adapted individuals in the population increased to the detriment of the initial
strain [21]. This increase shows that the initial strain was not fitted to these highly changing
temperature conditions. From cycle 8 to 10 (TLow = 12˚C; THigh = 35.5˚C), the transition
from a cycle to the next led systematically to a reduction of the selection coefficient. After
the transition in the new cycle, it gradually increased with the number of generations
highlighting the progressive emergence of cells better fitted to the selective pressure (Fig 3B;
black arrows).
With a Luria-Delbruck fluctuation analysis [7], Costas et al. [25] studied the variance of the
fitness during selection conditions and determined the origin of mutant adapted to the new
thermal conditions. They increased the average growth temperature as a stressing parameter
Continuous selection pressure to improve temperature acclimation of Tisochrysis lutea
PLOS ONE | https://doi.org/10.1371/journal.pone.0183547 September 13, 2017 8 / 19
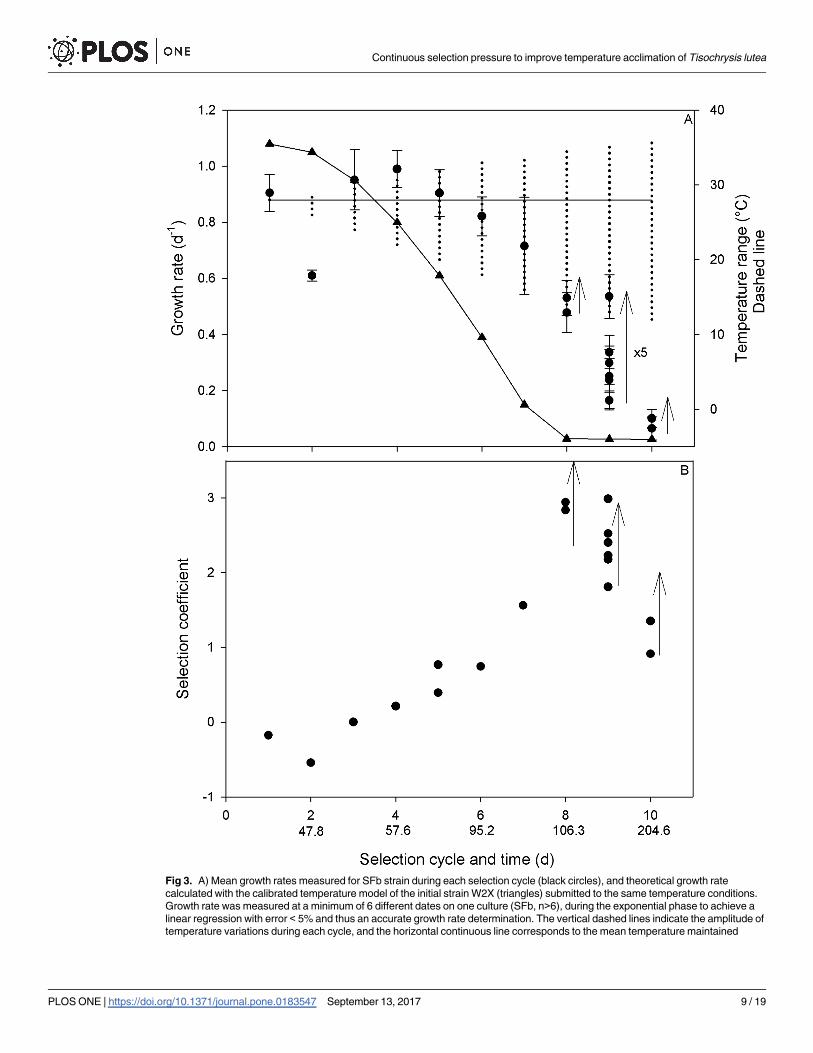
Fig 3. A) Mean growth rates measured for SFb strain during each selection cycle (black circles), and theoretical growth rate
calculated with the calibrated temperature model of the initial strain W2X (triangles) submitted to the same temperature conditions.
Growth rate was measured at a minimum of 6 different dates on one culture (SFb, n>6), during the exponential phase to achieve a
linear regression with error < 5% and thus an accurate growth rate determination. The vertical dashed lines indicate the amplitude of
temperature variations during each cycle, and the horizontal continuous line corresponds to the mean temperature maintained
Continuous selection pressure to improve temperature acclimation of Tisochrysis lutea
PLOS ONE | https://doi.org/10.1371/journal.pone.0183547 September 13, 2017 9 / 19
for Isochrysis galbana wild type (Tmax = 28˚C). Under a low temperature range (15–30˚C), the
increase of the strain fitness was due to acclimation or pre-selective mutations (selection from
the pre-existing genetic diversity). Under a higher range (30–35˚C), they assumed that the
observed response was linked to adaptive mutations (occurrence and selection of new
mutants). With our protocol, it was not possible to identify the source of fitness increase. Since
the pressure of selection was dynamic, in contrast to [25], the observed selection was probably
a dynamical equilibrium involving acclimation, pre-selective mutations and adaptive mutation
to the emergence of a new population with a broader thermal niche and/or a higher thermal
acclimation capacity.
New strain characterization
The new strains were obtained after 41 generations in fed-batch (SFb) and approximately 157
generations in turbidostat (STurb; value obtained from the estimate of the average growth rate
of the STurb population based on the dilution rate). The thermal response of these two final
new strains and the initial strain W2X was characterized with the TIP [16] and compared (Fig
2). The cardinal temperatures for these new strains were assessed using the model of [4]. The
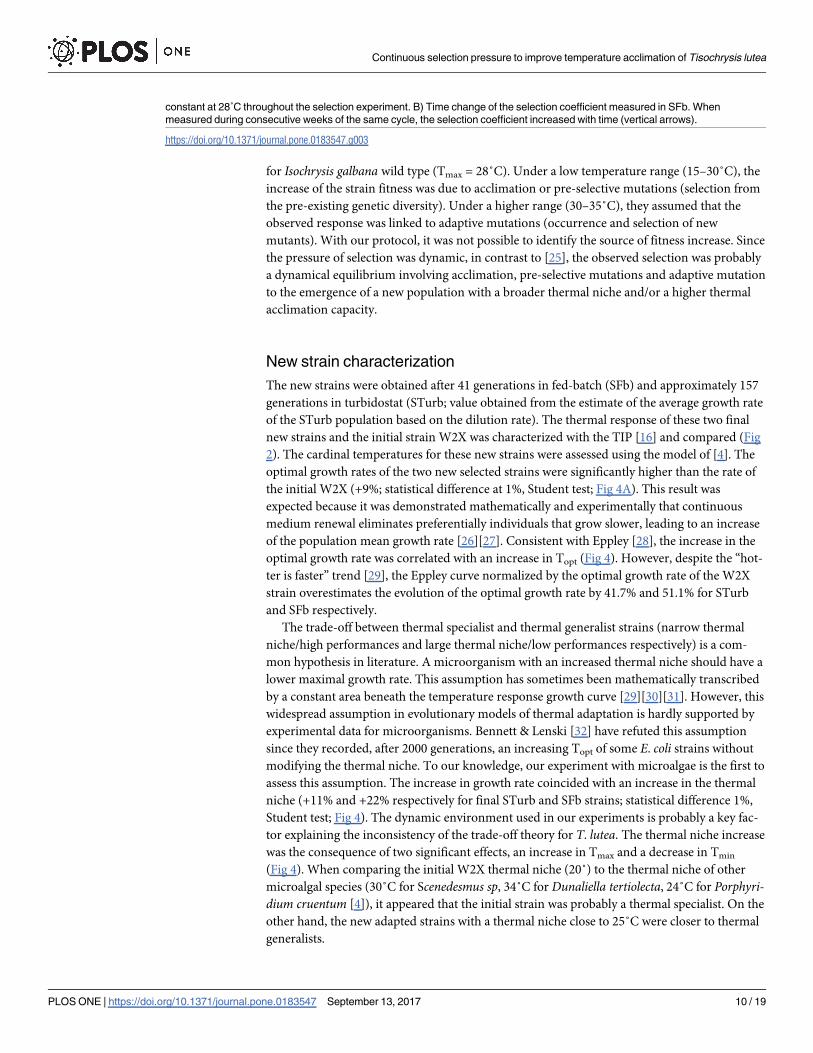
optimal growth rates of the two new selected strains were significantly higher than the rate of
the initial W2X (+9%; statistical difference at 1%, Student test; Fig 4A). This result was
expected because it was demonstrated mathematically and experimentally that continuous
medium renewal eliminates preferentially individuals that grow slower, leading to an increase
of the population mean growth rate [26][27]. Consistent with Eppley [28], the increase in the
optimal growth rate was correlated with an increase in Topt (Fig 4). However, despite the “hot-
ter is faster” trend [29], the Eppley curve normalized by the optimal growth rate of the W2X
strain overestimates the evolution of the optimal growth rate by 41.7% and 51.1% for STurb
and SFb respectively.
The trade-off between thermal specialist and thermal generalist strains (narrow thermal
niche/high performances and large thermal niche/low performances respectively) is a com-
mon hypothesis in literature. A microorganism with an increased thermal niche should have a
lower maximal growth rate. This assumption has sometimes been mathematically transcribed
by a constant area beneath the temperature response growth curve [29][30][31]. However, this
widespread assumption in evolutionary models of thermal adaptation is hardly supported by
experimental data for microorganisms. Bennett & Lenski [32] have refuted this assumption
since they recorded, after 2000 generations, an increasing Topt of some E. coli strains without
modifying the thermal niche. To our knowledge, our experiment with microalgae is the first to
assess this assumption. The increase in growth rate coincided with an increase in the thermal
niche (+11% and +22% respectively for final STurb and SFb strains; statistical difference 1%,
Student test; Fig 4). The dynamic environment used in our experiments is probably a key fac-
tor explaining the inconsistency of the trade-off theory for T. lutea. The thermal niche increase
was the consequence of two significant effects, an increase in Tmax and a decrease in Tmin
(Fig 4). When comparing the initial W2X thermal niche (20˚) to the thermal niche of other
microalgal species (30˚C for Scenedesmus sp, 34˚C for Dunaliella tertiolecta, 24˚C for Porphyri-dium cruentum [4]), it appeared that the initial strain was probably a thermal specialist. On the
other hand, the new adapted strains with a thermal niche close to 25˚C were closer to thermal
generalists.
constant at 28˚C throughout the selection experiment. B) Time change of the selection coefficient measured in SFb. When
measured during consecutive weeks of the same cycle, the selection coefficient increased with time (vertical arrows).
https://doi.org/10.1371/journal.pone.0183547.g003
Continuous selection pressure to improve temperature acclimation of Tisochrysis lutea
PLOS ONE | https://doi.org/10.1371/journal.pone.0183547 September 13, 2017 10 / 19
Fig 4. Comparison between the new STurb and SFb strains and the initial W2X strain. A) Growth rate. B) Cardinal
temperatures and thermal niche. Values are expressed as the mean ± standard deviation determined by a jackknife
analysis. Groups marked with the same letter (a, b or c) are not statistically different (1% error, Student test). Different
letters indicate groups statistically different.
https://doi.org/10.1371/journal.pone.0183547.g004
Continuous selection pressure to improve temperature acclimation of Tisochrysis lutea
PLOS ONE | https://doi.org/10.1371/journal.pone.0183547 September 13, 2017 11 / 19
Previous studies carried out with bacteria have shown that these microorganisms adapt
their optimal growth temperature (Topt) to the average temperature of their environment [33]
or slightly above as hypothesized by some models [34] but very few data reinforce this hypoth-
esis. After an adaptation of three months at constant average temperatures, [11] recorded the
same growth rate for Skeletonema costatum at 3˚C and 18˚C. Likewise, by submitting Isochrysisgalbana to increasing constant average temperatures, [35] reported positive growth at 35˚C for
the adapted strain, whereas the wild type did not grow at this temperature. Here, Topt of the
new strains increased during the selection process and was at the end higher than the average
temperature (28˚C). This evolution is consistent with [36] who compared the Topt modelled
for 195 species with the average temperature of the species location.
Our experiment, carried out with intense daily temperatures variations but constant mean
value, highlighted that temperature adaptation is complex and depends not only on the aver-
age temperature but also on the temperature range and its dynamics. It also highlighted the
importance to consider all the cardinal temperatures and not only the optimal growth temper-
ature as it is too often the case.
Evolution of the biochemical composition across the selection procedure
In T. lutea, nitrogen starvation increases the total lipid content [37][38]. The initial W2X strain
(CCAP 927/17), produces 2 times more neutral lipids (1.7 times more total lipids and a higher
ratio of neutral to polar lipids) than the wild type (CCAP 927/14; [17]). After our thermal
selection experiment, it was necessary to check the preservation of these highly interesting
lipid properties. Lipid content of the adapted strains cultivated at 28˚C during the TIP experi-
ment was compared with measurements made on the initial W2X, during the benchmark
experiment, in the same culture conditions. Starvation state were similar (C:N ratio: 20.9, 17.7
and 18.0 ± 1.3 mol:mol respectively for SFb, STurb and W2X).
The adapted SFb and STurb strains had higher total lipid content than the initial W2X
strain (0.58, 0.63 and 0.48 ± 0.01 μg.μgC-1 respectively for SFb, STurb and W2X; Fig 5A).
Lipid content found for the W2X was in accordance with result from [17] for the same strain
(0.4 ± 0.05 μg.μgC-1). It could be hypothesized that total lipids were enhanced due to the
thermal stress response induced by temperature variations. The acclimation response of
total lipids to temperature is not clear in the literature [39]. For some species, total lipids
increased as temperature decreases, and reach maximum levels at extreme temperatures [40]
[40][41][3]. Other authors found a strong link between total lipid content and growth rate
[42][43][14]. However, only acclimation to temperature was studied without emphasis on
long term evolution.
Moreover, the repartition in lipid classes changed strongly between the adapted and the ini-
tial strains. Under nitrogen starvation, adapted strains exhibited higher neutral lipid content
(+ 92%) and higher phospholipid content (+53%) than the W2X strain (Fig 5B). No difference
was observed in the relative repartition of free fatty acids between these strains (Table 2). In
response to cold temperatures, membrane cell fluidity is preserved by an increase of polyunsat-
urated fatty acid and a decrease of saturated and monosaturated fatty acid [14]. Very few infor-
mation exist on lipid class response to temperature (phospholipids, glycolipids and neutral
lipids). Some works suggest that an increase of the temperature increases total lipids and neu-
tral lipids [44]. Once again, these works studied only acclimation. Lipid adaptation to tempera-
ture was never experimented. Lipids were affected by the thermal selection procedure but the
attractive lipid profile of the initial strain in term of neutral lipids production was not degraded
but on the contrary improved. At the end, total lipid productivity of the adapted strains was
Continuous selection pressure to improve temperature acclimation of Tisochrysis lutea
PLOS ONE | https://doi.org/10.1371/journal.pone.0183547 September 13, 2017 12 / 19
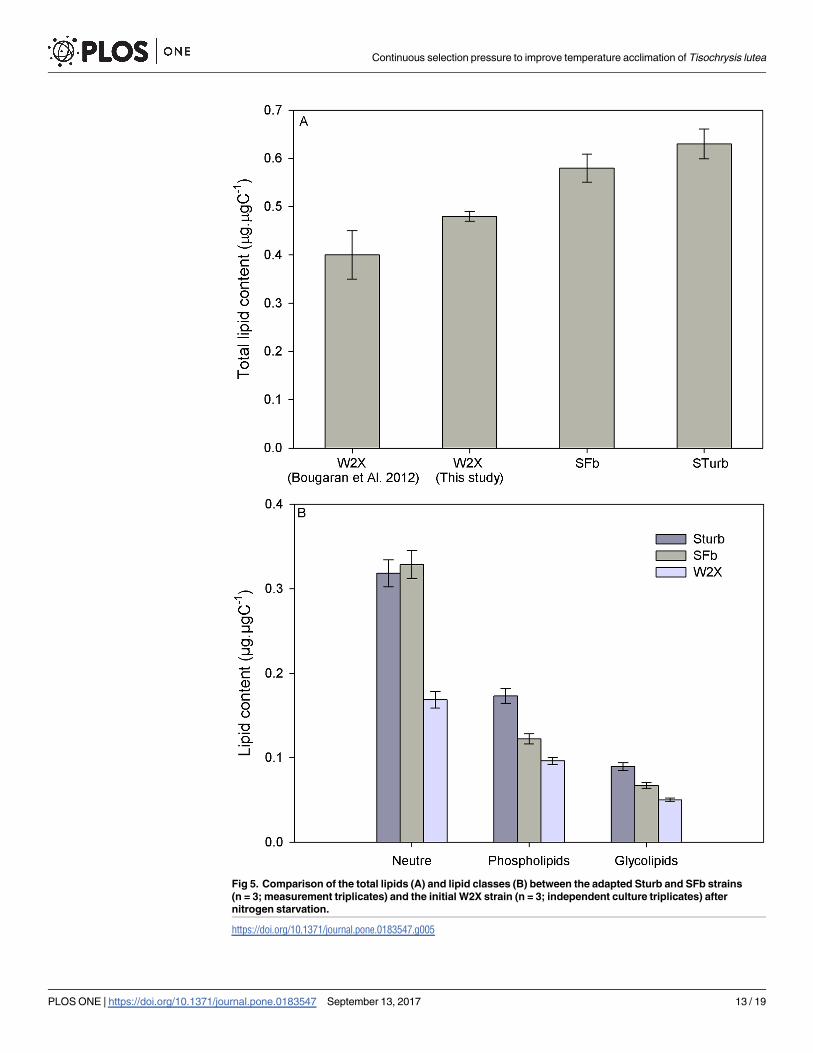
Fig 5. Comparison of the total lipids (A) and lipid classes (B) between the adapted Sturb and SFb strains
(n = 3; measurement triplicates) and the initial W2X strain (n = 3; independent culture triplicates) after
nitrogen starvation.
https://doi.org/10.1371/journal.pone.0183547.g005
Continuous selection pressure to improve temperature acclimation of Tisochrysis lutea
PLOS ONE | https://doi.org/10.1371/journal.pone.0183547 September 13, 2017 13 / 19
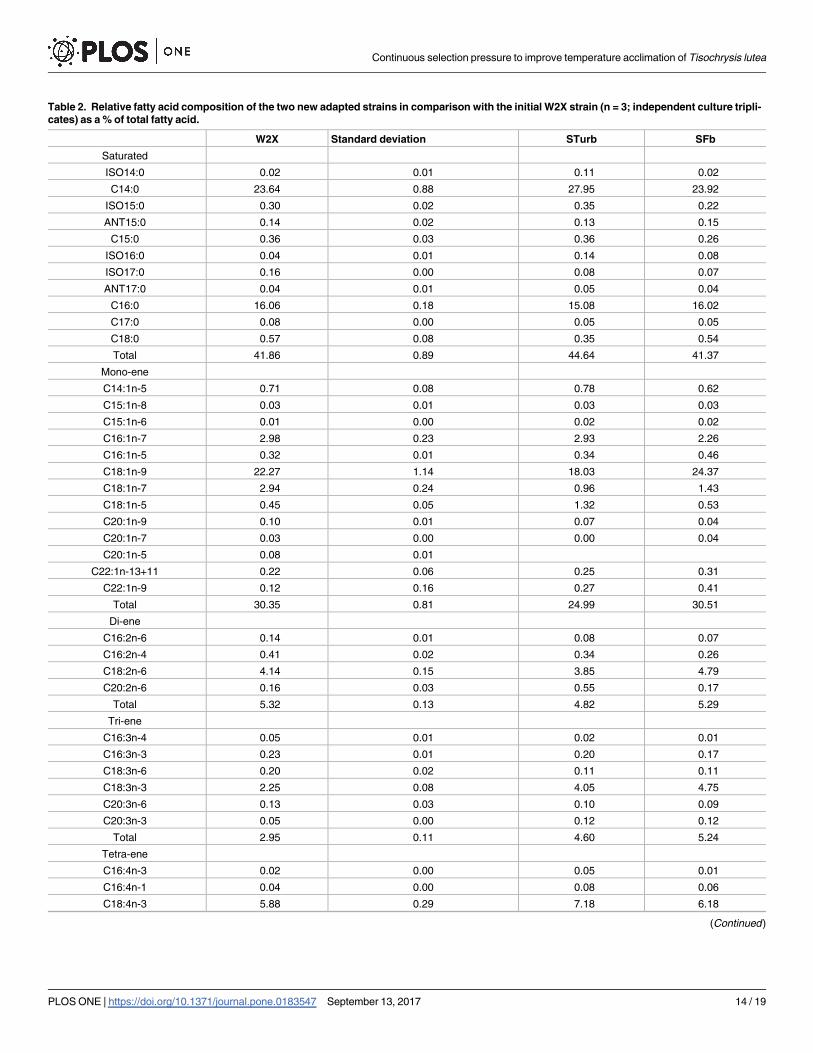
Table 2. Relative fatty acid composition of the two new adapted strains in comparison with the initial W2X strain (n = 3; independent culture tripli-
cates) as a % of total fatty acid.
W2X Standard deviation STurb SFb
Saturated
ISO14:0 0.02 0.01 0.11 0.02
C14:0 23.64 0.88 27.95 23.92
ISO15:0 0.30 0.02 0.35 0.22
ANT15:0 0.14 0.02 0.13 0.15
C15:0 0.36 0.03 0.36 0.26
ISO16:0 0.04 0.01 0.14 0.08
ISO17:0 0.16 0.00 0.08 0.07
ANT17:0 0.04 0.01 0.05 0.04
C16:0 16.06 0.18 15.08 16.02
C17:0 0.08 0.00 0.05 0.05
C18:0 0.57 0.08 0.35 0.54
Total 41.86 0.89 44.64 41.37
Mono-ene
C14:1n-5 0.71 0.08 0.78 0.62
C15:1n-8 0.03 0.01 0.03 0.03
C15:1n-6 0.01 0.00 0.02 0.02
C16:1n-7 2.98 0.23 2.93 2.26
C16:1n-5 0.32 0.01 0.34 0.46
C18:1n-9 22.27 1.14 18.03 24.37
C18:1n-7 2.94 0.24 0.96 1.43
C18:1n-5 0.45 0.05 1.32 0.53
C20:1n-9 0.10 0.01 0.07 0.04
C20:1n-7 0.03 0.00 0.00 0.04
C20:1n-5 0.08 0.01
C22:1n-13+11 0.22 0.06 0.25 0.31
C22:1n-9 0.12 0.16 0.27 0.41
Total 30.35 0.81 24.99 30.51
Di-ene
C16:2n-6 0.14 0.01 0.08 0.07
C16:2n-4 0.41 0.02 0.34 0.26
C18:2n-6 4.14 0.15 3.85 4.79
C20:2n-6 0.16 0.03 0.55 0.17
Total 5.32 0.13 4.82 5.29
Tri-ene
C16:3n-4 0.05 0.01 0.02 0.01
C16:3n-3 0.23 0.01 0.20 0.17
C18:3n-6 0.20 0.02 0.11 0.11
C18:3n-3 2.25 0.08 4.05 4.75
C20:3n-6 0.13 0.03 0.10 0.09
C20:3n-3 0.05 0.00 0.12 0.12
Total 2.95 0.11 4.60 5.24
Tetra-ene
C16:4n-3 0.02 0.00 0.05 0.01
C16:4n-1 0.04 0.00 0.08 0.06
C18:4n-3 5.88 0.29 7.18 6.18
(Continued )
Continuous selection pressure to improve temperature acclimation of Tisochrysis lutea
PLOS ONE | https://doi.org/10.1371/journal.pone.0183547 September 13, 2017 14 / 19
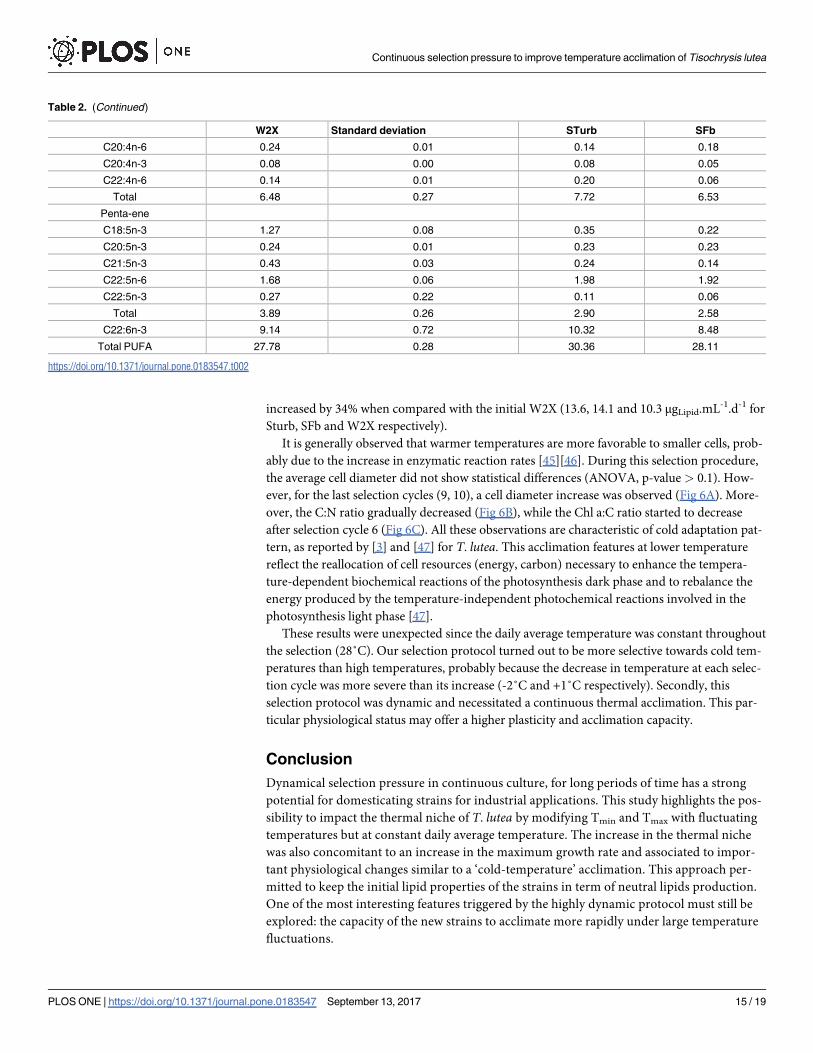
increased by 34% when compared with the initial W2X (13.6, 14.1 and 10.3 μgLipid.mL-1.d-1 for
Sturb, SFb and W2X respectively).
It is generally observed that warmer temperatures are more favorable to smaller cells, prob-
ably due to the increase in enzymatic reaction rates [45][46]. During this selection procedure,
the average cell diameter did not show statistical differences (ANOVA, p-value > 0.1). How-
ever, for the last selection cycles (9, 10), a cell diameter increase was observed (Fig 6A). More-
over, the C:N ratio gradually decreased (Fig 6B), while the Chl a:C ratio started to decrease
after selection cycle 6 (Fig 6C). All these observations are characteristic of cold adaptation pat-
tern, as reported by [3] and [47] for T. lutea. This acclimation features at lower temperature
reflect the reallocation of cell resources (energy, carbon) necessary to enhance the tempera-
ture-dependent biochemical reactions of the photosynthesis dark phase and to rebalance the
energy produced by the temperature-independent photochemical reactions involved in the
photosynthesis light phase [47].
These results were unexpected since the daily average temperature was constant throughout
the selection (28˚C). Our selection protocol turned out to be more selective towards cold tem-
peratures than high temperatures, probably because the decrease in temperature at each selec-
tion cycle was more severe than its increase (-2˚C and +1˚C respectively). Secondly, this
selection protocol was dynamic and necessitated a continuous thermal acclimation. This par-
ticular physiological status may offer a higher plasticity and acclimation capacity.
Conclusion
Dynamical selection pressure in continuous culture, for long periods of time has a strong
potential for domesticating strains for industrial applications. This study highlights the pos-
sibility to impact the thermal niche of T. lutea by modifying Tmin and Tmax with fluctuating
temperatures but at constant daily average temperature. The increase in the thermal niche
was also concomitant to an increase in the maximum growth rate and associated to impor-
tant physiological changes similar to a ‘cold-temperature’ acclimation. This approach per-
mitted to keep the initial lipid properties of the strains in term of neutral lipids production.
One of the most interesting features triggered by the highly dynamic protocol must still be
explored: the capacity of the new strains to acclimate more rapidly under large temperature
fluctuations.
Table 2. (Continued)
W2X Standard deviation STurb SFb
C20:4n-6 0.24 0.01 0.14 0.18
C20:4n-3 0.08 0.00 0.08 0.05
C22:4n-6 0.14 0.01 0.20 0.06
Total 6.48 0.27 7.72 6.53
Penta-ene
C18:5n-3 1.27 0.08 0.35 0.22
C20:5n-3 0.24 0.01 0.23 0.23
C21:5n-3 0.43 0.03 0.24 0.14
C22:5n-6 1.68 0.06 1.98 1.92
C22:5n-3 0.27 0.22 0.11 0.06
Total 3.89 0.26 2.90 2.58
C22:6n-3 9.14 0.72 10.32 8.48
Total PUFA 27.78 0.28 30.36 28.11
https://doi.org/10.1371/journal.pone.0183547.t002
Continuous selection pressure to improve temperature acclimation of Tisochrysis lutea
PLOS ONE | https://doi.org/10.1371/journal.pone.0183547 September 13, 2017 15 / 19
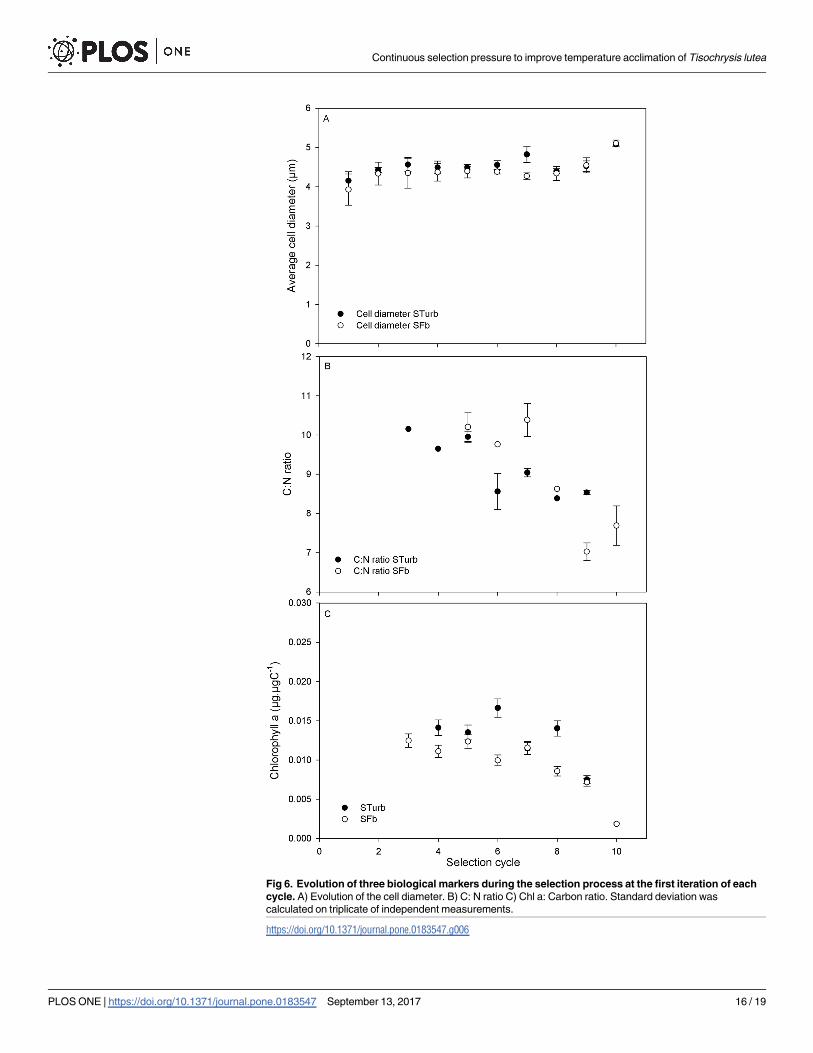
Fig 6. Evolution of three biological markers during the selection process at the first iteration of each
cycle. A) Evolution of the cell diameter. B) C: N ratio C) Chl a: Carbon ratio. Standard deviation was
calculated on triplicate of independent measurements.
https://doi.org/10.1371/journal.pone.0183547.g006
Continuous selection pressure to improve temperature acclimation of Tisochrysis lutea
PLOS ONE | https://doi.org/10.1371/journal.pone.0183547 September 13, 2017 16 / 19
Acknowledgments
H. Bonnefond acknowledges the support of an ADEME grant. The experiments were carried
out in the framework of the ANR Facteur 4 ANR-12-BIME-0004. The authors gratefully
acknowledge P. Chang for improvement of the English and T. Blasco for total carbon
measurements.
Author Contributions
Conceptualization: Hubert Bonnefond, Olivier Bernard, Antoine Sciandra.
Data curation: Hubert Bonnefond, Ghjuvan Grimaud, Judith Rumin.
Formal analysis: Ghjuvan Grimaud.
Funding acquisition: Gael Bougaran, Olivier Bernard, Antoine Sciandra.
Investigation: Hubert Bonnefond, Judith Rumin, Manon Gachelin.
Methodology: Hubert Bonnefond, Eric Pruvost, Olivier Bernard, Antoine Sciandra.
Project administration: Gael Bougaran, Olivier Bernard, Antoine Sciandra.
Resources: Amelie Talec, Marc Boutoute, Eric Pruvost.
Supervision: Olivier Bernard, Antoine Sciandra.
Validation: Hubert Bonnefond, Judith Rumin.
Visualization: Hubert Bonnefond, Antoine Sciandra.
Writing – original draft: Hubert Bonnefond.
Writing – review & editing: Hubert Bonnefond, Ghjuvan Grimaud, Gael Bougaran, Amelie
Talec, Olivier Bernard, Antoine Sciandra.
References
1. Ras M, Steyer J, Bernard O. Temperature effect on microalgae: a crucial factor for outdoor production.
Rev Environ Sci Biotechnol. 2013; 153–164. https://doi.org/10.1007/s11157-013-9310-6
2. Bechet Q, Shilton A, Guieysse B. Modeling the effects of light and temperature on algae growth: state of
the art and critical assessment for productivity prediction during outdoor cultivation. Biotechnol Adv.
Elsevier Inc.; 2013; 31: 1648–63. https://doi.org/10.1016/j.biotechadv.2013.08.014 PMID: 23981914
3. Thompson PA, Guo M, Harrison PJ. Effects of variation in temperature. I. On the biochemical composi-
tion of eight species of marine phytoplankton. J Phycol. 1992; 28: 481–488.
4. Bernard O, Remond B. Validation of a simple model accounting for light and temperature effect on
microalgal growth. Bioresour Technol. Elsevier Ltd; 2012; 123: 520–7. https://doi.org/10.1016/j.
biortech.2012.07.022 PMID: 22940363
5. Raven J a, Geider RJ. Temperature and algal growth. New Phytol. 1988; 110: 441–461. https://doi.org/
10.1111/j.1469-8137.1988.tb00282.x
6. Padfield D, Yvon-Durocher G, Buckling A, Jennings S, Yvon-Durocher G. Rapid evolution of metabolic
traits explains thermal adaptation in phytoplankton. Ecol Lett. 2016; 19: 133–142. https://doi.org/10.
1111/ele.12545 PMID: 26610058
7. Luria SE, Delbruck M. Mutations of Bacteria from Virus Sensitivity to Virus Resistance. Genetics. 1943;
28: 491–511.
8. Siddiqui KS, Williams TJ, Wilkins D, Yau S, Allen MA, Brown M V., et al. Psychrophiles. Annu Rev Earth
Planet Sci. 2013; 41: 87–115. https://doi.org/10.1146/annurev-earth-040610-133514
9. Xu Y, Feller G, Gerday C, Glansdorff N. Moritella Cold-Active Dihydrofolate Reductase : Are There Nat-
ural Limits to Optimization of Catalytic Efficiency at Low Temperature ? Moritella Cold-Active Dihydrofo-
late Reductase : Are There Natural Limits to Optimization of Catalytic Efficiency at Low T. J Bacteriol.
2003; 185: 5519–5526. https://doi.org/10.1128/JB.185.18.5519-5526.2003 PMID: 12949104
Continuous selection pressure to improve temperature acclimation of Tisochrysis lutea
PLOS ONE | https://doi.org/10.1371/journal.pone.0183547 September 13, 2017 17 / 19
10. Devos N, Ingouff M, Loppes R, Matagne RF. Rubisco adaptation to low temperatures: a comparative
study in psychrophilic and mesophilic unicellular algae. J Phycol. 1998; 34: 655–660. https://doi.org/10.
1046/j.1529-8817.1998.340655.x
11. Mortain-Bertrand a., Descolas-Gros C, Jupin H. Growth, photosynthesis and carbon metabolism in the
temperate marine diatom Skeletonema costatum adapted to low temperature and low photon-flux den-
sity. Mar Biol. 1988; 100: 135–141. https://doi.org/10.1007/BF00392963
12. Renaud SM, Zhou H, Parry D. Efect of temperature on the growth, total lipid content and fatty acid com-
position of recently isolated tropical microalgae Isochrysis sp., Nitzschia closterium, Nitzschia paleacea,
and commercial species Isochrysis sp.(clone T. J Appl . . .. 1995; 595–602. Available: http://link.
springer.com/article/10.1007/BF00003948
13. Renaud SM, Thinh L-V, Lambrinidis G, Parry DL. Effect of temperature on growth, chemical composi-
tion and fatty acid composition of tropical Australian microalgae grown in batch cultures. Aquaculture.
2002; 211: 195–214. https://doi.org/10.1016/S0044-8486(01)00875-4
14. Guschina I a, Harwood JL. Lipids and lipid metabolism in eukaryotic algae. Prog Lipid Res. 2006; 45:
160–86. https://doi.org/10.1016/j.plipres.2006.01.001 PMID: 16492482
15. Kobayashi Y, Harada N, Nishimura Y, Saito T, Nakamura M, Fujiwara T, et al. Algae Sense Exact Tem-
peratures: Small Heat Shock Proteins Are Expressed at the Survival Threshold Temperature in Cyani-
dioschyzon merolae and Chlamydomonas reinhardtii. Genome Biol Evol. 2014; 6: 2731–2740. https://
doi.org/10.1093/gbe/evu216 PMID: 25267447
16. Marchetti J, Bougaran G, Dean Le L. Optimizing conditions for the continuous culture of Isochrysis affi-
nis galbana relevant to commercial hatcheries. Aquaculture. 2012; 326–329: 106–115. Available: http://
www.sciencedirect.com/science/article/pii/S0044848611009094
17. Bougaran G, Rouxel C, Dubois N, Kaas R, Grouas S, Lukomska E, et al. Enhancement of neutral lipid
productivity in the microalga Isochrysis affinis Galbana (T-Iso) by a mutation-selection procedure. Bio-
technol Bioeng. 2012; 109: 2737–45. https://doi.org/10.1002/bit.24560 PMID: 22614222
18. Carrier G, Garnier M, Le Cunff L, Bougaran G, Probert I, De Vargas C, et al. Comparative transcriptome
of wild type and selected strains of the microalgae Tisochrysis lutea provides insights into the genetic
basis, lipid metabolism and the life cycle. PLoS One. 2014; 9. https://doi.org/10.1371/journal.pone.
0086889 PMID: 24489800
19. Guillard R. Culture of phytoplankton for feeding marine invertebrates. Cult Mar Invertebr Anim Plenum.
1975; 1975. http://scholar.google.com/scholar?hl=en&btnG=Search&q=intitle:Culture+of
+phytoplankton+for+feeding+marine+invertebrates#0
20. Bernard O. Odin [Internet]. 2016. https://team.inria.fr/biocore/software/odin/
21. Chevin L-M. On measuring selection in experimental evolution. Biol Lett. 2011; 7: 210–213. https://doi.
org/10.1098/rsbl.2010.0580 PMID: 20810425
22. Lichtenthaler H. Chlorophylls and carotenoids: Pigments of photosynthetic biomembranes. Methods
Enzymol. 1987; 148: 350–382. Available: http://www.sciencedirect.com/science/article/pii/
0076687987480361
23. Bligh E, Dyer W. A rapid method of total lipid extraction and purification. Can J Biochem Physiol. 1959;
37: 911–917. Available: http://www.nrcresearchpress.com/doi/abs/10.1139/o59-099 PMID: 13671378
24. Morrison WR, Smith LM. Preparation of Fatty Acid Methyl Esters and Dimethylacetals From Lipids With
Boron Fluoride—Methanol. J Lipid Res. 1964; 5: 600–608. PMID: 14221106
25. Costas E, Baselga-cervera B, Lopez-Rodas V. Estimating the Genetic Capability of Different Phyto-
plankton Organisms to Adapt to Climate Warming. Oceanogr Open Access. 2014; 2. https://doi.org/10.
4172/2332-2632.1000123
26. Masci P, Bernard O, Grognard F. Continuous selection of the fastest growing species in the chemostat.
IFAC Proceedings Volumes (IFAC-PapersOnline). 2008. 10.3182/20080706-5-KR-1001.3265
27. Hansen SR, Hubbell SP. Single-nutrient microbial competition: qualitative agreement between experi-
mental and theoretically forecast outcomes. Science. 1980; 207: 1491–1493. https://doi.org/10.1126/
science.6767274 PMID: 6767274
28. Eppley RW. Temperature and phytoplankton growth in the sea. Fish Bull. 1972; 70.
29. Knies JL, Kingsolver JG, Burch CL. Hotter is better and broader: thermal sensitivity of fitness in a popu-
lation of bacteriophages. Am Nat. 2009; 173: 419–430. https://doi.org/10.1086/597224 PMID:
19232002
30. Levins R. Evolution in changing environments. Princet Univ Press Princet NJ. 1968; 2: 120. https://doi.
org/10.2307/2173276
31. Huey RB, Slatkin M. cost and benefits of lizard thermoregulation. Q Rev og Biol. 1976; 51: 363–384.
Continuous selection pressure to improve temperature acclimation of Tisochrysis lutea
PLOS ONE | https://doi.org/10.1371/journal.pone.0183547 September 13, 2017 18 / 19
32. Bennett A, Lenski R. Evolutionary adaptation to temperature II. Thermal niches of experimental lines of
Escherichia coli. Evolution (N Y). 1993; 47: 1–12. Available: http://www.jstor.org/stable/10.2307/
2410113
33. Bennett A, Lenski R, Mittler J. Evolutionary adaptation to temperature. I. Fitness responses of Escheri-
chia coli to changes in its thermal environment. Evolution (N Y). 1992; 46: 16–30. https://doi.org/10.
2307/2409801
34. Urban MC, Burger R, Bolnick DI. Asymmetric selection and the evolution of extraordinary defences. Nat
Commun. 2013; 4: 2085. https://doi.org/10.1038/ncomms3085 PMID: 23820378
35. Huertas IE, Rouco M, Lopez-Rodas V, Costas E. Warming will affect phytoplankton differently: evi-
dence through a mechanistic approach. Proc Biol Sci. 2011; 278: 3534–43. https://doi.org/10.1098/
rspb.2011.0160 PMID: 21508031
36. Grimaud GM, Le Guennec V, Ayata S-D, Mairet F, Sciandra A, Bernard O. Modelling the effect of tem-
perature on phytoplankton growth across the global ocean. IFAC-PapersOnLine. Elsevier Ltd.; 2015;
48: 228–233. https://doi.org/10.1016/j.ifacol.2015.05.059
37. Lacour T, Sciandra A, Talec A, Mayzaud P, Bernard O. Neutral Lipid and Carbohydrate Productivities
As a Response To Nitrogen Status in Isochrysis Sp. (T-Iso; Haptophyceae): Starvation Versus Limita-
tion1. J Phycol. 2012; 48: 647–656. https://doi.org/10.1111/j.1529-8817.2012.01154.x PMID:
27011080
38. Breuer G, Lamers PP, Martens DE, Draaisma RB, Wijffels RH. The impact of nitrogen starvation on the
dynamics of triacylglycerol accumulation in nine microalgae strains. Bioresour Technol. Elsevier Ltd;
2012; 124: 217–226. https://doi.org/10.1016/j.biortech.2012.08.003 PMID: 22995162
39. Hu Q, Sommerfeld M, Jarvis E, Ghirardi M, Posewitz M, Seibert M, et al. Microalgal triacylglycerols as
feedstocks for biofuel production: Perspectives and advances. Plant J. 2008; 54: 621–639. https://doi.
org/10.1111/j.1365-313X.2008.03492.x PMID: 18476868
40. Gigova L, Ivanova N, Gacheva G, Andreeva R, Furnadzhieva S. Response of Trachydiscus Minutus
(Xanthophyceae) To Temperature and Light1. J Phycol. 2012; 48: 85–93. https://doi.org/10.1111/j.
1529-8817.2011.01088.x PMID: 27009653
41. Converti A, Casazza A a., Ortiz EY, Perego P, Del Borghi M. Effect of temperature and nitrogen concen-
tration on the growth and lipid content of Nannochloropsis oculata and Chlorella vulgaris for biodiesel
production. Chem Eng Process Process Intensif. 2009; 48: 1146–1151. https://doi.org/10.1016/j.cep.
2009.03.006
42. Roleda MY, Slocombe SP, Leakey RJG, Day JG, Bell EM, Stanley MS. Effects of temperature and
nutrient regimes on biomass and lipid production by six oleaginous microalgae in batch culture employ-
ing a two-phase cultivation strategy. Bioresour Technol. 2013; 129: 439–49. https://doi.org/10.1016/j.
biortech.2012.11.043 PMID: 23262022
43. Vıtova M, Bisova K, Kawano S, Zachleder V. Accumulation of energy reserves in algae: From cell
cycles to biotechnological applications. Biotechnol Adv. 2015; https://doi.org/10.1016/j.biotechadv.
2015.04.012 PMID: 25986035
44. Sriharan S, Bagga D, Nawaz M. The effects of nutrients and temperature on biomass, growth, lipid pro-
duction, and fatty acid composition of Cyclotella cryptica Reimann, Lewin, and Guillard. Appl Biochem
Biotechnol. 1991; 28–29: 317–326. https://doi.org/10.1007/BF02922611
45. Daufresne M, Lengfellner K, Sommer U. Global warming benefits the small in aquatic ecosystems. Proc
Natl Acad Sci U S A. 2009; 106: 12788–12793. https://doi.org/10.1073/pnas.0902080106 PMID:
19620720
46. Finkel Z V., Beardall J, Flynn KJ, Quigg A, Rees TA V, Raven J a. Phytoplankton in a changing world:
Cell size and elemental stoichiometry. J Plankton Res. 2010; 32: 119–137. https://doi.org/10.1093/
plankt/fbp098
47. Geider RJ. Light and temperature dependence of the carbon to chlorophyll a ratio in microalagae and
cyanobacteria: imoplication for physiology and growth of phytoplankton. New Phytol. 1987; 106: 1–34.
Continuous selection pressure to improve temperature acclimation of Tisochrysis lutea
PLOS ONE | https://doi.org/10.1371/journal.pone.0183547 September 13, 2017 19 / 19