Embed Size (px)
Citation preview
Continuous measurement of opticalsurfaces using a line-scan interferometerwith sinusoidal path length modulation
Holger Knell,1,∗ Soren Laubach,2,3 Gerd Ehret2 and Peter Lehmann1
1 Chair in Measurement Technology (CMT), Dept. Of Electrical Engineering, University ofKassel, Wilhelmshoher Allee 71, 34121 Kassel, Germany
2 Physikalisch-Technische Bundesanstalt (PTB), Bundesallee 100, 38116 Braunschweig,Germany
[email protected]∗[email protected]
Abstract: We present a fast approach to the continuous measurement ofrotational symmetric optical surfaces. This approach is based on a line scan-ning interferometer with sinusoidal modulation of the optical path length.The specimen is positioned with respect to the sensor and both are movedduring measurement by use of a five axes system comprising a high preci-sion rotational table. The calibration of both the line sensor as well as thescanning and positioning system is discussed. As proof of principle of themeasurement and stitching concept results of a scan of a rotational sym-metric sinusoidal structure and a spherical lens with a moderate slope areshown.OCIS codes: (110.0110) Imaging systems; (110.2650) Fringe analysis; (110.3175) Interfer-ometric imaging; (110.5086) Phase unwrapping; (110.6880) Three-dimensional image ac-quisition; (120.0120) Instrumentation, measurement, and metrology; (120.2650) Fringe anal-ysis; (120.2830) Height measurements; (120.3180) Interferometry; (120.3930) Metrologi-cal instrumentation; (120.3940) Metrology; (120.4640) Optical instruments; (120.4800) Op-tical standards and testing; (120.4820) Optical systems; (120.5050) Phase measurement;(120.5060) Phase modulation; (120.6650) Surface measurements, figure; (180.0180) Mi-croscopy; (180.3170) Interference microscopy.
References and links1. J.-M. Asfour and A. G. Poleshchuk, “Asphere testing with a Fizeau interferometer based on a combined
computer-generated hologram,” J. Opt. Soc. Am. A 23(1), 172–178 (2006).2. J. H. Bruning, D. R. Herriott, J. E. Gallagher, D. P. Rosenfeld, A. D. White, and D. J. Brangaccio, “Digital wave-
front measuring interferometer for testing optical surfaces and lenses,” Appl. Opt. 13(11), 2693–2703 (1974).3. C. Pruss and H. J. Tiziani, “Dynamic null lens for aspheric testing using a membrane mirror,” Opt. Commun.
233(1), 15–19 (2004).4. A. Beutler, “Comparison of 2D and 3D measurements of aspheres with a tactile and optical sensor on one
measuring instrument,” in “Proceedings of Optical Fabrication and Testing,” ed. (Optical Society of America,2014), pp. OTu4A–1.
5. R. Mastylo, D. Dontsov, E. Manske, and G. Jager, “A focus sensor for an application in a nanopositioning andnanomeasuring machine,” in Proc. SPIE 5856, 238–244 (2005).
6. H. J. Tiziani and H.-M. Uhde, “Three-dimensional image sensing by chromatic confocal microscopy,” Appl. Opt.33(10), 1838–1843 (1994).
7. J. Petter and G. Berger, “Non-contact profiling for high precision fast asphere topology measurement,” Proc.SPIE 8788, 878819 (2013).
8. P. Lehmann, M. Schulz, and J. Niehues, “Fiber optic interferometric sensor based on mechanical oscillation,”Proc. SPIE 7389, 738915 (2009).
9. M. Schulz and P. Lehmann, “Measurement of distance changes using a fibre-coupled common-path interferom-eter with mechanical path length modulation,” Meas. Sci. Technol. 24(6), 65202–65209 (2013).
#216737 - $15.00 USD Received 14 Aug 2014; revised 20 Oct 2014; accepted 24 Oct 2014; published 20 Nov 2014(C) 2014 OSA 1 December 2014 | Vol. 22, No. 24 | DOI:10.1364/OE.22.029787 | OPTICS EXPRESS 29787
10. C.-W. Liang, H.-S. Chang, P.-C. Lin, C.-C. Lee, and Y.-C. Chen, “Vibration modulated subaperture stitchinginterferometry,” Opt. Express 21(15), 18255–18260 (2013).
11. H. Zhang, H. Cheng, H. Y. Tam, Y. Wen, and D. Zhou, “High precision mode of subaperture stitching for opticalsurfaces measurement,” Front. Optoelec. 6(1), 167–174 (2013).
12. J. E. Millerd, N. J. Brock, J. B. Hayes, M. B. North-Morris, M. Novak, and J. C. Wyant, “Pixelated phase-maskdynamic interferometer,” Proc. SPIE 5531, (2004), pp. 304–314.
13. M. F. Kuchel, “Interferometric measurement of rotationally symmetric aspheric surfaces,” Proc. SPIE 7389,738916 (2009).
14. E. Garbusi, C. Pruss, and W. Osten, “Interferometer for precise and flexible asphere testing,” Opt. Lett. 33(24),2973–2975 (2008).
15. G. B. Baer, J. Schindler, C. Pruss, and W. Osten, “Measurement of Aspheres and Free-Form Surfaces with theTilted-Wave-Interferometer,” in Proceedings of Fringe, ITO, ed. (Springer, 2014), pp. 87–95.
16. H. Knell and P. Lehmann, “High speed measurement of specular surfaces based on carrier fringe patterns in aline scan Michelson interferometer setup,” Proc. SPIE 8788, 87880R (2013).
17. H. Knell, M. Schake, M. Schulz, and P. Lehmann, “Interferometric sensors based on sinusoidal optical pathlength modulation,” Proc. SPIE 9132, 91320I (2014).
18. O. Sasaki and H. Okazaki, “Sinusoidal phase modulating interferometry for surface profile measurement,” Appl.Opt. 25(18), 3137–3140 (1986).
19. U. Minoni, E. Sardini, E. Gelmini, F. Docchio, and D. Marioli, “A high-frequency sinusoidal phase-modulationinterferometer using an electro-optic modulator: Development and evaluation,” Rev. Sci. Instrum. 62, 2579–2583(1991).
20. K. Falaggis, D. P. Towers, and C. E. Towers, “Phase measurement through sinusoidal excitation with applicationto multi-wavelength interferometry,” J. Opt. A: Pure Appl. Opt. 11(5), 54008–54018 (2009).
21. P. Hariharan, B. F. Oreb, and T. Eiju, “Digital phase-shifting interferometry: a simple error-compensating phasecalculation algorithm,” Appl. Opt. 26(13), 2504–2506 (1987).
22. P. Lehmann, P. Kuhnhold, and W. Xie, “Reduction of chromatic aberration influences in vertical scanning white-light interferometry,” Meas. Sci. Technol. 25(6), 065203 (2014).
23. G. Ehret, M. Stavridis, C. Elster, “Deflectometric systems for absolute flatness measurements at PTB,” Meas.Sci. Technol. 23(9), 094007-1-094007-8 (2012).
24. Kemao, Q., “Windowed Fourier transform for fringe pattern analysis,” Appl. Opt. 43(13), 2695–2702 (2004).
1. Introduction
Fabrication of demanding optical components requires accurate measuring instruments in orderto fulfill geometrical tolerances. There are several well-established techniques to measure opti-cal surfaces of rotational symmetry. Probably the most common technique is the measurementof the complete object using a Fizeau or Twyman-Green interferometer and to apply a linearphase shifting technique to determine the phase information from a set of CCD camera images.This requires costly reference surfaces or computer generated holograms of sufficient accuracyadapting the wavefront to the geometry of the desired measurement object [1, 2]. The flexibil-ity of these full field phase shifting interferometers can be improved using adaptive optics toshape the reference wavefront [3]. As an alternative different point-wise measuring sensors arecombined with appropriate scanning and positioning systems in order to measure the geom-etry of an object in a sequential way. These systems for example use tactile, focus, confocalchromatic, or interferometric measuring principles [4–9]. Because of the point-wise workingprinciple there is a lack of either speed or lateral resolution. Other methods rely on the stitchingof sub-apertures and require the specimen to be moved exactly to distinct positions, so that thesub-apertures overlap appropriately. The measurement of sub-apertures usually uses methodsbased on linear phase shifting interferometry (PSI) [10, 11] to gather the height information ineach sub-aperture. Depending on the measurement technique the acquisition of separate datasets for each sub-aperture may be rather time consuming. Capturing four 90◦ phase shiftedsub-aperture images in a single shot is possible by using the pixelated phase mask technique re-cently developed [12]. However, stitching single data sets together leads to additional measure-ment uncertainty. Different methods to improve sub-aperture stitching have been employed:Aspherical objects of rotational symmetry can be measured by shifting a conventional Fizeauinterferometer designed for spherical surfaces in well-known steps to different positions along
#216737 - $15.00 USD Received 14 Aug 2014; revised 20 Oct 2014; accepted 24 Oct 2014; published 20 Nov 2014(C) 2014 OSA 1 December 2014 | Vol. 22, No. 24 | DOI:10.1364/OE.22.029787 | OPTICS EXPRESS 29788
the optical axis and carrying out PSI measurements at each position [13]. This results in a set ofcircular surface sections, related to those regions of the measuring object, where the measuredsurface locally fits the spherical wavefront. Another promising idea is the so-called tilted waveinterferometer (TWI) which illuminates the object with a set of tilted wavefronts [14, 15]. Thistechnique is similar to subaperture stitching but it does not require mechanical movement orscan axes. In this contribution we propose a novel approach to sub-aperture stitching. A linescanning interferometer [16,17] is used to measure ring shaped sub-apertures on a continuouslyrotating specimen. The interferometer consists of a microscope with a line scan camera and aMichelson setup which utilizes optical path length modulation (OPLM) in the reference arm togenerate interference signals from which the surface topography can be obtained. Measurementsystems based on OPLM were introduced first by Sasaki [18] and later by others [8, 19, 20].Several ring shaped sections related to different radial positions of the surface topography arestitched together, so that the complete surface topography finally results. Compared to point-wise measurement this approach promises better accuracy because of the overlapping rings.Compared to sub-aperture techniques employing 2D-fields of view, the line scan technique isless demanding from the optical point of view. Furthermore, the mechanical axes needed areclose to conventional configurations of tactile instruments used to measure objects of rotationalsymmetry, e.g. so-called form testers [4].
2. Sensor configuration
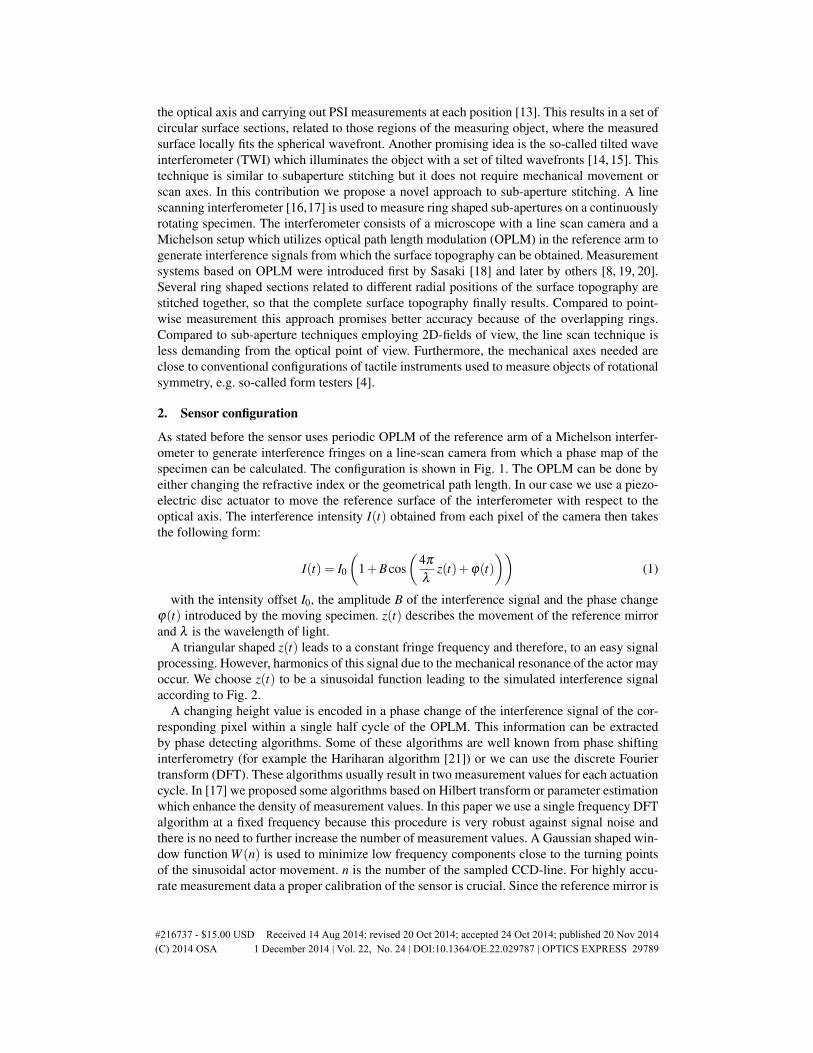
As stated before the sensor uses periodic OPLM of the reference arm of a Michelson interfer-ometer to generate interference fringes on a line-scan camera from which a phase map of thespecimen can be calculated. The configuration is shown in Fig. 1. The OPLM can be done byeither changing the refractive index or the geometrical path length. In our case we use a piezo-electric disc actuator to move the reference surface of the interferometer with respect to theoptical axis. The interference intensity I(t) obtained from each pixel of the camera then takesthe following form:
I(t) = I0
(1+Bcos
(4π
λz(t)+ϕ(t)
))(1)
with the intensity offset I0, the amplitude B of the interference signal and the phase changeϕ(t) introduced by the moving specimen. z(t) describes the movement of the reference mirrorand λ is the wavelength of light.
A triangular shaped z(t) leads to a constant fringe frequency and therefore, to an easy signalprocessing. However, harmonics of this signal due to the mechanical resonance of the actor mayoccur. We choose z(t) to be a sinusoidal function leading to the simulated interference signalaccording to Fig. 2.
A changing height value is encoded in a phase change of the interference signal of the cor-responding pixel within a single half cycle of the OPLM. This information can be extractedby phase detecting algorithms. Some of these algorithms are well known from phase shiftinginterferometry (for example the Hariharan algorithm [21]) or we can use the discrete Fouriertransform (DFT). These algorithms usually result in two measurement values for each actuationcycle. In [17] we proposed some algorithms based on Hilbert transform or parameter estimationwhich enhance the density of measurement values. In this paper we use a single frequency DFTalgorithm at a fixed frequency because this procedure is very robust against signal noise andthere is no need to further increase the number of measurement values. A Gaussian shaped win-dow function W (n) is used to minimize low frequency components close to the turning pointsof the sinusoidal actor movement. n is the number of the sampled CCD-line. For highly accu-rate measurement data a proper calibration of the sensor is crucial. Since the reference mirror is
#216737 - $15.00 USD Received 14 Aug 2014; revised 20 Oct 2014; accepted 24 Oct 2014; published 20 Nov 2014(C) 2014 OSA 1 December 2014 | Vol. 22, No. 24 | DOI:10.1364/OE.22.029787 | OPTICS EXPRESS 29789
Reference mirror
Light source
Line scancamera
Tube lens
Microscope objective
Specimen
Beam splitter
Projectedscan line
Bandpassfilter
Fig. 1: Michelson interferometer with oscillating reference mirror and light coupled directlyinto the interference beam splitter.
0 0.5 1 1.5 2 2.50
0.5
1
1.5
2
Time [ms]
Inte
nsity
[a. u
.]
0 0.5 1 1.5 2 2.5−1
−0.5
0
0.5
1
Mod
ulat
ion
[µm
]InterferenceOPLM
Fig. 2: Simulated interference signal of an OPLM interferometer and the corresponding pathlength modulation.
fixed to a piezoelectric disc actuator, the actuation amplitude is not completely constant alongthe scan line of the sensor. Therefore, the fringe frequency ff(p) and the fringe phase offsetϕo(p) of the OPLM have to be calibrated for each pixel of the scan line before measurement.The resulting phase is ϕf(p) . Here p is an index related to the pixel number of the CCD line, i.e.p ∈ {1, ...,1024}. While the fringe frequency can be measured on any static target, the fringephase offset has to be measured on a known preferably flat surface. Both values depend on theamplitude and the frequency of the actuator signal as well as on the location of the referencesurface corresponding to a given camera pixel. ϕo(p) consists of phase offsets from two differ-ent sources: the flatness deviation of the reference surface and the phase offset due to a positiondependent actor amplitude. Assuming a sample frequency fs the DFT algorithm leads to thefollowing equations to calculate the phase during a half cycle of the actuator signal:
#216737 - $15.00 USD Received 14 Aug 2014; revised 20 Oct 2014; accepted 24 Oct 2014; published 20 Nov 2014(C) 2014 OSA 1 December 2014 | Vol. 22, No. 24 | DOI:10.1364/OE.22.029787 | OPTICS EXPRESS 29790
If(p) =N/2−1
∑n=0
I(n, p)W (n) · exp(−2πin
ff(p)fs
)(2)
ϕf(p) = arctan
(Im(If(p)
)Re(If(p)
))−ϕo(p) (3)
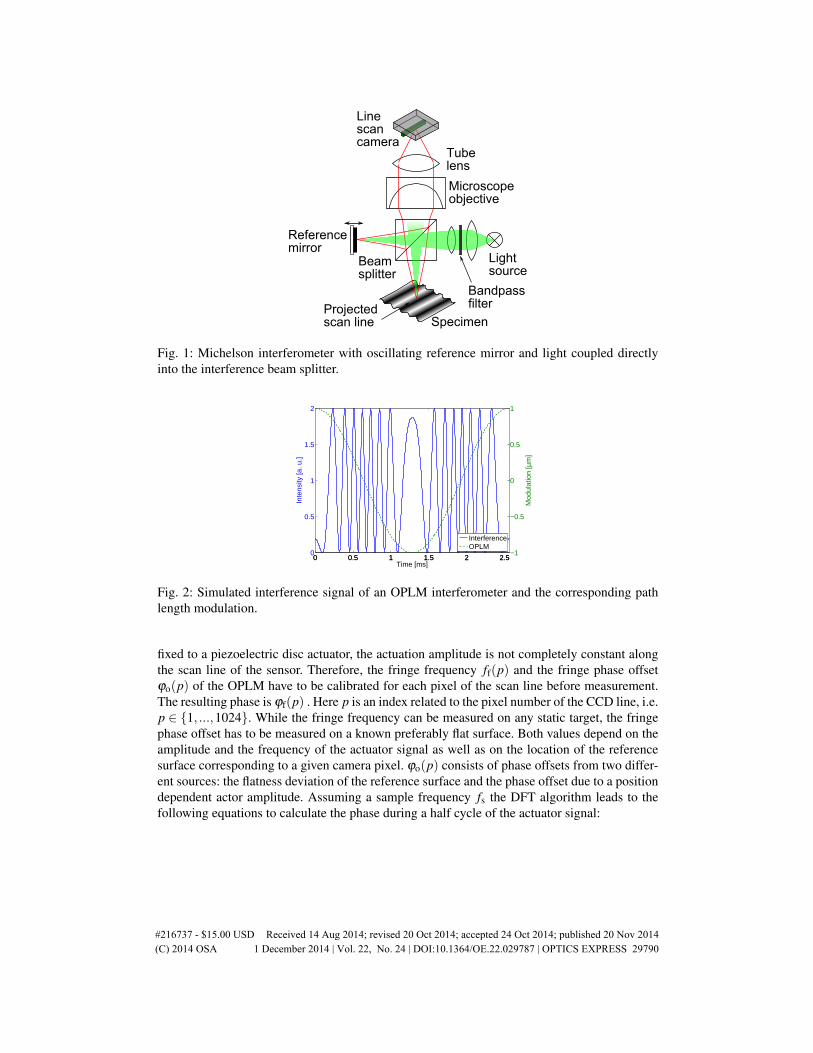
In order to obtain proper measurement results an additional calibration step is necessary: Dueto the hysteresis of actor movement there is an additional phase offset between measurementson the upward and downward actor movement ϕud . Furthermore, every second phase valuehas to be inverted because of the changing direction of actor movement. Using this calibrationprocedure a standard deviation σ below 0.8nm could be achieved in repeatability measurementson a static surface as it is shown in Fig. 3.
500 1000 1500 2000 2500 3000 3500−3
−2
−1
0
1
2
3
Measurement number [#]
Hei
ght d
evia
tion
[nm
]
σ = 0.77 nm
Fig. 3: Repeatability measurements on a static target for one single pixel, standard deviation isσ = 0.77nm.
For the optical setup of the sensor we use an infinity corrected apochromatic microscopeobjective with 5x magnification, NA = 0.14, working distance 34mm and a tube lens. For theinterferometer two configurations are possible. The first configuration is aimed at OPLM usinga narrow band light source with an actuated reference mirror as mentioned above. Here, thelight source is a green high power single emitter LED with an additional interference band passfilter in the afocal region of the illumination path. The filter bandwidth is FWHM = 9.7nmwith a center wavelength of λc = 531nm leading to a coherence length of lc = 29 µm. Thisspectral characteristic is a compromise allowing fairly large measuring range and avoiding theoccurrence of speckles and parasitic interferences. Since the intensity of the light source islargely reduced by the band pass filter, the illuminating light is directly coupled into the beamsplitter cube of the Michelson interferometer as shown in Fig. 1 in order to reduce any fur-ther loss. A polished silicon plate is used as reference mirror. This is a compromise betweensatisfying reflectivity and a low mass of the reference mirror leading to a high enough ampli-tude of sinusoidal excitation. The sensor is designed to work with the maximum acquisitionrate of the line scan camera of roughly fc = 50kHz. Taking N = 128 discrete samples dur-ing each actuation period this results in an actor frequency of fm = 390Hz at an amplitude ofA≈ 1 µm of the actor movement z(t) = A ·sin(2π fmt). If the sampling and actor frequency willbe lowered an increased SNR of the interference signal can be achieved. To be able to measuredistance changes with high accuracy, the signal acquisition has to be perfectly synchronous tothe OPLM. The easiest way to guarantee this is to derive the actuator signal from the same clock
#216737 - $15.00 USD Received 14 Aug 2014; revised 20 Oct 2014; accepted 24 Oct 2014; published 20 Nov 2014(C) 2014 OSA 1 December 2014 | Vol. 22, No. 24 | DOI:10.1364/OE.22.029787 | OPTICS EXPRESS 29791
source as the signal triggering the camera. In our arrangement both signals are generated by asingle microcontroller. However, still the clock jitter has to be taken into account, when quan-tifying measurement uncertainties. From Eq. (1) we can derive the maximum fringe frequencyfor constant distance: ff,max = 4πA fm/λ . This results in a jitter based phase error of:
∆ϕj = 2π ff,max ∆tj (4)
For a jitter of ∆tj = 127ns we calculate ∆ϕj = 74mrad resulting in a measurement errorof about ±0.3nm which can be neglected. In the second configuration we built a dispersioncompensated Michelson interferometer that can be used as a white light interferometer (WLI).Since the microscope objective is not designed for putting a beam splitter cube underneath (seeFig. 1) reduction of the resulting aberration is necessary. This is achieved by a plano-convexlens above the beam splitter cube and two plano-concave lenses between the beam splitter cubeand either the measurement object or the reference mirror of the interferometer. The curvaturesof the lenses are adapted to the wave front in a way that refraction is avoided for the lightcone focused on the optical axis. This requires that the illuminating light passes the microscopeobjective [22].
3. Concept based on line-scan sensor
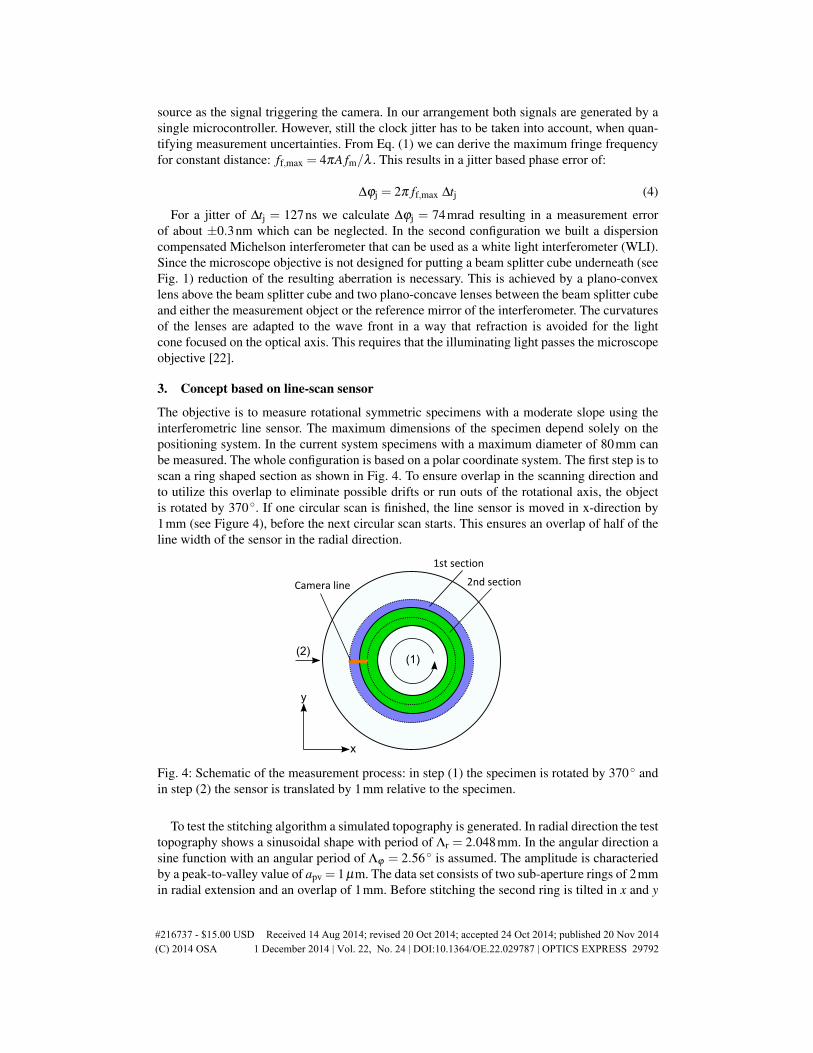
The objective is to measure rotational symmetric specimens with a moderate slope using theinterferometric line sensor. The maximum dimensions of the specimen depend solely on thepositioning system. In the current system specimens with a maximum diameter of 80mm canbe measured. The whole configuration is based on a polar coordinate system. The first step is toscan a ring shaped section as shown in Fig. 4. To ensure overlap in the scanning direction andto utilize this overlap to eliminate possible drifts or run outs of the rotational axis, the objectis rotated by 370◦. If one circular scan is finished, the line sensor is moved in x-direction by1mm (see Figure 4), before the next circular scan starts. This ensures an overlap of half of theline width of the sensor in the radial direction.
Camera line
y
x
(2)
2nd section
1st section
(1)
Fig. 4: Schematic of the measurement process: in step (1) the specimen is rotated by 370◦ andin step (2) the sensor is translated by 1mm relative to the specimen.
To test the stitching algorithm a simulated topography is generated. In radial direction the testtopography shows a sinusoidal shape with period of Λr = 2.048mm. In the angular direction asine function with an angular period of Λϕ = 2.56 ◦ is assumed. The amplitude is characteriedby a peak-to-valley value of apv = 1 µm. The data set consists of two sub-aperture rings of 2mmin radial extension and an overlap of 1mm. Before stitching the second ring is tilted in x and y
#216737 - $15.00 USD Received 14 Aug 2014; revised 20 Oct 2014; accepted 24 Oct 2014; published 20 Nov 2014(C) 2014 OSA 1 December 2014 | Vol. 22, No. 24 | DOI:10.1364/OE.22.029787 | OPTICS EXPRESS 29792
direction and an offset is added to test if the stitching procedure works correctly. The result ofthe stitching algorithm shows deviations from the originally simulated topography in the rangeof the numerical accuracy. After the ring shaped sections are stitched together, the data givenin polar coordinates is transformed to Cartesian coordinates and corrected by a best fit plane tocorrect for misalignment of the specimen.
4. Positioning system
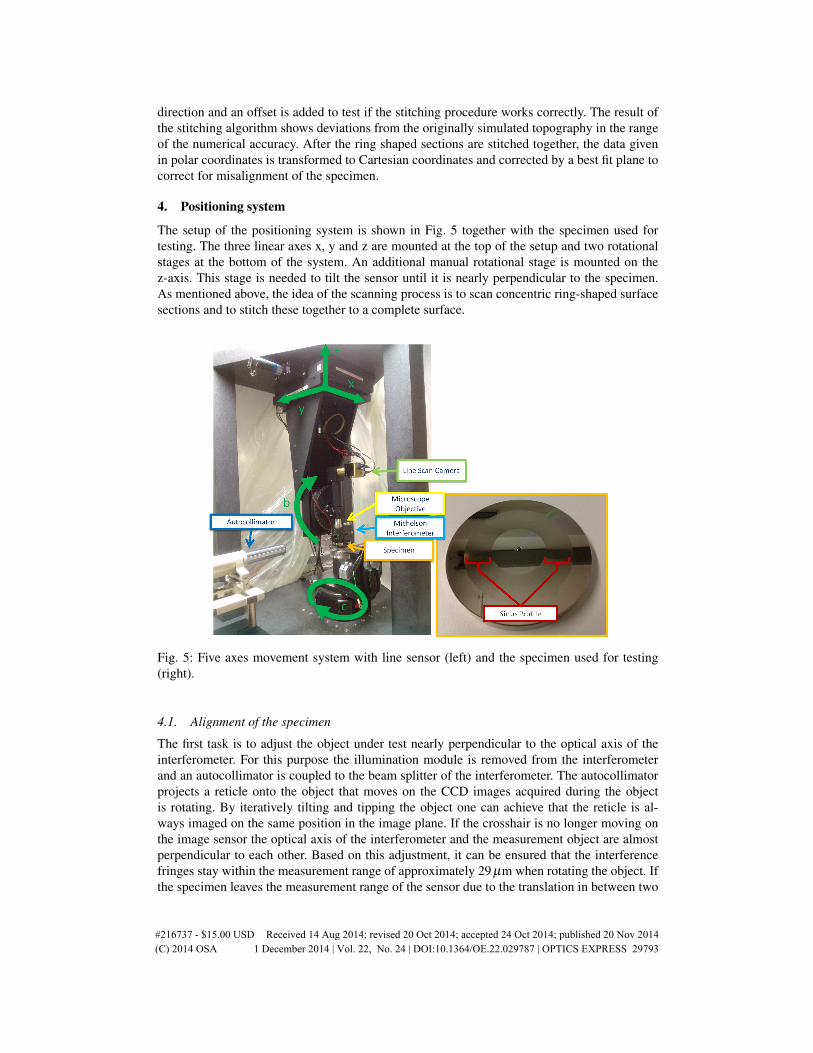
The setup of the positioning system is shown in Fig. 5 together with the specimen used fortesting. The three linear axes x, y and z are mounted at the top of the setup and two rotationalstages at the bottom of the system. An additional manual rotational stage is mounted on thez-axis. This stage is needed to tilt the sensor until it is nearly perpendicular to the specimen.As mentioned above, the idea of the scanning process is to scan concentric ring-shaped surfacesections and to stitch these together to a complete surface.
Fig. 5: Five axes movement system with line sensor (left) and the specimen used for testing(right).
4.1. Alignment of the specimen
The first task is to adjust the object under test nearly perpendicular to the optical axis of theinterferometer. For this purpose the illumination module is removed from the interferometerand an autocollimator is coupled to the beam splitter of the interferometer. The autocollimatorprojects a reticle onto the object that moves on the CCD images acquired during the objectis rotating. By iteratively tilting and tipping the object one can achieve that the reticle is al-ways imaged on the same position in the image plane. If the crosshair is no longer moving onthe image sensor the optical axis of the interferometer and the measurement object are almostperpendicular to each other. Based on this adjustment, it can be ensured that the interferencefringes stay within the measurement range of approximately 29 µm when rotating the object. Ifthe specimen leaves the measurement range of the sensor due to the translation in between two
#216737 - $15.00 USD Received 14 Aug 2014; revised 20 Oct 2014; accepted 24 Oct 2014; published 20 Nov 2014(C) 2014 OSA 1 December 2014 | Vol. 22, No. 24 | DOI:10.1364/OE.22.029787 | OPTICS EXPRESS 29793
circular measurements, only the z-axis has to be readjusted.The second task is to align the specimen with respect to the rotational axis. The interferometricsensor is positioned at the flank of the specimen and the position of the flank is observed dur-ing rotation. The centering process is iteratively done with micrometer accuracy by two linearstages mounted on the rotational stage, until the distance change observed during rotation is ata minimum.
4.2. Accuracy estimation of the movement axes
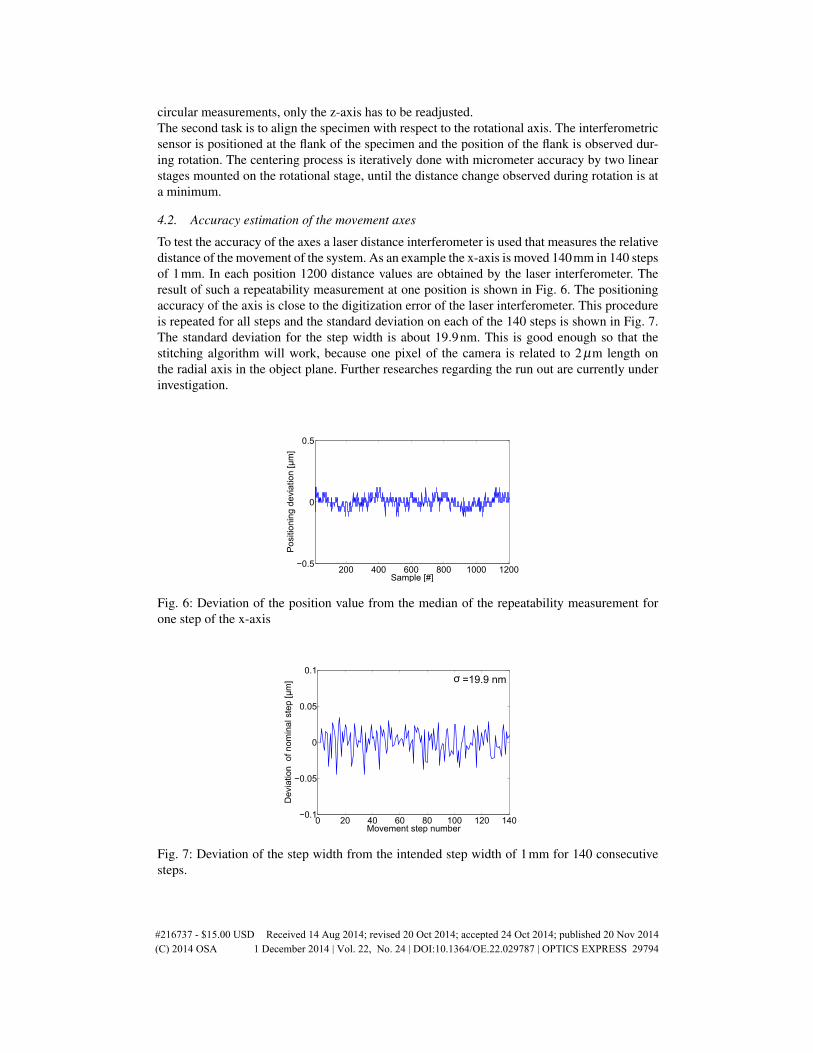
To test the accuracy of the axes a laser distance interferometer is used that measures the relativedistance of the movement of the system. As an example the x-axis is moved 140mm in 140 stepsof 1mm. In each position 1200 distance values are obtained by the laser interferometer. Theresult of such a repeatability measurement at one position is shown in Fig. 6. The positioningaccuracy of the axis is close to the digitization error of the laser interferometer. This procedureis repeated for all steps and the standard deviation on each of the 140 steps is shown in Fig. 7.The standard deviation for the step width is about 19.9nm. This is good enough so that thestitching algorithm will work, because one pixel of the camera is related to 2 µm length onthe radial axis in the object plane. Further researches regarding the run out are currently underinvestigation.
200 400 600 800 1000 1200−0.5
0
0.5
Sample [#]
Pos
ition
ing
devi
atio
n [µ
m]
Fig. 6: Deviation of the position value from the median of the repeatability measurement forone step of the x-axis
0 20 40 60 80 100 120 140−0.1
−0.05
0
0.05
0.1
Dev
iatio
n of
nom
inal
ste
p [µ
m]
Movement step number
σ =19.9 nm
Fig. 7: Deviation of the step width from the intended step width of 1mm for 140 consecutivesteps.
#216737 - $15.00 USD Received 14 Aug 2014; revised 20 Oct 2014; accepted 24 Oct 2014; published 20 Nov 2014(C) 2014 OSA 1 December 2014 | Vol. 22, No. 24 | DOI:10.1364/OE.22.029787 | OPTICS EXPRESS 29794
4.3. Calibration
The calibration can be done using a highly accurate flat surface as a calibration object. Theline sensor can be calibrated by one or two or more positions on the object as described be-fore in Sec. 2 and the median of the measurement results corresponds to the topography ofthe reference mirror. Measurement results show maximum deviations of about 60nm from theideal straight profile. However, once these deviations are known they can be eliminated duringmeasurement. In addition the object can be rotated and the run out of the rotational stage canbe measured and corrected because the surface of the calibration object can be seen as an idealflat for our purpose. The flatness can be measured with sub-nm accuracy at PTB [23]. So it canbe traced back to the meter.
5. Measurement results
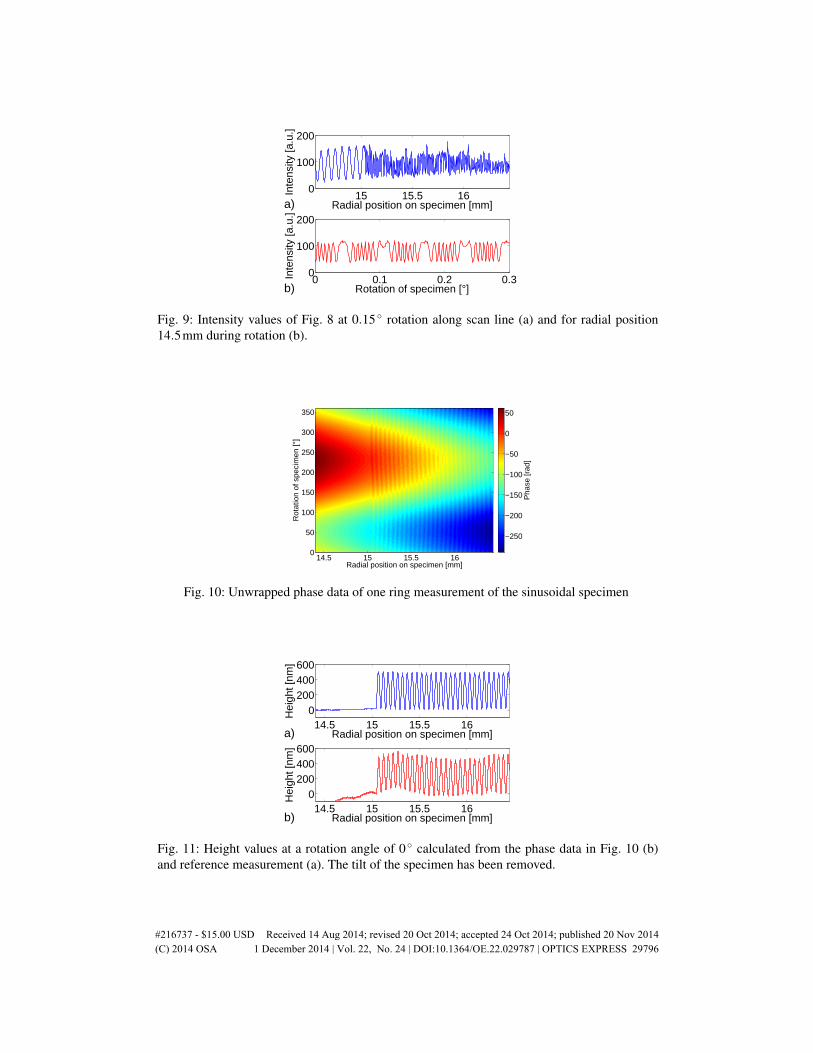
For testing and verification of the complete system we have designed a test specimen whichconsists of a flat disc with a 15mm wide sinusoidal structure in radial direction as it is shownin Fig. 5. The sinusoidal structure starts at a radius of 15mm, while the whole specimen has aradius of 40mm. The period length of the structure is 50 µm and the amplitude is 250nm. Thespecimen is specifically designed and manufactured by diamond turning at PTB. It shows a welldefined surface which allows to test the lateral as well as the height resolution of the sensor andprovides a structure on which stitching algorithms can be checked. An exemplary measurementis taken at the transition from the plane surface to the sinusoidal structure. The interference dataof a measured area corresponding to 0.3 ◦ of rotation is shown in Fig. 8 and Fig. 9. Along theordinate of Fig. 8 the interference fringes resulting from the OPLM can be observed whereasthe sinusoidal surface structure is related to the horizontal axis. Accordingly Fig. 9a) representsa line of Fig. 8 whereas Fig. 9b) represents a single column. Due to the flatness of the surfacethe signal in Fig. 9b) corresponds to the time-dependent OPLM signal accordingly to Fig. 2.The unwrapped phase data and resulting height values along the scan line are shown in Fig. 10and 11 a). Figure 11b) shows a reference measurement of the specimen with the measurementsystem described in [9]. The low frequency oscillation in the reference measurement is due tothe straightness deviation of the linear stage used to move the specimen.
Radial position on specimen [mm]
Rot
atio
n of
spe
cim
en [°
]
14.5 15 15.5 160
0.05
0.1
0.15
0.2
0.25
0.3
Inte
nsity
[a.u
.]
20
40
60
80
100
120
140
160
180
200
Fig. 8: Measured interference data of the sinusoidal structure and the plane structure of the testsurface
A single sub-aperture measured at an angular speed of 40◦/s consists of around 476 millionintensity values, which result in 7.4 million height measurements. To evaluate the capabilityof the stitching algorithm for the measured data, two overlapping ring-shaped sub-aperturetopographies are shown in Fig. 12 where the angular axis is plotted as a Cartesian axis. The
#216737 - $15.00 USD Received 14 Aug 2014; revised 20 Oct 2014; accepted 24 Oct 2014; published 20 Nov 2014(C) 2014 OSA 1 December 2014 | Vol. 22, No. 24 | DOI:10.1364/OE.22.029787 | OPTICS EXPRESS 29795
15 15.5 160
100
200
Radial position on specimen [mm]
Inte
nsity
[a.u
.]0 0.1 0.2 0.3
0
100
200
Rotation of specimen [°]In
tens
ity [a
.u.]
a)
b)
Fig. 9: Intensity values of Fig. 8 at 0.15 ◦ rotation along scan line (a) and for radial position14.5mm during rotation (b).
Radial position on specimen [mm]
Rot
atio
n of
spe
cim
en [°
]
14.5 15 15.5 160
50
100
150
200
250
300
350
Pha
se [r
ad]
−250
−200
−150
−100
−50
0
50
Fig. 10: Unwrapped phase data of one ring measurement of the sinusoidal specimen
14.5 15 15.5 160
200400600
Radial position on specimen [mm]
Hei
ght [
nm]
14.5 15 15.5 160
200400600
Radial position on specimen [mm]
Hei
ght [
nm]
a)
b)
Fig. 11: Height values at a rotation angle of 0◦ calculated from the phase data in Fig. 10 (b)and reference measurement (a). The tilt of the specimen has been removed.
#216737 - $15.00 USD Received 14 Aug 2014; revised 20 Oct 2014; accepted 24 Oct 2014; published 20 Nov 2014(C) 2014 OSA 1 December 2014 | Vol. 22, No. 24 | DOI:10.1364/OE.22.029787 | OPTICS EXPRESS 29796
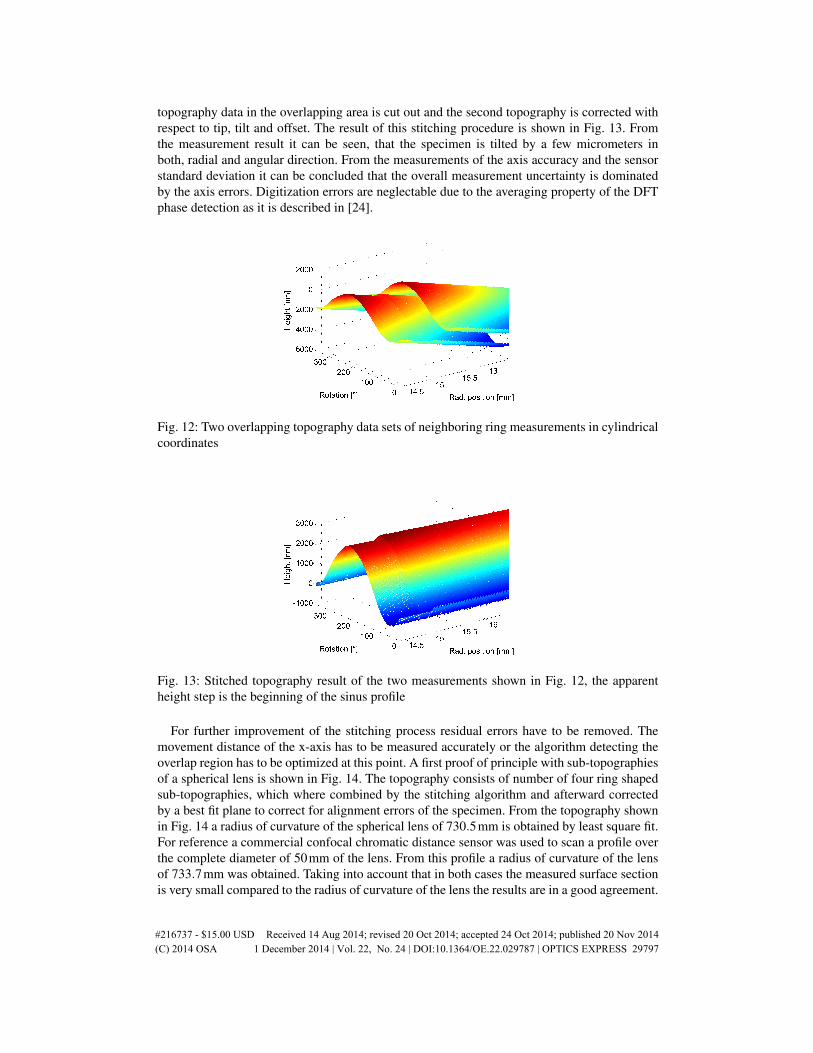
topography data in the overlapping area is cut out and the second topography is corrected withrespect to tip, tilt and offset. The result of this stitching procedure is shown in Fig. 13. Fromthe measurement result it can be seen, that the specimen is tilted by a few micrometers inboth, radial and angular direction. From the measurements of the axis accuracy and the sensorstandard deviation it can be concluded that the overall measurement uncertainty is dominatedby the axis errors. Digitization errors are neglectable due to the averaging property of the DFTphase detection as it is described in [24].
Fig. 12: Two overlapping topography data sets of neighboring ring measurements in cylindricalcoordinates
Fig. 13: Stitched topography result of the two measurements shown in Fig. 12, the apparentheight step is the beginning of the sinus profile
For further improvement of the stitching process residual errors have to be removed. Themovement distance of the x-axis has to be measured accurately or the algorithm detecting theoverlap region has to be optimized at this point. A first proof of principle with sub-topographiesof a spherical lens is shown in Fig. 14. The topography consists of number of four ring shapedsub-topographies, which where combined by the stitching algorithm and afterward correctedby a best fit plane to correct for alignment errors of the specimen. From the topography shownin Fig. 14 a radius of curvature of the spherical lens of 730.5mm is obtained by least square fit.For reference a commercial confocal chromatic distance sensor was used to scan a profile overthe complete diameter of 50mm of the lens. From this profile a radius of curvature of the lensof 733.7mm was obtained. Taking into account that in both cases the measured surface sectionis very small compared to the radius of curvature of the lens the results are in a good agreement.
#216737 - $15.00 USD Received 14 Aug 2014; revised 20 Oct 2014; accepted 24 Oct 2014; published 20 Nov 2014(C) 2014 OSA 1 December 2014 | Vol. 22, No. 24 | DOI:10.1364/OE.22.029787 | OPTICS EXPRESS 29797
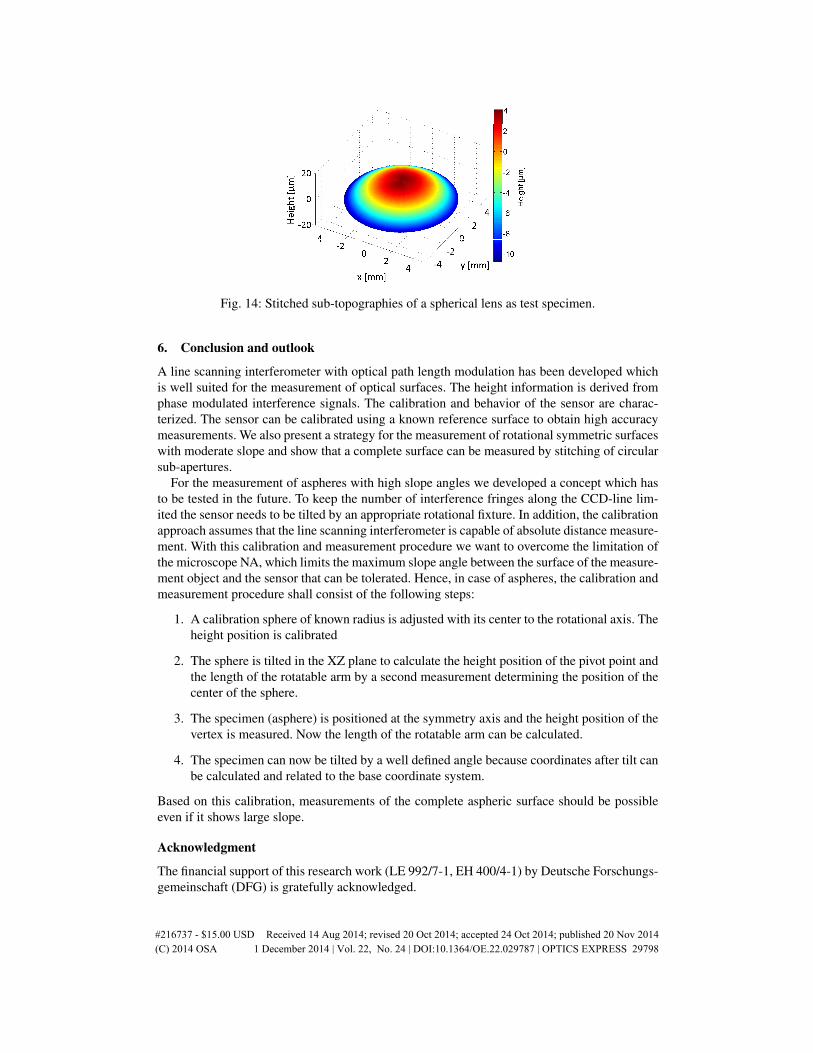
Fig. 14: Stitched sub-topographies of a spherical lens as test specimen.
6. Conclusion and outlook
A line scanning interferometer with optical path length modulation has been developed whichis well suited for the measurement of optical surfaces. The height information is derived fromphase modulated interference signals. The calibration and behavior of the sensor are charac-terized. The sensor can be calibrated using a known reference surface to obtain high accuracymeasurements. We also present a strategy for the measurement of rotational symmetric surfaceswith moderate slope and show that a complete surface can be measured by stitching of circularsub-apertures.
For the measurement of aspheres with high slope angles we developed a concept which hasto be tested in the future. To keep the number of interference fringes along the CCD-line lim-ited the sensor needs to be tilted by an appropriate rotational fixture. In addition, the calibrationapproach assumes that the line scanning interferometer is capable of absolute distance measure-ment. With this calibration and measurement procedure we want to overcome the limitation ofthe microscope NA, which limits the maximum slope angle between the surface of the measure-ment object and the sensor that can be tolerated. Hence, in case of aspheres, the calibration andmeasurement procedure shall consist of the following steps:
1. A calibration sphere of known radius is adjusted with its center to the rotational axis. Theheight position is calibrated
2. The sphere is tilted in the XZ plane to calculate the height position of the pivot point andthe length of the rotatable arm by a second measurement determining the position of thecenter of the sphere.
3. The specimen (asphere) is positioned at the symmetry axis and the height position of thevertex is measured. Now the length of the rotatable arm can be calculated.
4. The specimen can now be tilted by a well defined angle because coordinates after tilt canbe calculated and related to the base coordinate system.
Based on this calibration, measurements of the complete aspheric surface should be possibleeven if it shows large slope.
Acknowledgment
The financial support of this research work (LE 992/7-1, EH 400/4-1) by Deutsche Forschungs-gemeinschaft (DFG) is gratefully acknowledged.
#216737 - $15.00 USD Received 14 Aug 2014; revised 20 Oct 2014; accepted 24 Oct 2014; published 20 Nov 2014(C) 2014 OSA 1 December 2014 | Vol. 22, No. 24 | DOI:10.1364/OE.22.029787 | OPTICS EXPRESS 29798


![Variational reconstruction using subdivision surfaces with ... · Variational reconstruction using subdivision surfaces with continuous sharpness control 219 Litke et al. [23] proposed](https://img.pdfslide.us/doc/110x75/5f08d7d37e708231d423fd8c/variational-reconstruction-using-subdivision-surfaces-with-variational-reconstruction.jpg)