Embed Size (px)
Citation preview
Greinargerð03014
Continuous GPS measurements in Iceland 1999 - 2002
A thesis submitted to the University of Iceland for the degree of Master of Science in Geophysics
VÍ-JA01ReykjavíkMarch 2003
Halldór Geirsson
CONTENTS
Foreword 5
Summary 7
1 Introduction 8
2 Instruments and data transfer 11
3 Data processing 25
3.1 Estimation of scaling factors . . . .. . . . . . . . . . . . . . . . . . . . . . . 27
3.2 Detection of outliers .. . . . . . . . . . . . . . . . . . . . . . . . . . . . . . 32
4 Results 35
4.1 Time series . . . . . .. . . . . . . . . . . . . . . . . . . . . . . . . . . . . . 35
4.1.1 Effects of radome installation . . . . . .. . . . . . . . . . . . . . . . 51
4.2 Plates and plate velocities . . . . . .. . . . . . . . . . . . . . . . . . . . . . . 52
4.2.1 Velocity estimation . . . . .. . . . . . . . . . . . . . . . . . . . . . . 55
4.2.2 Velocities derived from the original time series .. . . . . . . . . . . . 57
4.2.3 Velocity estimation after removing offsets from the time series. . . . . 60
4.2.4 Velocities derived from data spanning August 1, 2000 to December 31,
2001 . . . . . . . . . . . . . . . . . . . . . . . . . . . . . . . . . . . 62
4.2.5 Vertical velocities . . . . . .. . . . . . . . . . . . . . . . . . . . . . . 65
4.3 Hengill triple junction .. . . . . . . . . . . . . . . . . . . . . . . . . . . . . . 67
4.4 Eyjafjallajökull and Katla volcanoes. . . . . . . . . . . . . . . . . . . . . . . 69
4.5 Hekla eruption 2000 .. . . . . . . . . . . . . . . . . . . . . . . . . . . . . . 72
4.6 The June 2000 earthquake sequence in South Iceland . .. . . . . . . . . . . . 75
5 Conclusions 81
Íslenskt ágrip (Icelandic summary) 83
6 References 87
FOREWORD
This publication is a thesis submitted to the University of Iceland for the degree of Mas-
ter of Science in Geophysics. The project was supervised by: Þóra Árnadóttir at the Nordic
Volcanological Institute, Páll Einarsson at the Science Institute, University of Iceland, and
Freysteinn Sigmundsson at the Nordic Volcanological Institute. I thank my supervisors for
their excellent support and guidance during the work. The thesis was written in early 2002 but
is published in March 2003. A few changes were made to the original paper to account for dif-
ferent circumstances, but all data processing and scientific results are left as they were written
originally.
The Icelandic continuous GPS network (ISGPS) is a cooperation project between the Ice-
landic Meteorological Office (IMO), Nordic Volcanological Institute (NORDVULK), Science
Institute, University of Iceland (SIUI) and University of Savoie (LGCA), France. Ragnar
Stefánsson (IMO), Freysteinn Sigmundsson (NORDVULK), Þóra Árnadóttir (NORDVULK)
and Páll Einarsson (SIUI) got the ISGPS project started. The initial design of the ISGPS
quadripod monument and technical aspects of the station setup came from Halldór Ólafsson
(NORDVULK) and Bergur H. Bergsson (formerly at IMO). I wish to thank these people for
being the driving force to initiate the ISGPS network.
I wish to thank all who have participated in the installation, operation and development of the
ISGPS network: Bergur H. Bergsson, Halldór Ólafsson, Jósef Hólmjárn (IMO), Erik Sturkell
(IMO), Thierry Villemin (LGCA), Antoine Berger (LGCA), Pálmi Erlendsson (IMO), Kristín
Jónsdóttir (IMO), Sighvatur K. Pálsson (IMO), Haukur Brynjólfsson (SIUI), Ólafur Eggerts-
son at Þorvaldseyri, Hjörleifur Sveinbjörnsson (IMO), Steinunn S. Jakobsdóttir (IMO) and the
rest of the staff at IMO, NORDVULK and SIUI. For providing good advice regarding techni-
cal aspects and data processing I thank Mike Jackson, Victoria Andretta, Jim Greenberg, Karl
Feaux and Lou Estey at UNAVCO, Christof Völksen, Markus Rennen and Þórarinn Þórarinsson
at the National Land Survey of Iceland, Uwe Hessels at BKG, Pierre Friedez, Stefan Schaher
and Markus Rotacher at AIUB. Without doubt many more have contributed to the ISGPS net-
work. I thank those who directly provided data used in this thesis: Þóra Árnadóttir and Kristján
Ágústsson (IMO). Fruitful discussion was provided by a number of people. Among those are
Ragnar Stefánsson, Gunnar B. Guðmundsson (IMO), Kristján Ágústsson and Knútur Árnason
(National Energy Authority).

I thank caretakers of the ISGPS stations and the whole Icelandic community for treating the
ISGPS stations with respect. An unlucky golfer that accidentally smashed a radome at HVER
gets my sympathy and wish for improved skills. I thank IMO for employing me and providing
office facilities. This work was in part supported by the EC project PRENLAB 2 and a special
funding for the monitoring of Mýrdalsjökull. I thank the Icelandic Government, Reykjavík
Energy, Icelandic Research Council, South Iceland Institute of Natural History, State Disaster
Relief Fund, French Polar Institute, IMO and the National Power Company for financial support
to purchase the GPS instruments for the stations.
6
SUMMARY
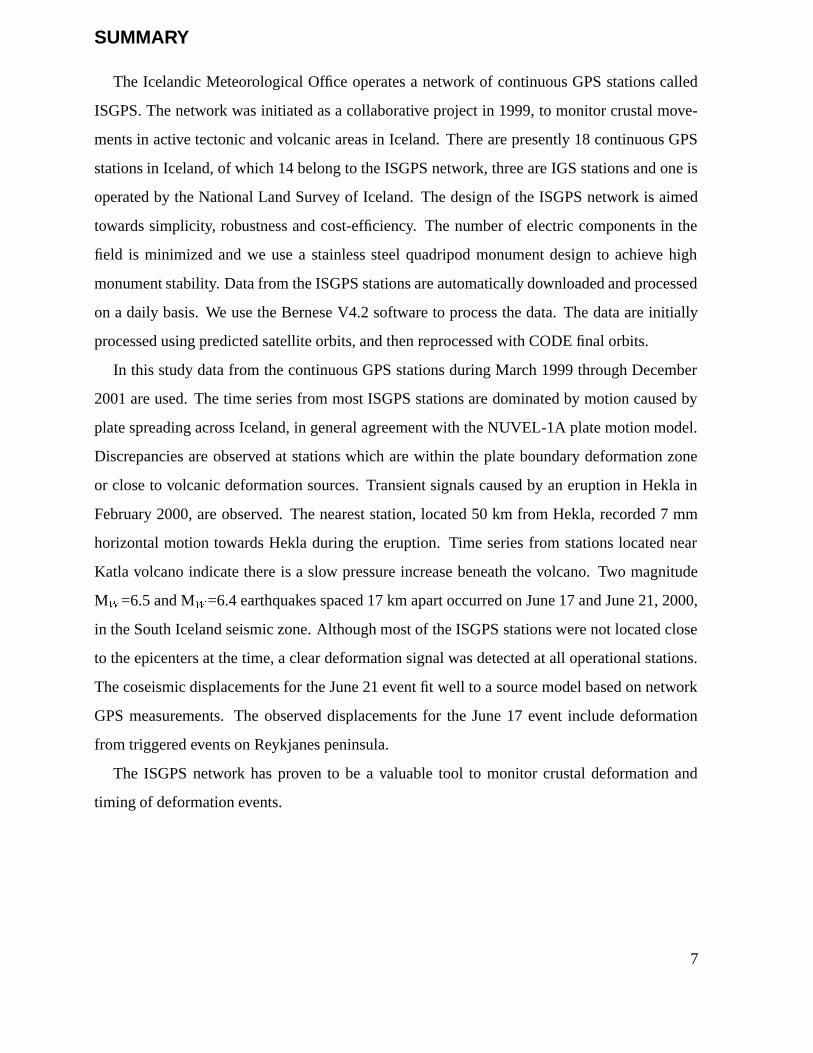
The Icelandic Meteorological Office operates a network of continuous GPS stations called
ISGPS. The network was initiated as a collaborative project in 1999, to monitor crustal move-
ments in active tectonic and volcanic areas in Iceland. There are presently 18 continuous GPS
stations in Iceland, of which 14 belong to the ISGPS network, three are IGS stations and one is
operated by the National Land Survey of Iceland. The design of the ISGPS network is aimed
towards simplicity, robustness and cost-efficiency. The number of electric components in the
field is minimized and we use a stainless steel quadripod monument design to achieve high
monument stability. Data from the ISGPS stations are automatically downloaded and processed
on a daily basis. We use the Bernese V4.2 software to process the data. The data are initially
processed using predicted satellite orbits, and then reprocessed with CODE final orbits.
In this study data from the continuous GPS stations during March 1999 through December
2001 are used. The time series from most ISGPS stations are dominated by motion caused by
plate spreading across Iceland, in general agreement with the NUVEL-1A plate motion model.
Discrepancies are observed at stations which are within the plate boundary deformation zone
or close to volcanic deformation sources. Transient signals caused by an eruption in Hekla in
February 2000, are observed. The nearest station, located 50 km from Hekla, recorded 7 mm
horizontal motion towards Hekla during the eruption. Time series from stations located near
Katla volcano indicate there is a slow pressure increase beneath the volcano. Two magnitude
M�=6.5 and M�=6.4 earthquakes spaced 17 km apart occurred on June 17 and June 21, 2000,
in the South Iceland seismic zone. Although most of the ISGPS stations were not located close
to the epicenters at the time, a clear deformation signal was detected at all operational stations.
The coseismic displacements for the June 21 event fit well to a source model based on network
GPS measurements. The observed displacements for the June 17 event include deformation
from triggered events on Reykjanes peninsula.
The ISGPS network has proven to be a valuable tool to monitor crustal deformation and
timing of deformation events.
7
1 INTRODUCTION
Iceland is situated on the divergent mid-Atlantic ocean ridge and owes its existence to the Ice-
landic hotspot, centered beneath Vatnajökull ice cap (Figure 1). The mid-Atlantic plate bound-
ary comes onshore on the Reykjanes peninsula in South Iceland and continues east along the
peninsula towards the Hengill triple junction area. At Hengill the plate boundary goes NNE
along the Western volcanic zone and towards east along the South Iceland seismic zone (SISZ),
which is a transform zone. The SISZ merges with a propagating rift zone, the Eastern volcanic
zone, which continues north through the country to the Kolbeinsey ridge via the Tjörnes frac-
ture zone. The rifting of 1.96 cm/yr across Iceland (DeMets et al. 1994) is accommodated by
the eastern and western volcanic zones. Presently the rifting is mostly (85%) taken up by the
Eastern volcanic zone and the spreading of the Western volcanic zone seems less active as has
been shown with episodic GPS network measurements (Sigmundsson et al. 1995).
The interaction between the divergent plate boundary and the mantle plume results in various
phenomena. Eruptions are frequent and seismic events can exceed magnitude 7 in the transform
zones in the south and the north. A number of episodic GPS measurements have been made
in Iceland to study deformation associated with volcanism and earthquakes, the first campaign
being performed in 1986 (Foulger et al. 1986). Until now the emphasis has been on episodic net-
work measurements allowing good spatial coverage but poor resolution of temporal variations
in deformation fields. Temporal variations in crustal deformation rates have been observed in
numerous geodetic studies in Iceland (e.g. Tryggvason (1986, 2000), Hreinsdóttir (1999), Jóns-
son et al. (1997), Sigmundsson et al. (1995) and Sturkell et al. (2002a,b)). Continuous GPS
stations give good temporal resolution and are thus well suited to study the temporal variations
in deformation in Iceland. The stations also serve well for timing deformation events and offer
the opportunity to monitor the state of the crust in near real-time.
Presently there are a few thousand permanent GPS stations operating in the world. The
largest networks are in Japan and North America, with over 1200 stations each. Permanent
GPS stations are used for a great variety of applications, e.g. to observe plate movements (e.g.
Sella et al. (2002)), constrain earth orientation parameters, serve as base stations for mapping
purposes and navigation, monitor deformation related to earthquakes and volcanoes (e.g. Owen
et al. (2000), Newman et al. (2001) and Lowry et al. (2001)), observe deformation resulting
from deglaciation (e.g. Scherneck et al. (2001)), estimate oceanic and atmospheric loading
8
−24° −22° −20° −18° −16° −14°63°
64°
65°
66°
67°
VOGS
HVER
OLKE
SOHOHVOL
THEYTHEYTHEY
HLID
VMEY
SKRO
KIDJ
RHOF
ISAKSELF
AKUR
RP
RR My
SISZ
WVZ
NVZ
EVZ
KR
TFZ
REYKand REYZ
HOFN
ISGPS LMI IGS
−24° −22° −20° −18° −16° −14°63°
64°
65°
66°
67°
0 50 100
km
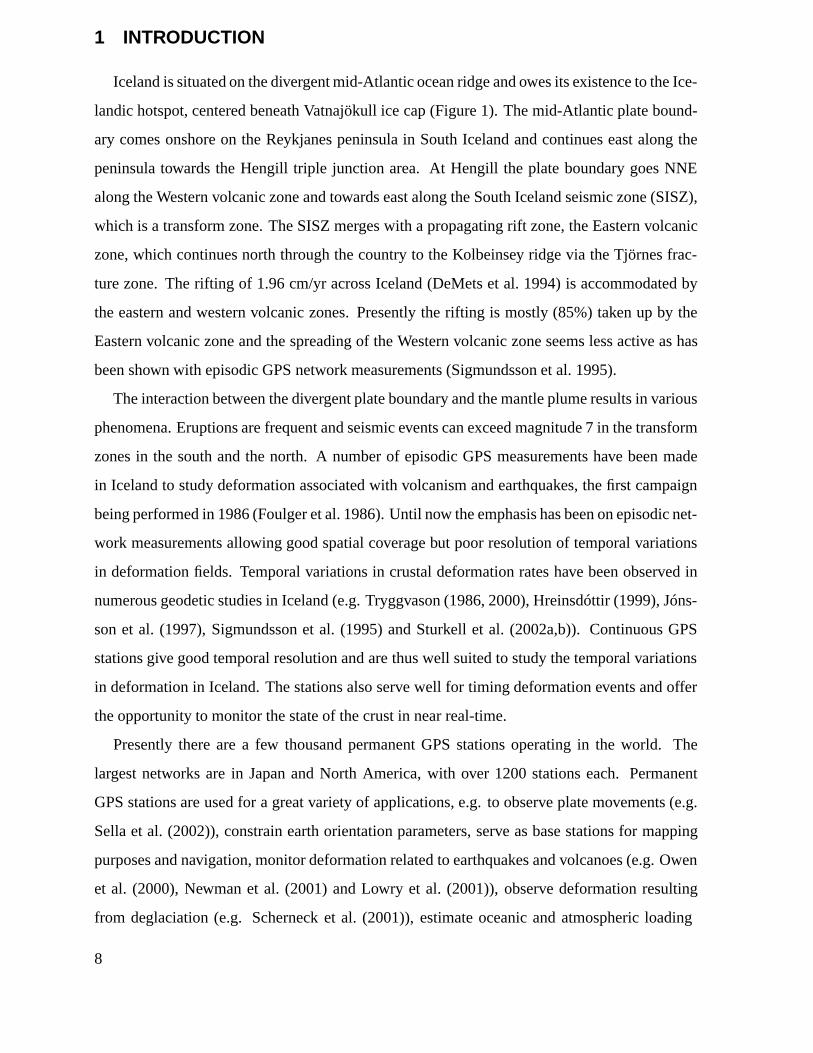
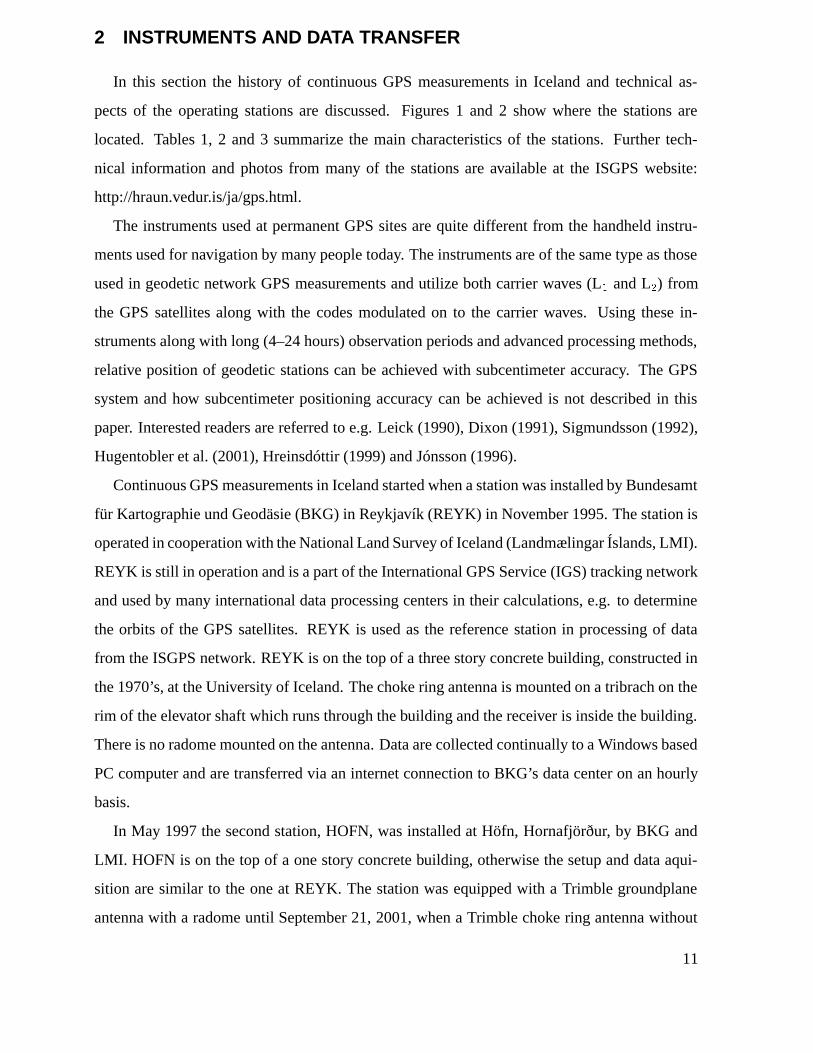
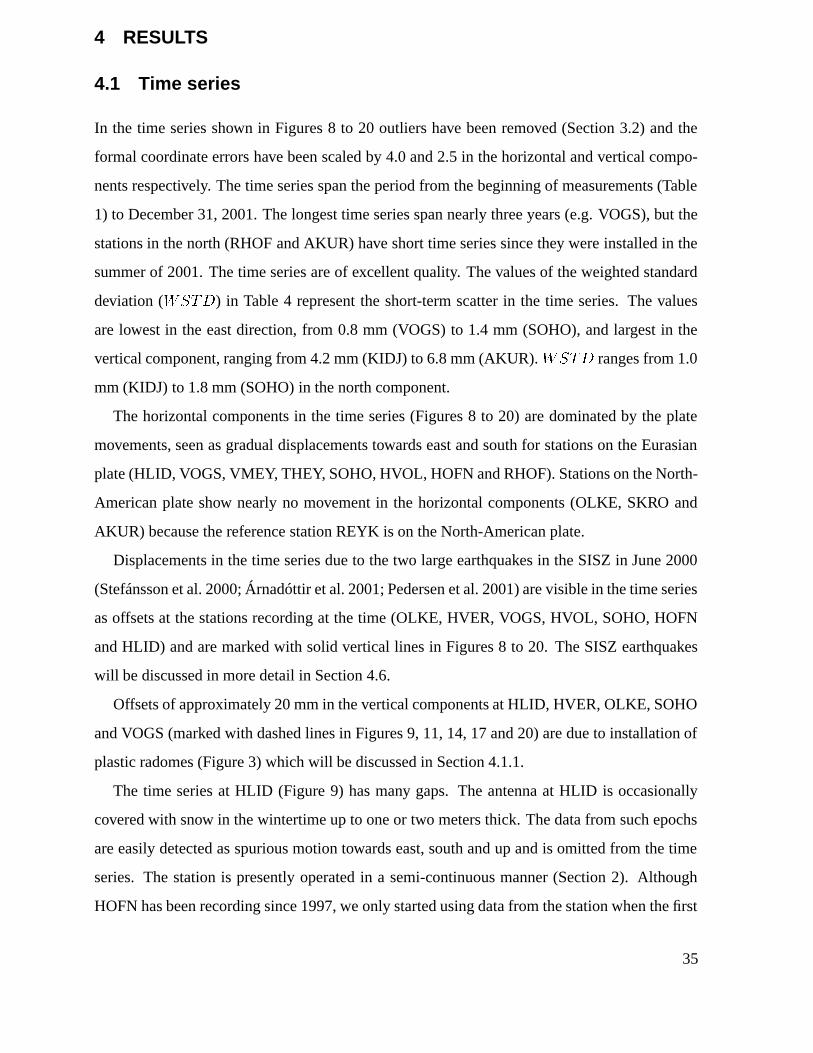
Figure 1.Tectonic overview showing locations of continuous GPS stations in Iceland. Squares
note ISGPS sites operated by IMO (Icelandic Meteorological Office), inverse triangle
notes a station operated by LMI (National Land Survey of Iceland) and regular tri-
angles note IGS (International GPS Service) stations. Four character station names
are shown for most stations. Dark grey areas outline active fissure swarms at the di-
vergent plate boundary (Einarsson and Sæmundsson 1987) and light grey areas are
glaciers. Abbrevations represent areas mentioned in the text (RR-Reykjanes Ridge,
RP-Reykjanes Peninsula, WVZ-Western Volcanic Zone, SISZ-South Iceland Seismic
Zone, My-Mýrdalsjökull, EVZ-Eastern Volcanic Zone, NVZ-Northern Volcanic Zone,
TFZ-Tjörnes Fracture Zone, KR-Kolbeinsey Ridge). The black rectangle outlines the
area shown in Figure 2.
parameters (e.g. Kirchner (2001)) and to estimate water vapour in the atmosphere for mete-
orological forcasting purposes (e.g. Tregoning et al. (1998)). The first continuously recording
GPS station in Iceland was installed in Reykjavík (REYK) in 1996 and as presently there are
18 continuously recording GPS stations in Iceland, of which 14 belong to the ISGPS network
(Figure 1). The purpose of the ISGPS network is to monitor crustal deformation processes in
near real-time and contribute to better understanding of processes causing crustal deformation.
9
This thesis concentrates on results from the permanently recording GPS stations in Iceland
to study the plate movements and temporal variations of deformation fields associated with
significant tectonic events such as the SISZ June 2000 earthquakes and volcanic events at Hekla
and Katla.
−22° −21.8° −21.6° −21.4° −21.2° −21° −20.8°
63.8°
64°
0
REYK
VOGS
OLKE
He Hr
HLID
HVERGr
KIDJ
SELF
ISGPS IGS
−22° −21.8° −21.6° −21.4° −21.2° −21° −20.8°
63.8°
64°
0 10 20 30
km
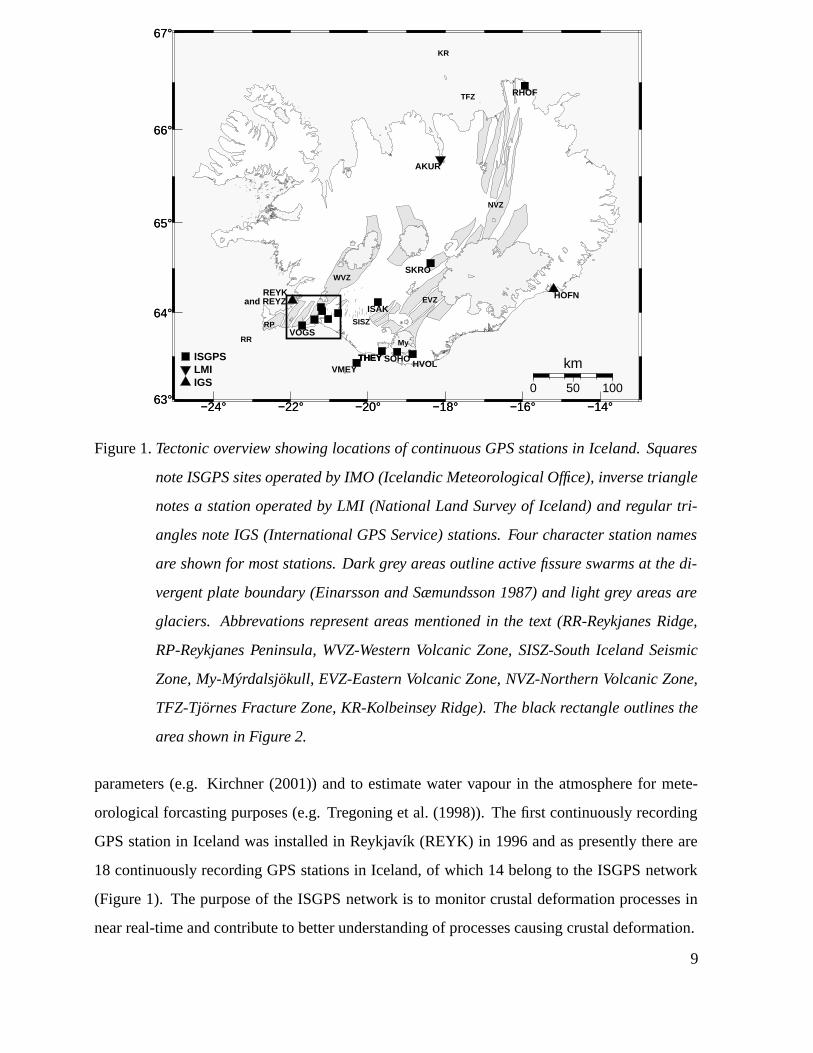
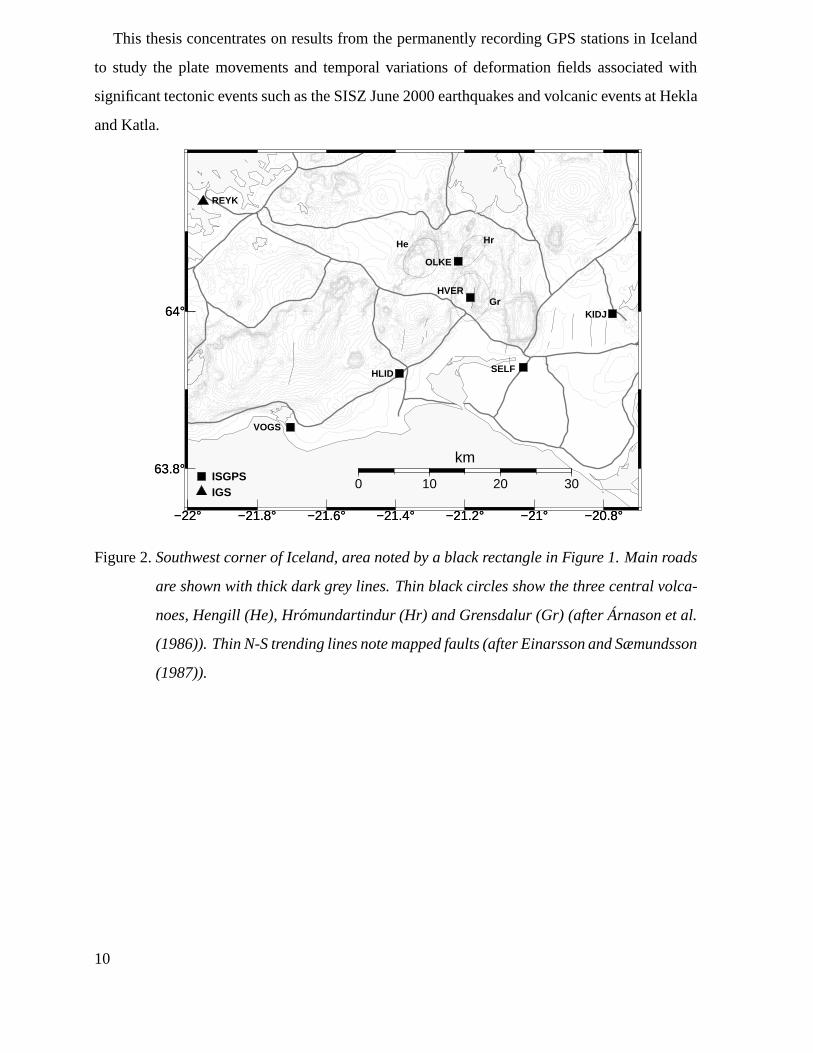
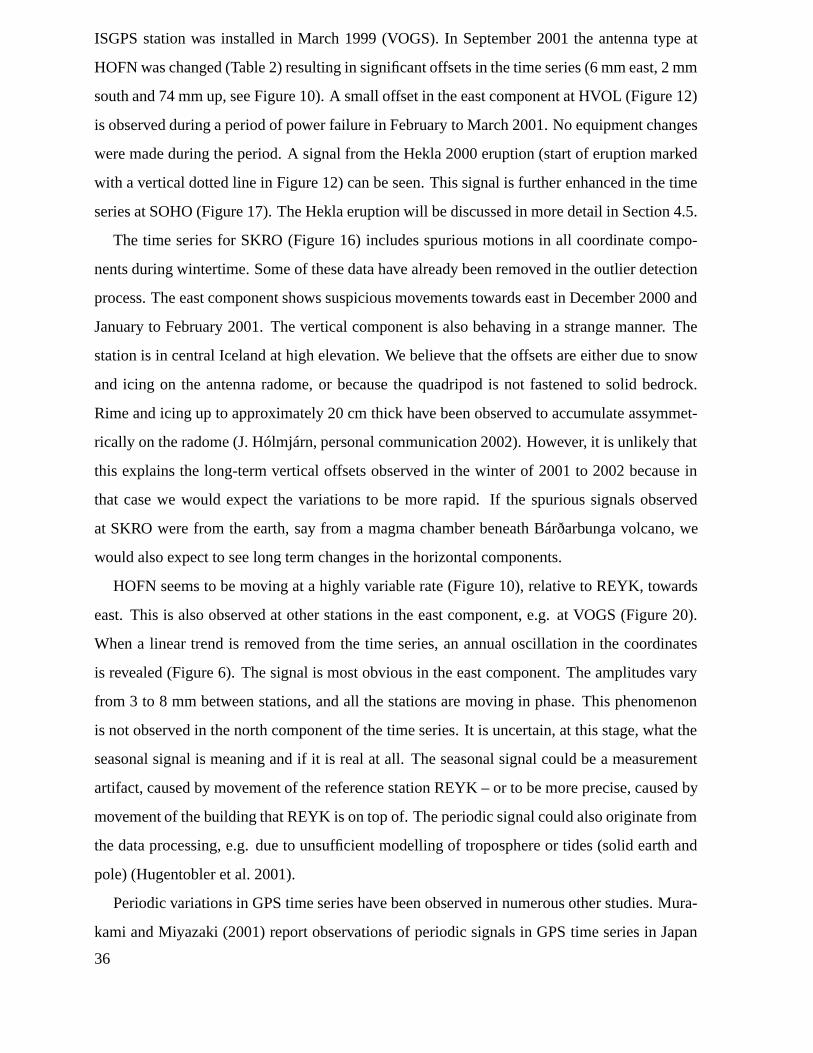
Figure 2.Southwest corner of Iceland, area noted by a black rectangle in Figure 1. Main roads
are shown with thick dark grey lines. Thin black circles show the three central volca-
noes, Hengill (He), Hrómundartindur (Hr) and Grensdalur (Gr) (after Árnason et al.
(1986)). Thin N-S trending lines note mapped faults (after Einarsson and Sæmundsson
(1987)).
10
2 INSTRUMENTS AND DATA TRANSFER
In this section the history of continuous GPS measurements in Iceland and technical as-
pects of the operating stations are discussed. Figures 1 and 2 show where the stations are
located. Tables 1, 2 and 3 summarize the main characteristics of the stations. Further tech-
nical information and photos from many of the stations are available at the ISGPS website:
http://hraun.vedur.is/ja/gps.html.
The instruments used at permanent GPS sites are quite different from the handheld instru-
ments used for navigation by many people today. The instruments are of the same type as those
used in geodetic network GPS measurements and utilize both carrier waves (L� and L�) from
the GPS satellites along with the codes modulated on to the carrier waves. Using these in-
struments along with long (4–24 hours) observation periods and advanced processing methods,
relative position of geodetic stations can be achieved with subcentimeter accuracy. The GPS
system and how subcentimeter positioning accuracy can be achieved is not described in this
paper. Interested readers are referred to e.g. Leick (1990), Dixon (1991), Sigmundsson (1992),
Hugentobler et al. (2001), Hreinsdóttir (1999) and Jónsson (1996).
Continuous GPS measurements in Iceland started when a station was installed by Bundesamt
für Kartographie und Geodäsie (BKG) in Reykjavík (REYK) in November 1995. The station is
operated in cooperation with the National Land Survey of Iceland (Landmælingar Íslands, LMI).
REYK is still in operation and is a part of the International GPS Service (IGS) tracking network
and used by many international data processing centers in their calculations, e.g. to determine
the orbits of the GPS satellites. REYK is used as the reference station in processing of data
from the ISGPS network. REYK is on the top of a three story concrete building, constructed in
the 1970’s, at the University of Iceland. The choke ring antenna is mounted on a tribrach on the
rim of the elevator shaft which runs through the building and the receiver is inside the building.
There is no radome mounted on the antenna. Data are collected continually to a Windows based
PC computer and are transferred via an internet connection to BKG’s data center on an hourly
basis.
In May 1997 the second station, HOFN, was installed at Höfn, Hornafjörður, by BKG and
LMI. HOFN is on the top of a one story concrete building, otherwise the setup and data aqui-
sition are similar to the one at REYK. The station was equipped with a Trimble groundplane
antenna with a radome until September 21, 2001, when a Trimble choke ring antenna without
11
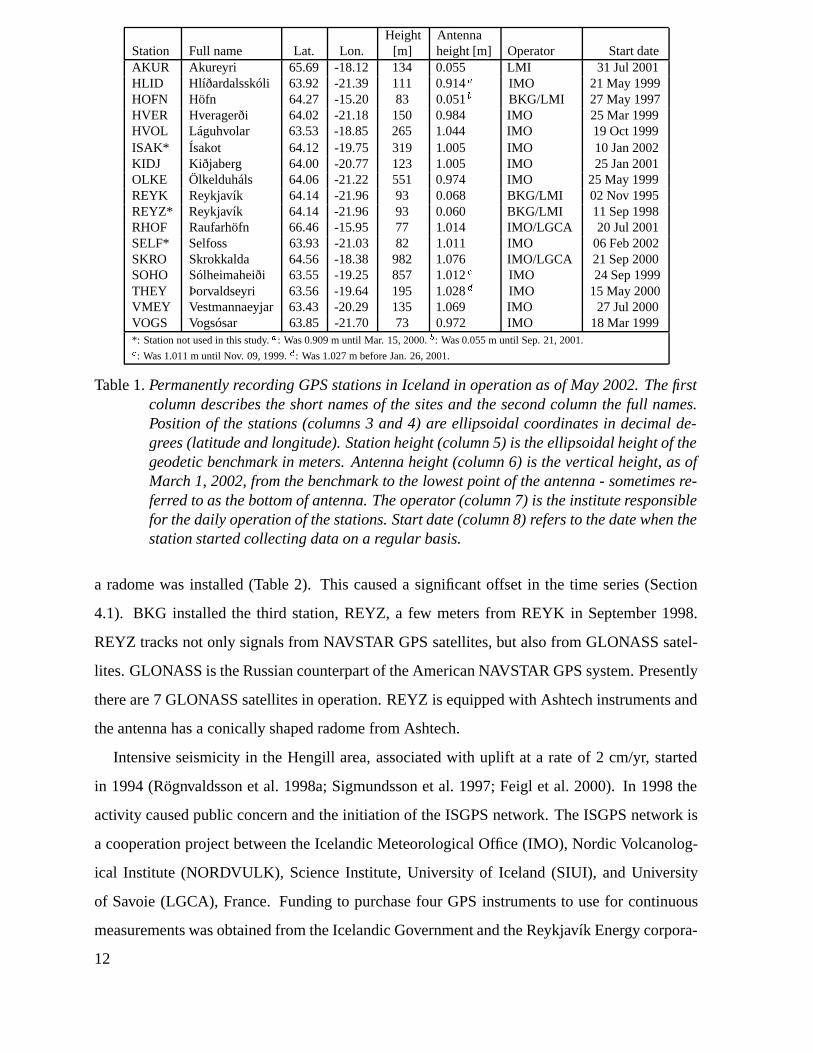
Height AntennaStation Full name Lat. Lon. [m] height [m] Operator Start dateAKUR Akureyri 65.69 -18.12 134 0.055 LMI 31 Jul 2001HLID Hlíðardalsskóli 63.92 -21.39 111 0.914� IMO 21 May 1999HOFN Höfn 64.27 -15.20 83 0.051� BKG/LMI 27 May 1997HVER Hveragerði 64.02 -21.18 150 0.984 IMO 25 Mar 1999HVOL Láguhvolar 63.53 -18.85 265 1.044 IMO 19 Oct 1999ISAK* Ísakot 64.12 -19.75 319 1.005 IMO 10 Jan 2002KIDJ Kiðjaberg 64.00 -20.77 123 1.005 IMO 25 Jan 2001OLKE Ölkelduháls 64.06 -21.22 551 0.974 IMO 25 May 1999REYK Reykjavík 64.14 -21.96 93 0.068 BKG/LMI 02 Nov 1995REYZ* Reykjavík 64.14 -21.96 93 0.060 BKG/LMI 11 Sep 1998RHOF Raufarhöfn 66.46 -15.95 77 1.014 IMO/LGCA 20 Jul 2001SELF* Selfoss 63.93 -21.03 82 1.011 IMO 06 Feb 2002SKRO Skrokkalda 64.56 -18.38 982 1.076 IMO/LGCA 21 Sep 2000SOHO Sólheimaheiði 63.55 -19.25 857 1.012� IMO 24 Sep 1999THEY Þorvaldseyri 63.56 -19.64 195 1.028� IMO 15 May 2000VMEY Vestmannaeyjar 63.43 -20.29 135 1.069 IMO 27 Jul 2000VOGS Vogsósar 63.85 -21.70 73 0.972 IMO 18 Mar 1999*: Station not used in this study.�: Was 0.909 m until Mar. 15, 2000.�: Was 0.055 m until Sep. 21, 2001.�: Was 1.011 m until Nov. 09, 1999.�: Was 1.027 m before Jan. 26, 2001.
Table 1.Permanently recording GPS stations in Iceland in operation as of May 2002. The firstcolumn describes the short names of the sites and the second column the full names.Position of the stations (columns 3 and 4) are ellipsoidal coordinates in decimal de-grees (latitude and longitude). Station height (column 5) is the ellipsoidal height of thegeodetic benchmark in meters. Antenna height (column 6) is the vertical height, as ofMarch 1, 2002, from the benchmark to the lowest point of the antenna - sometimes re-ferred to as the bottom of antenna. The operator (column 7) is the institute responsiblefor the daily operation of the stations. Start date (column 8) refers to the date when thestation started collecting data on a regular basis.
a radome was installed (Table 2). This caused a significant offset in the time series (Section
4.1). BKG installed the third station, REYZ, a few meters from REYK in September 1998.
REYZ tracks not only signals from NAVSTAR GPS satellites, but also from GLONASS satel-
lites. GLONASS is the Russian counterpart of the American NAVSTAR GPS system. Presently
there are 7 GLONASS satellites in operation. REYZ is equipped with Ashtech instruments and
the antenna has a conically shaped radome from Ashtech.
Intensive seismicity in the Hengill area, associated with uplift at a rate of 2 cm/yr, started
in 1994 (Rögnvaldsson et al. 1998a; Sigmundsson et al. 1997; Feigl et al. 2000). In 1998 the
activity caused public concern and the initiation of the ISGPS network. The ISGPS network is
a cooperation project between the Icelandic Meteorological Office (IMO), Nordic Volcanolog-
ical Institute (NORDVULK), Science Institute, University of Iceland (SIUI), and University
of Savoie (LGCA), France. Funding to purchase four GPS instruments to use for continuous
measurements was obtained from the Icelandic Government and the Reykjavík Energy corpora-
12
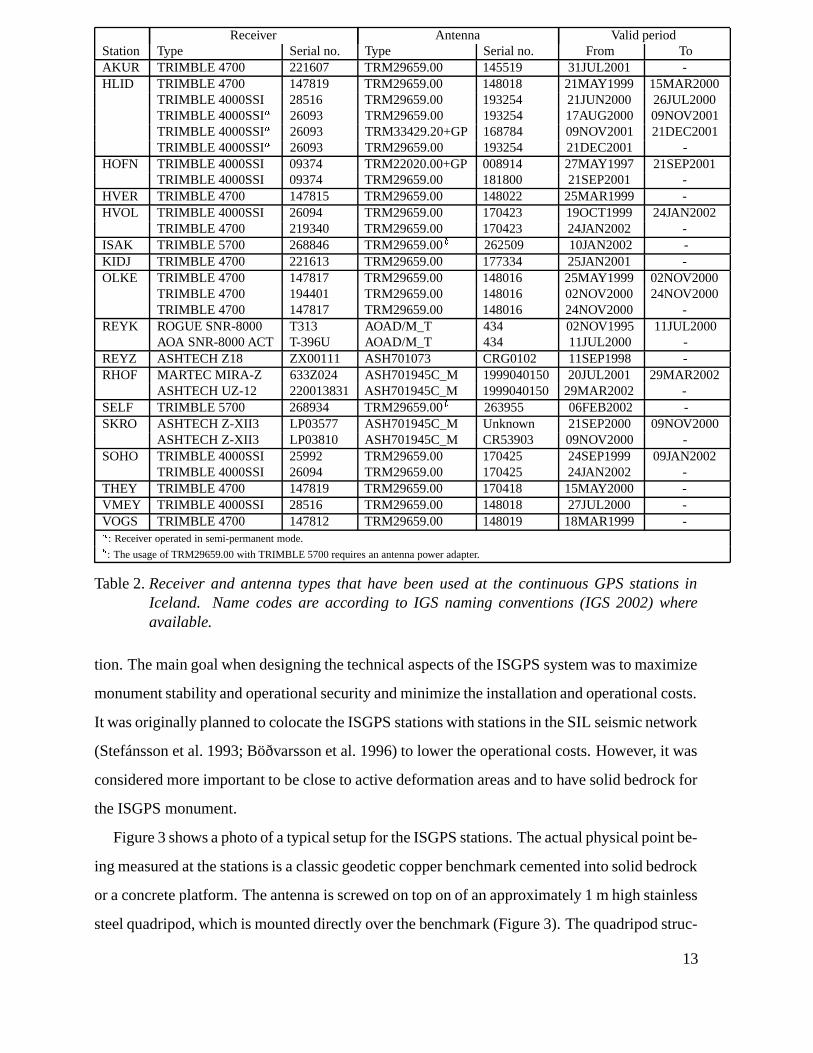
Receiver Antenna Valid periodStation Type Serial no. Type Serial no. From ToAKUR TRIMBLE 4700 221607 TRM29659.00 145519 31JUL2001 -HLID TRIMBLE 4700 147819 TRM29659.00 148018 21MAY1999 15MAR2000
TRIMBLE 4000SSI 28516 TRM29659.00 193254 21JUN2000 26JUL2000TRIMBLE 4000SSI� 26093 TRM29659.00 193254 17AUG2000 09NOV2001TRIMBLE 4000SSI� 26093 TRM33429.20+GP 168784 09NOV2001 21DEC2001TRIMBLE 4000SSI� 26093 TRM29659.00 193254 21DEC2001 -
HOFN TRIMBLE 4000SSI 09374 TRM22020.00+GP 008914 27MAY1997 21SEP2001TRIMBLE 4000SSI 09374 TRM29659.00 181800 21SEP2001 -
HVER TRIMBLE 4700 147815 TRM29659.00 148022 25MAR1999 -HVOL TRIMBLE 4000SSI 26094 TRM29659.00 170423 19OCT1999 24JAN2002
TRIMBLE 4700 219340 TRM29659.00 170423 24JAN2002 -ISAK TRIMBLE 5700 268846 TRM29659.00� 262509 10JAN2002 -KIDJ TRIMBLE 4700 221613 TRM29659.00 177334 25JAN2001 -OLKE TRIMBLE 4700 147817 TRM29659.00 148016 25MAY1999 02NOV2000
TRIMBLE 4700 194401 TRM29659.00 148016 02NOV2000 24NOV2000TRIMBLE 4700 147817 TRM29659.00 148016 24NOV2000 -
REYK ROGUE SNR-8000 T313 AOAD/M_T 434 02NOV1995 11JUL2000AOA SNR-8000 ACT T-396U AOAD/M_T 434 11JUL2000 -
REYZ ASHTECH Z18 ZX00111 ASH701073 CRG0102 11SEP1998 -RHOF MARTEC MIRA-Z 633Z024 ASH701945C_M 1999040150 20JUL2001 29MAR2002
ASHTECH UZ-12 220013831 ASH701945C_M 1999040150 29MAR2002 -SELF TRIMBLE 5700 268934 TRM29659.00� 263955 06FEB2002 -SKRO ASHTECH Z-XII3 LP03577 ASH701945C_M Unknown 21SEP2000 09NOV2000
ASHTECH Z-XII3 LP03810 ASH701945C_M CR53903 09NOV2000 -SOHO TRIMBLE 4000SSI 25992 TRM29659.00 170425 24SEP1999 09JAN2002
TRIMBLE 4000SSI 26094 TRM29659.00 170425 24JAN2002 -THEY TRIMBLE 4700 147819 TRM29659.00 170418 15MAY2000 -VMEY TRIMBLE 4000SSI 28516 TRM29659.00 148018 27JUL2000 -VOGS TRIMBLE 4700 147812 TRM29659.00 148019 18MAR1999 -�: Receiver operated in semi-permanent mode.�: The usage of TRM29659.00 with TRIMBLE 5700 requires an antenna power adapter.
Table 2.Receiver and antenna types that have been used at the continuous GPS stations inIceland. Name codes are according to IGS naming conventions (IGS 2002) whereavailable.
tion. The main goal when designing the technical aspects of the ISGPS system was to maximize
monument stability and operational security and minimize the installation and operational costs.
It was originally planned to colocate the ISGPS stations with stations in the SIL seismic network
(Stefánsson et al. 1993; Böðvarsson et al. 1996) to lower the operational costs. However, it was
considered more important to be close to active deformation areas and to have solid bedrock for
the ISGPS monument.
Figure 3 shows a photo of a typical setup for the ISGPS stations. The actual physical point be-
ing measured at the stations is a classic geodetic copper benchmark cemented into solid bedrock
or a concrete platform. The antenna is screwed on top on of an approximately 1 m high stainless
steel quadripod, which is mounted directly over the benchmark (Figure 3). The quadripod struc-
13
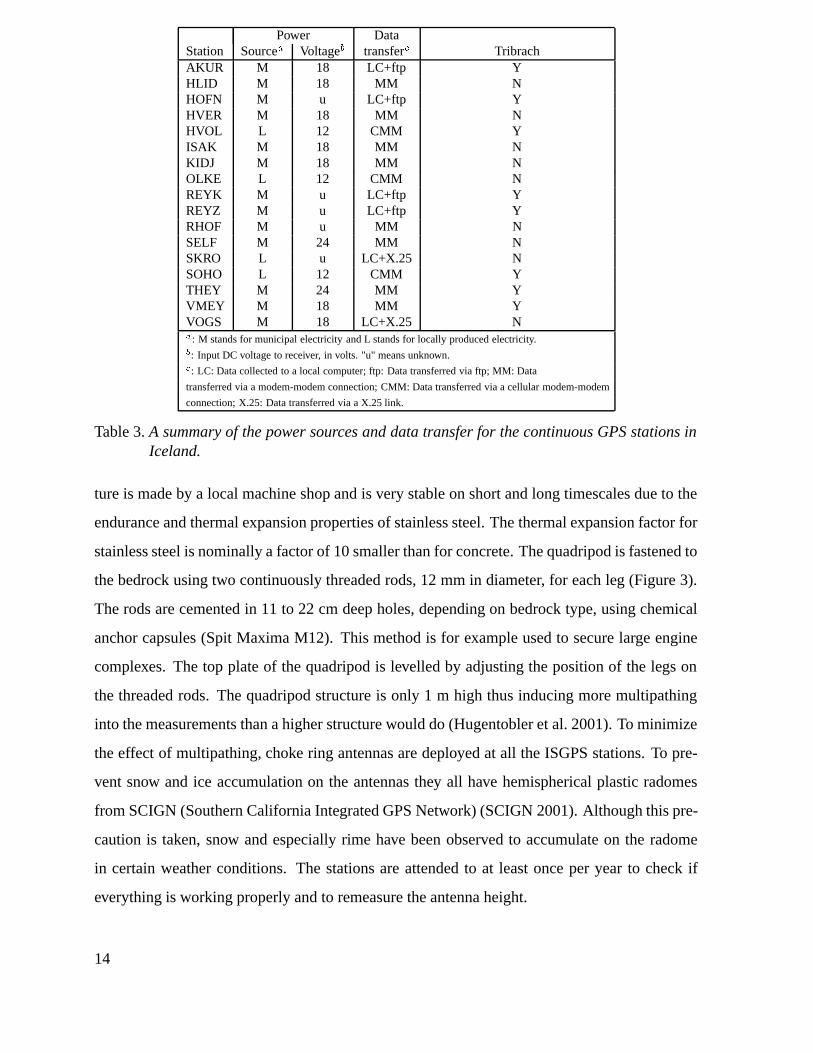
Power DataStation Source� Voltage� transfer� TribrachAKUR M 18 LC+ftp YHLID M 18 MM NHOFN M u LC+ftp YHVER M 18 MM NHVOL L 12 CMM YISAK M 18 MM NKIDJ M 18 MM NOLKE L 12 CMM NREYK M u LC+ftp YREYZ M u LC+ftp YRHOF M u MM NSELF M 24 MM NSKRO L u LC+X.25 NSOHO L 12 CMM YTHEY M 24 MM YVMEY M 18 MM YVOGS M 18 LC+X.25 N�: M stands for municipal electricity and L stands for locally produced electricity.�: Input DC voltage to receiver, in volts. "u" means unknown.�: LC: Data collected to a local computer; ftp: Data transferred via ftp; MM: Data
transferred via a modem-modem connection; CMM: Data transferred via a cellular modem-modem
connection; X.25: Data transferred via a X.25 link.
Table 3.A summary of the power sources and data transfer for the continuous GPS stations inIceland.
ture is made by a local machine shop and is very stable on short and long timescales due to the
endurance and thermal expansion properties of stainless steel. The thermal expansion factor for
stainless steel is nominally a factor of 10 smaller than for concrete. The quadripod is fastened to
the bedrock using two continuously threaded rods, 12 mm in diameter, for each leg (Figure 3).
The rods are cemented in 11 to 22 cm deep holes, depending on bedrock type, using chemical
anchor capsules (Spit Maxima M12). This method is for example used to secure large engine
complexes. The top plate of the quadripod is levelled by adjusting the position of the legs on
the threaded rods. The quadripod structure is only 1 m high thus inducing more multipathing
into the measurements than a higher structure would do (Hugentobler et al. 2001). To minimize
the effect of multipathing, choke ring antennas are deployed at all the ISGPS stations. To pre-
vent snow and ice accumulation on the antennas they all have hemispherical plastic radomes
from SCIGN (Southern California Integrated GPS Network) (SCIGN 2001). Although this pre-
caution is taken, snow and especially rime have been observed to accumulate on the radome
in certain weather conditions. The stations are attended to at least once per year to check if
everything is working properly and to remeasure the antenna height.
14
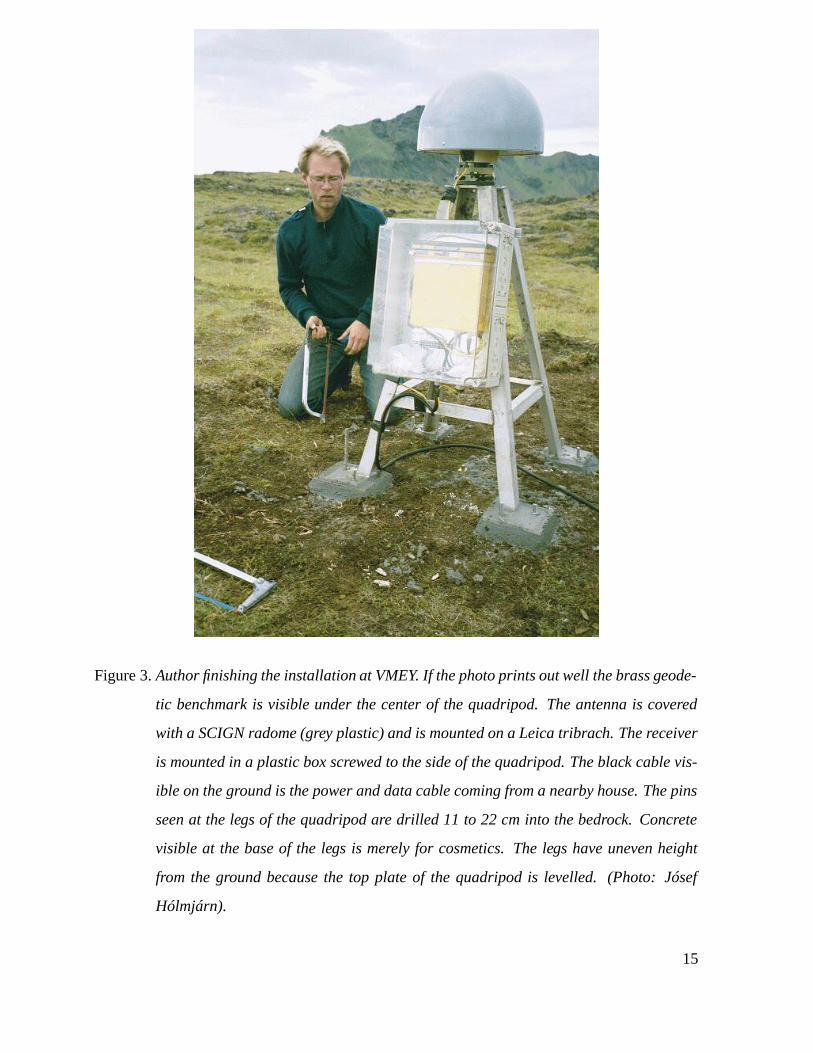
Figure 3.Author finishing the installation at VMEY. If the photo prints out well the brass geode-
tic benchmark is visible under the center of the quadripod. The antenna is covered
with a SCIGN radome (grey plastic) and is mounted on a Leica tribrach. The receiver
is mounted in a plastic box screwed to the side of the quadripod. The black cable vis-
ible on the ground is the power and data cable coming from a nearby house. The pins
seen at the legs of the quadripod are drilled 11 to 22 cm into the bedrock. Concrete
visible at the base of the legs is merely for cosmetics. The legs have uneven height
from the ground because the top plate of the quadripod is levelled. (Photo: Jósef
Hólmjárn).
15
databaseISGPS
Icelandic Meteorological OfficeISGPS station diagram
Daily download
Office.(Linux)
Icelandic MeteorologicalUPS
(program: Lapdogs)Modem − modem dialup connection
IMO
220V AC
Jetway 56kexternal modem.
(Rockwell chipset)
(9V AC)
box
Voltage
Quadripod
(18V DC)
VMEYVestmannaeyjar
House
VM
EY
Trimble 4000
converter (Trimble)
antenna cable
Modem voltage converter
RS232 modem cable
Connection
50 m data & power cable
antenna
SCIGN radome
Trimble choke ring
3 m Rg58
SSI receiver
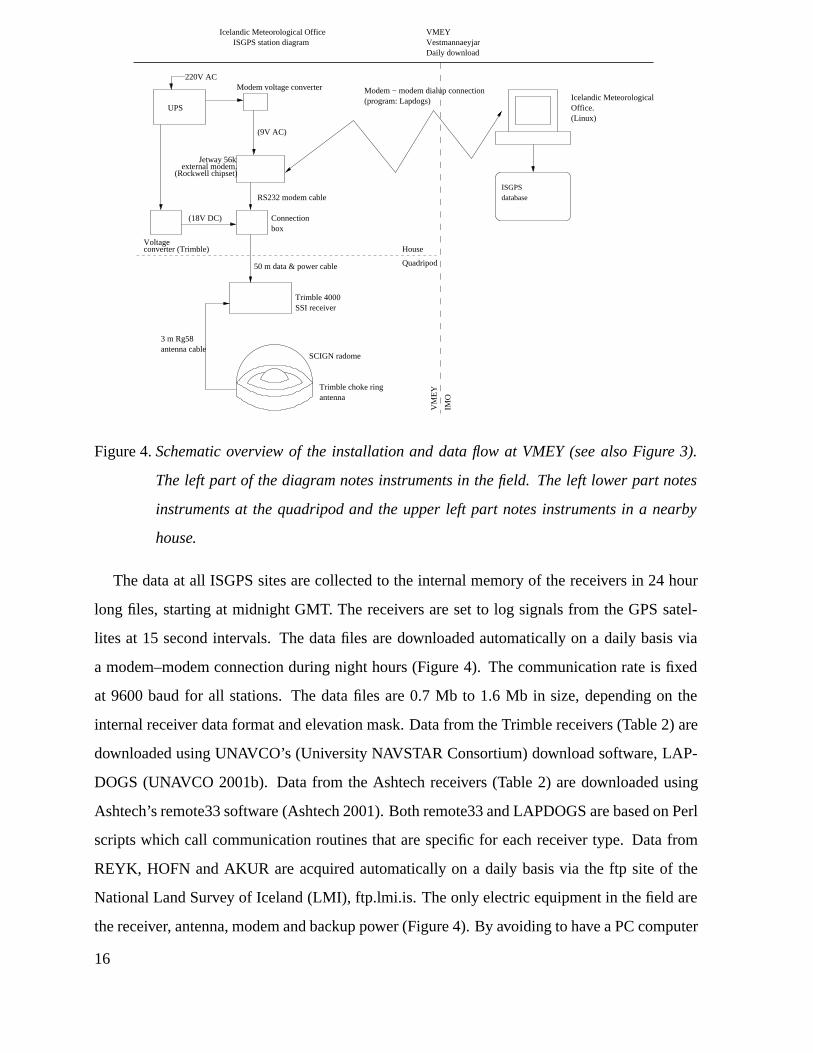
Figure 4.Schematic overview of the installation and data flow at VMEY (see also Figure 3).
The left part of the diagram notes instruments in the field. The left lower part notes
instruments at the quadripod and the upper left part notes instruments in a nearby
house.
The data at all ISGPS sites are collected to the internal memory of the receivers in 24 hour
long files, starting at midnight GMT. The receivers are set to log signals from the GPS satel-
lites at 15 second intervals. The data files are downloaded automatically on a daily basis via
a modem–modem connection during night hours (Figure 4). The communication rate is fixed
at 9600 baud for all stations. The data files are 0.7 Mb to 1.6 Mb in size, depending on the
internal receiver data format and elevation mask. Data from the Trimble receivers (Table 2) are
downloaded using UNAVCO’s (University NAVSTAR Consortium) download software, LAP-
DOGS (UNAVCO 2001b). Data from the Ashtech receivers (Table 2) are downloaded using
Ashtech’s remote33 software (Ashtech 2001). Both remote33 and LAPDOGS are based on Perl
scripts which call communication routines that are specific for each receiver type. Data from
REYK, HOFN and AKUR are acquired automatically on a daily basis via the ftp site of the
National Land Survey of Iceland (LMI), ftp.lmi.is. The only electric equipment in the field are
the receiver, antenna, modem and backup power (Figure 4). By avoiding to have a PC computer
16
operating at each site the operational security is maximized and the number of objects that can
break down in the field is minimized.
The first ISGPS station was installed at Vogsósar (VOGS) on March 18, 1999 (Table 1).
VOGS is in a Holocene pahoehoe lava field. The station is colocated with a SIL station (vos)
(Böðvarsson et al. 1996; Stefánsson et al. 1993). The station is 12 m from the seismometer
vault. The receiver is in the vault and uses power from the same source as the seismological
instruments. The power consumption for the Trimble 4700 is approximately 5 W. Data and
power are transmitted over an approximately 1200 m long ground cable. This cable length is too
long for the RS-232 communication standard to work, so RS-232/422 converters are deployed
at both ends of the cable. The power for the instruments is transmitted at 70 V DC over the cable
and is converted to 15 V in the vault. This is a standard in the SIL system. However, the receiver
at VOGS (a Trimble 4700) does not turn itself on after a power failure unless the input power is
over 18 V. Thus a DC/DC converter is used to run the receiver on 24 V. The daily data files are
downloaded to a Linux computer, that also operates the seismic instruments, using LAPDOGS.
The data are subsequently sent to the data center in Reykjavík via a X.25 link (Böðvarsson et al.
1996). The LAPDOGS software did not support communications with Trimble 4700 receivers
until in late 2000. Until then the data were continually logged to a Windows computer using the
Universal Reference Station (URS) software from Trimble. In the beginning of measurements
the data were transferred to a laptop computer every one or two weeks. This work was tedious
and time consuming. Later the Windows computer was connected to the seismic computer (then
operating on the Solaris system) and data transferred automatically to Reykjavík via the X.25
link. This method for data acquisition was unfortunate since the Windows computer tended to
break down frequently and it was impossible to access the Windows computer from Reykjavík.
Present setup is performing quite well except the X.25 link tends to break down. The X.25
communication software is not as robust in the Linux environment as in the Solaris or Interactive
Unix environments (S. S. Jakobsdóttir, personal communication 2002).
The second station in the ISGPS network was installed just outside Hveragerði (HVER) in
March 1999 (Table 1). The station is sited just over 2 km southeast of the inferred center of
uplift in the Hengill area (Feigl et al. 2000). Hveragerði is within the Grensdalur geothermal
area. HVER is sited at the Hveragerði Golf Club hut and is equipped with a Trimble 4700
receiver. There were problems finding solid bedrock in the area since the bedrock is highly
altered and fractured. A platform of reinforced concrete was built on the existing bedrock, of
17
intermediate silica composition, after a backhoe had been used to scrape off soil and loose rocks.
The platform is approximately 1.5x1.5 m wide and 0.5 m thick. 12 mm iron rods were driven
15-20 cm into the bedrock under the platform and the geodetic benchmark is fastened to one
of the rods. An iron grid was constructed upon the rods driven to the bedrock. (H. Ólafsson,
personal communication 2002). The quadripod is secured to the platform. The receiver is inside
an old nearby barn (a 30 m Rg214 antenna cable is used) in a plastic box, similar to the one
shown in Figure 3, fastened to a wall. A power converter from Trimble supplies 18 V DC
to the instrument. The receiver is connected to an external modem and data are downloaded
using the LAPDOGS software. Before LAPDOGS supported communications with Trimble
4700 receivers, the data were continually logged to a Windows computer operating URS, as for
VOGS. The data were then downloaded from the computer using a communication program
called PolyPM (U. Hessels, personal communication 1999). The computer tended to break
down every now and then and caused many gaps in the data collection. Present setup, with a
modem connected directly to the receiver, performs well.
HLID (Hlíðardalsskóli) was installed in May 1999 (Table 1). The quadripod is fastened into
a Holocene lava field approximately 20 m from the Hlíðardalsskóli building which houses the
receiver. The site is not well chosen for the antenna sometimes gets covered with windblown
snow that piles up on the leeside of the house. This is observed as spurious motion in the coor-
dinate time series (Árnadóttir et al. 2000) when the snow completely covers the antenna. The
winter of 1999 to 2000 was accompanied by unusually much snowfall and the receiver was
removed in March 2000. The antenna could not be found and was probably at 1 to 3 m depth.
At that time the receiver had stopped seeing any signals from the satellites. The station will be
moved to a better location in the future. HLID is presently operated in a semi-permanent mode,
meaning that the receiver is used for network GPS measurements during most of the summer
time. Initially, HLID was equipped with a Trimble 4700 receiver and the data transfer was sim-
ilar to what is described for HVER before LAPDOGS supported communications with Trimble
4700 instruments. Data are now donloaded using LAPDOGS. The receiver was removed to be
installed at THEY in March 2000. After the June 2000 SISZ earthquakes a Trimble 4000 SSI
receiver, initially intended for network GPS measurements by NORDVULK, was installed. The
antenna originally used was still at the site. In October 2001 the antenna was removed and sent
abroad for calibration. A layer of corrosion was observed between the aluminium antenna and
the stainless steel quadripod. Probably this does not affect the antenna height by more than
18
1 mm and can easily be prevented by having a thin plastic sheet between the antenna and the
quadripod.
Ölkelduháls (OLKE) was the fourth ISGPS station to be installed, in May 1999 (Table 1).
The station is within a high temperature geothermal area, at the SW part of the Hrómundartindur
system (Figure 2), 4 km north of the uplift center inferred by Feigl et al. (2000). The quadripod
is in a lava outcrop from Tjarnahnúkur crater, which erupted in early Holocene (Sæmundsson
1967). The receiver is in a plastic box on the side of the quadripod, similar as in Figure 3. The
site is a few kilometers from inhabited areas so electricity is produced at the site using a wind
generator and a solar panel. The electricity buffer consists of four 115 Ah batteries, sufficient
to support operation for over two weeks if electricity production fails. The wind generator type
initially used was faulty at high windspeeds and many maintenance trips were required. In
September 2000 a new type was installed and no maintenance due to power problems has been
required since then. During the summer of 1999 the data were downloaded to a laptop PC every
5 days or so, since the Trimble 4700 receivers can only store about 5 days worth of data. In
the autumn of 1999 a spread–spectrum radio link was established to a building on Háhryggur
(approximately 7 km north of OLKE) near Nesjavellir Power Plant. The building housed a
Windows computer continually logging data from OLKE with the URS software. The daily
data files were downloaded automatically during night hours using the PolyPM program. In
September 2000 a cellular modem with a directional antenna was installed at OLKE and the data
files collected directly from the receiver internal memory using LAPDOGS. The communication
rate for cellular modems is presently fixed at 9600 baud. A program calls OLKE once per day
to log the input voltage to the receiver and adds it to a plot on the internet. This enables us to
monitor the power status of stations equipped with local electricity generators.
Seismic unrest at Mýrdalsjökull and Eyjafjallajökull accompanied with a small jökulhlaup
in Jökulsá á Sólheimasandi in July 1999 (Sigurðsson et al. 2000) led to funding from the Ice-
landic Research Council for purchase of three Trimble 4000 SSI instruments for continuous
GPS measurements in the area. Initially the stations were planned to monitor Katla volcano.
GPS network measurements indicated that an intrusion event had occurred beneath the southern
flanks of Eyjafjallajökull (Sturkell et al. 2002b), so one station (THEY) was installed close to
the inferred intrusion center. The stations were originally intended to be operated in a semi-
continuous mode, with the receivers being used for GPS network measurements by NVI and
SIUI during summer time. However, activity at Katla and Eyjafjallajökull required the instru-
19
ments for near real-time monitoring and the instruments have been fixed at the sites since they
were installed. As will be discussed later, a grant from the the Icelandic Research Council was
provided in 2001 to change the receivers to make the instruments available for GPS network
measurements.
The station at Sólheimaheiði (SOHO) was installed in September 1999 (Table 1). It is only
5 km SSW of the subglacial Katla caldera rim and is thus well suited to monitor magma move-
ments beneath Katla. The station is sited in a glacially eroded lava outcrop. The bedrock was
hammered and polished to level the quadripod to within 2Æ, so the top plate of the quadripod is
not precisely levelled. The quadripod legs stand directly on the bedrock as opposed to at most
stations where the legs actually stand on the threaded rods. To level the antenna a Leica tribrach
is used, same type as can be seen in Figure 3. The hole in the top plate of the quadripod for the
bolt to secure the antenna is 1 to 2 mm wider than the bolt. Thus the antenna cannot be replaced
excactly at the same position if it is removed. The tribrach, along with an optical level, allows
the antenna to be precisely (to within 0.5 mm) centered over the benchmark. Tribrachs were
used in the installation of stations SOHO, HVOL, THEY and VMEY. The use of tribrachs in the
installation process was discontinued, but left at the stations already installed with a tribrach,
since the structure is more fragile and it is easy to accidentally tamper with the settings of the
tribrach. SOHO is remotely located and no municipal electricity is available within kilometers.
Thus electricity is produced at the site in the same manner as at OLKE, also sharing a simi-
lar history of problems. Data are collected in the same way as at OLKE. Sólheimaheiði is a
very windy place with high precipitation, icing conditions and rapid changes between freeze
and thaw causing a significant strain on the instruments. A new type of wind genearator was
installed in December 2000 that is still working. The receiver used at SOHO was a Trimble
4000 SSI until it was swapped for a Trimble 4700 receiver in the summer of 2002 and used for
network GPS measurements as originally planned. The same choke ring antenna is still used.
The Trimble 4700 instrument consumes only half of the power that the 4000 receiver uses.
HVOL (Láguhvolar) was installed in October 1999 (Table 1). It is 12 km SE of the Katla
caldera rim on a palagonite hill. The site is colocated with a SIL station (hvo). Initially this
station was intended to be colocated with another SIL station at Snæbýli (snb), approximately
20 km east of the glacier. A quadripod was installed at Snæbýli (SNAE) and the point has
been measured in several GPS network campaigns. The antenna at HVOL is mounted on a
tribrach and electricity is generated with a wind generator and a solar panel. Data are collected
20
via a cellular modem, with a directional antenna, of the same type as at OLKE and SOHO.
There are large sand plains deposited from the glacier in the surroundings and in high winds the
instruments are battered with airborne sand. Plastic surfaces such as the antenna radome and
the receiver box show signs of extensive wear. The Trimble 4000 SSI receiver was changed for
a Trimble 4700 receiver in January 2002 (Table 2).
THEY (Þorvaldseyri) was installed in May 2000 (Table 1). The station was initially intended
to be at Miðmörk, west of Eyjafjallajökull, where a SIL station (mid) is operating. Before
the installation of Miðmörk (MORK) was completed, results from GPS network measurements
showed significant deformation in the southern flanks of Eyjafjallajökull and it was decided to
install the station as close to the source of the signal as possible. THEY is located approximately
5 km WSW of the intrusion center inferred by Sturkell et al. (2002b). The quadripod is fastened
in a pre-Holocene lava layer from Eyjafjallajökull. The site is deep in a valley at the Koltungu-
virkjun local power plant. The nearby mountains mask the sky up to 15Æ in all directions but
south. The receiver and antenna are approximately 100 m from the turbine housing and power
(at 24 V) and data (RS-232) are transmitted to and from the turbine housing via a cable. The
antenna is mounted on a tribrach. Initially it was planned to have a Trimble 4000 SSI receiver
at THEY, but since HLID was not working properly at the time of the installation of THEY,
the Trimble 4700 receiver from HLID was used at THEY (Table 2). There was no telephone
connection at Koltunguvirkjun before installation of the instruments and a telephone line was
established in August 2000. The data were initially logged continually to a Windows computer
running URS. The environment in Koltunguvirkjun was hostile for computers because it was
damp and the regulators of the turbines were old. The power plant has been greatly renewed. In
January 2001 the computer was removed (actually that was the third computer tried at the site)
and a modem connected directly to the receiver. Data have been downloaded using LAPDOGS
since then.
The State Disaster Relief Fund (Viðlagasjóður) supported installation of a SIL seismic station
and an ISGPS station to monitor seismicity and crustal movement at the Westman Islands.
Westman Islands are a central volcanic area at the tip of the propagating Eastern volcanic zone
(Figure 1). An eruption in 1973 occurred in Heimaey, the largest island, covering the town in
Heimaey with ash and devastating a significant part of the inhabited areas. Presently around
4500 people live in Heimaey. VMEY started recording data on July 27, 2000 (Table 1). The
installation is shown in Figures 3 and 4. The station is in a Holocene lava field in the middle
21
west part of Heimaey. The antenna is mounted on a tribrach as at stations SOHO, HVOL and
THEY. A modem and a Trimble power supply are located in a nearby house (Figure 4) and data
are transferred on a daily basis using LAPDOGS. The station has been working very well and
almost no data have been lost since the station was installed.
A French group from the Laboratoire de Géodynamique des Chaines Alpines (LGCA), Uni-
versity of Savoie, led by Thierry Villemin, has been conducting GPS network measurements
in North Iceland since 1995. They have contributed to the buildup of the ISGPS network and
obtained funding from the French Polar Institute (IFRTP) to install a station at Skrokkalda
(SKRO), in the interior of the Iceland (Figure 1). The station was installed in September 2000
(Table 1). It is set on top of a small mountain. The quadripod was fastened in what looked like
solid bedrock, but spurious motion recorded at the station indicates that this is not the case. This
will be discussed more in Section 4.1 along with the time series from SKRO. The antenna is
secured directly to the top plate of the quadripod and has a hemispherical radome from SCIGN
(part number 0010-1). The antenna is connected to the receiver via a 70 m long Rg-214 antenna
cable and an amplifier. The receiver is in a hut, owned by the National Power Company, that
also houses various communication hardware. The instruments are powered by a diesel engine.
SKRO is colocated with a SIL seismic station (skr). The daily data file in the internal memory
of the receiver is downloaded during night hours to the SIL computer, running a program called
remote33 on a Linux platform. The file is subsequently transmitted to the data center in Reykja-
vík via a X.25 link. A telephone modem was connected to another serial port of the receiver in
the summer of 2002 to have an alternative communication link if the computer breaks down.
The June 2000 South Iceland seismic zone earthquake sequence (Section 4.6) called up on
densification of the ISGPS network in the SISZ. IMO funded instruments for installation of one
new station in 2001. The station was installed at Kiðjaberg (KIDJ) in January 2001 (Table 1).
The quadripod is secured in breccia from the Hreppar formation using 22 cm deep holes for the
threaded rods. The receiver is in a plastic box on the side of the quadripod and power and data
are transmitted via a 50 m long cable. The station has been performing well since its installation
and only 4 days of data are missing since the start of measurements as of May 2002.
Funding from the Icelandic Research Council supported installation of two permanently
recording stations in the SISZ and installation of new receivers at SOHO and HVOL to make
the preexisting instruments there available for GPS campaign measurements. The stations are
located at Selfoss airport (SELF) and at Stórólfshvoll (STOR), Hvolsvöllur. SELF started col-
22
lecting data in February 2002 (Table 1). The station is in the Þjórsárhraun lava field. The
communication link does not yet support automatic downloading of the data using LAPDOGS.
Data are logged to the internal memory card of the receiver, a Trimble 5700, which can store
around two months worth of data. The data are downloaded to a laptop every two months or
so. To use a choke ring antenna with the Trimble 5700 requires an antenna power adapter (part
number 43216-00). Installation of STOR has not yet been completed. A quadripod has been
installed in palagonite surroundings and the site has been included in GPS network campaigns.
A volumetric strain station (Stefánsson et al. 1983) is located within 1 km from the monument.
The French Polar Institute funded installation of a station in Raufarhöfn (RHOF). The station
was installed in July 2001 by LGCA and IMO (Table 1). The quadripod stands on a glacier
polished lava outcrop at the northern edge of the town. The receiver is inside a nearby house. In
March 2002 the receiver (a Martec Mira-Z) was swapped for an Ashtech�Z-12 receiver (Table
2). The receivers are near identical, since the inside of the Martec receiver is mostly provided
by Ashtech. Data are downloaded on a daily basis via a modem connection using the remote33
software.
AKUR (Akureyri) was installed in July 2001 by LMI and the University of Akureyri (Ta-
ble 1). The antenna is on an approximately 10 m high concrete chimney at the University of
Akureyri. Data are continually logged to a Windows computer running the Trimble Reference
Station software. The data are collected into 1 hour long files (at 5 s recording intervals) that
are subsequently sent to LMI’s data center in Akranes via ftp. At LMI the data are converted
into 24 hour long files (at 15 s recording intervals). Both data sets are publicly available at
ftp://ftp.lmi.is/GPS/AKUR (24h 15sec) and ftp://ftp.lmi.is/GPS/AKUR/1h5sec (1h 5sec for 90
days) (M. Rennen, personal communication 2002).
The National Power Company supported installation of a new permanent station at Ísakot
(ISAK). The station was installed in January 2002 (Table 1). ISAK is located near the intake
reservoir for Búrfellsvirkjun power plant in Þjórsárdalur. ISAK is approximately 15 km NW of
the summit of Hekla and should be able to detect major magma movements beneath the moun-
tain. The quadripod was installed over an existing geodetic benchmark that has been included in
network measurements since 1986 and used as a reference station in network campaigns around
Hekla and Torfajökull. The receiver is in a plastic box on one side of the quadripod. A modem
and a power supply are in a hut 150 m from the quadripod. Although this cable length is on the
verge of being too long for the RS-232 standard, there have been no problems with data transfer
23
since the installation.
In the summer of 2002 a station was installed at Árholt (ARHO), Tjörnes peninsula, North
Iceland, in cooperation with LGCA. Initial tests for installation of a permanent GPS station at
Grímsfjall, Vatnajökull, in cooperation with LGCA, have started. Installation and operation of
a station at Grímsfjall is technically very challenging. The place is known for extreme icing
conditions during all times of the year. A method to deice the antenna radome utilizing local
geothermal heat resources is being devoloped at IMO (J. Hólmjárn, personal communication
2002). The data will possibly be transmitted with the same spread-spectrum radio link as the
SIL station at Grímsfjall (grf) uses.
24
3 DATA PROCESSING
Data are analyzed with the Bernese V4.2 software (Hugentobler et al. 2001) using a process-
ing sequence, described by Árnadóttir et al. (2000), that includes: 1) cycle-slip screening and
outlier removal using ionosphere-free linear combination (L3) double-difference phase residu-
als; 2) estimation of an ionospheric model using the geometry-free linear combination (L4); 3)
using the previously obtained ionospheric model and constraining the coordinates of REYK the
L1 and L2 ambiguities are estimated and saved using the QIF ambiguity resolution strategy; 4)
introducing the L1 and L2 ambiguities the L3 linear combination is used to calculate the final
station coordinates and full covariance matrix.
Because precision GPS positioning requires differencing of carrier phase, we choose to
tightly constrain (effectively fix) one site in the network (REYK) at its International Terres-
trial Reference Frame 1997 (ITRF97) (Boucher et al. 1999) coordinates for each week. The
coordinates of REYK are referred to epoch 1997.0 and are projected to its present ITRF97 po-
sition using the ITRF97 velocities. Thus the daily coordinate results can be considered to be in
the ITRF97 reference frame.
After the data have been downloaded from the receivers, they are converted to RINEX (Re-
ceiver INdependent EXchange) format (Gurtner 1994) using UNAVCO’s teqc software (Estey
and Meertens 1999). When data from all stations have been collected, usually between 5 and 6
am GMT, preliminary results (coordinates) are automatically calculated using predicted satellite
orbits from the Center of Orbit Determination in Europe (CODE). The results are readily used to
update images on the ISGPS web pages that are used for monitoring activity in the crust. Later
the data are reprocessed using CODE final orbits (Hugentobler et al. 2001). In both phases of
processing we use the rapid pole information BULLET_A.ERP (McCarthy 1992, 1996). The
quality of CODE predicted and final orbits differs by a factor 4 (Hugentobler et al. 2001) and is
reflected in poorer quality of the results obtained using the predicted orbits.
The daily coordinate results are transformed to a local east-north-up coordinate system and
the displacement since a fixed epoch calculated relative to REYK to build up the time series.
The associated daily coordinate error is taken as the square root of the diagonal elements in
the daily solution covariance matrix after transforming it to a local east-north-up coordinate
system. We refer to this error as the "formal coordinate error". The off-diagonal elements
in the full covariance matrix, representing the correlation of the coordinate results between
25
−60−50−40−30−20−10
0102030405060
UP
(m
m)
1999.0 1999.5 2000.0 2000.5 2001.0 2001.5 2002.0 2002.5Year
−40−35−30−25−20−15−10
−505
10152025303540
NO
RT
H (
mm
)
1999.0 1999.5 2000.0 2000.5 2001.0 2001.5 2002.0 2002.5
VOGS − REYK
−40−35−30−25−20−15−10
−505
10152025303540
EA
ST
(m
m)
1999.0 1999.5 2000.0 2000.5 2001.0 2001.5 2002.0 2002.5
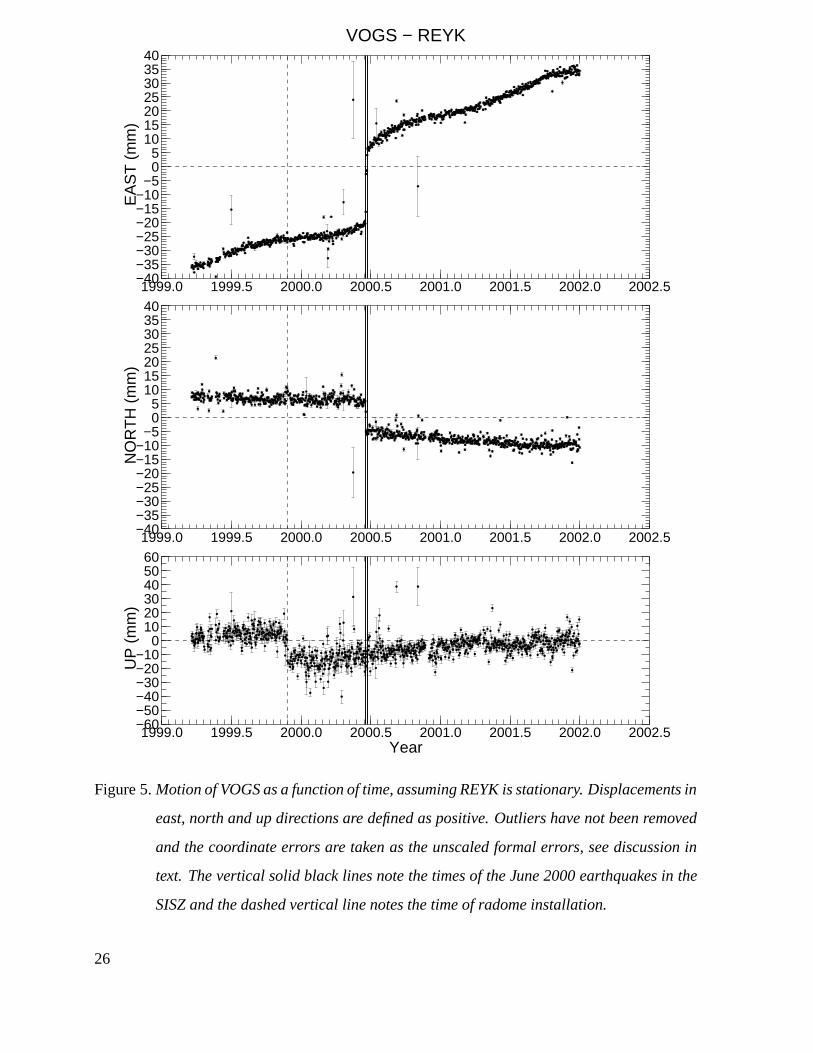
Figure 5.Motion of VOGS as a function of time, assuming REYK is stationary. Displacements in
east, north and up directions are defined as positive. Outliers have not been removed
and the coordinate errors are taken as the unscaled formal errors, see discussion in
text. The vertical solid black lines note the times of the June 2000 earthquakes in the
SISZ and the dashed vertical line notes the time of radome installation.
26
coordinate compononents and stations, are generally not zero. The off-diagonal elements in the
full covariance matrix are not taken into account in this study.
Figure 5 shows an example of the resulting time series. The figure shows the diplacements
of VOGS relative to REYK as a function of time. The plate movements appear as gradual
displacement towards east and south in Figure 5. As a first approximation we can assume that
the plate velocities are constant. The errorbars in Figure 5 are the formal coordinate errors. The
errors are not the true coordinate errors, as they are underestimated by the Bernese processing
software (Hugentobler et al. 2001) and need to be rescaled to obtain a more rigorous estimate
of the coordinate errors. Incorrect coordinate errors lead to wrong error estimates for offsets in
the time series, e.g. due to the June 2000 SISZ earthquakes and radome installation. Section 3.1
describes how the formal coordinate errors are rescaled.
There are a few outliers in the time series that need to be removed before the data are used
for further interpretation. Outliers can substantially bias plate velocities derived from the time
series (Section 4). The outliers can be removed by visual inspection, but that is not feasible
since it is time consuming and it is hard to keep consistency for all the stations. Section 3.2
describes how the outliers are detected and removed.
3.1 Estimation of scaling factors
As stated before, the Bernese processing software underestimates the true errors of the coor-
dinate solutions because systematic errors or mismodelled parameters are not included in the
formal error estimated by the processing software (Hugentobler et al. 2001). To obtain a res-
onable estimate of the daily coordinate errors we need to rescale the formal errors to obtain a
realistic error estimation.
This problem has been dealt with in many studies, since all Bernese software users (and
probably users of other software as well) necessarily need to face this important problem. How-
ever, there is no standard method approved by the GPS community and each study seems to use
its own method to obtain a scaling factor to multiply the formal errors. Usually scaling factors
are estimated by comparing the scatter of the data to the formal errors. The differences lie in
how the scatter is defined and how the full covariance matrix is used to define the errors to be
scaled.
The Bernese software offers a method to derive a scaling factor using the combination pro-
27
gram ADDNEQ (Hugentobler et al. 2001; Braun 2000). This method estimates the rms repeata-
bilities relative to a constant velocity model, meaning that the repeatabilitiy is calculated after
subtracting a best straight line fit (�� � ����) from the data. From Figure 5 we see that a straight
line represents the data poorly. Offsets in the time series due to the the June 2000 earthquakes
and radome installation would bias the repeatability estimation considerably. Furthermore, if we
remove the coseismic displacement from the east component of VOGS (described in more de-
tail in Section 4.6) and subtract a straight line, obtained by a least squares medhod (see Section
4.2.1), from the data we obtain the residual1 of the time series:
� � � � �� � � � ��� �� (1)
where� is the vector of observed displacements, e.g. for the east component of VOGS and�� is
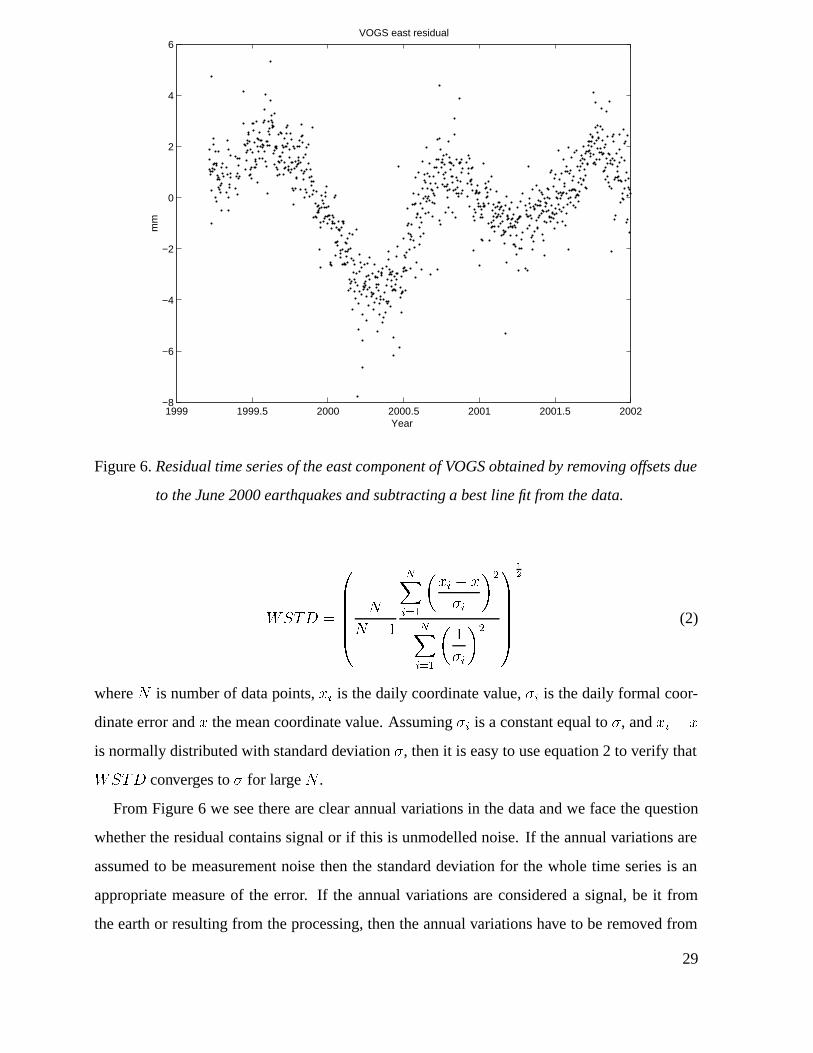
the best line fit. Figure 6 shows the residual of the east component of VOGS relative to REYK.
We see immediately from the figure that a straight line model leaves a residual with periodic
variations.
Árnadóttir et al. (2000) use the Bernese network adjustment program COMPAR to calculate
the average station coordinates for each week. COMPAR also returns the variation of the daily
solutions from the weekly average. They compare the variances to the formal errors and obtain
a scaling factor of 3 that they use for all coordinate components and sites. They also process
the data using the GIPSY/OASIS software (Webb and Zumberge 1993) and use there a scaling
factor of 2.7 to rescale the coordinate and velocity errors.
Lowry et al. (2001) transform the covariance matrix, obtained using the Bernese software, to
a local east-north-up coordinate system and define the formal error as the corresponding column
sum of the covariance matrix. They estimate the repeatability scaling factors using the 95th%
�� repeatability of the coordinates, relative to a time varying velocity model. This results in
scaling factors (one for each coordinate direction at each site) ranging from 2.0 to 3.9 (east), 1.6
to 3.6 (north) and 1.5 to 4.0 (up) in their case.
In this study we define the formal errors as the square root of the diagonal elements of
the covariance matrix and compare them to the weighted standard deviation, or repeatability,
defined as1It would be more precise to call this the "modified residual" since the offsets due to the June 2000 earthquakes
have been removed before estimating a best line fit.
28
1999 1999.5 2000 2000.5 2001 2001.5 2002−8
−6
−4
−2
0
2
4
6
Year
mm
VOGS east residual
Figure 6.Residual time series of the east component of VOGS obtained by removing offsets due
to the June 2000 earthquakes and subtracting a best line fit from the data.
�� �
������
�
� � �
�����
��� � ��
�
��
�����
��
�
��
������
�
�
(2)
where� is number of data points,�� is the daily coordinate value, � is the daily formal coor-
dinate error and�� the mean coordinate value. Assuming � is a constant equal to , and�� � ��
is normally distributed with standard deviation , then it is easy to use equation 2 to verify that
�� converges to for large� .
From Figure 6 we see there are clear annual variations in the data and we face the question
whether the residual contains signal or if this is unmodelled noise. If the annual variations are
assumed to be measurement noise then the standard deviation for the whole time series is an
appropriate measure of the error. If the annual variations are considered a signal, be it from
the earth or resulting from the processing, then the annual variations have to be removed from
29
the time series before estimating the standard deviation. Here, the latter approach is chosen,
and only the high frequency component is considered as measurement noise. This is in practice
achieved by using only short segments (e.g. 50 days) of the time series to calculate��.
We define the scaling factor as the ratio between the repeatability of the residual time series
within a specific time interval, and the median formal error within the same time interval:
��� �����
�����
(3)
where� refers to the east north and up coordinate directions,� refers to the time interval used,
��� refers to the median of the formal error � and�� is obtained from equation 2.
The median of the formal errors is chosen to represent the average error within a time interval
because it is a more robust estimator than the mean. The coordinate errors obtained by using
the scaling factor defined in equation 3 do not represent the absolute positioning accuracy of the
daily solutions because they also rely on e.g. the coordinates of the reference station (REYK).
The rescaled errors, obtained using the scaling factor as in equation 3, represent only the short-
term repeatability of the daily solutions.
Offsets in the time series due to the June 2000 SISZ earthquakes and equipment changes
are removed (see Sections 4.1.1 and 4.6), as well as outliers (Section 3.2), before estimating
the scaling factors. The time series for each station and each coordinate component are then
split into�� segments including� data points each where� refers to the station name as�� will
depend on the length of the time series at station�. Each segment in each coordinate component
is detrended using a weighted least squares method. From the detrended segments the��
and median formal errors are estimated to obtain scaling factors according to equation 3 for the
east, north and vertical components for each segment. The mean of the�� scaling factors, for
each component at each station, is calculated to obtain a single set of scaling factors in the east,
north and vertical components for each station.
Table 4 summarizes the results, using a time interval length of� � ��. The scaling factor
(center columns of Table 4) is generally largest for the east component and smallest for the verti-
cal component. There are considerable variations between stations and the scaling factors range
from 3.2 to 5.1 in east, from 3.1 to 5.0 in north and from 2.0 to 2.8 in the vertical component.
The median formal errors, calculated using all available data from the stations, shown in the left
part of Table 4 also vary between stations, but not nearly as much as the scaling factor. The
30
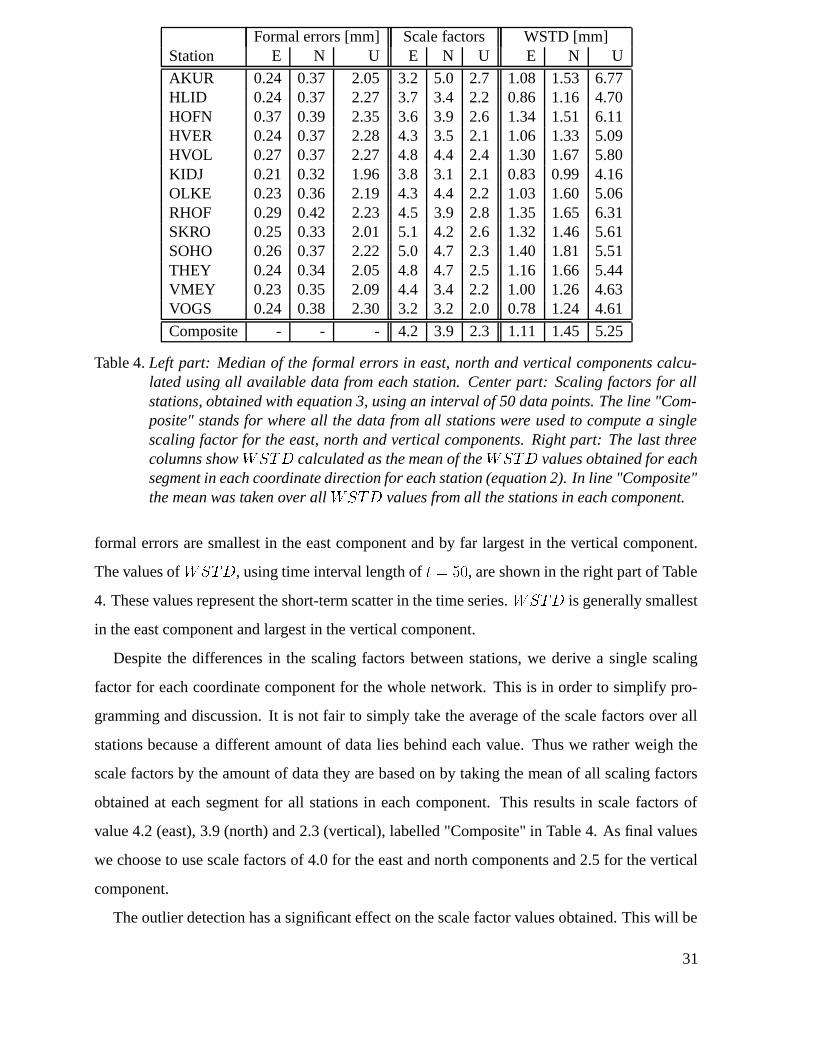
Formal errors [mm] Scale factors WSTD [mm]Station E N U E N U E N U
AKUR 0.24 0.37 2.05 3.2 5.0 2.7 1.08 1.53 6.77HLID 0.24 0.37 2.27 3.7 3.4 2.2 0.86 1.16 4.70HOFN 0.37 0.39 2.35 3.6 3.9 2.6 1.34 1.51 6.11HVER 0.24 0.37 2.28 4.3 3.5 2.1 1.06 1.33 5.09HVOL 0.27 0.37 2.27 4.8 4.4 2.4 1.30 1.67 5.80KIDJ 0.21 0.32 1.96 3.8 3.1 2.1 0.83 0.99 4.16OLKE 0.23 0.36 2.19 4.3 4.4 2.2 1.03 1.60 5.06RHOF 0.29 0.42 2.23 4.5 3.9 2.8 1.35 1.65 6.31SKRO 0.25 0.33 2.01 5.1 4.2 2.6 1.32 1.46 5.61SOHO 0.26 0.37 2.22 5.0 4.7 2.3 1.40 1.81 5.51THEY 0.24 0.34 2.05 4.8 4.7 2.5 1.16 1.66 5.44VMEY 0.23 0.35 2.09 4.4 3.4 2.2 1.00 1.26 4.63VOGS 0.24 0.38 2.30 3.2 3.2 2.0 0.78 1.24 4.61
Composite - - - 4.2 3.9 2.3 1.11 1.45 5.25
Table 4.Left part: Median of the formal errors in east, north and vertical components calcu-lated using all available data from each station. Center part: Scaling factors for allstations, obtained with equation 3, using an interval of 50 data points. The line "Com-posite" stands for where all the data from all stations were used to compute a singlescaling factor for the east, north and vertical components. Right part: The last threecolumns show�� calculated as the mean of the�� values obtained for eachsegment in each coordinate direction for each station (equation 2). In line "Composite"the mean was taken over all�� values from all the stations in each component.
formal errors are smallest in the east component and by far largest in the vertical component.
The values of��, using time interval length of� � ��, are shown in the right part of Table
4. These values represent the short-term scatter in the time series.�� is generally smallest
in the east component and largest in the vertical component.
Despite the differences in the scaling factors between stations, we derive a single scaling
factor for each coordinate component for the whole network. This is in order to simplify pro-
gramming and discussion. It is not fair to simply take the average of the scale factors over all
stations because a different amount of data lies behind each value. Thus we rather weigh the
scale factors by the amount of data they are based on by taking the mean of all scaling factors
obtained at each segment for all stations in each component. This results in scale factors of
value 4.2 (east), 3.9 (north) and 2.3 (vertical), labelled "Composite" in Table 4. As final values
we choose to use scale factors of 4.0 for the east and north components and 2.5 for the vertical
component.
The outlier detection has a significant effect on the scale factor values obtained. This will be
31
0 0.05 0.1 0.15 0.2 0.25 0.3 0.35 0.4 0.45 0.50
0.5
1
1.5
2
2.5
median error [mm]
WS
TD
[mm
]
(a)
0 0.1 0.2 0.3 0.4 0.50
0.5
1
1.5
2
2.5
3
median error [mm]
WS
TD
[mm
]
(b)
0 0.5 1 1.5 2 2.5 3 3.50
1
2
3
4
5
6
7
8
9
median error [mm]
WS
TD
[mm
]
(c)
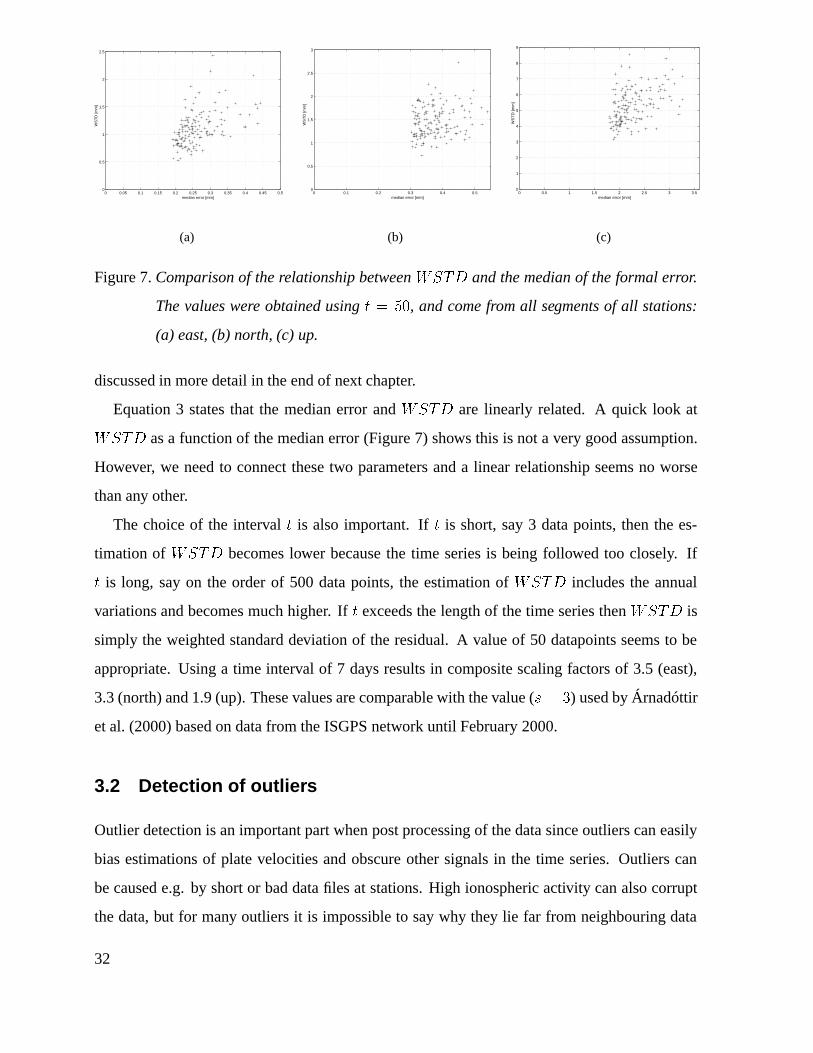
Figure 7.Comparison of the relationship between�� and the median of the formal error.
The values were obtained using� � ��, and come from all segments of all stations:
(a) east, (b) north, (c) up.
discussed in more detail in the end of next chapter.
Equation 3 states that the median error and�� are linearly related. A quick look at
�� as a function of the median error (Figure 7) shows this is not a very good assumption.
However, we need to connect these two parameters and a linear relationship seems no worse
than any other.
The choice of the interval� is also important. If� is short, say 3 data points, then the es-
timation of�� becomes lower because the time series is being followed too closely. If
� is long, say on the order of 500 data points, the estimation of�� includes the annual
variations and becomes much higher. If� exceeds the length of the time series then�� is
simply the weighted standard deviation of the residual. A value of 50 datapoints seems to be
appropriate. Using a time interval of 7 days results in composite scaling factors of 3.5 (east),
3.3 (north) and 1.9 (up). These values are comparable with the value (� � �) used by Árnadóttir
et al. (2000) based on data from the ISGPS network until February 2000.
3.2 Detection of outliers
Outlier detection is an important part when post processing of the data since outliers can easily
bias estimations of plate velocities and obscure other signals in the time series. Outliers can
be caused e.g. by short or bad data files at stations. High ionospheric activity can also corrupt
the data, but for many outliers it is impossible to say why they lie far from neighbouring data
32
points. From Figure 5 we can see there are two types of outliers: Type 1 – data points with
abnormally large errors and Type 2 – data points with normal errors but lie abnormally far
from its neighbouring data points. Consequently the outlier removal is performed in two steps,
removing outliers of Type 1 in the first step and outliers of Type 2 in the second step. When an
outlier is detected in one coordinate component, the other 2 components for the same day and
station are deleted from the time series.
We define Type 1 outliers as data points with error larger than 3 times the median error (Table
4) for each component at each station. The median is a much more robust estimator than the
mean in the presence of outliers. Before outlier detection, the median and mean of the formal
coordinate errors for the east component of VOGS were 0.240 and 0.310 respectively. After the
outlier detection the corresponding values were 0.238 and 0.259, emphasizing that the median
is a more appropriate estimator of the average than the mean when outliers are present.
Outliers of Type 2 are harder to deal with. We must define what we mean by the expression
"abnormally far from neighbouring data" and care must be taken not to remove data that actually
are far from its neighbouring data due to offsets in the time series (Figure 5). To detect outliers
of Type 2 we first remove from the time series known jumps due to earthquakes and radome
installation. The time series, for each component of each station, are then split into time intervals
including e.g. 50 data points each (discussed later in this section) and the median value of the
coordinates is calculated for each time interval. Again we choose to use the median instead of
the mean because it is a more robust estimator. If a coordinate value lies more than four times
the scaled median coordinate error (already calculated in step 1) from the median coordinate
value of each time interval, then the point is considered an outlier of Type 2. Stated a bit more
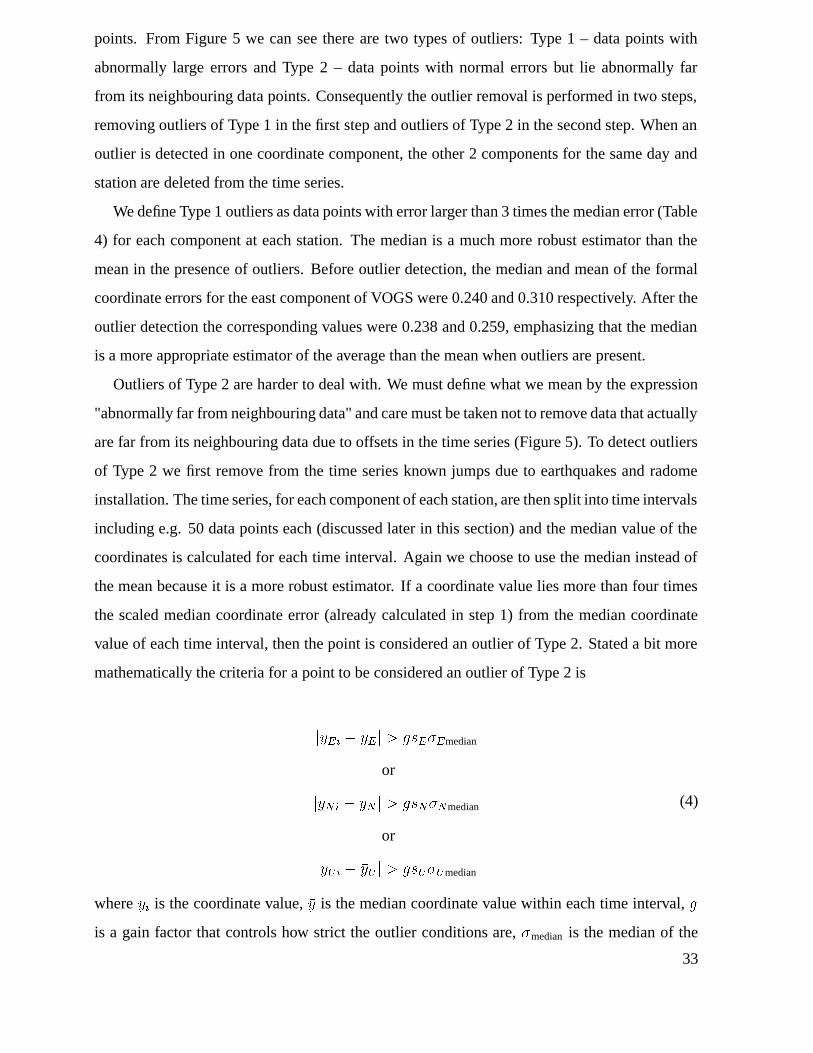
mathematically the criteria for a point to be considered an outlier of Type 2 is
��� � ��� � �� median
or
���� � ��� � � ��� �median
or
��� � �� � � �� median
(4)
where�� is the coordinate value,�� is the median coordinate value within each time interval,�
is a gain factor that controls how strict the outlier conditions are, median is the median of the
33
formal coordinate error (from step 1), and�, �� and� are the scaling factors (see Section
3.1). The labels E, N and U refer to the coordinate components.
For the outlier detection scale factors� � �� � ��� and� � �� were used. The gain
factor� controls how far from its neighbours a point is allowed to be without being considered
an outlier. The conditions become stricter as� is smaller. Values for� ranging from 1 to 10
were tested. Values below 2 were way too stringent and many points in the data series were
removed (16% of data points removed for station VOGS for� � ). Values above� � � proved
to be too large and many obvious outliers were not detected (2% of data points removed for
station VOGS for� � ). A value of� � ��� (4% of data points removed for station VOGS)
was finally used for the outlier detection.
The length of the time interval used in the outlier detection was varied between 20 and 200
data points. If the time interval is too long, then valid data points are considered outliers because
the data are not detrended and higher order signals in the time series start to interfere at time
intervals of 100 to 200 days. A too short time interval follows the data values too closely and
leaves many outliers undetected. A time window of 50 data points was used for the final outlier
detection.
The method does not account for gaps in the data. Since gaps in the data are usually much
shorter than 50 days, this is not considered important. It was only at station HLID that this
caused problems and a few valid data points were removed from the time series near large gaps
(see Figure 9). These data points were added to the time series again afterwards. A small
deformation signal observed at SOHO in relation to the Hekla 2000 eruption was removed
from the time series by the outlier detection scheme. This caused some valid data points to be
considered as outliers and they were added to the time series afterwards.
The outlier detection has a significant effect on the scaling factors obtained (see Section 3.1)
because outliers can greatly bias the estimation of�� (equation 2). Vice versa the scaling
factors affect the outlier detection through equation 4. In practice the outlier detection and
scaling factor estimation were made in an iterative manner — starting with a scaling factor of
3 to find an appropriate value of�, which is then used in the scaling factor estimation (outliers
are removed prior to the estimation) and the new scaling factor used in the outlier detection etc.
34
4 RESULTS
4.1 Time series
In the time series shown in Figures 8 to 20 outliers have been removed (Section 3.2) and the
formal coordinate errors have been scaled by 4.0 and 2.5 in the horizontal and vertical compo-
nents respectively. The time series span the period from the beginning of measurements (Table
1) to December 31, 2001. The longest time series span nearly three years (e.g. VOGS), but the
stations in the north (RHOF and AKUR) have short time series since they were installed in the
summer of 2001. The time series are of excellent quality. The values of the weighted standard
deviation (��) in Table 4 represent the short-term scatter in the time series. The values
are lowest in the east direction, from 0.8 mm (VOGS) to 1.4 mm (SOHO), and largest in the
vertical component, ranging from 4.2 mm (KIDJ) to 6.8 mm (AKUR).�� ranges from 1.0
mm (KIDJ) to 1.8 mm (SOHO) in the north component.
The horizontal components in the time series (Figures 8 to 20) are dominated by the plate
movements, seen as gradual displacements towards east and south for stations on the Eurasian
plate (HLID, VOGS, VMEY, THEY, SOHO, HVOL, HOFN and RHOF). Stations on the North-
American plate show nearly no movement in the horizontal components (OLKE, SKRO and
AKUR) because the reference station REYK is on the North-American plate.
Displacements in the time series due to the two large earthquakes in the SISZ in June 2000
(Stefánsson et al. 2000; Árnadóttir et al. 2001; Pedersen et al. 2001) are visible in the time series
as offsets at the stations recording at the time (OLKE, HVER, VOGS, HVOL, SOHO, HOFN
and HLID) and are marked with solid vertical lines in Figures 8 to 20. The SISZ earthquakes
will be discussed in more detail in Section 4.6.
Offsets of approximately 20 mm in the vertical components at HLID, HVER, OLKE, SOHO
and VOGS (marked with dashed lines in Figures 9, 11, 14, 17 and 20) are due to installation of
plastic radomes (Figure 3) which will be discussed in Section 4.1.1.
The time series at HLID (Figure 9) has many gaps. The antenna at HLID is occasionally
covered with snow in the wintertime up to one or two meters thick. The data from such epochs
are easily detected as spurious motion towards east, south and up and is omitted from the time
series. The station is presently operated in a semi-continuous manner (Section 2). Although
HOFN has been recording since 1997, we only started using data from the station when the first
35
ISGPS station was installed in March 1999 (VOGS). In September 2001 the antenna type at
HOFN was changed (Table 2) resulting in significant offsets in the time series (6 mm east, 2 mm
south and 74 mm up, see Figure 10). A small offset in the east component at HVOL (Figure 12)
is observed during a period of power failure in February to March 2001. No equipment changes
were made during the period. A signal from the Hekla 2000 eruption (start of eruption marked
with a vertical dotted line in Figure 12) can be seen. This signal is further enhanced in the time
series at SOHO (Figure 17). The Hekla eruption will be discussed in more detail in Section 4.5.
The time series for SKRO (Figure 16) includes spurious motions in all coordinate compo-
nents during wintertime. Some of these data have already been removed in the outlier detection
process. The east component shows suspicious movements towards east in December 2000 and
January to February 2001. The vertical component is also behaving in a strange manner. The
station is in central Iceland at high elevation. We believe that the offsets are either due to snow
and icing on the antenna radome, or because the quadripod is not fastened to solid bedrock.
Rime and icing up to approximately 20 cm thick have been observed to accumulate assymmet-
rically on the radome (J. Hólmjárn, personal communication 2002). However, it is unlikely that
this explains the long-term vertical offsets observed in the winter of 2001 to 2002 because in
that case we would expect the variations to be more rapid. If the spurious signals observed
at SKRO were from the earth, say from a magma chamber beneath Bárðarbunga volcano, we
would also expect to see long term changes in the horizontal components.
HOFN seems to be moving at a highly variable rate (Figure 10), relative to REYK, towards
east. This is also observed at other stations in the east component, e.g. at VOGS (Figure 20).
When a linear trend is removed from the time series, an annual oscillation in the coordinates
is revealed (Figure 6). The signal is most obvious in the east component. The amplitudes vary
from 3 to 8 mm between stations, and all the stations are moving in phase. This phenomenon
is not observed in the north component of the time series. It is uncertain, at this stage, what the
seasonal signal is meaning and if it is real at all. The seasonal signal could be a measurement
artifact, caused by movement of the reference station REYK – or to be more precise, caused by
movement of the building that REYK is on top of. The periodic signal could also originate from
the data processing, e.g. due to unsufficient modelling of troposphere or tides (solid earth and
pole) (Hugentobler et al. 2001).
Periodic variations in GPS time series have been observed in numerous other studies. Mura-
kami and Miyazaki (2001) report observations of periodic signals in GPS time series in Japan
36
and relate them to major earthquake occurrence. The annual amplitudes in their study are of
order of 3-9 mm in the horizontal components and are in phase. The authors consider various
error sources and conclude that the periodicity is a real signal from the solid part of the earth,
although the driving mechanism remains unknown. Heinert and Perlt (2002) suggest that sea-
sonal variations in the positions at REYK and HOFN are related to loss of seismic energy in
the SISZ. Poutanen et al. (2001) report on periodic signals in GPS time series from Finland
with periods from one day to one year. They propose that some of the periodicities are due to
modelling error in tropospheric parameters, but admit that the physical origin of many periods
is uncertain. Heki (2001) concludes that seasonal variation in Northeast Japan are caused by
snow load.
The subject of seasonal variations in the time series needs to be studied in more detail before
we can conclude if the signal is from the crust or just a measurement artifact.
37
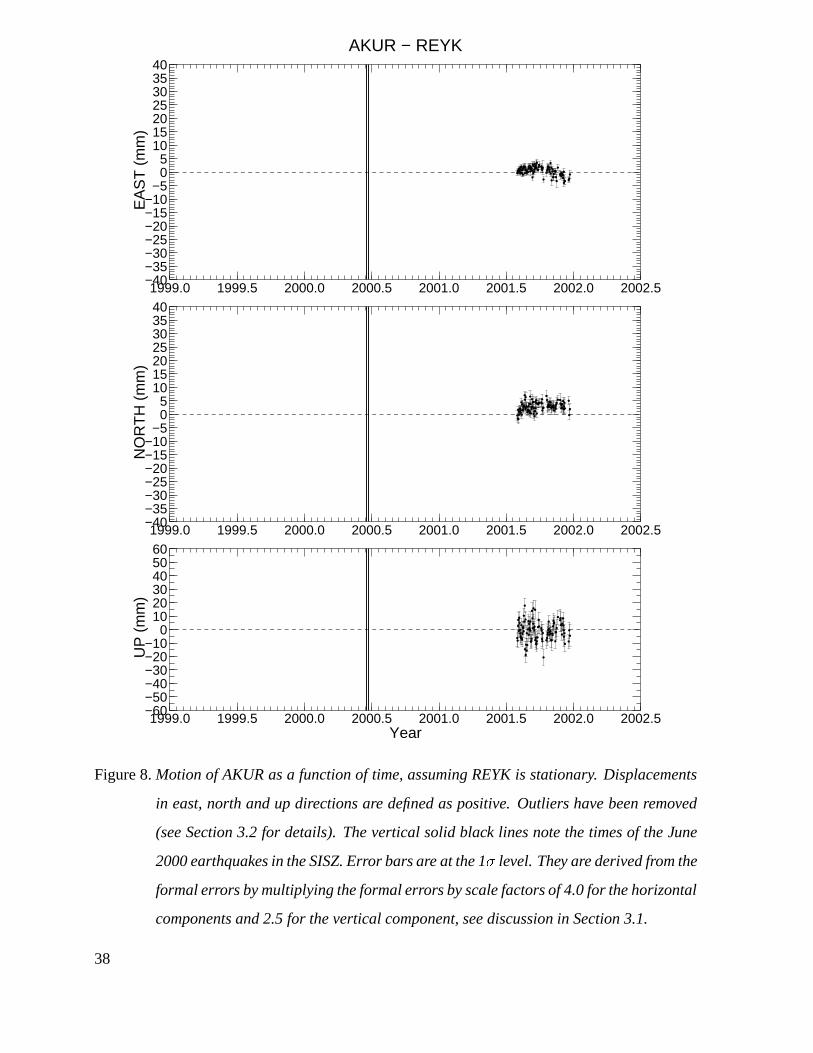
−60−50−40−30−20−10
0102030405060
UP
(m
m)
1999.0 1999.5 2000.0 2000.5 2001.0 2001.5 2002.0 2002.5Year
−40−35−30−25−20−15−10
−505
10152025303540
NO
RT
H (
mm
)
1999.0 1999.5 2000.0 2000.5 2001.0 2001.5 2002.0 2002.5
AKUR − REYK
−40−35−30−25−20−15−10
−505
10152025303540
EA
ST
(m
m)
1999.0 1999.5 2000.0 2000.5 2001.0 2001.5 2002.0 2002.5
Figure 8.Motion of AKUR as a function of time, assuming REYK is stationary. Displacements
in east, north and up directions are defined as positive. Outliers have been removed
(see Section 3.2 for details). The vertical solid black lines note the times of the June
2000 earthquakes in the SISZ. Error bars are at the 1 level. They are derived from the
formal errors by multiplying the formal errors by scale factors of 4.0 for the horizontal
components and 2.5 for the vertical component, see discussion in Section 3.1.
38
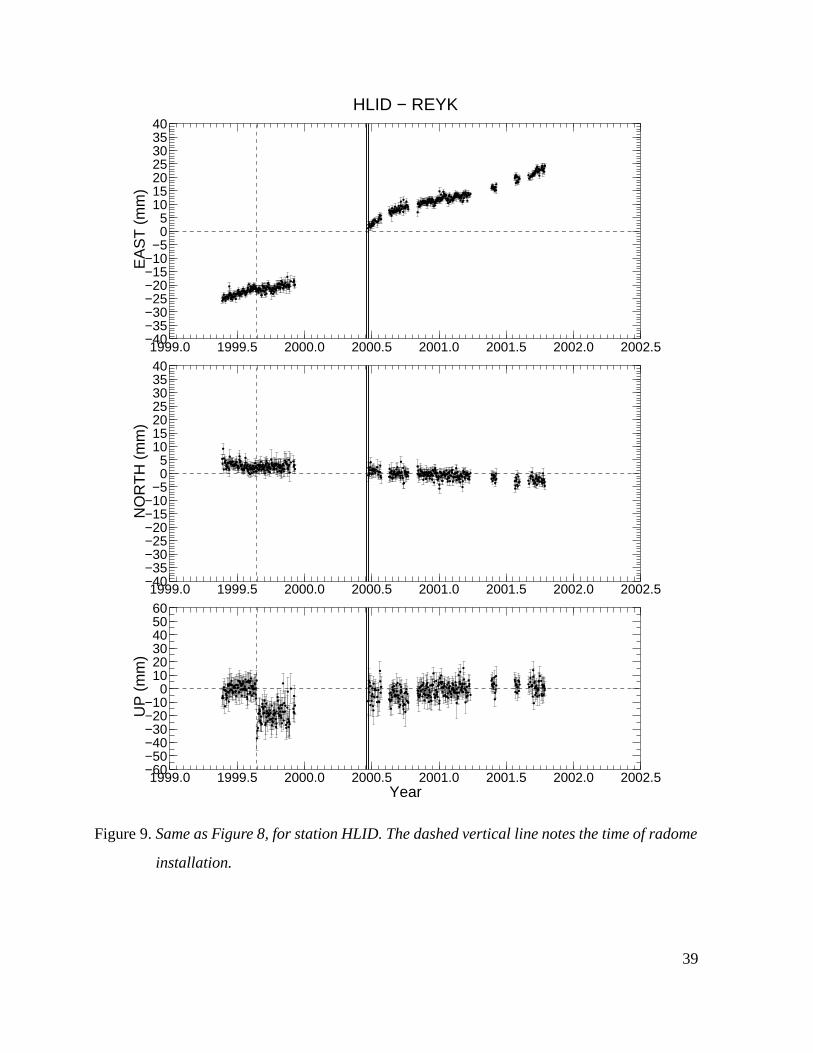
−60−50−40−30−20−10
0102030405060
UP
(m
m)
1999.0 1999.5 2000.0 2000.5 2001.0 2001.5 2002.0 2002.5Year
−40−35−30−25−20−15−10
−505
10152025303540
NO
RT
H (
mm
)
1999.0 1999.5 2000.0 2000.5 2001.0 2001.5 2002.0 2002.5
HLID − REYK
−40−35−30−25−20−15−10
−505
10152025303540
EA
ST
(m
m)
1999.0 1999.5 2000.0 2000.5 2001.0 2001.5 2002.0 2002.5
Figure 9.Same as Figure 8, for station HLID. The dashed vertical line notes the time of radome
installation.
39
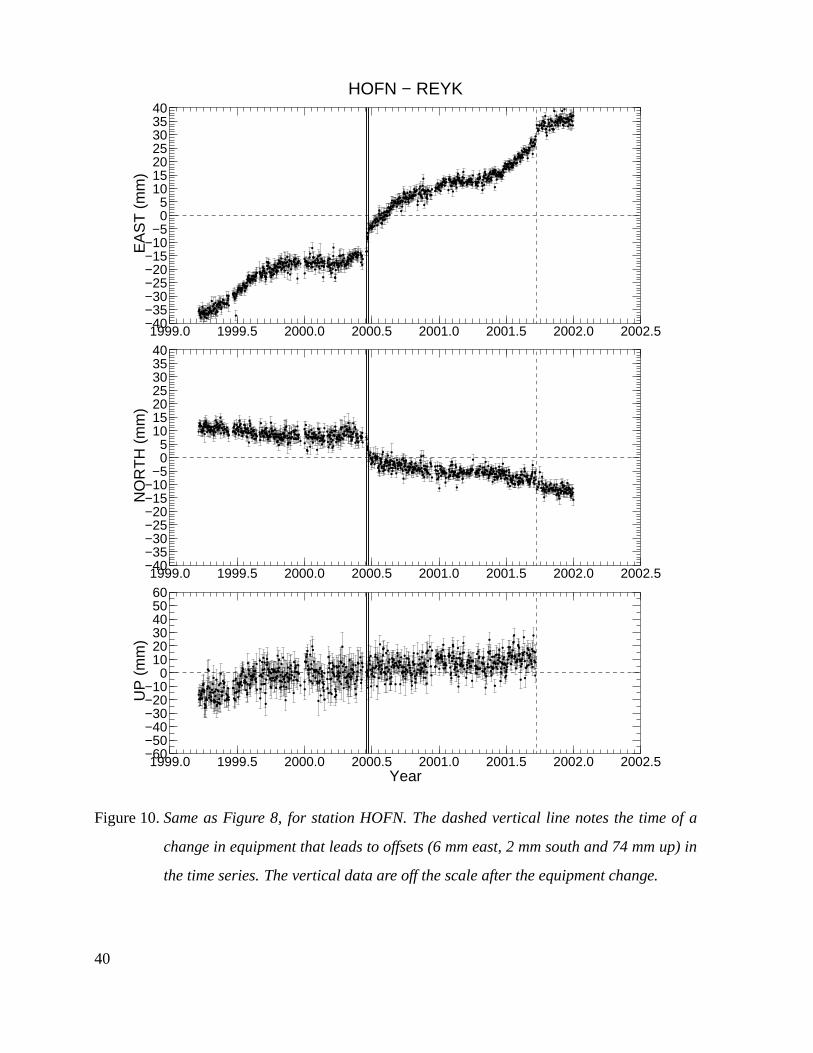
−60−50−40−30−20−10
0102030405060
UP
(m
m)
1999.0 1999.5 2000.0 2000.5 2001.0 2001.5 2002.0 2002.5Year
−40−35−30−25−20−15−10
−505
10152025303540
NO
RT
H (
mm
)
1999.0 1999.5 2000.0 2000.5 2001.0 2001.5 2002.0 2002.5
HOFN − REYK
−40−35−30−25−20−15−10
−505
10152025303540
EA
ST
(m
m)
1999.0 1999.5 2000.0 2000.5 2001.0 2001.5 2002.0 2002.5
Figure 10.Same as Figure 8, for station HOFN. The dashed vertical line notes the time of a
change in equipment that leads to offsets (6 mm east, 2 mm south and 74 mm up) in
the time series. The vertical data are off the scale after the equipment change.
40
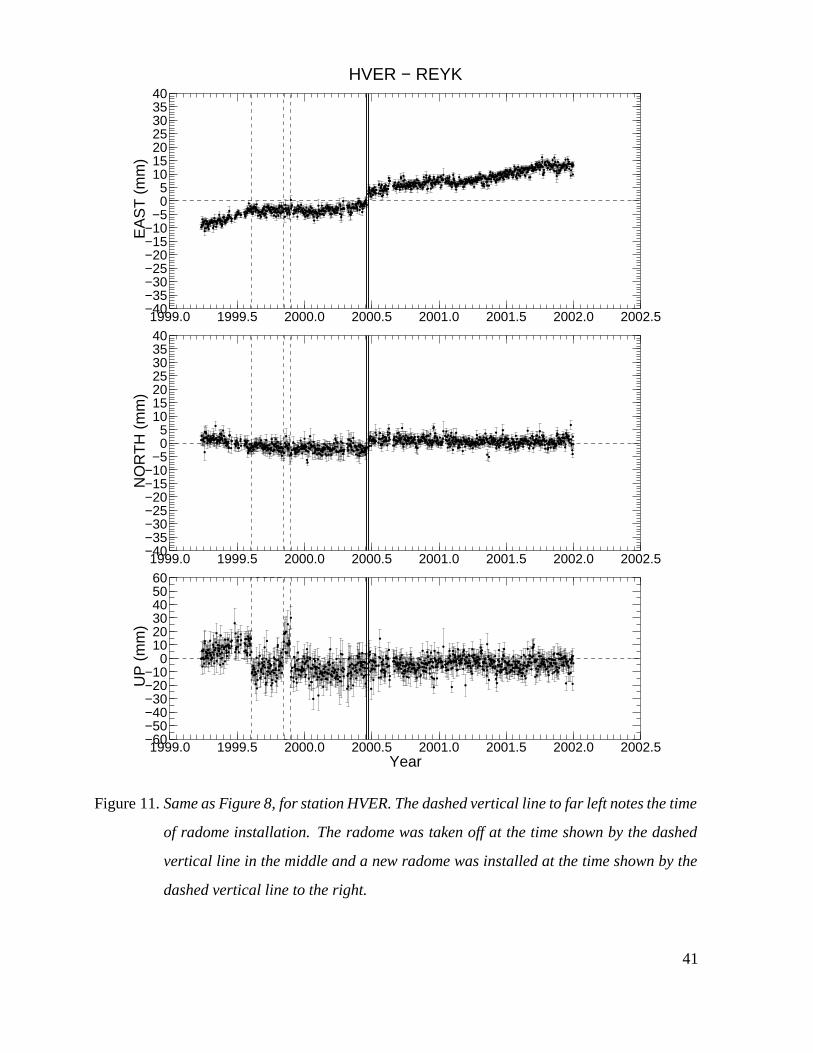
−60−50−40−30−20−10
0102030405060
UP
(m
m)
1999.0 1999.5 2000.0 2000.5 2001.0 2001.5 2002.0 2002.5Year
−40−35−30−25−20−15−10
−505
10152025303540
NO
RT
H (
mm
)
1999.0 1999.5 2000.0 2000.5 2001.0 2001.5 2002.0 2002.5
HVER − REYK
−40−35−30−25−20−15−10
−505
10152025303540
EA
ST
(m
m)
1999.0 1999.5 2000.0 2000.5 2001.0 2001.5 2002.0 2002.5
Figure 11.Same as Figure 8, for station HVER. The dashed vertical line to far left notes the time
of radome installation. The radome was taken off at the time shown by the dashed
vertical line in the middle and a new radome was installed at the time shown by the
dashed vertical line to the right.
41
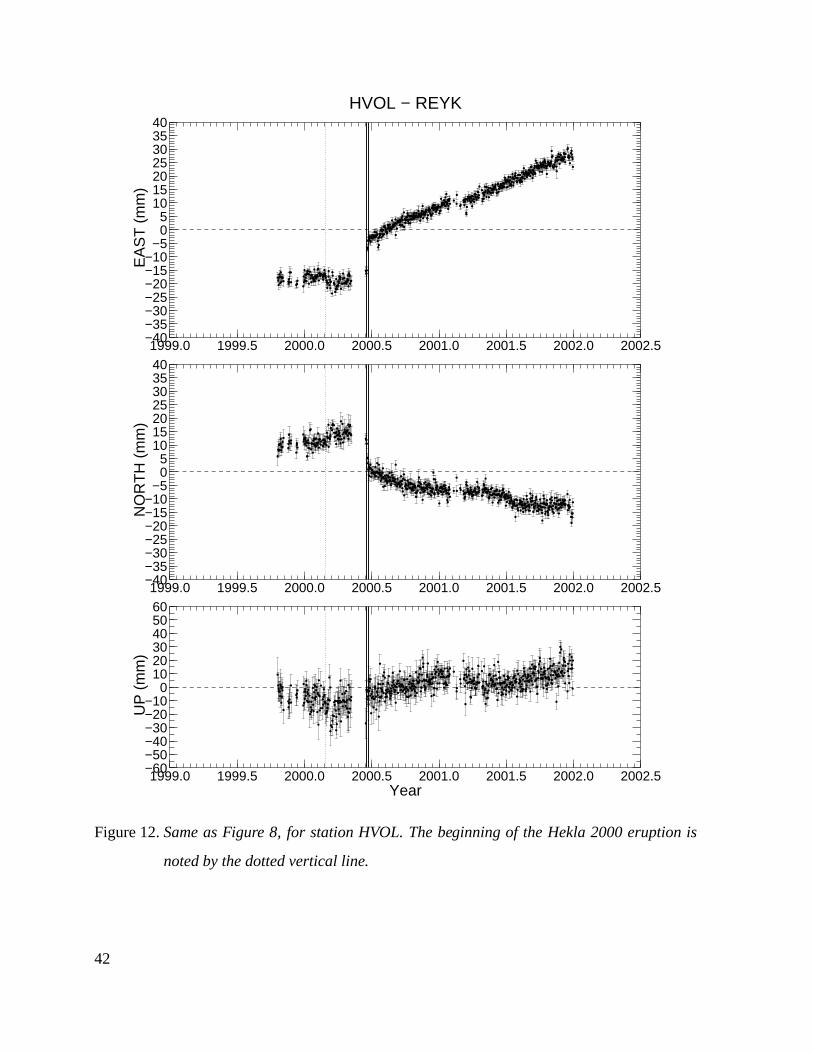
−60−50−40−30−20−10
0102030405060
UP
(m
m)
1999.0 1999.5 2000.0 2000.5 2001.0 2001.5 2002.0 2002.5Year
−40−35−30−25−20−15−10
−505
10152025303540
NO
RT
H (
mm
)
1999.0 1999.5 2000.0 2000.5 2001.0 2001.5 2002.0 2002.5
HVOL − REYK
−40−35−30−25−20−15−10
−505
10152025303540
EA
ST
(m
m)
1999.0 1999.5 2000.0 2000.5 2001.0 2001.5 2002.0 2002.5
Figure 12.Same as Figure 8, for station HVOL. The beginning of the Hekla 2000 eruption is
noted by the dotted vertical line.
42
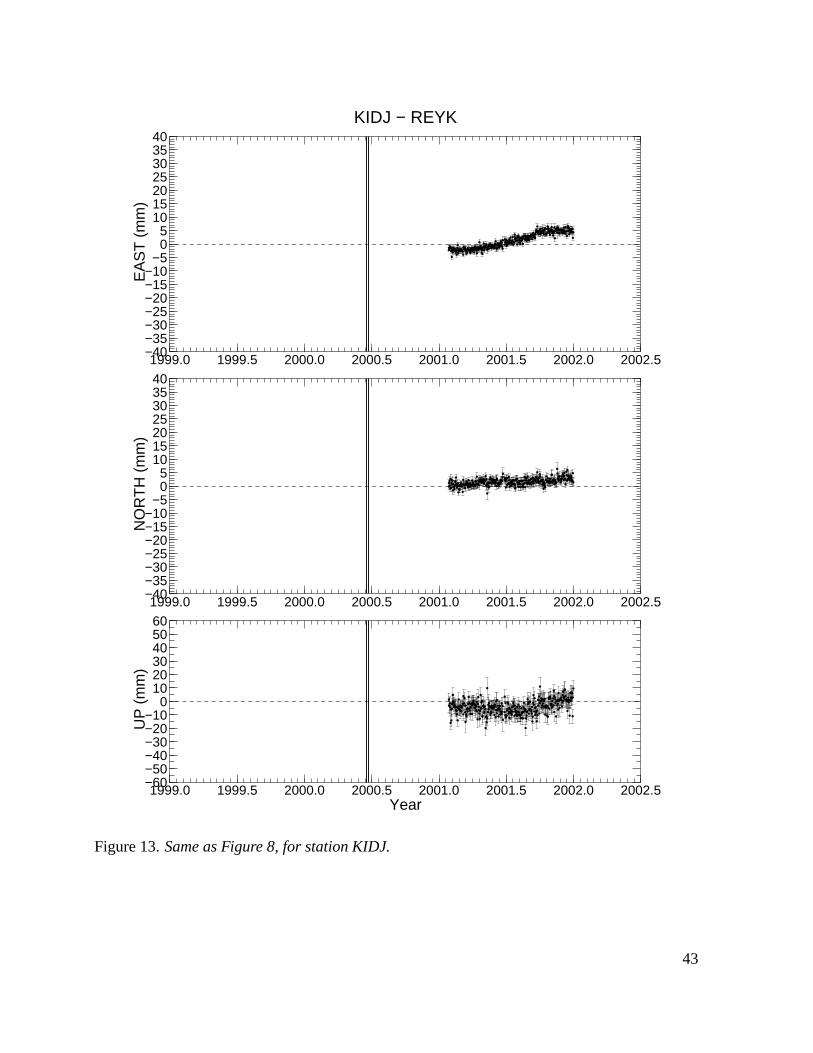
−60−50−40−30−20−10
0102030405060
UP
(m
m)
1999.0 1999.5 2000.0 2000.5 2001.0 2001.5 2002.0 2002.5Year
−40−35−30−25−20−15−10
−505
10152025303540
NO
RT
H (
mm
)
1999.0 1999.5 2000.0 2000.5 2001.0 2001.5 2002.0 2002.5
KIDJ − REYK
−40−35−30−25−20−15−10
−505
10152025303540
EA
ST
(m
m)
1999.0 1999.5 2000.0 2000.5 2001.0 2001.5 2002.0 2002.5
Figure 13.Same as Figure 8, for station KIDJ.
43
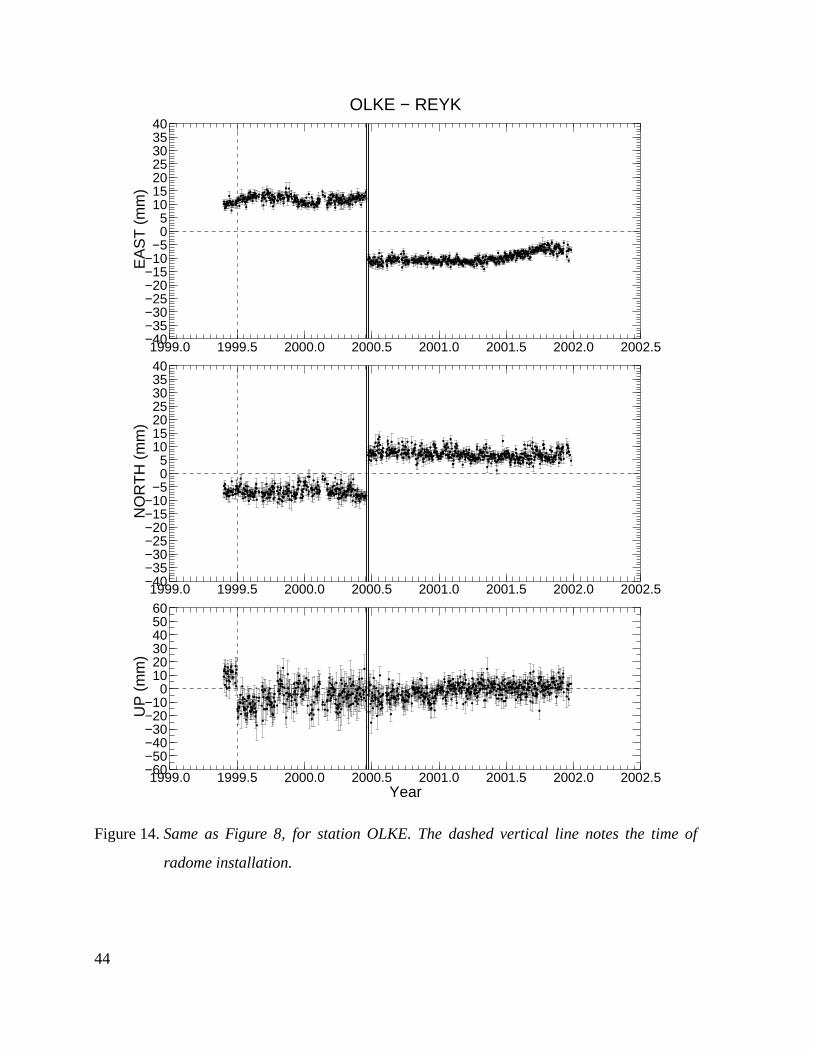
−60−50−40−30−20−10
0102030405060
UP
(m
m)
1999.0 1999.5 2000.0 2000.5 2001.0 2001.5 2002.0 2002.5Year
−40−35−30−25−20−15−10
−505
10152025303540
NO
RT
H (
mm
)
1999.0 1999.5 2000.0 2000.5 2001.0 2001.5 2002.0 2002.5
OLKE − REYK
−40−35−30−25−20−15−10
−505
10152025303540
EA
ST
(m
m)
1999.0 1999.5 2000.0 2000.5 2001.0 2001.5 2002.0 2002.5
Figure 14.Same as Figure 8, for station OLKE. The dashed vertical line notes the time of
radome installation.
44
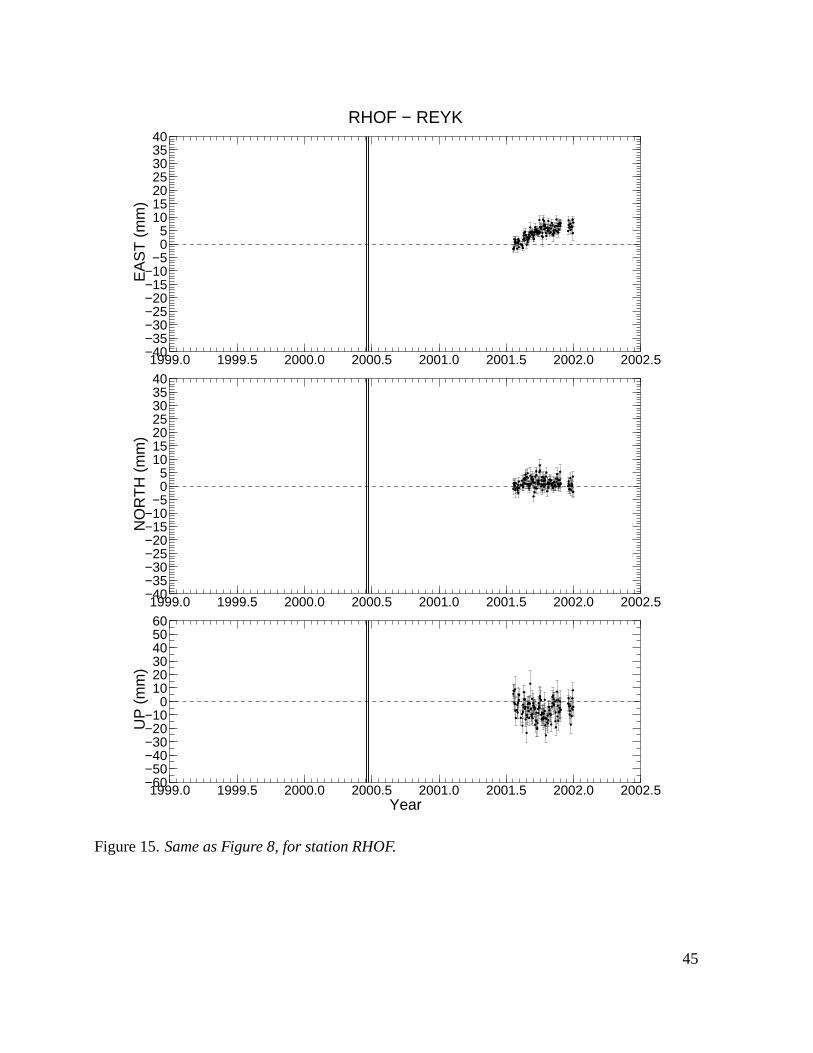
−60−50−40−30−20−10
0102030405060
UP
(m
m)
1999.0 1999.5 2000.0 2000.5 2001.0 2001.5 2002.0 2002.5Year
−40−35−30−25−20−15−10
−505
10152025303540
NO
RT
H (
mm
)
1999.0 1999.5 2000.0 2000.5 2001.0 2001.5 2002.0 2002.5
RHOF − REYK
−40−35−30−25−20−15−10
−505
10152025303540
EA
ST
(m
m)
1999.0 1999.5 2000.0 2000.5 2001.0 2001.5 2002.0 2002.5
Figure 15.Same as Figure 8, for station RHOF.
45
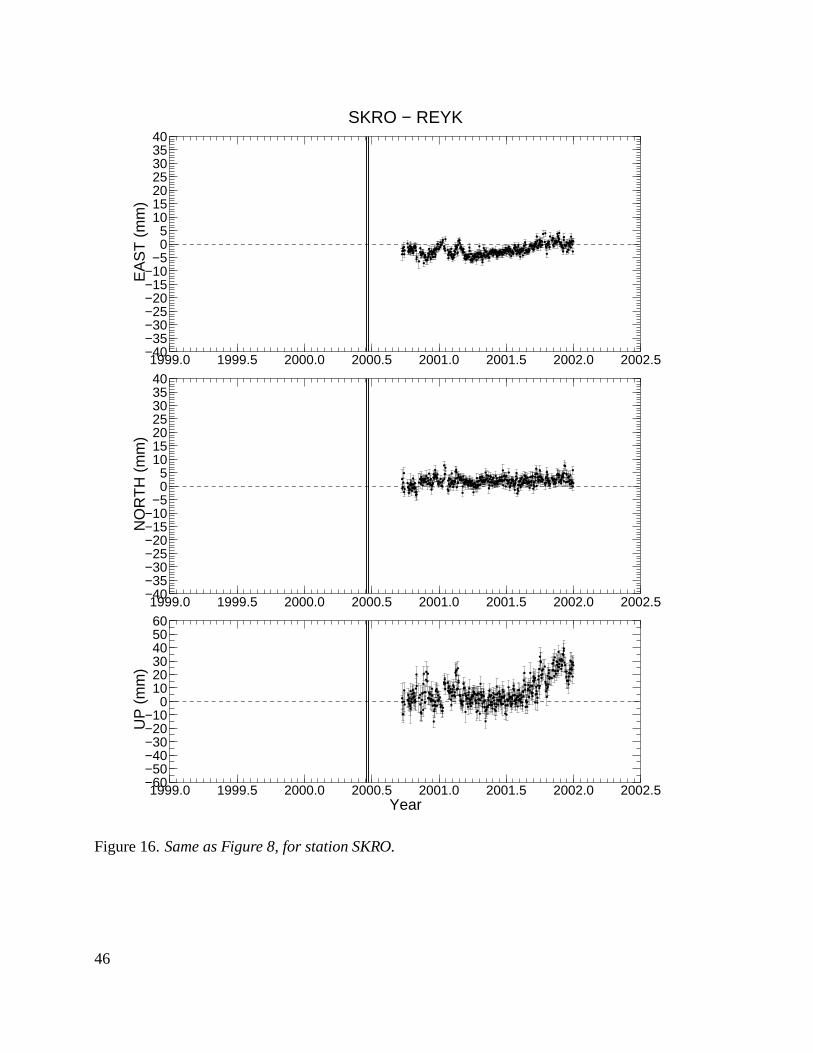
−60−50−40−30−20−10
0102030405060
UP
(m
m)
1999.0 1999.5 2000.0 2000.5 2001.0 2001.5 2002.0 2002.5Year
−40−35−30−25−20−15−10
−505
10152025303540
NO
RT
H (
mm
)
1999.0 1999.5 2000.0 2000.5 2001.0 2001.5 2002.0 2002.5
SKRO − REYK
−40−35−30−25−20−15−10
−505
10152025303540
EA
ST
(m
m)
1999.0 1999.5 2000.0 2000.5 2001.0 2001.5 2002.0 2002.5
Figure 16.Same as Figure 8, for station SKRO.
46
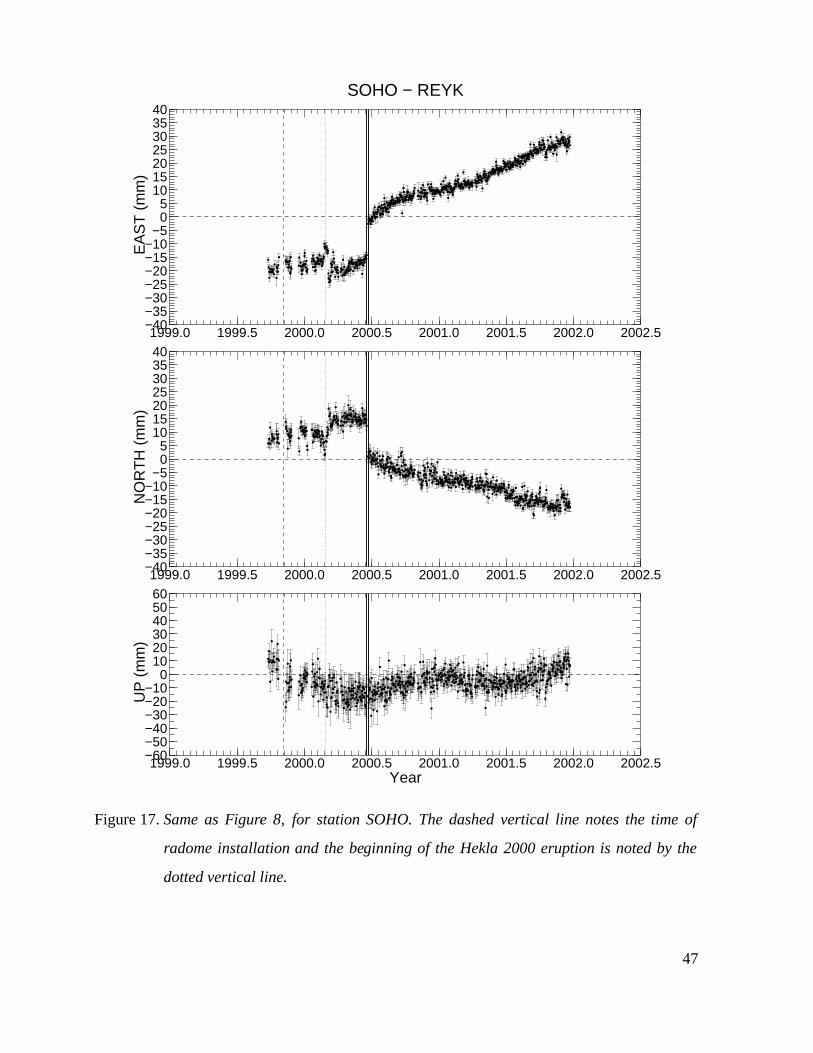
−60−50−40−30−20−10
0102030405060
UP
(m
m)
1999.0 1999.5 2000.0 2000.5 2001.0 2001.5 2002.0 2002.5Year
−40−35−30−25−20−15−10
−505
10152025303540
NO
RT
H (
mm
)
1999.0 1999.5 2000.0 2000.5 2001.0 2001.5 2002.0 2002.5
SOHO − REYK
−40−35−30−25−20−15−10
−505
10152025303540
EA
ST
(m
m)
1999.0 1999.5 2000.0 2000.5 2001.0 2001.5 2002.0 2002.5
Figure 17.Same as Figure 8, for station SOHO. The dashed vertical line notes the time of
radome installation and the beginning of the Hekla 2000 eruption is noted by the
dotted vertical line.
47
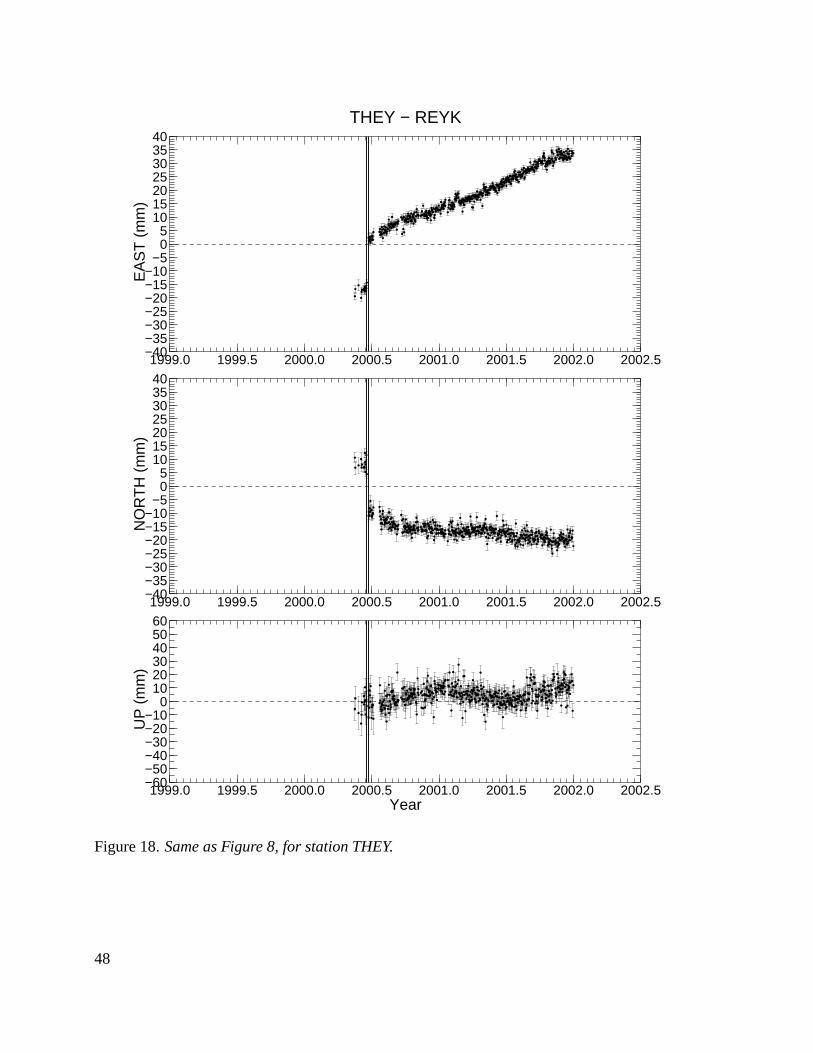
−60−50−40−30−20−10
0102030405060
UP
(m
m)
1999.0 1999.5 2000.0 2000.5 2001.0 2001.5 2002.0 2002.5Year
−40−35−30−25−20−15−10
−505
10152025303540
NO
RT
H (
mm
)
1999.0 1999.5 2000.0 2000.5 2001.0 2001.5 2002.0 2002.5
THEY − REYK
−40−35−30−25−20−15−10
−505
10152025303540
EA
ST
(m
m)
1999.0 1999.5 2000.0 2000.5 2001.0 2001.5 2002.0 2002.5
Figure 18.Same as Figure 8, for station THEY.
48
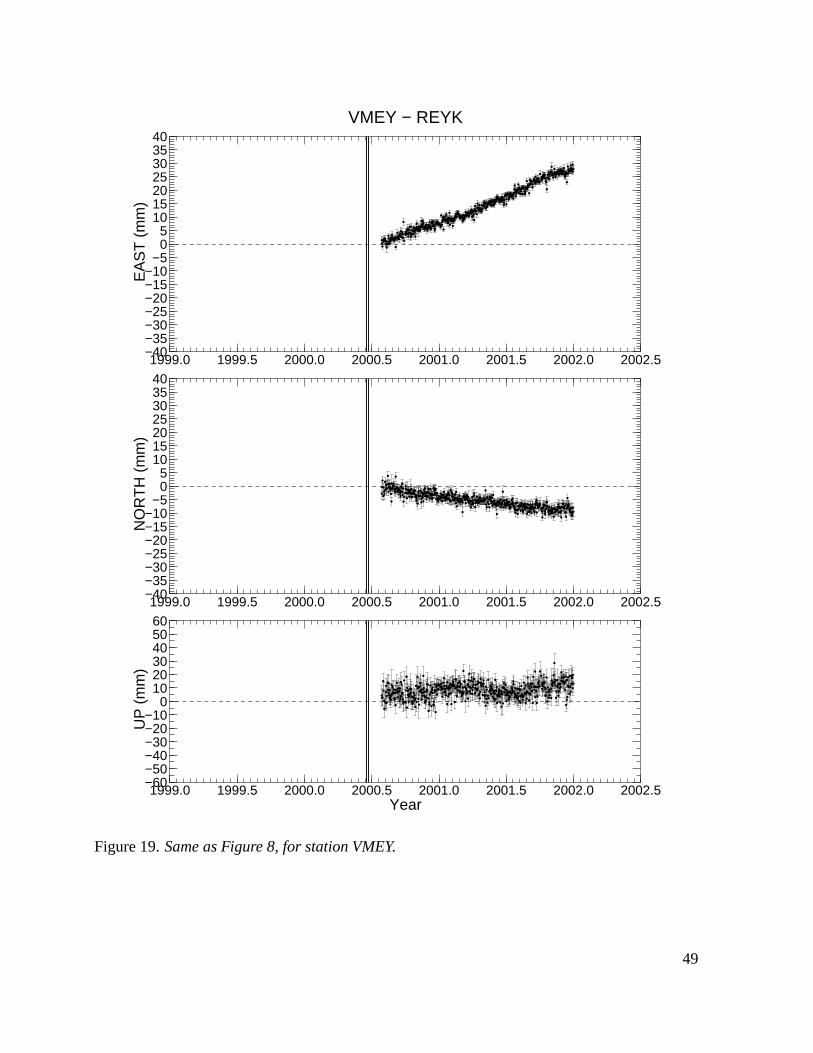
−60−50−40−30−20−10
0102030405060
UP
(m
m)
1999.0 1999.5 2000.0 2000.5 2001.0 2001.5 2002.0 2002.5Year
−40−35−30−25−20−15−10
−505
10152025303540
NO
RT
H (
mm
)
1999.0 1999.5 2000.0 2000.5 2001.0 2001.5 2002.0 2002.5
VMEY − REYK
−40−35−30−25−20−15−10
−505
10152025303540
EA
ST
(m
m)
1999.0 1999.5 2000.0 2000.5 2001.0 2001.5 2002.0 2002.5
Figure 19.Same as Figure 8, for station VMEY.
49

−60−50−40−30−20−10
0102030405060
UP
(m
m)
1999.0 1999.5 2000.0 2000.5 2001.0 2001.5 2002.0 2002.5Year
−40−35−30−25−20−15−10
−505
10152025303540
NO
RT
H (
mm
)
1999.0 1999.5 2000.0 2000.5 2001.0 2001.5 2002.0 2002.5
VOGS − REYK
−40−35−30−25−20−15−10
−505
10152025303540
EA
ST
(m
m)
1999.0 1999.5 2000.0 2000.5 2001.0 2001.5 2002.0 2002.5
Figure 20.Same as Figure 8, for station VOGS. The dashed vertical line notes the time of
radome installation.
50
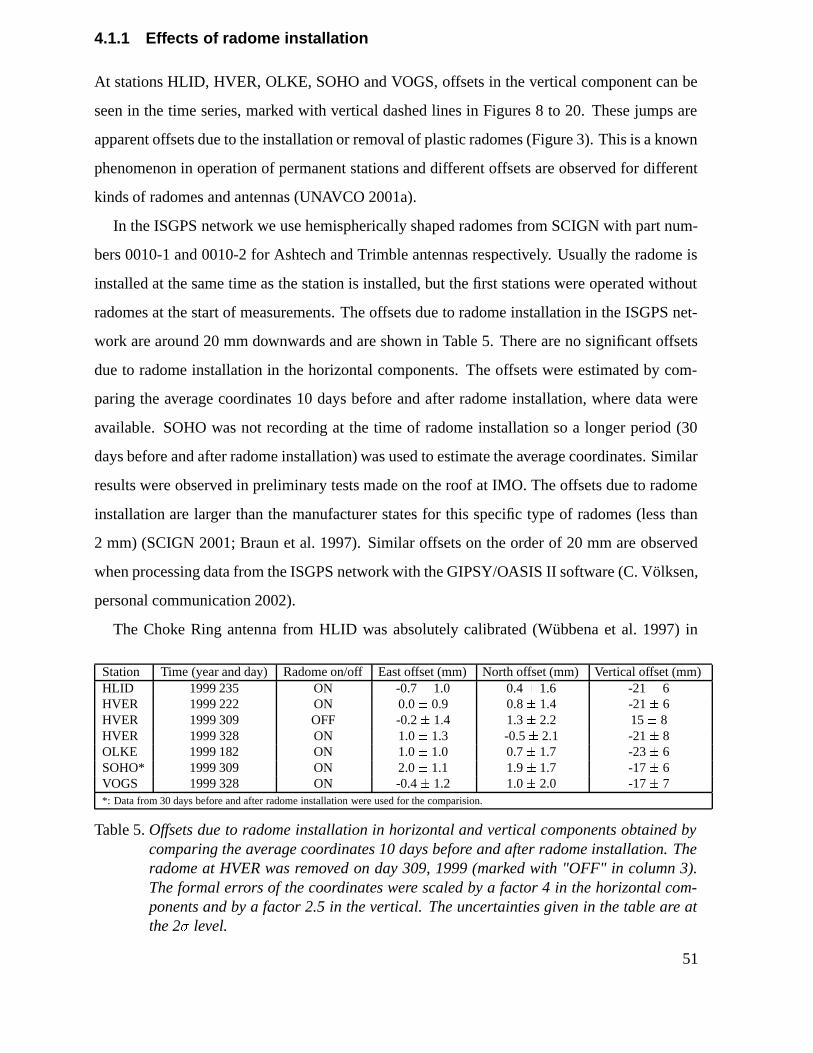
4.1.1 Effects of radome installation
At stations HLID, HVER, OLKE, SOHO and VOGS, offsets in the vertical component can be
seen in the time series, marked with vertical dashed lines in Figures 8 to 20. These jumps are
apparent offsets due to the installation or removal of plastic radomes (Figure 3). This is a known
phenomenon in operation of permanent stations and different offsets are observed for different
kinds of radomes and antennas (UNAVCO 2001a).
In the ISGPS network we use hemispherically shaped radomes from SCIGN with part num-
bers 0010-1 and 0010-2 for Ashtech and Trimble antennas respectively. Usually the radome is
installed at the same time as the station is installed, but the first stations were operated without
radomes at the start of measurements. The offsets due to radome installation in the ISGPS net-
work are around 20 mm downwards and are shown in Table 5. There are no significant offsets
due to radome installation in the horizontal components. The offsets were estimated by com-
paring the average coordinates 10 days before and after radome installation, where data were
available. SOHO was not recording at the time of radome installation so a longer period (30
days before and after radome installation) was used to estimate the average coordinates. Similar
results were observed in preliminary tests made on the roof at IMO. The offsets due to radome
installation are larger than the manufacturer states for this specific type of radomes (less than
2 mm) (SCIGN 2001; Braun et al. 1997). Similar offsets on the order of 20 mm are observed
when processing data from the ISGPS network with the GIPSY/OASIS II software (C. Völksen,
personal communication 2002).
The Choke Ring antenna from HLID was absolutely calibrated (Wübbena et al. 1997) in
Station Time (year and day) Radome on/off East offset (mm) North offset (mm) Vertical offset (mm)HLID 1999 235 ON -0.7� 1.0 0.4� 1.6 -21� 6HVER 1999 222 ON 0.0� 0.9 0.8� 1.4 -21� 6HVER 1999 309 OFF -0.2� 1.4 1.3� 2.2 15� 8HVER 1999 328 ON 1.0� 1.3 -0.5� 2.1 -21� 8OLKE 1999 182 ON 1.0� 1.0 0.7� 1.7 -23� 6SOHO* 1999 309 ON 2.0� 1.1 1.9� 1.7 -17� 6VOGS 1999 328 ON -0.4� 1.2 1.0� 2.0 -17� 7*: Data from 30 days before and after radome installation were used for the comparision.
Table 5.Offsets due to radome installation in horizontal and vertical components obtained bycomparing the average coordinates 10 days before and after radome installation. Theradome at HVER was removed on day 309, 1999 (marked with "OFF" in column 3).The formal errors of the coordinates were scaled by a factor 4 in the horizontal com-ponents and by a factor 2.5 in the vertical. The uncertainties given in the table are atthe 2 level.
51
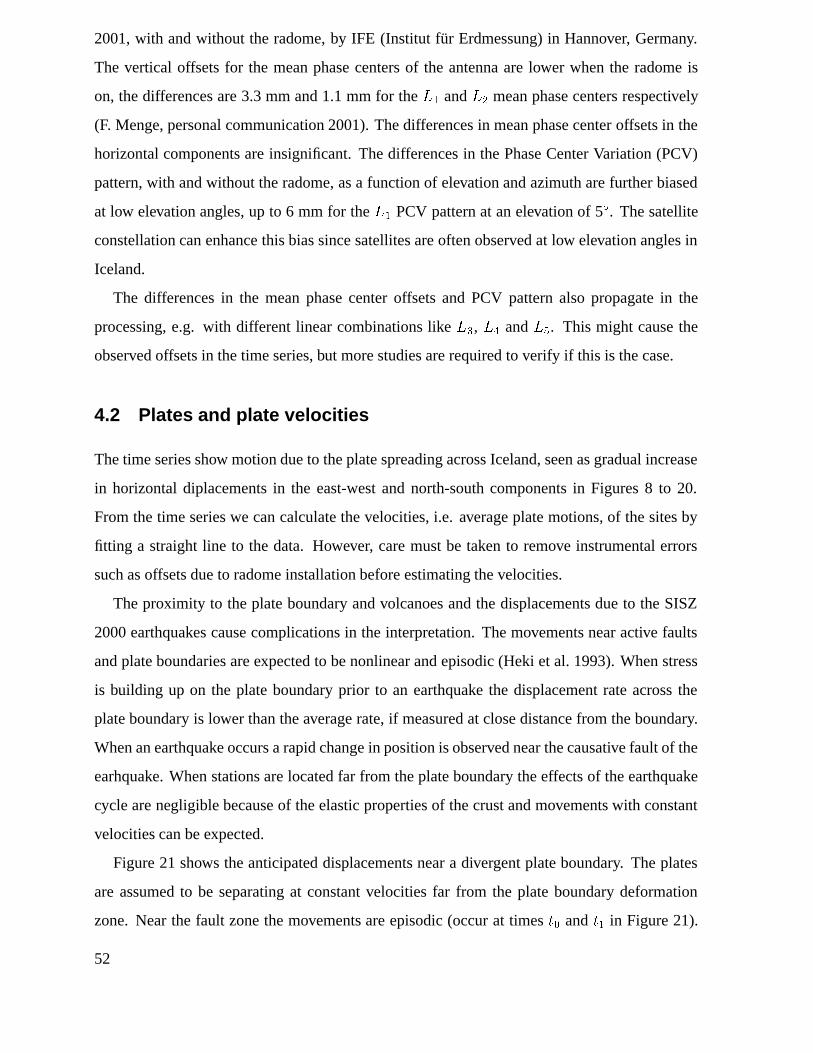
2001, with and without the radome, by IFE (Institut für Erdmessung) in Hannover, Germany.
The vertical offsets for the mean phase centers of the antenna are lower when the radome is
on, the differences are 3.3 mm and 1.1 mm for the�� and�� mean phase centers respectively
(F. Menge, personal communication 2001). The differences in mean phase center offsets in the
horizontal components are insignificant. The differences in the Phase Center Variation (PCV)
pattern, with and without the radome, as a function of elevation and azimuth are further biased
at low elevation angles, up to 6 mm for the�� PCV pattern at an elevation of 5Æ. The satellite
constellation can enhance this bias since satellites are often observed at low elevation angles in
Iceland.
The differences in the mean phase center offsets and PCV pattern also propagate in the
processing, e.g. with different linear combinations like��, �� and��. This might cause the
observed offsets in the time series, but more studies are required to verify if this is the case.
4.2 Plates and plate velocities
The time series show motion due to the plate spreading across Iceland, seen as gradual increase
in horizontal diplacements in the east-west and north-south components in Figures 8 to 20.
From the time series we can calculate the velocities, i.e. average plate motions, of the sites by
fitting a straight line to the data. However, care must be taken to remove instrumental errors
such as offsets due to radome installation before estimating the velocities.
The proximity to the plate boundary and volcanoes and the displacements due to the SISZ
2000 earthquakes cause complications in the interpretation. The movements near active faults
and plate boundaries are expected to be nonlinear and episodic (Heki et al. 1993). When stress
is building up on the plate boundary prior to an earthquake the displacement rate across the
plate boundary is lower than the average rate, if measured at close distance from the boundary.
When an earthquake occurs a rapid change in position is observed near the causative fault of the
earhquake. When stations are located far from the plate boundary the effects of the earthquake
cycle are negligible because of the elastic properties of the crust and movements with constant
velocities can be expected.
Figure 21 shows the anticipated displacements near a divergent plate boundary. The plates
are assumed to be separating at constant velocities far from the plate boundary deformation
zone. Near the fault zone the movements are episodic (occur at times�� and�� in Figure 21).
52
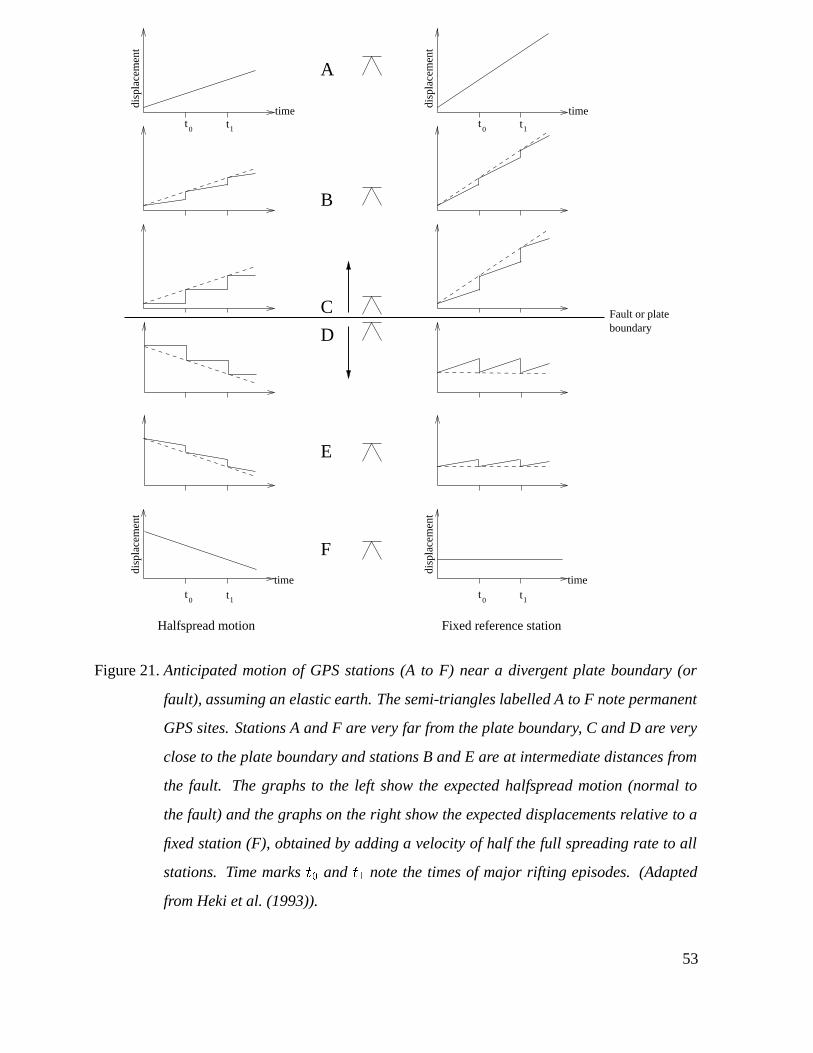
t0
t1
time
disp
lace
men
t
t0
t1
time
disp
lace
men
t
t0
t1
t0
t1
time
disp
lace
men
t
time
disp
lace
men
t
Halfspread motion Fixed reference station
Fault or plateboundary
A
B
D
E
F
C
Figure 21.Anticipated motion of GPS stations (A to F) near a divergent plate boundary (or
fault), assuming an elastic earth. The semi-triangles labelled A to F note permanent
GPS sites. Stations A and F are very far from the plate boundary, C and D are very
close to the plate boundary and stations B and E are at intermediate distances from
the fault. The graphs to the left show the expected halfspread motion (normal to
the fault) and the graphs on the right show the expected displacements relative to a
fixed station (F), obtained by adding a velocity of half the full spreading rate to all
stations. Time marks�� and �� note the times of major rifting episodes. (Adapted
from Heki et al. (1993)).
53
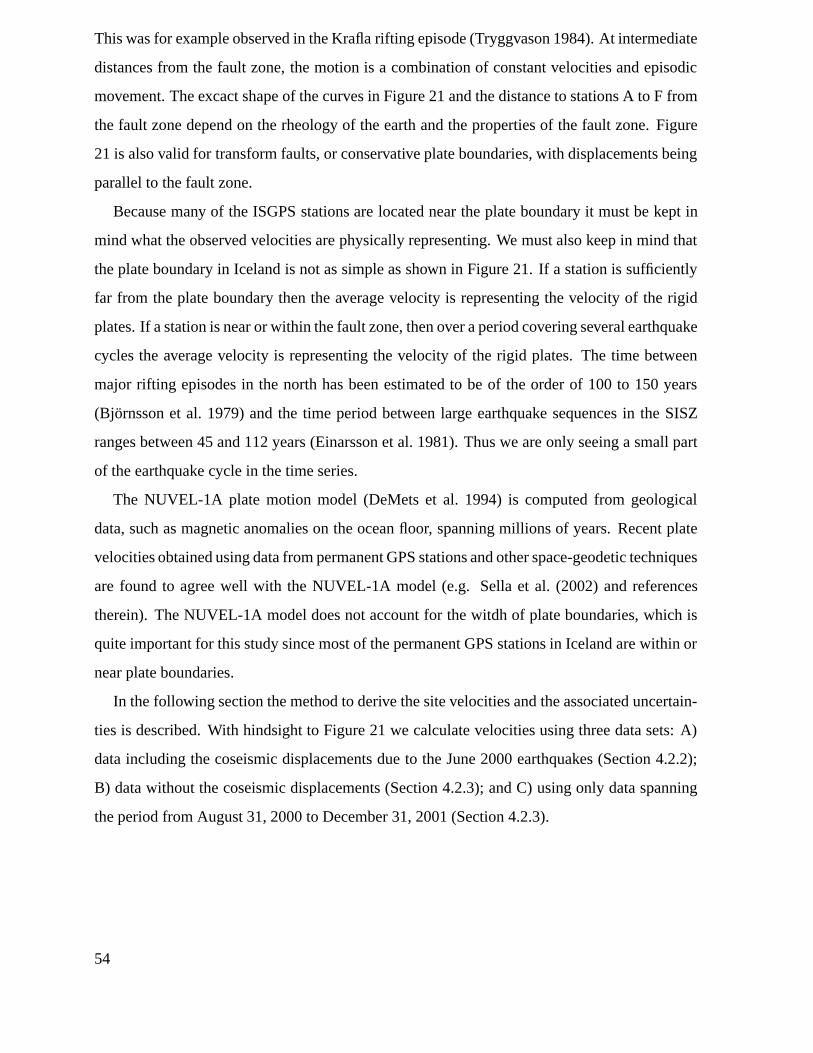
This was for example observed in the Krafla rifting episode (Tryggvason 1984). At intermediate
distances from the fault zone, the motion is a combination of constant velocities and episodic
movement. The excact shape of the curves in Figure 21 and the distance to stations A to F from
the fault zone depend on the rheology of the earth and the properties of the fault zone. Figure
21 is also valid for transform faults, or conservative plate boundaries, with displacements being
parallel to the fault zone.
Because many of the ISGPS stations are located near the plate boundary it must be kept in
mind what the observed velocities are physically representing. We must also keep in mind that
the plate boundary in Iceland is not as simple as shown in Figure 21. If a station is sufficiently
far from the plate boundary then the average velocity is representing the velocity of the rigid
plates. If a station is near or within the fault zone, then over a period covering several earthquake
cycles the average velocity is representing the velocity of the rigid plates. The time between
major rifting episodes in the north has been estimated to be of the order of 100 to 150 years
(Björnsson et al. 1979) and the time period between large earthquake sequences in the SISZ
ranges between 45 and 112 years (Einarsson et al. 1981). Thus we are only seeing a small part
of the earthquake cycle in the time series.
The NUVEL-1A plate motion model (DeMets et al. 1994) is computed from geological
data, such as magnetic anomalies on the ocean floor, spanning millions of years. Recent plate
velocities obtained using data from permanent GPS stations and other space-geodetic techniques
are found to agree well with the NUVEL-1A model (e.g. Sella et al. (2002) and references
therein). The NUVEL-1A model does not account for the witdh of plate boundaries, which is
quite important for this study since most of the permanent GPS stations in Iceland are within or
near plate boundaries.
In the following section the method to derive the site velocities and the associated uncertain-
ties is described. With hindsight to Figure 21 we calculate velocities using three data sets: A)
data including the coseismic displacements due to the June 2000 earthquakes (Section 4.2.2);
B) data without the coseismic displacements (Section 4.2.3); and C) using only data spanning
the period from August 31, 2000 to December 31, 2001 (Section 4.2.3).
54
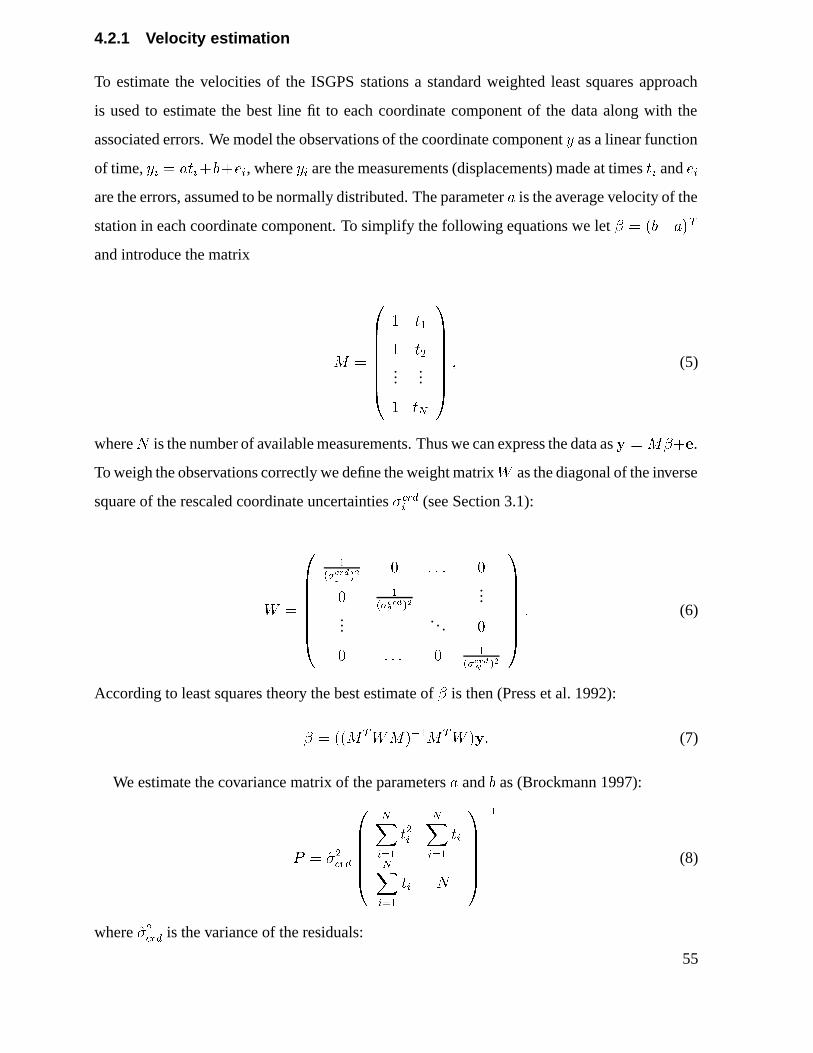
4.2.1 Velocity estimation
To estimate the velocities of the ISGPS stations a standard weighted least squares approach
is used to estimate the best line fit to each coordinate component of the data along with the
associated errors. We model the observations of the coordinate component� as a linear function
of time,�� � ��������, where�� are the measurements (displacements) made at times�� and��
are the errors, assumed to be normally distributed. The parameter� is the average velocity of the
station in each coordinate component. To simplify the following equations we let� � �� ���
and introduce the matrix
� �
��������
� ��
� ��...
...
� ��
��������
� (5)
where� is the number of available measurements. Thus we can express the data as� � ����.
To weigh the observations correctly we define the weight matrix� as the diagonal of the inverse
square of the rescaled coordinate uncertainties � �� (see Section 3.1):
� �
��������
������
���
� � � � �
� ������
���
......
. . . �
� � � � � ������
���
��������
� (6)
According to least squares theory the best estimate of� is then (Press et al. 1992):
� � ������������ ��� (7)
We estimate the covariance matrix of the parameters� and� as (Brockmann 1997):
� � � �� �
������
�����
���
�����
��
�����
�� �
������
��
(8)
where� �� � is the variance of the residuals:
55
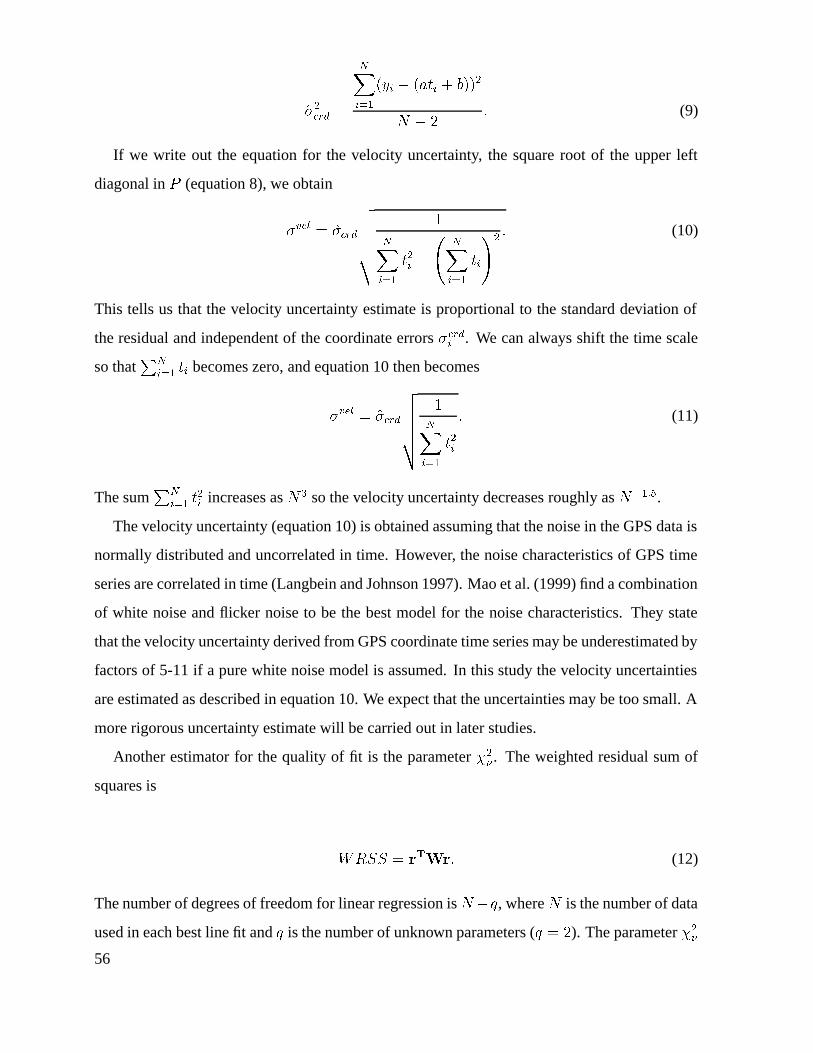
� �� � �
�����
��� � ���� � ����
� � � (9)
If we write out the equation for the velocity uncertainty, the square root of the upper left
diagonal in� (equation 8), we obtain
��� � � � �
��
�����
��� �
������
��
� � (10)
This tells us that the velocity uncertainty estimate is proportional to the standard deviation of
the residual and independent of the coordinate errors � �� . We can always shift the time scale
so that��
��� �� becomes zero, and equation 10 then becomes
��� � � � �
��
�����
���
� (11)
The sum��
��� ��� increases as�� so the velocity uncertainty decreases roughly as�����.
The velocity uncertainty (equation 10) is obtained assuming that the noise in the GPS data is
normally distributed and uncorrelated in time. However, the noise characteristics of GPS time
series are correlated in time (Langbein and Johnson 1997). Mao et al. (1999) find a combination
of white noise and flicker noise to be the best model for the noise characteristics. They state
that the velocity uncertainty derived from GPS coordinate time series may be underestimated by
factors of 5-11 if a pure white noise model is assumed. In this study the velocity uncertainties
are estimated as described in equation 10. We expect that the uncertainties may be too small. A
more rigorous uncertainty estimate will be carried out in later studies.
Another estimator for the quality of fit is the parameter��� . The weighted residual sum of
squares is
���� � ����� (12)
The number of degrees of freedom for linear regression is���, where� is the number of data
used in each best line fit and� is the number of unknown parameters (� � ). The parameter���
56
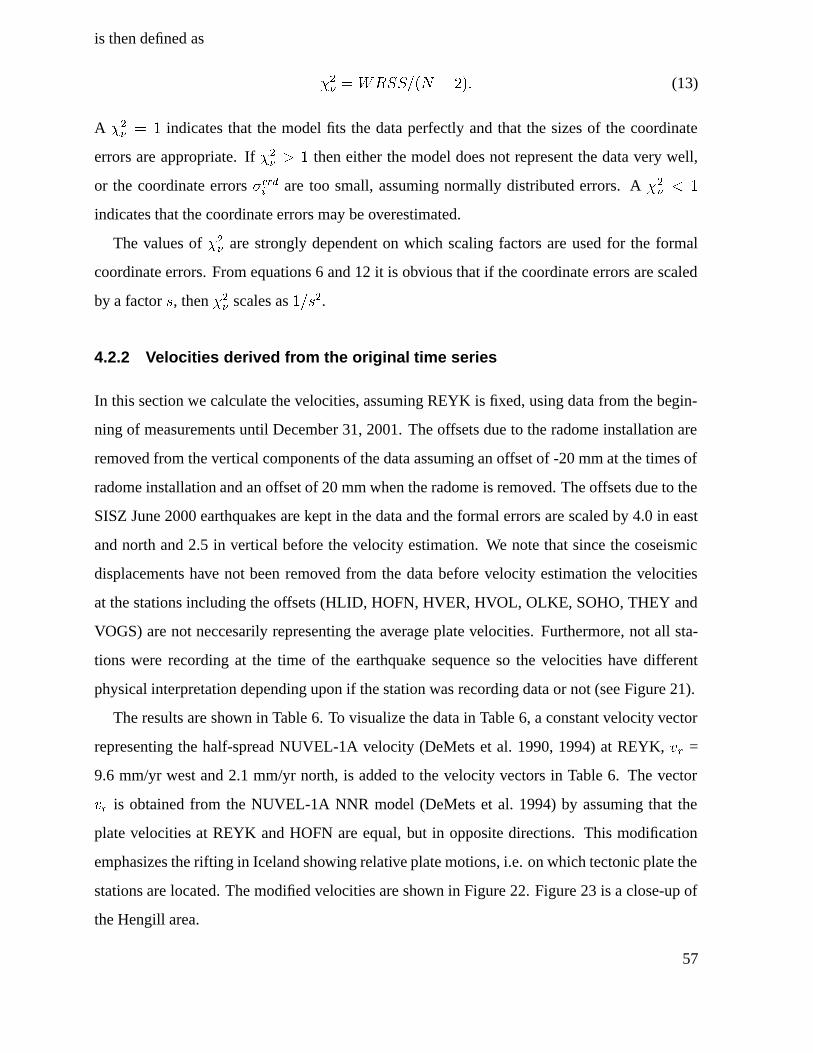
is then defined as
��� � ������� � �� (13)
A ��� � � indicates that the model fits the data perfectly and that the sizes of the coordinate
errors are appropriate. If��� � � then either the model does not represent the data very well,
or the coordinate errors � �� are too small, assuming normally distributed errors. A��� � �
indicates that the coordinate errors may be overestimated.
The values of��� are strongly dependent on which scaling factors are used for the formal
coordinate errors. From equations 6 and 12 it is obvious that if the coordinate errors are scaled
by a factor�, then��� scales as����.
4.2.2 Velocities derived from the original time series
In this section we calculate the velocities, assuming REYK is fixed, using data from the begin-
ning of measurements until December 31, 2001. The offsets due to the radome installation are
removed from the vertical components of the data assuming an offset of -20 mm at the times of
radome installation and an offset of 20 mm when the radome is removed. The offsets due to the
SISZ June 2000 earthquakes are kept in the data and the formal errors are scaled by 4.0 in east
and north and 2.5 in vertical before the velocity estimation. We note that since the coseismic
displacements have not been removed from the data before velocity estimation the velocities
at the stations including the offsets (HLID, HOFN, HVER, HVOL, OLKE, SOHO, THEY and
VOGS) are not neccesarily representing the average plate velocities. Furthermore, not all sta-
tions were recording at the time of the earthquake sequence so the velocities have different
physical interpretation depending upon if the station was recording data or not (see Figure 21).
The results are shown in Table 6. To visualize the data in Table 6, a constant velocity vector
representing the half-spread NUVEL-1A velocity (DeMets et al. 1990, 1994) at REYK, =
9.6 mm/yr west and 2.1 mm/yr north, is added to the velocity vectors in Table 6. The vector
is obtained from the NUVEL-1A NNR model (DeMets et al. 1994) by assuming that the
plate velocities at REYK and HOFN are equal, but in opposite directions. This modification
emphasizes the rifting in Iceland showing relative plate motions, i.e. on which tectonic plate the
stations are located. The modified velocities are shown in Figure 22. Figure 23 is a close-up of
the Hengill area.
57
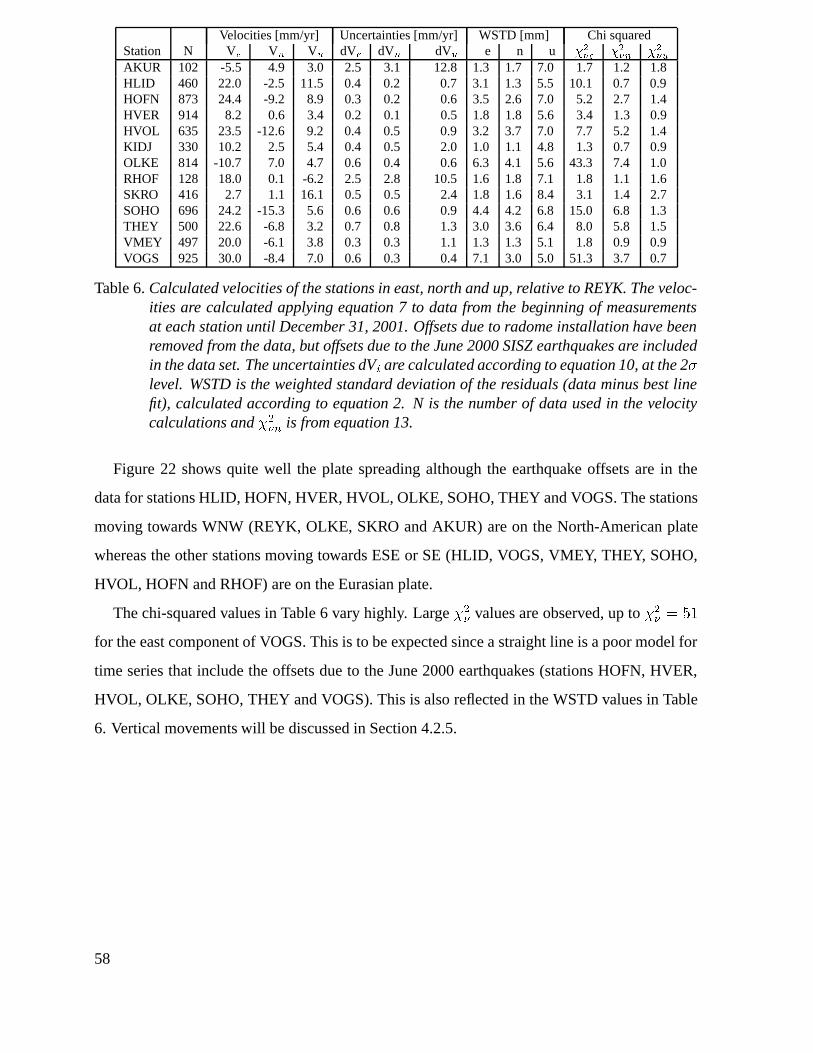
Velocities [mm/yr] Uncertainties [mm/yr] WSTD [mm] Chi squaredStation N V� V� V� dV� dV� dV� e n u �
�
����
����
��
AKUR 102 -5.5 4.9 3.0 2.5 3.1 12.8 1.3 1.7 7.0 1.7 1.2 1.8HLID 460 22.0 -2.5 11.5 0.4 0.2 0.7 3.1 1.3 5.5 10.1 0.7 0.9HOFN 873 24.4 -9.2 8.9 0.3 0.2 0.6 3.5 2.6 7.0 5.2 2.7 1.4HVER 914 8.2 0.6 3.4 0.2 0.1 0.5 1.8 1.8 5.6 3.4 1.3 0.9HVOL 635 23.5 -12.6 9.2 0.4 0.5 0.9 3.2 3.7 7.0 7.7 5.2 1.4KIDJ 330 10.2 2.5 5.4 0.4 0.5 2.0 1.0 1.1 4.8 1.3 0.7 0.9OLKE 814 -10.7 7.0 4.7 0.6 0.4 0.6 6.3 4.1 5.6 43.3 7.4 1.0RHOF 128 18.0 0.1 -6.2 2.5 2.8 10.5 1.6 1.8 7.1 1.8 1.1 1.6SKRO 416 2.7 1.1 16.1 0.5 0.5 2.4 1.8 1.6 8.4 3.1 1.4 2.7SOHO 696 24.2 -15.3 5.6 0.6 0.6 0.9 4.4 4.2 6.8 15.0 6.8 1.3THEY 500 22.6 -6.8 3.2 0.7 0.8 1.3 3.0 3.6 6.4 8.0 5.8 1.5VMEY 497 20.0 -6.1 3.8 0.3 0.3 1.1 1.3 1.3 5.1 1.8 0.9 0.9VOGS 925 30.0 -8.4 7.0 0.6 0.3 0.4 7.1 3.0 5.0 51.3 3.7 0.7
Table 6.Calculated velocities of the stations in east, north and up, relative to REYK. The veloc-ities are calculated applying equation 7 to data from the beginning of measurementsat each station until December 31, 2001. Offsets due to radome installation have beenremoved from the data, but offsets due to the June 2000 SISZ earthquakes are includedin the data set. The uncertainties dV� are calculated according to equation 10, at the 2 level. WSTD is the weighted standard deviation of the residuals (data minus best linefit), calculated according to equation 2. N is the number of data used in the velocitycalculations and��
�� is from equation 13.
Figure 22 shows quite well the plate spreading although the earthquake offsets are in the
data for stations HLID, HOFN, HVER, HVOL, OLKE, SOHO, THEY and VOGS. The stations
moving towards WNW (REYK, OLKE, SKRO and AKUR) are on the North-American plate
whereas the other stations moving towards ESE or SE (HLID, VOGS, VMEY, THEY, SOHO,
HVOL, HOFN and RHOF) are on the Eurasian plate.
The chi-squared values in Table 6 vary highly. Large��� values are observed, up to��
� � ��
for the east component of VOGS. This is to be expected since a straight line is a poor model for
time series that include the offsets due to the June 2000 earthquakes (stations HOFN, HVER,
HVOL, OLKE, SOHO, THEY and VOGS). This is also reflected in the WSTD values in Table
6. Vertical movements will be discussed in Section 4.2.5.
58
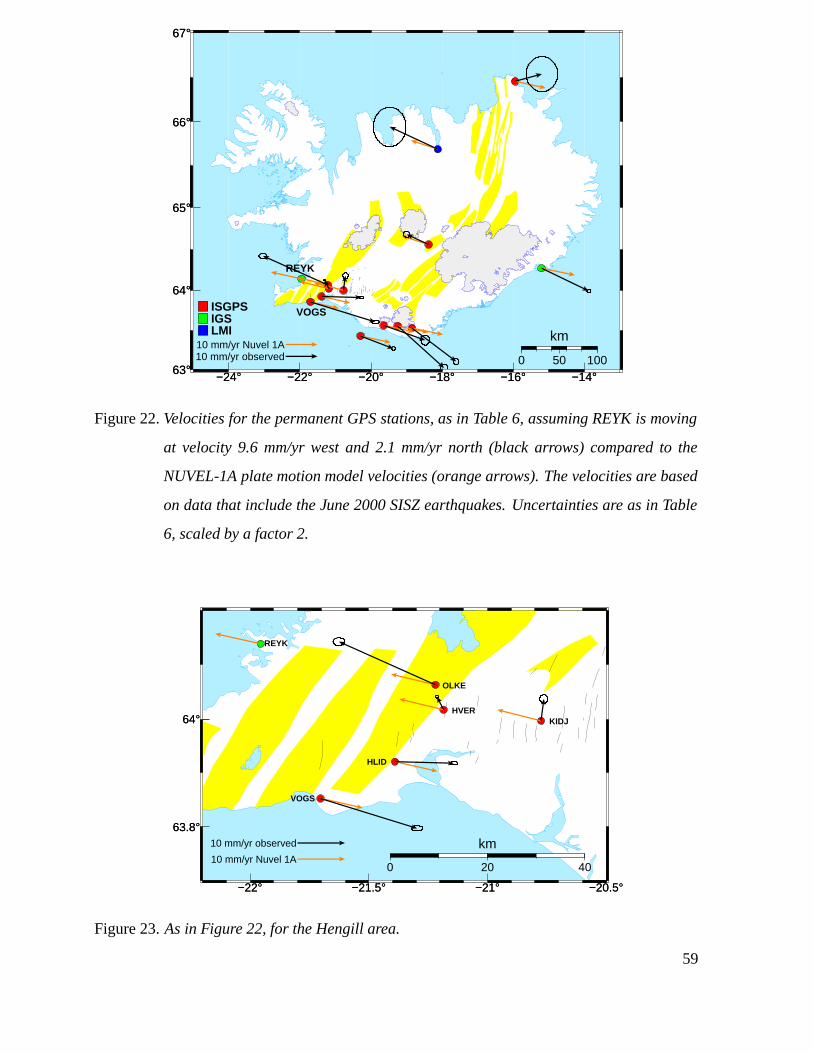
−24° −22° −20° −18° −16° −14°63°
64°
65°
66°
67°
REYK
VOGSISGPS IGSLMI
10 mm/yr Nuvel 1A10 mm/yr observed
−24° −22° −20° −18° −16° −14°63°
64°
65°
66°
67°
0 50 100
km
Figure 22.Velocities for the permanent GPS stations, as in Table 6, assuming REYK is moving
at velocity 9.6 mm/yr west and 2.1 mm/yr north (black arrows) compared to the
NUVEL-1A plate motion model velocities (orange arrows). The velocities are based
on data that include the June 2000 SISZ earthquakes. Uncertainties are as in Table
6, scaled by a factor 2.
−22° −21.5° −21° −20.5°
63.8°
64°
REYK
VOGS
OLKE
HLID
HVERKIDJ
10 mm/yr Nuvel 1A
10 mm/yr observed
−22° −21.5° −21° −20.5°
63.8°
64°
0 20 40
km
Figure 23.As in Figure 22, for the Hengill area.
59
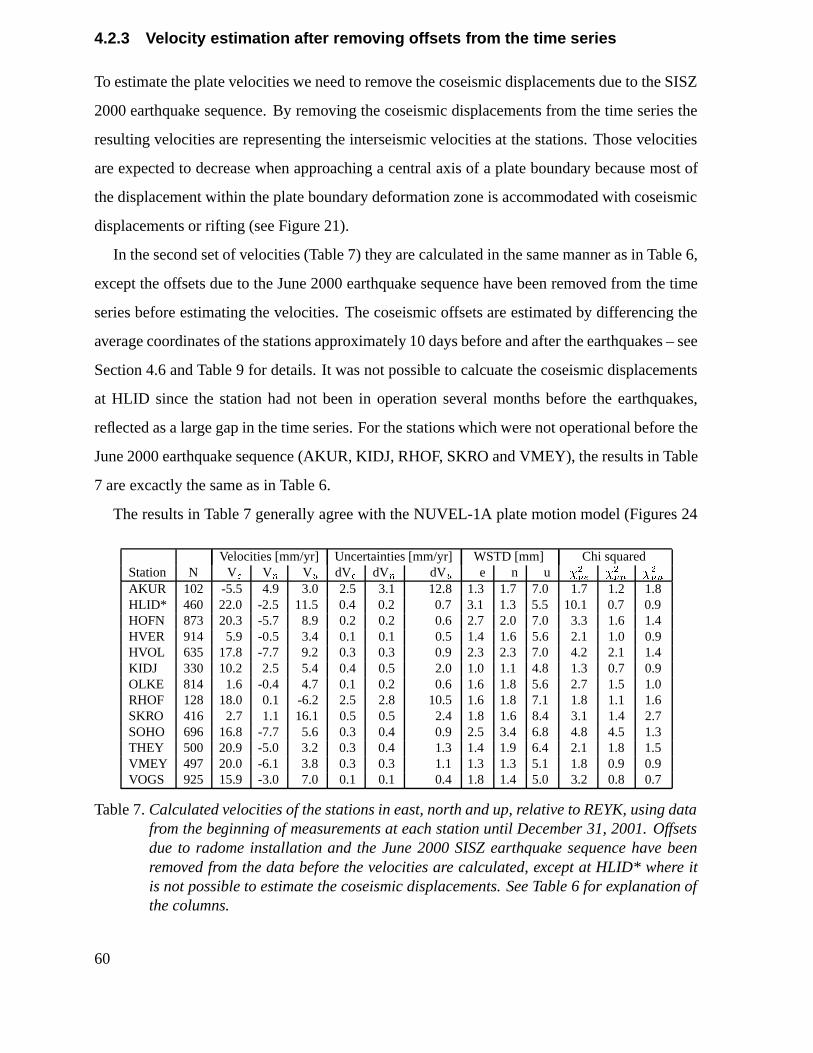
4.2.3 Velocity estimation after removing offsets from the time series
To estimate the plate velocities we need to remove the coseismic displacements due to the SISZ
2000 earthquake sequence. By removing the coseismic displacements from the time series the
resulting velocities are representing the interseismic velocities at the stations. Those velocities
are expected to decrease when approaching a central axis of a plate boundary because most of
the displacement within the plate boundary deformation zone is accommodated with coseismic
displacements or rifting (see Figure 21).
In the second set of velocities (Table 7) they are calculated in the same manner as in Table 6,
except the offsets due to the June 2000 earthquake sequence have been removed from the time
series before estimating the velocities. The coseismic offsets are estimated by differencing the
average coordinates of the stations approximately 10 days before and after the earthquakes – see
Section 4.6 and Table 9 for details. It was not possible to calcuate the coseismic displacements
at HLID since the station had not been in operation several months before the earthquakes,
reflected as a large gap in the time series. For the stations which were not operational before the
June 2000 earthquake sequence (AKUR, KIDJ, RHOF, SKRO and VMEY), the results in Table
7 are excactly the same as in Table 6.
The results in Table 7 generally agree with the NUVEL-1A plate motion model (Figures 24
Velocities [mm/yr] Uncertainties [mm/yr] WSTD [mm] Chi squaredStation N V� V� V� dV� dV� dV� e n u �
�
����
����
��
AKUR 102 -5.5 4.9 3.0 2.5 3.1 12.8 1.3 1.7 7.0 1.7 1.2 1.8HLID* 460 22.0 -2.5 11.5 0.4 0.2 0.7 3.1 1.3 5.5 10.1 0.7 0.9HOFN 873 20.3 -5.7 8.9 0.2 0.2 0.6 2.7 2.0 7.0 3.3 1.6 1.4HVER 914 5.9 -0.5 3.4 0.1 0.1 0.5 1.4 1.6 5.6 2.1 1.0 0.9HVOL 635 17.8 -7.7 9.2 0.3 0.3 0.9 2.3 2.3 7.0 4.2 2.1 1.4KIDJ 330 10.2 2.5 5.4 0.4 0.5 2.0 1.0 1.1 4.8 1.3 0.7 0.9OLKE 814 1.6 -0.4 4.7 0.1 0.2 0.6 1.6 1.8 5.6 2.7 1.5 1.0RHOF 128 18.0 0.1 -6.2 2.5 2.8 10.5 1.6 1.8 7.1 1.8 1.1 1.6SKRO 416 2.7 1.1 16.1 0.5 0.5 2.4 1.8 1.6 8.4 3.1 1.4 2.7SOHO 696 16.8 -7.7 5.6 0.3 0.4 0.9 2.5 3.4 6.8 4.8 4.5 1.3THEY 500 20.9 -5.0 3.2 0.3 0.4 1.3 1.4 1.9 6.4 2.1 1.8 1.5VMEY 497 20.0 -6.1 3.8 0.3 0.3 1.1 1.3 1.3 5.1 1.8 0.9 0.9VOGS 925 15.9 -3.0 7.0 0.1 0.1 0.4 1.8 1.4 5.0 3.2 0.8 0.7
Table 7.Calculated velocities of the stations in east, north and up, relative to REYK, using datafrom the beginning of measurements at each station until December 31, 2001. Offsetsdue to radome installation and the June 2000 SISZ earthquake sequence have beenremoved from the data before the velocities are calculated, except at HLID* where itis not possible to estimate the coseismic displacements. See Table 6 for explanation ofthe columns.
60
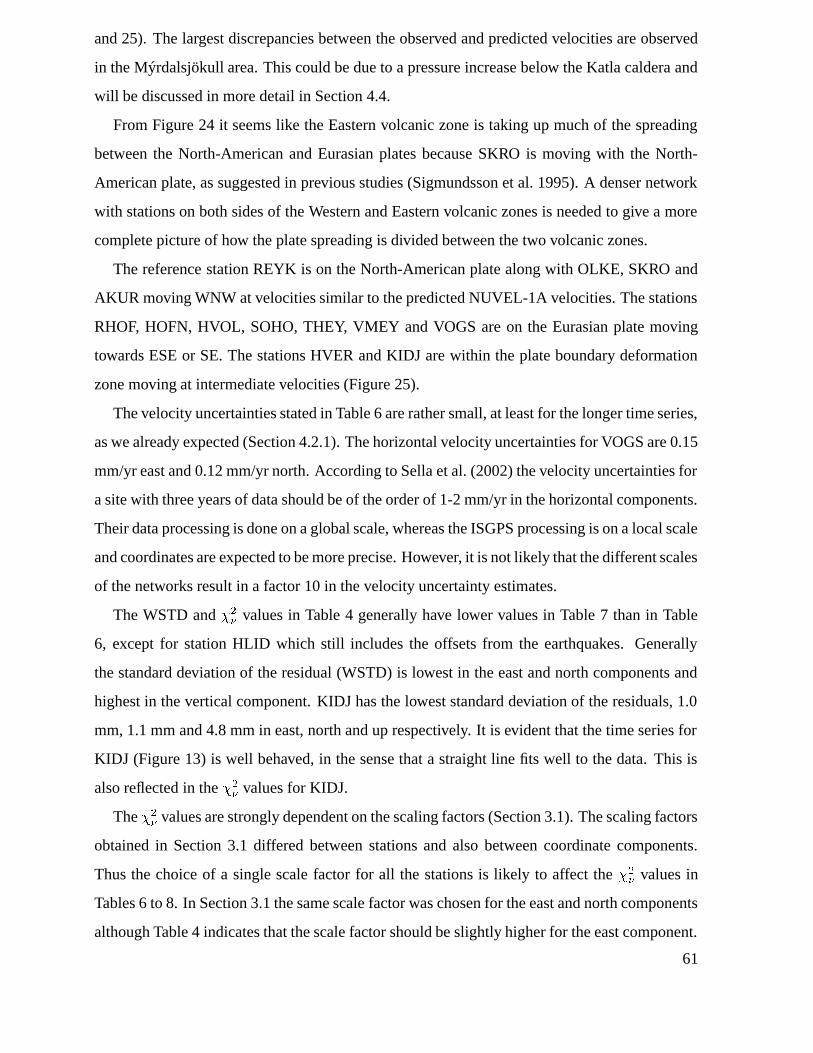
and 25). The largest discrepancies between the observed and predicted velocities are observed
in the Mýrdalsjökull area. This could be due to a pressure increase below the Katla caldera and
will be discussed in more detail in Section 4.4.
From Figure 24 it seems like the Eastern volcanic zone is taking up much of the spreading
between the North-American and Eurasian plates because SKRO is moving with the North-
American plate, as suggested in previous studies (Sigmundsson et al. 1995). A denser network
with stations on both sides of the Western and Eastern volcanic zones is needed to give a more
complete picture of how the plate spreading is divided between the two volcanic zones.
The reference station REYK is on the North-American plate along with OLKE, SKRO and
AKUR moving WNW at velocities similar to the predicted NUVEL-1A velocities. The stations
RHOF, HOFN, HVOL, SOHO, THEY, VMEY and VOGS are on the Eurasian plate moving
towards ESE or SE. The stations HVER and KIDJ are within the plate boundary deformation
zone moving at intermediate velocities (Figure 25).
The velocity uncertainties stated in Table 6 are rather small, at least for the longer time series,
as we already expected (Section 4.2.1). The horizontal velocity uncertainties for VOGS are 0.15
mm/yr east and 0.12 mm/yr north. According to Sella et al. (2002) the velocity uncertainties for
a site with three years of data should be of the order of 1-2 mm/yr in the horizontal components.
Their data processing is done on a global scale, whereas the ISGPS processing is on a local scale
and coordinates are expected to be more precise. However, it is not likely that the different scales
of the networks result in a factor 10 in the velocity uncertainty estimates.
The WSTD and���
values in Table 4 generally have lower values in Table 7 than in Table
6, except for station HLID which still includes the offsets from the earthquakes. Generally
the standard deviation of the residual (WSTD) is lowest in the east and north components and
highest in the vertical component. KIDJ has the lowest standard deviation of the residuals, 1.0
mm, 1.1 mm and 4.8 mm in east, north and up respectively. It is evident that the time series for
KIDJ (Figure 13) is well behaved, in the sense that a straight line fits well to the data. This is
also reflected in the���
values for KIDJ.
The���
values are strongly dependent on the scaling factors (Section 3.1). The scaling factors
obtained in Section 3.1 differed between stations and also between coordinate components.
Thus the choice of a single scale factor for all the stations is likely to affect the��
�values in
Tables 6 to 8. In Section 3.1 the same scale factor was chosen for the east and north components
although Table 4 indicates that the scale factor should be slightly higher for the east component.
61
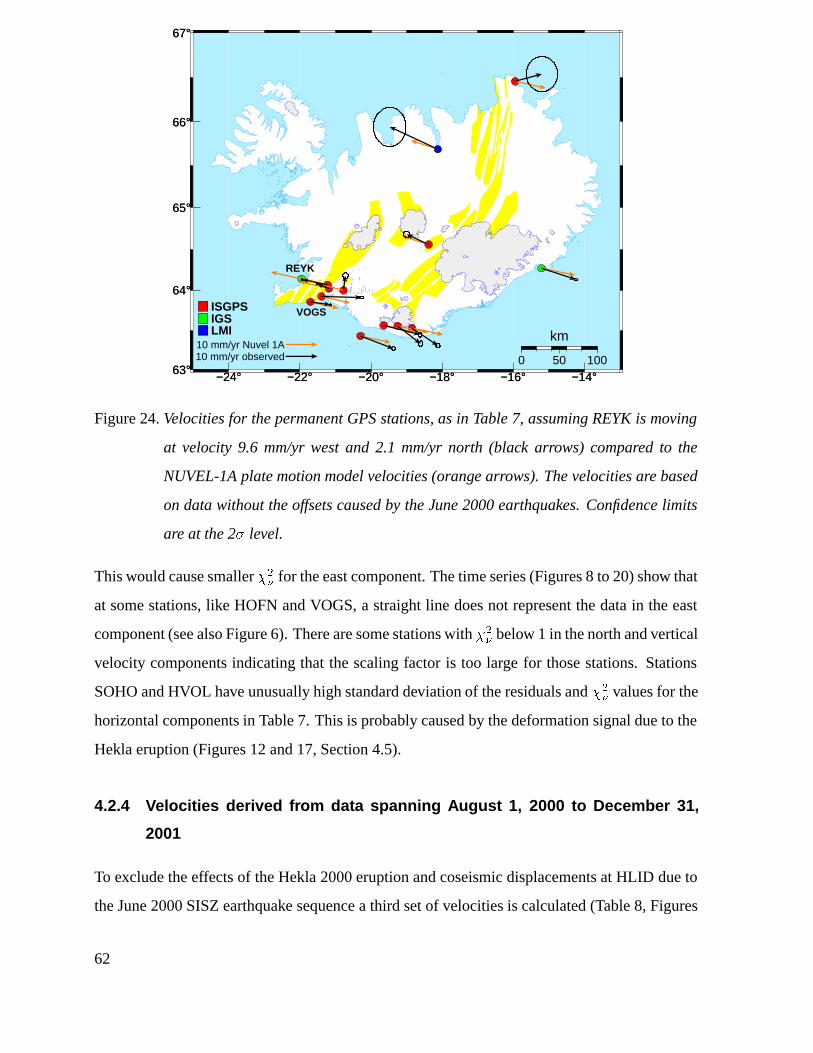
−24° −22° −20° −18° −16° −14°63°
64°
65°
66°
67°
REYK
VOGSISGPS IGSLMI
10 mm/yr Nuvel 1A10 mm/yr observed
−24° −22° −20° −18° −16° −14°63°
64°
65°
66°
67°
0 50 100
km
Figure 24.Velocities for the permanent GPS stations, as in Table 7, assuming REYK is moving
at velocity 9.6 mm/yr west and 2.1 mm/yr north (black arrows) compared to the
NUVEL-1A plate motion model velocities (orange arrows). The velocities are based
on data without the offsets caused by the June 2000 earthquakes. Confidence limits
are at the 2� level.
This would cause smaller��
�for the east component. The time series (Figures 8 to 20) show that
at some stations, like HOFN and VOGS, a straight line does not represent the data in the east
component (see also Figure 6). There are some stations with��
�below 1 in the north and vertical
velocity components indicating that the scaling factor is too large for those stations. Stations
SOHO and HVOL have unusually high standard deviation of the residuals and��
�values for the
horizontal components in Table 7. This is probably caused by the deformation signal due to the
Hekla eruption (Figures 12 and 17, Section 4.5).
4.2.4 Velocities derived from data spanning August 1, 2000 to December 31,
2001
To exclude the effects of the Hekla 2000 eruption and coseismic displacements at HLID due to
the June 2000 SISZ earthquake sequence a third set of velocities is calculated (Table 8, Figures
62
−22° −21.5° −21° −20.5°
63.8°
64°
REYK
VOGS
OLKE
HLID
HVERKIDJ
10 mm/yr Nuvel 1A
10 mm/yr observed
−22° −21.5° −21° −20.5°
63.8°
64°
0 20 40
km
Figure 25.As in Figure 24 for the Hengill area. The observed motion of HLID is not shown
here since the time series for HLID include coseismic offsets due to the June 2000
earthquake sequence.
26 and 27) using data only after August 1, 2000, until December 31, 2001. It is not necessary to
correct for any offsets, except for an offset due to a instrumental change at HOFN in September
2001 (Table 2). The results are expected to be the same as in Tables 6 and 7 for stations that
were installed after August 1, 2000 (AKUR, KIDJ, RHOF and SKRO).
The velocities obtained in this section can be interpreted as interseismic velocities at the
stations. Most stations are moving at velocities similar to the NUVEL-1A plate motion model,
except for the stations SOHO and HVOL near Mýrdalsjökull and in the Hengill area (Figure
27). The velocities are similar to the ones obtained in the previous section (Table 7), except for
SOHO, HVOL and HLID.
The stations HLID, HVER, OLKE and KIDJ are within the plate boundary deformation zone
moving at intermediate velocities. Station VOGS is moving at almost the NUVEL-1A rate,
HLID is on the Eurasian side of the plate boundary, and HVER is on the North-American side
of the plate boundary. OLKE is moving at nearly the NUVEL-1A rate for the North-American
plate. There are only 15 km between HLID and HVER and the present location of the plate
boundary is confined between the stations.
KIDJ is moving almost due north. KIDJ is within the SISZ, approximately 5 km west of the
Hestfjall fault which ruptured on June 21, 2000 (Figure 27). Thus postseismic movements at
63
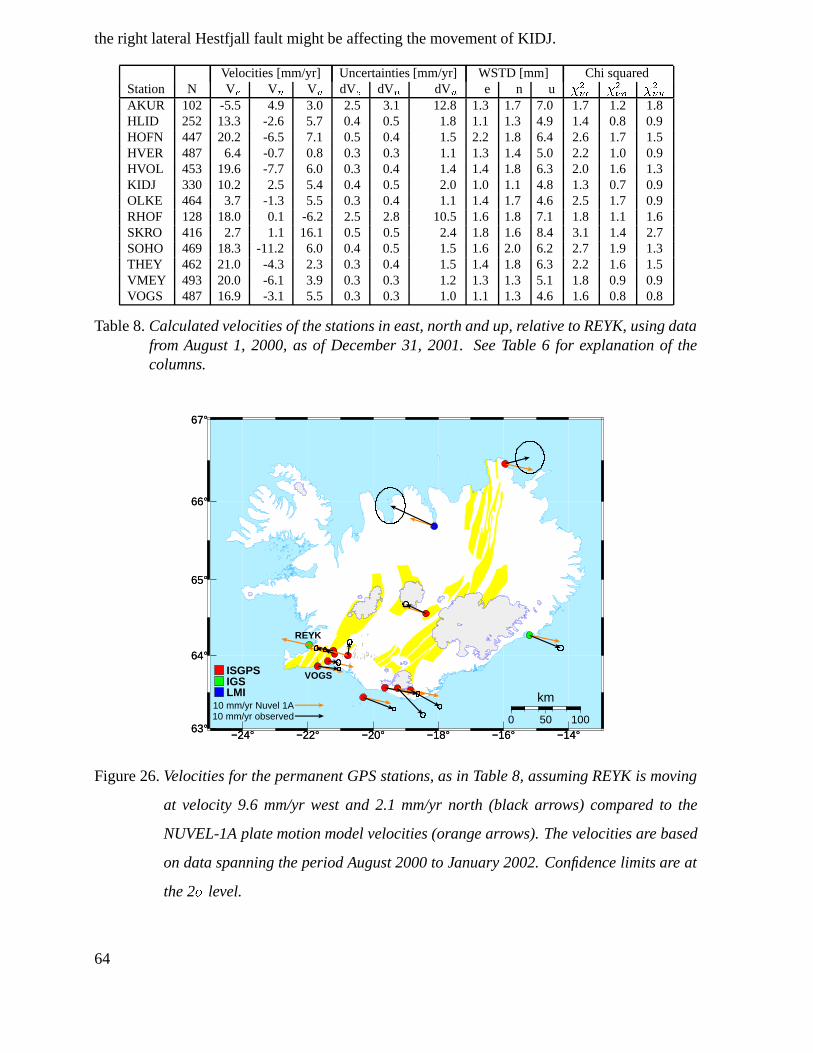
the right lateral Hestfjall fault might be affecting the movement of KIDJ.
Velocities [mm/yr] Uncertainties [mm/yr] WSTD [mm] Chi squaredStation N V� V� V� dV� dV� dV� e n u �
�
����
����
��
AKUR 102 -5.5 4.9 3.0 2.5 3.1 12.8 1.3 1.7 7.0 1.7 1.2 1.8HLID 252 13.3 -2.6 5.7 0.4 0.5 1.8 1.1 1.3 4.9 1.4 0.8 0.9HOFN 447 20.2 -6.5 7.1 0.5 0.4 1.5 2.2 1.8 6.4 2.6 1.7 1.5HVER 487 6.4 -0.7 0.8 0.3 0.3 1.1 1.3 1.4 5.0 2.2 1.0 0.9HVOL 453 19.6 -7.7 6.0 0.3 0.4 1.4 1.4 1.8 6.3 2.0 1.6 1.3KIDJ 330 10.2 2.5 5.4 0.4 0.5 2.0 1.0 1.1 4.8 1.3 0.7 0.9OLKE 464 3.7 -1.3 5.5 0.3 0.4 1.1 1.4 1.7 4.6 2.5 1.7 0.9RHOF 128 18.0 0.1 -6.2 2.5 2.8 10.5 1.6 1.8 7.1 1.8 1.1 1.6SKRO 416 2.7 1.1 16.1 0.5 0.5 2.4 1.8 1.6 8.4 3.1 1.4 2.7SOHO 469 18.3 -11.2 6.0 0.4 0.5 1.5 1.6 2.0 6.2 2.7 1.9 1.3THEY 462 21.0 -4.3 2.3 0.3 0.4 1.5 1.4 1.8 6.3 2.2 1.6 1.5VMEY 493 20.0 -6.1 3.9 0.3 0.3 1.2 1.3 1.3 5.1 1.8 0.9 0.9VOGS 487 16.9 -3.1 5.5 0.3 0.3 1.0 1.1 1.3 4.6 1.6 0.8 0.8
Table 8.Calculated velocities of the stations in east, north and up, relative to REYK, using datafrom August 1, 2000, as of December 31, 2001. See Table 6 for explanation of thecolumns.
−24° −22° −20° −18° −16° −14°63°
64°
65°
66°
67°
REYK
VOGSISGPS IGSLMI
10 mm/yr Nuvel 1A10 mm/yr observed
−24° −22° −20° −18° −16° −14°63°
64°
65°
66°
67°
0 50 100
km
Figure 26.Velocities for the permanent GPS stations, as in Table 8, assuming REYK is moving
at velocity 9.6 mm/yr west and 2.1 mm/yr north (black arrows) compared to the
NUVEL-1A plate motion model velocities (orange arrows). The velocities are based
on data spanning the period August 2000 to January 2002. Confidence limits are at
the 2� level.
64
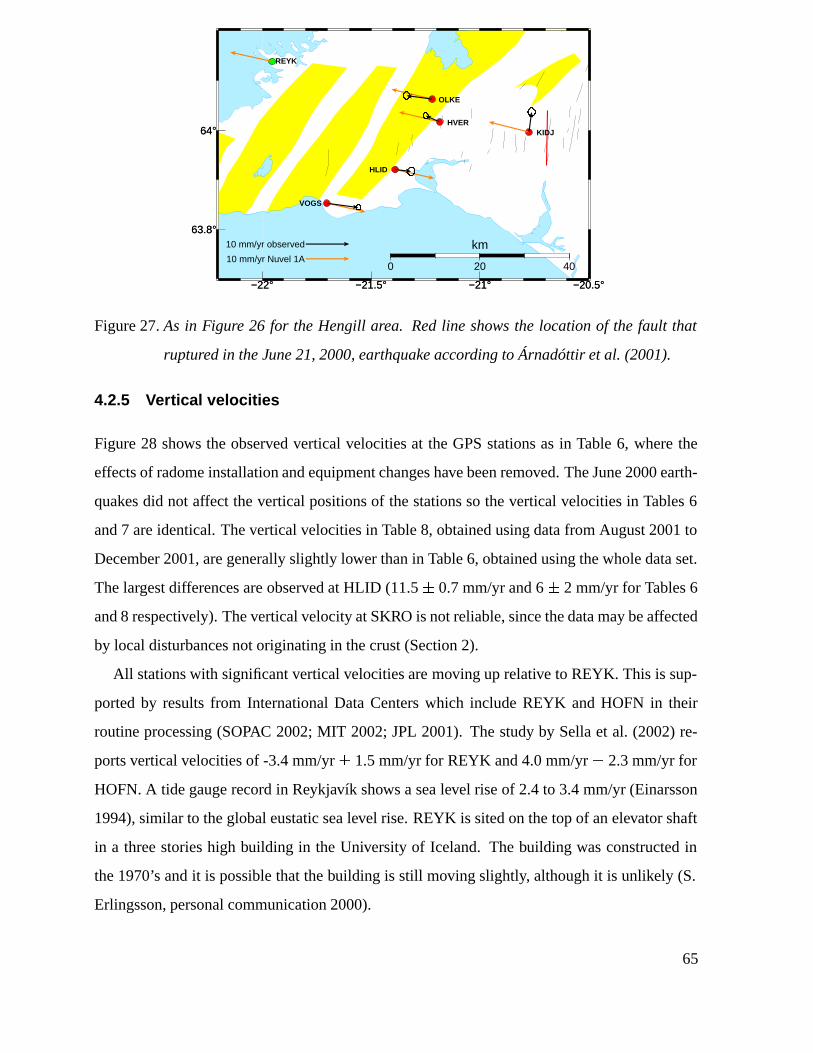
−22° −21.5° −21° −20.5°
63.8°
64°
REYK
VOGS
OLKE
HLID
HVERKIDJ
10 mm/yr Nuvel 1A
10 mm/yr observed
−22° −21.5° −21° −20.5°
63.8°
64°
0 20 40
km
Figure 27.As in Figure 26 for the Hengill area. Red line shows the location of the fault that
ruptured in the June 21, 2000, earthquake according to Árnadóttir et al. (2001).
4.2.5 Vertical velocities
Figure 28 shows the observed vertical velocities at the GPS stations as in Table 6, where the
effects of radome installation and equipment changes have been removed. The June 2000 earth-
quakes did not affect the vertical positions of the stations so the vertical velocities in Tables 6
and 7 are identical. The vertical velocities in Table 8, obtained using data from August 2001 to
December 2001, are generally slightly lower than in Table 6, obtained using the whole data set.
The largest differences are observed at HLID (11.5� 0.7 mm/yr and 6� 2 mm/yr for Tables 6
and 8 respectively). The vertical velocity at SKRO is not reliable, since the data may be affected
by local disturbances not originating in the crust (Section 2).
All stations with significant vertical velocities are moving up relative to REYK. This is sup-
ported by results from International Data Centers which include REYK and HOFN in their
routine processing (SOPAC 2002; MIT 2002; JPL 2001). The study by Sella et al. (2002) re-
ports vertical velocities of -3.4 mm/yr� 1.5 mm/yr for REYK and 4.0 mm/yr� 2.3 mm/yr for
HOFN. A tide gauge record in Reykjavík shows a sea level rise of 2.4 to 3.4 mm/yr (Einarsson
1994), similar to the global eustatic sea level rise. REYK is sited on the top of an elevator shaft
in a three stories high building in the University of Iceland. The building was constructed in
the 1970’s and it is possible that the building is still moving slightly, although it is unlikely (S.
Erlingsson, personal communication 2000).
65
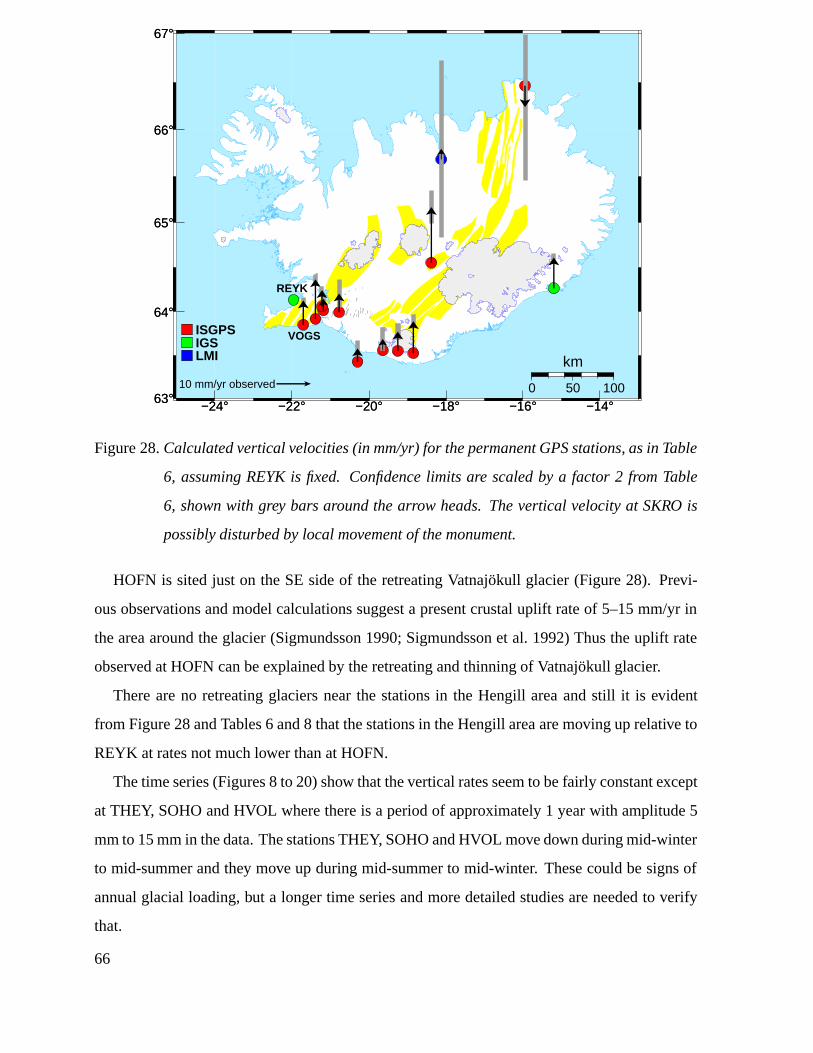
−24° −22° −20° −18° −16° −14°63°
64°
65°
66°
67°
REYK
VOGSISGPS IGSLMI
10 mm/yr observed
−24° −22° −20° −18° −16° −14°63°
64°
65°
66°
67°
0 50 100
km
Figure 28.Calculated vertical velocities (in mm/yr) for the permanent GPS stations, as in Table
6, assuming REYK is fixed. Confidence limits are scaled by a factor 2 from Table
6, shown with grey bars around the arrow heads. The vertical velocity at SKRO is
possibly disturbed by local movement of the monument.
HOFN is sited just on the SE side of the retreating Vatnajökull glacier (Figure 28). Previ-
ous observations and model calculations suggest a present crustal uplift rate of 5–15 mm/yr in
the area around the glacier (Sigmundsson 1990; Sigmundsson et al. 1992) Thus the uplift rate
observed at HOFN can be explained by the retreating and thinning of Vatnajökull glacier.
There are no retreating glaciers near the stations in the Hengill area and still it is evident
from Figure 28 and Tables 6 and 8 that the stations in the Hengill area are moving up relative to
REYK at rates not much lower than at HOFN.
The time series (Figures 8 to 20) show that the vertical rates seem to be fairly constant except
at THEY, SOHO and HVOL where there is a period of approximately 1 year with amplitude 5
mm to 15 mm in the data. The stations THEY, SOHO and HVOL move down during mid-winter
to mid-summer and they move up during mid-summer to mid-winter. These could be signs of
annual glacial loading, but a longer time series and more detailed studies are needed to verify
that.
66
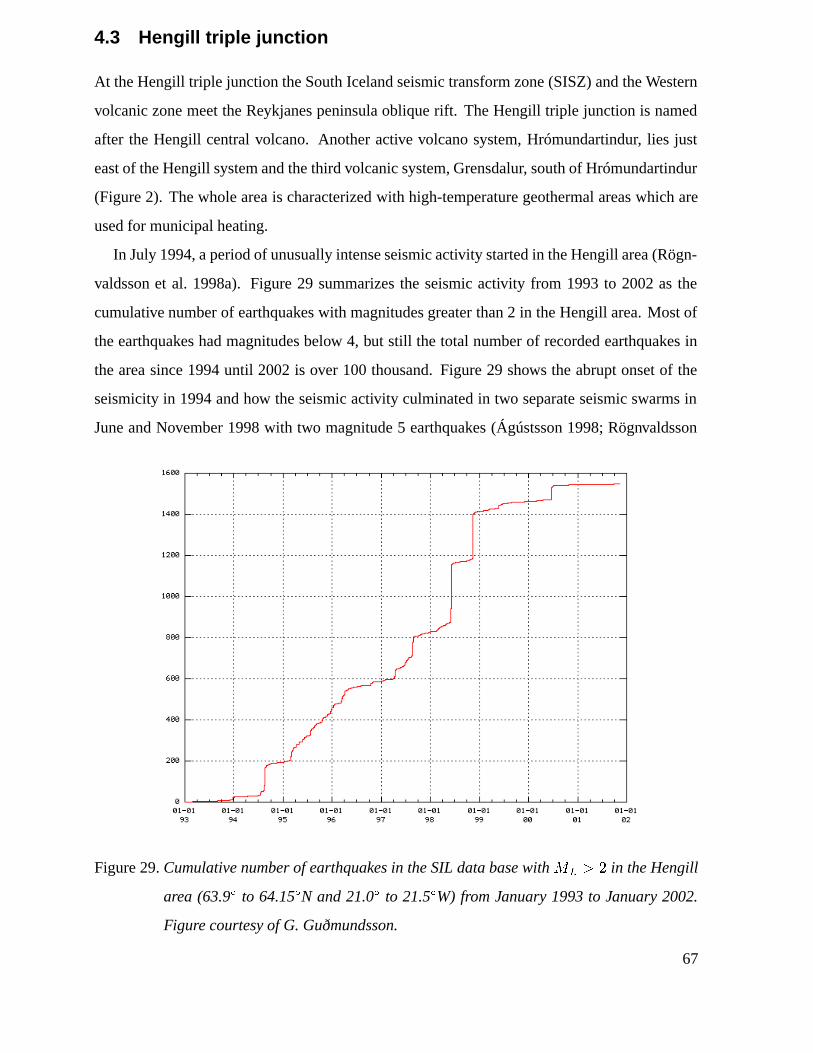
4.3 Hengill triple junction
At the Hengill triple junction the South Iceland seismic transform zone (SISZ) and the Western
volcanic zone meet the Reykjanes peninsula oblique rift. The Hengill triple junction is named
after the Hengill central volcano. Another active volcano system, Hrómundartindur, lies just
east of the Hengill system and the third volcanic system, Grensdalur, south of Hrómundartindur
(Figure 2). The whole area is characterized with high-temperature geothermal areas which are
used for municipal heating.
In July 1994, a period of unusually intense seismic activity started in the Hengill area (Rögn-
valdsson et al. 1998a). Figure 29 summarizes the seismic activity from 1993 to 2002 as the
cumulative number of earthquakes with magnitudes greater than 2 in the Hengill area. Most of
the earthquakes had magnitudes below 4, but still the total number of recorded earthquakes in
the area since 1994 until 2002 is over 100 thousand. Figure 29 shows the abrupt onset of the
seismicity in 1994 and how the seismic activity culminated in two separate seismic swarms in
June and November 1998 with two magnitude 5 earthquakes (Ágústsson 1998; Rögnvaldsson
Figure 29.Cumulative number of earthquakes in the SIL data base with�� � � in the Hengill
area (63.9Æ to 64.15ÆN and 21.0Æ to 21.5ÆW) from January 1993 to January 2002.
Figure courtesy of G. Guðmundsson.
67
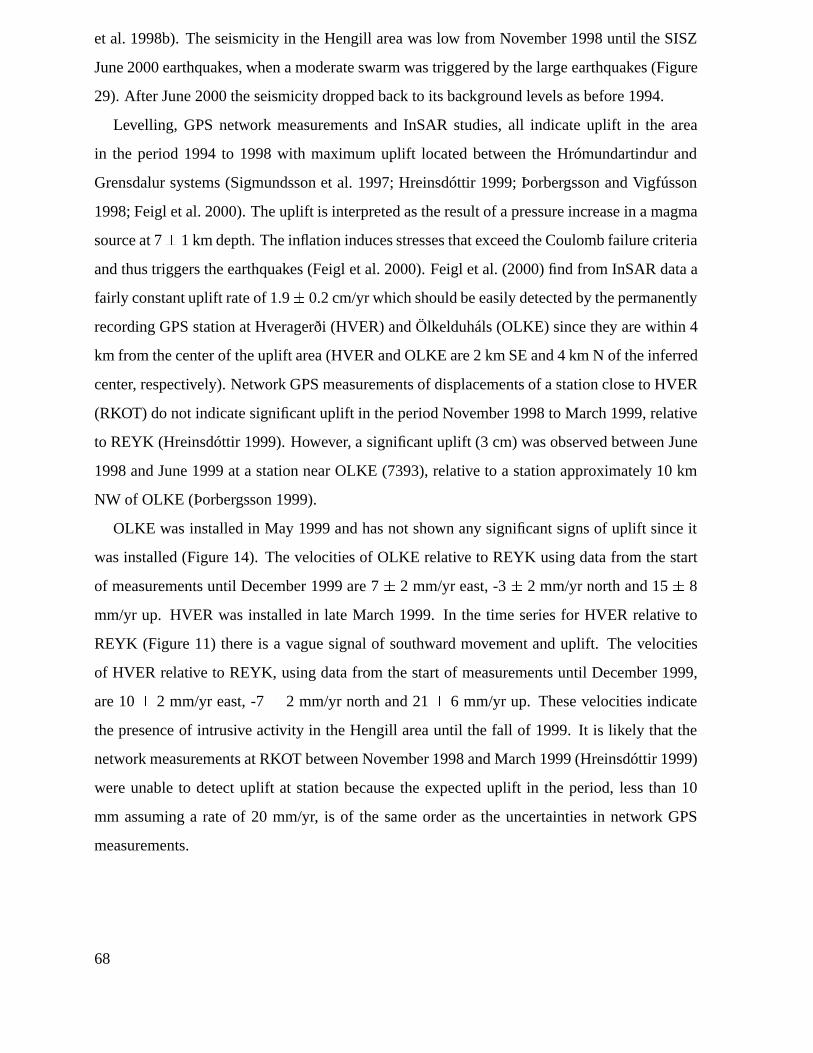
et al. 1998b). The seismicity in the Hengill area was low from November 1998 until the SISZ
June 2000 earthquakes, when a moderate swarm was triggered by the large earthquakes (Figure
29). After June 2000 the seismicity dropped back to its background levels as before 1994.
Levelling, GPS network measurements and InSAR studies, all indicate uplift in the area
in the period 1994 to 1998 with maximum uplift located between the Hrómundartindur and
Grensdalur systems (Sigmundsson et al. 1997; Hreinsdóttir 1999; Þorbergsson and Vigfússon
1998; Feigl et al. 2000). The uplift is interpreted as the result of a pressure increase in a magma
source at 7� 1 km depth. The inflation induces stresses that exceed the Coulomb failure criteria
and thus triggers the earthquakes (Feigl et al. 2000). Feigl et al. (2000) find from InSAR data a
fairly constant uplift rate of 1.9� 0.2 cm/yr which should be easily detected by the permanently
recording GPS station at Hveragerði (HVER) and Ölkelduháls (OLKE) since they are within 4
km from the center of the uplift area (HVER and OLKE are 2 km SE and 4 km N of the inferred
center, respectively). Network GPS measurements of displacements of a station close to HVER
(RKOT) do not indicate significant uplift in the period November 1998 to March 1999, relative
to REYK (Hreinsdóttir 1999). However, a significant uplift (3 cm) was observed between June
1998 and June 1999 at a station near OLKE (7393), relative to a station approximately 10 km
NW of OLKE (Þorbergsson 1999).
OLKE was installed in May 1999 and has not shown any significant signs of uplift since it
was installed (Figure 14). The velocities of OLKE relative to REYK using data from the start
of measurements until December 1999 are 7� 2 mm/yr east, -3� 2 mm/yr north and 15� 8
mm/yr up. HVER was installed in late March 1999. In the time series for HVER relative to
REYK (Figure 11) there is a vague signal of southward movement and uplift. The velocities
of HVER relative to REYK, using data from the start of measurements until December 1999,
are 10� 2 mm/yr east, -7� 2 mm/yr north and 21� 6 mm/yr up. These velocities indicate
the presence of intrusive activity in the Hengill area until the fall of 1999. It is likely that the
network measurements at RKOT between November 1998 and March 1999 (Hreinsdóttir 1999)
were unable to detect uplift at station because the expected uplift in the period, less than 10
mm assuming a rate of 20 mm/yr, is of the same order as the uncertainties in network GPS
measurements.
68
4.4 Eyjafjallajökull and Katla volcanoes
In June 1994 an earthquake swarm lasting for nearly a month occurred below the active volcano
Eyjafjallajökull in South Iceland. Eyjafjallajökull is covered by an ice cap and erupted last
in 1821-1823. Another sharp increase in the seismic activity beneath the mountain started
in October 1998 and lasted until January 2001 with peak activity during July to September
1999. Observed thrust faulting mechanisms, GPS network measurements and tilt measurements
support that the seismic swarms were due to shallow intrusions into the southern part of the
mountain (Dahm and Brandsdóttir 1997; Sturkell et al. 2002b). The timing of the intrusive
activity has been constrained with geodetic observations to occur within the time period between
July 1999 and May 2000 (Sturkell et al. 2002b).
The permanent GPS station THEY, installed in May 2000, is within 6 km from the modelled
intrusion centers from 1994 and 1999 (Sturkell et al. 2002b) and is thus well suited to monitor
future evolution of local intrusion activity beneath the southern flanks of Eyjafjallajökull. No
signs of postintrusive movements have been observed at THEY.
The nearest continuous station that was recording in 1999 (SOHO) is within 20 km east of
the intrusion center. The station was installed in late September 1999 and shows no conclusive
signs of activity related to Eyjafjallajökull. The intrusive activity could have been over already
in late September 1999. Sturkell et al. (2002b) model the deformation field observed in geodetic
data covering the 1999 event as coming from a shallow pressure source (3.5 km depth). Accord-
ing to their model the total displacement at SOHO during the whole intrusive event should be
approximately 12 mm east (E. Sturkell, personal communication 2002).
The average velocity of SOHO relative to REYK during September 24, 1999, to February
20, 2000, (87 data points) is 7 mm/yr� 3 mm/yr east and 3 mm/yr� 4 mm/yr north (2
uncertainties). This velocity is considerably lower than the NUVEL-1A velocity relative to
REYK (19 mm/yr east and -4 mm/yr north). If the effects of the intrusion were discernible at
SOHO we would expect velocities larger than the NUVEL-1A. Assuming it is possible to detect
movements of 6 mm we can conclude that at least half of the deformation due to the intrusion
in Eyjafjallajökull had occurred before the installation of the station (September 24, 1999).
Katla volcano is an off-rift volcano beneath Mýrdalsjökull glacier in South Iceland. The ice-
filled caldera, outlined in Figure 31, is 10x13 km in diameter and approximately 700 m deep
(Björnsson et al. 2000). Katla is known for great eruptions with devastating jökulhlaups and
69
has erupted 20 times in the last 11 centuries (Larsen 2000). The last great eruption was in 1918,
but possibly two small eruptions that did not penetrate the glacier occurred in 1955 (Tryggva-
son 1960) and 1999 (Einarsson and Brandsdóttir 2000; Vogfjörð 2002). The Mýrdalsjökull
area has shown persistent high seismic activity for more than four decades. There is a strong
seasonal trend in the activity with most of the earthquakes occurring in the autumn (Einarsson
and Brandsdóttir 2000). Crustal deformation measurements using precise levelling and network
GPS survey data in the Mýrdalsjökull area during 1967 to present do not show significant defor-
mation (Tryggvason 2000; Sturkell et al. 2002a). On July 18, 1999 a small jökulhlaup occurred
in Jökulsá á Sólheimasandi (Sigurðsson et al. 2000) accompanied with seismic tremors. Due to
this event and the fact that Katla is overdue for a large eruption, two permanent GPS stations
were installed at Sólheimaheiði (SOHO) and Láguhvolar (HVOL) (Figure 31) in the autumn of
1999.
SOHO is located approximately 10 km from the center of the caldera. Models of potential
deformation fields by Ágústsson (2000) suggest that the station is very sensitive to pressure
changes in Katla. From Figure 26 there seems to be an enhanced southward motion at stations
SOHO and HVOL compared to the NUVEL-1A model and surrounding stations. The residual
velocities, obtained by subtracting the full NUVEL-1A rate from the rates in Table 8, of SOHO,
HVOL, VMEY and THEY are shown in Figure 31. SOHO is moving outwards from the Katla
caldera at 0.9� 0.4 mm/yr west and 6.9� 0.5 mm/yr south and HVOL is moving at 0.4� 0.3
mm/yr east and 3.5� 0.4 mm/yr relative to Eurasia during the period August 2000 to December
2001.
Comparing time series from after the June 2000 SISZ earthquakes at stations SOHO, HVOL,
THEY and VMEY reveals a more detailed picture of the movements. From Figure 30 we see
that SOHO and perhaps HVOL are moving at a higher rate southward than the neighbouring
stations VMEY and THEY. From the figure we see slightly enhanced southward motion of
the stations just after the June 2000 earthquakes. We also see enhanced southward movement
at SOHO and HVOL during July to August 2001. The displacements at SOHO and HVOL
during this short period are around 5 mm towards south. There are no significant anomalous
movements observed in the east and vertical components of the time series during the period
July to August 2001. It is interesting to note that the southward movements in July to August
2001 took place when there was a low in the annual seismic activity in Mýrdalsjökull.
GPS network measurements were made in the area in July 2000 and in the beginning of June
70
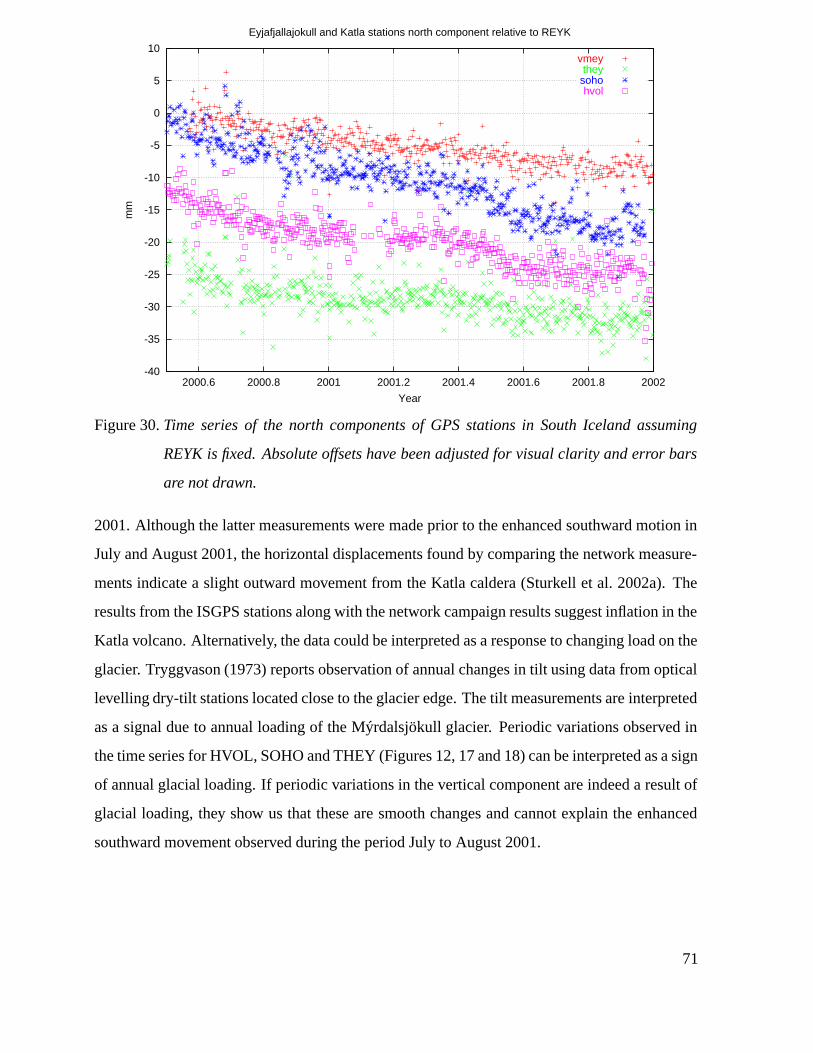
-40
-35
-30
-25
-20
-15
-10
-5
0
5
10
2000.6 2000.8 2001 2001.2 2001.4 2001.6 2001.8 2002
mm
Year
Eyjafjallajokull and Katla stations north component relative to REYK
vmeythey
sohohvol
Figure 30.Time series of the north components of GPS stations in South Iceland assuming
REYK is fixed. Absolute offsets have been adjusted for visual clarity and error bars
are not drawn.
2001. Although the latter measurements were made prior to the enhanced southward motion in
July and August 2001, the horizontal displacements found by comparing the network measure-
ments indicate a slight outward movement from the Katla caldera (Sturkell et al. 2002a). The
results from the ISGPS stations along with the network campaign results suggest inflation in the
Katla volcano. Alternatively, the data could be interpreted as a response to changing load on the
glacier. Tryggvason (1973) reports observation of annual changes in tilt using data from optical
levelling dry-tilt stations located close to the glacier edge. The tilt measurements are interpreted
as a signal due to annual loading of the Mýrdalsjökull glacier. Periodic variations observed in
the time series for HVOL, SOHO and THEY (Figures 12, 17 and 18) can be interpreted as a sign
of annual glacial loading. If periodic variations in the vertical component are indeed a result of
glacial loading, they show us that these are smooth changes and cannot explain the enhanced
southward movement observed during the period July to August 2001.
71
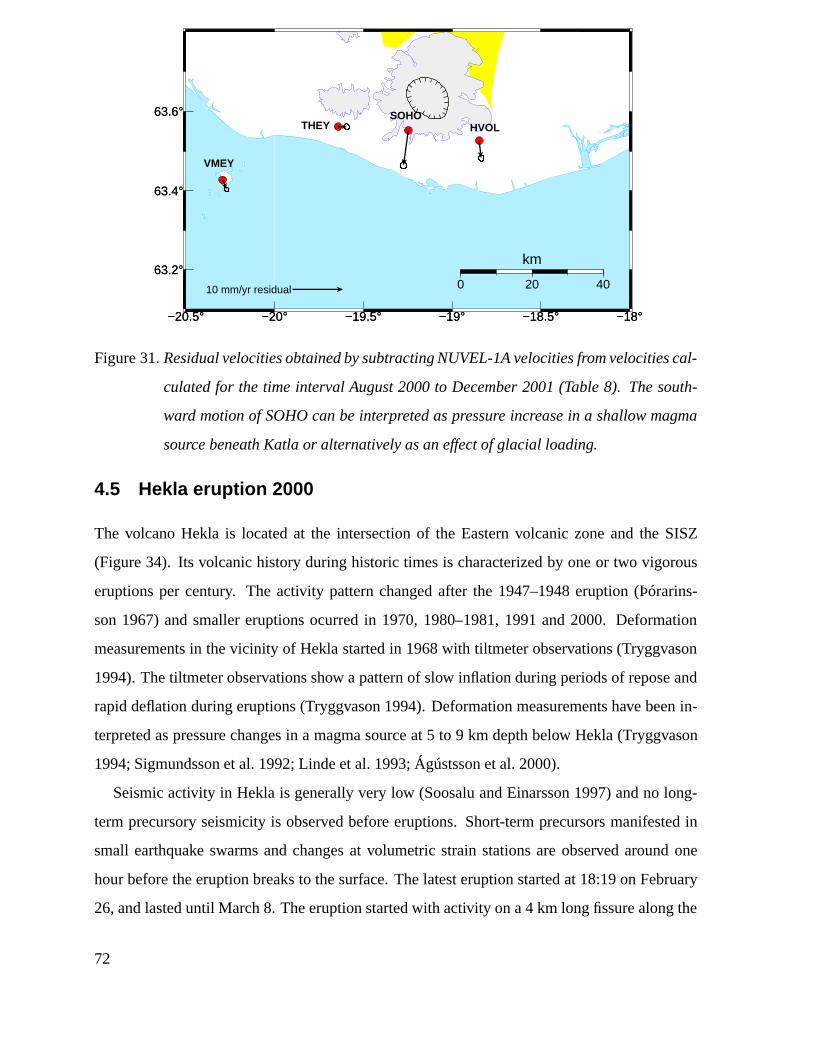
−20.5° −20° −19.5° −19° −18.5° −18°
63.2°
63.4°
63.6°
VMEY
THEYSOHO
HVOL
10 mm/yr residual
−20.5° −20° −19.5° −19° −18.5° −18°
63.2°
63.4°
63.6°
0 20 40
km
Figure 31.Residual velocities obtained by subtracting NUVEL-1A velocities from velocities cal-
culated for the time interval August 2000 to December 2001 (Table 8). The south-
ward motion of SOHO can be interpreted as pressure increase in a shallow magma
source beneath Katla or alternatively as an effect of glacial loading.
4.5 Hekla eruption 2000
The volcano Hekla is located at the intersection of the Eastern volcanic zone and the SISZ
(Figure 34). Its volcanic history during historic times is characterized by one or two vigorous
eruptions per century. The activity pattern changed after the 1947–1948 eruption (Þórarins-
son 1967) and smaller eruptions ocurred in 1970, 1980–1981, 1991 and 2000. Deformation
measurements in the vicinity of Hekla started in 1968 with tiltmeter observations (Tryggvason
1994). The tiltmeter observations show a pattern of slow inflation during periods of repose and
rapid deflation during eruptions (Tryggvason 1994). Deformation measurements have been in-
terpreted as pressure changes in a magma source at 5 to 9 km depth below Hekla (Tryggvason
1994; Sigmundsson et al. 1992; Linde et al. 1993; Ágústsson et al. 2000).
Seismic activity in Hekla is generally very low (Soosalu and Einarsson 1997) and no long-
term precursory seismicity is observed before eruptions. Short-term precursors manifested in
small earthquake swarms and changes at volumetric strain stations are observed around one
hour before the eruption breaks to the surface. The latest eruption started at 18:19 on February
26, and lasted until March 8. The eruption started with activity on a 4 kmlong fissure along the
72
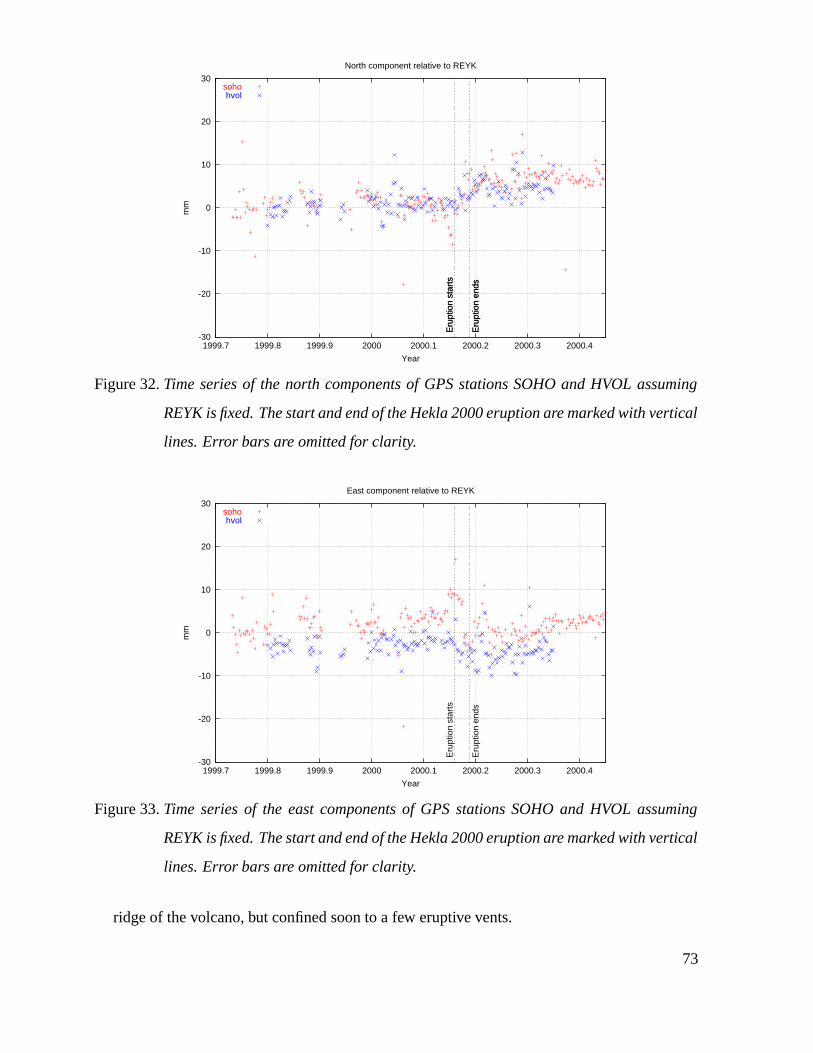
-30
-20
-10
0
10
20
30
1999.7 1999.8 1999.9 2000 2000.1 2000.2 2000.3 2000.4
mm
Year
North component relative to REYK
Eru
ptio
n st
arts
Eru
ptio
n en
ds
Eru
ptio
n st
arts
Eru
ptio
n en
ds
sohohvol
Figure 32.Time series of the north components of GPS stations SOHO and HVOL assuming
REYK is fixed. The start and end of the Hekla 2000 eruption are marked with vertical
lines. Error bars are omitted for clarity.
-30
-20
-10
0
10
20
30
1999.7 1999.8 1999.9 2000 2000.1 2000.2 2000.3 2000.4
mm
Year
East component relative to REYK
Eru
ptio
n st
arts
Eru
ptio
n en
ds
sohohvol
Figure 33.Time series of the east components of GPS stations SOHO and HVOL assuming
REYK is fixed. The start and end of the Hekla 2000 eruption are marked with vertical
lines. Error bars are omitted for clarity.
ridge of the volcano, but confined soon to a few eruptive vents.
73
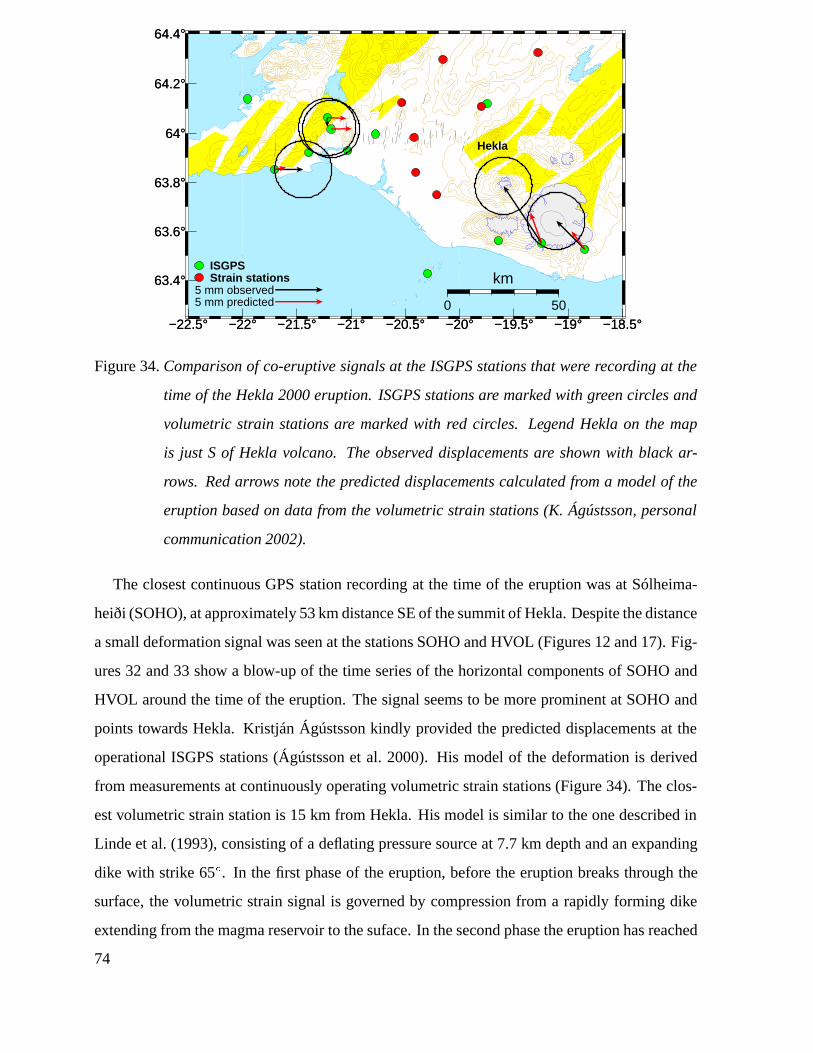
−22.5° −22° −21.5° −21° −20.5° −20° −19.5° −19° −18.5°
63.4°
63.6°
63.8°
64°
64.2°
64.4°
0
0
0
0
0
0
0
0
0
0
0
0
0
0
0
0
0
0
0
0
0
00
0
0
00
0
00
0
ISGPSStrain stations
Hekla
5 mm observed5 mm predicted
−22.5° −22° −21.5° −21° −20.5° −20° −19.5° −19° −18.5°
63.4°
63.6°
63.8°
64°
64.2°
64.4°
0 50
km
Figure 34.Comparison of co-eruptive signals at the ISGPS stations that were recording at the
time of the Hekla 2000 eruption. ISGPS stations are marked with green circles and
volumetric strain stations are marked with red circles. Legend Hekla on the map
is just S of Hekla volcano. The observed displacements are shown with black ar-
rows. Red arrows note the predicted displacements calculated from a model of the
eruption based on data from the volumetric strain stations (K. Ágústsson, personal
communication 2002).
The closest continuous GPS station recording at the time of the eruption was at Sólheima-
heiði (SOHO), at approximately 53 km distance SE of the summit of Hekla. Despite the distance
a small deformation signal was seen at the stations SOHO and HVOL (Figures 12 and 17). Fig-
ures 32 and 33 show a blow-up of the time series of the horizontal components of SOHO and
HVOL around the time of the eruption. The signal seems to be more prominent at SOHO and
points towards Hekla. Kristján Ágústsson kindly provided the predicted displacements at the
operational ISGPS stations (Ágústsson et al. 2000). His model of the deformation is derived
from measurements at continuously operating volumetric strain stations (Figure 34). The clos-
est volumetric strain station is 15 km from Hekla. His model is similar to the one described in
Linde et al. (1993), consisting of a deflating pressure source at 7.7 km depth and an expanding
dike with strike 65Æ. In the first phase of the eruption, before the eruption breaks through the
surface, the volumetric strain signal is governed by compression from a rapidly forming dike
extending from the magma reservoir to the suface. In the second phase the eruption has reached
74
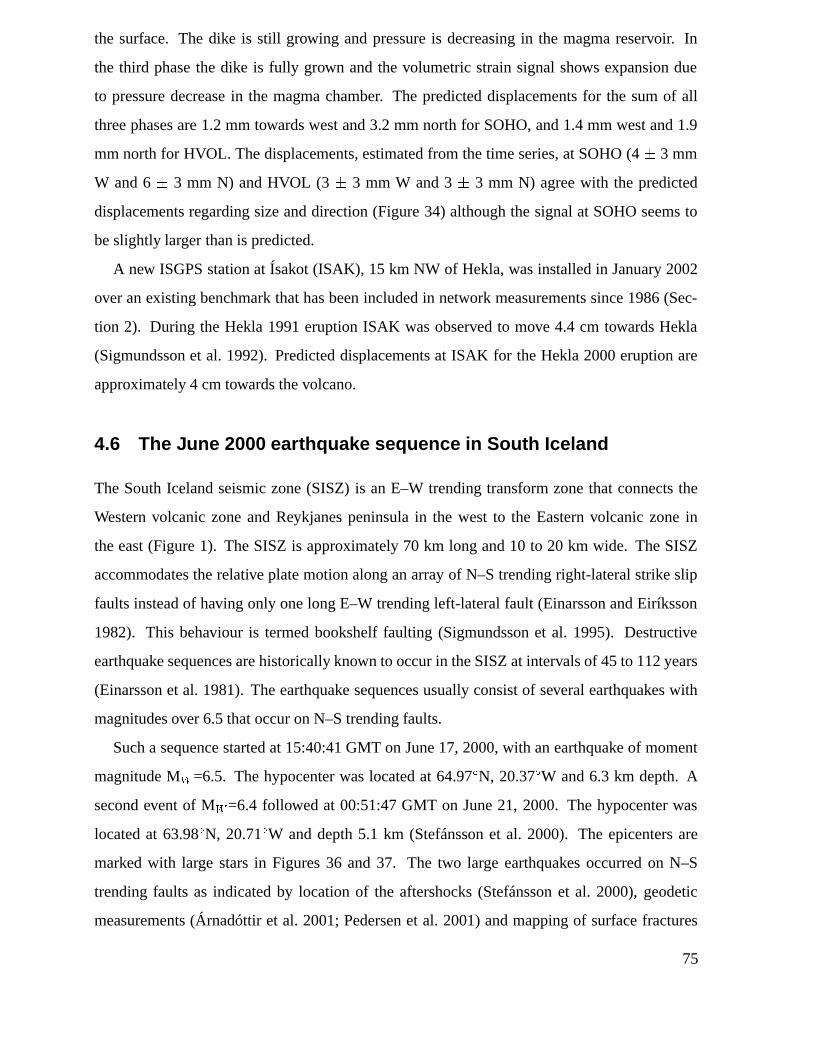
the surface. The dike is still growing and pressure is decreasing in the magma reservoir. In
the third phase the dike is fully grown and the volumetric strain signal shows expansion due
to pressure decrease in the magma chamber. The predicted displacements for the sum of all
three phases are 1.2 mm towards west and 3.2 mm north for SOHO, and 1.4 mm west and 1.9
mm north for HVOL. The displacements, estimated from the time series, at SOHO (4� 3 mm
W and 6� 3 mm N) and HVOL (3� 3 mm W and 3� 3 mm N) agree with the predicted
displacements regarding size and direction (Figure 34) although the signal at SOHO seems to
be slightly larger than is predicted.
A new ISGPS station at Ísakot (ISAK), 15 km NW of Hekla, was installed in January 2002
over an existing benchmark that has been included in network measurements since 1986 (Sec-
tion 2). During the Hekla 1991 eruption ISAK was observed to move 4.4 cm towards Hekla
(Sigmundsson et al. 1992). Predicted displacements at ISAK for the Hekla 2000 eruption are
approximately 4 cm towards the volcano.
4.6 The June 2000 earthquake sequence in South Iceland
The South Iceland seismic zone (SISZ) is an E–W trending transform zone that connects the
Western volcanic zone and Reykjanes peninsula in the west to the Eastern volcanic zone in
the east (Figure 1). The SISZ is approximately 70 km long and 10 to 20 km wide. The SISZ
accommodates the relative plate motion along an array of N–S trending right-lateral strike slip
faults instead of having only one long E–W trending left-lateral fault (Einarsson and Eiríksson
1982). This behaviour is termed bookshelf faulting (Sigmundsson et al. 1995). Destructive
earthquake sequences are historically known to occur in the SISZ at intervals of 45 to 112 years
(Einarsson et al. 1981). The earthquake sequences usually consist of several earthquakes with
magnitudes over 6.5 that occur on N–S trending faults.
Such a sequence started at 15:40:41 GMT on June 17, 2000, with an earthquake of moment
magnitude M�=6.5. The hypocenter was located at 64.97ÆN, 20.37ÆW and 6.3 km depth. A
second event of M�=6.4 followed at 00:51:47 GMT on June 21, 2000. The hypocenter was
located at 63.98ÆN, 20.71ÆW and depth 5.1 km (Stefánsson et al. 2000). The epicenters are
marked with large stars in Figures 36 and 37. The two large earthquakes occurred on N–S
trending faults as indicated by location of the aftershocks (Stefánsson et al. 2000), geodetic
measurements (Árnadóttir et al. 2001; Pedersen et al. 2001) and mapping of surface fractures
75

(Einarsson et al. 2000).
−60−50−40−30−20−10
0102030405060
UP
(m
m)
130 140 150 160 170 180 190 200 210Day number since January 1, 2000
−40−35−30−25−20−15−10
−505
10152025303540
NO
RT
H (
mm
)
130 140 150 160 170 180 190 200 210
VOGS − REYK
−40−35−30−25−20−15−10
−505
10152025303540
EA
ST
(m
m)
130 140 150 160 170 180 190 200 210
Figure 35.Time series of VOGS covering the period of the June 2000 earthquakes. The times
of the June 17 and 21 earthquakes are noted with vertical lines. Vertical axes have
been adjusted for visual clarity.
A significant coseismic deformation signal was observed at all operational ISGPS stations for
both the main earthquakes. Figure 35 shows an 80 day long time window from VOGS covering
the times of the earthquakes. The coseismic displacements due to each of the large earthquakes
can easily be separated. The weighted average of the coordinates is calculated for three time
intervals, using data from 10 days before the earthquakes, three days between the earthquakes
76
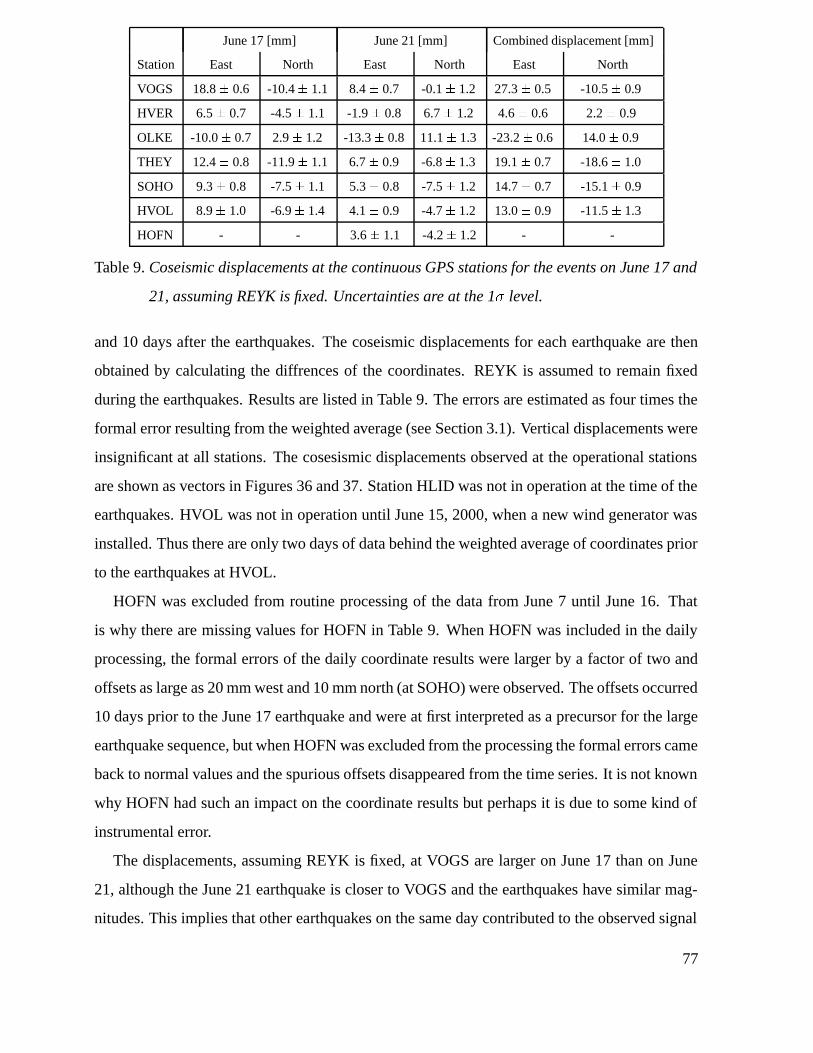
June 17 [mm] June 21 [mm] Combined displacement [mm]
Station East North East North East North
VOGS 18.8� 0.6 -10.4� 1.1 8.4� 0.7 -0.1� 1.2 27.3� 0.5 -10.5� 0.9
HVER 6.5� 0.7 -4.5� 1.1 -1.9� 0.8 6.7� 1.2 4.6� 0.6 2.2� 0.9
OLKE -10.0� 0.7 2.9� 1.2 -13.3� 0.8 11.1� 1.3 -23.2� 0.6 14.0� 0.9
THEY 12.4� 0.8 -11.9� 1.1 6.7� 0.9 -6.8� 1.3 19.1� 0.7 -18.6� 1.0
SOHO 9.3� 0.8 -7.5� 1.1 5.3� 0.8 -7.5� 1.2 14.7� 0.7 -15.1� 0.9
HVOL 8.9� 1.0 -6.9� 1.4 4.1� 0.9 -4.7� 1.2 13.0� 0.9 -11.5� 1.3
HOFN - - 3.6� 1.1 -4.2� 1.2 - -
Table 9.Coseismic displacements at the continuous GPS stations for the events on June 17 and
21, assuming REYK is fixed. Uncertainties are at the 1� level.
and 10 days after the earthquakes. The coseismic displacements for each earthquake are then
obtained by calculating the diffrences of the coordinates. REYK is assumed to remain fixed
during the earthquakes. Results are listed in Table 9. The errors are estimated as four times the
formal error resulting from the weighted average (see Section 3.1). Vertical displacements were
insignificant at all stations. The cosesismic displacements observed at the operational stations
are shown as vectors in Figures 36 and 37. Station HLID was not in operation at the time of the
earthquakes. HVOL was not in operation until June 15, 2000, when a new wind generator was
installed. Thus there are only two days of data behind the weighted average of coordinates prior
to the earthquakes at HVOL.
HOFN was excluded from routine processing of the data from June 7 until June 16. That
is why there are missing values for HOFN in Table 9. When HOFN was included in the daily
processing, the formal errors of the daily coordinate results were larger by a factor of two and
offsets as large as 20 mm west and 10 mm north (at SOHO) were observed. The offsets occurred
10 days prior to the June 17 earthquake and were at first interpreted as a precursor for the large
earthquake sequence, but when HOFN was excluded from the processing the formal errors came
back to normal values and the spurious offsets disappeared from the time series. It is not known
why HOFN had such an impact on the coordinate results but perhaps it is due to some kind of
instrumental error.
The displacements, assuming REYK is fixed, at VOGS are larger on June 17 than on June
21, although the June 21 earthquake is closer to VOGS and the earthquakes have similar mag-
nitudes. This implies that other earthquakes on the same day contributed to the observed signal
77
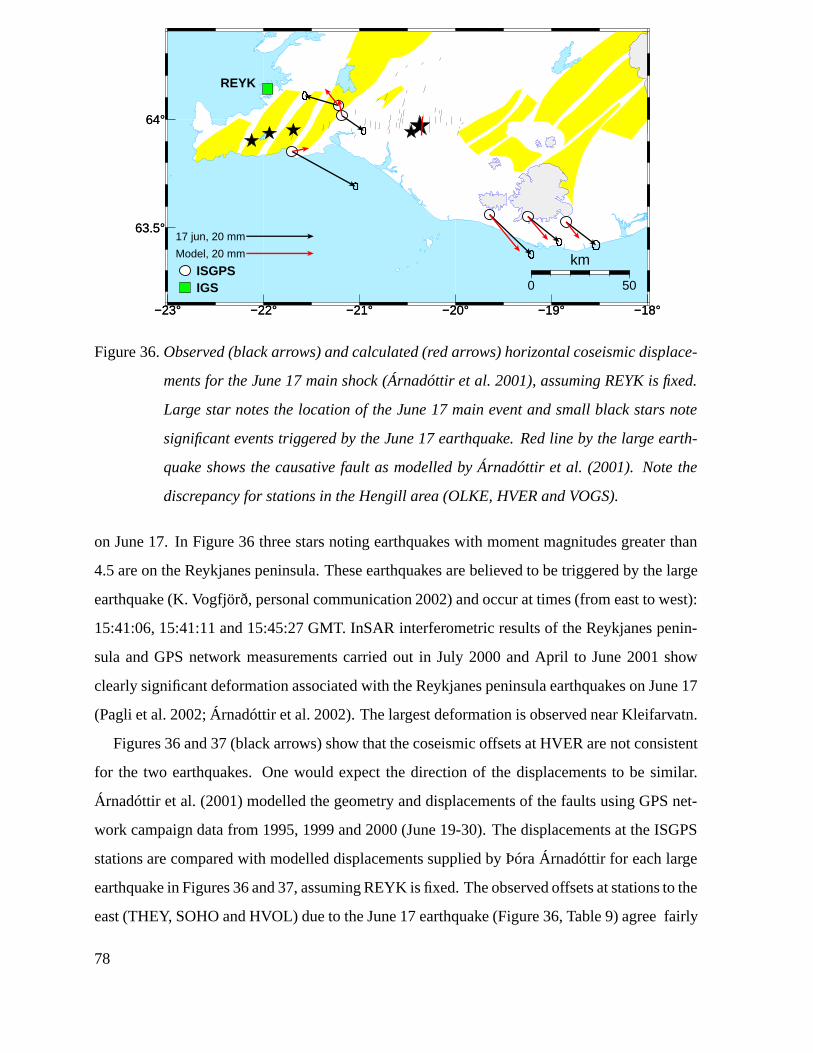
−23° −22° −21° −20° −19° −18°
63.5°
64°
ISGPS IGS
REYK
17 jun, 20 mm
Model, 20 mm
−23° −22° −21° −20° −19° −18°
63.5°
64°
0 50
km
Figure 36.Observed (black arrows) and calculated (red arrows) horizontal coseismic displace-
ments for the June 17 main shock (Árnadóttir et al. 2001), assuming REYK is fixed.
Large star notes the location of the June 17 main event and small black stars note
significant events triggered by the June 17 earthquake. Red line by the large earth-
quake shows the causative fault as modelled by Árnadóttir et al. (2001). Note the
discrepancy for stations in the Hengill area (OLKE, HVER and VOGS).
on June 17. In Figure 36 three stars noting earthquakes with moment magnitudes greater than
4.5 are on the Reykjanes peninsula. These earthquakes are believed to be triggered by the large
earthquake (K. Vogfjörð, personal communication 2002) and occur at times (from east to west):
15:41:06, 15:41:11 and 15:45:27 GMT. InSAR interferometric results of the Reykjanes penin-
sula and GPS network measurements carried out in July 2000 and April to June 2001 show
clearly significant deformation associated with the Reykjanes peninsula earthquakes on June 17
(Pagli et al. 2002; Árnadóttir et al. 2002). The largest deformation is observed near Kleifarvatn.
Figures 36 and 37 (black arrows) show that the coseismic offsets at HVER are not consistent
for the two earthquakes. One would expect the direction of the displacements to be similar.
Árnadóttir et al. (2001) modelled the geometry and displacements of the faults using GPS net-
work campaign data from 1995, 1999 and 2000 (June 19-30). The displacements at the ISGPS
stations are compared with modelled displacements supplied by Þóra Árnadóttir for each large
earthquake in Figures 36 and 37, assuming REYK is fixed. The observed offsets at stations to the
east (THEY, SOHO and HVOL) due to the June 17 earthquake (Figure 36, Table 9) agree fairly
78
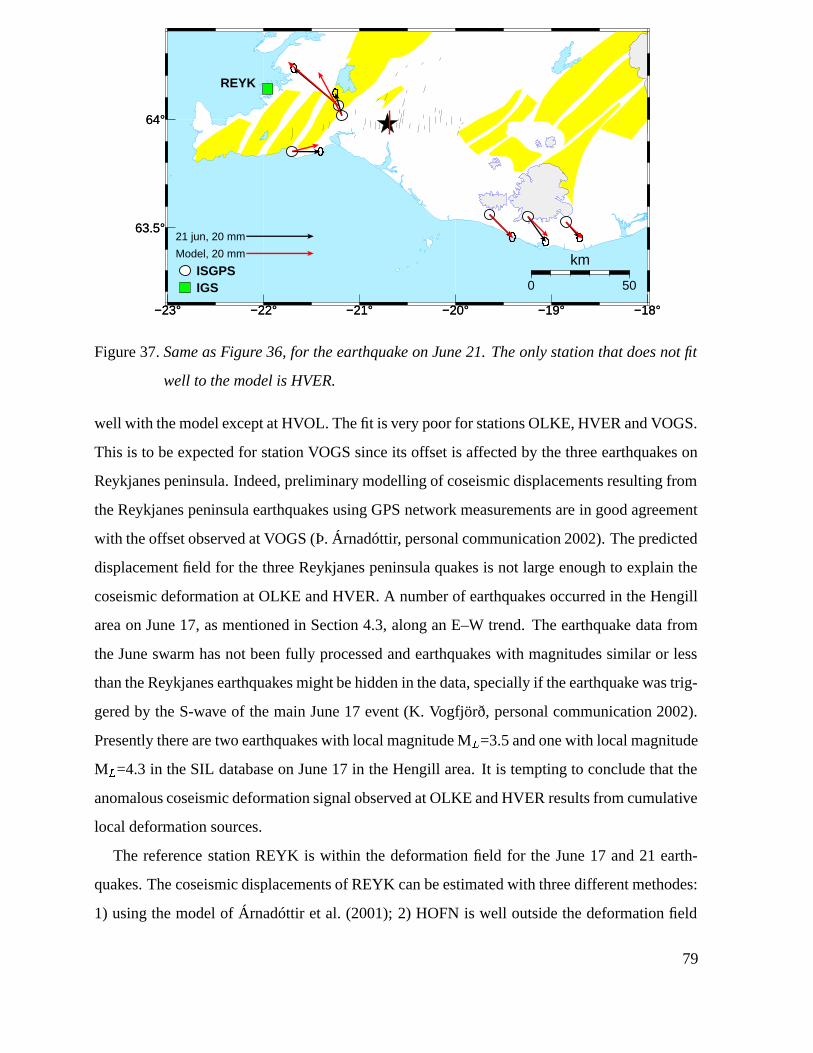
−23° −22° −21° −20° −19° −18°
63.5°
64°
ISGPS IGS
REYK
21 jun, 20 mm
Model, 20 mm
−23° −22° −21° −20° −19° −18°
63.5°
64°
0 50
km
Figure 37.Same as Figure 36, for the earthquake on June 21. The only station that does not fit
well to the model is HVER.
well with the model except at HVOL. The fit is very poor for stations OLKE, HVER and VOGS.
This is to be expected for station VOGS since its offset is affected by the three earthquakes on
Reykjanes peninsula. Indeed, preliminary modelling of coseismic displacements resulting from
the Reykjanes peninsula earthquakes using GPS network measurements are in good agreement
with the offset observed at VOGS (Þ. Árnadóttir, personal communication 2002). The predicted
displacement field for the three Reykjanes peninsula quakes is not large enough to explain the
coseismic deformation at OLKE and HVER. A number of earthquakes occurred in the Hengill
area on June 17, as mentioned in Section 4.3, along an E–W trend. The earthquake data from
the June swarm has not been fully processed and earthquakes with magnitudes similar or less
than the Reykjanes earthquakes might be hidden in the data, specially if the earthquake was trig-
gered by the S-wave of the main June 17 event (K. Vogfjörð, personal communication 2002).
Presently there are two earthquakes with local magnitude M�=3.5 and one with local magnitude
M�=4.3 in the SIL database on June 17 in the Hengill area. It is tempting to conclude that the
anomalous coseismic deformation signal observed at OLKE and HVER results from cumulative
local deformation sources.
The reference station REYK is within the deformation field for the June 17 and 21 earth-
quakes. The coseismic displacements of REYK can be estimated with three different methodes:
1) using the model of Árnadóttir et al. (2001); 2) HOFN is well outside the deformation field
79
of the earthquakes so changes in the baseline REYK-HOFN for the June 21 earthquake can be
attributed to REYK; 3) using data from international analysis centers that include REYK in their
processing. The predicted coseismic displacements for REYK are 1 mm west, 2 mm north the
June 17 event and 3 mm west, 3 mm north for the June 21 event (Þ. Árnadóttir, personal com-
munication 2002). The predicted displacements for HOFN are less than 1 mm (Þ. Árnadóttir,
personal communication 2002). We can thus attribute the coseismic displacements observed at
HOFN (Table 9) to REYK resulting in 3.6� 1.1 mm west and 4.2� 1.2 mm north coseismic
displacement for REYK due to the June 21 earthquake, in good agreement with the predicted
displacements. Visual inspection of time series of REYK from international data processing
centers like SOPAC (2002) and MIT (2002) reveals offsets ranging from 5 to 8 mm towards
west and from 4 to 7 mm towards north for the combined displacements due to the earthquakes.
80
5 CONCLUSIONS
1) The permanent GPS network in Iceland offers the opportunity to observe temporal vari-
ations in crustal deformation fields. The measurements show the plate motions and transients
due to earthquakes and volcanic activity.
2) Data from the ISGPS network are automatically collected and processed on a daily ba-
sis. Scaling factors for the formal errors were estimated 4.0 for the east and north coordinate
components and 2.5 for the vertical component.
3) Vertical offsets of 20 mm downwards are observed when SCIGN radomes are installed.
No significant horizontal offsets are detected due to radome installation.
4) Velocities are determined for the ISGPS stations. The interseismic horizontal velocities
are generally in agreement with the NUVEL-1A plate movement model which predicts that the
North-American and Eurasian plates are moving apart in Iceland at a rate of 19.6 mm/yr.
5) Stations REYK, OLKE, SKRO and AKUR are on the North-American plate and stations
HOFN, HVOL, RHOF, SOHO, THEY, VMEY and VOGS are on the Eurasian plate. Stations
HVER, HLID and KIDJ are within the plate boundary deformation zone moving at intermediate
rates.
6) Vertical movements show that all stations are moving up relative to REYK at rates ranging
from 3 mm/yr to 9 mm/yr.
7) No conclusive signs of intrusive activity in the Hengill area are observed since the stations
in the area were installed in the spring of 1999.
8) No signs of intrusive activity in Eyjafjallajökull are detected at station SOHO which was
installed in September 1999, nor THEY which was installed in May 2000. Thus we conclude
that the intrusion event in Eyjafjallajökull that started in July 1999, had ended or was mostly
over in the fall of 1999.
9) A prominent southward movement is observed at stations SOHO and HVOL near Katla
volcano during the period August 2000 to December 2001. SOHO is moving southwards at
7 mm/yr during the period. Enhanced southward motion during July to August 2001 is also
observed. These movements are interpreted as a magma pressure increase beneath the volcano.
10) Displacements due to the Hekla 2000 eruption were detected at stations SOHO and
HVOL. SOHO recorded 7 mm horizontal motion towards Hekla during the eruption.
11) Coseismic displacements are observed at the times of the June 17 and June 21, 2000,
81

earthquakes in the SISZ. Cosesismic displacements at stations west of the June 17 earthquake in-
clude displacements due to triggered events on Reykjanes peninsula and possibly in the Hengill
area. The displacements for the June 21 earthquake fit well to a model based on network GPS
measurements.
12) Periodic signals, with a period of approximately 1 year, are discernible in east and vertical
components of the time series at most stations. The origin of the movements, i.e. whether they
are measurement artifacts or a real signal from the earth, remains uncertain.
82

ÍSLENSKT ÁGRIP
SAMFELLDAR GPS MÆLINGAR Á ÍSLANDI 1999 TIL 2002
Inngangur
GPS kerfið samanstendur af 24 gervitunglum sem eru á sporbraut um jörðu í um 25.000 km
fjarlægð. GPS gervitunglin senda frá sér bylgjur á tveimur tíðnum: L� = 1575.42 MHz og L� =
1227.60 MHz. Kóði sem inniheldur m.a. upplýsingar um hvað klukkan er hjá gervitunglinu og
hvar það er staðsett er mótaður ofan á burðarbylgjurnar. GPS handtæki nota þennan kóða til að
reikna fjarlægðina til gervitunglanna. Ef fjarlægð til a.m.k. fjögurra gervitungla er þekkt þá er
hægt að reikna þrívíða staðsetningu mælitækisins með nákvæmni upp á nokkra metra.
Jarðskorpuhreyfingar nema örfáum sentimetrum á ári og því þarf sérhæfð GPS landmæl-
ingatæki og sérhæfðan hugbúnað til að fá staðsetningarnákvæmni innan við 1 cm. GPS land-
mælingatæki nota burðarbylgjurnar sjálfar auk kóðans. Til að losna við áhrif skekkjuvalda (t.d.
veðrahvolfs og jónahvolfs) þá eru notaðar afstæðar staðsetningar, þ.a. mælitæki er staðsett
miðað við þekkta staðsetningu annars mælitækis. Nákvæmnin er háð hversu lengi er mælt. Til
að ná nákvæmni innan við 0.5 cm í láréttri staðsetningu og um 1 cm í lóðréttri staðsetningu þarf
að mæla í átta klukkustundir eða lengur.
Ísland er á mótum Evrasíu- og Norður-Ameríkuflekanna sem eru að gliðna í sundur með
hraða sem nemur um 1.9 cm á ári. Flekaskilin liggja eftir Reykjanesinu, um Suðurlandsbrota-
beltið og norður eftir Eystra gosbeltinu. Við Húsavík og Kópasker hliðrast flekaskilin til vesturs
að Kolbeinseyjarhrygg. Gliðnun landsins virðist að mestu fara fram á Eystra gosbeltinu og
Vestra gosbeltið virðist vera lítið virkt. Eldvirkni fylgir að mestu legu flekaskilanna.
Flekaskil eru ekki skörp í þeim skilningi að heildarfærslan mælist yfir staka sprungu. Flekaskil
eru um 20 til 60 km breið svæði þar sem aflögunar gætir. Utan aflögunarsvæða eru plötu-
hreyfingar einsleitar. Á flekaskilum er aflögun skrykkjótt vegna jarðskjálftahrina og eldgosa
(mynd 21).
Stöðvar til samfelldra GPS mælinga
GPS landmælingar á Íslandi til að rannsaka jarðskorpuhreyfingar hófust þegar á upphafsárum
GPS kerfisins 1986. Í GPS landmælingunum er GPS loftneti stillt upp yfir fastmerki sem
er koparnagli í fastri klöpp. Viðtæki tengt loftnetinu safnar gögnunum. Með endurteknum
83
mælingum, á nokkurra mánaða til nokkurra ára fresti, má fylgjast með hvernig staðsetning fast-
merkisins breytist við aflögun jarðskorpunnar. Í samfelldum GPS mælingum er mælitækjunum
komið varanlega fyrir yfir fastmerkinu til að fylgjast með hvernig staðsetning þess breytist með
tíma.
Það eru nokkur þúsund GPS stöðvar til samfelldra mælinga í heiminum í dag. Þær gegna
fjölþættum tilgangi utan þess að mæla jarðskorpuhreyfingar. Fyrsta stöðin til samfelldra GPS
mælinga á Íslandi var sett upp í Reykjavík í nóvember 1995 af Þýsku landmælingastofnuninni
(BKG) í samstarfi við Landmælingar Íslands. Sömu aðilar settu upp stöð í Höfn í Hornafirði í
maí 1997. Gögn frá stöðvunum eru notuð af mörgum alþjóðlegum úrvinnslumiðstöðvum, m.a.
til að reikna út brautir GPS gervitunglanna.
Þrálát jarðskjálftavirkni í Henglinum hófst 1994. Landris (2 cm á ári) mældist á Hengils-
svæðinu samfara jarðskjálftavirkninni, sem tengt var kvikuinnskoti skammt norðvestan við
Hveragerði. Þessir atburðir voru hvati þess að Veðurstofa Íslands, Norræna eldfjallastöðin og
Raunvísindastofnun Háskólans tóku saman höndum um uppbyggingu samfelldra GPS mælinga
á Íslandi og var fyrsta stöðin sett upp á Vogsósum í Selvogi þann 18. mars 1999. Mælanetið
kallast ISGPS og stöðvarnar eru flestar nálægt flekaskilum eða virkum eldfjöllum (mynd 1).
Uppsetning tækjabúnaðar á ISGPS stöðvum hefur að miklu leyti þróast beint út frá net-
mælingum. GPS loftnetið hvílir á fjórfæti úr ryðfríu stáli sem er festur í trausta klöpp. Undir
miðju loftnetinu er fastmerki í klöpp sem er í raun punkturinn sem verið er að mæla. Viðtæki
skráir mælingar frá gervitunglunum á 15 sekúndna fresti í innra minni (myndir 3 og 4). Á
sólarhrings fresti hringir tölva í Reykjavík sjálfvirkt í viðtækin um mótald og sækir gögn frá
tækjunum.
Niðurstöður
Þegar gögn frá öllum samfelldum GPS stöðvum á Íslandi eru komin í hús er unnið sjálfvirkt
úr þeim með spábrautum GPS gervitunglanna og niðurstöður uppfærðar á vefnum. Síðar eru
endanlegar niðurstöður reiknaðar út með nákvæmnustu upplýsingum um brautir gervitunglanna.
Unnið er úr gögnunum með hugbúnaði sem kallast Bernese 4.2. Niðurstöður eru á formi
hnita hverrar stöðvar miðað við gefin hnit viðmiðunarstöðvarinnar í Reykjavík (REYK). Hnit
REYK eru í ITRF97 hnitakerfinu. Tímaraðir staðsetninga stöðvanna (myndir 8 til 20) eru sýndar
sem breytingar frá ákveðnum tímapunkti á staðsetningu stöðva miðað við að staðsetning REYK
84
breytist ekki.
Formlegar óvissur sem úrvinnsluforritið skilar eru of litlar, og eru óvissurnar því marg-
faldaðar með kvörðunartölum: 4.0 í láréttu þáttunum og 2.5 í lóðrétta þættinum. Kvörðunar-
tölurnar eru fengnar með að bera saman formlegu óvissurnar og staðalfrávik í tímaröðunum eftir
að útlagar hafa verið hreinsaðir úr tímaröðunum.
Tímaraðirnar sýna flekahreyfingar sem færslu í austur og suður, í ágætu samræmi við það
sem plötuhreyfingalíkanið NUVEL-1A spáir fyrir um. Færslur vegna Suðurlandsskjálftahrin-
unnar í júní 2000 sjást sem stökk í austur og suður í tímaröðunum. Til að reikna plötuhraða sem
lýsir meðalhreyfingu stöðvarinnar yfir nokkur ár verður fyrst að fjarlægja færslur vegna Suður-
landsskjálftanna úr gögnunum. Fæsluhraðarnir (mynd 26) benda til þess að meginhluti reksins
fari fram á Eystra gosbeltinu, en ekki á Vestra gosbeltinu. GPS netmælingar frá fyrri tíð styðja
þessa niðurstöðu. Lóðréttir færsluhraðar sýna að allar stöðvarnar eru á leiðinni upp, miðað við
REYK, með hraða sem nemur 3 til 9 mm á ári.
Frávik frá NUVEL-1A plötulíkaninu sjást innan aflögunarsvæðis flekaskilanna og við Mýr-
dalsjökul. Stöðvarnar VOGS og OLKE virðast vera á jaðri aflögunarsvæðis flekaskilanna, en
HLID og HVER eru vel innan þess — þó á sínum hvorum flekanum. Miðja flekaskilanna er
á milli HLID og HVER (mynd 27). Stöðin KIDJ er á miðju Suðurlandsbrotabeltinu, um 5 km
vestan við Hestfjallssprunguna sem skalf 21. júní 2000. Stöðin hreyfist hraðar til norðurs en
nálægar stöðvar (mynd 27) og kann það að stafa af áframhaldandi hreyfingum á misgenginu
eftir jarðskjálftann.
Stöðvarnar HVER og OLKE eru nálægt miðju risins sem mældist á Hengilssvæðinu 1994
til 1998. Þær sýna engin merki um áframhaldandi ris frá því þær voru settar upp (vor 1999).
Hugsanlegt er þó að risi hafi verið að ljúka um það leyti.
Stöðvar við Mýrdalsjökul benda til þess að kvikuþrýstingur undir Kötlu sé að aukast. Stöðin
á Sólheimaheiði (SOHO) er um 5 km SV af öskjubrún Kötlu. SOHO er að færast frá öskjunni,
í júlí og ágúst 2001 færist stöðin til suðurs um 4 mm. GPS netmælingar á öskjubrún Kötlu
og í kringum Mýrdalsjökul styðja þessar niðurstöður. Nauðsynlegt er að fylgjast grannt með
jarðskorpuhreyfingum við Kötlu í framtíðinni og mun SOHO gegna lykilhlutverki þar.
Heklugosið í febrúar 2000 kom vel fram á SOHO og einnig vottaði fyrir því á HVOL þrátt
fyrir að stöðvarnar séu í yfir 50 km fjarlægð frá Heklu. Færslurnar voru í átt að Heklu og
endurspegla þrýstiminnkun í kvikuþró undir Heklu. SOHO færðist um 7 mm í átt að Heklu
á meðan á gosinu stóð. Færslunum ber ágætlega saman við líkan sem byggt er á gögnum frá
85
þenslumælum Veðurstofu Íslands. Í janúar 2002 hófust samfelldar GPS mælingar við Ísakot,
um 15 km frá Heklu. Sú stöð bætir eftirlit með Heklu til muna.
Í júní 2000 urðu tveir stórir skjálftar (með vægisstærðir (M� ) 6.5 og 6.4) á Suðurlands-
brotabeltinu með þriggja og hálfs sólarhrings millibili. Samfara skjálftunum á Suðurlandi varð
mikil jarðskjálftavirkni út eftir Reykjanesskaganum. Færslur vegna hvors skjálfta um sig eru vel
aðgreinanlegar. Færslurnar á Vogsósum (VOGS) eru minni í seinni skjálftanum þó að skjálft-
arnir séu hér um bil jafnstórir og seinni skjálftinn sé nær. Það bendir til áhrifa frá smærri
skjálftum sem urðu úti á Reykjanesi nokkrum mínútum eftir Holtaskjálftann 17. júní 2000.
Færslum vegna Hestfjallsskjálftans 21. júní 2000 ber ágætlega saman við líkan byggt á GPS
netmælingum. Viðmiðunarstöðin í Reykjavík var innan aflögunarsvæðis Suðurlandsskjálftanna.
Hlutverk ISGPS kerfisins í vöktun eldfjalla er mikilvægt. Katla á eftir að bæra á sér fyrr
eða síðar og því er mikilvægt að fylgjast vel með jarðskorpuhreyfingum þar. Það er ákjósanlegt
að fjölga stöðvum til að fylgjast með öðrum virkum eldstöðvum eins og Grímsvötnum, Öskju
og Kröflu. Suðurlandsskjálftarnir 2000 eru taldir marka upphaf aukinnar jarðskjálftavirkni á
Suðurlandi og því er fýsilegt að fjölga stöðvum á Suðurlandi í framtíðinni. Ákjósanlegt er að
koma gagnasöfnun og úrvinnslu nær rauntíma, til dæmis á klukkustundar fresti, til að bæta
rauntímaeftirlit með jarðvá. Í framhaldi af því mætti þróa sjálfvirkt viðvörunarkerfi sem lætur
vita ef hreyfingar eru óeðlilegar. Í heildina séð hefur ISGPS kerfið réttlætt tilvist sína og tryggja
verður áframhaldandi rekstur og þróun þess.
86
6 REFERENCES
Ashtech 2001. Remote33. URL: ftp://ftp.ashtech.com/pub/software/remote33/.
Ágústsson, K. 1998. Jarðskjálftahrina á Hellisheiði og í Hengli í maí–júlí 1998. Sjálfvirkar
staðsetningar SIL mælanetsins.Veðurstofa Íslands – GreinargerðVÍ-G98040-JA06. Re-
port, Icelandic Meteorological Office. In Icelandic.
Ágústsson, K. 2000. Katla og Eyjafjallajökull - nokkur líkön og hugleiðingar.Veðurstofa
Íslands – GreinargerðVÍ-G00002-JA01. Report, Icelandic Meteorological Office. In Ice-
landic.
Ágústsson, K., R. Stefánsson, A. T. Linde, P. Einarsson, S. I. Sacks, G. B. Guðmundsson and
B. S. Þorbjarnardóttir 2000. Successful prediction and warning of the 2000 eruption of
Hekla based on seismicity and strain changes. In: Abstracts from the AGU Fall Meeting,
San Fransisco, California, December 15-19, 2000.
Árnadóttir, Þ., H. Geirsson, B. H. Bergsson and C. Völksen 2000. The Icelandic continuous
GPS network – ISGPS. March 18, 1999 – February 20, 2000.Rit Veðurstofu ÍslandsVÍ-
R00002-JA02. Research report, Icelandic Meteorological Office.
Árnadóttir, Þ., S. Hreinsdóttir, G. B. Guðmundsson, P. Einarsson, M. Heinert and C. Völksen
2001. Crustal deformation measured by GPS in the South Iceland Seismic Zone due to two
large earthquakes in June 2000.Geophys. Res. Lett.28 (21), 4031–4033.
Árnadóttir, Þ., H. Geirsson, E. Sturkell and P. Einarsson 2002. Jarðskorpuhreyfingar á Reykja-
nesskaga frá 1998 til 2001. In: Abstracts from the Spring Meeting of the Geoscience
Society of Iceland, Reykjavík, April 15, 2002. In Icelandic.
Árnason, K., G. I. Haraldsson, G. V. Johnsen, G. Þorbergsson, G. Hersir, K. Sæmundsson, L. S.
Georgsson and S. P. Snorrason 1986. Nesjavellir, jarðfræði- og jarðeðlisfræðileg könnun.
Skýrsla OrkustofnunarOS-86014/JHD-02. Technical report, National Energy Authority,
Reykjavík. In Icelandic.
Björnsson, A., G. Johnsen, S. Sigurðsson, G. Þorbergsson and E. Tryggvason 1979. Rifting of
the plate boundary in North Iceland 1975-1978.J. Geophys. Res.84, 3029–3038.
Björnsson, H., F. Pálsson and M. T. Guðmundsson 2000. Surface and bedrock topography of the
Mýrdalsjökull ice cap, Iceland: The Katla caldera, eruption sites and routes of jökulhlaups.
Jökull49, 29–46.
87
Boucher, C., Z. Altamimi and P. Sillard 1999. The 1997 International Terrestrial Reference
Frame (ITRF97).IERS Technical Note27.
Braun, J. 2000. Notes on velocity estimation with ADDNEQ. University NAVSTAR Con-
sortium, Boulder, Colorado. URL: http://www.unavco.ucar.edu/�braunj/bernese/lectures
/addneq_notes/vel_est.html. Last modified June 6, 2000.
Braun, J., B. Stephens, O. Ruud and C. Meertens 1997. The effect of antenna cov-
ers on GPS baseline solutions. University NAVSTAR Consortium, Boulder, Col-
orado. URL: http://www.unavco.ucar.edu/science_tech/dev_test/publications/dome_-
report/domeX5Freport-1.html.
Brockmann, E. 1997. Combination of solutions for geodetic and geodynamic applications of
the Global Positioning System (GPS).Report Band55, Schweizerischen Geodätischen
Kommission, Zurich, Switzerland.
Böðvarsson, R., S. Th. Rögnvaldsson, S. S. Jakobsdóttir, R. Slunga and R. Stefánsson 1996.
The SIL data acquisition and monitoring system.Seism. Res. Lett.67 (5), 35–67.
Dahm, T. and B. Brandsdóttir 1997. Moment tensors of microearthquakes from the Eyjafjalla-
jökull volcano in South Iceland.Geophys. J. Int.130, 183–192.
DeMets, C., R. G. Gordon, D. F. Argus and S. Stein 1990. Current plate motions.Geophys. J.
Int. 101, 425–478.
DeMets, C., R. G. Gordon, D. F. Argus and S. Stein 1994. Effect of recent revisions to the
geomagnetic reversal time scale on estimates of current plate motions.Geophys. Res. Lett.
21, 2191–2194.
Dixon, T. H. 1991. An introduction to the Global Positioning System and some geological
applications.Reviews of Geophysics29 (2), 249–276.
Einarsson, P. 1994. Crustal movements and relative sea level changes in Iceland. In: G. Viggós-
son (editor),Proceedings of the Hornafjörður International Coastal Symposium. The Ice-
landic Harbour Authority.
Einarsson, P., S. Björnsson, G. R. Foulger, R. Stefánsson and Þ. Skaftadóttir 1981. Seismicity
pattern in the South Iceland seismic zone. In: D. Simpson & P. G. Richards (editors),
Earthquake Prediction – An International Review. American Geophysical Union,Maurice
Ewing Series4, 141–151.
88
Einarsson, P. and B. Brandsdóttir 2000. Earthquakes in the Mýrdalsjökull area, Iceland, 1978–
1985: Seasonal correlation and connection with volcanoes.Jökull49, 59–73.
Einarsson, P., A. E. Clifton, F. Sigmundsson and R. Sigbjörnsson 2000. The South Iceland
earthquakes of June 2000: Tectonic environment and effects. Abstracts from the AGU Fall
Meeting, San Fransisco, California, December 15-19, 2000.
Einarsson, P. and J. Eiríksson 1982. Earthquake fractures in the districts Land and Rangárvellir
in the South Iceland Seismic Zone.Jökull32, 113–119.
Einarsson, P. and K. Sæmundsson 1987. Earthquake epicenters 1982–1985 and volcanic sys-
tems in Iceland. In: Þ. I. Sigfússon (editor),Í hlutarins eðli. Map accompanying Festschrift
for Þorbjörn Sigurgeirsson. Menningarsjóður, Reykjavík.
Estey, L. H. and C. M. Meertens 1999. TEQC: the multi-purpose toolkit for GPS/GLONASS
data.GPS Solutions3 (1), 44–49.
Feigl, K. L., J. Gasperi, F. Sigmundsson and A. Rigo 2000. Crustal deformation near Hengill
volcano, Iceland, 1993-1998: Coupling between magmatic activity and faulting inferred
from elastic modeling of satellite radar interferograms.J. Geophys. Res.105 (B11), 25655–
25670.
Foulger, G. R., R. Bilham, W. J. Morgan and P. Einarsson 1986. The Iceland GPS geodetic field
campaign 1986.EOS, Trans. Am. Geophys. Un., 1236.
Gurtner, W. 1994. RINEX: the Receiver-Independent Exchange Format.GPS World, July,
48–52.
Heinert, M. and J. Perlt 2002. Relationship of seismic events and divergent plate motion in
Iceland. In: Abstracts from the XXVII EGS General Assembly, Nice, France, April 21-26,
2002.
Heki, K. 2001. Seasonal modulation of interseismic strain buildup in northeastern Japan driven
by snow loads.Science293, 89–92.
Heki, K., G. R. Foulger, B. R. Julian and C. H. Jahn 1993. Plate dynamics near divergent
boundaries: Geophysical implications of postrifting crustal deformation in NE Iceland.J.
Geophys. Res.98 (B8), 14279–14297.
Hreinsdóttir, S. 1999.GPS geodetic measurements on the Reykjanes Peninsula, SW Iceland:
crustal deformation from 1993 to 1998. Master’s thesis, University of Iceland, Reykjavík.
89
Hugentobler, U., S. Schaer and P. Fridez 2001.Bernese GPS software version 4.2. Astronomical
Institute, University of Berne, Berne.
IGS 2002. IGS naming conventions. URL: http://igscb.jpl.nasa.gov/igscb/station/general/rcvr-
_ant.tab. Last modified March 5, 2002.
Jónsson, S. 1996.Crustal deformation across a divergent plate boundary, the Eastern Volcanic
Rift Zone, South Iceland, 1967–1994 using GPS and EDM. Master’s thesis, University of
Iceland, Reykjavík.
Jónsson, S., P. Einarsson and F. Sigmundsson 1997. Extension across a divergent plate bound-
ary, the Eastern Volcanic Rift Zone, South Iceland, 1967–1994, observed with GPS and
electronic distance measurements.J. Geophys. Res.112 (B6), 11913–11929.
JPL 2001. GPS time series. Jet Propulsion Laboratory, California Institute of Technology. URL:
http://sideshow.jpl.nasa.gov/mbh/series.html.
Kirchner, M. 2001.Study of local site displacements due to ocean tide loading using a GPS net-
work in Iceland. Report, Onsala Space Observatory, Chalmers University of Technology,
Onsala.
Langbein, J. and H. Johnson 1997. Correlated errors in geodetic time series: Implications for
time-dependent deformation.J. Geophys. Res.102, 591–603.
Larsen, G. 2000. Holocene eruptions within the Katla volcanic system, South Iceland: Charac-
teristics and environmental impact.Jökull49, 1–28.
Leick, A. 1990.GPS satellite surveying. John Wiley & Sons, New York.
Linde, A. T., K. Ágústsson, I. S. Sacks and R. Stefánsson 1993. Mechanism of the 1991 eruption
of Hekla from continuous borhole strain monitoring.Nature365, 737–740.
Lowry, A. R., M. W. Hamburger, C. M. Meertens and E. G. Ramos 2001. GPS monitoring of
crustal deformation at Taal volcano, Philippines.J. Volc. Geotherm. Res.105, 35–47.
Mao, A., C. G. A. Harrison and T. H. Dixon 1999. Noise in GPS coordinate time series.J.
Geophys. Res.104 (B2), 2797–2816.
McCarthy, D. D. 1992. IERS Standards.Technical Report, IERS Technical Note13, Observa-
torie de Paris, Paris.
McCarthy, D. D. 1996. IERS Conventions.Technical Report, IERS Technical Note21, Obser-
vatorie de Paris, Paris.
90
MIT 2002. MIT global time series web page. Geodesy and Geodynamics Laboratory, Mas-
sachusetts Institution of Technology, US. URL: http://bowie.mit.edu/�fresh/.
Murakami, M. and S. Miyazaki 2001. Periodicity of strain accumulation detected by perma-
nent GPS array: Possible relationship to seasonality of major earthquakes’ occurrence.
Geophys. Res. Lett.28 (15), 2983–2987.
Newman, A. W., T. H. Dixon, G. Ofoegbu and J. E. Dixon 2001. Geodetic and seismic con-
straints on recent activity at Long Valley Caldera, California: evidence for viscoelastic
rheology.J. Volc. Geotherm. Res.105, 183–206.
Owen, S., P. Segall, M. Lisowski, M. Murray, M. Bevis and J. Foster 2000. The January 30, 1997
eruptive event on Kilauea Volcano, Hawaii, as monitored by continuous GPS.Geophys.
Res. Lett.27, 2757–2760.
Pagli, C., R. Pedersen, F. Sigmundsson and K. Feigl 2002. Crustal deformation at the Reykjanes
Peninsula, Iceland, from 1992 to 2000, measured by satellite radar interferometry. In:
Abstracts from the 25th Nordic Geological Winter Meeting, Reykjavík, Iceland, January
6-9, 2002.
Pedersen, R., F. Sigmundsson, K. L. Feigl and Þ. Árnadóttir 2001. Coseismic interferograms
of two Ms=6.6 earthquakes in the South Iceland Seismic Zone, June 2000.Geophys. Res.
Lett.28 (17), 3341–3344.
Poutanen, M., H. Koivula and M. Ollikainen 2001. On the periodicity of GPS time series.
Abstracts from the IAG Scientific Assembly, Budapest, Hungary, September 2-7, 2001.
Press, W. H., S. A. Teukolsky, W. T. Vetterling and B. P. Flannery 1992.Numerical recipies in
C. Cambridge University Press, Cambridge.
Rögnvaldsson, S. Th., G. B. Guðmundsson, K. Ágústsson, S. S. Jakobsdóttir, R. Slunga and
R. Stefánsson 1998a. Overview of the 1993-1996 seismicity near Hengill.Rit Veðurstofu
Íslands, VÍ-R98006-JA05. Research report, Icelandic Meteorological Office.
Rögnvaldsson, S. Th., Þ. Árnadóttir, K. Ágústsson, Þ. Skaftadóttir, G. B. Guðmundsson,
G. Björnsson, K. S. Vogfjörð, R. Stefánsson, R. Böðvarsson, R. Slunga, S. S. Jakobs-
dóttir, B. S. Þorbjarnardóttir, P. Erlendsson, B. H. Bergsson, S. Ragnarsson, P. Halldórs-
son, B. Þorkelsson and M. Ásgeirsdóttir 1998b. Skjálftahrina í Ölfusi í nóvember 1998.
Veðurstofa Íslands – GreinargerðVÍ-R98046-JA09. Report, Icelandic Meteorological Of-
91
fice. In Icelandic.
Scherneck, H. G., J. M. Johansson, M. Vermeer, J. L. Davis, G. A. Milne and J. X. Mitro-
vica 2001. BIFROST project: 3-D crustal deformation rates derived from GPS confirm
postglacial rebound in Fennoscandia.Earth, Planets and Space53 (7), 703–708.
SCIGN 2001. SCIGN Radome Project. Southern California Integrated GPS Network, USGS
Pasadena Field Office. URL: http://pasadena.wr.usgs.gov/scign/group/dome/. Last modi-
fied April 30, 2001.
Sella, G. F., T. H. Dixon and A. Mao 2002. REVEL: A model for recent plate velocities from
space geodesy.J. Geophys. Res.In press.
Sigmundsson, F. 1990.Seigja jarðar undir Íslandi, samanburður líkanreikninga við jarðfræði-
leg gögn.Master’s thesis, University of Iceland, Reykjavík. In Icelandic.
Sigmundsson, F. 1992. Ný tegund landmælinga: GPS-landmælingar.Tæknivísir, 9–13. In
Icelandic.
Sigmundsson, F., P. Einarsson and R. Bilham 1992. Magma chamber deflation recorded by
the Global Positioning System: The Hekla 1991 eruption.Geophys. Res. Lett.19 (14),
1483–1486.
Sigmundsson, F., P. Einarsson, R. Bilham and E. Sturkell 1995. Rift-transform kinematics in
South Iceland: Deformation from Global Positioning System measurements, 1986 to 1992.
J. Geophys. Res.100 (B4), 6235–6248.
Sigmundsson, F., P. Einarsson, S. Th. Rögnvaldsson, G. Foulger, K. Hodkinson and G. Þor-
bergsson 1997. The 1994–1995 seismicity and deformation at the Hengill triple junction,
Iceland: Triggering of earthquakes by an inflating magma chamber in a zone of horizontal
shear stress.J. Geophys. Res.102, 15151–15161.
Sigurðsson, O., S. Zóphóníasson and E. Ísleifsson 2000. Jökulhlaup úr Sólheimajökli 18. júlí
1999.Jökull49, 75–80. In Icelandic.
Sæmundsson, K. 1967. Vulkanismus und Tektonik des Hengill-Gebietes in Südwest Island.
Acta Naturalia Islandica2. In German.
Soosalu, H. and P. Einarsson 1997. Seismicity around the Hekla and Torfajökull volcanoes,
Iceland, during a volcanically quiet period, 1991–1995.Bull. Volcanol.59, 36–48.
SOPAC 2002. Permanent GPS site time series. Scripps Orbit and Permanent Array Center.
92
URL: http://sopac.ucsd.edu/scripts/dbTimeseriesSites.cgi.
Stefánsson, R., R. Böðvarsson, R. Slunga, P. Einarsson, S. S. Jakobsdóttir, H. Bungum,
S. Gregersen, J. Havskov, J. Hjelme and H. Korhonen 1993. Earthquake prediction re-
search in the South Iceland Seismic Zone and the SIL project.Bull. Seism. Soc. Am.83
(3), 696–716.
Stefánsson, R., G. B. Guðmundsson and P. Halldórsson 2000. The two large earthquakes in the
South Iceland seismic zone on June 17 and 21, 2000.Veðurstofa Íslands – Greinargerð
VÍ-G00010-JA04. Report, Icelandic Meteorological Office.
Stefánsson, R., A. T. Linde and I. S. Sacks 1983. Strain signals in Iceland.Carnegie Institution
of Washington – Year Book82, 512–514.
Sturkell, E., H. Geirsson, P. Einarsson and F. Sigmundsson 2002a. Crustal deformation in
Eyjafjallajökull and Mýrdalsjökull from July 2000 to April 2002. In: Abstracts from the
Spring Meeting of the Geoscience Society of Iceland, Reykjavík, April 15, 2002.
Sturkell, E., F. Sigmundsson and P. Einarsson 2002b. 1994 and 1999 unrest and magma move-
ments at Eyjafjallajökull and Katla volcanoes, Iceland.J. Geophys. Res.Submitted.
Tregoning, P., R. Boers, D. O’Brien and M. Hendy 1998. Accuracy of absolute precipitable
water vapor estimates from GPS observations.J. Geophys. Res.103, 28901–28910.
Tryggvason, E. 1960. Earthquakes, jökulhlaups and subglacial eruptions.Jökull10, 18–22.
Tryggvason, E. 1973. Surface deformation and crustal structure in the Mýrdalsjökull area of
South Iceland.J. Geophys. Res.78 (14), 2488–2497.
Tryggvason, E. 1984. Widening of the Krafla fissure swarm during the 1975–1981 volcano-
tectonic episode.Bull. Volcanol.47, 47–69.
Tryggvason, E. 1986. Multiple magma reservoirs in a rift zone volcano: Ground deformation
and magma transport during the September 1984 eruption of Krafla, Iceland.J. Volc.
Geotherm. Res.28, 1–44.
Tryggvason, E. 1994. Observed ground deformation at Hekla, Iceland, prior to and during the
eruptions of 1970, 1980–1981.J. Volc. Geotherm. Res.61, 281–291.
Tryggvason, E. 2000. Ground deformation of Katla: Results of precision levelling 1967–1995.
Jökull48, 1–8.
UNAVCO 2001a. Antenna radomes. URL: http://www.unavco.ucar.edu/project_support/equip-
93
ment/permanent_station/antennas/radomes.html. Last modified September 21, 2001.
UNAVCO 2001b. Receiver downloading. URL: http://www.unavco.ucar.edu/data_support/soft-
ware/download/download.html. Last modified September 7, 2001.
Vogfjörð, K. 2002. Var eldgos orsök jarðskjálftaóróans í Sólheimajökulshlaupinu, 17. júlí 1999?
In: Abstracts from the Spring Meeting of the Geoscience Society of Iceland, Reykjavík,
April 15, 2002. In Icelandic.
Webb, F. H. and J. F. Zumberge 1993. An introduction to GIPSY/OASIS-II precision software
for the analysis of data from the Global Positioning System.JPL Publ.No. D-11088, Jet
Propulsion Laboratory, Pasadena, California.
Wübbena, G., M. Schmitz, F. Menge, G. Seeber and C. Völksen 1997. A new approach for field
calibration of absolute antenna phase center variations.Navigation44.
Þorbergsson, G. 1999. Nesjavallaveita. GPS-mælingar og mælingar yfir sprungur á
Hengilssvæði 1999.Skýrsla OrkustofnunarOS-99077. Technical report, National Energy
Authority, Reykjavík. In Icelandic.
Þorbergsson, G. and G. H. Vigfússon 1998. Nesjavallaveita. Fallmælingar og GPS-mælingar á
Hengilssvæði 1998.Skýrsla OrkustofnunarOS-98060. Technical report, National Energy
Authority, Reykjavík. In Icelandic.
Þórarinsson, S. 1967. The eruptions of Hekla in historical times. A tephrocronological study.
In: The eruption of Hekla 1947–1948I. Soc. Scientarium Islandica, 1–170.
94


![Chapter 5...earthquake source inversions based on seismological and high-rate GPS data suggest that the earthquakes off Miyagi [Miura et al., 2006; Umino et al., 2006], Sanriku [Tanioka](https://img.pdfslide.us/doc/110x75/5fc9c6df34294d7640473a7f/chapter-5-earthquake-source-inversions-based-on-seismological-and-high-rate.jpg)

![Sony Gps Navigation Nv u94t [ET]](https://img.pdfslide.us/doc/110x75/55cf8ed2550346703b95f822/sony-gps-navigation-nv-u94t-et.jpg)