Embed Size (px)
Citation preview
East Tennessee State UniversityDigital Commons @ East
Tennessee State University
Electronic Theses and Dissertations Student Works
12-2017
Continuing Professional Education for LicensedAccountants in TennesseeBrian J. LucasEast Tennessee State University
Follow this and additional works at: https://dc.etsu.edu/etd
Part of the Accounting Commons, and the Adult and Continuing Education Commons
This Dissertation - Open Access is brought to you for free and open access by the Student Works at Digital Commons @ East Tennessee StateUniversity. It has been accepted for inclusion in Electronic Theses and Dissertations by an authorized administrator of Digital Commons @ EastTennessee State University. For more information, please contact [email protected].
Recommended CitationLucas, Brian J., "Continuing Professional Education for Licensed Accountants in Tennessee" (2017). Electronic Theses and Dissertations.Paper 3318. https://dc.etsu.edu/etd/3318

Continuing Professional Education for
Licensed Accountants in Tennessee
____________________________________
A dissertation
presented to
the faculty of the Department of Educational Leadership and Policy Analysis
East Tennessee State University
____________________________________
In partial fulfillment
of the requirements for the degree
Doctor of Education in Educational Leadership
____________________________________
by
Brian J. Lucas
December 2017
____________________________________
Dr. James Lampley, Chair
Dr. Lana Lowe Becker
Dr. Bethany Flora
Dr. Donald Good
Keywords: Continuing Professional Education, Continuing Professional Development,
Certified Public Accountant.

2
ABSTRACT
Continuing Professional Education for
Licensed Accountants in Tennessee
by
Brian Lucas
Accounting is a professional occupation that is continually evolving and requires a dedication to
continuing education to meet the legal demands of new regulations and to maintain professional
competency. Continuing Professional Education (CPE) is required by state boards for certified
public accountants (CPA) to meet these requirements and to maintain professional competence.
CPAs are responsible for complying with all applicable CPE requirements, rules, and regulations
of state boards of accountancy, as well as those of other professional organizations.
The purpose of this study was to determine the opinions of CPAs about the current requirements
for CPE and to determine their level of satisfaction with the content and delivery of CPE
instruction. CPE has come under scrutiny in recent years with some professionals questioning if
the needs of accounting professional and the objectives of continuing education are being met.
This survey research included 23 Likert-type items and 5 demographic questions. The survey
was administered to 203 licensed certified public accountants to obtain their opinions about
continuing education. The 5 dimensions of the survey were: Value (cost benefit), Delivery
(methods and quality), Benefit to Self, Benefit to Others, and Barriers (to obtaining CPE). These
3
dimensions were compared across the demographic variables of gender, years of experience,
type of business, number of employees, and position with their employer.
No significant differences were found among the 5 dimensions between gender or among
different positions. Significant differences did occur among the Dimension of Value opinions
based on years of experience, among the Dimension of Value opinions based on type of
business, among Dimension of Benefit to Self based on type of business, among the Dimension
of Value based on number of employees, and among the Dimension of Benefit to Others based
on number of employees.

4
DEDICATION
I dedicate this dissertation work to the loving memory of my parents, Dr. George J. Lucas
and Margaret E. Lucas who both taught me the value of education. Through their personal lives,
they taught me that education adds to the quality of life. Education is an abstract value that is
priceless and can never be lost, stolen, or taken away. It lasts a lifetime and the knowledge can
be shared freely.
My immediate family including my wife Pat and two daughters Rachel and Leah, also
deserve special recognition and gratitude for tolerating me devoting time to my work and studies
instead of devoting time to them as they deserved. I will have to make up time I owe to them in
the future.

5
ACKNOWLEDGEMENTS
Most importantly I wish to thank Jesus Christ for giving me the strength to continue my
pursuit of education, as He helped to guide me on the new path that I had chosen.
I would also like to express my sincere appreciation to all the faculty of the Educational
Leadership and Policy Analysis department at East Tennessee State University for their
generosity for sharing with the students their knowledge and enthusiasm for education.
In addition, I would like to mention and give a special thanks to Ronnie Maye, a former
ELPA student, who initially informed me about the program and inspired me to investigate it.
Without him, I may have never known about the ELPA program in order for me to pursue my
dream.
6
TABLE OF CONTENTS
Page
ABSTRACT .........................................................................................................................2
DEDICATION .....................................................................................................................4
ACKNOWLEDGMENTS ...................................................................................................5
TABLE OF CONTENTS .....................................................................................................6
LIST OF TABLES ...............................................................................................................9
LIST OF FIGURES ...........................................................................................................11
Chapter
1. INTRODUCTION .....................................................................................................12
Statement of the Problem .......................................................................................13
Research Questions ................................................................................................14
Significance of the Study .......................................................................................15
Limitations and Delimitations ................................................................................15
Definitions of Terms ..............................................................................................16
Overview of Study .................................................................................................17
2. REVIEW OF LITERATURE ....................................................................................18
Continuing Education ............................................................................................18
Continuing Education of the Accounting Profession.............................................21
Opinions About Current CPE Regulations ............................................................25
Barriers to Obtaining Required CPE......................................................................30
Current Direction of CPE in Accounting ...............................................................33

7
Suggestions for Improvement ................................................................................36
Chapter Summary ..................................................................................................47
3. RESEARCH METHOD.............................................................................................49
Research Questions and Null Hypothesis ..............................................................49
Instrumentation ......................................................................................................54
Population and Sample ..........................................................................................55
Data Collection ......................................................................................................55
Data Analysis .........................................................................................................56
Chapter Summary ..................................................................................................56
4. RESULTS ..................................................................................................................57
Research Question 1 ..............................................................................................59
Research Question 2 ..............................................................................................66
Research Question 3 ..............................................................................................72
Research Question 4 ..............................................................................................79
Research Question 5 ..............................................................................................86
5. SUMMARY, CONCLUSIONS, AND RECOMMENDATIONS ............................92
Summary of Findings .............................................................................................92
Discussion ..............................................................................................................95
Conclusion .............................................................................................................98
Recommendations for Practice ..............................................................................99
Recommendations for Further Research ..............................................................100
REFERENCES ................................................................................................................101
8
APPENDICES .................................................................................................................103
APPENDIX A: CPE Requirements of the State of Tennessee ............................103
APPENDIX B: CPE Survey ................................................................................105
APPENDIX C: Survey Question Numbers by Dimension ..................................111
VITA ...............................................................................................................................113
9
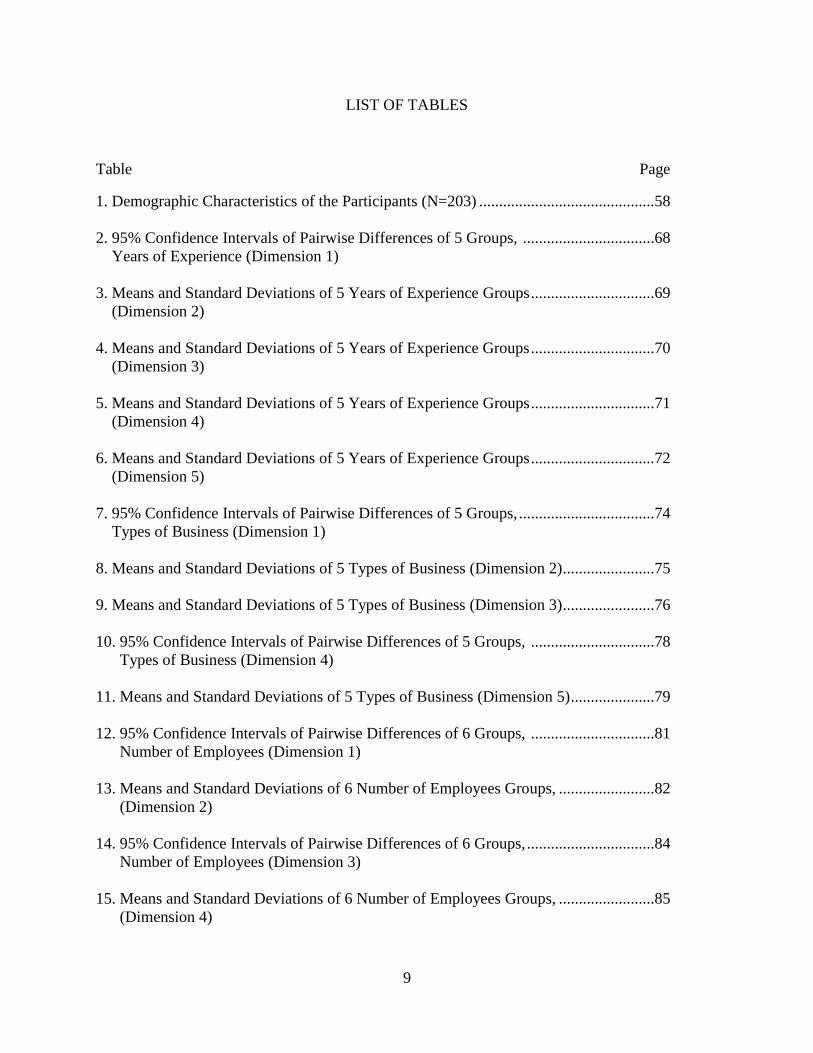
LIST OF TABLES
Table Page
1. Demographic Characteristics of the Participants (N=203) ............................................58
2. 95% Confidence Intervals of Pairwise Differences of 5 Groups, .................................68
Years of Experience (Dimension 1)
3. Means and Standard Deviations of 5 Years of Experience Groups ...............................69
(Dimension 2)
4. Means and Standard Deviations of 5 Years of Experience Groups ...............................70
(Dimension 3)
5. Means and Standard Deviations of 5 Years of Experience Groups ...............................71
(Dimension 4)
6. Means and Standard Deviations of 5 Years of Experience Groups ...............................72
(Dimension 5)
7. 95% Confidence Intervals of Pairwise Differences of 5 Groups, ..................................74
Types of Business (Dimension 1)
8. Means and Standard Deviations of 5 Types of Business (Dimension 2) .......................75
9. Means and Standard Deviations of 5 Types of Business (Dimension 3) .......................76
10. 95% Confidence Intervals of Pairwise Differences of 5 Groups, ...............................78
Types of Business (Dimension 4)
11. Means and Standard Deviations of 5 Types of Business (Dimension 5) .....................79
12. 95% Confidence Intervals of Pairwise Differences of 6 Groups, ...............................81
Number of Employees (Dimension 1)
13. Means and Standard Deviations of 6 Number of Employees Groups, ........................82
(Dimension 2)
14. 95% Confidence Intervals of Pairwise Differences of 6 Groups, ................................84
Number of Employees (Dimension 3)
15. Means and Standard Deviations of 6 Number of Employees Groups, ........................85
(Dimension 4)
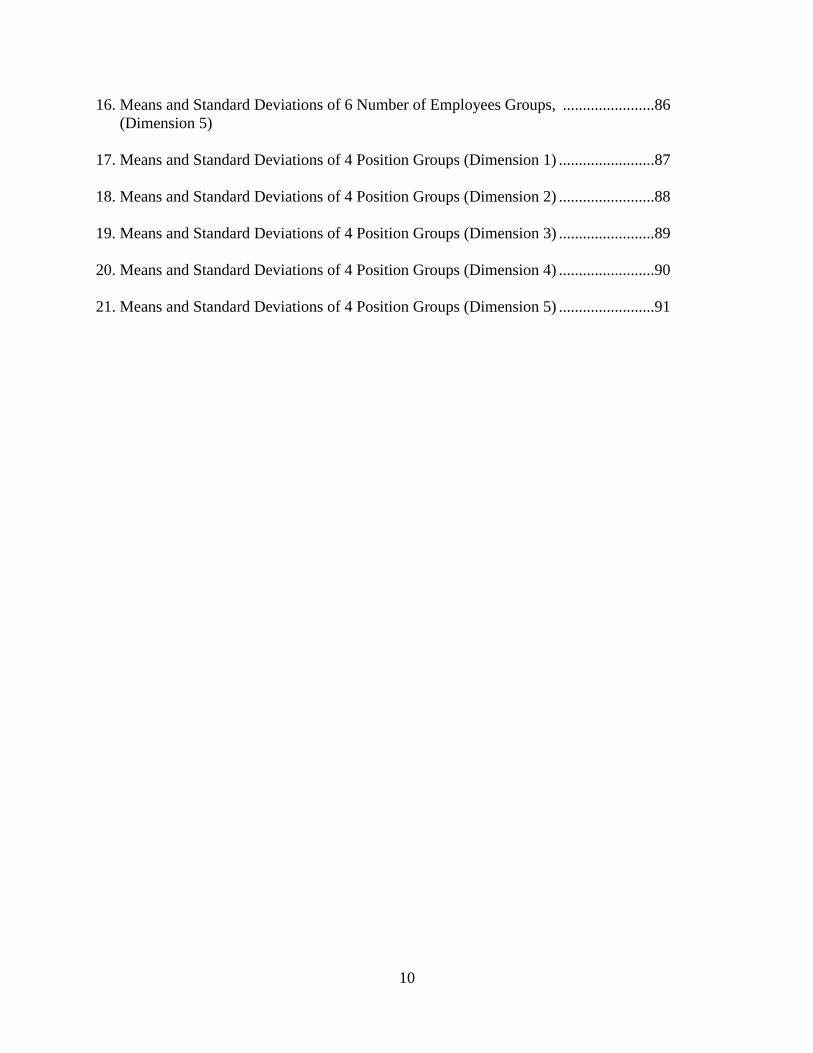
10
16. Means and Standard Deviations of 6 Number of Employees Groups, .......................86
(Dimension 5)
17. Means and Standard Deviations of 4 Position Groups (Dimension 1) ........................87
18. Means and Standard Deviations of 4 Position Groups (Dimension 2) ........................88
19. Means and Standard Deviations of 4 Position Groups (Dimension 3) ........................89
20. Means and Standard Deviations of 4 Position Groups (Dimension 4) ........................90
21. Means and Standard Deviations of 4 Position Groups (Dimension 5) ........................91
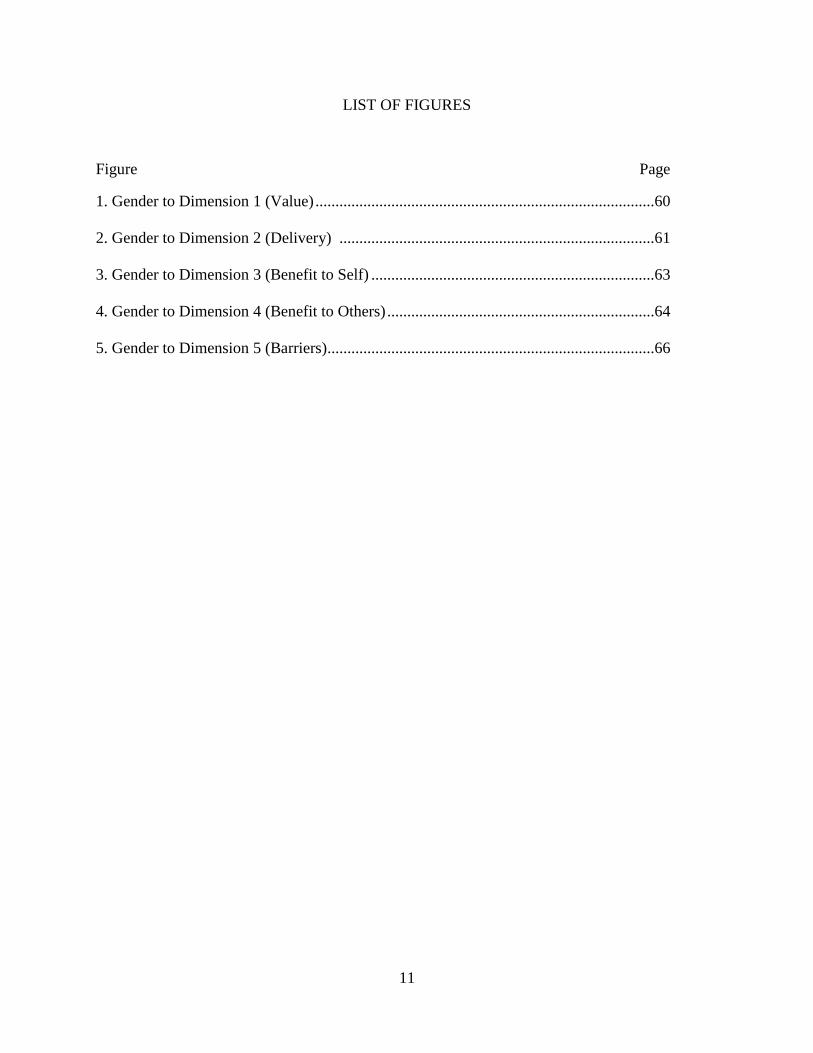
11
LIST OF FIGURES
Figure Page
1. Gender to Dimension 1 (Value) .....................................................................................60
2. Gender to Dimension 2 (Delivery) ...............................................................................61
3. Gender to Dimension 3 (Benefit to Self) .......................................................................63
4. Gender to Dimension 4 (Benefit to Others) ...................................................................64
5. Gender to Dimension 5 (Barriers)..................................................................................66
12
CHAPTER 1
INTRODUCTION
The accounting profession is a complex technical field that is constantly changing
because of new legislation, research, and business transactions evolving due to technology and
international business. Members of the accounting profession must continually seek the new
knowledge available to maintain their skills. Continuing Professional Education (CPE) is
required by state boards for certified public accountants (CPA) to meet these requirements to
maintain professional competence. CPAs are responsible for complying with all applicable CPE
requirements, rules and regulations of state boards of accountancy, as well as those of other
professional organizations. However, the CPE requirements vary from state to state.
CPAs in Tennessee are required to renew their licenses every two years. The general
requirement for CPE is 80 hours of instruction in this two year period with a minimum of 20
hours each year. Two hours of the requirement must be a board approved state-specific course
designed to familiarize the licensee with accountancy law and rules as well as professional
ethics. Other instructional areas are attest, taxation, auditing, and management advisory services.
CPAs may fulfill 50% of the CPE requirement by instructing classes. CPE credit may also be
earned by reading journals and taking an exam on the material. Also, CPE credit is available for
authoring a book or journal author on accounting.
A large number of professional certifications are included in the accounting profession
including: Certified Public Accountant (CPA), Certified Management Accountants (CMA),
Certified Internal Auditors (CIA), Certified General Accountant (CGA), Certified Fraud
Examiner (CFE), Certified Information Systems Auditor(CISA), and Chartered Accountant (CA)

13
(Robert Half International, 2014). In the United States, the largest professional accounting group
hold the Certified Public Accountant (CPA) designation, and some accounting professional hold
multiple certifications. As of 2016, the number of CPAs in the United States according to the
National Association of State Boards of Accountancy (NASBA) was to 664,532 (Sheridan,
2017). The group of accounting professionals that holds the official certification of CPA has
been chosen for this study as this group originated required continuing education in the
accounting profession, is the most widely recognized, and has a greater number of members than
any other group of accounting professionals in the United States.
Statement of the Problem
Professional accountants are required to maintain ongoing professional education
throughout their careers. States require continuing education, generally known as continuing
profession education (CPE), with certified licensed professionals meeting this requirement in a
variety of ways including traditional classes, seminars, and online courses. There has been
limited research in how professionals view the value, benefit, and delivery of CPE hours.
The purpose of this study was to determine the opinions of Certified Public Accountants
(CPAs) about the current requirements for Continuing Professional Education (CPE) and their
level of satisfaction in accomplishing the purposes intended by these requirements. The
researcher examined the perceptions of practicing CPAs about whether the current requirements
are an appropriate means to maintain professional competency and other factors related to their
opinions in obtaining required CPE including value, delivery, benefit to self, benefit to others,
and barriers to obtaining CPE.

14
Research Questions
This researcher investigated opinions and preferences of professional accountants
concerning continuing professional education requirements and examined whether these
opinions and preferences vary among different demographic groups. The research questions were
as follows:
1. Is there a significant difference in the mean scores for the five dimensions of the CPE
survey (Value, Delivery, Benefit to Self, Benefit to Others, and Barriers) between
males and females?
2. Is there a significant difference in the mean scores for the five dimensions of the CPE
survey (Value, Delivery, Benefit to Self, Benefit to Others, and Barriers) among
CPAs’ years of experience (1-9, 10-19, 20-29, 30-39, and 40 or more)?
3. Is there a significant difference in the mean scores on the five dimensions of the CPE
survey (Value, Delivery, Benefit to Self, Benefit to Others, and Barriers) among
CPAs’ types of business (public practice, banking/finance/insurance, industry,
government/education, and nonprofit/small business/other)?
4. Is there a significant difference in the mean scores on the five dimensions of the CPE
survey (Value, Delivery, Benefit to Self, Benefit to Others, and Barriers) among the
firm sizes by the number of employees (1-5, 6-25, 26-50, 51-100, 101-500, and 501
or more)?
5. Is there a significant difference in the mean scores on the five dimensions of the CPE
survey (Value, Delivery, Benefit to Self, Benefit to Others, and Barriers) among the
positions held by CPAs within the company (self-employed, employee, manager, and
partner/other)?
15
Significance of the Study
CPE continues to be a topic of discussion among educators and professionals with
differing opinions about what the current requirements should be, what delivery methods are
acceptable, and how compliance should be measured. Many proposed changes are currently
under discussion and review by the AICPA. The issuance of periodic exposure drafts requesting
professional opinions and comments for feedback indicates that change in currently in progress
(Task Forces of the AICPA & NASBA, 2011).
As a result of this study some of the CPE needs of certain accounting groups may be
identified. By asking the opinions of accounting professionals who are required to participate in
CPE this study may contribute to the current understanding of the issues, including delivery
methods and barriers to obtaining CPE credits. Studying the opinions of these professionals will
also provide more information to those delivering CPE to accounting professionals.
Limitations and Delimitations
Participants in this study were limited to a subset of licensed professional accountants
who attended a monthly regional chapter meeting of the Tennessee Society of CPAs in
Kingsport, Knoxville, or Chattanooga. Given the limitations of the study population, the results
of this study cannot be generalized to a larger population of CPAs in Tennessee or the United
States.
Although highly unlikely given the geographic distances, it is possible that subjects
attended multiple regional monthly meetings and completed the survey more than once.
Attempts to avoid this potential duplication were made by explanation at the beginning of the
meeting that it should not be repeated if it was completed in a different setting.
The interpretation of results is always limited by the validity and reliability of the
instrument used. In this study the survey is based on the Likert-type survey developed by
16
Wessels (2007). Wessels used the original survey with accountants in North Carolina to examine
their perceptions of continuing professional education requirements and barriers to obtaining
CPE. She was seeking areas of weakness in continuing education and discussed possible
improvements.
Definitions of Terms
Continuing Professional Development is somewhat broad in its definition because it can
be inclusive of required hours of study but is ongoing development that is generally not required
by statute for professional licensure. Instead the learning is simply personal development
undertaken by individual to increase their knowledge and or competence. “Essentially,
continuing professional development encompasses three types of activities: (1) Self-directed
learning experiences, (2) formal professional development programs, and (3) organizational
development strategies” (Caffarella & Zinn, 1999, pp. 242-243). The self-directed activities are
those learning experiences planned, executed, and evaluated by the individuals. The second type
of development programs are offered by third party organizations that include professional
meetings, workshops and conferences aimed at continually developing the professional. The
third type of activity, organizational development strategies, includes planned programs intended
to bring about change within an organization rather than an individual. This type of continuing
education is not based upon a prescribed number of hours to maintain a license, but typically the
individual or organization does so in order to continually improve products or services in the
professional field.
Continuing Professional Education (CPE) “is the education necessary after a person has
fulfilled all the formal educational requirements for entrance” and continued membership in a
17
particular profession (Chatfield & Vangermeersch, 1996, p. 168). CPE is commonly known as
the hours of education required by the state to maintain the professional license. Most
accountants are committed to ongoing training and updates due to the dynamic nature of their
profession, changing laws and regulations, to maintain a competitive advantage, and to provide
accurate information and adequate services. Failure to provide accurate information can be costly
for large businesses. The public is also provided some protection from accountants that would
otherwise fail to maintain knowledge of the changing laws.
Overview of Study
Chapter 1 presents the accounting profession and introduces some of the stakeholders and
decision makers including the AICPA, NASBA, the states of the United States, members of the
accounting profession, and businesses that receive professional accounting services. This chapter
also provides some explanation of the educational requirements of maintaining professional
licensure in the accounting profession and why this is necessary. Chapter 2 presents a literature
review of research that focuses on continuing education in the accounting profession. Chapter 3
presents the methodology of the research. Chapter 4 is used to present the data collected and the
results of the analyses. In Chapter 5, the findings of the research are be discussed, including
interpretations and potential impact. Suggestions for implementation and further research are
also discussed.

18
CHAPTER 2
REVIEW OF LITERATURE
The American Institute of Certified Public Accountants (AICPA) was established in 1908
and serves as one of the rule and standard setting body for members of the accounting profession
(AICPA, 2014), and plays a larger role in continuing education requirements than other
organizations involved in accounting standards. Changes made to the rules of accounting
practice apply to members of the AICPA and to licensed professionals across the United States.
The AICPA’s control over members is secondary, however, as licensure is administered by the
states. Another organization, the National Association of the State Boards of Accountancy
(NASBA), was also established in 1908 to unite communication and decision making across the
states.
The AICPA began providing continuing education for members in 1958. In 1971 the
AICPA made continuing education a requirement for all licensed accountants, with state
governments given the responsibility for enforcing this requirement. By 1994 all states had
enacted the requirement of continuing education in order to maintain licensure (Chatfield &
Vangermeersch, 1996). The International Federation of Accountants (IFAC) also instituted
mandatory continuing professional development for all its members in 2006, extending the
requirement for continuing professional education to a global scale (Wessels, 2007).
Continuing Education
Education to maintain and improve professional competence is called continuing
professional education (CPE). Prior to the 1970s continuing professional education was rarely
19
discussed. Queeney (1992) stated that several decades ago the concept of continuing professional
education was not a familiar one. People had the perception that once the initial professional
education was completed, that was all the training necessary. In some circumstances there may
have been an apprenticeship period served; but beyond that, they were always considered
professionals. People assumed that professionals would learn what they needed to learn on their
own.
The concept of continuing professional education began to grow in the 1960s as the pubic
became concerned about the competence of professionals. Many professionals who were
concerned about potential problems with carrying out their duties returned to the classroom as a
quick fix for minor incompetency. As time progressed more and more professionals began to
realize the need for continuing professional education programs (Queeney, 1992).
In the 1970s professionals were experiencing obsolescence in their fields, especially with
the exponential changes occurring in technology. Professionals were not keeping up with the
changes without self-motivated continuing professional development. When professional
societies were reluctant to make changes to member requirements, politicians and legislators
were motivated to show they cared about protecting the public, which brought about discussions
for required CPE (Stern & Queeney, 1992).
This segment of education for adults, continuing education to maintain or improve
professional competence, is a continually growing field, expanding requirements to more and
more professions. Hunt (1992) reported that individuals who practice one of the many licensed
professions will be required to obtain some form of continuing education, or lifelong learning,
throughout their career in order to maintain competence and keep up with the ever changing
complexity, technology, knowledge, skills, and regulations. In the early 1970s very few
20
professions had any specific requirements for continuing education. Now many occupations
require continuing education for licensure. Even practitioners in professions that do not require
licensure, such as auto mechanics, are required to keep pace with changing technologies and
regulations or their performance fails acceptable requirements. Professionals in many
occupations need to plan a career of lifelong learning in order to remain competitive and
effective in their field (Becker, 2011). This increasing need has made continuing education a
very interesting and dynamic field in education, with demand growing at an alarming rate (Hunt,
1992).
The traditional sole independent CPA who existed 30 to 40 years ago is less common,
and larger firms with more employees are becoming the norm. This shift brings about a need to
be able to manage a firm with a number of employees, and along with it, the need for
management education for middle and upper level professionals (Walley, 1996).
Another area affecting most businesses today is the global market place (The Future of
Learning, 2014). Businesses of all sizes and types are competing, trading, and expanding in the
global market place. This rapidly expanding globalization is creating many new complex
business transactions. Seventy-nine percent of CPA firms are projecting international growth,
including half of all sole practitioners. Historically the accounting field was based on planning
and certainty before going into a project. In these changing markets CPAs are required to use a
“feeling your way” experimental approach (The Future of Learning, 2014). The new business
environment requires a new mind shift and new approaches to learning and development.
In addition to changes occurring in the business world, education is also in the process of
changing. The traditional classroom with an instructor feeding information to students is
becoming obsolete. Future education will involve social interactive experiences and discussions

21
among peers. Education is still in a state of change and many uncertainties remain. According to
Harvard professor John Richards educators will bring changes to education by experimenting
with new teaching innovations, methods, and technologies (The Future of Learning, 2014).
Determining new methods will involve taking risks, analyzing results, and remaining flexible.
The changes required are not going to come about easily. Not only are students
experiencing change in how information is presented, teachers must also undergo change from a
teacher input focus to one of student output. Instructors have their own style of teaching and
people are often resistant to change. New teaching methods and learning styles must replace old
styles that instructors have become used to and are comfortable with. Informal learning methods
will be embraced, teachers will serve more as facilitators than lecturers, and technological
devices will make learning available anytime and anywhere (The Future of Learning, 2014).
Continuing Education of the Accounting Profession
The purpose of continuing education for accountants is to maintain and continually
improve the professional competence of members of the profession so that services performed
and opinions formed are as accurate and beneficial as possible and to ensure those receiving
services from CPAs licensed by the state are, in fact, receiving the services of qualified
professionals. Thomas and Harper (2001) pointed out that in the United States continuing
education requirements for professional certification are controlled by the states and the states
are responsible for issuing and maintaining the licenses to practice. When we compare
requirements across different states, vast differences exist. Although 40 hours of CPE per year
tends to be the average requirement, differences occur in annual minimums, carry-overs, hours
required in technical accounting areas like auditing and tax, and hours accepted outside of
22
technical accounting areas. The state mandated requirements of Tennessee are provided for
review in Appendix A (State of Tennessee, Board of Accountancy, 2014).
The accounting profession carries with it a successful core business model, with each
CPA demonstrating education and experience by passing a minimum competency exam and
required continuing education. These traits make CPAs a commodity of value that will “deliver
professional services that can be trusted to be high quality, accurate, and reliable” (Barry, 2014,
p. 5).
States began to require continuing professional education in the 1980s to ensure uniform
competency among professionals and to bolster the public’s confidence. Yet, the profession
remained largely self-regulated until congress passed the Sarbanes-Oxley act of 2002 to create
the PCAOB (Public Company Accounting Oversight Board). This led to CPA firms performing
accounting services for the public being subject to peer review every 3 years, and reports
submitted to the state for review. Prior to CPE requirements, reputation was just as important as
the bottom line (making a profit), and typically a good reputation led to good profits (Barry,
2014).
In recent years leaders at the AICPA, a national accounting regulatory body, and
NASBA, the national organization that joins the state regulatory bodies together, have discussed
continuing education requirements for CPAs. These two major leaders in the accounting
profession in the United States have worked together to develop task forces and discuss proposed
changes. In August 2011 the joint organizations issued a proposal draft stating their plans for
change, called an exposure draft (Task Forces of the AICPA and NASBA, 2011), requesting
professionals to respond to the draft expressing their opinions.
23
Although these organizations can require their members to follow the new guidelines, the
new guidelines have not yet been made official by the individual states that regulate licensure.
For the guidelines to become official each state must determine what items and to what extent
the new guidelines will be incorporated into its own licensing requirements. The authors do point
out the difference between “should” and “must”; so that should indicates guidelines to strive for,
while must indicates a requirement for certification. The proposed changes could take a while to
be translated into licensing requirements because it took 23 years for the requirement of
Continuing Professional Education to be incorporated into licensing requirements in all United
States and territories.
The first CPE revision suggested by the joint committees applies to professional
competence, stating that all continuing education credits should be associated with programs that
increase or maintain professional competence (Task Forces of the AICPA and NASBA, 2011).
This guideline is aimed at eliminating the practice of taking courses to fulfill required hours
which do not improve the CPA’s job performance. Courses are often taken that are easy or
familiar and, therefore, do not provide additional benefit. Sometimes course topics even fall
outside of the CPA’s work responsibilities.
The next area of change focuses on what is required of CPE providers. Professional CPE
sponsors are required to be certified by NASBA (with some exceptions for accredited schools),
with new standards adding to the benefits provided to the CPAs. Continuing professional
education may be obtained outside of NASBA certification, but then documentation falls upon
the individual CPA. New requirements for CPE presenter qualifications and the expected
benefits to be obtained by participants include objectives to be accomplished, knowledge level
24
aimed at addressing, and professional qualifications of the presenter (Task Forces of the AICPA
and NASBA, 2011).
While the AICPA and the NASBA task forces are currently working on a new unified set
of rules recommended for the future, the AICPA and its predecessor organization, the American
Institute of Accountants, have been working on a Uniform Accountancy Act (AICPA and
NASBA UAA Committees, 2014) since 1916. Although not as recent, the National Curriculum
Project (Ciesick, 1985) is an example of the changes that continue in accounting and how various
groups have attempted to create a structured and effective educational system to optimize the
profession. The National Curriculum concept began in with the Texas Society of CPAs and was
soon joined by the California, New York, and Illinois societies. From 1980 to 1982 these groups
designed a new curriculum urged other state societies to adopt. For a time the AICPA embraced
the curriculum and served as the primary coordinator of the project. The National Curriculum
became a task of grand proportions that involved eight task forces and over 100 members of the
profession from 40 states over several years. The grand size was difficult to manage (Ciesick,
1985).
The National Curriculum was a combination of 501 or more knowledge and skill areas
within and pertinent to accountancy and fits each area into an overall structure. Each individual
learning unit formed a CPE course that fits into a broader course of study. The accounting field
was segregated into three categories: public practice, industry, and government. Depending upon
the field of work, a specific course of study would be planned for professional to optimize their
learning experience over the course of their careers. Each learning unit was described in detail
giving a description, major topics covered, objectives, level of study (basic, intermediate,
advanced, or update), and the degree of knowledge or experience required. Within the categories

25
of practice, industry, and government were six principal fields: accounting and auditing, taxation,
advisory services, management, specialized knowledge and applications, and personal
development. Specific groups of learning units would be designed to complement certain fields
of study but allowed great flexibility to follow different paths to concentrate on more specific
fields of study. For many years the National Curriculum was to be the professional map of the
future and continued to have a strong hold in the industry until early in the new millennium
(Ciesick, 1985).
Opinions About Current CPE Regulations
Researchers satisfied with current requirements discussed ways that participants can
maximize their benefits within the current constraints existing system (eg. Korney, 2006). Some
have suggested that the current requirements are minimum standards and successful participants
will normally wish to learn far beyond the minimum requirements (eg. DeLange, Jackling &
Basioudis, 2013; Knese, 2013). And in some cases, minor changes were recommended that still
fit within the current structure (eg. Ramos, 2014).
The need for change group insists that the current structure of CPE is not adequate and
not fulfilling the intended goals (e.g Clyde,1998; McCabe 2015, Thomas & Harper, 2001). The
current requirements are antiquated and have not kept up with the rapid changes occurring in the
business world. Improvements are well past due and significant changes need to be made. The
changes suggested would provide much more benefit to the public and to accountants than the
current CPE requirements.
Knese (2013) was the chairman for the Institute of Management Accountants and is a
promoter of continuous learning. He expressed that when a professional is well rounded in many
26
areas, the conversations are more interesting for clients as well as the accountants seeking
business. Knese was satisfied with the current CPE requirements but believed that people should
continually strive to go well beyond the minimum requirements. The combination of continuing
professional education and continuous learning make a better professional and a more interesting
person. In our daily work people want to deal with knowledgeable professionals who are
interesting people.
Ramos (2014) is another CPA who considerers the current CPE standards to be adequate
but suggested approaches to maximize the benefits of the current system. His primary focus is
not monetary return on investment (ROI) in the traditional accounting terminology, but rather the
most efficient and effective ways to allocate CPE resources to get the most benefit. (These ways
are examined further in the Suggestions for Improvement section of this paper).
In 2007 Wessels examined accountants’ opinions of CPE. A Likert-type survey of 1,957
accountants in North Carolina revealed that the participants felt CPE requirements were effective
but many barriers were present that reduced the effectiveness. If these barriers could be
minimized, effectiveness could be increased. The results of Wessels survey indicate 85.5%
perceived their knowledge was increased and 85.2% agreed that they improve the image of the
profession. In comparison only 48% agreed that CPE helps to protect the public, 31.2% agreed
employability is increased, and 15.9% agreed earnings increased (Wessels, 2007).
DeLange’s (2013) research was conducted in Singapore, South Africa, Australia, the
United Kingdom, and the United States to get an international perspective of accountants’
opinions. His findings indicate that most of the participants were of the opinion that the CPE
required by legal statues should be considered minimum requirements and that true professionals
should strive to achieve well beyond the minimum requirements.
27
McCabe’s 2015 research specified a desire for change to CPE and can be summarized
with the following statement: “To fuel the passion for learning in the CPA profession, we must
fundamentally change how regulation, professional development and CPE are structured,
delivered and measured” (p. 1). Businesses rooted in tradition are constantly being challenged.
Change is certain in the workplace today, and only those willing to adapt will survive and
prosper in today’s marketplace. For this change to occur successfully, education is necessary. For
the accounting business this change must occur at all levels; in the college programs and in CPE
for the practicing accountants throughout their careers. The drive for changes in CPE began in
2008 during the recession and CPAs chose to save money by staying at home and taking courses
online, eliminating the costs of travel, hotels, and live face-to-face classes. The home computer
courses also saved time with busy schedules and allowed training to be more customized for
individual needs.
Walley (1996) endorsed the definite benefits from CPE and the ongoing need for such
requirements. He identified several areas of continuing education that need to change for the
profession to get the intended benefits. For example, managing a firm and the associated
personnel is a complex and difficult task and many people need to learn more so they are better
equipped to do the job. CPE credit for firm management should be offered to fulfil requirements
and be more easily obtainable for accountants.
Another area in need of CPE credit is the management of accounting engagements
(Walley, 1996). When accounting services are provided to a client, the engagement must be
properly planned and supervised, and appropriate conclusions reached. Resources must be
assigned in a proper and effective manner. CPE courses and credit for engagement management
would be beneficial.
28
The growing and extensive use of computer technology in accounting is the third area
identified by Walley (1996) as requiring CPE courses and credit. This need for technology
related knowledge and understanding adds a desperately needed component to the list of
educational requirements.
According to Walley (1996) communication is the fourth area severely neglected in the
education of accountants. For instance, the Continuing Education Development project found
that accountants are often weak in communicating with clients (Queeney, 1992). Communication
is not in the technical area of required CPE and many states do not give credit for
communication courses, yet communication is necessary and critical factor in client engagements
and management of CPA personnel. The primary cause of complaints against accounting firms is
due to lack of communication. Lack of communication or poorly managed lines of
communication in accounting firms is often the cause of failure for an organization.
When determining which courses receive credit and which ones do not, the crossover
benefit of related courses is currently ignored. For example, a business advisory course that does
award CPE credit can have crossover benefits to managing a CPA firm. A course in managing a
CPA firm that does not allow for CPE credit can have crossover benefit for business advisory
services. Providing credit for these related courses is Walley’s (1996) fifth area for
recommended improvement.
The sixth and last area Walley (1996) identified as requiring change was the disparity in
requirements among states. The requirements in one state can be vastly different from the
requirements in another state. For example, some states allow credit for computer technology or
management, while other states may only allow credit for the technical accounting related
courses, i.e. financial accounting, auditing, tax, and business advisory. Accounting firm
29
management and computer technology should both be included in the annual requirements to
maintain the CPA license. Of 40 hours CPE per year, Walley recommended 16 hours should be
in accounting firm management, engagement management, and computer technology. The
remaining 24 hours would continue to be in the classical technical accounting.
Another area in need of change is measuring what matters (The Future of Learning,
2014). The current focus on hours of input is far too indirect. There are many more direct
approaches to measure the desired outcome. “There must be a shift in compliance that is
authentic and relevant, and measures learner competency, development or performance” (The
Future of Learning, 2014). Clyde (1998) stressed the need for change in the current system in
“CPE is Broke; Let’s Fix It” (p. 77). She reiterated the message seen in other articles that current
CPE requirements are viewed by many CPAs as “hours I get to keep my license” and “what I do
to survive” (p. 77). This outlook is because the current system focuses on hours of input rather
than focusing on changes or improvements in output or capabilities. There is no real focus on
improvement or gain of skills or knowledge. The hours of class time input is a poor measurement
tool to quantify learning.
Clyde (1998) stated that the future demands of the accounting profession will require
CPAs to embrace lifelong learning. Continual changes in the accounting profession will demand
the knowledge base and competencies to be continually improved. Hopefully, future changes to
the profession will include focus upon increases in professional competency rather than an
accumulation of hours in passive absorption hoping learning takes place.
While formal classes with instructors or online courses that confirm participation are
more typically allowed for credit, this credit by licensing organizations does not coincide with
the majority of the actual learning that occurs in the life of a professional. An AICPA member
30
survey in 2014 ranked on-the- job training as very important or extremely important (The Future
of Learning, 2014); however, most organizations do not allow compliance credit for informal
training. For the typical professional 70% of learning takes place as informal on-the-job, 20% as
coaching and mentoring, and 10% in formally structured courses. The current system neglects
the significant learning and knowledge attainment that naturally takes place with on the job
training or self-directed readings or research. For example, during the course of working on a
return, a tax return preparer may need to research the requirements and limitations for a loss
carry back or when income averaging may be beneficial. Knowledge is gained but cannot be
counted toward meeting requirement standards.
Timeliness and customization are two more factors that are important considerations
when providing is CPE (The Future of Learning, 2014). If a new tax act is passed, timeliness
would allow a new webinar to be created in a short time to deliver training to the home or office.
Customization to meet specific training gaps is also an important feature and more customization
is being demanded from those seeking training.
Barriers to Obtaining Required CPE
CPE is relatively new concept to some professionals and many lack the knowledge of
how to choose appropriate educational programs, let alone how to create a long-term
development plan. As practicing professionals realize deficiencies, they tend to remedy the
situation with quick and convenient fixes and do not plan for a lifelong of learning for the
profession. Areas of known deficiencies are addressed in an ad hoc fashion, and other areas
are ignored completely. Because professionals were not initially prepared to become lifelong
learners, their approach has been sporadic, ineffective, and inefficient. Queeney (1992) points
31
out that people in general, including professionals, do not always seek out that which is best for
them. Some may choose the simplest and quickest path for convenience, cost, location, or
timeliness with little regard for content.
In current times many regulators of CPE are questioning if CPAs are now more
concerned with compliance rules and meeting the minimum required hours rather than improving
competency as intended. Some regulators question if taking the same required ethics course
repetitively is still taken seriously (Barry, 2014).
If accountants do not perceive the CPE as being effective, they are less likely to fully
participate in the program. For example, they may not pay attention to the presentation or may
take less challenging courses. Some accountants refer to CPE as required “hours to keep my
license” (Clyde, 1998, p. 77). In these circumstances the professional is seeking compliance
rather than competency (Wessels, 2007).
From the providers perspective; courses, workshops, and other activities are developed
on the basis of marketability and profitability with little if any planning for educational merit or
professional development over time. Professional accountants are not a homogenous group, but a
well-diversified group with many different needs. Each person has a different set of skills and a
different set of experiences. These differences bring about variations in educational needs
creating many small groups that are not satisfied by the profit hungry CPE providers that cater to
the masses (DeLang, 2013).
Barriers to obtaining CPE are sometimes referred to as deterrents, and Wessels identified
a number of these in her research and separated them into categories. The first category,
Situational Deterrents, are barriers that occur outside of the participants control and include work
requirements, family requirements, and costs. The second category is Dispositional Deterrents
32
which relate to a participant’s perceived value of the course. Institutional Deterrents include
course content, quality, location, and accessibility. The final category is Informational Deterrents
arising from lack of information (Wessels, 2007).
The U.S. Department of Education is interested in lifelong learning for adults and
considers continuing education for professionals a very specific subset of lifelong learning that
has different characteristics than other areas of lifelong learning for adults. Because of the
growing need for this field of education, the Department of Education has taken a special interest
in hopes of helping demand be met in a manner that is beneficial, especially for the learners.
Some of the characteristics that need to be taken into consideration are that these learners are
usually full-time working adults with families, schedules, and responsibilities that must be met
and fulfilled in addition to class and homework schedules. These factors must be taken into
consideration in the design of classes and coursework. The 1984 census indicated that over 8
million Americans participate in at least one job related educational opportunity, and we must
consider the magnitude of this educational enterprise and its effect on the economy not only
assisting with job performance, but also creating jobs (Hunt, 1992).
Stern and Queeney (1992) discussed some potential problem areas in CPE and attempt to
identify some possible solutions or improvements to those problems. One of the first problem
areas identified is that CPE is, as a whole, a part of a larger field of lifelong learning. In the arena
of lifelong learning there are academicians who study professionals as learners and how to
maximize the benefits of education for them. However, those providing CPE instruction are
specialized professionals, such as accountants, lawyers, or physicians, who are experts in their
fields but do not discuss or share information with the other professions nor with the
academicians in the area of lifelong learning. They operate in groups analogous to silos in that
33
they are not sharing or receiving additional information from the collective group on how to
maximize learning benefits to professionals.
Another problem area identified by Stern and Queeney (1992) is a gap that exists
between expectations of academic promoters of continuing education and those of the continuing
education providers. Some refer to this difference as research versus practice of CPE. On the
academic side the education researchers expect continuing education to be a quality product
following an organized set of guidelines that meet certain credentials. Those in higher education
express CPE delivery lacks quality. Providers of CPE do not have to be professional educators
and are often times businesses people that operate a business organized to make a profit. The
profit motives are often times at odds with the student needs or the quality of delivery. The focus
upon financial considerations as the driving force behind CPE could lead to decisions that are not
in the best interest of the student-professionals serving the public. Arguments continue over
whether mandatory CPE actually ensures competence or even assures learning has taken place.
Current Direction of CPE in Accounting
The AICPA (2014), an organization serving as the administration of the accounting
profession, recognizes and acknowledges that a need for change exists and a task force has been
assigned to focus on this goal. They seek input from all stakeholders in professional
development, including anyone affected directly or indirectly. The AICPA task force includes
public accounting firm leaders, industry CPAs, regulators, association leaders, and educators.
They refer to their work of lighting the fire as a metaphor to describe the growing desire to feed
the need to learn. They are examining the strategies available to increase the desire to learn and
34
make changes in continuing education that will keep up with the changing dynamics of
businesses today (The Future of Learning, 2014).
While the AICPA is trying to inspire the profession as a whole to take action in bringing
about the needed changes, barriers to change exist in people and in systems. For CPAs the
compliance based nature of the business can feel detached from building professional
competency. Some systems have begun to change by allowing shorter time increments for
learning, new learning methods like self-study with a monitor, and models that measure
competency. But uniform changes across the profession will take much time and effort to
implement (The Future of Learning, 2014).
The Uniform Accountancy Act (UAA) is designed to be an authoritative rule book for the
CPA profession and not intended to regulate state mandated CPE requirements or new learning
methods (AICPA and NASBA UAA Committees, 2014. However, the document does provide
general guidelines in many accounting areas including education along with other accounting
functions it is attempting to control and standardize within the profession. A paragraph from the
preamble for the section of statements on standards for continuing education aptly describes the
accounting profession today and why CPE is so important: “The profession of accountancy is
characterized by an explosion of relevant knowledge, ongoing changes and expansion, and
increasing complexity. Advancing technology, globalization of commerce, increasing
specialization, proliferating regulations, and the complex nature of business transactions have
created a dynamic environment that requires CPAs to continuously maintain and enhance their
knowledge, skills, and abilities” (AICPA and NASBA UAA Committees, 2014, Appendix B-6).
The rules do not specifically give guidance for every possible situation, but instead are intended
to be “evergreen” (AICPA and NASBA UAA Committees, 2014, Appendix B) by providing
35
broad, general guidelines that can be applicable to a variety of situations. The text explains
further that the standards are broadly stated to allow for new developments such as innovative
learning techniques and new learning theories that may include more emphasis on outcome-
based learning.
Learning activities will no longer focus on hours of class time but instead will serve: “to
maintain or improve professional competence” (AICPA and NASBA UAA Committee, 2014, p.
Appendix B-8). The development of skills does not need to be restricted to current needs but
may also address any field of service that could be needed in the future. To optimize the benefit
of CPE, an accountant should develop an individualized learning plan that will close the gaps
between current knowledge and skills and those that are needed in both the present and the
planned future.
In an update to the classic CPE requirements, the UAA now allows states to accept
independent study and self-study for CPE credit if they are overseen by a CPE program sponsor.
In addition, self-study requires a follow-up test and independent study will requires a contract of
what will be accomplished during the independent study and a written report of what was learned
and accomplished as outlined in the contract. In determining how many CPE credits are allowed
for self-study, the CPE sponsors must perform a pilot test of completion time or computation
using a prescribed word count formula (AICPA & NASBA UAA Committees, 2014).
CPAs are seeking courses that develop competency and are drifting away from the focus
on completion of required hours. “Over the next decade, competition will increase, as game-
changing new businesses challenge established players” (The Future of Learning, 2014). CPAs
are making the change toward competency-based training to be more competitive, efficient, and
productive. This type of training is also one of the focal points stressed by the Future of Learning
36
Task Force of the AICPA. The new focus is on training to improve rather than to maintain is a
positive and beneficial change for the future of CPE.
Suggestions for Improvement
Although many CPAs may view statutory CPE requirements as a “necessary evil,” most
agree that maintaining knowledge and skills is essential to a successful career in the ever
changing environment of accounting. The accounting profession has been described as “an
explosion of relevant knowledge, of a changing and expanding nature, and increasing
complexity” (Thomas & Harper, 2001, p. 33). For these reasons the accounting profession
demands CPAs continuously maintain and enhance their knowledge and skills through a lifelong
program of learning activities. Professionals should also learn about new emerging subject areas,
read a variety of business publications, and allocate time for topics less familiar (Knese, 2013).
In 2013 corporate spending on training increased by 15% and continues to rise in
response to the growing skills gap due in part to the rising complexity of laws, regulations, and
standards, as well as increased regulatory scrutiny (Ramos, 2014). CPA firms tend to focus on
measurable economic benefit but return on educational expenses is difficult to measure directly
and indirect measures are inaccurate. In frustration, CPA management tends to focus instead on
the spending side and, often times, responds by cutting spending on education to improve return
on investment (ROI).
To maximize the benefit of the educational dollars spent, attention needs to be placed on
spending education dollars more wisely (Ramos, 2014). Ramos (2014) suggested tying the firm’s
learning strategies to its business strategies, aligning training decisions across the firm,
outsourcing training, and increasing the applicability of sessions by in-house trainers as
37
approaches to maximize ROI in continuing professional education. When CPE credit is received,
the time should be spent on studies that will increase knowledge and not simply fulfill required
hours. Knese (2013) made a number of recommendations for increasing participation by
professionals at all levels of the organization to facilitate the commitment to continuous learning
through CPE.
Students and educators should be involved in decisions about what will be the focus of
responsibility, power, and authority over continuing professional education in accounting. We
have to take into consideration the various groups planning CPE including higher education,
CPE providers, professionals, and regulators such as the government. Successful continuing
professional education requires higher education groups to work with professional associations,
labor unions, employers, private enterprises, and other interested parties to increase the demand
for the delivery of more effective, efficient, and quality programs (Stern & Queeney, 1992).
Those providing CPE courses should realize that CPE is very different from other areas
of adult education. Take for instance initial professional education for groups like accountants or
engineers. They are taught about the profession through an introductory program at the
postsecondary level. Continuing professional education occurs at a post-tertiary level where
programs include practice level educational needs. Teaching experienced and practicing
professionals involves a different set of “pedagogical, organizational, political, and fiscal
characteristics” (Stern & Queeney, 1992, p. 16). Because of these unique sets of circumstances,
effective teaching of CPE requires knowledge, experience, and ideas from several perspectives,
making the sharing of knowledge with other professional groups and educators all that more
important and beneficial. Continuing education must have a more direct relationship with the
practice of the profession. It must build on previous education and experience, address a broad
38
scope of practice, and offer opportunities to maintain competence, improve performance, and
update knowledge. Professionals need a structured learning plan to become “intelligent
consumers of continuing professional education” (Queeney, 1992, p. 36).
A curricular framework of instruction (Queeney, 1992) beneficial to professionals would
plan coursework over a long period of time presented in a logical sequence. This structured
education would incorporate differing educational needs that occur in various career stages and
alternate career paths. Areas of specialization could be recognized and, by presenting a vast array
of educational activities and choices, the curricular framework would allow professionals to
discover areas in which they are not familiar. The AICPA has provided a great example by
taking the initiative to create professionally designed coursework that is delivered to
professionals in each area to provide a structured lesson that fits the needs of specialization in
many areas.
The first step in developing a curricular framework is to determine the areas or
professional specialties to be addressed within the accounting profession. The initial response by
providers has typically been to single issues, such as the advancement of technology. But
developers should be looking at the various specialties within the accounting spectrum and
develop courses, including technology courses, around the subject matter in actual practice. For
example, there are accountants in government, corporate business, finance, education, nonprofit,
and other specialty fields like mining or retirement planning. There is a vast array of specialties
that could benefit from utilizing new technologies within those applications (Stern & Queeney,
1992).
With any professional life cycle change, skills and knowledge learned in the past can
become rusty or obsolete. As mid-career professionals move toward higher levels of
39
management, they take on more supervisory responsibility, more levels of authority, and more
complex tasks. Experience may serve as their primary source of information, but courses can
facilitate this knowledge, and sharing best practices through more education can benefit many
managers in all areas of their work. When multiple practitioners are added to a firm, the senior
staff move into more management and change the tasks performed and responsibilities held.
Continuing education can provide smoother transitions in these circumstances and teach the new
skills required. Employers and regulators must encourage learning skills of working with people,
leadership, and business acumen in addition to the usual technical areas. Because these
nontechnical skills are important for success of the individual and the profession, they should be
included in the credit provided for compliance (Stern & Queeney, 1992).
As professionals perform more activities in a particular field and branch away from core
practices, educational professionals should be prepared to fill the voids as new requirements
emerge. If an accountant branches off into investment counseling, courses should be made
available that teach the detail required by an investment professional and not just introductory
material (Stern & Queeney, 1992).
When relevant areas for CPE are identified, providers can begin to develop professional
education content by performing a competency needs assessment. Queeney (1992) stressed the
importance of distinguishing between assessment of educational needs and a competency
assessment as the educational approach is often too broadly focused and does not completely
address what is needed. If continuing education providers do not adequately determine
competency needs and develop programming to address them, they will be cheating the
professionals they claim to serve. They might present programs that draw participants but they
would not be providing meaningful content to enhance professional performance.
40
Delivery method of the course material is another important concept in professional
education. There are many choices available for delivering course content. The most common
method relies on the conventional lecture format. New learning theories suggest that adults learn
better with an interactive environment, while computer delivered course work is gaining
popularity and momentum due to its flexibility with time and location (Queeney, 1992).
Rahman and Velayutham (1998) compared CPE offered through pedagogy, with an
instructor delivering course content, and andragogy, with the student being self-directed in the
learning process, to determine which method was being used in CPE to address the two types of
obsolescence. In the field of accounting knowledge obsolescence can occur when an accounting
theory rule changes and the CPA fails to update knowledge as the change occurs. An example is
provided from the 1970s when accounting principles started moving away from strict historical
accounting and began to include inflationary accounting. CPE requirements were not well
established at that time and years went by before most CPAs were aware of the change. Skills
obsolescence occurs when established practices change, although the basic theory remains the
same, and accountants are not aware of the change in practice (Rahman & Velayutham, 1998).
An example of skills obsolescence is when the four primary statements; Income, Balance Sheet,
Equity, and Sources of Funds; changed to Income, Balance Sheet, Equity, and Cash Flow. Many
accountants continued to prepare the older group of statements as primary documents despite the
change in requirements.
Rahman and Velayutham’s (1998) study found that both types of learning methods were
still in use and successful in filling in the educational gaps but each had strengths in different
areas. Andragogy was used more often and was more successful in teaching the core curriculum
of accounting; taxation, auditing, financial accounting, and management accounting. Pedagogy
41
methodology was still used extensively but was more often used in and was more successful at
teaching courses that were more peripheral or outside of mainstream accounting, such as law,
finance, management, and information technology.
Motivation and interest in learning needs to be inspired and this can be accomplished
with more face to face interactions, collaborations, and mentorship along with new technologies
and innovation. More individualistic interactions help to teach each person at his or her own pace
allowing him or hwe to learn more and appreciate what is learned in the process. A new job is
typically learned by mimicking others doing the job. People learn to drive by watching others
and then doing the task themselves. Sometimes people make mistakes and learning takes place
by trial and error. When it is done right, one remembers. Then the driving can take place in
public. This informal type of learning is becoming more prominent in education and a blended
environment is more likely in the future (Rahman & Velayutham, 1998).
Although 54% of companies still advocate for the classroom instruction (The Future of
Learning, 2014), instruction can be designed to connect with the students in a more personal way
that connects to their jobs, goals, and lives. Students do not want the classroom experience all the
time; nor do they want just online classes. They want a mixture of experiences that provides
results that really matter and make a difference in their lives. This mixture of methods is referred
to as “hybrid learning environments” (The Future of Learning, 2014).
The experience of babies learning to walk, imitating what they see, with trial and error is
called experiential learning. When professionals immerse themselves in an unfamiliar task, it is
learning by doing. This type of learning accounts for 70% of our total learning (The Future of
Learning, 2014). Because experiential learning is such a large percentage, it should not be
ignored and should be incorporated into the methods used to teach, including professional

42
development. Bagranoff, a member of the Future of Learning Task Force, has developed a
successful method of experiential learning by having students compete in professional business
presentations. It results in students working harder and learning much more than through
ordinary homework (Future of Learning, 2014).
Becker’s 2013 research was conducted in a college classroom but the learning theories
examined could be applicable to all accounting training and courses throughout one’s career in
accounting. Her study was in response to a request from the Accounting Education Change
Commission that made “learning to learn” a priority for inclusion in classroom training (Becker,
2013, p. 436). The study’s control group was taught accounting in the traditional manner,
focusing solely on the accounting subject matter with related reading assignments, lectures,
homework assignments, and homework review. The second group received similar instruction in
accounting but also received instruction in the process of learning and how to learn more
effectively. At the conclusion of the study the experimental group exhibited significantly better
performance overall than the control group demonstrating that accounting and learning strategies
can be taught in the same course without a reduction in the accounting concepts learned. Applied
to CPE, this approach would allow professionals to develop approaches to learning more
effectively and the new learning approaches could be applied to many different concepts or
subjects.
If educators could provide information to students about the end purpose to be achieved
from what is learned, thereby making the learning more relevant to students, their desire to learn
would grow significantly. Other learning motivators include rewards, competition, and feedback.
These ideas are fundamental to keeping gamers entertained and can be used in teaching to make
learning more desirable and engaging (The Future of Learning, 2014).
43
With the lecture style of teaching on the decline, instructors will be refocusing and
redesigning their classrooms with different perspectives. Some examples of these changes are
flipped classrooms with the instructors serving more as course facilitators, mentors, and course
engineers; and Technology Enabled Active Learning (TEAL), at MIT and Yale, where the
students get a brief lecture and then separate into work groups to explore different topics on their
own with the teacher serving as merely a mentor (The Future of Learning, 2014).
Other types of delivery methods include online approaches such as Massive Online
Learning Classrooms (MOOCs). MOOCs allow classes to be available free to many students. It
is a means of providing information free without cost or grading. CPAs are already participating
in micro-learning by taking online seminars at their desks during lunch on a variety of topics.
This allows learning to take place in smaller increments rather than the typical hours required for
a classroom setting. Other possibilities available with new technology include mobile learning on
electronic devices, even phones, and can be accomplished any time of any day. CPE providers
can use technology as a leverage to accomplish much more in education (The Future of
Learning, 2014).
Educators are taking advantage of new teaching methods and college graduates are
learning collaboratively and interactively. These new developments require states to revisit their
models for maintaining and improving competency. Some states have already made changes.
Maryland now allows 10 minute intervals of “micro-learning” (Barry, 2014, p. 5) for CPE credit
and New York is developing new on-line learning platforms with shorter time intervals and an
online CPE tracker.
Thomas and Harper (2001) stated that “CPAs learn in different ways” (p. 33). Lawyers
may learn best reading journals, and psychologists often prefer small group sessions with
44
cooperative learning and group feedback. In looking at the ways people naturally learn, The
Future of Learning committee determined that 20% of learning is accomplished through peer-to-
peer interactions (The Future of Learning, 2014). Business managers can explain what is learned
and practiced today. Supervisors can act as mentors to help teach and encourage learners to
pursue learning with a passion. ‘Just-in- time” learning (The Future of Learning, 2014) is a
natural form of learning for professionals that has not yet been officially allowed for CPE credit.
An example of appropriate just-in-time learning is an accountant looking up the rules of a tax
code while on the job to see if it can be used in a particular instance.
More consideration needs to be given to student needs, and not just fulfillment of
required hours (Stern & Queeney, 1992). The AICPA’s vision for the future of CPE is to
incorporate the multitude of ways to learn into meeting the requirements for mandatory CPE.
Instead of counting the hours spent sitting in training, measure completion by establishing where
we are now, where do we need to be, and what progress has been made toward closing this gap.
The first principle of Vela’s Twelve Principles of Effective Learning (Vela, 2002) is a
needs assessment. When the instructor understands the students’ needs, then the course can be
designed to more closely fulfill those needs and provide a more engaging environment for the
students. The proposed new learning standards suggest that CPAs develop a learning plan by
developing a brief assessment of the gap between current and needed knowledge, skills, and
abilities, followed by setting learning objectives and developing an action plan to fill the
objectives (Thomas & Harper, 2001).
Clyde’s 1998 research with CPAs involved developing a list of abilities and content
required for certain positions within accounting, e.g. auditor, financial controller, and had
accountants in those positions identify gaps in their knowledge or abilities. Coursework was then

45
prepared specifically to close the gaps identified. Later participants identified if their knowledge
or skills were increased. Clyde referred to this as a competency-based structure rather than one
based on hours of class time. Clyde’s competency-based approach offered the benefits of
attention to learning versus hours of input, focus on competencies required, and a means to
measure competencies and evaluate results. An individual’s gain in competency could be
measured through a variety of methods including testing, simulations, direct observations,
supervisor reports, client-customer evaluations, peer review, and self-administered assessments.
This new way of crediting continuing professional education will allow CPE credit
toward requirements through self-directed learning. The new methods for receiving CPE credit
would include reading professional publications, leadership in professional organizations,
participation in professional committee meetings, participation in formal management training,
special projects under mentor guidance, research on professional topics, and writing documents
for publication (Thomas & Harper, 2001).
Although the AICPA is providing leadership to create learning strategies and structure in
the profession, including new measurement approaches, some argue that these new methods will
be more difficult to control and measure. But consider what was previously measured: time spent
receiving input with little or no measure of output. The newly proposed learning methods will
require the participants to identify what has been accomplished, what progress has been made,
and what knowledge or skills has been improved. The new focus will be to learn in ways people
naturally learn. Accountants can then focus on true improvements in knowledge and skills rather
than obtaining an arbitrary number of hours to maintain their licenses (Thomas & Harper, 2001).
The Chartered Institute of Management Accounting (CIMA) in Europe provides an
model that is competency based and driven. There are no minimum number of hours required.

46
Instead, each member identifies his/her own competency needs and participates in learning
activities directly related to current and future roles. Participants are rewarded for competencies
rather than compliance. Efficiencies in time, expense, and results allow this system to serve as an
effective and efficient model (The Future of Learning, 2014). For this to occur in the United
States, change must occur in the regulation of professional development, as well as in CPE
structure, delivery, and measurement.
The final goal from the research of the AICPA is to create a unified, global competency
framework. This goal is in support of the International Accounting Standards Committee (IASC)
to develop one uniform global compliance standard. In the face of fast growing business
globalization, the profession must recognize that today’s businesses are not just local. Although
different currencies exist, investors must be able to compare one business to another by adjusting
for currencies but without having to adjust for a multitude of differences in accounting standards.
This can involve matters as simplistic as when revenue is recognized or when an expense is
incurred; but without global standards, resolving these issues across nations can be complicated
(The Future of Learning, 2014).
The goal of regulatory boards, and all those with an interest at stake, should be to make
learning a lifelong goal of the professionals. To accomplish this, providers must focus on the
needs of the individual learners. Instructors should find what are the objectives and goals of the
students taking a course or learning new skills. If providers could collect this information and
gear courses to meet these knowledge and competency needs of individual learners, the student
learner accomplishes much more and learning is reinforced. When the course material is fit to
student objectives, learning becomes more personal and the student feels more involved.
Providers should consider if the information is timely, applicable, and delivered in a manner that
47
the students can learn. Learning should be made more accessible on any device anywhere. Time
is a scarce resource and everything that can be done to help manage time facilitates learning.
Micro learning, just-in-time, and self-paced learning all help with optimizing students’ time (The
Future of Learning, 2014).
Professionals should strive to continually develop themselves to do the best job they can
(DeLange, 2013). Each professional is vastly different, and personal development strategies must
be determined by his/her own goals and drive for success, augmented by the desire for the
business to succeed and to provide the best service possible. Each accounting firm should take
both the individual needs and the needs of the firm into consideration. Firms should recognize
and reward those individuals who develop themselves beyond the minimum requirements and
bring new benefits to the business.
Providers of continuing education and organizations that oversee fulfillment of required
continuing education need to provide a support system for practicing professionals to help them
develop a relevant continuing education program. In conjunction with the support provisions,
individuals need to be encouraged to partake of the support to maximize the use of their time and
resources. Professionals may need to be continually reminded to get additional help from
educational professionals in forming educational plans to maximize the benefit of their life-long
learning (DeLange, 2013).
Chapter Summary
This research literature falls into two categories of recommendations: working with the
current system or making changes to the current system. From the point of view of working
within the current system, some literature has expressed ways to maximize the benefits of CPE
48
within the current constraints. Some others that promote working within the current system
express the requirements are minimum standards that motivated professionals will strive to go
well beyond the minimum requirements. A third group of research supports that change is
required because business and technology are changing the face of accounting and professional
education requirements are not keeping up with the rapid changes taking place. Those arguing
for change include the very groups that participate in the creation of accounting rules, the AICPA
and the NASBA. Professional development of the individual accountant has changed and the
way professionals learn is fast paced, on the job, as needed. The old methods of measuring 40
hours of input per year for CPE are not actually accounting for all the learning that is taking
place. Changes are due in the way professional development is measured as well as what is
measured. Several research articles have suggested measuring increases in competence or
abilities, rather than measuring the amount of time input. Such a change would bring us closer to
measuring more directly what the CPE is intended to improve.
49
CHAPTER 3
RESEARCH METHOD
The purpose of this study was to determine the opinions of Certified Public Accountants
(CPAs) about the current requirements for Continuing Professional Education (CPE) and their
level of satisfaction in accomplishing the purposes intended by these requirements. This chapter
also examines if opinions are affected by or show significant differences based on different
groups determined by the biographical data. This chapter also describes the research design,
defines the population and sample, explains the data collection, and discusses the planned
analysis of the data.
A nonexperimental quantitative research design was chosen to examine the relationship
among the opinions of accountants concerning the current state of continuing education
requirements and various categorical differences based on demographics. The term
nonexperimental is used to describe the effects and co-relationships associated with different
variables that occur naturally in the environment and are not under the control of the researcher.
Research Questions and Null Hypothesis
The study examined the current state of continuing professional education for
professional accountants. The general areas addressed were value, benefit to self, delivery,
benefit to others, and barriers to obtaining CPE. The research questions are provided in the
following list. Following each question are the corresponding null hypotheses to be tested.
50
Research Questions:
1. Is there a significant difference in the mean scores for the five dimensions of the CPE survey
(Value, Delivery, Benefit to Self, Benefit to Others, and Barriers) between males and
females?
Ho11: There is no significant difference in the mean scores on Dimension 1 (Value) of
the CPE survey between males and females.
Ho12: There is no significant difference in the mean scores on Dimension 2 (Delivery) of
the CPE survey between males and females.
Ho13: There is no significant difference in the mean scores on Dimension 3 (Benefit to
Self) of the CPE survey between males and females.
Ho14: There is no significant difference in the mean scores on Dimension 4 (Benefit to
Others) of the CPE survey between males and females.
Ho15: There is no significant difference in the mean scores on Dimension 5 (Barriers) of
the CPE survey between males and females.
2. Is there a significant difference in the mean scores for the five dimensions of the CPE survey
(Value, Delivery, Benefit to Self, Benefit to Others, and Barriers) among CPAs’ years of
experience (1-9, 10-19, 20-29, 30-39, and 40 or more)?
Ho21: There is no significant difference in the mean scores on Dimension 1 (Value) of
the CPE survey among the 5 years of experience groups (1-9, 10-19, 20-29, 30-39, and
40 or more).
51
Ho22: There is no significant difference in the mean scores on Dimension 2 (Delivery) of
the CPE survey among the 5 years of experience groups (1-9, 10-19, 20-29, 30-39, and
40 or more).
Ho23: There is no significant difference in the mean scores on Dimension 3 (Benefit to
Self) of the CPE survey among the 5 years of experience groups (1-9, 10-19, 20-29, 30-
39, and 40 or more).
Ho24: There is no significant difference in the mean scores on Dimension 4 (Benefit to
Others) of the CPE survey among the 5 years of experience groups (1-9, 10-19, 20-29,
30-39, and 40 or more).
Ho25: There is no significant difference in the mean scores on Dimension 5 (Barriers) of
the CPE survey among the 5 years of experience groups (1-9, 10-19, 20-29, 30-39, and
40 or more).
3. Is there a significant difference in the mean scores on the five dimensions of the CPE survey
(Value, Delivery, Benefit to Self, Benefit to Others, and Barriers) among CPAs’ types of
business (public practice, banking/finance/insurance, industry, government/education, and
nonprofit/small business/other)?
Ho31: There is no significant difference in the mean scores on Dimension 1 (Value) of
the CPE survey among the 5 types of business (public practice, banking/
finance/insurance, industry, government/education, and nonprofit/small business/other).
Ho32: There is no significant difference in the mean scores on Dimension 2 (Delivery) of
the CPE survey among the 5 types of business (public practice, banking/finance/
insurance, industry, government/education, and nonprofit/small business/other).
52
Ho33: There is no significant difference in the mean scores on Dimension 3 (Benefit to
Self) of the CPE survey among the 5 types of business (public practice,
banking/finance/insurance, industry, government/education, and nonprofit/small
business/other).
Ho34: There is no significant difference in the mean scores on Dimension 4 (Benefit to
Others) of the CPE survey among the 5 types of business practice (public practice,
banking/finance/insurance, industry, government/education, and nonprofit/small
business/other).
Ho35: There is no significant difference in the mean scores on Dimension 5 (Barriers) of
the CPE survey among the 5 types of business (public practice, banking/finance/
insurance, industry, government/education, and nonprofit/small business/other).
4. Is there a significant difference in the mean scores on the five dimensions of the CPE survey
(Value, Delivery, Benefit to Self, Benefit to Others, and Barriers) among the firm sizes by
the number of employees (1-5, 6-25, 26-50, 51-100, 101-500, and 501 or more)?
Ho41: There is no significant difference in the mean scores on Dimension 1 (Value) of
the CPE survey among the firms sizes by number of employees (1-5. 6-25, 26-50, 51-
100, 101-500, and 501 or more).
Ho42: There is no significant difference in the mean scores on Dimension 2 (Delivery) of
the CPE survey among the firms sizes by number of employees (1-5. 6-25, 26-50, 51-
100, 101-500, and 501 or more).
53
Ho43: There is no significant difference in the mean scores on Dimension 3 (Benefit to
Self) of the CPE survey among the firms sizes by number of employees (1-5. 6-25, 26-50,
51-100, 101-500, and 501 or more).
Ho44: There is no significant difference in the mean scores on Dimension 4 (Benefit to
Others) of the CPE survey among the firms sizes by number of employees (1-5. 6-25, 26-
50, 51-100, 101-500, and 501 or more).
Ho45: There is no significant difference in the mean scores on Dimension 5 (Barriers) of
the CPE survey among the firms sizes by number of employees (1-5. 6-25, 26-50, 51-
100, 101-500, and 501 or more).
5. Is there a significant difference in the mean scores on the five dimensions of the CPE survey
(Value, Delivery, Benefit to Self, Benefit to Others, and Barriers) among the positions held
by CPAs within the company (self-employed, employee, manager, and partner/other)?
Ho51: There is no significant difference in the mean scores on Dimension 1 (Value) of
the CPE survey among the 4 positions held by CPAs within the company (self-employed,
employee, manager, and partner/other).
Ho52: There is no significant difference in the mean scores on Dimension 2 (Delivery) of
the CPE survey among the 4 positions held by CPAs within the company (self-employed,
employee, manager, and partner/other).
Ho53: There is no significant difference in the mean scores on Dimension 3 (Benefit to
Self) of the CPE survey among the 4 positions held by CPAs within the company (self-
employed, employee, manager, and partner/other).
54
Ho54: There is no significant difference in the mean scores on Dimension 4 (Benefit to
Others) of the CPE survey among the 4 positions held by CPAs within the company (self-
employed, employee, manager, and partner/other).
Ho55: There is no significant difference in the mean scores on Dimension 5 (Barriers) of
the CPE survey among the 4 positions held by CPAs within the company (self-employed,
employee, manager, and partner/other).
Instrumentation
This nonexperimental research design used a Likert-type survey administered to CPAs at
their monthly local chapter meetings. The survey is based upon a survey developed by
Wessels (2007).
This survey contained ratings on a six point forced choice scale of strongly agree to
strongly disagree, to avoid neutral answers. This allowed the researcher to analyze the strength of
agreement or disagreement and measure to what extent they differ from the average based on the
demographics mentioned in the Research Questions section. The demographic section allowed
classification of five independent variables which are gender, years of experience, type of
business, size of company, and current position.
The dependent variables in the research are a sum of the opinions measuring agreement
with the questions presented. Each question is categorized into a Dimension and the sum of the
opinions for each Dimension is the calculated dependent variable. The five Dimensions are
presented below:
The Five Dimensions
1. Value (or cost/benefit)
2. Delivery (methods and quality)
3. Benefit to Self
55
4. Benefit to Others
5. Barriers (to obtaining CPE)
Population and Sample
Approximately 205 members of Tennessee Society of Certified Public Accountants
(TSCPA) served as participants and completed the survey at the various chapters located in
Northeast Tennessee. The format for the data collection allowed this researcher to explain the
educational purpose of the study to the subjects, which further facilitated participation.
The population represented by the sample were all the CPAs practicing in Eastern
Tennessee. Extrapolation of these results to all CPAs in Tennessee or possibly the United States
would be desirable but not appropriate due to the limited localization of these participants. The
TSCPA members of the local chapters who participated in the survey comprise the sample.
Data Collection
The survey was distributed at the monthly meetings of local TSCPA chapters which were
Tri-Cities, Knoxville, and Chattanooga. At the beginning of this research project, permission was
obtained from the Tennessee Society of CPAs (TSCPAs) to distribute the survey at monthly
meetings. Permission to perform the study was obtained from the Institutional Review Board
(IRB) of East Tennessee State University (ETSU). Permission was also granted by Wessels
(2007) to use the survey developed for her research.
A Likert-type survey was distributed on the tables prior to the meeting. The chapter
president introduced the researcher and the survey was briefly explained, and an explanation was
also provided on the first page of the survey itself. All participants were 18 years of age or older,
a requirement that was specified on the survey. No names or personal identifiable information
were requested, so participants remained anonymous. Each meeting included social time, lunch
or dinner, and an hour long presentation. After the meeting, forms were left on the table and were
56
picked up or collected at the door. This allowed respondents time to review the information and
decide whether to participate, as it was made clear that participation was voluntary.
Data Analysis
The responses to the survey were initially input into an Excel spreadsheet, and then
uploaded into IBM-SPSS Version 23. The first five hypotheses were tested using a series of
independent sample t-test. The remaining 20 hypotheses were tested using a series of one-way
ANOVAs (Analysis of Variance). An alpha level of .05 was chosen for the level of significance
to use in testing for significance throughout all tests. Post hoc tests were used as appropriate, and
we will discuss these tests in Chapter 4.
Chapter Summary
Chapter 3 presented the research methodology used in this study. Following the
introduction of what is covered in Chapter 3, the research design section provided an overview of
the type of research that was conducted as well as the benefits of such research indicating the
existence of a relationship, with no causal explanation, while minimizing objectivity. Next the
population and selection of the sample were explained followed by an explanation of how the
data would be collected. The data analysis section explained what procedures would be followed
in the analysis. Chapter 4 presents the results of the analyses.
57
CHAPTER 4
RESULTS
The purpose of this study was to determine the opinions of Certified Public Accountants
(CPAs) about the current requirements for Continuing Professional Education (CPE) and their
level of satisfaction in accomplishing the purposes intended by these requirements. The survey
was composed of five demographic questions and 23 opinion questions about CPE to acquire the
data used in this study. The dimensions of Value, Delivery, Benefit to Self, Benefit to Others,
and Barriers were categories of questions presented in a Likert-type survey.
This chapter presents the survey results by addressing participants’ level of agreement
with the five dimensions of Value, Delivery, Benefit to Self, Benefit to Others, and Barriers. The
statistical package IBM-SPSS computer software was used to analyze the data, providing
statistical significance test results in support of the study findings.
The survey was presented to 310 CPAs attending three local chapter meetings of the
Tennessee Society of CPAs in Kingsport, Knoxville, and Chattanooga; from which 203 CPAs
participated in the survey for a response rate of 65%. The demographics of participants in this
study are presented in Table 1.
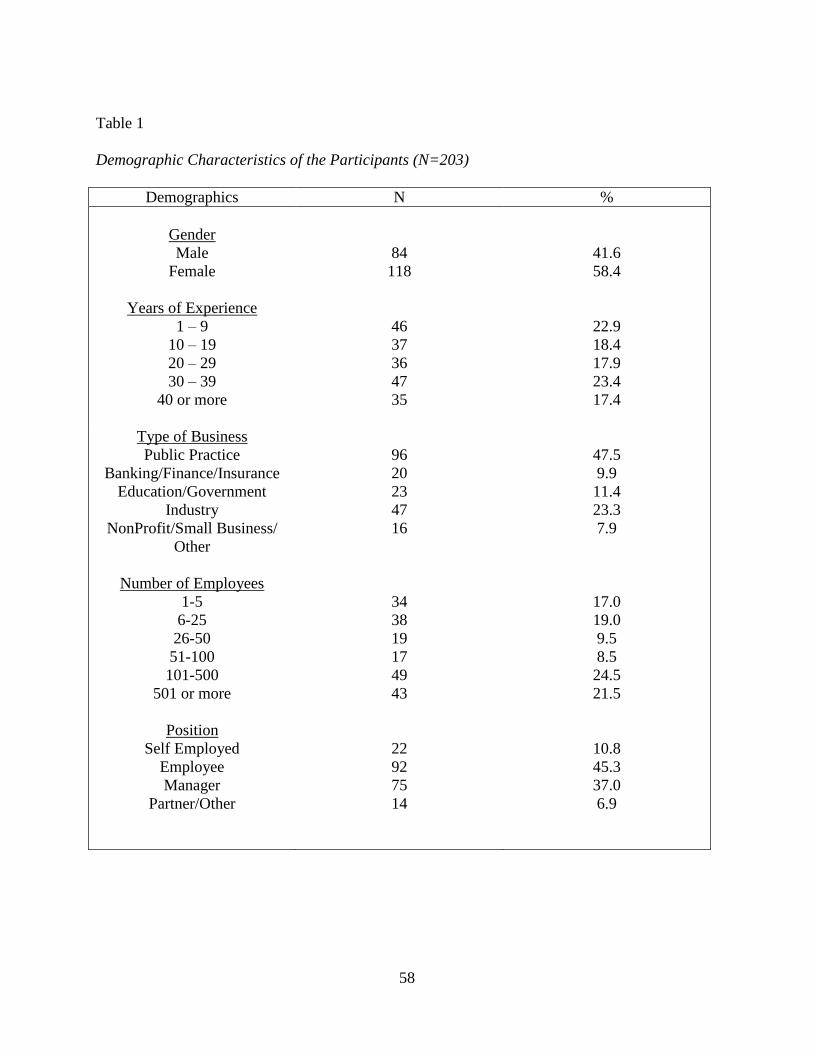
58
Table 1
Demographic Characteristics of the Participants (N=203)
Demographics N %
Gender
Male
Female
Years of Experience
1 – 9
10 – 19
20 – 29
30 – 39
40 or more
84
118
46
37
36
47
35
41.6
58.4
22.9
18.4
17.9
23.4
17.4
Type of Business
Public Practice
Banking/Finance/Insurance
Education/Government
Industry
NonProfit/Small Business/
Other
Number of Employees
1-5
6-25
26-50
51-100
101-500
501 or more
Position
Self Employed
Employee
Manager
Partner/Other
96
20
23
47
16
34
38
19
17
49
43
22
92
75
14
47.5
9.9
11.4
23.3
7.9
17.0
19.0
9.5
8.5
24.5
21.5
10.8
45.3
37.0
6.9
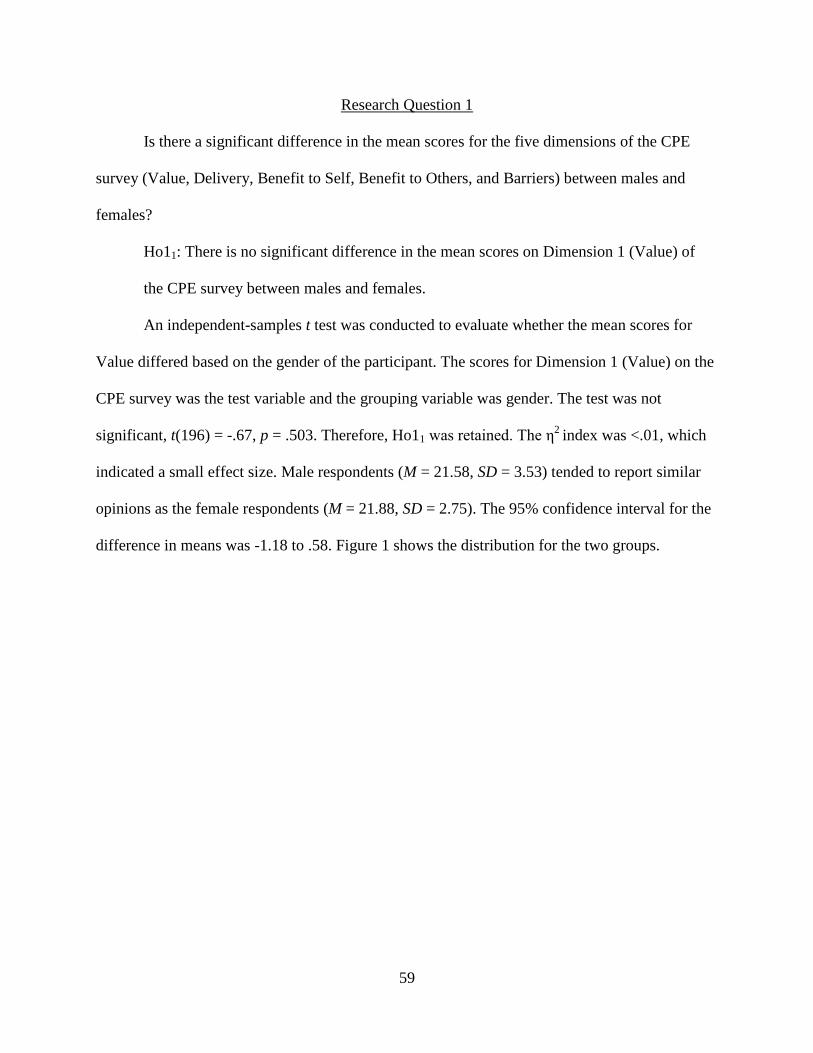
59
Research Question 1
Is there a significant difference in the mean scores for the five dimensions of the CPE
survey (Value, Delivery, Benefit to Self, Benefit to Others, and Barriers) between males and
females?
Ho11: There is no significant difference in the mean scores on Dimension 1 (Value) of
the CPE survey between males and females.
An independent-samples t test was conducted to evaluate whether the mean scores for
Value differed based on the gender of the participant. The scores for Dimension 1 (Value) on the
CPE survey was the test variable and the grouping variable was gender. The test was not
significant, t(196) = -.67, p = .503. Therefore, Ho11 was retained. The η2
index was <.01, which
indicated a small effect size. Male respondents (M = 21.58, SD = 3.53) tended to report similar
opinions as the female respondents (M = 21.88, SD = 2.75). The 95% confidence interval for the
difference in means was -1.18 to .58. Figure 1 shows the distribution for the two groups.
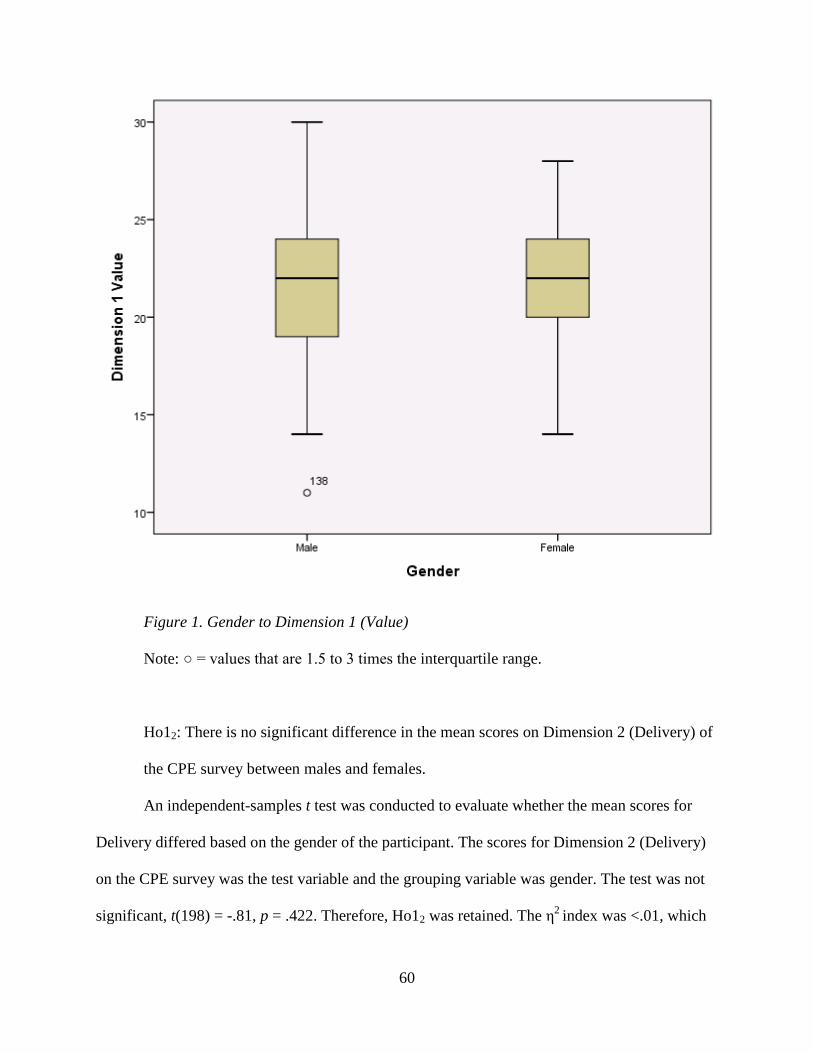
60
Figure 1. Gender to Dimension 1 (Value)
Note: ○ = values that are 1.5 to 3 times the interquartile range.
Ho12: There is no significant difference in the mean scores on Dimension 2 (Delivery) of
the CPE survey between males and females.
An independent-samples t test was conducted to evaluate whether the mean scores for
Delivery differed based on the gender of the participant. The scores for Dimension 2 (Delivery)
on the CPE survey was the test variable and the grouping variable was gender. The test was not
significant, t(198) = -.81, p = .422. Therefore, Ho12 was retained. The η2
index was <.01, which
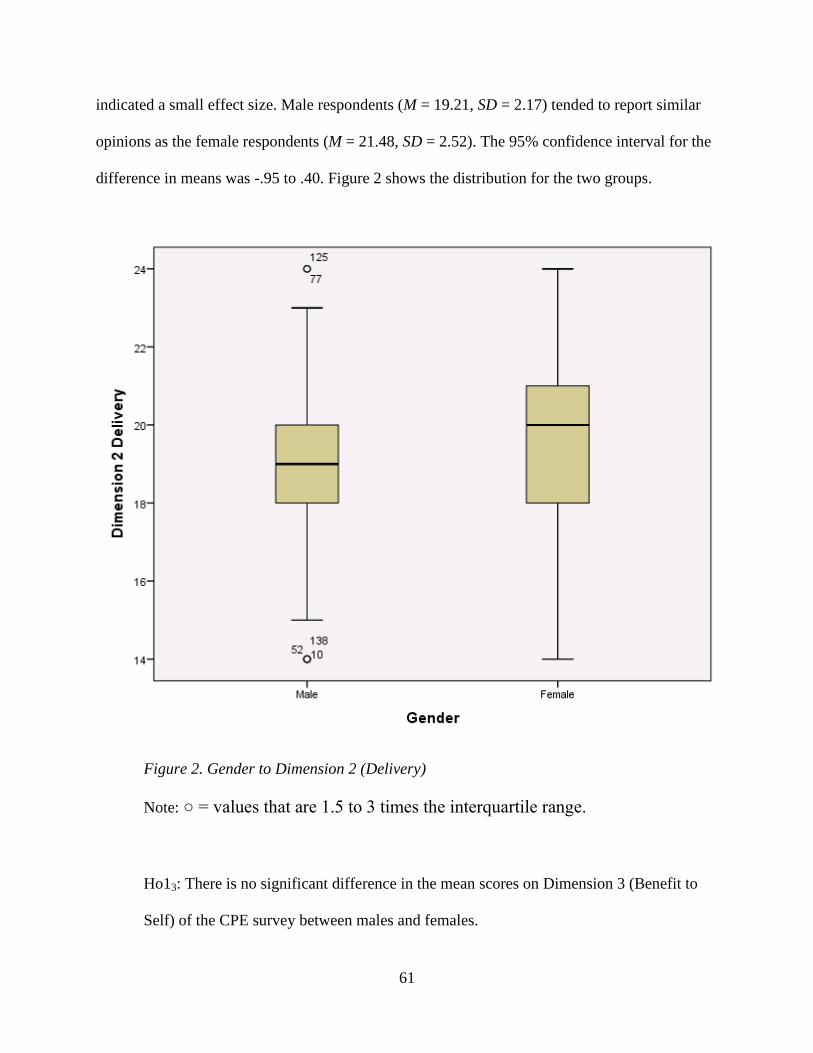
61
indicated a small effect size. Male respondents (M = 19.21, SD = 2.17) tended to report similar
opinions as the female respondents (M = 21.48, SD = 2.52). The 95% confidence interval for the
difference in means was -.95 to .40. Figure 2 shows the distribution for the two groups.
Figure 2. Gender to Dimension 2 (Delivery)
Note: ○ = values that are 1.5 to 3 times the interquartile range.
Ho13: There is no significant difference in the mean scores on Dimension 3 (Benefit to
Self) of the CPE survey between males and females.
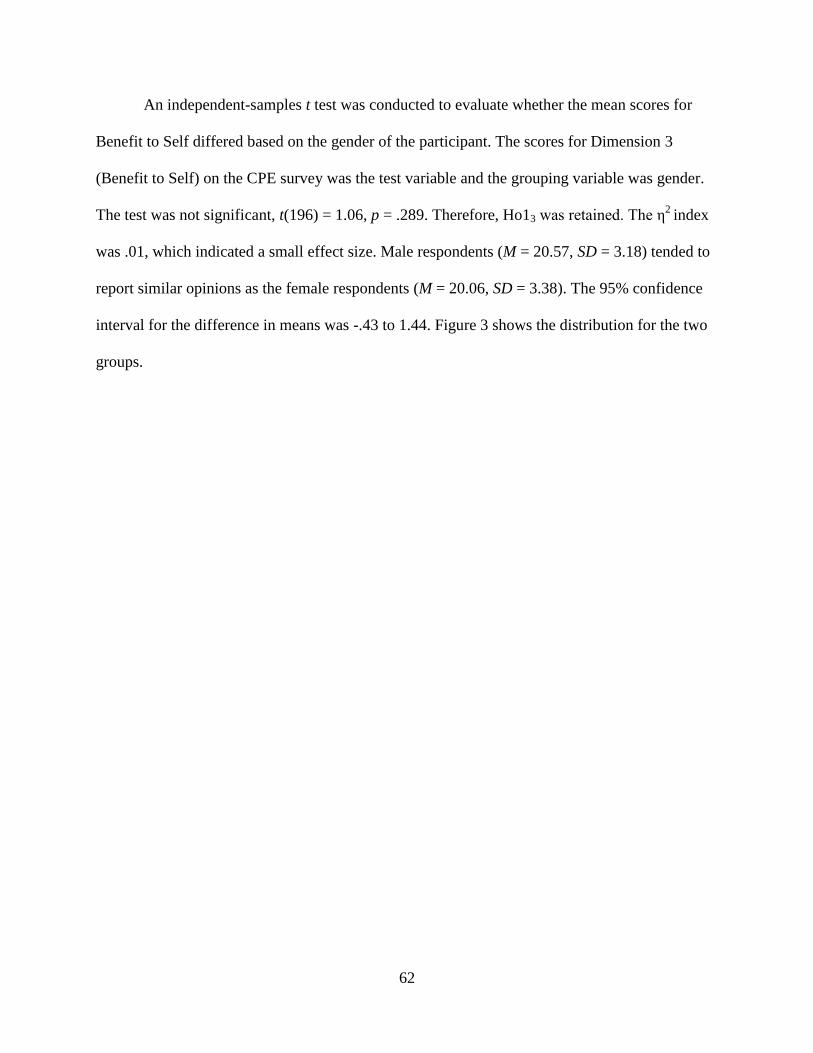
62
An independent-samples t test was conducted to evaluate whether the mean scores for
Benefit to Self differed based on the gender of the participant. The scores for Dimension 3
(Benefit to Self) on the CPE survey was the test variable and the grouping variable was gender.
The test was not significant, t(196) = 1.06, p = .289. Therefore, Ho13 was retained. The η2
index
was .01, which indicated a small effect size. Male respondents (M = 20.57, SD = 3.18) tended to
report similar opinions as the female respondents (M = 20.06, SD = 3.38). The 95% confidence
interval for the difference in means was -.43 to 1.44. Figure 3 shows the distribution for the two
groups.
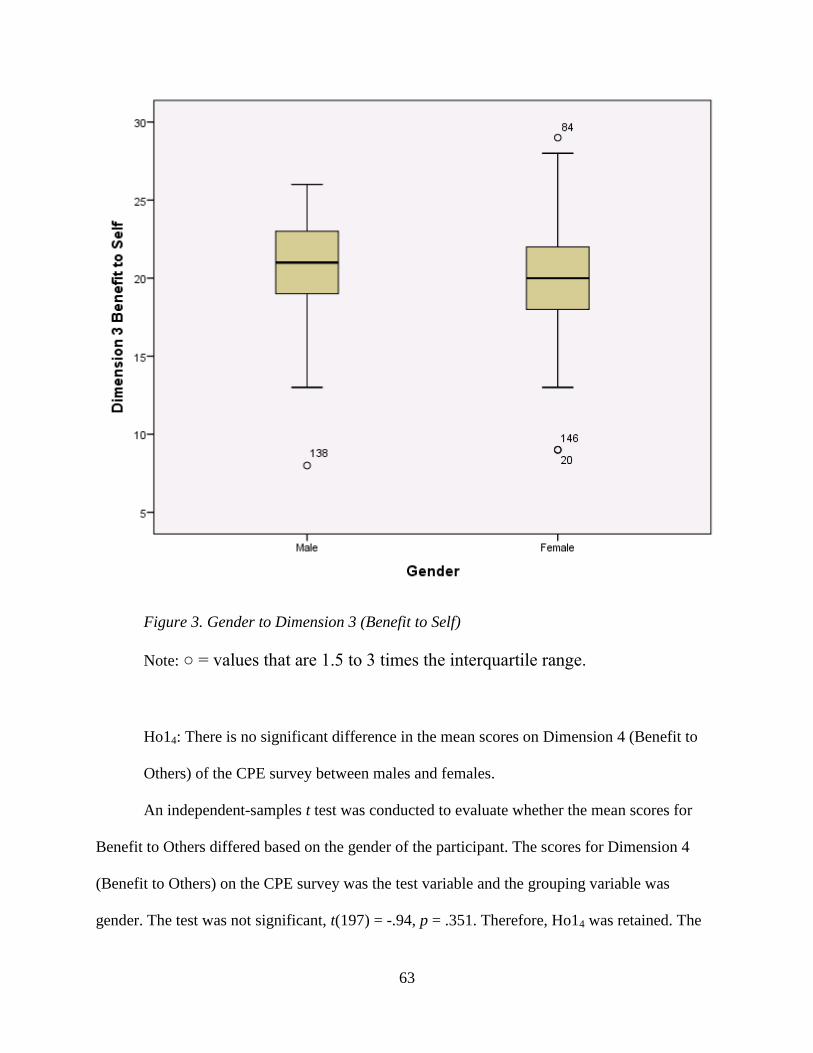
63
Figure 3. Gender to Dimension 3 (Benefit to Self)
Note: ○ = values that are 1.5 to 3 times the interquartile range.
Ho14: There is no significant difference in the mean scores on Dimension 4 (Benefit to
Others) of the CPE survey between males and females.
An independent-samples t test was conducted to evaluate whether the mean scores for
Benefit to Others differed based on the gender of the participant. The scores for Dimension 4
(Benefit to Others) on the CPE survey was the test variable and the grouping variable was
gender. The test was not significant, t(197) = -.94, p = .351. Therefore, Ho14 was retained. The
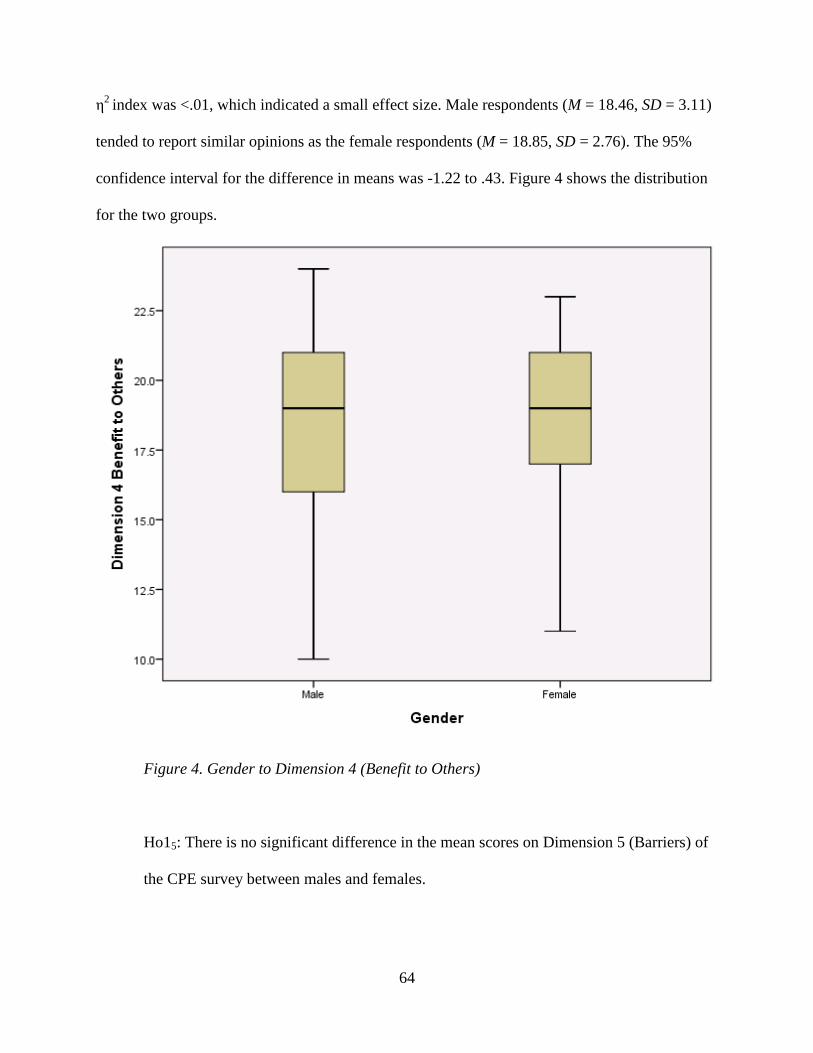
64
η2
index was <.01, which indicated a small effect size. Male respondents (M = 18.46, SD = 3.11)
tended to report similar opinions as the female respondents (M = 18.85, SD = 2.76). The 95%
confidence interval for the difference in means was -1.22 to .43. Figure 4 shows the distribution
for the two groups.
Figure 4. Gender to Dimension 4 (Benefit to Others)
Ho15: There is no significant difference in the mean scores on Dimension 5 (Barriers) of
the CPE survey between males and females.
65
An independent-samples t test was conducted to evaluate whether the mean scores for
Barriers differed based on the gender of the participant. The scores for Dimension 5 (Barriers) on
the CPE survey was the test variable and the grouping variable was gender. The test was not
significant, t(196) = .57, p = .568. Therefore, Ho15 was retained. The η2
index was .01, which
indicated a small effect size. Male respondents (M = 17.47, SD = 3.79) tended to report similar
opinions as the female respondents (M = 17.16, SD = 3.81). The 95% confidence interval for the
difference in means was -.77 to 1.40. Figure 5 shows the distribution for the two groups.
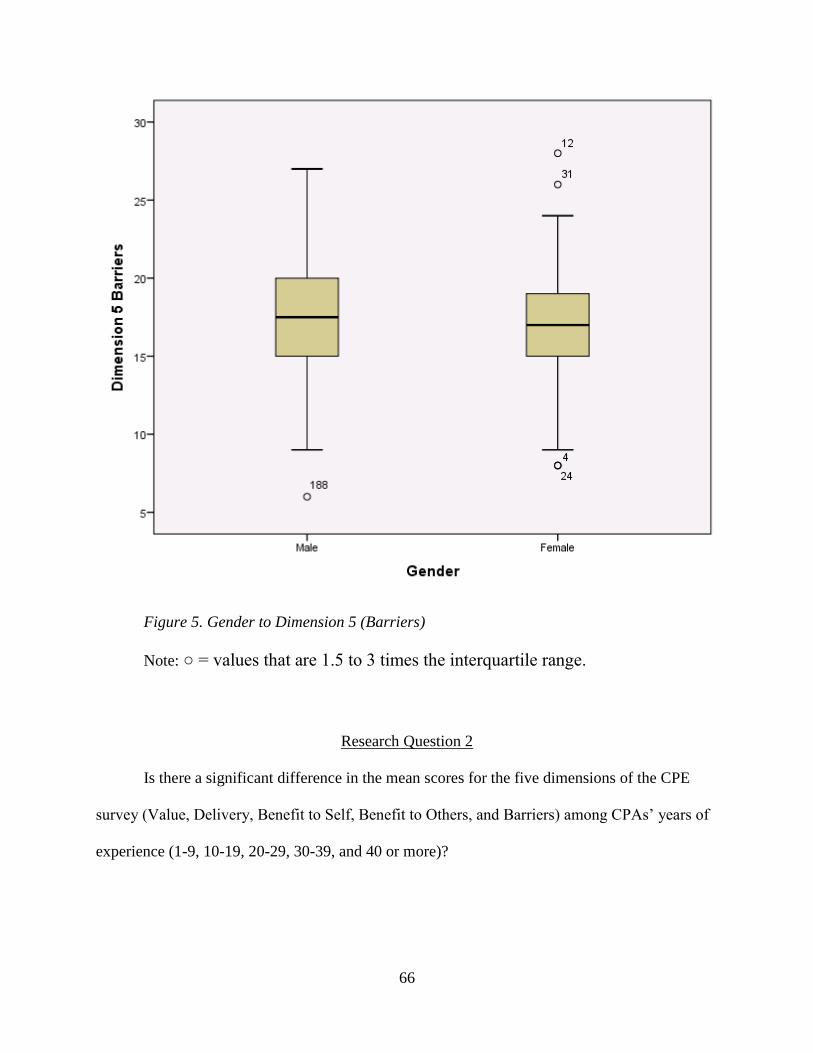
66
Figure 5. Gender to Dimension 5 (Barriers)
Note: ○ = values that are 1.5 to 3 times the interquartile range.
Research Question 2
Is there a significant difference in the mean scores for the five dimensions of the CPE
survey (Value, Delivery, Benefit to Self, Benefit to Others, and Barriers) among CPAs’ years of
experience (1-9, 10-19, 20-29, 30-39, and 40 or more)?
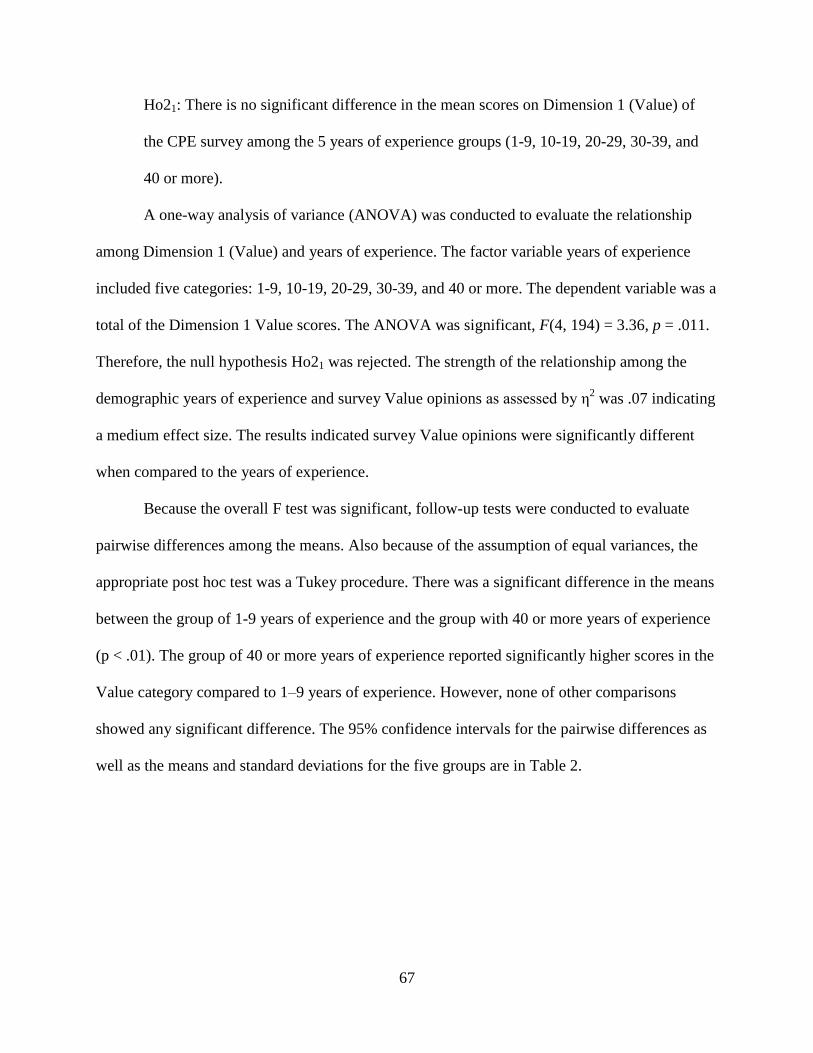
67
Ho21: There is no significant difference in the mean scores on Dimension 1 (Value) of
the CPE survey among the 5 years of experience groups (1-9, 10-19, 20-29, 30-39, and
40 or more).
A one-way analysis of variance (ANOVA) was conducted to evaluate the relationship
among Dimension 1 (Value) and years of experience. The factor variable years of experience
included five categories: 1-9, 10-19, 20-29, 30-39, and 40 or more. The dependent variable was a
total of the Dimension 1 Value scores. The ANOVA was significant, F(4, 194) = 3.36, p = .011.
Therefore, the null hypothesis Ho21 was rejected. The strength of the relationship among the
demographic years of experience and survey Value opinions as assessed by η2 was .07 indicating
a medium effect size. The results indicated survey Value opinions were significantly different
when compared to the years of experience.
Because the overall F test was significant, follow-up tests were conducted to evaluate
pairwise differences among the means. Also because of the assumption of equal variances, the
appropriate post hoc test was a Tukey procedure. There was a significant difference in the means
between the group of 1-9 years of experience and the group with 40 or more years of experience
(p < .01). The group of 40 or more years of experience reported significantly higher scores in the
Value category compared to 1–9 years of experience. However, none of other comparisons
showed any significant difference. The 95% confidence intervals for the pairwise differences as
well as the means and standard deviations for the five groups are in Table 2.
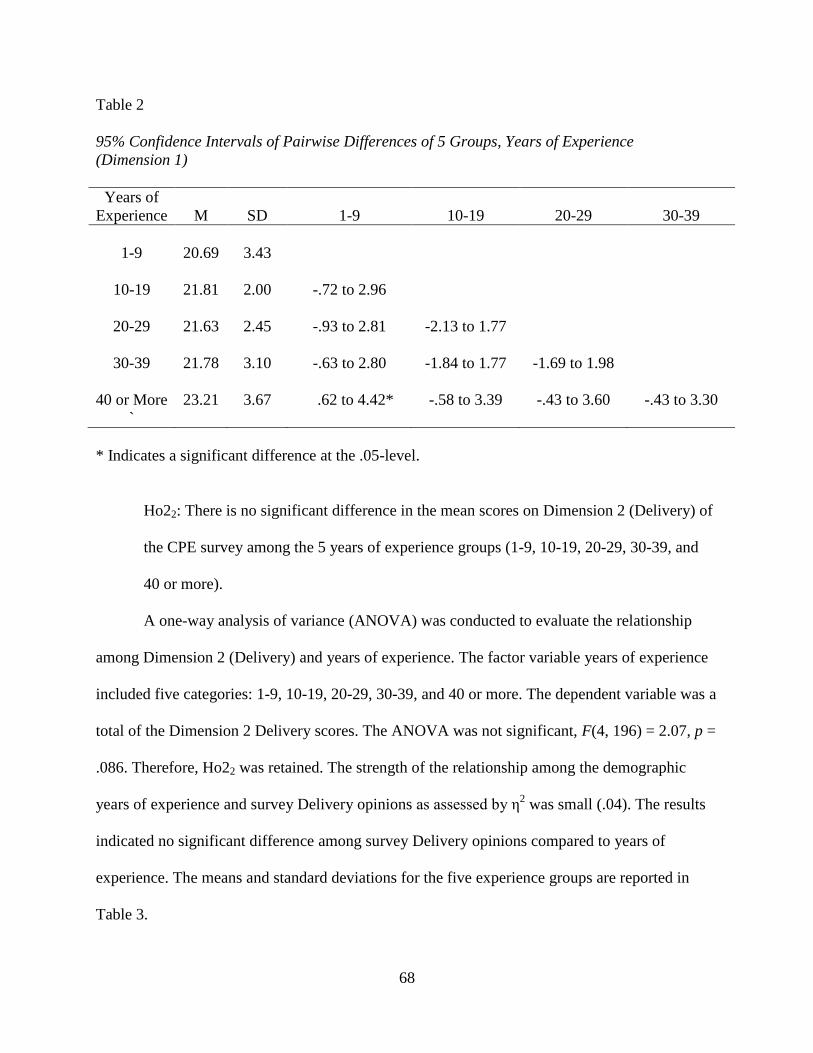
68
Table 2
95% Confidence Intervals of Pairwise Differences of 5 Groups, Years of Experience
(Dimension 1)
Years of
Experience
M
SD
1-9
10-19
20-29
30-39
1-9
20.69
3.43
10-19
21.81 2.00 -.72 to 2.96
20-29
21.63 2.45 -.93 to 2.81 -2.13 to 1.77
30-39
21.78 3.10 -.63 to 2.80 -1.84 to 1.77 -1.69 to 1.98
40 or More
`
23.21 3.67 .62 to 4.42* -.58 to 3.39 -.43 to 3.60 -.43 to 3.30
* Indicates a significant difference at the .05-level.
Ho22: There is no significant difference in the mean scores on Dimension 2 (Delivery) of
the CPE survey among the 5 years of experience groups (1-9, 10-19, 20-29, 30-39, and
40 or more).
A one-way analysis of variance (ANOVA) was conducted to evaluate the relationship
among Dimension 2 (Delivery) and years of experience. The factor variable years of experience
included five categories: 1-9, 10-19, 20-29, 30-39, and 40 or more. The dependent variable was a
total of the Dimension 2 Delivery scores. The ANOVA was not significant, F(4, 196) = 2.07, p =
.086. Therefore, Ho22 was retained. The strength of the relationship among the demographic
years of experience and survey Delivery opinions as assessed by η2 was small (.04). The results
indicated no significant difference among survey Delivery opinions compared to years of
experience. The means and standard deviations for the five experience groups are reported in
Table 3.
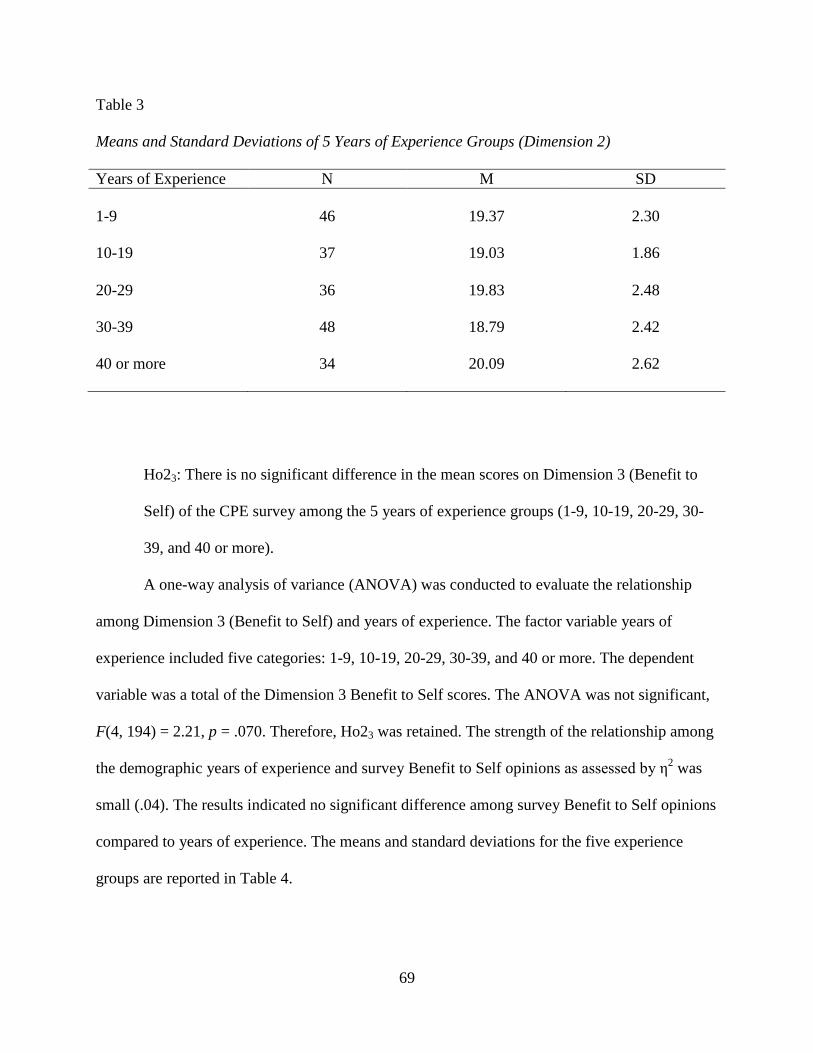
69
Table 3
Means and Standard Deviations of 5 Years of Experience Groups (Dimension 2)
Years of Experience N M SD
1-9
46
19.37
2.30
10-19 37 19.03 1.86
20-29 36 19.83 2.48
30-39 48 18.79 2.42
40 or more 34 20.09 2.62
Ho23: There is no significant difference in the mean scores on Dimension 3 (Benefit to
Self) of the CPE survey among the 5 years of experience groups (1-9, 10-19, 20-29, 30-
39, and 40 or more).
A one-way analysis of variance (ANOVA) was conducted to evaluate the relationship
among Dimension 3 (Benefit to Self) and years of experience. The factor variable years of
experience included five categories: 1-9, 10-19, 20-29, 30-39, and 40 or more. The dependent
variable was a total of the Dimension 3 Benefit to Self scores. The ANOVA was not significant,
F(4, 194) = 2.21, p = .070. Therefore, Ho23 was retained. The strength of the relationship among
the demographic years of experience and survey Benefit to Self opinions as assessed by η2 was
small (.04). The results indicated no significant difference among survey Benefit to Self opinions
compared to years of experience. The means and standard deviations for the five experience
groups are reported in Table 4.

70
Table 4
Means and Standard Deviations of 5 Years of Experience Groups (Dimension 3)
Years of Experience N M SD
1-9
46
19.89
3.80
10-19
37 20.00 2.61
20-29 35 20.74 2.79
30-39 48 19.63 3.27
40 or more 33 21.58 3.48
Ho24: There is no significant difference in the mean scores on Dimension 4 (Benefit to
Others) of the CPE survey among the 5 years of experience groups (1-9, 10-19, 20-29,
30-39, and 40 or more).
A one-way analysis of variance (ANOVA) was conducted to evaluate the relationship
among Dimension 4 (Benefit to Others) and years of experience. The factor variable years of
experience included five categories: 1-9, 10-19, 20-29, 30-39, and 40 or more. The dependent
variable was a total of the Dimension 4 Benefit to Others scores. The ANOVA was not
significant, F(4, 195) = 1.74, p = .143. Therefore, Ho24 was retained. The strength of the
relationship among the demographic years of experience and survey Benefit to Others opinions
as assessed by η2 was small (.03). The results indicated no significant difference among survey
Benefit to Self opinions compared to years of experience. The means and standard deviations for
the five experience groups are reported in Table 5.
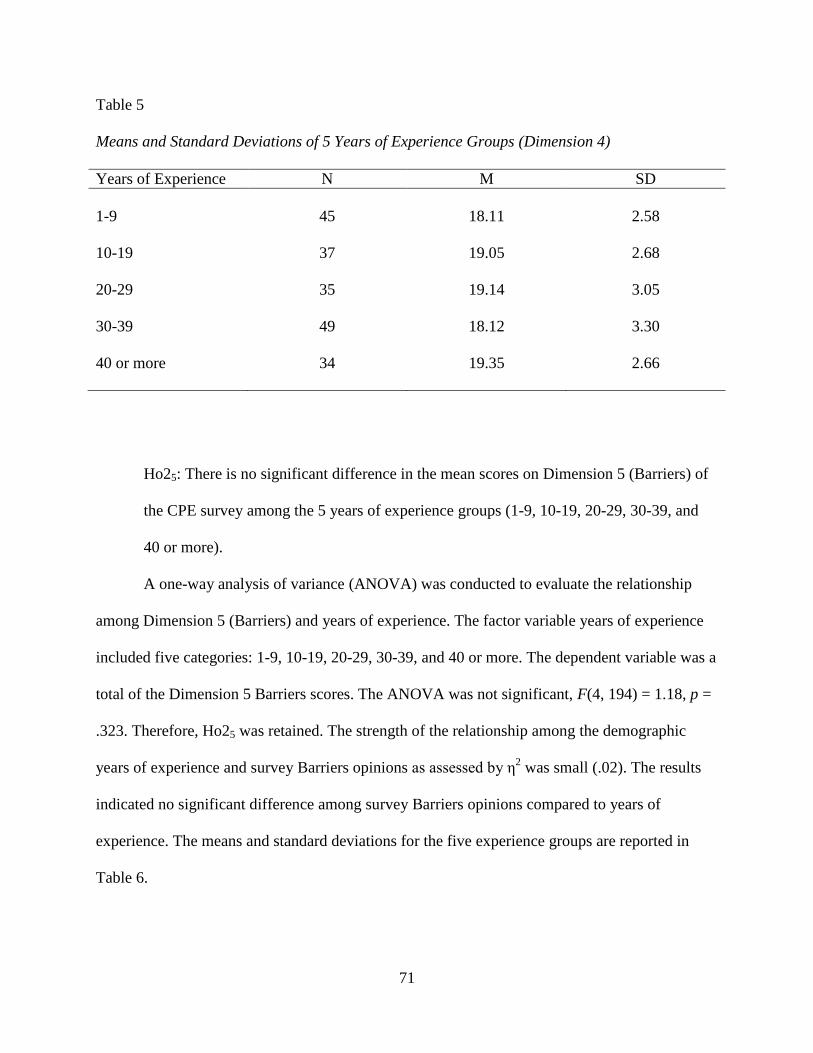
71
Table 5
Means and Standard Deviations of 5 Years of Experience Groups (Dimension 4)
Years of Experience N M SD
1-9
45
18.11
2.58
10-19
37 19.05 2.68
20-29 35 19.14 3.05
30-39 49 18.12 3.30
40 or more 34 19.35 2.66
Ho25: There is no significant difference in the mean scores on Dimension 5 (Barriers) of
the CPE survey among the 5 years of experience groups (1-9, 10-19, 20-29, 30-39, and
40 or more).
A one-way analysis of variance (ANOVA) was conducted to evaluate the relationship
among Dimension 5 (Barriers) and years of experience. The factor variable years of experience
included five categories: 1-9, 10-19, 20-29, 30-39, and 40 or more. The dependent variable was a
total of the Dimension 5 Barriers scores. The ANOVA was not significant, F(4, 194) = 1.18, p =
.323. Therefore, Ho25 was retained. The strength of the relationship among the demographic
years of experience and survey Barriers opinions as assessed by η2 was small (.02). The results
indicated no significant difference among survey Barriers opinions compared to years of
experience. The means and standard deviations for the five experience groups are reported in
Table 6.
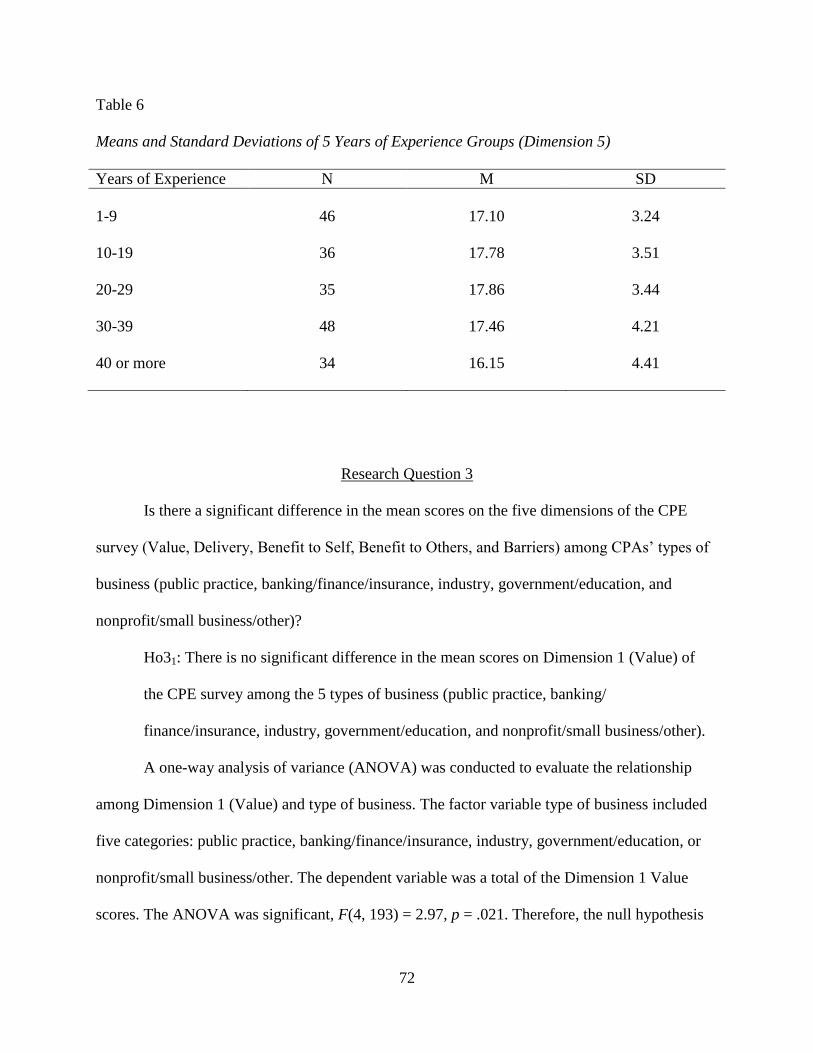
72
Table 6
Means and Standard Deviations of 5 Years of Experience Groups (Dimension 5)
Years of Experience N M SD
1-9
46
17.10
3.24
10-19
36 17.78 3.51
20-29 35 17.86 3.44
30-39 48 17.46 4.21
40 or more 34 16.15 4.41
Research Question 3
Is there a significant difference in the mean scores on the five dimensions of the CPE
survey (Value, Delivery, Benefit to Self, Benefit to Others, and Barriers) among CPAs’ types of
business (public practice, banking/finance/insurance, industry, government/education, and
nonprofit/small business/other)?
Ho31: There is no significant difference in the mean scores on Dimension 1 (Value) of
the CPE survey among the 5 types of business (public practice, banking/
finance/insurance, industry, government/education, and nonprofit/small business/other).
A one-way analysis of variance (ANOVA) was conducted to evaluate the relationship
among Dimension 1 (Value) and type of business. The factor variable type of business included
five categories: public practice, banking/finance/insurance, industry, government/education, or
nonprofit/small business/other. The dependent variable was a total of the Dimension 1 Value
scores. The ANOVA was significant, F(4, 193) = 2.97, p = .021. Therefore, the null hypothesis

73
Ho31 was rejected. The strength of the relationship among the demographic type of business and
survey Value opinions as assessed by η2 was .06 indicating a medium effect size. The results
indicated survey Value opinions were significantly different when compared to the type of
business.
Because the overall F test was significant, follow-up tests were conducted to evaluate
pairwise differences among the means. Because of the assumption of equal variances, the
appropriate post hoc test was a Tukey procedure. There was a significant difference in the means
between the public practice business and the banking/finance/insurance (p = .020). The banking/
finance/insurance reported significantly higher scores in the Value category compared to public
practice. However, none of other comparisons showed a significant difference. The 95%
confidence intervals for the pairwise differences as well as the means and standard deviations for
the five groups appear in Table 7.
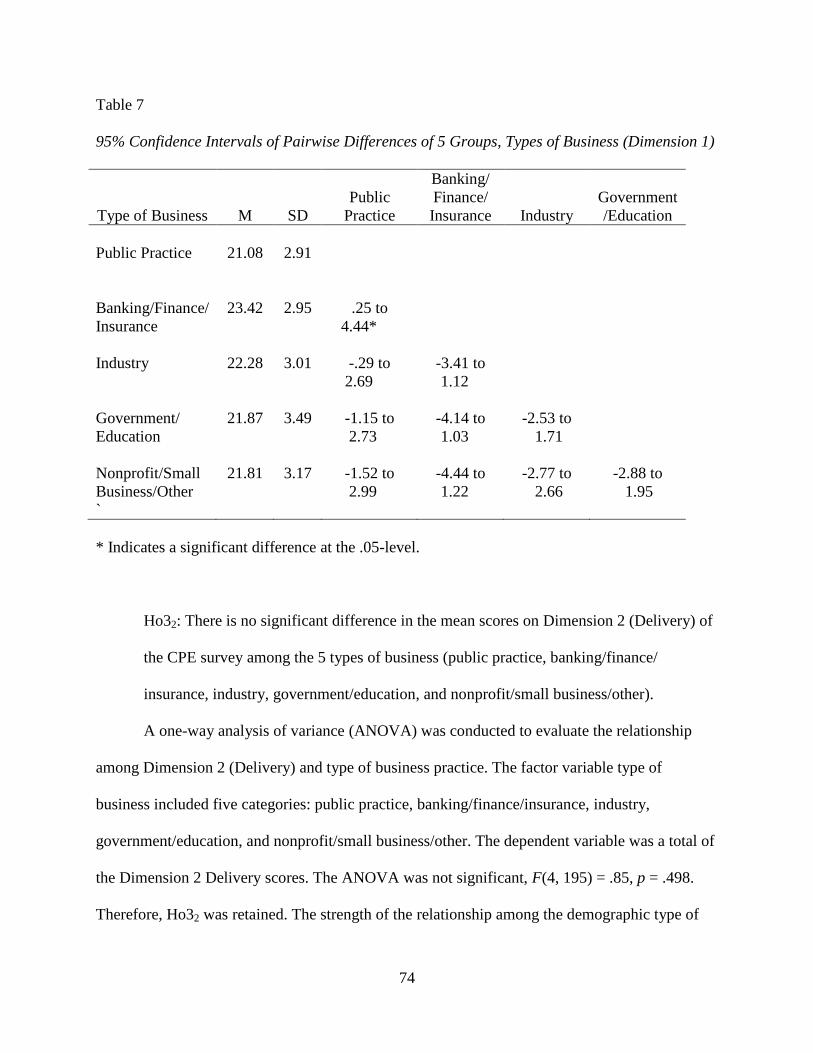
74
Table 7
95% Confidence Intervals of Pairwise Differences of 5 Groups, Types of Business (Dimension 1)
Type of Business
M
SD
Public
Practice
Banking/
Finance/
Insurance
Industry
Government
/Education
Public Practice
21.08
2.91
Banking/Finance/
Insurance
23.42 2.95 .25 to
4.44*
Industry
22.28 3.01 -.29 to
2.69
-3.41 to
1.12
Government/
Education
21.87 3.49 -1.15 to
2.73
-4.14 to
1.03
-2.53 to
1.71
Nonprofit/Small
Business/Other
`
21.81 3.17 -1.52 to
2.99
-4.44 to
1.22
-2.77 to
2.66
-2.88 to
1.95
* Indicates a significant difference at the .05-level.
Ho32: There is no significant difference in the mean scores on Dimension 2 (Delivery) of
the CPE survey among the 5 types of business (public practice, banking/finance/
insurance, industry, government/education, and nonprofit/small business/other).
A one-way analysis of variance (ANOVA) was conducted to evaluate the relationship
among Dimension 2 (Delivery) and type of business practice. The factor variable type of
business included five categories: public practice, banking/finance/insurance, industry,
government/education, and nonprofit/small business/other. The dependent variable was a total of
the Dimension 2 Delivery scores. The ANOVA was not significant, F(4, 195) = .85, p = .498.
Therefore, Ho32 was retained. The strength of the relationship among the demographic type of
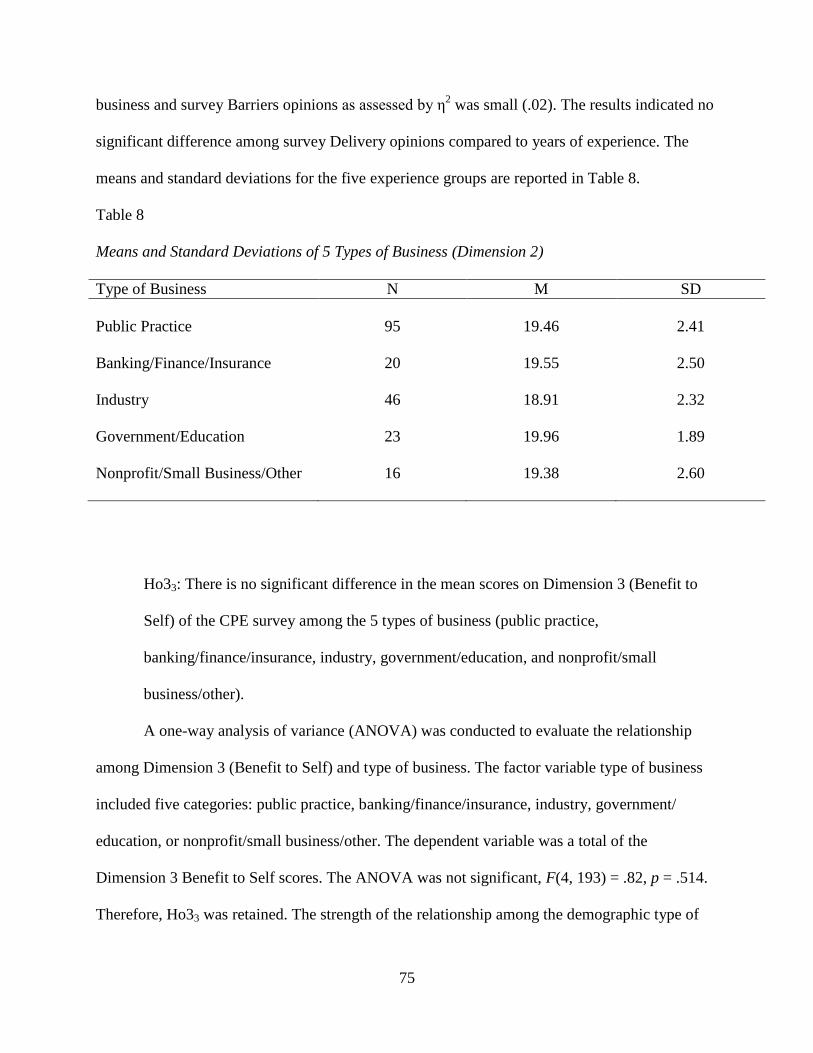
75
business and survey Barriers opinions as assessed by η2 was small (.02). The results indicated no
significant difference among survey Delivery opinions compared to years of experience. The
means and standard deviations for the five experience groups are reported in Table 8.
Table 8
Means and Standard Deviations of 5 Types of Business (Dimension 2)
Type of Business N M SD
Public Practice
95
19.46
2.41
Banking/Finance/Insurance
20 19.55 2.50
Industry 46 18.91 2.32
Government/Education 23 19.96 1.89
Nonprofit/Small Business/Other
16 19.38 2.60
Ho33: There is no significant difference in the mean scores on Dimension 3 (Benefit to
Self) of the CPE survey among the 5 types of business (public practice,
banking/finance/insurance, industry, government/education, and nonprofit/small
business/other).
A one-way analysis of variance (ANOVA) was conducted to evaluate the relationship
among Dimension 3 (Benefit to Self) and type of business. The factor variable type of business
included five categories: public practice, banking/finance/insurance, industry, government/
education, or nonprofit/small business/other. The dependent variable was a total of the
Dimension 3 Benefit to Self scores. The ANOVA was not significant, F(4, 193) = .82, p = .514.
Therefore, Ho33 was retained. The strength of the relationship among the demographic type of
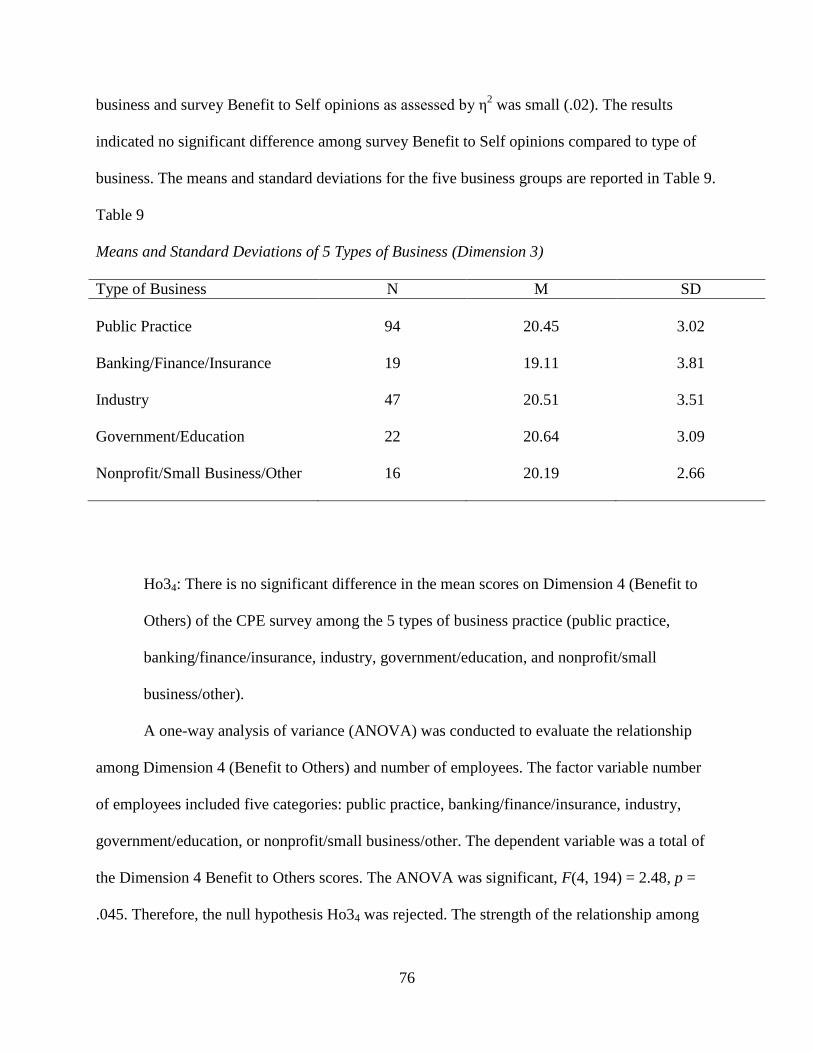
76
business and survey Benefit to Self opinions as assessed by η2 was small (.02). The results
indicated no significant difference among survey Benefit to Self opinions compared to type of
business. The means and standard deviations for the five business groups are reported in Table 9.
Table 9
Means and Standard Deviations of 5 Types of Business (Dimension 3)
Type of Business N M SD
Public Practice
94
20.45
3.02
Banking/Finance/Insurance
19 19.11 3.81
Industry 47 20.51 3.51
Government/Education 22 20.64 3.09
Nonprofit/Small Business/Other
16 20.19 2.66
Ho34: There is no significant difference in the mean scores on Dimension 4 (Benefit to
Others) of the CPE survey among the 5 types of business practice (public practice,
banking/finance/insurance, industry, government/education, and nonprofit/small
business/other).
A one-way analysis of variance (ANOVA) was conducted to evaluate the relationship
among Dimension 4 (Benefit to Others) and number of employees. The factor variable number
of employees included five categories: public practice, banking/finance/insurance, industry,
government/education, or nonprofit/small business/other. The dependent variable was a total of
the Dimension 4 Benefit to Others scores. The ANOVA was significant, F(4, 194) = 2.48, p =
.045. Therefore, the null hypothesis Ho34 was rejected. The strength of the relationship among

77
the demographic type of business and survey Benefit to Others opinions as assessed by η2 was
.05 indicating a medium effect size. The results indicated survey Benefit to Others opinions were
significantly different when compared to the type of business.
Because the overall F test was significant, follow-up tests were conducted to evaluate
pairwise differences among the means. Because of the assumption of equal variances, the
appropriate post hoc test was a Tukey procedure. There was a significant difference in the means
between public practice and industry (p = .023). The industry business reported significantly
higher scores in the Benefit to Self category compared to public practice. However, none of other
comparisons showed a significant difference. The 95% confidence intervals for the pairwise
differences as well as the means and standard deviations for the five groups are in Table 10.

78
Table 10
95% Confidence Intervals of Pairwise Differences of 5 Groups, Types of Business (Dimension 4)
Type of Business
M
SD
Public
Practice
Banking/
Finance/
Insurance
Industry
Government/
Education
Public
Practice
18.21
2.94
Banking/Finance/
Insurance
18.74 2.45 -1.46 to
2.51
Industry
19.77 2.56 .14 to
2.96*
-1.11 to
3.17
Government/
Education
18.83 3.51 -1.22 to
2.45
-2.36 to
2.53
-2.95 to
1.07
Nonprofit/Small
Business/Other
`
18.13 2.66 -2.22 to
2.04
-3.29 to
2.06
-3.92 to
.64
-3.27 to
1.87
* Indicates a significant difference at the .05-level.
Ho35: There is no significant difference in the mean scores on Dimension 5 (Barriers) of
the CPE survey among the 5 types of business (public practice, banking/finance/
insurance, industry, government/education, and nonprofit/small business/other).
A one-way analysis of variance (ANOVA) was conducted to evaluate the relationship
among Dimension 5 (Barriers) and type of business. The factor variable type of business
included five categories: public practice, banking/finance/insurance, industry,
government/education, or nonprofit/small business/other. The dependent variable was a total of
the Dimension 5 Barriers scores. The ANOVA was not significant, F(4, 193) = .90, p = .464.
Therefore, Ho35 was retained. The strength of the relationship among the demographic type of
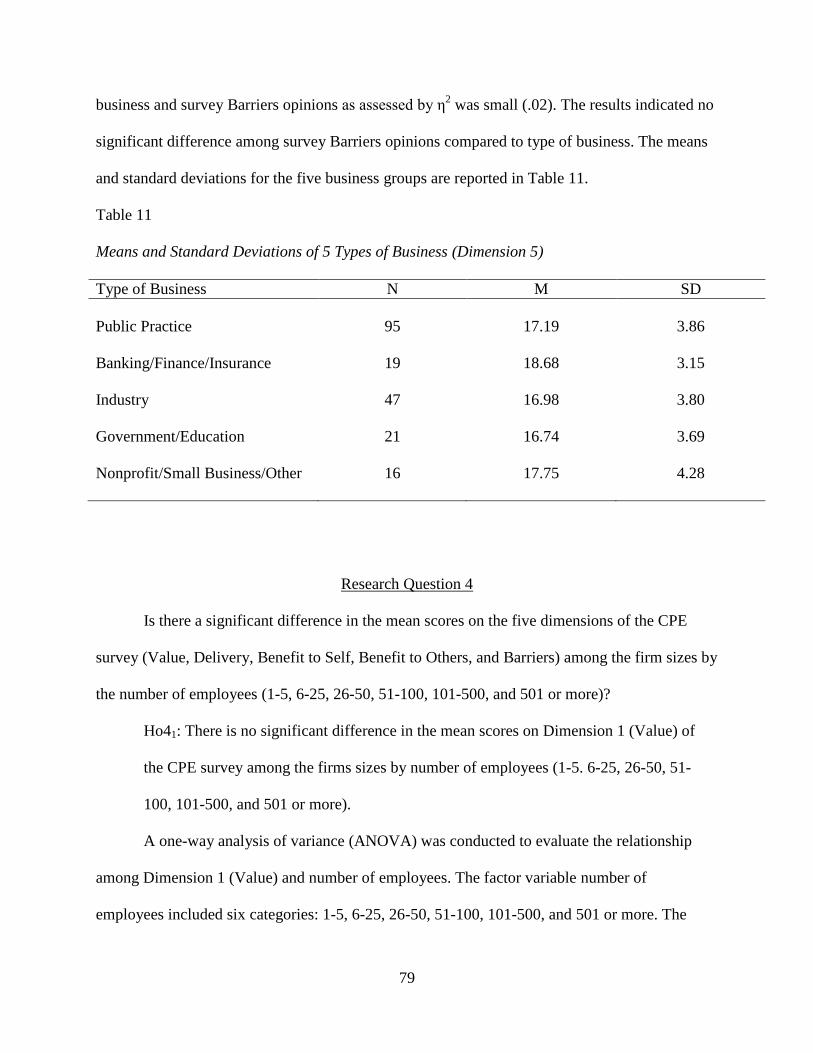
79
business and survey Barriers opinions as assessed by η2 was small (.02). The results indicated no
significant difference among survey Barriers opinions compared to type of business. The means
and standard deviations for the five business groups are reported in Table 11.
Table 11
Means and Standard Deviations of 5 Types of Business (Dimension 5)
Type of Business N M SD
Public Practice
95
17.19
3.86
Banking/Finance/Insurance
19 18.68 3.15
Industry 47 16.98 3.80
Government/Education 21 16.74 3.69
Nonprofit/Small Business/Other
16 17.75 4.28
Research Question 4
Is there a significant difference in the mean scores on the five dimensions of the CPE
survey (Value, Delivery, Benefit to Self, Benefit to Others, and Barriers) among the firm sizes by
the number of employees (1-5, 6-25, 26-50, 51-100, 101-500, and 501 or more)?
Ho41: There is no significant difference in the mean scores on Dimension 1 (Value) of
the CPE survey among the firms sizes by number of employees (1-5. 6-25, 26-50, 51-
100, 101-500, and 501 or more).
A one-way analysis of variance (ANOVA) was conducted to evaluate the relationship
among Dimension 1 (Value) and number of employees. The factor variable number of
employees included six categories: 1-5, 6-25, 26-50, 51-100, 101-500, and 501 or more. The
80
dependent variable was a total of the Dimension 1 Value scores. The ANOVA was significant,
F(5, 190) = 5.60, p = <.001. Therefore, the null hypothesis Ho41 was rejected. The strength of
the relationship among the demographic type of business and survey Value opinions as assessed
by η2 was .13 indicating a large effect size. The results indicated survey Value opinions were
significantly different when the number of employees was involved.
Because the overall F test was significant, follow-up tests were conducted to evaluate
pairwise differences among the means. Because of the assumption of equal variances, the
appropriate post hoc test was a Tukey procedure. There was a significant difference in the means
between 1-5 and 101-500 employees (p = .001), as well as between 501 or more and 101-500
employees (p = .001). The two groups of 1-5 employees and 501 or more employees reported
significantly higher scores in the Value category than the 101-500 employee group. However,
none of other comparisons were significantly different. The 95% confidence intervals for the
pairwise differences as well as the means and standard deviations for the five groups are in Table
12.
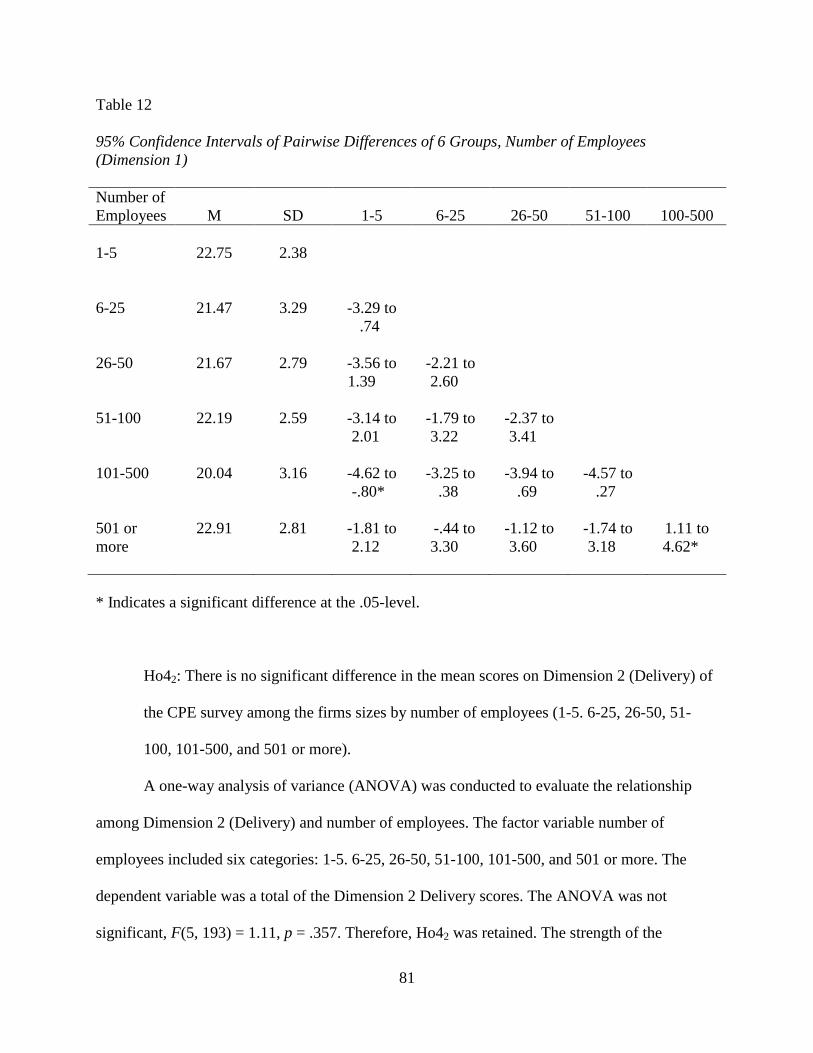
81
Table 12
95% Confidence Intervals of Pairwise Differences of 6 Groups, Number of Employees
(Dimension 1)
Number of
Employees
M
SD
1-5
6-25
26-50
51-100
100-500
1-5 22.75 2.38
6-25 21.47 3.29 -3.29 to
.74
26-50 21.67 2.79 -3.56 to
1.39
-2.21 to
2.60
51-100 22.19 2.59 -3.14 to
2.01
-1.79 to
3.22
-2.37 to
3.41
101-500 20.04 3.16 -4.62 to
-.80*
-3.25 to
.38
-3.94 to
.69
-4.57 to
.27
501 or
more
22.91 2.81 -1.81 to
2.12
-.44 to
3.30
-1.12 to
3.60
-1.74 to
3.18
1.11 to
4.62*
* Indicates a significant difference at the .05-level.
Ho42: There is no significant difference in the mean scores on Dimension 2 (Delivery) of
the CPE survey among the firms sizes by number of employees (1-5. 6-25, 26-50, 51-
100, 101-500, and 501 or more).
A one-way analysis of variance (ANOVA) was conducted to evaluate the relationship
among Dimension 2 (Delivery) and number of employees. The factor variable number of
employees included six categories: 1-5. 6-25, 26-50, 51-100, 101-500, and 501 or more. The
dependent variable was a total of the Dimension 2 Delivery scores. The ANOVA was not
significant, F(5, 193) = 1.11, p = .357. Therefore, Ho42 was retained. The strength of the
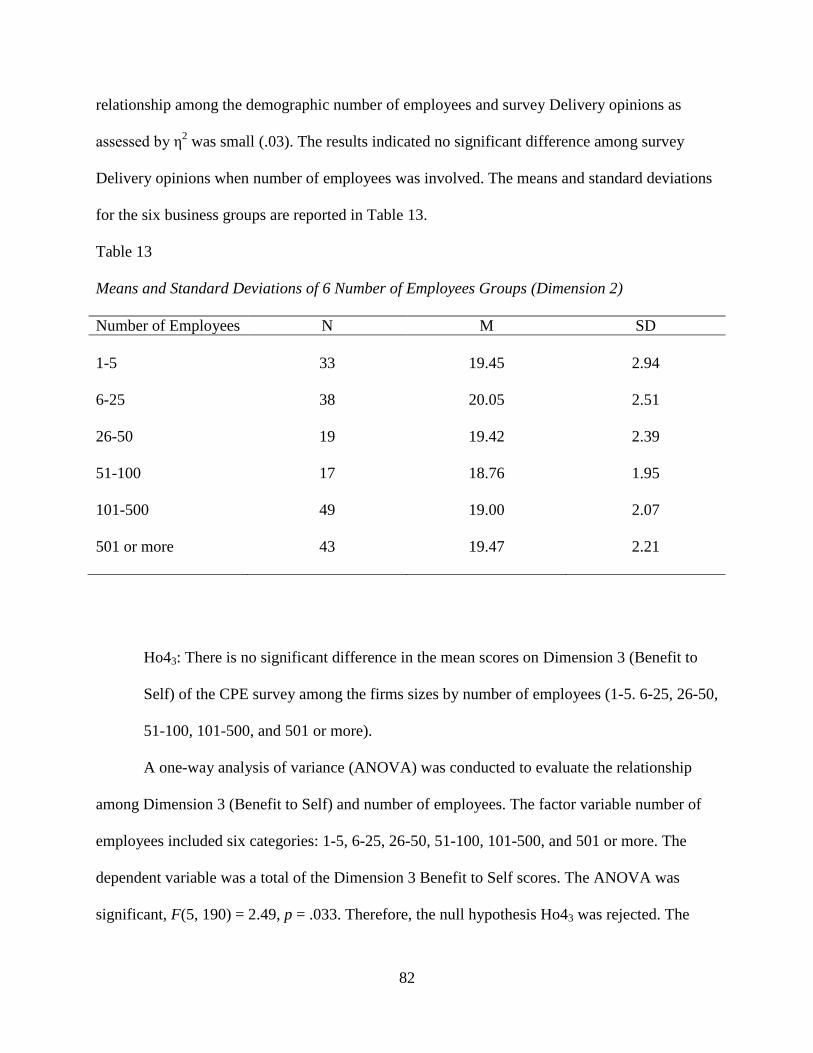
82
relationship among the demographic number of employees and survey Delivery opinions as
assessed by η2 was small (.03). The results indicated no significant difference among survey
Delivery opinions when number of employees was involved. The means and standard deviations
for the six business groups are reported in Table 13.
Table 13
Means and Standard Deviations of 6 Number of Employees Groups (Dimension 2)
Number of Employees N M SD
1-5
33
19.45
2.94
6-25
38 20.05 2.51
26-50 19 19.42 2.39
51-100 17 18.76 1.95
101-500 49 19.00 2.07
501 or more 43 19.47 2.21
Ho43: There is no significant difference in the mean scores on Dimension 3 (Benefit to
Self) of the CPE survey among the firms sizes by number of employees (1-5. 6-25, 26-50,
51-100, 101-500, and 501 or more).
A one-way analysis of variance (ANOVA) was conducted to evaluate the relationship
among Dimension 3 (Benefit to Self) and number of employees. The factor variable number of
employees included six categories: 1-5, 6-25, 26-50, 51-100, 101-500, and 501 or more. The
dependent variable was a total of the Dimension 3 Benefit to Self scores. The ANOVA was
significant, F(5, 190) = 2.49, p = .033. Therefore, the null hypothesis Ho43 was rejected. The
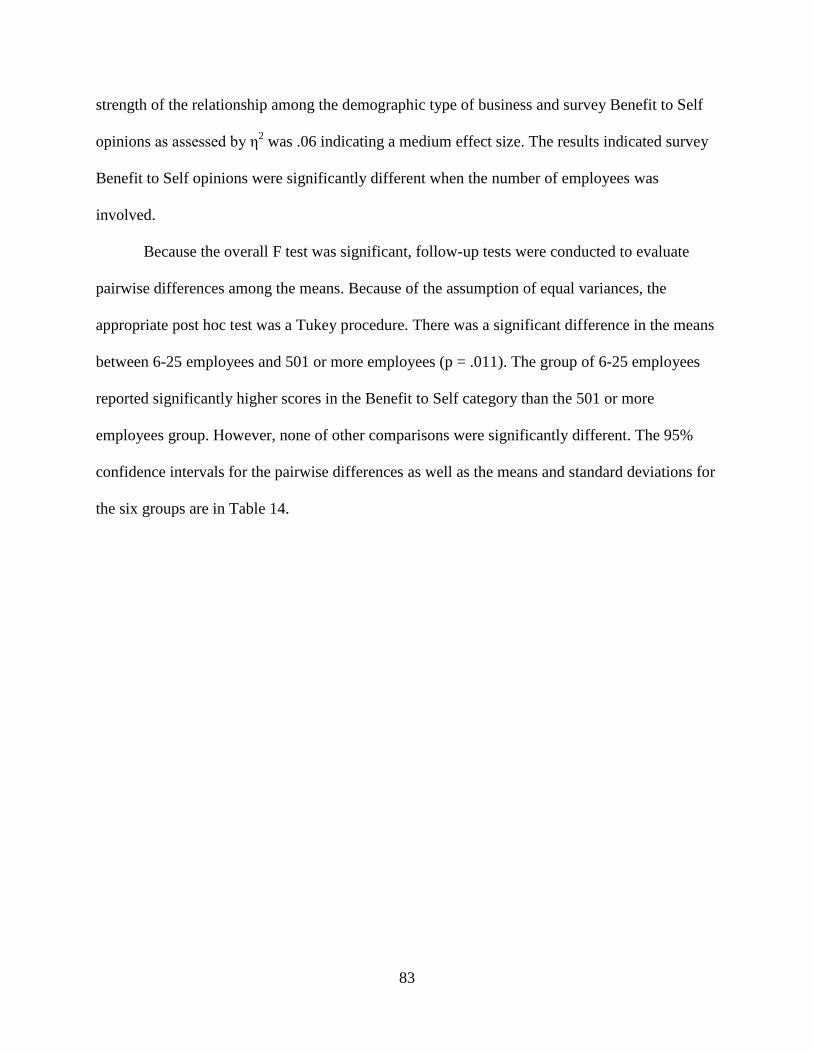
83
strength of the relationship among the demographic type of business and survey Benefit to Self
opinions as assessed by η2 was .06 indicating a medium effect size. The results indicated survey
Benefit to Self opinions were significantly different when the number of employees was
involved.
Because the overall F test was significant, follow-up tests were conducted to evaluate
pairwise differences among the means. Because of the assumption of equal variances, the
appropriate post hoc test was a Tukey procedure. There was a significant difference in the means
between 6-25 employees and 501 or more employees (p = .011). The group of 6-25 employees
reported significantly higher scores in the Benefit to Self category than the 501 or more
employees group. However, none of other comparisons were significantly different. The 95%
confidence intervals for the pairwise differences as well as the means and standard deviations for
the six groups are in Table 14.
84
Table 14
95% Confidence Intervals of Pairwise Differences of 6 Groups, Number of Employees
(Dimension 3)
Number of
Employees
M
SD
1-5
6-25
26-50
51-100
100-500
1-5
20.47 4.07
6-25 21.47 2.84 -1.22 to
3.23
26-50 19.78 1.87 -3.43 to
2.04
-4.35 to
.96
51-100 20.71 2.89 -2.55 to
3.02
-3.48 to
1.94
-2.21 to
4.07
101-500 20.29 3.42 -2.29 to
1.93
-3.19 to
.82
-2.05 to
3.07
-3.03 to
2.19
501 or
more
19.02
3.17 -3.62 to
.73
-4.53 to
-.37*
-3.37 to
1.86
-4.35 to
.99
-3.21 to
.69
* Indicates a significant difference at the .05-level.
Ho44: There is no significant difference in the mean scores on Dimension 4 (Benefit to
Others) of the CPE survey among the firms sizes by number of employees (1-5. 6-25, 26-
50, 51-100, 101-500, and 501 or more).
A one-way analysis of variance (ANOVA) was conducted to evaluate the relationship
among Dimension 4 (Benefit to Others) and number of employees. The factor variable number
of employees included six categories: 1-5. 6-25, 26-50, 51-100, 101-500, and 501 or more. The
dependent variable was a total of the Dimension 4 Benefit to Others scores. The ANOVA was

85
not significant, F(5, 191) = .71, p = .619. Therefore, Ho44 was retained. The strength of the
relationship among the demographic number of employees and survey Benefit to Others opinions
as assessed by η2 was small (.02). The results indicated no significant difference among survey
Benefit to Others opinions when compared to the number of employees. The means and standard
deviations for the six number of employees groups are reported in Table 15.
Table 15
Means and Standard Deviations of 6 Number of Employees Groups (Dimension 4)
Number of Employees N M SD
1-5
33
18.21
3.15
6-25
38 18.34 3.17
26-50 18 19.06 2.41
51-100 16 18.50 2.20
101-500 49 18.63 2.70
501 or more 43 19.28 2.84
Ho45: There is no significant difference in the mean scores on Dimension 5 (Barriers) of
the CPE survey among the firms sizes by number of employees (1-5. 6-25, 26-50, 51-
100, 101-500, and 501 or more).
A one-way analysis of variance (ANOVA) was conducted to evaluate the relationship
among Dimension 5 (Barriers) and number of employees. The factor variable number of
employees included six categories: 1-5, 6-25, 26-50, 51-100, 101-500, and 501 or more. The
dependent variable was a total of the Dimension 5 Barriers scores. The ANOVA was not
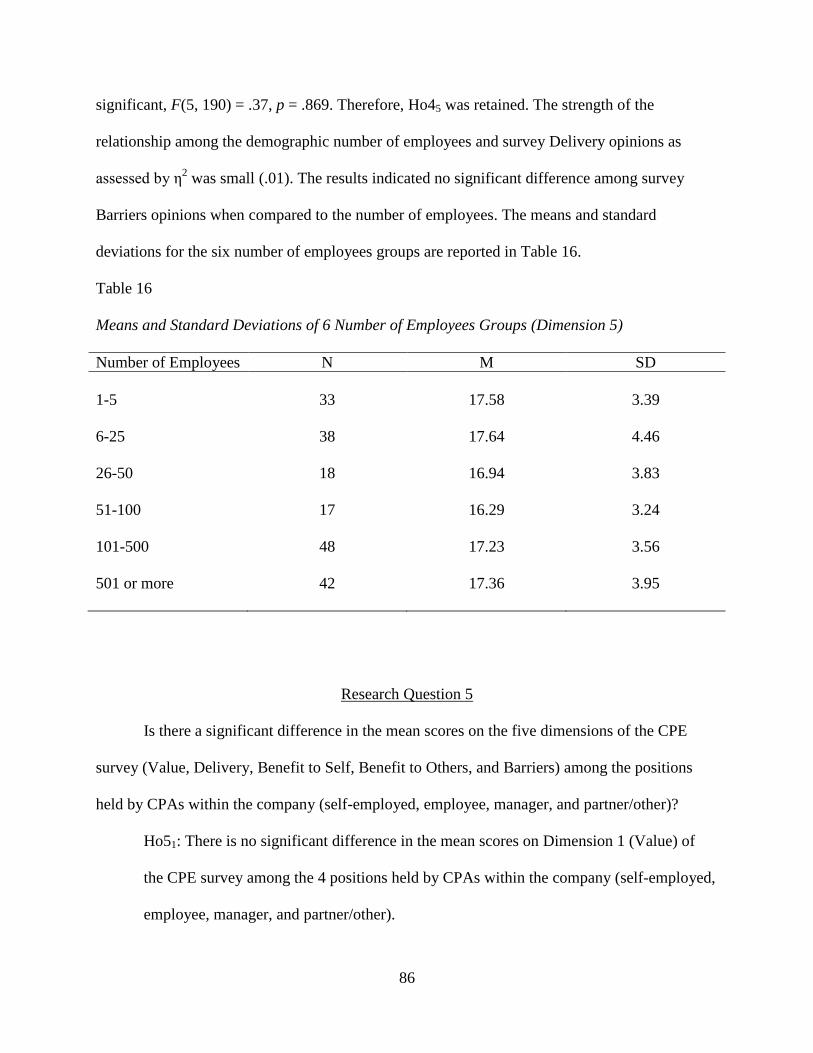
86
significant, F(5, 190) = .37, p = .869. Therefore, Ho45 was retained. The strength of the
relationship among the demographic number of employees and survey Delivery opinions as
assessed by η2 was small (.01). The results indicated no significant difference among survey
Barriers opinions when compared to the number of employees. The means and standard
deviations for the six number of employees groups are reported in Table 16.
Table 16
Means and Standard Deviations of 6 Number of Employees Groups (Dimension 5)
Number of Employees N M SD
1-5
33
17.58
3.39
6-25
38 17.64 4.46
26-50 18 16.94 3.83
51-100 17 16.29 3.24
101-500 48 17.23 3.56
501 or more 42 17.36 3.95
Research Question 5
Is there a significant difference in the mean scores on the five dimensions of the CPE
survey (Value, Delivery, Benefit to Self, Benefit to Others, and Barriers) among the positions
held by CPAs within the company (self-employed, employee, manager, and partner/other)?
Ho51: There is no significant difference in the mean scores on Dimension 1 (Value) of
the CPE survey among the 4 positions held by CPAs within the company (self-employed,
employee, manager, and partner/other).
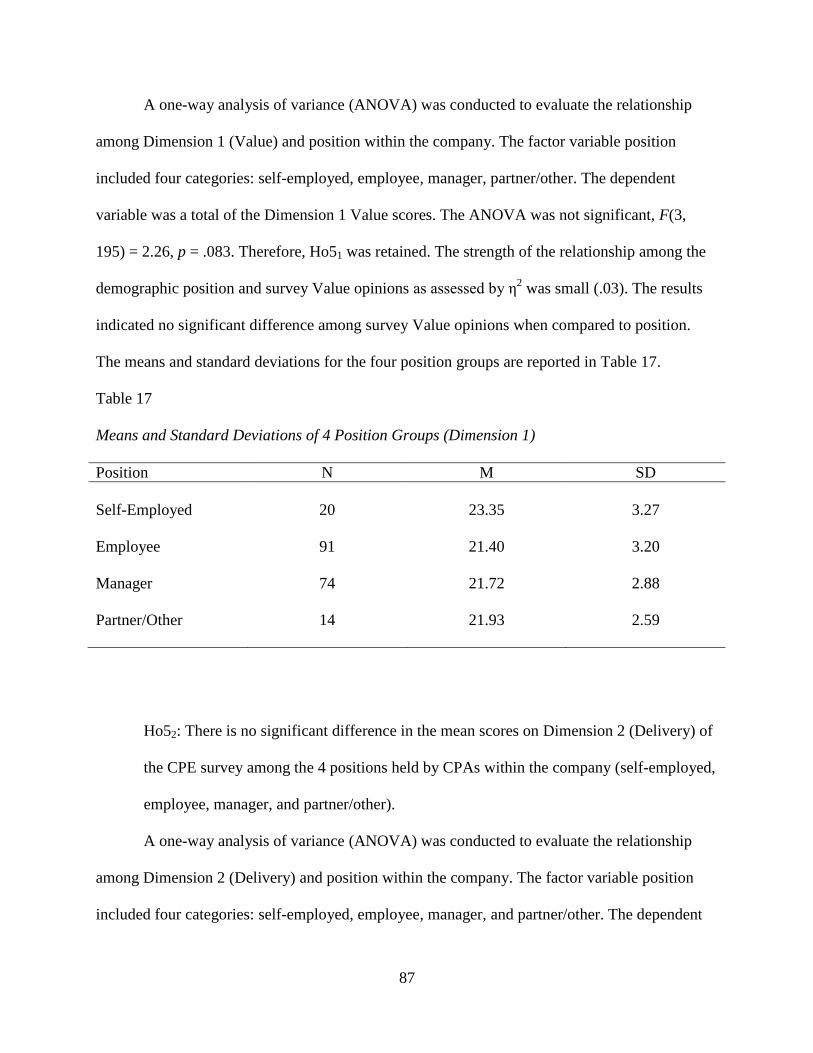
87
A one-way analysis of variance (ANOVA) was conducted to evaluate the relationship
among Dimension 1 (Value) and position within the company. The factor variable position
included four categories: self-employed, employee, manager, partner/other. The dependent
variable was a total of the Dimension 1 Value scores. The ANOVA was not significant, F(3,
195) = 2.26, p = .083. Therefore, Ho51 was retained. The strength of the relationship among the
demographic position and survey Value opinions as assessed by η2 was small (.03). The results
indicated no significant difference among survey Value opinions when compared to position.
The means and standard deviations for the four position groups are reported in Table 17.
Table 17
Means and Standard Deviations of 4 Position Groups (Dimension 1)
Position N M SD
Self-Employed
20
23.35
3.27
Employee
91 21.40 3.20
Manager 74 21.72 2.88
Partner/Other 14 21.93 2.59
Ho52: There is no significant difference in the mean scores on Dimension 2 (Delivery) of
the CPE survey among the 4 positions held by CPAs within the company (self-employed,
employee, manager, and partner/other).
A one-way analysis of variance (ANOVA) was conducted to evaluate the relationship
among Dimension 2 (Delivery) and position within the company. The factor variable position
included four categories: self-employed, employee, manager, and partner/other. The dependent
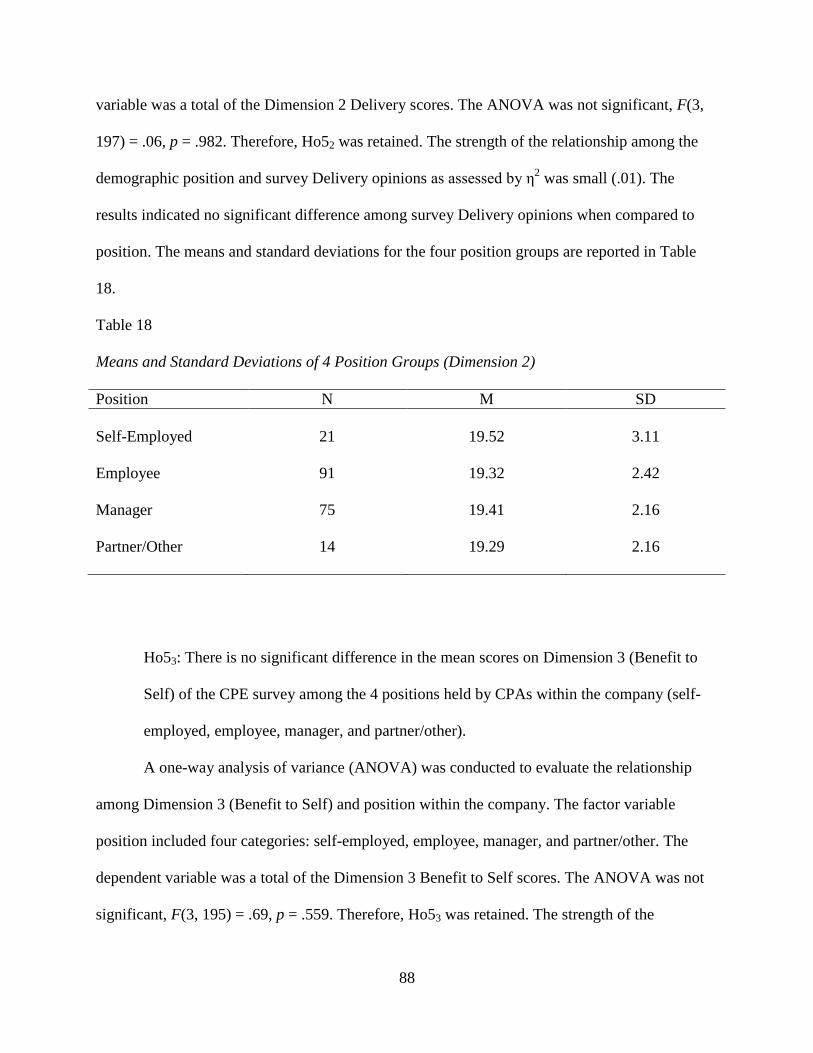
88
variable was a total of the Dimension 2 Delivery scores. The ANOVA was not significant, F(3,
197) = .06, p = .982. Therefore, Ho52 was retained. The strength of the relationship among the
demographic position and survey Delivery opinions as assessed by η2 was small (.01). The
results indicated no significant difference among survey Delivery opinions when compared to
position. The means and standard deviations for the four position groups are reported in Table
18.
Table 18
Means and Standard Deviations of 4 Position Groups (Dimension 2)
Position N M SD
Self-Employed
21
19.52
3.11
Employee
91 19.32 2.42
Manager 75 19.41 2.16
Partner/Other 14 19.29 2.16
Ho53: There is no significant difference in the mean scores on Dimension 3 (Benefit to
Self) of the CPE survey among the 4 positions held by CPAs within the company (self-
employed, employee, manager, and partner/other).
A one-way analysis of variance (ANOVA) was conducted to evaluate the relationship
among Dimension 3 (Benefit to Self) and position within the company. The factor variable
position included four categories: self-employed, employee, manager, and partner/other. The
dependent variable was a total of the Dimension 3 Benefit to Self scores. The ANOVA was not
significant, F(3, 195) = .69, p = .559. Therefore, Ho53 was retained. The strength of the
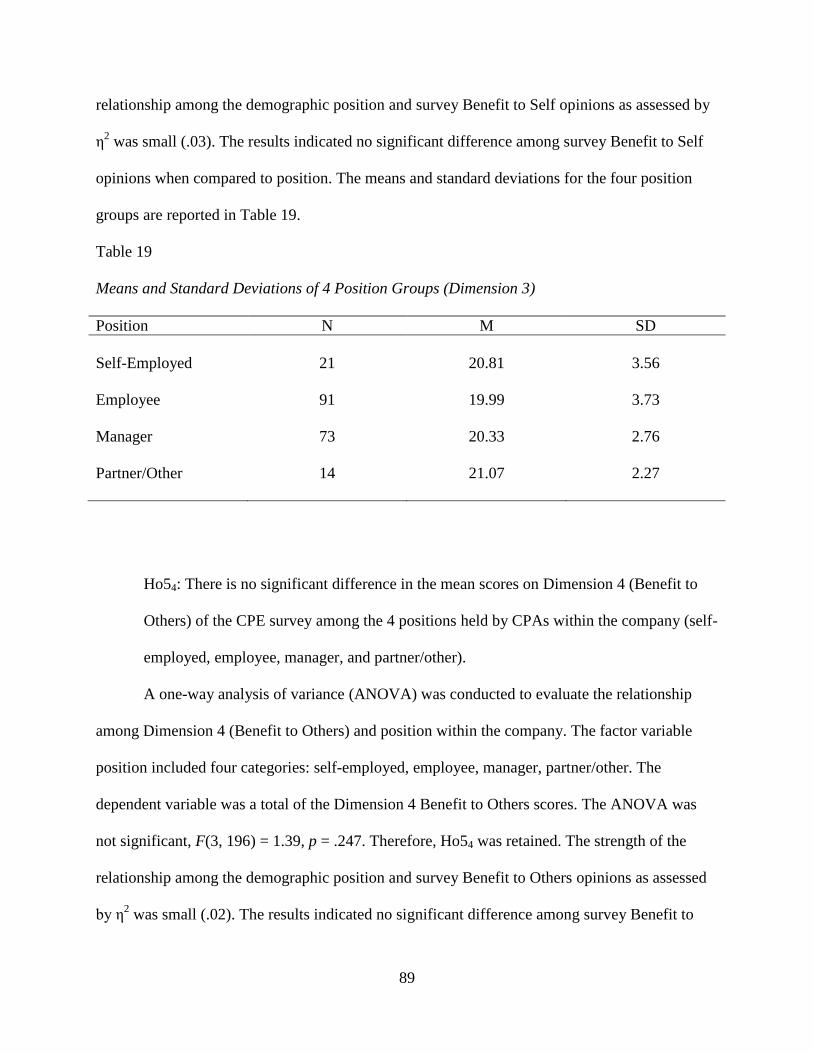
89
relationship among the demographic position and survey Benefit to Self opinions as assessed by
η2 was small (.03). The results indicated no significant difference among survey Benefit to Self
opinions when compared to position. The means and standard deviations for the four position
groups are reported in Table 19.
Table 19
Means and Standard Deviations of 4 Position Groups (Dimension 3)
Position N M SD
Self-Employed
21
20.81
3.56
Employee
91 19.99 3.73
Manager 73 20.33 2.76
Partner/Other 14 21.07 2.27
Ho54: There is no significant difference in the mean scores on Dimension 4 (Benefit to
Others) of the CPE survey among the 4 positions held by CPAs within the company (self-
employed, employee, manager, and partner/other).
A one-way analysis of variance (ANOVA) was conducted to evaluate the relationship
among Dimension 4 (Benefit to Others) and position within the company. The factor variable
position included four categories: self-employed, employee, manager, partner/other. The
dependent variable was a total of the Dimension 4 Benefit to Others scores. The ANOVA was
not significant, F(3, 196) = 1.39, p = .247. Therefore, Ho54 was retained. The strength of the
relationship among the demographic position and survey Benefit to Others opinions as assessed
by η2 was small (.02). The results indicated no significant difference among survey Benefit to

90
Others opinions when compared to position. The means and standard deviations for the four
position groups are reported in Table 20.
Table 20
Means and Standard Deviations of 4 Position Groups (Dimension 4)
Position N M SD
Self-Employed
21
18.67
2.97
Employee
91 18.26 2.82
Manager 74 19.19 2.93
Partner/Other 14 18.71 3.07
Ho55: There is no significant difference in the mean scores on Dimension 5 (Barriers) of
the CPE survey among the 4 positions held by CPAs within the company (self-employed,
employee, manager, and partner/other).
A one-way analysis of variance (ANOVA) was conducted to evaluate the relationship
among Dimension 5 (Barriers) and position within the company. The factor variable position
included four categories: self-employed, employee, manager, and partner/other. The dependent
variable was a total of the Dimension 5 Barriers scores. The ANOVA was not significant, F(3,
195) = 1.36, p = .256. Therefore, Ho55 was retained. The strength of the relationship among the
demographic position and survey Barriers opinions as assessed by η2 was small (.02). The results
indicated no significant difference among survey Barriers opinions when compared to position.
The means and standard deviations for the four position groups are reported in Table 21.
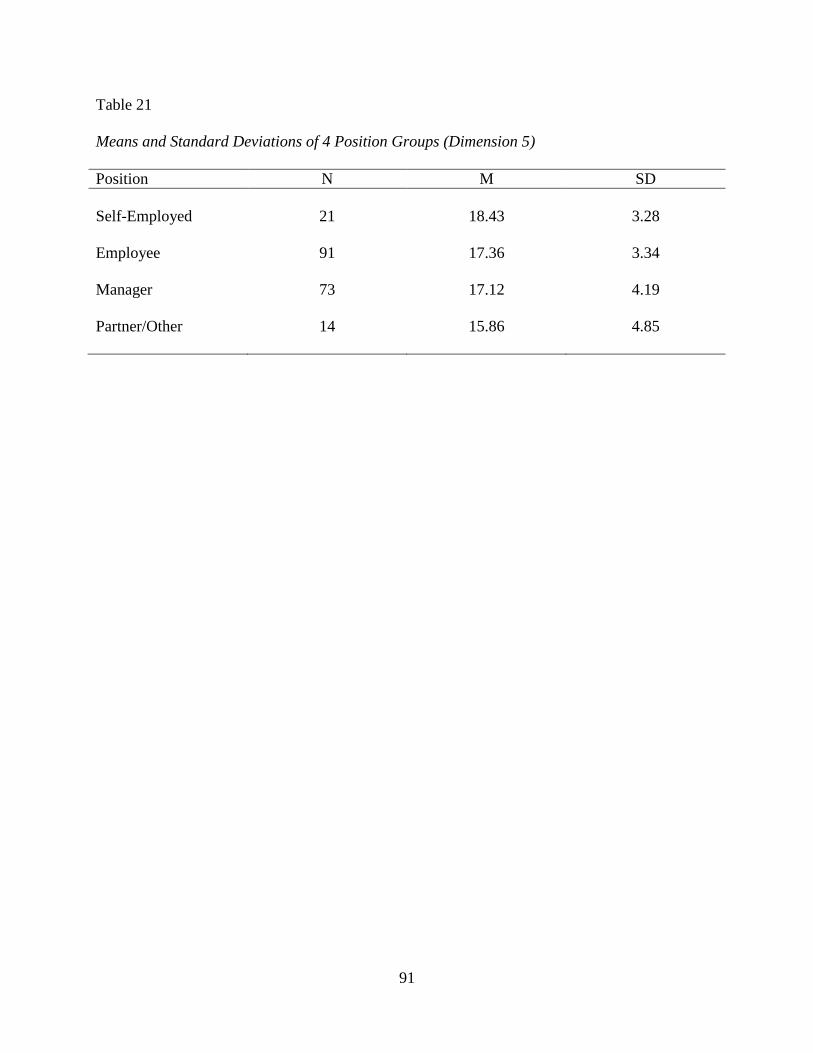
91
Table 21
Means and Standard Deviations of 4 Position Groups (Dimension 5)
Position N M SD
Self-Employed
21
18.43
3.28
Employee
91 17.36 3.34
Manager 73 17.12 4.19
Partner/Other 14 15.86 4.85

92
CHAPTER 5
SUMMARY, CONCLUSIONS, AND RECOMMENDATIONS
The purpose of this study was to determine the opinions of Certified Public Accountants
(CPAs) about the current continuing professional education requirements for licensure and if the
current requirements are accomplishing the purposes for which they are intended. CPE is
intended to assist in maintaining the CPAs’ professional competence to provide information that
is accurate and consistent because the information provided is used in making important
financial decisions that affect peoples’ lives. CPE also provides assurance to the public that the
CPA is qualified. Accountants must participate in lifelong learning due to the constantly
changing complexity, technology, knowledge, skills, and regulations required to perform their
duties properly (Hunt, 1992).
Accountants were asked for their opinions about CPE value, delivery methods, benefits to
themselves, benefits to others, and barriers to obtaining CPE. Data were collected from CPAs of
various demographics including gender, years of experience, type of company, number of
employees, and position in the company, and determine if significant differences in opinions
exist among the various demographics. This information will assist those providing CPE to
address those differences, make the CPE more valuable and beneficial, while making barriers
known and possibly minimized.
Summary of Findings
Data were collected from 203 participants of the 310 Tennessee Society of CPAs
members attending local chapter meetings in Tri-cities, Knoxville, and Chattanooga providing a
93
65% response rate. CPAs were presented with a survey of five demographic questions about
gender, years of experience, type of business, number of employees, and position at company.
Following those were 23 Likert-type questions grouped into five categories or Dimensions as
follows: Value, Delivery, Benefit to Self, Benefit to Others, and Barriers. These dependent
variables, Dimensions, were tested for significant differences among the independent variables,
the demographics. In this section the findings are discussed by results of the analysis.
Research Question 1: Is there a significant difference in the mean scores for the five
dimensions of the CPE survey (Value, Delivery, Benefit to Self, Benefit to Others, and Barriers)
between males and females?
No significant differences were found between males and females when tested for each of
the five dimensions of Value, Delivery, Benefit to Self, Benefit to Others, and Barriers. Males
and females tended to have similar scores for all dimensions.
Research Question 2: Is there a significant difference in the mean scores for the five
dimensions of the CPE survey (Value, Delivery, Benefit to Self, Benefit to Others, and Barriers)
among CPAs’ years of experience (1-9, 10-19, 20-29, 30-39, and 40 or more)?
Significant differences were found in Dimension 1 (Value) with respondents with 40 or
more years of experience (Mean = 23.21, SD = 3.67) reporting significantly higher Value scores
than respondents with 1-9 years of experience (Mean = 20.69, SD = 3.43). No other significant
differences were found in Dimension 1 (Value), and no significant differences among years of
experience and any of the other Dimensions of Delivery, Benefit to Self, Benefit to Others, and
Barriers.
Research Question 3: Is there a significant difference in the mean scores on the five
dimensions of the CPE survey (Value, Delivery, Benefit to Self, Benefit to Others, and Barriers)

94
among CPAs’ types of business (public practice, banking/finance/insurance, industry,
government/education, and nonprofit/small business/other)?
Significant differences were found among the Dimension 1 (Value) opinions when
compared to type of business. Additional significant differences were found among Dimension 4
(Benefit to Others) opinions and type of business. The other Dimensions of Delivery, Benefit to
Self, and Barriers did not show significant differences compared to type of business. Post hoc
tests revealed the specific groups with significantly different means. The banking/finance/
insurance (Mean = 23.42, SD = 2.95) type of business reported significantly higher scores in the
Dimension 1 (Value) compared to public practice (Mean = 21.08, SD = 2.91). Differences also
occurred with the industry business (Mean = 19.77, SD = 2.56) reported significantly higher
scores in the Dimension 4 (Benefit to Others) compared to public practice (Mean = 18.21, SD =
2.94). No other business types were significantly different on the five dimensions.
Research Question 4: Is there a significant difference in the mean scores on the five
dimensions of the CPE survey (Value, Delivery, Benefit to Self, Benefit to Others, and Barriers)
among the firm sizes by the number of employees (1-5, 6-25, 26-50, 51-100, 101-500, and 501
or more)?
Significant differences did occur among the Dimension 1 (Value) and the demographic,
number of employees, as well as among Dimension 3 (Benefit to Self) and number of
employees. The other Dimensions of Delivery, Benefit to Others, and Barriers did not show
significant differences compared to number of employees. Post hoc tests revealed the specific
groups with significantly different means. The two groups of 1-5 employees (Mean = 22.75, SD
= 2.38) and 501 or more employees (Mean = 22.91, SD = 2.81) both reported significantly
higher scores on the Dimension 1 (Value) than the 101-500 employees (Mean = 20.04, SD =
95
3.16). None of other Value comparisons showed significant difference. The other specific
comparison showing a significant difference occurred between 6-25 employees (Mean = 21.47,
SD = 2.84) group reporting significantly higher scores in the Dimension 3 (Benefit to Self) than
the 501 or more employees (Mean = 19.02, SD = 3.17) group. None of other comparisons of
number of employees showed significant differences.
Research Question 5: Is there a significant difference in the mean scores on the five
dimensions of the CPE survey (Value, Delivery, Benefit to Self, Benefit to Others, and Barriers)
among the positions held by CPAs within the company (self-employed, employee, manager, and
partner/other)?
No significant differences were found among the four positions in the company
demographics when tested for each of the five Dimensions of Value, Delivery, Benefit to Self,
Benefit to Others, and Barriers.
Discussion
The finding of no significant differences by gender is no surprise, as the literature
revealed no disparity or gap between males and females in obtaining or providing CPE. In fact,
the accounting profession has moved from a predominantly male occupation, to predominantly
female. In 1950 there were only 500 women professionals in the accounting profession, however
a study in 2012 revealed 60% of professionals in the accounting profession are women, both
certified and not certified (DuBios, 2013). Differences may exist in the workforce but differences
with regard to obtaining CPE were not found in the literature review and not found in the present
study. This may mean that women are provided the same opportunities and benefits with regard
to obtaining CPE.
96
The next question tested for differences based upon the years of experience and did find
significant differences in Dimension 1 (Value) between those with 40 or more years reporting
higher value than the 1-9 years of experience. This difference could indicate that the group with
less experience simply did not have enough personal experience to form as favorable opinion of
the value received from the continuing professional education. Recent college graduates going
into an accounting career may not have as much need or may not perceive as much benefit from
the additional education as the more experienced professional, especially those who have had the
most years of experience (40 years or more). This finding is in agreement with Wessel’s (2007)
comments that earlier studies of CPE effectiveness were conducted by Phillips (1983), Fletcher
and French (1987), and Young (1998); but Wessels considered these surveys to be deficient
because mandatory CPE was new and participants had insufficient experience to base their
responses. Those early in their careers may have viewed additional education as “hours to keep
their license”, as described by Clyde (1998) and not seen the value experienced by the seasoned
professionals. Some of the more experienced accountants had practiced prior to 1994 when CPE
was not yet required in all states (Chatfield & Vangermeersch, 1996) and could appreciate
differences before and after this requirement. The more experienced may value pursuing
education well beyond the minimum requirements as reported by Knese (2013) and DeLange et
al. (2013). Another recommendation came from Korney (2006) simply to provide a wider variety
of CPE courses for participants to meet specific needs of niche groups.
Value differences occurred again in the type of business demographic with banking/
finance/insurance reporting higher Dimension 1 (Value) opinions than public practice, and the
industry business reported higher Dimension 3 (Benefit to Others) opinions than the public
practice. In this instance there were differences in value and benefit to self in different business

97
types that may be due to the failure of providers to perform an adequate needs assessment for the
individual niches of the profession they are providing training for. Different types of businesses
will experience many differences in training needs, especially that of the public accounting
provider who would experience the largest variety of required skills of all the business types.
This variety of needs is not being satisfied by the profit incentive of most providers who often
focus on mainstream needs (Stern and Queeney, 1992). The CPE providers need to focus more
attention to a needs assessment of the individual learners. The variety of individual needs and
individual needs assessment is addressed in numerous research articles including Future of
Learning (2014), DeLange, Jackling, and Basioudis (2013), Vela (2002), Thomas and Harper
(2001); Clyde (1998), and Queeney (1991). This focus on fulfilling individual needs will help to
eliminate gaps in educational value and benefits to others perceived professionals.
Differences in Demographic Value opinions occurred a third time when testing against
the number of employees as well as differences in the Demographic Benefit to Self. The group
from 1-5 employees and 501 employees or more both reported higher scores in the Demographic
Value than the 101 to 500 employees group. A difference between a high employee number and
a low number is anticipated, but in this case high employee numbers and low employee numbers
both reported higher opinions than a group in the mid-range of employee numbers. Initial
reaction would be to attribute this finding to lack of CPE access for certain groups, but that
would fall under the Dimension 5 Barriers which found no significant differences. Additional
differences were found with the Dimension 4 (Benefit to Self), with the 6-25 employees group
reporting significantly higher scores in the Benefit to Self opinions than the 501 or more
employees. These differences are likely due to differences in the various corporate climates or
cultures. There are wide differences in the culture of employers across different types of
98
businesses. The major objective of The Future of Learning is to get businesses and CPE
providers to create a culture that will increase the professional’s desire to learn. This idea of
encouraging the professional’s desire to learn is also supported by DeLange et al. (2013) and
Knese (2013). A culture that encourages a lifetime of learning and sharpening skills would help
to close these gaps in perceived Value and Benefit to Self.
The final category of position held within the company found no significant differences
among the Demographics of Value, Delivery, Benefit to Self, Benefit to Others, or Barriers. This
would indicate that the position within the company, whether self-employed, employee,
manager, or partner, has little effect on the professional’s perception of CPE.
Conclusion
This study examined the opinions of Certified Public Accountants (CPAs) about the
current requirements for Continuing Professional Education (CPE) and their level of satisfaction
in accomplishing the purposes intended by these requirements. Significant differences were
found in CPA’s opinions in relation to years of experience, with 40 or more years perceiving
more Value in CPE than those with 1-9 years of experience. This finding was attributed to the
more experienced had more time to see the benefits of continuing education. In addition, some
with more experience had seen the profession prior to CPE being a requirement and could make
a better comparison.
The types of business reported significant differences in opinions in relation to value and
benefit to self. Different types of businesses will experience a variety in training needs,
sometimes creating niches in training needs because the small amount of demand is not met my
the profit motives of providers seeking the more profitable learner groups. This situation leaves
99
some training needs unfulfilled and could create these differences in opinions about Value and
Benefits to Self.
Significant differences were also found among CPA opinions based upon the number of
employees where they work. These differences occurred in opinions of Value and Benefit to
Others and were attributed to differences in business climate. Some businesses and CPE
providers encourage lifelong learning more than others, and the accounting teams with The
Future of Learning (2014) are trying to increase the desire to learn across all businesses and CPE
providers.
Recommendations for Practice
The following are recommendations in practice to facilitate the perceived Value of CPE
received by CPAs.
1. CPE providers and employers of CPAs should focus more attention on educating new
CPAs about the ongoing and long-term value of receiving continuing professional
education courses.
2. CPE providers need to perform needs assessment of the learners to determine more
individualistic needs and provide more training in subject areas that have demands
that are not fulfilled.
3. CPE providers and CPA employers alike need to provide more encouragement to
CPAs to continue their lifelong learning requirements with a passion, stressing the
benefits and value they receive by pursuing continuing professional education well
beyond the minimum requirements.
100
Recommendations for Further Research
Based on this study, the following recommendations are made about possible further
research.
1. A qualitative study should be done for researchers to understand the areas of CPE
delivery that are most problematic.
2. A qualitative study with in-depth interviews would build on the survey results and
researchers would gain understanding of the needs of CPAs.
3. A larger sample size in another quantitative study may have the benefit of producing
a more diverse group of participants.
4. A study that included other geographical regions of the U.S. beyond the Southeast
may yield other results and provide researchers with a better understanding of
differences by location.
5. A study that focused on women and millennials would provide researchers more
information about the specific CPE needs of these groups.
101
REFERENCES
AICPA. (2014). AICPA Mission and History. Retrieved May 15, 2015 from
http://www.aicpa.org/about/missionandhistory/pages/missionhistory.aspx
AICPA & NASBA UAA Committees. (2014). Uniform Accountancy Act, (7th
Ed.). Nashville,
TN: AICPA and NASBA.
Barry, J. S. (2014). Choosing competency over compliance. The CPA Journal, 84(6), 5-6.
Becker, L. (2013). Self-regulated learning in an introductory undergraduate accounting course.
Issues in Accounting Education, 28(3), 435-460.
Caffarella, R.S., & Zinn, L.F. (1999). Professional development for faculty: A conceptual
framework of barriers and supports. Innovative Higher Education, 23(4), 241-254.
Chatfield, M., & Vangermeersch, R. (1996). The history of accounting: An international
encyclopedia. New York: Garland.
Ciesick, R. (1985). The National CPE curriculum-professional excellence through
a structured but flexible learning-program. Journal of Accountancy, 160(4), 118-122.
Clyde, N. J. (1998). CPE is broke: let's fix it. Journal of Accountancy, 186(6), 77-80.
DeLange, D., Jackling, B. & Basioudis, G. (2013). A framework of best practice of continuing
professional development for the accounting profession. Accounting Education, 22(5),
494-497.
DuBois, S. (March 11, 2013). 5 professions ruled by women. Fortune. Retrieved July 31, 2017
from http://fortune.com/2013/03/11/5-professions-ruled-by-women/
The Future of Learning (2014). Lighting the Fire: Strategies to Fuel the Learning. Retrieved
December 6, 2015 from http://futureoflearning.aicpa.org/
Hunt, S. E. (1992). Introduction: The professional worker as learner. Professional Workers as
Learners: The Scope, Problems, and Accountability of Continuing Professional
Education in the 1990's (pp. 1-12). Washington DC, U.S. Department of Education.
Knese, W. F. (2013). Commitment to continuous learning. Strategic Finance, 95(6), 6, 61.
Korney, A. (2006). Variety is key in CPE! Accounting Today: for the web CPA, 20(1), 1, 9.
McCabe, S. (2015). Learning to love new ways of learning: Professional
education is on a decade-long course of change. Accounting Today, 29(2), 1.
102
NASBA (2014). About us. Retrieved November 23, 2014 from: http://nasba.org/about/
Queeney, D. S. (1992) Problems of content and delivery in continuing professional education.
Professional workers as learners: The scope, problems, and accountability of continuing
professional education in the 1990's. Washington DC: U.S. Department of Education.
Rahman, A. R., & Velayutham S.K. (1998). Instructional approaches and the nature of
obsolescence in continuing professional education (CPE) in accounting. Accounting
Education: An International Journal, 7(4), 287-303.
Ramos, M. (2014, May 27). High impact learning: 4 ways to maximize CPE ROI. CPA
Trendlines. Retrieved June 25, 2014 from http://cpatrendlines.com/2014/05/27/high-
impact-learning-4-ways-to-maximize-cpe-roi/
Robert Half Internatinal Inc. Guide_to_certifications_robert_half.pdf. Retrieved September 14,
2014 from
https://www.accountingweb.com/sites/default/files/guide_to_certifications_robert_half.p
df
Sheridan, T. (2016, June 1) 664,532: The number of active CPAs in the US. Retrieved May 24,
2017 from http://www.accountingweb.com/practice/team/664532-the-number-of-active-
cpas-in-the-us
State of Tennessee, Board of Accountancy. Continuing education requirements. Retrieved
November 11, 2014 from http://www.tn.gov/regboards/tnsba/cpeReqs.shtml
Stern, M. R., & Queeny, D. S. (1992). The scope of continuing professional education:
Providers, consumers, issues. Professional Workers as Learners: The Scope, Problems,
and Accountability of Continuing Professional Education in the 1990's (pp. 13 - 34).
Washington DC: U.S. Department of Education.
Task Forces of the AICPA & NASBA. (2011, August 15). Standards exposure draft. Retrieved
November 23, 2014 from http://www.nasba.org/files/2011/08/AICPA-
NASBA_StandardsExposureDraft.pdf
Thomas, P. B., & Harper, B. S. (2001). CPE: Changing with the profession. The CPA Journal,
71(10), 30-34.
Vela, J. K. (2002). Learning to listen, learning to teach: The power of dialogue in educating
adults. New York, NY: John Wiley & Sons.
Walley, E. (1996). Is it time to take another look at CPE? The CPA Journal, 66(2), 26-31.
Wessels, S. B. (2007). Accountants' perceptions of the effectiveness of mandatory continuing
professional education. Accounting Education: An International Journal, 16(4), 365-368.
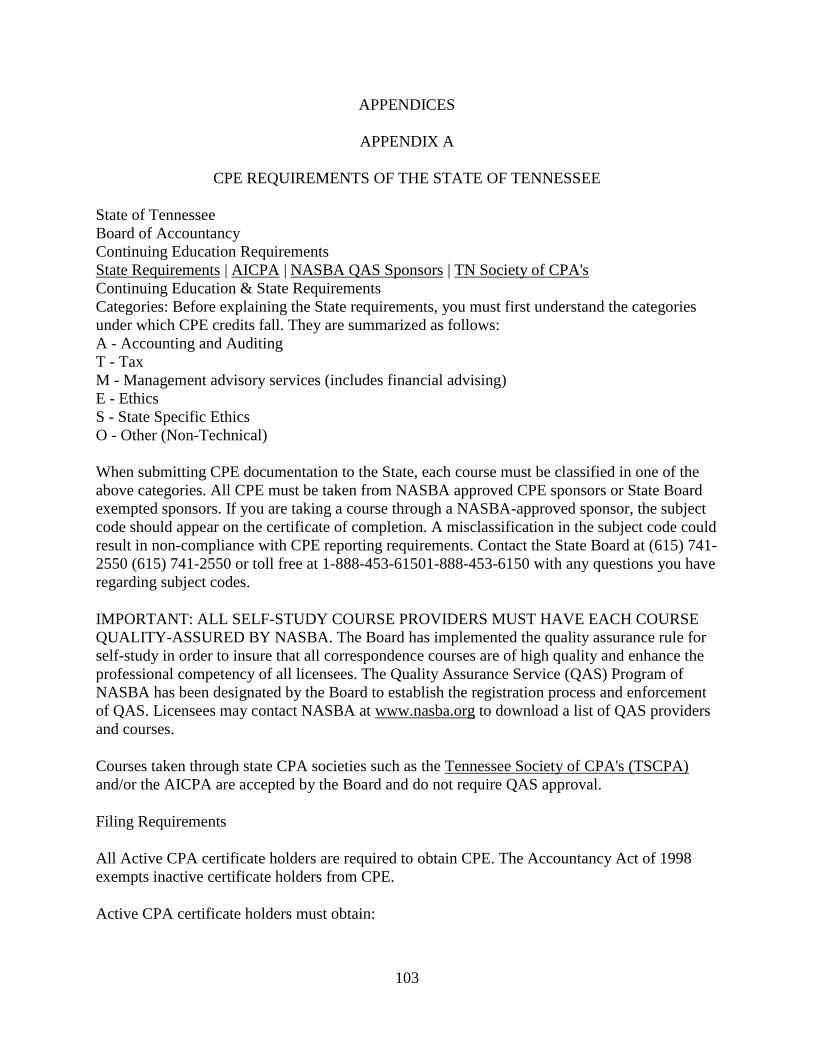
103
APPENDICES
APPENDIX A
CPE REQUIREMENTS OF THE STATE OF TENNESSEE
State of Tennessee
Board of Accountancy
Continuing Education Requirements
State Requirements | AICPA | NASBA QAS Sponsors | TN Society of CPA's
Continuing Education & State Requirements
Categories: Before explaining the State requirements, you must first understand the categories
under which CPE credits fall. They are summarized as follows:
A - Accounting and Auditing
T - Tax
M - Management advisory services (includes financial advising)
E - Ethics
S - State Specific Ethics
O - Other (Non-Technical)
When submitting CPE documentation to the State, each course must be classified in one of the
above categories. All CPE must be taken from NASBA approved CPE sponsors or State Board
exempted sponsors. If you are taking a course through a NASBA-approved sponsor, the subject
code should appear on the certificate of completion. A misclassification in the subject code could
result in non-compliance with CPE reporting requirements. Contact the State Board at (615) 741-
2550 (615) 741-2550 or toll free at 1-888-453-61501-888-453-6150 with any questions you have
regarding subject codes.
IMPORTANT: ALL SELF-STUDY COURSE PROVIDERS MUST HAVE EACH COURSE
QUALITY-ASSURED BY NASBA. The Board has implemented the quality assurance rule for
self-study in order to insure that all correspondence courses are of high quality and enhance the
professional competency of all licensees. The Quality Assurance Service (QAS) Program of
NASBA has been designated by the Board to establish the registration process and enforcement
of QAS. Licensees may contact NASBA at www.nasba.org to download a list of QAS providers
and courses.
Courses taken through state CPA societies such as the Tennessee Society of CPA's (TSCPA)
and/or the AICPA are accepted by the Board and do not require QAS approval.
Filing Requirements
All Active CPA certificate holders are required to obtain CPE. The Accountancy Act of 1998
exempts inactive certificate holders from CPE.
Active CPA certificate holders must obtain:
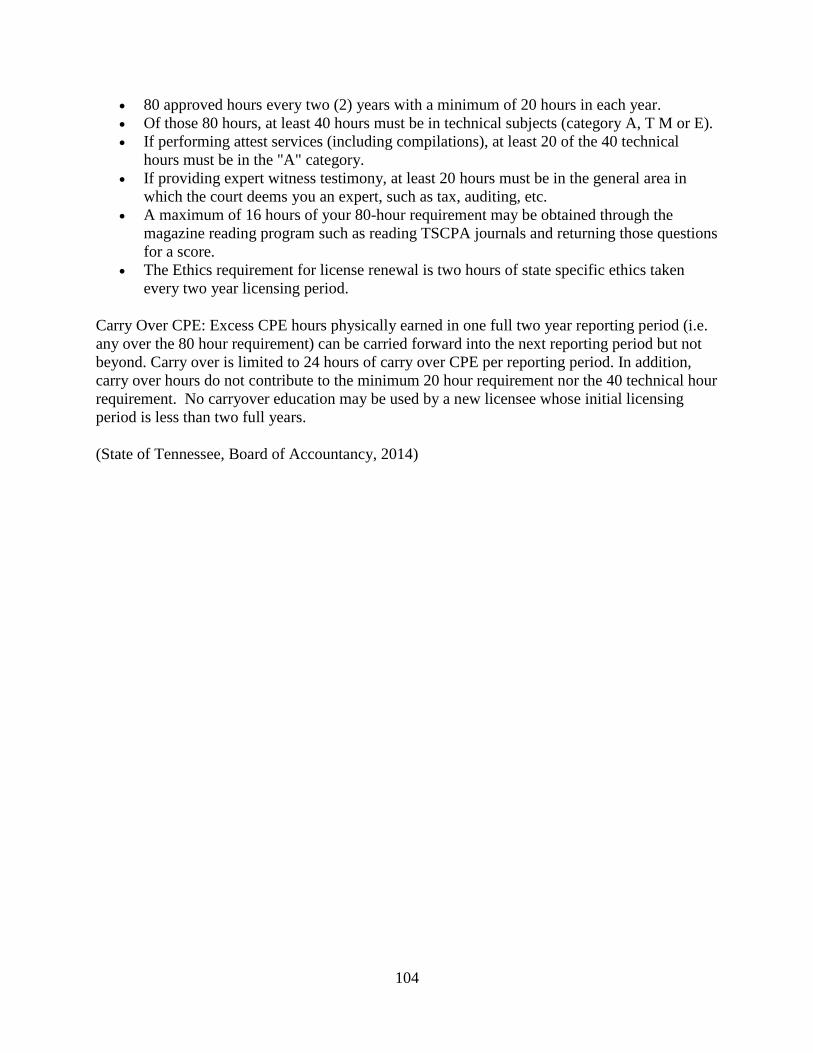
104
80 approved hours every two (2) years with a minimum of 20 hours in each year.
Of those 80 hours, at least 40 hours must be in technical subjects (category A, T M or E).
If performing attest services (including compilations), at least 20 of the 40 technical
hours must be in the "A" category.
If providing expert witness testimony, at least 20 hours must be in the general area in
which the court deems you an expert, such as tax, auditing, etc.
A maximum of 16 hours of your 80-hour requirement may be obtained through the
magazine reading program such as reading TSCPA journals and returning those questions
for a score.
The Ethics requirement for license renewal is two hours of state specific ethics taken
every two year licensing period.
Carry Over CPE: Excess CPE hours physically earned in one full two year reporting period (i.e.
any over the 80 hour requirement) can be carried forward into the next reporting period but not
beyond. Carry over is limited to 24 hours of carry over CPE per reporting period. In addition,
carry over hours do not contribute to the minimum 20 hour requirement nor the 40 technical hour
requirement. No carryover education may be used by a new licensee whose initial licensing
period is less than two full years.
(State of Tennessee, Board of Accountancy, 2014)
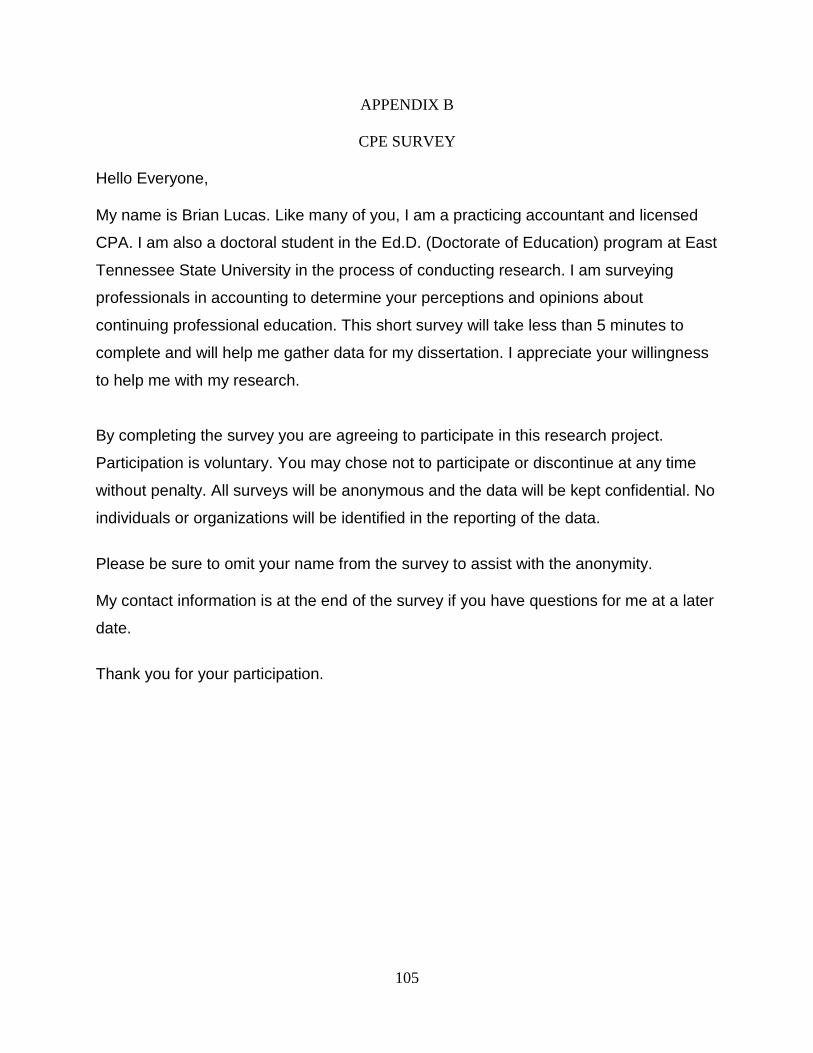
105
APPENDIX B
CPE SURVEY
Hello Everyone, My name is Brian Lucas. Like many of you, I am a practicing accountant and licensed
CPA. I am also a doctoral student in the Ed.D. (Doctorate of Education) program at East
Tennessee State University in the process of conducting research. I am surveying
professionals in accounting to determine your perceptions and opinions about
continuing professional education. This short survey will take less than 5 minutes to
complete and will help me gather data for my dissertation. I appreciate your willingness
to help me with my research.
By completing the survey you are agreeing to participate in this research project.
Participation is voluntary. You may chose not to participate or discontinue at any time
without penalty. All surveys will be anonymous and the data will be kept confidential. No
individuals or organizations will be identified in the reporting of the data.
Please be sure to omit your name from the survey to assist with the anonymity. My contact information is at the end of the survey if you have questions for me at a later
date.
Thank you for your participation.
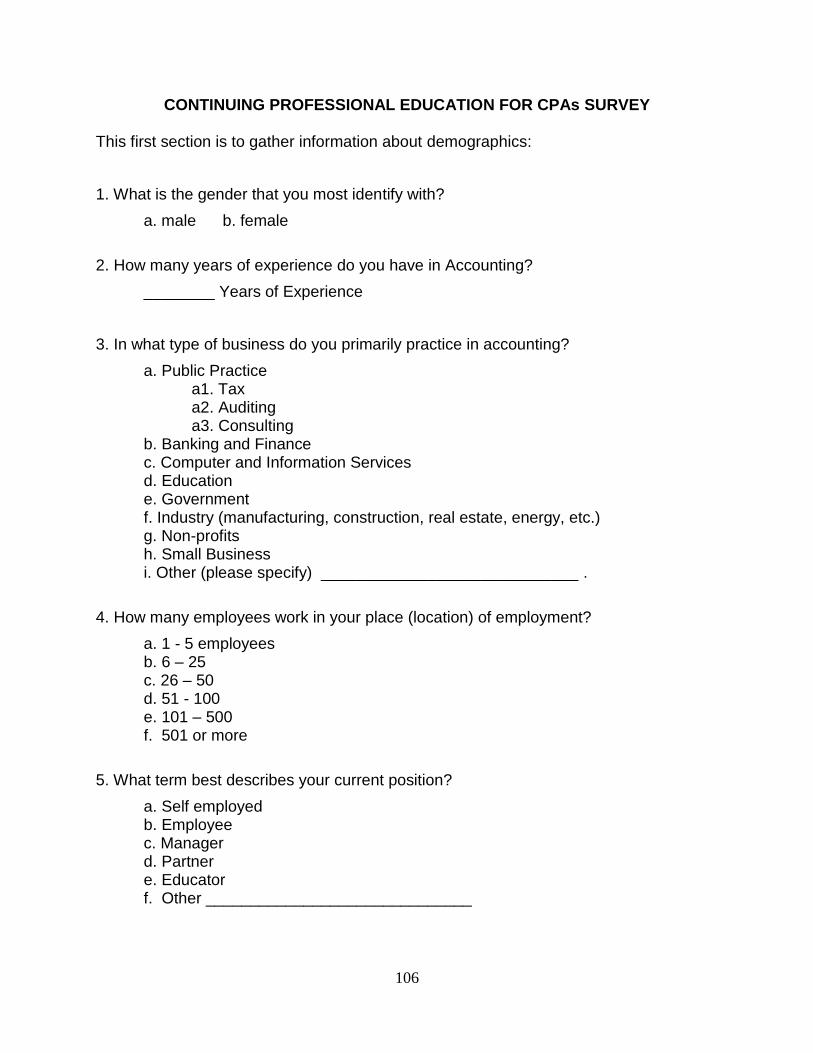
106
CONTINUING PROFESSIONAL EDUCATION FOR CPAs SURVEY
This first section is to gather information about demographics:
1. What is the gender that you most identify with?
a. male b. female
2. How many years of experience do you have in Accounting?
________ Years of Experience
3. In what type of business do you primarily practice in accounting?
a. Public Practice a1. Tax
a2. Auditing a3. Consulting b. Banking and Finance c. Computer and Information Services d. Education e. Government f. Industry (manufacturing, construction, real estate, energy, etc.) g. Non-profits h. Small Business i. Other (please specify) _____________________________ .
4. How many employees work in your place (location) of employment?
a. 1 - 5 employees b. 6 – 25 c. 26 – 50 d. 51 - 100 e. 101 – 500 f. 501 or more
5. What term best describes your current position?
a. Self employed b. Employee c. Manager d. Partner e. Educator f. Other ______________________________
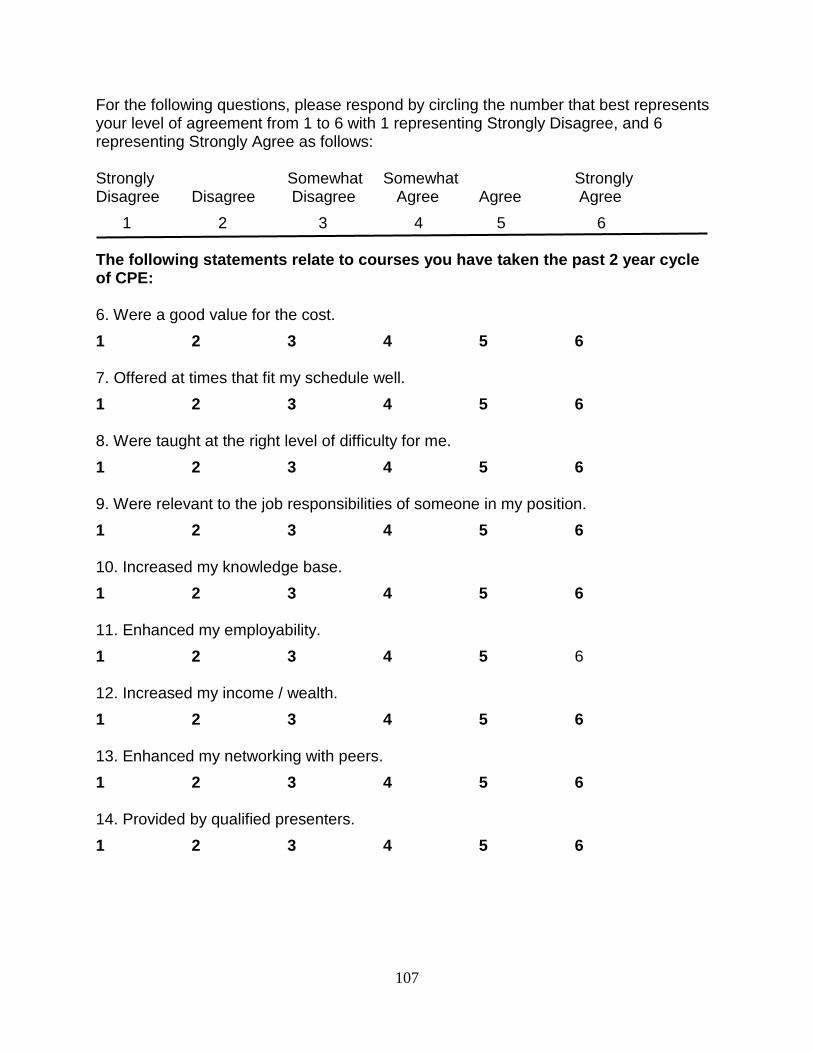
107
For the following questions, please respond by circling the number that best represents your level of agreement from 1 to 6 with 1 representing Strongly Disagree, and 6 representing Strongly Agree as follows: Strongly Somewhat Somewhat Strongly Disagree Disagree Disagree Agree Agree Agree
1 2 3 4 5 6 The following statements relate to courses you have taken the past 2 year cycle of CPE: 6. Were a good value for the cost.
1 2 3 4 5 6 7. Offered at times that fit my schedule well.
1 2 3 4 5 6 8. Were taught at the right level of difficulty for me.
1 2 3 4 5 6 9. Were relevant to the job responsibilities of someone in my position.
1 2 3 4 5 6 10. Increased my knowledge base.
1 2 3 4 5 6 11. Enhanced my employability.
1 2 3 4 5 6 12. Increased my income / wealth.
1 2 3 4 5 6 13. Enhanced my networking with peers.
1 2 3 4 5 6 14. Provided by qualified presenters.
1 2 3 4 5 6

108
Strongly Somewhat Somewhat Strongly Disagree Disagree Disagree Agree Agree Agree
1 2 3 4 5 6
15. Required CPE improves the image of the profession.
1 2 3 4 5 6 16. Required CPE can help protect the public from incompetent work.
1 2 3 4 5 6 17. Required CPE improves the competence of CPAs.
1 2 3 4 5 6 18. The indirect costs (travel, food, time, etc.) of CPE tends to be expensive.
1 2 3 4 5 6 19. The requirements of my job do not leave much time for CPE courses.
1 2 3 4 5 6 20. Long-distance travel for CPE is a significant financial burden.
1 2 3 4 5 6 21. If CPE were not required, I would take fewer courses.
1 2 3 4 5 6 22. I can learn what I need on-the-job or through in-house instruction.
1 2 3 4 5 6 23. I can learn what I need through reading and research on my own.
1 2 3 4 5 6 24. I do not like lectures and formal schooling.
1 2 3 4 5 6 25. I prefer online courses rather than traditional classroom courses.
1 2 3 4 5 6
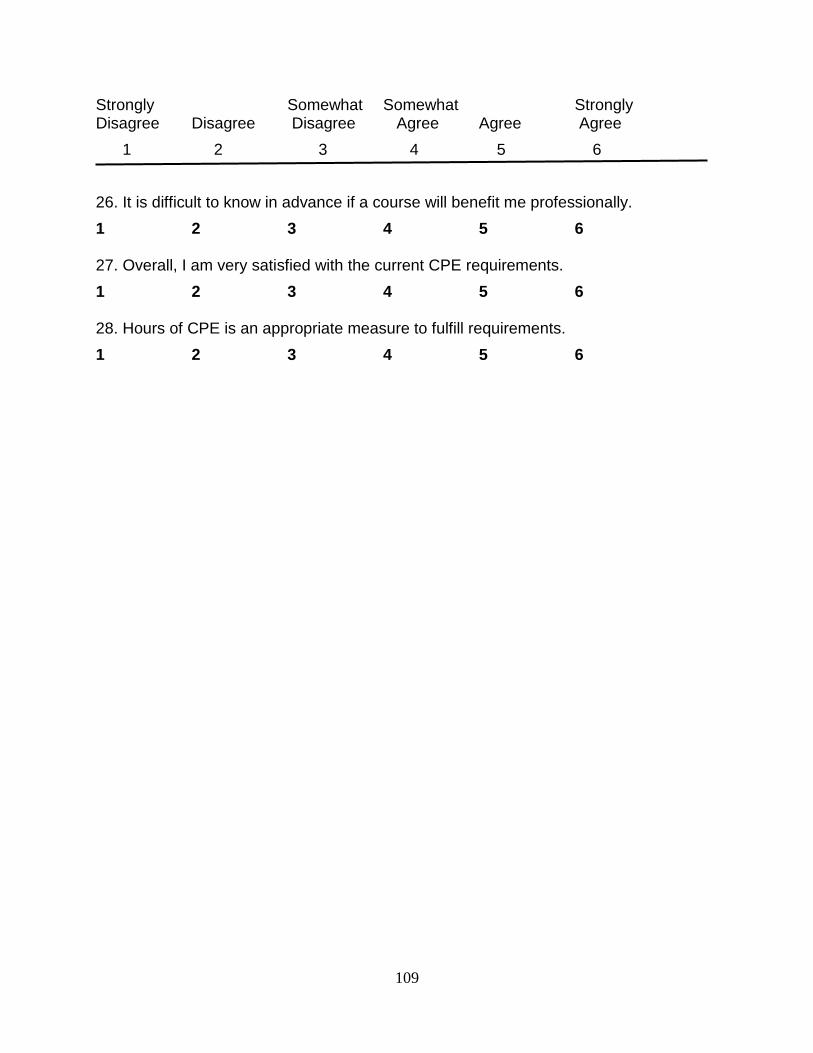
109
Strongly Somewhat Somewhat Strongly Disagree Disagree Disagree Agree Agree Agree
1 2 3 4 5 6
26. It is difficult to know in advance if a course will benefit me professionally.
1 2 3 4 5 6 27. Overall, I am very satisfied with the current CPE requirements.
1 2 3 4 5 6 28. Hours of CPE is an appropriate measure to fulfill requirements.
1 2 3 4 5 6
110
If you have any questions, problems, or research-related problems at any time, you may
contact Brian Lucas (423-276-3991; [email protected]), or Dr. Jim Lampley
(423.439.7619; [email protected]). You may also call the Chairperson of the ETSU
Institutional Review Board at 423-439-6054 for any questions you may have about your
rights as a research participant. If you have any questions or concerns about the
research and want to talk to someone independent of the research team or you cannot
reach the study staff, you may call an IRB Coordinator at 423-439-6055 or
423-439-6002.
This survey is from Wessels, 2007 with permission obtained May 15 of 2016.

111
APPENDIX C
SURVEY QUESTION NUMBERS BY DIMENSION
Value:
6. Were a good value for the cost.
18. The indirect costs (travel, food, time, etc.) of CPE tends to be expensive.
20. Long-distance travel for CPE is a significant financial burden.
27. Overall, I am very satisfied with the current CPE requirements.
28. Hours of CPE is an appropriate measure to fulfill requirements.
Delivery:
7. Offered at times that fit my schedule well.
8. Were taught at the right level of difficulty for me.
9. Were relevant to the job responsibilities of someone in my position.
14. Provided by qualified presenters.
Benefit to self:
10. Increased my knowledge base.
11. Enhanced my employability.
12. Increased my income / wealth.
13. Enhanced my networking with peers.
26. It is difficult to know in advance if a course will benefit me professionally.
Benefit to Others:
15. Required CPE improves the image of the profession.
16. Required CPE can help protect the public from incompetent work.
17. Required CPE improves the competence of CPAs.
21. If CPE were not required, I would take fewer courses.

112
Barriers:
19. The requirements of my job do not leave much time for CPE courses.
22. I can learn what I need on-the-job or through in-house instruction.
23. I can learn what I need through reading and research on my own.
24. I do not like lectures and formal schooling.
25. I prefer online courses rather than traditional classroom courses.
113
VITA
BRIAN J. LUCAS
Education: EdD, Educational Leadership, East Tennessee State University,
Johnson City, Tennessee, 2017
MAcct, Virginia Tech, Blacksburg, Virginia, 1985
MBA, James Madison University, Harrisonburg, Virginia, 1981
BS, Psychology, Virginia Tech, Blacksburg, Virginia, 1980
Professional Experience: Accountant, Self Employed, Johnson City, Tennessee, 2016-2017
Accountant, At Work Personnel, Johnson City, Tennessee,
2014-2016
Adjunct Faculty, Walters State Community College, Greeneville,
Tennessee, 2006-2013
Fixed Asset Accountant, Asahi Glass Company, Kingsport,
Tennessee, 2010-2011
Account Analyst, Mahle Incorporated, Morristown, Tennessee,
2004-2009
Finance Chairman, Saint Luke United Methodist Church,
Kingsport, TN 1997-2007
Financial Analyst, Glaxo Smithkline Pharmaceuticals, Bristol,
Tennessee, 1986-2004
Business Manager, Appalachian Repertory Theatre, Kingsport,
Tennessee, 2000-2004
Professional Certifications: Certified Public Accountant, State of Tennessee, 2006 (Inactive)
Professional Memberships: Tennessee Society of CPAs, 2006-present
Awards and Honors: Impact Award, Glaxo Smithkline Pharmaceuticals, 2000
Performance Award, Mahle Incorporated, 2007