Embed Size (px)
Citation preview
NOT PROTECTIVELY MARKED
NOT PROTECTIVELY MARKED
Continuing our Platform for Success
2011/12
Quarter 3 Performance Report
NOT PROTECTIVELY MARKED
1. INTRODUCTION & EXECUTIVE SUMMARY.................................................................... 5
1.1 INTRODUCTION...................................................................................................... 5 1.2 EXECUTIVE SUMMARY............................................................................................... 7
2. SERVICE RESPONSE ....................................................................................................... 9 2.1 COMMUNITY FOCUS................................................................................................... 9
Proportion of 999 calls answered within 10 seconds (NI) ............................................... 9 Time taken to respond to emergency incidents .............................................................. 9 Handling of non-emergency calls (NI) ........................................................................... 10 First to Finish (LI) ........................................................................................................... 11 Number of Emails (LI) .................................................................................................... 11 Complaints about Police Officers and Police Staff (NI) and Quality of Service Allegations (NI) .............................................................................................................. 12 User satisfaction with service provided (NI)................................................................... 12
3. PUBLIC REASSURANCE & COMMUNITY SAFETY ...................................................... 15 3.1 COMMUNITY FOCUS................................................................................................. 15
Antisocial Behaviour ...................................................................................................... 15 Number of recorded ASB community crimes and offences and detection rates (NI) (SOA) ............................................................................................................................. 16 ASB Incidents (LI) (SOA)............................................................................................... 17 Vandalism (LI) (SOA)..................................................................................................... 17 Level of Detected Youth Crime (NI) (SOA).................................................................... 18
3.2 PUBLIC PROTECTION............................................................................................... 19 Child Protection / Getting It Right For Every Child (GIRFEC) ....................................... 19 Managing Offenders ...................................................................................................... 20 Adult Protection.............................................................................................................. 20
3.3 ROAD CASUALTY REDUCTION ............................................................................... 21 ACPOS Scottish Road Policing Framework.................................................................. 21 Education ....................................................................................................................... 21 Enforcement................................................................................................................... 21 Engineering.................................................................................................................... 21 Encouragement.............................................................................................................. 22 Number of persons killed and injured in road accidents (NI) (SOA) ............................. 22
3.4 OTHER INDICATORS................................................................................................. 23 National Comparisons.................................................................................................... 23 Number of recorded crimes and offences (NI) .............................................................. 23 Detection Rate for Recorded Crimes and Offences (NI) ............................................... 25 Number of racist incidents, racially motivated crimes and offences and detection rates (NI) (SOA) ...................................................................................................................... 26 Number of Special Constables and hours they are on duty (NI)................................... 27
4. CRIMINAL JUSTICE & TACKLING CRIME...................................................................... 28 4.1 SERIOUS ORGANISED CRIME AND DRUGS.......................................................... 28
Weight of Class A drug seizures and number of supply and possession with intent to supply offences recorded (NI) (SOA) ............................................................................ 28 Local drug indicators (LI) (SOA) .................................................................................... 29
4.2 VIOLENCE .................................................................................................................. 30 Non Sexual Violence (LI) (SOA) .................................................................................... 30 Percentage of complainers and offenders under the influence of alcohol (LI) .............. 30 Serious Assault (LI)........................................................................................................ 31 Serious Sexual Offences (LI)......................................................................................... 31
CONTENTS
NOT PROTECTIVELY MARKED
NOT PROTECTIVELY MARKED
3
Robbery (LI) ................................................................................................................... 32 4.3 OTHER INDICATORS................................................................................................. 33
Number and percentage of reports submitted to the Procurator Fiscal within 28 calendar days (NI).......................................................................................................... 33 Number and percentage of reports submitted to the Children's Reporter within 14 calendar days (NI).......................................................................................................... 33 Use of Police Direct Measures: Antisocial Behaviour Fixed Penalty Notices (ASBFPNs) (NI) ................................................................................................................................. 34 Use of Police Direct Measures: Formal Adult Warnings (NI) ........................................ 35 Use of Police Direct Measures: Restorative Justice Warning & Conference Scheme (NI) ................................................................................................................................. 35 Undertaking Cases (LI) .................................................................................................. 35
4.4 NATIONAL SECURITY................................................................................................36 Level of Counter Terrorism Advice Delivered to Communities (NI) .............................. 36 Prevent........................................................................................................................... 36 Pursue............................................................................................................................ 36 Prepare .......................................................................................................................... 37 Protect............................................................................................................................ 37
5. SOUND GOVERNANCE & EFFICIENCY ........................................................................ 38 5.1 SERVICE RECONFIGURATION ................................................................................ 38
Number of Police Officers and Police Staff (NI) ............................................................ 38 Recruitment (LI) ............................................................................................................. 38 Staffing Profile by Declared Disability, Ethnicity and Gender (NI)................................. 39 Turnover rates for Police Officers and Police Staff (NI)................................................. 40 Proportion of working time lost to sickness absence (NI).............................................. 40 Staff Performance (LI).................................................................................................... 41
5.2 OTHER INDICATORS................................................................................................. 41 Value of efficiency savings generated (NI) .................................................................... 41 Procurement (LI) ............................................................................................................ 41 Expenditure on Salaries, Operating Costs and Capital (NI) .......................................... 42 Expenditure per Resident (NI) ....................................................................................... 42 Proportion of salary costs accounted for by overtime (NI) ............................................ 42
6. CONTEXT INDICATORS.................................................................................................. 43 Number of telephone calls and incidents (NI)................................................................ 43 Number of sudden death reports to Procurator Fiscal (NI) ........................................... 43 Number of missing person incidents (NI) and number of missing persons and levels of risk (LI) ........................................................................................................................... 44 Number of Registered Sex Offenders in the community (NI) ........................................ 44 Legal Services (LI) ......................................................................................................... 44 Number of domestic abuse incidents (NI) ..................................................................... 44 Number of drug related deaths (LI)................................................................................ 44 Number of Problem Drug Users (NI) ............................................................................. 44 Number of individuals brought into custody (NI)............................................................ 45 Number of Freedom of Information requests and questions (NI).................................. 45 Disclosure (LI) ................................................................................................................ 45
7. APPENDIX A..................................................................................................................... 46 7.1 INTERPRETATION OF INFORMATION .................................................................... 46
7.1.1 Force Priorities...................................................................................................... 46 7.1.2 National Indicators (NI) ......................................................................................... 46 7.1.3 Local Indicators (LI) .............................................................................................. 47 7.1.4 Single Outcome Agreement (SOAs)..................................................................... 47

NOT PROTECTIVELY MARKED
NOT PROTECTIVELY MARKED
4
7.1.5 Baselines and "Traffic Lights" ............................................................................... 47 7.2 ACRONYMS................................................................................................................ 49 7.3 FURTHER SOURCES OF INFORMATION................................................................ 50
NOT PROTECTIVELY MARKED
NOT PROTECTIVELY MARKED
5
1. INTRODUCTION & EXECUTIVE SUMMARY 1.1 INTRODUCTION "Continuing our Platform for Success" was published on 1 April 2011. This strategy document promotes the Force Mission and the strategy for delivery, upon which this report is focused. The Force Mission is achieved through delivery of the Force Priorities, which includes crime/disorder and business/organisational issues. The purpose of this report is to inform the Force Executive Board (FEB) and the Grampian Joint Police Board (GJPB) of progress towards achieving that Mission. The report is structured around the four 'areas of policing' identified within the Scottish Policing Performance Framework (SPPF):
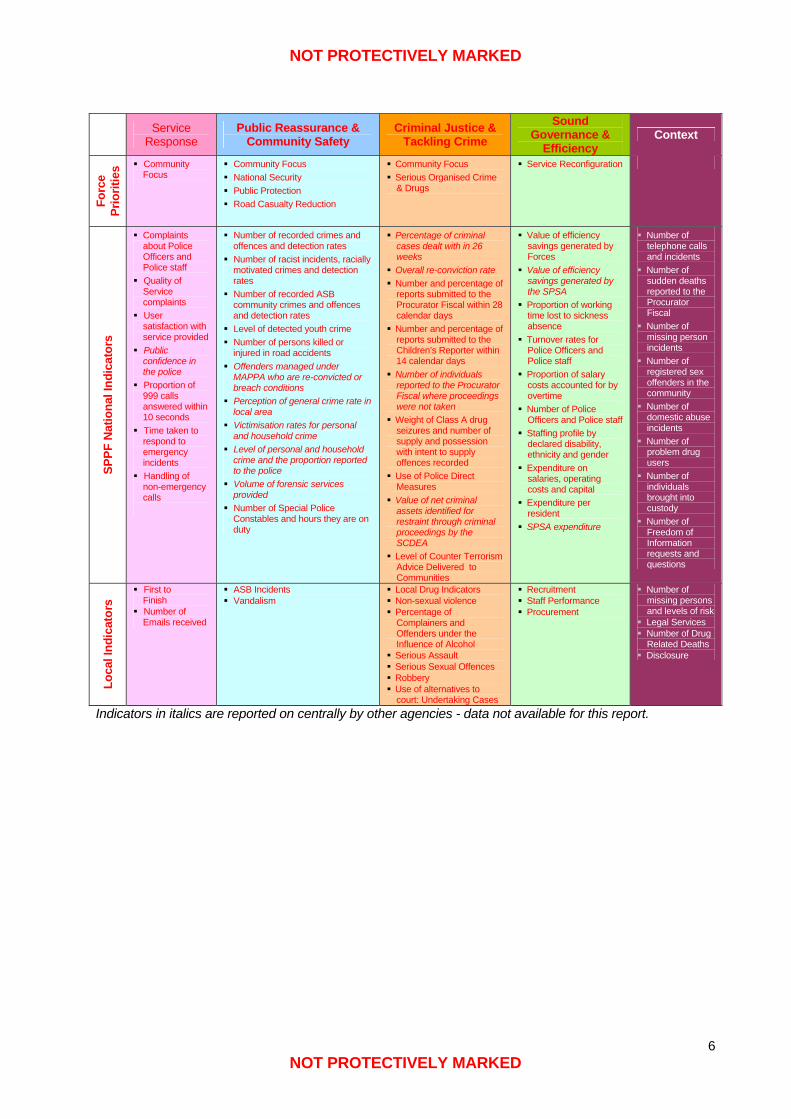
• Service Response • Public Reassurance and Community Safety • Criminal Justice and Tackling Crime • Sound Governance and Efficiency
Together, these encompass the full range of policing related activities of Grampian Police and our partners. This report is split into sections, each section covering one of the policing areas listed above. The Force Priorities for 2011/12 fit within the SPPF framework. National Indicators (NI) are included within each section of the report, as are a range of Local Indicators (LI). Further information on indicators can be obtained by contacting Superintendent MacColl, at [email protected].
NOT PROTECTIVELY MARKED
NOT PROTECTIVELY MARKED
6
Service
Response Public Reassurance &
Community Safety Criminal Justice &
Tackling Crime Sound
Governance & Efficiency
Context
Forc
e Pr
iorit
ies Community
Focus
Community Focus National Security Public Protection Road Casualty Reduction
Community Focus Serious Organised Crime
& Drugs
Service Reconfiguration
SPPF
Nat
iona
l Ind
icat
ors
Complaints about Police Officers and Police staff Quality of
Service complaints User
satisfaction with service provided Public
confidence in the police Proportion of
999 calls answered within 10 seconds Time taken to
respond to emergency incidents Handling of
non-emergency calls
Number of recorded crimes and offences and detection rates Number of racist incidents, racially
motivated crimes and detection rates Number of recorded ASB
community crimes and offences and detection rates Level of detected youth crime Number of persons killed or
injured in road accidents Offenders managed under
MAPPA who are re-convicted or breach conditions Perception of general crime rate in
local area Victimisation rates for personal
and household crime Level of personal and household
crime and the proportion reported to the police Volume of forensic services
provided Number of Special Police
Constables and hours they are on duty
Percentage of criminal cases dealt with in 26 weeks Overall re-conviction rate Number and percentage of
reports submitted to the Procurator Fiscal within 28 calendar days Number and percentage of
reports submitted to the Children’s Reporter within 14 calendar days Number of individuals
reported to the Procurator Fiscal where proceedings were not taken Weight of Class A drug
seizures and number of supply and possession with intent to supply offences recorded Use of Police Direct
Measures Value of net criminal
assets identified for restraint through criminal proceedings by the SCDEA Level of Counter Terrorism
Advice Delivered to Communities
Value of efficiency savings generated by Forces Value of efficiency
savings generated by the SPSA Proportion of working
time lost to sickness absence Turnover rates for
Police Officers and Police staff Proportion of salary
costs accounted for by overtime Number of Police
Officers and Police staff Staffing profile by
declared disability, ethnicity and gender Expenditure on
salaries, operating costs and capital Expenditure per
resident SPSA expenditure
Number of telephone calls and incidents Number of
sudden deaths reported to the Procurator Fiscal Number of
missing person incidents Number of
registered sex offenders in the community Number of
domestic abuse incidents Number of
problem drug users Number of
individuals brought into custody Number of
Freedom of Information requests and questions
Loca
l Ind
icat
ors
First to Finish Number of
Emails received
ASB Incidents Vandalism
Local Drug Indicators Non-sexual violence Percentage of
Complainers and Offenders under the Influence of Alcohol Serious Assault Serious Sexual Offences Robbery Use of alternatives to
court: Undertaking Cases
Recruitment Staff Performance Procurement
Number of missing persons and levels of risk Legal Services Number of Drug
Related Deaths Disclosure
Indicators in italics are reported on centrally by other agencies - data not available for this report.
NOT PROTECTIVELY MARKED
NOT PROTECTIVELY MARKED
7
1.2 EXECUTIVE SUMMARY The Force has on the whole maintained and improved on our performance compared to last quarter. The performance is seen as particularly positive when viewed against the backdrop of public sector financial constraints. Service Response Performance in the area of service response continues to be excellent across the Force. In relation to answering 999 calls, performance has improved, with 99.1% answered within 10 seconds. This is the best performance level achieved in the last two years. The average time taken to respond to emergency incidents also improved with the average response time reducing to its lowest level in the same two years. The Force’s ability to answer non-emergency calls remains above target. First to Finish This new local indicator, First to Finish was introduced at the beginning of this reporting year to monitor how effectively the Force Service Centre (FSC) resolves calls from the public without having to pass the caller to another resource within the Force. The percentage resolved at first point of contact continues to show improvement, with 78% of contacts resolved this quarter at first point of contact. This is an increase of 21% from quarter 2. The Force is committed to dealing with public contact in the most appropriate manner. The increase in resolution figures at FSC results in freeing up more time for our Officers to spend in their communities, either on patrol or dealing with community concerns. Complaints Complaints about Police Officers and Police Staff per 10000 population fell to its lowest level in the past two reported years. The quarterly average for complaints in 2011/12 is 142, compared to 154 for 2010/11. The number of closed allegations where action was taken rose in this quarter from 19% to 22% of cases. The Force adopts a rigorous approach to complaints handling to ensure the high standards we expect from our staff are maintained and improved. Public Satisfaction Remains High Public satisfaction remains high. A survey of individuals contacting the Police showed that individuals are satisfied with their initial contact with Police (96.5%) and satisfied with their treatment by Officers (91.6%). Just under 5% of survey respondents expressed some form of dissatisfaction with the way in which Grampian Police dealt with their matter. Community Focus – Antisocial Behaviour Continues to Fall Throughout this reporting period a number of locally based Operations ran within the Force, in particular in the lead up to the end of the year. These were driven by issues highlighted to our Officers in the communities. A focus of these Operations was to increase public reassurance through enhanced visibility in communities and to reduce crimes related to antisocial behaviour (ASB) . As a result, the number of ASB community crimes recorded in quarter 3 is the lowest recorded figure since the indicator was introduced at the start of 2007/08. The number of recorded vandalisms has reduced for the second consecutive quarter, the second lowest recorded figure since
NOT PROTECTIVELY MARKED
NOT PROTECTIVELY MARKED
8
the start of 2007/08. Road Casualty Reduction The downward trend of adult fatalities has continued throughout 2011/12. In quarter 3, there were 4 adult fatalities, which is a decrease of 7 (63.6%) when compared to quarter 3 last year. One child fatality was recorded in quarter 3, which was the first child fatality of 2011/12. Adults seriously injured has increased compared to the same period last year. It is important to emphasise the fine line between a serious road collision and what ultimately proves to be a fatal road collision. Crime Figures A total of 5897 Group 1-4 crimes were recorded this quarter which is less than the previous three quarters albeit higher than same quarter last year where performance in Group 4 crime was exceptional. The adverse weather conditions during quarter 3 last year appears to have had a significant contribution to the reduced figures. Detection Rates While the majority of detection rates across the different crime groups continue to be below the 3 year average those for Group 1 (Crimes of Violence) rose to 86.1% in this quarter, the highest level since quarter 2 2009/10. The detection rate in Group 2 (Sexual Offences) fell against the previous quarter. This detection rate remains below the Scottish average, while detection rates in Groups 1, 3 and 4 are all above the average of other Forces. Grampian Police continues to seek ways to improve detection rates and build on every opportunity to detect crime. The reduction in the Group 2 detection rate is partly due to the lower number of recorded Prostitution offences, which are generally always detected. Serious Organised Crime and Drugs During the last quarter officers from the Force's Major Investigation Teams disrupted 9 organised crime groups, seizing Class A drugs worth almost £250,000. Direct Measures While the use of direct measures which includes Formal Adult Warnings and Fixed Penalty Notices for Antisocial Behaviour fell again in this quarter discussions are continuing with the local Criminal Justice Board with a view to expanding their use in the future in an effort to enhance criminal justice disposals. Revised guidance on specific offences has restricted the use of direct measures for dealing with certain types of offences. Sound Governance and Efficiency The total number of Police Officers employed by the Force at the end of quarter 3 was 1525. The figures for Police Staff and Cadets were 685 and 6 respectively. Recruitment of Police Officers recommenced in October 2011 and the process is now gaining momentum. To date, 253 regular applications have been received and are being processed. ARE BEING PROCESSED.
NOT PROTECTIVELY MARKED
NOT PROTECTIVELY MARKED
9
2. SERVICE RESPONSE The area of Service Response relates to how Grampian Police respond to the public. The Force priority identified to deliver a high standard of Service Response is Community Focus. 2.1 COMMUNITY FOCUS
• We will engage and work with partners and the community to deliver improved policing services based on the principles of a community focused approach.
Proportion of 999 calls answered within 10 seconds (NI)
Proportion of 999 Calls Answered within 10 seconds
Q1 10/11
Q2 10/11
Q3 10/11
Q4 10/11
Q1 11/12
Q2 11/12
Q3 11/12
Total 999 calls 13595 13168 14169 12286 13323 13849 13270 Answered within 10 seconds 13205 12854 13851 12003 13175 13656 13145
% Answered within 10 seconds 97.1% 97.6% 97.8% 97.7% 98.9% 98.6% 99.1%
National Target – 90%.
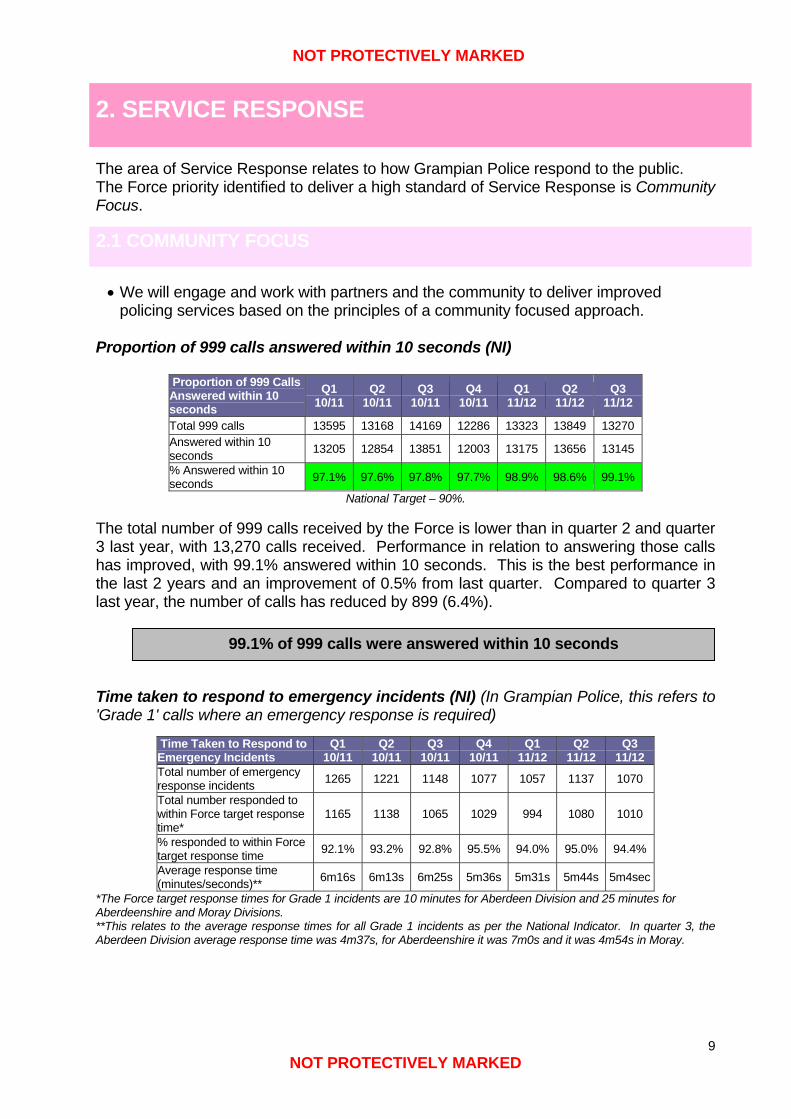
The total number of 999 calls received by the Force is lower than in quarter 2 and quarter 3 last year, with 13,270 calls received. Performance in relation to answering those calls has improved, with 99.1% answered within 10 seconds. This is the best performance in the last 2 years and an improvement of 0.5% from last quarter. Compared to quarter 3 last year, the number of calls has reduced by 899 (6.4%). Time taken to respond to emergency incidents (NI) (In Grampian Police, this refers to 'Grade 1' calls where an emergency response is required)
Time Taken to Respond to Emergency Incidents
Q1 10/11
Q2 10/11
Q3 10/11
Q4 10/11
Q1 11/12
Q2 11/12
Q3 11/12
Total number of emergency response incidents 1265 1221 1148 1077 1057 1137 1070
Total number responded to within Force target response time*
1165 1138 1065 1029 994 1080 1010
% responded to within Force target response time 92.1% 93.2% 92.8% 95.5% 94.0% 95.0% 94.4%
Average response time (minutes/seconds)** 6m16s 6m13s 6m25s 5m36s 5m31s 5m44s 5m4sec
*The Force target response times for Grade 1 incidents are 10 minutes for Aberdeen Division and 25 minutes for Aberdeenshire and Moray Divisions. **This relates to the average response times for all Grade 1 incidents as per the National Indicator. In quarter 3, the Aberdeen Division average response time was 4m37s, for Aberdeenshire it was 7m0s and it was 4m54s in Moray.
99.1% of 999 calls were answered within 10 seconds
NOT PROTECTIVELY MARKED
NOT PROTECTIVELY MARKED
10
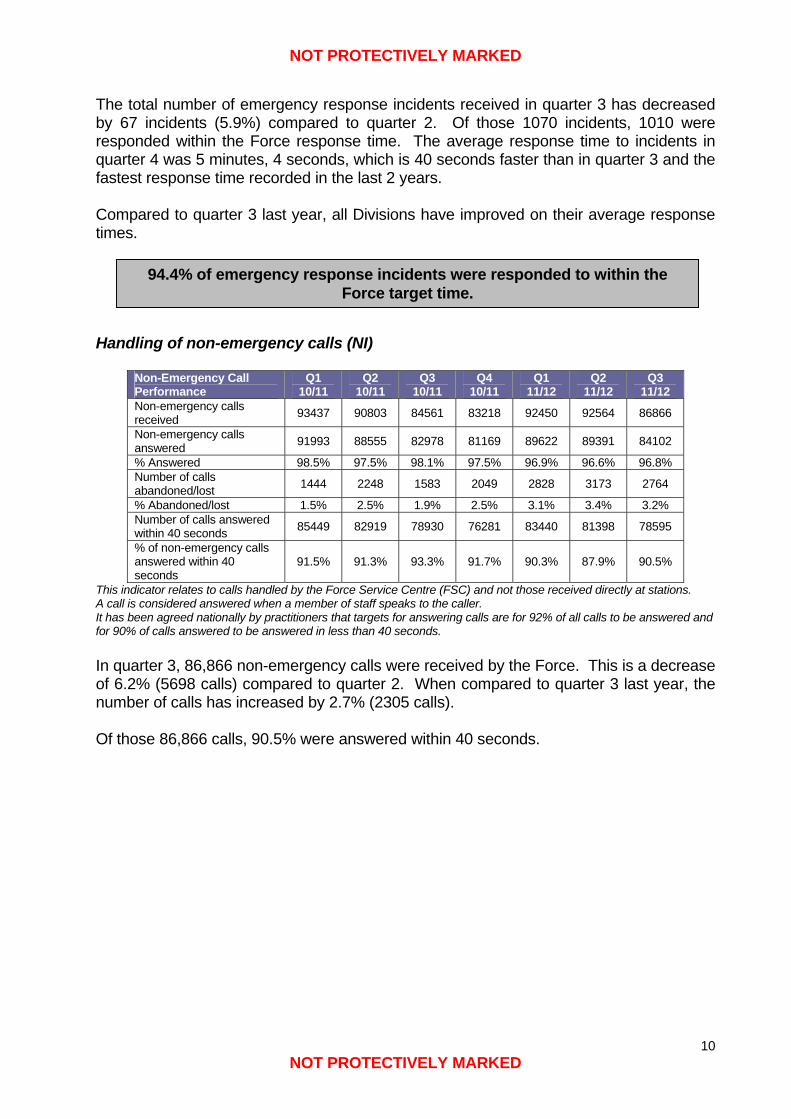
The total number of emergency response incidents received in quarter 3 has decreased by 67 incidents (5.9%) compared to quarter 2. Of those 1070 incidents, 1010 were responded within the Force response time. The average response time to incidents in quarter 4 was 5 minutes, 4 seconds, which is 40 seconds faster than in quarter 3 and the fastest response time recorded in the last 2 years. Compared to quarter 3 last year, all Divisions have improved on their average response times. Handling of non-emergency calls (NI)
Non-Emergency Call Performance
Q1 10/11
Q2 10/11
Q3 10/11
Q4 10/11
Q1 11/12
Q2 11/12
Q3 11/12
Non-emergency calls received 93437 90803 84561 83218 92450 92564 86866
Non-emergency calls answered 91993 88555 82978 81169 89622 89391 84102
% Answered 98.5% 97.5% 98.1% 97.5% 96.9% 96.6% 96.8% Number of calls abandoned/lost 1444 2248 1583 2049 2828 3173 2764
% Abandoned/lost 1.5% 2.5% 1.9% 2.5% 3.1% 3.4% 3.2% Number of calls answered within 40 seconds 85449 82919 78930 76281 83440 81398 78595
% of non-emergency calls answered within 40 seconds
91.5% 91.3% 93.3% 91.7% 90.3% 87.9% 90.5%
This indicator relates to calls handled by the Force Service Centre (FSC) and not those received directly at stations. A call is considered answered when a member of staff speaks to the caller. It has been agreed nationally by practitioners that targets for answering calls are for 92% of all calls to be answered and for 90% of calls answered to be answered in less than 40 seconds. In quarter 3, 86,866 non-emergency calls were received by the Force. This is a decrease of 6.2% (5698 calls) compared to quarter 2. When compared to quarter 3 last year, the number of calls has increased by 2.7% (2305 calls). Of those 86,866 calls, 90.5% were answered within 40 seconds.
94.4% of emergency response incidents were responded to within the Force target time.
NOT PROTECTIVELY MARKED
NOT PROTECTIVELY MARKED
11
First to Finish (LI)
Q1 11/12
Q2 11/12
Q3 11/12
Number of Contacts 92450 92564 86866 Number Resolved at first
point of contact 46982 52881 67948
% Resolved at first point of contact 51% 57% 78%
Number Resolved by Force Service Delivery
Unit (FSDU) 760 607 559
% Resolved by Force Service Delivery Unit
(FSDU) 0.9% 0.7% 0.6%
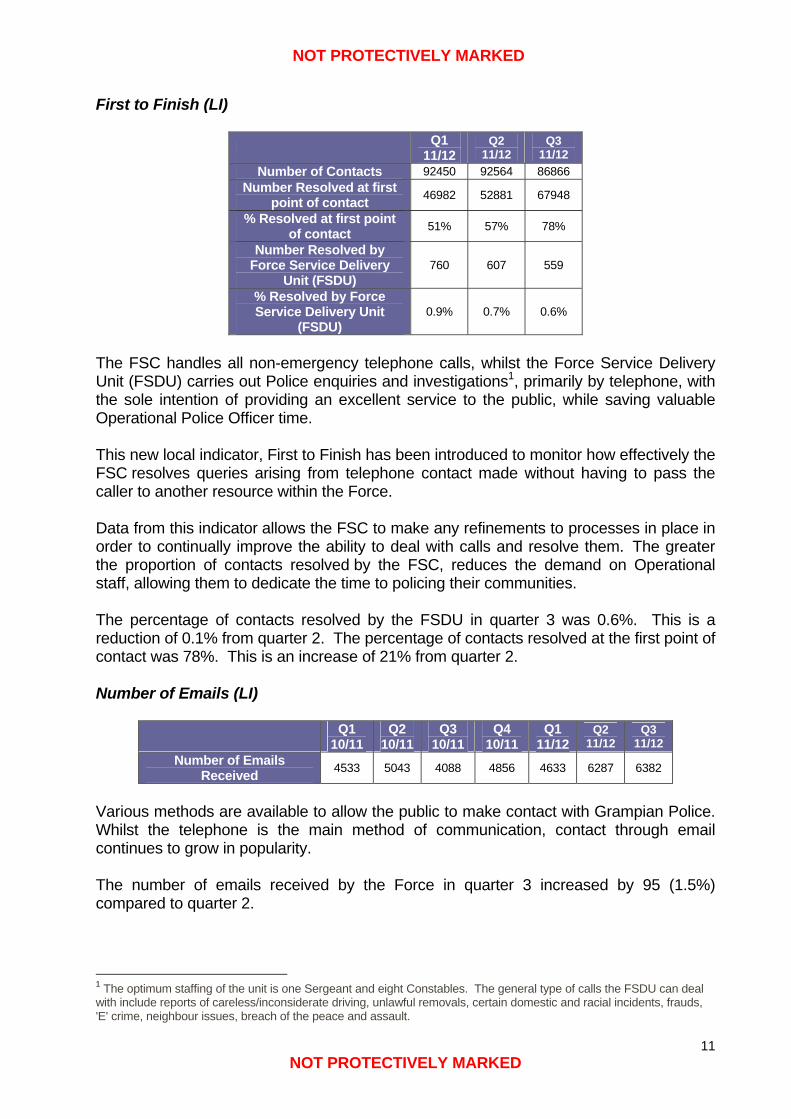
The FSC handles all non-emergency telephone calls, whilst the Force Service Delivery Unit (FSDU) carries out Police enquiries and investigations1, primarily by telephone, with the sole intention of providing an excellent service to the public, while saving valuable Operational Police Officer time. This new local indicator, First to Finish has been introduced to monitor how effectively the FSC resolves queries arising from telephone contact made without having to pass the caller to another resource within the Force. Data from this indicator allows the FSC to make any refinements to processes in place in order to continually improve the ability to deal with calls and resolve them. The greater the proportion of contacts resolved by the FSC, reduces the demand on Operational staff, allowing them to dedicate the time to policing their communities. The percentage of contacts resolved by the FSDU in quarter 3 was 0.6%. This is a reduction of 0.1% from quarter 2. The percentage of contacts resolved at the first point of contact was 78%. This is an increase of 21% from quarter 2. Number of Emails (LI)
Q1 10/11
Q2 10/11
Q3 10/11
Q4 10/11
Q1 11/12
Q2 11/12
Q3 11/12
Number of Emails Received 4533 5043 4088 4856 4633 6287 6382
Various methods are available to allow the public to make contact with Grampian Police. Whilst the telephone is the main method of communication, contact through email continues to grow in popularity. The number of emails received by the Force in quarter 3 increased by 95 (1.5%) compared to quarter 2.
1 The optimum staffing of the unit is one Sergeant and eight Constables. The general type of calls the FSDU can deal with include reports of careless/inconsiderate driving, unlawful removals, certain domestic and racial incidents, frauds, 'E' crime, neighbour issues, breach of the peace and assault.
NOT PROTECTIVELY MARKED
NOT PROTECTIVELY MARKED
12
Complaints about Police Officers and Police Staff (NI) and Quality of Service Allegations (NI)
Complaints Q1 10/11 Q2 10/11 Q3 10/11 Q4 10/11 Q1 11/12 Q2 11/12 Q3 11/12
Total Complaints 171 143 148 179 141 149 135
Complaints per 10,000 population** 3.14 2.62 2.72 3.28 2.56 2.71 2.45
Number of on duty closed allegations 216 194 185 184 231 185 202
Number of off duty closed allegations 9 7 1 0 0 1 5 Number of closed allegations where action is taken* 59 34 25 32 45 35 46
Number of Quality of Service closed allegations 35 42 36 69 44 39 63
Number of Quality of Service closed allegations per 10,000 population** 0.64 0.77 0.66 1.27 0.80 0.71 1.14
Complaints within this indicator refer to on duty, off duty and quality of service allegations *Action includes action by Crown Office Procurator Fiscal Service, action in terms of police conduct regulations/staff discipline procedures or action outwith police conduct regulations/staff discipline procedure, e.g., diversion to training or redeployment. ** Population in Grampian 2010/11 – 544,980, 2011/12 – 550,620
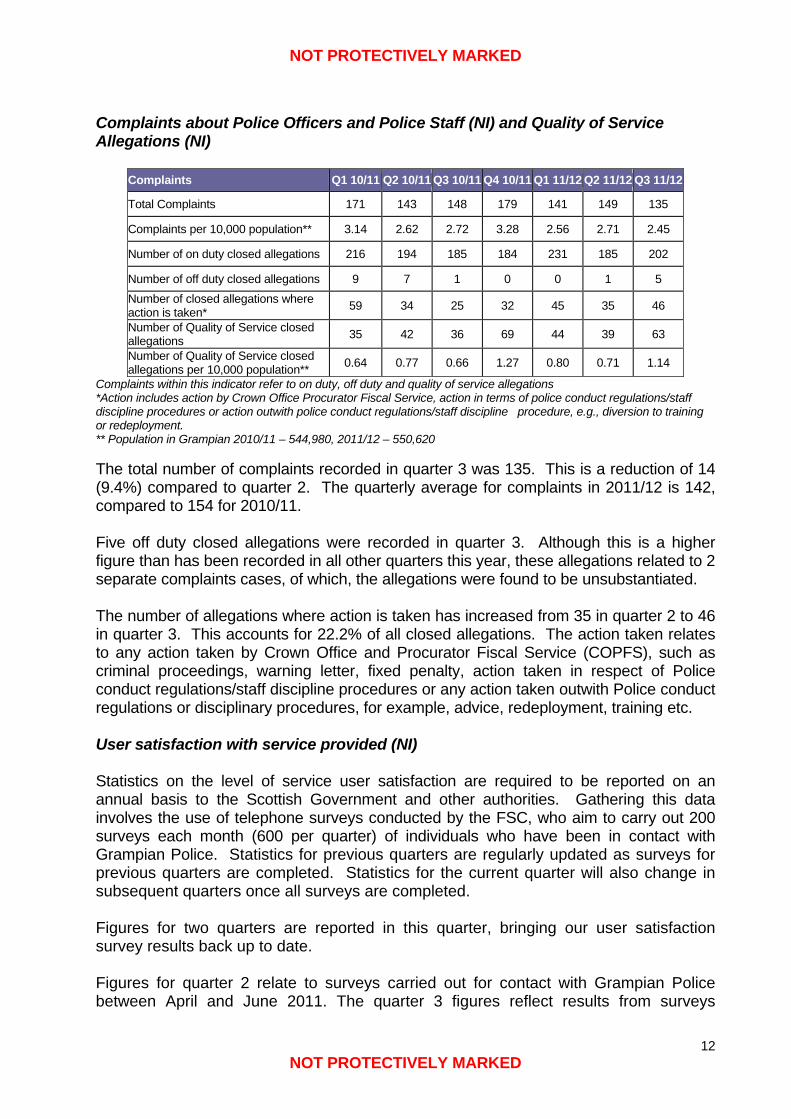
The total number of complaints recorded in quarter 3 was 135. This is a reduction of 14 (9.4%) compared to quarter 2. The quarterly average for complaints in 2011/12 is 142, compared to 154 for 2010/11. Five off duty closed allegations were recorded in quarter 3. Although this is a higher figure than has been recorded in all other quarters this year, these allegations related to 2 separate complaints cases, of which, the allegations were found to be unsubstantiated. The number of allegations where action is taken has increased from 35 in quarter 2 to 46 in quarter 3. This accounts for 22.2% of all closed allegations. The action taken relates to any action taken by Crown Office and Procurator Fiscal Service (COPFS), such as criminal proceedings, warning letter, fixed penalty, action taken in respect of Police conduct regulations/staff discipline procedures or any action taken outwith Police conduct regulations or disciplinary procedures, for example, advice, redeployment, training etc. User satisfaction with service provided (NI) Statistics on the level of service user satisfaction are required to be reported on an annual basis to the Scottish Government and other authorities. Gathering this data involves the use of telephone surveys conducted by the FSC, who aim to carry out 200 surveys each month (600 per quarter) of individuals who have been in contact with Grampian Police. Statistics for previous quarters are regularly updated as surveys for previous quarters are completed. Statistics for the current quarter will also change in subsequent quarters once all surveys are completed. Figures for two quarters are reported in this quarter, bringing our user satisfaction survey results back up to date. Figures for quarter 2 relate to surveys carried out for contact with Grampian Police between April and June 2011. The quarter 3 figures reflect results from surveys
NOT PROTECTIVELY MARKED
NOT PROTECTIVELY MARKED
13
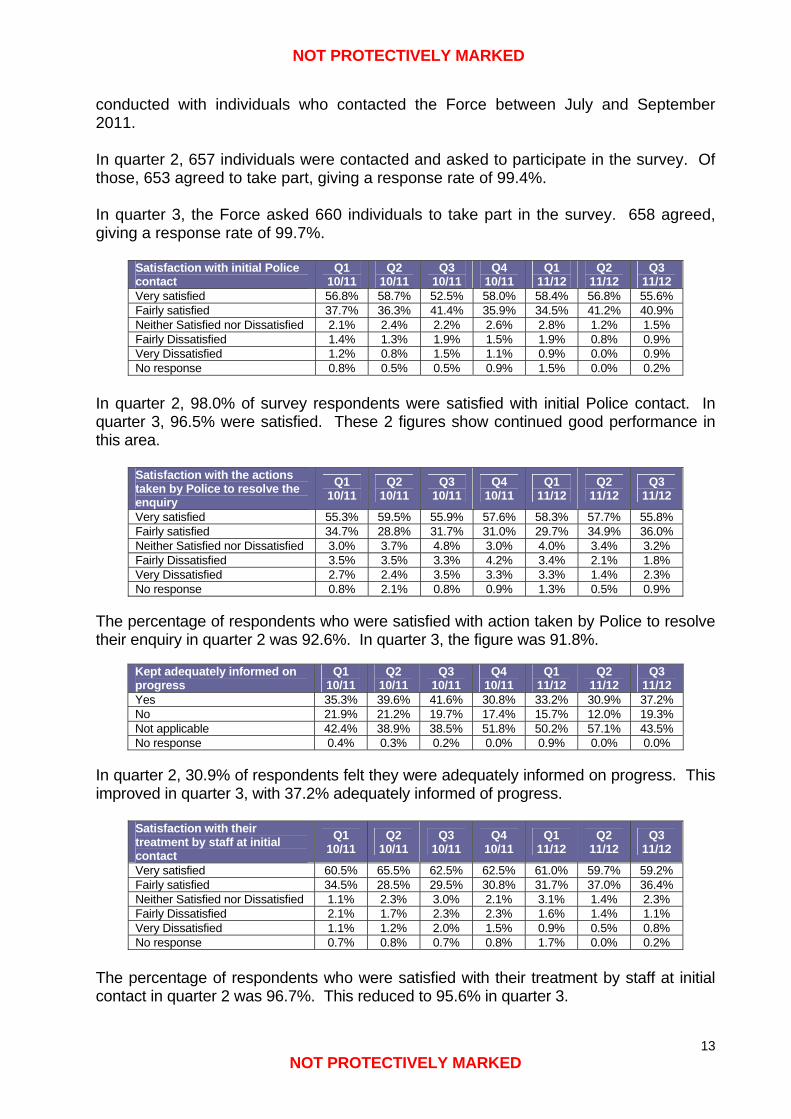
conducted with individuals who contacted the Force between July and September 2011. In quarter 2, 657 individuals were contacted and asked to participate in the survey. Of those, 653 agreed to take part, giving a response rate of 99.4%. In quarter 3, the Force asked 660 individuals to take part in the survey. 658 agreed, giving a response rate of 99.7%.
Satisfaction with initial Police contact
Q1 10/11
Q2 10/11
Q3 10/11
Q4 10/11
Q1 11/12
Q2 11/12
Q3 11/12
Very satisfied 56.8% 58.7% 52.5% 58.0% 58.4% 56.8% 55.6% Fairly satisfied 37.7% 36.3% 41.4% 35.9% 34.5% 41.2% 40.9% Neither Satisfied nor Dissatisfied 2.1% 2.4% 2.2% 2.6% 2.8% 1.2% 1.5% Fairly Dissatisfied 1.4% 1.3% 1.9% 1.5% 1.9% 0.8% 0.9% Very Dissatisfied 1.2% 0.8% 1.5% 1.1% 0.9% 0.0% 0.9% No response 0.8% 0.5% 0.5% 0.9% 1.5% 0.0% 0.2%
In quarter 2, 98.0% of survey respondents were satisfied with initial Police contact. In quarter 3, 96.5% were satisfied. These 2 figures show continued good performance in this area.
Satisfaction with the actions taken by Police to resolve the enquiry
Q1 10/11
Q2 10/11
Q3 10/11
Q4 10/11
Q1 11/12
Q2 11/12
Q3 11/12
Very satisfied 55.3% 59.5% 55.9% 57.6% 58.3% 57.7% 55.8% Fairly satisfied 34.7% 28.8% 31.7% 31.0% 29.7% 34.9% 36.0% Neither Satisfied nor Dissatisfied 3.0% 3.7% 4.8% 3.0% 4.0% 3.4% 3.2% Fairly Dissatisfied 3.5% 3.5% 3.3% 4.2% 3.4% 2.1% 1.8% Very Dissatisfied 2.7% 2.4% 3.5% 3.3% 3.3% 1.4% 2.3% No response 0.8% 2.1% 0.8% 0.9% 1.3% 0.5% 0.9%
The percentage of respondents who were satisfied with action taken by Police to resolve their enquiry in quarter 2 was 92.6%. In quarter 3, the figure was 91.8%.
Kept adequately informed on progress
Q1 10/11
Q2 10/11
Q3 10/11
Q4 10/11
Q1 11/12
Q2 11/12
Q3 11/12
Yes 35.3% 39.6% 41.6% 30.8% 33.2% 30.9% 37.2% No 21.9% 21.2% 19.7% 17.4% 15.7% 12.0% 19.3% Not applicable 42.4% 38.9% 38.5% 51.8% 50.2% 57.1% 43.5% No response 0.4% 0.3% 0.2% 0.0% 0.9% 0.0% 0.0%
In quarter 2, 30.9% of respondents felt they were adequately informed on progress. This improved in quarter 3, with 37.2% adequately informed of progress.
Satisfaction with their treatment by staff at initial contact
Q1 10/11
Q2 10/11
Q3 10/11
Q4 10/11
Q1 11/12
Q2 11/12
Q3 11/12
Very satisfied 60.5% 65.5% 62.5% 62.5% 61.0% 59.7% 59.2% Fairly satisfied 34.5% 28.5% 29.5% 30.8% 31.7% 37.0% 36.4% Neither Satisfied nor Dissatisfied 1.1% 2.3% 3.0% 2.1% 3.1% 1.4% 2.3% Fairly Dissatisfied 2.1% 1.7% 2.3% 2.3% 1.6% 1.4% 1.1% Very Dissatisfied 1.1% 1.2% 2.0% 1.5% 0.9% 0.5% 0.8% No response 0.7% 0.8% 0.7% 0.8% 1.7% 0.0% 0.2%
The percentage of respondents who were satisfied with their treatment by staff at initial contact in quarter 2 was 96.7%. This reduced to 95.6% in quarter 3.
NOT PROTECTIVELY MARKED
NOT PROTECTIVELY MARKED
14
Satisfaction with treatment by Officers who attended
Q1 10/11
Q2 10/11
Q3 10/11
Q4 10/11
Q1 11/12
Q2 11/12
Q3 11/12
Very satisfied 57.5% 71.7% 66.4% 64.0% 61.8% 52.9% 51.6% Fairly satisfied 34.2% 21.6% 28.4% 27.6% 28.2% 41.8% 40.0% Neither Satisfied nor Dissatisfied 2.5% 2.3% 1.3% 3.2% 3.4% 1.3% 2.1% Fairly Dissatisfied 1.8% 2.7% 1.0% 2.4% 2.3% 2.7% 2.5% Very Dissatisfied 2.9% 0.7% 1.6% 2.0% 2.7% 0.9% 2.1% No response 1.1% 1.0% 1.3% 0.8% 1.6% 0.4% 1.7%
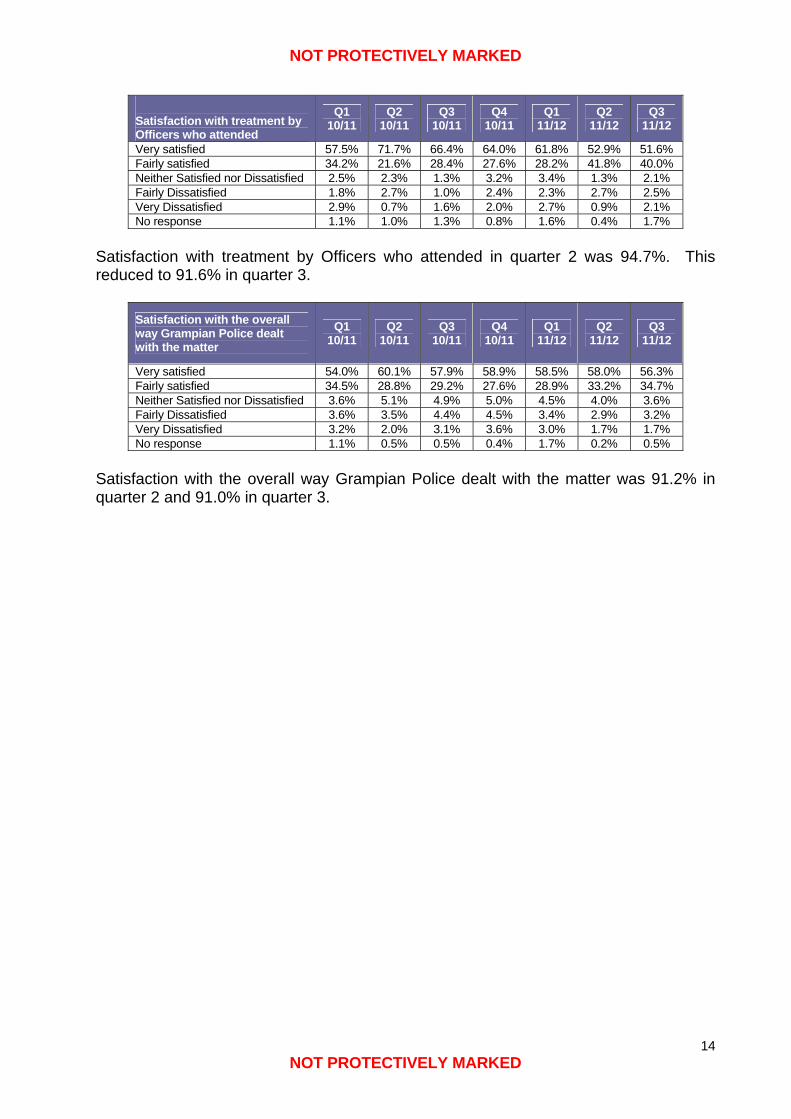
Satisfaction with treatment by Officers who attended in quarter 2 was 94.7%. This reduced to 91.6% in quarter 3.
Satisfaction with the overall way Grampian Police dealt with the matter
Q1 10/11
Q2 10/11
Q3 10/11
Q4 10/11
Q1 11/12
Q2 11/12
Q3 11/12
Very satisfied 54.0% 60.1% 57.9% 58.9% 58.5% 58.0% 56.3% Fairly satisfied 34.5% 28.8% 29.2% 27.6% 28.9% 33.2% 34.7% Neither Satisfied nor Dissatisfied 3.6% 5.1% 4.9% 5.0% 4.5% 4.0% 3.6% Fairly Dissatisfied 3.6% 3.5% 4.4% 4.5% 3.4% 2.9% 3.2% Very Dissatisfied 3.2% 2.0% 3.1% 3.6% 3.0% 1.7% 1.7% No response 1.1% 0.5% 0.5% 0.4% 1.7% 0.2% 0.5%
Satisfaction with the overall way Grampian Police dealt with the matter was 91.2% in quarter 2 and 91.0% in quarter 3.
NOT PROTECTIVELY MARKED
NOT PROTECTIVELY MARKED
15
3. PUBLIC REASSURANCE & COMMUNITY SAFETY The area of Public Reassurance and Community Safety includes proactive and neighbourhood based work areas. Priorities identified in this area of policing are: Community Focus, Public Protection and Road Casualty Reduction. 3.1 COMMUNITY FOCUS
• We will engage and work with partners and the community to deliver improved policing services based on the principles of a community focused approach.
Antisocial Behaviour For the 2011/12 financial year, Antisocial Behaviour (ASB) forms part of the Community Focus Force Priority. Throughout quarter 3 there have been a number of locally focused Operations running within the Force. These have been driven by issues highlighted in the Local Policing Team (LPT) quarterly updates. In Aberdeen Division, significant success has been achieved through Operation Maple2 in tackling street level drug supply, violence and in particular, domestic related incidents, vandalism, underage drinking, poor driver behaviour, including parking at, or near schools and other wider ASB. Operation Maple has benefited every LPT within the Division with the deployment of additional staff being achieved through specific partnership funding. Operation Maple will remain a key strand of Aberdeen Division's work to tackle ASB in quarter 4 and in the forthcoming financial year. The focus will be to look for further opportunities to develop partnership involvement and participation to deal with the often complex underlying issues of ASB. Operation Acorn3 has been dealing with ASB and youth annoyance particularly around the shopping precincts at Byron Square and Greenfern Place in Aberdeen during quarter 3. Joint high visibility patrols with Aberdeen City Wardens have continued at weekends and evenings, which have dealt robustly with individuals engaging in ASB. Multi Agency Groups involving Grampian Police, Aberdeen City Council, Grampian Fire and Rescue and various voluntary organisations have been formed and are making positive progress in identifying the most problematic individuals and ensuring that appropriate plans are in place to work with, challenge and change their behaviour. Over the duration of quarter 3, there has been a general reduction in incidents of negative behaviour. This focus will continue in quarter 4. 2 Operation Maple aimed to tackle drugs, violence and anti-social behaviour in Aberdeen, supported by Grampian Fire & Rescue Service, Grampian NHS and Aberdeen City Council. 3 Operation Acorn is aimed at dealing with the recurrent issues of antisocial behaviour, linked to youth annoyance, street drinking and at times general unruly and intimidating behaviour in Northfield and Mastrick.
NOT PROTECTIVELY MARKED
NOT PROTECTIVELY MARKED
16
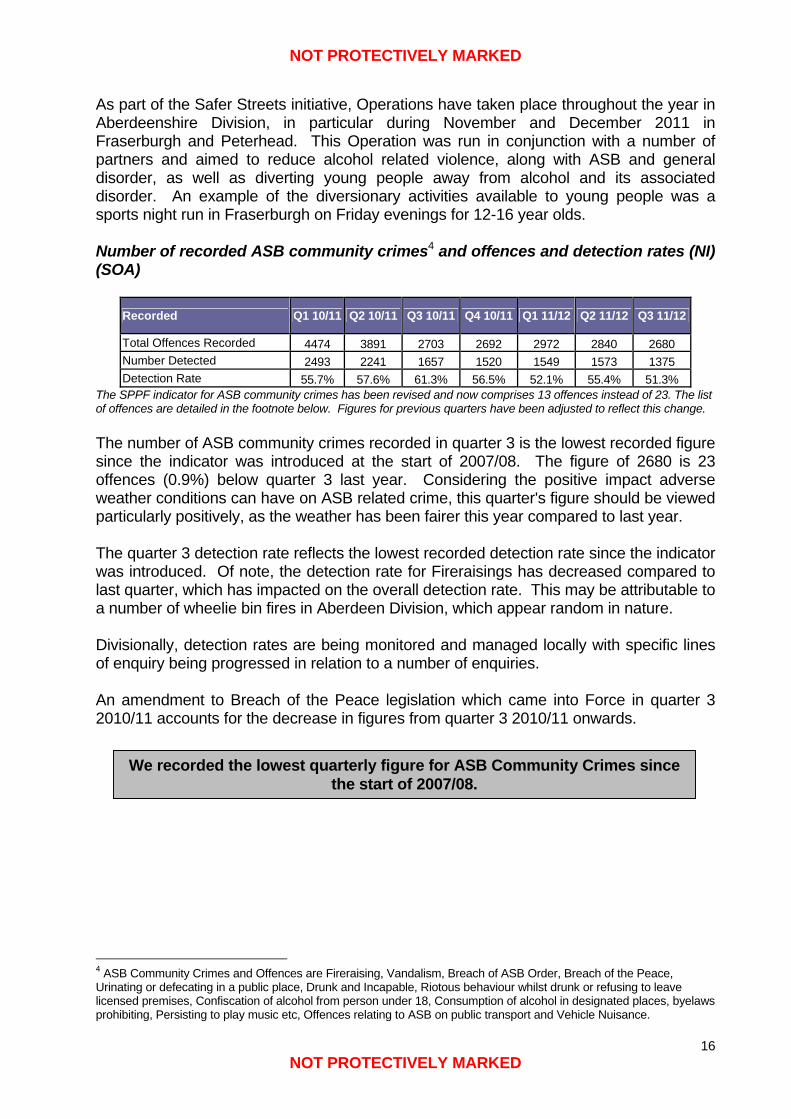
As part of the Safer Streets initiative, Operations have taken place throughout the year in Aberdeenshire Division, in particular during November and December 2011 in Fraserburgh and Peterhead. This Operation was run in conjunction with a number of partners and aimed to reduce alcohol related violence, along with ASB and general disorder, as well as diverting young people away from alcohol and its associated disorder. An example of the diversionary activities available to young people was a sports night run in Fraserburgh on Friday evenings for 12-16 year olds. Number of recorded ASB community crimes4 and offences and detection rates (NI) (SOA)
Recorded Q1 10/11 Q2 10/11 Q3 10/11 Q4 10/11 Q1 11/12 Q2 11/12 Q3 11/12
Total Offences Recorded 4474 3891 2703 2692 2972 2840 2680 Number Detected 2493 2241 1657 1520 1549 1573 1375 Detection Rate 55.7% 57.6% 61.3% 56.5% 52.1% 55.4% 51.3%
The SPPF indicator for ASB community crimes has been revised and now comprises 13 offences instead of 23. The list of offences are detailed in the footnote below. Figures for previous quarters have been adjusted to reflect this change. The number of ASB community crimes recorded in quarter 3 is the lowest recorded figure since the indicator was introduced at the start of 2007/08. The figure of 2680 is 23 offences (0.9%) below quarter 3 last year. Considering the positive impact adverse weather conditions can have on ASB related crime, this quarter's figure should be viewed particularly positively, as the weather has been fairer this year compared to last year. The quarter 3 detection rate reflects the lowest recorded detection rate since the indicator was introduced. Of note, the detection rate for Fireraisings has decreased compared to last quarter, which has impacted on the overall detection rate. This may be attributable to a number of wheelie bin fires in Aberdeen Division, which appear random in nature. Divisionally, detection rates are being monitored and managed locally with specific lines of enquiry being progressed in relation to a number of enquiries. An amendment to Breach of the Peace legislation which came into Force in quarter 3 2010/11 accounts for the decrease in figures from quarter 3 2010/11 onwards.
4 ASB Community Crimes and Offences are Fireraising, Vandalism, Breach of ASB Order, Breach of the Peace, Urinating or defecating in a public place, Drunk and Incapable, Riotous behaviour whilst drunk or refusing to leave licensed premises, Confiscation of alcohol from person under 18, Consumption of alcohol in designated places, byelaws prohibiting, Persisting to play music etc, Offences relating to ASB on public transport and Vehicle Nuisance.
We recorded the lowest quarterly figure for ASB Community Crimes since the start of 2007/08.
NOT PROTECTIVELY MARKED
NOT PROTECTIVELY MARKED
17
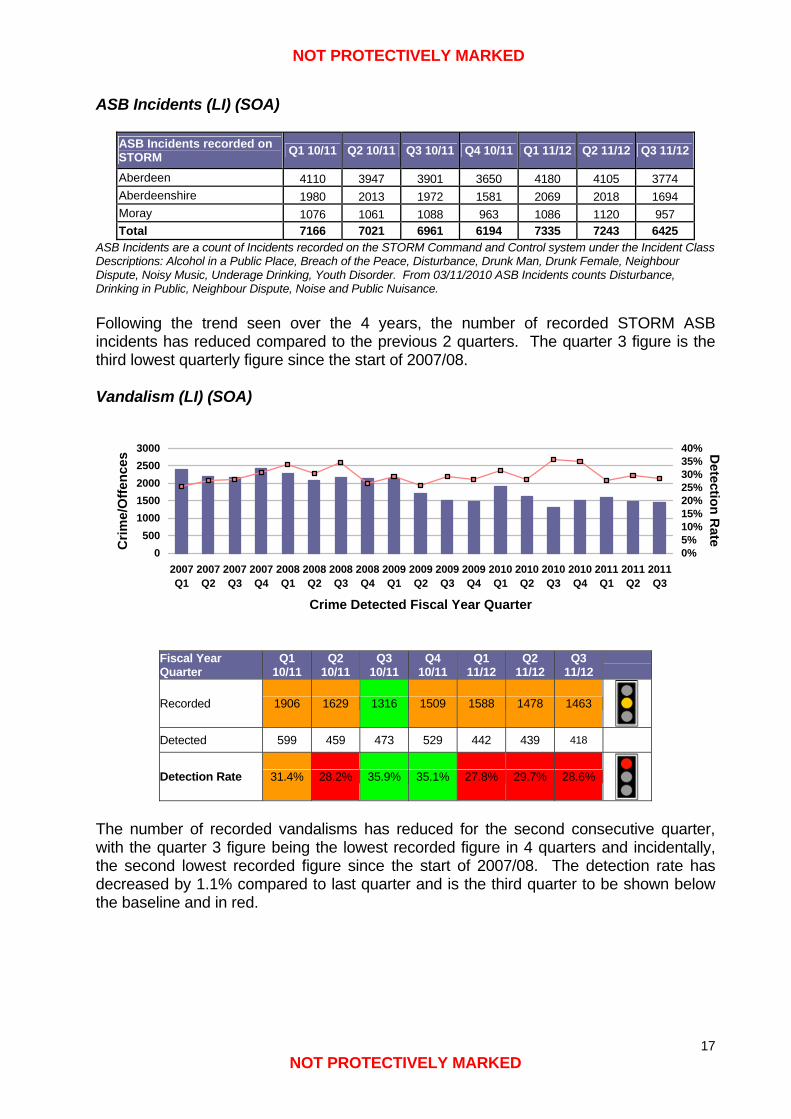
ASB Incidents (LI) (SOA)
ASB Incidents recorded on STORM Q1 10/11 Q2 10/11 Q3 10/11 Q4 10/11 Q1 11/12 Q2 11/12 Q3 11/12
Aberdeen 4110 3947 3901 3650 4180 4105 3774 Aberdeenshire 1980 2013 1972 1581 2069 2018 1694 Moray 1076 1061 1088 963 1086 1120 957 Total 7166 7021 6961 6194 7335 7243 6425
ASB Incidents are a count of Incidents recorded on the STORM Command and Control system under the Incident Class Descriptions: Alcohol in a Public Place, Breach of the Peace, Disturbance, Drunk Man, Drunk Female, Neighbour Dispute, Noisy Music, Underage Drinking, Youth Disorder. From 03/11/2010 ASB Incidents counts Disturbance, Drinking in Public, Neighbour Dispute, Noise and Public Nuisance. Following the trend seen over the 4 years, the number of recorded STORM ASB incidents has reduced compared to the previous 2 quarters. The quarter 3 figure is the third lowest quarterly figure since the start of 2007/08. Vandalism (LI) (SOA)
0500
10001500200025003000
2007Q1
2007Q2
2007Q3
2007Q4
2008Q1
2008Q2
2008Q3
2008Q4
2009Q1
2009Q2
2009Q3
2009Q4
2010Q1
2010Q2
2010Q3
2010Q4
2011Q1
2011Q2
2011Q3
Crime Detected Fiscal Year Quarter
Crim
e/O
ffenc
es
0%5%10%15%20%25%30%35%40% D
etection Rate
Fiscal Year Quarter
Q1 10/11
Q2 10/11
Q3 10/11
Q4 10/11
Q1 11/12
Q2 11/12
Q3 11/12
Recorded 1906 1629 1316 1509 1588 1478 1463
Detected 599 459 473 529 442 439 418
Detection Rate 31.4% 28.2% 35.9% 35.1% 27.8% 29.7% 28.6%
The number of recorded vandalisms has reduced for the second consecutive quarter, with the quarter 3 figure being the lowest recorded figure in 4 quarters and incidentally, the second lowest recorded figure since the start of 2007/08. The detection rate has decreased by 1.1% compared to last quarter and is the third quarter to be shown below the baseline and in red.
NOT PROTECTIVELY MARKED
NOT PROTECTIVELY MARKED
18
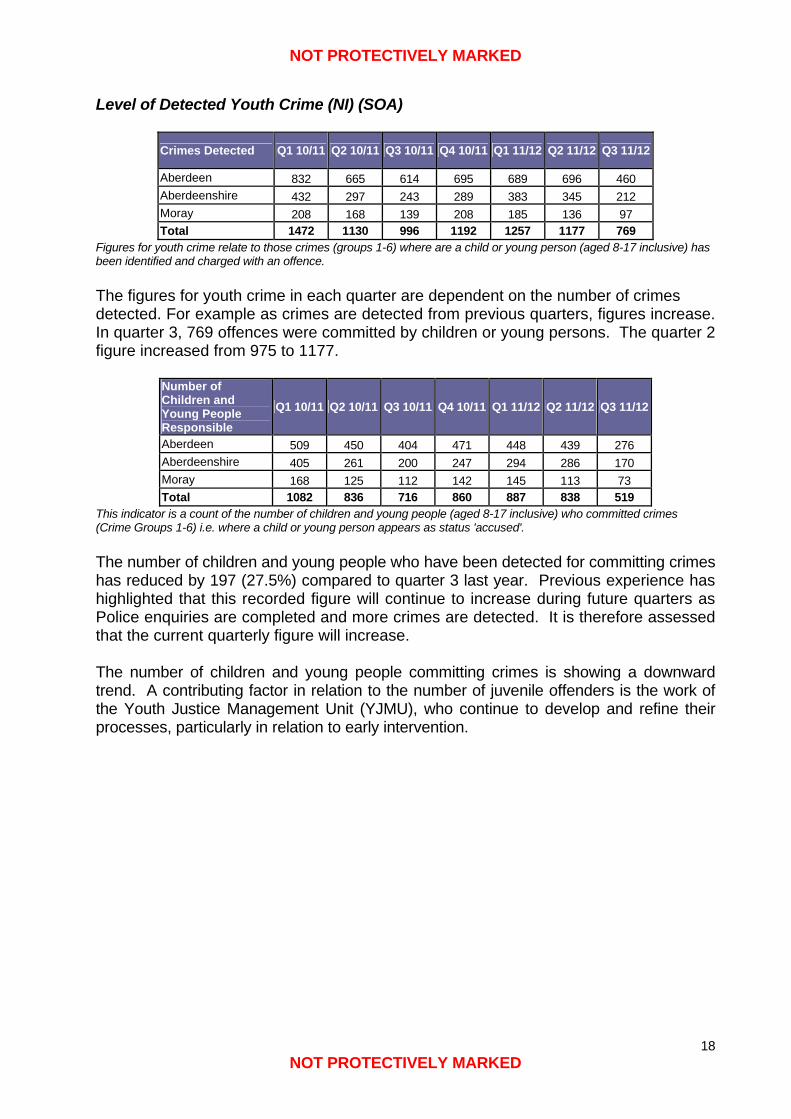
Level of Detected Youth Crime (NI) (SOA)
Crimes Detected Q1 10/11 Q2 10/11 Q3 10/11 Q4 10/11 Q1 11/12 Q2 11/12 Q3 11/12
Aberdeen 832 665 614 695 689 696 460 Aberdeenshire 432 297 243 289 383 345 212 Moray 208 168 139 208 185 136 97 Total 1472 1130 996 1192 1257 1177 769
Figures for youth crime relate to those crimes (groups 1-6) where are a child or young person (aged 8-17 inclusive) has been identified and charged with an offence. The figures for youth crime in each quarter are dependent on the number of crimes detected. For example as crimes are detected from previous quarters, figures increase. In quarter 3, 769 offences were committed by children or young persons. The quarter 2 figure increased from 975 to 1177.
Number of Children and Young People Responsible
Q1 10/11 Q2 10/11 Q3 10/11 Q4 10/11 Q1 11/12 Q2 11/12 Q3 11/12
Aberdeen 509 450 404 471 448 439 276 Aberdeenshire 405 261 200 247 294 286 170 Moray 168 125 112 142 145 113 73 Total 1082 836 716 860 887 838 519
This indicator is a count of the number of children and young people (aged 8-17 inclusive) who committed crimes (Crime Groups 1-6) i.e. where a child or young person appears as status 'accused'. The number of children and young people who have been detected for committing crimes has reduced by 197 (27.5%) compared to quarter 3 last year. Previous experience has highlighted that this recorded figure will continue to increase during future quarters as Police enquiries are completed and more crimes are detected. It is therefore assessed that the current quarterly figure will increase. The number of children and young people committing crimes is showing a downward trend. A contributing factor in relation to the number of juvenile offenders is the work of the Youth Justice Management Unit (YJMU), who continue to develop and refine their processes, particularly in relation to early intervention.
NOT PROTECTIVELY MARKED
NOT PROTECTIVELY MARKED
19
3.2 PUBLIC PROTECTION
• We will safeguard children, young people and vulnerable adults from risk of physical, emotional and sexual abuse or neglect and effectively manage offenders through internal and partnership processes.
Child Protection / Getting It Right For Every Child (GIRFEC) During the reporting period the Force has continued to prepare for the introduction of Visual Recording Interviews (VRI) of child witnesses. This coincides with the updated Scottish Government Guidance on Interviewing of Child Witnesses in Scotland and the arrival of the Visual Recording Equipment. Both elements of the new procedures will go live by 31 March 2012. Staff training in the new guidance and use of VRI equipment across the Force is being coordinated by the Family Protection Unit along with colleagues from Social Work and North East Scotland Child Protection Committee (NESCPC). The introduction VRI will have many benefits, in particular, visually recorded accounts from child witnesses can be used as prior statements, an alternative way in which vulnerable children in the most serious cases can give their main evidence. Work progressed during the quarter in preparation for the opening of the new Moray Child Protection Co-located Unit in Elgin. The building has been jointly funded by Grampian Police and Moray Council, with NHS leasing part of the unit for the Child Protection Nurse Specialist. The new unit marks an important milestone in the strengthening of partnership working in Child Protection and will be the first co-located unit in Scotland, incorporating all three lead agencies, helping to ensure the safety and welfare of children in Moray who are considered at risk of abuse. During the quarter, preparations were made for the follow through joint inspection of services to protect children and young people in the Moray Council area by Her Majesty’s Inspectorate of Education (HMIe). A Moray Division Officer has been assigned to liaise with Moray Council in preparation. The Inspection follows up from the 2009 Inspection of Child Services in Moray which identified six main points for action. A review of the Force Referral Unit was carried out to further enhance GIRFEC activities. In November 2011 the Aberdeen Operational Sub Group of NESCPC was tasked to set up a project to address the strategic objectives set in the external inspection of services to protect children in Aberdeen, carried out by the then Social Care and Social Work Inspectorate Scotland (SCSWIS), which was published in June 2011:
• Ensure that children and families get the help they need quickly.
• Make it easier for people to report concerns about children and ensure that staff respond to these concerns without delay.
The project is being managed by Aberdeen City Council Social Care and Wellbeing Child Protection Lead and is made up of partners including Health, Education, Voluntary Section, SCRA (Scottish Children’s Reporter Administration) and Police.
NOT PROTECTIVELY MARKED
NOT PROTECTIVELY MARKED
20
Managing Offenders During Quarter 3, one application was made under the Sex Offender Community Disclosure Scheme with no resulting disclosures. Adult Protection The afore mentioned review of the FRU, will also enhance adult protection activities. The multi-agency Information Sharing Protocol (ISP) for Adult Protection has received approval from all three of the Grampian Adult Protection Committees and through the Data Sharing Partnership and this ISP will be implemented. This will enhance the data sharing between Police, Local Authority and NHS Grampian in the Protection of adults at risk of harm.
NOT PROTECTIVELY MARKED
NOT PROTECTIVELY MARKED
21
3.3 ROAD CASUALTY REDUCTION
• We will work with partners and the public to achieve road casualty reduction by using the key themes of enforcement, education, engineering and personal responsibility.
ACPOS Scottish Road Policing Framework The ACPOS Scottish Road Policing Framework was published in 2009. Based on five pillars: education, enforcement, engineering, encouragement and evaluation, the framework aims to reduce deaths and injuries on Scotland's roads by 2020. The work undertaken under the framework in quarter 3 is summarised below: Education Operation Zenith 2011 concluded in quarter 3 with a further reduction in motorcycle casualties. During the seven month period of Operation Zenith, motorcycle collisions fell by 9% from 2010. When compared against the baseline figure set in 2009, the Force has seen a 29% reduction in motorcycle collisions. Zenith was recognised at the National Transport Awards receiving a Highly Commended award. Within Aberdeen Division, statistics have shown annual increases in pedestrian serious injury collisions in the over 55 age group. Consequently, the 'Winter Walker' initiative was developed in conjunction with First Group, Morrisons Supermarket and NHS Grampian. Pedestrian safety information was supplied to the identified age group along with their prescriptions. Signage and information was also placed on and within local buses. Enforcement The national Festive Safety Campaign has been the main area of attention during quarter 3, with the focus predominantly on drink and drug driving. The results of the campaign saw an increase in offences compared with the campaign in 2010. 57 drink drivers and 7 drug drivers were detected, compared to 47 drink drivers and no drug drivers last year. In advance of the commencement of the campaign, the Scottish Government announced that it had extended the vehicle forfeiture scheme for drink/drug driving offences for drivers who were three times above the legal limit and for those individuals who failed to provide a specimen at a Police Station. As a result of the offences detected in Force, eight vehicle forfeiture requests were made and are now being processed through the judicial system. Engineering The anticipation that local driving conditions would be affected adversely by snow and ice during quarter 3 did not materialise. Some areas within the Central Belt did see adverse weather conditions, resulting in the Scottish Government activating the newly formed Multi Agency Response Team (MART) several times. The MART includes representation from the emergency services, Scottish Government, Local Authorities and roads authorities who work together to coordinate the response to significant road issues. Should the Grampian area suffer from poor weather conditions, the MART will likely be activated. However, in the meantime, close liaison with north east roads authorities is
NOT PROTECTIVELY MARKED
NOT PROTECTIVELY MARKED
22
being maintained in preparation. Encouragement The Force continues its focus on young drink drivers (17-25 years), Roads Policing have implemented a poster and radio advertisement campaign in Aberdeenshire Division to target this group during the festive safety campaign. The campaign entitled 'Who's Pulling You Tonight?' was supported by drama students from Aberdeen College who posed for posters, which were then distributed through various licensed and other premises. Internal funding allowed for a series of local radio adverts and the initiative attracted a good level of local media interest. Number of persons killed and injured in road accidents (NI) (SOA)
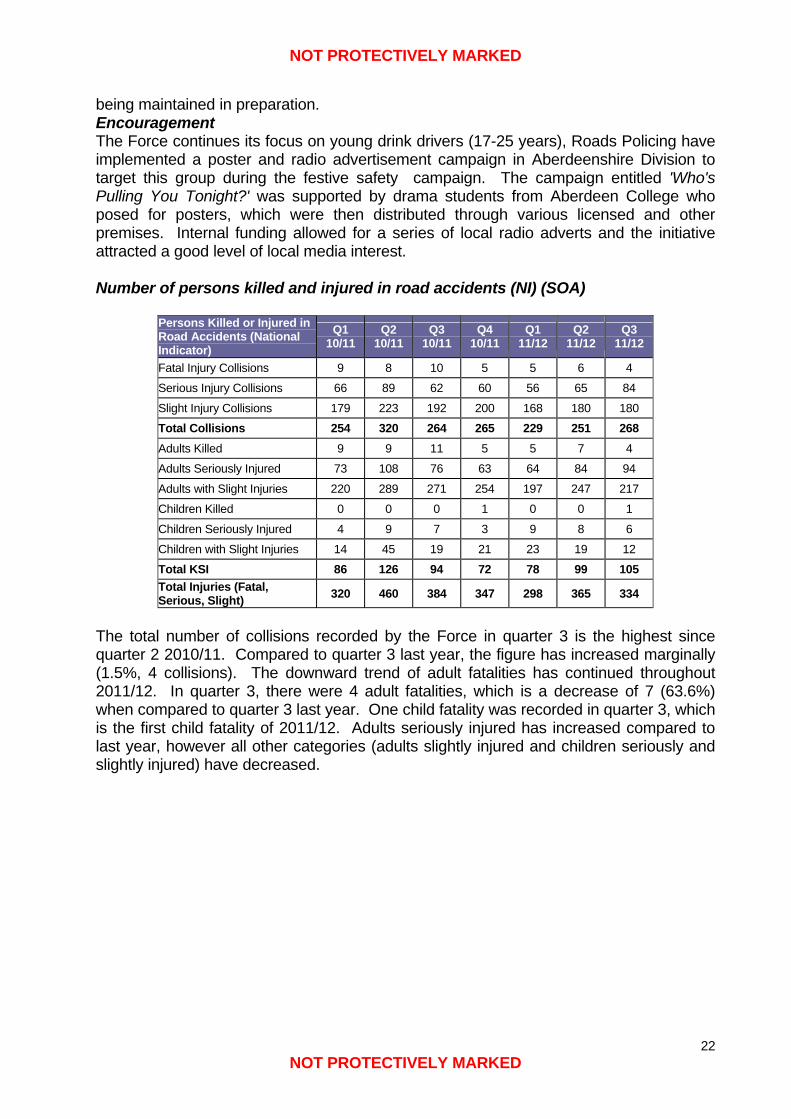
Persons Killed or Injured in Road Accidents (National Indicator)
Q1 10/11
Q2 10/11
Q3 10/11
Q4 10/11
Q1 11/12
Q2 11/12
Q3 11/12
Fatal Injury Collisions 9 8 10 5 5 6 4
Serious Injury Collisions 66 89 62 60 56 65 84
Slight Injury Collisions 179 223 192 200 168 180 180
Total Collisions 254 320 264 265 229 251 268 Adults Killed 9 9 11 5 5 7 4
Adults Seriously Injured 73 108 76 63 64 84 94
Adults with Slight Injuries 220 289 271 254 197 247 217
Children Killed 0 0 0 1 0 0 1
Children Seriously Injured 4 9 7 3 9 8 6
Children with Slight Injuries 14 45 19 21 23 19 12
Total KSI 86 126 94 72 78 99 105 Total Injuries (Fatal, Serious, Slight) 320 460 384 347 298 365 334
The total number of collisions recorded by the Force in quarter 3 is the highest since quarter 2 2010/11. Compared to quarter 3 last year, the figure has increased marginally (1.5%, 4 collisions). The downward trend of adult fatalities has continued throughout 2011/12. In quarter 3, there were 4 adult fatalities, which is a decrease of 7 (63.6%) when compared to quarter 3 last year. One child fatality was recorded in quarter 3, which is the first child fatality of 2011/12. Adults seriously injured has increased compared to last year, however all other categories (adults slightly injured and children seriously and slightly injured) have decreased.
NOT PROTECTIVELY MARKED
NOT PROTECTIVELY MARKED
23
3.4 OTHER INDICATORS National Comparisons Performance data for national comparisons relates to quarter 1 and 2 2011/12 and is taken from the ACPOS Police Service in Scotland Performance Report Quarter 2 2011/12. In comparison to all other Scottish Forces, the Force recorded offences above the Scottish average per 10,000 members of the population for group 2. Groups, 1, 3 and 4 were below the Scottish average. The detection rate in group 2 was below the Scottish average, with detection rates in 1, 3 and 4 all above the Scottish average. The number of offences recorded under groups 5, 6 and 7 are impacted upon by the level of law enforcement activity against each group. As this level of activity varies across Forces dependent on their individual priorities and resource deployment, no national comparisons have been included for these crime groups. Number of recorded crimes and offences (NI)
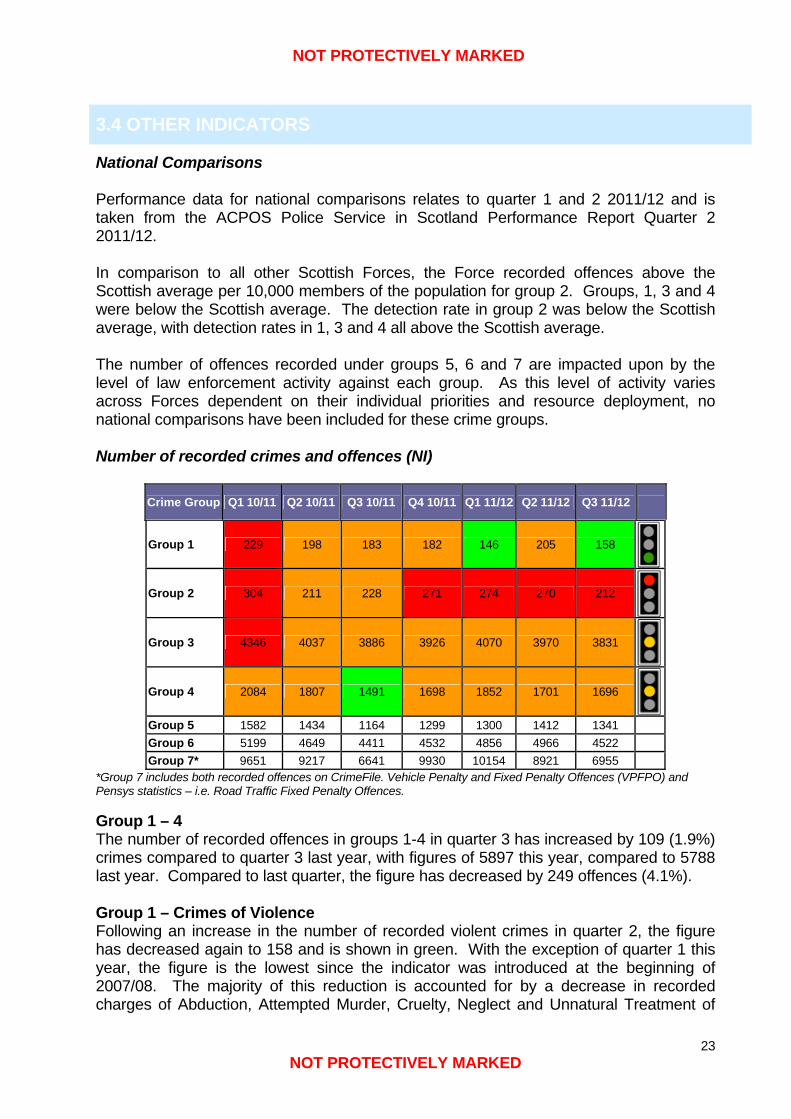
Crime Group Q1 10/11 Q2 10/11 Q3 10/11 Q4 10/11 Q1 11/12 Q2 11/12 Q3 11/12
Group 1 229 198 183 182 146 205 158
Group 2 304 211 228 271 274 270 212
Group 3 4346 4037 3886 3926 4070 3970 3831
Group 4 2084 1807 1491 1698 1852 1701 1696
Group 5 1582 1434 1164 1299 1300 1412 1341 Group 6 5199 4649 4411 4532 4856 4966 4522 Group 7* 9651 9217 6641 9930 10154 8921 6955
*Group 7 includes both recorded offences on CrimeFile. Vehicle Penalty and Fixed Penalty Offences (VPFPO) and Pensys statistics – i.e. Road Traffic Fixed Penalty Offences.
Group 1 – 4 The number of recorded offences in groups 1-4 in quarter 3 has increased by 109 (1.9%) crimes compared to quarter 3 last year, with figures of 5897 this year, compared to 5788 last year. Compared to last quarter, the figure has decreased by 249 offences (4.1%). Group 1 – Crimes of Violence Following an increase in the number of recorded violent crimes in quarter 2, the figure has decreased again to 158 and is shown in green. With the exception of quarter 1 this year, the figure is the lowest since the indicator was introduced at the beginning of 2007/08. The majority of this reduction is accounted for by a decrease in recorded charges of Abduction, Attempted Murder, Cruelty, Neglect and Unnatural Treatment of
NOT PROTECTIVELY MARKED
NOT PROTECTIVELY MARKED
24
Children, Serious Assault and Threats and Extortion. Group 2 – Crimes of Indecency The quarter 3 figure of 212 for recorded sexual offences is the lowest figure since quarter 2 2010/11. Given the introduction of the new Sexual Offences legislation in quarter 3 last year and the resultant increase in offences in this group, this decrease should be regarded as positive. A large part of this reduction is accounted for by a decrease in Prostitution offences, as a result of Operation Begonia5. The baseline figure for group 2 is 211 and so, the figure is only 1 crime away from being shown in amber. Group 3 – Crimes of Dishonesty The number of recorded offences in group 3 is the lowest since quarter 4 2009/10. Compared to quarter 2 this year, the figure has reduced by 139 offences (3.5%). The main reductions have been in Theft by Housebreakings, Shoplifting offences and Theft of Pedal Cycles. Compared to quarter 3 last year, the figure has reduced marginally by 55 crimes (1.4%). During December 2011, the Force held an event to raise awareness of bicycle security in an attempt to reduce the number of bicycle thefts. A review of recorded crimes to ensure accurate recording has also contributed to the decrease in offences. Group 4 – Fire-raising, Malicious and Reckless Conduct (including Vandalism) Group 4 crimes continue to show a positive downward trend. The quarter 3 figure from 2010/11 stands in stark contrast to other quarters, where the figure was significantly lower as a result of bad weather at the end of 2010. Group 5 – Other Crimes (including Resisting Arrest, Obstruction, Perverting the Course of Justice, Bail Offences and Drugs Offences) Compared to quarter 2, the number of crimes recorded in group 5 has decreased by 71 offences (5.0%). More than half (39) of this reduction is accounted for by a decrease in possession of drugs charges. Compared to quarter 3 last year, the figure has increased by 177 offences (15.2%). Group 6 – Miscellaneous Offences (including Minor Assault, Breach of the Peace, Racially Aggravated Offences, Licensing Offences and Telecommunications Offences) Compared to quarter 2, the figure has decreased by 444 offences (8.9%). The majority of this decrease is accounted for by fewer charges of Minor Assault, Breach of the Peace and Threatening and Abusive Behaviour. It should be noted that the quarter 2 figure was the highest recorded figure since quarter 1 2010/11. Group 7 – Offences Relating to Motor Vehicles Compared to quarter 2 this year, the figure has decreased by 1966 offences (22.0%). The most significant reductions have been in speeding offences, as well as seat belt and mobile phone offences. Operational focus throughout this period remained constant and there is no obvious explanation for this reduction. Analysis shows that the seat belt and speeding offences decreased during the same quarter last year, suggesting a seasonal trend, which might affect the number of offences picked up in patrols during the hours of darkness. 5 Operation Begonia involved working alongside partner agencies to try to encourage street workers away from prostitution.
NOT PROTECTIVELY MARKED
NOT PROTECTIVELY MARKED
25
Detection Rate for Recorded Crimes and Offences (NI)
Crime Group Q1 10/11 Q2 10/11 Q3 10/11 Q4 10/11 Q1 11/12 Q2 11/12 Q3 11/12
Group 1 81.2% 76.3% 82.0% 81.3% 78.8% 83.4% 86.1%
Group 2 65.8% 55.5% 53.9% 58.3% 59.9% 63.0% 56.1%
Group 3 38.3% 35.4% 40.8% 35.6% 37.1% 36.5% 37.6%
Group 4 30.6% 28.3% 34.3% 33.9% 29.2% 30.3% 28.5%
Group 5 99.2% 100.8% 97.8% 95.1% 98.0% 94.8% 94.7%
Group 6 69.3% 74.4% 75.7% 74.1% 74.0% 72.3% 76.3%
Group 7* 95.0% 95.0% 93.7% 96.2% 97.4% 95.4% 95.6%
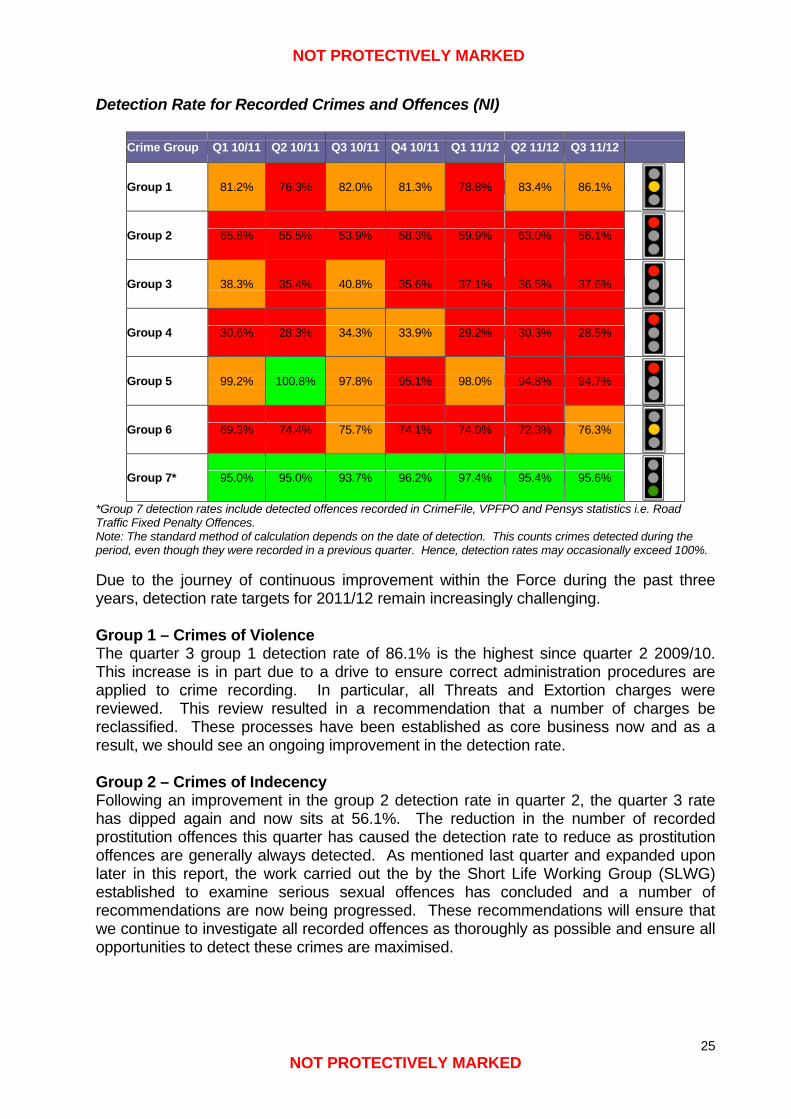
*Group 7 detection rates include detected offences recorded in CrimeFile, VPFPO and Pensys statistics i.e. Road Traffic Fixed Penalty Offences. Note: The standard method of calculation depends on the date of detection. This counts crimes detected during the period, even though they were recorded in a previous quarter. Hence, detection rates may occasionally exceed 100%.
Due to the journey of continuous improvement within the Force during the past three years, detection rate targets for 2011/12 remain increasingly challenging. Group 1 – Crimes of Violence The quarter 3 group 1 detection rate of 86.1% is the highest since quarter 2 2009/10. This increase is in part due to a drive to ensure correct administration procedures are applied to crime recording. In particular, all Threats and Extortion charges were reviewed. This review resulted in a recommendation that a number of charges be reclassified. These processes have been established as core business now and as a result, we should see an ongoing improvement in the detection rate. Group 2 – Crimes of Indecency Following an improvement in the group 2 detection rate in quarter 2, the quarter 3 rate has dipped again and now sits at 56.1%. The reduction in the number of recorded prostitution offences this quarter has caused the detection rate to reduce as prostitution offences are generally always detected. As mentioned last quarter and expanded upon later in this report, the work carried out the by the Short Life Working Group (SLWG) established to examine serious sexual offences has concluded and a number of recommendations are now being progressed. These recommendations will ensure that we continue to investigate all recorded offences as thoroughly as possible and ensure all opportunities to detect these crimes are maximised.
NOT PROTECTIVELY MARKED
NOT PROTECTIVELY MARKED
26
Group 3 – Crimes of Dishonesty Accompanying the fall in crime numbers, the group 3 detection rate has improved compared to last quarter and is now at the highest rate for the last 4 quarters. Group 4 – Fire-raising, Malicious and Reckless Conduct The quarter 3 detection rate for group 4 crimes is 28.5%. This is the lowest recorded rate since quarter 2 2010/11. As mentioned earlier in the report, part of this decrease can be attributed to a fall in the detection rate for Fireraising offences. Group 5 – Other Crimes The group 5 detection rate has remained very similar to the quarter 2 rate, at 94.7%. The detection rate for drug supply offences has been lower in the last quarters than in previous quarters. This is in part due to a backlog of drugs awaiting forensic analysis. In addition, we have recently entered into a partnership where we are alerted to and subsequently commence enquiries into drug packages destined for Aberdeen which have originated from outwith the UK. The difficulties with identifying the origin of these packages, means detecting these offences is particularly challenging. Group 6 – Miscellaneous Offences Following 3 quarters in red, the detection rate for quarter 3 is now above the baseline at 76.3%. This detection rate is the highest recorded since quarter 3 2009/10. Group 7 – Offences Relating to Motor Vehicles The group 7 detection rate increased slightly in quarter 3 to 95.6%. Number of racist incidents, racially motivated crimes and offences and detection rates (NI) (SOA)
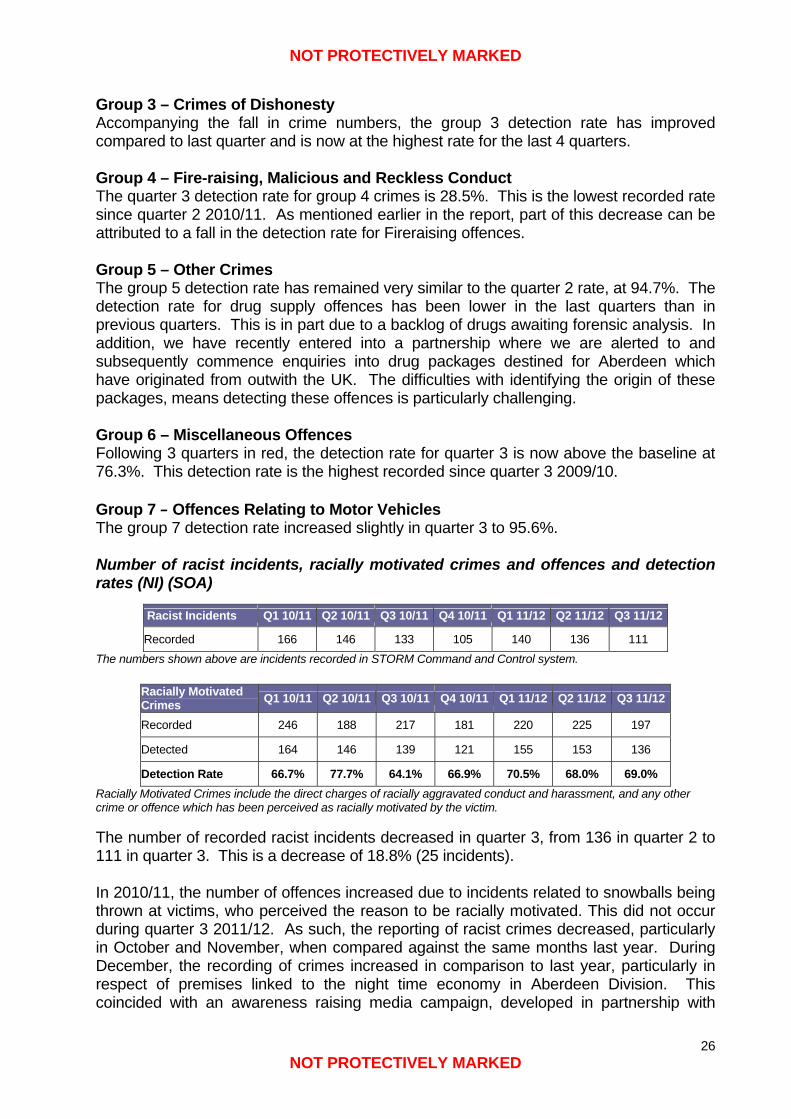
Racist Incidents Q1 10/11 Q2 10/11 Q3 10/11 Q4 10/11 Q1 11/12 Q2 11/12 Q3 11/12
Recorded 166 146 133 105 140 136 111 The numbers shown above are incidents recorded in STORM Command and Control system.
Racially Motivated Crimes Q1 10/11 Q2 10/11 Q3 10/11 Q4 10/11 Q1 11/12 Q2 11/12 Q3 11/12
Recorded 246 188 217 181 220 225 197
Detected 164 146 139 121 155 153 136
Detection Rate 66.7% 77.7% 64.1% 66.9% 70.5% 68.0% 69.0% Racially Motivated Crimes include the direct charges of racially aggravated conduct and harassment, and any other crime or offence which has been perceived as racially motivated by the victim. The number of recorded racist incidents decreased in quarter 3, from 136 in quarter 2 to 111 in quarter 3. This is a decrease of 18.8% (25 incidents). In 2010/11, the number of offences increased due to incidents related to snowballs being thrown at victims, who perceived the reason to be racially motivated. This did not occur during quarter 3 2011/12. As such, the reporting of racist crimes decreased, particularly in October and November, when compared against the same months last year. During December, the recording of crimes increased in comparison to last year, particularly in respect of premises linked to the night time economy in Aberdeen Division. This coincided with an awareness raising media campaign, developed in partnership with
NOT PROTECTIVELY MARKED
NOT PROTECTIVELY MARKED
27
Grampian Regional Equality Council. Also of note is the timing of the festive season, which led to two particularly busy, consecutive weekends. Number of Special Constables and hours they are on duty (NI)
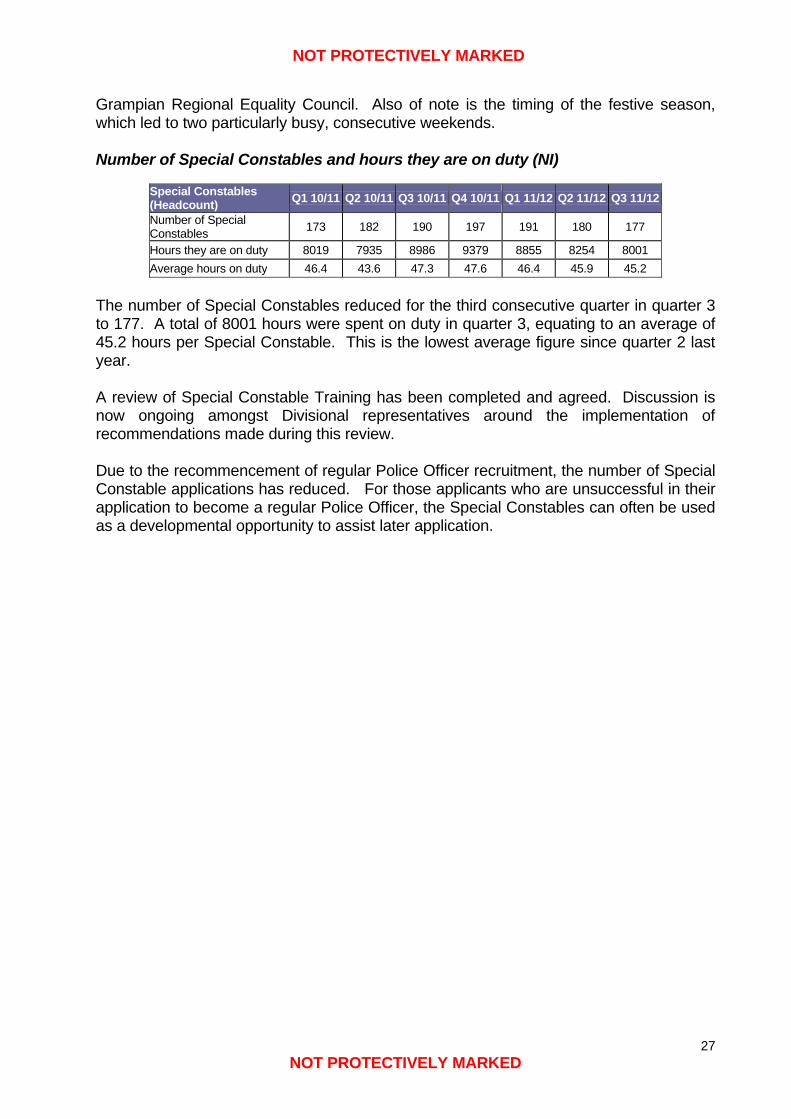
Special Constables (Headcount) Q1 10/11 Q2 10/11 Q3 10/11 Q4 10/11 Q1 11/12 Q2 11/12 Q3 11/12
Number of Special Constables 173 182 190 197 191 180 177
Hours they are on duty 8019 7935 8986 9379 8855 8254 8001 Average hours on duty 46.4 43.6 47.3 47.6 46.4 45.9 45.2
The number of Special Constables reduced for the third consecutive quarter in quarter 3 to 177. A total of 8001 hours were spent on duty in quarter 3, equating to an average of 45.2 hours per Special Constable. This is the lowest average figure since quarter 2 last year. A review of Special Constable Training has been completed and agreed. Discussion is now ongoing amongst Divisional representatives around the implementation of recommendations made during this review. Due to the recommencement of regular Police Officer recruitment, the number of Special Constable applications has reduced. For those applicants who are unsuccessful in their application to become a regular Police Officer, the Special Constables can often be used as a developmental opportunity to assist later application.
NOT PROTECTIVELY MARKED
NOT PROTECTIVELY MARKED
28
4. CRIMINAL JUSTICE & TACKLING CRIME The Force Priorities in this area are Serious Organised Crime and Drugs (SOC&D) and Community Focus (Violence strand) and National Security. 4.1 SERIOUS ORGANISED CRIME AND DRUGS
• We will reduce harm caused by Serious Organised Crime and Drugs and in particular, Controlled Drugs, within the communities we serve.
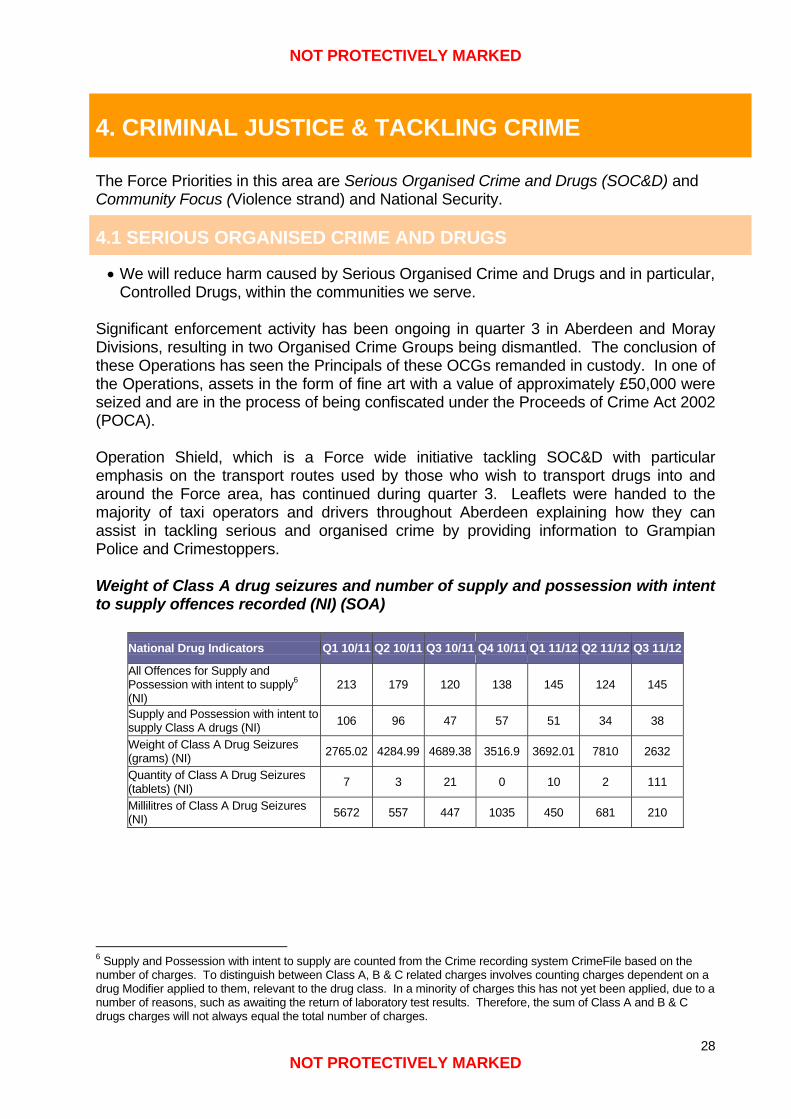
Significant enforcement activity has been ongoing in quarter 3 in Aberdeen and Moray Divisions, resulting in two Organised Crime Groups being dismantled. The conclusion of these Operations has seen the Principals of these OCGs remanded in custody. In one of the Operations, assets in the form of fine art with a value of approximately £50,000 were seized and are in the process of being confiscated under the Proceeds of Crime Act 2002 (POCA). Operation Shield, which is a Force wide initiative tackling SOC&D with particular emphasis on the transport routes used by those who wish to transport drugs into and around the Force area, has continued during quarter 3. Leaflets were handed to the majority of taxi operators and drivers throughout Aberdeen explaining how they can assist in tackling serious and organised crime by providing information to Grampian Police and Crimestoppers. Weight of Class A drug seizures and number of supply and possession with intent to supply offences recorded (NI) (SOA)
National Drug Indicators Q1 10/11 Q2 10/11 Q3 10/11 Q4 10/11 Q1 11/12 Q2 11/12 Q3 11/12
All Offences for Supply and Possession with intent to supply6 (NI)
213 179 120 138 145 124 145
Supply and Possession with intent to supply Class A drugs (NI) 106 96 47 57 51 34 38
Weight of Class A Drug Seizures (grams) (NI) 2765.02 4284.99 4689.38 3516.9 3692.01 7810 2632
Quantity of Class A Drug Seizures (tablets) (NI) 7 3 21 0 10 2 111
Millilitres of Class A Drug Seizures (NI) 5672 557 447 1035 450 681 210
6 Supply and Possession with intent to supply are counted from the Crime recording system CrimeFile based on the number of charges. To distinguish between Class A, B & C related charges involves counting charges dependent on a drug Modifier applied to them, relevant to the drug class. In a minority of charges this has not yet been applied, due to a number of reasons, such as awaiting the return of laboratory test results. Therefore, the sum of Class A and B & C drugs charges will not always equal the total number of charges.
NOT PROTECTIVELY MARKED
NOT PROTECTIVELY MARKED
29
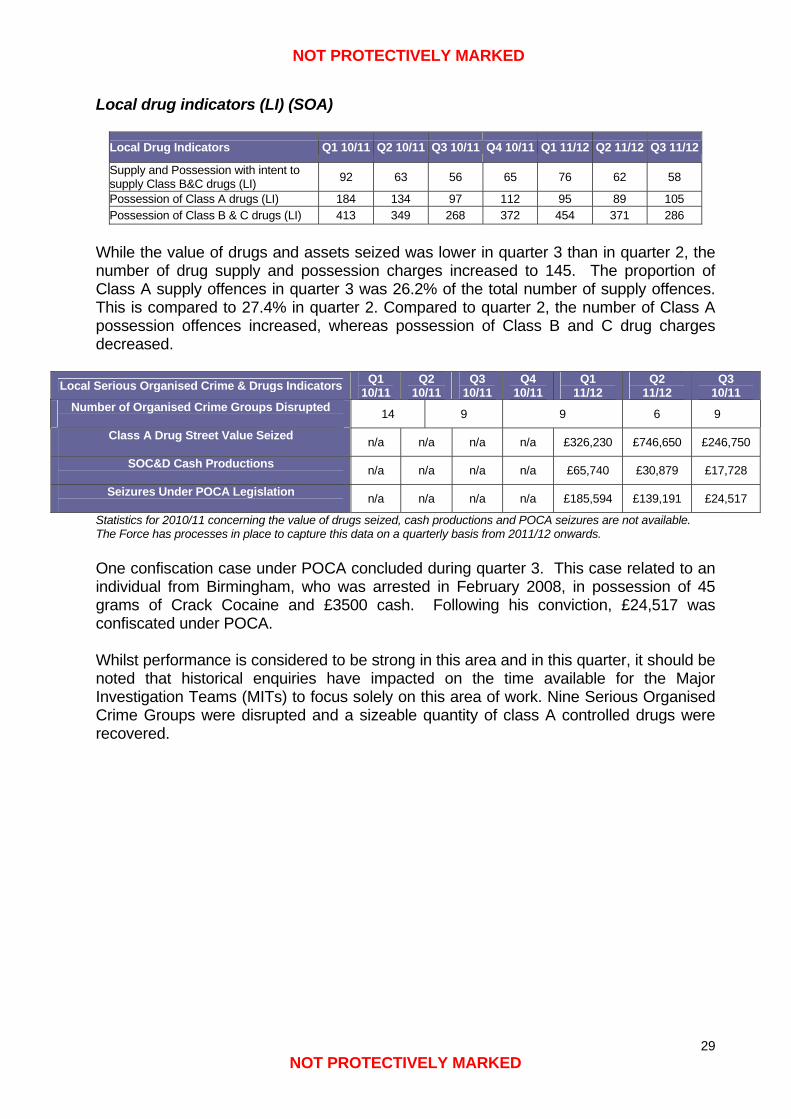
Local drug indicators (LI) (SOA)
Local Drug Indicators Q1 10/11 Q2 10/11 Q3 10/11 Q4 10/11 Q1 11/12 Q2 11/12 Q3 11/12
Supply and Possession with intent to supply Class B&C drugs (LI) 92 63 56 65 76 62 58
Possession of Class A drugs (LI) 184 134 97 112 95 89 105 Possession of Class B & C drugs (LI) 413 349 268 372 454 371 286
While the value of drugs and assets seized was lower in quarter 3 than in quarter 2, the number of drug supply and possession charges increased to 145. The proportion of Class A supply offences in quarter 3 was 26.2% of the total number of supply offences. This is compared to 27.4% in quarter 2. Compared to quarter 2, the number of Class A possession offences increased, whereas possession of Class B and C drug charges decreased.
Local Serious Organised Crime & Drugs Indicators Q1 10/11
Q2 10/11
Q3 10/11
Q4 10/11
Q1 11/12
Q2 11/12
Q3 10/11
Number of Organised Crime Groups Disrupted 14 9 9 6 9
Class A Drug Street Value Seized n/a n/a n/a n/a £326,230 £746,650 £246,750
SOC&D Cash Productions n/a n/a n/a n/a £65,740 £30,879 £17,728
Seizures Under POCA Legislation n/a n/a n/a n/a £185,594 £139,191 £24,517
Statistics for 2010/11 concerning the value of drugs seized, cash productions and POCA seizures are not available. The Force has processes in place to capture this data on a quarterly basis from 2011/12 onwards. One confiscation case under POCA concluded during quarter 3. This case related to an individual from Birmingham, who was arrested in February 2008, in possession of 45 grams of Crack Cocaine and £3500 cash. Following his conviction, £24,517 was confiscated under POCA. Whilst performance is considered to be strong in this area and in this quarter, it should be noted that historical enquiries have impacted on the time available for the Major Investigation Teams (MITs) to focus solely on this area of work. Nine Serious Organised Crime Groups were disrupted and a sizeable quantity of class A controlled drugs were recovered.
NOT PROTECTIVELY MARKED
NOT PROTECTIVELY MARKED
30
4.2 VIOLENCE
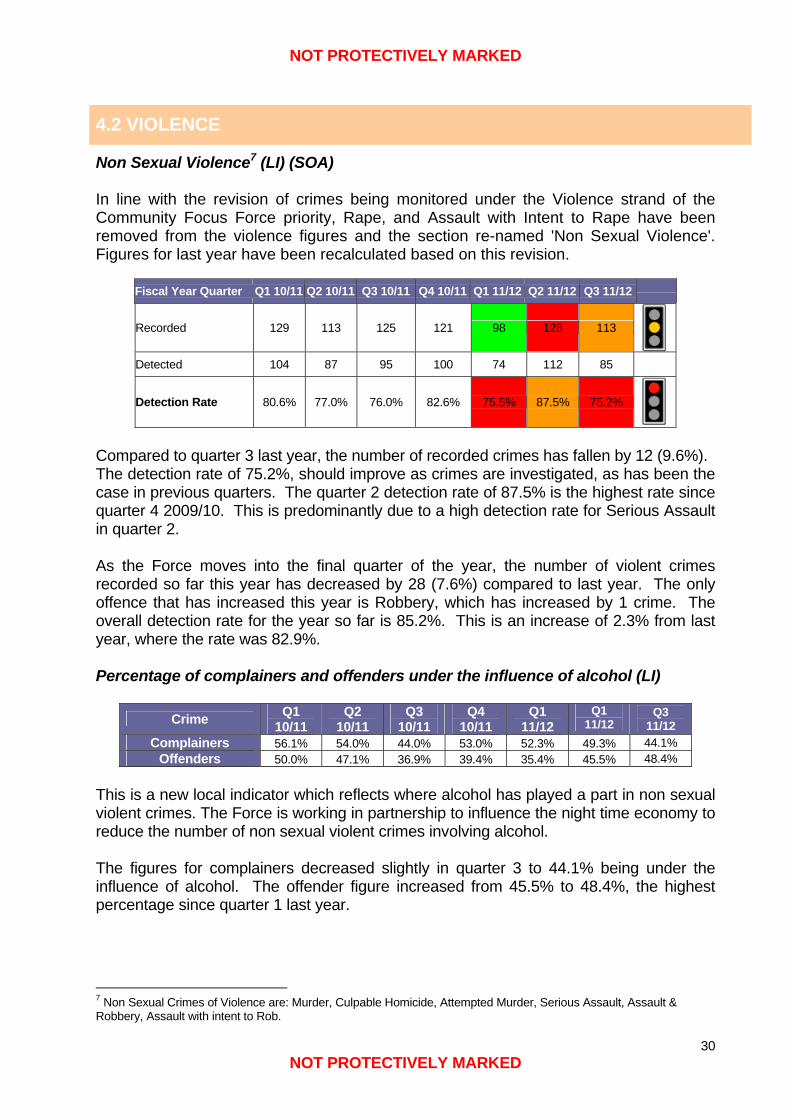
Non Sexual Violence7 (LI) (SOA) In line with the revision of crimes being monitored under the Violence strand of the Community Focus Force priority, Rape, and Assault with Intent to Rape have been removed from the violence figures and the section re-named 'Non Sexual Violence'. Figures for last year have been recalculated based on this revision.
Fiscal Year Quarter Q1 10/11 Q2 10/11 Q3 10/11 Q4 10/11 Q1 11/12 Q2 11/12 Q3 11/12
Recorded 129 113 125 121 98 128 113
Detected 104 87 95 100 74 112 85
Detection Rate 80.6% 77.0% 76.0% 82.6% 75.5% 87.5% 75.2%
Compared to quarter 3 last year, the number of recorded crimes has fallen by 12 (9.6%). The detection rate of 75.2%, should improve as crimes are investigated, as has been the case in previous quarters. The quarter 2 detection rate of 87.5% is the highest rate since quarter 4 2009/10. This is predominantly due to a high detection rate for Serious Assault in quarter 2. As the Force moves into the final quarter of the year, the number of violent crimes recorded so far this year has decreased by 28 (7.6%) compared to last year. The only offence that has increased this year is Robbery, which has increased by 1 crime. The overall detection rate for the year so far is 85.2%. This is an increase of 2.3% from last year, where the rate was 82.9%. Percentage of complainers and offenders under the influence of alcohol (LI)
Crime Q1 10/11
Q2 10/11
Q3 10/11
Q4 10/11
Q1 11/12
Q1 11/12
Q3 11/12
Complainers 56.1% 54.0% 44.0% 53.0% 52.3% 49.3% 44.1% Offenders 50.0% 47.1% 36.9% 39.4% 35.4% 45.5% 48.4%
This is a new local indicator which reflects where alcohol has played a part in non sexual violent crimes. The Force is working in partnership to influence the night time economy to reduce the number of non sexual violent crimes involving alcohol. The figures for complainers decreased slightly in quarter 3 to 44.1% being under the influence of alcohol. The offender figure increased from 45.5% to 48.4%, the highest percentage since quarter 1 last year.
7 Non Sexual Crimes of Violence are: Murder, Culpable Homicide, Attempted Murder, Serious Assault, Assault & Robbery, Assault with intent to Rob.
NOT PROTECTIVELY MARKED
NOT PROTECTIVELY MARKED
31
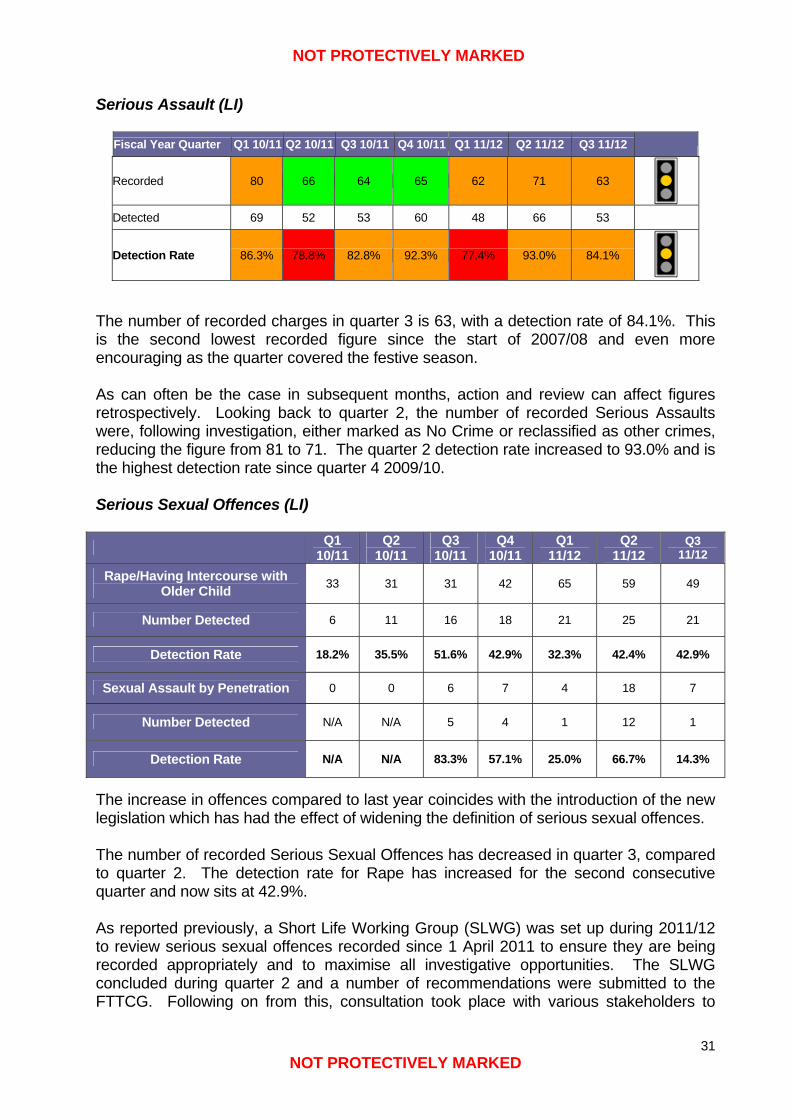
Serious Assault (LI)
Fiscal Year Quarter Q1 10/11 Q2 10/11 Q3 10/11 Q4 10/11 Q1 11/12 Q2 11/12 Q3 11/12
Recorded 80 66 64 65 62 71 63
Detected 69 52 53 60 48 66 53
Detection Rate 86.3% 78.8% 82.8% 92.3% 77.4% 93.0% 84.1%
The number of recorded charges in quarter 3 is 63, with a detection rate of 84.1%. This is the second lowest recorded figure since the start of 2007/08 and even more encouraging as the quarter covered the festive season. As can often be the case in subsequent months, action and review can affect figures retrospectively. Looking back to quarter 2, the number of recorded Serious Assaults were, following investigation, either marked as No Crime or reclassified as other crimes, reducing the figure from 81 to 71. The quarter 2 detection rate increased to 93.0% and is the highest detection rate since quarter 4 2009/10. Serious Sexual Offences (LI)
Q1 10/11
Q2 10/11
Q3 10/11
Q4 10/11
Q1 11/12
Q2 11/12
Q3 11/12
Rape/Having Intercourse with Older Child 33 31 31 42 65 59 49
Number Detected 6 11 16 18 21 25 21
Detection Rate 18.2% 35.5% 51.6% 42.9% 32.3% 42.4% 42.9%
Sexual Assault by Penetration 0 0 6 7 4 18 7
Number Detected N/A N/A 5 4 1 12 1
Detection Rate N/A N/A 83.3% 57.1% 25.0% 66.7% 14.3%
The increase in offences compared to last year coincides with the introduction of the new legislation which has had the effect of widening the definition of serious sexual offences. The number of recorded Serious Sexual Offences has decreased in quarter 3, compared to quarter 2. The detection rate for Rape has increased for the second consecutive quarter and now sits at 42.9%. As reported previously, a Short Life Working Group (SLWG) was set up during 2011/12 to review serious sexual offences recorded since 1 April 2011 to ensure they are being recorded appropriately and to maximise all investigative opportunities. The SLWG concluded during quarter 2 and a number of recommendations were submitted to the FTTCG. Following on from this, consultation took place with various stakeholders to
NOT PROTECTIVELY MARKED
NOT PROTECTIVELY MARKED
32
introduce a number of these recommendations. This should ensure a greater degree of consistency and management in terms of the investigative process across the Force and also that all possible lines of enquiry have been identified and pursued. These key recommendations are to be implemented by 31 March 2012, however work is progressing to the extent that these should implemented in advance of this date. Robbery (LI)
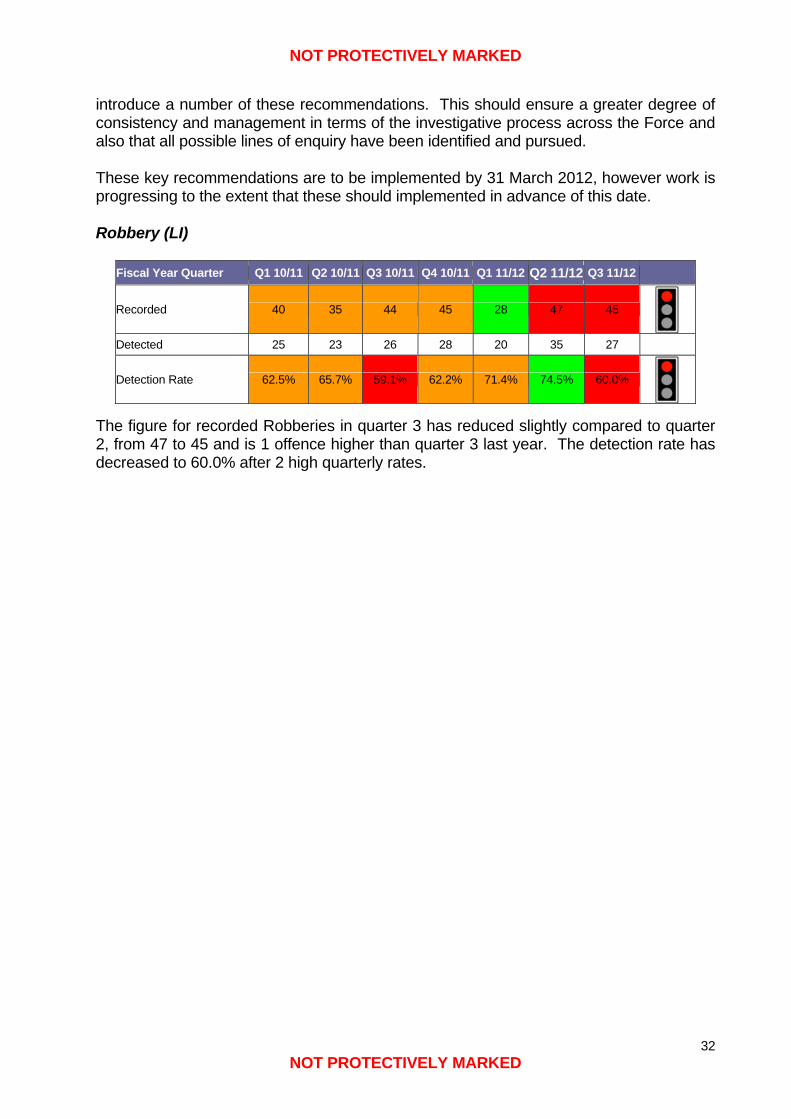
Fiscal Year Quarter Q1 10/11 Q2 10/11 Q3 10/11 Q4 10/11 Q1 11/12 Q2 11/12 Q3 11/12
Recorded 40 35 44 45 28 47 45
Detected 25 23 26 28 20 35 27
Detection Rate 62.5% 65.7% 59.1% 62.2% 71.4% 74.5% 60.0%
The figure for recorded Robberies in quarter 3 has reduced slightly compared to quarter 2, from 47 to 45 and is 1 offence higher than quarter 3 last year. The detection rate has decreased to 60.0% after 2 high quarterly rates.
NOT PROTECTIVELY MARKED
NOT PROTECTIVELY MARKED
33
4.3 OTHER INDICATORS Number and percentage of reports submitted to the Procurator Fiscal within 28 calendar days (NI)
01000200030004000500060007000
2007Q1
2007Q2
2007Q3
2007Q4
2008Q1
2008Q2
2008Q3
2008Q4
2009Q1
2009Q2
2009Q3
2009Q4
2010Q1
2010Q2
2010Q3
2010Q4
2011Q1
2011Q2
2011Q3
Fiscal Year Quarter
Rep
orts
82%84%86%88%90%92%94%96%98%
% on Target
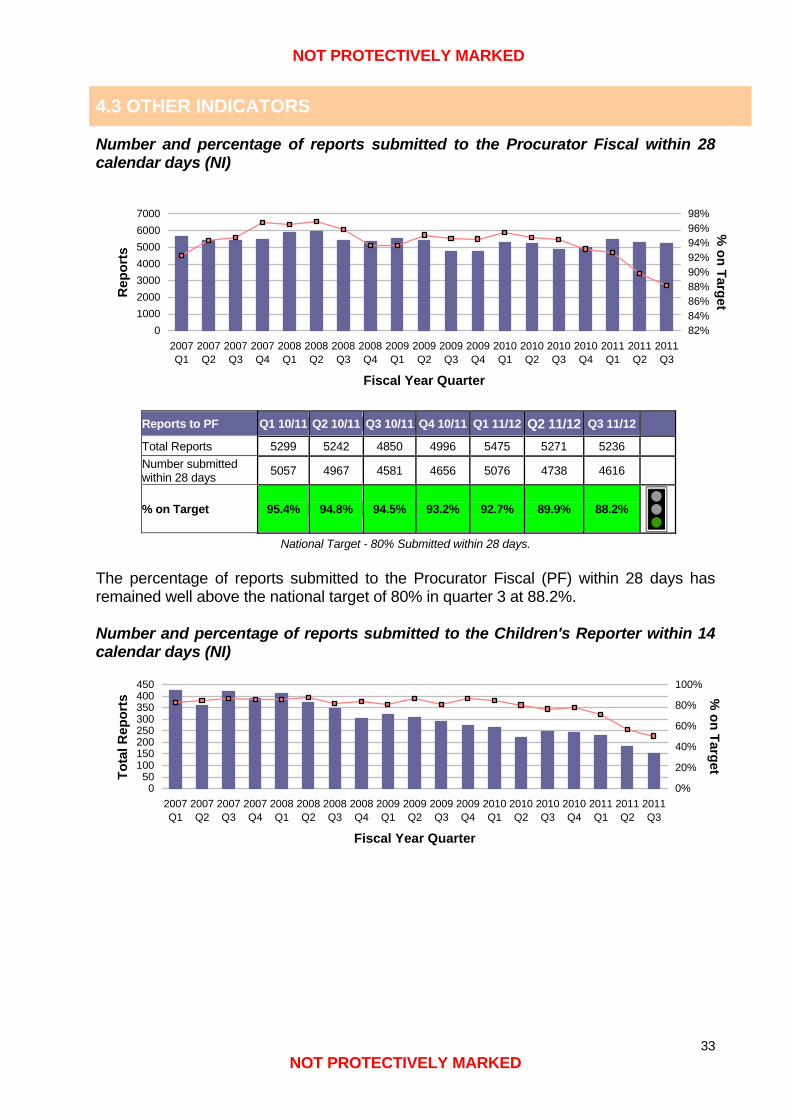
National Target - 80% Submitted within 28 days. The percentage of reports submitted to the Procurator Fiscal (PF) within 28 days has remained well above the national target of 80% in quarter 3 at 88.2%. Number and percentage of reports submitted to the Children's Reporter within 14 calendar days (NI)
050
100150200250300350400450
2007Q1
2007Q2
2007Q3
2007Q4
2008Q1
2008Q2
2008Q3
2008Q4
2009Q1
2009Q2
2009Q3
2009Q4
2010Q1
2010Q2
2010Q3
2010Q4
2011Q1
2011Q2
2011Q3
Fiscal Year Quarter
Tota
l Rep
orts
0%
20%
40%
60%
80%
100%
% on Target
Reports to PF Q1 10/11 Q2 10/11 Q3 10/11 Q4 10/11 Q1 11/12 Q2 11/12 Q3 11/12
Total Reports 5299 5242 4850 4996 5475 5271 5236 Number submitted within 28 days 5057 4967 4581 4656 5076 4738 4616
% on Target 95.4% 94.8% 94.5% 93.2% 92.7% 89.9% 88.2%
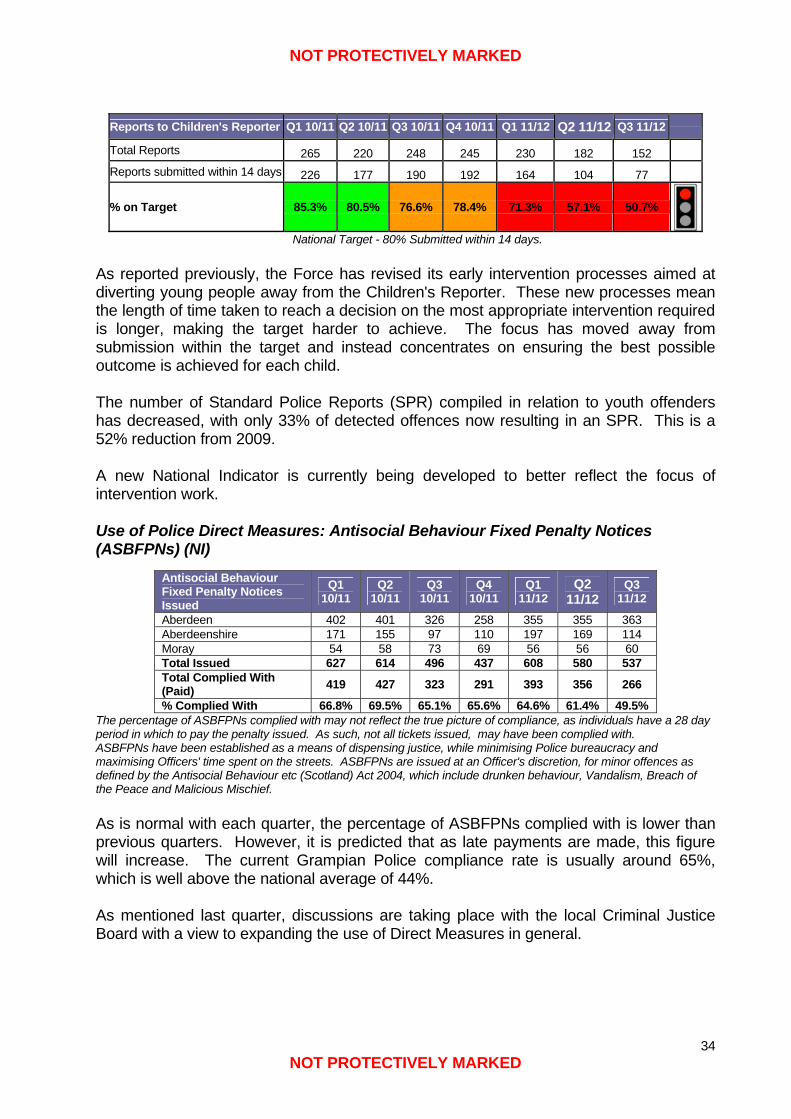
NOT PROTECTIVELY MARKED
NOT PROTECTIVELY MARKED
34
Reports to Children's Reporter Q1 10/11 Q2 10/11 Q3 10/11 Q4 10/11 Q1 11/12 Q2 11/12 Q3 11/12
Total Reports 265 220 248 245 230 182 152
Reports submitted within 14 days 226 177 190 192 164 104 77
% on Target 85.3% 80.5% 76.6% 78.4% 71.3% 57.1% 50.7%
National Target - 80% Submitted within 14 days. As reported previously, the Force has revised its early intervention processes aimed at diverting young people away from the Children's Reporter. These new processes mean the length of time taken to reach a decision on the most appropriate intervention required is longer, making the target harder to achieve. The focus has moved away from submission within the target and instead concentrates on ensuring the best possible outcome is achieved for each child. The number of Standard Police Reports (SPR) compiled in relation to youth offenders has decreased, with only 33% of detected offences now resulting in an SPR. This is a 52% reduction from 2009. A new National Indicator is currently being developed to better reflect the focus of intervention work. Use of Police Direct Measures: Antisocial Behaviour Fixed Penalty Notices (ASBFPNs) (NI)
Antisocial Behaviour Fixed Penalty Notices Issued
Q1 10/11
Q2 10/11
Q3 10/11
Q4 10/11
Q1 11/12
Q2 11/12
Q3 11/12
Aberdeen 402 401 326 258 355 355 363 Aberdeenshire 171 155 97 110 197 169 114 Moray 54 58 73 69 56 56 60 Total Issued 627 614 496 437 608 580 537 Total Complied With (Paid) 419 427 323 291 393 356 266
% Complied With 66.8% 69.5% 65.1% 65.6% 64.6% 61.4% 49.5% The percentage of ASBFPNs complied with may not reflect the true picture of compliance, as individuals have a 28 day period in which to pay the penalty issued. As such, not all tickets issued, may have been complied with. ASBFPNs have been established as a means of dispensing justice, while minimising Police bureaucracy and maximising Officers' time spent on the streets. ASBFPNs are issued at an Officer's discretion, for minor offences as defined by the Antisocial Behaviour etc (Scotland) Act 2004, which include drunken behaviour, Vandalism, Breach of the Peace and Malicious Mischief. As is normal with each quarter, the percentage of ASBFPNs complied with is lower than previous quarters. However, it is predicted that as late payments are made, this figure will increase. The current Grampian Police compliance rate is usually around 65%, which is well above the national average of 44%. As mentioned last quarter, discussions are taking place with the local Criminal Justice Board with a view to expanding the use of Direct Measures in general.
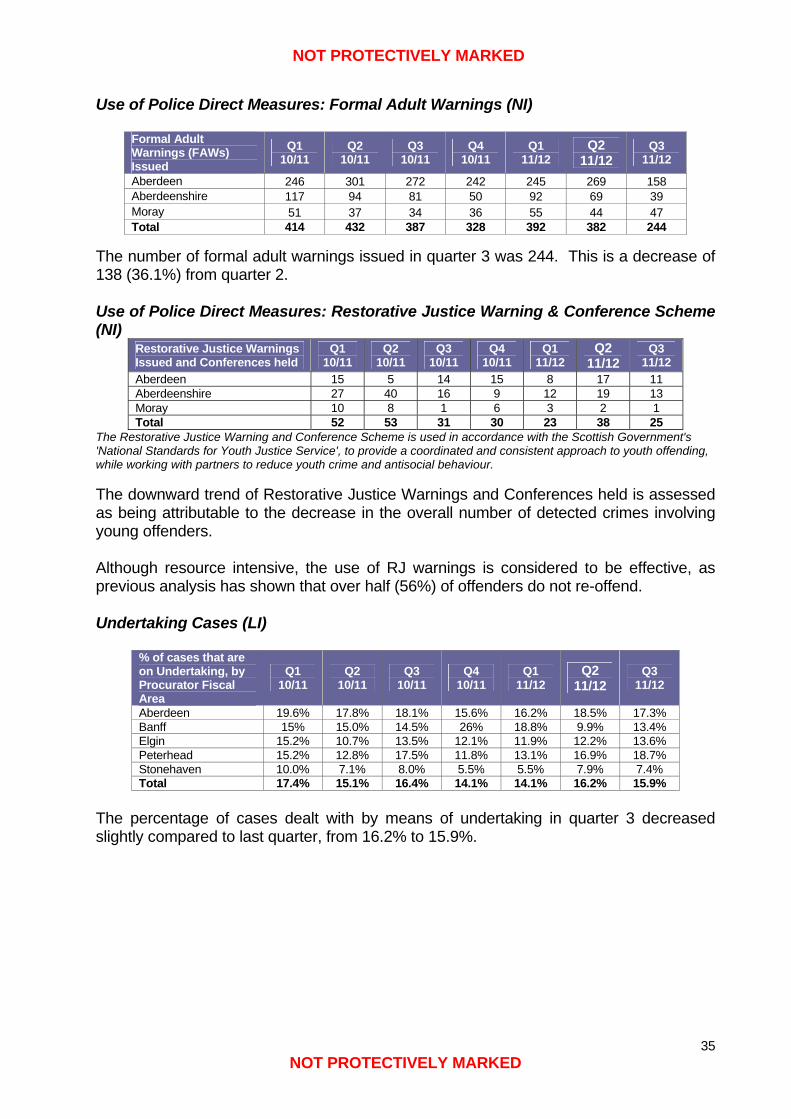
NOT PROTECTIVELY MARKED
NOT PROTECTIVELY MARKED
35
Use of Police Direct Measures: Formal Adult Warnings (NI)
Formal Adult Warnings (FAWs) Issued
Q1 10/11
Q2 10/11
Q3 10/11
Q4 10/11
Q1 11/12
Q2 11/12
Q3 11/12
Aberdeen 246 301 272 242 245 269 158 Aberdeenshire 117 94 81 50 92 69 39 Moray 51 37 34 36 55 44 47 Total 414 432 387 328 392 382 244
The number of formal adult warnings issued in quarter 3 was 244. This is a decrease of 138 (36.1%) from quarter 2. Use of Police Direct Measures: Restorative Justice Warning & Conference Scheme (NI)
Restorative Justice Warnings Issued and Conferences held
Q1 10/11
Q2 10/11
Q3 10/11
Q4 10/11
Q1 11/12
Q2 11/12
Q3 11/12
Aberdeen 15 5 14 15 8 17 11 Aberdeenshire 27 40 16 9 12 19 13 Moray 10 8 1 6 3 2 1 Total 52 53 31 30 23 38 25
The Restorative Justice Warning and Conference Scheme is used in accordance with the Scottish Government's 'National Standards for Youth Justice Service', to provide a coordinated and consistent approach to youth offending, while working with partners to reduce youth crime and antisocial behaviour.
The downward trend of Restorative Justice Warnings and Conferences held is assessed as being attributable to the decrease in the overall number of detected crimes involving young offenders. Although resource intensive, the use of RJ warnings is considered to be effective, as previous analysis has shown that over half (56%) of offenders do not re-offend. Undertaking Cases (LI)
% of cases that are on Undertaking, by Procurator Fiscal Area
Q1 10/11
Q2 10/11
Q3 10/11
Q4 10/11
Q1 11/12
Q2 11/12
Q3 11/12
Aberdeen 19.6% 17.8% 18.1% 15.6% 16.2% 18.5% 17.3% Banff 15% 15.0% 14.5% 26% 18.8% 9.9% 13.4% Elgin 15.2% 10.7% 13.5% 12.1% 11.9% 12.2% 13.6% Peterhead 15.2% 12.8% 17.5% 11.8% 13.1% 16.9% 18.7% Stonehaven 10.0% 7.1% 8.0% 5.5% 5.5% 7.9% 7.4% Total 17.4% 15.1% 16.4% 14.1% 14.1% 16.2% 15.9%
The percentage of cases dealt with by means of undertaking in quarter 3 decreased slightly compared to last quarter, from 16.2% to 15.9%.
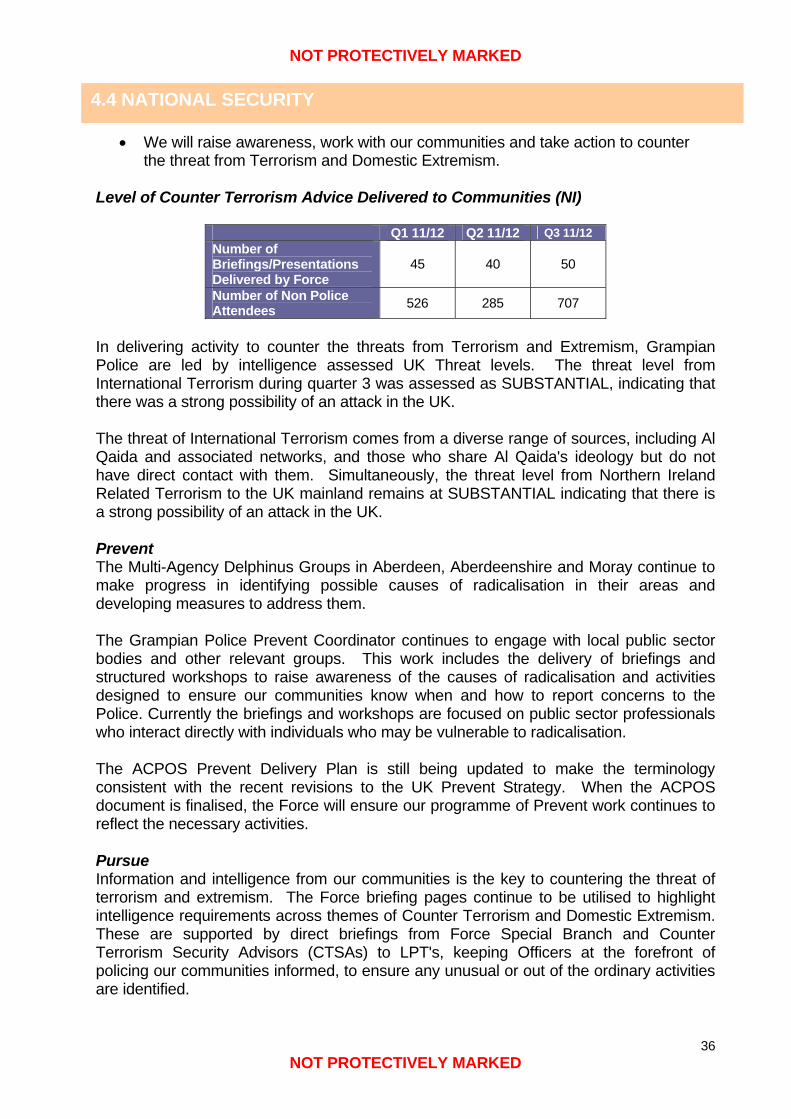
NOT PROTECTIVELY MARKED
NOT PROTECTIVELY MARKED
36
4.4 NATIONAL SECURITY
• We will raise awareness, work with our communities and take action to counter the threat from Terrorism and Domestic Extremism.
Level of Counter Terrorism Advice Delivered to Communities (NI)
Q1 11/12 Q2 11/12 Q3 11/12 Number of Briefings/Presentations Delivered by Force
45 40 50
Number of Non Police Attendees 526 285 707
In delivering activity to counter the threats from Terrorism and Extremism, Grampian Police are led by intelligence assessed UK Threat levels. The threat level from International Terrorism during quarter 3 was assessed as SUBSTANTIAL, indicating that there was a strong possibility of an attack in the UK. The threat of International Terrorism comes from a diverse range of sources, including Al Qaida and associated networks, and those who share Al Qaida's ideology but do not have direct contact with them. Simultaneously, the threat level from Northern Ireland Related Terrorism to the UK mainland remains at SUBSTANTIAL indicating that there is a strong possibility of an attack in the UK. Prevent The Multi-Agency Delphinus Groups in Aberdeen, Aberdeenshire and Moray continue to make progress in identifying possible causes of radicalisation in their areas and developing measures to address them. The Grampian Police Prevent Coordinator continues to engage with local public sector bodies and other relevant groups. This work includes the delivery of briefings and structured workshops to raise awareness of the causes of radicalisation and activities designed to ensure our communities know when and how to report concerns to the Police. Currently the briefings and workshops are focused on public sector professionals who interact directly with individuals who may be vulnerable to radicalisation. The ACPOS Prevent Delivery Plan is still being updated to make the terminology consistent with the recent revisions to the UK Prevent Strategy. When the ACPOS document is finalised, the Force will ensure our programme of Prevent work continues to reflect the necessary activities. Pursue Information and intelligence from our communities is the key to countering the threat of terrorism and extremism. The Force briefing pages continue to be utilised to highlight intelligence requirements across themes of Counter Terrorism and Domestic Extremism. These are supported by direct briefings from Force Special Branch and Counter Terrorism Security Advisors (CTSAs) to LPT's, keeping Officers at the forefront of policing our communities informed, to ensure any unusual or out of the ordinary activities are identified.
NOT PROTECTIVELY MARKED
NOT PROTECTIVELY MARKED
37
Similar to last quarter, tailored operations have run in order to maintain high levels of protective border security against threats from within the UK and overseas. These Operations have focused on individuals travelling to and from countries of CT interest and assessing any threat that may be posed locally. Preparations have continued for our involvement in the London 2012 Olympic and Paralympic Games and the preceding Torch Relay. Fortnightly planning meetings are being held. In addition, a meeting between Grampian Police and Northern Constabulary is scheduled for quarter 4 to discuss mutual cooperation during the Olympic period, particularly in relation to intelligence and investigation. Plans are in place for an Intelligence Cell to operate prior to, during and immediately after the Olympic Torch Relay in the Grampian Police area. Intelligence requirements are in the process of being compiled and will be disseminated in the next quarter. Prepare A CT Tabletop exercise was held during quarter 3, involving staff from Crime Management Business Area (CMBA), Aberdeen Division, Operational Planning and Support and British Transport Police (BTP). A live play multi-agency exercise took place during November 2011 at the Gordon Barracks, Aberdeen. The multi-agency debrief will be held during quarter 4. Protect CTSA's have continued to deliver Project Argus8 and Griffin9 events within the Force area. Covering the education and retail sectors, one Argus and four Griffin events were held. CTSA's have received a number of tasks from the National Counter Terrorism Security Office (NaCTSO) in relation to protective security issues around the Olympics. These relate to the Olympic Torch Relay route and Olympic Parallel events.
8 Project Argus is a National Counter Terrorism Security Office initiative, exploring ways to prevent, handle and recover from a terrorist attack, by taking businesses through a simulated terrorist attack. 9 Operation Griffin is an internationally acclaimed Counter Terrorism protective security initiative aimed at the business, retail and commercial communities, with the aim of providing an understanding of terrorism and extremism and the practical measures that can be taken to counter this in our communities.
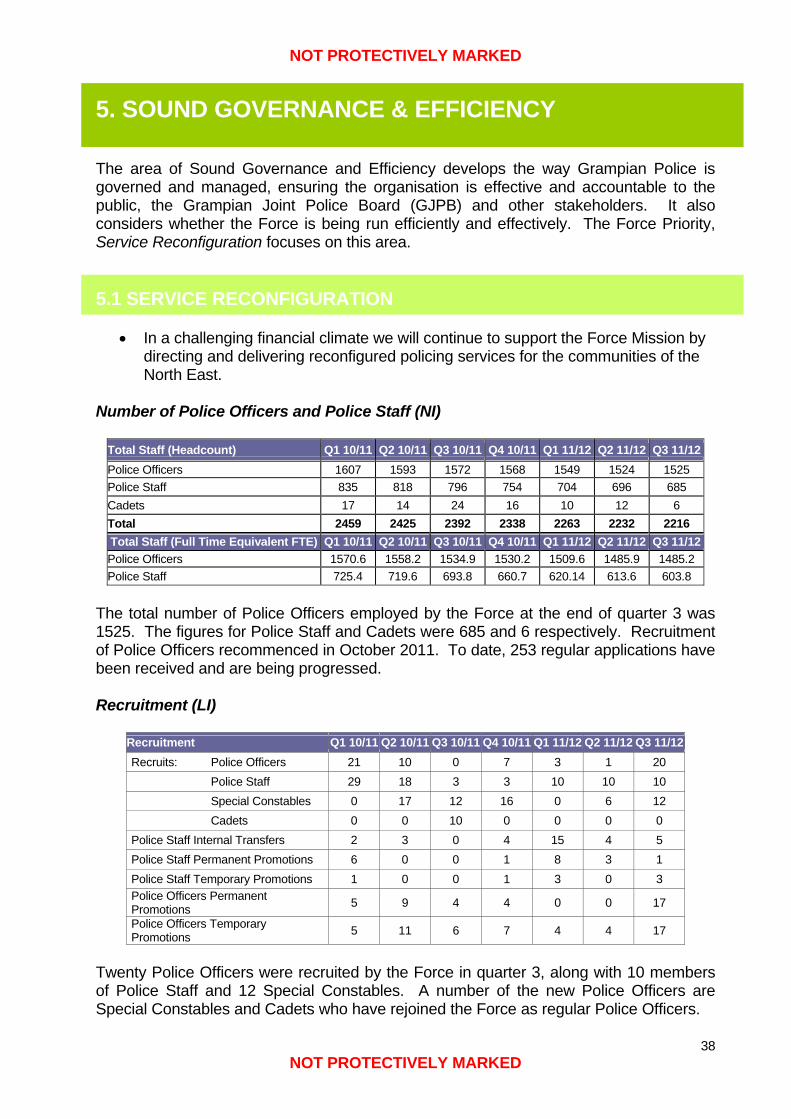
NOT PROTECTIVELY MARKED
NOT PROTECTIVELY MARKED
38
5. SOUND GOVERNANCE & EFFICIENCY The area of Sound Governance and Efficiency develops the way Grampian Police is governed and managed, ensuring the organisation is effective and accountable to the public, the Grampian Joint Police Board (GJPB) and other stakeholders. It also considers whether the Force is being run efficiently and effectively. The Force Priority, Service Reconfiguration focuses on this area. 5.1 SERVICE RECONFIGURATION
• In a challenging financial climate we will continue to support the Force Mission by directing and delivering reconfigured policing services for the communities of the North East.
Number of Police Officers and Police Staff (NI)
Total Staff (Headcount) Q1 10/11 Q2 10/11 Q3 10/11 Q4 10/11 Q1 11/12 Q2 11/12 Q3 11/12Police Officers 1607 1593 1572 1568 1549 1524 1525 Police Staff 835 818 796 754 704 696 685 Cadets 17 14 24 16 10 12 6 Total 2459 2425 2392 2338 2263 2232 2216 Total Staff (Full Time Equivalent FTE) Q1 10/11 Q2 10/11 Q3 10/11 Q4 10/11 Q1 11/12 Q2 11/12 Q3 11/12Police Officers 1570.6 1558.2 1534.9 1530.2 1509.6 1485.9 1485.2 Police Staff 725.4 719.6 693.8 660.7 620.14 613.6 603.8
The total number of Police Officers employed by the Force at the end of quarter 3 was 1525. The figures for Police Staff and Cadets were 685 and 6 respectively. Recruitment of Police Officers recommenced in October 2011. To date, 253 regular applications have been received and are being progressed. Recruitment (LI)
Recruitment Q1 10/11 Q2 10/11 Q3 10/11 Q4 10/11 Q1 11/12 Q2 11/12 Q3 11/12Recruits: Police Officers 21 10 0 7 3 1 20 Police Staff 29 18 3 3 10 10 10 Special Constables 0 17 12 16 0 6 12 Cadets 0 0 10 0 0 0 0 Police Staff Internal Transfers 2 3 0 4 15 4 5 Police Staff Permanent Promotions 6 0 0 1 8 3 1 Police Staff Temporary Promotions 1 0 0 1 3 0 3 Police Officers Permanent Promotions 5 9 4 4 0 0 17
Police Officers Temporary Promotions 5 11 6 7 4 4 17
Twenty Police Officers were recruited by the Force in quarter 3, along with 10 members of Police Staff and 12 Special Constables. A number of the new Police Officers are Special Constables and Cadets who have rejoined the Force as regular Police Officers.
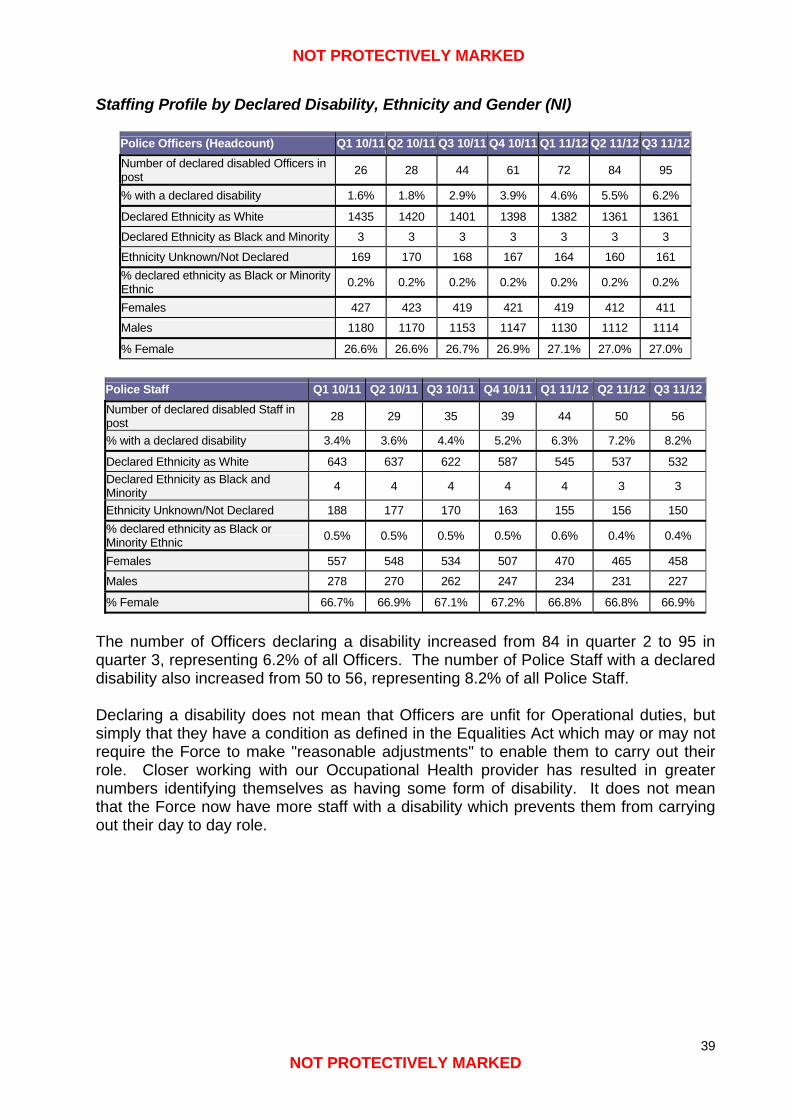
NOT PROTECTIVELY MARKED
NOT PROTECTIVELY MARKED
39
Staffing Profile by Declared Disability, Ethnicity and Gender (NI)
Police Officers (Headcount) Q1 10/11 Q2 10/11 Q3 10/11 Q4 10/11 Q1 11/12 Q2 11/12 Q3 11/12Number of declared disabled Officers in post 26 28 44 61 72 84 95
% with a declared disability 1.6% 1.8% 2.9% 3.9% 4.6% 5.5% 6.2%
Declared Ethnicity as White 1435 1420 1401 1398 1382 1361 1361
Declared Ethnicity as Black and Minority 3 3 3 3 3 3 3
Ethnicity Unknown/Not Declared 169 170 168 167 164 160 161 % declared ethnicity as Black or Minority Ethnic 0.2% 0.2% 0.2% 0.2% 0.2% 0.2% 0.2%
Females 427 423 419 421 419 412 411
Males 1180 1170 1153 1147 1130 1112 1114
% Female 26.6% 26.6% 26.7% 26.9% 27.1% 27.0% 27.0%
Police Staff Q1 10/11 Q2 10/11 Q3 10/11 Q4 10/11 Q1 11/12 Q2 11/12 Q3 11/12Number of declared disabled Staff in post 28 29 35 39 44 50 56
% with a declared disability 3.4% 3.6% 4.4% 5.2% 6.3% 7.2% 8.2%
Declared Ethnicity as White 643 637 622 587 545 537 532 Declared Ethnicity as Black and Minority 4 4 4 4 4 3 3
Ethnicity Unknown/Not Declared 188 177 170 163 155 156 150 % declared ethnicity as Black or Minority Ethnic 0.5% 0.5% 0.5% 0.5% 0.6% 0.4% 0.4%
Females 557 548 534 507 470 465 458
Males 278 270 262 247 234 231 227
% Female 66.7% 66.9% 67.1% 67.2% 66.8% 66.8% 66.9%
The number of Officers declaring a disability increased from 84 in quarter 2 to 95 in quarter 3, representing 6.2% of all Officers. The number of Police Staff with a declared disability also increased from 50 to 56, representing 8.2% of all Police Staff. Declaring a disability does not mean that Officers are unfit for Operational duties, but simply that they have a condition as defined in the Equalities Act which may or may not require the Force to make "reasonable adjustments" to enable them to carry out their role. Closer working with our Occupational Health provider has resulted in greater numbers identifying themselves as having some form of disability. It does not mean that the Force now have more staff with a disability which prevents them from carrying out their day to day role.
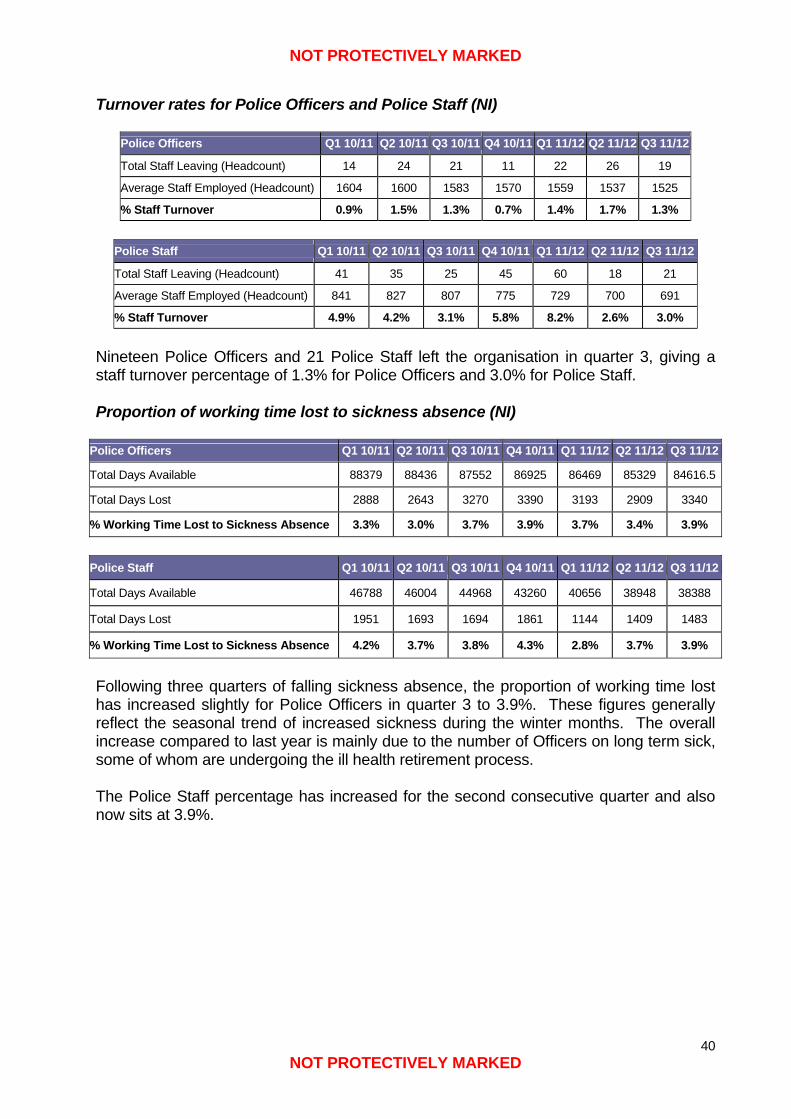
NOT PROTECTIVELY MARKED
NOT PROTECTIVELY MARKED
40
Turnover rates for Police Officers and Police Staff (NI)
Police Officers Q1 10/11 Q2 10/11 Q3 10/11 Q4 10/11 Q1 11/12 Q2 11/12 Q3 11/12
Total Staff Leaving (Headcount) 14 24 21 11 22 26 19
Average Staff Employed (Headcount) 1604 1600 1583 1570 1559 1537 1525
% Staff Turnover 0.9% 1.5% 1.3% 0.7% 1.4% 1.7% 1.3%
Police Staff Q1 10/11 Q2 10/11 Q3 10/11 Q4 10/11 Q1 11/12 Q2 11/12 Q3 11/12
Total Staff Leaving (Headcount) 41 35 25 45 60 18 21
Average Staff Employed (Headcount) 841 827 807 775 729 700 691
% Staff Turnover 4.9% 4.2% 3.1% 5.8% 8.2% 2.6% 3.0%
Nineteen Police Officers and 21 Police Staff left the organisation in quarter 3, giving a staff turnover percentage of 1.3% for Police Officers and 3.0% for Police Staff. Proportion of working time lost to sickness absence (NI)
Police Officers Q1 10/11 Q2 10/11 Q3 10/11 Q4 10/11 Q1 11/12 Q2 11/12 Q3 11/12
Total Days Available 88379 88436 87552 86925 86469 85329 84616.5
Total Days Lost 2888 2643 3270 3390 3193 2909 3340
% Working Time Lost to Sickness Absence 3.3% 3.0% 3.7% 3.9% 3.7% 3.4% 3.9%
Police Staff Q1 10/11 Q2 10/11 Q3 10/11 Q4 10/11 Q1 11/12 Q2 11/12 Q3 11/12
Total Days Available 46788 46004 44968 43260 40656 38948 38388
Total Days Lost 1951 1693 1694 1861 1144 1409 1483
% Working Time Lost to Sickness Absence 4.2% 3.7% 3.8% 4.3% 2.8% 3.7% 3.9%
Following three quarters of falling sickness absence, the proportion of working time lost has increased slightly for Police Officers in quarter 3 to 3.9%. These figures generally reflect the seasonal trend of increased sickness during the winter months. The overall increase compared to last year is mainly due to the number of Officers on long term sick, some of whom are undergoing the ill health retirement process. The Police Staff percentage has increased for the second consecutive quarter and also now sits at 3.9%.
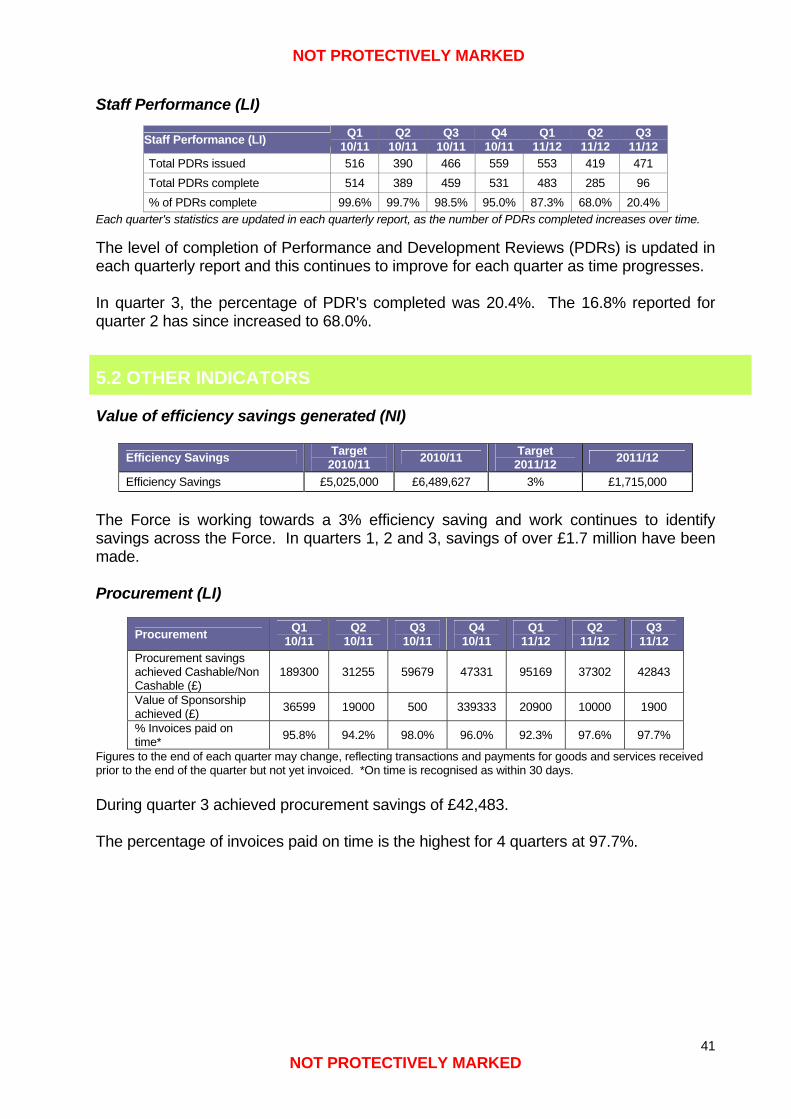
NOT PROTECTIVELY MARKED
NOT PROTECTIVELY MARKED
41
Staff Performance (LI)
Staff Performance (LI) Q1 10/11
Q2 10/11
Q3 10/11
Q4 10/11
Q1 11/12
Q2 11/12
Q3 11/12
Total PDRs issued 516 390 466 559 553 419 471 Total PDRs complete 514 389 459 531 483 285 96 % of PDRs complete 99.6% 99.7% 98.5% 95.0% 87.3% 68.0% 20.4%
Each quarter's statistics are updated in each quarterly report, as the number of PDRs completed increases over time. The level of completion of Performance and Development Reviews (PDRs) is updated in each quarterly report and this continues to improve for each quarter as time progresses. In quarter 3, the percentage of PDR's completed was 20.4%. The 16.8% reported for quarter 2 has since increased to 68.0%. 5.2 OTHER INDICATORS Value of efficiency savings generated (NI)
Efficiency Savings Target 2010/11 2010/11 Target
2011/12 2011/12
Efficiency Savings £5,025,000 £6,489,627 3% £1,715,000
The Force is working towards a 3% efficiency saving and work continues to identify savings across the Force. In quarters 1, 2 and 3, savings of over £1.7 million have been made. Procurement (LI)
Procurement Q1 10/11
Q2 10/11
Q3 10/11
Q4 10/11
Q1 11/12
Q2 11/12
Q3 11/12
Procurement savings achieved Cashable/Non Cashable (£)
189300 31255 59679 47331 95169 37302 42843
Value of Sponsorship achieved (£) 36599 19000 500 339333 20900 10000 1900
% Invoices paid on time* 95.8% 94.2% 98.0% 96.0% 92.3% 97.6% 97.7%
Figures to the end of each quarter may change, reflecting transactions and payments for goods and services received prior to the end of the quarter but not yet invoiced. *On time is recognised as within 30 days. During quarter 3 achieved procurement savings of £42,483. The percentage of invoices paid on time is the highest for 4 quarters at 97.7%.
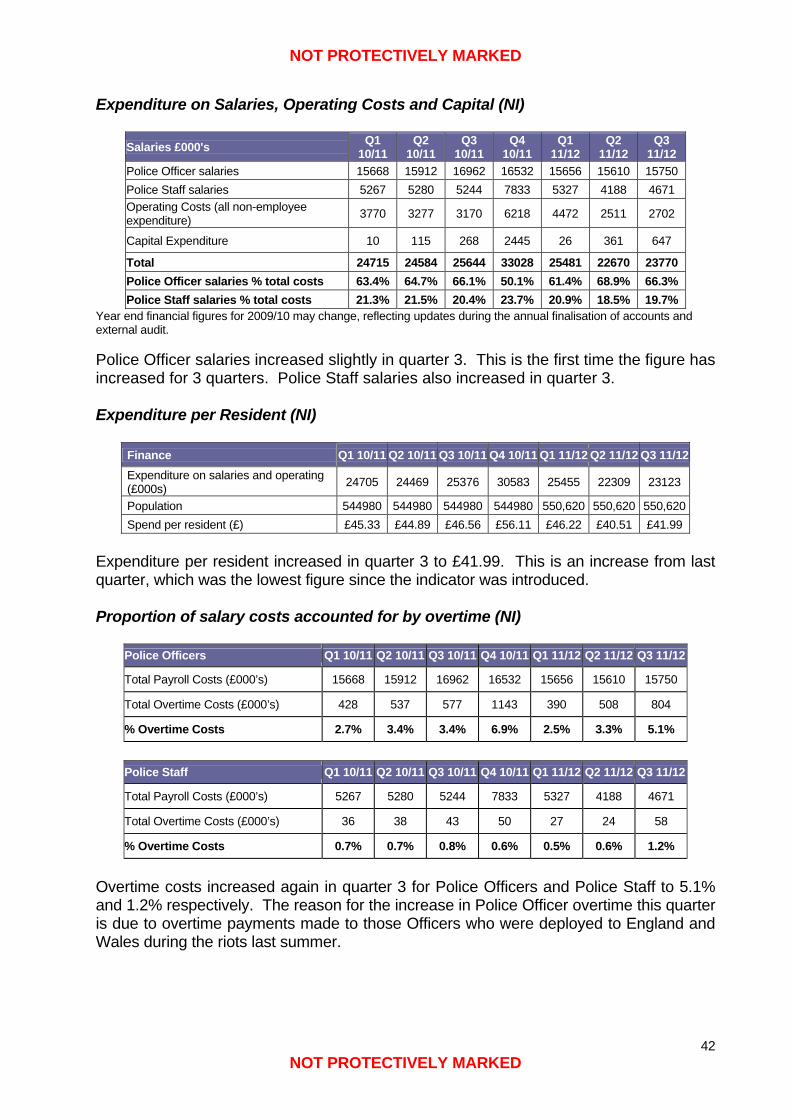
NOT PROTECTIVELY MARKED
NOT PROTECTIVELY MARKED
42
Expenditure on Salaries, Operating Costs and Capital (NI)
Salaries £000's Q1 10/11
Q2 10/11
Q3 10/11
Q4 10/11
Q1 11/12
Q2 11/12
Q3 11/12
Police Officer salaries 15668 15912 16962 16532 15656 15610 15750 Police Staff salaries 5267 5280 5244 7833 5327 4188 4671 Operating Costs (all non-employee expenditure) 3770 3277 3170 6218 4472 2511 2702
Capital Expenditure 10 115 268 2445 26 361 647
Total 24715 24584 25644 33028 25481 22670 23770 Police Officer salaries % total costs 63.4% 64.7% 66.1% 50.1% 61.4% 68.9% 66.3% Police Staff salaries % total costs 21.3% 21.5% 20.4% 23.7% 20.9% 18.5% 19.7%
Year end financial figures for 2009/10 may change, reflecting updates during the annual finalisation of accounts and external audit. Police Officer salaries increased slightly in quarter 3. This is the first time the figure has increased for 3 quarters. Police Staff salaries also increased in quarter 3. Expenditure per Resident (NI)
Finance Q1 10/11 Q2 10/11 Q3 10/11 Q4 10/11 Q1 11/12 Q2 11/12 Q3 11/12Expenditure on salaries and operating (£000s) 24705 24469 25376 30583 25455 22309 23123
Population 544980 544980 544980 544980 550,620 550,620 550,620Spend per resident (£) £45.33 £44.89 £46.56 £56.11 £46.22 £40.51 £41.99
Expenditure per resident increased in quarter 3 to £41.99. This is an increase from last quarter, which was the lowest figure since the indicator was introduced. Proportion of salary costs accounted for by overtime (NI)
Police Officers Q1 10/11 Q2 10/11 Q3 10/11 Q4 10/11 Q1 11/12 Q2 11/12 Q3 11/12
Total Payroll Costs (£000’s) 15668 15912 16962 16532 15656 15610 15750
Total Overtime Costs (£000’s) 428 537 577 1143 390 508 804
% Overtime Costs 2.7% 3.4% 3.4% 6.9% 2.5% 3.3% 5.1%
Police Staff Q1 10/11 Q2 10/11 Q3 10/11 Q4 10/11 Q1 11/12 Q2 11/12 Q3 11/12
Total Payroll Costs (£000’s) 5267 5280 5244 7833 5327 4188 4671
Total Overtime Costs (£000’s) 36 38 43 50 27 24 58
% Overtime Costs 0.7% 0.7% 0.8% 0.6% 0.5% 0.6% 1.2%
Overtime costs increased again in quarter 3 for Police Officers and Police Staff to 5.1% and 1.2% respectively. The reason for the increase in Police Officer overtime this quarter is due to overtime payments made to those Officers who were deployed to England and Wales during the riots last summer.
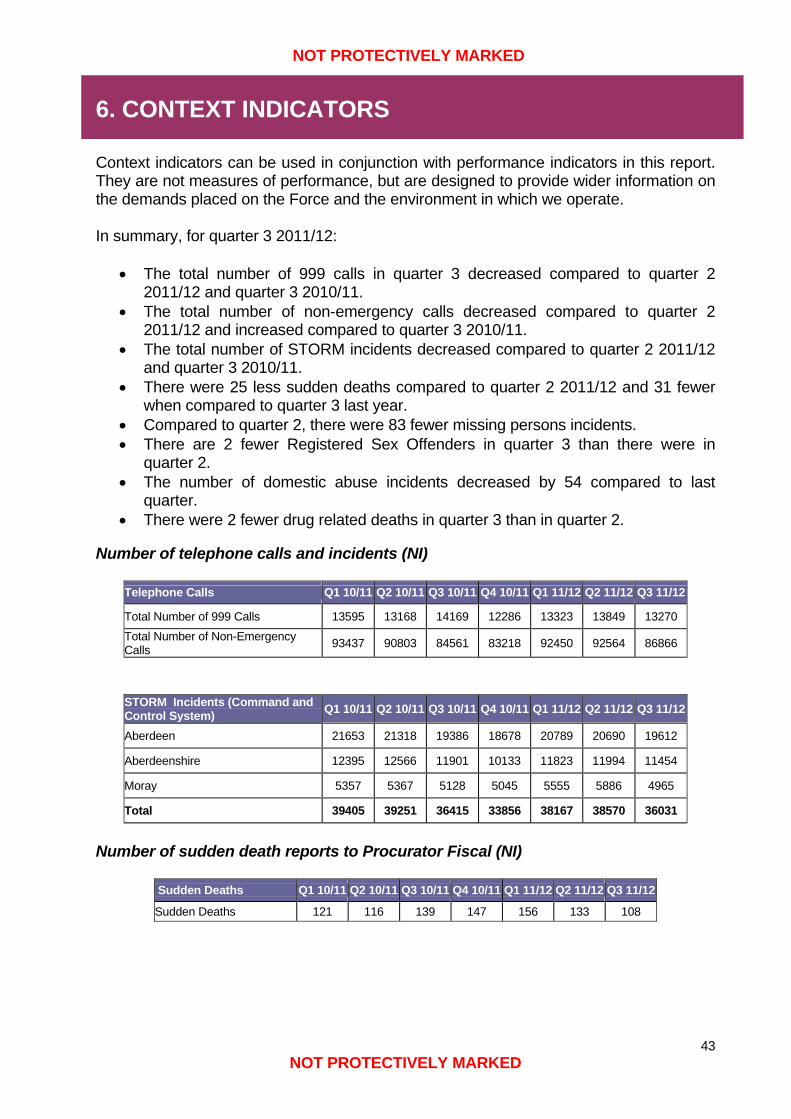
NOT PROTECTIVELY MARKED
NOT PROTECTIVELY MARKED
43
6. CONTEXT INDICATORS Context indicators can be used in conjunction with performance indicators in this report. They are not measures of performance, but are designed to provide wider information on the demands placed on the Force and the environment in which we operate. In summary, for quarter 3 2011/12:
• The total number of 999 calls in quarter 3 decreased compared to quarter 2 2011/12 and quarter 3 2010/11.
• The total number of non-emergency calls decreased compared to quarter 2 2011/12 and increased compared to quarter 3 2010/11.
• The total number of STORM incidents decreased compared to quarter 2 2011/12 and quarter 3 2010/11.
• There were 25 less sudden deaths compared to quarter 2 2011/12 and 31 fewer when compared to quarter 3 last year.
• Compared to quarter 2, there were 83 fewer missing persons incidents. • There are 2 fewer Registered Sex Offenders in quarter 3 than there were in
quarter 2. • The number of domestic abuse incidents decreased by 54 compared to last
quarter. • There were 2 fewer drug related deaths in quarter 3 than in quarter 2.
Number of telephone calls and incidents (NI)
Telephone Calls Q1 10/11 Q2 10/11 Q3 10/11 Q4 10/11 Q1 11/12 Q2 11/12 Q3 11/12
Total Number of 999 Calls 13595 13168 14169 12286 13323 13849 13270 Total Number of Non-Emergency Calls 93437 90803 84561 83218 92450 92564 86866
STORM Incidents (Command and Control System) Q1 10/11 Q2 10/11 Q3 10/11 Q4 10/11 Q1 11/12 Q2 11/12 Q3 11/12
Aberdeen 21653 21318 19386 18678 20789 20690 19612
Aberdeenshire 12395 12566 11901 10133 11823 11994 11454
Moray 5357 5367 5128 5045 5555 5886 4965
Total 39405 39251 36415 33856 38167 38570 36031
Number of sudden death reports to Procurator Fiscal (NI)
Sudden Deaths Q1 10/11 Q2 10/11 Q3 10/11 Q4 10/11 Q1 11/12 Q2 11/12 Q3 11/12
Sudden Deaths 121 116 139 147 156 133 108
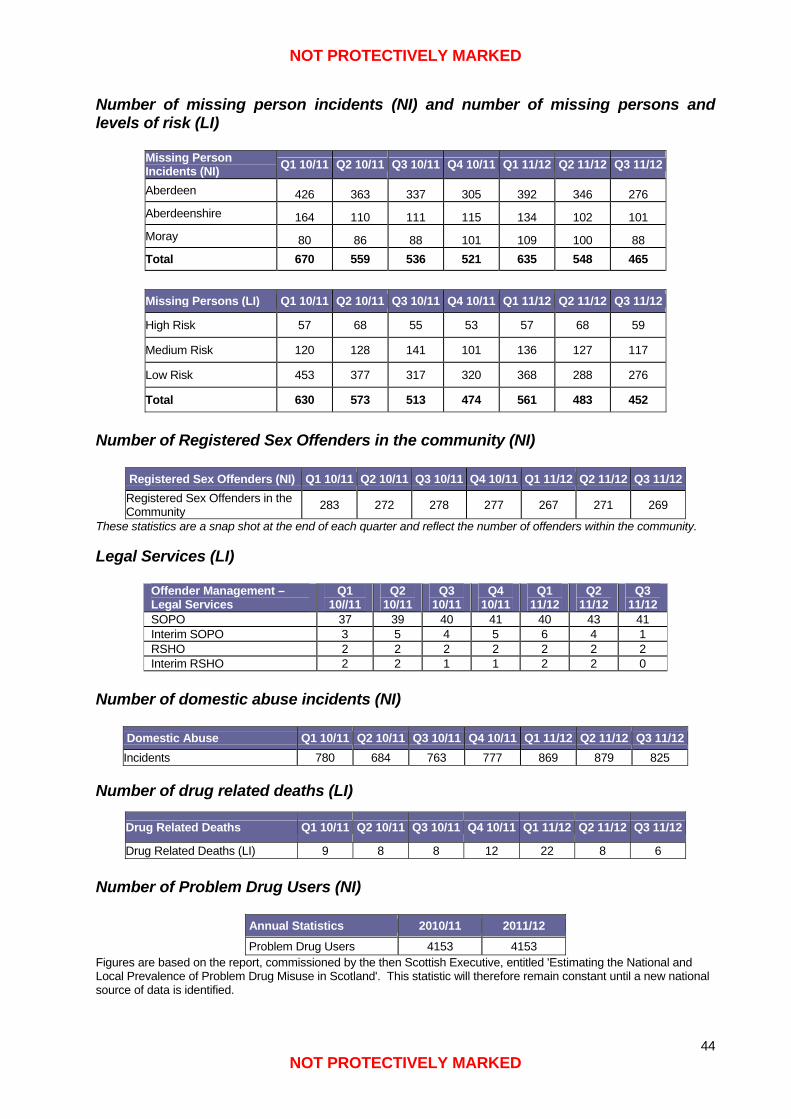
NOT PROTECTIVELY MARKED
NOT PROTECTIVELY MARKED
44
Number of missing person incidents (NI) and number of missing persons and levels of risk (LI)
Missing Person Incidents (NI) Q1 10/11 Q2 10/11 Q3 10/11 Q4 10/11 Q1 11/12 Q2 11/12 Q3 11/12
Aberdeen 426 363 337 305 392 346 276 Aberdeenshire 164 110 111 115 134 102 101 Moray 80 86 88 101 109 100 88 Total 670 559 536 521 635 548 465
Missing Persons (LI) Q1 10/11 Q2 10/11 Q3 10/11 Q4 10/11 Q1 11/12 Q2 11/12 Q3 11/12
High Risk 57 68 55 53 57 68 59
Medium Risk 120 128 141 101 136 127 117
Low Risk 453 377 317 320 368 288 276
Total 630 573 513 474 561 483 452
Number of Registered Sex Offenders in the community (NI)
Registered Sex Offenders (NI) Q1 10/11 Q2 10/11 Q3 10/11 Q4 10/11 Q1 11/12 Q2 11/12 Q3 11/12Registered Sex Offenders in the Community 283 272 278 277 267 271 269
These statistics are a snap shot at the end of each quarter and reflect the number of offenders within the community.
Legal Services (LI)
Offender Management – Legal Services
Q1 10//11
Q2 10/11
Q3 10/11
Q4 10/11
Q1 11/12
Q2 11/12
Q3 11/12
SOPO 37 39 40 41 40 43 41 Interim SOPO 3 5 4 5 6 4 1 RSHO 2 2 2 2 2 2 2 Interim RSHO 2 2 1 1 2 2 0
Number of domestic abuse incidents (NI)
Domestic Abuse Q1 10/11 Q2 10/11 Q3 10/11 Q4 10/11 Q1 11/12 Q2 11/12 Q3 11/12Incidents 780 684 763 777 869 879 825
Number of drug related deaths (LI)
Drug Related Deaths Q1 10/11 Q2 10/11 Q3 10/11 Q4 10/11 Q1 11/12 Q2 11/12 Q3 11/12
Drug Related Deaths (LI) 9 8 8 12 22 8 6 Number of Problem Drug Users (NI)
Annual Statistics 2010/11 2011/12 Problem Drug Users 4153 4153
Figures are based on the report, commissioned by the then Scottish Executive, entitled 'Estimating the National and Local Prevalence of Problem Drug Misuse in Scotland'. This statistic will therefore remain constant until a new national source of data is identified.
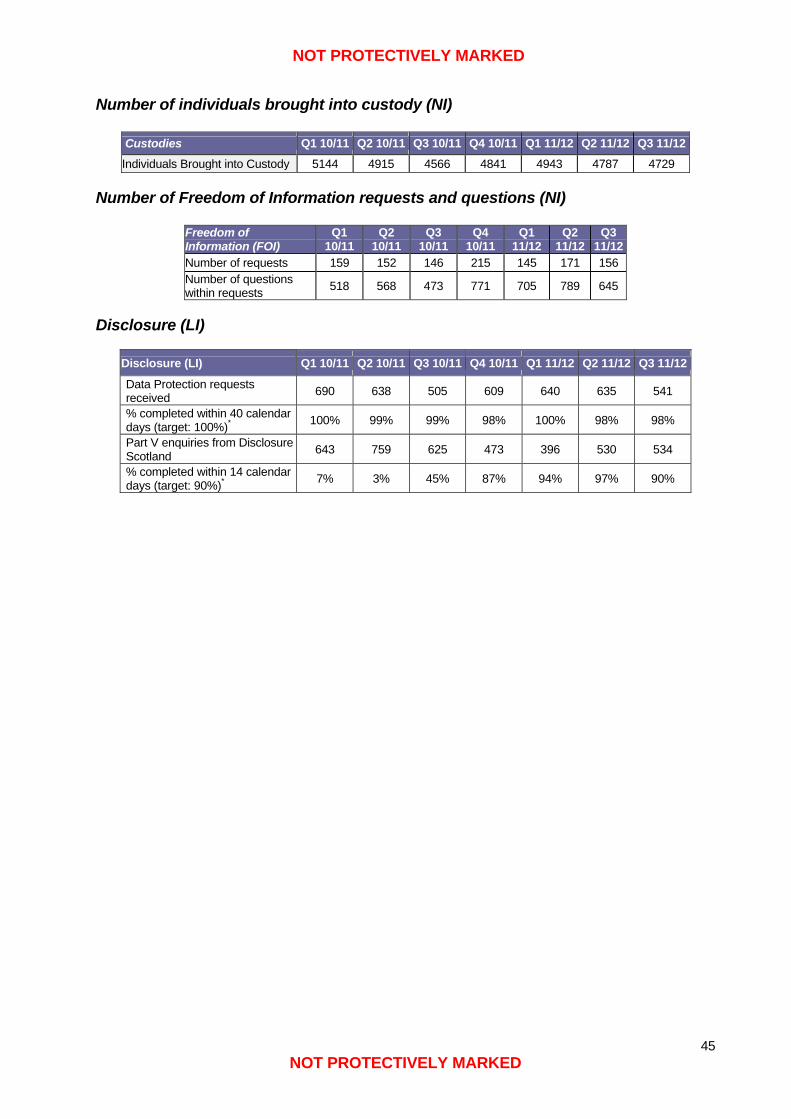
NOT PROTECTIVELY MARKED
NOT PROTECTIVELY MARKED
45
Number of individuals brought into custody (NI)
Custodies Q1 10/11 Q2 10/11 Q3 10/11 Q4 10/11 Q1 11/12 Q2 11/12 Q3 11/12Individuals Brought into Custody 5144 4915 4566 4841 4943 4787 4729
Number of Freedom of Information requests and questions (NI)
Freedom of Information (FOI)
Q1 10/11
Q2 10/11
Q3 10/11
Q4 10/11
Q1 11/12
Q2 11/12
Q3 11/12
Number of requests 159 152 146 215 145 171 156 Number of questions within requests 518 568 473 771 705 789 645
Disclosure (LI)
Disclosure (LI) Q1 10/11 Q2 10/11 Q3 10/11 Q4 10/11 Q1 11/12 Q2 11/12 Q3 11/12
Data Protection requests received 690 638 505 609 640 635 541
% completed within 40 calendar days (target: 100%)* 100% 99% 99% 98% 100% 98% 98%
Part V enquiries from Disclosure Scotland 643 759 625 473 396 530 534
% completed within 14 calendar days (target: 90%)* 7% 3% 45% 87% 94% 97% 90%
NOT PROTECTIVELY MARKED
NOT PROTECTIVELY MARKED
46
7. APPENDIX A 7.1 INTERPRETATION OF INFORMATION 7.1.1 Force Priorities The purpose of this report is to provide a picture of Grampian Police Force Priorities and how the Force is addressing them. This report identifies work and progress during 2011/12. The Force Priorities for 2011/12 are:
• Community Focus • National Security • Public Protection • Road Casualty Reduction • Serious Organised Crime & Drugs • Service Reconfiguration
7.1.2 National Indicators (NI) The SPPF was launched across Scotland in April 2007 and identified a set of National Indicators to be reported by all Forces. Additional indicators have been introduced each year. The information contained in this report reflects the structure of the information provided within the SPPF, which is still evolving. In this report, National Indicators have been integrated with Force Priorities, where relevant to that priority, and are now identified by the acronym (NI) after the title. Any calculations in this report which record statistics in proportion to population use the General Register's Office for Scotland 2011 mid year estimates of population, which record the Grampian population as 550,620 for 2011/12. Audit Scotland provide annual direction on Statutory Performance Indicators (SPIs). Previously 9 were set for Police Forces, however, in 2009/10, all indicators within the SPPF became auditable, therefore all NI's are now auditable. Crime Trend Information Where historical data is available, this is reported on a quarterly basis to provide comparison and an indication of longer term trends. Where graphs are used, the bars display the number of crimes/offences using the left axis, and the lines relate to the percentage detection rate in the right axis.
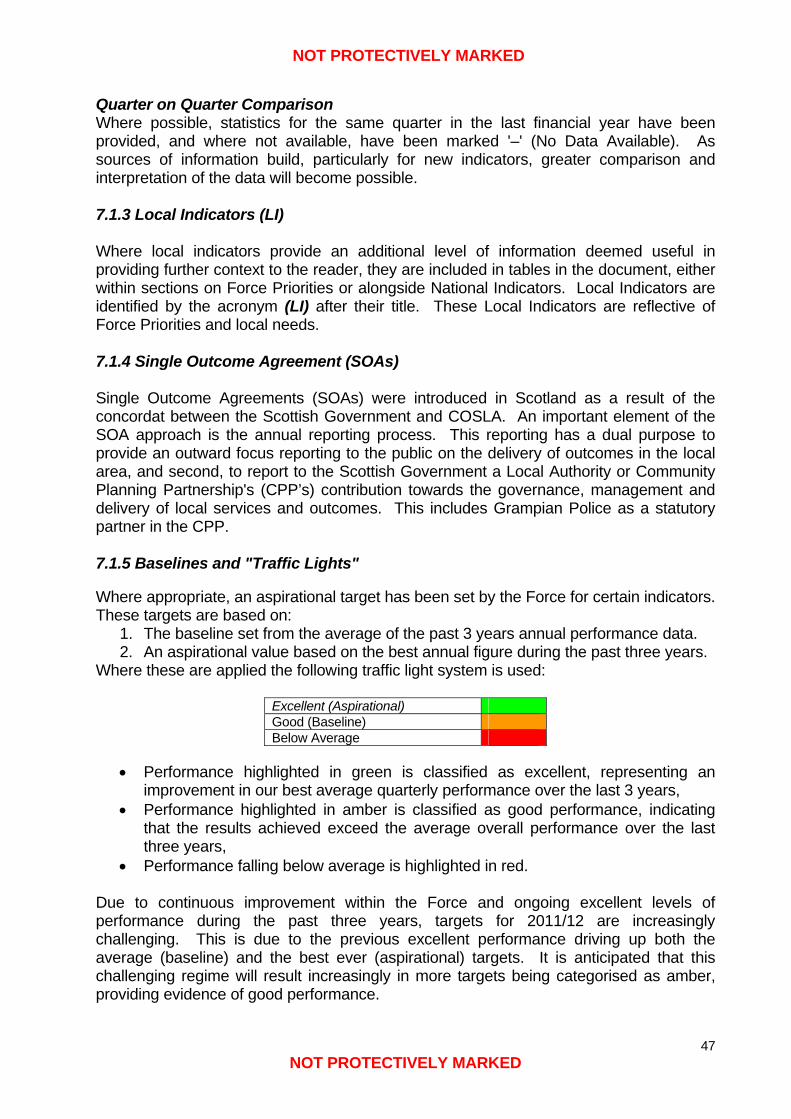
NOT PROTECTIVELY MARKED
NOT PROTECTIVELY MARKED
47
Quarter on Quarter Comparison Where possible, statistics for the same quarter in the last financial year have been provided, and where not available, have been marked '–' (No Data Available). As sources of information build, particularly for new indicators, greater comparison and interpretation of the data will become possible. 7.1.3 Local Indicators (LI) Where local indicators provide an additional level of information deemed useful in providing further context to the reader, they are included in tables in the document, either within sections on Force Priorities or alongside National Indicators. Local Indicators are identified by the acronym (LI) after their title. These Local Indicators are reflective of Force Priorities and local needs. 7.1.4 Single Outcome Agreement (SOAs) Single Outcome Agreements (SOAs) were introduced in Scotland as a result of the concordat between the Scottish Government and COSLA. An important element of the SOA approach is the annual reporting process. This reporting has a dual purpose to provide an outward focus reporting to the public on the delivery of outcomes in the local area, and second, to report to the Scottish Government a Local Authority or Community Planning Partnership's (CPP’s) contribution towards the governance, management and delivery of local services and outcomes. This includes Grampian Police as a statutory partner in the CPP. 7.1.5 Baselines and "Traffic Lights" Where appropriate, an aspirational target has been set by the Force for certain indicators. These targets are based on:
1. The baseline set from the average of the past 3 years annual performance data. 2. An aspirational value based on the best annual figure during the past three years.
Where these are applied the following traffic light system is used:
Excellent (Aspirational) Good (Baseline) Below Average
• Performance highlighted in green is classified as excellent, representing an
improvement in our best average quarterly performance over the last 3 years, • Performance highlighted in amber is classified as good performance, indicating
that the results achieved exceed the average overall performance over the last three years,
• Performance falling below average is highlighted in red. Due to continuous improvement within the Force and ongoing excellent levels of performance during the past three years, targets for 2011/12 are increasingly challenging. This is due to the previous excellent performance driving up both the average (baseline) and the best ever (aspirational) targets. It is anticipated that this challenging regime will result increasingly in more targets being categorised as amber, providing evidence of good performance.
NOT PROTECTIVELY MARKED
NOT PROTECTIVELY MARKED
48
The Force recognises that we require to build on every opportunity to detect crimes as we move forward in what will be a demanding period as transition to a National Police Service takes effect. In the interim, the Force will retain the (traffic light) system by which we judge performance and against which we are judged. The system has developed against several years of very positive outcomes and sets a high standard for future performance. The fact that a box is red does not always point to poor performance but reflects the challenge that we currently face.
NOT PROTECTIVELY MARKED
NOT PROTECTIVELY MARKED
49
7.2 ACRONYMS ACPO Association of Chief Police Officers ACPOS Association of Chief Police Officers Scotland ASB Antisocial Behaviour ASBFPN Antisocial Behaviour Fixed Penalty Notice ASBO Antisocial Behaviour Order BTP British Transport Police COPFS Crown Office Procurator Fiscal Service CT Counter Terrorism CTSA Counter Terrorism Security Advisor FAW Formal Adult Warning Scheme FCR Force Control Room FEB Force Executive Board FOI Freedom Of Information FSC Force Service Centre FSDU Force Service Delivery Unit FTE Full Time Equivalent FTTCG Force Tactical Tasking Coordinating Group GIRFEC Getting it Right for Every Child GJPB Grampian Joint Police Board GROS General Register Office for Scotland HMIe Her Majesty’s Inspectorate of Education KSI Killed or Seriously Injured LI Local Indicator LPT Local Policing Team MIT Major Investigation Team MART Multi Agency Response Team NESCPC North East Scotland Child Protection Committee NHS National Health Service NI National Indicator OCG Organised Crime Group PDR Performance and Development Review PF Procurator Fiscal POCA Proceeds of Crime Act PPR Public Performance Reporting PPU Public Protection Unit QOS Quality of Service RJ Restorative Justice RJW Restorative Justice Warning RSHO Risk of Sexual Harm Order RSO Registered Sex Offender RTC Road Traffic Collision SCSWIS Social Care and Social Work Inspectorate Scotland SCRA Scottish Children’s Reporter Administration SLWG Short Life Working Group SOA Single Outcome Agreement SOC&D Serious Organised Crime & Drugs SOP Standard Operating Procedure SOPO Sexual Offences Prevention Order SPI Statutory Performance Indicator SPPF Scottish Policing Performance Framework SPSA Scottish Police Services Authority SPR Standard Police Report TTCG Tactical Tasking and Coordinating Group UK United Kingdom VPFPO Vehicle Penalty and Fixed Penalty Offences VRI Visual Recording Interviews YJMU Youth Justice Management Unit
NOT PROTECTIVELY MARKED
NOT PROTECTIVELY MARKED
50
7.3 FURTHER SOURCES OF INFORMATION Census data is provided by the General Register Office for Scotland, and currently uses the most up to date statistics available: the 'Mid 2010 Population Estimates Scotland'. Data for the Grampian Police area can be found at: http://www.gro-scotland.gov.uk/statistics/theme/population/estimates/mid-year/2010/index.html Statistics on drug misuse are contained with the Executive Report commissioned by the Scottish Executive entitled, 'Estimating the National and Local Prevalence of Problem Drug Misuse in Scotland'. Figures based on 2006 estimate. The numbers can be found in section 5.1.6 of the Executive Report, which can be found at: http://www.drugmisuse.isdscotland.org/publications/local/Prevalence_2009.pdf Continuing our Platform for Success, 2011/12 can be accessed at: http://www.grampian.police.uk/Publications.aspx?id=59&pid=30;31;5;59 This report will be published at: http://www.grampian.police.uk/Publications.aspx?id=133&pid=30;31;5;133 Further information on the SPPF can be found at: http://www.scotland.gov.uk/Topics/Justice/public-safety/Police/Performance The 2010/11 ACPOS Annual Performance Report 2010/11 can be accessed at: http://www.acpos.police.uk/SPPF/Index.html