Embed Size (px)
Citation preview

Continuing Legal Education Written Materials
REUNION 2017 CLASS III
Doing Good by Doing Deals: Embedding Impact Objectives into Loan Agreements
1.5 CLE Credits
Lectured by
Deborah Kay Burand Assistant Professor of Clinical Law
NYU School of Law
Vanderbilt Hall 40 Washington Square South
Saturday, April 29, 2017 11:15 a.m. – 12:45 p.m.
CLE materials can be downloaded at: www.law.nyu.edu/alumni/reunion2017/clematerials
55
Resolving Impact Investment Disputes: When Doing Good Goes Bad
Deborah Burand
“The world is on the brink of a revolution in how we solve society’s toughest problems. The force capable of driving this revolution is ‘social impact investing,’ which harnesses entrepreneurship, innovation and capital to power social improvement.”
—Report of the independent Social Impact Investment Taskforce, established under the United Kingdom’s presidency of the G8 (September 15, 2014) 1
Deborah Burand is a clinical assistant professor at the University of Michigan Law School where she teaches in the area of impact investment lawyering and social entrepreneurship, and directs the International Transactions Clinic (ITC) that she co-founded in 2008 at the University of Michigan Law School. She thanks her colleagues at the University of Michigan Law School, in particular Professor Julian Mortenson and adjunct faculty of the ITC, Donald Crane and Carl Valenstein; together with the generous participants at the NewDirections in Community Lawyering, Social Entrepreneurship, and Dispute ResolutionScholarship Roundtable at Washington University School of Law, for their helpful comments, discussions, and suggestions on an early draft of this Article.
1. SOCIAL IMPACT INVESTMENT TASKFORCE, IMPACT INVESTMENT: THE INVISIBLE HEART OF MARKETS 1 (2014) [hereinafter THE INVISIBLE HEART OF MARKETS]. The Social Impact Investment Taskforce was launched during the summer of 2013 as an independent task force under the United Kingdom’s presidency of the G8. Government and sector experts from the G7 countries, the European Commission, and Australia collaborated to report on “catalysing a global market in impact investment.” Id. The G8 Impact Taskforce Report is one of several papers and reports that were issued under this mandate. See also SOCIAL IMPACT INVESTMENT TASKFORCE, POLICY LEVERS AND OBJECTIVES (2014); SOCIAL IMPACT INVESTMENT TASKFORCE, MEASURING IMPACT (2014); SOCIAL IMPACT INVESTMENT TASKFORCE,ALLOCATING FOR IMPACT (2014); SOCIAL IMPACT INVESTMENT TASKFORCE, PROFIT-WITH-PURPOSE BUSINESSES (2014); SOCIAL IMPACT INVESTMENT TASKFORCE, INTERNATIONAL DEVELOPMENT (2014); Social Impact Investment Taskforce, GOV.UK, (Oct 19, 2014), available at https://www.gov.uk/government/groups/social-impact-investment-taskforce (listing eight National Advisory Board Reports—Australia, Canada, France, Germany, Italy, Japan, the United Kingdom, and the United States—notably absent is Russia).
Washington University Open Scholarship
56 Journal of Law & Policy [Vol. 48:55
“One might with justification say that [impact investing] brings the invisible heart of markets to guide their invisible hand.”
—Sir Ronald Cohen, Chair of the Social Impact Taskforce, Letter to Leaders of Taskforce Governments2
“This is ground zero of a big deal.”
—Former US Secretary of the Treasury, Lawrence Summers (May 2014)3
INTRODUCTION
A “revolution,” the “invisible heart of markets,” “ground zero of a big deal”—these are powerful metaphors for characterizing the promise of a new approach to investing money called “impact investing.”4 But can all impact investments deliver on these expectations?
Most will deliver, but some may not. Accordingly, a challenge to growing a robust impact investment market is to make sure that the deals that fail to meet investors’ expectations don’t erode investor confidence in the impact investment market more generally.5 One
2. THE INVISIBLE HEART OF MARKETS, supra note 1. 3. See THE INVISIBLE HEART OF MARKETS, supra note 1, at 39 (Summers is quoted after
investing in a new social finance innovation—the social impact bond). See also Burand, infranote 31 and accompanying text for further discussion of social impact bonds.
4. Even Pope Francis is promoting impact investing. In June 2014, he issued a call to action to world leaders, saying “[i]t is urgent that governments throughout the world commit themselves to developing an international framework capable of promoting a market of high impact investments and thus to combating an economy which excludes and discards.” THEINVISIBLE HEART OF MARKETS, supra note 1, at 39.
5. This Article focuses on how to respond to impact investments that do not meet investors’ expectations, that is impact investments that have “gone bad.” Most of the examples cited in this Article focus on impact investments that have failed to meet investors’ financial expectations, rather than those that have failed to meet investors’ social expectations. Yet, in the impact investing market, investment disputes also can arise when there is financial or operational “over” performance by the impact investment, such that financial rewards are likely to overwhelm or distract managers’ attention from achieving social impact objectives. For example, the financial performance of a social enterprise may attract commercial investors that have little interest in the social mission of the enterprise. In some cases, notable financial success may make the social enterprise a target for acquisition by a larger commercial enterprise. Or, as happened in the microfinance sector, the financial rewards of conducting a lucrative initial public offering of a social enterprise may cause consternation among those who worry about subsequent mission drift. See, e.g., Muhammad Yunus,
http://openscholarship.wustl.edu/law_journal_law_policy/vol48/iss1/9
2015] When Doing Good Goes Bad 57
way to ensure that this nascent market stays healthy as a whole, even if individual impact investments struggle, is to develop innovative and value-aligned approaches to dispute resolution that mirror the innovations and value alignment found in impact investment deal structures.
This Article describes the state of impact investing today. In doing so, it examines trends in impact investment deal structures and documentation that distinguishes impact investments from more commercial investments. It also identifies unique challenges that may arise in disputes concerning weak or failing impact investments. To inform this discussion, this Article considers the responses of socially conscious investors to problems with their investments in troubled microfinance institutions shortly after the 2008 global recession. Finally, this Article considers the appropriateness of using international arbitration as a dispute resolution mechanism in cross-border, impact investments. This Article concludes with several suggestions for dispute resolution mechanisms that are capable of resolving disputes arising from impact investments gone bad.
I. WHAT IS IMPACT INVESTING?
While investing to advance societal goals is not a new idea, a market that self-identifies as impact investing only recently has emerged.6 The meaning of the term “impact investment” is not universally agreed upon. A growing consensus, however, recognizes that impact investing is more than investing with good intentions.7
Sacrificing Microcredit for Megaprofits, N.Y. TIMES (Jan. 14, 2011), http://www.nytimes.com/2011/01/15/opinion/15yunus.html?_r=1 (Professor Yunus, the founder of Grameen Bank and 2006 winner of the Nobel Peace Prize for his contributions to creating the microfinance sector, criticizes the commercialization of microfinance and argues that “[p]overty should be eradicated, not seen as a money-making opportunity”).
6. The term “impact investing” was first coined in 2007 at a conference convened by the Rockefeller Foundation in Bellagio, Italy. The use of financial investments to advance social goals has a much longer history, however. Some observers trace impact investing’s roots in the United States to 1950, when the United States started selling political risk insurance to US companies investing abroad. See U.S. NATIONAL ADVISORY BOARD ON IMPACT INVESTING,PRIVATE CAPITAL, PUBLIC GOOD: HOW SMART FEDERAL POLICY CAN GALVANIZE IMPACT INVESTING—AND WHY IT’S URGENT 12 (2014).
7. Paul Brest & Kelly Born, When Can Impact Investing Create Real Impact?, STAN.SOC. INNOV. REV. (Fall 2013) at 22 (with commentary by Audrey Choi, Morgan Stanley;
Washington University Open Scholarship
58 Journal of Law & Policy [Vol. 48:55
Intentions matter, of course; but so does measurement of progress toward achieving those intentions. According to the G8’s Social Impact Investment Taskforce (the “Taskforce”), “the defining characteristic of impact investment is that the goal of generating financial returns is unequivocally pursued within the context of setting impact objectives and measuring their achievement.”8
This Article adopts the definition of impact investment used bythe Global Impact Investment Network (GIIN) in its 2013 survey of 125 impact investors:9 “[i]mpact investments are investments made into companies, organizations, and funds with the intention to generate social and environmental impact alongside a financial return. They can be made in both emerging and developed markets, and target a range of returns from below market to market rate, depending upon the circumstances.”10
II. HOW BIG IS THE IMPACT INVESTING MARKET TODAY AND WHAT ARE ITS PROSPECTS FOR CONTINUED GROWTH?
As the quotes that introduced this Article indicate, some champions of impact investing see its potential power as nothing short of transformative, capable of mobilizing entrepreneurship, innovation, and capital to solve some of society’s most challenging
Sterling Speirn, W.K. Kellogg Foundation; Alvaro Rodriguez Arregui & Michael Chu, IGNIA); see also OPIC In Action, OPIC, http://www.opic.gov/opic-action/impact-investing (last visited Oct. 19, 2014) (OPIC identifies deals as “impact investments” when its partners “. . . design their very business models with an explicit and inherent intent at startup to address environmental or social issues, as well as a business model with a structure dedicated to achieving both impact and financial returns”).
8. See THE INVISIBLE HEART OF MARKETS, supra note 1, at 18 (in contrast, an “investment that results in impact that is marginal to a business’s main activity is not impact investment, though it might be viewed as ‘investment with impact’”).
9. Yasemin Saltuk et al., Spotlight on the Market: The Impact Investor Survey, GLOBAL SOCIAL FINANCE (May 2, 2014), 1, 13 available at http://www.thegiin.org/binary-data/ 2014MarketSpotlight.PDF (this survey gathered the responses of 125 impact investors at end of 2013). Because this Article examines key findings of the GIIN survey, it adopts the GIIN definition of impact investing.
10. Id. at 13; see also About Impact Investing, GLOBAL IMPACT INVESTING NETWORK(GIIN) (2014), http://www.thegiin.org/cgibin/iowa/resources/about/index.html. GIIN identifies four core characteristics of impact investing: (1) intentionality, (2) investment with return expectations, (3) range of return expectations and asset classes, and (4) impact measurement. Id.
http://openscholarship.wustl.edu/law_journal_law_policy/vol48/iss1/9
2015] When Doing Good Goes Bad 59
problems.11 Whether impact investing can live up to its promise, however, is likely to turn on whether impact investments actually deliver on their multiple bottom lines—that is, their ability to deliver financial returns alongside measurable progress toward desired social and environmental impacts.12
Many market observers are betting that impact investments will do just that, as shown by the fast growth rate of capital investment in the impact investing market. A recent survey of 125 impact investors found that these investors managed approximately $46 billion in impact investment assets as of the end of 2013.13 Survey respondents also reported that they planned to invest another $12.7 billion in 2014, while increasing the number of impact investment transactions executed in 2014 by 31 percent.14
Whether this pace of growth can and will continue is debatable. Current impact investors point to the following challenges to growing their portfolios of impact investments:
1. Shortage of high quality investment opportunities with track records
2. Lack of appropriate capital across the risk/return spectrum
3. Difficulty exiting impact investments
11. See THE INVISIBLE HEART OF MARKETS, supra note 1, at 1 (“By bringing a third dimension, impact, to the 20th century capital market dimensions of risk and return, impact investing has the potential to transform our ability to build a better society for all”).
12. John Elkington coined the term “triple bottom line” when describing the financial, social and environmental bottom lines of companies. See, e.g., JOHN ELKINGTON, CANNIBALS WITH FORKS: THE TRIPLE BOTTOM LINE OF 21ST CENTURY BUSINESS (1997).
13. See Saltuk et al., supra note 9, at 5–6 (surveyed respondents providing numerical data for 2013 and 2012 experienced 10 percent growth in capital committed between 2012 and 2013 and 20 percent growth in the number of deals executed). Impact investing is taking place across a range of sectors, but the majority of impact investing is currently concentrated in the financial services sector, including both microfinance (21 percent) and other types of financial services (21 percent). See Saltuk et al., supra note 9, at 7. This sectoral allocation may start to shift. A number of survey respondents indicated that they plan to increase their sector exposure to food and agriculture and to healthcare. Id.
14. Id. at 12–13 (surveyed respondents committed $10.6 billion and executed 4,914 deals in 2013. In 2014, they expect to invest another $12.7 billion and execute another 6,419 deals).
Washington University Open Scholarship
60 Journal of Law & Policy [Vol. 48:55
4. Lack of innovative deal/fund structures to accommodate investors’ or portfolio companies’ needs
5. Lack of common way to talk about impact investing15
These are significant concerns that deserve attention and creative solutions, but it should be noted that these are the concerns of a relatively small number of investors (125) that are already active in the impact investment market.
The real challenge here is convincing a much larger class of investors to enter the impact investment market, namely those 1,276 investment managers that currently manage more than $45 trillion in assets and have committed to incorporate social, environmental, and governance factors into their investment decisions.16 To convince these investment managers to direct some portion of the assets under their management to the impact investing market, work needs to be done to ensure that any weak or failing impact investments are dealt with efficiently and effectively. Otherwise, disappointments over the performance of a handful of impact investments may spill over and taint these investment managers’ view of the quality of the rest of the impact investing market.
III. WHAT KINDS OF DEALS ARE BEING DONE IN IMPACT INVESTING AND HOW ARE THESE TRANSACTIONS DIFFERENT FROM MORE
TRADITIONAL COMMERCIAL INVESTMENTS?
Currently, more than two-thirds of impact investing deal flow takes place in emerging markets outside the United States. Much of that deal flow is in the form of debt financing.17 Therefore, as a
15. Id. at 17. 16. See THE INVISIBLE HEART OF MARKETS, supra note 1, at 18. 17. See Saltuk et al., supra note 9, at 6–7, 23 (debt financing accounts for 62 percent of
the impact investment assets currently under management, and private equity investments amount to 24 percent). This current preference for debt financing may reflect one of the concerns identified by impact investors in the Impact Investor Survey—namely, it is difficult to exit an impact investment. Id. at 6, tbl.4 (difficulty of exiting investments ranked in the top three of perceived challenges to the growth of the impact investing market). The lack of exit options, in turn, canplace additional pressure on parties trying to resolve an impact investment dispute since it is
http://openscholarship.wustl.edu/law_journal_law_policy/vol48/iss1/9
2015] When Doing Good Goes Bad 61
general matter, the documentation of an impact investment will look very familiar to those experienced in structuring more traditional, cross-border commercial investments, particularly international debt financings.
Some impact investors, however, have developed new forms of documentation and deal structures that attempt to align their capital to the business models, including financial and social objectives, of their investees. As one impact investor has commented, “[t]he bottom line is that impact is being generated by the underlying operating entity. As investors, our job is to understand the underlying business model and determine whether we are prepared to align our capital to support it.”18
A recent study of the innovative deal structures currently used in impact investments observed that both debt and equity investors19 are modifying and adapting traditional deal structures to align the timing and amount of financial returns with the business models of their borrowers/investees.20 Some lenders offer borrowers more flexible
unlikely that a disgruntled investor can walk away from a dispute by simply selling its impact investment to another party.
18. Id. at 13. 19. Grant funders also are experimenting with new hybrid structures. For example, some
donors are developing “repayable grant” facilities that, upon the occurrence of certain agreed milestones (often operational or financial targets), convert their grants into loans that the grant recipient is expected to repay to the donor. This structure may appear counterintuitive as it effectively penalizes high-achieving grant recipients by introducing a financial liability to replace what originally was “free” money. This structure could also introduce an element of moral hazard such that grant recipients have a financial incentive not to meet the agreed milestones. The donors proposing these structures, however, appear willing to accept the risks inherent in this misalignment of incentives. Some critics might argue that grant recipients that meet certain operational or financial threshold indicators of success can afford to return the grant funding. Recycling these donor funds back to the donors, they argue, benefits all impact investment stakeholders, since relatively scarce grant resources can then made available to other grant recipients. Examples of repayable grants are available in the author’s clinic files; see also “conditionally repayable contributions” offered by the Canadian government to small businesses (conditions for these repayable contributions are described at http://www.canada governmentgrants.org/conditionally-repayable-contribution.php); repayable grants also are offered by the Global Water Foundation to small and medium enterprises and local entrepreneurs. See Grant Guidelines, GLOBAL WATER FOUND. http://www.globalwater foundation.org/index.php?page=grant (last visited June 10, 2015).
20. Diana Propper de Callejon et al., Innovative Deal Structures for Impact Investments (2014) (report) (on file with author). This study, Innovative Deal Structures for Impact Investments, is based on interviews with nearly one hundred impact investors, enterprises, legal experts, and advisors from around the world. Its key findings, which were released in
Washington University Open Scholarship
62 Journal of Law & Policy [Vol. 48:55
repayment schedules. For example, they are creating variable payment structures that are triggered when (and in some cases, only if) the borrower meets certain thresholds of revenues or cash flows. Therefore, the timing and amount of debt repayments are contingent on the borrower’s financial performance rather than a traditional, fixed payment schedule.21 Other lenders are providing for principal amortization schedules that go for as long as ten years or grace periods of eighteen to twenty-four months or more; some lenders are agreeing to forego prepayment penalties or, in a few cases, offer prepayment discounts.22
Equity investors also are attempting to align the timing and amount of dividend payments and redemption rights with the business models of their investees. In doing so, they stage dividend payments and redemption-based exits, and, in some cases, link these payments to the investee’s revenues or amount of cash on hand.23
Beyond aligning impact investors’ financial return expectations to the investee’s business model, some impact investors also attempt to embed social impact goals directly into the contractual provisions of their investments. These provisions could aim to protect against
September 2014, focus on privately held, early-stage businesses. The lead researchers were Diana Propper de Callejon and Bruce Campbell, with support from Gabi Blumberg. Id.
21. See id. One variable payment structure used by impact investors is called the “demand dividend.” The demand dividend structure, it should be noted, does not offer dividends to its investors. Rather, the demand dividend is a variation on debt royalty structures and often includes the following features: (1) a payment schedule that is tied to the cash flow of the borrower, (2) a honeymoon period (grace period) where repayment obligations are deferred, (3) a fixed payment obligation that is calculated as a multiple of the amount lent to the borrower, and (4) covenants focused on ensuring that the borrower reaches a positive cash flow. See SANTA CLARA UNIV., DEMAND DIVIDEND: CREATING RELIABLE RETURNS IN IMPACT INVESTING 3 (June 2013), available at http://www.scu.edu/socialbenefit/impact-capital/upload/ Demand-Dividend-Description.pdf.
22. See Propper de Callejon, supra note 20, at 3. 23. See id. at 2.
http://openscholarship.wustl.edu/law_journal_law_policy/vol48/iss1/9
2015] When Doing Good Goes Bad 63
unintended and undesirable social impacts or,24 conversely, to spur and measure desired social impacts.25
Other impact investors, however, do not appear to rely (or at least not as much) on contractual provisions in their investment documentation to ensure mission compliance.26 Instead, these
24. SARAH FORSTER ET AL., IMPLEMENTING THE CONSUMER PROTECTION PRINCIPLES: ATECHNICAL GUIDE FOR INVESTORS 15–16 (Nov. 2010). The German-owned, development finance institution, KfW, uses a contractual provision when making loans to microfinance institutions that aims to minimize adverse impacts on the end-users of its funding. More specifically, this contractual provision attempts to ensure that the microfinance institutions receiving loans from KfW adopt adequate customer protections for the micro-entrepreneurs that they serve. It states:
The Borrower [microfinance institution] shall fully comply with all existing and future national laws and regulations on consumer protection especially in the area of financial services. The Borrower shall in particular provide its customers with clear and comprehensive information on the main characteristics of the financial services the customers [micro-entrepreneurs] seek. The Borrower shall, for example, have thoroughly informed its customers in good time before the signing of a loan agreement on the terms and conditions of the loan in a way easily understandable for the customer. These loan agreements shall further contain such information and shall be drafted in a manner the customers are able to understand. Furthermore, the Borrower shall critically review the customer’s repayment capacities before signing a loan agreement and shall refrain from any form of unfair or even harmful debt collection practices.
Id. at 16. While some investors have included clauses like the above that require financial institutions to assess the repayment capacity of micro-entrepreneurs in both their loan and equity documentation, other investors have opted not to include such clauses in their investment documentation, and, instead, are focusing efforts on working with investees to improve client protection practices. See id. at 15–16.
25. Typically these contractual provisions are put in the form of reporting covenants, which require the investee to report to its funders on the social impact of its operations and activities. In the microfinance context, where financial inclusion is the desired social impact, these covenants can take the form of reporting provisions relating to the number of poor clients in rural areas or the number of female micro-entrepreneurs being served, for example. See generally Richard Rosenberg, Measuring Results of Microfinance Institutions: Minimum Indicators That Donors and Investors Should Track, CGAP, (June 2009), available athttp://www.cgap.org/sites/default/files/CGAP-Technical-Guide-Measuring-Results-of-Micro finance-Institutions-Minimum-Indicators-That-Donors-and-Investors-Should-Track-Jul-2009.pdf).
26. In 2013/2014, students of the ITC conducted a survey of impact investors to determine the extent to which impact investors are using contractual provisions in their investment documentation to ensure compliance with social mission goals. Christina M. Culver & Feihong Xu, University of Michigan International Transactions Clinic, Reinforcing Social Mission Through Redemption Clauses: A Survey of Industry Standards (2014) (unpublished survey) (on file with author) [hereinafter Reinforcing Social Mission Survey]. More specifically, students interviewed half a dozen impact investors with active equity investments to find out whether these impact investors used contractual provisions, such as redemption clauses, to encourage
Washington University Open Scholarship

64 Journal of Law & Policy [Vol. 48:55
investors use the pre-investment, due diligence process to assess the seriousness of the potential investee’s commitment to achieving targeted social objectives. Once the investment is made, these impact investors rely on investees’ governance structures to police the monitoring of, and compliance with, their investees’ social mission goals.27
Another factor that some impact investors leverage to shape investee behavior is the prospect, or lack thereof, of future funding. Some impact investors have indicated that they are unlikely to contribute future, additional funding to any investees that materially deviate from their stated social missions.28 The effectiveness of such a threat to withhold future investments is likely to turn on the extent to which other sources of attractive capital present themselves to the investee.
Other ways that impact is being embedded in deal structures and investment documentation include the following:
1. A social mission definition is included in the deal documentation;29
2. The use of proceeds of the investment are restricted to financing those business operations that are driving social impact outcomes;30
3. The investee’s governance structure includes the appointment of a board member with the responsibility to oversee the investee’s social impact;31
investees’ compliance with stated social mission goals. Id. at 2. Among the surveyed impact investors, only a few expressly tied social mission compliance to redemption rights. Id. at 2. Furthermore, rarely (if ever) are such redemption rights actually used to accelerate an exit. Id. at 2. Rather, those surveyed investors that link social mission to redemption rights appear to be using such rights as leverage to bring the investees to the negotiating table, while also signaling to investees (as well as to other investors, presumably) that social mission compliance is a priority. Id. at 3.
27. Id. at 4. 28. Id. at 2–3. 29. See Propper de Callejon, supra note 19, at 3. 30. Id.31. Id.
http://openscholarship.wustl.edu/law_journal_law_policy/vol48/iss1/9
2015] When Doing Good Goes Bad 65
4. Financial returns are correlated to social impact outcomes actually achieved by the investee—either directly (the higher the social impact, the higher the expected financial return)32 or inversely (a lower financial return is required if a higher social impact return is achieved); or
5. Investors are seeking to preserve the social mission objectives of their investees, even at exit.33
In this author’s opinion, this last issue presents some of the thorniest, and perhaps most controversial, deal structures and clauses in impact investing. A variety of methods have attempted to preserve social mission, a goal sometimes called “mission lock,” beyond the contractual terms of the impact investment. In some cases, the investee’s founders—presumably the people and/or institutions most concerned with maintaining control of the investee’s social mission—are granted veto power to block investor exits that conflict with that mission.34
In other cases, mission lock is being attempted through the investee’s choice of legal form and/or charter provisions. Several relatively new legal forms of corporate entities are emerging in the United States and elsewhere that can be utilized by organizations seeking to generate financial returns as well as positive social and/or environmental benefits.35 Organizations’ motivations for choosing
32. Id. In the case of a new social finance innovation, social impact bonds (SIBs), financial and social returns are correlated positively so that financial returns increase when targeted social outcomes are met or exceeded. See generally Deborah Burand, Globalizing Social Finance: How Social Impact Bonds and Social Impact Performance Guarantees Can Scale Development, 9 N.Y.U. J.L. & BUS. 447 (2013) (describing two of the first SIB structures).
33. See Propper de Callejon, supra note 20, at 3. 34. Id. The termination of valuable licenses or hikes in the royalties/fees to be paid for
such licenses also are reportedly being used by some to deter social mission drift (or at the very least, make such a drift more “painful”).
35. One new legal form in the United States is the “benefit corporation.” Adopted first in Maryland in 2010, twenty-seven states have enacted benefit corporation legislation to date. Notably, among these states, Delaware enacted public benefit corporation legislation in 2013. Alicia Plerhoples, Delaware Public Benefit Corporations 90 Days Out: Who’s Opting In?, 14 U.C. DAVIS BUS. L.J. 247, 248 (2014). Delaware Supreme Court Chief Justice Leo E. Strine, Jr. recently offered an analysis of the potential implications of Delaware’s decision to adopt public benefit corporation legislation. In his opinion, Delaware’s decision to permit a new legal form of company—the public benefit
Washington University Open Scholarship

66 Journal of Law & Policy [Vol. 48:55
one of these legal forms can be mixed. In some cases, it appears that this legal formation decision is being made by the founders. In other cases, impact investors also may be pushing the organization to incorporate as one of these new legal forms.
One’s choice of legal entity, however, is not the only way to achieve mission lock. Some organizations are including mission locks in their charter documents.36 It remains to be seen whether
corporation—is of particular significance because Delaware is the state of incorporation for the majority of American public companies and the preferred domicile for American companies seeking to go public. Consequently, he predicts that benefit corporations that hope to go public are likely to domicile in Delaware. Relatedly, Chief Justic Strine observes that one of the most important consequences of Delaware’s public benefit corporation legislation is that the Revlondoctrine is not applicable to public benefit corporations. Consequently, the board’s duty in a sale of control is fundamentally changed: namely, the board of a public benefit corporation cannot simply sell the corporation to highest bidder, but must use its own judgment to choose the best offer after considering all corporate constituencies. Leo E. Strine, Jr., Making It Easier for Directors to “Do the Right Thing”?, 4 HARV. BUS. L. REV. 235, 243–45 (2014). In addition to benefit corporation legislation, some states have enacted laws that allow other legal forms of enterprises that expressly contemplate a social mission, such as “flexible purpose” or “social purpose” corporations (California and Washington, respectively), and “low profit, limited liability companies” (L3Cs). See generally J. Haskell Murray, Corporate Forms of Social Enterprise: Comparing the State Statutes (Jan. 15, 2015), available athttp://ssrn.com/abstract=1988556. Nine states have enacted L3C legislation, but North Carolina repealed its L3C legislation effective January 2014. As of August 24, 2014, over one thousand L3Cs have been formed in the United States. Latest LC3 Tally, INTERSECTOR PARTNERS L3C,http://www.intersectorl3c.com/l3c_tally.html (last visited Oct. 26, 2014).
This is happening outside the United States too. For example, the “community interest company” is a relatively new legal form in the United Kingdom. Introduced in 2005, community interest companies now number over ten thousand. See generally THE OFFICE OF THE REGULATOR OF COMMUNITY INTEREST COMPANIES, OPERATIONAL REPORT: SECOND QUARTER 2014–2015, available at https://www.gov.uk/government/uploads/system/uploads/ attachment_data/file/365907/CIC-14-1163-community-interest-companies-operational-report-second-quarter-2014-15.pdf.
36. In 2013 the ITC provided pro bono legal support to help a L3C convert into a more traditional C Corporation at the request of an investor, but expressly included a broad social purpose in the Articles of Incorporation similar to that found in the Model Benefit Corporation Legislation (“Model Legislation”) (originally drafted by Bill Clark of Drinker, Biddle, & Reath LLP, the Model Legislation has evolved. A current version (June 2014) of the Model Legislation can be found at http://benefitcorp.net/attorneys/model-legislation.). More specifically, the Articles include a provision stating:
The purpose or purposes for which the corporation is formed are to engage in any activity within the purposes for which corporations may be formed under the Michigan Business Corporation Act, including, without limitation, creating a (i) general public benefit, meaning a material positive impact on society and the environment, taken as a whole, assessed against a third-party standard, from the business and operations of the corporation, and (ii) the specific public benefits of improving human health and
http://openscholarship.wustl.edu/law_journal_law_policy/vol48/iss1/9
2015] When Doing Good Goes Bad 67
these mission locks will prove effective.37 Similarly, it remains to be seen whether those investors that achieve an effective mission lock will be satisfied in the long term with the social performance of their investee, particularly if the mission lock limits the investee’s ability to innovate or attract additional capital needed to scale its operations.
IV. WHAT RISKS DO IMPACT INVESTMENTS PRESENT AND HOW ARETHEY CURRENTLY PERFORMING? WHAT HAPPENS WHEN AN IMPACT
INVESTMENT GOES BAD?
For the second year in a row, “[b]usiness model execution [and] management risk” top the list of impact investors’ concerns as to the most significant contributors to risk in their impact investment
providing low-income or underserved individuals or communities with beneficial products or services.
See Design Innovations for Infants and Mothers Everywhere (DIIME), Articles of Incorporation (Apr. 23, 2013) (on file with author). Some companies are including provisions in their charter documents that specify what they will not do to make profits. A notable and recent example is Ello.co, an ad-free social media network that converted to a Delaware public benefit corporation in the fall of 2014. Its new charter states, in part, that: Ello shall not for pecuniary gain:
1. Sell user-specific data to a third party; 2. Enter into an agreement to display paid advertising on behalf of a third party; and 3. In the event of an acquisition or asset transfer, the Company shall require any acquiring entity to adopt these requirements with respect to the operations of Ello or its assets.
Jonathan Shieber, Ello Raises $5.5 Million, Legally Files As Public Benefit Corp. Meaning No Ads Ever, TECH CRUNCH (Oct. 23, 2014), http://techcrunch.com/2014/10/23/ello-raises-5-5-million-legally-files-as-public-benefit-corp-meaning-no-ads-ever/ (emphasis added) (reproducing Oct. 20, 2014 memorandum executed by founders and current investors of Ello).
37. One practical but not particularly easy way that charter provisions of benefit corporations can be “unlocked” is through a vote of the requisite number of shareholders/members. For example, under the model benefit corporation legislation, shareholders can vote to terminate benefit corporation status by a two-thirds supermajority vote. Model Benefit Corp. Legislation § 105(a) (2013); see, e.g., DEL. CODE ANN. tit. 8 § 363(c)(1) (dilution or change of public benefit corporation’s commitment to pursue a public benefit must be approved by two-thirds of outstanding shares); see also DEL. CODE ANN. tit. 8 § 363(c)(2) (public benefit corporation cannot merge or consolidate with another entity if, as result of such merger or consolidation, the surviving corporation’s certificate of incorporation lacks identical provisions identifying public benefit, unless the merger or consolidation transaction received approval of two-thirds of outstanding shares of the public benefit corporation).
Washington University Open Scholarship
68 Journal of Law & Policy [Vol. 48:55
portfolios.38 To combat this concern, most impact investment capital (89 percent) has gone to companies that are in a post-venture stage, and hence have a proven track record of performance.39 A much smaller amount of impact investment capital (11 percent) has been invested to date in seed, start-up, or venture stage enterprises.40 As impact investors start to invest in less proven enterprises, the chances of underperformance—both in terms of social impact and financial expectations—are likely to increase.41
38. Saltuk et al., supra note 9, at 34 (other contributors to the risk of impact investment portfolios, in descending order of concern to surveyed impact investors, include: liquidity and exit risk; market demand and competition risk; country and currency risk; macroeconomic risk; financing risk; and perception and reputational risk); see also Paul Brest & Kelly Born, supranote 7, at 29 (according to Alvaro Rodriguez Arregui and Michael Chu, impact investors have a higher tolerance for risk than do traditional investors).
39. Saltuk et al., supra note 9, at 7 (35 percent growth stage, 44 percent mature and privately held, and 10 percent mature and publicly traded).
40. Id.41. See, e.g., David Bank, E+Co Avoids Litigation—Barely—and Emerges Persistent,
HUFFINGTION POST BLOG (Oct. 3, 2012), http://www.huffingtonpost.com/david-bank/eco-avoids-liquidation-ba_b_1932503.html. This was, at least in part, a challenge faced by the now defunct E+Co, which provided capital and technical assistance to sustainable energy entrepreneurs in Central America, Southeast Asia, and Sub-Saharan Africa. According to co-founder Christine Eibs Singer, E+Co’s portfolio of investments faced challenges due to a mismatch between the increasing amount of capital that E+Co could tap to finance small and growing businesses and the diminishing amount of grants and other funding available to E+Co to provide technical assistance to those same investees. She is quoted in the press, saying, “[t]he portfolio had grown in volume, but it was a lot of startup entrepreneurs and they needed hand-holding. The challenge is how do you fund the technical assistance to de-risk these investments?” Id. In 2012, E+Co faced a restructuring of its investment portfolio and winding up of operations. Nearly half of the E+Co portfolio was written off or down. The remaining portfolio was transferred to private equity funds in debt-for-equity exchanges. Id.; see also Scott Anderson, Weekly Roundup: E+Co’s Slow Burn and What it Means for Impact Investing, NEXTBILLION (Oct. 13, 2012), http://nextbillion.net/blogspot.aspx?blogid=2977. According to Anderson, E+Co’s experience “raises questions beyond management, governance, due diligence, and investment squabbles.” Id. Given that E+Co was viewed as a trailblazer and, prior to its demise, a success story in impact investing, Anderson asks what is an appropriate fund model for impact investing, how many boards/investors understand the risks to their capital when they invest in impact investment funds, and “how many truly understand (and are comfortable with) what patient capital means in practice?” Id. Over two years later, the wind-up of E+Co is still discussed within the impact investing community as observers look for lessons to take away from this experience. In May 2014, Scott Anderson returned to this story in an interview with Christopher Aidun, CEO and Managing Director of Persistent Energy Partners, the company that acquired E+Co’s Africa portfolio of investments as part of E+Co’s restructuring plan. Prior to his current leadership roles at Persistent Energy Partners, Mr. Aidun served as the managing director of E+Co. At E+Co, Mr.
http://openscholarship.wustl.edu/law_journal_law_policy/vol48/iss1/9
2015] When Doing Good Goes Bad 69
Most impact investors, however, report that their impact investment portfolios currently perform in line with their social impact and financial return expectations.42 What is more, a sizeable number of impact investments are exceeding their investors’expectations.43 Where there have been disappointing results, these are
Aidun helped negotiate the debt restructuring plan with key E+Co creditors, which led to E+Co’s asset transfer of its African portfolio to Persistent Energy Partners, the for-profit company co-founded by Mr. Aidun. Scott Anderson, A Renewable Proposition (Part 1): Formerly E+Co, Persistent Energy Partners Looks to Solar Horizon, NEXT BILLION (May 20, 2014), http://nextbillion.net/blogpost.aspx?blogid=3885. According to Mr. Aidun, the reason that E+Co’s business model did not work was due to the number and size of the deals it was making:
Managing a large number of small investments [most of E+Co’s investments ranged from $200,000 to $250,000] requires at least as much attention as managing a large number of large investments. In fact, investing in small entrepreneurs in developing markets means that even greater investment management effort is required per investment. E+Co didn’t earn enough in management fees and grants to support the size of investment staff needed to manage its portfolio. So even with all the sophistication of a private equity fund, E+Co was doomed.
Id. Audrey Desiderato, co-founder and COO of SunFunder, a solar finance company, draws different lessons from the E+Co experience. After disclosing that one of the founders of E+Co was an important mentor of hers, Ms. Desiderato identifies five lessons to be gleaned from E+Co’s demise: (1) start with a for-profit model; (2) create investment products and processes and harness technologies aimed at dealing with the fact that many of the target portfolio companies for investment cannot furnish investors ideal levels of financial and customer data; (3) stay in physical proximity to investments to observe their operations; (4) create a financial eco-system that graduates target portfolio companies from one source of capital to another and fosters investor coordination (rather than competition); and (5) match funding sources’ expectations to target portfolio companies’ risk profiles; match the skills and talents of board, staff, and advisors to the investing entity’s business model; and ensure that all involved understand mission goals. Audrey Desiderato, What Can SunFunder Learn from E+Co,SUNFINDER (July 24, 2014), http://blog.sunfunder.com/post/92753292356/what-can-sunfunder-learn-from-e-co.
42. Saltuk et al., supra note 9, at 31. Note that while the return expectations of impact investors can vary greatly, most impact investors expect some amount of a financial return. Id.at 13 (80 percent of surveyed investors think it is “essential” that impact investments generate financial returns). Some impact investors are “financial first” oriented, meaning that they seek to optimize financial returns provided a base threshold of social returns is met. Others are “impact first” investors; they seek to optimize social returns provided a base threshold of financial returns is met. Others fall somewhere in between. JESSICA FREIREICH & KATHERINE FULTON, INVESTING FOR SOCIAL AND ENVIRONMENTAL IMPACT: A DESIGN FOR CATALYZING AN EMERGING INDUSTRY 31–32 (2009) (identifies categories of impactinvestors based on the investors’ primary investment motivations).
43. Of this group, 20 percent report that their investments are outperforming against their social impact expectations, and 16 percent report outperformance against their financial returnexpectations. Saltuk et al., supra note 9, at 31.
Washington University Open Scholarship
70 Journal of Law & Policy [Vol. 48:55
more often due to financial underperformance than to social impact underperformance.44
This is not to suggest, however, that impact investing is immune to performance problems, financial or otherwise.45 The most notable example of what can go wrong in impact investing can be found in the microfinance sector, which currently accounts for slightly more than one-fifth of the impact investment market.46 The microfinance sector faced serious refinancing challenges when the 2008 financial downturn constrained liquidity on a global scale. While the number of microfinance institutions that defaulted as a result of this liquidity crunch was not as large as some (including this author) feared,47
some microfinance investors unhappily found themselves in the middle of negotiating and structuring debt workouts for troubled microfinance institutions.48
A 2009–2010 study of seventeen microfinance debt workouts (sixteen microfinance institutions and one regional microfinance investment fund) found a variety of reasons for the failures that led to these workouts.49 In most cases, microcredit portfolio deterioration was the proximate cause of the problem. Other factors, however, such as weak management and governance within the microfinance institutions, adverse macroeconomic conditions, and difficult political environments also contributed to performance problems.50 In two cases, investors identified fraud in the microfinance institutions.51 Of particular relevance to this discussion, however, is how these
44. Only 1 percent reported underperformance on social impact, while 9 percent reported financial underperformance relative to expectations. Id.
45. See, e.g., supra note 38 and accompanying text. 46. See supra note 12. 47. See Deborah Burand, Deleveraging Microfinance: Principles for Managing Voluntary
Debt Workouts of Microfinance Institutions, 27 J.L. & COM. 193, 199–200 (2009). 48. See, e.g., INTERNAT’L ASSOC. OF MICROFIN. INVESTORS, MICROFIN. LENDERS
WORKING GROUP, AND MORGAN STANLEY, CHARTING THE COURSE: BEST PRACTICES AND TOOLS FOR VOLUNTARY DEBT RESTRUCTURINGS IN MICROFINANCE (2011), available at http://www.morganstanley.com/globalcitizen/pdf/IAMFI.pdf [hereinafter INTERNAT’L ASSOC.OF MICROFIN. INVESTORS] (approximately six percent of the loans made by microfinance investment intermediaries required restructuring during this period).
49. Id. at 5 (approximately 6 percent of the loans made by microfinance investment intermediaries required restructuring during this period).
50. Id. 51. Id.
http://openscholarship.wustl.edu/law_journal_law_policy/vol48/iss1/9
2015] When Doing Good Goes Bad 71
microfinance investors behaved toward the troubled investee, and toward each other, when confronted with investments going bad.
One key finding is that the diversity of lenders to these microfinance institutions made debt workouts especially challenging. Microfinance, like much of impact investing, has attracted investors with a wide range of investment motivations and return expectations.52 The sheer number of lenders with loans outstanding to a single microfinance institution complicated some of these workouts.53 Additionally, the lenders often were quite diverse with respect to their risk tolerances, sources of funding, legal mandates (e.g., some were not legally authorized to receive equity stakes in return for troubled debt assets), and deliberative processes.54 Taken together, this diversity slowed the workouts, sometimes to the detriment of the troubled microfinance institution that needed a fast resolution of its debt problems.
The microfinance institutions, however, were not the only ones who suffered from the diverse range of interests evidenced by the lenders. Some intercreditor relationships suffered as well. As one representative of a microfinance investment fund tellingly observed: “To those who take the money and run . . . people don’t forget. Behavior comes back to haunt you.”55 Another key finding was that, while social objectives mattered, investors’ perceived fiduciary responsibilities to their own sources of capital sometimes led them to prioritize capital protection over advancement of the investee’s social mission.56 One representative of a microfinance investment intermediary framed this tension as follows: “We are continuing to
52. See discussion of varying investor expectation supra note 42. 53. One representative of a microfinance investment fund observed that organizing a large
group of lenders was like “herding cats.” INTERNAT’L ASSOC. OF MICROFIN. INVESTORS,supra note 48, at 7.
54. Id. at 7–8.55. Id. at 7. 56. Id. at 7–8. Socially-motivated lenders noted that, like more commercial lenders, they
too had fiduciary responsibilities to their stakeholders and that the repayment of their outstanding loans to microfinance institutions was necessary to support the financing of future investments. As a result, in some cases, some socially-motivated lenders soundly rejected any workout scenario that would have provided them with restructuring terms that were less favorable from a financial standpoint than those offered to more commercially-oriented co-lenders.
Washington University Open Scholarship
72 Journal of Law & Policy [Vol. 48:55
learn as a social investor what the balance is in protecting investors’capital and being patient capital.”57
A third, perhaps not surprising, finding is that investors that have gone through a workout are changed as a result of that experience and may approach new investments and potential co-lenders with more caution and suspicion. For example, some investors that participated in microfinance debt workouts subsequently decided to engage more rigorous due diligence processes in hopes of avoiding another workout situation.58 Others concluded that their standard loan agreements contained flaws that weakened investor claims on the borrower, particularly vis-à-vis other lenders. These investors, therefore, decided to take steps to improve their loan documentation and processes, including making better (or, for some, any) use of local counsel to enforce legal claims on borrowers’ assets.59 Still others considered adding new covenants to their loan agreements that would attempt to shape a troubled borrower’s behavior toward its investors60 and penalize or forestall any preferential treatment by the borrower of some lenders over others.61
57. Id. at 7. 58. Id. at 17 (Microfinance investors determined to strengthen “their due diligence, loan
documentation, monitoring and restructuring capabilities.”). 59. Id. at 9, 17. 60. Id. at 39. For example, some lenders determined that, in the future if a borrowing
microfinance institution became distressed, they would propose that all lenders to that microfinance institution should amend their loan documentation so as standardize the timing and content of the reports and notices required of the borrower. This would ensure that information was shared equally among all lenders and no lender would benefit from getting borrower information faster than others. This standardization also would make it easier for the troubled MFI since it would no longer bear the administrative burden of meeting multiple reporting requirements.
61. Id. at 33–39. For example, some lenders involved in these microfinance workouts later proposed adding a negative covenant to their loan documentation that would prohibit any early redemption or prepayment by a troubled microfinance institution of its debt obligations. This covenant was intended in part to preserve the microfinance’s net cash flow. It was also intended to protect lenders who had provided borrower-friendly financial terms and conditions from being disadvantaged should the borrower try to first prepay its more onerous debt obligations to others. Id. at 39. The irony here is that some borrowers with limited cash on hand paid down their more expensive commercial debt obligations at the expense of servicing cheaper debt obligations to more socially-motivated lenders. While a wholly rational decision from the point of view of the borrower, this practice did not sit well with disadvantaged lenders. More specifically, some “social impact first” lenders made it clear that they were “unwilling to
http://openscholarship.wustl.edu/law_journal_law_policy/vol48/iss1/9
2015] When Doing Good Goes Bad 73
A fourth finding is that investors were likely to try, at least at the outset, managing disputes in a coordinated and consensual fashion outside of more formal mechanisms such as litigation or bankruptcy proceedings.62 Lenders, however, often were slow to form intercreditor committees to engage collectively with the troubled borrower, 63 and, as a result, lost valuable time that could have been spent responding to the weakening financial positions of the microfinance institution.64 In part, these delays may have been due to the relative inexperience in managing debt workouts of some of the individuals involved.65
assume a de facto subordinated position or outcome relative to other [more commercially-oriented] investors.” Id. at 7–8.
62. Id. at 10. Because of concerns about the lack of clear-cut bankruptcy laws in the emerging markets where these troubled MFIs were operating, and worries that forced liquidation strategies could backfire “given the challenge in servicing microloans and the likelihood that client repayment [would] plummet once an MFI’s imminent closure [became] public,” lenders involved in these microfinance workouts generally preferred to pursue voluntary restructurings.
63. Id. at 7. In nearly all cases, lenders formed intercreditor committees to engage with the troubled microfinance institution; but, there were numerous instances where lenders did not respond with sufficient urgency or had problems forming a lender group that was able to negotiate collectively and present a unified position in negotiations with the borrower.
64. Id. Only a small number of the creditor committees entered into formal intercreditor or standstill agreements. Id. at 7.
65. Id. at 8 (microfinance investment intermediaries involved in these workouts had “almost no staff members in their microfinance investment departments with prior debt workout experience”). To respond to this challenge and help the microfinance sector as a whole learn from these voluntary debt workout experiences, a working group of investors in microfinance (organized under the auspices of IAMFI) secured the pro bono services of the ITC during the 2009–2010 academic year to produce four tools to facilitate smoother debt workouts of microfinance institutions in the future. One product was the development of Microfinance Voluntary Debt Workout Principles (“Microfinance Workout Principles”). The Microfinance Workout Principles were informed by guidelines applied to negotiations of commercially-oriented, cross-border debt workouts in the financial sector, such as those developed by the International Federation of Insolvency Professionals (INSOL). See, e.g., INSOL, STATEMENT OF PRINCIPLES FOR A GLOBAL APPROACH TO MULTI-CREDITOR WORKOUTS (2000), available at http://www.insol.org/pdf/ Lenders.pdf. The Microfinance Workout Principles draw on these guidelines, but then were adapted to respond to the unique characteristics of microfinance and investors in microfinance. See INTERNAT’L ASSOC. OF MICROFIN. INVESTORS, supra note 48, at 21–24. Another product was the development of an Intercreditor Agreement Template to guide investors in creating ex post intercreditor agreements. See id. app. 5, at 25–31.
Washington University Open Scholarship

74 Journal of Law & Policy [Vol. 48:55
So, what can the microfinance experience teach the impact investing market more generally about dispute resolution? One obvious lesson from these microfinance debt workouts, which may hold true for other types of troubled impact investments, is that an impact investor’s commitment to achieving both a financial and a social return will be tested when an impact investment begins to underperform financially. It is likely that financial considerations ultimately will guide investors’ responses—even more socially-motivated investors.66 Furthermore, the wide variety of investors attracted to impact investing can slow and complicate the resolution of a troubled impact investment, should a workout become necessary. Coordinating investors likely will become still more challenging when the multiple investors that are party to a dispute have opted for different mechanisms to resolve disputes, and, in some cases, have chosen the laws of different jurisdictions to govern their investment documentation.
If this microfinance experience is indicative of how other disputes might play out in impact investing, investors are likely, at least initially, to attempt to resolve impact investment disputes on a consensual and informal basis outside of more formal mechanisms. Furthermore, given that so much of impact investing today is in the form of debt investments, debt workouts likely will be accomplished through the establishment of intercreditor committees, and ex post intercreditor agreements or standstill agreements.
A third product was the creation of a debt restructuring menu of options, outlining various alternatives available to investors to encourage lender participation in voluntary debt workouts. See id. app. 6, at 32. The last product was a Microfinance Loan Covenant Review. To complete this review, students in the ITC researched loan agreements in commercial and microfinance contexts and reviewed, confidentially, two mainstream and four microfinance loan agreements. The review identified covenants that lenders might incorporate into their future loan documentation to microfinance institutions to further mitigate risk, such as restrictions on the borrower’s ability to make distributions to shareholders; restrictions on consolidations and mergers; insurance coverage requirements; and compliance with anti-corruption, anti-terrorism and anti-money laundering laws. The review also identified variations in definitions and calculation methods of common covenant items that could benefit from harmonization in the future. See id. app. 7, at 33–39.
66. See, e.g., INTERNAT’L ASSOC. OF MICROFIN. INVESTORS, supra note 48, at 7 (quoting a microfinance investor who noted that “All of us want to get our money back. This is no different from the ‘world.’”).
http://openscholarship.wustl.edu/law_journal_law_policy/vol48/iss1/9
2015] When Doing Good Goes Bad 75
Finally, it is likely that the contractual provisions currently included in impact investment documentation will shift in content and grow in importance as the impact investment market gains more experience dealing with conflicts that may arise from these investments. One other likely result is that some of the complexity being built into the structures of impact investments may give way to simpler transactions—particularly for low-value transactions where the cost of enforcing a complex payment provision or complex deal structure threatens to overwhelm the amounts in dispute.
V. HOW ARE IMPACT INVESTMENTS PLANNING TO RESOLVE DISPUTES? WHAT CONSIDERATIONS ARE RELEVANT? HOW CAN WE
CREATE MORE EFFECTIVE MECHANISMS TO RESOLVE DISPUTES ARISING FROM IMPACT INVESTMENTS GONE BAD?
Impact investors appear to be taking a variety of approaches to mitigate or avoid the possible risks of impact investing. In many cases, the most effective and practical approach to managing these risks may be to look beyond the four corners of the investment documentation. Yet, the underlying investment documentation still will need to include some form of dispute resolution mechanism. Furthermore, while investors and investees may not be inclined to ask (or pay) their lawyers to tailor dispute resolution provisions to the idiosyncrasies that shape their particular impact investment transactions, the act of merely dropping boilerplate dispute provisions from commercially-oriented agreements into impact investment agreements is hardly appropriate—particularly in impact investments where great care has been taken to introduce novel structures or terms to reflect the transacting parties’ social motivations.
Given the nascent stage of impact investing, the current body of research about which dispute resolution processes are most appropriate for particular types of disputes has not yet extended to disputes arising out of impact investments, especially disputes arising out of the social impact goals of the investment. To the extent that impact investment disputes arise from social mission-oriented expectations, it is worth considering, even if just hypothetically, which dispute resolution mechanisms are most appropriate to respond to such disputes and to explore what modifications or improvements
Washington University Open Scholarship

76 Journal of Law & Policy [Vol. 48:55
could be made to enhance the effectiveness of these mechanisms when applied to impact investments.
Arbitration is currently the preferred method of resolving international commercial disputes.67 As such, it should not be surprising that many impact investors also opt to resolve cross-border investment disputes through international arbitration.68 In part, impact investors’ preference for arbitration may be due to the fact that most impact investments are taking place in emerging markets, where the efficiency and impartiality of judicial systems may be viewed with skepticism by foreign investors.69 In the commercial context, however, international arbitration is not only preferred by those who worry that the opposing party is coming from a country with an inefficient or unreliable judicial system. Often, international arbitration is favored over litigation by parties seeking a quicker, more private proceeding that is subject to more limited discovery rules. Alternatively, the parties may want to ensure that the dispute is presided over by a specialist who is knowledgeable in the field from which the dispute arises.70 Another important benefit of international
67. See, e.g., GARY B. BORN, INTERNATIONAL COMMERCIAL ARBITRATION 94 (2d ed. 2014); see also S.I. Strong, Beyond International Commercial Arbitration? The Promise of International Commercial Mediation, 45 WASH. U. J.L. & POL’Y 11, 11–12, 27 (2014).
68. In 2012–2013, a legal working group of in-house lawyers for impact investors and social enterprises from the Aspen Network of Development Entrepreneurs (ANDE) noted the growing use of arbitration clauses in impact investment documentation and asked the ITC to create a guide for drafting arbitration clauses for cross-border investment transactions in social enterprises. See DEBORAH BURAND, WHITNEY SCHNEIDER—WHITE & JAY SPRINGER, ASPEN NETWORK OF DEV. ENTREPRENEURS, Guide to Drafting Arbitration Clauses for Cross-Border Investment Transactions in Social Enterprises: Annotated Model Arbitration Clause and Annotated Model Multi-Tier Dispute Resolution Clause 5 (2013) (on file with author) [hereinafter ANDE Arbitration Guide].
69. In many developing countries, even if there is a functioning and reputable judicial branch, courts may experience significant backlogs, which can add to lengthy delays in resolving disputes. For example, one commentator has noted that there are “habitual delays of up to 15 years” in litigating commercial disputes in India. Ramon Gosh, Commercial Disputes in India, Vol 9, Issue 3. Investigative Intelligence (2011), available at http://www.kroll.com/ media/pdf/articles/Asian-Mena_Counsel_Ramon_Ghosh_May2011.pdf; see also India—Doing business in, Chambers & Partners Legal Practice Guide, Litigation 2014–2015, available athttp://www.chambersandpartners.com/guide/practice-guides/location/241/6600/1028-0.
70. See generally WHITE & CASE & QUEEN MARY UNIVERSITY OF LONDON, 2010INTERNATIONAL ARBITRATION SURVEY: CHOICES IN INTERNATIONAL ARBITRATION 2–3(2010) (stating that arbitration is widely used to resolve international disputes because of its flexibility). Parties can choose governing law, place of arbitration, arbitration institution (if
http://openscholarship.wustl.edu/law_journal_law_policy/vol48/iss1/9
2015] When Doing Good Goes Bad 77
arbitration is the relatively easy enforcement of arbitral awards as a result of international treaties created to promote the recognition and enforcement of arbitral awards.71
Presumably, impact investors (and, possibly, their investees) share similar perceptions of the advantages of arbitration for resolving disputes arising in cross-border impact investments. But is arbitration well suited for resolving disputes between an impact investor and its investee, or among impact investors that have co-invested in the same investee? Put differently, are the perceived benefits of arbitration likely to be realized in an impact investment dispute?
For the purpose of this analysis, this Article focuses on four considerations that are likely to be important when fashioning an effective dispute resolution mechanism for impact investing:
(1) knowledge/skills of decision-makers charged with resolving the dispute;
(2) speed of proceedings;
(3) adversarial/private nature of proceedings; and
(4) cost of proceedings.
A. Knowledge/Skills of Decision-Makers
One perceived benefit of arbitration is that parties can control who will resolve their dispute. In theory, parties can pick an arbitrator who understands their business goals, and the context in which the dispute arises, yet is also impartial.72 On the face of it, this sounds like a
used), and arbitrators, among others. See also William S. Fiske, Should Small and Medium-Size American Businesses “Going Global” Use International Commercial Arbitration?, 18 TRANSNAT’L LAW 455, 481 (2005) (“Before opting out of litigation and, instead, into arbitration, American-based transborder businesses should consider three simple variables: (a) the nature of the transaction at issue; (b) the legal tradition of their trade partner’s country; and (c) the local judiciary’s expertise with the relevant commercial issue”).
71. Strong, supra note 67, at 27–28. 72. Susan D. Franck, A Survival Guide for Small Businesses: Avoiding the Pitfalls in
International Dispute Resolution, 3 MINN. J. BUS. L. & ENTREPRENEURSHIP 19, 28 (2004). Franck points out that it may be at the negotiation stage to gauge what disputes, if any, will arise in connection with the transaction. Id. She notes that parties may be better situated looking for an arbitrator with a helpful background after a dispute arises and facts/issues have crystallized. Id. She also cautions against defining too narrowly the required attributes of an
Washington University Open Scholarship
78 Journal of Law & Policy [Vol. 48:55
good idea for impact investment disputes too, particularly given the very limited experience that sitting judges (and possibly juries) may have in considering impact investment disputes. In today’s world,however, where are the arbitrators who are skilled and knowledgeable about social enterprises and impact investing?
A lack of arbitrator expertise in impact investing raises the likelihood of unpredictable dispute resolution processes and outcomes, which in turn can significantly undermine investor confidence. As a result, new investors may delay their entry into, or existing investors may hasten their exit from, the impact investing market. Accordingly, unless initiatives are launched to develop impact investment arbitrators or to educate existing arbitrators about the distinguishing features of impact investing, today’s arbitrators are no more likely to bring specialized knowledge to impact investing than their judicial counterparts.
One possible solution is to establish arbitral tribunals that use arbitrators with specialized expertise in impact investing.73 While the idea of creating an “impact investing tribunal” could be useful in the future as the impact investing market matures and deal flows increase, the establishment of a niche tribunal for the impact investing market does not adequately solve today’s problem—namely, the current lack of arbitrators who are knowledgeable about impact investing. Happily, however, the answer to that problem just might reside in the impact investing market itself.
Currently, the world of international arbitrators is populated for the most part by lawyers and judges, but that has not always been the case.74 There is no legal requirement that arbitrators must be
arbitrator, as overly “prescribing attributes for arbitrators at the contractual stage does a disservice to a business’ commercial objective to have a flexible and enforceable dispute resolution mechanism.” Id.
73. See Fiske, supra note 70, at 477–78 (describing, for example, the emergence of niche arbitral tribunals, such as the American Arbitration Association’s E-Commerce Dispute Management Protocol, which is technology focused dispute resolution service for b2b internet transactions; the Grain and Feed Trade Association’s arbitrations for commercial disputes over sales of grain and herds; and the World Intellectual Property Organization’s (WIPO’s) arbitrations focusing on domain name dispute resolution).
74. See Thomas J. Stipanowich & Zachary P. Ulrich, Arbitration in Evolution: Current Practices and Perspectives of Experienced Commercial Arbitrators 43–44 (Legal Studies Research Paper Series, Paper No. 2014/30, 2014), available at http://papers.ssrn.com/sol3/
http://openscholarship.wustl.edu/law_journal_law_policy/vol48/iss1/9
2015] When Doing Good Goes Bad 79
members of the bar.75 One possible solution to the lack of qualified arbitrators with impact investment experience is to seek potential arbitrators from within the growing ranks of impact investing professionals.
Another, perhaps more practical, approach is to introduce expert testimony from impact investing professionals in arbitration. Indeed, some commentators argue that, given that arbitration’s evidentiary rules and discovery requirements are less onerous than those found in litigation, arbitration is better suited than litigation to using expert evidence effectively.76 Dispute panels involving experts from various disciplines have long been used in construction and securities/brokerage disputes.77 There is no reason why impact investing should not do so too. Furthermore, impact-investing experts may be particularly useful in helping arbitrators craft appropriate remedies for an impact investment dispute. This may be particularly true where the issue at stake is not purely monetary.
B. Speed of Proceedings
Speed is another reason that parties sometimes choose arbitration. In the resource-constrained world of small and medium-sized enterprises, a fast decision or resolution of a dispute often is valued more highly than a favorable outcome.78 The rapid resolution of disputes may be critical to keep fundamentally strong impact investments on track toward achieving their financial and social objectives, and also to build and maintain the confidence of new and existing impact investors, so they will be inclined to make additional
papers.cfm?abstract_id=2519196 (citing antecedents of modern arbitration practice, which included merchant and professional guilds to resolve disputes of their members).
75. Id. at 10. 76. See George Ruttinger & Joe Meadows, Using Experts in Arbitration, 62 DISP. RESOL.
J. 46, 47–48 (2007) (stating that arbitration offers more opportunities for using and presenting expert testimony than litigation).
77. Stipanowich & Ulrich, supra note 74, at 44. 78. According to a survey of small and medium enterprise (SME) respondents, the top
requirement of a dispute resolution mechanism was speed; the second ranked requirement was a favorable outcome. See ROB VAN DER HORST, RENATE DE VREE, & PAUL VAN DER ZEIJDEN,EIM BUSINESS & POLICY RESEARCH, SME ACCESS TO ALTERNATIVE DISPUTE RESOLUTION SYSTEMS 67 (2006).
Washington University Open Scholarship
80 Journal of Law & Policy [Vol. 48:55
impact investments. Unfortunately, in practice, arbitration is not always faster than litigation.79
On the other hand, steps are being taken to establish expedited or fast track procedures for commercial arbitration.80 According to a recent survey of arbitrators, expedited procedures are most likely to be used in commercial arbitrations with relatively low-value amounts in dispute.81 Given that most impact investments are also relatively small,82 use of expedited or fast track procedures may be necessary to increase the efficiency of arbitration as a dispute resolution mechanism for impact investment disputes.
79. Strong, supra note 6758, at 26 (internal citations omitted) (noting current discontent with international arbitration arising from perception that arbitral processes have become “too slow, expensive and legalistic”).
80. See, e.g., INTERNATIONAL CENTER FOR DISPUTE RESOLUTION, INTERNATIONAL DISPUTE RESOLUTION PROCEDURES, INTERNATIONAL EXPEDITED PROCEDURES 8 (2014).
81. Stipanowich & Ulrich, supra note 74, at 39 (Chart FF). In a survey of arbitrators’ experience with streamlined or fast track arbitration procedures, Stipanowich and Ulrich found that fast track procedures in arbitration were used most prevalently in low value disputes. In response to the question, “have you served as an arbitrator in a case under streamlined or fast track procedures involving disputes” of certain dollar amounts, survey respondents answered “yes” at the following rates:
Under $100,000: 88 percent
From $100,000 to $499,000: 43 percent
From $500,000 to $999,000, 21 percent
From $1 million to $4.99 million: 17 percent responded yes
From $5 million to $9.99 million: 2 percent
From $10 million to $49.9 million, 2 percent
$50 million or more: 2 percent Id.
82. See supra note 14.
http://openscholarship.wustl.edu/law_journal_law_policy/vol48/iss1/9
2015] When Doing Good Goes Bad 81
C. Adversarial/Private Nature of Proceedings
Parties sometimes choose arbitration over litigation because of the perception that litigation is more polarizing and can cause already challenged relationships among the parties to deteriorate further, particularly if grievances are aired in a public courtroom. At first blush, a less polarizing, dispute resolution mechanism than litigation sounds like a good idea for impact investment disputes too, particularly given that so much of impact investing is based on aligning the values and return expectations of investors and investees. But is arbitration any friendlier than litigation? And, perhaps even more important, is the privacy afforded most arbitral decisions healthy for the impact investing market?
One can argue that the impact investing market needs its missteps to be widely shared so that the learnings gleaned from those missteps can prevent others from making the same mistakes.83 Moreover, important public policy consequences may arise from a failed impact investment. To resolve such disputes in secret could have damaging implications that go far beyond the impact investing market, particularly when impact investment transactions are grounded in private/public partnerships to address a thorny societal problem.84
Accordingly, parties considering impact investment arbitration may decide that it is not only in the impact investing market’s broader interest to forego the confidentiality that often accompanies commercial arbitration, but that it also is in the broader societal interest to bring their impact investment dispute proceedings out into
83. For example, Jeffrey Liebman points to the need for “high value learning” to emerge from the experimentation taking place with social impact bond structures so that lessons from these transactions can be shared broadly and quickly with others putting together new deals. JEFFREY B. LIEBMAN, CENTER FOR AMERICAN PROGRESS “SOCIAL IMPACT BONDS: APROMISING NEW FINANCING MODEL TO ACCELERATE SOCIAL INNOVATION AND IMPROVE GOVERNMENT PERFORMANCE” 20 (2011).
84. Social impact bonds and other government-sponsored “pay for success” financings are examples of impact investments that deliberately align private and public interests in a financial transaction. See generally Center for American Progress Fact Sheet: Social Impact Bonds, CNTR. FOR AMERICAN PROGRESS, available at https://www.americanprogress.org/issues/ economy/report/2014/02/12/84003/fact-sheet-social-impact-bonds-in-the-united-states/.
Washington University Open Scholarship
82 Journal of Law & Policy [Vol. 48:55
the open.85 This is most likely to be relevant for those impact investments where significant public policy considerations are at stake.
D. Costs of Proceedings
Even if knowledgeable arbitrators can speedily reach decisions in the international arbitration of impact investment disputes, while preserving some semblance of amicable and transparent proceedings, costs remain a problem. In short, the costs involved in arbitrating an impact investment dispute may overwhelm the sums in question.86
Managing costs in dispute resolution is not a problem unique to impact investments, of course. Small and medium enterprises have
85. The idea of opening arbitration proceedings to the public when public interests are involved is not as radical as it might first appear. A significant step was taken recently in this regard by the United Nations Commission on International Trade (UNCITRAL) in 2013, which adopted a set of rules aimed at opening these types of dispute proceedings to the public (the “Transparency Rules”). UNITED NATIONALS COMMISSION ON INTERNATIONAL TRADE LAW,UNCITRAL RULES ON TRANSPARENCY IN TREATY-BASED INVESTOR-STATE ARBITRATION, 6 (2014), available at http://www.uncitral.org/pdf/english/texts/arbitration/rules-on-transparency/ Rules-on-Transparency-E.pdf. The Transparency Rules came into effect on April 1, 2014. TRANSPARENCY REGISTRY (A REPOSITORY FOR THE PUBLICATION OF INFORMATION AND DOCUMENTS IN TREATY BASED INVESTOR STATE ARBITRATION), Introduction, UNICITRAL (2015), http://www.uncitral.org/transparency-registry/en/introduction.html. Subsequently, the Mauritius Convention on Transparency was adopted to ensure application of the Transparency Rules among ratifying governments. The Mauritius Convention on Transparency opened for signature on March 17, 2015. UNIS (United Nations Information Service) Press Release, March 17, 2015, “Signing Ceremony for the United Nations Convention on Transparency in Treaty-based Investor-State Arbitration”, available athttp://www.unis.unvienna.org/unis/en/pressrels/2015/unisl214.html. This transparency initiative was fuelled by the view that these disputes are likely to involve issues of public interest and uses of taxpayer funds such that confidentiality concerns of the disputing parties should be balanced against the public interests at stake. See generally FAQ—UNCITRAL Rules on Transparency in Treaty-based Investor-State Arbitration, “What is the purpose of the Rules on Transparency?”, UNCITRAL (2014), available at http://www.uncitral.org/uncitral/uncitral_ texts/arbitration/2014Transparency_FAQ.html#purpose. Related, another potentially useful tool is to create a form of registry for publication of information relevant to impact investment arbitration awards that involve significant public policy considerations and actors. See, e.g., id.
86. While the average size of an impact investment transaction in 2013 was approximately $2 million, impact investment transactions vary in size from thousands of dollars to several millions of dollars. See supra note 14, describing the size of capital flows and number of impact investments made with that capital in 2013.
http://openscholarship.wustl.edu/law_journal_law_policy/vol48/iss1/9
2015] When Doing Good Goes Bad 83
long faced problems of cost when turning to arbitration to resolve cross-border disputes.87
One possible cost-saving response is to reconsider the type of legal fee arrangements that are most appropriate for impact investment disputes. How might alternative fee arrangements be structured? Should model agreements or templates be created to demonstrate alternative fee arrangements for impact investment disputes? When, if ever, should pro bono or low bono arrangements be encouraged?
Arbitrators willing to provide pro bono services do exist, but they are rare and more willing to forego fees when disputes involveindividuals, rather than companies.88 On the other hand, most law firms have been unwilling, to date, to take on international arbitrations at a reduced fee.89 In contrast, law school-sponsored clinics may be uniquely situated to provide representation to parties involved in an impact investment dispute, particularly given the social justice and/or economic development motivations that underpin many impact investment transactions.90 Just as student attorneys in the International Transactions Clinic (ITC) now represent investors and investees in the creation of impact investments, student attorneys could also represent such clients in impact investment disputes that are of such low value that the private bar is uninterested in representing the disputing parties. Rethinking fee arrangements might be particularly appropriate in those disputes that arise when the impact investor and the investee have agreed to forego some amount of financial return in order to advance social impact goals. This is one place where the lawyers involved in a dispute may want to consider
87. See Horst et al., supra note 78, at 67 tbl.41 (among desired requirements of dispute resolution mechanism, low price was ranked as third highest requirement by small enterprises with fifty or fewer employees).
88. See Burand et al., supra note 68, at 7.89. Id.90. See generally Thomas J. Stipanowich, Reflections on the State and Future of
Commercial Arbitration: Challenges, Opportunities, Proposals, 29 (Columbia American Review of International Arbitration, Vol. 25, 2014; Pepperdine University Legal Studies Research Paper No. 2014/29, available at SSRN: http://ssrn.com/abstract=2519084) (describing growing interest in mediation-oriented law clinics in US law schools).
Washington University Open Scholarship
84 Journal of Law & Policy [Vol. 48:55
whether their values align well with those of their clients, such that the lawyers might provide their services at reduced rates.
Another cost-saving strategy is to select a location for the arbitration proceedings that is not unduly expensive for the parties. This approach may push parties to opt for local or regional arbitral institutions that are closer to the location of the investment. Or, alternatively, where the dispute involves parties from different jurisdictions, the parties may consider using technology-enabled, dispute resolution processes to reduce the expense of face-to-face proceedings.91
Perhaps the largest cost-saving strategy is to resolve impact investment parties’ concerns before they ripen into a full-blown dispute. Accordingly, parties to an impact investment might include in their investment documentation a pre-arranged, routine mechanism for communicating about concerns that may arise in the course of the investment.92
Parties also may want to including “stepped” dispute resolution clauses into their impact investment documentation.93 A multi-tiered
91. See, e.g., ICDR Manufacturer/Supplier Online Dispute Resolution Protocol (MSODR), INTERNATIONAL CENTRE FOR DISPUTE RESOLUTION (2015), https://www.icdr.org/ icdr/faces/icdrservices/msodr; see also Bette J. Roth, Randall W. Wulff & Charles A. Cooper, ADR Rules of the International Chamber of Commerce (ICC), 2 ALTERNATIVE DISP. RESOL.PRAC. GUIDE APPENDIX II-25, (2006) (noting that in some countries, e-mediation or online dispute resolution has introduced a promising way to resolve disputes for small and medium-sized enterprises).
92. This is a feature seen in dispute boards that are used in infrastructure project financings. See Cyril Chern & Patricia O. Sulser, Keeping Public-Private Partnership Infrastructure Projects on Track: The Power of Multistakeholder Partnering Committees and Dispute Boards in Emerging-Market Infrastructure Projects, 5 THE WORLD BANK L. REV. 21, 36 (2013) (describing use of dispute boards in project financings used by the International Finance Corporation). Another feature of dispute boards that could prove useful in the impact investment context is dispute boards’ ability to promote an inclusion agenda, allowing the dispute board to go beyond hearing evidence from the contracting parties to take into consideration, for example, the voices of affected community members. Id.
93. Parties always can informally agree to pursue negotiation or mediation. However, there may be some value in expressly stating this expectation at the beginning of the investment relationship and memorializing it in the investment documentation. While there is a risk that parties might take advantage of such provisions, even stall for time to prepare for the eventual arbitration or litigation, this risk can be addressed by including time limits for the negotiation and/or mediation period, after which either party can escalate the dispute and turn to a more formal dispute resolution proceeding such as arbitration or litigation.
http://openscholarship.wustl.edu/law_journal_law_policy/vol48/iss1/9
2015] When Doing Good Goes Bad 85
or stepped approach requires that the parties engage in negotiation94
or mediation95 before they turn to arbitration or litigation to resolve disputes. Mediation, in particular, may be useful to impact investments as mediation’s more informal and consensus-based procedures can help preserve the parties’ relationship beyond the dispute at hand.96
CONCLUSION
Impact investments are experimenting with novel deal structures, unusual contractual terms, and untested legal forms of entities—all against the challenging backdrop of conducting cross-border transactions in countries where judicial efficiency and impartiality may be uncertain. This combination of transactional novelty and legal uncertainty presents a dilemma for those who hope to see the impact investment market continue to grow.
To date, much of the attention on impact investing has focused on increasing the deal flow of these impact investment transactions. Yet, if impact investing is to grow into a robust and resilient asset class, attention must also focus on developing effective mechanisms for resolving disputes that will inevitably arise when impact investments fail to meet investor expectations. Consequently, emphasis should be given to building an ecosystem for dispute resolution that best serves the impact investment market.
94. Negotiation as used here means taking attempts to resolve a dispute to higher-level decision-makers (upper management) within the disputing parties’ organizations.
95. Mediation as used here means a form of “supervised” negotiation where higher-level decision-makers are in charge of resolving the dispute but they are doing this under the supervision of a neutral third-party, the mediator. Mediation is generally not binding on its own, but parties can agree to memorialize in writing a mediated solution. See generally, Edna Sussman & Conna A. Weiner, Striving for the ‘Bullet-Proof’ Mediation Settlement Agreement,8 NYSBA New York Dispute Resolution Lawyer 22 (Spring 2015) at 25, available at http://sussmanadr.com/docs/Bullet%20Proofing%20the%20mediation%20agreement%20NYSBA%20Spring%2015.pdf (noting that many mediations conclude with only oral agreements, the authors recommend recording the settlement agreement in writing).
96. See Strong, supra note 67, at 25–26 (observes that consensus-based procedures [as can be found in mediation] offer advantages such as preservation of ongoing relationships, and that “value- or structure-based disputes may derive particular benefits from mediation” as opposed to disputes that “focus primarily on monetary concerns”).
Washington University Open Scholarship
86 Journal of Law & Policy [Vol. 48:55
This Article suggests that, while the international nature of most impact investments makes international arbitration a more likely choice for dispute resolution than litigation, more work must be done to make international arbitration an efficient and effective dispute resolution mechanism for impact investment disputes. To start, a cadre of arbitrators that understand impact investing should be developed, both to increase the speed with which arbitral decisions are reached and to reduce the costs of arbitration. Furthermore, if arbitration continues to be the preferred mechanism for resolving impact investment disputes, appropriate transparency must be brought to these proceedings and their resulting decisions so market players can learn from each other’s mistakes. Similarly, increased transparency may be required in those arbitral proceedings where the disputed impact investment raises significant public policy considerations.
In the meantime, those drafting dispute resolution provisions for impact investment documentation may want to consider including pre-arranged, routine processes for addressing concerns that may arise in the course of the investment so as to avoid the need for implementing a dispute resolution mechanism in the first place. Drafters of impact investment documentation should also consider including a stepped dispute mechanism that directs parties to negotiation and mediation before resorting to international arbitration.
In order to advance this discussion, more thorough research should be done regarding the actual practices of impact investors when confronting weak or failing impact investments, and a larger data set of impact investment documentation must be examined to ascertain what contractual provisions are typically included in impact investment documentation to address disputes. The challenge with this proposal, of course, is that some impact investment market advocates may worry that frank discussions about the likelihood of failed impact investments will dampen the enthusiasm of new entrants to the impact investment market. While that concern is valid, the alternative is far worse; only a few flashy failures may be enough to start a drumbeat of criticisms sounded by skeptics eager to claim that the impact investment market is just smoke and mirrors. The
http://openscholarship.wustl.edu/law_journal_law_policy/vol48/iss1/9
2015] When Doing Good Goes Bad 87
distrust and suspicion that follows such claims may do irreparable damage to this nascent market.
If impact investing truly is to mature into the “revolution,”“invisible heart of markets,” and “ground zero of a big deal” that its proponents claim, work must start now to ensure that the dispute resolution mechanisms introduced into impact investments are just as innovative and value-aligned as the deal structures attracting investors willing to invest billions, and possibly trillions, of dollars into this new market.
Washington University Open Scholarship
541
THE SOCIAL ENTERPRISE LAW MARKET
J. HASKELL MURRAY
ABSTRACT
During the last seven years, over thirty states have passed at least one social enterprise statute. These social enterprise statutes allow the formation of a plethora of new entity types, including low-profit limited liability companies, benefit corporations, benefit limited liability companies, public benefit corporations, and social purpose corporations. Social enterprises have attracted increasing academic attention, but virtually nothing has been written on if and how states are competing for these entities. This Article attempts to fill that void, while also providing a history of the social enterprise forms, a comparative analysis, and recommendations for states that wish to engage in jurisdictional competition in the social enterprise law market.
TABLE OF CONTENTS
ABSTRACT............................................................................................. 541 INTRODUCTION...................................................................................... 542 I. OVERVIEW OF U.S. SOCIAL ENTERPRISE LAW AND LITERATURE .... 543
A. Low-Profit Limited Liability Companies (“L3Cs”)............. 543 B. Benefit Corporations and Benefit LLCs............................... 546 C. Social Purpose Corporations ................................................. 552 D. Public Benefit Corporations................................................. 553
II. ITERATIONS AND INNOVATIONS IN SOCIAL ENTERPRISE LAW........ 555 A. Entity Purpose ...................................................................... 555 B. Third-Party Standards and Social Reporting........................ 556
© 2016 J. Haskell Murray.J. Haskell Murray is an Assistant Professor of Management and Business Law at Belmont
University. The Author thanks, for their comments and conversations about this Article, the attendees of the Association of American Law Schools’ Nonprofit Law and Philanthropy Panel on Social Enterprise, Cass Brewer, Joan Heminway, Mohsen Manesh, Alicia Plerhoples, and Dana Brakman Reiser. With permission, this Article draws from and builds on the author’s chapter State Laboratories and Social Enterprise Law written for RESEARCH HANDBOOK ON PARTNERSHIPS, LLCS AND ALTERNATIVE FORMS OF BUSINESS ORGANIZATIONS (Robert W. Hillman & Mark J. Loewenstein eds., 2015). William Ball provided excellent research assistance. The opinions expressed and any errors made are solely those of the author.
542 MARYLAND LAW REVIEW [VOL. 75:541
C. Dissenters’ Rights................................................................. 558 D. Naming and Notification...................................................... 559 E. Legacy Preservation Provisions............................................ 561 F. Relatively Stagnant Areas..................................................... 562
III. JURISDICTIONAL COMPETITION OR JURISDICTIONAL POSITIONING................................................................................... 563
A. Race to the Bottom, Race to the Top, or Neither? ............... 563 B. Indeterminacy and Price Discrimination .............................. 566 C. Current Financial Stakes and Jurisdictional Positioning ...... 568 D. State Niches and Differentiation from Delaware ................. 570
IV. INTEREST GROUPS AND SKEPTICS.................................................. 572 A. The Activists ........................................................................ 575 B. The Business Managers........................................................ 578 C. The Skeptics ......................................................................... 579 D. The Politicians...................................................................... 580
V. THE PRESENT AND FUTURE OF THE SOCIAL ENTERPRISE LAW MARKET ..................................................................................... 581 A. Leaders and Laggards........................................................... 581 B. Attracting Social Enterprises................................................ 582 C. Considering the Future ......................................................... 586
VI. CONCLUSION .................................................................................. 587
INTRODUCTION
In her iconic book The Genius of American Corporate Law, Professor Roberta Romano claims “federalism spurs innovation in public policy because of the incremental experimentation afforded by fifty laboratories of states competing for citizens and firms.”1 The legal academy has given much attention to jurisdictional competition for traditional business associations such as corporations and limited liability companies (“LLCs”).2 Delaware has long been recognized as the clear winner in the
1. ROBERTA ROMANO, THE GENIUS OF AMERICAN CORPORATE LAW 5 (1993) (first citing THOMAS R. DYE, AMERICAN FEDERALISM: COMPETITION AMONG GOVERNMENTS (1990); then citing COMPETITION AMONG STATES AND LOCAL GOVERNMENTS (Daphne A. Kenyon & John Kincaid eds., 1991)).
2. See, e.g., Lucian Arye Bebchuk, Federalism and the Corporation: The Desirable Limits on State Competition in Corporate Law, 105 HARV. L. REV. 1435 (1992); Bruce H. Kobayashi & Larry E. Ribstein, Delaware for Small Fry: Jurisdictional Competition for Limited Liability Companies, 2011 U. ILL. L. REV. 91 (2011); Jeffry Netter & Annette Poulsen, State Corporation Laws and Shareholders: The Recent Experience, 18 FIN. MGMT. 29 (1989); Larry E. Ribstein & Erin Ann O’Hara, Corporations and the Market for Law, 2008 U. ILL. L. REV. 661 (2008); Roberta Romano, Law as a Product: Some Pieces of the Incorporation Puzzle, 1 J.L. ECON. &ORG. 225 (1985).
2016] THE SOCIAL ENTERPRISE LAW MARKET 543
competition among the states for these traditional business associations, with some academics arguing that the competition has been a “race to the bottom” and others contending that the competition has been a “race to the top.”3 More recently, commentators have claimed other states do not now pose much of a threat to Delaware’s dominance, and that the federal government is the main check on Delaware’s power in the law market for traditional business associations.4 To date, the behavior surrounding emerging social enterprise forms, such as low-profit limited liability companies and benefit corporations, has not been thoroughly discussed or analyzed. Also, unlike the situation with the more traditional business associations, currently Delaware does not appear to be the dominant state inthe social enterprise law market.
Part I of this Article provides an overview and brief history of social enterprise forms in the United States, along with discussion of the related, early academic literature. Part II describes many of the innovations in the social enterprise law area and the various iterations of these laws. Part III asks why states are passing social enterprise laws, and provides a new theory of jurisdictional positioning to describe states that are not engaged in full competition but wish to remain poised to compete if the stakes are raised. Part IV describes the various interest groups that are impacting the passage and shape of social enterprise laws, including activists, managers, politicians, and skeptics. Finally, Part V examines hand-collected data on social enterprise forms, providing a description of the current social enterprise landscape and offering advice to states that wish to compete for social enterprises in the future. This Article concludes by drawing on the Delaware experience to predict the characteristics of the winning state in any future jurisdictional competition that may arise over social enterprises.
I. OVERVIEW OF U.S. SOCIAL ENTERPRISE LAW AND LITERATURE
A. Low-Profit Limited Liability Companies (“L3Cs”)
The 2008 Vermont Low-Profit Limited Liability statute was both the first L3C statute and the first social enterprise statute in the United States. Since 2008, eight additional states and two federal tribal jurisdictions have
3. See, e.g., RALPH K. WINTER, GOVERNMENT AND THE CORPORATION 7–11 (1978) (race to the bottom); William L. Cary, Federalism and Corporate Law: Reflections upon Delaware, 83 YALE L.J. 663 (1974) (race to the bottom); Frank H. Easterbrook, Managers’ Discretion and Investors’ Welfare: Theories and Evidence, 9 DEL. J. CORP. L. 540 (1984) (race to the top); Romano, supra note 2, at 265–73.
4. Lucian Arye Bebchuk & Assaf Hamdani, Vigorous Race or Leisurely Walk: Reconsidering the Competition over Corporate Charters, 112 YALE L.J. 553, 558, 604–05 (2002); Mark J. Roe, Delaware’s Competition, 117 HARV. L. REV. 588, 591 (2003).
544 MARYLAND LAW REVIEW [VOL. 75:541
passed L3C statutes.5 Effective January 1, 2014, North Carolina became the first of the nine original L3C states to repeal its L3C statute, though it allowed previously formed L3Cs to continue to exist in the state.6 The L3C concept is championed by Robert “Bob” Lang, the Chief Executive Officerof The Mary Elizabeth & Gordon B. Mannweiler Foundation.7 Mr. Lang worked with attorneys on the L3C concept but is not a lawyer himself.8
L3C statutes were drafted, primarily, to target Program Related Investments (“PRI”) from foundations, and thereby aid social enterprises in their attempts to raise capital.9 The statutes mirror, in many respects, the PRI regulations and often simply replace “investment” in the regulations with “company” in the L3C statutes.10 The L3C statutes require that the L3C “significantly furthers the accomplishment of one or more charitable or educational purposes” and require that the L3C “would not have been formed but for the company’s relationship to the accomplishment of charitable or educational purposes.”11 The L3C statutes also require that “[n]o significant purpose of the company is the production of income or the appreciation of property” but the statutes make clear that the production of
5. Steven R. Chiodini & David A. Levitt, Program-Related Investing in L3Cs: A Question-and-Answer Guide, 118 J. TAX’N 41, 41, 43 n.10 (2013) (listing Illinois, Louisiana, Maine, Michigan, North Carolina, Rhode Island, Utah, Vermont, Wyoming, Oglala Sioux Tribe and the Crow Indian Nation of Montana); see also Here’s the Latest L3C Tally, INTERSECTOR PARTNERS,L3C (Sept. 3, 2015), http://www.intersectorl3c.com/l3c_tally.html (listing the month and year that each L3C statute was passed, the number of L3Cs formed in each jurisdiction, and the L3C company names).
6. Cass Brewer, Hybrid Business Entities in 2014, SOCENTLAWBLOG (Jan. 6, 2014), http://socentlaw.com/2014/01/hybrid-business-entities-in-2014/; Anne Field, North Carolina Officially Abolishes the L3C, FORBES (Jan. 11, 2014), http://www.forbes.com/sites/annefield/2014/01/11/north-carolina-officially-abolishes-the-l3c/.
7. Robert Lang & Elizabeth Carrott Minnigh, The L3C, History, Basic Construct, and Legal Framework, 35 VT. L. REV. 15, 15 (2010) (stating that Bob Lang conceived of the L3C form in 2005).
8. Robert Lang, LINKEDIN, https://www.linkedin.com/pub/robert-lang/b/b0/aa2 (last visited Nov. 9, 2015).
9. Lang & Minnigh supra note 7, at 15–17; John A. Pearce II & Jamie Patrick Hopkins, Regulation of L3Cs for Social Entrepreneurship: A Prerequisite to Increase Utilization, 92 NEB.L. REV. 259, 272–73 (2013) (explaining that L3C proponents intended for the L3C to attract PRIs from foundations, but stating that L3C investments do not automatically qualify as PRIs and noting that at least one senior IRS agent has encouraged caution when attempting to invest in a L3C as a PRI). PRIs are investments that are not made for financial reasons, but to facilitate the exempt purpose of a private foundation. Thomas Kelley, Law and Choice of Entity on the Social Enterprise Frontier, 84 TUL. L. REV. 337, 355–56 (2009). In addition, the “IRS considers all moneys paid out as PRIs to be ‘qualifying distributions,’ which means they count toward the IRS’s requirement that private foundations spend five percent of their net worth in any given year.” Id. at 356.
10. Pearce II & Hopkins, supra note 9, at 261–62 (noting that the L3C statutes were intended to mirror the PRI requirements).
11. VT. STAT. ANN. tit. 11, §§ 4001(14), 4162(1) (2010). Other state L3C statutes largely follow Vermont’s lead. Cassady V. Brewer & Michael J. Rhim, Using the ‘L3C’ for Program-Related Investments, TAX’N EXEMPTS, Nov./Dec. 2009, at 11, 13 (noting that the Vermont L3C statute is similar to the L3C statutes in other states).
2016] THE SOCIAL ENTERPRISE LAW MARKET 545
significant income or the appreciation property standing alone is not conclusive evidence of a statutory violation.12 The L3C proponents believed that if the L3C statutes required of companies the same thing that the PRI regulations require of investments, an L3C would become a safe place for foundations to make PRIs, without need for costly written legal opinions from counsel or advanced private letter rulings by the InternalRevenue Service (“IRS”).13 To date, however, the IRS has not expressly endorsed the L3C as an unassailable safe harbor for PRIs.14 Lang promoted a tranched investment structure for L3Cs where foundations would provide high-risk, low-return capital, which would make it more likely that traditional investors would obtain a market return.15
Lang and his supporters have touted the L3C as aiding private foundations in the PRI process; a “for-profit with [a] nonprofit soul” that serves both profit and social purpose;16 a branding vehicle; and a way, through his proposed tranched investment structure, to provide each set of investors their desired social and financial returns.17 Professors and practitioners quickly launched significant criticism against the L3C. These skeptics claimed, among other things, that the statutes did not significantly protect or aid private foundations in the PRI process; LLCs could serve the same purpose as the L3C under the current tax law; the statutes were overhyped and the claims of L3C proponents were overly optimistic; the skeletal L3C statute was insufficient to deal with the complexities stemming from the conflicts between the “two masters” of profit and purpose; and the proposed tranched investments were impractical and could
12. VT. STAT. ANN. tit. 11, §§ 4001(14), 4162(2). 13. Robert M. Lang, Jr., The L3C: The New Way to Organize Socially Responsible and
Mission Driven Organizations, 36 ALI-ABA CONTINUING LEGAL EDUC. 251, 253–56 (2007) (describing his view on how the L3C can cut costs for foundations looking to make a PRI); cf. John Tyler, Negating the Legal Problem of Having “Two Masters”: A Framework for L3CFiduciary Duties and Accountability, 35 VT. L. REV. 117, 125–26 (2010) (noting that L3Cs do not have to attract PRIs and that there may be uses for the L3C form outside of the foundation and PRI contexts).
14. See Jamie Hopkins, Low-Profit Limited Liability Companies: High-Risk Tax Fad or Legitimate Social Investment Planning Opportunity?, 2014 CARDOZO L. REV. DE NOVO 35, 42–43, (2014) http://www.cardozolawreview.com/content/denovo/HOPKINS_2014_35.pdf (first citing IRS, Proposed Guidelines, Examples of Program Related Investments, 77 Fed. Reg. 23,429 (proposed Apr. 19, 2012) (codified at 26 C.F.R. pt. 53), https://federalregister.gov/a/2012-9468; then citing Carter G. Bishop, The Low Profit LLC (L3C): Program Related Investment by Proxy or Perversion?, 63 ARK. L. REV. 243, 250 (2010)) (noting that the IRS has proposed rules with examples of proper PRIs suggesting that L3Cs could be a proper recipient, but also noting that the IRS guidance does not provide a complete safe harbor for L3Cs and sufficient caution is recommended).
15. Lang & Minnigh, supra note 7, at 17–19 (explaining the proposed tranched L3C investment structure).
16. Id. at 17.17. See generally Lang, Jr., supra note 13; Lang & Minnigh supra note 7; Arthur Wood,
Transcript: New Legal Structures to Address the Social Capital Famine, 35 VT. L. REV. 45 (2010).
546 MARYLAND LAW REVIEW [VOL. 75:541
lead to private inurement that may jeopardize the investing foundations’ tax exemptions.18 A few commentators largely agreed with the criticisms, but also suggested reforms for the L3C law. The suggested reforms for the L3C law included the following: amend the proposed tranched model by replacing traditional investors with social investors; require at least one tax-exempt investor; add reporting and registration requirements for certain L3Cs; require at least a partial asset lock for L3Cs engaged in mergers and acquisitions activity; and provide free transferability and withdraw by any tax-exempt member of an L3C.19
Possibly in response to the academic and practitioner criticism, the passing of the L3C statutes has been at a relative standstill, with the last L3C statute passed in 2012.20 From 2012 to present, over a dozen state social enterprise statutes, of types other than the L3C, were passed.21 The number of L3C statutes has actually decreased since 2012; as mentioned above, effective January 1, 2014, North Carolina repealed its L3C statute.22
Currently, there are reported to be approximately 1200 L3Cs and most are small, closely held entities.23
B. Benefit Corporations and Benefit LLCs
In 2010, Maryland passed the first benefit corporation statute.24
Currently, over two dozen states have passed benefit corporation statutes, a few of which are “public benefit corporation” statutes, discussed below in a
18. Bishop, supra note 14, at 243–46 (claiming that the L3C does not protect foundations making a PRI and challenging the proposed L3C tranche investment plan); J. William Callison & Allan W. Vestal, The L3C Illusion: Why Low-Profit Limited Liability Companies Will Not Stimulate Socially Optimal Private Foundation Investment in Entrepreneurial Ventures, 35 VT. L.REV. 273, 274–75 (2010) (challenging the optimism of the L3C proponents); David S. Chernoff, L3Cs: Less than Meets the Eye, 21 TAX’N EXEMPTS, May/June 2010, at 3, 4–5 (dispelling six myths about the L3C); Daniel S. Kleinberger, A Myth Deconstructed: The “Emperor’s New Clothes” on the Low-Profit Limited Liability Company, 35 DEL. J. CORP. L. 879, 879 (2010) (claiming that a number of “glowing characterizations [of the L3C] are each flatly wrong”).
19. See generally Cassady V. (“Cass”) Brewer, Seven Ways to Strengthen and Improve the L3C, 25 REGENT U. L. REV. 329 (2013); J. Haskell Murray & Edward I. Hwang, Purpose with Profit: Governance, Enforcement, Capital-Raising and Capital-Locking in Low-Profit Limited Liability Companies, 66 U. MIAMI L. REV. 1 (2011).
20. Here’s the Latest L3C Tally, supra note 5. Rhode Island passed the most recent L3C statute. See R.I. GEN. LAWS § 7-16-76 (1999 & Supp. 2014) (effective July 1, 2012).
21. See infra Appendix A.22. See Brewer, supra note 6.23. A review of the L3C list compiled by interSector Partners, L3C reveals almost no
recognizable companies and a number of companies that are not even large enough to afford or desire a website. Here’s the Latest L3C Tally, supra note 5.
24. Act effective October 1, 2010, 2010 Md. Laws Ch. 97, § 1 (S.B. 690) (current version atMD. CODE ANN., CORPS. & ASS’NS § 5-6C-01 (West 2014)).
2016] THE SOCIAL ENTERPRISE LAW MARKET 547
separate Section.25 B Lab, a non-profit organization, which has been privately certifying companies as “certified B corporations” since June of 2007, has been a major force behind the passing of benefit corporation statutes.26 Many proponents of the benefit corporation form have authored or contributed to a white paper entitled The Need and Rationale for the Benefit Corporation (“Proponent White Paper”).27 Major arguments made in the Proponent White Paper and the responses by skeptics are summarized in this Section.
The authors of the Proponent White Paper claim that the market (including consumers, investors, and social entrepreneurs) is demanding a society-focused, for-profit entity form like the benefit corporation.28
Skeptics note that relatively few people have taken advantage of the existing social enterprise forms, such as benefit corporations.29 Only approximately 1000 benefit corporations were formed in the first four years of the statute’s existence, suggesting the market demand may be less than was claimed.30 For comparison, Delaware is home to over one million entities, and in 2007 an average of 430 LLCs were formed every weekday in Delaware.31 In 2014 alone, over 169,000 total entities were formed in Delaware, so approximately 1000 benefit corporations (spread over many
25. State by State Legislative Status, BENEFIT CORP. INFO. CTR., http://benefitcorp.net/policymakers/state-by-state-status (last visited Sept. 20, 2015); see infra Part I.D.
26. Our History, BCORPORATION.NET, http://www.bcorporation.net/what-are-b-corps/the-non-profit-behind-b-corps/our-history (last visited Nov. 18, 2015) (stating that the first full-time work at B Lab commenced on July 5, 2006 and the first B Corps were certified on June 8, 2007).
27. William H. Clark, Jr. & Larry Vranka, White Paper: The Need and Rationale for the Benefit Corporation: Why It Is the Legal Form That Best Addresses the Needs of Social Entrepreneurs, Investors, and, Ultimately, the Public, BENEFIT CORP. (Jan. 18, 2013), http://benefitcorp.net/sites/default/files/documents/Benefit%20Corporation%20White%20Paper.pdf.
28. Id. at 2–6.29. J. William Callison, Benefit Corporations, Innovation, and Statutory Design, 26 REGENT
U. L. REV. 143, 165 (2013); Dana Brakman Reiser, Benefit Corporations—A Sustainable Form of Organization?, 46 WAKE FOREST L. REV. 591, 623 (2011).
30. Kate Cooney, Justin Koushyar, Matthew Lee & J. Haskell Murray, Benefit Corporation and L3C Adoption: A Survey, STAN. SOC. INNOVATION REV. (Dec. 5, 2014),http://ssir.org/articles/entry/benefit_corporation_and_l3c_adoption_a_survey. Currently, there are roughly 1400 “certified B corporations” in existence, but benefit corporations are not required to be certified, and the certified B corporations, oddly, include partnerships, LLCs, and traditional corporations, in addition to benefit corporations. Certified B Corporations, BCORPORATION.NET,http://www.bcorporation.net/ (last visited Jan. 15, 2015). During the publication process, the number of benefit corporations has risen significantly though this new total number is still insignificant in face of the total number of businesses in Delaware and elsewhere in the United States. Appendix A.
31. Mohsen Manesh, Delaware and the Market for LLC Law: A Theory of Contractibility and Legal Indeterminacy, 52 B.C. L. REV. 189, 201 (2011) (discussing how formation of LLCs significantly outpaced incorporations in Delaware).

548 MARYLAND LAW REVIEW [VOL. 75:541
states) is a small drop in a big bucket.32 Proponents of the benefit corporation form counter by noting that the first statute was passed just a few years ago, that awareness of the benefit corporation is still spreading,and that the number of benefit corporations is growing.33
The Proponent White Paper’s authors also argue that existing case law hinders socially focused for-profit entities, citing iconic corporate law cases like Dodge v. Ford Motor Co.,34 Unocal Corp. v. Mesa Petroleum Co.,35
Revlon Inc., v. MacAndrews & Forbes Holdings, Inc.,36 and eBay Domestic Holdings v. Newmark.37 The benefit corporation movement has been spurred, in part, by statements by the current Chief Justice of the Delaware Supreme Court, Leo Strine, including the statement that “as a matter of corporate law, the object of the corporation is to produce profits for the stockholders[;] . . . the social beliefs of the managers, no more than their own financial interests, cannot be their end in managing the corporation.”38
Also, former Delaware Chancellor William Chandler wrote in eBay v. Newmark that “[h]aving chosen a for-profit corporate form, the craigslist directors are bound by the fiduciary duties and standards that accompany that form. Those standards include acting to promote the value of the corporation for the benefit of its stockholders.”39 Some critical commentators have noted that existing law already provides potential solutions for social entrepreneurs, including (1) using the flexible, contract-based LLC form, (2) incorporating in one of the more than thirty states with a constituency statute, and (3) incorporating in a state like Oregon, which
32. Jeff Mordock, Delaware Sets Record for New Businesses, DELAWAREONLINE (Jan. 6, 2015), http://www.delawareonline.com/story/money/business/2015/01/06/delaware-sets-record-new-businesses/21366135/ (noting that the roughly 169,000 new businesses formed in Delaware in 2014 set a new record, breaking the 162,000 mark set in 2007).
33. See, e.g., Interview with William H. Clark, Jr., Corporate & Securities Partner at Drinker Biddle & Reath LLP and Drafter of the Model Benefit Corporation Legislation, in Seattle, WA at Seattle Pacific University (Oct. 8, 2014); see also E-mail from William H. Clark, Jr., to J. Haskell Murray, Assistant Professor at Belmont University (Jan. 23, 2015, 11:46 AM) (on file with author) (confirming the conversation and agreeing with the statement attached to this footnote); FAQ: General Questions, BENEFIT CORP., http://benefitcorp.net/faq (last visited Nov. 19, 2015) (noting that the first benefit corporation law was passed in 2010 and citing “Method, Plum Organics, King Arthur Flour, Patagonia, Solberg Manufacturing, and Rasmussen Colleges” as some well-known benefit corporations).
34. Dodge v. Ford Motor Co., 170 N.W. 668 (Mich. 1919).35. Unocal Corp. v. Mesa Petroleum Co., 493 A.2d 956 (Del. 1985).36. Revlon Inc., v. MacAndrews & Forbes Holdings, Inc., 506 A.2d 173 (Del. 1986).37. eBay Domestic Holdings, Inc. v. Newmark, 16 A.3d 1, 34 (Del. Ch. 2010); Clark &
Vranka, supra note 27, at 7–13.38. Leo E. Strine, Jr., Our Continuing Struggle with the Idea That For-Profit Corporations
Seek Profit, 47 WAKE FOREST L. REV. 135, 151 (2012).39. eBay Domestic Holdings, Inc,. 16 A.3d at 34. Professor Lyman Johnson has questioned
the eBay decision and noted the lack of citation to authority for the court’s statement about the need to focus on shareholder profits. Lyman Johnson, Pluralism in Corporate Form: Corporate Law and Benefit Corps., 25 REGENT U. L. REV. 269, 274–75 (2013).
2016] THE SOCIAL ENTERPRISE LAW MARKET 549
expressly allows corporations to adopt a social or environmental purpose.40
Certain academics have argued that social entrepreneurs could avoid the holdings of the cases cited in the Proponent White Paper by incorporating in more stakeholder-friendly states, and even in the states where the cited cases control the business judgment rule provides significant protection for social entrepreneurs.41 Other commentators contend that even if benefit corporations are not technically needed, this new entity form might serve as a useful signaling device.42
The centerpiece of the Model Benefit Corporation Legislation is its purpose clause, which states that each benefit corporation must pursue a “general public benefit,” defined as “[a] material positive impact on society and the environment, taken as a whole, assessed against a third-party standard, from the business and operations of a benefit corporation.”43 In previous work, this author has claimed that the “general public benefit” concept is too vague, provides insufficient guidance to directors when they face zero-sum games, and should be supplemented to require the prioritization of the interests, or at least the identification of the benefit corporation’s primary interest.44 Other commentators have suggested that the “general public benefit” mandate is too broad, and statutes should be made flexible enough to allow social entrepreneurs to focus on one or more narrow social or environmental issues without being forced to consider all stakeholders.45
Proponents of the benefit corporation form claim that the benefit corporation law provides a higher level of accountability and transparency
40. Cassady V. (“Cass”) Brewer, A Novel Approach to Using LLCs for Quasi-Charitable Endeavors (A/K/A “Social Enterprise”), 38 WM. MITCHELL L. REV. 678, 685–86 (2012) (noting that the LLC entity form can be used for social enterprise purposes); J. Haskell Murray, Choose Your Own Master: Social Enterprise, Certifications, and Benefit Corporation Statutes, 2 AM. U.BUS. L. REV. 1, 20–21 (2012) (discussing the legal solutions, outside of social enterprise law, for social entrepreneurs); cf. Mark J. Loewenstein, Benefit Corporations: A Challenge in Corporate Governance, 68 BUS. LAW. 1007, 1036 (2013) (noting, with approval, that some critics of social enterprise have argued that the existing corporate law is sufficient for social entrepreneurs, but stating that a purpose of the benefit corporation law is not just to allow socially focused behavior, but to mandate socially focused behavior).
41. Johnson, supra note 39, at 273–78; Loewenstein, supra note 40, at 1008 n.3; Murray, supra note 40, at 16–17.
42. J. Haskell Murray, Defending Patagonia: Mergers and Acquisitions with Benefit Corporations, 9 HASTINGS BUS. L.J. 485, 505–07 (2013); Joseph W. Yockey, Does Social Enterprise Law Matter?, 66 ALA. L. REV. 767 (2015).
43. MODEL BENEFIT CORP. LEGIS. §§ 102, 201(a) (2014), http://benefitcorp.net/sites/default/files/documents/Model_Benefit_Corp_Legislation.pdf.
44. Murray, supra note 40, at 5.45. J. William Callison, Putting New Sheets on a Procrustean Bed: How Benefit
Corporations Address Fiduciary Duties, the Dangers Created, and Suggestions for Change, 2 AM. U. BUS. L. REV. 85, 98–104 (2012) (calling the inflexibility of the Model Benefit Corporation Legislation the “Illiberalism Problem”); Loewenstein, supra note 40, at 1014–15 (claiming the Model Benefit Corporation Legislation is overly rigid because it would not allow an entity to focus on only one set of stakeholders).
550 MARYLAND LAW REVIEW [VOL. 75:541
than traditional corporate law.46 Proponents argue that accountability isincreased by statutory language requiring directors to consider the interests of various corporate stakeholders, mandating a corporate purpose to benefit society and the environment, and providing benefit enforcement proceedings for resolution of complaints related to alleged violations of the benefit corporation statute.47 Transparency is increased, proponents argue, by the benefit corporation statutes requiring an annual benefit report and requiring the measurement of general public benefit against a “comprehensive, credible, independent and transparent”48 third-party standard.49
Various authors have called into question the alleged strength of these so-called accountability and transparency measures in the benefit corporation law.50 For example, some commentators have noted that only shareholders, and not the other stakeholders, have standing to bring a benefit enforcement proceeding.51 Shareholders may not have significantincentives to keep directors accountable to other stakeholders, especially when doing so reduces the shareholders’ financial returns.52 Delaware Supreme Court Chief Justice Leo Strine has criticized benefit corporation law, writing that “[benefit corporations exist in] a fictional land where you can take other people’s money, use it as you wish, and ignore the best interests of those with the only right to vote.”53 Some academic articles have suggested statutory amendments to provide more serious accountability, including imposing a charitable giving floor, adding a partial-asset lock, instituting stakeholder standing, and regulating the third-party standard providers that currently vary wildly in quality.54 At least one author has noted that benefit enforcement proceedings may be used by
46. Clark & Vranka, supra note 27, at 15–21.47. Id.48. William H. Clark, Jr. & Elizabeth K. Babson, How Benefit Corporations Are Redefining
the Purpose of Business Corporations, 38 WM. MITCHELL L. REV. 817, 846 (2012).49. Id. at 842–50 (paying particular attention to the importance of a third-party standard);
Clark & Vranka, supra note 27. Bill Clark and Lizzie Babson have done legal work for the primary third-party standard provider, B Lab.
50. Callison, supra note 45, at 90–92, 109–111 (discussing the influence of B Lab in passing what he considers unwise legislation and noting the possible use of benefit corporations to greenwash given that the area is largely unregulated); see also David Groshoff, Contrepreneurship? Examining Social Enterprise Legislation’s Feel-Good Governance Giveaways, 16 U. PA. J. BUS. L. 233, 262 (2013) (noting the weakness of the benefit corporation’sprimary enforcement mechanism—the benefit enforcement proceeding).
51. Murray, supra note 40, at 16–17; Reiser, supra note 29, at 613–14.52. See Leo E. Strine, Jr., Making It Easier for Directors to “Do the Right Thing”? 4 HARV.
BUS. L. REV. 235, 250–52 (2014) (questioning whether a shareholder will be motivated to protect other stakeholders).
53. Strine, Jr., supra note 38, at 150.54. J. Haskell Murray, Social Enterprise Innovation: Delaware’s Public Benefit Corporation
Law, 4 HARV. BUS. L. REV. 345, 363 (2014); Murray, supra note 40, at 22; Murray, supra note 42, at 507–11.
2016] THE SOCIAL ENTERPRISE LAW MARKET 551
shareholders to “greenmail” benefit corporations into buying off those particular shareholders, possibly to the detriment of the corporation, its mission, and the other stakeholders.55 On the transparency front, authors have noted that the statutory requirements involving benefit reports are extremely vague, susceptible to white- and green-washing, and generally lack an express enforcement mechanism for punishing benefit corporations that do not provide the reports.56 A few commentators have suggested that financial tools, and the private market in general, may be more effective than statutes in providing accountability and transparency.57
Currently, Maryland and Oregon provide for the formation of benefit LLCs.58 The existing benefit LLC statutes are nearly identical to the benefit corporation statutes, but the benefit LLC law relies on the state LLC statute, instead of the state corporation statute, to fill in the gaps.59 Most proponents of the benefit corporation statutes, including B Lab, claim that they are not encouraging the passage of benefit LLC legislation at this time because they believe the traditional LLC law to be flexible enough to address the needs of social entrepreneurs who are not interested in the corporate form.60 Other proponents, however, believe that the benefit LLC
55. See Callison, supra note 45, at 109–11 (arguing that benefit enforcement proceedings may be used improperly by plaintiffs simply looking to extract funds from benefit corporations or for “adherence to their idiosyncratic conception of the good”). The term “greenmail” is often used in the hostile takeover situation when a corporation pays “a firm or individual in exchange for an agreement not to proceed with a tender offer,” but “greenmail” can also be used more generally, as Callison uses the term, to refer to payments for not proceeding with other actions related to the corporation. Jonathan R. Macey & Fred S. McChesney, A Theoretical Analysis of Corporate Greenmail, 95 YALE L.J. 13, 14 n.1 (1985); see also Callison, supra note 45, at 109–11.
56. Callison, supra note 45, at 109–10; Murray, supra note 40, at 42–43. Greenwashing can be defined as making false or exaggerated claims about the environmental friendliness of a product, company, or industry. Michael R. Siebecker, Trust & Transparency: Promoting Efficient Corporate Disclosure Through Fiduciary-Based Discourse, 87 WASH. U. L. REV. 115, 133–34 (2009). Greenwashing, however, does not have one agreed upon definition. Miriam A. Cherry, The Law and Economics of Corporate Social Responsibility and Greenwashing, 14 U.C. DAVIS BUS. L. J. 281, 295 (2014). Greenwashing is “when a company tries to portray itself as more environmentally minded than it actually is.” David Gelles, Social Responsibility That Rubs Right Off, N.Y. TIMES (Oct. 17, 2015), http://www.nytimes.com/2015/10/18/business/energy-environment/social-responsibility-that-rubs-right-off.html?_r=0. “[A]s a conceptual matter, a whitewash has three essential components: an underlying defect, an attempt to conceal the defect by diverting attention, and a failure to fix the underlying defect.” Lesley Wexler, Extralegal Whitewashes, 62 DEPAUL L. REV. 817, 825 (2013).
57. Dana Brakman Reiser & Steven A. Dean, Hunting Stag with Fly Paper: A Hybrid Financial Instrument for Social Enterprise, 54 B.C. L. REV. 1495 (2013); see also Murray, supra note 40, at 45–46.
58. MD. CODE ANN., CORPS. & ASS’NS §§ 4a-1201–1208 (West 2014); OR. REV. STAT.§§ 60.750-60.770 (2014).
59. See MD. CODE ANN., CORPS. & ASS’NS §§ 4a-1201–1208; OR. REV. STAT. §§ 60.750–60.770.
60. See Murray, supra note 40, at 23 n.101 (citing Telephone Interview with William H. Clark, Jr., Partner, Drinker Biddle & Reath and primary draftsperson for the Model Benefit Corporation Legislation (Jan. 23, 2012)).
552 MARYLAND LAW REVIEW [VOL. 75:541
is a useful form because many small businesses prefer the LLC framework, while also desiring the branding and signaling provided by a “benefit” entity form.61
C. Social Purpose Corporations
Two states, California and Washington, have passed more flexible social enterprise statutes that resist some of the mandatory provisions of the benefit corporation statutes, such as the required “general public benefit purpose.”62 Unlike the Model-based benefit corporation statutes, these social purpose corporations (“SPC”) statutes do not require a general public benefit purpose but do require adoption of one or more specific purposes.63
While the Model-based benefit corporation statutes require pursuit of a “general public purpose” and require benefit corporation directors to consider the interests of all stakeholders, the SPC statutes allow focus on a narrower group of stakeholders.64
The SPC statutes also expressly provide for dissenters’ rights, the payment of fair value for the shares of shareholders who object to conversion to an SPC from a more traditional entity form.65 Dissenters’ rights have been included in a few benefit corporation statutes, including California’s, but are not included in the statutes that follow the Model Benefit Corporation Legislation.66 Bill Clark, the primary drafter of the benefit corporation legislation, has argued that dissenters’ rights might harm cash-poor corporations that wish to convert, but do not have the resources to pay the shareholders who do not want to make the change to a social enterprise form.67
61. Telephone Interview with James Woulfe, Public Policy and Impact Investing Specialist at the Social Enterprise Trust (Jan. 29, 2015). Mr. Woulfe was involved in the Connecticut benefit corporation efforts and is considering supporting the passage of benefit LLC legislation in Connecticut. Id.
62. Rob R. Carlson & Lisa M. Tran, California Creates Two New Types of Corporations: Understanding the Benefit Corporation and Flexible Purpose Corporation, STAY CURRENT: ACLIENT ALERT FROM PAUL HASTINGS (Mar. 2012),http://www.paulhastings.com/assets/publications/2137.pdf. See generally What Are SPCs?, SOCIAL PURPOSE CORP., http://www.spcwa.com/what-are-spcs/ (last visited Sept. 19, 2015).
63. CAL. CORP. CODE §§ 2500–2517, 2600–2605, 2700–2702, 2800, 2900, 3000–3002, 3100, 3200–3203, 3300–3306, 3400–3401, 3500–3503 (West 2014); WASH. REV. CODE ANN.§§ 23B.25.005–150 (West 2013).
64. CAL. CORP. CODE § 3305 (West 2014); WASH. REV. CODE ANN. §§ 23B.25.020–030 (West 2013).
65. CAL. CORP. CODE § 2602(b) (West 2014); WASH. REV. CODE ANN. § 23B.25.120 (West 2013); Antony Page, New Corporate Forms and Green Business, 37 WM. & MARY ENVT’L L. &POL’Y REV. 347, 357 (2013).
66. J. Haskell Murray, Corporate Forms of Social Enterprise: Comparing the State Statutes(Jan. 15, 2015) (unpublished chart), http://papers.ssrn.com/sol3/papers.cfm?abstract_id=1988556.
67. Clark & Vranka, supra note 27.
2016] THE SOCIAL ENTERPRISE LAW MARKET 553
Supporters of benefit corporation statutes have stated that the SPC statutes are too weak to support the dual mission of social entrepreneurs.68
Benefit corporation proponents worry that SPCs might harm society by focusing on a narrow set of interests, for example, caring for the environment, while treating their employees poorly.69 Critics of the benefit corporation framework respond that the benefit corporation statute has overpromised, will suffocate companies with its mandatory provisions, and has not provided the means to live up to its bold claims of achieving both profit and broad purpose.70
D. Public Benefit Corporations
In 2013, Delaware, the leader in U.S. corporate law, entered the social enterprise law scene with its own statutory innovation: the public benefit corporation (“PBC”).71 B Lab places Delaware’s PBC statute under the benefit corporation umbrella, but the Delaware statute differs from the Model statute in a number of ways.72 Colorado and Minnesota have already adopted large parts of Delaware’s PBC statute, and other states are considering using portions of, or the entirety of, Delaware’s framework.73
The Delaware statute is more permissive than the Model Benefit Corporation Legislation in most areas, but has more mandatory provisions in the corporate purpose area than the SPC statutes.74 In language broader than that in the SPC statutes, a Delaware PBC “is a for-profit corporation . . . intended to produce a public benefit or public benefits and
68. See, e.g., Derek Ridgway, Flexible Purpose Corporation vs. Benefit Corporation, HANSONBRIDGETT (Sept. 4, 2012), http://www.hansonbridgett.com/Publications/articles/2012-09-flexible-purpose.aspx (calling the FPC “watered down” and opining that the FPC “will undoubtedly become more susceptible to ‘greenwashing,’ which may in turn erode the underlying purpose and benefits of the entity over time”); Clark & Vranka, supra note 27, at app. C, 4–9(stating that the FPC law lacks the accountability and transparency of the benefit corporation law).
69. Clark & Vranka, supra note 27, at 8.70. See, e.g., Callison, supra note 45, at 113–14; Loewenstein, supra note 40, at 1036–37. 71. DEL. CODE ANN. tit. 8, §§ 361–368 (2011 & Supp. 2015); see also Murray, supra note
54, at 350–64 (providing a brief history of the public benefit corporation in Delaware and comparing the Delaware legislation to the Model Benefit Corporation Legislation).
72. Murray, supra note 54, at 350 (noting the process, B Lab’s involvement, and the opinion of certain B Lab employees regarding the passage of the public benefit corporation law in Delaware); Governor Markell Signs Public Benefit Corporation Legislation, DELAWARE.GOV(July 17, 2013), http://news.delaware.gov/2013/07/17/governor-markell-signs-public-benefit-corporation-legislation/.
73. See generally Callison, supra note 29; Deborah J. Walker, Please Welcome the Minnesota Public Benefit Corporation, U. ST. THOMAS L.J. (forthcoming), http://papers.ssrn.com/sol3/papers.cfm?abstract_id=2408241.
74. Compare DEL. CODE ANN. tit. 8, §§ 361–368 (2011 & Supp. 2015), with MODEL BENEFIT CORP. LEGIS. (2014),http://benefitcorp.net/sites/default/files/documents/Model_Benefit_Corp_Legislation.pdf; see alsoMurray, supra note 54, at 369–70 (comparing major provisions of the Delaware Public Benefit Corporation Law with the Model Benefit Corporation Legislation).
554 MARYLAND LAW REVIEW [VOL. 75:541
to operate in a responsible and sustainable manner.”75 The Delaware PBC statute also requires PBCs to choose a specific purpose and to “manage or direct the business and affairs of the public benefit corporation in a manner that balances [1] the pecuniary interests of the stockholders, [2] the best interests of those materially affected by the corporation’s conduct, and [3] the specific public benefit or public benefits identified in its certificate of incorporation.”76 The Delaware law only requires a benefit report every two years, instead of the annual requirement under the Model Benefit Corporation Legislation, and the Delaware PBC law does not require the report to be publicly posted.77 Further, the Delaware law allows, but does not require, a Benefit Director or use of a third-party standard. In short, Delaware’s PBC law mostly pushes the Model’s benefit corporation framework toward increased private ordering.78
The Colorado statute largely followed the Delaware PBC law, but Colorado has reporting requirements that more closely follow the Model.79
The Corporate Laws Drafting Committee under the Colorado Bar Association (“CBA”) first attempted to pass a law that would allow firms to choose a general public benefit, a specific public benefit, or both.80 The CBA then attempted to pass a law that mirrored Delaware in all areas.81
The CBA reportedly faced opposition from B Lab and its supporters on both attempts; eventually Colorado passed a compromise PBC law that followed Delaware in most areas except for the reporting requirements.82
The Minnesota PBC law, effective January 1, 2015, allows the formation of two types of entities: general benefit corporations and specific benefit corporations.83 The general benefit corporation is akin to the Model-type benefit corporation and the specific benefit corporation is similar to the SPC.84
75. DEL. CODE ANN. tit. 8, § 362(a) (2011 & Supp. 2015).76. Id. § 365(a) (emphasis added); see also Murray, supra note 54, at 355 n.64 (discussing
the debate on the choice to use the word “balance” in the Delaware PBC law and the word “consider” in the Model Benefit Corporation legislation in relation to the director duties toward stakeholder interests).
77. DEL. CODE ANN. tit. 8, § 366(b) (2011 & Supp. 2015).78. Murray, supra note 54, at 351–54. Private ordering has been defined as “self-regulation
voluntarily undertaken by private parties.” Niva Elkin-Koren, What Contracts Cannot Do: The Limits of Private Ordering in Facilitating a Creative Commons, 74 FORDHAM L. REV. 375, 376 (2005).
79. Herrick K. Lidstone, Jr., The Long and Winding Road to Public Benefit Corporations in Colorado, COLO. LAW., Jan. 2014, at 40, http://papers.ssrn.com/sol3/papers.cfm?abstract_id=2266654 (last visited Sept. 20, 2015).
80. Callison, supra note 29, at 159–60. 81. Id. at 163.82. COLO. REV. STAT. ANN. §§ 7-101-501–509 (West 2006 Supp. 2014); Callison, supra
note 29, at 159–64. 83. Walker, supra note 73, at 2, 17.84. MINN. STAT. ANN. § 304A (West 2011 & Supp. 2015).
2016] THE SOCIAL ENTERPRISE LAW MARKET 555
The PBC laws are quite recent, so relatively little legal scholarship has been published on this specific entity type as of the publication of this Article. The academic articles that have been written have largely considered the PBC form to be an improvement on most of the existing social enterprise laws.85 The same articles, however, have noted various issues with the PBC laws, including continued lack of clarity for directors and the seeming lack of effective enforcement mechanisms.86
II. ITERATIONS AND INNOVATIONS IN SOCIAL ENTERPRISE LAW
As Part I demonstrates, states have passed a variety of social enterprise statutes and social enterprise law has drawn out conflicting views in the literature. Social enterprise law has evolved over time, sometimes due to the passage of a statute that creates a new entity type and sometimes due to the passage of a statute that simply modifies an existing entity type. As described in more detail in this Part, social enterprise statutes have evolved significantly over time. The L3C statutes are very thin and have few requirements, but they do clearly state that the common good must be the primary purpose of the L3C.87 The benefit corporation statutes, along with the FPC, SPC, and PBC statutes, are less clear on the priorities of the entities than the L3C, but add significant additional detail in other areas.88
The iterations and innovations involving the social enterprise forms,organized by legal issue, are discussed below.89
A. Entity Purpose
Defining entity purpose has been at the heart of many of the social enterprise statutes.90 For L3C statutes, the law is clear that “charitable or educational purposes” must dominate the “production of income.”91
Subsequent social enterprise statutes have defined entity purpose, but most have not clearly explained how the interests of shareholders and other stakeholders should be prioritized. For example, the Model Benefit
85. See generally Frederick H. Alexander, Lawrence A. Hamermesh, Frank R. Martin, & Norman M. Monhait, M&A Under Delaware’s Public Benefit Corporation Statute: A Hypothetical Tour, 4 HARV. BUS. L. REV. 255 (2014); Callison, supra note 29; Murray, supranote 54; Strine, supra note 52.
86. See supra note 85.87. See, e.g., VT. STAT. ANN. tit. 11, §§ 4001(14), 4161–4163 (2010).88. Murray, supra note 66.89. See infra Part II.A–F.90. See Clark & Vranka, supra note 27, at 15 (stating that defining corporate purpose to
“create a material positive impact on society and the environment” is one of three major provisions in the benefit corporation statutes); see also Elizabeth Schmidt, Vermont’s Social Hybrid Pioneers: Early Observations and Questions to Ponder, 35 VT. L. REV. 163, 168 (2010) (noting the important social purpose provisions in the L3C statutes).
91. See, e.g., VT. STAT. ANN. tit. 11, § 4162 (2010).

556 MARYLAND LAW REVIEW [VOL. 75:541
Corporation Legislation and most states that follow the Model require a “general public benefit purpose.”92 Shareholders are included among the stakeholders that directors of benefit corporations must consider, but The Model Benefit Corporation Legislation does not provide prioritization among stakeholders.93 The SPC statutes address what Bill Callison calls the “illiberalism problem” created by the broad, mandatory “general public [benefit] purpose,” by providing more flexibility in the definition of entity purpose.94 The SPC statutes allow an entity’s focus to be on one or more specific stakeholders.95 The PBC statutes, initially championed by Delaware, stake out middle ground by requiring both a specific public benefit purpose and a more general public purpose.96 The SPC and PBC statutes, however, do not clearly address the issue of prioritization among shareholders and other stakeholders.97
B. Third-Party Standards and Social Reporting
L3C statutes do not require the use of a third-party standard in measuring the social impact of an entity.98 Benefit corporation statutes, most of which were passed after the L3C statutes, do require use of a third-party standard, while Delaware’s PBC statute expressly allows, but does not require, a third-party standard.99 Colorado’s PBC statute follows the Model in requiring a third-party standard, while the SPC statutes do not require entities to use a third-party standard to measure social impact.100
The L3C statutes do not expressly require any social reporting.101 The Model Benefit Corporation Legislation and most state benefit corporation statutes require annual benefit reports that must be posted on a public portion of the firm’s website.102 A few of the benefit corporation statutes,
92. MODEL BENEFIT CORP. LEGIS. § 201(a) (2014),http://benefitcorp.net/sites/default/files/documents/Model_Benefit_Corp_Legislation.pdf.
93. See id. § 301.94. Callison, supra note 29, at 151–52 (arguing that the “general public purpose” concept is
overly restrictive and that different corporate actors are likely to have different understandings of what is good for society).
95. CAL. CORP. CODE § 3305 (West 2014); WASH. REV. CODE ANN. §§ 23B.25.020–030 (West 2013).
96. See DEL. CODE ANN tit. 8, §§ 362, 365 (2011 & Supp. 2015); see also COLO. REV. STAT.ANN. §§ 7-101-503, 506 (West 2006 & Supp. 2014).
97. See COLO. REV. STAT. ANN. §§ 7-101-503, 506 (West 2006 & Supp. 2014); see also CAL. CORP. CODE §§ 2500–3503 (West 2014).
98. See, e.g., VT. STAT. ANN. tit. 11, §§ 4001(14), 4161–4163 (2010).99. Murray, supra note 66; see also Dana Brakman Reiser, Theorizing Forms for Social
Enterprise, 62 EMORY L.J. 681, 690–91 (2013) (claiming that the third-party standardrequirement is a cornerstone requirement of the benefit corporation legislation).
100. Murray, supra note 66.101. See, e.g., VT. STAT. ANN. tit. 11, §§ 3001–3023 (2010) (repeal effective July 1, 2016).102. Murray, supra note 66. Forthcoming research by the author will show, however, that
early benefit corporations have had miserably low compliance rates (under ten percent) with

2016] THE SOCIAL ENTERPRISE LAW MARKET 557
namely Florida, Massachusetts, Minnesota, Nevada, New Hampshire, and New Jersey, create express penalties for failing to provide benefit reports.103
For example, in New Jersey, if an annual benefit report is not filed for two years, then that benefit corporation will lose its benefit corporation status.104
Most of the state benefit corporation statutes, however, have no express enforcement mechanism related to social reporting.105 The California SPCstatute requires both annual and special reports.106 The Delaware PBC statute requires only biennial reports and the report only has to be shared with shareholders and not the general public, unless the PBC decides to require public disclosure.107 A minority of states, including Arizona, Arkansas, Massachusetts, Minnesota, Nebraska, New Hampshire, New Jersey, Pennsylvania, South Carolina, and Utah, require filing the annual benefit corporation report with the state.108 While many of these states that require filing are also the states that have enforcement mechanisms for failing to file a report, some states like Utah, require filing of the benefit report with the secretary of state, but do not expressly mention a consequence for failing to file.109 Even worse, many of the states neither require filing of the benefit report with the state nor do they have any effective enforcement mechanism for failing to produce the report on the firm’s website.110
regard to the social reporting requirements. See generally, J. Haskell Murray, An Early Report on Benefit Reports, 118 W. VA. L. REV. 25 (forthcoming 2016), http://papers.ssrn.com/sol3/papers.cfm?abstract_id=2682709.
103. FLA. STAT. ANN. § 607.613 (West 2007 & Supp. 2015); MASS. GEN. LAWS ANN. ch. 156E, § 7 (West 2005 & Supp. 2014); MINN. STAT. ANN. § 304A.301 (West 2011 & Supp. 2014);NEV. REV. STAT. ANN. § 78B.030(3) (LexisNexis 2010 & Supp. 2013); N.J. STAT. ANN.§ 14A:18-11(d)(2) (West 2003 & Supp. 2015); N.H. REV. STAT. ANN. § 293-C:13 (LexisNexis 2014).
104. N.J. STAT. ANN. § 14A:18-11(d)(2).105. Murray, supra note 66.106. CAL. CORP. CODE §§ 2500–2517 (West 2014); see also Reiser & Dean, supra note 57, at
72–74 (discussing the extensive reporting requirements of the FPC statute).107. DEL. CODE ANN. tit. 8, § 366 (2011 & Supp. 2015); see also Murray, supra note 54, at
371 (showing the differences between the Delaware PBC law and the Model Benefit Corporation Legislation).
108. ARIZ. REV. STAT. ANN. § 10-2442 (2013 & Supp. 2014); ARK. CODE ANN. § 4-36-401 (2001 & Supp. 2013); MASS. GEN. LAWS ANN. ch. 156E, § 16 (West 2005 & Supp. 2015); MINN.STAT. ANN. § 304A.301 (West 2011 & Supp. 2015); NEB. REV. STAT. § 21-414 (2012 & Supp. 2014); N.H. REV. STAT. ANN. § 293- C:13 (LexisNexis 2014); N.J. STAT. ANN. § 14A:18-11 (West 2003 & Supp. 2015); 15 PA. STAT. AND CONS. STAT. ANN. § 3331 (West 2013 & Supp. 2015); S.C. CODE ANN. § 33-38-500 (2012); UTAH CODE ANN. § 16-10b-402 (LexisNexis 2014).
109. See UTAH CODE ANN. § 16-10b-402.110. Murray, supra note 66. This failure to require filing of the benefit report and the failure
to provide enforcement mechanisms may be oversight or may reflect the reality that many states have extremely limited resources and are not willing to invest significantly in benefit corporations at this early stage.
558 MARYLAND LAW REVIEW [VOL. 75:541
C. Dissenters’ Rights
Neither the L3C statutes nor the Model Benefit Corporation Legislation address dissenters’ rights for shareholders who oppose the transition to or from social enterprise status.111 The authors of the Proponent White Paper argue that dissenters’ rights should not be included in social enterprise laws because dissenters’ rights are usually coupled with a liquidity event and changing entity types would not provide the liquidity needed to pay dissenters.112 This reasoning is not particularly persuasive because if converting to a benefit corporation was a prudent strategy, new shareholders could be found to buy out any dissenters.
A number of states have departed from the Model Benefit Corporation Legislation and expressly provided for dissenters’ rights. California’s benefit corporation and SPC statutes were the first to expressly address and require dissenters’ rights.113 Florida, Minnesota, and Washington followed.114 Allowing dissenters’ rights, but only when adopting benefit corporation status, not when terminating benefit corporation status, are the states of Colorado, Connecticut, Delaware, Massachusetts, Nevada, and South Carolina.115
Going in a different direction, Virginia addresses the issue of apotentially unwanted entity conversion by requiring one hundred percent shareholder approval for adoption of benefit corporation status, instead of the typical two-thirds shareholder vote.116 No known claims for dissenters’ rights in the benefit corporation context currently exist. The mere existence of dissenters’ rights in some states, however, may lead to better shareholder protection because of the significant financial liability that could be triggered if firms convert to (or in some states “from”) a social enterprise entity form in the face of significant shareholder opposition. While dissenters’ rights may protect shareholders who do not want such a change in firm entity type, dissenters’ rights may also open the door to costly claims from private company shareholders who are simply looking for liquidity.
111. See, e.g., VT. STAT. ANN. tit. 11, §§ 4001(14), 4161–4163 (2010); Murray, supra note 66.
112. Clark & Vranka, supra note 27.113. See Murray, supra note 66.114. FLA. STAT. ANN. §§ 607.604-605 (West 2007 & Supp. 2015); MINN. STAT. ANN.
§ 304A.103 (West 2011 & Supp. 2015); WASH. REV. CODE ANN. § 23B.25.120 (West 2013) .115. See Murray, supra note 66.116. VA. CODE ANN. §§ 13.1-785–786 (2011). Delaware requires ninety percent shareholder
approval for a traditional corporation to convert to a public benefit corporation. DEL. CODE ANN.tit. 8, § 363 (2014).
2016] THE SOCIAL ENTERPRISE LAW MARKET 559
D. Naming and Notification
One of the often-cited benefits of social enterprise legislation is the branding or signaling aspect, but this benefit may be difficult to capture if alarge percentage of the public are not aware of the company’s social enterprise entity selection.117 From a legal standpoint, the Model Benefit Corporation Legislation and most benefit corporation state statutes require acknowledgment that the firm is a benefit corporation in the articles of incorporation, but have largely not required notification of entity type in the formal name.118 L3C statutes require that the firm name include the abbreviation L3C.119 California (SPC), Colorado (PBC), Delaware (PBC), Louisiana (BC), Minnesota (PBC), and Washington (SPC) also require designation of the entity type in the firm name.120 Statutes without a naming requirement have made it difficult on researchers, and presumably interested consumers and government officials, to track these social enterprises. According to Erik Trojian, B Lab’s Director of Policy, the naming requirement was not included in the Model because of the administrative costs that existing firms would have to shoulder to amend various documents related to their name.121 Of course, B Lab’s motivation is to make adoption of these forms as easy as possible; state legislatures, however, may wish to include a naming requirement, as a number of states have, to improve transparency and traceability of these social enterprises.122
Some states, including California, Colorado, Delaware, Louisiana, Maryland, Nevada, and New York, have required notification of the entity type on stock certificates.123
Social enterprise legal entity forms are still not well known in many quarters.124 The names of the social enterprise entity forms often include words like “benefit,” “social,” or “sustainable,” therefore requiring that the entity type be included in the company’s name could aid social enterprises
117. Loewenstein, supra note 40, at 1034–35 (discussing the branding challenges that may occur if the benefit corporation statutes vary significantly from state to state); Murray, supra note 54, at 357–58; Yockey, supra note 42, at 812–13.
118. Callison, supra note 45, at 93 (“There are no name requirements, either in the positive sense, where benefit corporations must designate themselves as such, or in the negative sense, where corporations that are not benefit corporations cannot use a name implying benefit corporation status.”); Murray, supra note 54, at 357–58 (discussing some of the difficulties arising from the absence of a naming requirement in the benefit corporation statutes); Murray, supra note 66.
119. See, e.g., VT. STAT. ANN. tit. 11, § 4005(a)(2) (2010).120. Murray, supra note 66.121. Telephone Interview with Erik Trojian, Dir. of Policy, B Lab (Aug. 15, 2013).122. Id. (discussing the difficulties some companies might have in switching to the benefit
corporation form if those companies were required to change their legal name). 123. Murray, supra note 66.124. Reiser, supra note 29, at 622–24 (claiming that the benefit corporation brand is not yet
well known in the marketplace).
560 MARYLAND LAW REVIEW [VOL. 75:541
in signaling to managers, employees, customers, and governments the social mission of the firms.125 As Professor Joseph Yockey has argued, social enterprise laws may serve as focal points and can “direct[] social enterprises toward a desired starting point for structuring their behavior.”126
Even if the social enterprises were well known, Professor Usha Rodrigues wonders if social enterprises can send a strong signal to stakeholders given their dual focus on public purpose and profit.127
The names chosen for the hybrid forms—low-profit limited liability company, flexible purpose corporation, social purpose corporation, benefit corporation, and public benefit corporation—may play a role in entity-norm creation and signaling.128 The weakest names, from a social perspective, are “low-profit limited liability company” and “flexible purpose corporation.” Recently, each of those forms has attracted less attention, perhaps at least partially owing to the entity names, which do not clearly state the social purpose of the hybrid form. The flexible purpose corporation name has been abandoned altogether.129 In contrast, the names “social purpose corporation,” “benefit corporation,” and “public benefit corporation” connote a focus on the society at large.130 The public does not generally take the time to dive into the nuances of corporate law, therefore,the name of the entity form may be important in the initial shaping of the
125. Murray, supra note 54, at 505–06; Yockey, supra note 42, at 812 (noting the influence entity choice may have on the culture of social enterprises); cf. Robert C. Illig, Oregon’sExperiment with Sustainable Corporate Governance: A Friendly Critique, 25 J. ENVTL. L. &LITIG. 189, 202 (2010) (“Signaling is a dangerous sport, as one loses control of the signal as soon as it is commenced, and it is frequently received either too loudly or not at all. As a result, signals are subject to the twin risks of misinterpretation and misdelivery.”).
126. Yockey, supra note 42, at 808. 127. Usha Rodrigues, Entity and Identity, 60 EMORY L.J. 1257, 1318–19 (2011).128. Stronger signals might be sent through more than “mere talk” by states. For example, tax
incentives might prove to be a strong signal because in that case states will have made a financial sacrifice, at least in the short run, unlike simply passing a social enterprise statute, which requires almost no financial support from the state. See Illig, supra note 125, at 194 (arguing that Oregon could send a strong signal to green businesses by “eliminat[ing] the state income tax on any profits an organization earns from selling green technologies”); id. at 202; Murray, supra note 42.
129. Alicia Plerhoples, Flexible Purpose Corporations Change Their Name, SOCENTLAW.COM (Oct. 20, 2014), http://socentlaw.com/2014/10/flexible-purpose-corporations-change-their-name/.
130. The positive nature of these names may give rise to reasonable calls for a state requirement for socially beneficial activity. See Stefan J. Padfield, Rehabilitating Concession Theory, 66 OKLA. L. REV. 327, 333 (2014) (“Under concession theory, the state retains significant presumptive authority to regulate the corporate entity in exchange for granting this bundle of rights to incorporators.” (citing Larry E. Ribstein, Why Corporations?, 1 BERKELEY BUS. L.J.183, 208 (2004))). But see First Nat’l Bank of Bos. v. Bellotti, 435 U.S. 765, 778 n.14 (1978) (noting that a concession theory, the theory that “corporations, as creatures of the State, have only those rights granted them by the State” was an “extreme position” with regard to traditional corporations). Professor Padfield argues that he is only using “‘concession theory’ to denote a theory of the corporation that gives deference to government regulation, as opposed to removing all limits on the state’s right to regulate corporations.” Padfield, supra, at 333.
2016] THE SOCIAL ENTERPRISE LAW MARKET 561
public’s view of the entity.131 Despite the signals sent by the name of the forms, the profit-making of these hybrid forms may taint the social identity if stronger private or public regulation is not put in place to guard against rent-seeking by profit-focused actors.132 In fact, the society-focused name might even prove to be a detriment when scandals involving those firms are brought to light and the public lashes out against the hypocrisy.
E. Legacy Preservation Provisions
Connecticut cut a new path with its legacy preservation provisions.133
The legacy preservation provision is an interesting new statutory addition that allows benefit corporations in Connecticut the option to “lock in” their social mission after a twenty-four-month waiting period and unanimous shareholder approval.134 A Connecticut benefit corporation with an adopted legacy provision that chooses to merge may only merge with a similar benefit corporation with a legacy provision.135 A disposition of assets of a Connecticut benefit corporation with an adopted legacy preservation provision may only be made to a charitable organization or a benefit corporation with a similar legacy preservation provision.136
This legacy provision may give some confidence to impact investors who are looking for assurances that their money will be used for social purposes. The provision may prevent managers of benefit corporations from “selling out” when the mission fades or the potential profits from a sale increase. The legacy provision, however, does not ensure that a benefit corporation will do any social good, nor does it prevent managers of benefit corporations from rent-seeking through excessive salaries and personal benefits. Finally, the legacy provision may be overly restricted, as the greatest social good may be achieved by selling the company for a high price to a traditional corporation and allowing the benefit corporation’s
131. See Illig, supra note 125, at 193 (noting the public’s lack of familiarity with corporate law).
132. See MUHAMMAD YUNUS, BUILDING SOCIAL BUSINESS: THE NEW KIND OF CAPITALISM THAT SERVES HUMANITY’S MOST PRESSING NEEDS 14–31 (2010) (arguing that social businesses should be sustainable, but should not be run with shareholders seeking profits because the conflicts are too strong).
133. James Woulfe, Woulfe on Connecticut Benefit Corporation Law, BUS. L. PROF BLOG(July 18, 2014), http://lawprofessors.typepad.com/business_law/2014/07/woulfe-on-connecticut-benefit-corporation-law.html. The Connecticut benefit corporation statute became effective on October 1, 2014. State by State Legislative Status, supra note 25.
134. CON. GEN. STAT. ANN. § 33-1355 (2005 & Supp. 2015). The purpose of this waiting period is not clear, but it may lead to fewer benefit corporations adopting this provision because it may simply vanish from the minds of the managers after the benefit corporation is formed. The statute is not clear regarding whether managers could adopt the provision when the benefit corporation is formed, to be effective twenty-four months from formation.
135. Id. § 33-1356(c). 136. Id. § 33-1356(d).

562 MARYLAND LAW REVIEW [VOL. 75:541
shareholders to give to society in their own ways through the proceeds.137
A better solution to mission drift may be found in a mandatory partial asset lock, a minimum charitable contribution rule, or the use of financial instruments that encourage a social focus.138 These solutions are not as highly restrictive, serve a signaling purpose, and provide a likely social benefit.139
F. Relatively Stagnant Areas
Some areas of social enterprise law have remained relatively stagnant. For example, most social enterprise laws that have addressed the area have provided significant protection to managers.140 Originally, the Model Benefit Corporation Legislation did not allow any monetary liability for the directors and officers of benefit corporations for “failure of the benefit corporation to pursue or create general public benefit or specific public benefit.”141 Later versions of the Model Benefit Corporation Legislation allowed benefit corporations to opt into monetary liability for such a failure to pursue or create public benefit.142 The Delaware PBC protects directors, as long as their conduct “is both informed and disinterested and not such that no person of ordinary, sound judgment would approve.”143
No social enterprise laws to date have provided automatic standing to sue to external stakeholders despite the mandate in the statutes to “consider” or “balance” external stakeholder interests.144 In addition, no state, other than Connecticut, has done much in the way of locking in a mission or providing for serious consequences if the mission is aborted.145
137. See Milton Friedman, The Social Responsibility of Business Is to Increase Its Profits,N.Y. TIMES MAG. (Sept. 13, 1970), www.colorado.edu/studentgroups/libertarians/issues/friedman-soc-resp-business.html (arguing that businesses should focus on increasing its profits, while staying within “the rules of the game,”and leave “social responsibility” to individuals).
138. See generally Murray, supra note 40; Reiser & Dean, supra note 57.139. While no proposed solution is likely to be without some flaws, a minimum charitable
contribution (in time or money) would place those contributions into a charitable regime that is much more heavily regulated than the for-profit market.
140. Murray, supra note 66.141. MODEL BENEFIT CORP. LEGIS. § 301(c)(2) (2014),
http://benefitcorp.org/sites/default/files/documents/Model_Benefit_Corp_Legislation.pdf; Murray, supra note 40, at 22 n.98.
142. MODEL BENEFIT CORP. LEGIS. § 301(c)(2), http://benefitcorp.net/sites/default/files/documents/Model_Benefit_Corp_Legislation.pdf; Murray, supra note 40, at 22 n.98. There are no indications that any benefit corporations have yet to take advantage of the opportunity to opt into allowing the possibility of monetary liability for directors or officers who fail to pursue or create public benefit.
143. DEL. CODE ANN. tit. 8, § 365(b) (West 2011 & Supp. 2015); Delaware Public Benefit Corporations: FAQs (on file with author).
144. Murray, supra note 66.145. Murray, supra note 66; Woulfe, supra note 133; Benefit Corporations Have Arrived in
Connecticut, MURTHA CULLINA LLP (June 2014), http://www.murthalaw.com/news_alerts/1404-
2016] THE SOCIAL ENTERPRISE LAW MARKET 563
Even Connecticut’s legacy protection provisions are optional.146 Moststates allow the benefit corporations to drop their status with a two-thirds shareholder vote. Since the passage of the first statute, the penalty for L3Csviolating the statute has simply been conversion to an LLC; the L3C statutes provide neither express penalties in addition to the conversion nor any statutory remedy to the L3C members who, after conversion, only hold an interest in an LLC.147
Finally, the general public benefit purpose language and the need of a third-party standard appear to be two items that B Lab clings to in their promoting of the benefit corporation law.148 Delaware was able to alter the general public purpose language and was able to make the third-party standard optional.149 Reportedly, B Lab’s response to other states that try similar manipulations, especially in regard to the third-party standard requirement, is to tell those states, “[you are] not Delaware.”150
Parts I and II have described what has come into being and what has changed in social enterprise law. Parts III and IV will attempt to describe why the evolution of social enterprise law occurred and “how” states may proceed in the future.
III. JURISDICTIONAL COMPETITION OR JURISDICTIONAL POSITIONING
A. Race to the Bottom, Race to the Top, or Neither?
Jurisdictional competition for corporation charters has been heavily analyzed and hotly debated in the academic legal literature.151 In 1974, William Cary, then a law professor at Columbia University, wrote a seminal article in the Yale Law Journal where he argued that Delaware corporate law was leading a “race for the bottom.”152 In basic terms, the race to the bottom theory posits that states competing for charters have enacted management-friendly enabling statutes and “have watered the rights of shareholders vis-à-vis management down to a thin gruel.”153
may—-benefit-corporations-arrived-connecticut (noting the uniqueness of Connecticut’s legacy provisions in its benefit corporation statute).
146. CON. GEN. STAT. ANN. § 33-1355 (2005 & Supp. 2015). 147. VT. STAT. ANN. tit. 11, § 4163(a) (2010) (“A limited liability company that elects to be
an L3C and subsequently fails to satisfy any one of the requirements set forth in section 4162 of this title shall immediately cease to be a low-profit limited liability company, but by continuing to meet all the other requirements of this chapter, continues to exist as a limited liability company.”).
148. Telephone Interview with Erik Trojian, Dir. of Policy, B Lab (Aug. 15, 2013).149. DEL. CODE ANN. tit. 8, §§ 362(a), 366 (West 2011 & Supp. 2015).150. Callison, supra note 29, at 163.151. See generally Roberta Romano, The Market for Corporate Law Redux, in OXFORD
HANDBOOK OF LAW AND ECONOMICS (Francesco Parisi ed.) (forthcoming 2015), http://papers.ssrn.com/sol3/papers.cfm?abstract_id=2514650.
152. Cary, supra note 3.153. Id. at 666.
564 MARYLAND LAW REVIEW [VOL. 75:541
Professor Cary’s seminal article has been cited over 1000 times and a popular legal academic blog even bears the title “The Race to the Bottom.”154 Additional research has sprouted to support and add to Cary’s claims.155
Others, including Judge Ralph Winter of the U.S. Court of Appeals for the Second Circuit, have countered that Delaware has led a “race for the top.”156 Proponents of the “race to the top” theory argue that investors will prefer firms that do not excessively favor management and that competition for charters creates incentives to construct the optimal corporate code. Over time, the choice regarding where to incorporate has essentially boiled down to two potential states: Delaware and the home state of the firm.157
As explained by Professor Daines, “Federalism has thus resulted in a series of local markets with one national producer, rather than a nationwide ‘race to the top/bottom.’”158 Professor Romano mentioned “Delaware’s reputation for responsiveness to corporate concerns”159 and “comprehensive body of case law, judicial expertise in corporation law, and administrative expertise” as reasons for Delaware’s preeminence.160 Some commentators claim this “race to the top” versus “race to the bottom” debate is now at a stalemate.161
154. Westlaw Keycite of William L. Cary, Federalism and Corporate Law: Reflections upon Delaware, 83 YALE L.J. 663 (1974); THERACETOTHEBOTTOM.ORG,http://www.theracetothebottom.org/ (last visited Sept. 21, 2015).
155. See, e.g., Oren Bar-Gill, Michal Barzuza & Lucian Bebchuk, The Market for Corporate Law, 162 J. INSTITUTIONAL & THEORETICAL ECON. 134, 137, 162 (2006); Lucian Bebchuk, Alma Cohen & Allen Ferrell, Does the Evidence Favor State Competition in Corporate Law?, 90 CAL.L. REV. 1775 (2002); Bebchuk, supra note 2; Richard W. Jennings, Federalization of Corporation Law: Part Way or All the Way, 31 BUS. LAW. 991, 993–94 (1976); Stanley A. Kaplan, Fiduciary Responsibility in the Management of the Corporation, 31 BUS. LAW. 883, 885–87 (1976).
156. See generally ROMANO, supra note 1; Robert Daines, Does Delaware Law Improve Firm Value?, 62 J. FIN. ECON. 525, 527–31 (2001); Roberta Romano, The State Competition Debate in Corporate Law, 8 CARDOZO L. REV. 709 (1987); Ralph K. Winter, Jr., State Law, Shareholder Protection, and the Theory of the Corporation, 6 J. LEGAL STUD. 251 (1977); Judge Ralph Winter, Private Goals and Competition Among State Legal Systems, 6 HARV. J.L. & PUB. POL’Y127 (1982); cf. Ralph K. Winter, The “Race for the Top” Revisited: A Comment on Eisenberg, 89 COLUM. L. REV. 1526, 1528 (1989) (“I am far more confident that Professor Cary’s argument about the race to the bottom is wrong than I am that my argument that Delaware is leading the race to the top is right.”).
157. Robert Daines, The Incorporation Choices of IPO Firms, 77 N.Y.U. L. REV. 1559, 1559 (2002).
158. Id.; see also Lucian Arye Bebchuk & Alma Cohen, Firms’ Decisions Where to Incorporate, 46 J.L. & ECON. 383, 394–402 (2003) (discussing the existence of “home-state advantage” in the market for corporate law).
159. ROMANO, supra note 1, at 38.160. Id. at 39.161. See, e.g., Robert Anderson IV & Jeffrey Manns, The Delaware Delusion, 93 N.C. L.
Rev. 1049, 1059 (2015); Roe supra note 4, at 634. But see Michael Klausner, Corporations,Corporate Law, and Networks of Contracts, 81 VA. L. REV. 757, 842 (1995) (claiming that there is “broad consensus” in favor of some form of the “race to the top” theory).
2016] THE SOCIAL ENTERPRISE LAW MARKET 565
More recent scholarship on jurisdictional competition has suggested that there is no longer vigorous competition between states for corporate charters, though perhaps there had been such competition in the past before Delaware became so dominant.162 These commentators argue that Delaware’s main competition in the corporate law arena now comes from the federal government, rather than from other states, and have posited that federal law, not state law through state competition, has accounted for most changes in the amount of shareholder protection over the last eighty years.163 Professor Romano, however, has argued that Delaware publicly expresses more concern about state competition than federal competition, and that federal legislation in the corporate law arena is still “rare and episodic.”164 Some commentators argue that Delaware has developed monopoly-like power for the charters of large out-of-state corporations and has held the other states at bay by taking a middle-of-the-road approach, balancing appeal to managers and shareholders.165 Other scholars recently argued that even if states do not actively compete for out-of-state incorporations, they compete defensively to retain corporations located within their borders.166 Still others claim that states do not even compete defensively because the financial stakes are too low for states other than
162. Mark J. Loewenstein, Delaware as Demon: Twenty-Five Years After Professor Cary’sPolemic, 71 U. COLO. L. REV. 497, 501–02 (2000); see also Marcel Kahan & Ehud Kamar, TheMyth of State Competition in Corporate Law, 55 STAN. L. REV. 679, 748–49 (2002) (concluding that states, other than Delaware, do not have sufficient financial incentive to compete for incorporations); Roe, supra note 4.
163. See, e.g., Bebchuk & Hamdani, supra note 4, at 604-05; Brian R. Cheffins, Steven A. Bank & Harwell Wells, The Race to the Bottom Recalculated: Scoring Corporate Law over Time(UCLA Sch. of Law, Law-Econ Research Paper No. 10, 2014; ECGI-Law, Working Paper No. 261, 2014; Univ. of Cambridge Faculty of Law, Research Paper No. 54, 2014; Temple Univ. Legal Studies, Research Paper No. 38, 2014), http://papers.ssrn.com/sol3/papers.cfm?abstract_id=2475242; Roe, supra note 4.
164. Romano, supra note 151, at 46.165. See e.g., Krešimir Piršl, Trends, Developments, and Mutual Influences Between United
States Corporate Law(s) and European Community Company Law(s), 14 COLUM. J. EUR. L. 277,315–17 (2008).
166. George W. Dent, Jr., For Optional Federal Incorporation, 35 J. CORP. L. 499, 505 (2010) (noting that while states do not appear to be competing with Delaware for nationwide dominance, there is evidence that states take action, e.g., through statutory amendments, to defend themselves against the possibility that their current companies will leave the state); Gordon Moodie, Forty Years of Charter Competition: A Race to Protect Directors from Liability? (John. M. Olin Ctr. for Law, Econ., & Bus. Fellows’ Discussion Paper Series, Paper No. 1, 2004), www.law.harvard.edu/programs/olin_center/fellows_papers/pdf/Moodie_1.pdf (showing that states that did not react to major statutory innovations, often from Delaware, lost more local corporations to other states than those that did); Romano, supra note 2, at 226; Roberta Romano, The States as a Laboratory: Legal Innovation and State Competition for Corporate Charters, 23 YALE J. ON REG. 209, 214–36 (2006) (tracking the diffusion of certain corporate law innovations across states and claiming that “after Delaware, states that are early to adopt corporate law innovations are more likely to succeed in the chartering market by retaining more locally-domiciled firms”).
566 MARYLAND LAW REVIEW [VOL. 75:541
Delaware.167 These commentators claim that political factors and economic barriers prevent states from competing with Delaware.168
Additionally, some commentators have tried to explain Delaware’s sustained success by pointing to Delaware’s expert judiciary and their responsive legislature.169 Others have noted the positive network externalities produced by having many other companies formed in the same state.170 Professors Robert Anderson and Jeffrey Manns use empirical data around merger reincorporation to claim that Delaware law does not add significant economic value and that the state is dominant simply because lawyers are familiar with the state’s law and assume it is superior.171
Professors Brian Broughman, Jesse Fried, and Daran Ibrahim contend that Delaware is dominant, at least in part, because its law serves as “lingua franca” for investors across the country.172
B. Indeterminacy and Price Discrimination
Professor Ehud Kamar has argued that the indeterminacy of Delaware’s corporate law prevents other states from benefiting from Delaware’s positive learning and network externalities and increases Delaware’s market power.173 Professor Kamar with Professor Marcel Kahan has stated that Delaware uses its significant market power to increase its profits through price discrimination; currently Delaware enjoys
167. Kahan & Kamar, supra note 162, at 699–700 (arguing that the financial incentives for states to engage in defensive competition are extremely weak because of the minimal amounts collected from franchise tax revenue and legal business). Kahan and Kamar appear open, however, to the possibility that the benefits to local lawyers may play a role, albeit a minor role, in states attempting to retain locally incorporated businesses. Id.
168. Id. at 724–35 (claiming the economic entry barriers are created by Delaware’s expert and well-paid judges, Delaware’s well-known corporate law, and Delaware’s reputation). The authors also claim that the political factors deterring competition with Delaware include the relatively small size and delay of profits from incorporation competition, focus on other priorities, and opposition of local interest groups. Id.; see also, Marcel Kahan, The State of State Competition for Incorporations (NYU Law and Economics Research Paper, No. 14-19, August 2014), http://papers.ssrn.com/sol3/papers.cfm?abstract_id=2474658 (arguing that competition literature can be divided into three debates: (1) a “directional” debate over whether firms would choose laws that benefit managers or laws that benefit shareholders; (2) a debate on “whether, how, and which states compete for incorporations,” and (3) a debate around federalism and corporate law).
169. Romano, supra note 151, at 52–55.170. Klausner, supra note 161, at 844–47 (claiming that the value of a corporation’s charter
increases along with increases in the number of firms formed in the state). Klausner argues that legal services and judicial precedent are likely to improve with a larger network and that once Delaware took a commanding lead, there was a self-reinforcing dynamic that helped the state maintain and even extend its lead. Id.
171. Anderson & Manns, supra note 161.172. Brian Broughman, Jesse M. Fried & Darian Ibrahim, Delaware Law as Lingua Franca:
Theory and Evidence, 57 J. L. & ECON. 865 (2014).173. Ehud Kamar, A Regulatory Competition Theory of Indeterminacy in Corporate Law, 98
COLUM. L. REV. 1908 (1998). Legal indeterminacy creates uncertainty stemming from broad standards that provide for significant judicial discretion. Id. at 1913–15.
2016] THE SOCIAL ENTERPRISE LAW MARKET 567
the ability to charge large firms a premium for incorporation, up to $180,000 per year.174 Professor Moshen Manesh has claimed that Delaware does not have the same market power with LLCs because of, among other things, the contractibility and reduction of legal indeterminacy in LLC law.175 Despite the apparent lack of ability to price discriminate in the LLC market, professors Bruce Kobayashi and Larry Ribstein concluded that Delaware has won the competition for LLCs for many of the same reasons Delaware has won the competition for corporate charters, and that most other states seem more interested in retaining local LLCs than fighting for LLCs from outside their state.176
Benefit corporation statutes provide, potentially, even more room for judicial intervention as they currently mandate a plethora of interests that directors of benefit corporations must consider. As mentioned above, the benefit corporation must serve a general public benefit purpose, defined as: “[a] material positive impact on society and the environment, taken as a whole, assessed against a third-party standard, from the business and operations of a benefit corporation.”177 Almost each word in this key definition could use judicial interpretation. Further, benefit corporation statutes do not allow contracting around or out of the “general public benefit purpose” which takes the issue out of the hands private parties and leaves significant questions for the courts to answer.178 On the other hand, benefit corporation statutes provide significant protection to managers, which means plaintiffs’ attorneys may not find lawsuits worth bringing, especially if most benefit corporations remain small and unable to pay any large damage awards.179 Also, currently, most of the benefit corporations formed are small entities and incapable or unwilling to pay large
174. See Marcel Kahan & Ehud Kamar, Price Discrimination in the Market for Corporate Law, 86 CORNELL L. REV. 1205, 1210–14, 1229 (2001) (discussing the evidence and sources of Delaware’s market power); Corporate and UCC Fee Information: Franchise Tax Calculator,STATE OF DELAWARE, https://corp.delaware.gov/fee.shtml (noting the maximum fee of $180,000 a year) (last visited Nov. 21, 2010).
175. See Manesh, supra note 31, at 220–41 (explaining that Delaware’s network and judicial advantages are diminished in the LLC context).
176. Kobayashi & Ribstein, supra note 2, at 136 (concluding that the quality of the courts is a major factor in attracting LLCs to Delaware and noting that most substantive provisions do not appear to have a significant impact in the LLC market).
177. MODEL BENEFIT CORP. LEGIS. § 102 (2014),http://benefitcorp.net/sites/default/files/documents/Model_Benefit_Corp_Legislation.pdf.
178. Callison, supra note 45; J. Haskell Murray, supra note 40.179. MODEL BENEFIT CORP. LEGIS. §§ 301(c), 303(c),
http://benefitcorp.net/sites/default/files/documents/Model_Benefit_Corp_Legislation.pdf(protecting directors and officers, respectively, from monetary damages stemming from the directors’ and officers’ action or inaction (as long as acting in compliance with general business duties and the benefit corporation statute) or “failure of the benefit corporation to pursue or create general public benefit or specific public benefit”).
568 MARYLAND LAW REVIEW [VOL. 75:541
incorporation fees.180 If benefit corporations become a more popular vehicle for large corporations in the future, and if at least one state can differentiate its product sufficiently, the indeterminacy in the benefit corporation law allows for the possibility of significant price discrimination. The social enterprises built on the LLC base (L3C and Benefit LLC), however, tend toward increased contractibility where potential market power may not be as strong.181
C. Current Financial Stakes and Jurisdictional Positioning
Appendix A to this Article sets forth the number of benefit corporations and L3Cs formed, respectively, in each state as the given dates.182 The data collection process for benefit corporations was challenging. Kate Cooney (Yale University), Matthew Lee (INSEAD), Justin Koushyar (Emory University), and I collected data over the course of more than twelve months. Many states we contacted did not distinguish between traditional corporations and benefit corporations in their databases.183 We had to work our way through secretary of states’ offices to find someone who even knew what benefit corporations were. Generally, once we found a knowledgeable person, we had to request a search of their database. Some states were better organized than others. Delaware, along with a few other states like California, had been tracking benefit corporations before we called and were able to provide the data quickly.184 For the L3C data we relied on the collection efforts of interSector Partners, which has been collecting this data consistently.185
L3Cs are likely a bit easier to track because the statutes generally require some form of “L3C” in the entity name, while most benefit corporation statutes do not have naming requirements.186
The best data to date suggests that there is currently very little at stake for states in the social enterprise area, with fewer than 5000 social enterprises formed nationwide.187 This number is insignificant in the face of almost six million corporations and over three million partnerships
180. Find a Benefit Corporation, BENEFIT CORPORATION,http://benefitcorp.net/businesses/find-a-benefit-corp (last visited Oct. 29, 2015). Most of the benefit corporations listed are extremely small and many do not even have company websites. Id.
181. Manesh, supra note 31, at 211–16.182. See infra Appendix A. 183. Part of the benefit corporation legislation pitch to states has been that the law will cost
extremely little to implement. 184. Unfortunately, California notified us that they planned to stop collecting data on our
behalf, our contact person at the state left his position, and it became difficult to find another person knowledgeable about benefit corporations at their Secretary of State’s office.
185. Here’s the Latest L3C Tally, supra note 5.186. See supra Part II.D.187. See infra Appendix A.
2016] THE SOCIAL ENTERPRISE LAW MARKET 569
currently in existence.188 The interest in social enterprises would have to increase exponentially for any state to make considerable revenue off of social enterprise franchise fees. States like New Jersey, and South Carolina have been stuck at single digit numbers of benefit corporations for well over twelve months.189 Washington, D.C. also has fewer than ten benefit corporations and its first (and, for a time, only) benefit corporation was formed with the assistance of the Georgetown Law Center Social Enterprise and Nonprofit Clinic.190 Professor Eric Talley found that only sixty benefit corporations and fifteen flexible purpose corporations (now called SPCs)were formed in the first eight months of the California laws being enacted.191 Only 5% of the entities formed were headquartered outside of California, suggesting that virtually no revenue was brought in from companies outside of the state.192 Currently, there does not appear to be vigorous competition for out-of-state social enterprises because so few exist, making the potential financial rewards for states negligible.
If the financial rewards related to social enterprises are currently so small, why are states passing social enterprise laws? One logical explanation could be called “jurisdictional positioning.” Jurisdictional positioning could be defined as states making sure that they are in a good starting place when the rewards in an area reach a level worth vigorously competing to win. Early movers have a distinct advantage in jurisdictional competition due to significant firm migration costs and the time consuming gestation of network and learning effects.193 In addition to the potential
188. U.S. CENSUS DEP’T, 2012 STATISTICAL ABSTRACT 491 (2012) (based on 2008 federal tax filings), https://www.census.gov/prod/2011pubs/12statab/business.pdf.
189. See infra Appendix A.190. Georgetown Law Students Incorporate First Benefit Corporation in D.C., GEO. L. (Nov.
21, 2013), http://www.law.georgetown.edu/news/press-releases/georgetown-law-students-incorporate-benefit-corporation.cfm.
191. Eric L. Talley, Corporate Form and Social Entrepreneurship: A Status Report from California (and Beyond) (UC Berkley Public Law Research Paper, No. 2144567, 2012), http://papers.ssrn.com/sol3/papers.cfm?abstract_id=2144567.
192. Id. at 8.193. See Jonathan Macey, Delaware: Home of the World’s Most Expensive Raincoat, 33
HOFSTRA L. REV. 1131, 1138–39 (2005) (describing Delaware’s first mover advantages in the area of traditional corporations). The growth in the “impact investing” movement, which is partially tied to the social enterprise movement, may be one of the things giving states hope of a later payday related to social enterprise. ANTONY BUGG-LEVINE & JED EMERSON, IMPACT INVESTING: TRANSFORMING HOW WE MAKE MONEY WHILE MAKING A DIFFERENCE (2011). Large investment banks like J.P. Morgan and Credit Suisse are devoting more resources to impact investing, which, at least in part, services social enterprise. See Corporate Responsibility and Social Finance, JPMORGAN CHASE & CO., http://www.jpmorganchase.com/corporate/Corporate-Responsibility/social-finance (last visited Sept. 28, 2015); Responsible Investments, CREDIT SUISSE, https://perspectives.credit-suisse.com/ch/private-clients/investments/en/our-products/sustainable-investments/product-range.jsp (last visited Sept. 28, 2015). Moreover, many of the nation’s top business schools have established social enterprise or social innovation programs, signaling that the next generation of business leaders may be more interested in social businesses. See, e.g., Social Enterprise, HARV. BUS. SCH., http://www.hbs.edu/socialenterprise/
570 MARYLAND LAW REVIEW [VOL. 75:541
financial rewards from winning a social enterprise charter competition, states could also be interested in the potential positive externalities flowing from social enterprises’ focus on society and the environment.
D. State Niches and Differentiation from Delaware
At this point in jurisdictional competition for business entities, most states have recognized that they cannot compete with Delaware for traditional, large corporations.194 Instead, states have started to find niches where they can develop expertise and competitive advantage.
Nevada has, perhaps, been the most aggressive challenger of Delaware, loosening its laws to protect managers (directors and officers) even more than Delaware and advertising the benefits of Nevada corporate law heavily.195 Nevada also charges a much lower maximum franchise tax than Delaware: $180,000 versus $11,100.196 Further, Professors Kobayashi and Ribstein argue that Nevada may be lowering the costs to control cheating for firms through the adoption of more bright-line rules for liability.197 Some authors claim that Nevada is the only state other than Delaware to openly compete for corporation charters and attract a significant number of out-of-state corporations.198 Nevada, however, seems to focus most of its efforts on closely-held entities.199 Closely-held entities are a large group of companies, and perhaps should not be called a niche, but Nevada seems to be shying away from direct competition with Delaware over large public companies, where Delaware is strongest.200
North Dakota attempted to differentiate itself by making its law friendlier to shareholders and focusing on shareholders and shareholder
(last visited Sept. 28, 2015); Center for Social Innovation, STAN. GRADUATE SCH. OF BUS., http://csi.gsb.stanford.edu (last visited Sept. 28, 2015); Social Impact, WHARTON, U. OF PA.,http://socialimpact.wharton.upenn.edu/projects/ (last visited Sept. 28, 2015); Center for the Advancement of Social Entrepreneurship, DUKE, THE FUQUA SCH. OF BUS., http://www.caseatduke.org (last visited Oct. 10, 2015).
194. See, e.g., Telephone Interview with James Woulfe, Public Policy and Impact Investing Specialist at the Social Enterprise Trust (Jan. 29, 2015) (discussing how Connecticut is looking for ways to attract types of businesses, such as social enterprises, that may not be Delaware’sprimary focus).
195. Michal Barzuza, Market Segmentation: The Rise of Nevada as a Liability-Free Jurisdiction, 98 VA. L. REV. 935, 949–56, 964–65 (2012).
196. Id. at 973–74. As Professor Barzuza notes, even though Nevada is less expensive than Delaware, Nevada charges a maximum initial fee of $30,000 in addition to its maximum annual fee of $11,100, which is much more expensive for incorporation than many other states. Id. Corporate and UCC Fee Information: Franchise Tax Calculator, supra note 174.
197. Bruce H. Kobayashi & Larry E. Ribstein, Nevada and the Market for Corporate Law, 35 SEATTLE U. L. REV. 1165, 1168–69 (2012).
198. Kahan & Kamar, supra note 162, at 716 (citing John G. Edwards, Nevada Joins the Company of Top Incorporation States, LAS VEGAS REV. J., Feb. 8, 1998, at 1K).
199. Id. at 716–17; Piršl, supra note 165, at 317. 200. Kobayashi & Ribstein, supra note 2.
2016] THE SOCIAL ENTERPRISE LAW MARKET 571
activists, rather than managers.201 By most accounts, however, North Dakota’s experiment, while an interesting one, failed to attract many out-of-state corporations.202 Although North Dakota tried a different strategy than Delaware, it did not seem to focus on a narrower group of companies like most of the other states mentioned in this Section. This lack of narrow focus may have hurt North Dakota.
Outside of Nevada and North Dakota, numerous other states have attempted to chip away at Delaware by focusing on relatively narrow types of companies. These companies are often in complex industries that require special expertise, sophisticated laws, and benefit from tax or other favorable treatment. For example, Wyoming and South Dakota have gotten into the asset protection and trust race.203 Oregon has attempted to be a leader for green companies, even before the current social enterprise law movement began in earnest in the United States.204 Connecticut has made a bid for financial services companies through tax provisions and other laws.205
Maryland has attracted a number of regulated investment firms, such as Real Estate Investment Trusts (“REITs”). In 2000, Maryland ranked second only to Delaware in the ranking of incorporations of U.S. public companies.206 Massachusetts, like Maryland, has gained some traction in
201. Mark J. Roe, Delaware’s Shrinking Half-Life, 62 STAN. L. REV. 125, 150–51 (2009)(explaining North Dakota’s strategy of focusing on a different group of corporate stakeholders, namely shareholder activists).
202. Barzuza, supra note 195, at 971. Barzuza and others mention American Railcar Industries, Inc. as one of, if not the only, major corporation to reincorporate in North Dakota. Id. Carl C. Icahn, who had supported the North Dakota legal changes, controlled American Railcar. Id.; see also Joshua P. Fershee, The North Dakota Publicly Traded Corporations Act: A Branding Initiative Without a (North Dakota) Brand, 84 N.D. L. REV. 1085, 1088–89, 1105 (2008).
203. See Timothy O. Beppler & Christopher M. Reimer, Domestic Asset Protection Trusts: A Comparison of the Laws of Utah and Wyoming, UTAH B.J., Mar.–Apr. 2010, at 12, 16 (mentioning that, unlike some states, Wyoming does not impose income tax on trusts); Clay D. Geittmann, Chaos to Comprehension: Estate Planning in Wyoming, WYO. LAW., Dec. 2007, at 18, 20(claiming that amendments to Wyoming law in 2007 to allow for self-settled asset protection trusts helped make Wyoming extremely competitive in the relatively narrow competition for trusts); Christopher M. Reimer, The Undiscovered Country: Wyoming’s Emergence as a LeadingTrust Situs Jurisdiction, 11 WYO. L. REV. 165, 194–95 (2011) (calling Wyoming a top destination for trusts, due, at least in part, to board powers for the settlor).
204. Robert C. Illig, supra note 125, at 189 (dating Oregon’s efforts in the green business area to 2007 and attributing at least part of the growth in this industry to an organization called Oregon Lawyers for a Sustainable Future); Judd F. Sneirson, Race to the Left: A Legislator’s Guide to Greening a Corporate Code, 88 OR. L. REV. 491, 495–502 (2009) (mentioning the growth of green or sustainable businesses and noting that Oregon “has already begun efforts to position itself as ‘the Delaware of green business’” through amendments to its corporate code).
205. John R. Shaughnessy & Scott E. Sebastian, 2010 Connecticut Tax Law Developments, 85 CONN. B.J. 71, 80–82 (2011); Richard W. Tomeo, Connecticut Takes Bold Steps in the Taxation of Financial Service Companies, 8 J. MULTISTATE TAX’N & INCENTIVES 209, 210 (1998).
206. Professors Kahan and Kamar claim that Maryland’s success in this niche area can be traced to the minimal franchise tax and “Maryland’s attraction for investment funds is based on the fact that Maryland law contains a number of statutory provisions targeted at investment companies, including provisions designed to assure that the investment company satisfies federal
572 MARYLAND LAW REVIEW [VOL. 75:541
the REIT area.207 Massachusetts also appears to compete in the business trust and mutual fund areas.208
Given that some of the rhetoric used by proponents of social enterprise has been largely critical of traditional Delaware corporate law, social enterprise may be a niche that other states think they can dominate, or at least compete on a more even playing field.209 In addition to attempting to find a niche in the competition for business entities, another (more cynical) explanation of the widespread passage of social enterprise law is based on the interest groups involved. The next Part explores the influence of these interest groups on the passage of social enterprise legislation and on the social enterprise movement in general.210
IV. INTEREST GROUPS AND SKEPTICS
Interest group theory has significant explanatory power with regard to the recent proliferation of social enterprise laws, which skeptics can claim are not being passed for the good of the public, but rather for a relatively small group that stand to benefit from the laws. The interest group theory of legislation, also called the economic theory of legislation, posits that legislation will be bought and sold as a good to the group that values it most.211 Under this theory, interest groups use currency consisting of
tax requirements, a waiver of the requirement to hold annual meetings of shareholders, and a grant of power to the board of an investment company to increase the number of authorized shares without shareholder approval.” Kahan & Kamar, supra note 162, at 721; see also Guhan Subramanian, The Influence of Antitakeover Statutes on Incorporation Choice: Evidence on the “Race” Debate and Antitakeover Overreaching, 150 U. PA. L. REV. 1795, 1815–16 (2002) (noting that virtually all of Maryland’s success in attracting public companies is due to its success in attracting REITs); Charles M. Elson, Book Review, 52 BUS. LAW. 1003, 1004 (1997) (reviewing NAT’L ASS’N OF REAL ESTATE INV. TRUSTS, THE PUBLIC REIT LEGAL SOURCEBOOK (1995))(commenting on Maryland and Delaware’s relative strength in the REIT area).
207. Daines, supra note 157, at 1572 n.51; Sheldon A. Jones, Laura M. Moret & James M. Storey, The Massachusetts Business Trust and Registered Investment Companies, 13 DEL. J.CORP. L. 421, 428–29 (1988) (noting Massachusetts’ competition in the business trust area, in part through favorable statutes and case law); William L. Martin II, Federal Regulation of Real Estate Investment Trusts: A Legislative Proposal, 127 U. PA. L. REV. 316, 316 n.2 (1978) (noting that REITS often form as Massachusetts business trusts).
208. See Diane M. Ring, Exploring the Challenges of Electronic Commerce Taxation Through the Experience of Financial Instruments, 51 TAX L. REV. 663, 667 (1996) (describing Massachusetts’ strength in the mutual fund industry).
209. TEDx Talks, TEDxPhilly—Jay Coen Gilbert—On Better Businesses, YOUTUBE, at 9:45–10:02 (Dec. 1, 2010), http://www.youtube.com/watch?v=mGnz-w9p5FU (claiming that maximizing shareholder value is “the only game in town” in Delaware (citing eBay Domestic Holdings v. Newmark, 16 A.3d 1 (Del. Ch. 2010)). See generally Clark & Vranka, supra note 27.
210. See infra Part V. 211. Jonathan R. Macey, Promoting Public-Regarding Legislation Through Statutory
Interpretation: An Interest Group Model, 86 COLUM. L. REV. 223, 227 (1986). See generally Einer R. Elhauge, Does Interest Group Theory Justify More Intrusive Judicial Review?, 101 YALE L.J. 31, 35 (1991) (“The defining theme of the interest group theory of lawmaking is its rejection of the presumption that the government endeavors to further the public interest. Rather, under

2016] THE SOCIAL ENTERPRISE LAW MARKET 573
“political support, promises of future favors, outright bribes, and whatever else politicians value” to achieve passage of legislation that favors the interest groups’ desires.212 Using microeconomic tools, the interest group theory claims the price an interest group ultimately pays will be influenced
interest group theory, all the participants in the political process act to further their self-interest.”);Macey, supra note 193, at 1136–37 (claiming that attorneys are the primary interest group thatbenefits under their theory); Jonathan R. Macey & Geoffrey P. Miller, Toward an Interest-Group Theory of Delaware Corporate Law, 65 TEX. L. REV. 469 (1987) (applying interest group theory to Delaware corporate law). George K. Yin, Temporary-Effect Legislation, Political Accountability, and Fiscal Restraint, 84 N.Y.U. L. REV. 174, 240 (2009) (“In very general terms, the interest-group theory of the legislative process conceptualizes legislation as carrying out a transfer of benefits from one group (typically thought to be large, disorganized, and with diffuse interests, such as taxpayers generally) to some other group (small, focused, and easily organized, such as persons or firms having some common, special interest.” (first citing DANIEL A. FARBER & PHILIP P. FRICKEY, LAW AND PUBLIC CHOICE: A CRITICAL INTRODUCTION 23 (1991); then citing William M. Landes & Richard A. Posner, The Independent Judiciary in an Interest-Group Perspective, 18 J.L. & ECON. 875, 877 (1975); and then citing George J. Stigler, The Theory of Economic Regulation, 2 BELL J. ECON. & MGMT. SCI. 3, 3–4, 10–11 (1971))).
212. Macey, supra note 211, at 227–28 (citing William M. Landes & Richard A. Posner, The Independent Judiciary in an Interest-Group Perspective, 18 J.L. & ECON. 875, 877 (1975)). Later in the article Macey also mentions “investing in congressional retirement funds” and paying “honoraria for speaking engagements” as other currency used by interest groups to purchase legislative favors. Id. at 230 (citing G. Easterbrook, What’s Wrong With Congress?, THE ATLANTIC, Dec. 1984, at 57, 70–72). Professor Elhauge writes that “interest groups influence the political process . . . by paying lawmakers in the form of bribes, speaking fees, supportive advertising, campaign contributions, or offers of future employment; by pressuring political officials to support or oppose the appointment, promotion, removal, or budget of regulators; and by influencing the information that reaches legislators, regulators, and the voting public.”Elhauge, supra note 211, at 35–36 (first citing DAVID R. MAYHEW, CONGRESS: THE ELECTORAL CONNECTION 39–41 (1974); then citing Gary S. Becker, A Theory of Competition Among Pressure Groups for Political Influence, 98 Q.J. ECON. 371–72, 392 (1983); then citing Jonathan R. Macey, Promoting Public-Regarding Legislation Through Statutory Interpretation, 86 COLUM.L. REV. 223, 230–31 (1986); then citing William Page, Interest Groups, Antitrust, and State Regulation, 1987 DUKE L.J. 618, 636 (1987); then citing Sam Peltzman, Toward a More General Theory of Regulation, 19 J.L. & ECON. 211, 213–14 (1976); and then citing George Stigler, The Theory of Economic Regulation, 2 BELL J. ECON. & MGMT. SCI. 3, 12 (1971)); see also William M. Landes & Richard A. Posner, The Independent Judiciary in an Interest-Group Perspective, 18J.L. & ECON. 875, 877 (1975); accord John F. Manning, The Absurdity Doctrine, 116 HARV. L.REV. 2387, 2410–12 (2003). Macey claims:
[S]tatutes generally can be divided into three distinct categories. The first are those designed to advance some public purpose, such as protection of the environment or providing for national defense. Besides these public interest statutes, there are two types of special interest statutes—”open-explicit” statutes and “hidden-implicit”statutes. Open-explicit statutes are naked, undisguised wealth transfers to a particular, favored group. By contrast, hidden-implicit statutes are couched in public interest terms to avoid the political fallout associated with blatant special interest statutes.
Hidden-implicit statutes exist because the political costs of enacting them is lower than the political costs of enacting open-explicit statutes. We observe open-explicit statutes because they are less ambiguous and therefore more likely to be enforced in precisely the way the relevant interest groups prefer. As described below, in deciding whether to lobby for one type of statute or another, interest groups must make a trade-off between the higher political costs associated with open-explicit statutes and the greater uncertainty associated with hidden-implicit statutes.
Macey, supra note 211, at 232–33.
574 MARYLAND LAW REVIEW [VOL. 75:541
by the value of the legislation to the group and the costs of organizing the coalition.213
Small and large interest groups each have their advantages and challenges. The legislative benefits are less diluted and coordination iseasier for smaller interest groups.214 Larger interest groups have advantages that include: “(1) more votes, (2) some economies of scale, and (3) perhaps more total resources.”215 Interest group resources appear important regardless of size, and the success of an interest group may depend, in part, on the attributes of any opposing interest groups. Interest groups may thrive in a representative government because information costs involving the impact of legislation can be high and transaction costs for organizing lobbying groups, while limiting free-riders, may be
213. Elhauge, supra note 211, at 36–37 (discussing collective action problems); Landes & Posner, supra note 212, at 877.
214. Richard A. Posner, Economics, Politics, and the Reading of Statutes and the Constitution, 49 U. CHI. L. REV. 263, 266 (1982); see also Elhauge, supra note 211, at 37–40(stating that “large diffuse groups face greater collective action obstacles to group petitioning in three respects:” (1) “for any given level of aggregate group benefits, large diffuse groups are more susceptible to free rider problems because the benefits from seeking or opposing a particular legal change must be spread over a larger number of beneficiaries,” (2) “given a particular incentive to free ride, a larger group will have a tougher time organizing collective efforts to overcome free riding. Having a large number of members makes it more difficult and costly to identify members, reach collective cost-sharing agreements, and monitor and punish free riding. In small groups, free riding will be easier to detect because it has a proportionally larger effect. Small groups also generally have lower organizational costs, and their members are more likely to have ongoing personal contact, making monitoring easier and making social sanctions, in particular, more effective,” (3) “for any given level of per capita benefit to group members from a legal change, a larger group will likely face a smaller opposition that is more motivated because it suffers greater per capita costs. Hence, large groups are not just less effective in their own right; they also generally face more effective opposition than small groups. . . . The confluence of these advantages and disadvantages may not benefit small groups per se. Rather, it may benefit those small to medium-sized groups that enjoy optimal combinations of free-riding avoidance, weak opposition, voting power, resources, and economies of scale.” (footnote omitted)); Rachel Sachs, The New Model of Interest Group Representation in Patent Law, 16 YALE J. L. & TECH. 344, 349 (2013–14) (noting the advantages of relatively small interest groups and stating that “legislative activity will be dominated by comparatively small interest groups with members who would reap a disproportionate share of any legislated benefit, while the costs of such legislation are dispersed far more widely” (first citing MANCUR OLSON, JR., THE LOGIC OF COLLECTIVE ACTION: PUBLIC GOODS AND THE THEORY OF GROUPS 128 (1965); then citing JAMES M. BUCHANAN & GORDON TULLOCK, THE CALCULUS OF CONSENT 292 (1965); and then citing Richard A. Posner, Economics, Politics, and the Reading of Statutes and the Constitution, 49 U. CHI. L. REV. 263, 266 (1982))).
215. Elhauge, supra note 211, at 39 (first citing Sam Peltzman, Toward a More General Theory of Regulation, 19 J.L. & ECON. 211, 214 (1976); then citing George Stigler, The Theory of Economic Regulation, 2 BELL J. ECON. & MGMT. SCI. 3, 13 (1971); then citing MANCUR OLSON,THE LOGIC OF COLLECTIVE ACTION 47 (2d ed. 1971); then citing Gary S. Becker, A Theory of Competition Among Pressure Groups for Political Influence, 98 Q.J. ECON. 371, 380 (1983); then citing Peltzman, supra, at 213; Stigler, supra, at 12; then citing RUSSELL HARDIN, COLLECTIVE ACTION 45 (1982); and then citing Richard Posner, Theories of Economic Regulation, 5 BELL J.ECON. & MGMT. SCL. 335, 349 (1974)).
2016] THE SOCIAL ENTERPRISE LAW MARKET 575
significant.216 Groups with lower information costs and lower transaction costs may be more effective in achieving wealth transfers from groups with greater organizational challenges.217
Interest group theory works well to explain the widespread adoption and development of social enterprise law. While public interest theory holds that “the ideal and the actual function of legislation [is] to increase economic welfare by correcting market failures,” a shift from the “dominant public perception of ‘government as helper’” to distrust and focus on private interests appears to be descriptively accurate.218 The various interests groups, discussed below, appear to have catalyzed the passage of the social enterprise legislation and have made a compelling case to legislators. However, politicians have mixed motives, and a strongversion of interest group theory, whereby legislation is solely justified by interest group preferences and efforts, likely overstates the reality.219
A. The Activists
Social enterprise activists, as used here, are individuals or organizations that lobby for the passage of social enterprise law and strongly support the social enterprise movement, often with some personal and professional motives. Social enterprise activists are not only influential in getting laws passed, but may also serve as evaluators of the various state
216. Macey, supra note 211, at 229.217. Id. at 229–30 (“The major implications of interest group theory are that legislation
transfers wealth from society as a whole to those discrete, well-organized groups that enjoy superior access to the political process, and that government will enact laws that reduce societal wealth and economic efficiency in order to benefit these economic groups. The economic theory of legislation does not predict that all laws will enrich the few at the expense of the many, but it does predict that this will be the dominant outcome and that there will be a trend in this direction.”(citing M. OLSON, THE RISE AND DECLINE OF NATIONS 75–117 (1982))).
218. Macey, supra note 211, at 223; Richard A. Posner, Economics, Politics, and the Reading of Statutes and the Constitution, 49 U. CHI. L. REV. 263, 265 (1982) (citing W. BAUMOL,WELFARE ECONOMICS AND THE THEORY OF THE STATE (2d ed. 1965) and A. PIGOU, THE ECONOMICS OF WELFARE (4th ed. 1932)).
219. Sachs, supra note 214, at 350–51 (citing research showing “that the effect of interest group pressure on Congress could ‘range from insignificant to determinative,’ depending on ‘the configuration of a large number of factors—among them the nature of the issue, the nature of the demand, the structure of political competition, and the distribution of resources.’” (quoting KAY LEHMAN SCHLOZMAN & JOHN T. TIERNEY, ORGANIZED INTERESTS AND AMERICAN DEMOCRACY 317 (1986))). Later, Sachs notes, “where legislation is ‘applicable to a particular industry,’ interest group theory likely has comparatively greater explanatory power. Ultimately, the ‘best picture of the political process’ is one in which ‘constituent interest, special interest groups, and ideology all influence legislative conduct.’” Id. at 351 (first quoting Posner, supra note, 218, at 271; then quoting Daniel A. Farber & Philip P. Frickey, The Jurisprudence of Public Choice, 65 TEX. L. REV. 873, 900–01 (1987); then citing DANIEL A. FARBER & PHILIP P.FRICKEY, LAW AND PUBLIC CHOICE: A CRITICAL INTRODUCTION 33 (1991); then citing Einer R. Elhauge, Does Interest Group Theory Justify More Intrusive Judicial Review?, 101 YALE L.J. 31, 43 (1991); and then citing Arti K. Rai, Engaging Facts and Policy: A Multi-Institutional Approach to Patent System Reform, 103 COLUM. L. REV. 1035, 1067–68 (2003)).
576 MARYLAND LAW REVIEW [VOL. 75:541
laws and may direct entrepreneurs to the states that the activists think have better laws.220 As such, state government officials seem to be aware of the influential social enterprise activists.
Bob Lang seems to be the primary social enterprise activist for the L3C form, while the nonprofit organization B Lab has been the biggest player in the benefit corporation area.221 Bob Lang may not have included enough supporters, with sufficient resources, to support the widespread adoption of the L3C legislation, and the criticism and constructive suggestions for change do not appear to have led to significant amendments to the substance of the L3C legislation.222 On the other hand, B Lab appears more inclusive and has been able to reach out to a wider range of people and amass more resources, even though the core B Lab team has remained relatively small.223 While B Lab has not always been successful in bringing people in the social enterprise area together, they appear to have made a good faith attempt to consider opposing views and have modified their model legislation a number of times.224
220. Murray, supra note 54, at 350–51 (discussing B Lab’s issues with the Delaware public benefit corporation statutes, including that the statutes do not require public posting of the benefit report and do not require use of a third party standard); Clark & Vranka, supra note 27, at app. C. (discussing the perceived weaknesses of the flexible purpose corporation statute, including that it is a “cumbersome” law, that the “special purpose” requirement is not broad or flexible enough, and that the statute does not provide the same level of transparency and accountability as the benefit corporation statute because of limitations on reporting and the non-requirement of a third-party standard).
221. AMERICANS FOR COMMUNITY DEVELOPMENT,https://www.americansforcommunitydevelopment.org (last visited June 20, 2015) (compiling information about the L3C, including information about Bob Lang, the inspiration of the L3C entity form). Attorney Marc Lane has also been extremely active in the L3C movement. About Our Founder, MARC J. LANE WEALTH GROUP, http://www.marcjlane.com/index.php?src=gendocs&ref=AboutOurFounder&category=About (last visited Sept. 3, 2015) (calling Marc Lane “the force behind Illinois’ Low-profit Limited Liability Company (L3C) legislation” and claiming that he “has been instrumental in promoting L3C legislation in other states”).
222. See generally Bishop, supra note 14; Brewer, supra note 19; Callison & Vestal, supra note 18; Kleinberger, supra note 18; Murray & Hwang, supra note 19. To the author’sknowledge, none of the suggestions in these articles by respected academics and practitioners have been adopted in L3C legislation. See., e.g., VT. STAT. ANN. tit. 11, §§ 4001(14), 4161–4163(2010).
223. Maribel Morey, The Rockefeller Foundation’s Hand in Hobby Lobby, STAN. SOC.INNOVATION REV., Aug. 21, 2014, http://www.ssireview.org/bl/entry/the_rockefeller_foundations_hand_in_hobby_lobby (noting that B Lab was an early recipient of a Rockefeller Foundation grant); Our Team,BCORPORATION.NET, http://www.bcorporation.net/what-are-b-corps/the-non-profit-behind-b-corps/our-team (last visited Sept. 2, 2015) (noting that two of the three B Lab founders previously ran “AND1, a $250 million basketball footwear and apparel business” before co-founding B Lab).
224. Callison, supra note 29, at 159 (discussing the heated debates, over more than three years, between B Lab and the Corporate Laws Drafting Committee under the Colorado Bar Association). Stanford Psychology Professor Carol Dweck’s description of the differences between a growth mindset (learning from criticism) and a fixed mindset (ignoring useful feedback) can provide useful advice to all those involved in social enterprise. See generally
2016] THE SOCIAL ENTERPRISE LAW MARKET 577
These activists are a new feature in the jurisdictional competition landscape. Other entity forms did not seem to have similarly visible, organized, and influential champions. These social enterprise forms are the first forms that explicitly mix social purpose and private profit, thus attracting supporters who seek success in both areas. These activists have led to more rapid passage of the social enterprise forms than may have occurred if the process were more organic.225 While most of the interest groups below have been discussed in the jurisdictional competition literature, activists like Bob Lang and B Lab seem to be absent. Both Bob Lang and B Lab profit from the existence of social enterprise. Bob Lang provides social enterprise consulting services and B Lab charges social enterprises for its certification.226
Other social enterprise activists like lawyers and additional service providers have also entered the fray, albeit with more minor roles. B Lab appears to have exerted significant effort to recruit these supportive business people and lawyers.227 Most of these professionals seem hopeful of gaining some personal benefits from their newfound expertise in the social enterprise law and an entire industry has evolved to advise these new social enterprises.228 Consultants, financial services professionals, and
CAROL S. DWECK, MINDSET: THE NEW PSYCHOLOGY OF SUCCESS (2006). Those with growth mindsets, open to change and improvement, are most likely to flourish. Id.
225. Deborah Sweeney, The Evolution of an Entity: A Closer Look at Benefit Corporations, MY CORPORATION (Sept. 9, 2013), http://blog.mycorporation.com/2013/09/the-evolution-of-an-entity-a-closer-look-at-benefit-corporations-infographic/ (comparing the spread of benefit corporation legislation to the spread of LLC legislation). This infographic is a bit misleading because the LLC form spread very quickly once the IRS weighed in on the form, but it took a few decades for the IRS to act. Id.
226. Make it Official, CERTIFIED B CORPORATIONS, http://www.bcorporation.net/become-a-b-corp/how-to-become-a-b-corp/make-it-official (last visited Sept. 2, 2015) (listing the annual certification fee ranges from $500 to $50,000+ based on annual sales). B Lab is, however, a nonprofit corporation and it provides its third-party standard, though not its certification, for free. About B Lab, B LAB, https://www.bcorporation.net/what-are-b-corps/about-b-lab (last visited Nov. 21, 2010) (noting that the B Impact Assessment is “A Free and Confidential Tool to Compare your Company’s Impact.”) Bob Lang’s Americans for Community Development provides a variety of services for L3Cs, and is currently developing certification courses for social enterprise advisors. Certification, AMERICANS FOR COMMUNITY DEVELOPMENT,https://www.americansforcommunitydevelopment.org/certification.html (last visited Sept. 3, 2015).
227. See, e.g., Clark & Vranka, supra note 27, at 1 (listing drafting authors and some supporters of a white paper advocating for the advancement of benefit corporation law).
228. See, e.g., About Us, INTERSECTOR PARTNERS, L3C, http://www.intersectorl3c.com/aboutus.html (last visited Sept. 4, 2015) (stating that their services include “Social Enterprise strategy & development”); B CORP ADVISORS,http://bcorpadvisors.com (last visited Sept. 4, 2015) (explaining that “B Corp Advisors helps organizations and executive teams understand, evaluate and implement the legal and business dimensions of: Benefit Corporations, Flexible Purpose Corporations, Certified B Corporations, Other Sustainable or Hybrid Legal Forms”); BLUE DOT ADVOCATES, http://www.bluedotlaw.com (last visited Sept. 4, 2015) (a law firm with a focus on social enterprise and impact investing); MARC J. LANE WEALTH GROUP, LOW-PROFIT LIMITED LIABILITY COMPANIES (“L3CS”)
578 MARYLAND LAW REVIEW [VOL. 75:541
lawyers serving the social sector have accounted for a significant portion of the social enterprises formed to date.229 While these service providers are becoming more of a factor, Bob Lang and B Lab still appear largely in control of their respective social enterprise movements.
B. The Business Managers
Managers of business entities make up another interest group that appears to be impacting social enterprise law drafting, adoption, and implementation.230 These managers may reasonably be concerned not only with the success of their businesses, but, more personally, with addressing their own potential liability.231 To date, the social enterprise laws have generally offered managers significant protection.232 These social enterprise laws limit the standing of those who can bring a claim and make building a successful claim extremely difficult.233 External stakeholders are not expressly given standing to sue in any of the existing social enterprise statutes, even though the statutes require consideration of their interests.234
Further, the Model Benefit Corporation Legislation, upon which most state benefit corporation statutes are based, provides that directors are not personally liable for monetary damages for “failure of the benefit corporation to pursue or create general public benefit or specific public
http://www.marcjlane.com/index.php?submenu=L3C&submenu=Social_Enterprises&src=gendocs&ref=L3C&category=Capabilities (last visited Sept. 4, 2015) (claiming to be “recognized as a national leader in the development of L3Cs”); Our Story, UPSPRING, http://upspringassociates.com/who-we-are/ (last visited Oct. 10, 2015) (“We serve the social enterprise community with effective and sustainable consulting services”); WESTAWAY LAW,http://westawaylaw.com/about (last visited Sept. 4, 2015) (“an innovative law firm committed to serving the social enterprise sector”).
229. Alicia E. Plerhoples, Delaware Public Benefit Corporations 90 Days Out: Who’s Opting In?, 14 U.C. DAVIS BUS. L.J. 247, 263 (2014) (noting that 31% of early Delaware public benefit corporations were in professional services, many servicing the social sector).
230. The term “managers,” as used here, refers to the board of directors and/or executive officers. See Therese H. Maynard, Spinning in a Hot IPO—Breach of Fiduciary Duty or Business as Usual?, 43 WM. & MARY L. REV. 2023, 2034–35, 2035 n.29 (2002) (using the term “managers” to refer to directors and/or officers).
231. Cf. Jill E. Fisch, The Peculiar Role of the Delaware Courts in the Competition for Corporate Charters, 68 U. CIN. L. REV. 1061, 1088 n.179 (2000) (discussing the backlash and statutory response resulting from Smith v. Van Gorkom, 488 A.2d 858 (Del 1985) in which the directors were held liable for breaching the duty of care).
232. See supra Part II.F (explaining how the significant liability protection for managers has been a mainstay in social enterprise legislation).
233. Murrray, supra note 66.234. See, e.g., S.C. CODE ANN. § 33-38-440 (2012); VA. CODE ANN. § 13.1-790 (2011). Most
benefit corporation statutes, however, do expressly allow benefit corporation managers to choose external stakeholders that may have standing. S.C. CODE ANN. § 33-38-440; VA. CODE ANN.§ 13.1-790 To date, the author is not aware of any benefit corporation that has granted standing to an external stakeholder. While such a grant of standing is certainly possible, especially for the benefit corporations that deeply care about accountability, most social enterprises are unlikely to allow another standing to sue and disrupt their business.
2016] THE SOCIAL ENTERPRISE LAW MARKET 579
benefit.”235 Delaware’s PBC law protects director actions if the directors’ decisions are informed, disinterested, and not irrational.236 As long as they are largely protected from liability, managers of socially conscious firms have been generally supportive of social enterprise law, even if their companies have not yet made the switch. B Lab has utilized these managers, many of whom are influential in their respective states, as supporters, and B Lab has seemingly extended its influence by enlisting these significant tax-paying proponents.237
C. The Skeptics
A number of academics and some sophisticated lawyers have criticized all or part of the social enterprise laws.238 Some of the critics have contributed to the evolution of social enterprise laws, and academics such as Daniel Kleinberger and Carter Bishop, along with practitioner Bill Callison, played a large role in the apparent stall and decline of the L3C form.239 B Lab has attempted to reach out to academics and high-level legal practitioners to discuss the Model legislation, but B Lab has also been criticized for failing to modify certain controversial provisions of the Model legislation.240 As Macey and Miller recognize, lawyers often act as the gatekeepers of corporate law but frequently, in the social enterprise context, bar association committees are being overruled or pressured into approving the laws by other interest groups.241 While some of the skeptics have simply criticized without providing any constructive solutions, most of the skeptics have offered ways forward and could improve the future of social enterprise laws.242
235. MODEL BENEFIT CORP. LEGIS. §§ 102, 301(c)(2) (2014).236. DEL. CODE ANN. tit. 8, § 365(b) (2011 & Supp. 2015); Delaware Public Benefit
Corporations: FAQs (on file with author). 237. See State by State Status of Legislation, BENEFIT CORPORATION,
http://benefitcorp.net/policymakers/state-by-state-status (last visited Oct. 30, 2015) (listing key supporters such as the businesses of Hawthorne Auto Clinic (Oregon), West Paw Design (Montana), and Dansko (Pennsylvania).
238. See, e.g., Kent Greenfield, A Skeptic’s View of Benefit Corporations, 1 EMORY CORP.GOVERNANCE & ACCOUNTABILITY REV. 17 (2014),http://law.emory.edu/ecgar/_documents/volumes/1/1/greenfield.pdf; Kleinberger supra note 18,Bishop supra note 18; Callison & Vestal, supra note 18; Murray supra note 40, at 22–24 (discussing areas of possible improvements for the benefit corporation law); Murray & Hwang, supra note 19, at 42–50 (discussing possible improvements for the L3C law).
239. Kleinberger, supra note 18; Bishop supra note 18; Callison & Vestal, supra note 18.240. Callison, supra note 29, at 161–63 (Bill Callison was an attorney involved in the benefit
corporation debates and legislative drafting process in Colorado).241. Id.; Macey & Miller, supra note 211, at 503–506 (discussing the role of the Delaware
bar).242. See CASS R. SUNSTEIN & REID HASTIE, WISER: GETTING BEYOND GROUPTHINK TO
MAKE GROUPS SMARTER 9–13 (arguing against “happy talk” to make people feel better and arguing that anxious, critical people can make organizations stronger over time).
580 MARYLAND LAW REVIEW [VOL. 75:541
D. The Politicians
Under the interest group theory of legislation, politicians act in their own self-interest, for example they may act consistent with their desire to be reelected or keep their political party in power.243 “In public choice legal scholarship, the role of the legislator has been transformed from that of a passive broker to a rent-seeking actor. A rent-seeking legislator strategically uses the threat of negative regulation or the promise of favorable regulation to secure interest group payments.”244
For state politicians, the reasons to support social enterprise laws are readily apparent. Social business is popular; Wall Street and traditional for-profit corporations are not.245 Even for the pro-market, pro-Wall Street politicians, these laws purport to embrace freedom, do not force anyone to incorporate under the laws, and expressly deny altering the existing corporate laws. Social enterprise laws allow the market to operate. The statutes appear to appeal to both the social justice advocates on the left and to the free market proponents on the right.246 Research has shown that a “larger ‘green’ workforce exerts a significant positive influence on Benefit Corporation legislation passage,” suggesting that environmentally-friendly states are especially interested in social enterprise law.247 Additionally, social enterprise laws have been promoted as no cost or low cost to states. Currently, there are not state-level tax breaks for the social enterprises and not even much in the way of necessary changes at secretary of state’s offices, as the social enterprises are often simply included in the LLC or corporation framework. The benefits, therefore, do not have to be large to justify passage of these laws in the eyes of politicians. While a few cities, such as San Francisco and Philadelphia, have provided some financialbenefits to social enterprises, the benefits to date have been quite small.248
States may attract some businesses to the state and may gain some revenue, with negligible costs, or so the pitch goes. The activists and business
243. Nancy J. Knauer, How Charitable Organizations Influence Federal Tax Policy: “Rent-Seeking” Charities or Virtuous Politicians?, 1996 WIS. L. REV. 971, 1034–35 n.326; Elhauge, supra note 211.
244. Knauer, supra note 243, at 1036 (first citing Robert D. Tollison, Public Choice and Legislation, 74 VA. L. REV. 339, 361 (1988); and then citing Richard L. Doernberg & Fred S. McChesney, Review Essay, Doing Good or Doing Well?: Congress and the Tax Reform Act of 1986, 62 N.Y.U. L. REV. 891, 893 (1987)).
245. OCCUPY WALL STREET, http://occupywallst.org/ (detailing a nationwide movement against “the ruling class”).
246. Kyle Westaway, Something Republicans and Democrats Can Agree On: Social Entrepreneurship, STAN. SOC. INNOVATION REV. (Apr. 17, 2012), http://ssir.org/articles/entry/something_republicans_and_democrats_can_agree_on_social_entrepreneurship.
247. Hans Rawhouser, Michael Cummings & Andrew Crane, Benefit Corporation Legislation and the Emergence of a Social Hybrid Category, 57 CAL. MGMT. REV. 13, 18 (2015).
248. Murray, supra note 40.
2016] THE SOCIAL ENTERPRISE LAW MARKET 581
managers, mentioned above, are likely vocal, motivated, and influential groups, as those groups pay taxes, vote, and have a good bit to gain from the legislation. While the skeptics also pay taxes and vote, they appear to have less to gain and fewer resources. State bar associations have been involved, to some extent, in the political process, but they have not been significantly involved in every state’s process.249 Occasionally, a state politician warms to the social enterprise movement enough to take the legislation to a vote with little or no support from the state bar association.
V. THE PRESENT AND FUTURE OF THE SOCIAL ENTERPRISE LAW MARKET
A. Leaders and Laggards
According to the early data, the current leaders in the nascent social enterprise market are Delaware, Nevada, Maryland, California, and New York.250 It is, however, much too early to crown a winner. Delaware seems to have started relatively strong based on its reputation in corporate law. Nevada has been attempting to challenge Delaware on other fronts and is pushing to be a leader in corporate law. Nevada is in the lead currently, but may have been boosted by the inclusion of a benefit corporation check box on the state form, which incorporators may or may not have fully understood.251 Maryland has done relatively well by virtue of being the very first mover; Maryland has a year or more head start on most states. Finally, New York and California have done relatively well, probably because they are large states and have more social enterprises located in their states that want to use local law.252
The District of Columbia, New Jersey, and South Carolina have lagged; they are all stuck in the single digits of benefit corporations formed.253 From the L3C side, Rhode Island, Maine, and Wyoming have lagged.254 Excluding New Jersey, these states all have relatively low population levels, coupled with a relative lack of corporate law expertise. The Delaware experience might suggest that small size is an advantage, but the business law expertise to attract out-of-state firms, state population, and business formations within the state will likely be correlated. New Jersey is
249. See State by State Status of Legislation, BENEFIT CORPORATION,http://benefitcorp.net/policymakers/state-by-state-status (listing, for example, the Florida Bar Association, as a “key supporter” of the benefit corporation legislation).
250. See infra Appendix A. 251. Cooney, Koushyar, Lee & Murray, supra note 30. 252. Cf. Subramanian, supra note 206, at 1814–16 (noting that California is a top home for
corporate headquarters, but underperforms in the incorporation market if the share of headquartered corporations are taken into account; New York, likewise, seems to underperform in the incorporation market relative to its headquarter status, which is much stronger).
253. See infra Appendix A.254. See infra Appendix A.

582 MARYLAND LAW REVIEW [VOL. 75:541
a curious addition to this group; as mentioned, previously it was a leader in corporate law, is close to New York City, and has a relatively largepopulation itself. From personal interaction with people in the New Jersey Department of State, my working hypothesis is that the relative lack of knowledge of social enterprise within that office is limiting the formation of benefit corporations in the state.255 However, with only about 1000 entities at the number one state, no state has established itself as dominant.
B. Attracting Social Enterprises
The literature dealing with more established entity types suggests that states can attract social enterprises by: (1) being an early mover; (2) having an expert and responsive legal system; (3) making a credible commitment to the desired infrastructure; and (4) engaging the corporate bar.256
Commentators have also mentioned geographic proximity to major financial and political centers as an advantage.257 Surprisingly, one argument that apparently has not been made in the scholarly literature is the importance of states engaging the legal academy.
Lessons from the literature can be applied to the social enterprise situation, along with the suggested importance of engaging the academy. Regarding its being an early mover, Delaware’s experience shows that while it is not necessary to be a first mover to eventually dominate a law market, it appears that being an early mover is advantageous.258 Being an early mover in social enterprise may position states to take the lead in that niche area, but those early states must be willing to amend their laws to keep up with the developments.259 States wish to be in a good position relative to other states regarding any competition involving social
255. Of the states I contacted, the New Jersey Secretary of State was the least helpful and seemed to be the least knowledgeable about these new forms. See Secretary of State—Corporate Filings, N.J. DEPT. OF STATE, http://www.nj.gov/state/archives/catsestat03.html (last visited Sept. 4, 2015).
256. See infra Part V.B (Present and Future).257. Christopher M. Bruner, Market-Dominant Small Jurisdictions in a Globalizing Financial
World 58 (Washington & Lee Pub. Legal Studies Research Paper, No. 2013-19, 2013), http://papers.ssrn.com/sol3/papers.cfm?abstract_id=2343111.
258. Brett H. McDonnell, Getting Stuck Between Bottom and Top: State Competition for Corporate Charters in the Presence of Network Effects, 31 HOFSTRA L. REV. 681, 687 (2003). Learning and network effects accumulate over time and states that enter an area early have an advantage.
259. States that are entering the social enterprise area now, after over twenty statutes have been passed, are able to learn from the mistakes and imperfections in other state statutes. As a general rule, the more recent social enterprise statutes seem more nuanced and evolved than the early statutes. To date, states have not seemed to be updating their social enterprise statutes as other states innovate in their new statutes. Once the social enterprise statutes are passed, the states have shown little interest in amending them, with a notable exception being the FPC in California. Plerhoples, supra note 129. The FPC amendments included a name change and some other minor statutory changes. Id.

2016] THE SOCIAL ENTERPRISE LAW MARKET 583
enterprise, but do not seem willing to spend significant funds yet.260 With respect to having an expert and responsive legal system, states interested in the social enterprise law market may wish to learn from Delaware. Some attribute Delaware’s success to its indeterminate case law and expert judiciary.261 Others credit, at least in part, an appropriately responsive legislature, the admired Chancery Court, and administrative expertise.262
States could start by forming a business law court (if they do not already have one) and could also make commitments to regularly revise their social enterprise law to respond to developments.263 A credible commitment to social enterprise might include funding incubator space, being the first state to provide a significant tax benefit to social enterprise,264 a responsive secretary of state’s office, and perhaps eventually developing a financial reliance on the social enterprises formed in the state.265 The corporate bar, composed of both litigation and transactional attorneys, likely influences the market for business law.266 Attorneys advise their clients where to
260. See supra Part IV.D (explaining how most states are currently spending relatively little money on social enterprises).
261. Kamar, supra note 173, at 1910–13, 1927–28, 1935.262. ROMANO, supra note 1, at 39–42.263. See Anne Tucker Nees, Making a Case for Business Courts: A Survey of and Proposed
Framework to Evaluate Business Courts, 24 GA. ST. U. L. REV. 477, 488, 502–03 (2007) (surveying fifteen business courts and proposing a framework for evaluation of business courts that includes attention to “efficiency, quality, and due process”).
264. Significant tax incentives could be a game changer but would be costly to a state and should be considered carefully to avoid greenwashing. The tax incentives offered to date have been very small, but tax incentives may be among the most effective, though costly, things a state can do to attract social enterprises. See, e.g., The California Benefit Corporation Discount Ordinance, S. F. ADMIN. CODE § 14C.3 (June 3, 2012), http://www.amlegal.com/nxt/gateway.dll?f=templates&fn=default.htm&vid=amlegal:sanfrancisco_ca (last visited Sept. 15, 2013) (In its S. F. ADMIN. CODE § 14C.3, San Francisco providedpreferences in government contracting to California benefit corporations, but these provisions expired on Sept. 1, 2015); see Lloyd Hitoshi Mayer & Joseph R. Ganahl, Taxing Social Enterprise, 66 STAN. L. REV. 387, 439–41 (2014) (arguing that full charitable tax benefits should not be offered to social enterprises, but arguing for a few tax accommodations for social enterprises such as expanding the deductibility of charitable contributions); cf. Philadelphia First City to Offer Green Biz Tax Incentives, SUSTAINABLEBUSINESS.COM (Dec. 4, 2009), http://www.sustainablebusiness.com/index.cfm/go/news.display/id/19350 (last visited Sept. 15, 2013) (providing small tax credits to certain Certified B Corporations) Certified B Corporations can be any of the legal entity forms, including benefit corporation, traditional corporation, or LLC).
265. Omari Scott Simmons, Branding the Small Wonder: Delaware’s Dominance and the Market for Corporate Law, 42 U. RICH. L. REV. 1129, 1178–79 (2008) (commenting on Delaware’s credible commitment, including “investment in legal capital (i.e., judicial expertise, case law, a specialized bar, and a business-like Division of Corporations) and its reliance on franchise taxes”). States like Delaware, New York, California, Nevada, and Maryland, which already have significant infrastructure built for related entity forms, may have a sizeable lead on other states, given that they already have some commitment to other entity types and businesses, in addition to the resources needed.
266. Kahan & Kamar, supra note 162, at 705–06 (arguing that “[t]he driving force behind many corporate statutes is corporate lawyers” but noting collective action problems and the lack
584 MARYLAND LAW REVIEW [VOL. 75:541
incorporate and are often involved in state politics. Attorneys are pointed to as one of the reasons that states still amend their corporate law in spite of the limited financial incentives for most states.267 Attorneys may also be involved, directly or indirectly, in getting laws passed that encourage formations in their home state or at least encourage local entities to stay in their state.268 Attorneys are likely to advise their clients to form in states where they are familiar with the state law: primarily their home state and Delaware. Thus, if states are interested in attracting social enterprises, they need to reach attorneys and educate them about the benefits of their socialenterprise laws.269
Geographic proximity to the financial capital (New York City) and the political capital (Washington, D.C.) of the United States may account for some of Delaware’s success.270 States near New York City and Washington, D.C. may have an advantage in any future social enterprise competition. Social enterprise, however, seems strongest among progressives, who are more highly concentrated on the west coast. Moreover, geographic proximity to economic and political centers may have decreased in importance as travel has become and is becoming much easier. States that are not close to financial and political centers may increase their competitiveness by funding excellent transportation systems within their state for easy travel for business people and attorneys representing those businesses.
Interestingly, the literature on jurisdictional competition has not paid much attention to the influence of the legal academy. Law professors have significant impact on the future of the law through their role in training future attorneys. If law students learn Delaware law while in school, they may be more likely to advise their clients to incorporate under Delaware law. Current and former Delaware judges spend a substantial amount of time interacting with corporate professors in the legal academy.271 Most
of strong incentives (citing William J. Carney, The Production of Corporate Law, 71 S. CAL. L.REV. 715, 737–49 (1998))).
267. Id. at 696.268. Romano, supra note 151 (noting that “by prodding legislatures to innovate or imitate
another state’s innovation, in response to exogenous shocks caused by changing business and legal circumstances, [lawyers] benefit their clients and thereby themselves, by maintaining, if not expanding, their practice, by making their state a more appealing domicile”).
269. As discussed below, it may be easiest and most efficient to reach law professors and law students because states may have a more eager audience at law schools than in the busy marketplace.
270. Bruner, supra note 257, at 58, 60.271. Chief Justice of the Delaware Supreme Court Leo Strine writes law review articles and
teaches at multiple law schools. Leo Strine Author Page, SOC. SCI. RES. NETWORK,http://papers.ssrn.com/sol3/cf_dev/AbsByAuth.cfm?per_id=328830 (last visited Nov. 1, 2014) (showing over thirty legal articles by Chief Justice Leo Strine and listing his adjunct position at University of Pennsylvania Law School along with his lecturer on law position at Harvard Law School). Chief Justice Strine has even co-authored articles with corporate law professors. See,
2016] THE SOCIAL ENTERPRISE LAW MARKET 585
judges in other states do not seem quite as involved with the legal academy.272 States interested in becoming a leader in social enterprise law should consider involving the legal academic world in their discussions and encouraging more engagement between governmental officials and professors. Incubators for social enterprises, which involve universities and state governments may be one way forward in this area.273 Also, if professors, especially corporate law professors, are aware of the uniqueness of a state’s social enterprise law, and are convinced that it is a valuable addition to the entity menu, the professors may discuss the law with their classes.274 In time, just as most law students graduate knowing Delaware corporate law, we could reach a point where law students graduate knowing
e.g., Leo E. Strine, Jr., Lawrence A. Hamermesh & Matthew Jennejohn, Putting Stockholders First, Not the First-Filed Complaint, 69 BUS. LAW. 1, 1 n.* (2013) (stating that LawrenceHamermesh is a longtime professor at Widener Law School, and Matthew Jennejohn is a former law clerk for then Vice Chancellor Leo Strine on the Delaware Court of Chancery and current law professor at J. Reuben Clark Law School, Brigham Young University) Vice Chancellor Travis Laster, who has been called “Strine on steroids” has become the academic liaison on the Delaware Court of Chancery now that former Chancellor Strine has moved to the Delaware Supreme Court. Ashby Jones, On Delaware Vice Chancellor Travis Laster: ‘Strine on Steroids’, THE WALL ST. J. L. BLOG (Feb. 11, 2011), http://blogs.wsj.com/law/2011/02/11/on-delaware-vice-chancellor-travis-laster-strine-on-steroids/. Vice Chancellor Laster has written at least fourteen legal articles (some before and some after assuming his position on the bench), has lectured at various law schools, and has been involved in the Harvard Law School Program on Corporate Governance. Vice Chancellor J. Travis Laster, Harvard Law School Program on Corporate Governance, http://www.law.harvard.edu/programs/corp_gov/laster-bio.shtml. Former Delaware judges have been and are involved in legal academia, including former Chancellor Bill Allen (NYU Law School), former Chief Justice Myron Steele (University of Virginia School of Law) and former Justice Jack Jacobs (Columbia Law School and Vanderbilt Law School). William T. Allen, N.Y.U SCH. OF L.,https://its.law.nyu.edu/facultyprofiles/index.cfm?fuseaction=profile.biography&personid=19739(last visited Aug. 30, 2015); Jack B. Jacobs, COLUM. L. SCH.,http://www.law.columbia.edu/fac/Jack_Jacobs (last visited Aug. 30, 2015); Jack B. Jacobs, SIDLEY AUSTIN LLP http://www.sidley.com/people/jack-b-jacobs (last visited Aug. 31, 2015); Myron T. Steele, U. OF VA. SCH. OF L.,http://www.law.virginia.edu/lawweb/faculty.nsf/FHPbI/1427463 (last visited Aug. 30, 2015).
272. There are some obvious exceptions to the statement that judges in states other than Delaware do not seem as involved with the legal academy. One notable exception is Judge Richard Posner of the United States Court of Appeals for the Seventh Circuit. Richard A. Posner,U. OF CHI. L. SCH., http://www.law.uchicago.edu/faculty/posner-r (last visited Aug 30, 2015) (noting Judge Posner’s position as a senior lecturer at the law school, as well as his numerous academic articles and books). Judge Posner, however, is a federal judge and corporate law still is primarily a state law subject.
273. Melissa Ip, 5 Social Enterprise Incubators and Accelerators You Should Know About,SOC. ENTERPRISE BUZZ (Oct. 3, 2012), http://www.socialenterprisebuzz.com/2012/10/03/5-social-enterprise-incubators-and-accelerators-you-should-know-about/ (noting five major social enterprise incubators). The number of social enterprise incubators has seemed to increase exponentially since this article, though most of the incubators are young and small.
274. Gordon Smith, Utah Benefit Corporation Act, THE CONGLOMERATE (May 13, 2014), http://www.theconglomerate.org/2014/05/utah-benefit-corporation-act.html (wondering whether corporate law professors should teach benefit corporation law in the general business organizations class).
586 MARYLAND LAW REVIEW [VOL. 75:541
the social enterprise law of the particular state that best communicates and demonstrates its value to the legal academy.
C. Considering the Future
State laboratories have been hard at work. With the assistance of proponents like B Lab, states have created various iterations of social enterprise statutes and spawned numerous innovations, creating a number of entirely new social enterprise entity types. This evolution is likely to continue with over a dozen more states actively considering social enterprise statutes. This experimentation by the states, allowed by federalism, is part of what Professor Roberta Romano calls “the genius of American corporate law.”275 The evolution of social enterprise laws may be the most significant business law product of the state laboratories in the past decade. Professors Erin O’Hara and Larry Ribstein remind us in their book The Law Market that firms are free to shop for these new laws.276
Predicting the future can be a dangerous game, and at this early stage it is difficult to tell whether any of the current social enterprise laws will prove attractive enough to draw large numbers of entities. If the social enterprise law market does heat up, predicting a winner of that competition will also be difficult to do at the beginning of the race. On one hand, smaller states may have more incentive to pursue social enterprise due to the potentially significant positive impact on their smaller budgets.277 On the other hand, most social enterprises seem to be staying in their home state currently, which favors large states like California and New York. States with significant infrastructure to service business entities, like Delaware and Nevada, also have a nice starting position because those resources can be easily used for social enterprises in addition to other, more traditional entity types. The early data on the formation of benefit corporations shows Nevada with a strong lead, followed by Delaware, New York, and California.278 At this stage, however, it is still much too early to declare a clear winner. In any event, as discussed above, the state laboratories, prompted by a number of interest groups, have produced a variety of social enterprise laws.279 The evolution of these social enterprise
275. ROMANO, supra note 1.276. ERIN A. O’HARA & LARRY E. RIBSTEIN, THE LAW MARKET (2009).277. Jonathan R. Macey, Federal Deference to Local Regulators and the Economic Theory of
Regulation: Toward a Public-Choice Explanation of Federalism, 76 VA. L. REV. 265, 278 (1990) (noting that corporate charter franchise taxes constitutes a relatively high percentage of Delaware’s total budget).
278. See infra Appendix A; see also Cooney, Koushyar, Lee & Murray, supra note 30(explaining that the unique and easy benefit corporation check box on Nevada’s standard incorporation form may be a factor in Nevada’s lead); cf. CASS R. SUNSTEIN, SIMPLER: THE FUTURE OF GOVERNMENT 5–12 (2013) (arguing for doing away with unnecessary complexity and promoting more simple, common-sense processes).
279. See supra Part V.

2016] THE SOCIAL ENTERPRISE LAW MARKET 587
forms will be interesting to watch over the coming years, and states may glean valuable lessons from the jurisdictional competition literature involving more established entity types that this Article discussed.
VI. CONCLUSION
Over less than a decade, we have seen a proliferation of social enterprise forms in the United States. This Article describes some of the evolution of these social enterprise forms and the state of the social enterprise law market. Given the indeterminacy of benefit corporation law, this Article posits that if social enterprises become more popular, a dominant state could eventually engage in significant price discrimination and collect significant revenue related to attracting social enterprises. Currently, only a relatively small number of social enterprises have been formed and thus the financial stakes are quite low. This Article suggests that jurisdictional positioning and interest group theory, rather than seriousjurisdictional competition, explain why states are passing social enterprise statutes. If social enterprise forms become more widely used in the future, states may choose to compete more vigorously in the social enterprise area. This Article suggests that interested states could learn from the Delaware experience with traditional corporations, coupled with a few additional suggestions, in any future attempt to attract social enterprises.
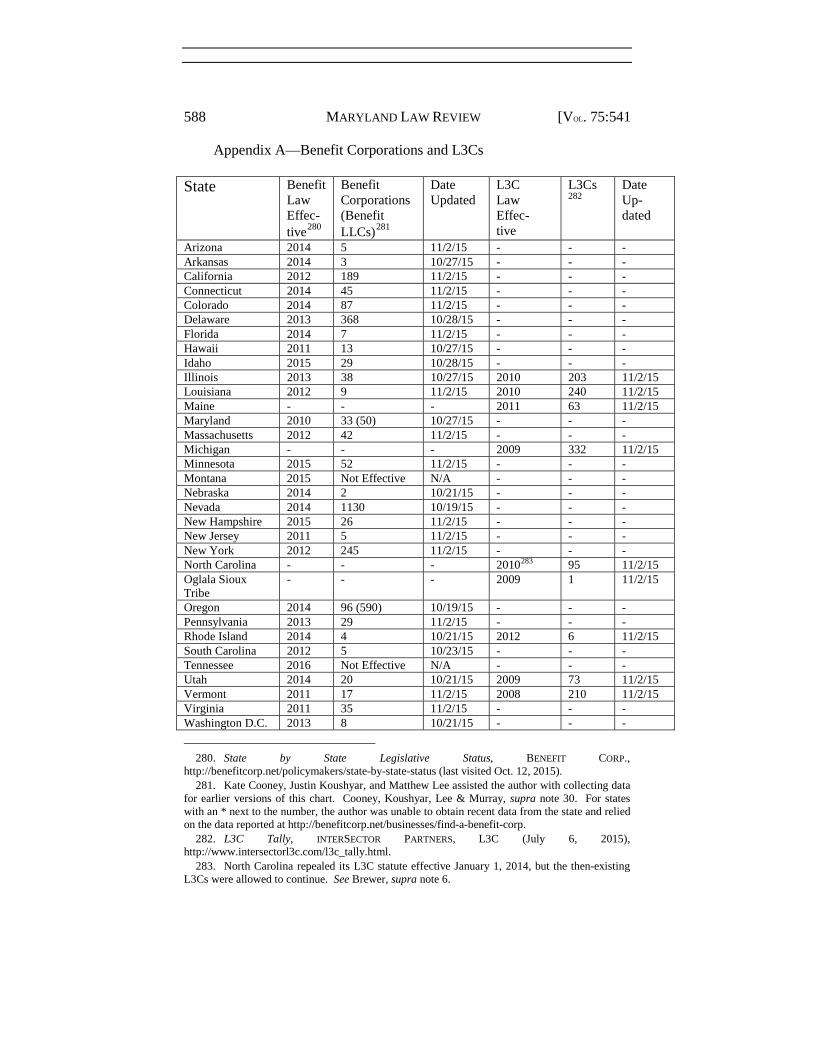
588 MARYLAND LAW REVIEW [VOL. 75:541
Appendix A—Benefit Corporations and L3Cs
State Benefit Law Effec-tive280
Benefit Corporations (Benefit LLCs)281
Date Updated
L3C Law Effec-tive
L3Cs282
DateUp-dated
Arizona 2014 5 11/2/15 - - -Arkansas 2014 3 10/27/15 - - -California 2012 189 11/2/15 - - -Connecticut 2014 45 11/2/15 - - -Colorado 2014 87 11/2/15 - - -Delaware 2013 368 10/28/15 - - -Florida 2014 7 11/2/15 - - -Hawaii 2011 13 10/27/15 - - -Idaho 2015 29 10/28/15 - - -Illinois 2013 38 10/27/15 2010 203 11/2/15Louisiana 2012 9 11/2/15 2010 240 11/2/15Maine - - - 2011 63 11/2/15Maryland 2010 33 (50) 10/27/15 - - -Massachusetts 2012 42 11/2/15 - - -Michigan - - - 2009 332 11/2/15Minnesota 2015 52 11/2/15 - - -Montana 2015 Not Effective N/A - - -Nebraska 2014 2 10/21/15 - - -Nevada 2014 1130 10/19/15 - - -New Hampshire 2015 26 11/2/15 - - -New Jersey 2011 5 11/2/15 - - -New York 2012 245 11/2/15 - - -North Carolina - - - 2010283 95 11/2/15Oglala Sioux Tribe
- - - 2009 1 11/2/15
Oregon 2014 96 (590) 10/19/15 - - -Pennsylvania 2013 29 11/2/15 - - -Rhode Island 2014 4 10/21/15 2012 6 11/2/15South Carolina 2012 5 10/23/15 - - -Tennessee 2016 Not Effective N/A - - -Utah 2014 20 10/21/15 2009 73 11/2/15Vermont 2011 17 11/2/15 2008 210 11/2/15Virginia 2011 35 11/2/15 - - -Washington D.C. 2013 8 10/21/15 - - -
280. State by State Legislative Status, BENEFIT CORP., http://benefitcorp.net/policymakers/state-by-state-status (last visited Oct. 12, 2015).
281. Kate Cooney, Justin Koushyar, and Matthew Lee assisted the author with collecting data for earlier versions of this chart. Cooney, Koushyar, Lee & Murray, supra note 30. For states with an * next to the number, the author was unable to obtain recent data from the state and relied on the data reported at http://benefitcorp.net/businesses/find-a-benefit-corp.
282. L3C Tally, INTERSECTOR PARTNERS, L3C (July 6, 2015), http://www.intersectorl3c.com/l3c_tally.html.
283. North Carolina repealed its L3C statute effective January 1, 2014, but the then-existing L3Cs were allowed to continue. See Brewer, supra note 6.

2016] THE SOCIAL ENTERPRISE LAW MARKET 589
State Benefit Law Effec-tive280
Benefit Corporations (Benefit LLCs)281
Date Updated
L3C Law Effec-tive
L3Cs282
DateUp-dated
West Virginia 2014 94 10/19/15 - - -Wyoming - - - 2009 37 11/2/15Total 2636 (640) 1266
Impact Investing TrendsEvidence of a Growing Industry
DATA FROM
ANNUAL IMPACT
INVESTOR SURVEYS
Impact Investing Trends: Evidence of a Growing Industry
About the Global Impact Investing Network (GIIN)The GIIN is a nonprofit organization dedicated to increasing the scale and effectiveness of impact investing. Impact investments are investments made into companies, organizations, and funds with the intention to generate social and environmental impact alongside a financial return. The GIIN builds critical infrastructure and supports activities, education, and research that help accelerate the development of a coherent impact investing industry. For more information, see www.thegiin.org.
Acknowledgements
Authored by the GIIN Research TeamAbhilash Mudaliar, Director
Aliana Pineiro, Manager
Rachel Bass, Associate
Research supportThe research team would like to recognize the contributions of various members of the broader GIIN team. For review and input, we thank Susan Balloch, Amit Bouri, Giselle Leung, Peter Malik, Hannah Schiff, Sapna Shah, Andrew Siwo, and Amy Stillman. For communications review and guidance, we thank Laura Gustafson and Kimberly Moynihan.
SponsorsThis report was produced using data from the 2013-2015 Annual Impact Investor Surveys and their corresponding reports. All three of these reports were produced with the generous partnership and support of JPMorgan Chase & Co. The 2016 report (using data from 2015) was also funded with UK aid from the UK Government through the Department for International Development’s Impact Programme.
IntervieweesThis report includes insights from interviews with five impact investors about recent changes and future developments in the impact investing market: Sandeep Farias from Elevar Equity, María Victoria González from Adobe Capital, Huib-Jan de Ruijter from FMO, Ommeed Sathe from Prudential Financial, Inc., and Evita Zanuso from Big Society Capital.
DECEMBER 2016
Respondents grew their
impact assets from USD
25.4 billion to 35.5 billion
from 2013 to 2015
iI M P A C T I N V E S T I N G T R E N D S

Letter from the CEO

Dear readers,
“Study the past if you would define the future,” Confucius
The above quote is a personal favorite. To me, it is an important reminder that there can be great value derived from reflecting on and understanding the past, especially if you are trying to change the future.
The market for impact investing is no longer nascent, but it is also far from being fully formed or matured. As such, the impact investing industry is at a perfect moment for reflection. By looking closely at data from the past few years of impact investing, we can better direct the industry’s trajectory so that this powerful practice can reach its full potential—and faster. That is why I am thrilled to present Impact Investing Trends: Evidence of a Growing Industry, the very first GIIN report speaking specifically to trends in the market over time.
At the GIIN, I have the daily privilege of hearing how members are leading the way to finance innovative solutions to pressing global issues in areas such as affordable housing, climate change, and healthcare. Given these conversations and findings from industry research, such as the GIIN’s Annual Impact Investor Survey, I have long been confident that this industry has been developing steadily. However, with the data presented in this latest report, we now have compelling evidence that the impact investing industry is growing, both in terms of size and maturation.
I am delighted to share that the data show many encouraging signs for the industry, including the following key trends:
1. Impact investors are demonstrating strong growth, with assets under management growing by 18% compounded annually from 2013 to 2015;
2. Impact investments are made across the world, in a diverse range of sectors and using various financial instruments, reflecting the wide variety of impact theses and strategies pursued by impact investors;
3. Impact investors are consistently satisfied with both impact and financial performance;
4. The industry is making progress against several key indicators of market growth, despite there being certain barriers remaining to industry development.
I’d like to reflect in particular on why the last highlighted trend is just as encouraging as the other findings. In fact, I find this trend to be the most reassuring, for it indicates room for (and hope for) more: more improvement, more investors entering the market, more impact. We have come a long way in building this market, but we have further to go, as the amount of available impact investment capital does not yet come close to matching the scope of the pressing social and environmental problems we face today. This brings me back to the importance of the research contained in this report.
If you are already an active impact investor, I hope this research will be useful in guiding future investment decisions and helping to increase your impact. If you are looking to enter the space, I hope this research helps support a case for getting involved in this growing market. If you are not a professional investor, but you are a curious and active citizen of the world, I hope you are encouraged by these trends, and will continue to look for ways to align your own assets with your values.
Impact investing’s time has come. Many investors around the world have led the way and have laid a strong foundation for this movement. With this strong foundation, we now have the opportunity to build an even stronger future for impact investing, and, thus, a stronger future for the world.
How do you wish to define this future?
Amit Bouri CEO, Global Impact Investing Network [email protected]
iiiI M P A C T I N V E S T I N G T R E N D S


Table of Contents
Methodology ............................................................................................................................................................... 2
Introduction ............................................................................................................................................................... 4
Executive Summary .................................................................................................................................................. 5
Sample Characteristics ............................................................................................................................................. 6
Headquarters locations ................................................................................................................................................................................................6
Organization type ..........................................................................................................................................................................................................6
Target returns sought ................................................................................................................................................................................................... 7
Indicators of Growth ................................................................................................................................................ 8
Assets under management .......................................................................................................................................................................................8
Investment activity .......................................................................................................................................................................................................10
State of the Market ...................................................................................................................................................13
Progress on indicators of market growth ........................................................................................................................................................... 13
Challenges to the growth of the impact investing industry ....................................................................................................................... 13
Asset Allocations ......................................................................................................................................................16
Assets under management .....................................................................................................................................................................................16
AUM allocations by geography ............................................................................................................................................................................ 17
AUM allocations by sector ......................................................................................................................................................................................18
AUM allocations by instrument .............................................................................................................................................................................19
AUM allocations by stage of business ...............................................................................................................................................................20
Fund Managers ......................................................................................................................................................... 22
Fund manager sources of capital ..........................................................................................................................................................................22
Capital raised .................................................................................................................................................................................................................23
Investment Performance ........................................................................................................................................ 26
Gross returns expectations ..................................................................................................................................................................................... 26
Performance relative to expectations ................................................................................................................................................................. 26
Risk .....................................................................................................................................................................................................................................27
Investor Insights
Prudential...........................................................................................................................................................................................................................9
FMO ................................................................................................................................................................................................................................. 12
Adobe Capital ...............................................................................................................................................................................................................15
Elevar Equity .................................................................................................................................................................................................................. 21
Big Society Capital ..................................................................................................................................................................................................... 25
Appendix 1 ................................................................................................................................................................ 29
Appendix 2 ...............................................................................................................................................................30
Appendix 3 ................................................................................................................................................................31
1I M P A C T I N V E S T I N G T R E N D S
Methodology
This report captures data from 62 impact investors that have completed the Global Impact Investing Network’s (GIIN) Annual Impact Investor Survey each of the past three years (2014–2016), answering questions regarding their activities for the year prior to data collection, plans for the following year, and general perceptions of broader market trends and topics. Thus, although these surveys were administered at the beginning of each year 2014–2016, the collected data refer to the years 2013–2015, which will be the years referenced in this report.
Inclusion criteriaAll respondents represent impact investing organizations, not individual investors. In an effort to ensure that respondents had meaningful experience managing impact investments, survey-eligibility criteria each year required that respondents had either: (a) committed USD 10 million to impact investments since their inception and/or (b) completed at least five impact investing transactions.1 The GIIN provided its definition of impact investing (see Appendix 2), which respondents used to determine their eligibility.
Analysis includedWhile many questions have been repeated in the survey instrument each of the past three years, several questions have changed over time, and others have been removed or added. For this report, the GIIN research team analyzed only those questions with comparable data from each of the past three years. For some questions with multiple choices, certain available answer choices have been modified, added, or deleted over time; in these cases, only comparable options were analyzed.
Investor insightsAdditionally, the research team conducted brief interviews with five individuals at select repeat respondent organizations in order to gather perspectives on both recent changes in the impact investing market and the forward-looking trajectory of the industry. The interviewees were selected to reflect a range of organizational types, investment geographies, and asset classes in the impact investing space.
Data accuracyThe individuals representing each organization and responding to each respective survey may change from year to year, which can lead to subtly different interpretations of some survey questions. Each year, the GIIN research team conducted basic checks during data cleaning, processing, and analysis, clarifying with respondents as appropriate to improve accuracy. Further, in the process of analyzing changes over time, the GIIN research team conducted additional data checks and sought additional clarification to ensure year-on-year consistency.
Exchange rate fluctuationsRespondents report key numeric figures each year in USD, such as assets under management (AUM) and capital committed. This report does not attempt to analyze any potential exchange rate fluctuations.
1 In 2013, investors were required to have committed at least USD 10 million to impact investments in order to qualify for the survey. In 2014 and 2015, the survey included a
second, alternate criterion to qualify, namely that investors may have made at least five impact investment transactions.
2 G L O B A L I M P A C T I N V E S T I N G N E T W O R K

Table iii: Sector Codes
Code Name of sector
Education Education
Energy Energy
Fin services (excl. microfinance)
Financial services (excluding microfinance)
Food & ag Food and agriculture
Healthcare Healthcare
Housing Housing
ICT Information and communication technologies
Microfinance Microfinance
WASH Water and sanitation
Other Other
Analysis by sub-groupIn addition to aggregate analysis of the full sample of 62 respondents, this report also highlights certain notable differences in responses by particular sub-groups of respondents, for example by investors with a substantial majority of their capital allocated to a particular geography. Table i presents a full list of these sub-groups.
Table i: Respondent sub-groups
Sub-group Description of the categoryNumber of respondents
EM-focused investors Respondents that allocated 75% of their AUM to emerging markets (EM) every year 30
DM-focused investors Respondents that allocated 75% of their AUM to developed markets (DM) every year 21
Market-rate investors Respondents that principally targeted risk-adjusted, market-rate returns every year 26
Below-market investorsRespondents that principally targeted below-market-rate returns every year; some targeted closer to market-rate and some targeted closer to capital-preservation returns
27
PD-focused investors Respondents that allocated 75% of their AUM to private debt (PD) every year 11
PE-focused investors Respondents that allocated 75% of their AUM to private equity (PE) every year 13
Region and sector codesFor brevity, regions and sectors referenced in the report are given shorter names, codes which are shown in Tables ii and iii. The Annual Survey instruments did not provide precise region or sector definitions, so responses reflect respondents’ interpretations of each region or sector boundaries.
Table ii: Region Codes
Code Name of region
DM Developed Markets
North America United States and Canada
WNS Europe Western, Northern, and Southern Europe
Oceania Oceania
EM Emerging Markets
SSA Sub-Saharan Africa
LACLatin America and the Caribbean (including Mexico)
South Asia South Asia
ESE Asia East and Southeast Asia
MENA Middle East and North Africa
EECA Eastern Europe, Russia, and Central Asia
3I M P A C T I N V E S T I N G T R E N D S

IntroductionSince 2011, the GIIN has conducted a rigorous annual survey of the growing community of impact investors. The resultant reports have provided the most comprehensive view of market activity and industry development worldwide.2
Each year, as much as is possible, practical, and relevant, the survey maintains a core set of questions regarding investor activity and perspectives. Over the last three years, the survey has also captured detailed information on investors’ portfolio allocations. The respondent sample has also grown steadily over time (see Table iv) and includes 62 respondents that have completed the survey each of the last three years.
Table iv: Total number of respondents to each year’s Annual Survey
Year of data Number of respondents
2010 25
2011 52
2012 99
2013 125
2014 146
2015 158
Examining these detailed survey responses over time allowed the GIIN to produce this first-ever industry-level trends analysis on global impact investor market activity. This data is complemented by qualitative insights from five impact investors on how the market has changed in recent years and how it will continue to evolve. The GIIN hopes that insights from this research will further the impact investing industry’s reach and effectiveness, enable data-driven decision-making, and improve transparency of this growing market.
2 Conducted as a joint partnership between the GIIN and J.P. Morgan for the first five years (2011 to 2015), in 2016, the GIIN produced the survey entirely in-house, with
J.P. Morgan remaining involved as an anchor sponsor. The UK Department for International Development also provided generous support for the 2016 survey.
62 repeat respondents.
4 G L O B A L I M P A C T I N V E S T I N G N E T W O R K
Executive SummarySample characteristicsThe 62 respondents included in this analysis represent a range of geographies, organization types, and returns philosophies.
• Approximately 80% of respondents are headquartered in developed markets.
• Over half of respondents identify as fund managers (56%) and one-fifth identify as foundations (20%). The remaining organization types are banks/diversified financial institutions, development finance institutions, family offices, and pension funds/insurance companies.
• Roughly half of the respondents in the sample are market-rate investors—with some slight fluctuations from year-to-year—and the rest are below-market investors.
Key findingsSeveral key themes emerged from these three years of data:
1. Respondents have demonstrated strong growth, collectively increasing their impact investing assets under management (AUM) from USD 25.4 billion in 2013 to USD 35.5 billion in 2015 (n=61), 3 a compound annual growth rate (CAGR) of 18%. The volume of capital raised by fund managers also increased at a compounded rate of 18% each year, growing from USD 1.7 billion in 2013 to USD 2.3 billion in 2015 (n=26).4
2. Respondents have maintained a steady pace of activity, committing a total of USD 7.1 billion, USD 9.2 billion, and USD 9.1 billion in 2013, 2014, and 2015 respectively, across over 3,000 transactions each year (n=62).
3. Certain key geographies, sectors, and instruments are particularly common among impact investors.
a. Geography: Over 60% of AUM was allocated to emerging markets each year.
b. Sector: The top three sectors receiving the highest proportions of AUM were microfinance, other financial services, and energy, respectively. Collectively, these three sectors accounted for the majority of AUM every year.
c. Instrument: Approximately 70% of AUM was allocated through private debt and private equity each year.
4. The industry continues to progress across various indicators of market growth, but consistent challenges remain. Respondents reported seeing significant progress in terms of the number of intermediaries with successful track records, levels of government support for the market, and the availability of exit options. Notwithstanding this progress, respondents consistently cited ‘lack of appropriate capital across the risk/return spectrum’ and ‘shortage of high-quality investment opportunities with track record’ as the top challenges facing the industry.
5. Respondents report broad overall satisfaction with their impact and financial performance, as compared to their expectations.
a. Each year, 98% of respondents indicated impact performance in line with or exceeding their expectations, and 85% to 95% of respondents indicated financial performance in line with or better than their expectations.
b. ‘Business model execution and management risk’ ranked first among the risks to impact investing portfolios considered.
3 One respondent declined to provide information regarding its assets under management.
4 Twenty-six fund managers responded to this question each year; a handful planned and/or reported USD 0 capital raise for one, two, or all three years.
5I M P A C T I N V E S T I N G T R E N D S
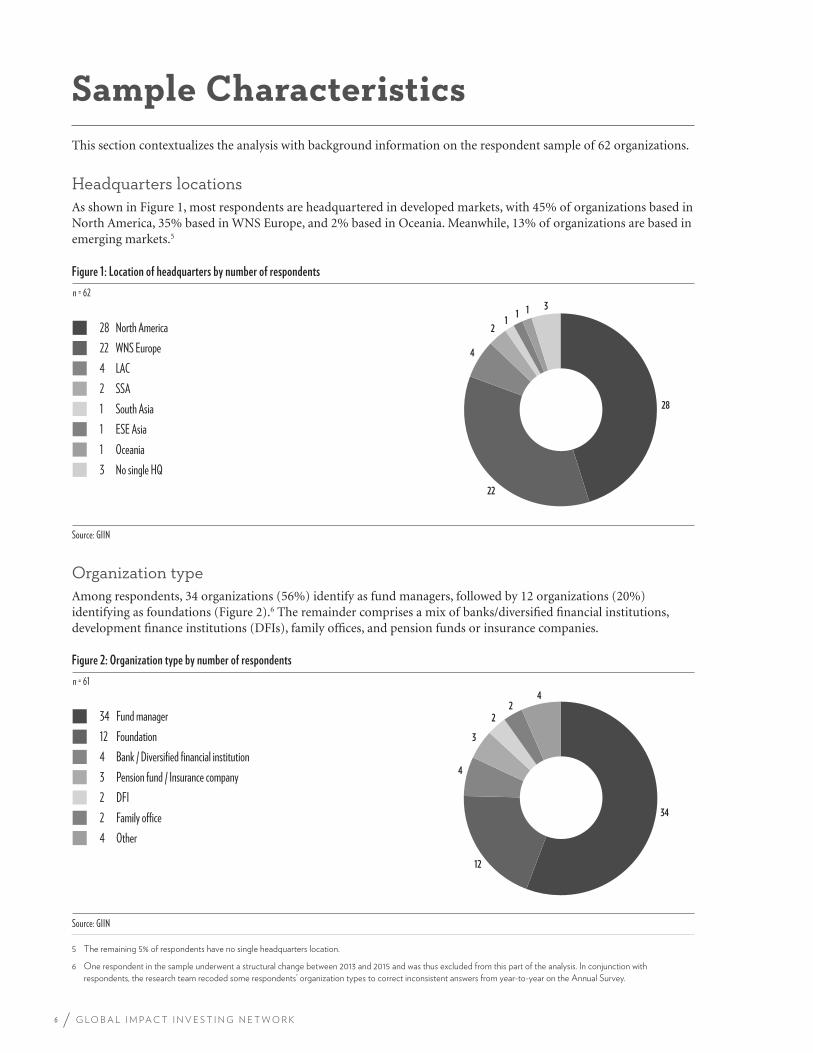
Sample CharacteristicsThis section contextualizes the analysis with background information on the respondent sample of 62 organizations.
Headquarters locationsAs shown in Figure 1, most respondents are headquartered in developed markets, with 45% of organizations based in North America, 35% based in WNS Europe, and 2% based in Oceania. Meanwhile, 13% of organizations are based in emerging markets.5
Figure 1: Location of headquarters by number of respondents
n = 62
Source: GIIN
3
28
22
4
2 1
1 1
28 North America 22 WNS Europe 4 LAC 2 SSA 1 South Asia 1 ESE Asia 1 Oceania 3 No single HQ
Organization typeAmong respondents, 34 organizations (56%) identify as fund managers, followed by 12 organizations (20%) identifying as foundations (Figure 2).6 The remainder comprises a mix of banks/diversified financial institutions, development finance institutions (DFIs), family offices, and pension funds or insurance companies.
Figure 2: Organization type by number of respondents
n = 61
Source: GIIN
34
12
4
3
2 2
4
34 Fund manager 12 Foundation 4 Bank / Diversified financial institution 3 Pension fund / Insurance company 2 DFI 2 Family office 4 Other
5 The remaining 5% of respondents have no single headquarters location.
6 One respondent in the sample underwent a structural change between 2013 and 2015 and was thus excluded from this part of the analysis. In conjunction with
respondents, the research team recoded some respondents’ organization types to correct inconsistent answers from year-to-year on the Annual Survey.
6 G L O B A L I M P A C T I N V E S T I N G N E T W O R K
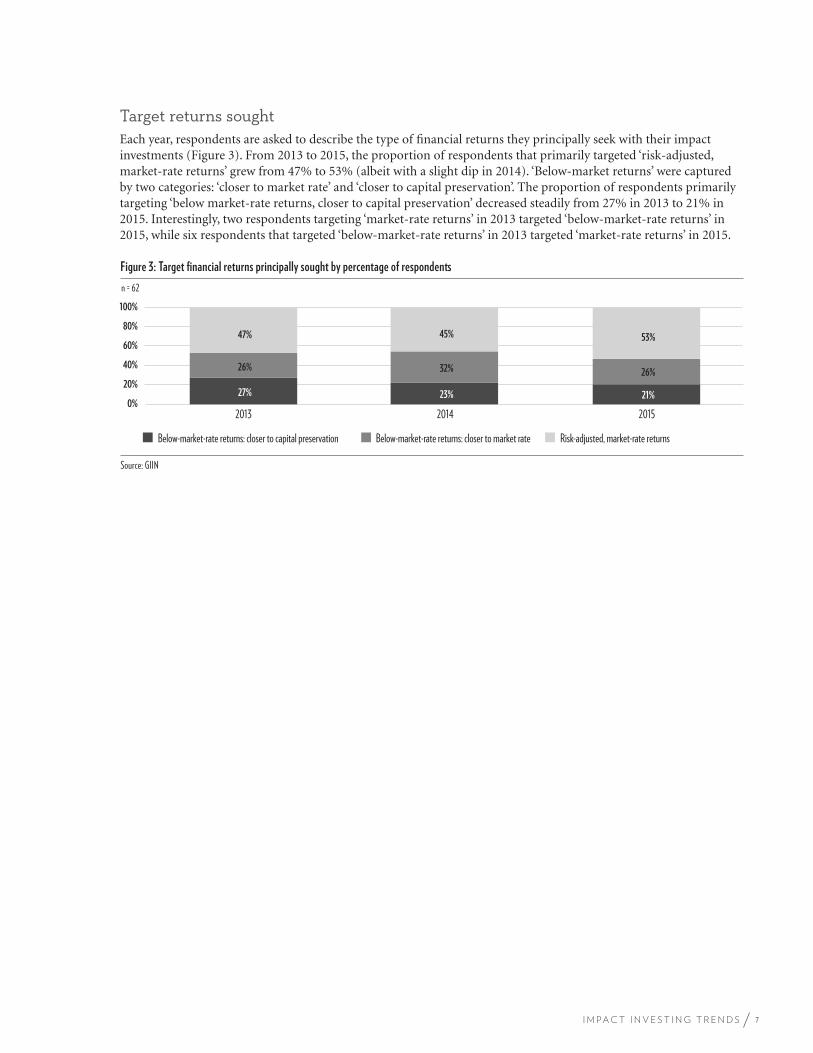
Target returns soughtEach year, respondents are asked to describe the type of financial returns they principally seek with their impact investments (Figure 3). From 2013 to 2015, the proportion of respondents that primarily targeted ‘risk-adjusted, market-rate returns’ grew from 47% to 53% (albeit with a slight dip in 2014). ‘Below-market returns’ were captured by two categories: ‘closer to market rate’ and ‘closer to capital preservation’. The proportion of respondents primarily targeting ‘below market-rate returns, closer to capital preservation’ decreased steadily from 27% in 2013 to 21% in 2015. Interestingly, two respondents targeting ‘market-rate returns’ in 2013 targeted ‘below-market-rate returns’ in 2015, while six respondents that targeted ‘below-market-rate returns’ in 2013 targeted ‘market-rate returns’ in 2015.
Figure 3: Target financial returns principally sought by percentage of respondents
Source: GIIN
Below-market-rate returns: closer to capital preservation Below-market-rate returns: closer to market rate Risk-adjusted, market-rate returns
27% 23% 21%
26% 32% 26%
47% 45% 53%
0%
20%
40%
60%
80%
100%
2013 2014 2015
n = 62
7I M P A C T I N V E S T I N G T R E N D S
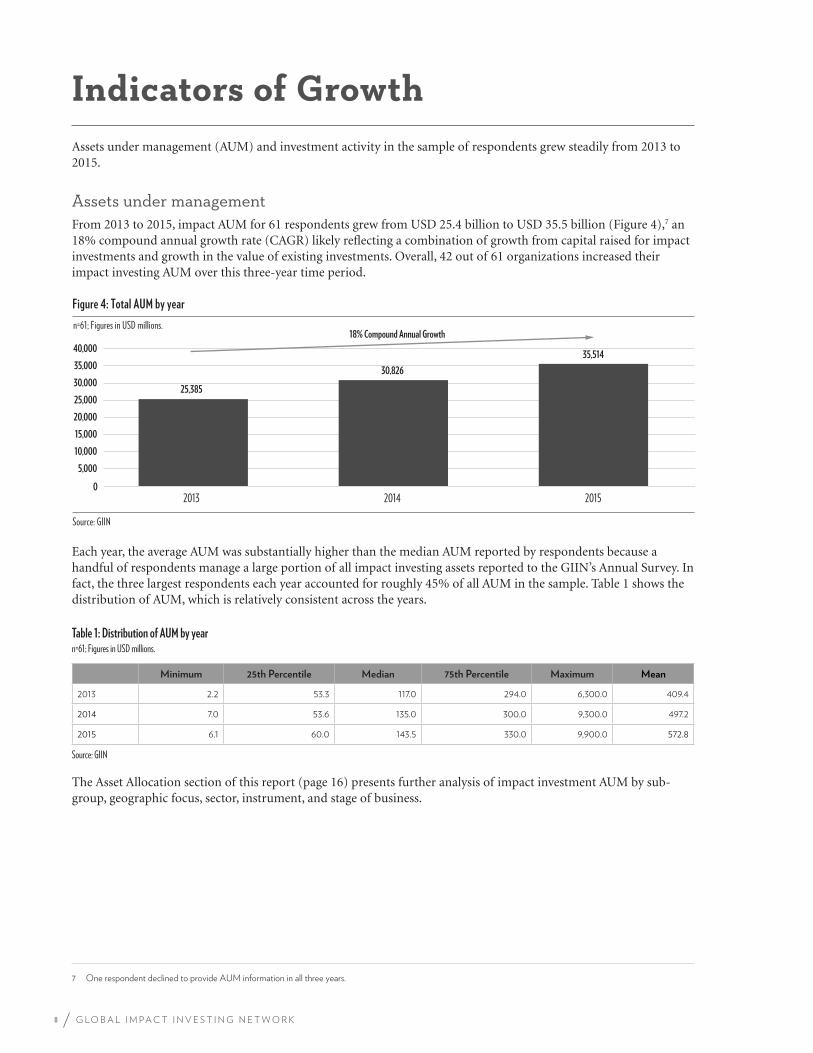
Indicators of Growth Assets under management (AUM) and investment activity in the sample of respondents grew steadily from 2013 to 2015.
Assets under management From 2013 to 2015, impact AUM for 61 respondents grew from USD 25.4 billion to USD 35.5 billion (Figure 4),7 an 18% compound annual growth rate (CAGR) likely reflecting a combination of growth from capital raised for impact investments and growth in the value of existing investments. Overall, 42 out of 61 organizations increased their impact investing AUM over this three-year time period.
Figure 4: Total AUM by year
Source: GIIN
0 2013 2014 2015
25,385
30,826
18% Compound Annual Growth
35,514
5,000
10,000
15,000
20,000
25,000
30,000
35,000
40,000
n=61; Figures in USD millions.
Each year, the average AUM was substantially higher than the median AUM reported by respondents because a handful of respondents manage a large portion of all impact investing assets reported to the GIIN’s Annual Survey. In fact, the three largest respondents each year accounted for roughly 45% of all AUM in the sample. Table 1 shows the distribution of AUM, which is relatively consistent across the years.
Table 1: Distribution of AUM by yearn=61; Figures in USD millions.
Minimum 25th Percentile Median 75th Percentile Maximum Mean
2013 2.2 53.3 117.0 294.0 6,300.0 409.4
2014 7.0 53.6 135.0 300.0 9,300.0 497.2
2015 6.1 60.0 143.5 330.0 9,900.0 572.8
Source: GIIN
The Asset Allocation section of this report (page 16) presents further analysis of impact investment AUM by sub-group, geographic focus, sector, instrument, and stage of business.
7 One respondent declined to provide AUM information in all three years.
8 G L O B A L I M P A C T I N V E S T I N G N E T W O R K
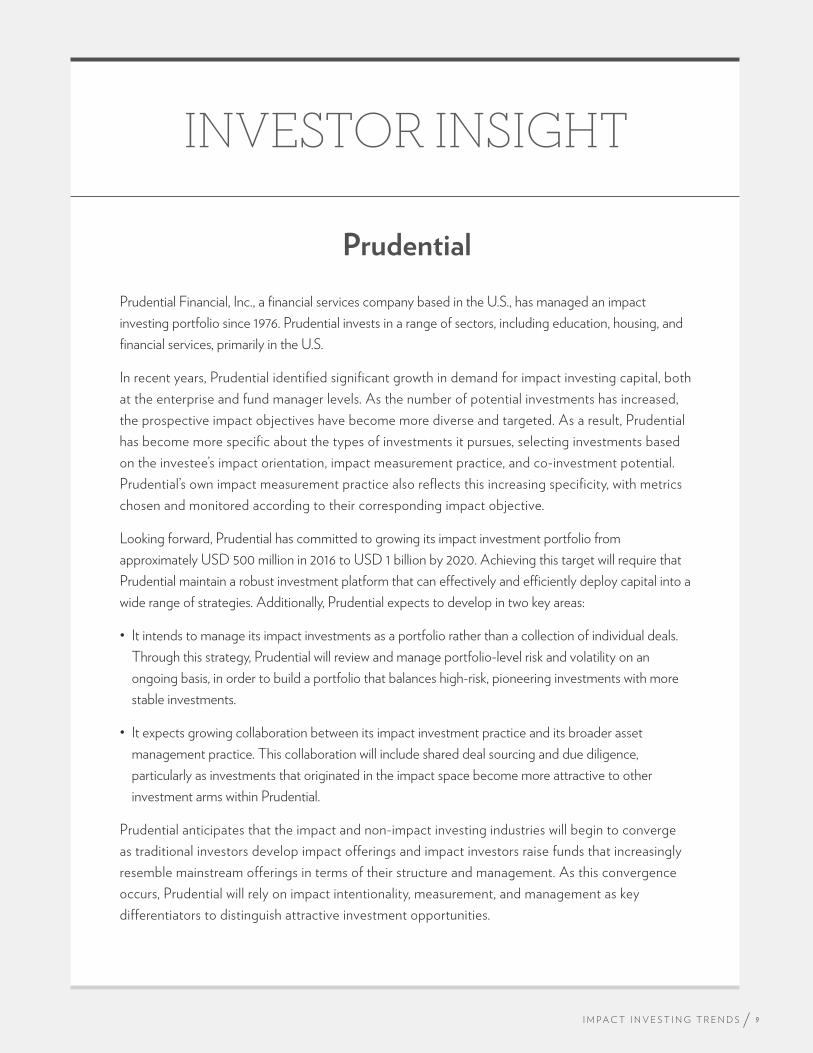
INVESTOR INSIGHT
Prudential
Prudential Financial, Inc., a financial services company based in the U.S., has managed an impact
investing portfolio since 1976. Prudential invests in a range of sectors, including education, housing, and
financial services, primarily in the U.S.
In recent years, Prudential identified significant growth in demand for impact investing capital, both
at the enterprise and fund manager levels. As the number of potential investments has increased,
the prospective impact objectives have become more diverse and targeted. As a result, Prudential
has become more specific about the types of investments it pursues, selecting investments based
on the investee’s impact orientation, impact measurement practice, and co-investment potential.
Prudential’s own impact measurement practice also reflects this increasing specificity, with metrics
chosen and monitored according to their corresponding impact objective.
Looking forward, Prudential has committed to growing its impact investment portfolio from
approximately USD 500 million in 2016 to USD 1 billion by 2020. Achieving this target will require that
Prudential maintain a robust investment platform that can effectively and efficiently deploy capital into a
wide range of strategies. Additionally, Prudential expects to develop in two key areas:
• It intends to manage its impact investments as a portfolio rather than a collection of individual deals.
Through this strategy, Prudential will review and manage portfolio-level risk and volatility on an
ongoing basis, in order to build a portfolio that balances high-risk, pioneering investments with more
stable investments.
• It expects growing collaboration between its impact investment practice and its broader asset
management practice. This collaboration will include shared deal sourcing and due diligence,
particularly as investments that originated in the impact space become more attractive to other
investment arms within Prudential.
Prudential anticipates that the impact and non-impact investing industries will begin to converge
as traditional investors develop impact offerings and impact investors raise funds that increasingly
resemble mainstream offerings in terms of their structure and management. As this convergence
occurs, Prudential will rely on impact intentionality, measurement, and management as key
differentiators to distinguish attractive investment opportunities.
9I M P A C T I N V E S T I N G T R E N D S
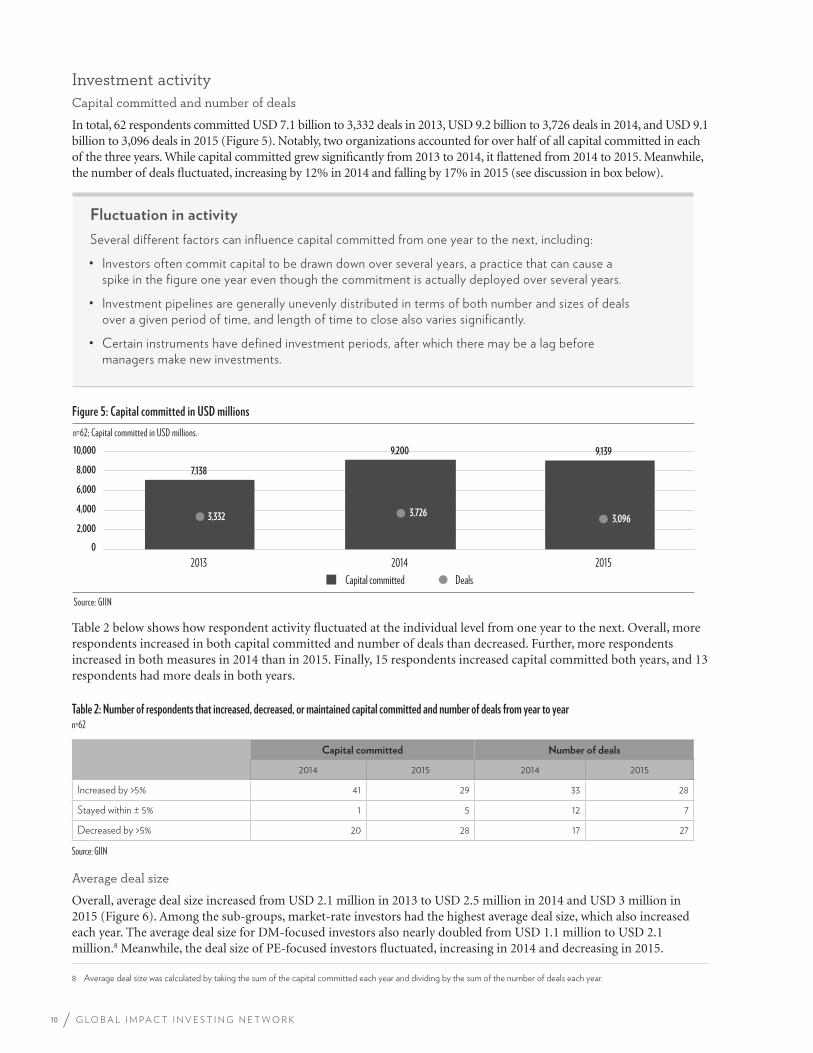
Investment activityCapital committed and number of deals
In total, 62 respondents committed USD 7.1 billion to 3,332 deals in 2013, USD 9.2 billion to 3,726 deals in 2014, and USD 9.1 billion to 3,096 deals in 2015 (Figure 5). Notably, two organizations accounted for over half of all capital committed in each of the three years. While capital committed grew significantly from 2013 to 2014, it flattened from 2014 to 2015. Meanwhile, the number of deals fluctuated, increasing by 12% in 2014 and falling by 17% in 2015 (see discussion in box below).
Figure 5: Capital committed in USD millions
Source: GIIN
2013 Capital committed Deals
2014 2015
7,138
9,200 9,139
3,332 3,726 3,096
0
2,000
4,000
6,000
8,000
10,000
n=62; Capital committed in USD millions.
Table 2 below shows how respondent activity fluctuated at the individual level from one year to the next. Overall, more respondents increased in both capital committed and number of deals than decreased. Further, more respondents increased in both measures in 2014 than in 2015. Finally, 15 respondents increased capital committed both years, and 13 respondents had more deals in both years.
Table 2: Number of respondents that increased, decreased, or maintained capital committed and number of deals from year to yearn=62
Capital committed Number of deals
2014 2015 2014 2015
Increased by >5% 41 29 33 28
Stayed within ± 5% 1 5 12 7
Decreased by >5% 20 28 17 27
Source: GIIN
Average deal size
Overall, average deal size increased from USD 2.1 million in 2013 to USD 2.5 million in 2014 and USD 3 million in 2015 (Figure 6). Among the sub-groups, market-rate investors had the highest average deal size, which also increased each year. The average deal size for DM-focused investors also nearly doubled from USD 1.1 million to USD 2.1 million.8 Meanwhile, the deal size of PE-focused investors fluctuated, increasing in 2014 and decreasing in 2015.
8 Average deal size was calculated by taking the sum of the capital committed each year and dividing by the sum of the number of deals each year.
Fluctuation in activity
Several different factors can influence capital committed from one year to the next, including:
• Investors often commit capital to be drawn down over several years, a practice that can cause a spike in the figure one year even though the commitment is actually deployed over several years.
• Investment pipelines are generally unevenly distributed in terms of both number and sizes of deals over a given period of time, and length of time to close also varies significantly.
• Certain instruments have defined investment periods, after which there may be a lag before managers make new investments.
10 G L O B A L I M P A C T I N V E S T I N G N E T W O R K
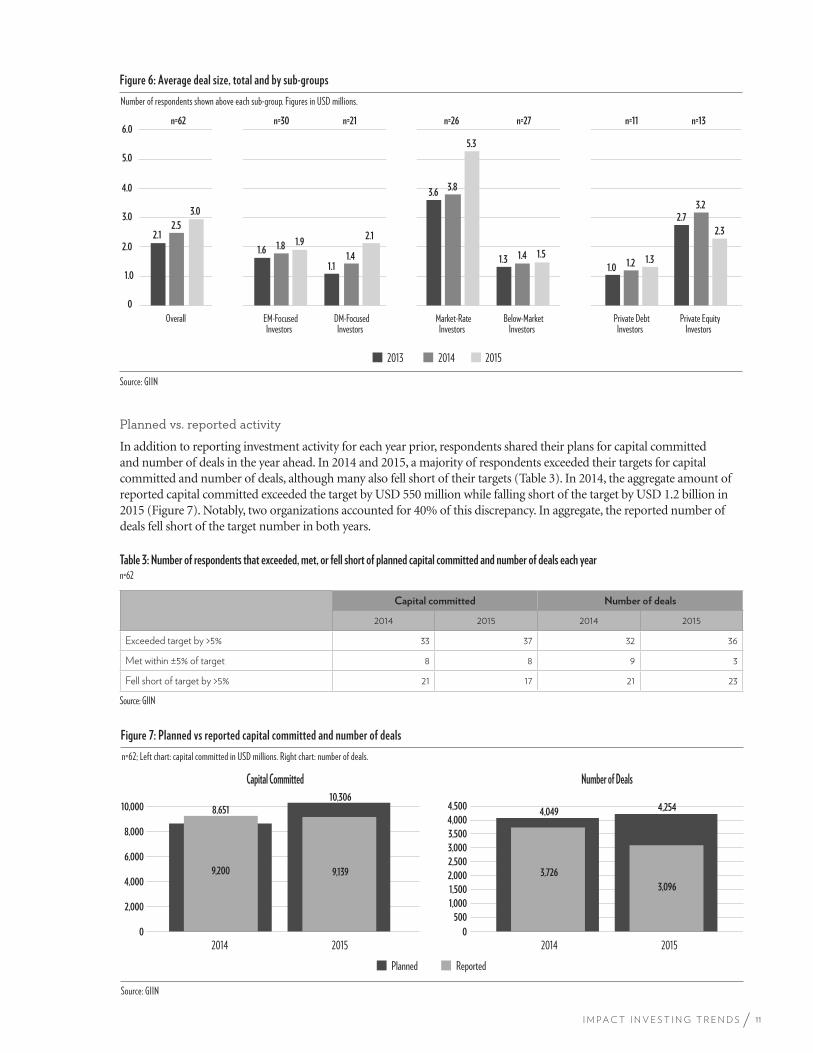
Figure 6: Average deal size, total and by sub-groups
Source: GIIN
0
1.0
2.0
3.0
4.0
5.0
6.0 n=62 n=27 n=13n=11n=26n=21n=30
2.1
1.6
1.1
3.6
1.3 1.0
2.7 2.5
1.8 1.4
3.8
1.4 1.2
3.2 3.0
1.9 2.1
5.3
1.5 1.3
2.3
Overall EM-FocusedInvestors
DM-FocusedInvestors
Market-RateInvestors
Below-MarketInvestors
Private DebtInvestors
Private EquityInvestors
2013 2014 2015
Number of respondents shown above each sub-group. Figures in USD millions.
Planned vs. reported activity
In addition to reporting investment activity for each year prior, respondents shared their plans for capital committed and number of deals in the year ahead. In 2014 and 2015, a majority of respondents exceeded their targets for capital committed and number of deals, although many also fell short of their targets (Table 3). In 2014, the aggregate amount of reported capital committed exceeded the target by USD 550 million while falling short of the target by USD 1.2 billion in 2015 (Figure 7). Notably, two organizations accounted for 40% of this discrepancy. In aggregate, the reported number of deals fell short of the target number in both years.
Table 3: Number of respondents that exceeded, met, or fell short of planned capital committed and number of deals each yearn=62
Capital committed Number of deals
2014 2015 2014 2015
Exceeded target by >5% 33 37 32 36
Met within ±5% of target 8 8 9 3
Fell short of target by >5% 21 17 21 23
Source: GIIN
Figure 7: Planned vs reported capital committed and number of deals
Source: GIIN
Planned Reported
500
1,000
1,500
2,000
2,500
3,000
3,500
4,000
4,500
2014 2015 2014 2015
Capital Committed Number of Deals
8,651
10,306
9,200 9,139
0 0
2,000
4,000
6,000
8,000
10,000 4,049 4,254
3,726
3,096
n=62; Left chart: capital committed in USD millions. Right chart: number of deals.
11I M P A C T I N V E S T I N G T R E N D S
INVESTOR INSIGHT
FMO
FMO, the Dutch development finance institution (DFI), has been investing for social and environmental
impact since 1970. FMO has identified three noteworthy changes in both its own impact investing
practice and the wider industry during the last three years, as well as corresponding forward-looking
opportunities:
1 Ongoing refinement of impact measurement practice: With the help of an external consultant,
FMO has developed an impact measurement model that captures both direct and indirect outcomes
from an investment. The model considers external, macro-level data, investee performance metrics,
and other indicators of impact. Looking forward, FMO hopes the market will move toward auditable,
integrated impact reporting with higher-quality impact data.
2 Growing importance of its catalytic role: It is widely recognized that private capital and
partnerships are needed to realize the Sustainable Development Goals. In recent years, FMO has
increasingly played a catalytic role e.g. by taking a second loss position in several of its investments,
thus mitigating risk for private investors. Through FMO Investment Management and syndicated
loans, FMO has catalyzed and channeled capital from institutional investors and high-net-worth
individuals to emerging markets. Looking forward, FMO sees further opportunity to facilitate public-
private partnerships and to crowd in private capital, for instance for green bonds in emerging markets.
3 An increasingly specialized intermediary market: FMO noted the emergence of more funds
focused on specific geographies and impact themes. Funds have expressed greater interest in forestry,
renewable energy and women-owned SMEs, for instance. Further, FMO has found more funds with a
liability structure built to accommodate both public and private capital. In addition to funds, ‘platforms’
and holding companies are gaining importance. For example, the Arise platform invests in financial
inclusion in Africa with a longer term horizon than is typical with closed-ended funds and also provides
other, non-financial support.
12 G L O B A L I M P A C T I N V E S T I N G N E T W O R K
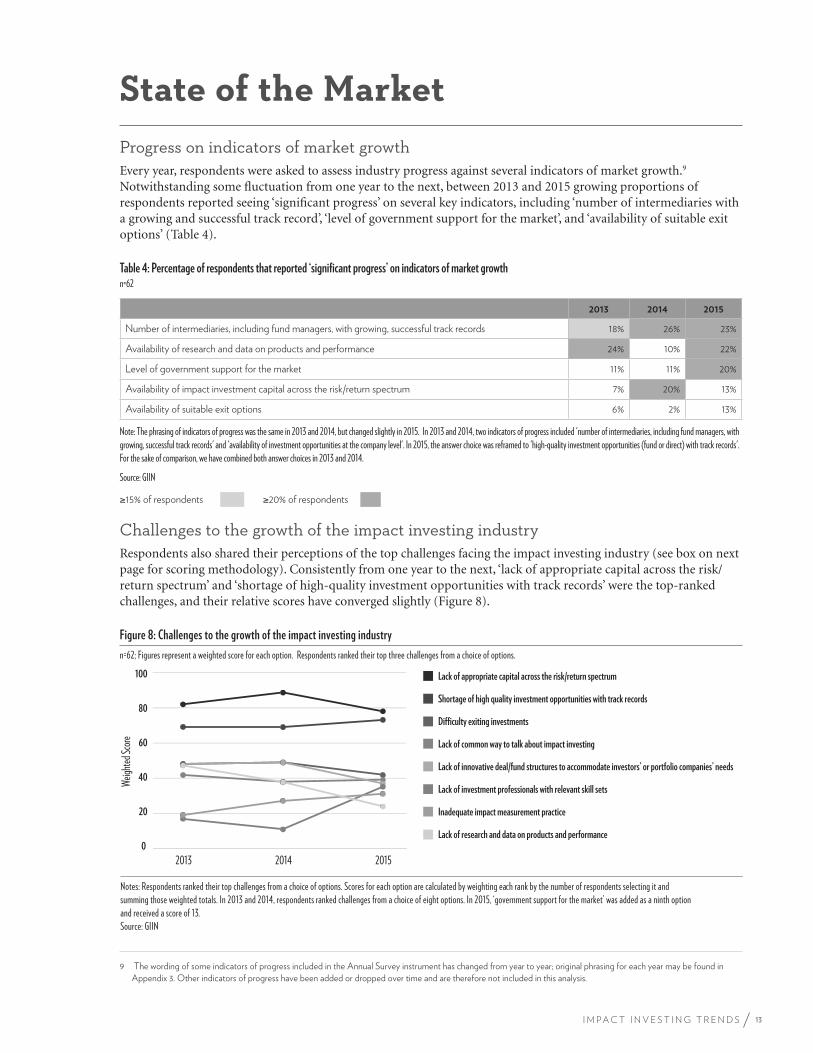
State of the MarketProgress on indicators of market growthEvery year, respondents were asked to assess industry progress against several indicators of market growth.9 Notwithstanding some fluctuation from one year to the next, between 2013 and 2015 growing proportions of respondents reported seeing ‘significant progress’ on several key indicators, including ‘number of intermediaries with a growing and successful track record’, ‘level of government support for the market’, and ‘availability of suitable exit options’ (Table 4).
Table 4: Percentage of respondents that reported ‘significant progress’ on indicators of market growthn=62
2013 2014 2015
Number of intermediaries, including fund managers, with growing, successful track records 18% 26% 23%
Availability of research and data on products and performance 24% 10% 22%
Level of government support for the market 11% 11% 20%
Availability of impact investment capital across the risk/return spectrum 7% 20% 13%
Availability of suitable exit options 6% 2% 13%
Note: The phrasing of indicators of progress was the same in 2013 and 2014, but changed slightly in 2015. In 2013 and 2014, two indicators of progress included 'number of intermediaries, including fund managers, with growing, successful track records' and 'availability of investment opportunities at the company level'. In 2015, the answer choice was reframed to 'high-quality investment opportunities (fund or direct) with track records'. For the sake of comparison, we have combined both answer choices in 2013 and 2014.
Source: GIIN
15% of respondents 20% of respondents
Challenges to the growth of the impact investing industryRespondents also shared their perceptions of the top challenges facing the impact investing industry (see box on next page for scoring methodology). Consistently from one year to the next, ‘lack of appropriate capital across the risk/return spectrum’ and ‘shortage of high-quality investment opportunities with track records’ were the top-ranked challenges, and their relative scores have converged slightly (Figure 8).
Figure 8: Challenges to the growth of the impact investing industry
n=62; Figures represent a weighted score for each option. Respondents ranked their top three challenges from a choice of options.
Notes: Respondents ranked their top challenges from a choice of options. Scores for each option are calculated by weighting each rank by the number of respondents selecting it and summing those weighted totals. In 2013 and 2014, respondents ranked challenges from a choice of eight options. In 2015, ‘government support for the market’ was added as a ninth option and received a score of 13.Source: GIIN
0
20
40
60
80
100
2013 2014 2015
Weigh
ted Sc
ore
Lack of appropriate capital across the risk/return spectrum
Shortage of high quality investment opportunities with track records
Difficulty exiting investments
Lack of common way to talk about impact investing
Lack of innovative deal/fund structures to accommodate investors’ or portfolio companies’ needs
Lack of investment professionals with relevant skill sets
Inadequate impact measurement practice
Lack of research and data on products and performance
9 The wording of some indicators of progress included in the Annual Survey instrument has changed from year to year; original phrasing for each year may be found in
Appendix 3. Other indicators of progress have been added or dropped over time and are therefore not included in this analysis.
13I M P A C T I N V E S T I N G T R E N D S
Scoring Methodology
Throughout the survey instruments, some questions request respondents to rank a given set of options relative to each other. This report presents a weighted score for each answer choice, calculated by weighting each rank by the number of respondents that selected it and summing those weighted totals. In this case, respondents ranked the top three challenges,10 so the score for each option equals (number that ranked it first x 3) + (number that ranked it second x 2) + (number that ranked it third x 1).
It is important to note that since respondents rank each answer choice, the data only reflect the perceptions of each challenge in relation to the others, but may not capture an absolute increase or decrease of the significance of each challenge.
By score, the ‘lack of investment professionals with relevant skill sets’ and ‘inadequate impact measurement practice’ rose the most as perceived challenges. This first challenge may reflect growing demand for professionals with particular skills, which could stem from an increasingly specialized and segmented market. The second challenge may indicate growing expectations for increasingly sophisticated impact measurement practice and reporting. Conversely, ‘lack of research and data on products and performance’ and ‘lack of innovative structures to accommodate investors’ or portfolio companies’ needs’ showed the greatest decrease in score over time, thus indicating relative improvement in these indicators. These improvements may have resulted from a growing volume of high-quality research, including recent studies of the financial performance of impact investments.11
Overall, the prioritized challenges remained relatively consistent across the three-year period (Figure 8), though respondents have, at the same time, consistently indicated improvement in terms of various measures of progress (Table 4). Taken together, this suggests that, although certain barriers to growth remain, the impact investing industry continues to move forward.
10 In 2015, respondents ranked their top five challenges because the list of options was expanded. Only the top three are considered in the score presented here.
11 Recent publications on financial performance of impact investments include: Amit Bouri et al., Introducing the Impact Investing Benchmark (The GIIN and Cambridge
Associates, 2015), https://thegiin.org/knowledge/publication/introducing-the-impact-investing-benchmark; and Jacob Gray et al., Great Expectations: Mission
Preservation and Financial Performance in Impact (Wharton Business School, 2015), https://socialimpact.wharton.upenn.edu/programs/impact-investing/
14 G L O B A L I M P A C T I N V E S T I N G N E T W O R K
INVESTOR INSIGHT
Adobe Capital
Adobe Capital is a fund manager headquartered and investing in Mexico. Since Adobe Capital was
established in 2013, it has observed growing activity in Mexico among both local and international
impact investors. Additionally, Adobe has noted increasing flow of capital from investors new to impact
investing and rising participation in the annual Latin American Impact Investment Forum, which will host
its seventh convening in 2017.
This growing focus on investment for social and environmental stewardship is mirrored in the
emergence of more impact-oriented entrepreneurs. Looking ahead, Adobe perceives growing
opportunities in three key sectors: clean energy, financial inclusion, and healthcare. However, while the
number of potential investment opportunities has increased, their quality and track records remain
unproven. It also believes that accelerator programs will play a significant role in developing quality
investment opportunities.
Currently, Adobe is raising its second fund and beginning to divest from its first. One of the primary
learnings from the first fund has been a strategic evolution in impact measurement and management.
Specifically, Adobe regularly reviews the set of IRIS12 metrics reported by its investees to ensure
that they generate value and reflect on-the-ground impact. It also requires that all of its portfolio
companies pursue a GIIRS13 rating within six months of receiving investment capital. These steps,
Adobe feels, have begun to offer greater clarity around each company’s impact intentions and impact
management practice.
12 IRIS is the catalog of generally accepted performance metrics managed by the GIIN that impact investors use to measure the social, environmental, and
financial results of their investments. For more information, see iris.thegiin.org.
13 GIIRS Ratings provide comparable ratings of a company or a fund’s social and environmental impact.
15I M P A C T I N V E S T I N G T R E N D S
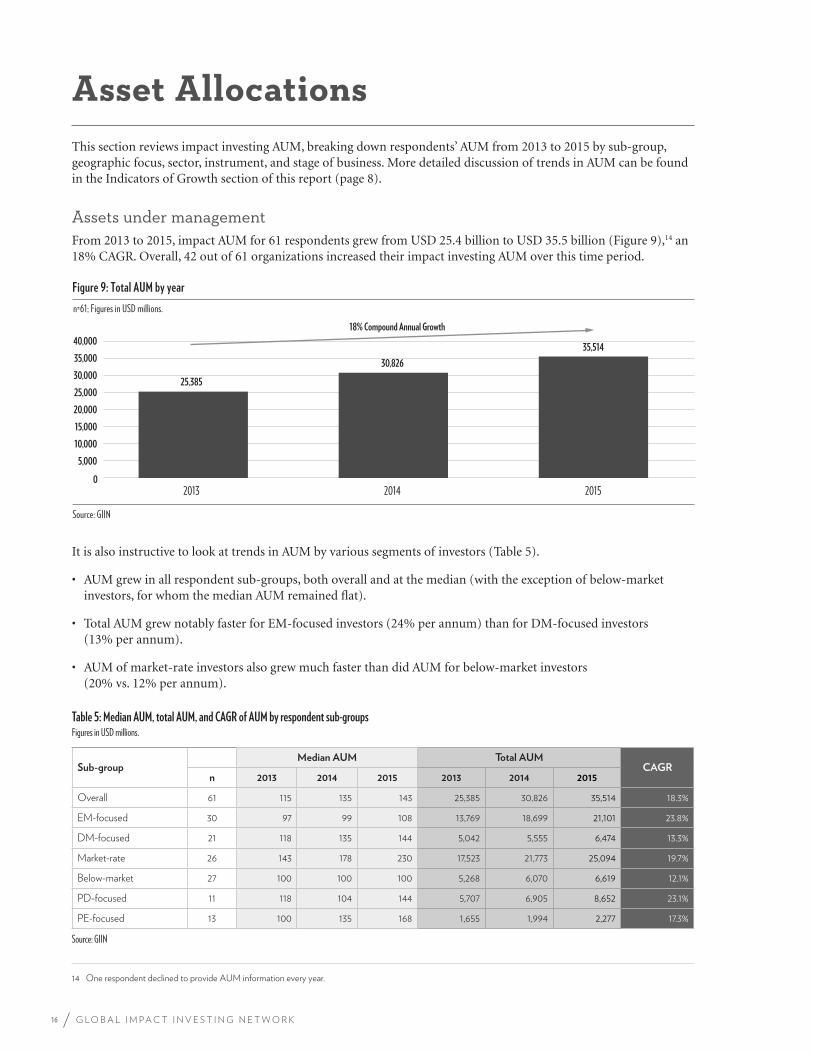
Asset AllocationsThis section reviews impact investing AUM, breaking down respondents’ AUM from 2013 to 2015 by sub-group, geographic focus, sector, instrument, and stage of business. More detailed discussion of trends in AUM can be found in the Indicators of Growth section of this report (page 8).
Assets under management From 2013 to 2015, impact AUM for 61 respondents grew from USD 25.4 billion to USD 35.5 billion (Figure 9),14 an 18% CAGR. Overall, 42 out of 61 organizations increased their impact investing AUM over this time period.
Figure 9: Total AUM by year
Source: GIIN
0 2013 2014 2015
25,385
30,826
18% Compound Annual Growth
35,514
5,000
10,000
15,000
20,000
25,000
30,000
35,000
40,000
n=61; Figures in USD millions.
It is also instructive to look at trends in AUM by various segments of investors (Table 5).
• AUM grew in all respondent sub-groups, both overall and at the median (with the exception of below-marketinvestors, for whom the median AUM remained flat).
• Total AUM grew notably faster for EM-focused investors (24% per annum) than for DM-focused investors(13% per annum).
• AUM of market-rate investors also grew much faster than did AUM for below-market investors(20% vs. 12% per annum).
Table 5: Median AUM, total AUM, and CAGR of AUM by respondent sub-groups Figures in USD millions.
Sub-groupMedian AUM Total AUM
CAGRn 2013 2014 2015 2013 2014 2015
Overall 61 115 135 143 25,385 30,826 35,514 18.3%
EM-focused 30 97 99 108 13,769 18,699 21,101 23.8%
DM-focused 21 118 135 144 5,042 5,555 6,474 13.3%
Market-rate 26 143 178 230 17,523 21,773 25,094 19.7%
Below-market 27 100 100 100 5,268 6,070 6,619 12.1%
PD-focused 11 118 104 144 5,707 6,905 8,652 23.1%
PE-focused 13 100 135 168 1,655 1,994 2,277 17.3%
Source: GIIN
14 One respondent declined to provide AUM information every year.
16 G L O B A L I M P A C T I N V E S T I N G N E T W O R K
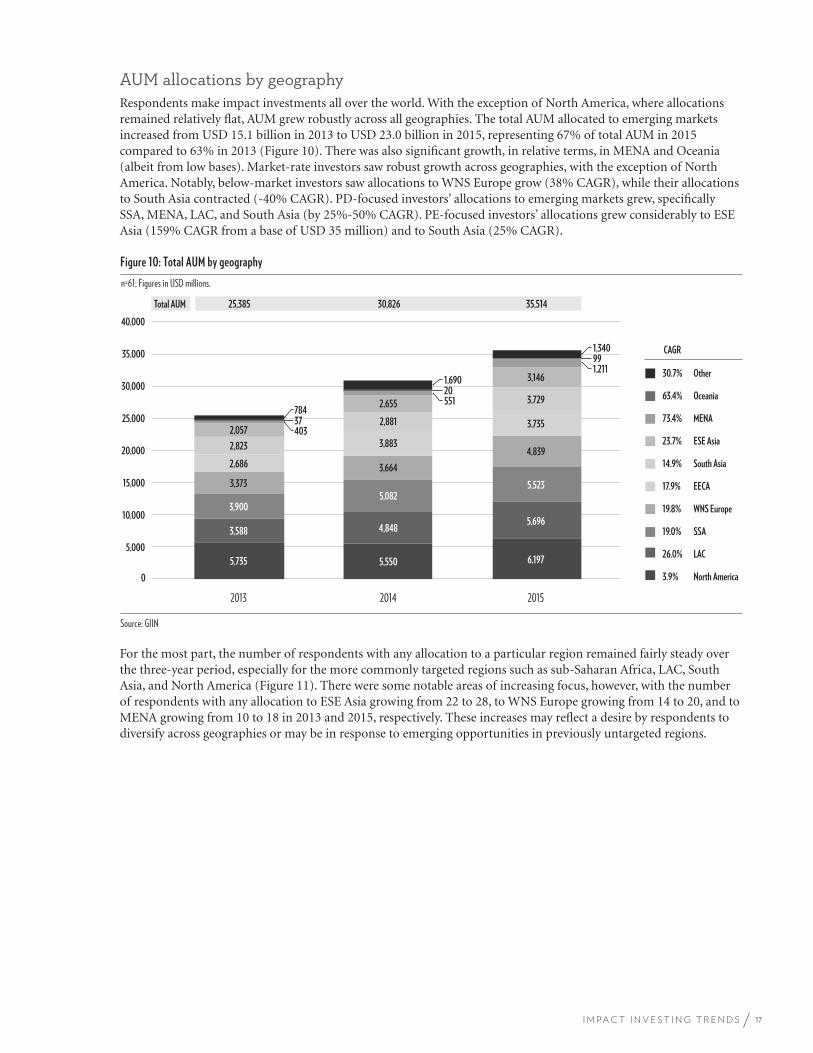
AUM allocations by geographyRespondents make impact investments all over the world. With the exception of North America, where allocations remained relatively flat, AUM grew robustly across all geographies. The total AUM allocated to emerging markets increased from USD 15.1 billion in 2013 to USD 23.0 billion in 2015, representing 67% of total AUM in 2015 compared to 63% in 2013 (Figure 10). There was also significant growth, in relative terms, in MENA and Oceania (albeit from low bases). Market-rate investors saw robust growth across geographies, with the exception of North America. Notably, below-market investors saw allocations to WNS Europe grow (38% CAGR), while their allocations to South Asia contracted (-40% CAGR). PD-focused investors’ allocations to emerging markets grew, specifically SSA, MENA, LAC, and South Asia (by 25%-50% CAGR). PE-focused investors’ allocations grew considerably to ESE Asia (159% CAGR from a base of USD 35 million) and to South Asia (25% CAGR).
Figure 10: Total AUM by geography
Source: GIIN
5,735 5,550 6,197
3,588 4,848 5,696
3,900 5,082
5,523 3,373
3,664
4,839 2,686
3,883
3,735
2,823
2,881
3,729
2,057
2,655
3,146
403 37 784
55120 1,690
30.7%
63.4%
73.4%
23.7%
14.9%
17.9%
19.8%
19.0%
26.0%
3.9%
Other
Oceania
MENA
ESE Asia
South Asia
EECA
WNS Europe
SSA
LAC
North America
1,21199 1,340
0
2013 2014 2015
5,000
10,000
15,000
20,000
25,000
30,000
35,000
40,000
25,385Total AUM 35,51430,826
n=61; Figures in USD millions.
CAGR
For the most part, the number of respondents with any allocation to a particular region remained fairly steady over the three-year period, especially for the more commonly targeted regions such as sub-Saharan Africa, LAC, South Asia, and North America (Figure 11). There were some notable areas of increasing focus, however, with the number of respondents with any allocation to ESE Asia growing from 22 to 28, to WNS Europe growing from 14 to 20, and to MENA growing from 10 to 18 in 2013 and 2015, respectively. These increases may reflect a desire by respondents to diversify across geographies or may be in response to emerging opportunities in previously untargeted regions.
17I M P A C T I N V E S T I N G T R E N D S
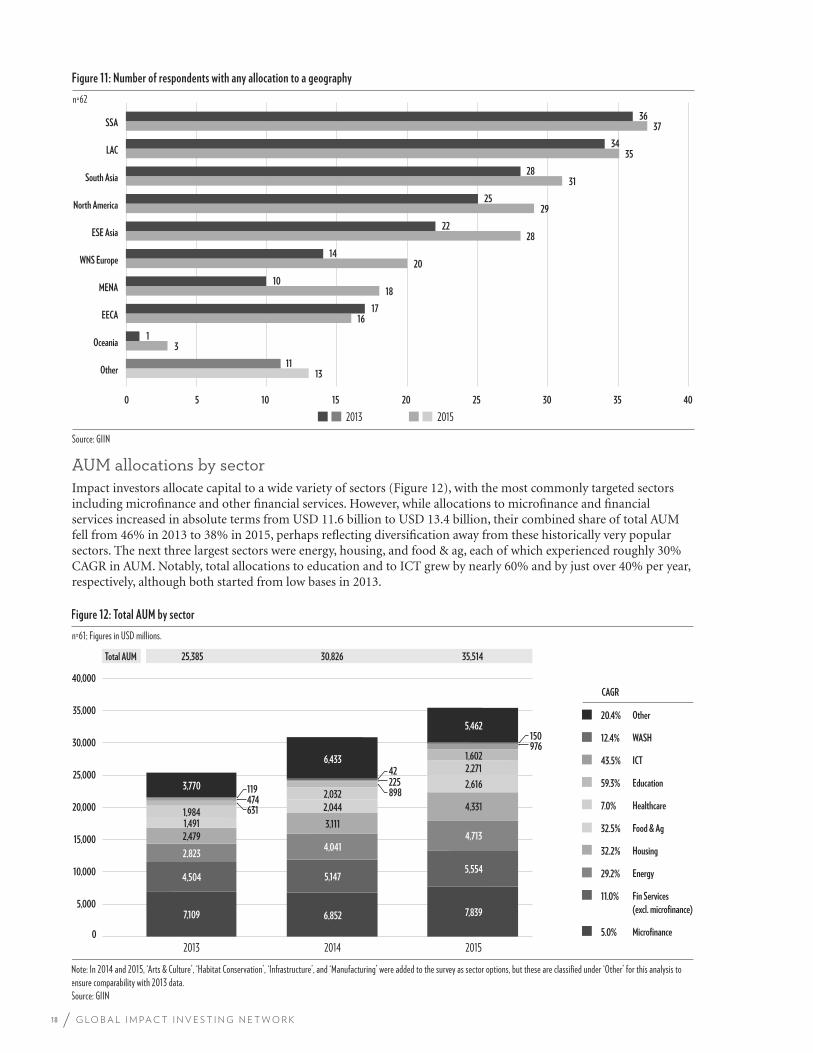
Figure 11: Number of respondents with any allocation to a geography
Source: GIIN
13
3
16
18
20
28
29
31
35
37
11
1
17
10
14
22
25
28
34
36
0 5 10 15 20 25 30 35 40
Other
Oceania
EECA
MENA
WNS Europe
ESE Asia
North America
South Asia
LAC
SSA
2013 2015
n=62
AUM allocations by sectorImpact investors allocate capital to a wide variety of sectors (Figure 12), with the most commonly targeted sectors including microfinance and other financial services. However, while allocations to microfinance and financial services increased in absolute terms from USD 11.6 billion to USD 13.4 billion, their combined share of total AUM fell from 46% in 2013 to 38% in 2015, perhaps reflecting diversification away from these historically very popular sectors. The next three largest sectors were energy, housing, and food & ag, each of which experienced roughly 30% CAGR in AUM. Notably, total allocations to education and to ICT grew by nearly 60% and by just over 40% per year, respectively, although both started from low bases in 2013.
Figure 12: Total AUM by sector
Note: In 2014 and 2015, ‘Arts & Culture’, ‘Habitat Conservation’, ‘Infrastructure’, and ‘Manufacturing’ were added to the survey as sector options, but these are classified under ‘Other’ for this analysis to ensure comparability with 2013 data.Source: GIIN
Other
WASH
ICT
Education
Healthcare
Food & Ag
Housing
Energy
Fin Services
(excl. microfinance)
Microfinance
20.4%
12.4%
43.5%
59.3%
7.0%
32.5%
32.2%
29.2%
11.0%
5.0%
CAGR
0
2013 2014 2015
5,000
10,000
15,000
20,000
25,000
30,000
35,000
40,000
7,109 6,852 7,839
4,504 5,147 5,554
2,823 4,041
4,713 2,479 3,111
4,331
1,491
2,044
2,616
1,984
2,032
2,271
631
898
1,602
474
225
976
119
42
150
3,770
6,433
5,462
25,385Total AUM 35,51430,826
n=61; Figures in USD millions.
18 G L O B A L I M P A C T I N V E S T I N G N E T W O R K
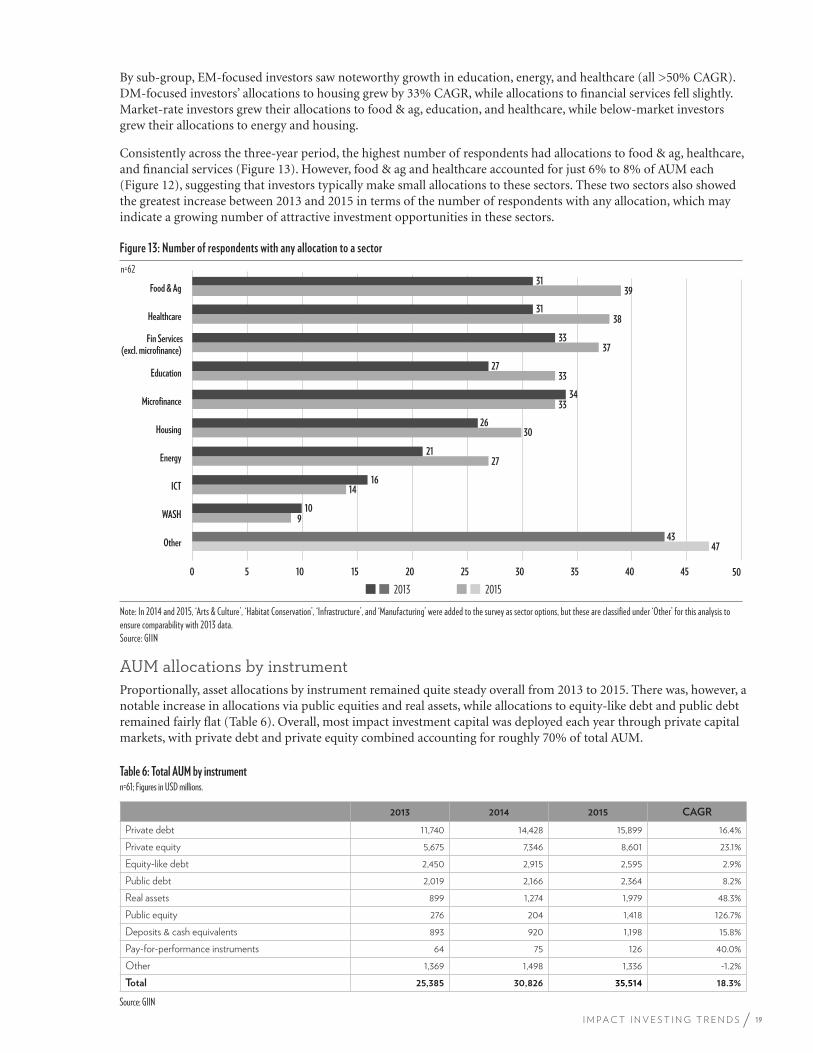
By sub-group, EM-focused investors saw noteworthy growth in education, energy, and healthcare (all >50% CAGR). DM-focused investors’ allocations to housing grew by 33% CAGR, while allocations to financial services fell slightly. Market-rate investors grew their allocations to food & ag, education, and healthcare, while below-market investors grew their allocations to energy and housing.
Consistently across the three-year period, the highest number of respondents had allocations to food & ag, healthcare, and financial services (Figure 13). However, food & ag and healthcare accounted for just 6% to 8% of AUM each (Figure 12), suggesting that investors typically make small allocations to these sectors. These two sectors also showed the greatest increase between 2013 and 2015 in terms of the number of respondents with any allocation, which may indicate a growing number of attractive investment opportunities in these sectors.
Figure 13: Number of respondents with any allocation to a sector
Note: In 2014 and 2015, ‘Arts & Culture’, ‘Habitat Conservation’, ‘Infrastructure’, and ‘Manufacturing’ were added to the survey as sector options, but these are classified under ‘Other’ for this analysis to ensure comparability with 2013 data.Source: GIIN
47
9
14
27
30
33
33
37
38
39
43
10
16
21
26
34
27
33
31
31
0 5 10 15 20 25 30 35 40 45 50
Other
WASH
ICT
Energy
Housing
Microfinance
Education
Fin Services(excl. microfinance)
Healthcare
Food & Ag
n=62
2013 2015
AUM allocations by instrumentProportionally, asset allocations by instrument remained quite steady overall from 2013 to 2015. There was, however, a notable increase in allocations via public equities and real assets, while allocations to equity-like debt and public debt remained fairly flat (Table 6). Overall, most impact investment capital was deployed each year through private capital markets, with private debt and private equity combined accounting for roughly 70% of total AUM.
Table 6: Total AUM by instrumentn=61; Figures in USD millions.
2013 2014 2015 CAGR
Private debt 11,740 14,428 15,899 16.4%
Private equity 5,675 7,346 8,601 23.1%
Equity-like debt 2,450 2,915 2,595 2.9%
Public debt 2,019 2,166 2,364 8.2%
Real assets 899 1,274 1,979 48.3%
Public equity 276 204 1,418 126.7%
Deposits & cash equivalents 893 920 1,198 15.8%
Pay-for-performance instruments 64 75 126 40.0%
Other 1,369 1,498 1,336 -1.2%
Total 25,385 30,826 35,514 18.3%
Source: GIIN19I M P A C T I N V E S T I N G T R E N D S
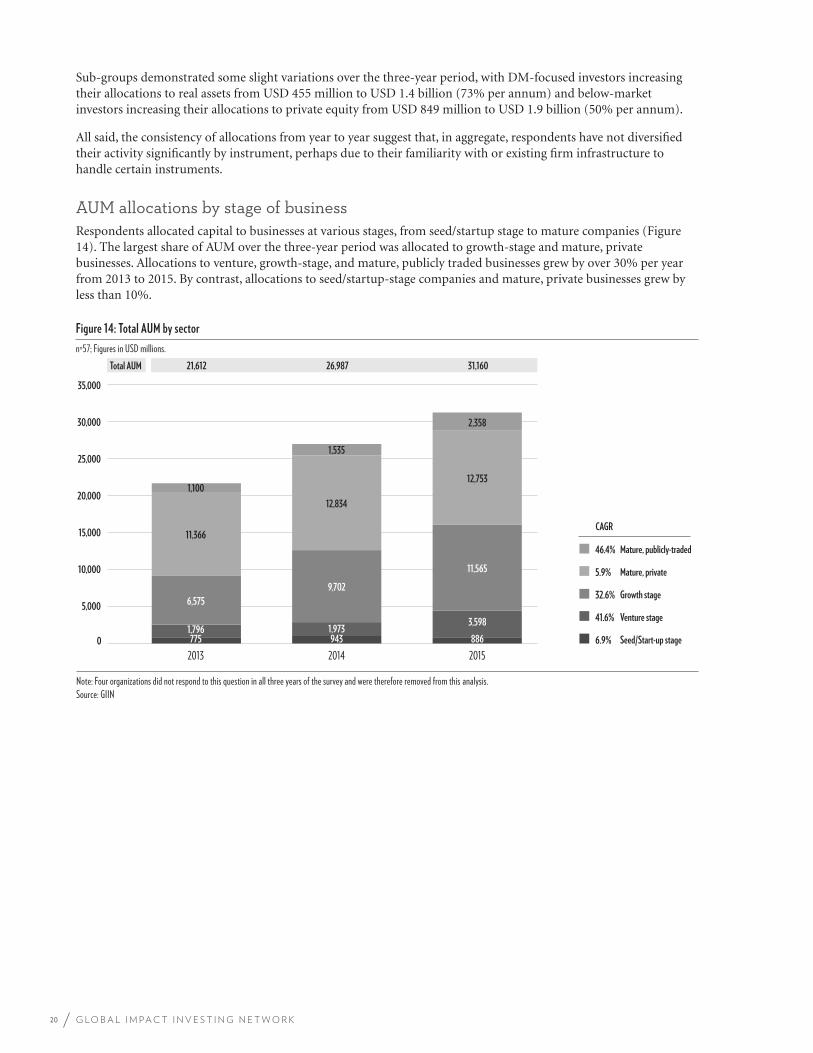
Sub-groups demonstrated some slight variations over the three-year period, with DM-focused investors increasing their allocations to real assets from USD 455 million to USD 1.4 billion (73% per annum) and below-market investors increasing their allocations to private equity from USD 849 million to USD 1.9 billion (50% per annum).
All said, the consistency of allocations from year to year suggest that, in aggregate, respondents have not diversified their activity significantly by instrument, perhaps due to their familiarity with or existing firm infrastructure to handle certain instruments.
AUM allocations by stage of businessRespondents allocated capital to businesses at various stages, from seed/startup stage to mature companies (Figure 14). The largest share of AUM over the three-year period was allocated to growth-stage and mature, private businesses. Allocations to venture, growth-stage, and mature, publicly traded businesses grew by over 30% per year from 2013 to 2015. By contrast, allocations to seed/startup-stage companies and mature, private businesses grew by less than 10%.
Figure 14: Total AUM by sector
n=57; Figures in USD millions.
Note: Four organizations did not respond to this question in all three years of the survey and were therefore removed from this analysis.Source: GIIN
Mature, publicly-traded
Mature, private
Growth stage
Venture stage
Seed/Start-up stage
CAGR
46.4%
5.9%
32.6%
41.6%
6.9%0
2013 2014 2015
5,000
10,000
15,000
20,000
25,000
30,000
35,000
775 943 886 1,796 1,973
3,598
6,575
9,702
11,565
11,366
12,834
12,753 1,100
1,535
2,358
21,612Total AUM 31,16026,987
20 G L O B A L I M P A C T I N V E S T I N G N E T W O R K
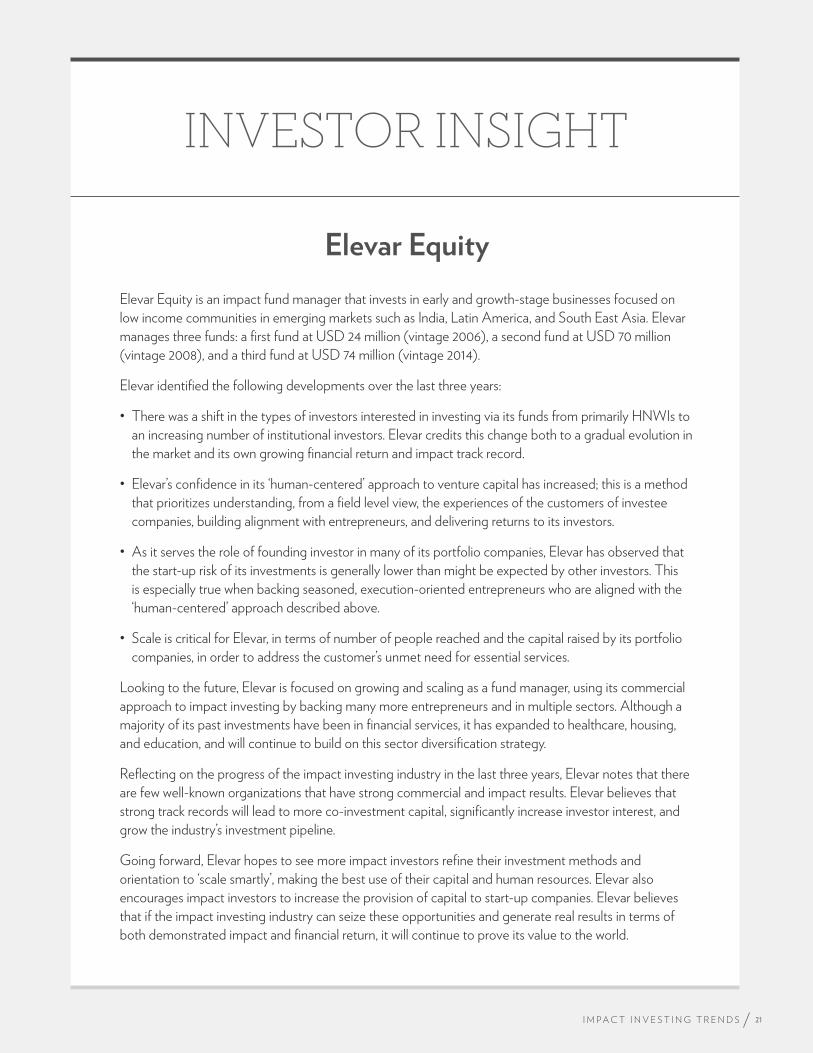
INVESTOR INSIGHT
Elevar Equity
Elevar Equity is an impact fund manager that invests in early and growth-stage businesses focused on
low income communities in emerging markets such as India, Latin America, and South East Asia. Elevar
manages three funds: a first fund at USD 24 million (vintage 2006), a second fund at USD 70 million
(vintage 2008), and a third fund at USD 74 million (vintage 2014).
Elevar identified the following developments over the last three years:
• There was a shift in the types of investors interested in investing via its funds from primarily HNWIs to
an increasing number of institutional investors. Elevar credits this change both to a gradual evolution in
the market and its own growing financial return and impact track record.
• Elevar’s confidence in its ‘human-centered’ approach to venture capital has increased; this is a method
that prioritizes understanding, from a field level view, the experiences of the customers of investee
companies, building alignment with entrepreneurs, and delivering returns to its investors.
• As it serves the role of founding investor in many of its portfolio companies, Elevar has observed that
the start-up risk of its investments is generally lower than might be expected by other investors. This
is especially true when backing seasoned, execution-oriented entrepreneurs who are aligned with the
‘human-centered’ approach described above.
• Scale is critical for Elevar, in terms of number of people reached and the capital raised by its portfolio
companies, in order to address the customer’s unmet need for essential services.
Looking to the future, Elevar is focused on growing and scaling as a fund manager, using its commercial
approach to impact investing by backing many more entrepreneurs and in multiple sectors. Although a
majority of its past investments have been in financial services, it has expanded to healthcare, housing,
and education, and will continue to build on this sector diversification strategy.
Reflecting on the progress of the impact investing industry in the last three years, Elevar notes that there
are few well-known organizations that have strong commercial and impact results. Elevar believes that
strong track records will lead to more co-investment capital, significantly increase investor interest, and
grow the industry’s investment pipeline.
Going forward, Elevar hopes to see more impact investors refine their investment methods and
orientation to ‘scale smartly’, making the best use of their capital and human resources. Elevar also
encourages impact investors to increase the provision of capital to start-up companies. Elevar believes
that if the impact investing industry can seize these opportunities and generate real results in terms of
both demonstrated impact and financial return, it will continue to prove its value to the world.
21I M P A C T I N V E S T I N G T R E N D S
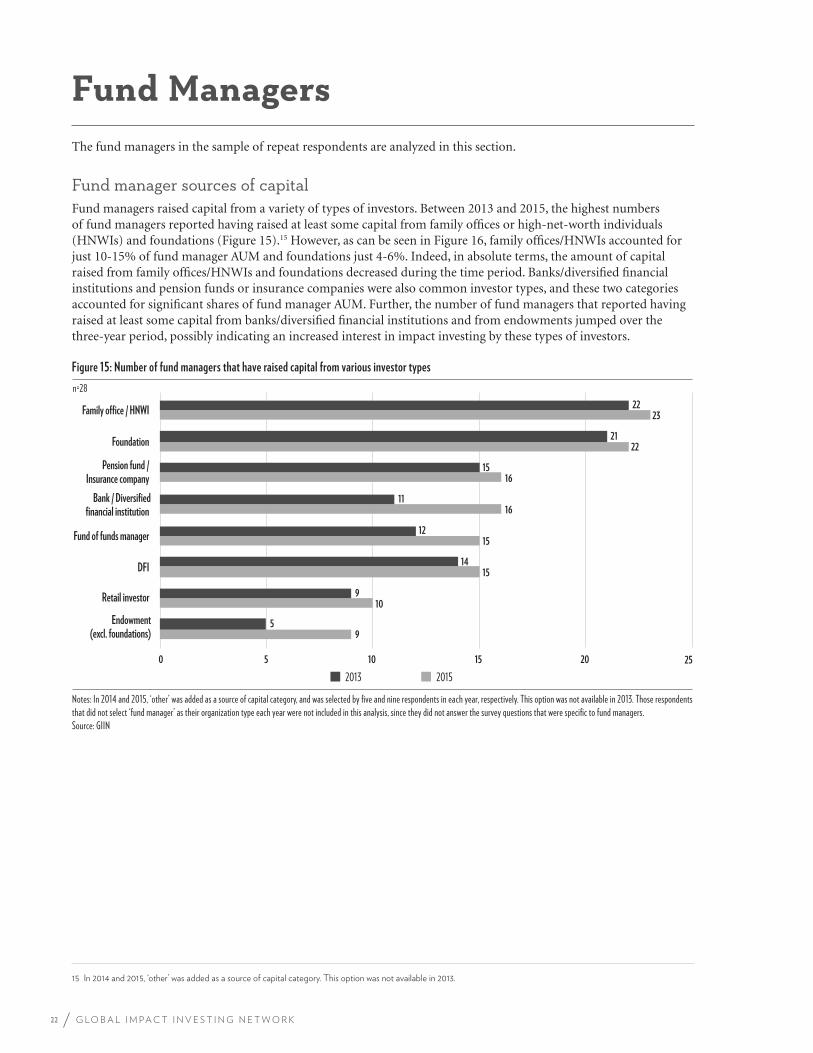
Fund Managers The fund managers in the sample of repeat respondents are analyzed in this section.
Fund manager sources of capitalFund managers raised capital from a variety of types of investors. Between 2013 and 2015, the highest numbers of fund managers reported having raised at least some capital from family offices or high-net-worth individuals (HNWIs) and foundations (Figure 15).15 However, as can be seen in Figure 16, family offices/HNWIs accounted for just 10-15% of fund manager AUM and foundations just 4-6%. Indeed, in absolute terms, the amount of capital raised from family offices/HNWIs and foundations decreased during the time period. Banks/diversified financial institutions and pension funds or insurance companies were also common investor types, and these two categories accounted for significant shares of fund manager AUM. Further, the number of fund managers that reported having raised at least some capital from banks/diversified financial institutions and from endowments jumped over the three-year period, possibly indicating an increased interest in impact investing by these types of investors.
Figure 15: Number of fund managers that have raised capital from various investor types
Notes: In 2014 and 2015, ‘other’ was added as a source of capital category, and was selected by five and nine respondents in each year, respectively. This option was not available in 2013. Those respondents that did not select ‘fund manager’ as their organization type each year were not included in this analysis, since they did not answer the survey questions that were specific to fund managers. Source: GIIN
0 5 10 15 20 25
9
10
15
15
16
16
22
23
5
9
14
12
11
15
21
22
Endowment(excl. foundations)
Retail investor
DFI
Fund of funds manager
Bank / Diversifiedfinancial institution
Pension fund / Insurance company
Foundation
Family office / HNWI
n=28
2013 2015
15 In 2014 and 2015, ‘other’ was added as a source of capital category. This option was not available in 2013.
22 G L O B A L I M P A C T I N V E S T I N G N E T W O R K
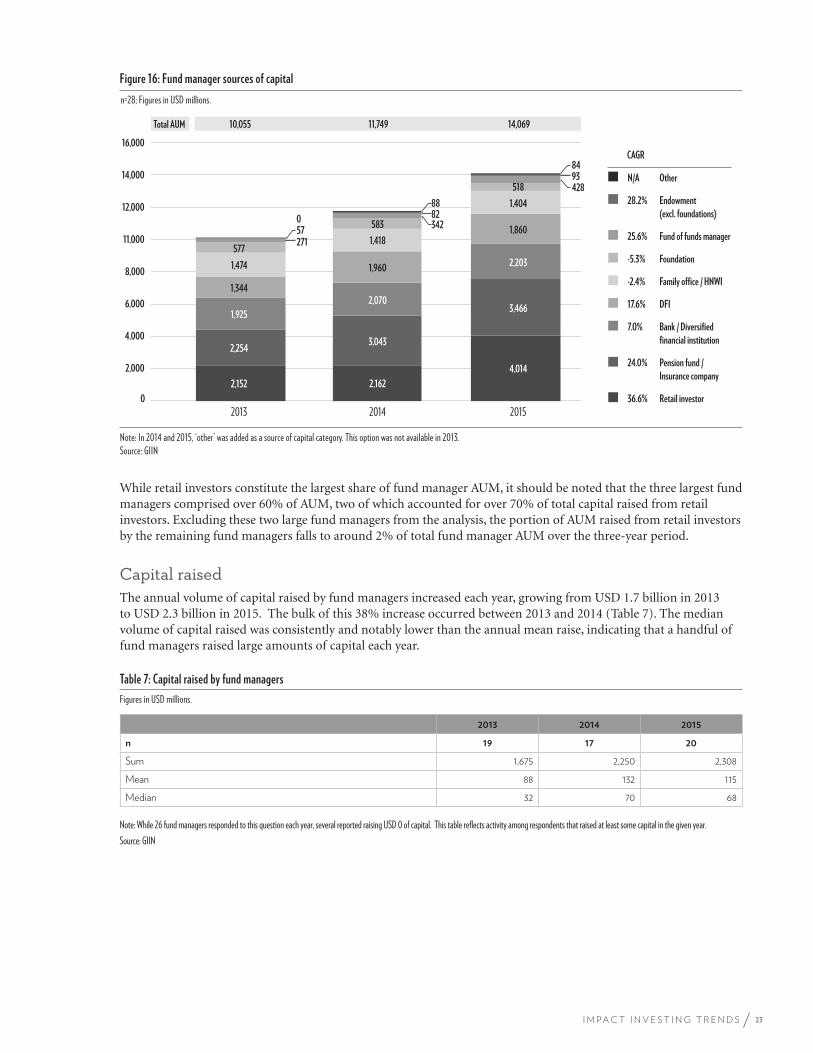
10,055Total AUM 14,06911,749
Figure 16: Fund manager sources of capital
Note: In 2014 and 2015, ‘other’ was added as a source of capital category. This option was not available in 2013.Source: GIIN
Other
Endowment
(excl. foundations)
Fund of funds manager
Foundation
Family office / HNWI
DFI
Bank / Diversified
financial institution
Pension fund /
Insurance company
Retail investor
N/A
28.2%
25.6%
-5.3%
-2.4%
17.6%
7.0%
24.0%
36.6% 0
2013 2014 2015
2,000
4,000
6,000
8,000
11,000
12,000
14,000
16,000
271 57
3428288
2,152 2,162
4,014
2,254 3,043
3,466 1,925
2,070
2,203
1,344
1,960
1,860
1,474
1,418
1,404
577
583
518
0
93 84
428
n=28; Figures in USD millions.
CAGR
While retail investors constitute the largest share of fund manager AUM, it should be noted that the three largest fund managers comprised over 60% of AUM, two of which accounted for over 70% of total capital raised from retail investors. Excluding these two large fund managers from the analysis, the portion of AUM raised from retail investors by the remaining fund managers falls to around 2% of total fund manager AUM over the three-year period.
Capital raisedThe annual volume of capital raised by fund managers increased each year, growing from USD 1.7 billion in 2013 to USD 2.3 billion in 2015. The bulk of this 38% increase occurred between 2013 and 2014 (Table 7). The median volume of capital raised was consistently and notably lower than the annual mean raise, indicating that a handful of fund managers raised large amounts of capital each year.
Table 7: Capital raised by fund managers
Figures in USD millions.
2013 2014 2015
n 19 17 20
Sum 1,675 2,250 2,308
Mean 88 132 115
Median 32 70 68
Note: While 26 fund managers responded to this question each year, several reported raising USD 0 of capital. This table reflects activity among respondents that raised at least some capital in the given year.Source: GIIN
23I M P A C T I N V E S T I N G T R E N D S
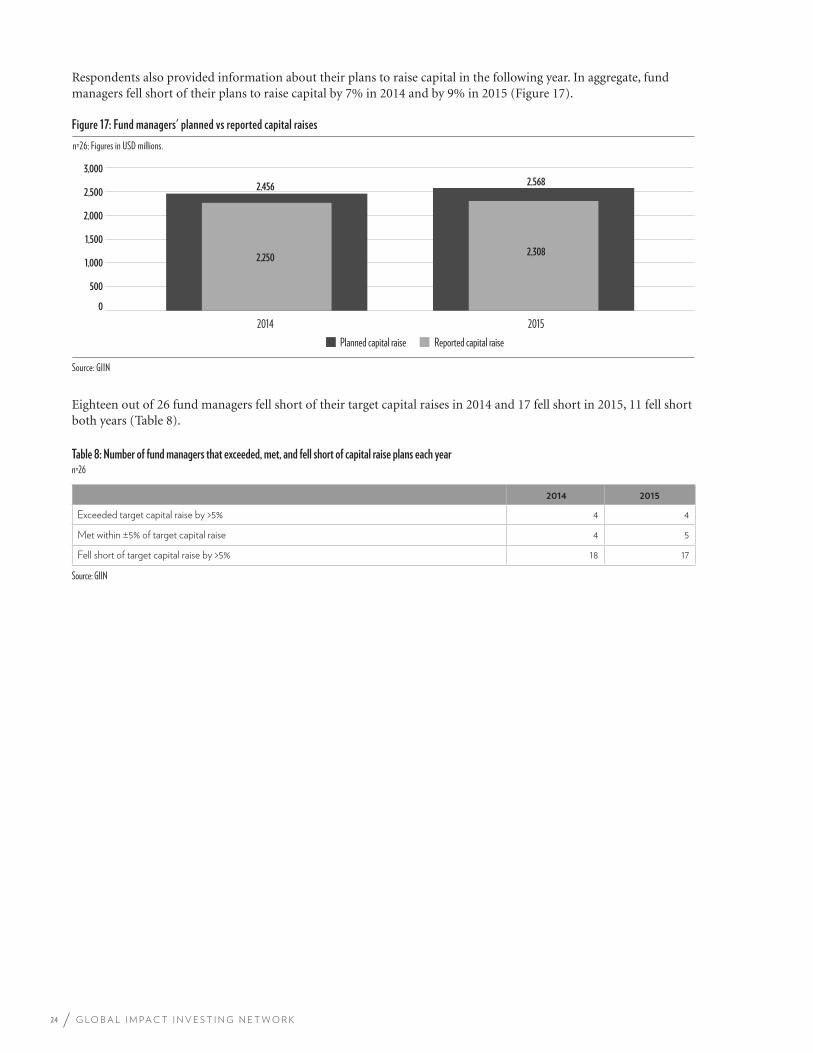
Respondents also provided information about their plans to raise capital in the following year. In aggregate, fund managers fell short of their plans to raise capital by 7% in 2014 and by 9% in 2015 (Figure 17).
Figure 17: Fund managers' planned vs reported capital raises
Source: GIIN
0
500
1,500
1,000
2,000
2,500
3,000
2,456 2,568
2,250 2,308
2014 2015 Planned capital raise Reported capital raise
n=26; Figures in USD millions.
Eighteen out of 26 fund managers fell short of their target capital raises in 2014 and 17 fell short in 2015, 11 fell short both years (Table 8).
Table 8: Number of fund managers that exceeded, met, and fell short of capital raise plans each yearn=26
2014 2015
Exceeded target capital raise by >5% 4 4
Met within ±5% of target capital raise 4 5
Fell short of target capital raise by >5% 18 17
Source: GIIN
24 G L O B A L I M P A C T I N V E S T I N G N E T W O R K
INVESTOR INSIGHT
Big Society Capital
Big Society Capital (BSC) is a financial institution founded in 2012 to help develop the social impact
investment market in the UK, both as an investor and a market-builder. It is funded by a combination
of public money through dormant bank accounts and investments from four UK banks. In the last few
years, the organization has become more proactive in its approach to making investments. It shifted from
selecting proposals through an open application process to collaborating with partners to co-develop
ideas which aim to address a specific social need.
Since its inception, BSC has observed the following major developments in the UK social impact
investing industry:
• Increased deal flow especially in housing, employment, training and education, communities, sports,
arts, and heritage.
• Increased variety of social impact investing products that address social challenges, including secured
debt, unsecured debt, charity bonds, equity, community shares, and real estate.
• Growing use of social impact bonds to fund innovations and scale evidence-based approaches to
issues such as homelessness, youth unemployment, children’s welfare, and long-term health conditions.
A key focus area for BSC has been impact measurement. BSC partnered with social investment financial
intermediaries and impact experts, including Investing for Good, New Philanthropy Capital, Social Value
International, and Triangle Consulting, to develop the Outcomes Matrix, a tool used by charities and
social enterprises to define and measure their impact. Together with the Access Foundation and Power
to Change, BSC is delivering the Impact Management Programme which will provide support including
online resources and grants.
In 2016, BSC is conducting a major survey of its stakeholders to evaluate its current strategy and inform
its future programming. One new initiative seeks to address the ‘poverty premium’, or the concept
that people living in poverty pay more for basic goods and services than do those with higher incomes.
With a combination of grant funding and investment capital, the program will incubate and scale social
enterprises that address this problem.
Looking ahead, BSC perceives opportunities to scale housing-related social impact investments
and pay-for-success models and to attract new impact investors, including institutional investors,
to the market. BSC notes two major challenges facing the UK and European impact investing
market: 1) uncertainty among investors and social enterprises following the UK referendum result in
June 2016 to leave the European Union (“Brexit”); and 2) a lack of investors willing to take risk and
prioritize social impact, rather than expecting commercial returns on all social impact investments.
25I M P A C T I N V E S T I N G T R E N D S
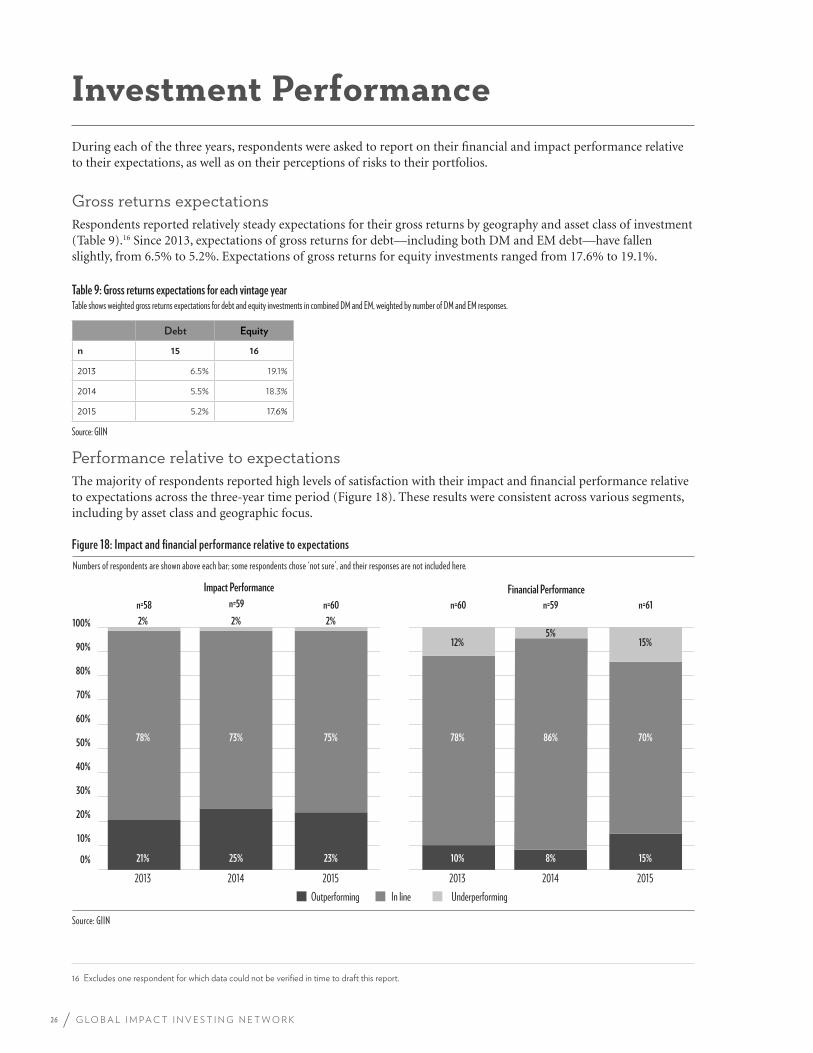
Investment Performance During each of the three years, respondents were asked to report on their financial and impact performance relative to their expectations, as well as on their perceptions of risks to their portfolios.
Gross returns expectationsRespondents reported relatively steady expectations for their gross returns by geography and asset class of investment (Table 9).16 Since 2013, expectations of gross returns for debt—including both DM and EM debt—have fallen slightly, from 6.5% to 5.2%. Expectations of gross returns for equity investments ranged from 17.6% to 19.1%.
Table 9: Gross returns expectations for each vintage yearTable shows weighted gross returns expectations for debt and equity investments in combined DM and EM, weighted by number of DM and EM responses.
Debt Equity
n 15 16
2013 6.5% 19.1%
2014 5.5% 18.3%
2015 5.2% 17.6%
Source: GIIN
Performance relative to expectationsThe majority of respondents reported high levels of satisfaction with their impact and financial performance relative to expectations across the three-year time period (Figure 18). These results were consistent across various segments, including by asset class and geographic focus.
Figure 18: Impact and financial performance relative to expectations
Source: GIIN
0%
10%
20%
30%
40%
50%
60%
70%
80%
90%
100%
Outperforming In line Underperforming
21% 25% 23%
78% 73% 75%
2% 2% 2%
2013 2014 2015
10% 8% 15%
78% 86% 70%
12% 5%
15%
2013 2014 2015
n=58 n=59 n=61n=60n=60n=59
Impact Performance Financial Performance
Numbers of respondents are shown above each bar; some respondents chose ‘not sure’, and their responses are not included here.
16 Excludes one respondent for which data could not be verified in time to draft this report.
26 G L O B A L I M P A C T I N V E S T I N G N E T W O R K
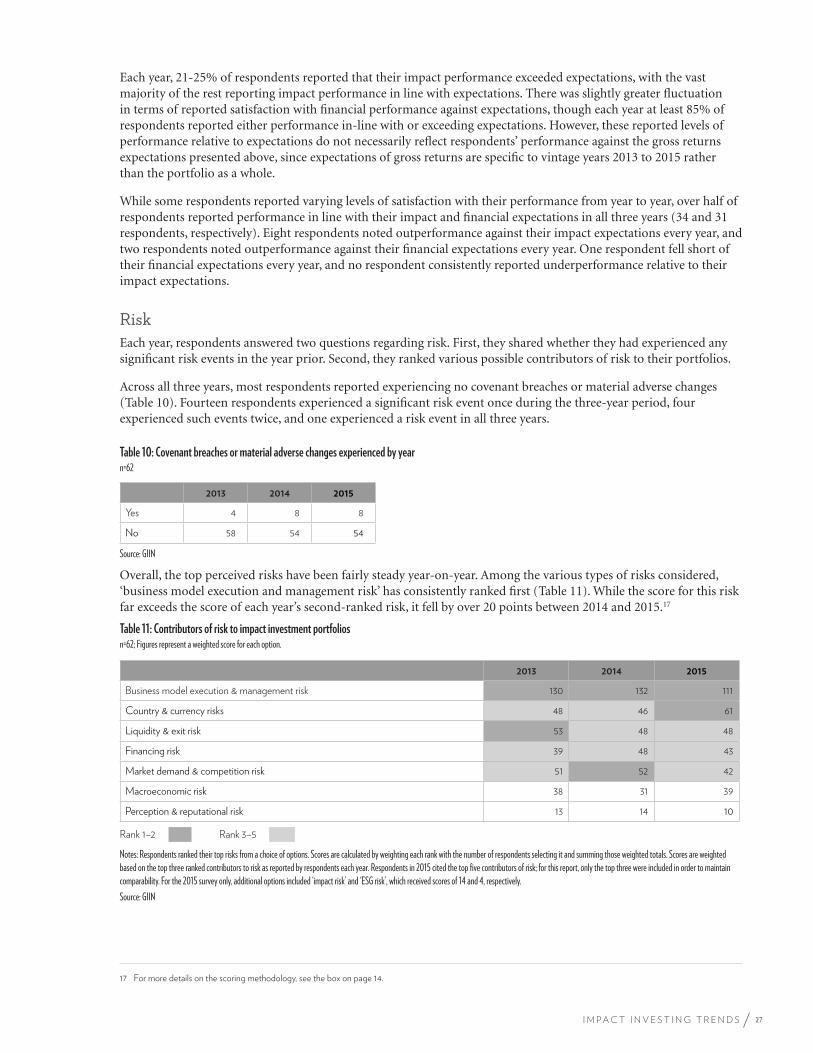
Each year, 21-25% of respondents reported that their impact performance exceeded expectations, with the vast majority of the rest reporting impact performance in line with expectations. There was slightly greater fluctuation in terms of reported satisfaction with financial performance against expectations, though each year at least 85% of respondents reported either performance in-line with or exceeding expectations. However, these reported levels of performance relative to expectations do not necessarily reflect respondents’ performance against the gross returns expectations presented above, since expectations of gross returns are specific to vintage years 2013 to 2015 rather than the portfolio as a whole.
While some respondents reported varying levels of satisfaction with their performance from year to year, over half of respondents reported performance in line with their impact and financial expectations in all three years (34 and 31 respondents, respectively). Eight respondents noted outperformance against their impact expectations every year, and two respondents noted outperformance against their financial expectations every year. One respondent fell short of their financial expectations every year, and no respondent consistently reported underperformance relative to their impact expectations.
RiskEach year, respondents answered two questions regarding risk. First, they shared whether they had experienced any significant risk events in the year prior. Second, they ranked various possible contributors of risk to their portfolios.
Across all three years, most respondents reported experiencing no covenant breaches or material adverse changes (Table 10). Fourteen respondents experienced a significant risk event once during the three-year period, four experienced such events twice, and one experienced a risk event in all three years.
Table 10: Covenant breaches or material adverse changes experienced by yearn=62
2013 2014 2015
Yes 4 8 8
No 58 54 54
Source: GIIN
Overall, the top perceived risks have been fairly steady year-on-year. Among the various types of risks considered, ‘business model execution and management risk’ has consistently ranked first (Table 11). While the score for this risk far exceeds the score of each year’s second-ranked risk, it fell by over 20 points between 2014 and 2015.17
Table 11: Contributors of risk to impact investment portfoliosn=62; Figures represent a weighted score for each option.
2013 2014 2015
Business model execution & management risk 130 132 111
Country & currency risks 48 46 61
Liquidity & exit risk 53 48 48
Financing risk 39 48 43
Market demand & competition risk 51 52 42
Macroeconomic risk 38 31 39
Perception & reputational risk 13 14 10
Rank 1–2 Rank 3–5
Notes: Respondents ranked their top risks from a choice of options. Scores are calculated by weighting each rank with the number of respondents selecting it and summing those weighted totals. Scores are weighted based on the top three ranked contributors to risk as reported by respondents each year. Respondents in 2015 cited the top five contributors of risk; for this report, only the top three were included in order to maintain comparability. For the 2015 survey only, additional options included ‘impact risk’ and ‘ESG risk’, which received scores of 14 and 4, respectively.Source: GIIN
17 For more details on the scoring methodology, see the box on page 14.
27I M P A C T I N V E S T I N G T R E N D S
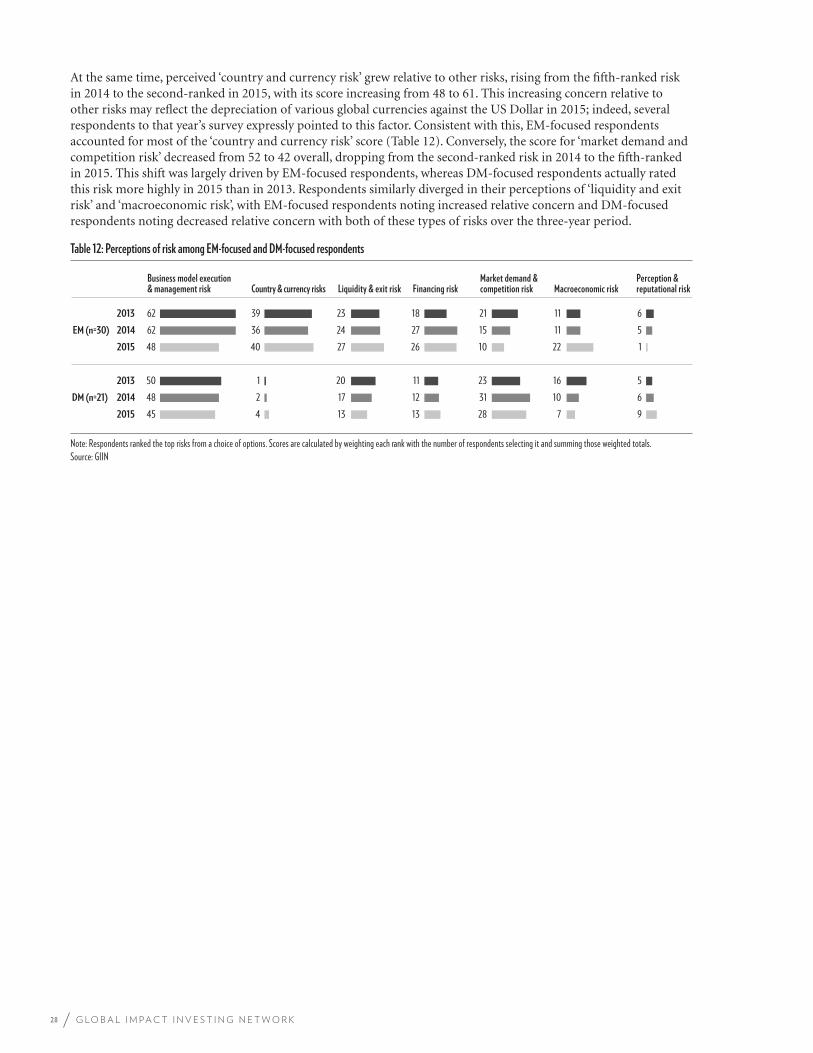
At the same time, perceived ‘country and currency risk’ grew relative to other risks, rising from the fifth-ranked risk in 2014 to the second-ranked in 2015, with its score increasing from 48 to 61. This increasing concern relative to other risks may reflect the depreciation of various global currencies against the US Dollar in 2015; indeed, several respondents to that year’s survey expressly pointed to this factor. Consistent with this, EM-focused respondents accounted for most of the ‘country and currency risk’ score (Table 12). Conversely, the score for ‘market demand and competition risk’ decreased from 52 to 42 overall, dropping from the second-ranked risk in 2014 to the fifth-ranked in 2015. This shift was largely driven by EM-focused respondents, whereas DM-focused respondents actually rated this risk more highly in 2015 than in 2013. Respondents similarly diverged in their perceptions of ‘liquidity and exit risk’ and ‘macroeconomic risk’, with EM-focused respondents noting increased relative concern and DM-focused respondents noting decreased relative concern with both of these types of risks over the three-year period.
Table 12: Perceptions of risk among EM-focused and DM-focused respondents
Note: Respondents ranked the top risks from a choice of options. Scores are calculated by weighting each rank with the number of respondents selecting it and summing those weighted totals.Source: GIIN
Business model execution & management risk Country & currency risks Liquidity & exit risk Financing risk
Market demand &competition risk Macroeconomic risk
Perception &reputational risk
2013 62 39 23 18 21 11 6
2014 62 36 24 27 15 11 5
2015 48 40 27 26 10 22 1
2013 50 1 20 11 23 16 5
2014 48 2 17 12 31 10 6
2015 45 4 13 13 28 7 9
EM (n=30)
DM (n=21)
28 G L O B A L I M P A C T I N V E S T I N G N E T W O R K
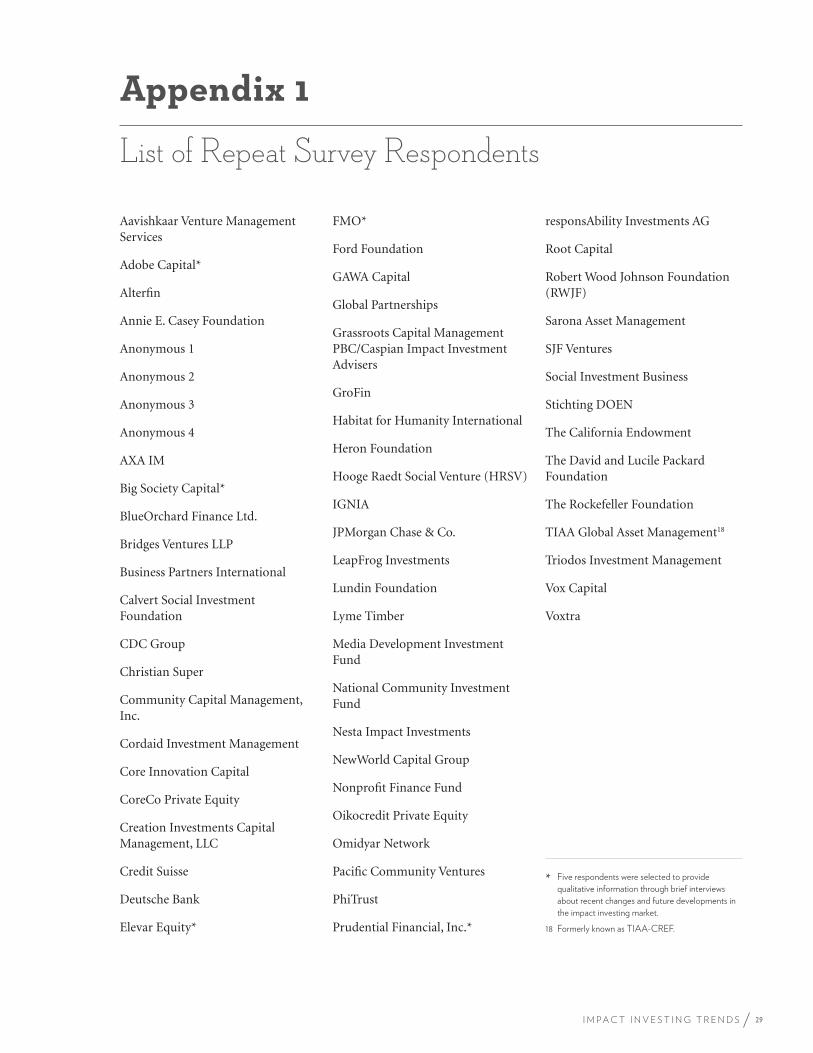
Aavishkaar Venture Management Services
Adobe Capital*
Alterfin
Annie E. Casey Foundation
Anonymous 1
Anonymous 2
Anonymous 3
Anonymous 4
AXA IM
Big Society Capital*
BlueOrchard Finance Ltd.
Bridges Ventures LLP
Business Partners International
Calvert Social Investment Foundation
CDC Group
Christian Super
Community Capital Management, Inc.
Cordaid Investment Management
Core Innovation Capital
CoreCo Private Equity
Creation Investments Capital Management, LLC
Credit Suisse
Deutsche Bank
Elevar Equity*
FMO*
Ford Foundation
GAWA Capital
Global Partnerships
Grassroots Capital Management PBC/Caspian Impact Investment Advisers
GroFin
Habitat for Humanity International
Heron Foundation
Hooge Raedt Social Venture (HRSV)
IGNIA
JPMorgan Chase & Co.
LeapFrog Investments
Lundin Foundation
Lyme Timber
Media Development Investment Fund
National Community Investment Fund
Nesta Impact Investments
NewWorld Capital Group
Nonprofit Finance Fund
Oikocredit Private Equity
Omidyar Network
Pacific Community Ventures
PhiTrust
Prudential Financial, Inc.*
responsAbility Investments AG
Root Capital
Robert Wood Johnson Foundation (RWJF)
Sarona Asset Management
SJF Ventures
Social Investment Business
Stichting DOEN
The California Endowment
The David and Lucile Packard Foundation
The Rockefeller Foundation
TIAA Global Asset Management18
Triodos Investment Management
Vox Capital
Voxtra
* Five respondents were selected to provide
qualitative information through brief interviews
about recent changes and future developments in
the impact investing market.
18 Formerly known as TIAA-CREF.
Appendix 1
List of Repeat Survey Respondents
29I M P A C T I N V E S T I N G T R E N D S
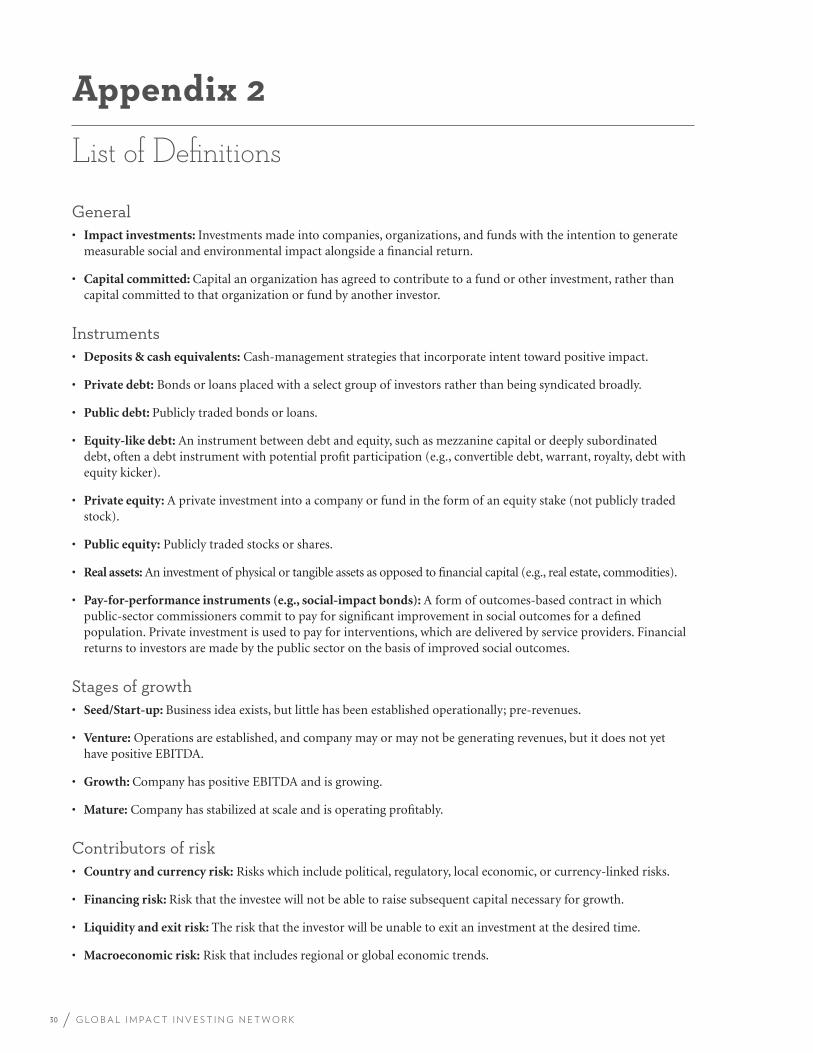
General• Impact investments: Investments made into companies, organizations, and funds with the intention to generate
measurable social and environmental impact alongside a financial return.
• Capital committed: Capital an organization has agreed to contribute to a fund or other investment, rather than capital committed to that organization or fund by another investor.
Instruments• Deposits & cash equivalents: Cash-management strategies that incorporate intent toward positive impact.
• Private debt: Bonds or loans placed with a select group of investors rather than being syndicated broadly.
• Public debt: Publicly traded bonds or loans.
• Equity-like debt: An instrument between debt and equity, such as mezzanine capital or deeply subordinated debt, often a debt instrument with potential profit participation (e.g., convertible debt, warrant, royalty, debt with equity kicker).
• Private equity: A private investment into a company or fund in the form of an equity stake (not publicly traded stock).
• Public equity: Publicly traded stocks or shares.
• Real assets: An investment of physical or tangible assets as opposed to financial capital (e.g., real estate, commodities).
• Pay-for-performance instruments (e.g., social-impact bonds): A form of outcomes-based contract in which public-sector commissioners commit to pay for significant improvement in social outcomes for a defined population. Private investment is used to pay for interventions, which are delivered by service providers. Financial returns to investors are made by the public sector on the basis of improved social outcomes.
Stages of growth• Seed/Start-up: Business idea exists, but little has been established operationally; pre-revenues.
• Venture: Operations are established, and company may or may not be generating revenues, but it does not yet have positive EBITDA.
• Growth: Company has positive EBITDA and is growing.
• Mature: Company has stabilized at scale and is operating profitably.
Contributors of risk• Country and currency risk: Risks which include political, regulatory, local economic, or currency-linked risks.
• Financing risk: Risk that the investee will not be able to raise subsequent capital necessary for growth.
• Liquidity and exit risk: The risk that the investor will be unable to exit an investment at the desired time.
• Macroeconomic risk: Risk that includes regional or global economic trends.
Appendix 2
List of Definitions
30 G L O B A L I M P A C T I N V E S T I N G N E T W O R K
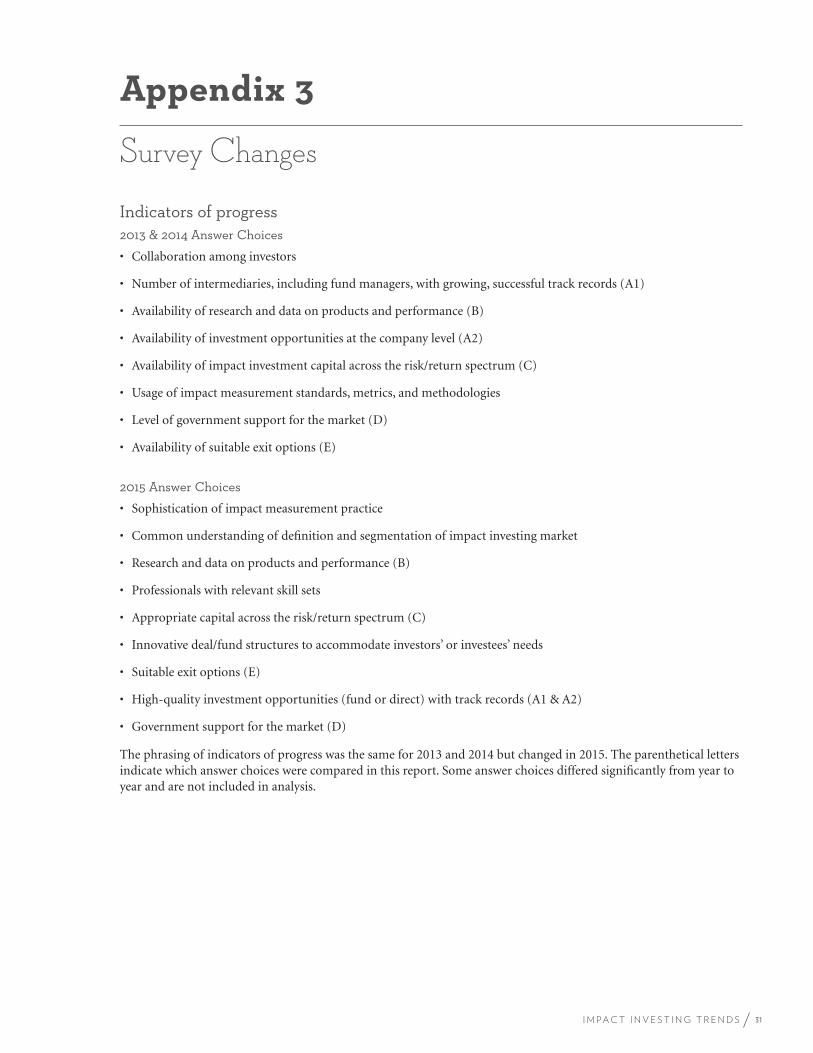
Indicators of progress2013 & 2014 Answer Choices
• Collaboration among investors
• Number of intermediaries, including fund managers, with growing, successful track records (A1)
• Availability of research and data on products and performance (B)
• Availability of investment opportunities at the company level (A2)
• Availability of impact investment capital across the risk/return spectrum (C)
• Usage of impact measurement standards, metrics, and methodologies
• Level of government support for the market (D)
• Availability of suitable exit options (E)
2015 Answer Choices
• Sophistication of impact measurement practice
• Common understanding of definition and segmentation of impact investing market
• Research and data on products and performance (B)
• Professionals with relevant skill sets
• Appropriate capital across the risk/return spectrum (C)
• Innovative deal/fund structures to accommodate investors’ or investees’ needs
• Suitable exit options (E)
• High-quality investment opportunities (fund or direct) with track records (A1 & A2)
• Government support for the market (D)
The phrasing of indicators of progress was the same for 2013 and 2014 but changed in 2015. The parenthetical letters indicate which answer choices were compared in this report. Some answer choices differed significantly from year to year and are not included in analysis.
Appendix 3
Survey Changes
31I M P A C T I N V E S T I N G T R E N D S
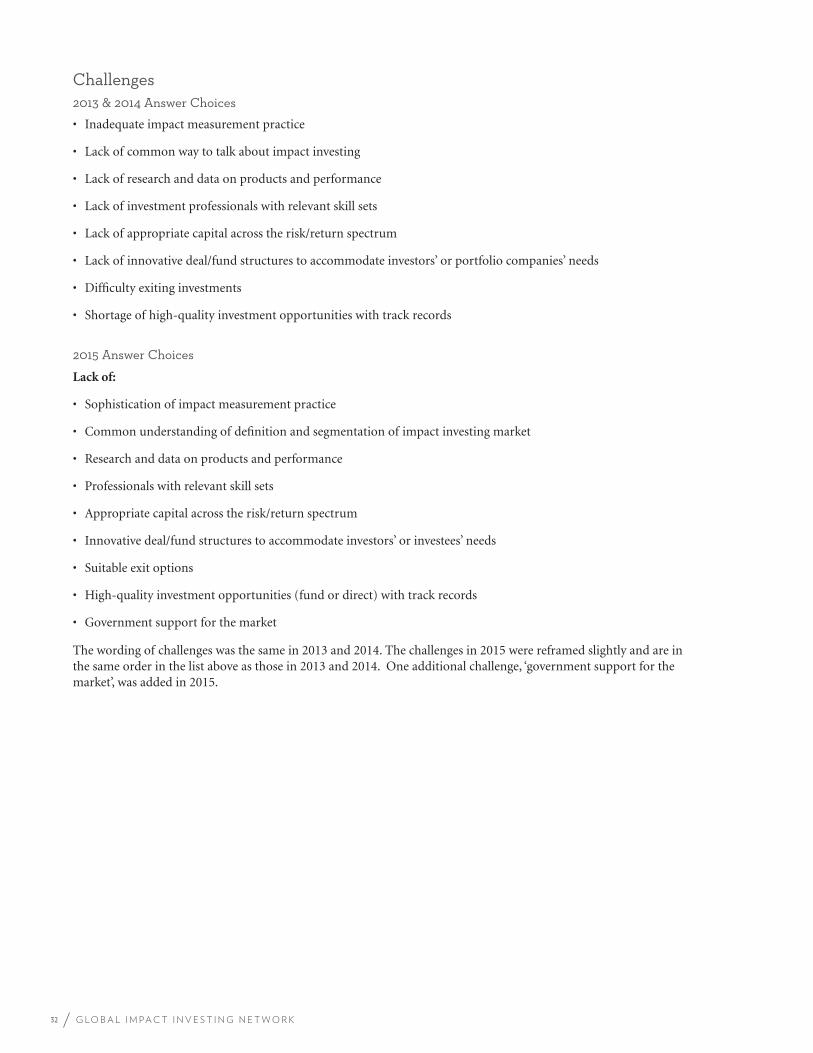
Challenges2013 & 2014 Answer Choices
• Inadequate impact measurement practice
• Lack of common way to talk about impact investing
• Lack of research and data on products and performance
• Lack of investment professionals with relevant skill sets
• Lack of appropriate capital across the risk/return spectrum
• Lack of innovative deal/fund structures to accommodate investors’ or portfolio companies’ needs
• Difficulty exiting investments
• Shortage of high-quality investment opportunities with track records
2015 Answer Choices
Lack of:
• Sophistication of impact measurement practice
• Common understanding of definition and segmentation of impact investing market
• Research and data on products and performance
• Professionals with relevant skill sets
• Appropriate capital across the risk/return spectrum
• Innovative deal/fund structures to accommodate investors’ or investees’ needs
• Suitable exit options
• High-quality investment opportunities (fund or direct) with track records
• Government support for the market
The wording of challenges was the same in 2013 and 2014. The challenges in 2015 were reframed slightly and are in the same order in the list above as those in 2013 and 2014. One additional challenge, ‘government support for the market’, was added in 2015.
32 G L O B A L I M P A C T I N V E S T I N G N E T W O R K
For more informationPlease contact Rachel Bass at [email protected] with any comments or questions about this report.
To download industry research by the GIIN and others, please visit www.thegiin.org/knowledge-center.
DisclosuresThe Global Impact Investing Network (“GIIN”) is a nonprofit 501c(3) organization dedicated to increasing the scale and effectiveness of impact investing. The GIIN builds critical infrastructure and supports activities, education, and research that help accelerate the development of a coherent impact investing industry.
Readers should be aware that the GIIN has had and will continue to have relationships with many of the organizations identified in this report, through some of which the GIIN has received and will continue to receive financial and other support.
The GIIN has collected data for this report that it believes to be accurate and reliable, but the GIIN does not make any warranty, express or implied, regarding any information, including warranties as to the accuracy, validity or completeness of the information.
This material is not intended as an offer, solicitation, or recommendation for the purchase or sale of any financial instrument or security.
More information about the Global Impact Investing NetworkThis brief is a publication of the Global Impact Investing Network (GIIN), the leading nonprofit organization dedicated to increasing the scale and effectiveness of impact investing. The GIIN builds critical market infrastructure and supports activities, education, and research that help accelerate the development of the impact investing field.
IRISIRIS is the catalog of generally-accepted performance metrics that leading impact investors use to measure social, environmental, and financial success, evaluate deals, and grow the credibility of the impact investing industry. iris.thegiin.org
ImpactBaseImpactBase is the searchable, online database of impact investment funds and products designed for investors. Fund or product profiles on ImpactBase gain exposure to the global impact investing community. impactbase.org
Fund Manager Training ProgramThe GIIN training program offers practical coursework to help fund managers build applied skills to successfully attract, deploy, and manage capital. thegiin.org/fund-manager-training
Career CenterThe GIIN Career Center is a source for job openings from members of the GIIN Investors’ Council and other impact investing leaders. jobs.thegiin.org
If your organization is interested in deepening its engagement with the impact investing market by joining a global community of like-minded peers, consider GIIN membership. To learn more about membership and to access interviews with leading impact investors, research from the field, and more examples of impact investments, visit www.thegiin.org.
33I M P A C T I N V E S T I N G T R E N D S

Global Impact Investing Network30 Broad Street38th FloorNew York, NY 10004 [email protected]
Impact Investing Private Equity Fund Industry
LEGAL CONSIDERATIONS
IN PARTNERSHIP WITH
IMPACT INVESTING PRIVATE EQUITY FUND INDUSTRY: LEGAL CONSIDERATIONS 2
AUTHORS
The primary authors of this report were Jennifer Bolton, Ilomai Kurrik, and Rebecca Pereira of Clifford Chance.
ADVISORS
We would also like to acknowledge the time and inputs of various advisors:
• Tae Ho Cho, Avrohom Gelber, and Craig Medwick of Clifford Chance
• Katerina Drisi and Heather Eisenlord of ISLP
• Amit Bouri, Jerome Tagger, and Abhilash Mudaliar of the GIIN
• Joshua Mintz, Vice President, and General Counsel for the MacArthur Foundation
ISLP The International Senior Lawyers Project (ISLP) provides the pro bono services of highly skilled and experienced lawyers to promote human rights, equitable and sustainable economic development, and the rule of law worldwide. ISLP assists governments, non-governmental organizations, and other institutions working to build legal capacity and to advance the rights and well-being of their citizens. For more information, please visit www.islp.org.
CLIFFORD CHANCE Clifford Chance is one of the world’s pre-eminent law firms, with resources across five continents. The firm’s clients include corporates from all the commercial and industrial sectors, governments, regulators, trade bodies, and not-for-profit organisations. Clifford Chance seeks to provide the highest-quality advice and legal insight, which combines the firm’s global standards with in-depth local expertise. For more information, please visit www.cliffordchance.com.
GIIN The Global Impact Investing Network is a not-for-profit organization dedicated to increasing the scale and effectiveness of impact investing. Impact investments are investments made into companies, organizations, and funds with the intention to generate measurable social and environmental impact alongside a financial return. For more information, please visit www.thegiin.org.
ACKNOWLEDGEMENTS

IMPACT INVESTING PRIVATE EQUITY FUND INDUSTRY: LEGAL CONSIDERATIONS 3
CONTENTS
FOREWORD ......................................................................................................... 4
1. INTRODUCTION ..............................................................................................5
2. FUND STRUCTURING ....................................................................................9
3. ECONOMIC TERMS ...................................................................................... 17
4. GOVERNANCE TERMS ............................................................................... 24
5. INFORMATIONAL NEEDS OF INVESTORS ............................................. 27
6. CONCLUSION ...............................................................................................30
APPENDIX A: GENERAL OVERVIEW OF THE
VARIETY OF FUND TYPES AND STRUCTURES ........................................ 32
APPENDIX B: KEY GOVERNANCE TERMS .................................................. 37
APPENDIX C: U.S. REGULATORY ISSUES .................................................... 45
APPENDIX D: GLOSSARY ................................................................................ 52

IMPACT INVESTING PRIVATE EQUITY FUND INDUSTRY: LEGAL CONSIDERATIONS 4
Dear reader,
The impact investing market is becoming increasingly prominent. Defined as investments made with the intention to generate social and environmental impact alongside a financial return, impact investments account for at least USD 46 billion assets under management, according to the GIIN and J.P. Morgan 2014 Impact Investor Survey.
Impact investing is unique in so far as it brings together investors that (a) pursue various return expectations (from concessionary to market rate), (b) have a range of risk appetites and (c) are of various legal forms (nonprofit and for-profit). Increasingly, these investors come together when investing in a pooled structure – a fund or vehicle managed by a fund manager.
In such an actively developing landscape, investors and their legal counsel would benefit from a better understanding of the various structural, tax, economic, and governance implications specific to this emerging practice. This brief, authored by the legal team at Clifford Chance, and supported by experts at the International Senior Lawyers Project, is a valuable ready reference that outlines legal issues for investors and advisors to consider when investing in impact investing funds.
The document, which focuses particularly on U.S. law and private equity fund regulation, is the culmination of months of meticulous research into existing legislation and real-world fund structures. While not a substitute for legal advice, it includes a range of general points and considerations that will be of value to for-profit and nonprofit investors as they explore making impact investments.
One of the many ways in which the GIIN pursues its mission of enhancing the scale and effectiveness of impact investing is through publishing research that bridges important information gaps in the market. In this spirit, we hope readers find the presented information useful, and thank our research partners at Clifford Chance and ISLP for their generous time and support in putting this document together.
Sincerely,
Amit Bouri CEO, Global Impact Investing Network
FOREWORD
IMPACT INVESTING PRIVATE EQUITY FUND INDUSTRY: LEGAL CONSIDERATIONS 5| INTRODUCTION
This briefing and related content relates to issues for both investors in and sponsors1 of impact investment funds when negotiating the terms of making an investment in an impact investment fund. The impact investing sector is highly varied, incorporating various asset classes and instruments, investors and investment vehicles based in numerous jurisdictions globally, as well as investors of varying types, from foundations to pension funds to DFIs. The focus of this brief is on investors in private equity funds. While the issues raised for consideration may be pertinent to many fund investors and fund sponsors throughout the impact investment sector, this brief primarily references concerns for U.S.-based investors and fund sponsors, and focuses specifically on U.S. regulations of private funds.
Impact investments are investments made with the intention of generating social and/or environmental impact, as well as a financial return to their investors. The impact investing sector is growing exponentially, reported at US$10.6 billion in new commitments in 20132 and a total of US$46 billion in impact investments under management in 20133 in a 2014 survey by J.P. Morgan and the GIIN of 125 impact investors managing at least US$10 million. One of the keys to such growth is a better understanding of both the tools used to make impact investments, particularly private equity funds (specifically, closed-end, blind-pool investment vehicles). Over a quarter of the new commitments reported in 2013, US$2.8 billion, was raised through funds.4 Funds reported managing US$16 billion in impact investments in 2013, over a third of total impact investments under management.5 Impact investment fundraising continues to be on the rise and provides strong potential for increased commitments from a broad range of investors.
Private equity funds globally have the potential to grow the impact investment industry more than other structures currently available to impact investors. The relative longevity of the private equity fund industry, and the standardization and regulation of such funds and fund managers (see Appendix C for an in-depth discussion of U.S. regulatory issues), offer some of the best means for unlocking capital to drive social impact. Moreover, private funds provide the means for impact investors to have the greatest impact, as the pooled capital can expand the financial
1 Bolded terms appear in the Glossary.2 Yasemin Saltuk et al, “Spotlight on the Market: The Impact Investor Survey,” J.P. Morgan (02 May 2014): 5,
accessed January 12, 2015, URL: http://www.thegiin.org/cgi-bin/iowa/resources/research/594.html.3 Ibid, p. 21.4 Ibid, p. 9.5 Ibid.
1. INTRODUCTION
IMPACT INVESTING PRIVATE EQUITY FUND INDUSTRY: LEGAL CONSIDERATIONS 6| INTRODUCTION
resources available to address the issue that the investor wishes to impact far greater than most single investors can on their own. Private impact funds that attract non-impact investors are particularly well-placed to do this, since they are able to further grow the pool of capital by which impact investors can see their goals achieved. Furthermore, private funds allow an investor to allocate its budget across a wide portfolio of impact investments, both within a single fund and by investing in multiple funds.
There is a broad range of investors making impact investments, including high net worth individuals, family offices, foundations, endowments, public and private pension plans, DFIs, other governmental or quasi-governmental organizations (such as the IFC of the World Bank), funds-of-funds, insurance companies, and other institutional investors. Not all investors have clarity as to what their fellow investors’ goals are in making impact investments. Though investors may meet at the annual meeting typically held by a fund after they have closed on their investment into the fund, at the point of negotiating the terms of a fund, prior to closing a fund investment, potential fund investors often operate in a vacuum, communicating only with the fund manager and not the other investors or potential investors.
This lack of clarity, combined with the perception of some investors that their fellow investors may have competing goals in making impact investments, may lead to hesitation among certain investors about the impact investing industry or about using private fund vehicles in order to make impact investments. Some industry participants may be concerned that investors have competing aspirations in making impact investments, because they perceive certain investors as being either “impact first” or “finance first” investors. But investors of all stripes may have both financial and non-financial objectives; impact investors and non-impact investors alike may be non-profit or for-profit. Understanding the similarities and differences between various investors’ goals and concerns in investing in private funds is key for the growth of the impact investing industry as a whole, and investors and fund managers alike should strive for such understanding. The focus of this briefing will be on providing that understanding, primarily with respect to investors and funds based in the U.S.
Of course, not all investors, even within the same category or classification, have the same goals or needs when investing in private funds. This is the nature of private equity funds: they are constantly evolving to grow, leverage, or improve different industries, geographical regions, or financial structures that could be sources of profit to investors, and institutional investors frequently reevaluate their investment policies to seek out different opportunities offered by the wide array of private equity fund managers. But investors are themselves pushing to be considered in the aggregate in fund negotiations and are finding strength in numbers.
For much of the 2000s, private fund investors (or as they are often referred to in the industry, “LPs,” i.e., limited partners, because the structure of their investment is typically as a limited partner in a limited partnership vehicle) operated in a vacuum when investing in private equity funds. Although an institutional investor committing
Investors of all stripes may have both financial and non-financial objectives...
Not all investors, even within the same category or classification, have the same goals or needs when investing in private funds...
IMPACT INVESTING PRIVATE EQUITY FUND INDUSTRY: LEGAL CONSIDERATIONS 7| INTRODUCTION
a significant percentage of a fund’s target size, anchoring an emerging manager’s fund or serving some other strategic purpose of a fund manager would have greater negotiating power, smaller investors found that, other than on the margins, fund terms were often “take it or leave it,” especially in the most highly sought after funds.
Following the global financial crisis and the plummeting of investment in private equity funds, certain private fund investors saw an opportunity to press for standards on economic, governance, and information-sharing terms and conditions of funds and established the Institutional Limited Partner Association, a trade organization of institutional investors in private equity funds (ILPA). It released the ILPA Principles, a description of standards for key terms in private equity funds that are generally desirable from an investor’s perspective. Thus, institutional investors became more of a force to be reckoned with and, although the best-performing fund managers continued to attract capital without changing their fund terms, most fund managers increasingly catered to prospective investors.
So in the past decade or more, the pendulum has swung from being somewhat investor-friendly following the tech crash of the early 2000s to being heavily fund sponsor-favorable during the economic boom years to being more investor-friendly again following the global fiscal crisis. The private equity fund industry has benefitted as a result of this evolution, with fund terms becoming increasingly more sophisticated and nuanced with each shift. Moreover, government-imposed regulatory schemes in both the U.S. and the European Union have been on the increase in recent years, ostensibly to provide for greater protection of investors, such as through the provision of better and increased information to investors from fund managers.
Similar to the effect that greater LP unity has had on the alternative fund industry generally, GIIN believes the industry as a whole can benefit if fund managers and investors alike strive to understand other investors’ needs and concerns when investing in private impact investment funds. Public and private pension funds have long dominated the LP universe, but investors such as private foundations and DFIs are a significant presence in private impact investment funds. Appreciating how various investors’ investing goals are both similar and different may be one of the keys to keeping the industry developing and thriving as a whole.
All investors typically have a similar basic approach to investing in private investment funds. Initially attracted to a potential investment based on a variety of factors, including the track record of the fund manager and the fund’s investment sector, strategy, and geographical focus, all investors will want to ensure that the fund is structured in such a way as to provide for limited liability and optimal tax outcome. All investors will also focus on the fees to be paid by the fund’s investors to the fund manager and on the share of the investors’ profits to be allocated to the fund’s general partner. When generally satisfied with the economic terms, most institutional investors will then ensure that the fund’s governance terms and information rights provided to investors are satisfactory. An investor may withdraw from its consideration of the investment at any point during this process, but rarely does an investor do so purely as a result of an impasse on governance and
The pendulum has swung from being somewhat investor-friendly following the tech crash of the early 2000s, to being heavily fund sponsor-favorable during the economic boom years, to being more investor-friendly again following the global fiscal crisis...
IMPACT INVESTING PRIVATE EQUITY FUND INDUSTRY: LEGAL CONSIDERATIONS 8| INTRODUCTION
transparency issues.
This is not to say that governance and transparency issues are minor elements of a private fund for investors. Even without a particular term, some investors might be able to take a more holistic view and weigh the risks involved, appreciating that it is content with the terms of the investment. But this approach is frequently not possible for other investors, who cannot take such risks and who must ensure that their standards are met with each investment. Certain non-economic parameters may be so fundamental to investors, having been built into the investor’s charter or otherwise being part and parcel of the investor’s permitted investment thesis, that no balancing of overall terms can satisfy that particular need. For example, non-profit and for-profit investors alike may have adopted the United Nations-backed Principles for Responsible Investments (UNPRI), which are voluntary and aspirational actions for incorporating environmental, social, and corporate governance (“ESG”) issues into investment practices across asset classes. Some investors who have adopted UNPRI may have a “best efforts” standard. Thus, they may be satisfied that the fund investment comports with the investor’s investment parameters even without the fund’s adoption of UNPRI because the investor used its best efforts to cause the fund to adopt UNPRI. Other investors may not have such flexibility. Fund managers—particularly emerging fund managers—may be unaware (and therefore frustrated) that certain investors cannot trade points the way that others sometimes can. Negotiations between investors and funds can suffer as a result, though outside legal counsel can greatly assist in smoothing the way.
IMPACT INVESTING PRIVATE EQUITY FUND INDUSTRY: LEGAL CONSIDERATIONS 9| FUND STRUCTURING
Having performed the necessary initial due diligence to determine that it may wish to invest in a particular fund, whether an impact investing fund or otherwise, an institutional investor will wish to review the fund structure in order to ensure the jurisdiction of the organization of the fund (or any parallel or feeder investment vehicle being offered for investment by the investor) provides for limited liability and an optimal tax result.
LIMITED LIABILITY
Fund sponsors generally set up their funds with both the investors and the investments in mind. A fund making its investments predominantly in one country may initially consider having its fund vehicles set up in such country, or if not there, then wherever the office of the fund manager is located, in part due to familiarity with such jurisdictions and so as to minimize the legal jurisdictions applicable to deals done by the fund. But some such jurisdictions may not have a developed private fund industry that can provide the fund with clarity on how it would be treated for legal purposes. In particular, investors may not be treated as having the limited liability that they need. Whether located themselves inside or outside of the U.S., fund sponsors particularly catering to U.S. investors might set up a Delaware vehicle (typically a limited partnership) for U.S.-taxable investors and a non-U.S. vehicle for non-U.S. investors and U.S. tax-exempt investors. The non-U.S. vehicle might be set up in the closest possible time zone, such as the Cayman Islands, or if the fund anticipates having a lot of investors in other time zones, in one of multiple jurisdictions in such time zones. Numerous jurisdictions globally provide for limited liability status to passive investors in privately offered investment vehicles, but jurisdictions can vary in approach as to how much a passive investor might engage in fund governance before they are deemed to be participating in the management of the fund and thus lose their limited liability status. Delaware is one of the most clear as far as not ascribing general liability to investors, notwithstanding limited partners’ veto rights over certain investments or participation on advisory committees that have the power to approve certain investments and conflicts of interest; this is one of the reasons it is a popular choice of investment vehicle for funds with a U.S. nexus.
2. FUND STRUCTURING
IMPACT INVESTING PRIVATE EQUITY FUND INDUSTRY: LEGAL CONSIDERATIONS 10| FUND STRUCTURING
TAX
Fund sponsors will also seek to set up their fund, or their multiple parallel and feeder vehicles comprising the aggregate fund, with the tax status of their potential investors in mind. While generally investors that are U.S. taxpayers and those that are treated as tax-exempt for U.S. federal income tax purposes will seek a market return on their investment, specific classes of investors are subject to special U.S. tax rules that may impact the type of investments they may make.
a. U.S. Tax-exempt Investors
Unrelated Business Taxable Income: Generally, U.S. investors that are exempt from taxation (“U.S. tax-exempt investors”) under Section 501 of the U.S. Internal Revenue Code of 1986, as amended (the “Code”), including private foundations, prefer to invest through investment vehicles that are treated as corporations for U.S. federal income tax purposes to minimize the risk of recognizing “unrelated business taxable income” (“UBTI”). Some U.S. tax-exempt investors will manage this risk through internal structuring, but many expect that a fund will provide a feeder fund or some other “blocker” entity for the benefit of U.S. tax-exempt investors. Other U.S. tax-exempt investors are willing to recognize UBTI if they determine that investing in a feeder fund or “blocker” entity would otherwise result in a lower economic return.
A U.S. tax-exempt investor generally will be exempt from U.S. federal income tax on its income and gains. However, this general exemption from tax does not apply to UBTI of a U.S. tax-exempt investor. Generally, UBTI includes income or gain derived from a trade or business (other than a trade or business of trading in securities) the conduct of which is substantially unrelated to the exercise or performance of the U.S. tax-exempt investor’s exempt purpose or function. UBTI also includes (i) income or gain derived by such an unrelated trade or business conducted through an entity treated as fiscally transparent for U.S. federal income tax purposes, (ii) income derived by a U.S. tax-exempt investor from debt-financed property and (ii) gains derived by a U.S. tax-exempt investor from the disposition of debt-financed property.
By investing through a corporation, a U.S. tax-exempt investor’s income derived from an investment should be limited to dividends and gain and should not be treated as UBTI, except to the extent the U.S. tax-exempt investor incurs indebtedness to acquire or own its interest in the corporation. It should be noted that an investment in a non-U.S. corporation that is treated as a “passive
foreign investment company” (a “PFIC”), however, could result in materially adverse tax consequences to a U.S. investor (as discussed further below). But unless dividends paid by a PFIC that are allocated to a U.S. tax-exempt investor are characterized as UBTI, the PFIC rules will not apply to a U.S. tax-exempt investor’s investment in such a PFIC.
U.S. investors that are exempt from taxation prefer to invest through investment vehicles that are treated as corporations for U.S. federal income tax purposes...
IMPACT INVESTING PRIVATE EQUITY FUND INDUSTRY: LEGAL CONSIDERATIONS 11| FUND STRUCTURING
b. U.S. Tax-exempt Investors: Private Foundations
Program Related Investments: Private foundations, a special class of tax-exempt organizations under Section 501(c)(3) of the Code (“501(c)(3)
organizations”), can “invest” in both other 501(c)(3) organizations and for-profit organizations. To avoid the imposition of excise taxes, however, private foundations need to avoid making investments that will jeopardize their ability in both the short and long term to fulfill their charitable purpose, so called “jeopardizing investments.” If a private foundation makes an investment that is a jeopardizing investment, but it does not qualify as a “program related
investment” (a “PRI,” as defined below), the private foundation is subject to a 10% excise tax on the amount of the investment. An additional 10% excise tax may be imposed on the manager of the private foundation if the manager has knowledge that the investment jeopardizes the private foundation’s ability to fulfill its charitable purpose. An exception to the jeopardizing rules are investments known as PRIs.
PRIs must meet the following requirements:
• The primary purpose of the investment is to accomplish one or more exempt purposes of the foundation.
• Production of income or appreciation of property is not a significant purpose of the investment.
• No lobbying activity will be supported.
i. Primary purpose of the investment
A private foundation must carefully review its organizational documents and investment restrictions to determine the scope of its exempt purposes and whether a PRI is consistent with such purposes. While a private foundation can make a PRI in a for-profit organization, the private foundation must ensure that an investment significantly furthers the accomplishment of its exempt activities (other than through the generation of income to be used by the foundation for its exempt purposes) and that the investment would not have been made but for the relationship between the investment and the accomplishment of the foundation’s exempt activities. For example, a private foundation whose goal is to promote a society of economically independent and engaged citizens who contribute to the improvement of their communities through programs that advance education and entrepreneurship should be able to invest in a for-profit fund that is organized for the purpose of investing in businesses in low-income communities owned or controlled by members of a minority or other disadvantaged group. An investment by the same private foundation in a for-profit fund that is organized to conserve ecologically valuable forestland, however, would not qualify as a PRI for that private foundation because the fund would not help the foundation achieve one of its charitable purposes.
While a private foundation can make a PRI in a for-profit organization, the private foundation must ensure that an investment significantly furthers the accomplishment of its exempt activities...
IMPACT INVESTING PRIVATE EQUITY FUND INDUSTRY: LEGAL CONSIDERATIONS 12| FUND STRUCTURING
Additionally, if a private foundation has broad exempt purposes, it will have greater flexibility in making PRIs, while a private foundation with a narrow exempt purpose will be subject to greater restrictions in making PRIs. For example, a private foundation that has a broad exempt purpose of scientific research may be able to make a PRI in a program aimed at discovering the cure for a specific disease and a PRI in a program aimed at aiding in the scientific education of college students; but, a private foundation with an exempt purpose of finding the cure for a specific disease generally will only be able to invest in a program aimed at discovering the cure for that specific disease.
ii. Production of income or appreciation of property is not a
significant purpose
In order to satisfy the requirement that no significant purpose of the foundation’s investment be to generate financial return, private foundations often take the view that their investment must generate little to no return. Guidance from the U.S. Internal Revenue Service (the “IRS”) suggests that this requirement will be satisfied if, at the time the investment was made, the intent to produce income or to recognize appreciation did not constitute a significant reason for the private foundation making the investment. The fact that an investment subsequently generates market or above-market returns will not, on its own, prevent an investment from being treated as a PRI. There are no clear guidelines on how much return an investment can make yet still qualify to be treated as a PRI, and private foundations must carefully consider each investment. An important factor that is relevant to the determination of whether a significant purpose of an investment is to generate financial return is whether an investor investing solely for profit would make the investment on the same terms as the private foundation.
To minimize the risk of making a jeopardizing investment, private foundations generally seek to make investments that have returns significantly lower than returns generated by investments made by an investor solely seeking profit, and some funds will structure a private foundation’s interest in a manner that will cap or limit a private foundation’s return on its investment in some other way. For example, PRIs often take the form of loans bearing interest at below market rates. Private foundations may also consider making investments in hybrid corporations, such as L3Cs, which are organized and operate within the standards for PRIs (discussed further below).
iii. Changes in an investment
Generally, a foundation determines whether an investment qualifies as a PRI based on the facts and circumstances at the time the investment is made and not based on later developments.Once a foundation determines that an investment is a PRI, subject to review by the IRS, the investment
An important factor that is relevant to the determination of whether a significant purpose of an investment is to generate financial return is whether an investor investing solely for profit would make the investment on the same terms as the private foundation.

IMPACT INVESTING PRIVATE EQUITY FUND INDUSTRY: LEGAL CONSIDERATIONS 13| FUND STRUCTURING
will continue to be treated as a PRI if changes to the form or terms of an investment are made primarily for exempt purposes and not for any significant purpose involving the production of income or the appreciation of property. Generally, a change in the form or terms of an investment for the protection of the private foundation’s investment will not cause the investment to cease to qualify as a PRI. A PRI may cease to be treated as such because of a “critical change in circumstances,” such as serving an illegal purpose or a private purpose of the private foundation or its managers. If an investment ceases to be treated as a PRI, a determination would then be made as to whether the investment is a “jeopardizing investment.” Private foundations should also consider whether a PRI continues to serve one of its exempt purposes after a change in the mission of the PRI.
iv. Proposed Treasury Regulations
In 2012, proposed Treasury Regulations were published providing additional examples of investments that qualify as PRIs. These new examples clarify that:
(i) An activity conducted in a foreign country furthers a charitable purpose if the same activity would further a charitable purpose if conducted in the United States.
(ii) The charitable purposes served by a PRI are not limited to serving economically disadvantaged individuals and deteriorated urban areas.
(iii) An investment can qualify as a PRI if the investment is made in persons that do not themselves qualify for assistance from the private foundation, but which serve as the instrument by which a private foundation’s purpose is accomplished.
(iv) The presence of a potential for a high rate of return should not, by itself, prevent an investment from qualifying as a PRI (e.g., an equity investment in a recycling company that could prevent pollution in a developing country can qualify as a PRI even if there is a high risk associated with the investment and a potential for a high rate of return if the company is successful).
(v) PRIs can take the form of loans with an “equity kicker” (e.g., a loan to a company coupled with stock to induce the private foundation to make the loan), a loan guarantee or a guarantee and reimbursement arrangement.
Excess Business Holdings: Private foundations generally seek to avoid having “excess business holdings” because excess business holdings are subject to a 10% excise tax. Generally, an excess business holding is the portion of a private foundation’s investment in a corporation or other entity conducting a business that is not substantially related to the exempt
Generally, a foundation determines whether an investment qualifies as a PRI based on the facts and circumstances at the time the investment is made and not based on later developments...
IMPACT INVESTING PRIVATE EQUITY FUND INDUSTRY: LEGAL CONSIDERATIONS 14| FUND STRUCTURING
purposes of the private foundation and exceeds 20% of the voting power of such a corporation (or 20% of the beneficial or profits interests in such an unincorporated entity).
The excess business holding rules are not applicable to PRIs. Additionally, the excess business holding rules generally are not applicable to investments in entities that derive more than 95% of their gross income from passive sources. For these purposes, passive income generally includes dividends, interest, payments with respect to securities loans, annuities, royalties, certain rents and capital gains, and certain income from the sale of goods (if the seller of such goods does not manufacture, produce, physically receive, or deliver, negotiate the sale of, or maintain inventories in such goods).
c. U.S. Taxable Investors
Philanthropic Investments: A U.S. taxpayer looking to “invest” its money in organizations that generate positive social or environmental impact is faced with a threshold question from a U.S. tax perspective: whether to donate its money via a charitable contribution to an organization that qualifies as a 501(c)(3) organization, for which the U.S. taxpayer generally should be able to take a deduction for U.S. federal income tax purposes, or to invest in a fund that allows the taxpayer to receive a return on its investment, for which the U.S. taxpayer cannot take a deduction for U.S. federal income tax purposes.
While several states are creating new hybrid organizations including L3Cs (Low-
profit Limited Liability Companies), Benefit Corporations, and Flexible
Purpose Corporations that allow an organization to both have a philanthropic purpose and to generate a return to investors, the U.S. tax rules do not yet recognize these organizations as tax-exempt. Like an investment in a fund organized solely to generate profit, a U.S. taxpayer is not entitled to a deduction for U.S. federal income tax purposes for amounts invested in such a hybrid organization, even if the investor’s expected return from its investment is below market because of the fund’s emphasis on a social or environmental mission.
Investments in Fiscally Transparent Entities: Unlike U.S. tax-exempt investors, U.S. taxable investors generally prefer to invest in investment vehicles that are fiscally transparent for U.S. federal income tax purposes. Generally, an entity that is fiscally transparent for U.S. federal income tax purposes is an entity that is not subject to tax itself in the United States and would not be if it earned U.S. source income; rather, the income, losses, credits, and deductions of the entity flow through to, and are included in the income of, the equity investors in the entity. Fiscally transparent entities will also not be classified as PFICs or “controlled foreign corporations” (“CFCs”), each as described below, with respect to a U.S. taxable investor; however, U.S. investors will be subject to the PFIC and CFC regimes with respect to PFICs or CFCs held indirectly through a fiscally transparent entity.
IMPACT INVESTING PRIVATE EQUITY FUND INDUSTRY: LEGAL CONSIDERATIONS 15| FUND STRUCTURING
Passive Foreign Investment Companies: In general, a non-U.S. entity classified for U.S. federal income tax purposes as a corporation will be treated as a PFIC if it meets either of the following tests for any taxable year: (1) 75% or more of its gross income is “passive income,” or (2) 50% or more of its assets, based on their average value for the year, are held for the production of passive income. For these purposes, “passive income” generally includes, among other things, dividends, interest, rents and royalties not treated as earned in connection with the active conduct of a trade or business, and gains from the disposition of assets producing passive income. Certain distributions received from, and dispositions of the stock of, a PFIC could be subject to materially greater amounts of tax in the hands of a U.S. taxable investor than a comparable investment in a non-PFIC.
Investors may be able to make certain elections that could result in different tax results; however, these elections generally require either that the PFIC be publicly traded or that the PFIC provides certain information regarding its income and assets in each taxable year. U.S. taxable investors often request assurances from a fund that it will undertake to obtain the relevant information to allow a U.S. taxable investor to make such an election. However, the ability of a fund to obtain the relevant information from a portfolio company often depends on the level of control the fund has over the specific PFIC and the cost of preparing such information.
Regardless of whether any of the foregoing elections are made, an investor in a PFIC will also be required to report additional information regarding the nature of its investment in a PFIC to the IRS and U.S. taxable investors will often request assurances from a fund that it will undertake to provide the relevant information to allow the investor to comply with such reporting requirements.
Controlled Foreign Corporations: Generally, a non-U.S. entity classified as a corporation for U.S. federal income tax purposes will be classified as a CFC if greater than 50% of the total vote or value of the non-U.S. corporation is owned (applying certain attribution rules), in the aggregate, by U.S. shareholders that each own (in each case, applying certain attribution rules) 10% or more of the total combined voting power of all classes of stock of such corporation. Such 10% U.S. shareholders (that are U.S. taxable investors) will be required to include certain items in taxable income prior to the receipt of distributions. Gain from the sale of stock of a CFC will also be treated as ordinary income, and not capital gain.
An investor in a CFC will also be required to report additional information regarding the nature of its investment in a CFC to the IRS, and U.S. taxable investors will often request assurances from a fund that it will undertake to provide the relevant information to allow the investor to comply with such reporting requirements.

IMPACT INVESTING PRIVATE EQUITY FUND INDUSTRY: LEGAL CONSIDERATIONS 16| FUND STRUCTURING
Other Sources of Phantom Income: In addition to the rules regarding PFICs and CFCs, certain other investments could cause U.S. taxable investors to recognize phantom income (i.e., the recognition of income without the contemporaneous receipt of cash sufficient to pay the corresponding tax liability). Investments directly (or indirectly through a fiscally transparent entity) in certain types of debt instruments (e.g., investments in debt instruments with interest holidays, discount securities, and payment in kind securities) could result in the recognition of phantom income.
IMPACT INVESTING PRIVATE EQUITY FUND INDUSTRY: LEGAL CONSIDERATIONS 17| ECONOMIC TERMS
In addition to considering the jurisdiction of the organization of the fund and the necessary structuring for the best tax result for the investor, all types of investors will review the key economic terms of the fund. The economic terms establish the balance between risk and reward that is perceived to drive the fund towards successful investments and divestments. The following provides a brief overview of the typical terms or ranges of terms that may be found in fund documentation and the concerns investors may have regarding such economic terms. The approach to these terms does not, as a general matter, vary between non-profit and for-profit investors (other than as noted above for private foundations seeking to make program-related investments).
DISTRIBUTIONS
a. Distribution Waterfall: In setting out the agreed-on economic arrangement between the sponsor and the investors in a customary private equity fund, a distribution waterfall provides that the income and capital proceeds from investments allocated to each investor are split between the fund sponsor (or more specifically, typically either the general partner of the limited partnership that forms the fund or else an affiliate of the general partner that is a “special
limited partner,” sometimes referred to as the “carried interest partner”) and the investor in an order of tiered priority. Unlike hedge funds, which pay the sponsor an “incentive allocation” (or “performance fee”) on a periodic basis subject to a “high water mark” test, private equity funds generally distribute excess cash (net of fund-level expenses, liabilities, and other required reserves) as it is generated, with the lion’s share being payable only upon the liquidation of an investment. At each tier of the waterfall, distributions are made in a specific ratio between the investor and the sponsor until either: (a) that tier is satisfied and the next tier is reached, or (b) the fund is wound up and the remaining assets distributed in a manner that reflects the agreed-on economics. Any amount of an investor’s allocation distributed to the fund sponsor is referred to as the “carried interest” or simply “carry.”
There are typically two types of distribution waterfalls, the whole fund (or return of capital) waterfall and the deal-by-deal (or investment-by-
investment) waterfall:
3. ECONOMIC TERMS
IMPACT INVESTING PRIVATE EQUITY FUND INDUSTRY: LEGAL CONSIDERATIONS 18| ECONOMIC TERMS
“Whole Fund” Waterfall: In a whole fund waterfall, all capital contributions of investors and a preferred return thereon are distributed to investors before the fund sponsor begins to participate in any of the carried interest. This is by far the preferred structure of investors.
“Deal-by-Deal” Waterfall: In a deal-by-deal waterfall, only the capital in respect of realized deals is returned to limited partners at each distribution and, after the preferred return thereon is distributed to the limited partners, the general partner receives any carry. Fund sponsors prefer this type of waterfall as it accelerates the receipt of carried interest. Because distribution of carried interest is accelerated, investors must be certain to have “clawback” rights through which they can require fund sponsors to return distributions of carried interest if, and to the extent that, when calculating the fund’s aggregate profit the sponsor receives a greater proportion of profits to which it would otherwise be entitled (discussed further below).
i. Preferred Return/Hurdle Rate: Whatever the waterfall’s structure, the first step of the waterfall is typically the preferred return (although this is sometimes swapped with the “return of capital step”). The preferred return is the minimum return that must be received by an investor before any carry is paid to the fund manager. Preferred returns encourage fund managers to attain higher returns and force them to forgo compensation for returns at or below the threshold. The amount of the preferred return can vary from fund to fund, asset class to asset class, and year to year, but 8% is a figure commonly seen in private equity fund documentation. Preferred returns are a common feature of carried interest calculations in private equity funds; however, a preferred return can be structured in various ways, such as by using multiple hurdles and, after each hurdle, having a “catch-up” (as discussed below) to the general partner until the general partner has received a certain percentage of the profit.
Perceived gains from a preferred return include that it acts to discourage fund managers from taking excessive risk and motivates fund managers to realize gains in their investments more promptly. These may be counter-balanced, however, by the possible downside to this arrangement, whereby the threat of forgoing compensation may motivate fund managers to make investments that may generate higher returns or faster payouts but that also bear higher risks, which may not be in the best interests of the investors. Also, when the value of a fund declines to such a point that it is unlikely to generate a return in excess of the preferred return, the fund manager may lack incentive to continue managing the fund for the remainder of its term.
ii. Return of Capital: Following (or prior to) the preferred return step is the “return of capital” step, whereby the distributions available are applied against: (i) the capital contributions made in respect of the investment generating the distribution proceeds; (ii) the capital contributions
The preferred return is the minimum return that must be received by an investor before any carry is paid to the fund manager...
IMPACT INVESTING PRIVATE EQUITY FUND INDUSTRY: LEGAL CONSIDERATIONS 19| ECONOMIC TERMS
in respect of any previously realized investments (including written-off investments); and (iii) in a whole-fund waterfall only, all capital contributions previously made, including for unrealized and outstanding investments.
iii. “Catch-up” to General Partner & “Carry” i.e., profit-split: In addition to the return on its monies invested togetherwith the other investors in the fund, the general partner is also entitled to a portion of the profits earned by such other investors, which is the general partner’s performance-based compensation for running the fund. This “carried interest” or “carry” is typically set at 20% (lower for funds-of-funds) and will be payable to the general partner once the investors have received back their original capital contributions and preferred return thereon. This is typically achieved in two steps: first, the “catch-up” step, when the general partner receives either all or a lion’s share of the proceeds until, in effect, carried interest is paid out against the profits received by the LPs as the preferred return; second, profits are divided 80% to the limited partners and 20% to the general partner. Venture capital funds typically do not have a catch-up step to their waterfalls (so the general partner never receives a true 20% of profits, though if the fund is very profitable, it will come close).
b. General Partner Clawback: If earlier carried interest payments to the fund manager in hindsight appear to be overpayments, a “clawback” obligation may be imposed on the fund sponsor. This situation will typically occur when the initial investments of the fund are highly profitable, resulting in carry to the general partner, but subsequent investments are not. Thus looking across all the fund’s investments in the aggregate, investors may not have received adequate distributions to satisfy their preferred return while the general partner received carry, or the investors may have received all their preferred return but the general partner may have received carry in excess of the set percentage (e.g., an amount over 20%). The obligation to return excess distributions to investors may be supported by an escrow of some amount of the carried interest or a guarantee from the individual principals or from the fund sponsor (sometimes the latter being referred to as a “keepwell letter”).
c. Limited Partner Giveback: Any ability of a fund to recycle distributable or distributed proceeds aside, many funds also provide for a mechanism whereby the investors may be required to return distributions to the fund to satisfy any liabilities of the fund, sometimes even after the fund vehicle has terminated and been wound up (though more typically liabilities are limited to indemnification obligations only). Limited partners should ensure that the general partner clawback is re-calculated after giving effect to any limited partner giveback. The focus of negotiations frequently centers upon time limits and caps on the amounts to be returned, as investors want to be able to deploy distributions received for other purposes and not hold cash reserves for potential indemnity claims. It is also important for investors to ensure that the giveback provision
Many funds also provide for a mechanism whereby the investors may be required to return distributions to the fund to satisfy any liabilities of the fund...Though more typically liabilities are limited to indemnification obligations only...
IMPACT INVESTING PRIVATE EQUITY FUND INDUSTRY: LEGAL CONSIDERATIONS 20| ECONOMIC TERMS
is not used as a money management tool by the general partner, therefore investors prefer the giveback to be required only for indemnification, rather than fund expenses more generally.
d. Distributions In-kind & Valuation: When a fund reserves the right to provide its investors with distributions of securities in lieu of cash, a number of issues arise, most fundamentally surrounding the valuation of such securities. If an investor is allocated freely tradable securities, the general partner may (assuming the return of capital, preferred return, and catch-up steps of the distribution waterfall have been satisfied) distribute the carry in cash to itself. But if the investor liquidates its shares at less than the valuation as of the date of distribution (as the price of the shares is likely to fall with other fund investors similarly attempting to sell their shares), then the general partner will have realized more than 20% of actual profit; however, such excess may not be caught by the clawback. Therefore investors like to ask for a centered trading average, whereby the value of the securities will be determined by reference not only to the value as of the date of distribution, but the five days prior and following as well.
Valuation for securities that are not marketable is even more problematic. Not only is there no liquid market for setting price, but investors invest in private equity funds precisely to access liquidity from private markets, so if they are left with illiquid securities, the fund manager has not accomplished the endgame. Fund managers may use comparable freely tradable securities for valuation purposes (including for determining carry) and apply discounts to those comps, but how much of a discount to apply is a matter of debate. If a fund is permitted to distribute securities other than readily marketable securities, then, assuming the fund has an advisory committee (an “Advisory Committee”), the Advisory Committee may be required to approve any valuation done by the general partner or at the general partner’s behest.
e. Alternative Returns: The above economic terms generally relate to all closed-end, blind pool investment vehicles where third-party investors receive equity or equity-like interests in the fund. Some investors may make such a fund investment through a different route, such as acting as a lender to a fund (e.g., the U.S.’s development finance institution, the Overseas Private Investment
Corporation (OPIC)), thereby receiving an earlier return on its investment as compared to other third-party investors. Though more rare, other investors may wish to ensure that they receive a portion of the carry and/or the management fee depending on their appetite for risk. Thus, if the fund sponsor so permits, they do not invest directly into the fund; rather, they arrange to invest in the “upper-tier” structure of the fund as a member of the general partner and receive a portion of the general partner’s profits (as well as exposure to the general partner’s unlimited liability). Other fund structures may have a number of alternative terms, particularly in relation to co-investments or other joint ventures for the acquisition or development of identified portfolio companies or other assets, or smaller club deals, in which the participants are few and
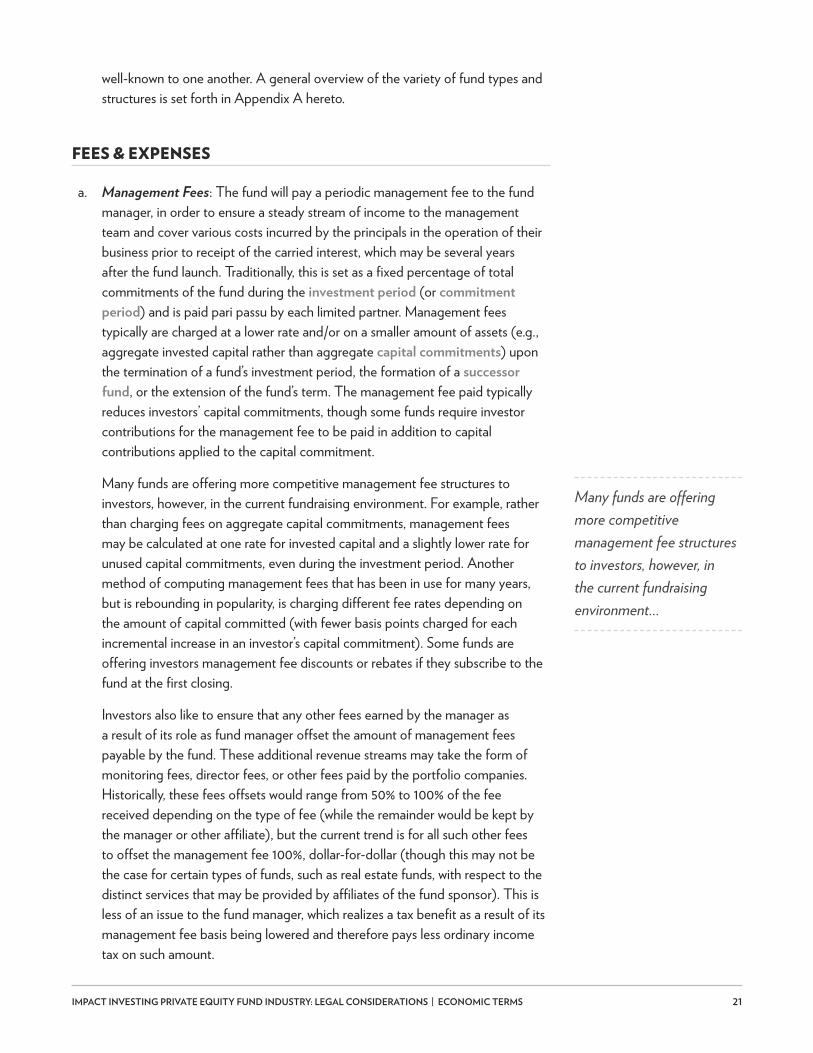
IMPACT INVESTING PRIVATE EQUITY FUND INDUSTRY: LEGAL CONSIDERATIONS 21| ECONOMIC TERMS
well-known to one another. A general overview of the variety of fund types and structures is set forth in Appendix A hereto.
FEES & EXPENSES
a. Management Fees: The fund will pay a periodic management fee to the fund manager, in order to ensure a steady stream of income to the management team and cover various costs incurred by the principals in the operation of their business prior to receipt of the carried interest, which may be several years after the fund launch. Traditionally, this is set as a fixed percentage of total commitments of the fund during the investment period (or commitment
period) and is paid pari passu by each limited partner. Management fees typically are charged at a lower rate and/or on a smaller amount of assets (e.g., aggregate invested capital rather than aggregate capital commitments) upon the termination of a fund’s investment period, the formation of a successor
fund, or the extension of the fund’s term. The management fee paid typically reduces investors’ capital commitments, though some funds require investor contributions for the management fee to be paid in addition to capital contributions applied to the capital commitment.
Many funds are offering more competitive management fee structures to investors, however, in the current fundraising environment. For example, rather than charging fees on aggregate capital commitments, management fees may be calculated at one rate for invested capital and a slightly lower rate for unused capital commitments, even during the investment period. Another method of computing management fees that has been in use for many years, but is rebounding in popularity, is charging different fee rates depending on the amount of capital committed (with fewer basis points charged for each incremental increase in an investor’s capital commitment). Some funds are offering investors management fee discounts or rebates if they subscribe to the fund at the first closing.
Investors also like to ensure that any other fees earned by the manager as a result of its role as fund manager offset the amount of management fees payable by the fund. These additional revenue streams may take the form of monitoring fees, director fees, or other fees paid by the portfolio companies. Historically, these fees offsets would range from 50% to 100% of the fee received depending on the type of fee (while the remainder would be kept by the manager or other affiliate), but the current trend is for all such other fees to offset the management fee 100%, dollar-for-dollar (though this may not be the case for certain types of funds, such as real estate funds, with respect to the distinct services that may be provided by affiliates of the fund sponsor). This is less of an issue to the fund manager, which realizes a tax benefit as a result of its management fee basis being lowered and therefore pays less ordinary income tax on such amount.
Many funds are offering more competitive management fee structures to investors, however, in the current fundraising environment...
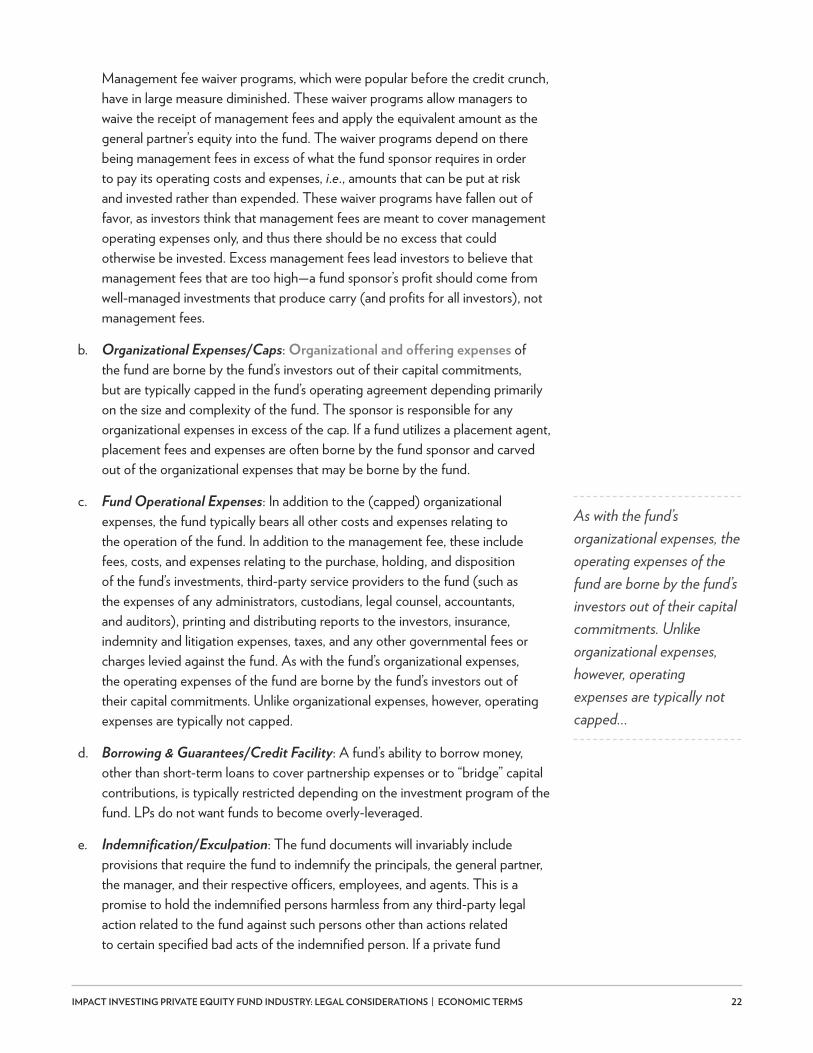
IMPACT INVESTING PRIVATE EQUITY FUND INDUSTRY: LEGAL CONSIDERATIONS 22| ECONOMIC TERMS
Management fee waiver programs, which were popular before the credit crunch, have in large measure diminished. These waiver programs allow managers to waive the receipt of management fees and apply the equivalent amount as the general partner’s equity into the fund. The waiver programs depend on there being management fees in excess of what the fund sponsor requires in order to pay its operating costs and expenses, i.e., amounts that can be put at risk and invested rather than expended. These waiver programs have fallen out of favor, as investors think that management fees are meant to cover management operating expenses only, and thus there should be no excess that could otherwise be invested. Excess management fees lead investors to believe that management fees that are too high—a fund sponsor’s profit should come from well-managed investments that produce carry (and profits for all investors), not management fees.
b. Organizational Expenses/Caps: Organizational and offering expenses of the fund are borne by the fund’s investors out of their capital commitments, but are typically capped in the fund’s operating agreement depending primarily on the size and complexity of the fund. The sponsor is responsible for any organizational expenses in excess of the cap. If a fund utilizes a placement agent, placement fees and expenses are often borne by the fund sponsor and carved out of the organizational expenses that may be borne by the fund.
c. Fund Operational Expenses: In addition to the (capped) organizational expenses, the fund typically bears all other costs and expenses relating to the operation of the fund. In addition to the management fee, these include fees, costs, and expenses relating to the purchase, holding, and disposition of the fund’s investments, third-party service providers to the fund (such as the expenses of any administrators, custodians, legal counsel, accountants, and auditors), printing and distributing reports to the investors, insurance, indemnity and litigation expenses, taxes, and any other governmental fees or charges levied against the fund. As with the fund’s organizational expenses, the operating expenses of the fund are borne by the fund’s investors out of their capital commitments. Unlike organizational expenses, however, operating expenses are typically not capped.
d. Borrowing & Guarantees/Credit Facility: A fund’s ability to borrow money, other than short-term loans to cover partnership expenses or to “bridge” capital contributions, is typically restricted depending on the investment program of the fund. LPs do not want funds to become overly-leveraged.
e. Indemnification/Exculpation: The fund documents will invariably include provisions that require the fund to indemnify the principals, the general partner, the manager, and their respective officers, employees, and agents. This is a promise to hold the indemnified persons harmless from any third-party legal action related to the fund against such persons other than actions related to certain specified bad acts of the indemnified person. If a private fund
As with the fund’s organizational expenses, the operating expenses of the fund are borne by the fund’s investors out of their capital commitments. Unlike organizational expenses, however, operating expenses are typically not capped...

IMPACT INVESTING PRIVATE EQUITY FUND INDUSTRY: LEGAL CONSIDERATIONS 23| ECONOMIC TERMS
establishes an Advisory Committee, its members would also be covered by the indemnification provisions. Fund documents will also contain exculpation provisions, which promise not to take legal action against the indemnified persons other than those related to certain bad acts of the indemnified persons. These provisions complement the indemnification provisions by limiting the potential liability of the principals and the other specified persons to the partnership and the partners. Appropriate indemnification and exculpation provisions are regarded as essential because the process of making and disposing of private equity investments involves a certain degree of litigation risk. The specified bad conduct (e.g., fraud, willful misconduct, and gross negligence) for which indemnification and exculpation are not granted is often the subject of protracted negotiation.
f. Management Expenses: The fund’s manager is expected to bear the cost of its own ordinary administrative and overhead expenses incurred in managing the fund. These costs typically include the costs and expenses associated with running the business of the manager, such as employee compensation and benefits, rent, and office furnishings, as opposed to specific expenses directly related to the operation of the fund and its investments.
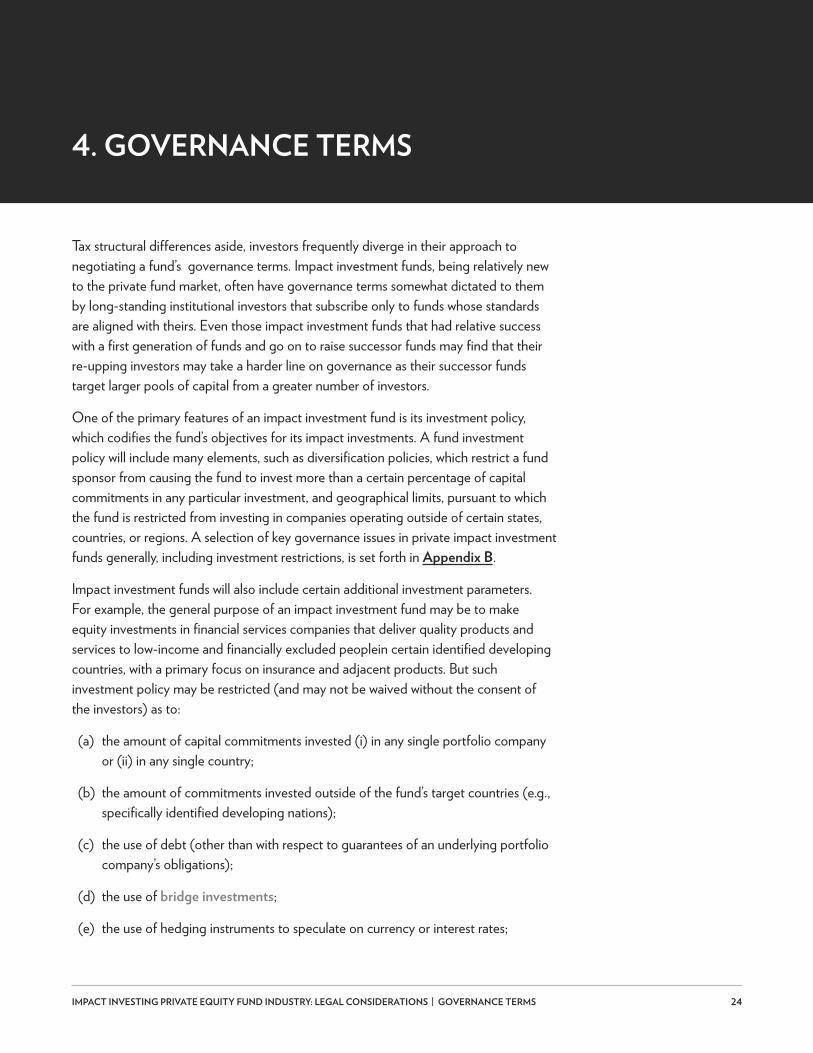
IMPACT INVESTING PRIVATE EQUITY FUND INDUSTRY: LEGAL CONSIDERATIONS 24| GOVERNANCE TERMS
Tax structural differences aside, investors frequently diverge in their approach to negotiating a fund’s governance terms. Impact investment funds, being relatively new to the private fund market, often have governance terms somewhat dictated to them by long-standing institutional investors that subscribe only to funds whose standards are aligned with theirs. Even those impact investment funds that had relative success with a first generation of funds and go on to raise successor funds may find that their re-upping investors may take a harder line on governance as their successor funds target larger pools of capital from a greater number of investors.
One of the primary features of an impact investment fund is its investment policy, which codifies the fund’s objectives for its impact investments. A fund investment policy will include many elements, such as diversification policies, which restrict a fund sponsor from causing the fund to invest more than a certain percentage of capital commitments in any particular investment, and geographical limits, pursuant to which the fund is restricted from investing in companies operating outside of certain states, countries, or regions. A selection of key governance issues in private impact investment funds generally, including investment restrictions, is set forth in Appendix B.
Impact investment funds will also include certain additional investment parameters. For example, the general purpose of an impact investment fund may be to make equity investments in financial services companies that deliver quality products and services to low-income and financially excluded peoplein certain identified developing countries, with a primary focus on insurance and adjacent products. But such investment policy may be restricted (and may not be waived without the consent of the investors) as to:
(a) the amount of capital commitments invested (i) in any single portfolio company or (ii) in any single country;
(b) the amount of commitments invested outside of the fund’s target countries (e.g., specifically identified developing nations);
(c) the use of debt (other than with respect to guarantees of an underlying portfolio company’s obligations);
(d) the use of bridge investments;
(e) the use of hedging instruments to speculate on currency or interest rates;
4. GOVERNANCE TERMS
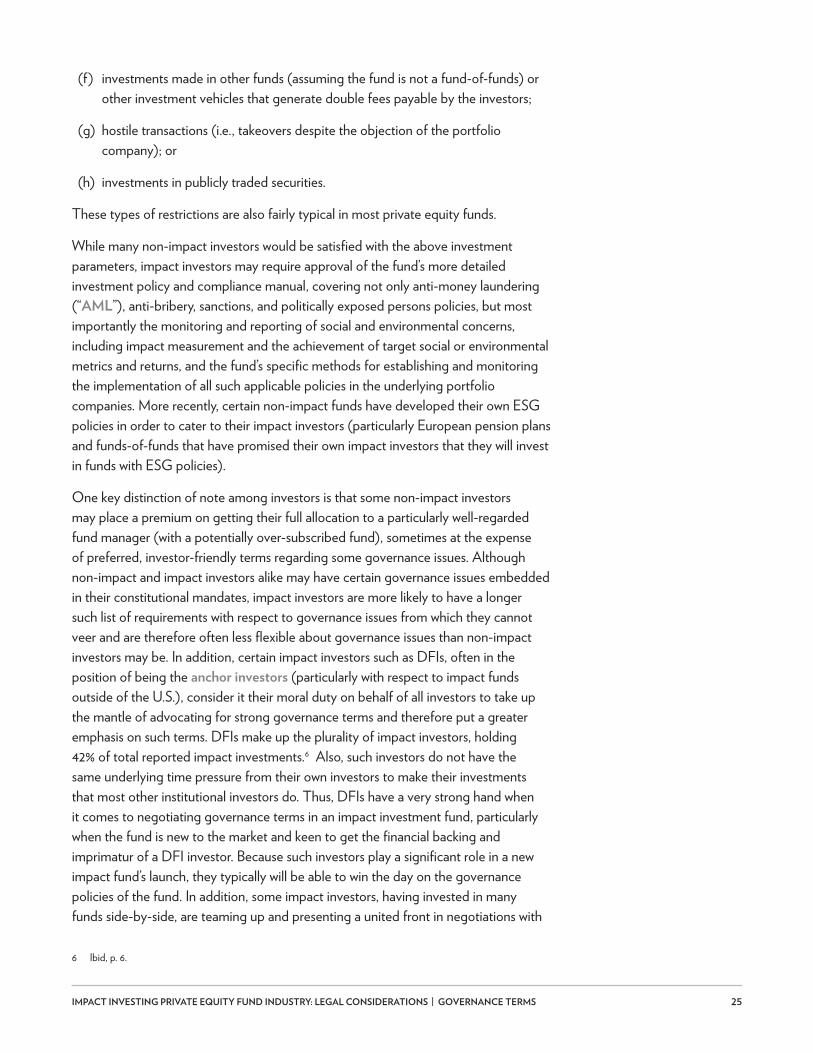
IMPACT INVESTING PRIVATE EQUITY FUND INDUSTRY: LEGAL CONSIDERATIONS 25| GOVERNANCE TERMS
(f) investments made in other funds (assuming the fund is not a fund-of-funds) or other investment vehicles that generate double fees payable by the investors;
(g) hostile transactions (i.e., takeovers despite the objection of the portfolio company); or
(h) investments in publicly traded securities.
These types of restrictions are also fairly typical in most private equity funds.
While many non-impact investors would be satisfied with the above investment parameters, impact investors may require approval of the fund’s more detailed investment policy and compliance manual, covering not only anti-money laundering (“AML”), anti-bribery, sanctions, and politically exposed persons policies, but most importantly the monitoring and reporting of social and environmental concerns, including impact measurement and the achievement of target social or environmental metrics and returns, and the fund’s specific methods for establishing and monitoring the implementation of all such applicable policies in the underlying portfolio companies. More recently, certain non-impact funds have developed their own ESG policies in order to cater to their impact investors (particularly European pension plans and funds-of-funds that have promised their own impact investors that they will invest in funds with ESG policies).
One key distinction of note among investors is that some non-impact investors may place a premium on getting their full allocation to a particularly well-regarded fund manager (with a potentially over-subscribed fund), sometimes at the expense of preferred, investor-friendly terms regarding some governance issues. Although non-impact and impact investors alike may have certain governance issues embedded in their constitutional mandates, impact investors are more likely to have a longer such list of requirements with respect to governance issues from which they cannot veer and are therefore often less flexible about governance issues than non-impact investors may be. In addition, certain impact investors such as DFIs, often in the position of being the anchor investors (particularly with respect to impact funds outside of the U.S.), consider it their moral duty on behalf of all investors to take up the mantle of advocating for strong governance terms and therefore put a greater emphasis on such terms. DFIs make up the plurality of impact investors, holding 42% of total reported impact investments.6 Also, such investors do not have the same underlying time pressure from their own investors to make their investments that most other institutional investors do. Thus, DFIs have a very strong hand when it comes to negotiating governance terms in an impact investment fund, particularly when the fund is new to the market and keen to get the financial backing and imprimatur of a DFI investor. Because such investors play a significant role in a new impact fund’s launch, they typically will be able to win the day on the governance policies of the fund. In addition, some impact investors, having invested in many funds side-by-side, are teaming up and presenting a united front in negotiations with
6 Ibid, p. 6.
IMPACT INVESTING PRIVATE EQUITY FUND INDUSTRY: LEGAL CONSIDERATIONS 26| GOVERNANCE TERMS
impact investment funds. As the impact investment industry grows and the number of investors increases, it may become more difficult for impact investors to present such a united front unless they develop their own set of principles for private impact investment fund terms similar to the ILPA principles, but including the methodology for achieving and measuring impact.
Some of the points negotiated between a fund investor and a fund sponsor may be addressed by revising the fund’s operating agreement. But fund sponsors may prefer to handle some points that are very individual to investors outside of the fund agreement for a variety of reasons. Thus, fund operating agreements typically permit the sponsor to enter into side letter agreements with investors. A side letter entered into by the fund and an investor alters the terms of that investor’s agreement with respect to its investment in the fund and its rights and obligations under the operating agreement. Certain investors require side letters because of their special regulatory or tax needs. Other investors may command additional or special economic, informational, or other benefits as a condition to their investment. Impact investors often have extensive side letters to ensure that the fund follows negotiated policies and procedures if such policies and procedures are not hard-wired into the operative agreement of the fund. Investors may also seek to receive the right to see all such side letters and the right to elect the same terms and conditions as such side letters (referred to in the industry as “most-favored nations” or “MFN” rights, borrowing a term from the World Trade Organization). Fund sponsors may respond to such requests in a variety of ways, including granting them to a limited degree (e.g., only granting the right to see letters with investors of the same or lower commitments as the requesting investor).
Impact investors often have extensive side letters to ensure that the fund follows negotiated policies and procedures...
IMPACT INVESTING PRIVATE EQUITY FUND INDUSTRY: LEGAL CONSIDERATIONS 27| INFORMATIONAL NEEDS OF INVESTORS
Investors will require varying and sometimes customized information about the fund and its investments, often as a result of promises that they have made with their underlying investors or beneficial owners. Fund managers generally try to limit the amount of bespoke information so provided, as providing such additional information adds to the administrative and operational burden of the fund and increases the fund’s operating expenses to the objection of the other investors in the fund that do not have customized reporting and other requirements. In addition, fund managers and investors (who are not subject to the U.S. Freedom of Information Act (“FOIA”) or other so-called “sunshine” laws) are concerned that information about the fund and its investments may become public, thus jeopardizing their profitability in the event that any of the fund’s investors are subject to FOIA or the sunshine laws of other jurisdictions. These sunshine laws require certain investors, such as public pension plans, to publicize otherwise confidential information about their investments; thus, fund managers try to limit the information provided to such investors or else provide the information to such investors in a manner that makes it difficult for the information to be published.
a. Reporting: Partnership agreements generally provide that the general partner is required to keep accurate books and records and to furnish the investors with various reports, including unaudited quarterly reports (e.g., within 45 days of the end of the quarter) and audited annual reports (e.g., within 90 days of the end of the fiscal year) describing the fund’s investments (including a valuation of the investments). In addition, an investor typically wants the right to obtain any other information about the fund or any of the fund’s investments that it reasonably requests and the right to inspect the books and records of the fund. Impact investors that have the expectation of the fund meeting certain social needs or other targets may, in addition, require funds to ascertain whether or not such targets have been met in accordance with pre-defined parameters and to include all such relevant information in its reports. Investors representing a majority of the equity interests in the fund may have the right to cause an audit of the books of the fund by an independent auditor at any time at the expense of the fund.
Some investors request additional information from the fund about its operations, portfolio, and other matters. A distinction may be drawn between “above the line” information that a sponsor is willing to provide to investors generally and more sensitive information that will not be provided (or that
5. INFORMATIONAL NEEDS OF INVESTORS
Impact investors that have the expectation of the fund meeting certain social needs or other targets may, in addition, require funds to ascertain whether or not such targets have been met...

IMPACT INVESTING PRIVATE EQUITY FUND INDUSTRY: LEGAL CONSIDERATIONS 28| INFORMATIONAL NEEDS OF INVESTORS
will be provided only to those investors that can assure that it will be treated confidentially). Impact investors typically require a much deeper and broader scope of disclosure, particularly in respect of oversight measures taken by the fund of each portfolio company’s adherence to various policies, summaries of particular events at the portfolio company level, and the fund’s own compliance with the various policies and investment directives in place. Most institutional investors require notice of any events that may give rise to potential litigation for the fund; but impact investors may outline for the fund with greater specificity the items that they believe may subject the fund to potential litigation, rather than leaving the decision about notifying the LPs about potential litigation to the reasonable discretion of the general partner.
b. Valuation: Investors want to receive copies of any policies referenced in the fund’s operating agreement, which will typically include the fund’s valuation policy. Funds must have in place effective policies and procedures for valuing the investments that they hold. As a result of the lack of appropriate knowledge or controls, errors in valuation can arise that materially affect a fund’s net asset value. In addition to being in accordance with market practice, valuation policies must be consistently and vigorously applied. Funds usually adopt U.S. GAAP (Generally Accepted Accounting Principles) or IFRS (International Financial Reporting Standards) to determine the fair value of any fund investment or interest in the fund.
c. List of other Investors and Advisory Committee Members: As the Advisory Committee may have the power to influence key decisions of the fund, investors typically want to know its membership, which may not be fully determined until after the fund’s final closing. Investors may also require a list of other investors invested in the fund to enable them to contact those investors in the normal course or due to an extraordinary event. A few impact investors may request approval rights over any subsequent investors into the fund.
d. Annual Meeting; Consultation Rights: Even the smaller funds will normally hold an annual meeting for its investors during which investors have the opportunity to ask all manner of questions regarding the fund in person. Investors may also request any documents provided during the meeting and minutes that may be produced following the meeting. Many investors, but particularly impact investors, will require regular consultation rights with the fund manager so as to ensure the ability to speak directly with the fund principals, particularly if they do not anticipate always being able to attend the annual meeting.
e. Legal Opinions: At closing, investors typically request:
i. an opinion that the fund will be treated for U.S. federal income tax purposes, as applicable, as either (i) a corporation or (ii) a partnership that is not treated as a “publicly traded partnership”;
IMPACT INVESTING PRIVATE EQUITY FUND INDUSTRY: LEGAL CONSIDERATIONS 29| INFORMATIONAL NEEDS OF INVESTORS
ii. a securities opinion that the issuance of the investor interest does not require the fund to register under the Investment Company Act of 1940 (as amended, the “Investment Company Act”) or register the fund offering under the Securities Act of 1933 (as amended, the “Securities
Act”);
iii. a partnership opinion that the documents are properly authorized; are duly executed and delivered; and are the legal, valid, and binding obligations of the general partner;
iv. if the fund is relying on status as a VCOC (i.e., a venture capital operating company) or an REOC (i.e., a real estate operating company), an assurance that the fund is not treated as holding “plan assets” for purposes of ERISA (the U.S. Employee Retirement Investment Security Act of 1974) and may accept capital from an investor subject to Title I of ERISA (such as a U.S. private pension plan) without being subject to the fiduciary requirements of ERISA, a form of VCOC or REOC opinion; and
v. if the deal contains a side letter and/or guarantee, a legal opinion addressing such agreements.
IMPACT INVESTING PRIVATE EQUITY FUND INDUSTRY: LEGAL CONSIDERATIONS 30| CONCLUSION
Private equity funds are excellent sources of capital for impact investments, particularly during periods of economic instability, when banks limit the risk they are willing and able to take. More recently, banks have become subject to higher capital and liquidity requirements, thus limiting the amount of capital that operating companies can seek from them. Moreover, private equity funds can be important to economic growth, especially when governments face their own deficits and are thus unable to fund public projects or otherwise provide for public goods. But in all of the discussions in recent years of the perceived regulatory risks of private funds, what has become somewhat lost is the diversity of private funds and the opportunities that they present for investors, as well as the institutional strength of investors.
Funds engage in a variety of strategies, including the impact investment sector. As the landscape of private funds has ballooned over the past decade, such strategies have become increasingly competitive and nuanced. Impact investors that cannot compromise on their fundamental investment principles have had enormous influence on the terms and conditions of private funds in recent years as their appetites for favorable private equity returns (and their willingness to bear the risk that is paired with those returns) have increased. Although impact investment funds collectively constitute a small fraction of the private fund industry as a whole, GIIN expects impact investment funds to balloon in the next six to ten years as impact investors better understand that their capital may be well-deployed via a private fund and as non-impact investors increase their impact investments and put their trust in established impact managers.
The competition for investors’ commitments is ever increasing, putting greater negotiating strength into investors’ hands, which in turn has led to the market-leading principles of ILPA. While the ILPA principles continue to serve as a benchmark for many investors as they negotiate their fund investments, we note an increasing trend in similarly situated investors forming small coalitions to negotiate the terms of their investments. Impact investors have formed many coalitions and associations in recent years and have the opportunity to set certain standards for impact investment funds. While these coalitions can present their own challenges, general partners increasingly appreciate fewer (though longer) negotiations, and investors certainly find strength in numbers.
This trend, for now limited mainly to similarly situated large institutional investors, such as DFIs and non-U.S. pension plans or other private investors, could also
6. CONCLUSION

IMPACT INVESTING PRIVATE EQUITY FUND INDUSTRY: LEGAL CONSIDERATIONS 31| CONCLUSION
be utilized by smaller institutional investors, such as family offices which may not normally engage in fund negotiations. Such investors would likely find value in engaging fund sponsors in such negotiations if their investments were grouped and they sought the assistance of outside counsel who regularly engage with fund sponsors and are well-versed in such negotiations. Somewhat counterintuitively, fund sponsors might additionally encourage greater attention to negotiation and due diligence by family offices and other smaller investors in order to make their funds more transparent and attractive to such investors.
THE INFORMATION CONTAINED IN THIS BRIEFING PAPER IS FOR INFORMATIONAL PURPOSES AND GUIDANCE ONLY, IS NOT LEGAL OR TAX ADVICE, AND SHOULD NOT BE RELIED UPON AS SUCH. THIS BRIEFING PAPER IS NOT INTENDED TO BE A SUBSTITUTE FOR OBTAINING LEGAL, AND TAX ADVICE FROM INDEPENDENT, LEGAL AND TAX COUNSEL. BECAUSE THE INFORMATION IN THIS BRIEFING PAPER IS GENERAL IN NATURE AND MAY NOT APPLY TO PARTICULAR FACTUAL OR LEGAL CIRCUMSTANCES, YOU SHOULD CONSULT WITH YOUR OWN INDEPENDENT, LEGAL, AND TAX COUNSEL. FURTHER, LAWS AND PROCEDURES CHANGE FREQUENTLY AND ARE SUBJECT TO DIFFERING INTERPRETATIONS. THEREFORE, THE ACCURACY AND COMPLETENESS OF THE INFORMATION CONTAINED IN THIS BRIEFING PAPER IS NOT GUARANTEED. WE UNDERTAKE NO OBLIGATION TO UPDATE THIS BRIEFING PAPER IN THE EVENT THAT THERE IS A CHANGE IN APPLICABLE LAWS AND PROCEDURES.
IMPACT INVESTING PRIVATE EQUITY FUND INDUSTRY: LEGAL CONSIDERATIONS 32| APPENDIX A
There are many types of funds generally available for investment, and the economic and other expectations of investors in those funds vary according to the fund type. Furthermore, risk tolerance will vary from portfolio category to portfolio category, depending not only on purpose but also time frame. Non-profit and for-profit investors alike must determine how much risk they are willing to assume for each type of investment product, with investment diversification to manage risk a must for most non-profit investment portfolios and public and private pension funds. Diversification by asset class, asset allocation, and within asset classes is considered prudent.
a. Growth Equity: Growth equity funds invest in quickly growing companies with proven ideas/business models to help support further growth. Such funds provide not only financial capital, but also strategic guidance and operational support so as to help the company grow and achieve its full potential. Such funds may make minority equity investments and let the existing management team continue to run the business. The capital injection from such funds may be used for a variety of purposes, such as scaling-up operations, enhancing distribution, expanding geographically, developing a new product, or financing an acquisition.
The majority of investors in these types of funds are institutional investors. There is typically less opportunity for negotiation in the funds with the highest target capital commitments (i.e., the “mega-funds”) because (i) such funds are generally run by the most successful and established fund managers, causing investors to compete with each other to receive their desired allocations to such funds; and (ii) the fund structures of most mega-funds are firmly established in prior funds.
b. Leveraged Buyout: Leveraged buyout funds acquire majority control of portfolio companies (almost always 100% ownership of mature firms) using financial leverage. The acquisitions ar made using both debt and equity, but the proportions can vary depending on the acquisition target, the market conditions, and the ability of the buyout fund to raise debt. The debt portion typically accounts for 50%-85% of the purchase price. The companies targeted by those funds must therefore generate stable operating cash flows which will be used to make interest and principal payments.
c. Hedge Fund: The “hedge fund” definition has come to incorporate any absolute return fund investing within the financial markets (stocks, bonds, commodities, currencies, derivatives, etc.) and/or applying non-traditional portfolio management
APPENDIX A: GENERAL OVERVIEW OF THE
VARIETY OF FUND TYPES AND STRUCTURES
IMPACT INVESTING PRIVATE EQUITY FUND INDUSTRY: LEGAL CONSIDERATIONS 33| APPENDIX A
techniques including, but not restricted to, shorting, leveraging, arbitrage, and swaps. There is often little room for negotiation by investors into hedge funds due to their open-ended structure, generally permitting investors to redeem their interests (subject to certain lock-up periods) if they do not agree with the investment platform. Hedge funds thus generally represent a “take it or leave it” approach for investors.
d. Hybrid Funds: There are various investment vehicles that are referred to as hybrid structures, but generally hybrid funds can be divided into two categories: fixed-term hybrid structures and evergreen hybrid structures. Fixed-term hybrid structures, like private equity funds generally, will have finite subscription periods, closed-end terms, specific investment periods, and distribution waterfall profit allocations. Unlike traditional private equity funds, which generally have a term of 10 years, fixed-term hybrid structures will typically have a term between 18 months and three years and a much shorter investment period. A fixed-term hybrid structure may include illiquid investments (with a short horizon) as well as liquid investments. Evergreen hybrid structures combine rolling lock-ups and rolling subscriptions with limited liquidity. These vehicles will have initial lock-ups ranging from one to three years during which redemptions are prohibited. A soft lock-up period may follow, whereby redemptions are permitted, subject to an early withdrawal fee. Both types of hybrid vehicles will charge lower fees than traditional hedge funds so as to compensate for the longer lock-up periods.
e. Fund-of-Funds: A fund-of-funds is an investment strategy of holding a portfolio of other investment funds rather than investing directly in portfolio companies. Funds-of-funds are a good tool for diversification and often the only route for smaller investors seeking to invest in the most popular funds that have certain minimum commitment requirements. Investors have less control, however, over the underlying fund investments. These types of funds often have longer terms as a result of the types of underlying investments made; therefore, investors have a greater need to negotiate their ability to transfer such investments.
f. Real Estate Funds: Private real estate funds may include private direct real estate investments in multiple property types (such as multifamily housing, commercial, retail, or industrial), “REITs” (real estate investment trusts), debt instruments, and derivatives. They are categorized as “core” funds, which generate steady income, and “opportunity” funds, which seek to generate capital appreciation. There is greater attention paid to leverage in such funds. These types of funds often have longer terms as a result of the types of underlying investments made; therefore, there is a greater need to negotiate the investors’ ability to transfer such investments.
g. Infrastructure/Real Asset Funds: Infrastructure funds are traditionally interested in lower risk investments such as roads, rail, grid, and waste facilities, which have a longer term investment horizon and lower returns over the period. More recently, institutional investors are seeking to invest in “real assets,” where the
IMPACT INVESTING PRIVATE EQUITY FUND INDUSTRY: LEGAL CONSIDERATIONS 34| APPENDIX A
fund’s underlying assets are a combination of physical assets, such as buildings, and essential infrastructure services.
h. Debt/Credit Funds: Within debt funds, there is a tremendous variety from which to pick depending on the assets to which the debt held by the fund is linked. Broadly speaking, though, in the private funds context, debt funds acquire debt securities and rely on the interest produced by such fixed income investments. The main investing objectives of a debt fund will usually be preservation of capital and generation of income. The fee ratios on debt funds are lower, on average, than equity funds because the overall management costs are lower. Performance against a benchmark is considered to be a secondary consideration to absolute return when investing in a debt fund. Though investors may be investing in a fund at equity level, capital diversification is offered by the variety of debt in which the debt fund might invest (e.g., senior/mezzanine).
Those funds that themselves originate debt, rather than merely purchasing existing debt, are referred to as “credit funds.” One of the results of the banking crisis has been the growing role of alternative finance providers who have plugged the gaps that traditional banks can no longer meet. These so-called “shadow banking” activities have lately become a focus of various regulators. These regulators acknowledge that shadow banking performs important functions in the financial system, e.g., by creating additional sources of funding and offering investors alternatives to bank deposits, but are concerned that shadow banking may pose potential threats to long-term financial stability.
i. Venture Capital Funds: This type of fund manages money from investors seeking private equity stakes in startup and small- and medium-size enterprises with strong growth potential. These investments are generally characterized as high-risk/high-return opportunities. Theoretically, venture capital funds give investors the ability to get in early at a company’s startup stage or in special situations where there is opportunity for explosive growth. While a fund structure diversifies risk, these funds are inherently risky.
j. Pledge Fund:In this structure, each investor enters into a separate but identical agreement with the manager, often called a “participation agreement.” Under this agreement, each investor pays a fee to the manager and, in return, the manager undertakes to source and offer all the investment opportunities of a particular type to those investors.
These pledge fund structures have certain perceived advantages for the investor, including greater control for investors over how their commitments are invested, the opportunity to evaluate individual investments to assess their merits and risks and ensure that investments are consistent with the investor’s understanding of the fund’s investment strategy, and the ability to terminate the commitment to fund investments. Multiple vehicles, a greater volume of documentation, and a more active role, however, may make pledge funds less
IMPACT INVESTING PRIVATE EQUITY FUND INDUSTRY: LEGAL CONSIDERATIONS 35| APPENDIX A
attractive to many investors. Investor discretion to assess individual investments is only effective if such an investor has sufficient knowledge and experience with relevant assets and sufficient resources to analyze, e.g., reports from the manager and other due diligence documents on each underlying investment.
The manager of a pledge fund retains a guaranteed income from the management fees paid under the participation agreement. This allows the manager to carry on its business in an orderly way (e.g., to rent office premises and hire staff). This type of fund has certain disadvantages for the manager, though: unlike a blind pool fund, the manager has no certainty when identifying and negotiating investment opportunities of the degree to which investors will actually participate in that investment, or indeed if sufficient investors will participate to allow the fund to make the investment at all. This lack of certainty may make it more difficult for the manager to successfully negotiate investments in a short period of time; in particular, it may be more difficult for a pledge fund to obtain exclusivity in a proposed transaction. Confidentiality is also another concern as the manager will have to provide its investors with a considerable amount of information about proposed investments prior to actually making those investments.
k. Club deals: This term describes a private equity buyout or the assumption of a controlling interest in a company that involves several different private equity firms. This group of firms pools its assets together and makes the acquisition collectively. The practice has historically allowed private equity firms to purchase much more expensive companies together than they could alone. Also, with each company taking a smaller position, risk can be reduced.
These types of funds are not, however, without their disadvantages. Certain practical issues such as the appointment of multiple advisors and extended multi-dimensional negotiations increase the overall cost associated with club investments. Club investors from different geographies may face difficult decisions on the jurisdiction of the club. And domestic tax laws may treat the club as an “association of persons” depending on the nature of the club arrangement, which may severely impact the returns of the investors.
l. Co-Investments: A traditional co-investment is a minority investment made directly into an operating company, alongside a fund, typically in a leveraged buyout, recapitalization, or growth capital transaction.
Through co-investments, the fund manager may make larger, controlling investments without either dedicating too much of the fund’s capital to a single transaction (and creating exposure issues or violating any investment limitations agreed with the fund’s investors) or sharing the deal with competing private equity firms. Compensation to the fund manager with respect to co-investments varies, but co-investors typically do not pay management fees or carried interest on co-investments.

IMPACT INVESTING PRIVATE EQUITY FUND INDUSTRY: LEGAL CONSIDERATIONS 36| APPENDIX A
m. Managed Accounts: Some investors seek their own customized “managed account” arrangements, which provide for greater control (but eliminate the benefit of risk-sharing that pooled investment vehicles provide). These arrangements may be created either in tandem or independently of any blind pool fundraising, with potentially different economics and different investment criteria. These arrangements frequently provide for the investor to have some participation in investment decisions. This can create significant challenges for their fund managers, not least the articulation to their traditional fund investors of the consequences of such managed accounts, particularly as regards the extent of access to deal flow and allocation of investment opportunities.
IMPACT INVESTING PRIVATE EQUITY FUND INDUSTRY: LEGAL CONSIDERATIONS 37| APPENDIX B
a. Conflicts of Interest: Often, sponsors of private equity funds manage multiple investment vehicles or otherwise engage in a number of asset management and related services that can potentially give rise to a number of conflicts of interest. The determination of what transactions between related parties may be potential conflicts is of fundamental importance.
Failure to fully address conflicts situations is typically of great concern to investors. In addition, the Investment Advisers Act of 1940 (as amended, the “Advisers Act”) and the rules promulgated thereunder prohibit agency cross transactions and principal trades without specific authorization from their clients, although investors may agree in the fund agreement how such authorization may be effected (in lieu of obtaining such authorization from each and every investor). For example, it may be agreed that the general partner present potential conflicts of interest to the fund’s Advisory Committee, which will consider the terms of the proposed transaction and determine whether or not to provide its consent. Or a fund might utilize an unaffiliated independent representative to make such determinations on behalf of the investors (provided that such independent representative has herself been approved by each investor).
b. Transfer Rights: Private equity fund interests are illiquid investments that must be held until the fund terminates and is liquidated. Thus, transfers of LP interests are prohibited unless certain qualifications are met: for instance, assuring that the transferor is not trying to create a market in selling unregistered securities or avoiding the application of ERISA’s fiduciary requirements. Large institutional investors will typically request, and receive, the right to transfer their interests to bona fide affiliates, subject to the affiliate being able to make the standard representations and warranties required of all investors.
c. Advisory Committee: Advisory Committees provide limited partners with an ability to better oversee the ongoing operation of a fund during the course of its life. Each partnership agreement may vary slightly the particular responsibilities of the Advisory Committee, but most funds do have them. Recurring roles for the committees are to resolve conflicts of interest that may arise and to consent to certain actions that might otherwise constitute a breach of the partnership agreement (e.g., a waiver of investment limitations that would otherwise prohibit a particular investment). By having a representative on the Advisory Committee, an investor is better placed to influence decisions of the fund. Depending on the
APPENDIX B: KEY GOVERNANCE TERMS
Often, sponsors of private equity funds manage multiple investment vehicles, or otherwise engage in a number of asset management and other related services that can potentially give rise to a number of conflicts of interest.
IMPACT INVESTING PRIVATE EQUITY FUND INDUSTRY: LEGAL CONSIDERATIONS 38| APPENDIX B
jurisdiction of the fund, however, the role of the Advisory Committee will have to be carefully constrained so as to ensure the retention of limited liability by each investor represented on the Advisory Committee. An investor who seeks but does not obtain Advisory Committee representation may try instead to obtain non-voting observer status to the Advisory Committee or copies of all information that the fund provides to the Advisory Committee.
d. Term/Termination: The term of a fund generally consists of an investment period followed by a divestment period. Shorter or longer terms may be required depending on the time it takes to source, acquire, harvest, and exit investments. In addition to a pre-determined termination date where the fund has a fixed life, investors and fund managers must give particular thought to further termination mechanisms, including the early termination of the investment period (preventing the general partner from making further investments, but not shortening the fund’s permitted aggregate term length, which allows the general partner to harvest the fund’s existing investments). Upon a supermajority-in-interest vote of investors, funds may allow for a “no-fault” termination of the fund’s term. The investors’ right to vote to terminate the fund or its investment period early may also be triggered by related provisions, such as the change of control of the general partner (discussed further below under “Change of Control”), a key person event (discussed further below under “Time and Attention; Key Person Event”), the removal of the general partner, and the establishment of a successor fund, each as described below:
i. General Partner Removal: The fund’s operating agreement may provide the ability of a certain percentage of investors to elect to remove the general partner in certain very limited circumstances. For example, a majority-in-interest of investors may have the ability to elect to remove the general partner for “cause,” usually with disastrous consequences for the general partner (e.g., by a “haircut” on any carry earned by the general partner). A supermajority-in-interest may have the right to remove the general partner without “cause.” General partner removal is often considered the “nuclear option” that investors use only as a rare, last recourse in any dispute with a general partner. Any removal of the general partner typically triggers fund termination unless the investors decide to appoint a new general partner to continue the fund.
ii. Successor Fund: Though this issue is of less focus for investors who think that if they are happy with a fund manager it will not matter if they are investing via the present fund or a successor fund, investors typically prefer successor funds not to invest until the investment period of the prior fund has terminated or some other protection has been built in (such as the reduction or elimination of management fees paid by the existing fund) to ensure that the fund sponsor’s focus remains on the existing fund. Indeed, a successful fund of almost any size is often the foundation for significantly larger successor funds, representing correspondingly larger opportunities for the successful general partner and principals.
Advisory Committees provide limited partners with an ability to better oversee the ongoing operation of a fund...However, the role of the Advisory Committee will have to be carefully constrained so as to ensure the retention of limited liability by each investor represented on the Advisory Committee...

IMPACT INVESTING PRIVATE EQUITY FUND INDUSTRY: LEGAL CONSIDERATIONS 39| APPENDIX B
e. Capital Commitments: Investors typically contribute their committed capital to the fund over time, upon receipt from the general partner of a drawdown
notice. Typically, investors have a 10 business day period to provide the fund with the capital contributions requested or be subject to potentially serious default consequences (discussed further below).
i. Fundraising Periods: Private equity funds are structured as closed-ended investment vehicles. A fund’s governing documents generally permit the fund to raise capital commitments only during a limited, initial fundraising period (typically 12 to 18 months) after which the fund may not accept additional investor commitments.
ii. Closings: A first closing of the fund occurs when the sponsor identifies investors who are ready to commit sufficient capital to the fund (based on the sponsor’s capital raising target). Sometimes a fund is only permitted to hold an initial closing after a minimum amount of capital has been raised. After the first closing, subsequent closings may be held throughout the fundraising period. At each closing, investors become limited partners of the fund by executing a subscription agreement, as well as the fund’s limited partnership agreement, and having such documents accepted by the general partner.
iii. GP Capital Commitments: The general partner, together with affiliates of the fund sponsor, traditionally invests a certain amount of money alongside the limited partners in order to ensure that the interests of all partners are adequately aligned. The commitment of the general partner can occur directly through the fund vehicle, which would ensure that it participates pari passu with every investment made by the limited partners, or the general partner may participate via a co-investment vehicle, though investors typically require assurance that the general partner participates in each fund investment on the same terms and conditions of the fund.
iv. Change of Control: It is in the investors’ best interest that the general partner remain for the duration of the term of the fund. Thus, the partnership should specify that the general partner may not voluntarily withdraw as general partner, dissolve or liquidate, undergo a change of control, or transfer its interest. The concern here is that the principals will sell their future interests in the fund for immediate cash and withdraw from management of the fund. This is a grave matter for investors whose impetus in making an investment in any given fund is the talent and investment history of the principals who together comprise the general partner. Additionally, such a change of control provision helps to protect the investors from being deserted by the general partner if the portfolio investments that the fund has made have lost value and, hence, the prospects of the general partner ever receiving a carried interest are slim.
Sometimes a fund is only permitted to hold an initial closing after a minimum amount of capital has been raised...
The general partner, together with affiliates of the fund sponsor, traditionally invests a certain amount of money alongside the limited partners, in order to ensure that the interests of all partners are adequately aligned...
IMPACT INVESTING PRIVATE EQUITY FUND INDUSTRY: LEGAL CONSIDERATIONS 40| APPENDIX B
v. Recycling: The fund’s operating agreement may permit the fund to “recycle” capital that is returned to the investor. Typically a fund may be able to re-deploy: (a) investments yielding a quick return (e.g., bridge investments realized within one year after the investment is made, discussed further below under “Bridge Investments”); (b) returns attributable to capital contributions used to satisfy organizational expenses and other fund expenses; and (c) returns on investments during the investment period. The aggregate amount of capital commitments that the general partner may deploy on behalf of each investor may be limited, however, to some percentage slightly higher than 100% of each investor’s original fund commitment (but rarely greater than 150%).
vi. Excuse:Some investors may be excused from making a particular investment because of investment restrictions pre-agreed with the general partner, either as described in the fund’s operating agreement or in a side letter agreement between the investor and the fund. For example, some religious organizations request excuse in the event of certain types of so-called “sin” investments made by the fund, such as investments involving alcohol, pork, prostitution, or firearms. In the event of excuse, investors’ capital commitment may remain unaffected or be reduced by the amount that the fund would have drawn down in the absence of excuse. In other circumstances, there may be regulatory or other reasons why an investor is required to withdraw from a fund completely. Greater attention has been paid to how excuse rights are granted, particularly by impact investors. Impact investors do not necessarily seek excuse rights for themselves; rather, they are concerned that other investors may try to use excuse rights in order to avoid participating in investments that they simply do not want to make, instead of investing blind along with all investors.
vii. Default: Capital commitment default provisions may create severe penalties for a defaulting investor, such as: (a) forced sale of the defaulting investor’s capital account to other existing investors at a discount; (b) interest penalties; (c) automatic reduction of the defaulting investor’s capital account to cover owed amounts and penalties; or (d) the loss of all or certain rights as an investor, including participation in future investments or voting determinations.
viii. Feeder Funds: Feeder funds are special purpose vehicles formed by a fund to accommodate investment in the fund by one or more investors. Due to the particular jurisdiction of incorporation of the fund, an investor or class of investors may prefer (primarily for tax purposes) to invest in the fund indirectly through an upper-tier entity. One common use of feeder funds is to act as “blockers” for U.S. federal income tax purposes. These types of feeder funds are structured to be treated as corporate taxpayers for U.S. federal income tax purposes so that investors in the feeder funds do not receive direct allocations or distributions of fund income. This ensures that
Some investors may be excused from making a particular investment because of investment restrictions pre-agreed with the general partner...
Impact investors do not necessarily seek excuse rights for themselves; rather, they are concerned that other investors may try to use excuse rights in order to avoid participating in investments that they simply do not want to make...
IMPACT INVESTING PRIVATE EQUITY FUND INDUSTRY: LEGAL CONSIDERATIONS 41| APPENDIX B
non-U.S. investors are not required to file U.S. federal tax returns and pay U.S. income tax in connection with those allocations and distributions. Many U.S. tax-exempt investors also prefer to invest through feeder funds organized as blockers to reduce the likelihood that their investment generates UBTI.
ix. Parallel Funds: Parallel funds are parallel investment vehicles generally formed to invest in and divest from the same investments at the same time as the main fund. They are formed under substantially the same terms as the main fund, with specific differences in terms to the extent required to accommodate the regulatory, tax, or investment requirements applicable to the investors in the parallel fund. Parallel funds are often created in jurisdictions other than that of the main fund. For example, a Delaware-based fund may form a Cayman Islands-based parallel fund to accommodate non-U.S. investors who often prefer to invest through a non-U.S. entity to avoid the U.S. tax compliance obligations that apply to investors in U.S. entities. The parallel fund generally invests directly in each investment alongside and in parallel with the Delaware fund, in fixed proportions determined by their respective capital commitments. Additionally, funds formed to invest in specific countries or regions may have separate funds for local and international investors.
x. Alternative Investment Vehicles: Alternative investment vehicles are special purpose investment vehicles formed to accommodate the structuring needs of the fund (or its investors) in connection with one or more particular investments. Unlike a parallel fund, which is designed as an umbrella entity for investors to participate as an alternative to the main fund, an alternative investment vehicle is formed so that investors who have subscribed to the main fund (or a parallel fund) can take advantage of efficient structures to hold specific assets if the fund is not the optimal investment vehicle for a particular investment, whether for tax, regulatory, or other legal reasons. Operating agreements typically permit the sponsor to form an alternative investment vehicle through which all (or certain) investors may invest in a fund investment, relieving those investors from the obligation to participate in the investment through the fund itself. The fund agreement generally requires alternative investment vehicles to have substantially the same terms as the fund. The general partner or manager typically has a great deal of discretion under the fund agreement whether to form an alternative investment vehicle for a particular investment and, if it does, whether to form the vehicle for a particular investor or group of investors. For example, a Cayman Islands-based fund seeking to invest in a portfolio company located in a country that imposes a withholding tax on distributions to offshore financial centers may form an alternative investment vehicle in another jurisdiction that is not deemed an offshore financial centre for the purpose of making the investment.
IMPACT INVESTING PRIVATE EQUITY FUND INDUSTRY: LEGAL CONSIDERATIONS 42| APPENDIX B
f. Investment Period; Investment Limitations:
i. Investment Period: The investment period of a fund will often last between four and six years. At the end of this period, any undrawn capital commitments of a limited partner may no longer be used for new investment and will only be subject to drawdowns for existing commitments, expenses, reserves, to repay existing borrowings, or to fund follow-on investments in companies that are already in the fund’s portfolio or that otherwise enhance the fund’s existing investments.
ii. Time and Attention; Key Person Event: Investors frequently make investments in a fund primarily in reliance on the skill and expertise of certain individuals to manage the fund and its investments. Often the operation of the fund is tied to the presence of these individuals, who are deemed to be “key persons.” Key persons will be required to meet certain minimum time commitment requirements to the fund, e.g., substantially all of a key person’s business time and attention must be dedicated to the fund and any prior or successor funds. Failure of a certain number of key persons to meet such requirements may trigger a key person event. Key person events vary from fund to fund, but investors prefer a key person event to trigger an automatic suspension of the fund’s investment period. If triggered, the fund is prevented from making new investments until a sufficient number of new key persons are appointed. Often, if the suspension period continues for a long enough period (for example, six months), then the investment period terminates and the fund enters liquidation mode.
iii. Diversification Limits: The general partner is generally not permitted to invest more than a certain percentage of the fund’s capital commitments in a single portfolio company, including investments in affiliated entities, bridge investments, and follow-on investments in such portfolio company. Depending on the size of the aggregate capital commitments and the investment focus of the fund, such percentage could be between 10% and 35% for any single portfolio company.
iv. Bridge Investments: Some general partners will seek flexibility to exceed the diversity cap on a short term basis by having the ability to make a “bridge investment”. Bridge investments may take the form of short-term debt or equity in an underlying portfolio company, although they are usually debt investments which will be refinanced or converted to equity investments within a year. Since a bridge investment is intended to be temporary, a carried interest will usually not be earned on it and consequently a preferred return will not accrue on capital contributed for a bridge investment. For example, a general partner may intend to sell a portion of a portfolio investment soon after it is made to a co-investor, and thus it may make the most sense to the general partner to structure
Investors frequently make investments in a fund primarily in reliance on the skill and expertise of certain individuals...Key persons will be required to meet certain minimum time commitment requirements to the fund...
IMPACT INVESTING PRIVATE EQUITY FUND INDUSTRY: LEGAL CONSIDERATIONS 43| APPENDIX B
that part of the investment as a bridge investment so as not to diminish the fund’s investment rate of return (IRR). In addition, capital contributed for a bridge investment that is realized quickly (e.g., within the fund’s investment period) can usually be “recycled” (see “Recycling” above).
v. Geographical Limits / Restricted Nation Covenant (Iran, North
Korea, etc.): If it is contemplated that investments will be made abroad, investors may seek limitations on the amounts that may be invested in any particular jurisdiction. Any foreign investments should be subject to the general partner’s receipt of legal advice (possibly in the form of an opinion) that such investment will not subject any investor to liability in excess of its capital contribution.
vi. Ethical Investor Limits / ESG Policy Acknowledgement: Many investors, for environmental, social, or religious reasons/policies require prohibitions on investments in portfolio companies primarily engaged in certain sectors, such as alcohol, gambling, firearms, prostitution, tobacco, and pork products. Moreover, impact investors may require as a pre-condition of their investment that the fund agree to a responsible investment code that imposes obligations on the part of the fund to ensure that the companies in which it invests adopt and maintain rigorous environmental, social, and corporate governance standards.
vii. Hostile deals: Generally, funds are not permitted to engage in any “hostile transaction” (i.e., a transaction that is opposed by a majority of the target company’s board of directors and/or shareholders). Investors generally do not want the negative press that can accompany a hostile transaction, and such transactions are usually expensive.
viii. Investments generating additional management fees or carry: A fund is typically prohibited from making a portfolio investment if, as a result, the fund would be obligated to pay any party additional management fees or carried interest, which rules out investments in any other pooled investment vehicles. This addresses concerns that investors will be paying multiple layers of fees.
ix. Publicly Traded Securities: Investors generally request, subject to certain caveats, that the fund not invest in any publicly-traded companies. The general purpose of private equity funds is to make private investments that investors may not otherwise have access to, not to invest in the public markets. Certain exceptions may be made for private equity-like investments, such as taking a controlling stake in a publicly-traded company in a “going private” transaction or purchasing privately offered securities from a public company. The fund may nonetheless provide a cap of 5% to 10% on such investments.
IMPACT INVESTING PRIVATE EQUITY FUND INDUSTRY: LEGAL CONSIDERATIONS 44| APPENDIX B
g. Amendments: The partnership agreement may typically be amended only with the written consent of the majority-in-interest of the investors. An amendment to the allocation and distribution sections or an amendment requiring the investors to increase their capital commitments, however, usually requires the unanimous consent of the investors. Notwithstanding the above, the general partner may amend the partnership agreement without investor consent in order to reflect the admission of an additional investor or an increasing investor pursuant to the terms of the partnership agreement, comply with applicable law, or correct a typographical error.
h. Voting: Fund voting (e.g., with respect to amendments) is based on the proportion of the investors’ capital commitments held by each investor and not on a “one-partner, one-vote” basis. Any interests held by the general partner and its affiliates are typically excluded from any voting by the investors.
i. Governing Law: Delaware is the most popular jurisdiction for formation of U.S.-domiciled private equity funds sponsored by U.S.-based general partners. In addition to funds formed in Germany, the Netherlands, Luxembourg, France, and the UK, common “offshore” jurisdictions for funds formed outside the United States that are nonetheless marketed to U.S. investors include, among others, the Cayman Islands, Bermuda, the British Virgin Islands, Jersey, Guernsey, Ireland, Gibraltar, Malta, Cyprus, and Mauritius. The best choice for a non-U.S.-domiciled fund will depend on tax and regulatory considerations. Often, the same sponsor will choose to operate a fund strategy using parallel vehicles formed in different jurisdictions (for example, a Delaware limited partnership and a parallel Cayman vehicle) to address the needs of different types of investors. The sponsor will typically seek to cause the documentation for these multiple funds to be as similar as possible; however, due to differences in local law, achievement of identical fund terms may not be possible.
j. Disputes: To address disputes among the principals, arbitration is a dispute resolution method that is often required by the governing documents of general partners and management companies due to its speed and confidentiality. However, it is somewhat less common in fund documents governing the relationship between sponsors and investors. Indeed, some U.S. public pension plans require that disputes be resolved in courts of such plans’ jurisdictions.
k. Power of Attorney: The partnership agreement and the subscription agreement typically contain powers of attorney, granted by the investor to the general partner. Some investors require that any grant of a power of attorney be narrow and extend only to ministerial actions such as corporate filings and amendments thereto. Certain institutional investors may be prohibited from granting a power of attorney altogether, but then typically agree with the general partner to expedite delivery of any required signatures.
IMPACT INVESTING PRIVATE EQUITY FUND INDUSTRY: LEGAL CONSIDERATIONS 45| APPENDIX C
A private equity fund is at its core a set of corporate transactions to acquire securities. Prior to the Wall Street Crash of 1929, there was little regulation of securities. During the Great Depression, President Franklin D. Roosevelt’s New Deal programs included the first piece of legislation to regulate the offer and sale of securities, the Securities Act, followed by the Securities Exchange Act of 1934 (as amended, the “Exchange
Act”), the Investment Company Act, and the Advisers Act. These four statutes, each as amended, form the core of U.S. federal regulation of the private fund industry to this day. The four aspects of fund investing that U.S. securities laws attempt to address are fund offerings and sales, fund marketing, fund ownership, and fund management.
Historically, the private fund industry in the U.S. has avoided registration under these four statutes (with the exception of the Advisers Act, which regulates fund managers, and which recently has been amended to extend its registration requirements to even more fund managers, as discussed further below). Broadly speaking, the purpose of registration under the U.S. securities laws is to protect average members of the investing public by requiring the funds to provide to the Securities and Exchange Commission (“SEC”) and/or such investors fulsome disclosures regarding their investments, the sales process surrounding those investments, and those who sell and manage those investments. These disclosures take a substantial amount of time to prepare and are generally very costly, requiring significant legal expenses, which of course limits the returns available to investors. Private funds and those who manage and sell them may be deemed to fall outside the purpose of the regulation for the reasons described further below and thus are exempt from the registration requirements of the U.S. securities laws. Other than with respect to the Advisers Act, most private funds would not be able to bear the burden of the registration requirements. Even the large-scale funds that could administer such registrations would find their expenses relating to registration to be so onerous as to fundamentally change their business model, causing a loss of interested investors and principals and thus a collapse of their business.
a. Fund offerings and sales
The foremost concern of the U.S. federal government when they began creating these centralized laws regulating securities was adequate disclosure to investors of the terms and conditions of the securities being offered. Thus, the primary securities law affecting U.S. and non-U.S. offerings alike, the Securities Act,
APPENDIX C: U.S. REGULATORY ISSUES
IMPACT INVESTING PRIVATE EQUITY FUND INDUSTRY: LEGAL CONSIDERATIONS 46| APPENDIX C
requires all offers and sales of securities to be registered with the SEC , which registration requires a complex (and issuers would say onerous) level of detail of the securities being offered for sale to be submitted to the SEC. Private funds have traditionally been exempt from the Securities Act’s registration requirement because private fund interests are not available for sale to the general public and thus their investors do not require the protection of the Securities Act’s disclosure requirements. Fund sponsors ensure that their fund offerings are deemed exempt from the registration requirement of the Securities Act and qualify for this so-called “private offering” exemption by utilizing the safe harbors provided by Regulation D and Regulation S promulgated under the Securities Act. Furthermore, recent changes to Regulation D as a result of the Jumpstart Our Business Startups Act of 2012 (the “JOBS Act”) permit public offerings without registration under the Securities Act under certain circumstances discussed further below.
The primary tenet behind Regulation D has long been that, so long as fund investors are relatively sophisticated, financially astute, and have a substantive relationship with the fund issuer (or its placement agent) that pre-dates the offering of fund interests to those investors, they do not need the protections offered by the Securities Act’s registration requirements. Issuers both within and outside of the U.S. may rely upon Regulation D; Regulation D is the primary safe harbor relied upon by fund sponsors globally, wherever their funds may be based, who intend to offer fund interests to U.S. investors and thus fall under the purview of the Securities Act. The Regulation D safe harbor (found in Rules 501 to 508 under the Securities Act, including the Preliminary Notes thereto) allows issuers to offer interests to an unlimited number of “accredited
investors” and up to 35 non-accredited investors (though in effect, issuers utilizing the Regulation D safe harbor only offer interests to accredited investors due to additional regulatory burdens that would ensue from offering interests to non-accredited investors). “Accredited investors” may be individuals, trusts, corporations, pension plans, and other entities who satisfy stipulated income or net value tests, typically entities with total assets greater than $5 million and individuals with net worth in excess of $1 million.
The “private offering” exemption, however, no longer requires that the offering be private. The JOBS Act uprooted the notion that accredited investors need to have a substantial, pre-existing relationship with fund sponsors (or their placement agents). The regulations promulgated under the JOBS Act that came into effect as of September 23, 2013 have eliminated the requirement that issuers relying on Regulation D must ensure that the interests are not sold by means of “general solicitation or general advertising.” Thus interests offered under the Regulation D safe harbor may now technically be offered to the general public, although virtually all investors must still be able to satisfy the “accredited investor” standards and, in addition, other applicable regulations may nonetheless require that such offerings continue to be private. The JOBS
IMPACT INVESTING PRIVATE EQUITY FUND INDUSTRY: LEGAL CONSIDERATIONS 47| APPENDIX C
Act has thus provided for increased flexibility—issuers may continue to offer fund interests in the traditional manner without relying on general solicitation, or they may engage in general solicitation.
Regulation D has historically required that a fund offer and sell interests only to persons it “reasonably believes” are accredited investors. Private funds have traditionally relied on investor questionnaires in subscription documents to collect information from prospective investors sufficient to establish this “reasonable belief,” and courts have generally accepted this practice. The JOBS Act changed this standard for any fund utilizing general solicitation to offer its interests by requiring not only(i) that an issuer have a reasonable belief that it is selling securities only to accredited investors, but also(ii) that an issuer take “reasonable steps to verify” that it is selling securities only to accredited investors. This second requirement means that private funds engaging in general solicitation must take steps beyond those required to comply with traditional Regulation D private placement. To assist issuers, Regulation D now identifies four safe harbor methods to satisfy the new general solicitation requirements regarding the verification of accredited investors.
The burden of verification, combined with the potential loss of other regulatory exemptions applicable to funds, such as exemption from CFTC registration and state fund offering registration, means that traditional fund issuers are, for the time being, not taking advantage of the ability to rely on general solicitation. This trend may continue, with only new fund managers who do not have the advantage of sufficient pre-existing, substantial relationships with accredited investors taking advantage of the increased access to capital that the JOBS Act regulations are meant to provide. Time will tell if the placement agent industry suffers as a result of general solicitation or if instead investors depend more on placement agents and other resources to distinguish the most reputable funds from all other funds offered publicly.
A fund may rely on the safe harbors of Regulation D and Regulation S concurrently to ensure that its offering and sale is exempt from the registration requirements of the Securities Act. The Regulation S safe harbor is for securities that are offered and sold outside the United States. Offers and sales made outside of the U.S. are not deemed to be subject to the registration requirements of the Securities Act, whether or not the purchasers are U.S. persons or foreign investors, as long as the conditions of Regulation S are met, namely that the transaction is offshore and that there are no “directed selling efforts” (effectively, that there be no general solicitation or general advertising, as referenced in Regulation D). It should be noted that while the JOBS Act changed Regulation D to no longer prohibit “general solicitation,” the “no directed selling efforts” requirement of Regulation S remains intact.
One final note on “general solicitation” and “directed selling efforts”: SEC Rule 135e permits non-U.S. funds to hold non-U.S. press conferences and
IMPACT INVESTING PRIVATE EQUITY FUND INDUSTRY: LEGAL CONSIDERATIONS 48| APPENDIX C
meetings discussing a proposed offering of unregistered securities (in reliance on Regulation D or Regulation S) if (i) the intent is to make a bona fide offering outside the U.S. (which can be concurrent with a U.S. offering) and (ii) access is given to both U.S. and non-U.S. press. Such press conferences and the like are not considered “general solicitation” or “directed selling efforts.”
Exempt private placement offerings of securities are still subject to anti-fraud provisions of U.S. federal securities law under Rule 10b-5 of the Exchange Act. Rule 10b-5 promotes full disclosure in connection with offers and sales of securities and prohibits the making of any untrue statement of a material fact and prohibits the omission of any material fact necessary to make the statements not misleading. These anti-fraud rules need to be considered by a fund sponsor in particular when crafting the fund’s private placement memorandum, including any risk factors, offering legends, track record disclosure (particularly net v. gross disclosure), and when disclosing new developments in a supplement to the private placement memorandum.
b. Fund management
Investment advisers (or fund managers) are entities that are in the business of, and are compensated for, giving advice—either directly or through publications—regarding securities. The Advisers Act and the rules promulgated thereunder regulate a fund’s investment adviser and require certain investment advisers to register with the SEC and others to have “exempt reporting adviser” (or “ERA”) status. Many investors will only invest with fund managers who are registered under the Advisers Act, as it gives them comfort that their fund managers are being sufficiently regulated. Both full registration and ERA status subject an investment adviser to certain reporting requirements; but full registration status is more onerous and carries numerous other requirements, including SEC examination of books and records (although ERA status still subjects an adviser to SEC examination for cause). Registered advisers are prohibited from charging performance fees except to “qualified clients” (investors who have at least $1 million in assets under management or a net worth of more than $2 million) and from advertising. All investment advisers, whether registered or not, must comply with the anti-fraud rules of the Advisers Act.
The Dodd-Frank Wall Street Reform and Consumer Protection Act (the “Dodd-Frank Act”) amended the Advisers Act, most significantly by repealing the private adviser exemption which previously permitted fund managers with fewer than 15 funds under management to claim exemption from registration under the Advisers Act. Now there are two new exemptions: the foreign private adviser exemption (only available to advisers with no place of business in the U.S. and less than $25 million in aggregate assets under management attributable to U.S. investors) and the private fund adviser exemption (a
IMPACT INVESTING PRIVATE EQUITY FUND INDUSTRY: LEGAL CONSIDERATIONS 49| APPENDIX C
conditional exemption for advisers who act solely for private funds and who have less than $150 million of AUM in the U.S.). Investors in funds whose managers qualify for such exemptions are less likely to be concerned about the regulation of such fund managers by the SEC. “Pay-to-play” rules have also targeted the practice of investment advisers making or arranging (or being solicited to make) political contributions while also seeking investment advisory business from a governmental body, which has an effect on investment advisers managing assets for US state and local government bodies. These include public pension plans, state college savings plans, or state and local employee savings plans. Advisers are prohibited from providing services to a government entity for two years after the adviser or any covered associate makes a contribution to an official of the government entity. The pay-to-play prohibition also restricts the use of placement agents, solicitors, and finders.
c. Fund ownership
A separate securities law statute applies to the fund itself, as opposed to the offer of securities in the fund or to the fund manager. The Investment Company Act regulates the ownership of securities. The Investment Company Act generally requires registration for “investment companies,” i.e., issuers (such as private funds or mutual funds) that hold themselves out as being engaged primarily in the business of investing or trading in securities. While mutual funds generally register under the Investment Company Act, certain exceptions from registration as an investment company with the SEC are made for funds being privately offered with limited numbers of beneficial owners (the “3(c)(1)
exemption”) or funds whose owners are all “qualified purchasers” (the “3(c)(7)
exemption”).
“Qualified purchaser” status relies on the net value of the individual or entity that is the beneficial owner reaching a certain minimum (a minimum that is much higher than the net value requirements of “accredited investor” status under the Securities Act). “Qualified purchasers” generally refer to natural persons or companies owning $5 million in investments; investment managers investing $25 million in assets; and “knowledgeable employees,” i.e., executive officers and directors of a fund or fund manager and non-clerical employees of a fund or fund manager who participate in investment activities.
Smaller private funds that do not anticipate a large number of investors (subject to certain look-through provisions to an investor’s beneficial owners) and that do not propose to make a public offering of their securities may utilize the 3(c)(1) exemption, but generally the 3(c)(7) exemption is utilized whenever possible as it does not require the fund to concern itself with the 100-beneficial owner limit of 3(c)(1). A fund may rely on both 3(c)(1) and 3(c)(7) concurrently. Furthermore, a non-U.S. fund may rely on either exemption and needs to concern itself only with its U.S. investors to determine compliance with either exemption.
IMPACT INVESTING PRIVATE EQUITY FUND INDUSTRY: LEGAL CONSIDERATIONS 50| APPENDIX C
Finally, the Exchange Act (as modified by the JOBS Act) limits private fund ownership to 2,000 persons in total or 500 persons who are not accredited investors. If either such limit is exceeded, funds must register their interests under the Exchange Act. However, funds are generally in the business of making investments rather than marketing their fund to as many investors as possible—marketing is just a means to the end. Thus, in practice, due to the nature of private funds and their typically limited offering periods, ownership does not come close to reaching such limits.
d. Fund marketing
Anyone who sells the interests in a private fund (with certain limited exemptions for a fund selling its own securities without the use of a third-party marketer) is also subject to its own securities regulation. The Exchange Act imposes registration requirements on broker-dealers, including placement agents. Under Section 15(a), it is unlawful for any person meeting the definition of “broker” or “dealer” to effect transactions in any security unless registered, though specific safe harbors from broker-dealer registration are recognized. A private fund not utilizing a registered broker-dealer but instead selling its own securities may rely on the issuer exemption. An issuer may sell its own securities as it is not a “broker” (because the securities are not being sold for the account of others) and it is not a “dealer” (because it is not both buying and selling the securities, but rather distributing them directly to investors). SEC Rule 3a4-1 provides a safe harbor exemption for placement activities by a fund’s “associated persons”: namely, natural persons who control, are controlled by, or have common control with the issuer and who (i) do not receive transaction-based compensation, (ii) are not an associated person of a broker-dealer, and (iii) are not otherwise subject to statutory disqualification. In addition:
(a) Securities may only be offered and sold to certain financial institutions and intermediaries.
(b) Only “passive sale” activities may take place.
(c) The associated person must have substantial business duties unrelated to securities sales and participate in placement activities no more than once every 12 months.
Although the focus of this brief has been on U.S. funds, it is worthwhile noting that, although the U.S. securities laws on marketing do not distinguish impact investment funds from other fund offerings, the European Union has established a regime, the Regulation on European Social Entrepreneurship Fund (EuSEF) for marketing sub-€500 million private investment funds at least 70% of the capital commitments of which is invested, via equity or debt structures, in investments that provide services or goods to vulnerable, marginalized, disadvantaged, or excluded persons; employ a method of production of services
IMPACT INVESTING PRIVATE EQUITY FUND INDUSTRY: LEGAL CONSIDERATIONS 51| APPENDIX C
that embodies their social objective; and provide financial support exclusively to such social undertaking. EuSEF will permit smaller social-impact fund managers to benefit from the AIFMD passport regime and market their funds throughout the EEA, thereby making it quicker and easier for such fund managers to raise capital, as well as increasing the confidence of investors that wish to make impact investments.
e. The Volcker Rule
The Volcker Rule is a provision of the Dodd-Frank Act that amended the Bank Holding Company Act to prohibit certain banking entities (and their affiliates and subsidiaries) from acquiring or retaining any ownership interest in, or sponsoring, a hedge fund or a private equity fund. An issuer is deemed to be a “hedge fund” or a “private equity fund” for purposes of the Volcker Rule if it would be an investment company under the Investment Company Act but for the 3(c)(1) or 3(c)(7) exemptions discussed above. Thus, most private funds are caught by the Volcker Rule, though the final rules implementing the Volcker Rule have yet to take effect. Some banks have spun out their private fund businesses in reaction to the Volcker Rule, while others are biding their time until the final rules are implemented.
f. FCPA & Anti-Bribery
The Foreign Corrupt Practices Act is not securities law legislation directed at private funds per se, but U.S. fund issuers (and their non-U.S. subsidiaries) need to ensure compliance with the FCPA, particularly when reviewing the qualification of investors subscribing to a fund. The FCPA originated out of the Watergate scandal, following which the government investigated widespread use of improper payments and found that over 400 companies, including about 20% of the Fortune 500, made “questionable” foreign payments to foreign government officials, politicians, and political parties totaling more than $300 million. The FCPA, signed into law in 1977, has two principal provisions: anti-bribery prohibitions, prohibiting bribery of non-U.S. government officials; and books and records requirements, requiring U.S. issuers to maintain accurate books and records and reasonable accounting controls (this latter requirement is actually an amendment to the Exchange Act discussed above). Violations of the FCPA can lead to both criminal and civil penalties, with dual enforcement vested in the U.S. Department of Justice and the SEC.
IMPACT INVESTING PRIVATE EQUITY FUND INDUSTRY: LEGAL CONSIDERATIONS 52| APPENDIX D
3(c)(1) exemption | The private investment company exemption from registration as an investment company under the Investment Company Act for issuers conducting private offerings only with limited number of beneficial owners (not more than 100 persons, which includes both natural persons and companies).
3(c)(7) exemption | The exemption from registration as an investment company under the Investment Company Act for issuers conducting private offerings only with owners who are all “qualified purchasers.”
501(c)(3) organizations | Organizations that qualify as tax-exempt under Section 501(c)(3) of the Code.
Accredited investors | Individuals, trusts, corporations, pension plans, and other entities who satisfy stipulated income or net value tests, typically entities with total assets greater than $5 million and individuals with net worth greater than $1 million.
Advisers Act | The Investment Advisers Act of 1940, as amended.
Advisory Committee | A committee to the fund composed of a small number of limited partners, which may have certain consultation and/or approval rights as described in the fund’s operating agreement. See also Appendix B.
AIFMD | The Alternative Investment Fund Managers Directive of the European Union, which entered into force on July 21, 2011, and was due to be transposed into national law within the EEA by July 22, 2013 (although not all EEA member states have done so). AIFMD aims at establishing common requirements governing the authorization and supervision of alternative investment fund managers in order to provide a coherent approach to the related risks and their impact on investors and markets in the EEA. The issues raised by AIFMD must be addressed by all fund managers globally whenever marketing to investors in the EEA.
Anchor investors | Generally, the first third-party investor(s) committing a significant amount of capital to an investment fund, though such investment may not be made until after the first closing of the fund.
AUM | Assets under management.
Benefit Corporation | Generally, a type of for-profit entity, which, in addition to seeking profit, has a social welfare or environmental purpose.
APPENDIX D: GLOSSARY
IMPACT INVESTING PRIVATE EQUITY FUND INDUSTRY: LEGAL CONSIDERATIONS 53| APPENDIX D
Bridge investments | Short-term investments by a fund in an underlying portfolio company. See also Appendix B.
Capital commitments | The amount of money that an investor agrees to contribute to an investment fund, typically in the investor’s subscription agreement with the fund. See also Appendix B.
Carried interest (or carry) | Any amount of an investor’s allocated profit distributed to the fund sponsor, i.e., the amount of profit that the general partner receives (outside of the profit it makes on its own capital commitment) on the fund’s realized investments.
CFTC | The U.S. Commodity Futures Trading Commission.
Clawback | The amount of carry that a general partner (or carried interest partner, as applicable) must return to the fund, to be re-distributed to the limited partners, in the event that, when fund distributions to date are calculated on an aggregate basis (typically at liquidation, but a fund may provide for earlier, interim clawback calculations), the general partner has received carry but the limited partners have not received their full return of capital and preferred return, or the general partner has received more than its allotted carry percentage (e.g., over 20%).
Closed-end, blind-pool investment vehicles | Issuers of investment (typically equity) securities to third-party investors, who make their commitment for a fixed term and do not know what the specific investments will be that the issuer makes prior to their commitments to the issuer.
Closing | The time at which a fund issues limited partnership interests to investors who have subscribed for investment in the fund. See also Appendix B.
Code | The U.S. Internal Revenue Code of 1986, as amended.
Controlled foreign corporation (“CFCs”) | A non-U.S. entity classified as a corporation for U.S. federal income tax purposes, if greater than 50% of the total vote or value of the non-U.S. entity is owned (applying certain attribution rules), in the aggregate, by U.S. shareholders that each own (in each case, applying certain attribution rules) 10% or more of the total combined voting power of all classes of stock of such corporation.
Critical change in circumstances | A condition, such as serving an illegal purpose or a private purpose of the private foundation or its manager, which may result in an investment ceasing to qualify as a PRI.
Deal-by-deal waterfall (or investment-by-investment waterfall) | Distribution waterfall whereby distributable proceeds are allocated and distributed solely with respect to the investment generating the proceeds, rather than across all prior investments, which structure may permit the general partner to receive carry with respect to an individual investment notwithstanding that investors may not have

IMPACT INVESTING PRIVATE EQUITY FUND INDUSTRY: LEGAL CONSIDERATIONS 54| APPENDIX D
received a return of all of their prior capital contributions. Sometimes referred to in Europe as an “American-style” waterfall.
Debt-financed property | Generally, property held to produce income (including gain from its disposition) for which a portion of acquisition cost is financed by borrowed funds.
Default | When an investor does not fund the capital call issued to it by a fund manager, it is deemed to be in default. See also Appendix B.
DFI | Development finance institution.
Distribution waterfall | The fund structure that determines the allocation and distribution as between the investors and the general partner of the distributable proceeds of a fund, including operating income, dividends, and capital proceeds.
Dodd-Frank Act | The Dodd-Frank Wall Street Reform and Consumer Protection Act.
Drawdown notice | Notification from a fund manager to an investor that a capital call to investors is being made, which typically must be funded either directly or by offset of distributable proceeds within 10 business days.
Economic terms | Refers to all of the economic terms and conditions specified in the limited partnership agreement of the fund, in particular the management fee and the distribution waterfall.
EEA | European Economic Area, which consists of the member states of the European Union and three of the four member states of the European Free Trade Association (Iceland, Liechtenstein, and Norway).
ERA | Exempt reporting adviser under the Advisers Act.
ERISA | The U.S. Employee Retirement Investment Security Act of 1974, which is particularly relevant for purposes of fund investments made by U.S. private pension plans. ERISA imposes stringent fiduciary standards of conduct in furtherance of its primary goal of safeguarding the interests of participants and beneficiaries of employee benefit plans.
ESG | Environmental, social and corporate governance.
EuSEF | European Social Entrepreneurship Fund.
Excess business holdings | Generally, a portion of a private foundation’s investment in a corporation or other entity conducting a business that is not substantially related to the exempt purposes of the private foundation and exceeds 20% of the voting power of such a corporation (or 20% of the beneficial or profits interests in such an unincorporated entity).
Exchange Act | The Securities Exchange Act of 1934, as amended.

IMPACT INVESTING PRIVATE EQUITY FUND INDUSTRY: LEGAL CONSIDERATIONS 55| APPENDIX D
FCPA | The Foreign Corrupt Practices Act.
Feeder funds | Special purpose vehicles through which one or more investors invest in a fund, formed to accommodate those investors’ tax or other considerations. See also Appendix B.
Fiscally transparent entity | Generally, an entity that is not subject to tax itself, but whose income, losses, credits and deductions flow through to, and are included currently in the income of, the equity investors in the entity as if the items were realized directly by such equity investors.
Flexible Purpose Corporations | Generally, a California corporation that meets certain requirements and specifies in its charter that it has a “special purpose,” which can include a charitable or public purpose.
FOIA | The U.S. Freedom of Information Act, requiring certain investors (such as public pension plans) to provide otherwise confidential information about their investments.
Fund vehicles | All of the lower-tier entities comprising the fund through which investors invest in the fund and the fund makes its investments in portfolio companies. A simple fund may have only one vehicle, in which all investors invest and through which it makes all of its investments directly. Larger funds, accommodating investors globally and making investments globally, may have more complicated structures, including parallel funds, feeder funds and alternative investment vehicles.
Fund-of-funds | An investment strategy of holding a portfolio of other investment funds rather than investing directly in portfolio companies. See also Appendix A.
Fundraising period | The initial, limited period of time during which a fund offers limited partnership interests to prospective investors. See also Appendix B.
General partner (or GP) | Given that U.S. private equity funds are typically formed as limited partnerships, the “general partner” refers to the sponsor entity, usually a newly formed special purpose vehicle in which the exclusive power to manage the fund is vested (which power the general partner may delegate to the investment manager) and which has unlimited liability with respect to the fund’s debts and obligations.
Giveback (or limited partner clawback (chiefly British)) | The amount of returned capital or other distributions that a limited partner may be obligated to return in order to assist the fund in satisfying its liabilities, often limited to liabilities incurred as a result of the fund’s indemnification obligations. The giveback may be limited as to time (typically anywhere between two years after receipt of a distribution and three years following the fund’s termination) and as to amount (set as a percentage of the capital commitment of the limited partner or the distributions received by the limited partner).
IMPACT INVESTING PRIVATE EQUITY FUND INDUSTRY: LEGAL CONSIDERATIONS 56| APPENDIX D
Governance terms | Refers to all of the terms and conditions specified in the limited partnership agreement of the fund, which describe in detail the parameters of what the fund can and cannot do. Colloquially, reference to a fund’s governance does not include its economic terms. Governance may be described, in a modified manner, in the “term sheet” of a fund’s private placement memorandum, but the term sheet may omit many carve-outs and exceptions to the terms and conditions contained in the limited partnership agreement. See also Appendix B.
“High water mark” test | Because investors in open-ended funds (which is how hedge funds are typically structured) may acquire and divest themselves of an interest in such funds at different points in time from each other, hedge funds must rely upon the so-called “high water mark” test to determine whether or not any performance fee to the fund manager is applicable to an investor’s interest. A performance fee may only be paid to the fund manager in respect of any interest held by the investor if the net value of the investor’s interest in the fund has increased since the later of the time of the investor’s contribution to the fund and the time the last performance fee was paid to the fund manager with respect to such interest.
ILPA | Institutional Limited Partner Association.
ILPA Principles | A description of standards for key terms in private equity funds that are generally desirable from an institutional investor’s perspective.
Impact investments | Investments made to generate social and environmental impact as well as a financial return to their investors.
Information rights | Refers to the investors’ rights to all information, particularly financial reports, about the fund and its investments as specified in the limited partnership agreement of the fund.
Investment companies | Issuers, such as private funds or mutual funds, that hold themselves out as being engaged primarily in the business of investing or trading in securities. They are required to register under the Investment Company Act unless an exemption can be utilized.
Investment Company Act | The Investment Company Act of 1940, as amended.
Investment period (or commitment period) | The period of time during which the fund manager may drawdown capital commitments for investment in underlying portfolio companies. See also Appendix B.
IRS | The U.S. Internal Revenue Service.
Jeopardizing investments | Investments that will jeopardize a private foundation’s ability in both the short and long term to fulfill its charitable purposes. Jeopardizing investments could lead to the imposition of excise taxes.
JOBS Act | The Jumpstart Our Business Startups Act of 2012.
IMPACT INVESTING PRIVATE EQUITY FUND INDUSTRY: LEGAL CONSIDERATIONS 57| APPENDIX D
Limited partners (“LPs”) | Private equity fund investors, called “limited partners” in reference to the typical structure of their investment in a fund as limited partners in a limited partnership.
Low-profit Limited Liability Companies (“L3Cs”) | Generally, a for-profit limited liability company that is specifically organized to further one or more charitable or educational purposes to facilitate PRIs.
Management fee | An annual fee, paid quarterly or semi-annually, either in advance or in arrears, by the fund to the fund manager calculated as a percentage of the fund’s assets, to ensure a steady stream of income to the management team and cover various costs incurred by the principals in the operation of their business.
Organizational and offering expenses | Expenses incurred in forming and marketing the fund and any related vehicles, including printing, travel, legal, accounting, and filing fees and costs.
Overseas Private Investment Corporation (“OPIC”) | The U.S.’s development finance institution.
Parallel funds | Two or more investment vehicles through which investors subscribe to a private fund, each vehicle being formed to cater to the tax and jurisdiction of the anticipated investors. See also Appendix B.
Passive foreign investment company (“PFIC”) | Generally, a non-U.S. entity classified for U.S. federal income tax purposes as a corporation that meets either of the following tests for any taxable year: (1) 75% or more of its gross income is “passive income,” or (2) 50% or more of its assets, based on their average value for the year, are held for the production of passive income.
Performance fee (or incentive allocation) | Any profit that a hedge fund or other open-ended vehicle pays to its sponsor on a periodic basis, typically subject to a “high water mark” test.
Phantom income | The recognition of income without the contemporaneous receipt of cash sufficient to pay the corresponding tax liability.
Plan assets | The presence or absence of plan assets is crucial in determining whether the fiduciary standards imposed by ERISA apply to a particular fund. Generally, when a U.S. private pension plan invests in another entity, its assets include the investment, but not any of the underlying assets of the entity. In the case of a U.S. private pension plan’s investment in an equity interest of a privately-offered fund that is not registered under the Investment Company Act, its assets include both the equity interest (its LP interest in the fund) and an undivided interest in each of the underlying assets of the fund (the fund’s portfolio companies), unless it is established that either the fund is an operating company (the so-called VCOC or REOC exemptions) or equity participation in the fund by benefit plan investors is not significant (the so-called 25% test).

IMPACT INVESTING PRIVATE EQUITY FUND INDUSTRY: LEGAL CONSIDERATIONS 58| APPENDIX D
Preferred return (or hurdle rate) | The minimum return that must be received by an investor before any performance-based compensation is paid to the fund manager.
Private offering | Generally, non-public offers and sales of securities to a limited number of qualified investors. Specifically, non-public offers and sales of securities that are exempt from the registration requirements of the Securities Act through utilizing the safe harbors provided by the rules set forth in Regulation D and Regulation S promulgated under the Securities Act.
Private placement memorandum | The primary marketing document of a private equity fund describing the business purpose of the fund. Though not a legally binding document, it still must accurately describe the fund in compliance with anti-fraud rules.
Program related investment (“PRI”) | An exception to the jeopardizing investment rules. For an investment to qualify as a PRI, it must meet the following requirements: (1) the primary purpose of the investment is to accomplish one or more exempt purposes of the foundation, (2) production of income or appreciation of property is not a significant purpose of the investment, and (3) no lobbying activity will be supported.
Qualified clients | Investors who have at least $1 million in assets under management or a net worth of more than $2 million; defined in the Advisers Act.
Qualified purchasers | Highly sophisticated persons that are able to invest in private investment funds relying on the 3(c)(7) exemption, including: natural persons and family-owned companies with at least $5 million in investments; other companies with at least $25 million in investments; certain trusts in which the trustee and each settler are qualified purchasers; companies owned solely by qualified purchasers; qualified institutional buyers (QIBs), including registered investment companies and similar institutions that own and invest on a discretionary basis at least $100 million of unaffiliated securities; and “knowledgeable employees,” such as executive officers and directors of a fund or fund manager and other non-clerical employees of a fund or fund manager who participate in the fund’s investment activities.
Recycling | The ability of a fund to re-deploy capital that has been or could be distributed to its investors. See also Appendix B.
REOC | Real estate operating company.
SEC | The Securities and Exchange Commission.
Securities Act | The Securities Act of 1933, as amended.
Shadow banking | Non-bank credit activity, which performs many of the same functions but is not regulated in the same way as banking.
Side letters | A separate agreement entered into by a fund and an investor that alters or augments the terms of its investment in the fund.
IMPACT INVESTING PRIVATE EQUITY FUND INDUSTRY: LEGAL CONSIDERATIONS 59| APPENDIX D
Special limited partner (or carried interest partner) | A special purpose vehicle through which a fund sponsor will invest in the fund and which, in lieu of the general partner, receives all carry distributions. This structure ensures that any carry received is not subject to the unlimited liability of the general partner.
Sponsor | General term of reference for the investment firm forming a private fund.
Subscription agreement (or subscription deed) | The contract between the investor and the fund pursuant to which the investor commits to contributing a certain amount of money (its capital commitment) to the fund when called; agrees to the terms of the limited partnership agreement or other operative agreement governing the fund; and makes certain representations, warranties, and other undertakings concerning its status in order that the fund may ensure that it complies with various tax, regulatory, and other requirements.
Successor fund | A fund having the same investment purpose as an existing fund of a fund sponsor, but raised because the existing fund’s investment period has terminated and it no longer has the ability to raise new capital and seek new investments. See also Appendix B.
U.S. tax-exempt investors | U.S. investors that are generally exempt from taxation under Section 501 of the Code, including private foundations.
United Nations Principles for Responsible Investment (“UNPRI”) | Voluntary and aspirational actions for incorporating ESG issues into investment practices across asset classes.
Unrelated business taxable income (“UBTI”) | Generally, except with respect to certain categories of exempt trading activity, UBTI for any U.S. tax-exempt investor includes: (i) income or gain derived from a trade or business owned directly or through entities treated as fiscally transparent for U.S. federal income tax purposes, the conduct of which is substantially unrelated to the exercise or performance of such investor’s exempt purpose or function; (ii) income derived by such investor from debt-financed property; and (iii) gains derived by a such investor from the disposition of debt-financed property.
VCOC | Venture capital operating company.
Whole fund waterfall (or return of capital waterfall) | Distribution waterfall whereby distributable proceeds are allocated and distributed with respect to all prior investments, irrespective of the investment generating the proceeds, which structure provides that all capital contributions of investors are returned before the general partner begins to receive any of carried interest. Sometimes referred to in Europe as a “European-style” waterfall.

2016 THE SIXTH EDITION
Annual Impact Investor Survey

IA N N U A L I M P A C T I N V E S T O R S U R V E Y 2 0 1 6
2016 Annual Impact Investor Survey
Authored by the GIIN Research TeamAbhilash Mudaliar, Director
Hannah Schiff, Manager
Rachel Bass, Associate
About the Global Impact Investing Network (GIIN)The GIIN is a nonprofit organization dedicated to increasing the scale and effectiveness of impact investing. Impact investments are investments made into companies, organizations, and funds with the intention to generate social and environmental impact alongside a financial return. The GIIN builds critical infrastructure and supports activities, education, and research that help accelerate the development of a coherent impact investing industry. For more information, see www.thegiin.org.
Acknowledgements
SponsorsThis year, we begin a new stage of the long and fruitful partnership between the GIIN and J.P. Morgan on this report. In previous years, J.P. Morgan’s Social Finance team has worked side-by-side with the GIIN to shape the survey questions, analyze the data, and draft the report. Their team has played a pioneering role in developing this important research. While this year we are excited to have taken on the execution of the project fully in-house, J.P. Morgan has continued to provide valuable support as an anchor sponsor.
The study was also produced with support from the U.K. Government through the Department for International Development’s Impact Programme.
Research supportThe Research Team would like to recognize the contributions of various members of the broader GIIN Team. We thank Rebecca Kurland for desk research on key market developments in 2015. For review and input we thank Susan Balloch, Amit Bouri, Ari Cohen, Giselle Leung, Kelly McCarthy, Kimberly Moynihan, Sapna Shah, and Wen-Hua Yang.
Beta testersThe survey instrument was beta-tested by Liz Adams of the Lyme Timber Company, Amy Bell and Ali El Idrissi of J.P. Morgan, Claudia Belli and Jacky Prudhomme of BNP Paribas, Huib-Jan de Ruijter of FMO, Cindy Hu of Prudential, Christine Looney of the Ford Foundation, Urmi Sengupta of the MacArthur Foundation, Bhairvee Shavdia of HCAP, and Julie Shea of Root Capital.
Additionally, several GIIN team members beta-tested the survey instrument and provided valuable feedback: Ari Cohen, Giselle Leung, Kelly McCarthy, Peter Murphy, Annie Olszewski, Sapna Shah, Andrew Siwo, and Brett Stevenson.
May 2016
USD 15.2 billion
7,551 impact investmentsin 2015
committed by 157 respondents to

IIIA N N U A L I M P A C T I N V E S T O R S U R V E Y 2 0 1 6
Letter from the CEO
Dear readers,
We live in a data-driven world. This is certainly true in the investing world. And it is especially true in impact investing, a rapidly growing practice of using investments to drive critical social and environmental change. Impact investing, while deeply rooted in both the heart and the head, is a movement where data can play a key role in guiding us to a better world.
As such, I am pleased to introduce the 2016 Annual Impact Investor Survey. This is the sixth edition of our landmark report, the world’s most comprehensive annual survey of the impact investing market. Each year we look to build on previous surveys, to support those already making impact investments, and help orient those looking to start. This year’s research includes important information around investor perspectives, highlighting respondent views on topics such as impact measurement, liquidity and other key challenges, and investment decision-making processes.
Reflecting momentum that has been indicated in various other forms—interest from multiple governments and global leaders, increased media coverage, and a growing GIIN membership body that now includes over 220 organizations across the world—this research shows significant activity in 2015, as well as investor plans to increase commitments in 2016. While signs of growth are important and encouraging, we want to celebrate more than growth alone; I am particularly excited by this survey’s important data about gains in market sophistication.
The respondents, a diverse and active group of impact investors, noted progress against key areas of development in the impact investing industry. They reported seeing more research and data available, improvements in the availability of trained professionals, and more high-quality investment opportunities. Additionally, as impact measurement is a core component of impact investing, we at the GIIN are especially encouraged to note that 99% of respondents report that they measure impact, with 65% using metrics aligned with IRIS, the GIIN’S catalog of social and environmental metrics.
A key takeaway I’d like to emphasize is that the data show impact investing is no longer a nascent market. Investors around the world have been hard at work to grow and improve this market—demonstrating that investments can and should be directed toward addressing some of the most pressing social and environmental challenges. And with momentous levels of importance being placed on the COP21 climate agreement and the United Nation’s Sustainable Development Goals, impact investing’s coming of age is particularly timely given the clear role impact investors can play in advancing such global efforts. We thank impact investors for their leadership. And we thank you for your readership.
I welcome your thoughts and reactions.
Amit Bouri CEO, Global Impact Investing Network [email protected]
The respondents,
a diverse and active
group of impact
investors, noted
progress against key
areas of development
in the impact
investing industry.
IV G L O B A L I M P A C T I N V E S T I N G N E T W O R K
Methodology ............................................................................................................................VIII
Executive Summary ................................................................................................................. X
Sample Characteristics ........................................................................................................... 1
Headquarters locations...................................................................................................................................... 1
Organization type ................................................................................................................................................2
Year of first impact investment .......................................................................................................................3
Target returns sought .........................................................................................................................................3
Investment Activity ..................................................................................................................5
Capital committed since inception ..............................................................................................................5
Activity in 2015 and plans for 2016 ...............................................................................................................5
Repeat respondents ............................................................................................................................................7
State of the Impact Investing Market ................................................................................ 8
Progress on indicators of market growth ...................................................................................................8
Challenges ..............................................................................................................................................................9
Asset Allocations and Future Plans ..................................................................................12
Assets under management ............................................................................................................................12
AUM by organization type ............................................................................................................................13
AUM by geographic focus ............................................................................................................................13
AUM by sector ................................................................................................................................................... 17
AUM by instrument ..........................................................................................................................................19
AUM by stage of business .............................................................................................................................21
The Intermediary landscape .............................................................................................. 23
Motivations for investing through funds ................................................................................................. 23
Considerations when evaluating fund managers ................................................................................ 24
Assessment of fund manager skills ............................................................................................................ 24
Fund manager activity .................................................................................................................................... 25
Targeting and Measuring Social and Environmental Impact .................................. 32
Impact goals ........................................................................................................................................................ 32
Impact strategies ............................................................................................................................................... 35
Impact management and measurement practices ............................................................................. 35
Table of Contents
VA N N U A L I M P A C T I N V E S T O R S U R V E Y 2 0 1 6
Investment Performance .....................................................................................................40
Target financial returns ....................................................................................................................................40
Performance relative to expectations ........................................................................................................41
Private equity exits ............................................................................................................................................ 42
Responsible exits ...............................................................................................................................................44
Risk ..........................................................................................................................................................................46
Liquidity................................................................................................................................................................. 47
Investment Decision-Making ..............................................................................................49
Motivations for allocating capital to impact investments ................................................................49
Investment committee ....................................................................................................................................49
Due diligence ......................................................................................................................................................50
Use of investment advisors ............................................................................................................................51
2015 Market Development Boxes
Notable New Entrants and Activity .............................................................................................................4
U.S. Regulations .................................................................................................................................................. 11
Research on Impact Investing in Africa ....................................................................................................16
Impact Investing and the Sustainable Development Goals ...........................................................30
Climate Finance ................................................................................................................................................ 39
Financial Performance Research ................................................................................................................48
Appendix 1. List of Survey Respondents ........................................................................ 53
Appendix 2. List of Definitions Provided to Survey Respondents ......................... 55

VI G L O B A L I M P A C T I N V E S T I N G N E T W O R K
List of TablesTable i: Respondent sub-groups referenced in the report .................................................................................................... IX
Table ii: Region codes ............................................................................................................................................................................ IX
Table iii: Sector codes ............................................................................................................................................................................. IX
Table iv: Number and size of investments made and targeted ............................................................................................. X
Table v: Challenges to the growth of the impact investing industry ................................................................................. XI
Table vi: Capital raised in 2015 and planned capital raise in 2016 .....................................................................................XIV
Table 1: Number and size of investments made and targeted ..............................................................................................5
Table 2: Investment activity by organization type .......................................................................................................................6
Table 3: Capital committed and number of deals in 2015 among repeat respondents .............................................. 7
Table 4: Challenges to the growth of the impact investing industry ...................................................................................9
Table 5: AUM statistics by organization type, USD millions ................................................................................................ 13
Table 6: Geographic allocations by various segments ............................................................................................................. 15
Table 7: Sector allocations by various segments ........................................................................................................................ 18
Table 8: Instrument allocation by organization type ................................................................................................................ 20
Table 9: Allocations to real assets sectors ..................................................................................................................................... 21
Table 10: Business stage allocations by various segments........................................................................................................22
Table 11: Motivations for investing through funds/GPs ...........................................................................................................23
Table 12: Capital raised in 2015 and planned capital raise in 2016 ........................................................................................25
Table 13: Fund manager sources of capital (AUM-weighted)...............................................................................................26
Table 14: Average carried interest by asset class ..........................................................................................................................29
Table 15: Select fund data for PE/VC fund managers that have managed three funds ............................................29
Table 16: Motivations for targeting climate-change-related objectives .............................................................................34
Table 17: Water resources management sub-sectors ................................................................................................................34
Table 18: Measurement challenges ....................................................................................................................................................38
Table 19: Gross return expectations for 2015 vintage investments .....................................................................................40
Table 20: Gross return expectations for Market Rate and Below Market respondents for 2015 vintage investments ....................................................................................................................................................41
Table 21: Exit mechanisms and exit types, 2008 - 2015 ............................................................................................................ 44
Table 22: Covenant breaches or material adverse changes experienced in 2015 ......................................................... 46
Table 23: Contributors of risk to impact investment portfolios ............................................................................................. 46
Table 24: Motivations for conventional investors to allocate capital to impact investments ..................................................49
Table 25: Impact investment decision-making processes compared to conventional investment processes ... 50
List of FiguresFigure i: Total AUM by geography .................................................................................................................................................XII
Figure ii: Planned allocation changes by geography during 2016 .......................................................................................XII
Figure iii: Total AUM by sector ..........................................................................................................................................................XIII
Figure iv: Planned allocation changes by sector during 2016 ................................................................................................XIII
Figure v: Distribution of fund size by asset class ........................................................................................................................XV
Figure vi: How social/environmental performance is measured ..........................................................................................XV
Figure vii: Performance relative to expectations .........................................................................................................................XVI
Figure viii: Sample private equity exits by sector, 2008 - 2015 ..............................................................................................XVII
Figure ix: Sample private equity exits by region, 2008 - 2015 .............................................................................................XVII
Figure 1: Map of respondent headquarters locations ...................................................................................................................1
Figure 2: Location of sample headquarters by number of respondents .............................................................................. 2
Figure 3: Organization type by number of respondents ............................................................................................................ 2
Figure 4: Year of first impact investment ........................................................................................................................................... 3
Figure 5: Target financial returns principally sought ...................................................................................................................... 3
Figure 6: Number of respondents that plan to increase, decrease, or maintain level of activity, 2015-2016 .........5
Figure 7: Median capital committed and deals made in 2015 ..................................................................................................6
Figure 8: Reported activity in 2014 and 2015 among repeat respondents .......................................................................... 7
Figure 9: Number of repeat respondents that increased, decreased, or maintained level of activity, 2014-2015 .................................................................................................................................................................... 7
List of Tables and Figures

VIIA N N U A L I M P A C T I N V E S T O R S U R V E Y 2 0 1 6
Figure 10: Progress on indicators of market growth ........................................................................................................................8
Figure 11: Distribution of sample AUM............................................................................................................................................. 12
Figure 12: Total AUM by organization type ..................................................................................................................................... 13
Figure 13: Total AUM by geography .................................................................................................................................................. 14
Figure 14: Number of respondents with allocations to a geography ..................................................................................... 14
Figure 15: Planned allocation changes by geography during 2016 ........................................................................................ 15
Figure 16: Total AUM by sector ............................................................................................................................................................ 17
Figure 17: Number of respondents with allocations to a sector .............................................................................................. 17
Figure 18: Planned allocation changes by sector during 2016 .................................................................................................. 18
Figure 19: Total AUM by instrument ................................................................................................................................................... 19
Figure 20: Number of respondents with any allocations using an instrument ................................................................... 19
Figure 21: Planned allocation changes by instrument during 2016 ....................................................................................... 20
Figure 22: Total AUM by stage of business...................................................................................................................................... 21
Figure 23: Number of respondents with allocations to a stage of business ........................................................................ 21
Figure 24: Minimum waiting period for expected cash flows from real asset investments ..........................................22
Figure 25: Importance of various factors in evaluating fund managers / GPs ...................................................................24
Figure 26: Assessment of fund manager skill ...................................................................................................................................24
Figure 27: Number of current and past funds managed by number of respondents .....................................................25
Figure 28: Number of fund managers who have raised capital from various investor types .......................................26
Figure 29: Fund manager challenges in raising capital .................................................................................................................27
Figure 30: Proportion of investors in first fund who invested in second fund ....................................................................27
Figure 31: Proportion of capital in second fund from investors in first fund .......................................................................27
Figure 32: Number of funds by vintage year ....................................................................................................................................28
Figure 33: Distribution of fund size by asset class ..........................................................................................................................28
Figure 34: Fund term by asset class .....................................................................................................................................................29
Figure 35: Primary impact objectives ..................................................................................................................................................32
Figure 36: Social impact themes targeted by number of respondents .................................................................................33
Figure 37: Environmental impact themes targeted by number of respondents ...............................................................33
Figure 38: Strategies for achieving social and/or environmental impact .............................................................................35
Figure 39: Reasons for measuring social and environmental performance .........................................................................36
Figure 40: How social/environmental performance is measured ............................................................................................36
Figure 41: Do you use data on investees’ social and environmental performance to inform business decisions? ................................................................................................................................................................37
Figure 42: How do you use data on investees’ social and environmental performance to inform business decisions? ................................................................................................................................................................37
Figure 43: Who is principally in charge of managing the social/environmental performance of your investments? ...................................................................................................................................................................37
Figure 44: Target return type by geography of investment ......................................................................................................40
Figure 45: Performance relative to expectations ............................................................................................................................41
Figure 46: Financial performance relative to expectations by geography of investment, target returns sought, and asset class focus..............................................................................................................................42
Figure 47: Sample private equity exits by year ................................................................................................................................42
Figure 48: Sample private equity exits by sector, 2008 - 2015 ..................................................................................................43
Figure 49: Sample private equity exits by region, 2008 - 2015 .................................................................................................43
Figure 50: Initial ownership stake of sample exits, 2008 - 2015 .................................................................................................43
Figure 51: Holding period of sample exits, 2008 - 2015 ..............................................................................................................43
Figure 52: Exit mechanisms, 2008 - 2015 .......................................................................................................................................... 44
Figure 53: Do you believe impact investors have a responsibility to try to ensure the continuity of impact after they exit an investment? ........................................................................................................................... 44
Figure 54: How do you try to ensure continuity of impact at exit? ........................................................................................ 45
Figure 55: Relationship between pursuing the impact intent of the investment and achieving the best financial outcomes at exit......................................................................................................................................... 45
Figure 56: Importance of various liquidity features ........................................................................................................................47
Figure 57: Interest in tools for enabling greater liquidity .............................................................................................................47
Figure 58: How respondents use investment advisors to support their impact investing work .................................. 51
VIII G L O B A L I M P A C T I N V E S T I N G N E T W O R K
Methodology
This report captures data from 158 impact investors collected via a survey distributed between December 2015 and February 2016. Respondents variously answered questions in relation to their activities since inception, specifically in 2015 as well as plans for 2016.
Inclusion criteriaAll respondents represent impact investing organizations, not individual investors. In an effort to ensure that respondents have meaningful experience managing impact investments, survey-eligibility criteria required that respondents either: a) have committed USD 10 million in impact investments since their inception and/or b) have closed at least five impact investing transactions. The GIIN provided its definition of impact investing (see Appendix 2), against which respondents self-reported their eligibility.
Sample overlap with previous surveysThe sample for this survey changes to some extent each year, which is important to consider when comparing findings presented in this report with those from previous surveys. Out of the 158 respondents in this year’s sample, 101 also responded in 2015. The Research Team analyzed this overlapping sub-sample to discern changes in activity of the same set of respondents. This analysis is presented where appropriate.
Data accuracy While the GIIN Research Team conducted basic data checks and sought clarifications as appropriate prior to analysis, all information in this report is based on self-reported data. Respondents were instructed to complete the survey with respect only to their impact investing portfolios. The GIIN provided its definition of ‘impact investing’ as a guide (see Appendix 2), which respondents applied to their portfolios as they saw fit.
Data recodingA handful of survey questions allowed respondents to provide free-form answers. In order to enable more useful interpretation of responses, where underlying meanings were unambiguous, the GIIN Research Team recoded these free-form responses into more uniform categories or themes.
Role of outliersAs is often the case in research, a handful of outliers in a sample can have outsized influence on aggregate findings. Some respondents to our annual survey manage comparatively large impact investing portfolios. Where appropriate and feasible, this report presents analysis both including and excluding outliers in order to enable more nuanced interpretations of findings.
Scoring method for ranked questionsThroughout the survey, there are several questions where respondents ranked a given set of options relative to each other (e.g., most important challenges or most important reasons for tracking impact). This report presents both the overall rank and a ‘score’ for each answer choice intended to represent how close the rankings are to one another. These scores are calculated by weighting each rank by the number of respondents that selected it and summing those weighted totals. For example, if respondents were asked to rank the top three of a set of options, the score for each option = (number that ranked it first × 3) + (number that ranked it second × 2) + (number that ranked it third × 1). In cases with tied scores, tied answer choices will have the same rank.
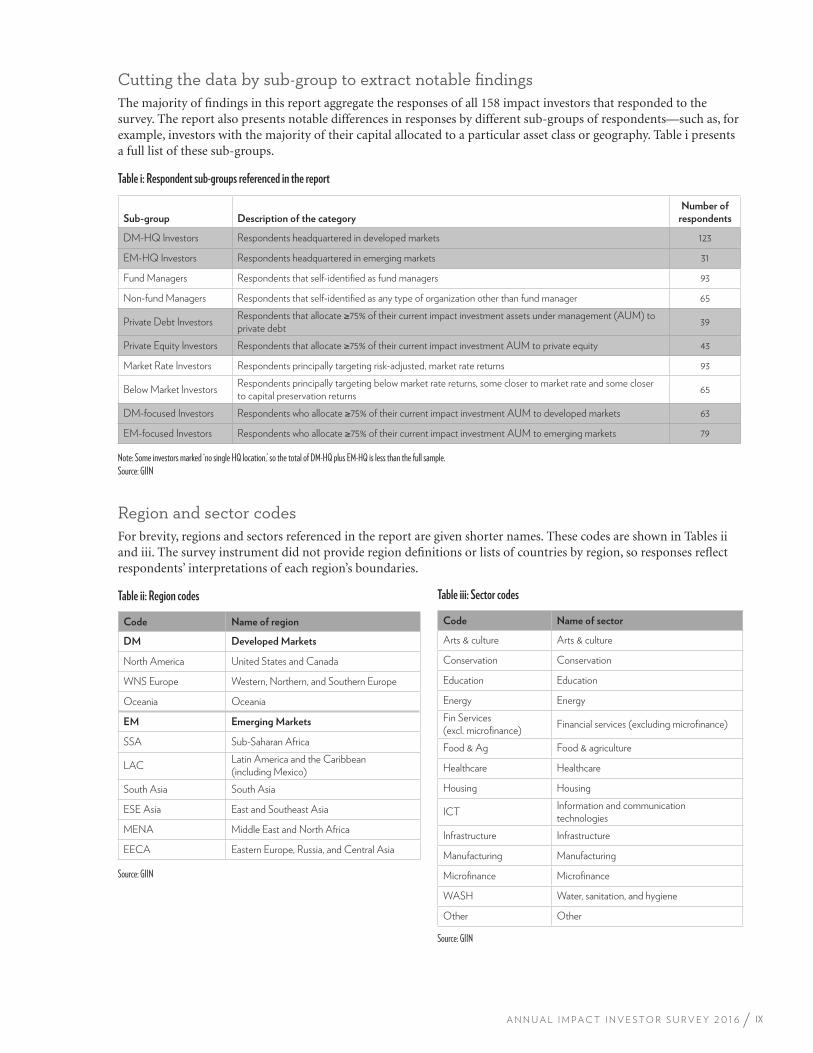
IXA N N U A L I M P A C T I N V E S T O R S U R V E Y 2 0 1 6
Cutting the data by sub-group to extract notable findingsThe majority of findings in this report aggregate the responses of all 158 impact investors that responded to the survey. The report also presents notable differences in responses by different sub-groups of respondents—such as, for example, investors with the majority of their capital allocated to a particular asset class or geography. Table i presents a full list of these sub-groups.
Table i: Respondent sub-groups referenced in the report
Sub-group Description of the categoryNumber of
respondents
DM-HQ Investors Respondents headquartered in developed markets 123
EM-HQ Investors Respondents headquartered in emerging markets 31
Fund Managers Respondents that self-identified as fund managers 93
Non-fund Managers Respondents that self-identified as any type of organization other than fund manager 65
Private Debt InvestorsRespondents that allocate 75% of their current impact investment assets under management (AUM) to private debt
39
Private Equity Investors Respondents that allocate 75% of their current impact investment AUM to private equity 43
Market Rate Investors Respondents principally targeting risk-adjusted, market rate returns 93
Below Market InvestorsRespondents principally targeting below market rate returns, some closer to market rate and some closer to capital preservation returns
65
DM-focused Investors Respondents who allocate 75% of their current impact investment AUM to developed markets 63
EM-focused Investors Respondents who allocate 75% of their current impact investment AUM to emerging markets 79
Note: Some investors marked ‘no single HQ location,’ so the total of DM-HQ plus EM-HQ is less than the full sample. Source: GIIN
Region and sector codesFor brevity, regions and sectors referenced in the report are given shorter names. These codes are shown in Tables ii and iii. The survey instrument did not provide region definitions or lists of countries by region, so responses reflect respondents’ interpretations of each region’s boundaries.
Table ii: Region codes
Code Name of region
DM Developed Markets
North America United States and Canada
WNS Europe Western, Northern, and Southern Europe
Oceania Oceania
EM Emerging Markets
SSA Sub-Saharan Africa
LACLatin America and the Caribbean (including Mexico)
South Asia South Asia
ESE Asia East and Southeast Asia
MENA Middle East and North Africa
EECA Eastern Europe, Russia, and Central Asia
Source: GIIN
Table iii: Sector codes
Code Name of sector
Arts & culture Arts & culture
Conservation Conservation
Education Education
Energy Energy
Fin Services (excl. microfinance)
Financial services (excluding microfinance)
Food & Ag Food & agriculture
Healthcare Healthcare
Housing Housing
ICTInformation and communication technologies
Infrastructure Infrastructure
Manufacturing Manufacturing
Microfinance Microfinance
WASH Water, sanitation, and hygiene
Other Other
Source: GIIN
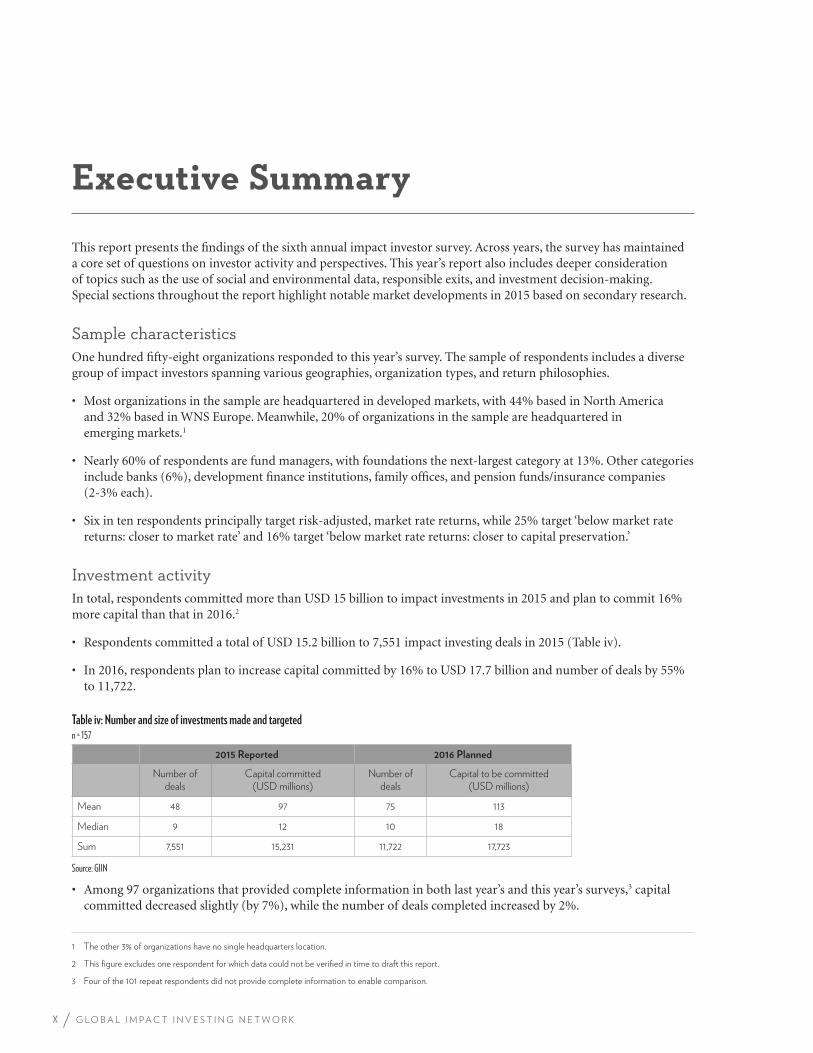
X G L O B A L I M P A C T I N V E S T I N G N E T W O R K
Executive Summary
This report presents the findings of the sixth annual impact investor survey. Across years, the survey has maintained a core set of questions on investor activity and perspectives. This year’s report also includes deeper consideration of topics such as the use of social and environmental data, responsible exits, and investment decision-making. Special sections throughout the report highlight notable market developments in 2015 based on secondary research.
Sample characteristicsOne hundred fifty-eight organizations responded to this year’s survey. The sample of respondents includes a diverse group of impact investors spanning various geographies, organization types, and return philosophies.
• Most organizations in the sample are headquartered in developed markets, with 44% based in North America and 32% based in WNS Europe. Meanwhile, 20% of organizations in the sample are headquartered in emerging markets.1
• Nearly 60% of respondents are fund managers, with foundations the next-largest category at 13%. Other categories include banks (6%), development finance institutions, family offices, and pension funds/insurance companies (2-3% each).
• Six in ten respondents principally target risk-adjusted, market rate returns, while 25% target ‘below market rate returns: closer to market rate’ and 16% target ‘below market rate returns: closer to capital preservation.’
Investment activityIn total, respondents committed more than USD 15 billion to impact investments in 2015 and plan to commit 16% more capital than that in 2016.2
• Respondents committed a total of USD 15.2 billion to 7,551 impact investing deals in 2015 (Table iv).
• In 2016, respondents plan to increase capital committed by 16% to USD 17.7 billion and number of deals by 55% to 11,722.
Table iv: Number and size of investments made and targetedn = 157
2015 Reported 2016 Planned
Number of deals
Capital committed (USD millions)
Number of deals
Capital to be committed (USD millions)
Mean 48 97 75 113
Median 9 12 10 18
Sum 7,551 15,231 11,722 17,723
Source: GIIN
• Among 97 organizations that provided complete information in both last year’s and this year’s surveys,3 capital committed decreased slightly (by 7%), while the number of deals completed increased by 2%.
1 The other 3% of organizations have no single headquarters location.
2 This figure excludes one respondent for which data could not be verified in time to draft this report.
3 Four of the 101 repeat respondents did not provide complete information to enable comparison.
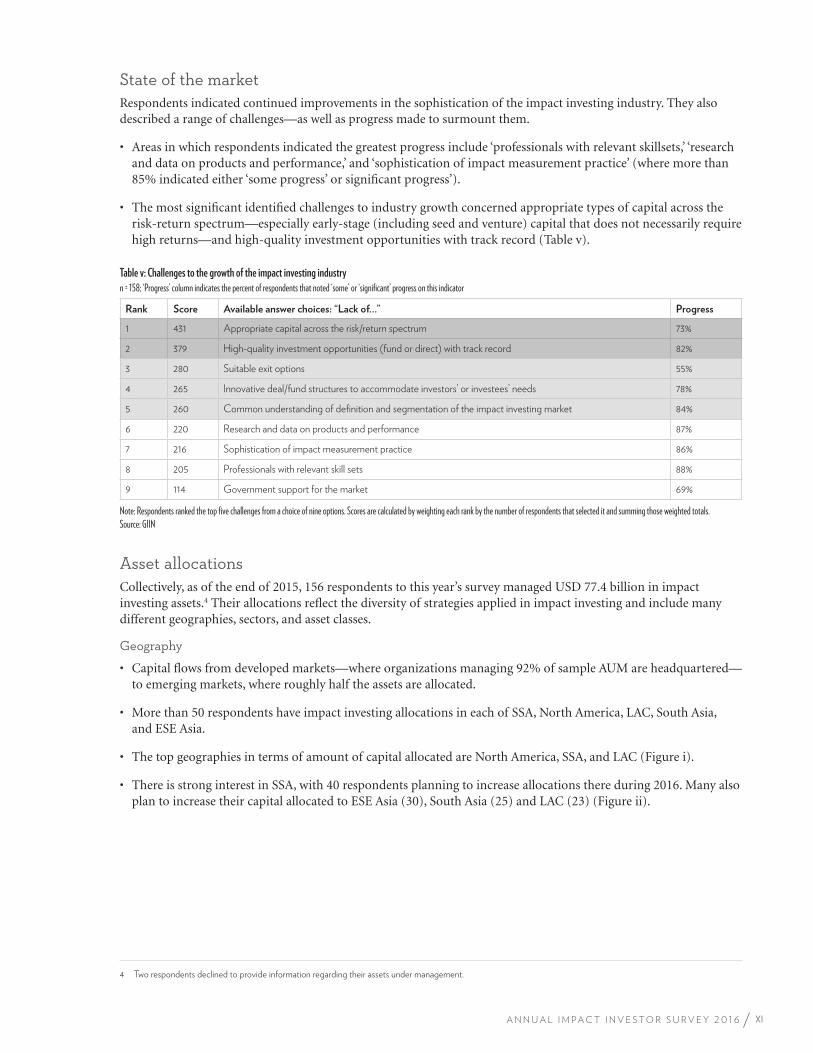
XIA N N U A L I M P A C T I N V E S T O R S U R V E Y 2 0 1 6
State of the marketRespondents indicated continued improvements in the sophistication of the impact investing industry. They also described a range of challenges—as well as progress made to surmount them.
• Areas in which respondents indicated the greatest progress include ‘professionals with relevant skillsets,’ ‘research and data on products and performance,’ and ‘sophistication of impact measurement practice’ (where more than 85% indicated either ‘some progress’ or significant progress’).
• The most significant identified challenges to industry growth concerned appropriate types of capital across the risk-return spectrum—especially early-stage (including seed and venture) capital that does not necessarily require high returns—and high-quality investment opportunities with track record (Table v).
Table v: Challenges to the growth of the impact investing industry
n = 158; ‘Progress’ column indicates the percent of respondents that noted ‘some’ or ‘significant’ progress on this indicator
Rank Score Available answer choices: “Lack of…” Progress
1 431 Appropriate capital across the risk/return spectrum 73%
2 379 High-quality investment opportunities (fund or direct) with track record 82%
3 280 Suitable exit options 55%
4 265 Innovative deal/fund structures to accommodate investors’ or investees’ needs 78%
5 260 Common understanding of definition and segmentation of the impact investing market 84%
6 220 Research and data on products and performance 87%
7 216 Sophistication of impact measurement practice 86%
8 205 Professionals with relevant skill sets 88%
9 114 Government support for the market 69%
Note: Respondents ranked the top five challenges from a choice of nine options. Scores are calculated by weighting each rank by the number of respondents that selected it and summing those weighted totals.Source: GIIN
Asset allocationsCollectively, as of the end of 2015, 156 respondents to this year’s survey managed USD 77.4 billion in impact investing assets.4 Their allocations reflect the diversity of strategies applied in impact investing and include many different geographies, sectors, and asset classes.
Geography
• Capital flows from developed markets—where organizations managing 92% of sample AUM are headquartered—to emerging markets, where roughly half the assets are allocated.
• More than 50 respondents have impact investing allocations in each of SSA, North America, LAC, South Asia, and ESE Asia.
• The top geographies in terms of amount of capital allocated are North America, SSA, and LAC (Figure i).
• There is strong interest in SSA, with 40 respondents planning to increase allocations there during 2016. Many also plan to increase their capital allocated to ESE Asia (30), South Asia (25) and LAC (23) (Figure ii).
4 Two respondents declined to provide information regarding their assets under management.
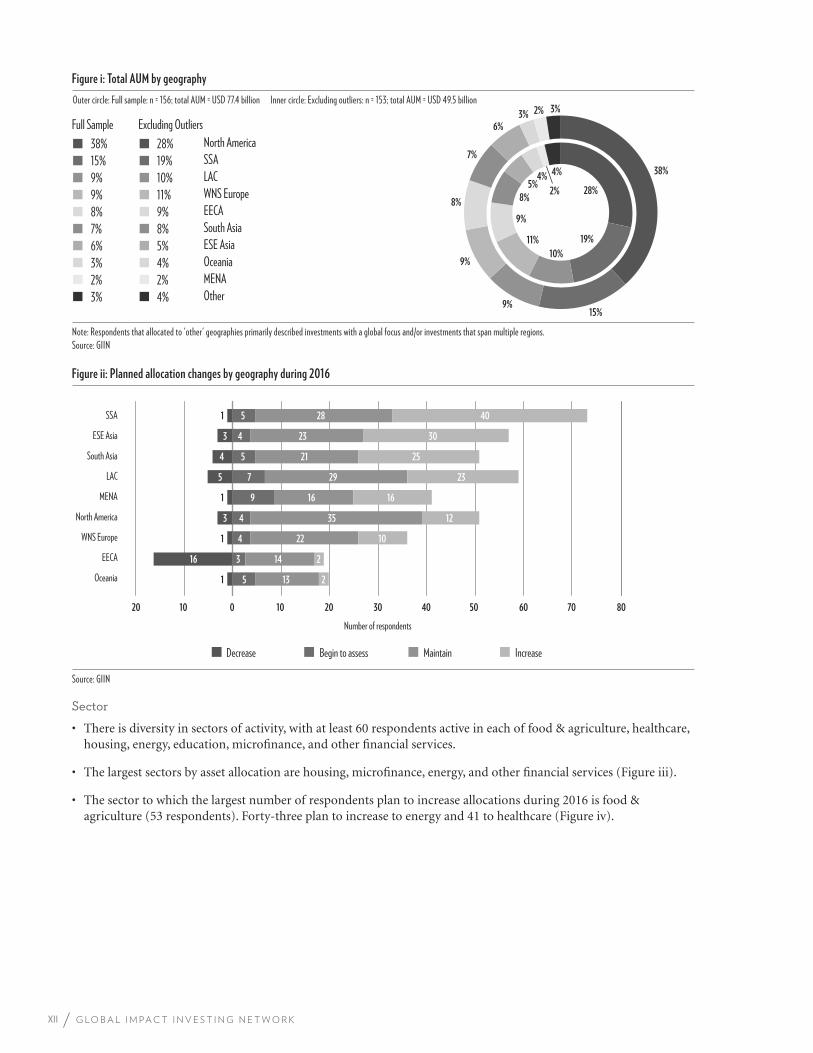
XII G L O B A L I M P A C T I N V E S T I N G N E T W O R K
Figure i: Total AUM by geography
Outer circle: Full sample: n = 156; total AUM = USD 77.4 billion Inner circle: Excluding outliers: n = 153; total AUM = USD 49.5 billion
Note: Respondents that allocated to 'other' geographies primarily described investments with a global focus and/or investments that span multiple regions.Source: GIIN
10%
11%
9%
8%
5% 4%
2%
4%
28%
38%
19%
15% 9%
9%
8%
7%
6% 3% 2% 3%
LACWNS EuropeEECASouth Asia
OceaniaMENAOther
North AmericaSSA
ESE Asia
Full Sample
9%9%8%7%
3%2%3%
38%15%
6%
Excluding Outliers
10%11%9%8%
4%2%4%
28%19%
5%
Figure ii: Planned allocation changes by geography during 2016
Source: GIIN
Decrease Begin to assess Maintain Increase
0 20 10 10 20 30 40 50 60 70 80
Oceania
EECA
WNS Europe
North America
MENA
LAC
South Asia
ESE Asia
SSA
1
1
1
1
16
3
5
4
3
5
3
4
4
9
7
5
4
5
13
14
22
35
16
29
21
23
28
2
2
10
12
16
23
25
30
40
Number of respondents
Sector
• There is diversity in sectors of activity, with at least 60 respondents active in each of food & agriculture, healthcare, housing, energy, education, microfinance, and other financial services.
• The largest sectors by asset allocation are housing, microfinance, energy, and other financial services (Figure iii).
• The sector to which the largest number of respondents plan to increase allocations during 2016 is food & agriculture (53 respondents). Forty-three plan to increase to energy and 41 to healthcare (Figure iv).
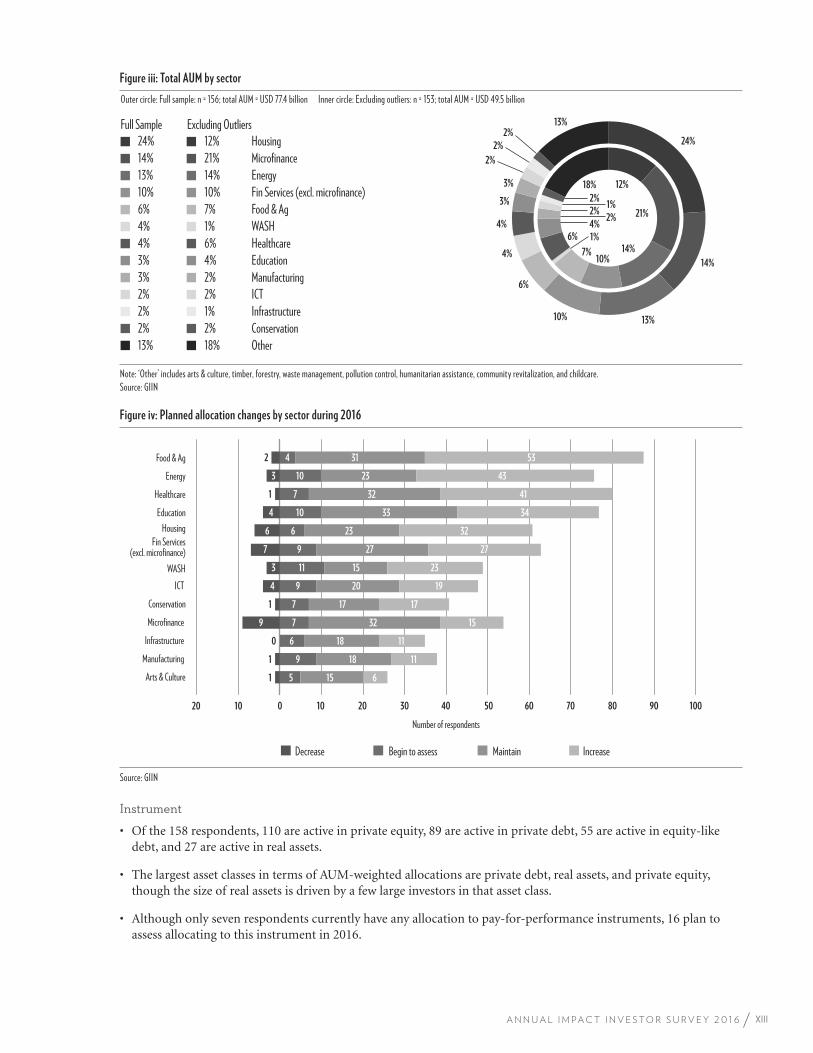
XIIIA N N U A L I M P A C T I N V E S T O R S U R V E Y 2 0 1 6
Figure iii: Total AUM by sector
Outer circle: Full sample: n = 156; total AUM = USD 77.4 billion Inner circle: Excluding outliers: n = 153; total AUM = USD 49.5 billion
Full Sample
Note: ‘Other’ includes arts & culture, timber, forestry, waste management, pollution control, humanitarian assistance, community revitalization, and childcare.Source: GIIN
Energy Fin Services (excl. microfinance) Food & Ag
Housing Microfinance
13%10%6%
24%14%
Excluding Outliers
7%
14%10%
12%21%
WASH
Education Manufacturing
Healthcare 4%
3%3%
4%1%
2%4%6%
ICT
Conservation Other
Infrastructure 2%
2%13%
2%2%
18%2%1%
12%
21%
14% 10%
7%
1% 6% 4%
2% 2%
1% 2%
18%
24%
14%
13% 10%
6%
4%
4%
3%
3%
2%
2%
2% 13%
Figure iv: Planned allocation changes by sector during 2016
Source: GIIN
Decrease Begin to assess Maintain Increase
0 20 20 10 10 30 50 70 40 60 80 90 100
Arts & Culture
Infrastructure
Conservation
WASH
Manufacturing
Microfinance
ICT
Fin Services(excl. microfinance)
HousingEducation
Healthcare
Energy
Food & Ag
1
1
0
9
1
4
3
7
6
4
1
3
2
5
9
6
7
7
9
11
9
6
10
7
10
4
15
18
18
32
17
20
15
27
23
33
32
23
31
6
11
11
15
17
19
23
27
32
34
41
43
53
Number of respondents
Instrument
• Of the 158 respondents, 110 are active in private equity, 89 are active in private debt, 55 are active in equity-like debt, and 27 are active in real assets.
• The largest asset classes in terms of AUM-weighted allocations are private debt, real assets, and private equity, though the size of real assets is driven by a few large investors in that asset class.
• Although only seven respondents currently have any allocation to pay-for-performance instruments, 16 plan to assess allocating to this instrument in 2016.
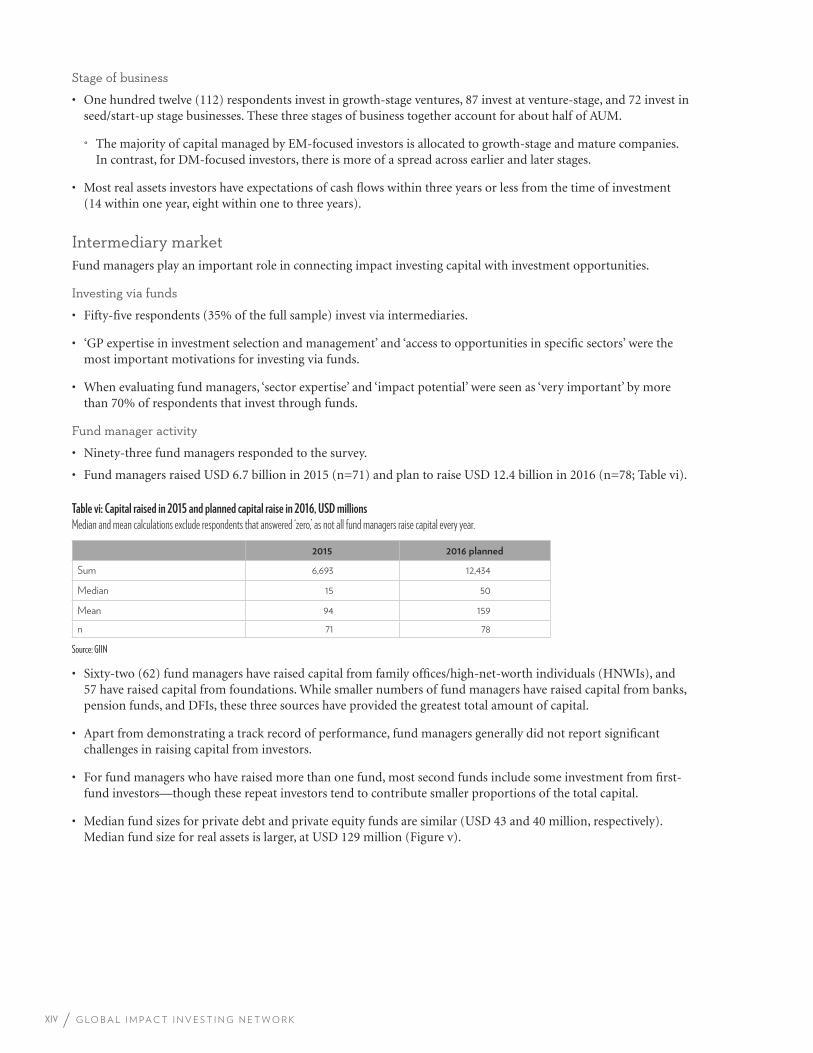
XIV G L O B A L I M P A C T I N V E S T I N G N E T W O R K
Stage of business
• One hundred twelve (112) respondents invest in growth-stage ventures, 87 invest at venture-stage, and 72 invest in seed/start-up stage businesses. These three stages of business together account for about half of AUM.
˚ The majority of capital managed by EM-focused investors is allocated to growth-stage and mature companies. In contrast, for DM-focused investors, there is more of a spread across earlier and later stages.
• Most real assets investors have expectations of cash flows within three years or less from the time of investment (14 within one year, eight within one to three years).
Intermediary marketFund managers play an important role in connecting impact investing capital with investment opportunities.
Investing via funds
• Fifty-five respondents (35% of the full sample) invest via intermediaries.
• ‘GP expertise in investment selection and management’ and ‘access to opportunities in specific sectors’ were the most important motivations for investing via funds.
• When evaluating fund managers, ‘sector expertise’ and ‘impact potential’ were seen as ‘very important’ by more than 70% of respondents that invest through funds.
Fund manager activity
• Ninety-three fund managers responded to the survey.
• Fund managers raised USD 6.7 billion in 2015 (n=71) and plan to raise USD 12.4 billion in 2016 (n=78; Table vi).
Table vi: Capital raised in 2015 and planned capital raise in 2016, USD millions
Median and mean calculations exclude respondents that answered ‘zero,’ as not all fund managers raise capital every year.
2015 2016 planned
Sum 6,693 12,434
Median 15 50
Mean 94 159
n 71 78
Source: GIIN
• Sixty-two (62) fund managers have raised capital from family offices/high-net-worth individuals (HNWIs), and 57 have raised capital from foundations. While smaller numbers of fund managers have raised capital from banks, pension funds, and DFIs, these three sources have provided the greatest total amount of capital.
• Apart from demonstrating a track record of performance, fund managers generally did not report significant challenges in raising capital from investors.
• For fund managers who have raised more than one fund, most second funds include some investment from first-fund investors—though these repeat investors tend to contribute smaller proportions of the total capital.
• Median fund sizes for private debt and private equity funds are similar (USD 43 and 40 million, respectively). Median fund size for real assets is larger, at USD 129 million (Figure v).
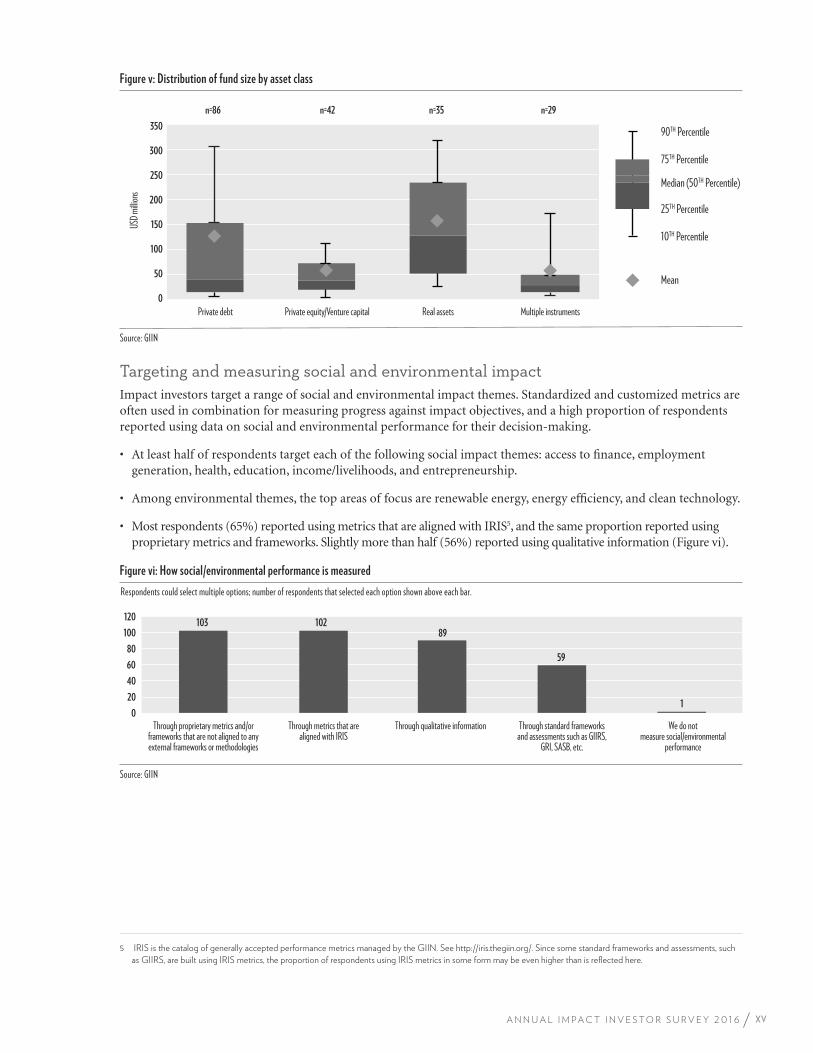
XVA N N U A L I M P A C T I N V E S T O R S U R V E Y 2 0 1 6
Figure v: Distribution of fund size by asset class
Source: GIIN
0
50
100
150
200
250
300
350
Private debt Private equity/Venture capital Real assets Multiple instruments
USD m
illions
n=42 n=29n=86 n=35
90TH Percentile
75TH Percentile
10TH Percentile
Mean
25TH Percentile
Median (50TH Percentile)
Targeting and measuring social and environmental impactImpact investors target a range of social and environmental impact themes. Standardized and customized metrics are often used in combination for measuring progress against impact objectives, and a high proportion of respondents reported using data on social and environmental performance for their decision-making.
• At least half of respondents target each of the following social impact themes: access to finance, employment generation, health, education, income/livelihoods, and entrepreneurship.
• Among environmental themes, the top areas of focus are renewable energy, energy efficiency, and clean technology.
• Most respondents (65%) reported using metrics that are aligned with IRIS5, and the same proportion reported using proprietary metrics and frameworks. Slightly more than half (56%) reported using qualitative information (Figure vi).
Figure vi: How social/environmental performance is measured
Respondents could select multiple options; number of respondents that selected each option shown above each bar.
Source: GIIN
40
20
0
60
80
100
120
Through qualitative information Through standard frameworks and assessments such as GIIRS,
GRI, SASB, etc.
We do not measure social/environmental
performance
Through metrics that are aligned with IRIS
102
Through proprietary metrics and/or frameworks that are not aligned to any external frameworks or methodologies
10389
59
1
5 IRIS is the catalog of generally accepted performance metrics managed by the GIIN. See http://iris.thegiin.org/. Since some standard frameworks and assessments, such
as GIIRS, are built using IRIS metrics, the proportion of respondents using IRIS metrics in some form may be even higher than is reflected here.
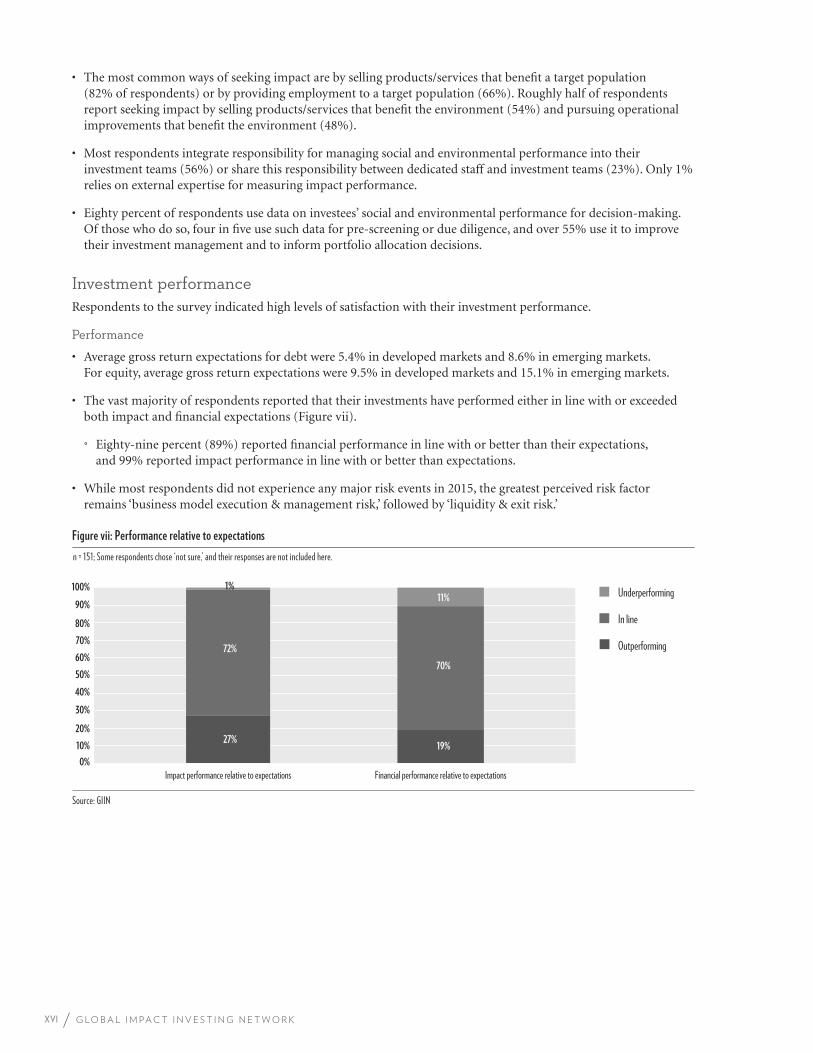
XVI G L O B A L I M P A C T I N V E S T I N G N E T W O R K
• The most common ways of seeking impact are by selling products/services that benefit a target population (82% of respondents) or by providing employment to a target population (66%). Roughly half of respondents report seeking impact by selling products/services that benefit the environment (54%) and pursuing operational improvements that benefit the environment (48%).
• Most respondents integrate responsibility for managing social and environmental performance into their investment teams (56%) or share this responsibility between dedicated staff and investment teams (23%). Only 1% relies on external expertise for measuring impact performance.
• Eighty percent of respondents use data on investees’ social and environmental performance for decision-making. Of those who do so, four in five use such data for pre-screening or due diligence, and over 55% use it to improve their investment management and to inform portfolio allocation decisions.
Investment performanceRespondents to the survey indicated high levels of satisfaction with their investment performance.
Performance
• Average gross return expectations for debt were 5.4% in developed markets and 8.6% in emerging markets. For equity, average gross return expectations were 9.5% in developed markets and 15.1% in emerging markets.
• The vast majority of respondents reported that their investments have performed either in line with or exceeded both impact and financial expectations (Figure vii).
˚ Eighty-nine percent (89%) reported financial performance in line with or better than their expectations, and 99% reported impact performance in line with or better than expectations.
• While most respondents did not experience any major risk events in 2015, the greatest perceived risk factor remains ‘business model execution & management risk,’ followed by ‘liquidity & exit risk.’
Figure vii: Performance relative to expectations
Source: GIIN
0%
10%
20%
30%
40%
50%
60%
70%
80%
90%
100%
Impact performance relative to expectations Financial performance relative to expectations
Underperforming
In line
Outperforming
27% 19%
72%
70%
1% 11%
n = 151; Some respondents chose ‘not sure,’ and their responses are not included here.
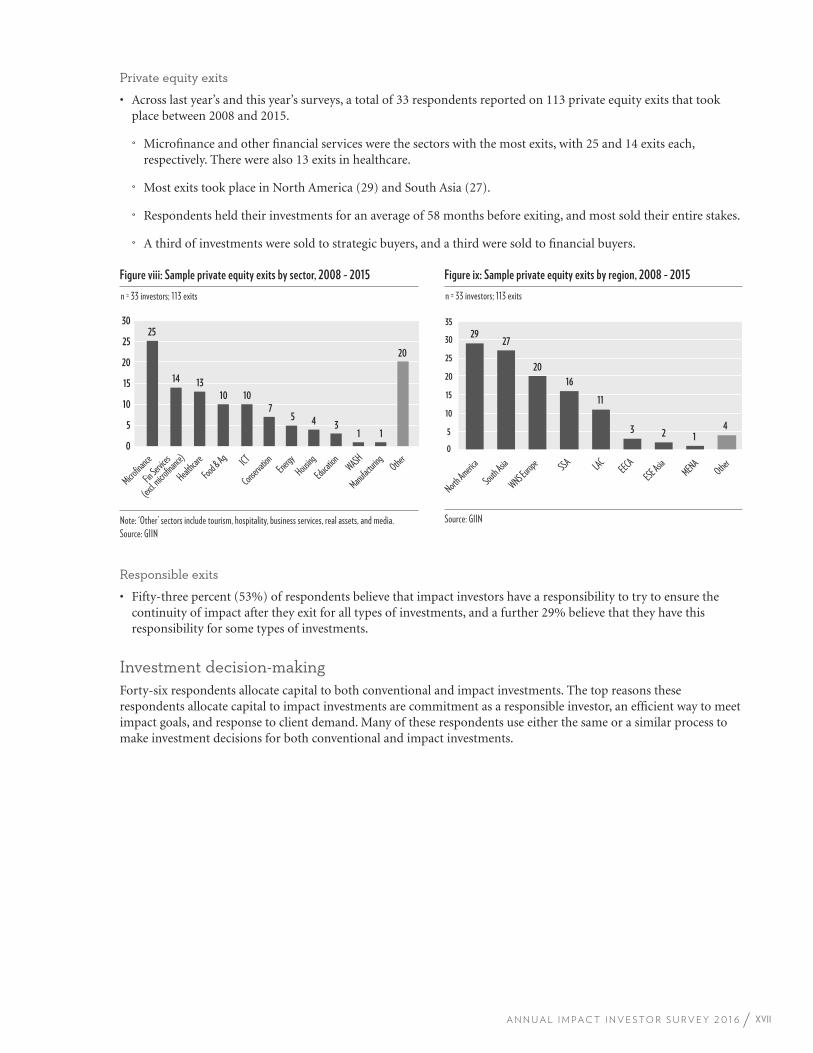
XVIIA N N U A L I M P A C T I N V E S T O R S U R V E Y 2 0 1 6
Private equity exits
• Across last year’s and this year’s surveys, a total of 33 respondents reported on 113 private equity exits that took place between 2008 and 2015.
˚ Microfinance and other financial services were the sectors with the most exits, with 25 and 14 exits each, respectively. There were also 13 exits in healthcare.
˚ Most exits took place in North America (29) and South Asia (27).
˚ Respondents held their investments for an average of 58 months before exiting, and most sold their entire stakes.
˚ A third of investments were sold to strategic buyers, and a third were sold to financial buyers.
Figure viii: Sample private equity exits by sector, 2008 – 2015
n = 33 investors; 113 exits
Note: ‘Other’ sectors include tourism, hospitality, business services, real assets, and media. Source: GIIN
30
0
5
10
15
20
2525
14 13
10 10
7 5 4 3
1 1
20
Microfinance
Fin Services
(excl. micro
finance)
Healthcare
Food & Ag ICT
Conservation Energy
Housing
Education WASH
Manufacturing Other
Figure ix: Sample private equity exits by region, 2008 – 2015
n = 33 investors; 113 exits
Source: GIIN
North America
South Asia
WNS Europe SSA LAC
EECAESE Asia
MENA Other
0
5
10
15
20
25
30
35
29 27
20
16
11
3 2 1 4
Responsible exits
• Fifty-three percent (53%) of respondents believe that impact investors have a responsibility to try to ensure the continuity of impact after they exit for all types of investments, and a further 29% believe that they have this responsibility for some types of investments.
Investment decision-makingForty-six respondents allocate capital to both conventional and impact investments. The top reasons these respondents allocate capital to impact investments are commitment as a responsible investor, an efficient way to meet impact goals, and response to client demand. Many of these respondents use either the same or a similar process to make investment decisions for both conventional and impact investments.

XVIII G L O B A L I M P A C T I N V E S T I N G N E T W O R K
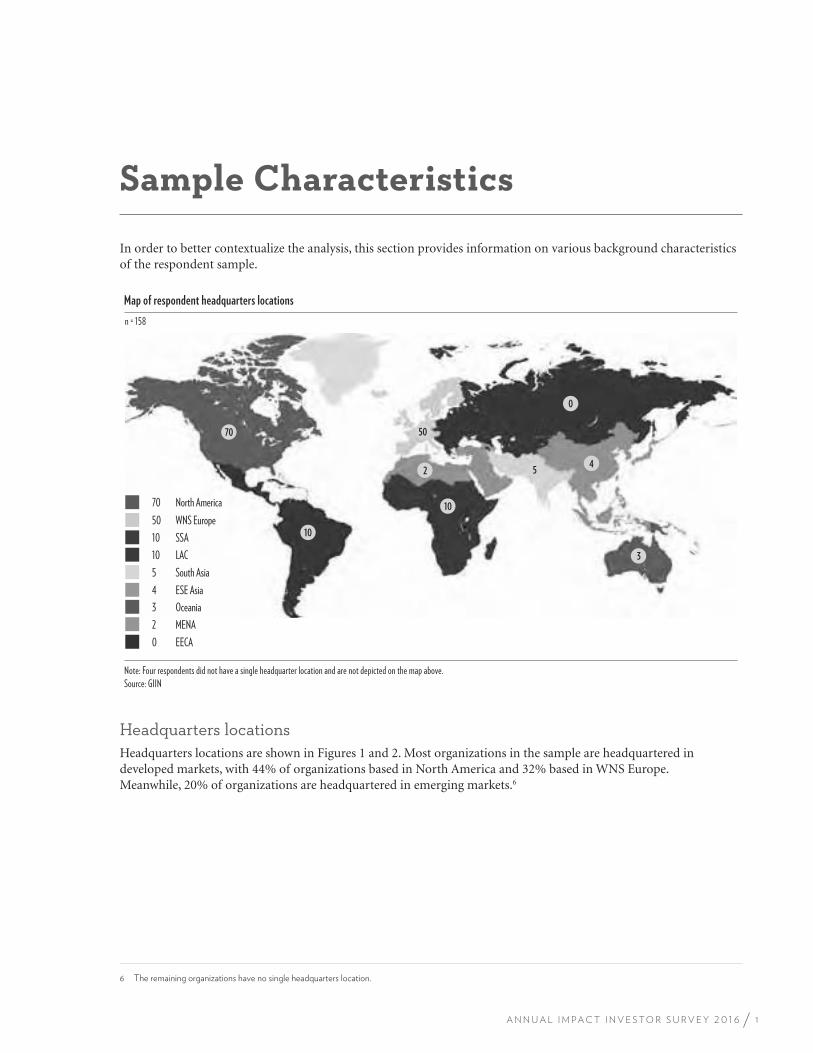
1A N N U A L I M P A C T I N V E S T O R S U R V E Y 2 0 1 6
Sample Characteristics
In order to better contextualize the analysis, this section provides information on various background characteristics of the respondent sample.
Map of respondent headquarters locations
n = 158
Note: Four respondents did not have a single headquarter location and are not depicted on the map above.Source: GIIN
70 North America 50 WNS Europe 10 SSA 10 LAC
3 Oceania 2 MENA
4 ESE Asia 5 South Asia
0 EECA
2
10
0
45
3
5070
10
Headquarters locationsHeadquarters locations are shown in Figures 1 and 2. Most organizations in the sample are headquartered in developed markets, with 44% of organizations based in North America and 32% based in WNS Europe. Meanwhile, 20% of organizations are headquartered in emerging markets.6
6 The remaining organizations have no single headquarters location.
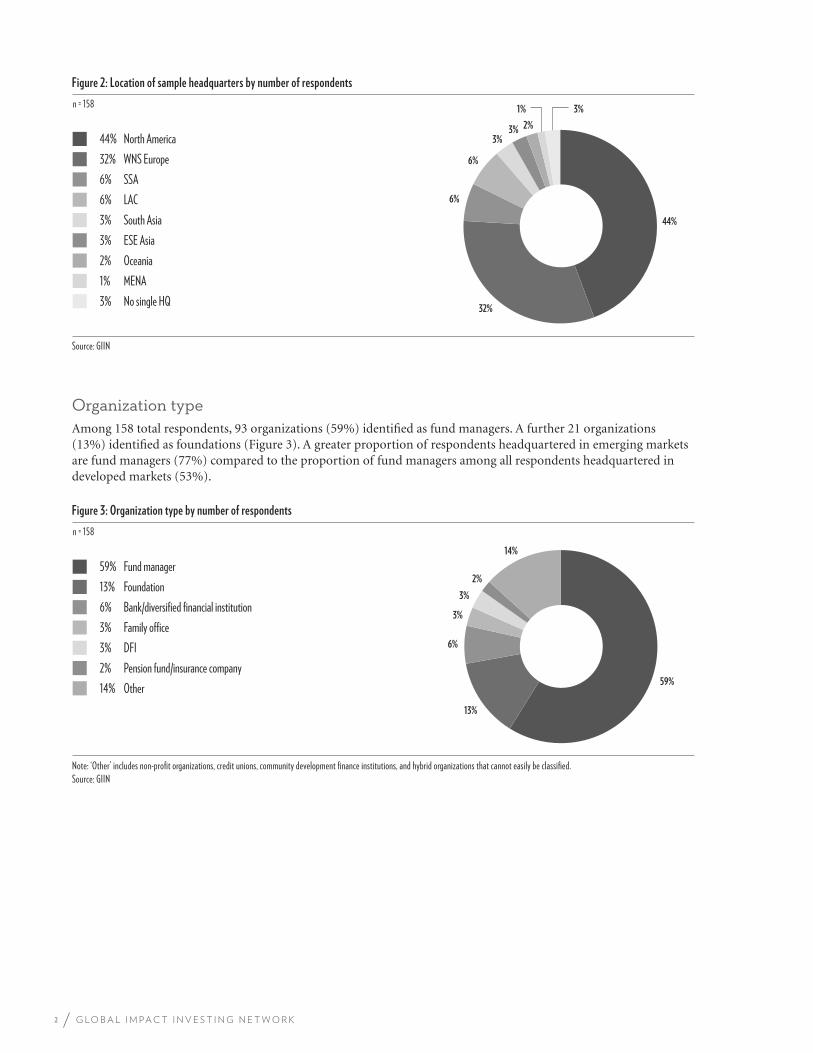
2 G L O B A L I M P A C T I N V E S T I N G N E T W O R K
Figure 2: Location of sample headquarters by number of respondents
n = 158
Source: GIIN
1% 3%
44%
32%
6%
6%
3% 3% 2%
44% North America 32% WNS Europe 6% SSA 6% LAC 3% South Asia 3% ESE Asia 2% Oceania 1% MENA 3% No single HQ
Organization typeAmong 158 total respondents, 93 organizations (59%) identified as fund managers. A further 21 organizations (13%) identified as foundations (Figure 3). A greater proportion of respondents headquartered in emerging markets are fund managers (77%) compared to the proportion of fund managers among all respondents headquartered in developed markets (53%).
Figure 3: Organization type by number of respondents
n = 158
Note: ‘Other’ includes non-profit organizations, credit unions, community development finance institutions, and hybrid organizations that cannot easily be classified.Source: GIIN
59% Fund manager 13% Foundation 6% Bank/diversified financial institution 3% Family office3% DFI 2% Pension fund/insurance company 14% Other 59%
13%
6%
3%
3%
2%
14%
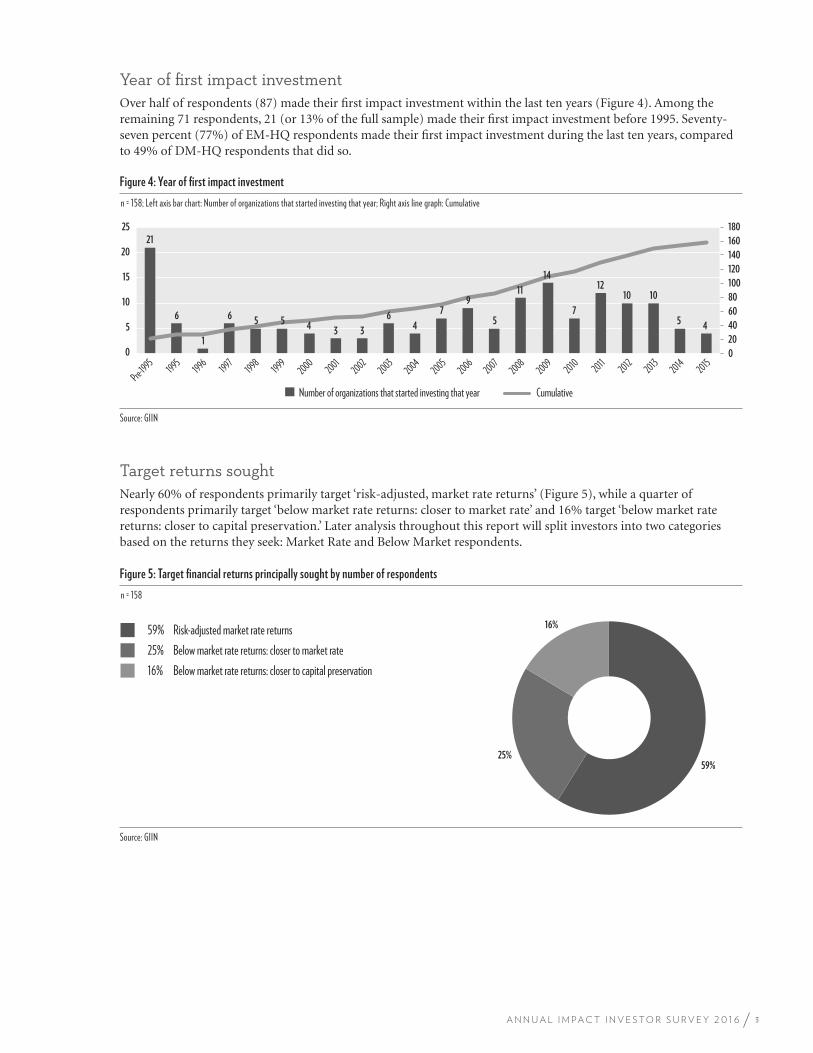
3A N N U A L I M P A C T I N V E S T O R S U R V E Y 2 0 1 6
Year of first impact investment Over half of respondents (87) made their first impact investment within the last ten years (Figure 4). Among the remaining 71 respondents, 21 (or 13% of the full sample) made their first impact investment before 1995. Seventy-seven percent (77%) of EM-HQ respondents made their first impact investment during the last ten years, compared to 49% of DM-HQ respondents that did so.
Figure 4: Year of first impact investment
n = 158; Left axis bar chart: Number of organizations that started investing that year; Right axis line graph: Cumulative
Source: GIIN
21
6
1
6 5 5
4 3 3
6 4
7 9
5
11
14
7
12 10 10
5 4
0
20
40
60
80
100
120
140
160
180
0
5
10
15
20
25
Pre-1995 1995
1996 1997
1998 1999
2000 2001
2002 2003
2004 2005
2006 2007
2008 2009
2010 2011 2012
2013 2014
2015
Number of organizations that started investing that year Cumulative
Target returns soughtNearly 60% of respondents primarily target ‘risk-adjusted, market rate returns’ (Figure 5), while a quarter of respondents primarily target ‘below market rate returns: closer to market rate’ and 16% target ‘below market rate returns: closer to capital preservation.’ Later analysis throughout this report will split investors into two categories based on the returns they seek: Market Rate and Below Market respondents.
Figure 5: Target financial returns principally sought by number of respondents
n = 158
Source: GIIN
59% Risk-adjusted market rate returns 25% Below market rate returns: closer to market rate 16% Below market rate returns: closer to capital preservation
59% 25%
16%
4 G L O B A L I M P A C T I N V E S T I N G N E T W O R K
Notable New Entrants and Activity
In the past few years, major institutional investors,7 such as Zurich Insurance and AXA Group, have entered the impact investing
market. That momentum continued to build in 2015, with impact investing gaining traction with additional institutional investors.
The examples below reflect growing interest in the impact investing industry from some of the world’s leading investing firms.
• In February 2015, BlackRock Inc. announced the creation of BlackRock Impact,8 which will deploy both equity and debt globally
into investment solutions that produce measurable social and environmental outcomes.9 The unit will also manage over USD
225 billion already with the firm in values-aligned strategies. BlackRock appointed Deborah Winshel, formerly of the Robin Hood
Foundation, as a Managing Director and the first global head of impact investing at the firm.
• In April 2015, Bain Capital, LP announced the formation of a new unit focused on impact investing. The unit plans to raise funds
from high-net-worth individuals, public pensions, and endowments to invest in companies and projects that promote broader
social good. Investments will focus primarily on the U.S. and will span sectors including health, energy, education, environment,
and neighborhood development. Former Massachusetts Governor Deval Patrick joined the private equity firm as Managing
Director and is tasked with overseeing the new unit.10
• In July 2015, Goldman Sachs Asset Management announced that it would acquire Imprint Capital, an investment advisory
firm exclusively focused on impact investing. While Goldman Sachs has been active in impact investing for many years, its
acquisition of Imprint will deepen its capacity to deliver environmental, social, and effective governance (ESG) impact and
impact investing opportunities.11
• Also in September, Australian Superannuation fund HESTA announced a partnership with Social Ventures Australia to
launch the Social Impact Investment Trust. HESTA committed AUD 30 million to the trust, which is one of Australia’s largest
impact funds. The fund aims to raise AUD 100 million to invest in opportunities that improve employment, education,
housing, and health.12
7 ‘Institutional investor’ in this context means a large organization, such as a bank, pension fund, or insurance company, that makes substantial and varied
investments.
8 Jessica Toonkel, “Exclusive: BlackRock to Ramp up Impact Investing,” Reuters, February 9, 2016, http://www.reuters.com/article/us-blackrock-impact-exclusive-
idUSKBN0LD18W20150209.
9 BlackRock, “BlackRock Appoints Deborah Winshel to Lead Impact Investing Platform,” press release, February 15, 2015, https://www.blackrock.com/corporate/
en-us/newsroom/press-releases/article/corporate-one/press-releases/deborah-winshel-lead-impact-investing-platform_US.
10 Ryan Dezember, “Massachusetts Ex-Gov. Patrick to Run New Bain Unit,” Wall Street Journal, April 13, 2015, http://www.wsj.com/articles/massachusetts-ex-gov-
patrick-to-run-new-bain-unit-1428973279.
11 Goldman Sachs, “ Goldman Sachs Asset Management (GSAM) to Acquire Leading Institutional Impact Investing Firm Imprint Capital,” press release, July 13,
2015, http://www.goldmansachs.com/media-relations/press-releases/current/gsam-announcement-7-13-15.html.
12 Alex Clifton-Jones, “HESTA Partners with SVA to Launch New Impact Fund,” Impact Investing Australia, September 15, 2015, http://impactinvestingaustralia.
com/uncategorized/hesta-partners-with-sva-to-launch-new-impact-fund/.
2015 MARKET DEVELOPMENT
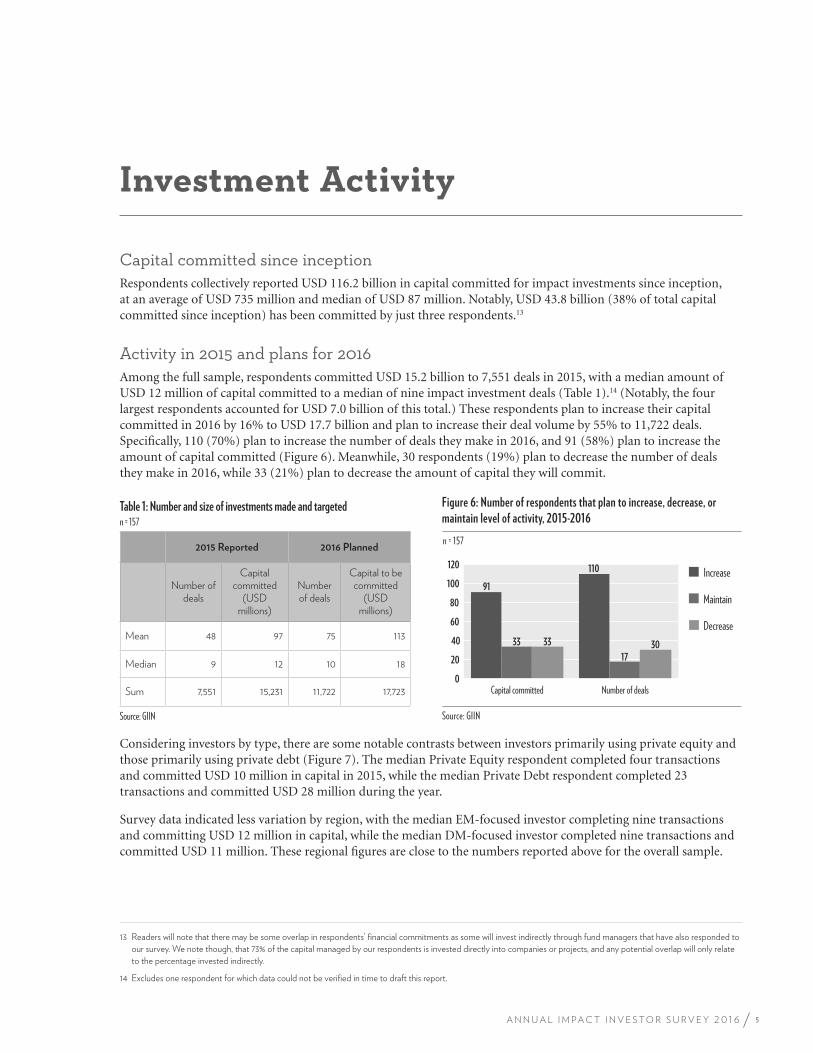
5A N N U A L I M P A C T I N V E S T O R S U R V E Y 2 0 1 6
Investment Activity
Capital committed since inceptionRespondents collectively reported USD 116.2 billion in capital committed for impact investments since inception, at an average of USD 735 million and median of USD 87 million. Notably, USD 43.8 billion (38% of total capital committed since inception) has been committed by just three respondents.13
Activity in 2015 and plans for 2016Among the full sample, respondents committed USD 15.2 billion to 7,551 deals in 2015, with a median amount of USD 12 million of capital committed to a median of nine impact investment deals (Table 1).14 (Notably, the four largest respondents accounted for USD 7.0 billion of this total.) These respondents plan to increase their capital committed in 2016 by 16% to USD 17.7 billion and plan to increase their deal volume by 55% to 11,722 deals. Specifically, 110 (70%) plan to increase the number of deals they make in 2016, and 91 (58%) plan to increase the amount of capital committed (Figure 6). Meanwhile, 30 respondents (19%) plan to decrease the number of deals they make in 2016, while 33 (21%) plan to decrease the amount of capital they will commit.
Table 1: Number and size of investments made and targetedn = 157
2015 Reported 2016 Planned
Number of deals
Capital committed
(USD millions)
Number of deals
Capital to be committed
(USD millions)
Mean 48 97 75 113
Median 9 12 10 18
Sum 7,551 15,231 11,722 17,723
Source: GIIN
Considering investors by type, there are some notable contrasts between investors primarily using private equity and those primarily using private debt (Figure 7). The median Private Equity respondent completed four transactions and committed USD 10 million in capital in 2015, while the median Private Debt respondent completed 23 transactions and committed USD 28 million during the year.
Survey data indicated less variation by region, with the median EM-focused investor completing nine transactions and committing USD 12 million in capital, while the median DM-focused investor completed nine transactions and committed USD 11 million. These regional figures are close to the numbers reported above for the overall sample.
13 Readers will note that there may be some overlap in respondents’ financial commitments as some will invest indirectly through fund managers that have also responded to
our survey. We note though, that 73% of the capital managed by our respondents is invested directly into companies or projects, and any potential overlap will only relate
to the percentage invested indirectly.
14 Excludes one respondent for which data could not be verified in time to draft this report.
Number of deals
Figure 6: Number of respondents that plan to increase, decrease, or
maintain level of activity, 2015-2016
n = 157
Source: GIIN
20
40
0
60
80
100
120Increase
Maintain Decrease
91
110
33
17
33 30
Capital committed
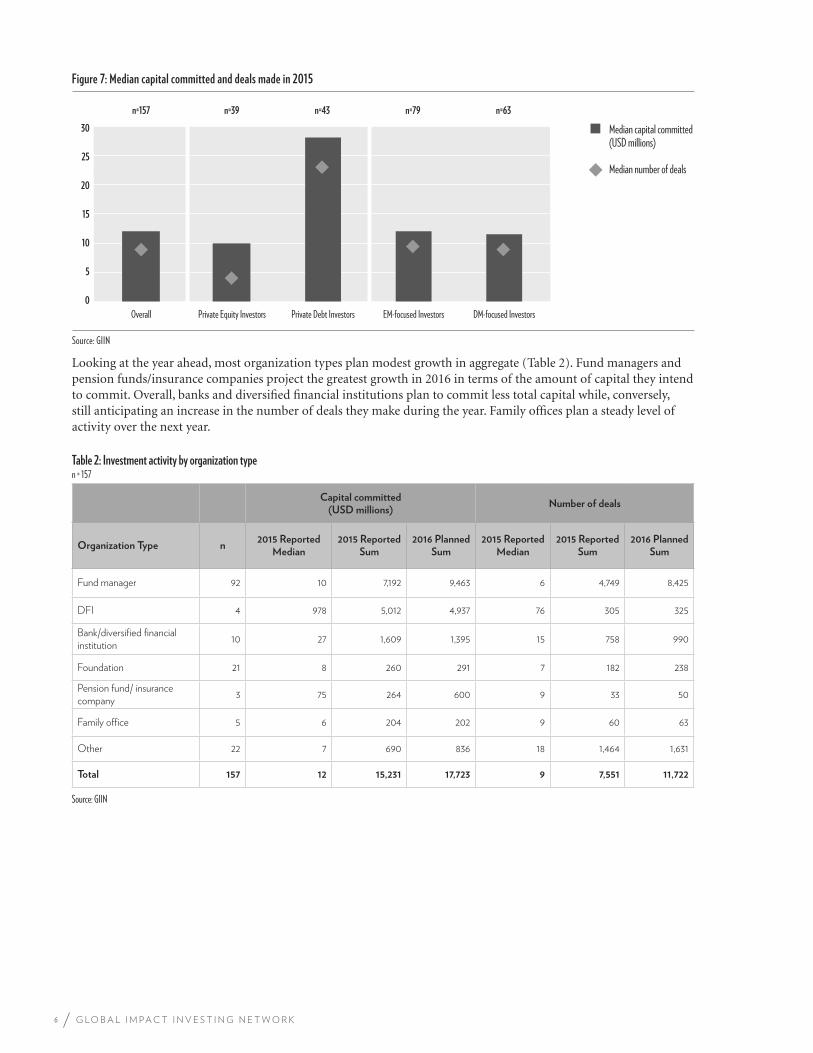
6 G L O B A L I M P A C T I N V E S T I N G N E T W O R K
Figure 7: Median capital committed and deals made in 2015
Source: GIIN
0
5
10
15
20
25
30
Overall Private Equity Investors Private Debt Investors EM-focused Investors DM-focused Investors
n=157 n=63n=79n=43n=39
Median capital committed (USD millions)
Median number of deals
Looking at the year ahead, most organization types plan modest growth in aggregate (Table 2). Fund managers and pension funds/insurance companies project the greatest growth in 2016 in terms of the amount of capital they intend to commit. Overall, banks and diversified financial institutions plan to commit less total capital while, conversely, still anticipating an increase in the number of deals they make during the year. Family offices plan a steady level of activity over the next year.
Table 2: Investment activity by organization type n = 157
Capital committed (USD millions)
Number of deals
Organization Type n2015 Reported
Median 2015 Reported
Sum 2016 Planned
Sum 2015 Reported
Median2015 Reported
Sum2016 Planned
Sum
Fund manager 92 10 7,192 9,463 6 4,749 8,425
DFI 4 978 5,012 4,937 76 305 325
Bank/diversified financial institution
10 27 1,609 1,395 15 758 990
Foundation 21 8 260 291 7 182 238
Pension fund/ insurance company
3 75 264 600 9 33 50
Family office 5 6 204 202 9 60 63
Other 22 7 690 836 18 1,464 1,631
Total 157 12 15,231 17,723 9 7,551 11,722
Source: GIIN
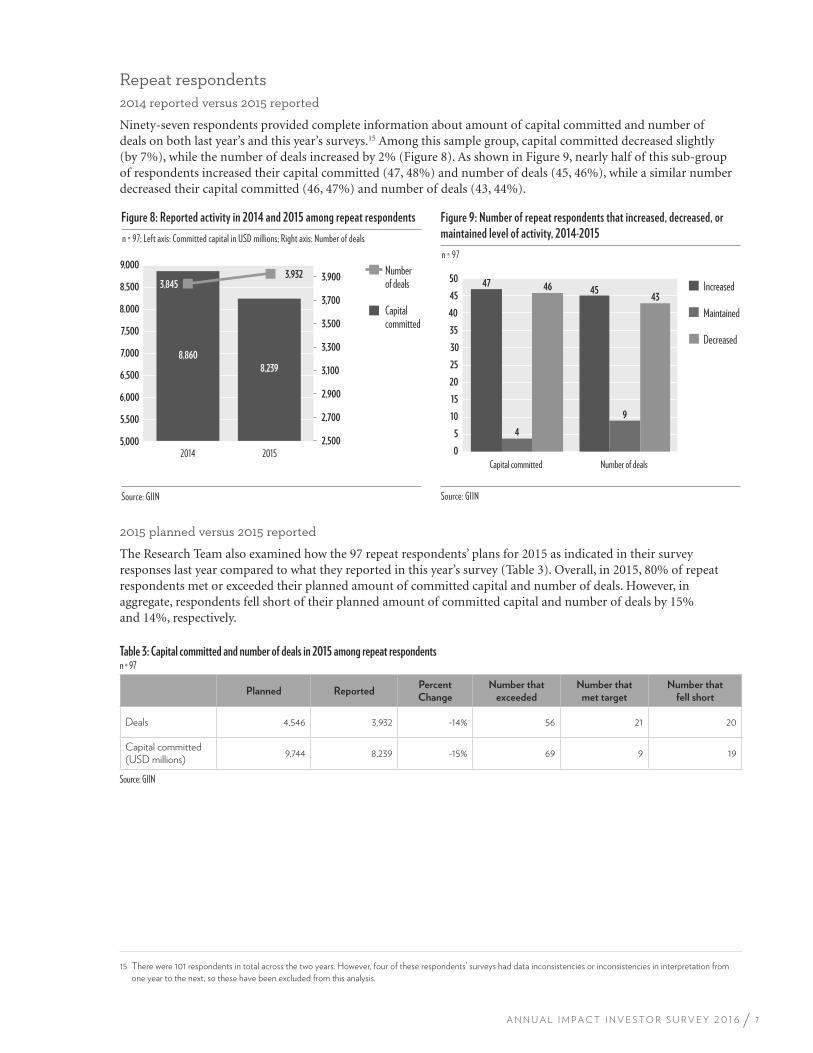
7A N N U A L I M P A C T I N V E S T O R S U R V E Y 2 0 1 6
Repeat respondents2014 reported versus 2015 reported
Ninety-seven respondents provided complete information about amount of capital committed and number of deals on both last year’s and this year’s surveys.15 Among this sample group, capital committed decreased slightly (by 7%), while the number of deals increased by 2% (Figure 8). As shown in Figure 9, nearly half of this sub-group of respondents increased their capital committed (47, 48%) and number of deals (45, 46%), while a similar number decreased their capital committed (46, 47%) and number of deals (43, 44%).
Figure 8: Reported activity in 2014 and 2015 among repeat respondents
n = 97; Left axis: Committed capital in USD millions; Right axis: Number of deals
5,000
5,500
6,000
6,500
7,000
7,500
8,000
8,500
9,000
2014 20152,500
2,700
2,900
3,100
3,300
3,500
3,700
3,900Number of deals
Capital committed
8,860
3,8453,932
8,239
Source: GIIN
Figure 9: Number of repeat respondents that increased, decreased, or
maintained level of activity, 2014-2015
n = 97
Source: GIIN
25
30
20
10
15
0
5
35
40
45
50Increased
Maintained Decreased
47 45
4
9
46 43
Number of dealsCapital committed
2015 planned versus 2015 reported
The Research Team also examined how the 97 repeat respondents’ plans for 2015 as indicated in their survey responses last year compared to what they reported in this year’s survey (Table 3). Overall, in 2015, 80% of repeat respondents met or exceeded their planned amount of committed capital and number of deals. However, in aggregate, respondents fell short of their planned amount of committed capital and number of deals by 15% and 14%, respectively.
Table 3: Capital committed and number of deals in 2015 among repeat respondentsn = 97
Planned ReportedPercent Change
Number that exceeded
Number that met target
Number that fell short
Deals 4,546 3,932 -14% 56 21 20
Capital committed (USD millions)
9,744 8,239 -15% 69 9 19
Source: GIIN
15 There were 101 respondents in total across the two years. However, four of these respondents’ surveys had data inconsistencies or inconsistencies in interpretation from
one year to the next, so these have been excluded from this analysis.
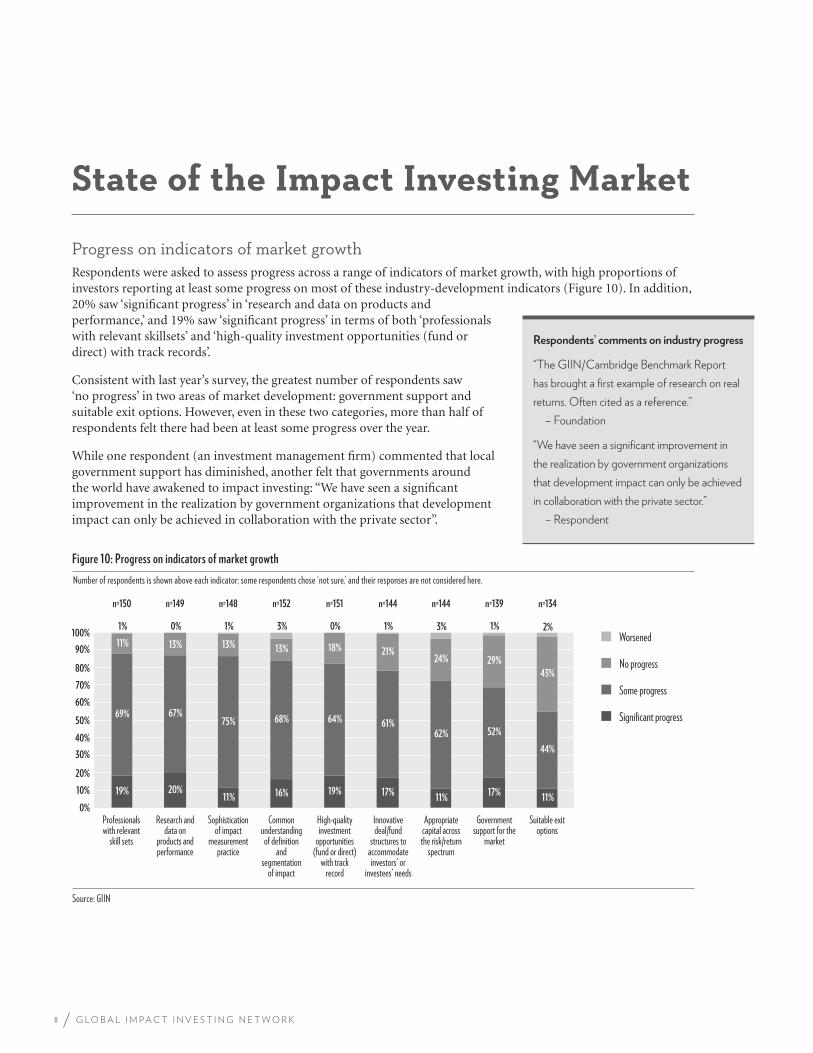
8 G L O B A L I M P A C T I N V E S T I N G N E T W O R K
State of the Impact Investing Market
Progress on indicators of market growth Respondents were asked to assess progress across a range of indicators of market growth, with high proportions of investors reporting at least some progress on most of these industry-development indicators (Figure 10). In addition, 20% saw ‘significant progress’ in ‘research and data on products and performance,’ and 19% saw ‘significant progress’ in terms of both ‘professionals with relevant skillsets’ and ‘high-quality investment opportunities (fund or direct) with track records’.
Consistent with last year’s survey, the greatest number of respondents saw ‘no progress’ in two areas of market development: government support and suitable exit options. However, even in these two categories, more than half of respondents felt there had been at least some progress over the year.
While one respondent (an investment management firm) commented that local government support has diminished, another felt that governments around the world have awakened to impact investing: “We have seen a significant improvement in the realization by government organizations that development impact can only be achieved in collaboration with the private sector”.
Figure 10: Progress on indicators of market growth
Source: GIIN
0%
10%
20%
30%
40%
50%
60%
70%
80%
90%
100%
Professionals with relevant
skill sets
Research and data on
products and performance
Sophistication of impact
measurement practice
Common understanding
of definition and
segmentation of impact
High-quality investment
opportunities (fund or direct)
with track record
Innovative deal/fund
structures to accommodate investors' or
investees' needs
Appropriate capital across the risk/return
spectrum
Government support for the
market
Suitable exit options
Worsened
No progress
Some progress
Significant progress
19% 20% 11% 16% 19% 17%
11% 17%
11%
69% 67% 75% 68% 64% 61%
62% 52%
44%
11% 13% 13% 13% 18% 21% 24% 29%
43%
1% 0% 1% 3% 0% 1% 3% 1% 2%
n=150 n=148 n=151 n=144 n=134n=149 n=152 n=144 n=139
Number of respondents is shown above each indicator; some respondents chose ‘not sure,’ and their responses are not considered here.
Respondents’ comments on industry progress
“The GIIN/Cambridge Benchmark Report
has brought a first example of research on real
returns. Often cited as a reference.”
– Foundation
“We have seen a significant improvement in
the realization by government organizations
that development impact can only be achieved
in collaboration with the private sector.”
– Respondent
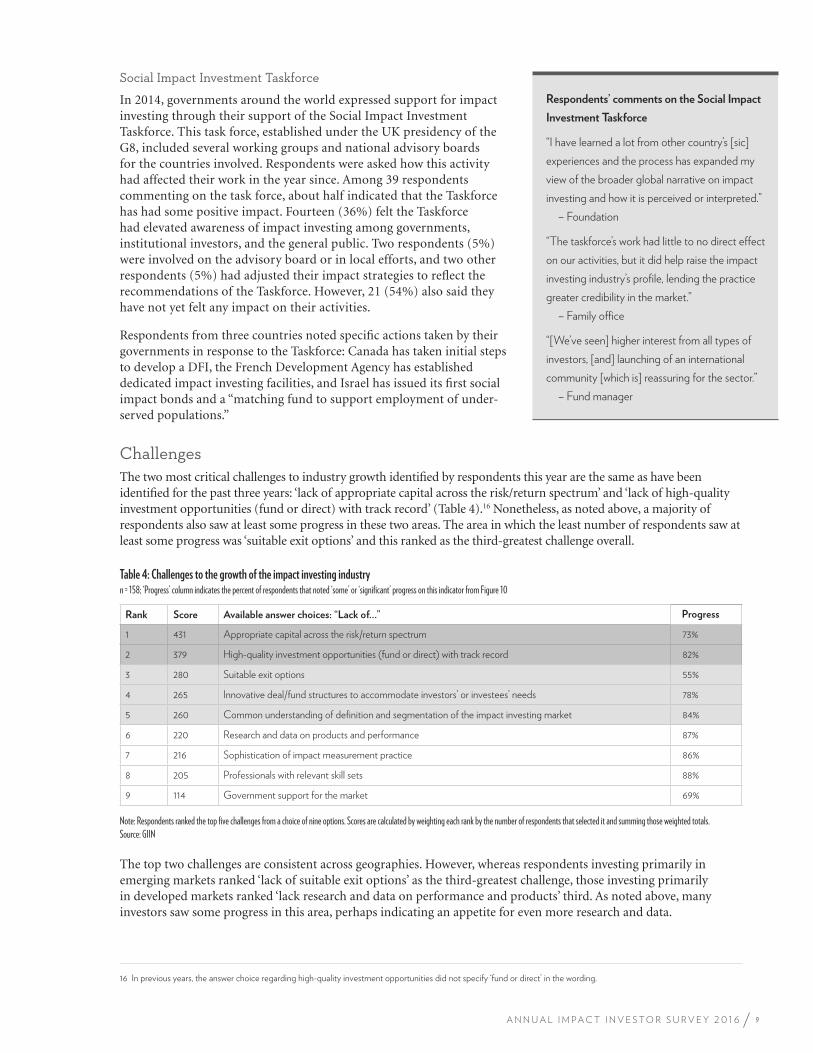
9A N N U A L I M P A C T I N V E S T O R S U R V E Y 2 0 1 6
Social Impact Investment Taskforce
In 2014, governments around the world expressed support for impact investing through their support of the Social Impact Investment Taskforce. This task force, established under the UK presidency of the G8, included several working groups and national advisory boards for the countries involved. Respondents were asked how this activity had affected their work in the year since. Among 39 respondents commenting on the task force, about half indicated that the Taskforce has had some positive impact. Fourteen (36%) felt the Taskforce had elevated awareness of impact investing among governments, institutional investors, and the general public. Two respondents (5%) were involved on the advisory board or in local efforts, and two other respondents (5%) had adjusted their impact strategies to reflect the recommendations of the Taskforce. However, 21 (54%) also said they have not yet felt any impact on their activities.
Respondents from three countries noted specific actions taken by their governments in response to the Taskforce: Canada has taken initial steps to develop a DFI, the French Development Agency has established dedicated impact investing facilities, and Israel has issued its first social impact bonds and a “matching fund to support employment of under-served populations.”
ChallengesThe two most critical challenges to industry growth identified by respondents this year are the same as have been identified for the past three years: ‘lack of appropriate capital across the risk/return spectrum’ and ‘lack of high-quality investment opportunities (fund or direct) with track record’ (Table 4).16 Nonetheless, as noted above, a majority of respondents also saw at least some progress in these two areas. The area in which the least number of respondents saw at least some progress was ‘suitable exit options’ and this ranked as the third-greatest challenge overall.
Table 4: Challenges to the growth of the impact investing industryn = 158; ‘Progress’ column indicates the percent of respondents that noted ‘some’ or ‘significant’ progress on this indicator from Figure 10
Rank Score Available answer choices: “Lack of…” Progress
1 431 Appropriate capital across the risk/return spectrum 73%
2 379 High-quality investment opportunities (fund or direct) with track record 82%
3 280 Suitable exit options 55%
4 265 Innovative deal/fund structures to accommodate investors’ or investees’ needs 78%
5 260 Common understanding of definition and segmentation of the impact investing market 84%
6 220 Research and data on products and performance 87%
7 216 Sophistication of impact measurement practice 86%
8 205 Professionals with relevant skill sets 88%
9 114 Government support for the market 69%
Note: Respondents ranked the top five challenges from a choice of nine options. Scores are calculated by weighting each rank by the number of respondents that selected it and summing those weighted totals. Source: GIIN
The top two challenges are consistent across geographies. However, whereas respondents investing primarily in emerging markets ranked ‘lack of suitable exit options’ as the third-greatest challenge, those investing primarily in developed markets ranked ‘lack research and data on performance and products’ third. As noted above, many investors saw some progress in this area, perhaps indicating an appetite for even more research and data.
16 In previous years, the answer choice regarding high-quality investment opportunities did not specify ‘fund or direct’ in the wording.
Respondents’ comments on the Social Impact
Investment Taskforce
“I have learned a lot from other country’s [sic]
experiences and the process has expanded my
view of the broader global narrative on impact
investing and how it is perceived or interpreted.”
– Foundation
“The taskforce’s work had little to no direct effect
on our activities, but it did help raise the impact
investing industry’s profile, lending the practice
greater credibility in the market.”
– Family office
“[We’ve seen] higher interest from all types of
investors, [and] launching of an international
community [which is] reassuring for the sector.”
– Fund manager

10 G L O B A L I M P A C T I N V E S T I N G N E T W O R K
The topic of definition and segmentation of the impact investing market attracted several interesting comments from respondents. One investor noted there is a “need to move away from a single definition of impact investing—there are different risk, return, and impact characteristics in different sectors, geographies, and deal sizes.” Another (a non-bank financial institution) noted that “we are still seeing that there is often disproportionate focus on financial returns and social/environmental impact is taken for granted. Whereas some types of impact can be generated without sacrificing financial return, we should avoid the conclusion that it is possible to generate all types of impact without sacrificing financial return.”
Respondents that indicated ‘lack of appropriate capital across the risk/return spectrum’ as a challenge were asked to provide more detail regarding where along that spectrum they saw the greatest gap(s). Of the 39 respondents that provided detailed comments, the highest number identified gaps related to stage-of-business or risk tolerance. In terms of stage, many respondents (31) noted a lack of seed, early-, and venture-stage capital. In terms of risk, respondents identified limited availability of risk-willing capital that would accept higher impact in lieu of higher financial returns (12), opportunities for first-loss capital or loan guarantees (4), and a need for analysis and pricing of emerging-market or forex risk (2). Some respondents also noted there is a lack of market rate, risk-adjusted capital (4), and four respondents noted there is a lack of patient, long-term capital. Further, five respondents identified an opportunity for institutional investors to engage more across the entire risk/return spectrum.

11A N N U A L I M P A C T I N V E S T O R S U R V E Y 2 0 1 6
U.S. Regulations
2015 saw two important regulatory updates governing the investment activities of private foundations and federally regulated
pension funds in the United States, both of which hold promise for encouraging greater capital flows into impact investments.
Guidance for Foundations
In September, the U.S. Treasury Department issued guidance stating that private foundations may invest their endowments with an
eye towards their own charitable purposes, even if doing so might sacrifice financial returns.17 “When exercising ordinary business care
and prudence in deciding whether to make an investment, foundation managers may consider all relevant facts and circumstances,
including the relationship between a particular investment and the foundation’s charitable purposes,” the guidance stated.
It further clarified that “foundation managers are not required to select only investments that offer the highest rates of return, the
lowest risks, or the greatest liquidity so long as the foundation managers exercise the requisite ordinary business care and prudence
under the facts and circumstances prevailing at the time of the investment in making investment decisions that support, and do not
jeopardize, the furtherance of the private foundation’s charitable purposes.”
A 2011 study by the Commonfund Institute found that nine percent of private foundations applied ESG criteria to their investment
decisions. In 2015, a study, also by the Commonfund—this time in partnership with the Council on Foundations—found that 19%
of private foundations used various types of mission-aligned investing strategies, such as negative screening and direct impact
investing.18 Thus, the U.S. Treasury’s guidance provides welcome clarity as foundations seem to be increasingly interested in using
mission-related investing to further their charitable goals.
Guidance for Pension Funds
In October, the U.S. Department of Labor (DoL) issued new guidance for pension
funds interested in pursuing “economically targeted investments” (ETIs), a type of
impact investment that seeks certain social or environmental goals alongside a market-
rate financial return.19
The new DoL guidance is intended to encourage more ETIs. It states that “fiduciaries
may consider social and environmental goals as tie-breakers when choosing between
investment alternatives that are otherwise equal with respect to return and risk over the
appropriate time horizon.” The guidance also clarifies that “environmental, social, and
governance issues may have a direct relationship to the economic value of the plan’s
investment,” and thus that these issues “are not merely collateral considerations or tie-
breakers, but rather are proper components of the fiduciary’s primary analysis of the economic merits of competing investment choices.”
U.S.-based pension funds have a combined USD 17.9 trillion in assets under management.20 According to a survey by Deloitte, as of
2013 only six percent of U.S. pension funds had made an impact investment, but 64% said they expected to make impact investments
in the future. This revised ETI guidance can hopefully spur pension funds towards realizing those ambitions.
17 Peter Holiat, Office of the Associate Chief Counsel (Tax-Exempt and Government Entities Division), “Investments Made for Charitable Purposes: Notice 2015-
62,” Internal Revenue Service, https://www.irs.gov/pub/irs-drop/n-15-62.pdf.
18 John Cochrane, “The MRI Guidance Is a Really Big Deal,” Council on Foundations (blog), September 23, 2015, http://www.cof.org/blogs/re-
philanthropy/2015-09-23/mri-guidance-really-big-deal.
19 Department of Labor, Employee Benefits Security Administration, “Interpretive Bulletin Relating to the Fiduciary Standard under ERISA in Considering
Economically Targeted Investments,” 29 CFR 2509, RIN 1210-AB73
(Oct. 26, 2015), https://federalregister.gov/a/2015-27146.
20 The new guidance only applies to pension plans that are governed by the federal Employment and Retirement Securities Act of 1974 (ERISA), which covers about
half of all pension assets under management in the United States. However, in practice, even pension funds that are regulated at the state and local levels have
typically adopted some version of the federal ERISA standards. See John Griffith and Diane Yentel, “New Guidance Opens the Door for More Impact Investments
by Pension Funds,” Enterprise (blog), October 22, 2015, http://blog.enterprisecommunity.com/2015/10/administration-investments-pension.
“Issues like the US Department of Labor
clearing the way for impact investing in
retirement plans in Oct 2015 are important
advances into unleashing potential capital
flows to our fund in the future.”
– Fund manager
2015 MARKET DEVELOPMENT
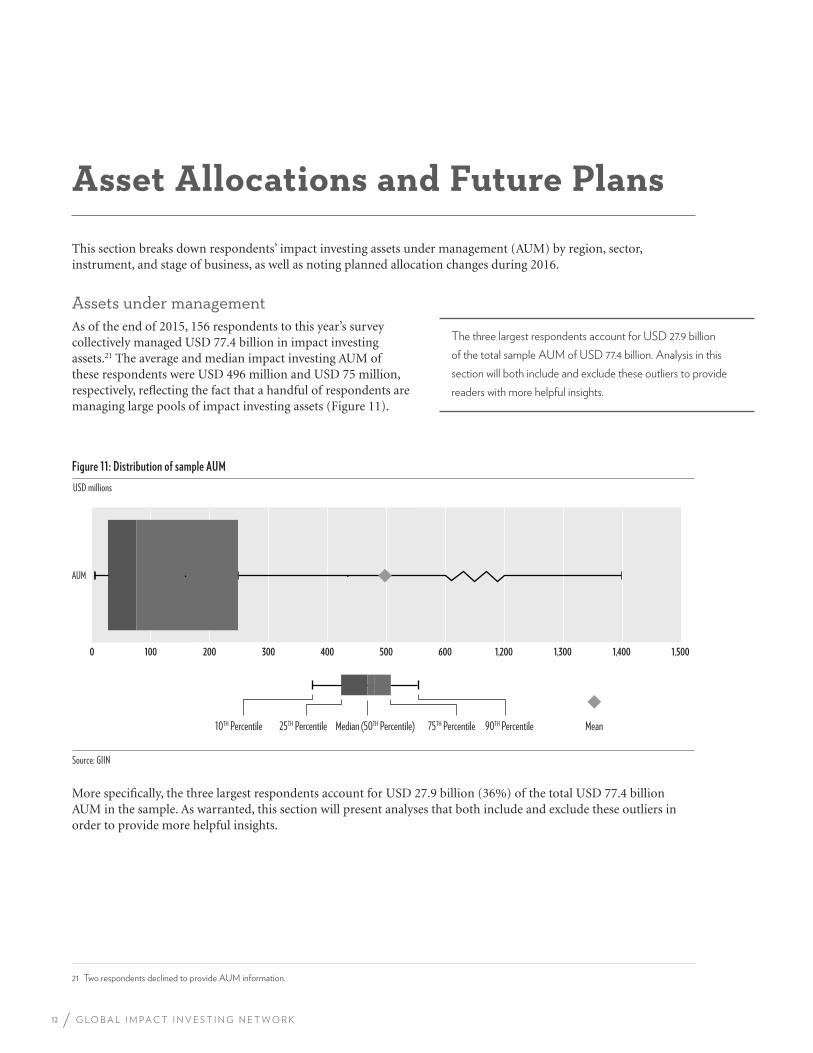
12 G L O B A L I M P A C T I N V E S T I N G N E T W O R K
Asset Allocations and Future Plans
This section breaks down respondents’ impact investing assets under management (AUM) by region, sector, instrument, and stage of business, as well as noting planned allocation changes during 2016.
Assets under managementAs of the end of 2015, 156 respondents to this year’s survey collectively managed USD 77.4 billion in impact investing assets.21 The average and median impact investing AUM of these respondents were USD 496 million and USD 75 million, respectively, reflecting the fact that a handful of respondents are managing large pools of impact investing assets (Figure 11).
Figure 11: Distribution of sample AUM
Source: GIIN
100 0 200 300 400 500 600 1,300 1,400 1,200 1,500
AUM
10TH Percentile 25TH Percentile 90TH Percentile Mean75TH PercentileMedian (50TH Percentile)
USD millions
More specifically, the three largest respondents account for USD 27.9 billion (36%) of the total USD 77.4 billion AUM in the sample. As warranted, this section will present analyses that both include and exclude these outliers in order to provide more helpful insights.
21 Two respondents declined to provide AUM information.
The three largest respondents account for USD 27.9 billion
of the total sample AUM of USD 77.4 billion. Analysis in this
section will both include and exclude these outliers to provide
readers with more helpful insights.
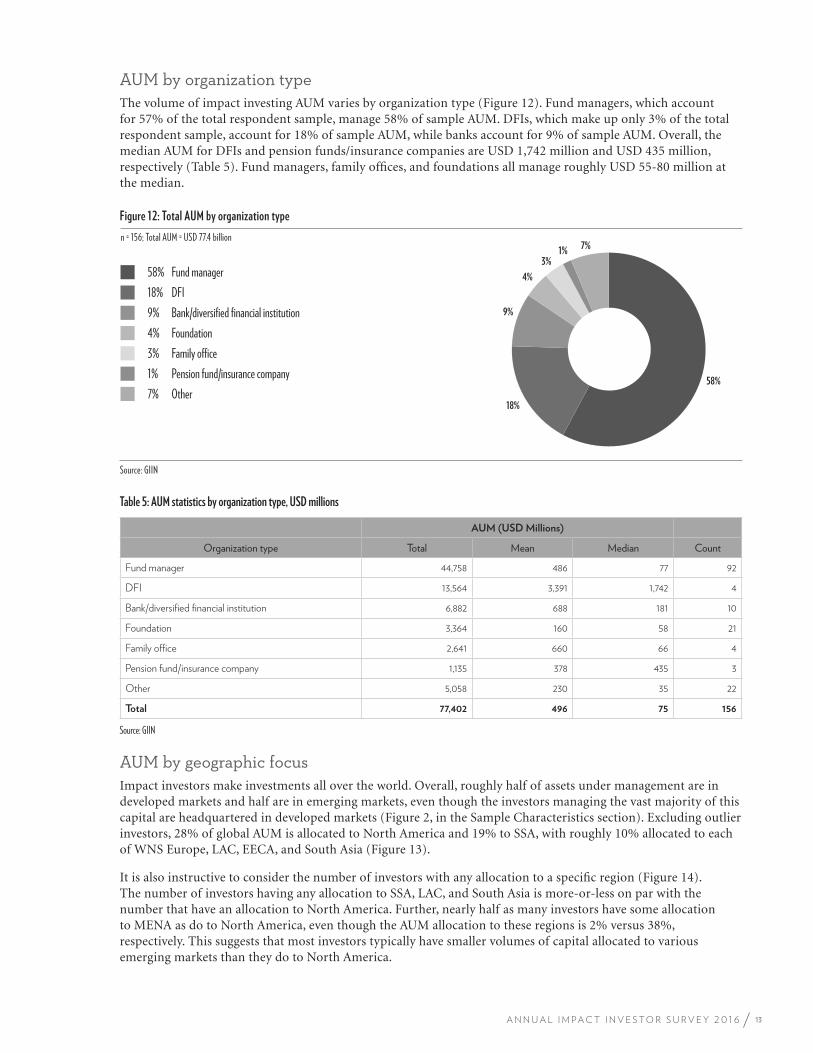
13A N N U A L I M P A C T I N V E S T O R S U R V E Y 2 0 1 6
AUM by organization typeThe volume of impact investing AUM varies by organization type (Figure 12). Fund managers, which account for 57% of the total respondent sample, manage 58% of sample AUM. DFIs, which make up only 3% of the total respondent sample, account for 18% of sample AUM, while banks account for 9% of sample AUM. Overall, the median AUM for DFIs and pension funds/insurance companies are USD 1,742 million and USD 435 million, respectively (Table 5). Fund managers, family offices, and foundations all manage roughly USD 55-80 million at the median.
Figure 12: Total AUM by organization type
n = 156; Total AUM = USD 77.4 billion
Source: GIIN
58% Fund manager 18% DFI 9% Bank/diversified financial institution 4% Foundation3% Family office 1% Pension fund/insurance company 7% Other
58%
18%
9%
4%
3% 1% 7%
Table 5: AUM statistics by organization type, USD millions
AUM (USD Millions)
Organization type Total Mean Median Count
Fund manager 44,758 486 77 92
DFI 13,564 3,391 1,742 4
Bank/diversified financial institution 6,882 688 181 10
Foundation 3,364 160 58 21
Family office 2,641 660 66 4
Pension fund/insurance company 1,135 378 435 3
Other 5,058 230 35 22
Total 77,402 496 75 156
Source: GIIN
AUM by geographic focusImpact investors make investments all over the world. Overall, roughly half of assets under management are in developed markets and half are in emerging markets, even though the investors managing the vast majority of this capital are headquartered in developed markets (Figure 2, in the Sample Characteristics section). Excluding outlier investors, 28% of global AUM is allocated to North America and 19% to SSA, with roughly 10% allocated to each of WNS Europe, LAC, EECA, and South Asia (Figure 13).
It is also instructive to consider the number of investors with any allocation to a specific region (Figure 14). The number of investors having any allocation to SSA, LAC, and South Asia is more-or-less on par with the number that have an allocation to North America. Further, nearly half as many investors have some allocation to MENA as do to North America, even though the AUM allocation to these regions is 2% versus 38%, respectively. This suggests that most investors typically have smaller volumes of capital allocated to various emerging markets than they do to North America.
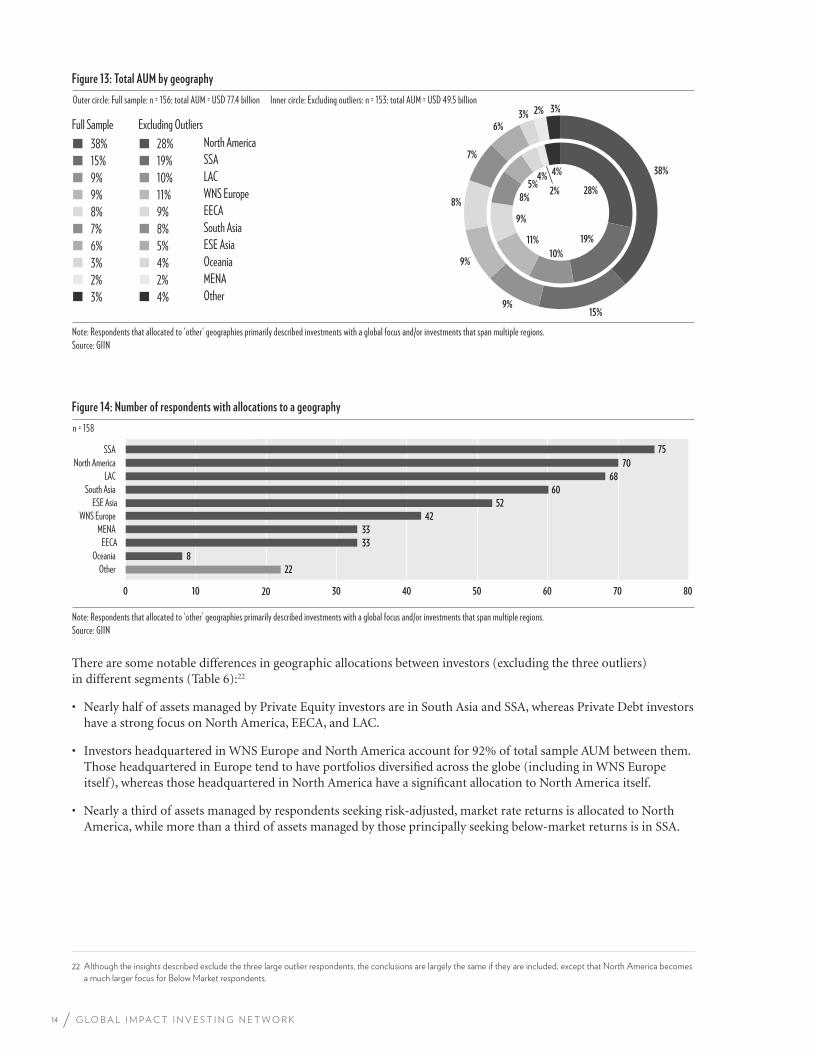
14 G L O B A L I M P A C T I N V E S T I N G N E T W O R K
Figure 13: Total AUM by geography
Outer circle: Full sample: n = 156; total AUM = USD 77.4 billion Inner circle: Excluding outliers: n = 153; total AUM = USD 49.5 billion
Note: Respondents that allocated to 'other' geographies primarily described investments with a global focus and/or investments that span multiple regions.Source: GIIN
10%
11%
9%
8%
5% 4%
2%
4%
28%
38%
19%
15% 9%
9%
8%
7%
6% 3% 2% 3%
LACWNS EuropeEECASouth Asia
OceaniaMENAOther
North AmericaSSA
ESE Asia
Full Sample
9%9%8%7%
3%2%3%
38%15%
6%
Excluding Outliers
10%11%9%8%
4%2%4%
28%19%
5%
Figure 14: Number of respondents with allocations to a geography
n = 158
Note: Respondents that allocated to ‘other’ geographies primarily described investments with a global focus and/or investments that span multiple regions.Source: GIIN
0 10 20 30 40 50 60 70 80
EECAMENA
WNS Europe
Other Oceania
ESE AsiaSouth Asia
LAC North America
SSA
22
8
33
33
42
52
60
68
70
75
There are some notable differences in geographic allocations between investors (excluding the three outliers) in different segments (Table 6):22
• Nearly half of assets managed by Private Equity investors are in South Asia and SSA, whereas Private Debt investors have a strong focus on North America, EECA, and LAC.
• Investors headquartered in WNS Europe and North America account for 92% of total sample AUM between them. Those headquartered in Europe tend to have portfolios diversified across the globe (including in WNS Europe itself), whereas those headquartered in North America have a significant allocation to North America itself.
• Nearly a third of assets managed by respondents seeking risk-adjusted, market rate returns is allocated to North America, while more than a third of assets managed by those principally seeking below-market returns is in SSA.
22 Although the insights described exclude the three large outlier respondents, the conclusions are largely the same if they are included, except that North America becomes
a much larger focus for Below Market respondents.
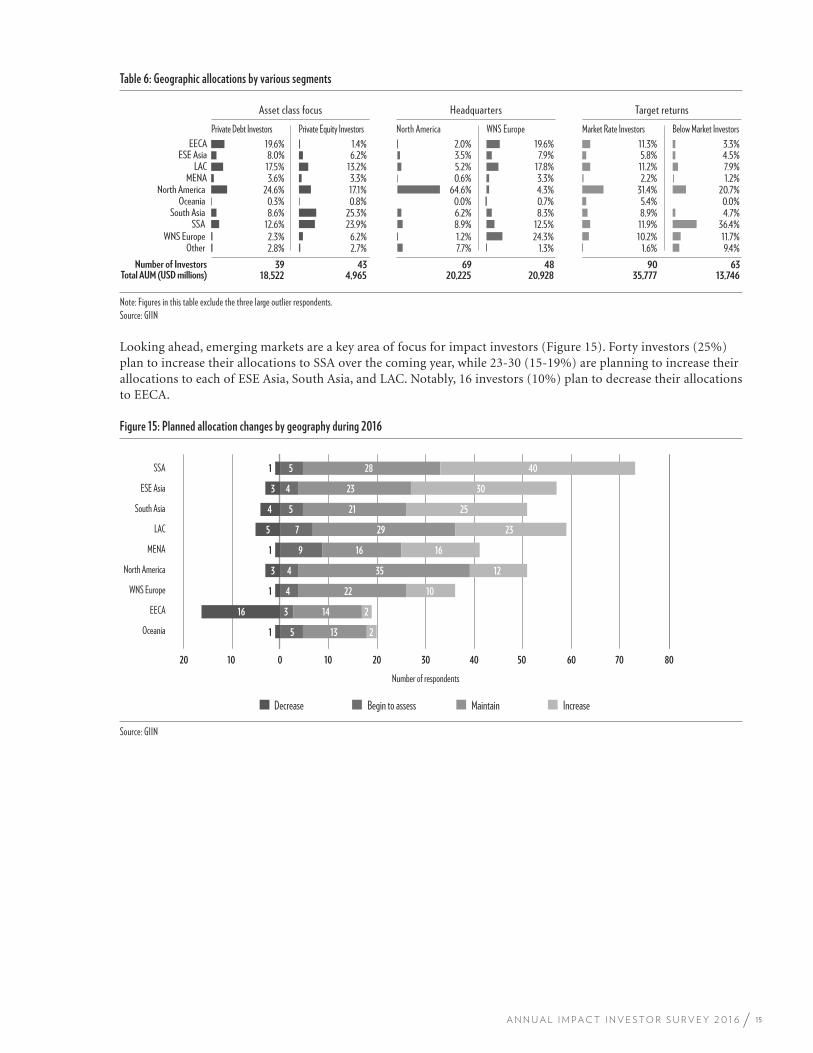
15A N N U A L I M P A C T I N V E S T O R S U R V E Y 2 0 1 6
Asset class focus Headquarters
Private Debt Investors Private Equity Investors
3.6% 17.5%
3.3% 13.2%
MENALAC
North America WNS Europe
0.6% 5.2%
3.3% 17.8%
Table 6: Geographic allocations by various segments
Target returns
Market Rate Investors Below Market Investors
2.2% 11.2%
1.2% 7.9%
8.0% 6.2% ESE Asia 3.5% 7.9% 5.8% 4.5%
24.6% North America 17.1% 64.6% 4.3% 31.4% 20.7%
19.6% 1.4% EECA 2.0% 19.6% 11.3% 3.3%
12.6% 8.6% 0.3%
SSA South Asia
23.9% 25.3%
0.8% Oceania
8.9% 6.2% 0.0%
12.5% 8.3% 0.7%
11.9% 8.9% 5.4%
36.4% 4.7% 0.0%
Note: Figures in this table exclude the three large outlier respondents.Source: GIIN
2.3% WNS Europe
18,522 39
2.8% 6.2%
4,965 43
2.7%
Total AUM (USD millions)Number of Investors
Other 1.2%
20,225 69
7.7% 24.3%
20,928 48
1.3% 10.2%
35,777 90
1.6% 11.7%
13,746 63
9.4%
Looking ahead, emerging markets are a key area of focus for impact investors (Figure 15). Forty investors (25%) plan to increase their allocations to SSA over the coming year, while 23-30 (15-19%) are planning to increase their allocations to each of ESE Asia, South Asia, and LAC. Notably, 16 investors (10%) plan to decrease their allocations to EECA.
Figure 15: Planned allocation changes by geography during 2016
Source: GIIN
Decrease Begin to assess Maintain Increase
0 20 10 10 20 30 40 50 60 70 80
Oceania
EECA
WNS Europe
North America
MENA
LAC
South Asia
ESE Asia
SSA
1
1
1
1
16
3
5
4
3
5
3
4
4
9
7
5
4
5
13
14
22
35
16
29
21
23
28
2
2
10
12
16
23
25
30
40
Number of respondents
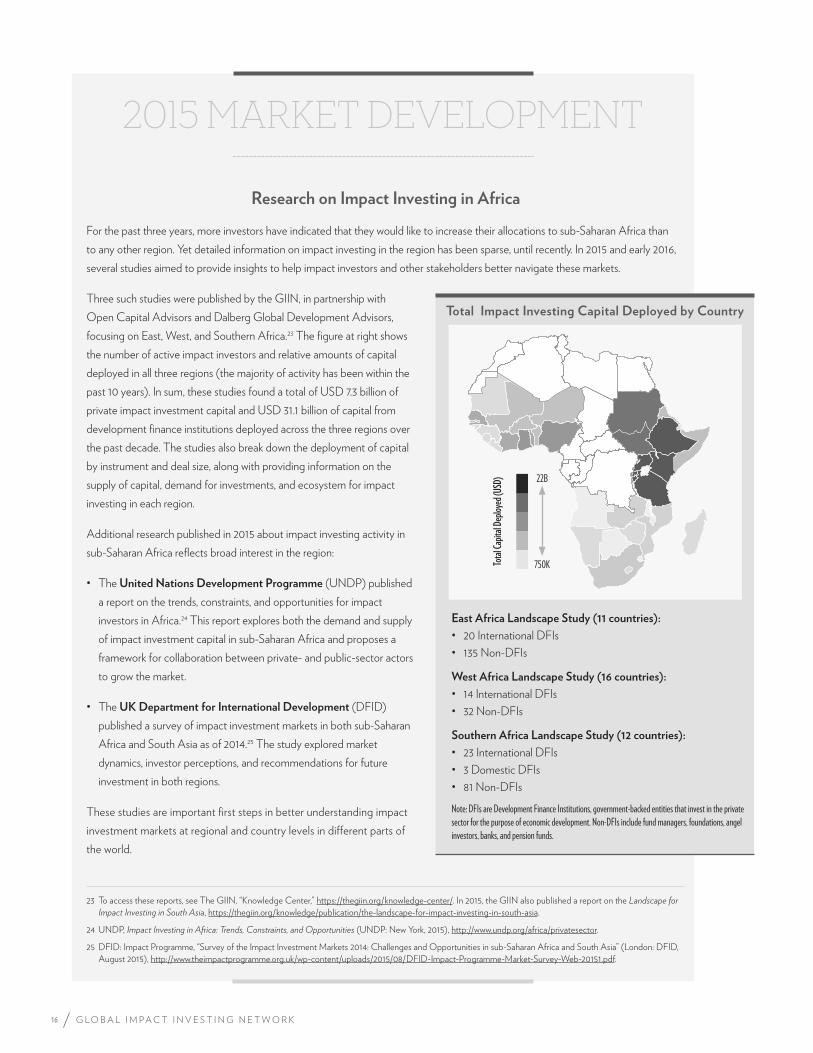
16 G L O B A L I M P A C T I N V E S T I N G N E T W O R K
Research on Impact Investing in Africa
For the past three years, more investors have indicated that they would like to increase their allocations to sub-Saharan Africa than
to any other region. Yet detailed information on impact investing in the region has been sparse, until recently. In 2015 and early 2016,
several studies aimed to provide insights to help impact investors and other stakeholders better navigate these markets.
Three such studies were published by the GIIN, in partnership with
Open Capital Advisors and Dalberg Global Development Advisors,
focusing on East, West, and Southern Africa.23 The figure at right shows
the number of active impact investors and relative amounts of capital
deployed in all three regions (the majority of activity has been within the
past 10 years). In sum, these studies found a total of USD 7.3 billion of
private impact investment capital and USD 31.1 billion of capital from
development finance institutions deployed across the three regions over
the past decade. The studies also break down the deployment of capital
by instrument and deal size, along with providing information on the
supply of capital, demand for investments, and ecosystem for impact
investing in each region.
Additional research published in 2015 about impact investing activity in
sub-Saharan Africa reflects broad interest in the region:
• The United Nations Development Programme (UNDP) published
a report on the trends, constraints, and opportunities for impact
investors in Africa.24 This report explores both the demand and supply
of impact investment capital in sub-Saharan Africa and proposes a
framework for collaboration between private- and public-sector actors
to grow the market.
• The UK Department for International Development (DFID)
published a survey of impact investment markets in both sub-Saharan
Africa and South Asia as of 2014.25 The study explored market
dynamics, investor perceptions, and recommendations for future
investment in both regions.
These studies are important first steps in better understanding impact
investment markets at regional and country levels in different parts of
the world.
23 To access these reports, see The GIIN, “Knowledge Center,” https://thegiin.org/knowledge-center/. In 2015, the GIIN also published a report on the Landscape for
Impact Investing in South Asia, https://thegiin.org/knowledge/publication/the-landscape-for-impact-investing-in-south-asia.
24 UNDP, Impact Investing in Africa: Trends, Constraints, and Opportunities (UNDP: New York, 2015), http://www.undp.org/africa/privatesector.
25 DFID: Impact Programme, “Survey of the Impact Investment Markets 2014: Challenges and Opportunities in sub-Saharan Africa and South Asia” (London: DFID,
August 2015), http://www.theimpactprogramme.org.uk/wp-content/uploads/2015/08/DFID-Impact-Programme-Market-Survey-Web-20151.pdf.
East Africa Landscape Study (11 countries):
• 20 International DFIs
• 135 Non-DFIs
West Africa Landscape Study (16 countries):
• 14 International DFIs
• 32 Non-DFIs
Southern Africa Landscape Study (12 countries):
• 23 International DFIs
• 3 Domestic DFIs
• 81 Non-DFIs
Note: DFIs are Development Finance Institutions, government-backed entities that invest in the private sector for the purpose of economic development. Non-DFIs include fund managers, foundations, angel investors, banks, and pension funds.
Total Impact Investing Capital Deployed by Country
Tota
l Cap
ital D
eplo
yed
(USD
) 22B
750K
2015 MARKET DEVELOPMENT
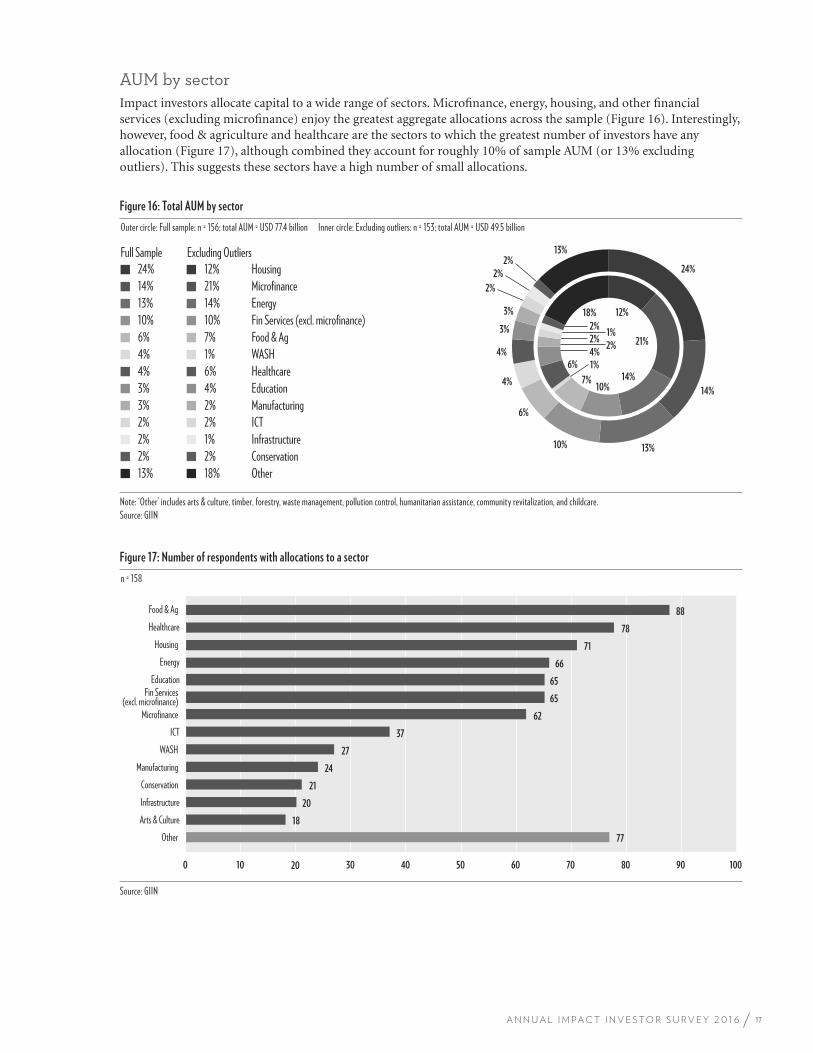
17A N N U A L I M P A C T I N V E S T O R S U R V E Y 2 0 1 6
AUM by sectorImpact investors allocate capital to a wide range of sectors. Microfinance, energy, housing, and other financial services (excluding microfinance) enjoy the greatest aggregate allocations across the sample (Figure 16). Interestingly, however, food & agriculture and healthcare are the sectors to which the greatest number of investors have any allocation (Figure 17), although combined they account for roughly 10% of sample AUM (or 13% excluding outliers). This suggests these sectors have a high number of small allocations.
Figure 16: Total AUM by sector
Outer circle: Full sample: n = 156; total AUM = USD 77.4 billion Inner circle: Excluding outliers: n = 153; total AUM = USD 49.5 billion
Full Sample
Note: ‘Other’ includes arts & culture, timber, forestry, waste management, pollution control, humanitarian assistance, community revitalization, and childcare.Source: GIIN
Energy Fin Services (excl. microfinance) Food & Ag
Housing Microfinance
13%10%6%
24%14%
Excluding Outliers
7%
14%10%
12%21%
WASH
Education Manufacturing
Healthcare 4%
3%3%
4%1%
2%4%6%
ICT
Conservation Other
Infrastructure 2%
2%13%
2%2%
18%2%1%
12%
21%
14% 10%
7%
1% 6% 4%
2% 2%
1% 2%
18%
24%
14%
13% 10%
6%
4%
4%
3%
3%
2%
2%
2% 13%
Figure 17: Number of respondents with allocations to a sector
Source: GIIN
0 10 20 30 60 50 40 70 80 90 100
ICT
Microfinance
Fin Services (excl. microfinance)
Manufacturing
WASH
Infrastructure
Conservation
Other
Arts & Culture
Education
Energy
Housing
Healthcare
Food & Ag
77
18
20
21
24
27
37
62
65
65
66
71
78
88
n = 158
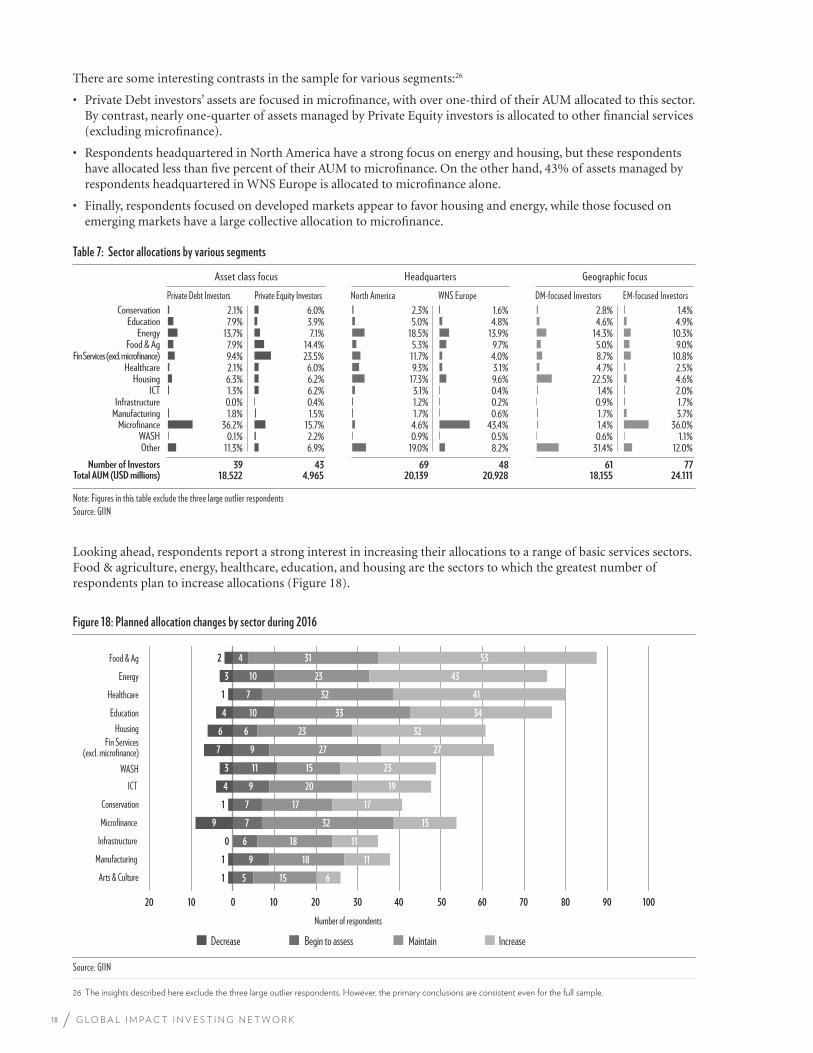
18 G L O B A L I M P A C T I N V E S T I N G N E T W O R K
There are some interesting contrasts in the sample for various segments:26
• Private Debt investors’ assets are focused in microfinance, with over one-third of their AUM allocated to this sector. By contrast, nearly one-quarter of assets managed by Private Equity investors is allocated to other financial services (excluding microfinance).
• Respondents headquartered in North America have a strong focus on energy and housing, but these respondents have allocated less than five percent of their AUM to microfinance. On the other hand, 43% of assets managed by respondents headquartered in WNS Europe is allocated to microfinance alone.
• Finally, respondents focused on developed markets appear to favor housing and energy, while those focused on emerging markets have a large collective allocation to microfinance.
Note: Figures in this table exclude the three large outlier respondents Source: GIIN
Asset class focus Headquarters
Private Debt Investors Private Equity Investors
0.0% 1.3% 6.3% 2.1% 9.4% 7.9%
13.7% 7.9% 2.1%
InfrastructureICT
HousingHealthcare
18,522 39
1.8% 0.4%6.2%6.2%6.0%
23.5%14.4%
7.1%3.9%6.0%
4,965 43
1.5%
Total AUM (USD millions)Number of Investors
Manufacturing
Fin Services (excl. microfinance)Food & Ag
EnergyEducation
ConservationNorth America WNS Europe
1.2% 3.1%
17.3% 9.3%
11.7% 5.3%
18.5% 5.0% 2.3%
20,139 69
1.7% 0.2% 0.4% 9.6% 3.1%
4.0% 9.7%
13.9% 4.8% 1.6%
20,928 48
0.6%
Table 7: Sector allocations by various segments
Geographic focus
DM-focused Investors EM-focused Investors
0.9% 1.4%
22.5% 4.7% 8.7% 5.0%
14.3% 4.6% 2.8%
18,155 61
1.7% 1.7%
2.0% 4.6% 2.5%
10.8% 9.0%
10.3% 4.9% 1.4%
24.111 77
3.7%
0.1% 36.2%
WASHMicrofinance
11.3% 2.2%
15.7%
6.9%Other0.9% 4.6%
19.0% 0.5%
43.4%
8.2% 0.6% 1.4%
31.4% 1.1%
36.0%
12.0%
Looking ahead, respondents report a strong interest in increasing their allocations to a range of basic services sectors. Food & agriculture, energy, healthcare, education, and housing are the sectors to which the greatest number of respondents plan to increase allocations (Figure 18).
Figure 18: Planned allocation changes by sector during 2016
Source: GIIN
Decrease Begin to assess Maintain Increase
0 20 20 10 10 30 50 70 40 60 80 90 100
Arts & Culture
Infrastructure
Conservation
WASH
Manufacturing
Microfinance
ICT
Fin Services(excl. microfinance)
HousingEducation
Healthcare
Energy
Food & Ag
1
1
0
9
1
4
3
7
6
4
1
3
2
5
9
6
7
7
9
11
9
6
10
7
10
4
15
18
18
32
17
20
15
27
23
33
32
23
31
6
11
11
15
17
19
23
27
32
34
41
43
53
Number of respondents
26 The insights described here exclude the three large outlier respondents. However, the primary conclusions are consistent even for the full sample.
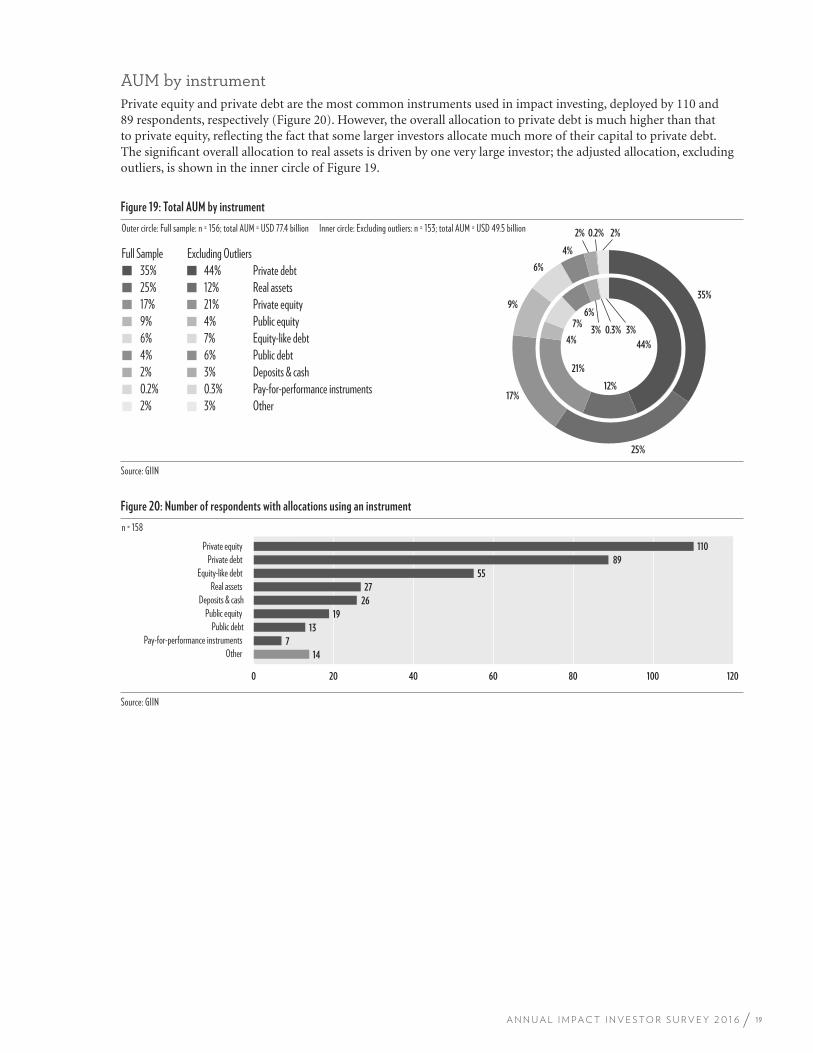
19A N N U A L I M P A C T I N V E S T O R S U R V E Y 2 0 1 6
AUM by instrumentPrivate equity and private debt are the most common instruments used in impact investing, deployed by 110 and 89 respondents, respectively (Figure 20). However, the overall allocation to private debt is much higher than that to private equity, reflecting the fact that some larger investors allocate much more of their capital to private debt. The significant overall allocation to real assets is driven by one very large investor; the adjusted allocation, excluding outliers, is shown in the inner circle of Figure 19.
Figure 19: Total AUM by instrument
Outer circle: Full sample: n = 156; total AUM = USD 77.4 billion Inner circle: Excluding outliers: n = 153; total AUM = USD 49.5 billion
Source: GIIN
Private equity Public equityEquity-like debt Public debt
Pay-for-performance instruments Other
Private debt Real assets
Deposits & cash
44%
12%
21%
4%
7% 6%
3% 0.3% 3%
35%
25%
17%
9%
6%
4%
2% 0.2% 2%
Full Sample Excluding Outliers
17%9%6%4%
0.2%2%
35%25%
2%
21%4%7%6%
0.3%3%
44%12%
3%
Figure 20: Number of respondents with allocations using an instrument
n = 158
Source: GIIN
0 20 40 60 80 100 120
Pay-for-performance instruments Other
Public debtPublic equity
Deposits & cashReal assets
Equity-like debt Private debt
Private equity
14
7
13
19
26
27
55
89
110
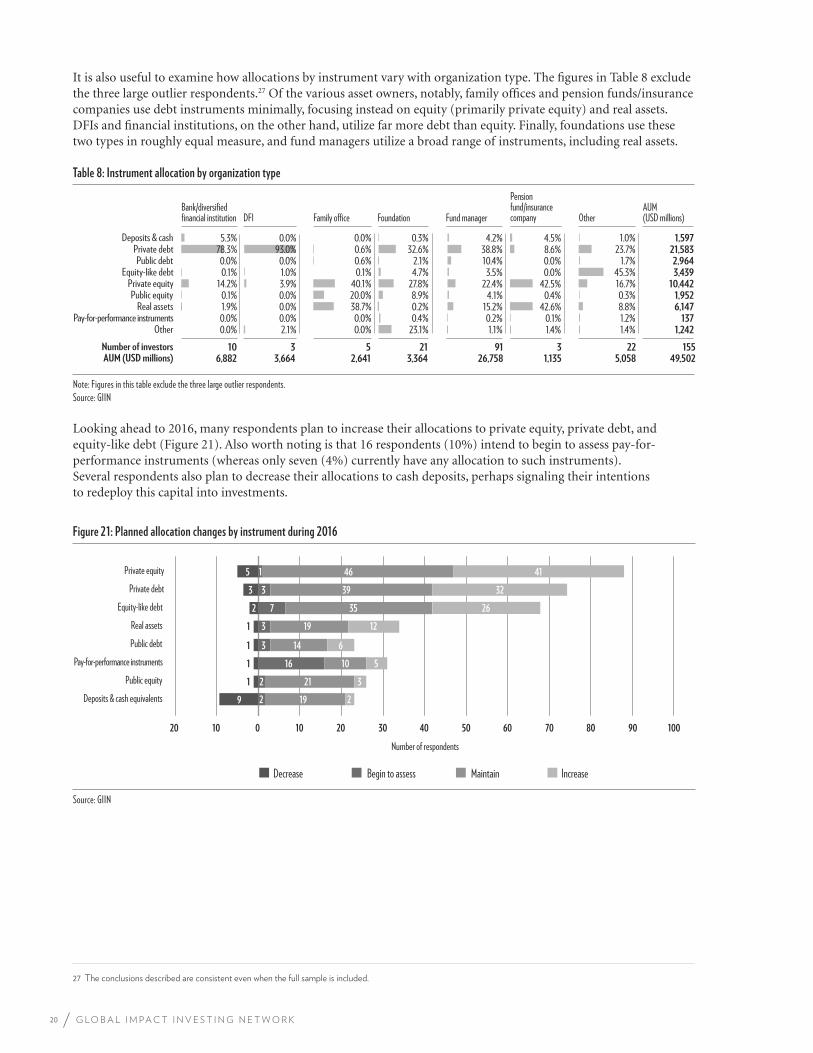
20 G L O B A L I M P A C T I N V E S T I N G N E T W O R K
It is also useful to examine how allocations by instrument vary with organization type. The figures in Table 8 exclude the three large outlier respondents.27 Of the various asset owners, notably, family offices and pension funds/insurance companies use debt instruments minimally, focusing instead on equity (primarily private equity) and real assets. DFIs and financial institutions, on the other hand, utilize far more debt than equity. Finally, foundations use these two types in roughly equal measure, and fund managers utilize a broad range of instruments, including real assets.
Bank/diversified financial institution
Pension fund/insurance companyDFI
0.0% 0.0% 1.9% 0.1%
14.2% 0.1% 0.0%
78.3% 5.3%
OtherPay-for-performance instruments
Real assetsPublic equity
2.1%0.0%0.0%0.0%3.9%1.0%0.0%
93.0%0.0%
Private equityEquity-like debt
Public debtPrivate debt
Deposits & cash
Table 8: Instrument allocation by organization type
0.0%0.0%
38.7%20.0%40.1%
0.1%0.6%0.6%0.0%
23.1%0.4%0.2%8.9%
27.8%4.7%2.1%
32.6%0.3%
1.1%0.2%
15.2%4.1%
22.4%3.5%
10.4%38.8%
4.2%
1.4%0.1%
42.6%0.4%
42.5%0.0%0.0%8.6%4.5%
Family office Foundation Fund manager OtherAUM (USD millions)
1.4%1.2%8.8%0.3%
16.7%45.3%
1.7%23.7%
1.0%
1,242137
6,1471,952
10,4423,4392,964
21,5831,597
Note: Figures in this table exclude the three large outlier respondents. Source: GIIN
10 3 Number of investors 5 21 91 3 22 6,882 3,664 AUM (USD millions) 2,641 3,364 26,758 1,135 5,058
15549,502
Looking ahead to 2016, many respondents plan to increase their allocations to private equity, private debt, and equity-like debt (Figure 21). Also worth noting is that 16 respondents (10%) intend to begin to assess pay-for-performance instruments (whereas only seven (4%) currently have any allocation to such instruments). Several respondents also plan to decrease their allocations to cash deposits, perhaps signaling their intentions to redeploy this capital into investments.
Figure 21: Planned allocation changes by instrument during 2016
Source: GIIN
Decrease Begin to assess Maintain Increase
0 20 20 40 60 80 10 10 30 50 70 90 100
Public equity
Deposits & cash equivalents
Pay-for-performance instruments
Public debt
Real assets
Equity-like debt
Private debt
Private equity
9
1
1
1
1
2
3
5
2
2
16
3
3
7
3
1
19
21
10
14
19
35
39
46
2
3
5
6
12
26
32
41
Number of respondents
27 The conclusions described are consistent even when the full sample is included.
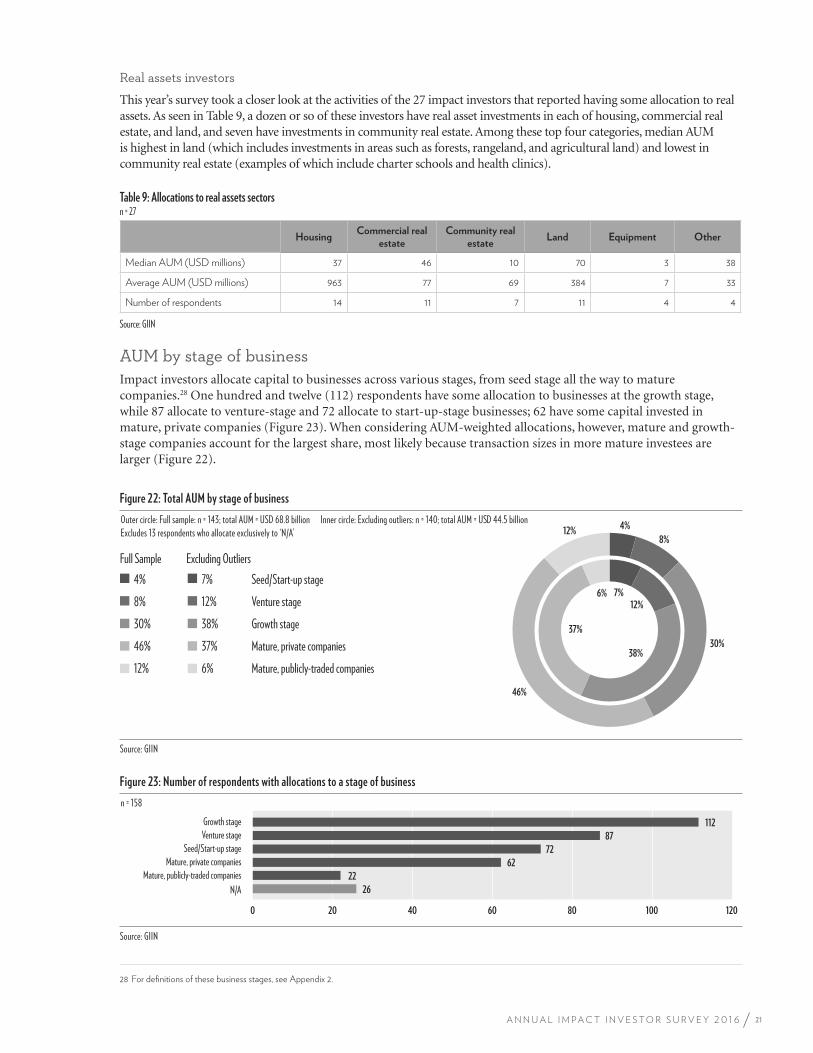
21A N N U A L I M P A C T I N V E S T O R S U R V E Y 2 0 1 6
Real assets investors
This year’s survey took a closer look at the activities of the 27 impact investors that reported having some allocation to real assets. As seen in Table 9, a dozen or so of these investors have real asset investments in each of housing, commercial real estate, and land, and seven have investments in community real estate. Among these top four categories, median AUM is highest in land (which includes investments in areas such as forests, rangeland, and agricultural land) and lowest in community real estate (examples of which include charter schools and health clinics).
Table 9: Allocations to real assets sectorsn = 27
HousingCommercial real
estateCommunity real
estateLand Equipment Other
Median AUM (USD millions) 37 46 10 70 3 38
Average AUM (USD millions) 963 77 69 384 7 33
Number of respondents 14 11 7 11 4 4
Source: GIIN
AUM by stage of businessImpact investors allocate capital to businesses across various stages, from seed stage all the way to mature companies.28 One hundred and twelve (112) respondents have some allocation to businesses at the growth stage, while 87 allocate to venture-stage and 72 allocate to start-up-stage businesses; 62 have some capital invested in mature, private companies (Figure 23). When considering AUM-weighted allocations, however, mature and growth-stage companies account for the largest share, most likely because transaction sizes in more mature investees are larger (Figure 22).
Figure 22: Total AUM by stage of business
Outer circle: Full sample: n = 143; total AUM = USD 68.8 billion Inner circle: Excluding outliers: n = 140; total AUM = USD 44.5 billionExcludes 13 respondents who allocate exclusively to ‘N/A’
Source: GIIN
7% 12%
38%
37%
6%
4%
8%
30%
46%
12%
Growth stage
Mature, private companies
Mature, publicly-traded companies
Seed/Start-up stage
Venture stage
Full Sample
30%
46%
12%
4%
8%
Excluding Outliers
38%
37%
6%
7%
12%
Figure 23: Number of respondents with allocations to a stage of business
n = 158
Source: GIIN
0 20 40 60 80 100 120
N/A Mature, publicly-traded companies
Mature, private companies Seed/Start-up stage
Venture stage Growth stage
26
22
62
72
87
112
28 For definitions of these business stages, see Appendix 2.
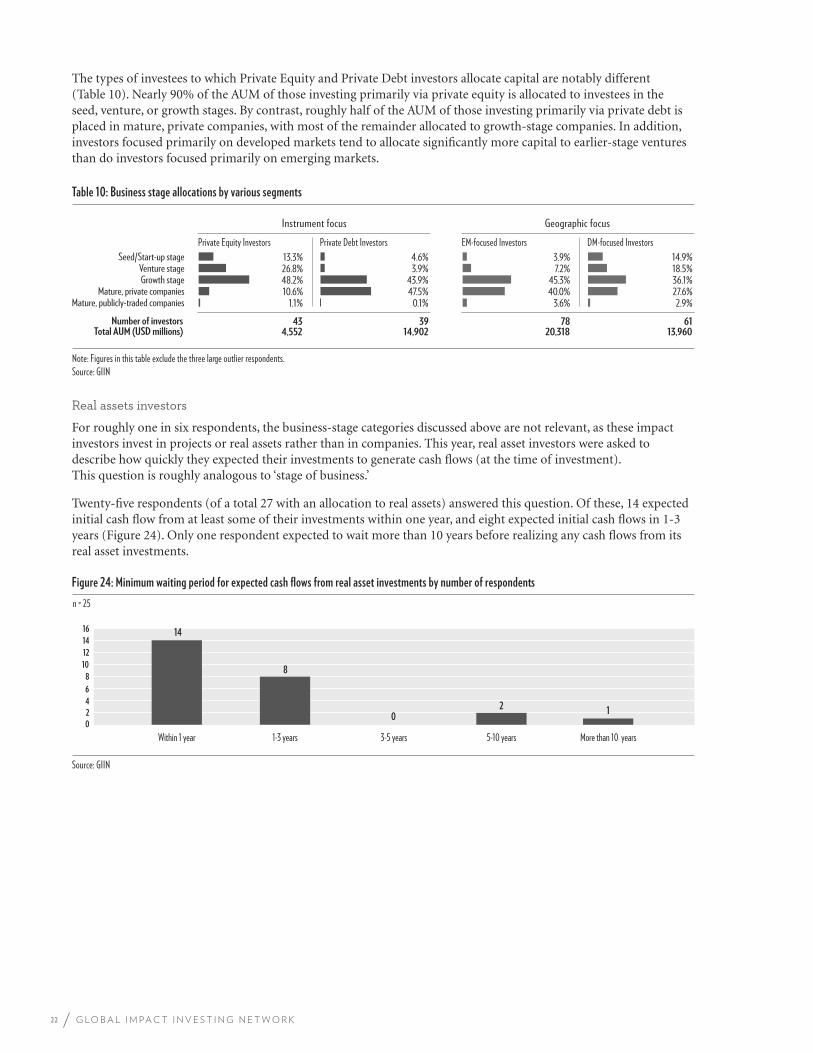
22 G L O B A L I M P A C T I N V E S T I N G N E T W O R K
The types of investees to which Private Equity and Private Debt investors allocate capital are notably different (Table 10). Nearly 90% of the AUM of those investing primarily via private equity is allocated to investees in the seed, venture, or growth stages. By contrast, roughly half of the AUM of those investing primarily via private debt is placed in mature, private companies, with most of the remainder allocated to growth-stage companies. In addition, investors focused primarily on developed markets tend to allocate significantly more capital to earlier-stage ventures than do investors focused primarily on emerging markets.
Note: Figures in this table exclude the three large outlier respondents.Source: GIIN
Instrument focus Geographic focus
Private Equity Investors Private Debt Investors
0.1%47.5%43.9%
3.9%4.6%
Mature, publicly-traded companiesMature, private companies
Growth stageVenture stage
Seed/Start-up stageEM-focused Investors DM-focused Investors
1.1% 10.6% 48.2% 26.8% 13.3%
3.6% 40.0% 45.3%
7.2% 3.9%
2.9% 27.6% 36.1% 18.5% 14.9%
39 Number of investors 43 78 61 14,902Total AUM (USD millions) 4,552 20,318 13,960
Table 10: Business stage allocations by various segments
Real assets investors
For roughly one in six respondents, the business-stage categories discussed above are not relevant, as these impact investors invest in projects or real assets rather than in companies. This year, real asset investors were asked to describe how quickly they expected their investments to generate cash flows (at the time of investment). This question is roughly analogous to ‘stage of business.’
Twenty-five respondents (of a total 27 with an allocation to real assets) answered this question. Of these, 14 expected initial cash flow from at least some of their investments within one year, and eight expected initial cash flows in 1-3 years (Figure 24). Only one respondent expected to wait more than 10 years before realizing any cash flows from its real asset investments.
Figure 24: Minimum waiting period for expected cash flows from real asset investments by number of respondents
n = 25
Source: GIIN
4
2
0
6
8
10
12
14
16
Within 1 year 1-3 years 3-5 years 5-10 years More than 10 years
14
8
0 2 1
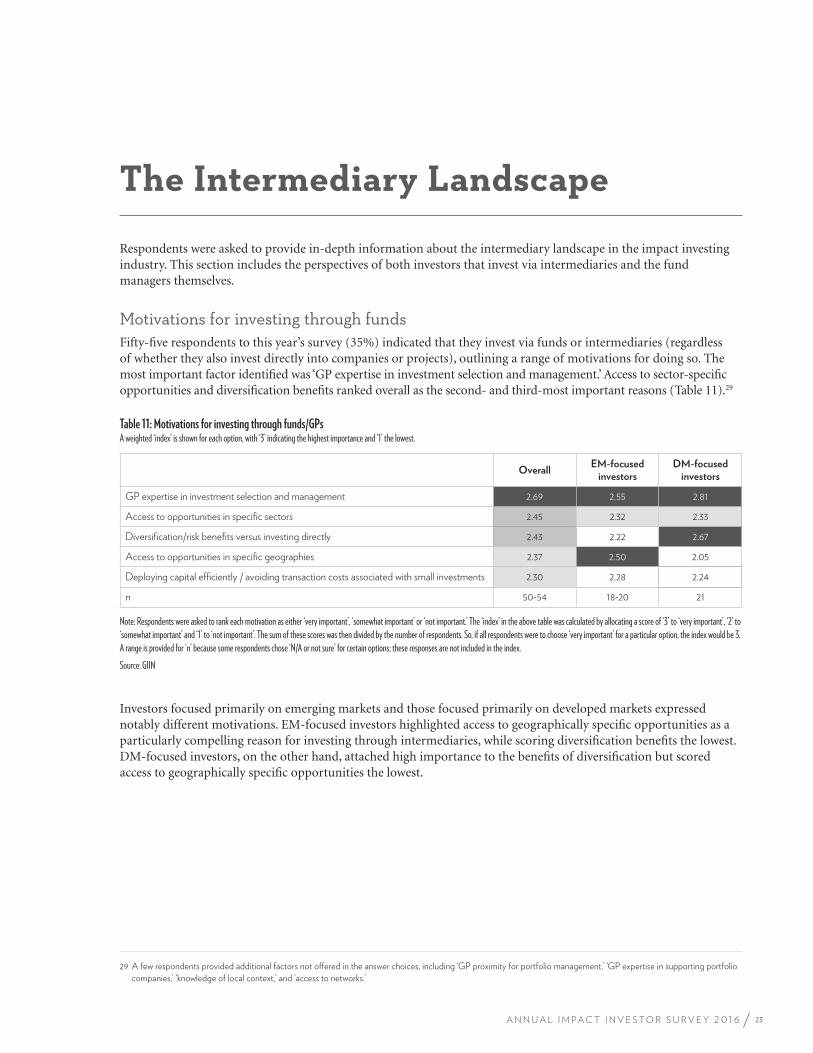
23A N N U A L I M P A C T I N V E S T O R S U R V E Y 2 0 1 6
The Intermediary Landscape
Respondents were asked to provide in-depth information about the intermediary landscape in the impact investing industry. This section includes the perspectives of both investors that invest via intermediaries and the fund managers themselves.
Motivations for investing through fundsFifty-five respondents to this year’s survey (35%) indicated that they invest via funds or intermediaries (regardless of whether they also invest directly into companies or projects), outlining a range of motivations for doing so. The most important factor identified was ‘GP expertise in investment selection and management.’ Access to sector-specific opportunities and diversification benefits ranked overall as the second- and third-most important reasons (Table 11).29
Table 11: Motivations for investing through funds/GPs A weighted ‘index’ is shown for each option, with ‘3’ indicating the highest importance and ‘1’ the lowest.
OverallEM-focused
investorsDM-focused
investors
GP expertise in investment selection and management 2.69 2.55 2.81
Access to opportunities in specific sectors 2.45 2.32 2.33
Diversification/risk benefits versus investing directly 2.43 2.22 2.67
Access to opportunities in specific geographies 2.37 2.50 2.05
Deploying capital efficiently / avoiding transaction costs associated with small investments 2.30 2.28 2.24
n 50-54 18-20 21 Note: Respondents were asked to rank each motivation as either ‘very important’, ‘somewhat important’ or ‘not important.’ The ‘index’ in the above table was calculated by allocating a score of ‘3’ to ‘very important’, ‘2’ to ‘somewhat important’ and ‘1’ to ‘not important’. The sum of these scores was then divided by the number of respondents. So, if all respondents were to choose ‘very important’ for a particular option, the index would be 3. A range is provided for ‘n’ because some respondents chose ‘N/A or not sure’ for certain options; these responses are not included in the index.
Source: GIIN
Investors focused primarily on emerging markets and those focused primarily on developed markets expressed notably different motivations. EM-focused investors highlighted access to geographically specific opportunities as a particularly compelling reason for investing through intermediaries, while scoring diversification benefits the lowest. DM-focused investors, on the other hand, attached high importance to the benefits of diversification but scored access to geographically specific opportunities the lowest.
29 A few respondents provided additional factors not offered in the answer choices, including ‘GP proximity for portfolio management,’ ‘GP expertise in supporting portfolio
companies,’ ‘knowledge of local context,’ and ‘access to networks.’
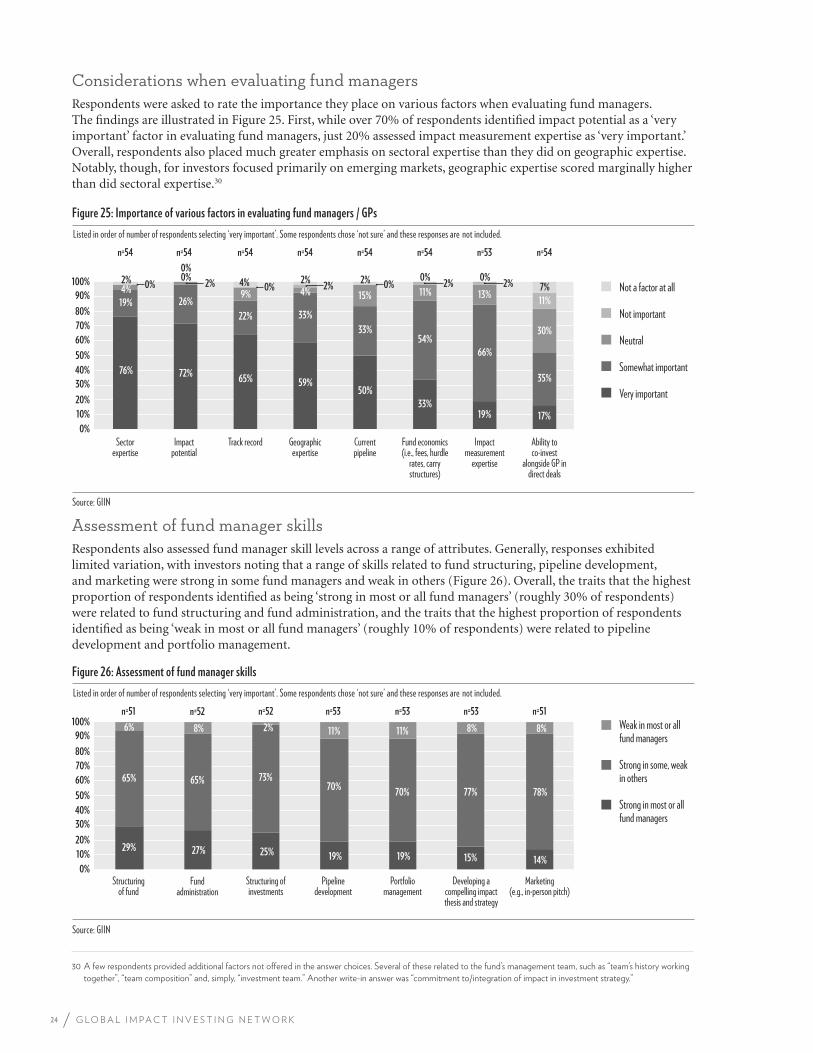
24 G L O B A L I M P A C T I N V E S T I N G N E T W O R K
Considerations when evaluating fund managersRespondents were asked to rate the importance they place on various factors when evaluating fund managers. The findings are illustrated in Figure 25. First, while over 70% of respondents identified impact potential as a ‘very important’ factor in evaluating fund managers, just 20% assessed impact measurement expertise as ‘very important.’ Overall, respondents also placed much greater emphasis on sectoral expertise than they did on geographic expertise. Notably, though, for investors focused primarily on emerging markets, geographic expertise scored marginally higher than did sectoral expertise.30
Figure 25: Importance of various factors in evaluating fund managers / GPs
Listed in order of number of respondents selecting ‘very important’. Some respondents chose ‘not sure’ and these responses are not included.
Source: GIIN
0%
10%
20%
30%
40%
50%
60%
70%
80%
90%
100%
Sector expertise
Impact potential
Track record Geographic expertise
Current pipeline
Fund economics (i.e., fees, hurdle
rates, carry structures)
Impact measurement
expertise
Ability to co-invest
alongside GP in direct deals
Not a factor at all
Not important
Neutral
Somewhat important
Very important
n=54 n=54 n=54 n=54 n=54n=54 n=54 n=53
2% 0% 0% 2% 0% 2%
19% 26%
76% 72% 65% 59%
50%
33% 19% 17%
22% 33%
33% 54%
66%
35%
4% 9% 4% 15% 11% 13%
30%
11%
2% 0% 0%
4% 2% 2% 0% 0% 7% 2%
Assessment of fund manager skillsRespondents also assessed fund manager skill levels across a range of attributes. Generally, responses exhibited limited variation, with investors noting that a range of skills related to fund structuring, pipeline development, and marketing were strong in some fund managers and weak in others (Figure 26). Overall, the traits that the highest proportion of respondents identified as being ‘strong in most or all fund managers’ (roughly 30% of respondents) were related to fund structuring and fund administration, and the traits that the highest proportion of respondents identified as being ‘weak in most or all fund managers’ (roughly 10% of respondents) were related to pipeline development and portfolio management.
Figure 26: Assessment of fund manager skills
Listed in order of number of respondents selecting ‘very important’. Some respondents chose ‘not sure’ and these responses are not included.
Source: GIIN
0%
10%
20%
30%
40%
50%
60%
70%
80%
90%
100%
Structuringof fund
Fund administration
Structuring of investments
Pipeline development
Portfolio management
Developing a compelling impact thesis and strategy
Marketing(e.g., in-person pitch)
Weak in most or all fund managers
Strong in some, weak in others
Strong in most or all fund managers
n=51 n=52 n=53 n=51n=52 n=53 n=53
29% 27% 25% 19% 19% 15% 14%
65% 65% 73% 70%
70% 77% 78%
6% 8% 2% 11% 11% 8% 8%
30 A few respondents provided additional factors not offered in the answer choices. Several of these related to the fund’s management team, such as “team’s history working
together”, “team composition” and, simply, “investment team.” Another write-in answer was “commitment to/integration of impact in investment strategy.”
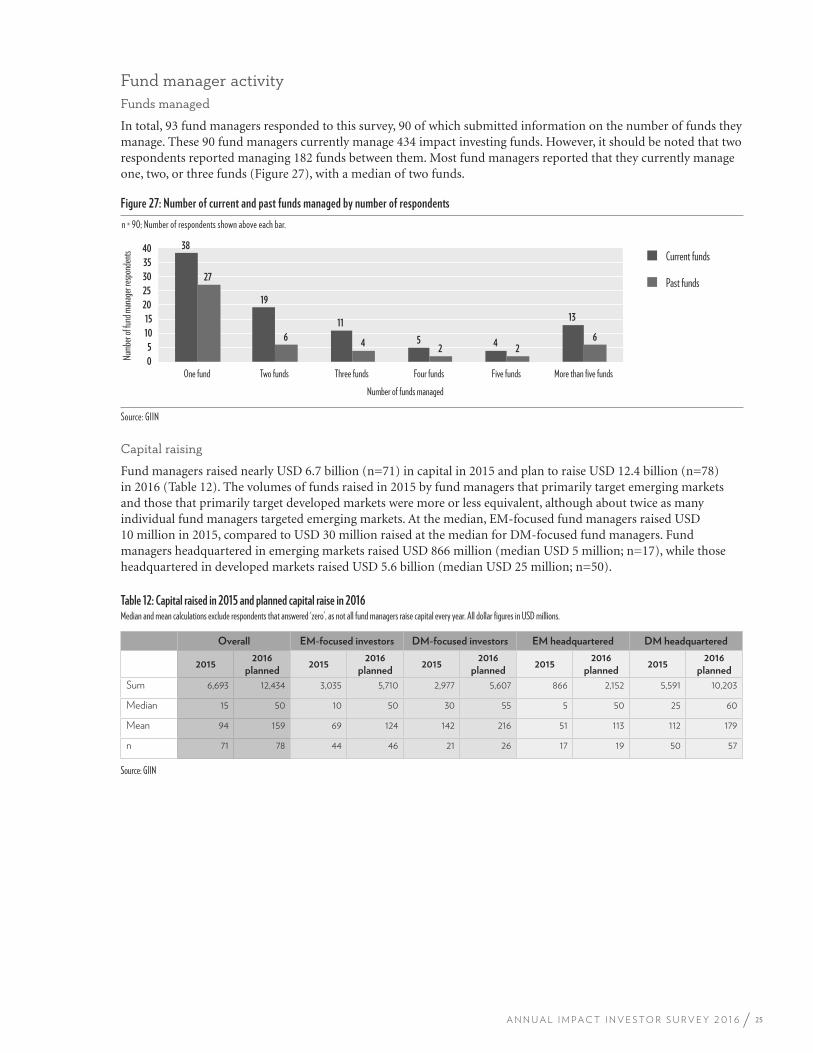
25A N N U A L I M P A C T I N V E S T O R S U R V E Y 2 0 1 6
Fund manager activityFunds managed
In total, 93 fund managers responded to this survey, 90 of which submitted information on the number of funds they manage. These 90 fund managers currently manage 434 impact investing funds. However, it should be noted that two respondents reported managing 182 funds between them. Most fund managers reported that they currently manage one, two, or three funds (Figure 27), with a median of two funds.
Figure 27: Number of current and past funds managed by number of respondents
Number of funds managed
Numb
er of
fund m
anag
er res
pond
ents
n = 90; Number of respondents shown above each bar.
Source: GIIN
5
10
15
0
20
25
35
30
40
One fund Two funds Three funds Five funds More than five fundsFour funds
Current funds
Past funds
38
19
11
5 4
13
27
6 4
2 2 6
Capital raising
Fund managers raised nearly USD 6.7 billion (n=71) in capital in 2015 and plan to raise USD 12.4 billion (n=78) in 2016 (Table 12). The volumes of funds raised in 2015 by fund managers that primarily target emerging markets and those that primarily target developed markets were more or less equivalent, although about twice as many individual fund managers targeted emerging markets. At the median, EM-focused fund managers raised USD 10 million in 2015, compared to USD 30 million raised at the median for DM-focused fund managers. Fund managers headquartered in emerging markets raised USD 866 million (median USD 5 million; n=17), while those headquartered in developed markets raised USD 5.6 billion (median USD 25 million; n=50).
Table 12: Capital raised in 2015 and planned capital raise in 2016Median and mean calculations exclude respondents that answered ‘zero’, as not all fund managers raise capital every year. All dollar figures in USD millions.
Overall EM-focused investors DM-focused investors EM headquartered DM headquartered
20152016
planned2015
2016 planned
20152016
planned2015
2016 planned
20152016
planned
Sum 6,693 12,434 3,035 5,710 2,977 5,607 866 2,152 5,591 10,203
Median 15 50 10 50 30 55 5 50 25 60
Mean 94 159 69 124 142 216 51 113 112 179
n 71 78 44 46 21 26 17 19 50 57
Source: GIIN
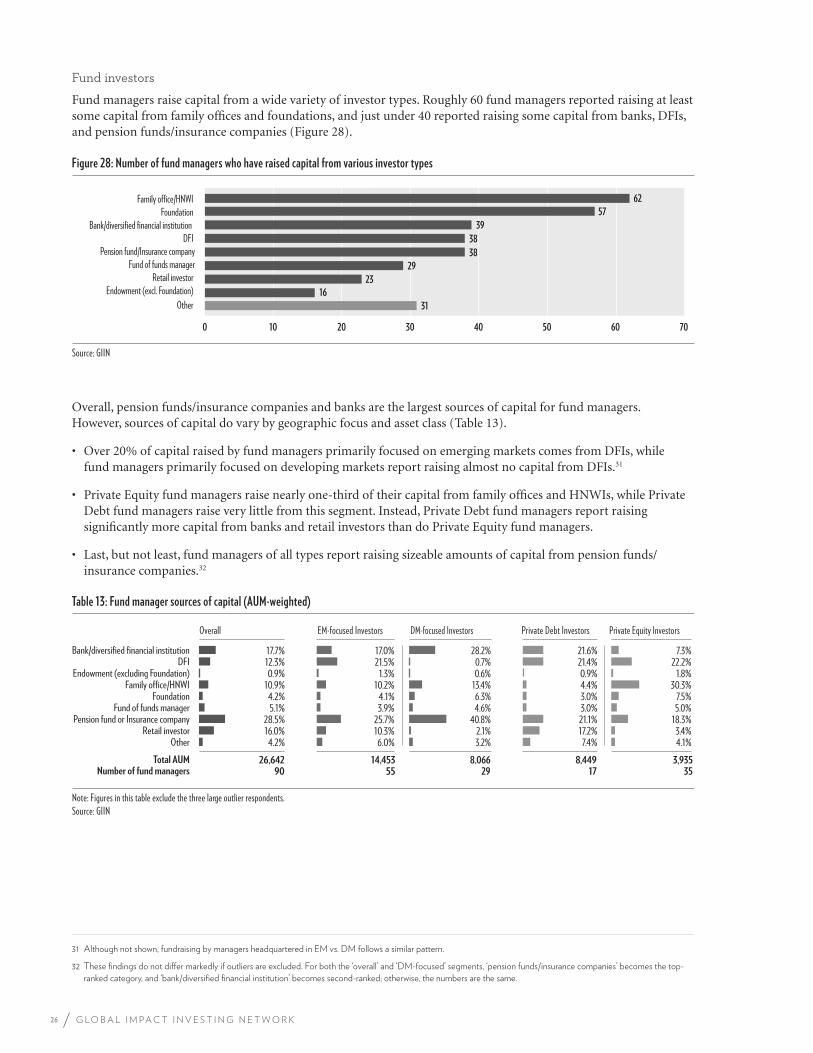
26 G L O B A L I M P A C T I N V E S T I N G N E T W O R K
Fund investors
Fund managers raise capital from a wide variety of investor types. Roughly 60 fund managers reported raising at least some capital from family offices and foundations, and just under 40 reported raising some capital from banks, DFIs, and pension funds/insurance companies (Figure 28).
Figure 28: Number of fund managers who have raised capital from various investor types
Source: GIIN
0 10 20 30 50 40 60 70
Endowment (excl. Foundation) Other
Retail investor Fund of funds manager
Pension fund/Insurance companyDFI
Bank/diversified financial institution Foundation
Family office/HNWI
31
16
23
29
38
38
39
57
62
Overall, pension funds/insurance companies and banks are the largest sources of capital for fund managers. However, sources of capital do vary by geographic focus and asset class (Table 13).
• Over 20% of capital raised by fund managers primarily focused on emerging markets comes from DFIs, while fund managers primarily focused on developing markets report raising almost no capital from DFIs.31
• Private Equity fund managers raise nearly one-third of their capital from family offices and HNWIs, while Private Debt fund managers raise very little from this segment. Instead, Private Debt fund managers report raising significantly more capital from banks and retail investors than do Private Equity fund managers.
• Last, but not least, fund managers of all types report raising sizeable amounts of capital from pension funds/insurance companies.32
Overall EM-focused Investors
4.2% 16.0% 28.5%
5.1% 4.2%
10.9% 0.9%
12.3% 17.7%
OtherRetail investor
Pension fund or Insurance companyFund of funds manager
6.0% 10.3% 25.7%
3.9% 4.1%
10.2% 1.3%
21.5% 17.0%
FoundationFamily office/HNWI
Endowment (excluding Foundation)DFI
Bank/diversified financial institution
Table 13: Fund manager sources of capital (AUM-weighted)
3.2% 2.1%
40.8% 4.6% 6.3%
13.4% 0.6% 0.7%
28.2%
7.4% 17.2% 21.1% 3.0% 3.0% 4.4% 0.9%
21.4% 21.6%
4.1% 3.4%
18.3% 5.0% 7.5%
30.3% 1.8%
22.2% 7.3%
DM-focused Investors Private Debt Investors Private Equity Investors
26,642 14,453 Total AUM 8,066 8,449 3,935
Note: Figures in this table exclude the three large outlier respondents. Source: GIIN
90 55 Number of fund managers 29 17 35
31 Although not shown, fundraising by managers headquartered in EM vs. DM follows a similar pattern.
32 These findings do not differ markedly if outliers are excluded. For both the ‘overall’ and ‘DM-focused’ segments, ‘pension funds/insurance companies’ becomes the top-
ranked category, and ‘bank/diversified financial institution’ becomes second-ranked; otherwise, the numbers are the same.
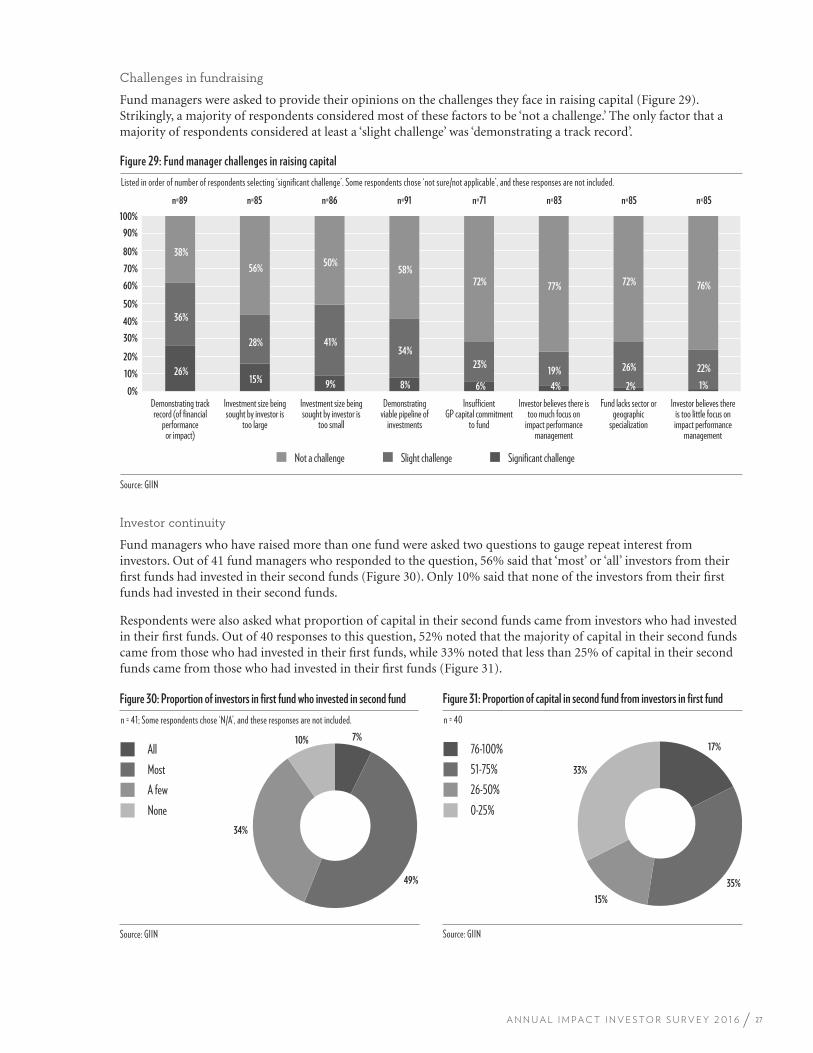
27A N N U A L I M P A C T I N V E S T O R S U R V E Y 2 0 1 6
Challenges in fundraising
Fund managers were asked to provide their opinions on the challenges they face in raising capital (Figure 29). Strikingly, a majority of respondents considered most of these factors to be ‘not a challenge.’ The only factor that a majority of respondents considered at least a ‘slight challenge’ was ‘demonstrating a track record’.
Figure 29: Fund manager challenges in raising capital
Listed in order of number of respondents selecting ‘significant challenge’. Some respondents chose ‘not sure/not applicable’, and these responses are not included.
Source: GIIN
0%
10%
20%
30%
40%
50%
60%
70%
80%
90%
100%
Demonstrating track record (of financial
performanceor impact)
Investment size being sought by investor is
too large
Investment size being sought by investor is
too small
Demonstrating viable pipeline of
investments
InsufficientGP capital commitment
to fund
Investor believes there is too much focus on
impact performance management
Fund lacks sector or geographic
specialization
Investor believes there is too little focus on impact performance
management
Not a challenge Slight challenge Significant challenge
n=89 n=86 n=71 n=83 n=85n=85 n=91 n=85
26% 15%
6% 4% 2% 1%
36%
28% 41% 34%
9% 8%
23% 19% 26% 22%
38%
56% 50%
58% 72% 77% 72% 76%
Investor continuity
Fund managers who have raised more than one fund were asked two questions to gauge repeat interest from investors. Out of 41 fund managers who responded to the question, 56% said that ‘most’ or ‘all’ investors from their first funds had invested in their second funds (Figure 30). Only 10% said that none of the investors from their first funds had invested in their second funds.
Respondents were also asked what proportion of capital in their second funds came from investors who had invested in their first funds. Out of 40 responses to this question, 52% noted that the majority of capital in their second funds came from those who had invested in their first funds, while 33% noted that less than 25% of capital in their second funds came from those who had invested in their first funds (Figure 31).
Figure 30: Proportion of investors in first fund who invested in second fund
n = 41; Some respondents chose ‘N/A’, and these responses are not included.
Source: GIIN
All Most A few None
7%
49%
34%
10%
Figure 31: Proportion of capital in second fund from investors in first fund
n = 40
Source: GIIN
76-100% 51-75% 26-50% 0-25%
17%
35%
15%
33%
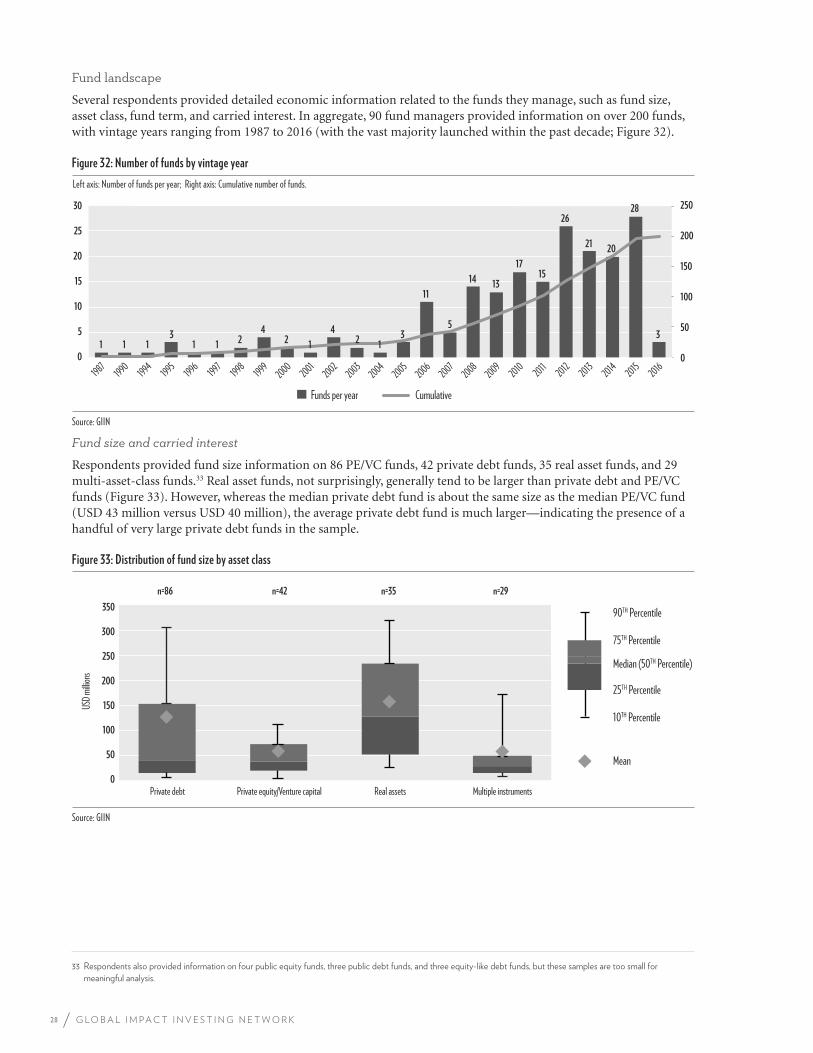
28 G L O B A L I M P A C T I N V E S T I N G N E T W O R K
Fund landscape
Several respondents provided detailed economic information related to the funds they manage, such as fund size, asset class, fund term, and carried interest. In aggregate, 90 fund managers provided information on over 200 funds, with vintage years ranging from 1987 to 2016 (with the vast majority launched within the past decade; Figure 32).
Figure 32: Number of funds by vintage year
Left axis: Number of funds per year; Right axis: Cumulative number of funds.
Source: GIIN
0
50
100
150
200
250
0
5
10
15
20
25
30
1987
1990 1994
1995 1996
1997 1998
1999 2000
2001 2002
2003 2004
2005 2006
2007 2008
2009 2010
2012 2014
2016 2015
2013 2011
1 1 1 3
1 1 2 4
2 1
4 2 1
3
11
5
14 13
17 15
26
21 20
28
3
Funds per year Cumulative
Fund size and carried interest
Respondents provided fund size information on 86 PE/VC funds, 42 private debt funds, 35 real asset funds, and 29 multi-asset-class funds.33 Real asset funds, not surprisingly, generally tend to be larger than private debt and PE/VC funds (Figure 33). However, whereas the median private debt fund is about the same size as the median PE/VC fund (USD 43 million versus USD 40 million), the average private debt fund is much larger—indicating the presence of a handful of very large private debt funds in the sample.
Figure 33: Distribution of fund size by asset class
Source: GIIN
0
50
100
150
200
250
300
350
Private debt Private equity/Venture capital Real assets Multiple instruments
USD m
illions
n=42 n=29n=86 n=35
90TH Percentile
75TH Percentile
10TH Percentile
Mean
25TH Percentile
Median (50TH Percentile)
33 Respondents also provided information on four public equity funds, three public debt funds, and three equity-like debt funds, but these samples are too small for
meaningful analysis.
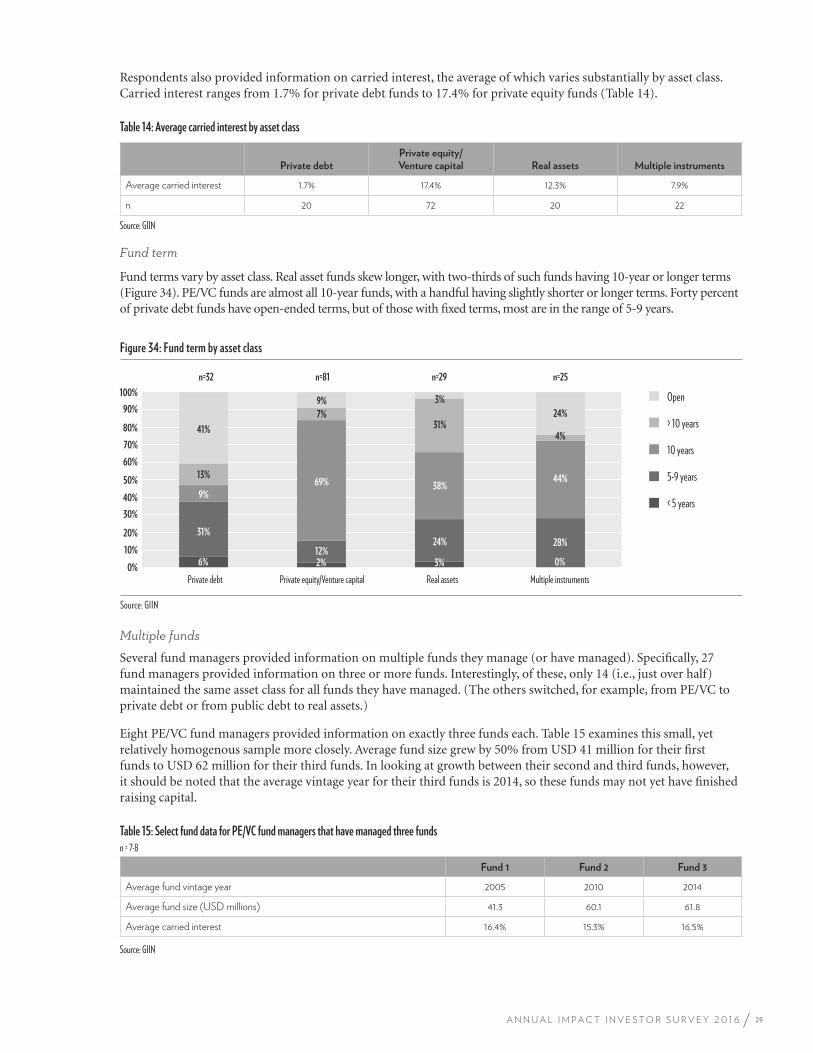
29A N N U A L I M P A C T I N V E S T O R S U R V E Y 2 0 1 6
Respondents also provided information on carried interest, the average of which varies substantially by asset class. Carried interest ranges from 1.7% for private debt funds to 17.4% for private equity funds (Table 14).
Table 14: Average carried interest by asset class
Private debtPrivate equity/ Venture capital Real assets Multiple instruments
Average carried interest 1.7% 17.4% 12.3% 7.9%
n 20 72 20 22
Source: GIIN
Fund term
Fund terms vary by asset class. Real asset funds skew longer, with two-thirds of such funds having 10-year or longer terms (Figure 34). PE/VC funds are almost all 10-year funds, with a handful having slightly shorter or longer terms. Forty percent of private debt funds have open-ended terms, but of those with fixed terms, most are in the range of 5-9 years.
Figure 34: Fund term by asset class
Source: GIIN
0%
10%
20%
30%
40%
50%
60%
70%
80%
90%
100% Open
> 10 years
10 years
5-9 years
< 5 years
Multiple instruments
n=25
0%
28%
44%
4%
24%
Private debt
n=32
6%
31%
9%
13%
41%
Private equity/Venture capital
n=81
2% 12%
69%
7%
9%
Real assets
n=29
3%
24%
38%
31%
3%
Multiple funds
Several fund managers provided information on multiple funds they manage (or have managed). Specifically, 27 fund managers provided information on three or more funds. Interestingly, of these, only 14 (i.e., just over half) maintained the same asset class for all funds they have managed. (The others switched, for example, from PE/VC to private debt or from public debt to real assets.)
Eight PE/VC fund managers provided information on exactly three funds each. Table 15 examines this small, yet relatively homogenous sample more closely. Average fund size grew by 50% from USD 41 million for their first funds to USD 62 million for their third funds. In looking at growth between their second and third funds, however, it should be noted that the average vintage year for their third funds is 2014, so these funds may not yet have finished raising capital.
Table 15: Select fund data for PE/VC fund managers that have managed three funds
n = 7-8
Fund 1 Fund 2 Fund 3
Average fund vintage year 2005 2010 2014
Average fund size (USD millions) 41.3 60.1 61.8
Average carried interest 16.4% 15.3% 16.5%
Source: GIIN
30 G L O B A L I M P A C T I N V E S T I N G N E T W O R K
2015 MARKET DEVELOPMENT
Impact Investing and the Sustainable Development Goals
In the year 2000, the UN, along with governments and non-governmental organizations around the world, committed to eight
priority goals to achieve by 2015, the Millennium Development Goals (MDGs). In September 2015, the UN and other stakeholders
adopted the new Sustainable Development Goals (SDGs), building on the momentum inspired by the MDGs.34
The SDGs
comprise 17 social and environmental objectives, ranging from the eradication of global poverty to the conservation of the world’s
oceans and marine resources, each with targets to be met by 2030. Whereas the MDGs were focused on developing countries,
the SDGs apply to both developed and developing countries.
The ambitious nature of the SDGs underscores the critical role to be played by private-sector businesses and investors. Even with
the support of governments, NGOs, charities, and foundations, a significant funding gap still exists to support the achievement of the
SDGs by 2030. For example, for developing countries alone, the shortfall between current aid flows and the investment needed to
finance sustainable development is, it has been estimated, around USD 2.5 trillion per year.35
Given this global momentum toward aligned action, impact investors have begun to examine their activities in the context of their
contributions to the SDGs.
• Bank of America aligned its 2012 commitment of USD 50 billion over the next 10 years to advance a low-carbon economy
with SDG 7: Affordable and clean energy. In order to achieve its goal, Bank of America will employ a wide range of
financing tools, including lending, equipment finance, capital-market and advisory activity, carbon finance, and advice and
investment solutions for clients.36
• Deutsche Bank has shown interest in pursuing strategies to support the SDGs. Deutsche Bank Asset Management is a member
of the Sustainable Development Investment Partnership, which intends to mobilize USD 100 billion of private capital within the
next five years.37 In addition, the firm manages several public-private partnership funds in support of various SDGs, including the
Essential Capital Consortium and the Africa Agriculture and Trade Investment Fund. Deutsche Bank also achieved accreditation
for the UN’s Green Climate Fund, which allows for joint product development in support of financing SDG13: Climate action.
• The Inter-American Development Bank (IDB) committed to advance partnerships related to the SDGs, particularly to
SDG 2: End hunger, achieve food security and improved nutrition, and promote sustainable agriculture. The IDB plans to
support the development of environmentally sustainable agriculture in Latin America and the Caribbean, a region particularly
affected by malnutrition.38
34 United Nations Sustainable Development: Knowledge Platform, https://sustainabledevelopment.un.org/post2015/summit.
35 Bruno Bischoff, Ben Ridley, and Sandrine Simon, Aiming for Impact: Credit Suisse and the Sustainable Development Goals (Zurich: Credit Suisse, 2015),
https://www.credit-suisse.com/media/assets/corporate/docs/about-us/responsibility/banking/aiming-for-impact.pdf.
36 “$50 billion, 10 year Environmental Business Initiative,” https://business.un.org/en/commitments/1902.
37 Deutsche Bank, “Deutsche Bank enters new partnership addressing Sustainable Development Goals,” press release, October 20, 2015,
https://www.db.com/newsroom_news/2015/cr/deutsche-bank-enters-new-partnership-addressing-sustainable-development-goals-en-11240.htm.
38 Bernardo Guillamon, “Want to Save the World? Invest in Latin America – Together,” Inter-American Development Bank (blog), August 6, 2015,
http://blogs.iadb.org/partnerships-for-development/2015/08/06/want-to-save-the-world-invest-in-latin-america-together/.
31A N N U A L I M P A C T I N V E S T O R S U R V E Y 2 0 1 6
2015 MARKET DEVELOPMENT
• Mkoba Private Equity Fund committed to assess the impact of its USD 150 million fund on the SDGs. The fund invests in small
and medium-sized enterprises engaged in agriculture and agribusiness, manufacturing, innovative technologies, mobile payment
systems, and city services in six developing countries. The investment team will also help investees track their contributions to the
SDGs at the company level.39
• Sarona Asset Management is embedding the Sustainable Development Goals (SDGs) framework in the way it measures and
evaluates the impact of its investments.40 Sarona completed an analysis of how the 49 companies that were in Sarona Frontier
Markets Fund 2’s portfolio at the end of September 2015 relate to the SDGs. The firm found that the companies contribute to 16
out of the 17 SDGs, and 105 out of the 169 underlying targets. Sarona shares this analysis with existing and potential investors.
• Sonen Capital examined its portfolio’s alignment with the SDGs. Its annual impact report41 describes how its investments in areas
such as clean power, sustainable timber, and green real estate contribute to seven of the SDGs. The report also maps Sonen’s
three investment strategies—public equities, fixed income, and real assets—to these seven SDGs.
Several resources were developed in 2015 to help investors and businesses that seek to contribute to the new global priorities.
Investors and business may, for example, wish to take advantage of new financial structures (such as blended finance) or align with
impact metrics (as outlined in the SDG compass).
• Blended Finance Vol. 1: A Primer for Development Finance and Philanthropic Funders developed by the OECD and
World Economic Forum
• SDG Compass developed by the Global Reporting Initiative (GRI), United Nations Global Compact (UNGC), and World
Business Council for Sustainable Development (WBCSD)
• Investing in Sustainable Development Goals published by the UN Conference on Trade and Development (UNCTAD)
• More than the Sum of Its Parts: Making Multi-Stakeholder Initiatives Work developed by the Global Development
Incubator (GDI), USAID, and the Omidyar Network
39 “Equity Investments for SDGs One Company at a Time,” https://business.un.org/en/commitments/3968#overview.
40 Sarona Responsible Investments. Accessed April 2016. http://www.saronafund.com/responsible-investments/
41 Sonen Capital 2015 Annual Impact Report. April 2016. Accessed April 15, 2016. http://www.sonencapital.com/wp2015/wp-content/uploads/2016/04/2015AIR.pdf.
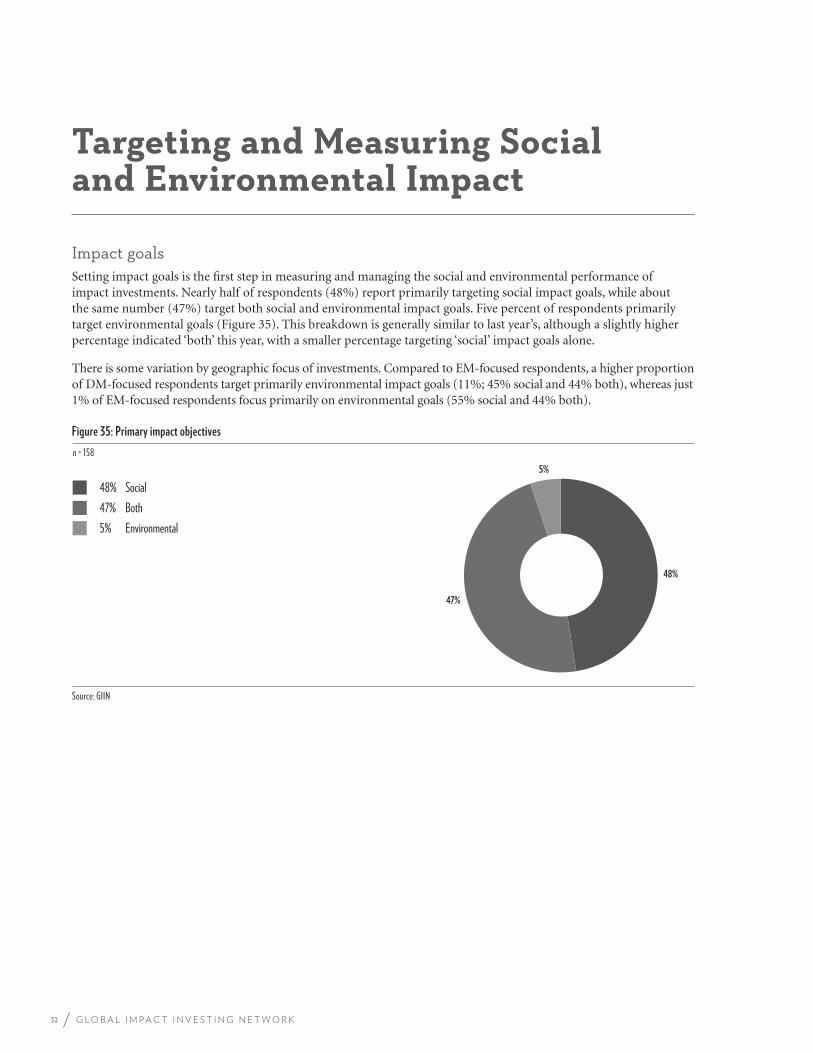
32 G L O B A L I M P A C T I N V E S T I N G N E T W O R K
Targeting and Measuring Social and Environmental Impact
Impact goalsSetting impact goals is the first step in measuring and managing the social and environmental performance of impact investments. Nearly half of respondents (48%) report primarily targeting social impact goals, while about the same number (47%) target both social and environmental impact goals. Five percent of respondents primarily target environmental goals (Figure 35). This breakdown is generally similar to last year’s, although a slightly higher percentage indicated ‘both’ this year, with a smaller percentage targeting ‘social’ impact goals alone.
There is some variation by geographic focus of investments. Compared to EM-focused respondents, a higher proportion of DM-focused respondents target primarily environmental impact goals (11%; 45% social and 44% both), whereas just 1% of EM-focused respondents focus primarily on environmental goals (55% social and 44% both).
Figure 35: Primary impact objectives
n = 158
Source: GIIN
48% Social 47% Both 5% Environmental
48%
47%
5%
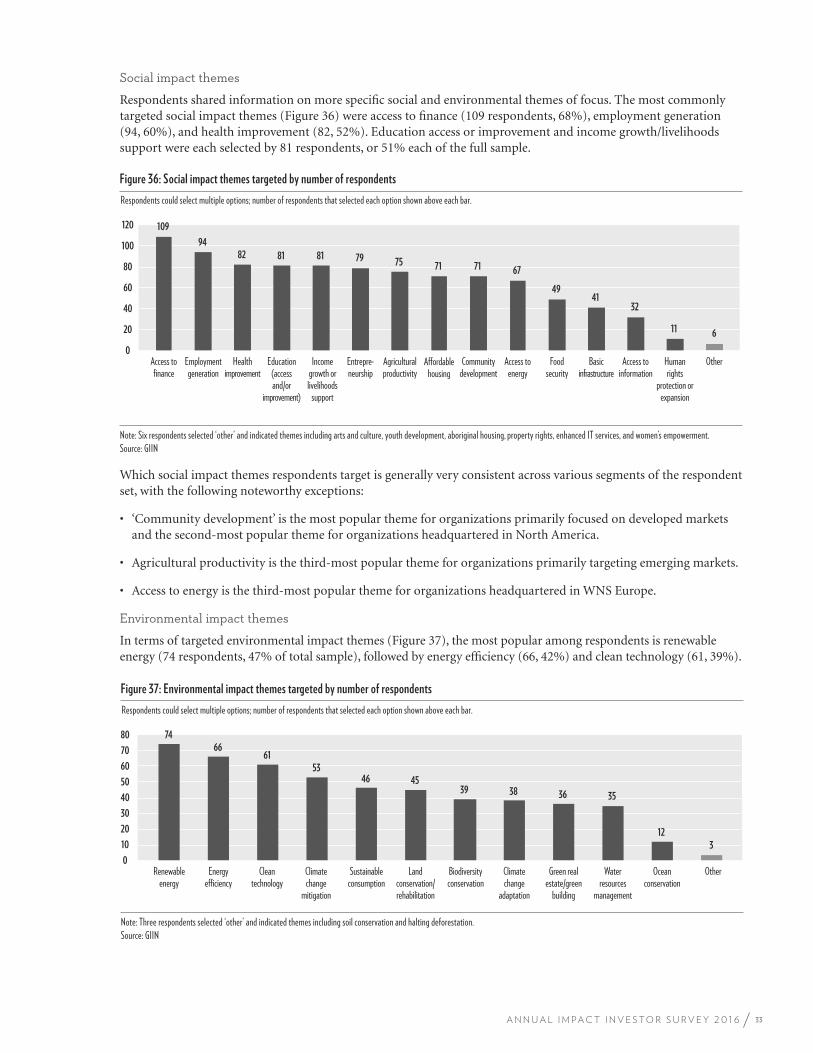
33A N N U A L I M P A C T I N V E S T O R S U R V E Y 2 0 1 6
Social impact themes
Respondents shared information on more specific social and environmental themes of focus. The most commonly targeted social impact themes (Figure 36) were access to finance (109 respondents, 68%), employment generation (94, 60%), and health improvement (82, 52%). Education access or improvement and income growth/livelihoods support were each selected by 81 respondents, or 51% each of the full sample.
Figure 36: Social impact themes targeted by number of respondents
Respondents could select multiple options; number of respondents that selected each option shown above each bar.
Note: Six respondents selected ‘other’ and indicated themes including arts and culture, youth development, aboriginal housing, property rights, enhanced IT services, and women’s empowerment. Source: GIIN
109
94 82 81 81 79 75 71 71 67
49 41
32
11 6
120
0
20
40
60
80
100
Access to finance
Employment generation
Health improvement
Education (access and/or
improvement)
Income growth or livelihoods
support
Entrepre-neurship
Agricultural productivity
Affordable housing
Community development
Access to energy
Food security
Basic infrastructure
Access to information
Humanrights
protection or expansion
Other
Which social impact themes respondents target is generally very consistent across various segments of the respondent set, with the following noteworthy exceptions:
• ‘Community development’ is the most popular theme for organizations primarily focused on developed markets and the second-most popular theme for organizations headquartered in North America.
• Agricultural productivity is the third-most popular theme for organizations primarily targeting emerging markets.
• Access to energy is the third-most popular theme for organizations headquartered in WNS Europe.
Environmental impact themes
In terms of targeted environmental impact themes (Figure 37), the most popular among respondents is renewable energy (74 respondents, 47% of total sample), followed by energy efficiency (66, 42%) and clean technology (61, 39%).
Figure 37: Environmental impact themes targeted by number of respondents
Respondents could select multiple options; number of respondents that selected each option shown above each bar.
Note: Three respondents selected ‘other’ and indicated themes including soil conservation and halting deforestation. Source: GIIN
74 66
61 53
46 45 39 38 36 35
12
3
80
0
10
20
30
40
50
60
70
Renewable energy
Energy efficiency
Clean technology
Climate change
mitigation
Sustainable consumption
Land conservation/rehabilitation
Biodiversity conservation
Climate change
adaptation
Green real estate/green
building
Water resources
management
Ocean conservation
Other
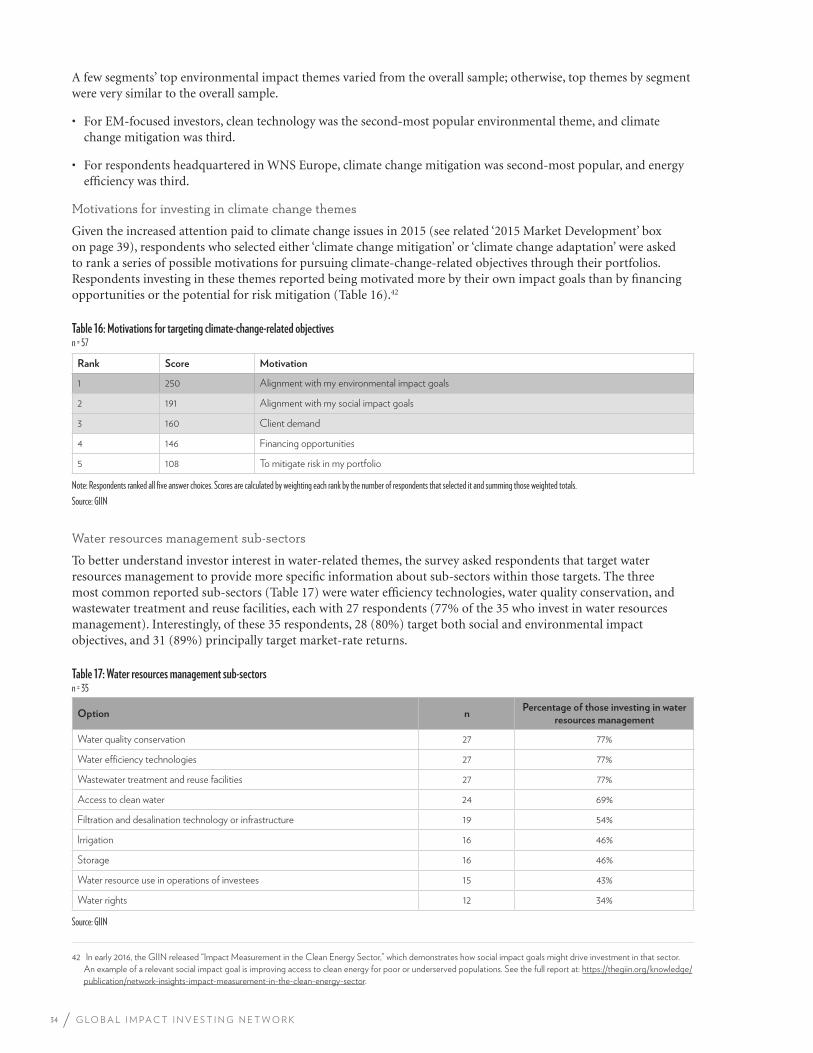
34 G L O B A L I M P A C T I N V E S T I N G N E T W O R K
A few segments’ top environmental impact themes varied from the overall sample; otherwise, top themes by segment were very similar to the overall sample.
• For EM-focused investors, clean technology was the second-most popular environmental theme, and climate change mitigation was third.
• For respondents headquartered in WNS Europe, climate change mitigation was second-most popular, and energy efficiency was third.
Motivations for investing in climate change themes
Given the increased attention paid to climate change issues in 2015 (see related ‘2015 Market Development’ box on page 39), respondents who selected either ‘climate change mitigation’ or ‘climate change adaptation’ were asked to rank a series of possible motivations for pursuing climate-change-related objectives through their portfolios. Respondents investing in these themes reported being motivated more by their own impact goals than by financing opportunities or the potential for risk mitigation (Table 16).42
Table 16: Motivations for targeting climate-change-related objectivesn = 57
Rank Score Motivation
1 250 Alignment with my environmental impact goals
2 191 Alignment with my social impact goals
3 160 Client demand
4 146 Financing opportunities
5 108 To mitigate risk in my portfolio
Note: Respondents ranked all five answer choices. Scores are calculated by weighting each rank by the number of respondents that selected it and summing those weighted totals.Source: GIIN
Water resources management sub-sectors
To better understand investor interest in water-related themes, the survey asked respondents that target water resources management to provide more specific information about sub-sectors within those targets. The three most common reported sub-sectors (Table 17) were water efficiency technologies, water quality conservation, and wastewater treatment and reuse facilities, each with 27 respondents (77% of the 35 who invest in water resources management). Interestingly, of these 35 respondents, 28 (80%) target both social and environmental impact objectives, and 31 (89%) principally target market-rate returns.
Table 17: Water resources management sub-sectorsn = 35
Option nPercentage of those investing in water
resources management
Water quality conservation 27 77%
Water efficiency technologies 27 77%
Wastewater treatment and reuse facilities 27 77%
Access to clean water 24 69%
Filtration and desalination technology or infrastructure 19 54%
Irrigation 16 46%
Storage 16 46%
Water resource use in operations of investees 15 43%
Water rights 12 34%
Source: GIIN
42 In early 2016, the GIIN released “Impact Measurement in the Clean Energy Sector,” which demonstrates how social impact goals might drive investment in that sector.
An example of a relevant social impact goal is improving access to clean energy for poor or underserved populations. See the full report at: https://thegiin.org/knowledge/
publication/network-insights-impact-measurement-in-the-clean-energy-sector.
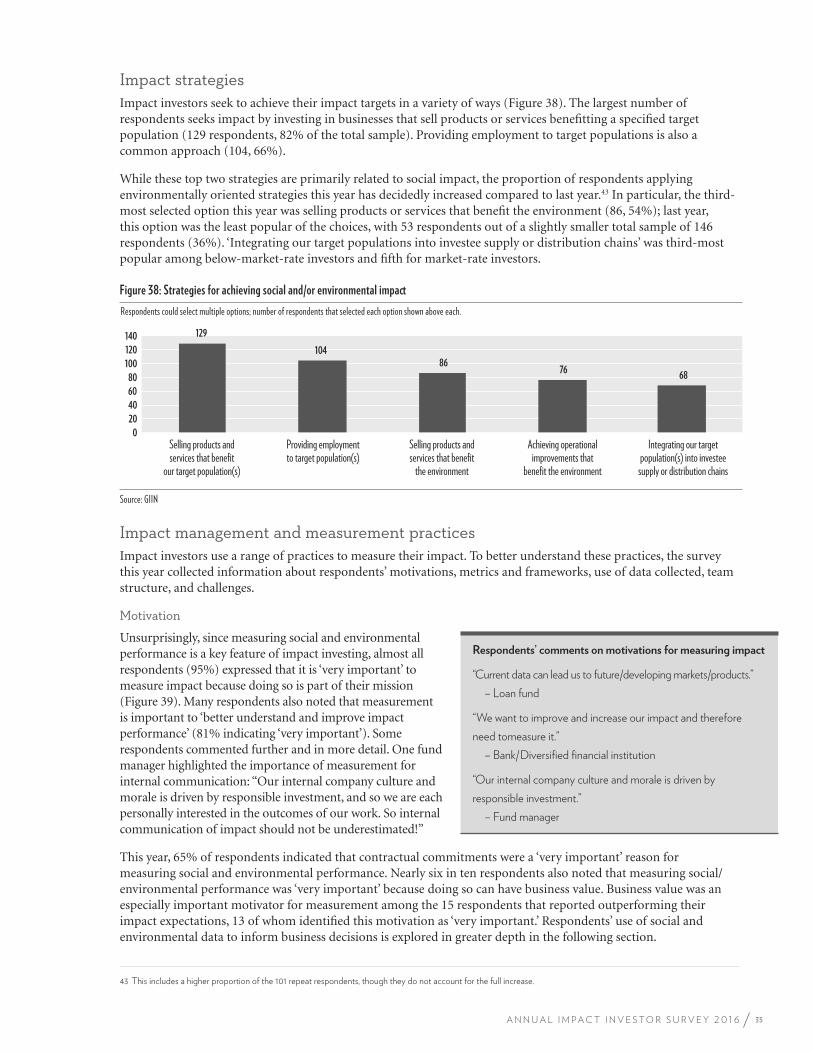
35A N N U A L I M P A C T I N V E S T O R S U R V E Y 2 0 1 6
Impact strategiesImpact investors seek to achieve their impact targets in a variety of ways (Figure 38). The largest number of respondents seeks impact by investing in businesses that sell products or services benefitting a specified target population (129 respondents, 82% of the total sample). Providing employment to target populations is also a common approach (104, 66%).
While these top two strategies are primarily related to social impact, the proportion of respondents applying environmentally oriented strategies this year has decidedly increased compared to last year.43 In particular, the third-most selected option this year was selling products or services that benefit the environment (86, 54%); last year, this option was the least popular of the choices, with 53 respondents out of a slightly smaller total sample of 146 respondents (36%). ‘Integrating our target populations into investee supply or distribution chains’ was third-most popular among below-market-rate investors and fifth for market-rate investors.
Figure 38: Strategies for achieving social and/or environmental impact
Respondents could select multiple options; number of respondents that selected each option shown above each.
Source: GIIN
40
20
0
60
80
100
120
140
Selling products and services that benefit
our target population(s)
Providing employment to target population(s)
Selling products and services that benefit
the environment
Achieving operational improvements that
benefit the environment
Integrating our target population(s) into investee
supply or distribution chains
129
104 86
76 68
Impact management and measurement practicesImpact investors use a range of practices to measure their impact. To better understand these practices, the survey this year collected information about respondents’ motivations, metrics and frameworks, use of data collected, team structure, and challenges.
Motivation
Unsurprisingly, since measuring social and environmental performance is a key feature of impact investing, almost all respondents (95%) expressed that it is ‘very important’ to measure impact because doing so is part of their mission (Figure 39). Many respondents also noted that measurement is important to ‘better understand and improve impact performance’ (81% indicating ‘very important’). Some respondents commented further and in more detail. One fund manager highlighted the importance of measurement for internal communication: “Our internal company culture and morale is driven by responsible investment, and so we are each personally interested in the outcomes of our work. So internal communication of impact should not be underestimated!”
This year, 65% of respondents indicated that contractual commitments were a ‘very important’ reason for measuring social and environmental performance. Nearly six in ten respondents also noted that measuring social/environmental performance was ‘very important’ because doing so can have business value. Business value was an especially important motivator for measurement among the 15 respondents that reported outperforming their impact expectations, 13 of whom identified this motivation as ‘very important.’ Respondents’ use of social and environmental data to inform business decisions is explored in greater depth in the following section.
43 This includes a higher proportion of the 101 repeat respondents, though they do not account for the full increase.
Respondents’ comments on motivations for measuring impact
“Current data can lead us to future/developing markets/products.”
– Loan fund
“We want to improve and increase our impact and therefore
need tomeasure it.”
– Bank/Diversified financial institution
“Our internal company culture and morale is driven by
responsible investment.”
– Fund manager
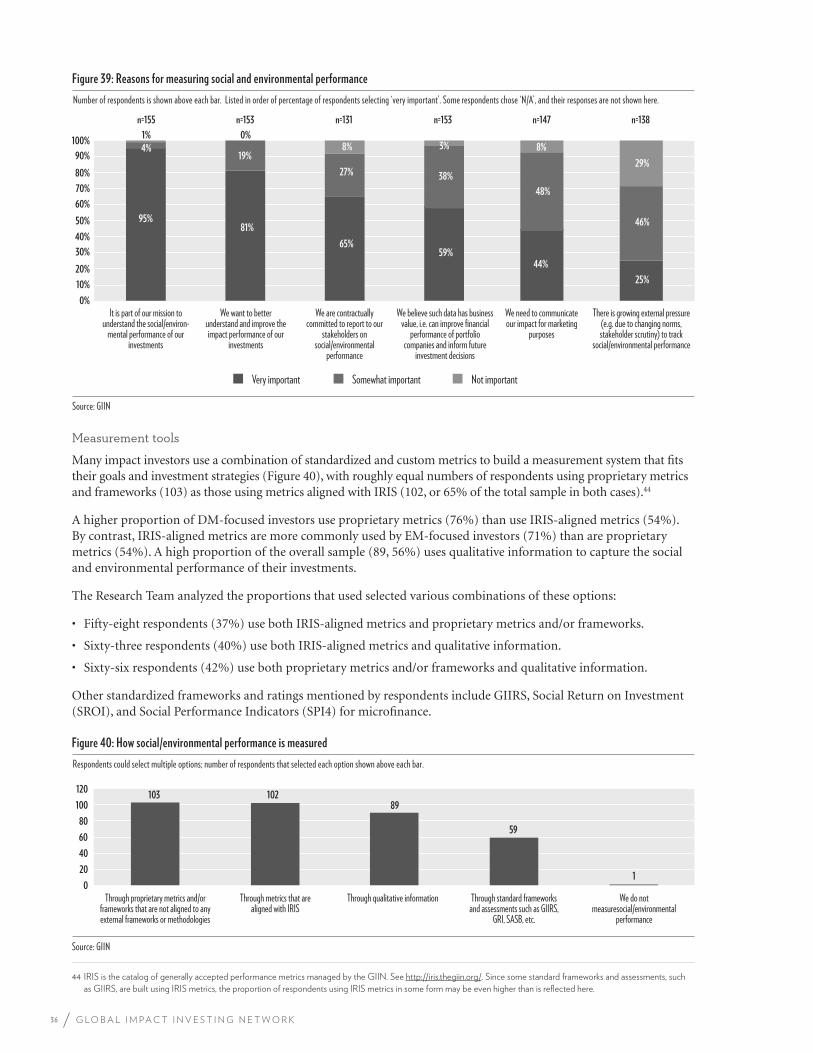
36 G L O B A L I M P A C T I N V E S T I N G N E T W O R K
Figure 39: Reasons for measuring social and environmental performance
Number of respondents is shown above each bar. Listed in order of percentage of respondents selecting ‘very important’. Some respondents chose ‘N/A’, and their responses are not shown here.
Source: GIIN
0%
10%
20%
30%
40%
50%
60%
70%
80%
90%
100%
It is part of our mission to understand the social/environ-
mental performance of our investments
We want to better understand and improve the impact performance of our
investments
We are contractually committed to report to our
stakeholders on social/environmental
performance
We believe such data has business value, i.e. can improve financial
performance of portfolio companies and inform future
investment decisions
We need to communicateour impact for marketing
purposes
There is growing external pressure (e.g. due to changing norms, stakeholder scrutiny) to track
social/environmental performance
Very important Somewhat important Not important
1% 0%
95% 81%
65% 59%
44%
25%
4% 19%
27% 38%
48%
46%
8% 3% 8%
29%
n=153 n=147 n=138n=155 n=153 n=131
Measurement tools
Many impact investors use a combination of standardized and custom metrics to build a measurement system that fits their goals and investment strategies (Figure 40), with roughly equal numbers of respondents using proprietary metrics and frameworks (103) as those using metrics aligned with IRIS (102, or 65% of the total sample in both cases).44
A higher proportion of DM-focused investors use proprietary metrics (76%) than use IRIS-aligned metrics (54%). By contrast, IRIS-aligned metrics are more commonly used by EM-focused investors (71%) than are proprietary metrics (54%). A high proportion of the overall sample (89, 56%) uses qualitative information to capture the social and environmental performance of their investments.
The Research Team analyzed the proportions that used selected various combinations of these options:
• Fifty-eight respondents (37%) use both IRIS-aligned metrics and proprietary metrics and/or frameworks.
• Sixty-three respondents (40%) use both IRIS-aligned metrics and qualitative information.
• Sixty-six respondents (42%) use both proprietary metrics and/or frameworks and qualitative information.
Other standardized frameworks and ratings mentioned by respondents include GIIRS, Social Return on Investment (SROI), and Social Performance Indicators (SPI4) for microfinance.
Figure 40: How social/environmental performance is measured
Respondents could select multiple options; number of respondents that selected each option shown above each bar.
Source: GIIN
40
20
0
60
80
100
120
Through qualitative information Through standard frameworks and assessments such as GIIRS,
GRI, SASB, etc.
We do not measuresocial/environmental
performance
Through metrics that are aligned with IRIS
102
Through proprietary metrics and/or frameworks that are not aligned to any external frameworks or methodologies
10389
59
1
44 IRIS is the catalog of generally accepted performance metrics managed by the GIIN. See http://iris.thegiin.org/. Since some standard frameworks and assessments, such
as GIIRS, are built using IRIS metrics, the proportion of respondents using IRIS metrics in some form may be even higher than is reflected here.
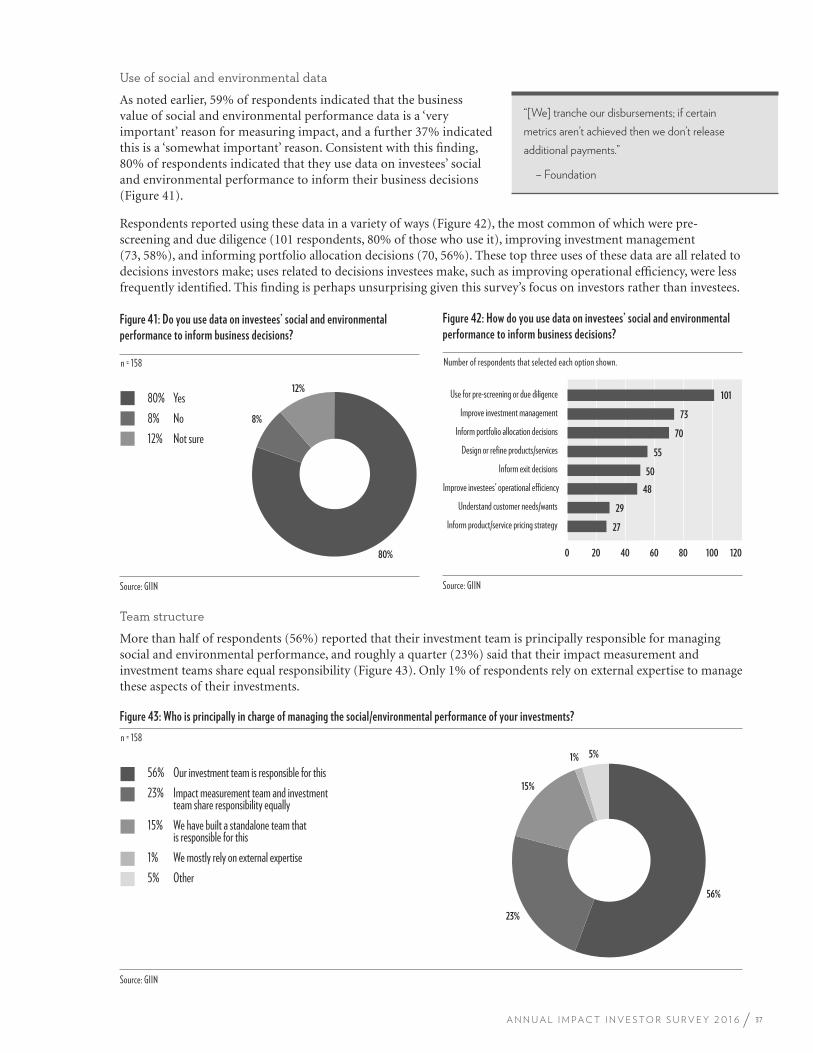
37A N N U A L I M P A C T I N V E S T O R S U R V E Y 2 0 1 6
Use of social and environmental data
As noted earlier, 59% of respondents indicated that the business value of social and environmental performance data is a ‘very important’ reason for measuring impact, and a further 37% indicated this is a ‘somewhat important’ reason. Consistent with this finding, 80% of respondents indicated that they use data on investees’ social and environmental performance to inform their business decisions (Figure 41).
Respondents reported using these data in a variety of ways (Figure 42), the most common of which were pre-screening and due diligence (101 respondents, 80% of those who use it), improving investment management (73, 58%), and informing portfolio allocation decisions (70, 56%). These top three uses of these data are all related to decisions investors make; uses related to decisions investees make, such as improving operational efficiency, were less frequently identified. This finding is perhaps unsurprising given this survey’s focus on investors rather than investees.
Figure 41: Do you use data on investees’ social and environmental
performance to inform business decisions?
n = 158
80% Yes 8% No 12% Not sure
80%
8%
12%
Source: GIIN
Figure 42: How do you use data on investees’ social and environmental
performance to inform business decisions?
Number of respondents that selected each option shown.
Source: GIIN
27
29
48
50
55
70
73
101
0 20 40 60 80 100 120
Inform product/service pricing strategy
Inform exit decisions
Understand customer needs/wants
Improve investees' operational efficiency
Design or refine products/services
Inform portfolio allocation decisions
Improve investment management
Use for pre-screening or due diligence
Team structure
More than half of respondents (56%) reported that their investment team is principally responsible for managing social and environmental performance, and roughly a quarter (23%) said that their impact measurement and investment teams share equal responsibility (Figure 43). Only 1% of respondents rely on external expertise to manage these aspects of their investments.
Figure 43: Who is principally in charge of managing the social/environmental performance of your investments?
n = 158
Source: GIIN
56% Our investment team is responsible for this 23% Impact measurement team and investment team share responsibility equally 15% We have built a standalone team that is responsible for this 1% We mostly rely on external expertise 5% Other
56%
23%
15%
1% 5%
“[We] tranche our disbursements; if certain
metrics aren’t achieved then we don’t release
additional payments.”
– Foundation
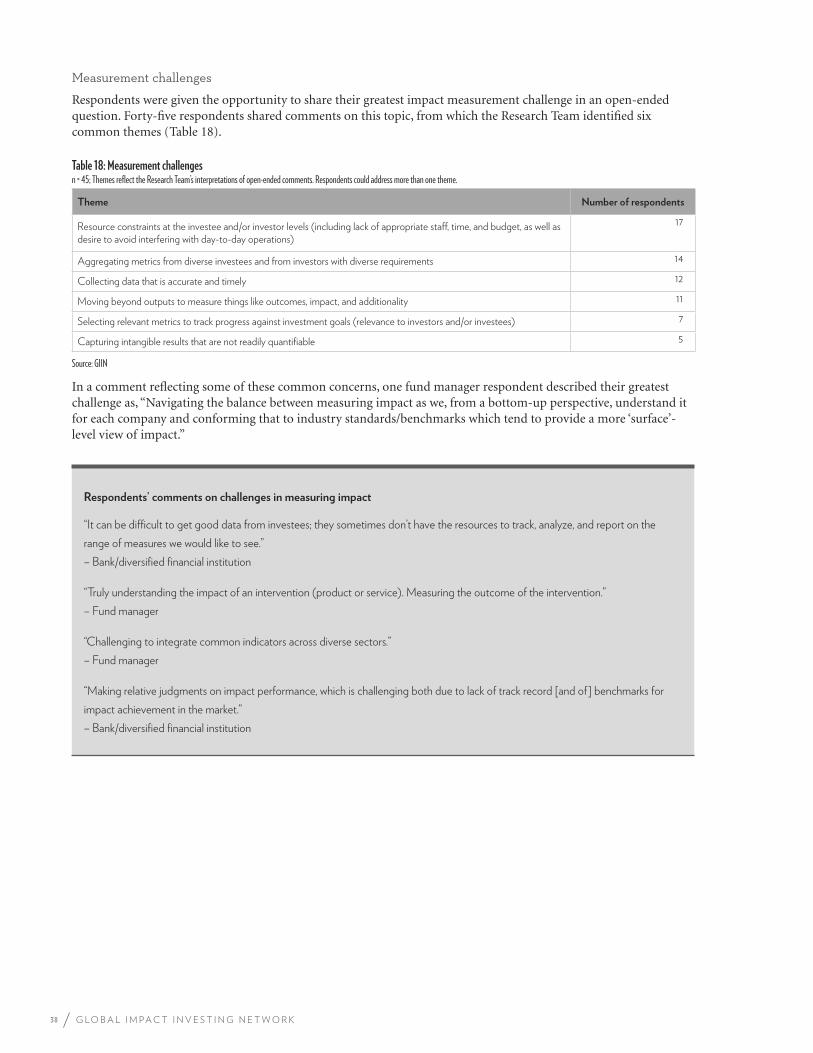
38 G L O B A L I M P A C T I N V E S T I N G N E T W O R K
Measurement challenges
Respondents were given the opportunity to share their greatest impact measurement challenge in an open-ended question. Forty-five respondents shared comments on this topic, from which the Research Team identified six common themes (Table 18).
Table 18: Measurement challengesn = 45; Themes reflect the Research Team’s interpretations of open-ended comments. Respondents could address more than one theme.
Theme Number of respondents
Resource constraints at the investee and/or investor levels (including lack of appropriate staff, time, and budget, as well as desire to avoid interfering with day-to-day operations)
17
Aggregating metrics from diverse investees and from investors with diverse requirements 14
Collecting data that is accurate and timely 12
Moving beyond outputs to measure things like outcomes, impact, and additionality 11
Selecting relevant metrics to track progress against investment goals (relevance to investors and/or investees) 7
Capturing intangible results that are not readily quantifiable 5
Source: GIIN
In a comment reflecting some of these common concerns, one fund manager respondent described their greatest challenge as, “Navigating the balance between measuring impact as we, from a bottom-up perspective, understand it for each company and conforming that to industry standards/benchmarks which tend to provide a more ‘surface’-level view of impact.”
Respondents’ comments on challenges in measuring impact
“It can be difficult to get good data from investees; they sometimes don’t have the resources to track, analyze, and report on the
range of measures we would like to see.”
– Bank/diversified financial institution
“Truly understanding the impact of an intervention (product or service). Measuring the outcome of the intervention.”
– Fund manager
“Challenging to integrate common indicators across diverse sectors.”
– Fund manager
“Making relative judgments on impact performance, which is challenging both due to lack of track record [and of] benchmarks for
impact achievement in the market.”
– Bank/diversified financial institution

39A N N U A L I M P A C T I N V E S T O R S U R V E Y 2 0 1 6
Climate Finance
2015 was a landmark year for global recognition of the need to combat climate change. In December, at a historic conference held by
the United Nations in Paris, officials from 195 countries signed an agreement committing to action to prevent increases in the earth’s
temperature from exceeding two degrees Celsius above the temperature of pre-industrial times.45
A core theme of the Paris summit (known as “COP21”) and its accompanying activities was financing for the range of efforts required
to achieve this ambitious goal. The transition to a low-carbon and climate-friendly economy has piqued the interest of both private
and public financiers. Many private investors see the coming transition as an opportunity to invest in new technologies, infrastructure,
and energy sources. Others are finally seeing broader interest in investments they have already been making for years, such as
conservation of forests or wetlands.
Other notable developments in climate finance during 2015 included the following:
• Launch of the Land Degradation Neutrality Fund by the UN Convention to Combat Desertification managed by French
asset manager Mirova.46 The fund aims to rehabilitate 12 million hectares of degraded land per year, with the impact goals of
mitigating climate change, conserving biodiversity, and improving food security and nutrition. The fund managers estimate there
are opportunities for investment through the fund worth more than USD 1 billion.
• Citi’s commitment to a USD 100 billion, 10-year initiative to finance activities that reduce the impacts of climate change.47
Investment areas include renewable energy, energy efficiency, sustainable urban transportation, green affordable housing, and
water and sanitation infrastructure.
• Announcement by the World Bank Group that it will increase its climate financing to USD 29 billion per year by
2020.48 This total includes both direct finance for climate-change-related work and leveraged co-financing. The Group’s private
investment arm, the International Finance Corporation, deployed USD 2.3 billion in 103 climate-related investments in FY 2015
alone, as well as mobilizing another USD 2.2 billion from other investors. Other multilateral institutions have made smaller annual
commitments to the theme, including the African Development Bank, the Asian Development Bank, and the Inter-American
Development Bank.49
• Launch of the Breakthrough Energy Coalition by Bill Gates, Mark Zuckerberg, and 20 other billionaires. The multibillion-
dollar facility is expected to invest in early-stage clean energy technologies around the world.50
• FMO’s introduction of Climate Investor One to facilitate financing for renewable energy projects in emerging markets.
During COP21, the Minister for Foreign Trade and Development Cooperation of the Netherlands announced a EUR 50 million
commitment to the instrument, which aims to catalyze a further USD 2 billion in finance from public and private sources.51
45 Helen Briggs, “Global Climate Deal: In Summary,” BBC News, December 12, 2015, http://www.bbc.com/news/science-environment-35073297.
46 UNCCD and Mirova, Land Degradation Neutrality Fund: An Innovative Investment Fund Project (2015), http://www.unccd.int/Lists/SiteDocumentLibrary/
Publications/2015_ldn_fund_brochure_eng.pdf.
47 Citigroup, “Citi Announces $100 Billion, 10-Year Commitment to Finance Sustainable Growth,” press release, February 18, 2015, http://www.citigroup.com/citi/
news/2015/150218a.htm.
48 “Climate Finance: Overview,” World Bank, accessed March 15, 2016, http://www.worldbank.org/en/topic/climatefinance/overview.
49 Smita Nakhooda et al., 10 Things to Know about Climate Finance in 2015 ( London: Overseas Development Institute, December 2015), http://www.odi.org/sites/odi.
org.uk/files/odi-assets/publications-opinion-files/10093.pdf.
50 Breakthrough Energy Coalition, http://www.breakthroughenergycoalition.com/en/index.html.
51 The Lab, “Dutch Government announces € 50 million commitment to Climate Investor One,” press release, December 3, 2015, http://climatefinancelab.org/press-
release/dutch-government-announces-e50m-commitment-to-climate-investor-one/.
2015 MARKET DEVELOPMENT
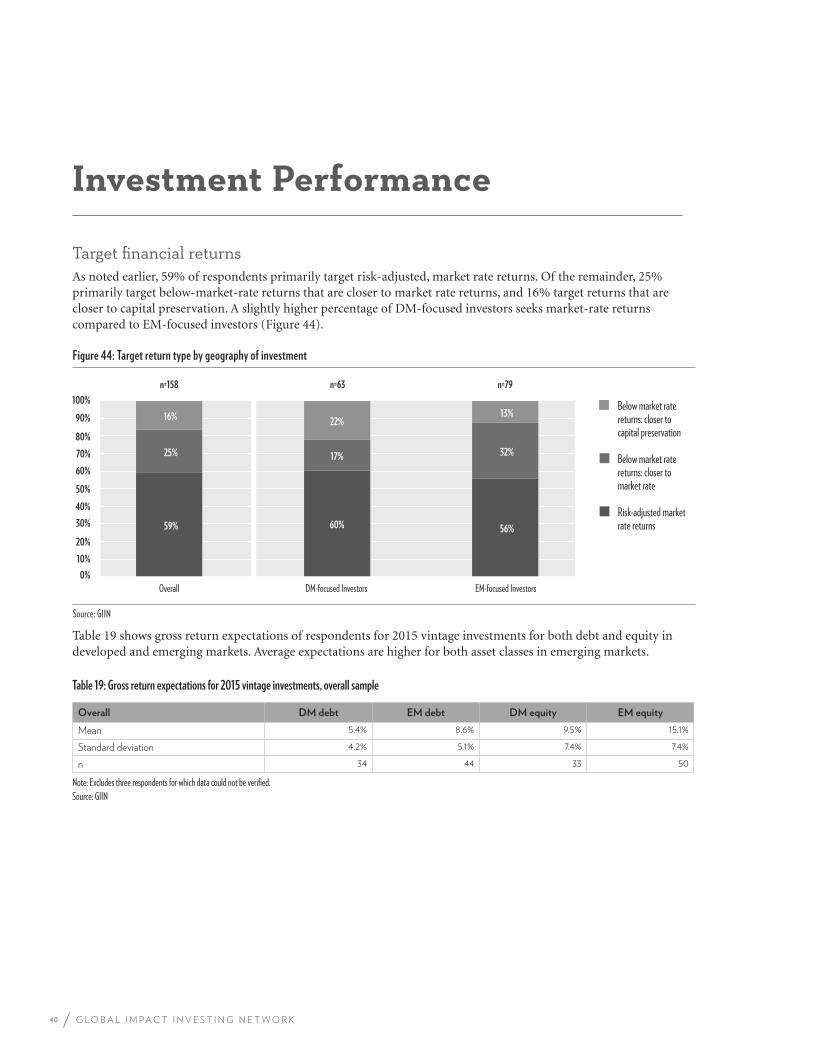
40 G L O B A L I M P A C T I N V E S T I N G N E T W O R K
Investment Performance
Target financial returnsAs noted earlier, 59% of respondents primarily target risk-adjusted, market rate returns. Of the remainder, 25% primarily target below-market-rate returns that are closer to market rate returns, and 16% target returns that are closer to capital preservation. A slightly higher percentage of DM-focused investors seeks market-rate returns compared to EM-focused investors (Figure 44).
Figure 44: Target return type by geography of investment
Source: GIIN
0%
10%
20%
30%
40%
50%
60%
70%
80%
90%
100%
Overall DM-focused Investors EM-focused Investors
59% 60% 56%
25% 17% 32%
16% 22%
13% Below market rate returns: closer to capital preservation
Below market rate returns: closer to market rate
Risk-adjusted market rate returns
n=158 n=63 n=79
Table 19 shows gross return expectations of respondents for 2015 vintage investments for both debt and equity in developed and emerging markets. Average expectations are higher for both asset classes in emerging markets.
Table 19: Gross return expectations for 2015 vintage investments, overall sample
Overall DM debt EM debt DM equity EM equity
Mean 5.4% 8.6% 9.5% 15.1%
Standard deviation 4.2% 5.1% 7.4% 7.4%
n 34 44 33 50
Note: Excludes three respondents for which data could not be verified.Source: GIIN
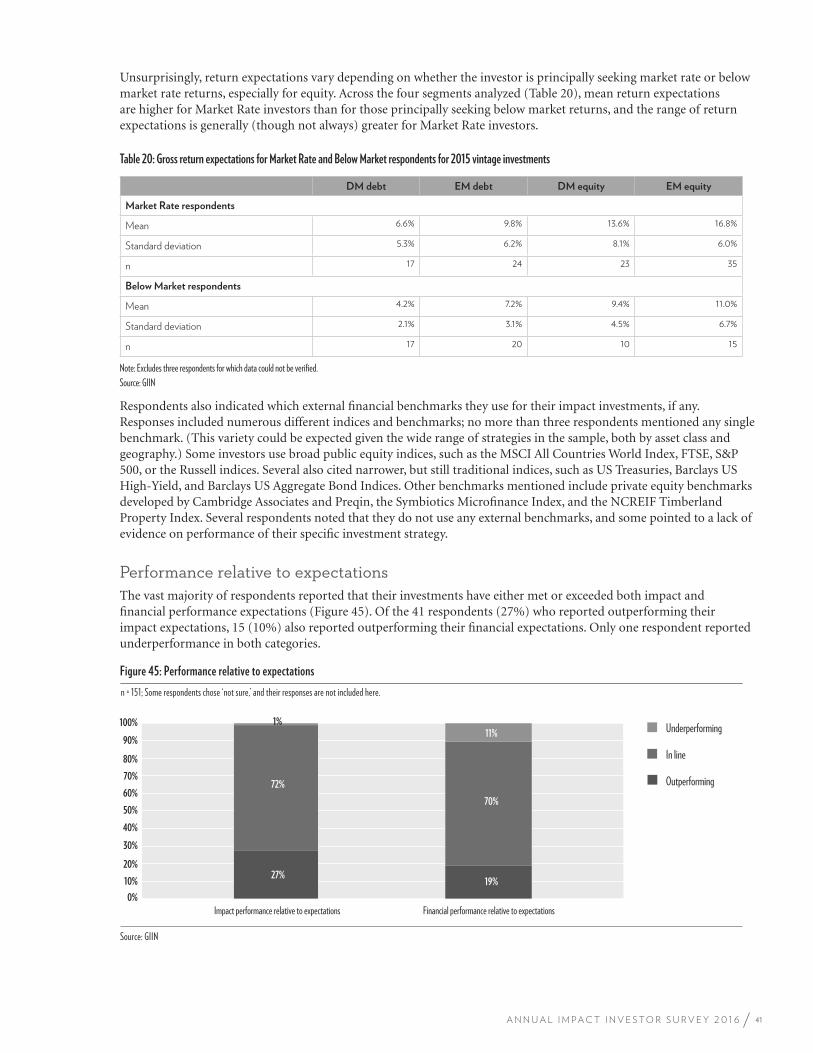
41A N N U A L I M P A C T I N V E S T O R S U R V E Y 2 0 1 6
Unsurprisingly, return expectations vary depending on whether the investor is principally seeking market rate or below market rate returns, especially for equity. Across the four segments analyzed (Table 20), mean return expectations are higher for Market Rate investors than for those principally seeking below market returns, and the range of return expectations is generally (though not always) greater for Market Rate investors.
Table 20: Gross return expectations for Market Rate and Below Market respondents for 2015 vintage investments
DM debt EM debt DM equity EM equity
Market Rate respondents
Mean 6.6% 9.8% 13.6% 16.8%
Standard deviation 5.3% 6.2% 8.1% 6.0%
n 17 24 23 35
Below Market respondents
Mean 4.2% 7.2% 9.4% 11.0%
Standard deviation 2.1% 3.1% 4.5% 6.7%
n 17 20 10 15
Note: Excludes three respondents for which data could not be verified.Source: GIIN
Respondents also indicated which external financial benchmarks they use for their impact investments, if any. Responses included numerous different indices and benchmarks; no more than three respondents mentioned any single benchmark. (This variety could be expected given the wide range of strategies in the sample, both by asset class and geography.) Some investors use broad public equity indices, such as the MSCI All Countries World Index, FTSE, S&P 500, or the Russell indices. Several also cited narrower, but still traditional indices, such as US Treasuries, Barclays US High-Yield, and Barclays US Aggregate Bond Indices. Other benchmarks mentioned include private equity benchmarks developed by Cambridge Associates and Preqin, the Symbiotics Microfinance Index, and the NCREIF Timberland Property Index. Several respondents noted that they do not use any external benchmarks, and some pointed to a lack of evidence on performance of their specific investment strategy.
Performance relative to expectationsThe vast majority of respondents reported that their investments have either met or exceeded both impact and financial performance expectations (Figure 45). Of the 41 respondents (27%) who reported outperforming their impact expectations, 15 (10%) also reported outperforming their financial expectations. Only one respondent reported underperformance in both categories.
Figure 45: Performance relative to expectations
0%
10%
20%
30%
40%
50%
60%
70%
80%
90%
100%
Impact performance relative to expectations
Source: GIIN
Financial performance relative to expectations
Underperforming
In line
Outperforming
27% 19%
72%
70%
1% 11%
n = 151; Some respondents chose ‘not sure,’ and their responses are not included here.
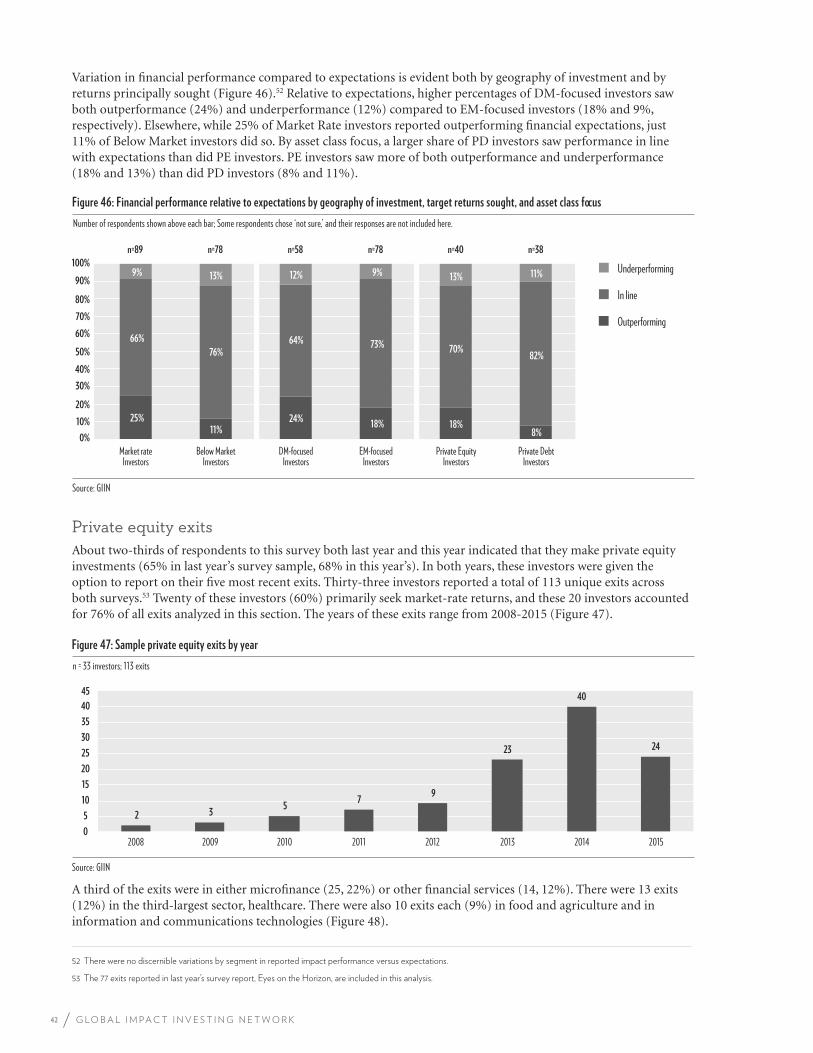
42 G L O B A L I M P A C T I N V E S T I N G N E T W O R K
Variation in financial performance compared to expectations is evident both by geography of investment and by returns principally sought (Figure 46).52 Relative to expectations, higher percentages of DM-focused investors saw both outperformance (24%) and underperformance (12%) compared to EM-focused investors (18% and 9%, respectively). Elsewhere, while 25% of Market Rate investors reported outperforming financial expectations, just 11% of Below Market investors did so. By asset class focus, a larger share of PD investors saw performance in line with expectations than did PE investors. PE investors saw more of both outperformance and underperformance (18% and 13%) than did PD investors (8% and 11%).
Figure 46: Financial performance relative to expectations by geography of investment, target returns sought, and asset class focus
Number of respondents shown above each bar; Some respondents chose ‘not sure,’ and their responses are not included here.
Source: GIIN
0%
10%
20%
30%
40%
50%
60%
70%
80%
90%
100%
Market rate Investors
Below Market Investors
DM-focused Investors
EM-focused Investors
Private Equity Investors
Private Debt Investors
Underperforming
In line
Outperforming
25% 11%
24% 18% 18%
8%
66%
76% 64% 73% 70%
82%
9% 13% 12% 9% 13% 11%
n=89 n=78 n=58 n=78 n=40 n=38
Private equity exitsAbout two-thirds of respondents to this survey both last year and this year indicated that they make private equity investments (65% in last year’s survey sample, 68% in this year’s). In both years, these investors were given the option to report on their five most recent exits. Thirty-three investors reported a total of 113 unique exits across both surveys.53 Twenty of these investors (60%) primarily seek market-rate returns, and these 20 investors accounted for 76% of all exits analyzed in this section. The years of these exits range from 2008-2015 (Figure 47).
Figure 47: Sample private equity exits by year
n = 33 investors; 113 exits
Source: GIIN
40
45
0
5
10
15
20
25
30
35
2008 2009 2010 2011 2012 2013 2014 2015
2 3 5
7 9
23
40
24
A third of the exits were in either microfinance (25, 22%) or other financial services (14, 12%). There were 13 exits (12%) in the third-largest sector, healthcare. There were also 10 exits each (9%) in food and agriculture and in information and communications technologies (Figure 48).
52 There were no discernible variations by segment in reported impact performance versus expectations.
53 The 77 exits reported in last year’s survey report, Eyes on the Horizon, are included in this analysis.
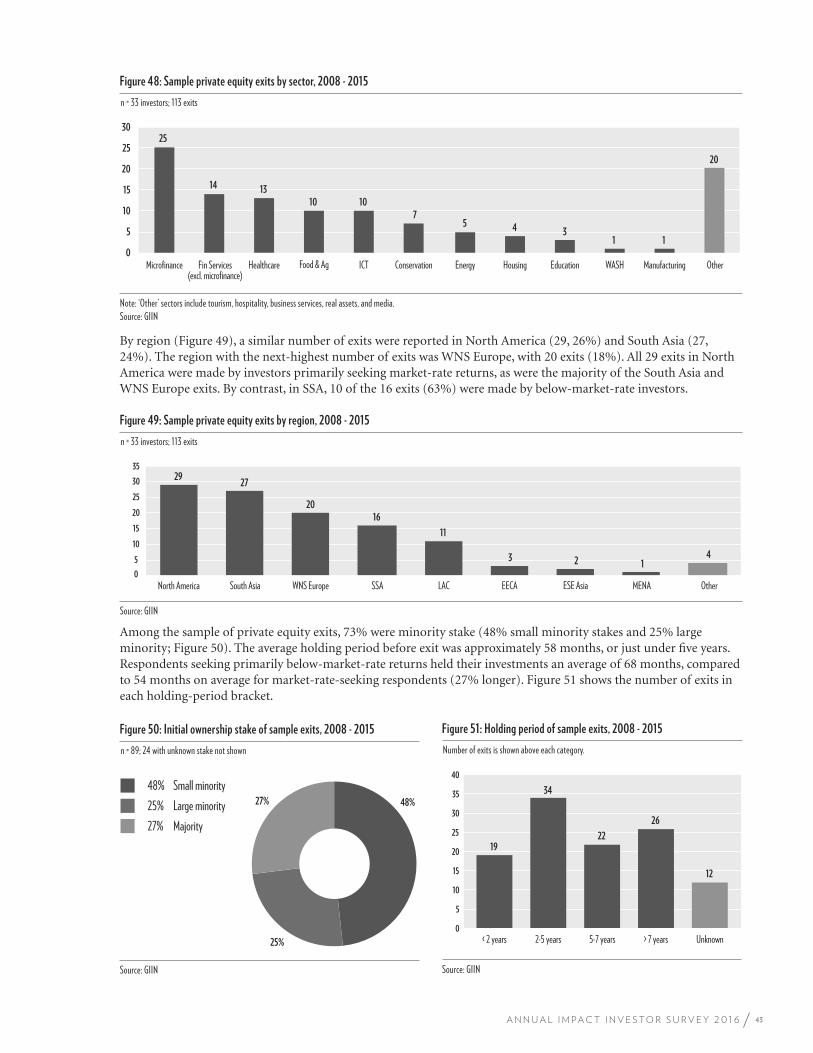
43A N N U A L I M P A C T I N V E S T O R S U R V E Y 2 0 1 6
Figure 48: Sample private equity exits by sector, 2008 - 2015
n = 33 investors; 113 exits
Note: ‘Other’ sectors include tourism, hospitality, business services, real assets, and media. Source: GIIN
30
0
5
10
15
20
25
Microfinance Healthcare Fin Services (excl. microfinance)
Food & Ag ICT Conservation Energy Housing Education WASH Manufacturing Other
25
14 13
10 10
7 5 4 3
1 1
20
By region (Figure 49), a similar number of exits were reported in North America (29, 26%) and South Asia (27, 24%). The region with the next-highest number of exits was WNS Europe, with 20 exits (18%). All 29 exits in North America were made by investors primarily seeking market-rate returns, as were the majority of the South Asia and WNS Europe exits. By contrast, in SSA, 10 of the 16 exits (63%) were made by below-market-rate investors.
Figure 49: Sample private equity exits by region, 2008 - 2015
n = 33 investors; 113 exits
Source: GIIN
0
5
10
15
20
25
30
35
North America South Asia WNS Europe SSA LAC EECA ESE Asia Other MENA
29 27
20 16
11
3 2 1 4
Among the sample of private equity exits, 73% were minority stake (48% small minority stakes and 25% large minority; Figure 50). The average holding period before exit was approximately 58 months, or just under five years. Respondents seeking primarily below-market-rate returns held their investments an average of 68 months, compared to 54 months on average for market-rate-seeking respondents (27% longer). Figure 51 shows the number of exits in each holding-period bracket.
Figure 50: Initial ownership stake of sample exits, 2008 - 2015
n = 89; 24 with unknown stake not shown
Source: GIIN
48% Small minority 25% Large minority 27% Majority
27% 48%
25%
Figure 51: Holding period of sample exits, 2008 - 2015
Number of exits is shown above each category.
10
5
0
15
20
25
30
35
40
< 2 years 2-5 years 5-7 years > 7 years Unknown
19
34
22
26
12
Source: GIIN
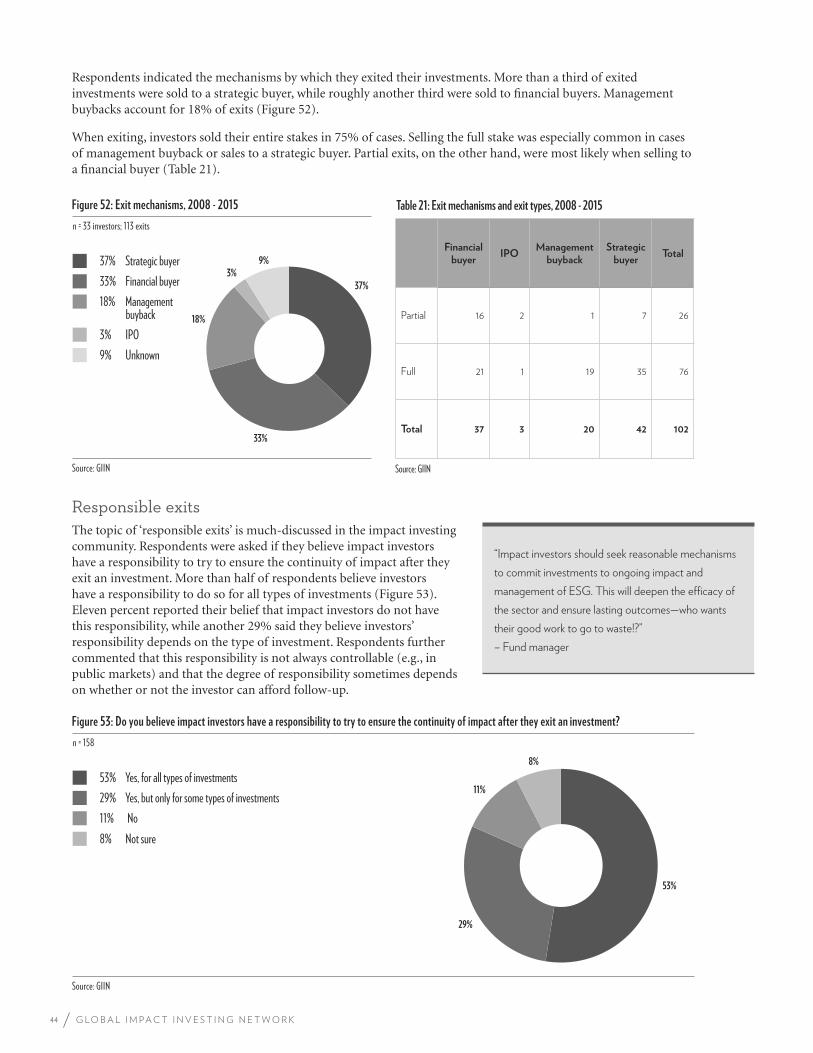
44 G L O B A L I M P A C T I N V E S T I N G N E T W O R K
Respondents indicated the mechanisms by which they exited their investments. More than a third of exited investments were sold to a strategic buyer, while roughly another third were sold to financial buyers. Management buybacks account for 18% of exits (Figure 52).
When exiting, investors sold their entire stakes in 75% of cases. Selling the full stake was especially common in cases of management buyback or sales to a strategic buyer. Partial exits, on the other hand, were most likely when selling to a financial buyer (Table 21).
Table 21: Exit mechanisms and exit types, 2008 - 2015Figure 52: Exit mechanisms, 2008 - 2015
n = 33 investors; 113 exits
Source: GIIN
37% Strategic buyer 33% Financial buyer 18% Management
buyback 3% IPO 9% Unknown
37%
33%
18%
3% 9%
Financial buyer
IPOManagement
buybackStrategic
buyerTotal
Partial 16 2 1 7 26
Full 21 1 19 35 76
Total 37 3 20 42 102
Source: GIIN
Responsible exitsThe topic of ‘responsible exits’ is much-discussed in the impact investing community. Respondents were asked if they believe impact investors have a responsibility to try to ensure the continuity of impact after they exit an investment. More than half of respondents believe investors have a responsibility to do so for all types of investments (Figure 53). Eleven percent reported their belief that impact investors do not have this responsibility, while another 29% said they believe investors’ responsibility depends on the type of investment. Respondents further commented that this responsibility is not always controllable (e.g., in public markets) and that the degree of responsibility sometimes depends on whether or not the investor can afford follow-up.
Figure 53: Do you believe impact investors have a responsibility to try to ensure the continuity of impact after they exit an investment?
n = 158
Source: GIIN
53% Yes, for all types of investments 29% Yes, but only for some types of investments 11% No 8% Not sure
53%
29%
11%
8%
“Impact investors should seek reasonable mechanisms
to commit investments to ongoing impact and
management of ESG. This will deepen the efficacy of
the sector and ensure lasting outcomes—who wants
their good work to go to waste!?”
– Fund manager
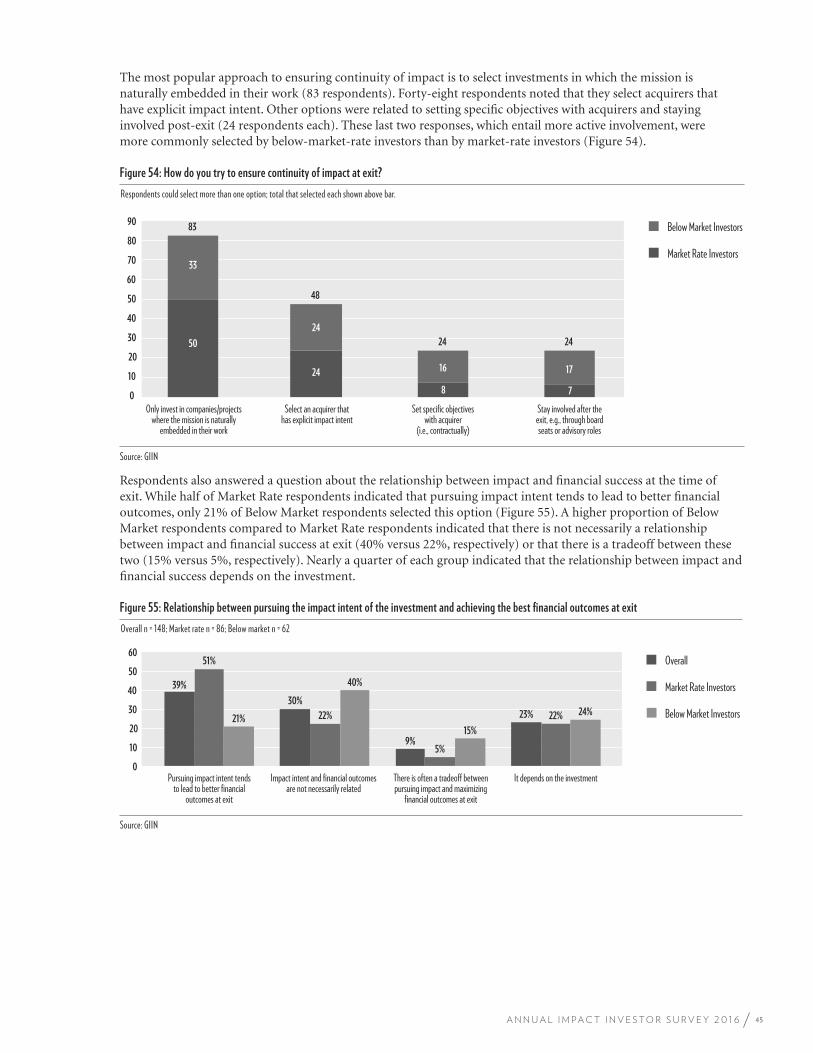
45A N N U A L I M P A C T I N V E S T O R S U R V E Y 2 0 1 6
The most popular approach to ensuring continuity of impact is to select investments in which the mission is naturally embedded in their work (83 respondents). Forty-eight respondents noted that they select acquirers that have explicit impact intent. Other options were related to setting specific objectives with acquirers and staying involved post-exit (24 respondents each). These last two responses, which entail more active involvement, were more commonly selected by below-market-rate investors than by market-rate investors (Figure 54).
Figure 54: How do you try to ensure continuity of impact at exit?
Respondents could select more than one option; total that selected each shown above bar.
Source: GIIN
30
10
20
0
40
50
60
70
80
90
Only invest in companies/projects where the mission is naturally
embedded in their work
Select an acquirer that has explicit impact intent
Set specific objectives with acquirer
(i.e., contractually)
Stay involved after the exit, e.g., through board seats or advisory roles
50
24
33
24
16
8 7
17
83
48
24 24
Below Market Investors
Market Rate Investors
Respondents also answered a question about the relationship between impact and financial success at the time of exit. While half of Market Rate respondents indicated that pursuing impact intent tends to lead to better financial outcomes, only 21% of Below Market respondents selected this option (Figure 55). A higher proportion of Below Market respondents compared to Market Rate respondents indicated that there is not necessarily a relationship between impact and financial success at exit (40% versus 22%, respectively) or that there is a tradeoff between these two (15% versus 5%, respectively). Nearly a quarter of each group indicated that the relationship between impact and financial success depends on the investment.
Figure 55: Relationship between pursuing the impact intent of the investment and achieving the best financial outcomes at exit
Overall n = 148; Market rate n = 86; Below market n = 62
Source: GIIN
10
20
0
30
40
50
60
Pursuing impact intent tends to lead to better financial
outcomes at exit
Impact intent and financial outcomes are not necessarily related
There is often a tradeoff between pursuing impact and maximizing
financial outcomes at exit
It depends on the investment
39%
30%
9%
23%
51%
22%
5%
22% 21%
40%
15%
24%
Overall
Market Rate Investors Below Market Investors
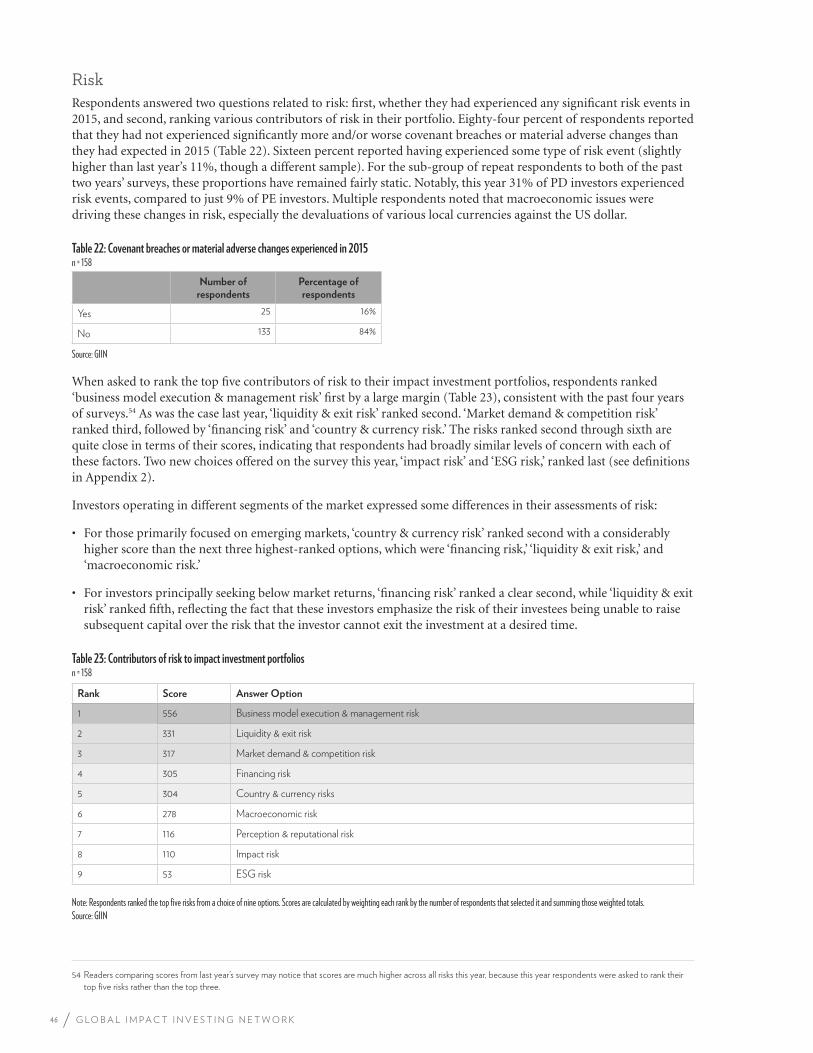
46 G L O B A L I M P A C T I N V E S T I N G N E T W O R K
RiskRespondents answered two questions related to risk: first, whether they had experienced any significant risk events in 2015, and second, ranking various contributors of risk in their portfolio. Eighty-four percent of respondents reported that they had not experienced significantly more and/or worse covenant breaches or material adverse changes than they had expected in 2015 (Table 22). Sixteen percent reported having experienced some type of risk event (slightly higher than last year’s 11%, though a different sample). For the sub-group of repeat respondents to both of the past two years’ surveys, these proportions have remained fairly static. Notably, this year 31% of PD investors experienced risk events, compared to just 9% of PE investors. Multiple respondents noted that macroeconomic issues were driving these changes in risk, especially the devaluations of various local currencies against the US dollar.
Table 22: Covenant breaches or material adverse changes experienced in 2015n = 158
Number of respondents
Percentage of respondents
Yes 25 16%
No 133 84%
Source: GIIN
When asked to rank the top five contributors of risk to their impact investment portfolios, respondents ranked ‘business model execution & management risk’ first by a large margin (Table 23), consistent with the past four years of surveys.54 As was the case last year, ‘liquidity & exit risk’ ranked second. ‘Market demand & competition risk’ ranked third, followed by ‘financing risk’ and ‘country & currency risk.’ The risks ranked second through sixth are quite close in terms of their scores, indicating that respondents had broadly similar levels of concern with each of these factors. Two new choices offered on the survey this year, ‘impact risk’ and ‘ESG risk,’ ranked last (see definitions in Appendix 2).
Investors operating in different segments of the market expressed some differences in their assessments of risk:
• For those primarily focused on emerging markets, ‘country & currency risk’ ranked second with a considerably higher score than the next three highest-ranked options, which were ‘financing risk,’ ‘liquidity & exit risk,’ and ‘macroeconomic risk.’
• For investors principally seeking below market returns, ‘financing risk’ ranked a clear second, while ‘liquidity & exit risk’ ranked fifth, reflecting the fact that these investors emphasize the risk of their investees being unable to raise subsequent capital over the risk that the investor cannot exit the investment at a desired time.
Table 23: Contributors of risk to impact investment portfoliosn = 158
Rank Score Answer Option
1 556 Business model execution & management risk
2 331 Liquidity & exit risk
3 317 Market demand & competition risk
4 305 Financing risk
5 304 Country & currency risks
6 278 Macroeconomic risk
7 116 Perception & reputational risk
8 110 Impact risk
9 53 ESG risk
Note: Respondents ranked the top five risks from a choice of nine options. Scores are calculated by weighting each rank by the number of respondents that selected it and summing those weighted totals.Source: GIIN
54 Readers comparing scores from last year’s survey may notice that scores are much higher across all risks this year, because this year respondents were asked to rank their
top five risks rather than the top three.
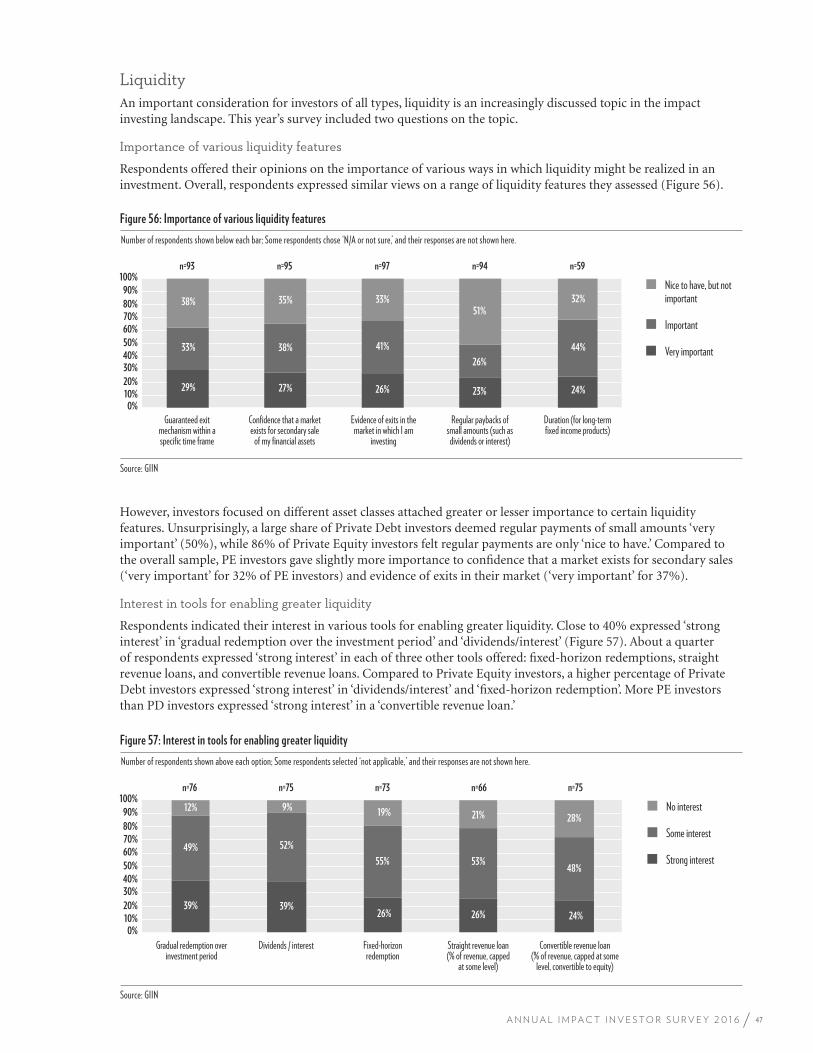
47A N N U A L I M P A C T I N V E S T O R S U R V E Y 2 0 1 6
LiquidityAn important consideration for investors of all types, liquidity is an increasingly discussed topic in the impact investing landscape. This year’s survey included two questions on the topic.
Importance of various liquidity features
Respondents offered their opinions on the importance of various ways in which liquidity might be realized in an investment. Overall, respondents expressed similar views on a range of liquidity features they assessed (Figure 56).
Figure 56: Importance of various liquidity features
Number of respondents shown below each bar; Some respondents chose ‘N/A or not sure,’ and their responses are not shown here.
Source: GIIN
0% 10% 20%
30% 40%
50%
60% 70% 80%
90%
100%
Guaranteed exit mechanism within a specific time frame
Confidence that a market exists for secondary sale
of my financial assets
Evidence of exits in the market in which I am
investing
Regular paybacks of small amounts (such as dividends or interest)
Duration (for long-term fixed income products)
Nice to have, but not important
Important
Very important
n=93 n=95 n=97 n=94 n=59
27%
38%
35%
29%
33%
38%
26%
41%
33%
23%
26%
51%
24%
44%
32%
However, investors focused on different asset classes attached greater or lesser importance to certain liquidity features. Unsurprisingly, a large share of Private Debt investors deemed regular payments of small amounts ‘very important’ (50%), while 86% of Private Equity investors felt regular payments are only ‘nice to have.’ Compared to the overall sample, PE investors gave slightly more importance to confidence that a market exists for secondary sales (‘very important’ for 32% of PE investors) and evidence of exits in their market (‘very important’ for 37%).
Interest in tools for enabling greater liquidity
Respondents indicated their interest in various tools for enabling greater liquidity. Close to 40% expressed ‘strong interest’ in ‘gradual redemption over the investment period’ and ‘dividends/interest’ (Figure 57). About a quarter of respondents expressed ‘strong interest’ in each of three other tools offered: fixed-horizon redemptions, straight revenue loans, and convertible revenue loans. Compared to Private Equity investors, a higher percentage of Private Debt investors expressed ‘strong interest’ in ‘dividends/interest’ and ‘fixed-horizon redemption’. More PE investors than PD investors expressed ‘strong interest’ in a ‘convertible revenue loan.’
Figure 57: Interest in tools for enabling greater liquidity
Number of respondents shown above each option; Some respondents selected ‘not applicable,’ and their responses are not shown here.
Source: GIIN
0% 10%
20%
30% 40%
50%
60%
70%
80%
90%
100%
Gradual redemption over investment period
Dividends / interest Fixed-horizon redemption
Straight revenue loan (% of revenue, capped
at some level)
Convertible revenue loan(% of revenue, capped at some
level, convertible to equity)
No interest
Some interest
Strong interest
n=76 n=75 n=73 n=66 n=75
39% 39% 26% 26% 24%
49% 52%
55% 53% 48%
12% 9% 19% 21% 28%
48 G L O B A L I M P A C T I N V E S T I N G N E T W O R K
2015 MARKET DEVELOPMENT
Financial Performance Research
Both current and potential impact investors have increasingly expressed demand for research on the financial performance of impact
investments. In 2015, several organizations responded to this demand with studies evaluating the performance of private equity and
private debt impact investments.
Private Equity
• In June 2015, the GIIN and Cambridge Associates published a report analyzing the financial performance of 51 private equity
impact investing funds seeking market-rate returns.55 Included funds pursue a range of social impact objectives and operate across
geographies and sectors with vintage years ranging from 1998 to 2010. The study found that, while competitive market-rate returns
are achievable in private equity impact investing, manager selection is critical—just as in conventional private equity investing.
• In October 2015, the Wharton Social Impact Initiative published a study analyzing the performance of private equity funds
between 2000 and 2015.56 The study found that private equity impact investing funds seeking risk-adjusted market rate returns
were able to achieve returns comparable to public-market equivalents.
Private Debt
• In June 2015, EngagedX published a study analyzing 426 transactions made between 2002 and 2014 by three social investment
financial intermediaries in the UK.57 Included transactions took place across a range of sectors and did not necessarily target
market-rate returns, often prioritizing the provision of appropriate capital to social purpose organizations over and above the
making of financial returns. This was reflected in varied performance, with the authors finding greater net losses on funds that
might have been more focused on testing the principles of social investment, while those that were set up to be more financially
sustainable performed “reasonably well.”
• In July 2015, the Boston Consulting Group published research which considered both the transaction- and fund-level
performance of the Futurebuilders England Fund, an early entrant to the UK social investment market that offers repayable
finance, grants, and professional support to community-development organizations.58 The study analyzed data from 148 total
transactions made between 2004 and 2010, many of which included both investment and grant components.59 According to
the study, Futurebuilders achieved a high rate of capital recovery, particularly from simple loan products, despite lending to
organizations with little prior exposure to loan finance.
These studies represent significant advancement in the effort to bridge information gaps regarding the financial performance of
impact investments. However, further research is needed to understand performance across different market segments. Financial
performance analysis will remain a priority on the GIIN’s research agenda in the years ahead.
55 Amit Bouri et al., Introducing the Impact Investing Benchmark (Global Impact Investing Network and Cambridge Associates: June 25, 2015), https://thegiin.org/
knowledge/publication/introducing-the-impact-investing-benchmark.
56 Jacob Gray et al., Great Expectations: Mission Preservation and Financial Performance in Impact Investing (Philadelphia: Wharton Social Impact Initiative, October
2015), http://socialimpact.wharton.upenn.edu/wp-content/uploads/2013/11/Great-Expectations_Mission-Preservation-and-Financial-Performance-in-Impact-
Investing_10.7.pdf.
57 The Social Investment Market through a Data Lens. Social Investment Research Council. June 5, 2015.
http://www.engagedx.com/downloads/SIRC_EngagedX_The_Social_Investment_Market_Through_a_Data_Lens_FINAL.pdf.
58 Adrian Brown, Lina Behrens, and Anna Schuster, A Tale of Two Funds: The Management and Performance of Futurebuilders England (London: Boston Consulting
Group, July 2015), http://www.sibgroup.org.uk/fbe/.
59 The study did not specify the fund’s target rates of return.
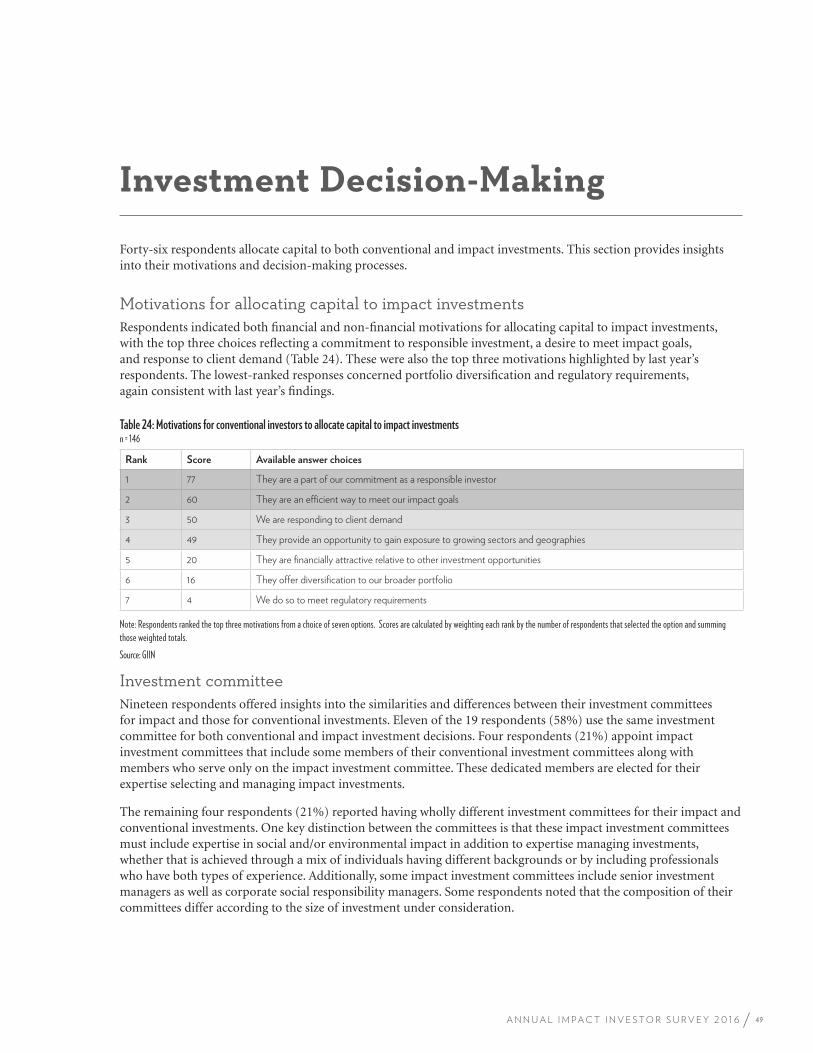
49A N N U A L I M P A C T I N V E S T O R S U R V E Y 2 0 1 6
Investment Decision-Making
Forty-six respondents allocate capital to both conventional and impact investments. This section provides insights into their motivations and decision-making processes.
Motivations for allocating capital to impact investmentsRespondents indicated both financial and non-financial motivations for allocating capital to impact investments, with the top three choices reflecting a commitment to responsible investment, a desire to meet impact goals, and response to client demand (Table 24). These were also the top three motivations highlighted by last year’s respondents. The lowest-ranked responses concerned portfolio diversification and regulatory requirements, again consistent with last year’s findings.
Table 24: Motivations for conventional investors to allocate capital to impact investmentsn = 146
Rank Score Available answer choices
1 77 They are a part of our commitment as a responsible investor
2 60 They are an efficient way to meet our impact goals
3 50 We are responding to client demand
4 49 They provide an opportunity to gain exposure to growing sectors and geographies
5 20 They are financially attractive relative to other investment opportunities
6 16 They offer diversification to our broader portfolio
7 4 We do so to meet regulatory requirements Note: Respondents ranked the top three motivations from a choice of seven options. Scores are calculated by weighting each rank by the number of respondents that selected the option and summing those weighted totals.
Source: GIIN
Investment committeeNineteen respondents offered insights into the similarities and differences between their investment committees for impact and those for conventional investments. Eleven of the 19 respondents (58%) use the same investment committee for both conventional and impact investment decisions. Four respondents (21%) appoint impact investment committees that include some members of their conventional investment committees along with members who serve only on the impact investment committee. These dedicated members are elected for their expertise selecting and managing impact investments.
The remaining four respondents (21%) reported having wholly different investment committees for their impact and conventional investments. One key distinction between the committees is that these impact investment committees must include expertise in social and/or environmental impact in addition to expertise managing investments, whether that is achieved through a mix of individuals having different backgrounds or by including professionals who have both types of experience. Additionally, some impact investment committees include senior investment managers as well as corporate social responsibility managers. Some respondents noted that the composition of their committees differ according to the size of investment under consideration.
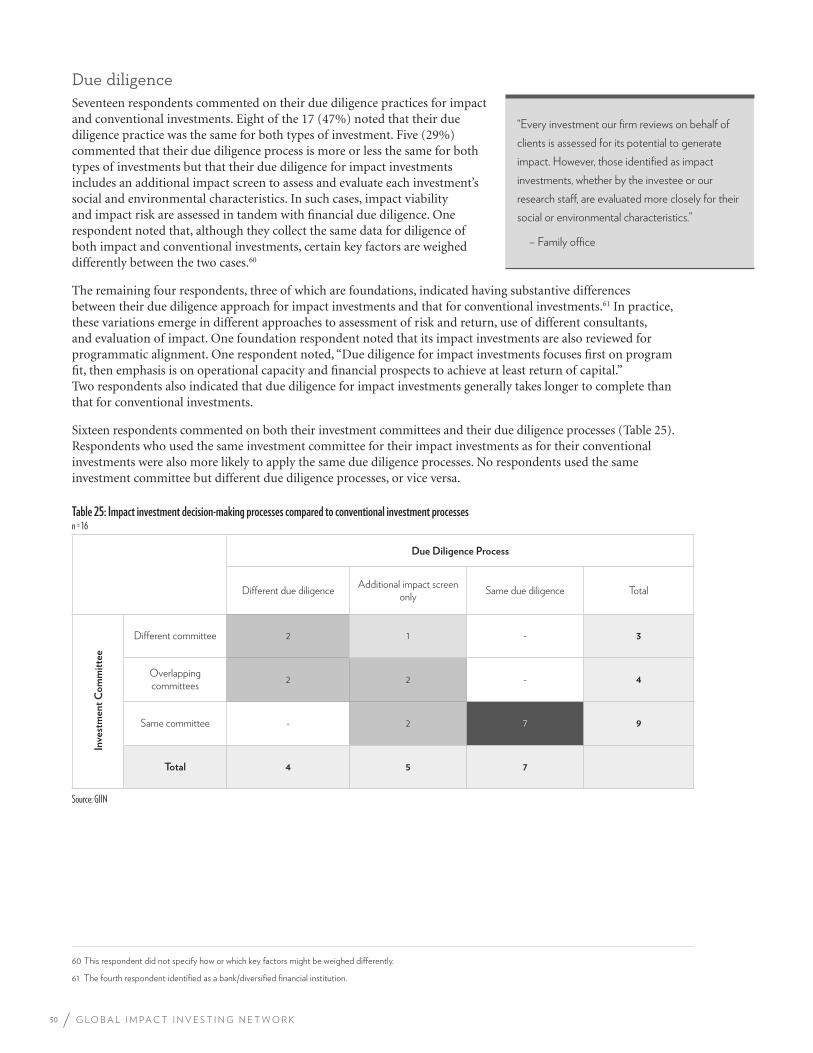
50 G L O B A L I M P A C T I N V E S T I N G N E T W O R K
Due diligenceSeventeen respondents commented on their due diligence practices for impact and conventional investments. Eight of the 17 (47%) noted that their due diligence practice was the same for both types of investment. Five (29%) commented that their due diligence process is more or less the same for both types of investments but that their due diligence for impact investments includes an additional impact screen to assess and evaluate each investment’s social and environmental characteristics. In such cases, impact viability and impact risk are assessed in tandem with financial due diligence. One respondent noted that, although they collect the same data for diligence of both impact and conventional investments, certain key factors are weighed differently between the two cases.60
The remaining four respondents, three of which are foundations, indicated having substantive differences between their due diligence approach for impact investments and that for conventional investments.61 In practice, these variations emerge in different approaches to assessment of risk and return, use of different consultants, and evaluation of impact. One foundation respondent noted that its impact investments are also reviewed for programmatic alignment. One respondent noted, “Due diligence for impact investments focuses first on program fit, then emphasis is on operational capacity and financial prospects to achieve at least return of capital.” Two respondents also indicated that due diligence for impact investments generally takes longer to complete than that for conventional investments.
Sixteen respondents commented on both their investment committees and their due diligence processes (Table 25). Respondents who used the same investment committee for their impact investments as for their conventional investments were also more likely to apply the same due diligence processes. No respondents used the same investment committee but different due diligence processes, or vice versa.
Table 25: Impact investment decision-making processes compared to conventional investment processesn = 16
Due Diligence Process
Different due diligenceAdditional impact screen
onlySame due diligence Total
Inve
stm
ent
Co
mm
itte
e
Different committee 2 1 - 3
Overlapping committees
2 2 - 4
Same committee - 2 7 9
Total 4 5 7
Source: GIIN
60 This respondent did not specify how or which key factors might be weighed differently.
61 The fourth respondent identified as a bank/diversified financial institution.
“Every investment our firm reviews on behalf of
clients is assessed for its potential to generate
impact. However, those identified as impact
investments, whether by the investee or our
research staff, are evaluated more closely for their
social or environmental characteristics.”
– Family office
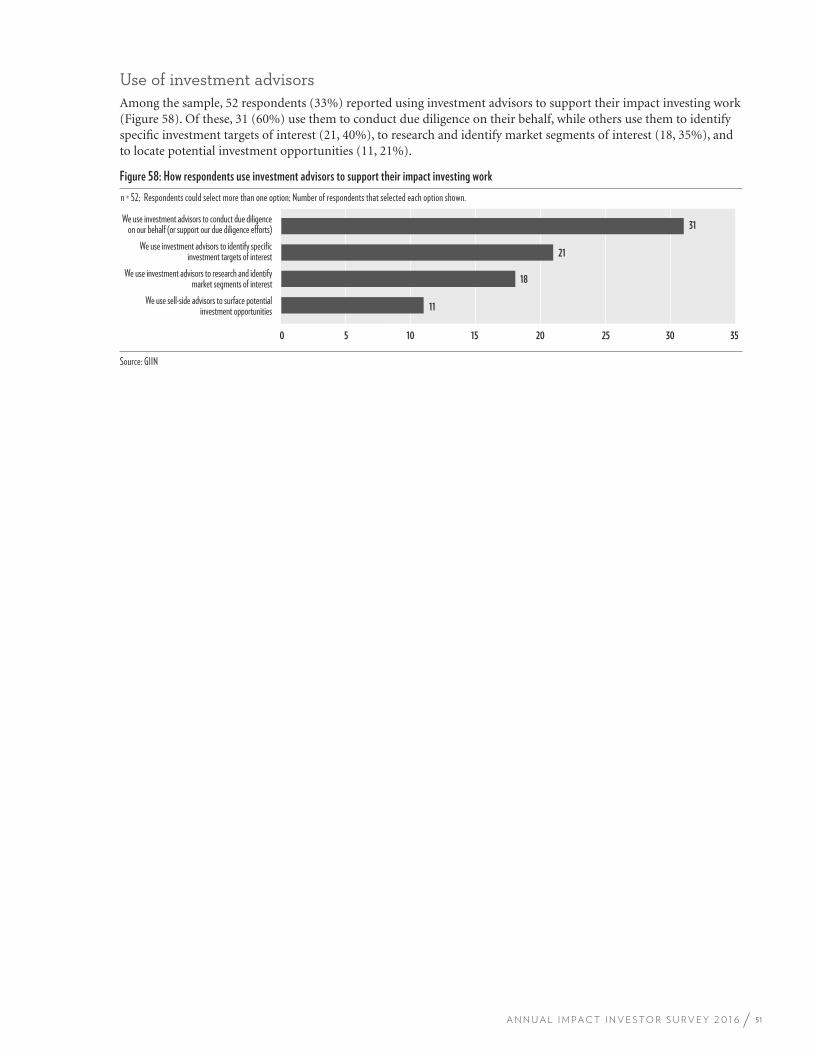
51A N N U A L I M P A C T I N V E S T O R S U R V E Y 2 0 1 6
Use of investment advisorsAmong the sample, 52 respondents (33%) reported using investment advisors to support their impact investing work (Figure 58). Of these, 31 (60%) use them to conduct due diligence on their behalf, while others use them to identify specific investment targets of interest (21, 40%), to research and identify market segments of interest (18, 35%), and to locate potential investment opportunities (11, 21%).
Figure 58: How respondents use investment advisors to support their impact investing work
n = 52; Respondents could select more than one option; Number of respondents that selected each option shown.
Source: GIIN
0 5 10 15 20 25 30 35
We use sell-side advisors to surface potential investment opportunities
We use investment advisors to research and identify market segments of interest
We use investment advisors to identify specific investment targets of interest
We use investment advisors to conduct due diligence on our behalf (or support our due diligence efforts)
11
18
21
31

52 G L O B A L I M P A C T I N V E S T I N G N E T W O R K
Appendices
53A N N U A L I M P A C T I N V E S T O R S U R V E Y 2 0 1 6
Appendix 1. List of Survey RespondentsWe are grateful to the following organizations for their contributions, without which this survey would not be possible.
3Sisters Sustainable Management/Scarab Funds
Aavishkaar Venture Management Services
Adobe Capital
AgDevCo
Alterfin
Annie E. Casey Foundation
Anonymous 1
Anonymous 2
Anonymous 3
Aravaipa Ventures
Arun LLC
ASN Novib Microcredit Fund
Athena Capital Advisors
Aventura Investment Partners
AXA IM
Bamboo Finance
Bethnal Green Ventures
Big Issue Invest
Big Society Capital
BlueOrchard Finance Ltd.
BNP Paribas
Bridges Ventures LLP
BuildForward Capital
Business Partners International
Caisse Solidaire
California Fisheries Fund, Inc.
Calvert Social Investment Foundation
Capria/Unitus Seed Fund
Capricorn Investment Group
CDC Group
Christian Super
Citizen Capital Partenaires
Community Capital Management, Inc.
Community Investment Management, LLC
Community Reinvestment Fund, USA
Conservation Forestry
Conservation International
Contact Fund, LLC
Contrarian Drishti Partners
COOPEST
Cordaid Investment Management
Core Innovation Capital
CoreCo Private Equity
Craft3
Creas
Creation Investments Capital Management, LLC
Credit Suisse
Cultivian Sandbox Ventures
Développement international Desjardins
Deutsche Bank
Dev Equity
Developing World Markets (DWM)
EcoEnterprises Fund
Ecotrust Forest Management
Elevar Equity
Endeavor Global
Energy Access Ventures
ENGIE Rassembleurs d’Energies
Enterprise Community Partners
Equity for Tanzania (EFTA)
Finance in Motion
Fledge
FMO
Fondazione Sviluppo e Crescita - CRT
Fonds 1818
Ford Foundation
Forsyth Street
Futuregrowth Asset Management
GAWA Capital
Global Partnerships
Gordon and Betty Moore Foundation
Grameen Credit Agricole Foundation
Grassroots Business Fund
Grassroots Capital Management PBC/Caspian Impact Investment Advisers
Gray Ghost Ventures
GroFin
Habitat for Humanity International
HCAP Partners LLC
Heron Foundation
Homewise, Inc.
Hooge Raedt Social Venture (HRSV)
Investisseurs et Partenaires (I&P)
ICCO Investments
54 G L O B A L I M P A C T I N V E S T I N G N E T W O R K
IDP Foundation, Inc.
IGNIA
Impact Community Capital
Impact First Investments
Impax Asset Management
Inversor Fund
J.W. McConnell Family Foundation
JPMorgan Chase & Co.
Kois Invest
Kukula Capital Plc
LeapFrog Investments
LGT Venture Philanthropy
Lok Capital
Lombard Odier SA
Lundin Foundation
Lyme Timber
MacArthur Foundation
MainStreet Capital Partners
Media Development Investment Fund
Mergence Investment Managers
MicroVest Capital Management, LLC
National Community Investment Fund
Nesta Impact Investments
New Forests
New Market Funds
NewWorld Capital Group
Nonprofit Finance Fund
Northern California Community Loan Fund
Novastar Ventures
Oikocredit Private Equity
Omidyar Network
Omnivore Partners
Overseas Private Investment Corporation (OPIC)
Pacific Community Ventures
Phatisa Fund Managers
PhiTrust
Progression Capital Africa Ltd
Prudential Impact Investments
Promotora Social México (PSM)
Quadia
Renewal Funds
responsAbility Investments AG
Root Capital
RS Group
Robert Wood Johnson Foundation (RWJF)
Sarona Asset Management
Self-Help Credit Union
Shared Interest
Sitawi
SJF Ventures
SLM Partners
Social and Sustainable Capital
Social Investment Business
Sonen Capital
Stichting DOEN
Symbiotics
The California Endowment
The Climate Trust
The David and Lucile Packard Foundation
The McKnight Foundation
The Osiris Group
The Rockefeller Foundation
TIAA-CREF
Treehouse Investments, LLC
Triodos Investment Management
Triple Jump
Truestone Impact Investment Management
TVM Capital Healthcare partners
Upaya Social Ventures
Vermont Community Loan Fund
VilCap Investments
Vital Capital Fund
Vox Capital
Voxtra
Working Capital for Community Needs (WCCN)
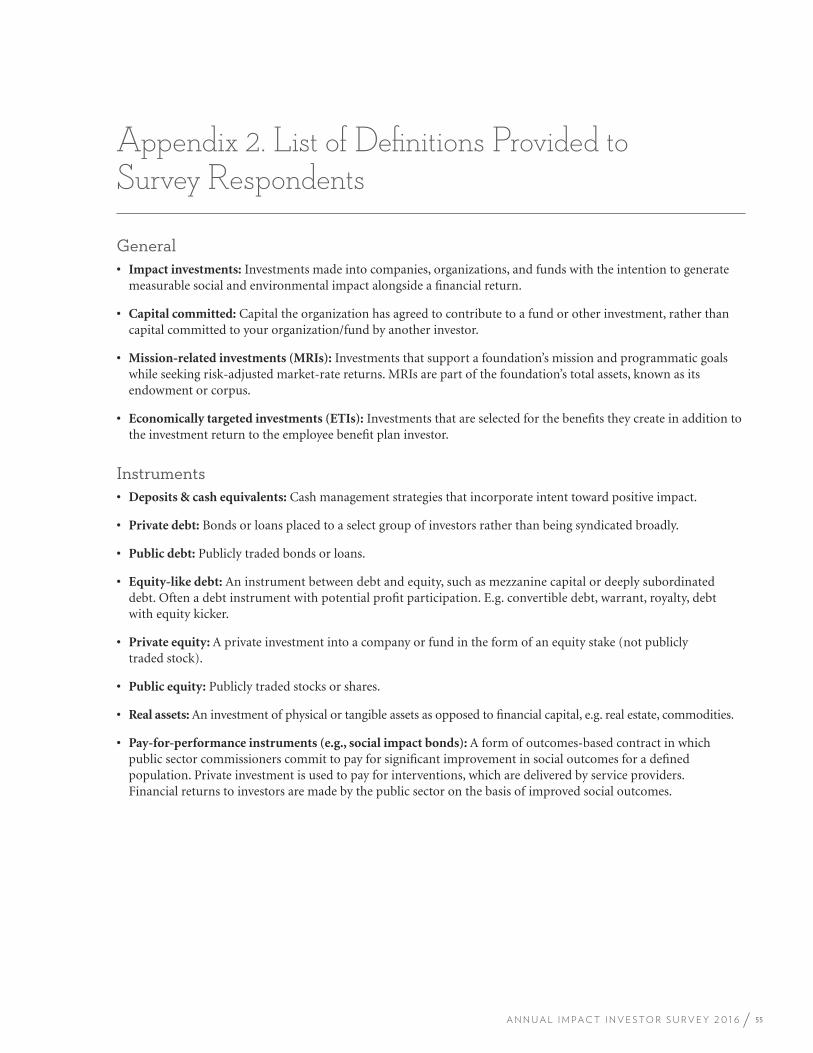
55A N N U A L I M P A C T I N V E S T O R S U R V E Y 2 0 1 6
Appendix 2. List of Definitions Provided to Survey Respondents General• Impact investments: Investments made into companies, organizations, and funds with the intention to generate
measurable social and environmental impact alongside a financial return.
• Capital committed: Capital the organization has agreed to contribute to a fund or other investment, rather than capital committed to your organization/fund by another investor.
• Mission-related investments (MRIs): Investments that support a foundation’s mission and programmatic goals while seeking risk-adjusted market-rate returns. MRIs are part of the foundation’s total assets, known as its endowment or corpus.
• Economically targeted investments (ETIs): Investments that are selected for the benefits they create in addition to the investment return to the employee benefit plan investor.
Instruments• Deposits & cash equivalents: Cash management strategies that incorporate intent toward positive impact.
• Private debt: Bonds or loans placed to a select group of investors rather than being syndicated broadly.
• Public debt: Publicly traded bonds or loans.
• Equity-like debt: An instrument between debt and equity, such as mezzanine capital or deeply subordinated debt. Often a debt instrument with potential profit participation. E.g. convertible debt, warrant, royalty, debt with equity kicker.
• Private equity: A private investment into a company or fund in the form of an equity stake (not publicly traded stock).
• Public equity: Publicly traded stocks or shares.
• Real assets: An investment of physical or tangible assets as opposed to financial capital, e.g. real estate, commodities.
• Pay-for-performance instruments (e.g., social impact bonds): A form of outcomes-based contract in which public sector commissioners commit to pay for significant improvement in social outcomes for a defined population. Private investment is used to pay for interventions, which are delivered by service providers. Financial returns to investors are made by the public sector on the basis of improved social outcomes.
56 G L O B A L I M P A C T I N V E S T I N G N E T W O R K
Stages of growth• Seed/Start-up: Business idea exists, but little has been established operationally; pre-revenues.
• Venture: Operations are established, and company may or may not be generating revenues, but does not yet have positive EBITDA.
• Growth: Company has positive EBITDA and is growing.
• Mature: Company has stabilized at scale and is operating profitably.
Contributors of risk• Country and currency risks: Risks which include political, regulatory, local economic or currency-linked risks.
• ESG risk: Risk derived from noncompliance with environmental, social, or governance criteria.
• Financing risk: Risk of the investee not being able to raise subsequent capital necessary to its growth.
• Impact risk: The possibility that the investment does not achieve the desired social or environmental benefits.
• Liquidity and exit risk: The risk of being unable to exit the investment at the desired time.
• Macroeconomic risk: Risk that includes regional or global economic trends.
Exit mechanisms• Strategic buyer: A buyer, usually another company in the same sector, whose reasons for purchasing stake include
potential for synergies with their existing company.
• Financial buyer: A buyer that is primarily interested in the potential for the company to generate a financial return.
• IPO: Initial public offering, or the first sale of stock by a private company to the public.
• Management buyback: Management or other executives purchase shares from the investor.

For more informationPlease contact Hannah Schiff at [email protected] with any comments or questions about this report.
To download industry research by the GIIN and others, please visit www.thegiin.org/knowledge-center.
DisclosuresThe Global Impact Investing Network (“GIIN”) is a nonprofit 501c(3) organization dedicated to increasing the scale and effectiveness of impact investing. The GIIN builds critical infrastructure and supports activities, education, and research that help accelerate the development of a coherent impact investing industry.
Readers should be aware that the GIIN has had and will continue to have relationships with many of the organizations identified in this report, through some of which the GIIN has received and will continue to receive financial and other support.
The GIIN has collected data for this report that it believes to be accurate and reliable, but the GIIN does not make any warranty, express or implied, regarding any information, including warranties as to the accuracy, validity or completeness of the information.
This material is not intended as an offer, solicitation, or recommendation for the purchase or sale of any financial instrument or security.

Global Impact Investing Network30 Broad Street38th FloorNew York, NY 10004 [email protected]