Embed Size (px)
Citation preview

Journal of Cultural Economics24: 181–204, 2000.© 2000Kluwer Academic Publishers. Printed in the Netherlands.
181
Contingent Valuation of a Cultural Public Good andPolicy Design: The Case of “Napoli Musei Aperti”?
WALTER SANTAGATAUniversity of Turin, Department of Economics, Via Po, 53, 10124 Torino, Italy
GIOVANNI SIGNORELLOUniversity of Catania, Department of “Scienze Economico-Agrarie ed Estimative”,Via Valdisavoia 5, 95123 Catania, Italy
Abstract. The aim of the paper is twofold: to report on the application of a contingent valuationsurvey to determine the value to the Naples population of maintaining “Napoli Musei Aperti”, acultural public good provided by the city of Naples, and to explore some alternative schemes ofcultural policy. The paper is divided in two parts. The first presents some results of the contingentvaluation study. The second discusses the use of the contingent valuation as a policy instrument inthe public cultural sector.
Key words: contingent valuation, public goods, cultural goods, logit spike model, and cultural policy
1. Introduction
Revealing individual preferences is a necessary condition for the optimal provisionof public goods (Green and Laffont, 1979; Starret, 1988), and of cultural publicgoods as well. Moreover, estimating the economic value for cultural public goodsprovides basic information as far as the regulatory policy issues of the culturalsector are concerned.
Assessing the use value and the passive-use values (existence, option and be-quest value), tacitly implied by the willingness to pay for cultural public goods,however, is a difficult exercise and requires non market techniques such as contin-gent valuation (CV) (Pommerehne, 1987; Mitchell and Carson, 1989; Hanemann,1994).
CV is a survey based approach, in which representative individuals are askedto report information about their maximum Willingness to Pay (WTP) to secure orto avoid the supposed change in the level of provision of the public good. Statedmonetary information is contingent upon the simulated circumstances created inthe survey.
Since the pioneering studies by Davis (1964) and Randall, Ives and Eastman(1974), an intensive research program has been devoted to the refinements in CV.As a result of this effort, CV has advanced and matured to such a point that it is
182 WALTER SANTAGATA AND GIOVANNI SIGNORELLO
now rapidly moving from being an esoteric and idiosyncratic economic instrumentto the status of a useful and necessary informative tool. That happens not onlyin the U.S.A., where the bulk of the empirical applications and methodologicalprogress has taken place, but also all over the world. CV is now authorized andrecommended by a growing number of national and international organizations andagencies, such as the World Bank, FAO, UNEP, and OECD; a recent bibliographyby Carson et al. (1995) lists over 2000 papers and studies from over 40 countries(either developed or developing) on different topics. The international diffusion ofCV, as well as the kind of valued goods and services, demonstrate its adaptability todifferent socio-economic context, and its high flexibility with respect to the objectof estimate (Navrud, 1995; Whittington, 1998).
As far as the economic evaluation of cultural public goods is concerned, to ourknowledge only a few empirical CV studies can be mentioned. Navrud et al. (1992)estimated value for visitors to the Nidaros Cathedral in Trondheim, Norway; Maggi(1994) quantified use value and non use values for three historic monuments inPiedmont, Italy, the Castello of Venaria Reale, the Certosa of Persio, and the SacroMonte of Varallo; Grosclaude and Soguel (1994) assessed values for selected localhistoric limestone buildings maintenance in Neuchâtel, Switzerland; Willis (1994)quantified the user value for the Durham Cathedral, England; Martin (1994) valuedthe “Musée de la civilisation” in Quebec; Hansen (1997) measured the total valueof The Royal Theatre in Copenhagen; Carson et al. (1997) valued the benefits tovisitors and non-visitors of preserving and improving conditions in Fez Medina(Morocco); Morey et al. (1997) estimated benefits of the reduction acid in injuriesto a discrete subset of outdoor marble monuments in Washington, D.C.; Scarpa etal. (1998) estimated access value to the Contemporary Art Museum of the Castellodi Rivoli (Turin); Whitehead, Chambers and Chambers (1998) investigated the pre-servation value of an historic building located in St. Genevieve, Missouri. Roche(1998) valued the benefit of the restoration of the Colon Theatre in Buenos Aires,Argentina. Frey (1997) provided a critical appraisal of CV in this area.
This paper presents some results of a CV study aimed at measuring the totalbenefits accruing to local residents from maintaining the provision ofNapoli MuseiAperti, a cultural public good provided in Naples. The present application com-bines and extends the previous CV studies carried out in the field in several ways.The distinctive features of our CV study are manifested in the ways we set up thescenario, analyzed the data set, and derived policy implications for the culturalsector.
Wherever possible, we try to place respondents in an incentive compatible situ-ation, and we attempt to adhere to many of the best established devices, such asNOAA panel guidelines (Arrow et al., 1993). Further, in the scenario we designeda particular sequence of valuation questions. Respondents are initially asked a gen-eral discrete choice question concerning whether or not they wish to donate somepositive payment (payment principle question); then, for those agreeing to donatesomething, a further single bounded discrete choice question is asked; finally, in-
THE CASE OF “NAPOLI MUSEI APERTI” 183
dividuals “in the market” are followed-up by an open-ended question to state theirmaximum WTP. This questioning strategy splits the sample into two categories:those who are indifferent and those who find that the program improves their wel-fare; moreover, it generates a mixed data set (discrete and continuous variables)and it allows comparison of WTP values obtained from single bounded discretechoice formats with those obtained from open-ended elicitation question. Singlebounded discrete choice data sets are analyzed parametrically by a conventionallogit model and spike logit model, and non-parametrically through the Turnbullestimator. An open-ended bid valuation function of the whole sample is estimatedby a Tobit censored regression model.
In this paper we pursue two main goals: to offer a reliable empirical contributionto the contingent valuation literature in the area of cultural goods, and to exploresome alternative schemes of cultural policy.
Our contingent valuation WTP estimates appear to have a reasonable size. Theeconometric analysis shows the usefulness of spike models when there is a largeproportion of corner solutions (zero bidders) in the sample; our findings also indic-ate that conventional logit analysis, based on the ignorance of the payment principleanswers, provides a good approximation to the more complete spike model.1
The rest of paper is organized as follows. Section 1 describes the good to be val-ued, the design and the administration of the survey. Section 2 present the data, theeconometric models and estimation of WTP figures. Section 3 explores policy andregulatory issues that could be designed and implemented through CV estimates.
2. Survey
2.1. THE GOOD TO BE VALUED: “ NAPOLI MUSEI APERTI”
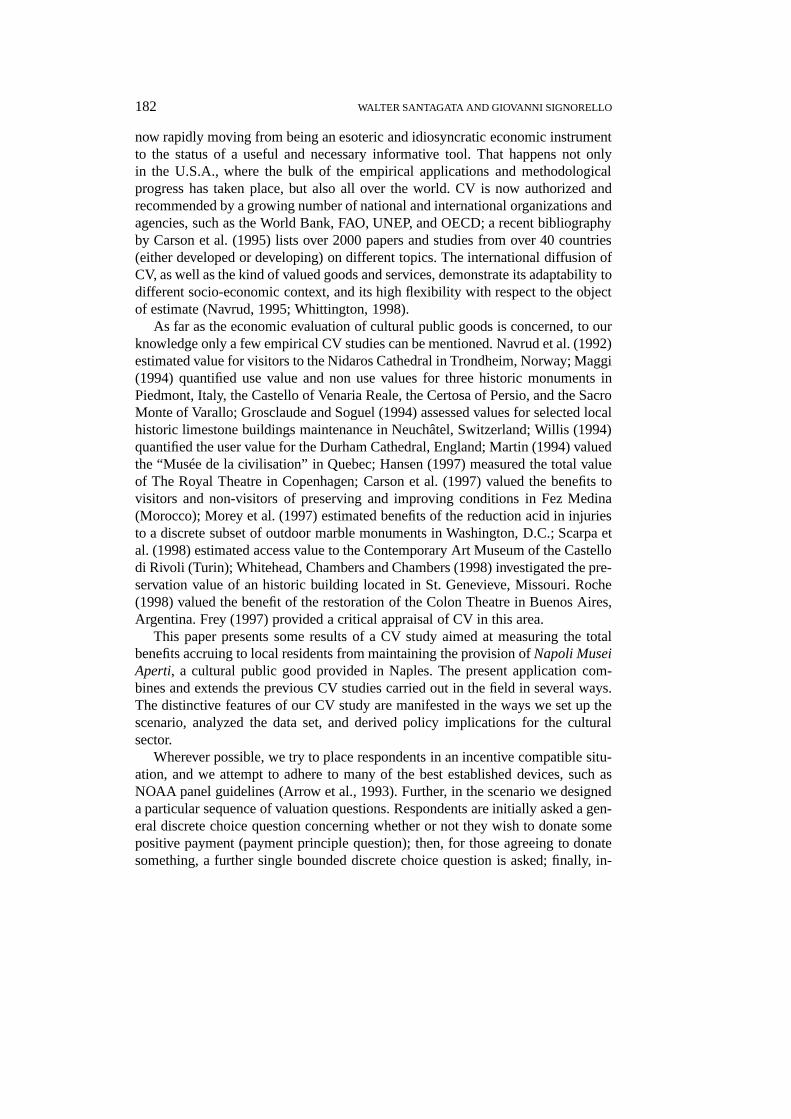
Napoli Musei Aperti(NMA) is a public cultural program provided by the city ofNaples, that has been conceived to make it possible to visit and enjoy important cul-tural, historic and artistic monuments and sites located in four central areas of thecity, namely in the historic Roman (“Decumano” and “Spaccanapoli”) and Spanishquarters. The cultural network includes 29 churches, eight aristocratic palaces,eight historical squares, and one museum. Until the program was started, thesepublic cultural goods were closed, not restored and not included in a recommendedguided tour.
In 1996 NMA was visited by about 814,000 people, both residents and tourists.At present the program is publicly provided by means of both local and nationalpublic funds. Its total cost is about 2.2 million ECU (4.3 billion lire) per year,which means 2.45 ECU (4,800 lire) per each resident above eighteen years old (theminimum age of an Italian voter).
NMA is a mixed public good, subject to congestion. The daily capacity of thegood is quite large – far more than the current annual total visitors – and in the pastcongestion has not been influential. Within this carrying capacity, we can describeit as a pure public good with zero marginal cost for additional users.

184 WALTER SANTAGATA AND GIOVANNI SIGNORELLO
2.2. THE DESIGN OF THE QUESTIONNAIRE
CV shares the same underlying logic of all economic (market and non-market)valuation methods: to measure the value of a good, the analyst has to observepeople’s choice. In particular, the analyst would observe both theobject of choiceand thecircumstancesof that choice, especially the consequences of such a choicein terms of substitution effects with other goods. When both the object of choiceand the related circumstances are defined, the decision made in favor of the objectimplies that its value is at least equal to what was foregone to obtain it. In a CVsurvey, the analyst records individual choices in a hypothetical setting. The objectof choice is represented by the change in the level of the provision of the publicgood to be valued, and the circumstances of the choice are the components of thevirtual scenario (Smith et al., 1997).
Although CV surveys often seem easy to non-practitioners, designing a CVquestionnaire with high content validity represents a very challenging task.
The key issues are the description of the good to be valued, the payment mech-anism, and the context for the valuation. Each component should be describedby satisfying both theoretical requirements and the need for the respondents tounderstand and believe the scenario to be plausible where they are asked to make ahypothetical transaction. The literature offers general warnings and guidelines fordesigning (and successively to administrating) a valid CV survey (Fischhoff andFurby, 1988; Arrow et al., 1993).
The development of the questionnaire used in our CV study involved a focusgroup, a pre-test, and a review of the proposed questionnaire by other researcherwith experience in the design of contingent valuation surveys. Another step ofquestionnaire development was the determination of the bid vector for use in thesingle bounded discrete choice elicitation format stage.2
The final questionnaire included four sections. In the first section we describedthe NMA program using an illustrated map, and the economic features of its pro-vision; then, we asked questions about past and recent visits to at least one of thecultural sites included in NMA network. In the second section, we asked people toreveal how many times they attend theatres, operas, ballets, concerts, museums andcinema. Given the average entrance prices for each item, the interviewer was ableto estimate and remind the respondent of his/her personal expenditures on culturalactivities in the last 12 months. We introduced this reminder to force the respond-ents in some way to consider the relevance of budget constraint prior to give anyvaluation answer. The budget reminder device provides at least two more sourcesof information. The first one describes, both in monetary terms and in consumptionunits, the individual consumption of a significant sub-sample of private and publiccultural services provided in Naples. This information was used in the analysis ofthe payment principle question and the valuation functions. The second source ofinformation deals with free riding and overriding behavior. Economic theory statesthat free riding is a serious problem when the size of the group is large and the
THE CASE OF “NAPOLI MUSEI APERTI” 185
good to be supplied is a public good. Both characteristics are present in the NMAprogram. To limit free riding two strategies could be addressed. The first one isthe adoption of the dichotomous choice (referendum) elicitation format. As Hoehnand Randall (1987) argued, the referendum format could be an incentive compat-ible mechanism. The second strategy consists in reminding people, just prior tothe willingness to pay announcement for NMA, of their expenditures on culturalgoods. It should be noted that the items of the cultural budget are a sub-set of thewhole budget for culture. What is of interest here is to remind people to make achoice between close substitutes. The idea behind this methodological approach isto define thresholds of reliability that could help in discriminating between truthfulrespondents and respondents who potentially override, freeride or easyride (Cornesand Sandler, 1987). Potentialoverridersare defined as respondents announcing amaximum willingness to pay greater than their yearly cultural expenditures. Po-tential easyridersare defined as respondents announcing a maximum willingnessto pay equal zero and yearly cultural expenditures greater than zero. Removingoverriders and easyriders from the valuation functions improves the fit of the es-timation model. Appendix III reports empirical evidence of this proposition. Thethird section of the questionnaire was designed to collect information on voluntarymonetary contribution to the continued provision of NMA program. We construc-ted the hypothetical scenario stating first the total andper capitacurrent publicexpenditure sustained by city government for the provision of the NMA program,and then the average individual fiscal contribution. Next, we asked each individualto imagine that the local authorities would not be able to fund the NMA programany more because they would be forced to invest all the money to support otherlocal social priorities. Then, we pointed out that the program could be still providedif each adult citizen offer a voluntary monetary contribution. We know from exper-imental economics that one of the most insidious traps of WTP revelation is theactual structure of the provision of a public good (Antoci and Sacco, 1997). Manypeople do not trust public administrators. In other words, even if people would liketo contribute voluntarily, they are prevented by the supposed inefficient behavioron the part of public bureaucrats. Many individuals think that the state will wastetheir money. Hence to reduce this negative tendency, we proposed a mechanismthat would enforce a reasonable confidence in the utilization of the total privatecontribution. In the questionnaire we stated:
− the total amount of voluntary contribution for NMA would be managed by anon-profit agency;
− every year the citizens would be informed on the way money has been spentand on the reached results;
− the individual monetary contribution would be collected each year only if itsamount would be sufficient to bear all the costs for supplying NMA Program,just as it is currently supplied by the Naples local authority. Otherwise, themoney would not be collected and the NMA program would be abandoned.
186 WALTER SANTAGATA AND GIOVANNI SIGNORELLO
So far, we have illustrated many essential components of the hypothetical scenario,namely: the source of the change (diversion of the public expenditures towardsother local priorities); the reference (NMA program abandoned) and the target level(NMA program at the current state) of the good; the payment vehicle (monetaryvoluntary contribution); the decision-making unit (each resident over 18 years);the timing of the payment (annual); the participants in the market (all residentsover 18 years); the budget reminder (individual representation of current culturalexpenditures); and the rule of the provision of the good (total contribution shouldcover total cost). A further essential element of the scenario is the valuation ques-tions. There are various ways to elicit WTP. In this survey, we adopted a multilevelquestioning strategy in which the single bound discrete choice question was chosenas the primary valuation question. In the first level, respondents were asked whetheror not they agreed to donate something to maintain the NMA. The aim of this so-called “payment principle question” was to validate refusals and reduce protestbehavior. Only yes answer respondents were included in the second level wherethey were asked a single bounded discrete choice valuation question. This format,introduced in a seminal article by Bishop and Heberlein (1978), now dominatesthe CV literature and it has been endorsed also by the NOAA panel. Its popular-ity among scholars stems from its inherent market resemblance. Single boundeddiscrete choice involves asking respondents whether they would be willing to pay(contribute) specific amount and the amount is varied at random across respond-ent. We used a vector formed by ten bid amounts [5, 7, 10, 15, 20, 25, 30, 50,75, 100 thousand Lire]. The bid range was chosen to cover what we perceived,through the open-ended pretest, to be the likely range of WTP. Each bid was ran-domly assigned with equal probability to each respondents. Given that the singlebounded discrete choice question format yields data that allows us to calculate onlysummary statistics (e.g., mean, median, and other quartiles) of the willingness topay, we introduced a third valuation question: the single bounded discrete choicequestion was followed up by an open-ended (or continuous valuation) question.Respondents who agreed to donate the given bid were asked to specify the max-imum amount they would be willing to donate to the special fund for the continuedprovision of NMA. Respondents who refused to pay the given bid were also askedto specify their maximum amount. In both cases, respondents were prompted togive answers consistent with the choice made in the previous single bounded dis-crete choice stage. In other words, if the answer to single bounded discrete choicewas “yes” the maximum WTP would not be lower than the posed bid.Vice versa,if the answer was “no” the maximum WTP must be lower than the assigned bid. Tosummarize, each individual was potentially asked to give three valuation responses:two discrete (yes or no) and one continuous (amount of contribution). For a sub-sample of respondents, this elicitation scheme generated a hierarchical data set, aswe have a multiple response nested within each individual response. For the wholesample, the possible paths of response were as follows (in parentheses is indicatedthe location of the continuous WTP):

THE CASE OF “NAPOLI MUSEI APERTI” 187
1. No (WTP= 0).2. Yes⇒ Yes+ continuous amount (WTP≥ bid).3. Yes⇒ No+ continuous amount (WTP< bid).
It is clear that this combination of WTP question provides more statistical inform-ation to the analyst. However, it has a drawback: the potential anchoring effect ofthe proposed bid to the open-ended bids. In the final section of the survey we askeda set of questions to identify the socio-economic profile of the respondent. A copyof the full questionnaire is available from the authors upon request. Appendix IIreports an excerpt of the valuation questions.
2.3. THE EXECUTION OF THE SURVEY
A direct survey was administered in autumn 1997. Five hundred individuals weredrawn from citizens, over 18, registered on the electoral roll.3
There was a 75 per cent response rate. The final usable sample was composed of468 citizens. The response rate for each question was consistently high except forthe questions on delicate issues such as occupation and net personal and householdincome.
3. Results
3.1. SAMPLE DESCRIPTION
Table A.I (Appendix I) gives a summary of some socio-economic characteristics ofthe sample which on average reveals a high knowledge of the NMA program anda wide fruition of sites included in the NMA program. With regards to the othervariables, our sample appears representative of general population over 18 years at0.05 level of sample error.
3.2. RESULTS FROM PAYMENT PRINCIPLE QUESTION
226 respondents (48%), out of 468, answered negatively to the payment principlequestion. This proportion of people who chose not to contribute is unexpectedlyhigh, considering the special features of NMA, which includes sites and monu-ments of great historical and symbolic importance for Naples. We explored why aso large number of respondents decided to stay “out of the market”. The primaryrecorded motive was genuine indifference towards the provision of NMA, anda secondary reason was the assignment of any eventual private contribution toother local social emergencies. Of course a well-known reason could have beenthe strategic behavior to free ride. The proportion of protest reasons, such as thatgovernment should provide for the provision out of taxes already paid, was not sub-stantial. Dealing with protest zero bidders is a critical issue. We used the strategy ofconsidering them as real zero bids. This results in conservative estimates of the pub-lic’s WTP. The payment principle question splits respondents in two sub-samples,

188 WALTER SANTAGATA AND GIOVANNI SIGNORELLO
Table I. Probit model for the payment principle question
Maximum likelihood estimates
Log-likelihood –276.5
Restricted (slopes= 0) log-l. –324.1
Chi-squared (12) 95.2
Significance level 0.1E-06
Variable Coeff. t-ratio
Constant –1.05 –2.6
EXPEND 0.19E-05 3.0
KNOW 0.92 5.0
NUMVISIT 0.31E-01 1.3
AGE –0.55E-02 –1.4
SEX 0.11 0.9
EDUC 0.78E-02 0.5
HOUSEHOLD 0.12E-01 0.4
Q1 0.87E-01 0.3
Q2 0.42 1.4
Q3 0.32 0.8
Q4 0.32 1.0
Q5 –0.63E-01 –0.2
Note:Q1, Q2, Q3, Q4, and Q5 are the dummy variables for the sixdistricts.
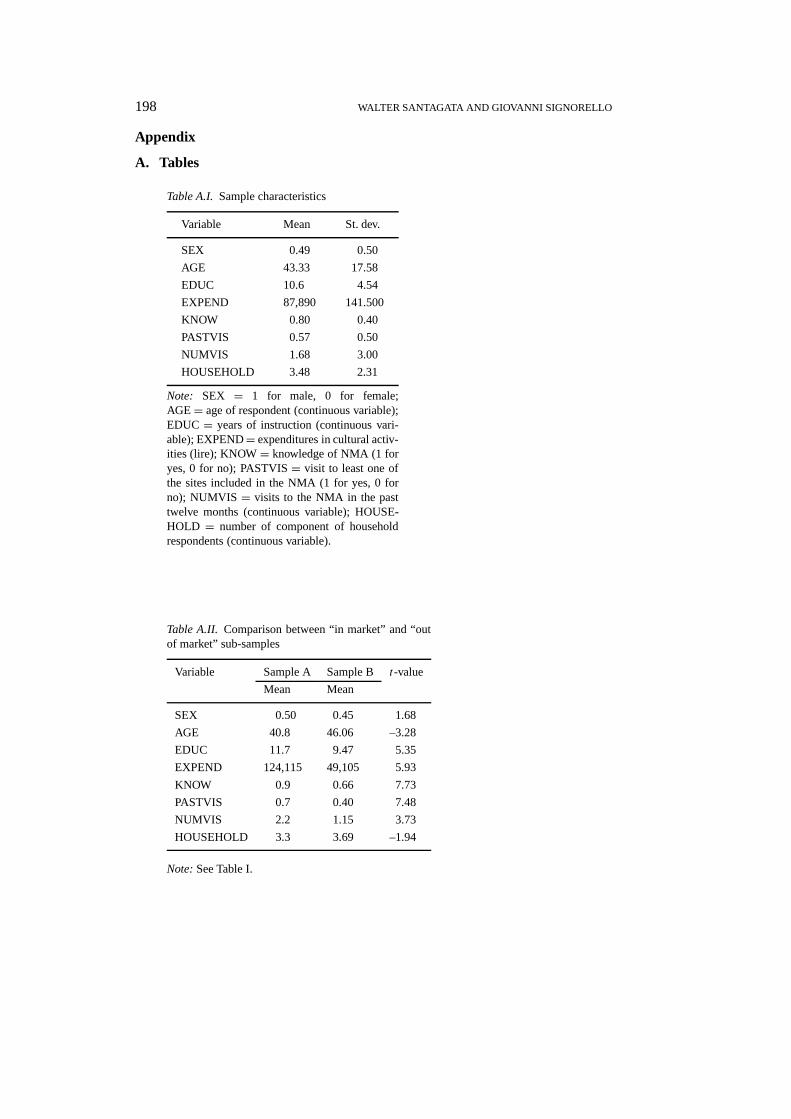
A and B. Sample A includes the proportionp = 0.52 of respondents willing todonate something for NMA; sample B includes the proportion(1 − p) = 0.48of respondents not willing to donate anything for NMA. Table A.II (Appendix I)compares the characteristics of both sub-samples. Thet-values shows statisticaldifference at 5 per cent level of significance between the two samples with respectto all considered variables, except to household size.
The joint impact of the above variables was analyzed by modelling the discreteyes/no response to the payment principle question using a probit regression. Toaccount for the influence of districts where respondents live, we included in thequalitative regression model five dummy variables, as we divided the city of Naplesin six homogeneous districts. Table I shows the estimation results of the “macro”decision of respondents: whether to be or not be in the market for NMA. Themodel predicts the actual outcome in about 66 per cent of all cases. Moreover,among the explanatory variables, only the coefficients of EXPEND and KNOW aresignificantly different from zero. The sign of the estimated coefficients is positivefor all variables except AGE and Q1.

THE CASE OF “NAPOLI MUSEI APERTI” 189
Table II. Proportions of yes answers and Ayer et al. estimates of yes proportion
Bid (It. lire) Whole sample Sample A
# resp. # yes % yes e.s.f. # resp. # yes % yes e.s.f.
5000 56 29 52 0.54 30 29 97 0.97
7000 46 24 52 0.54 26 24 92 0.96
10000 40 18 45 0.54 18 18 100 0.96
15000 44 30 68 0.54 31 30 97 0.96
20000 43 20 47 0.47 26 20 77 0.77
25000 41 13 32 0.32 17 13 76 0.77
30000 49 11 22 0.24 23 11 48 0.54
50000 54 14 26 0.24 23 14 61 0.54
75000 46 8 17 0.23 22 8 36 0.45
100000 46 14 29 0.23 26 14 54 0.45
Total 468 181 242 181
3.3. WTP ESTIMATION FROM SINGLEBOUNDED DISCRETE CHOICE
VALUATION QUESTION
As explained above, respondents who agreed to contribute for the continued exist-ence of NMA were asked a further question on whether they would be willing todonate a specific annual amount (bid) drawn at random from the vector specifiedin the previous section of the paper. Table II reports the basic data set derivedfrom the single bounded discrete choice valuation question for the whole sample.Table II incorporates non-participants (zero bidders); this allows us to compareboth a conventional analysis based on the ignorance of mass probability at zero inthe WTP distribution, and a spike-based analysis. For each bid, Table II displays thenumber of respondents facing that bid, the number of yes responses, the proportionof yes responses and the empirical survival function (e.s.f) of yes answers estim-ated using the pooled adjacent violators algorithm (PAVA) described in Kriström(1990).4 Table II also reports data for the nonzero bidders (sub-sample A).
The discrete choice data set of Table II was analyzed using (i) a conventionallogit regression model based on the ignorance of the zero bidders, (ii) a spike logitmodel which employs all information coming from the two discrete choice valu-ation questions, and (iii) a spike Turnbull estimator (Signorello, 1988; Haab andMcConnell, 1997; Turnbull, 1976). The spike is the probability that WTP is equalto zero. The logit model (either conventional or spike-based) is parametric as it isbased on the assumption that in the population the latent true variable WTP followsa logistic distribution. The Turnbull estimator is a non-parametric approach. Toallow comparison among the different techniques, we adopted a simple univari-

190 WALTER SANTAGATA AND GIOVANNI SIGNORELLO
Table III. Estimated logit models
Variable Whole sample Spike Sub-sample A
Constant 0.64659E-01 (0.45) 0.4281E-01 ( 0.5) 2.1703 (8.3)
Bid –0.16342E-04 (–4.6) –0.16778E-04 (–8.9) –0.2814E-04 (–5.7)
Log-likelihood –300.467 –433.413 –118.538
N 468 468 242
Note:Asymptotict-value in parentheses.
ate linear logit model which, according the random maximizing utility framework(Hanemann, 1984), is given by:
Prob(yes|Bid = Prob(Bid ≤WTP) = Fη(1V ) = 1−GWTP(Bid) == [1+ exp−(α − βBid)]−1 ,
(1)
whereFη is the c.d.f. of the random errorη = ε0 − ε1, 1V = V (1, Y − Bid) −V (0, Y ) is the difference in indirect utility function (1 represents the NMA and 0represents the state of nature without NMA),GWTP(Bid) is the c.d.f. of the randomvariable WTP,α andβ are the coefficients to be estimated. In terms of Hicksianwelfare measures, the WTP corresponds to the equivalent surplus. The estimatedsurvival function(1−GWTP(Bid)) can be interpreted as an aggregate demand curvefor discrete commodity. The log-likelihood function of spike logit model is shownin Kriström (1997).
The results of the maximum likelihood estimation of conventional logit modeland spike logit model are presented in Table III, which also shows the estimated lo-git equation for the sub-sample A, which includes only respondents who answeredthey were willing to contribute some positive amount prior to answering the singlebounded discrete choice question.
In all three cases estimated coefficients have the expected signs and are signi-ficantly different from zero. As expected, the spike model is more efficient thanconventional logit model. The spike, calculated as[1+ exp(α)]−1 is equal to 0.49which is very close to the actual proportion of people who declined to donateanything for the provision of NMA.
From the estimated logit equations, we calculated the expected value of themean WTP, E(WTP), using the formula
ln[1+ exp(α)]/β (2)
developed by Hanemann (1984) for a WTP distribution truncated at zero in theleft side. When coefficients come from the sub-sample A, the overall mean (wholesample) is estimated by multiplying the partial mean (based only on sub-sample A)by the proportion of the population willing to donate something(p = 0.52).
THE CASE OF “NAPOLI MUSEI APERTI” 191
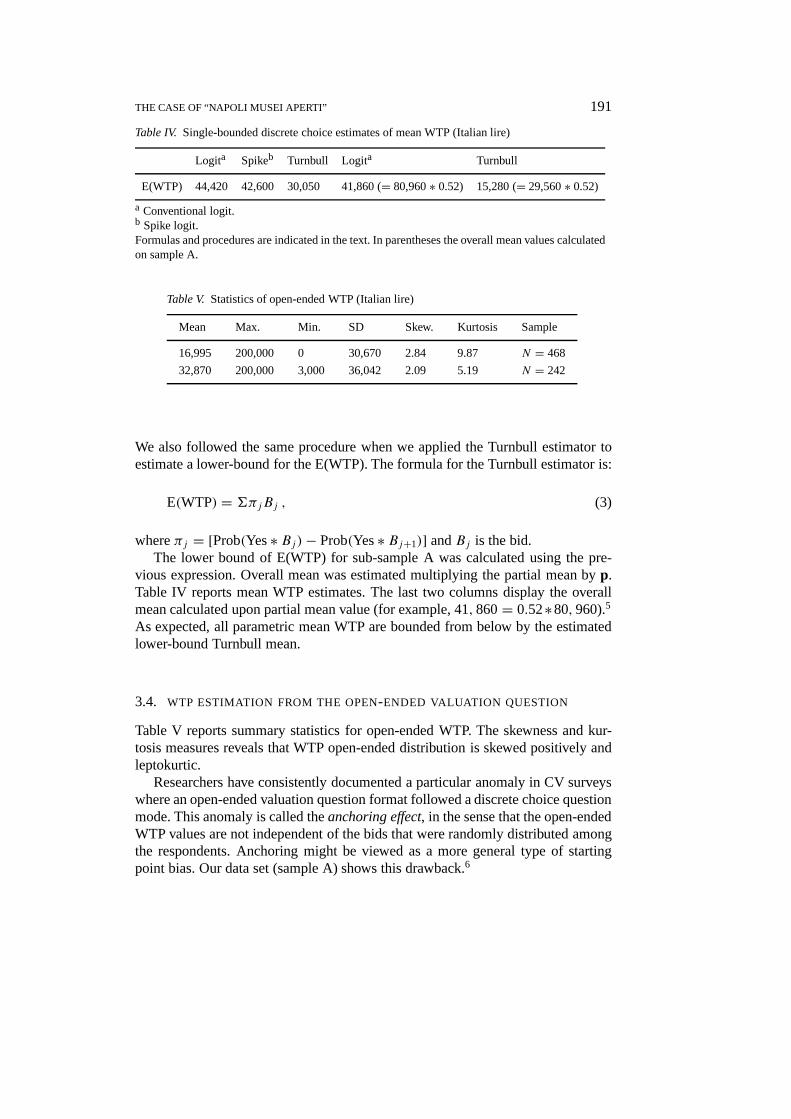
Table IV. Single-bounded discrete choice estimates of mean WTP (Italian lire)
Logita Spikeb Turnbull Logita Turnbull
E(WTP) 44,420 42,600 30,050 41,860 (= 80,960∗ 0.52) 15,280 (= 29,560∗ 0.52)
a Conventional logit.b Spike logit.Formulas and procedures are indicated in the text. In parentheses the overall mean values calculatedon sample A.
Table V. Statistics of open-ended WTP (Italian lire)
Mean Max. Min. SD Skew. Kurtosis Sample
16,995 200,000 0 30,670 2.84 9.87 N = 468
32,870 200,000 3,000 36,042 2.09 5.19 N = 242
We also followed the same procedure when we applied the Turnbull estimator toestimate a lower-bound for the E(WTP). The formula for the Turnbull estimator is:
E(WTP) = 6πjBj , (3)
whereπj = [Prob(Yes∗ Bj)− Prob(Yes∗ Bj+1)] andBj is the bid.The lower bound of E(WTP) for sub-sample A was calculated using the pre-
vious expression. Overall mean was estimated multiplying the partial mean byp.Table IV reports mean WTP estimates. The last two columns display the overallmean calculated upon partial mean value (for example, 41,860= 0.52∗80,960).5
As expected, all parametric mean WTP are bounded from below by the estimatedlower-bound Turnbull mean.
3.4. WTP ESTIMATION FROM THE OPEN-ENDED VALUATION QUESTION
Table V reports summary statistics for open-ended WTP. The skewness and kur-tosis measures reveals that WTP open-ended distribution is skewed positively andleptokurtic.
Researchers have consistently documented a particular anomaly in CV surveyswhere an open-ended valuation question format followed a discrete choice questionmode. This anomaly is called theanchoring effect, in the sense that the open-endedWTP values are not independent of the bids that were randomly distributed amongthe respondents. Anchoring might be viewed as a more general type of startingpoint bias. Our data set (sample A) shows this drawback.6

192 WALTER SANTAGATA AND GIOVANNI SIGNORELLO
3.5. COMPARISON OF WTP FROM SINGLE-BOUNDED AND OPEN-ENDED DATA
As expected, the open-ended mean WTP value is lower than the single boundeddiscrete choice mean. In the literature there are many explanations for this disparity.The argument of strategic bias is unlikely to apply to our case because we ask abouta donation payment vehicle. With donations, the incentive for understatement ofthe true WTP should be modest. One of the possible explanations is that answeringan open-ended question is a more difficult task as quantitative information is re-quired. When cognitive difficulty and preference uncertainty are present, it is morelikely that the respondent will give lower values.
On the other hand, discrete choice data generally seem to be affected by a certaindegree of yea-saying. Such phenomenon (i.e., yes answers were given independ-ently of the bid) bias discrete choice estimates of mean WTP upward. Our datawere found to be affected by such compliance bias.7
3.6. VALUATION FUNCTIONS
It is common practice in CV studies to estimate a valuation function, i.e., a functionthat relates discrete choice or WTP to variables that are supposed to have an influ-ence on the choice or on the stated WTP amount. This explorative estimation canserve two purposes. Firstly, it allows us to perform a test of construct (theoretical)validity by determining whether choices or WTP amount are significantly relatedto covariates suggested by the theory. Secondly, it could be used for transferringthe sample results to populations different from the one from which the sample isdrawn, and for taking into account non-respondents of the CV survey provided thatwe know their characteristics.
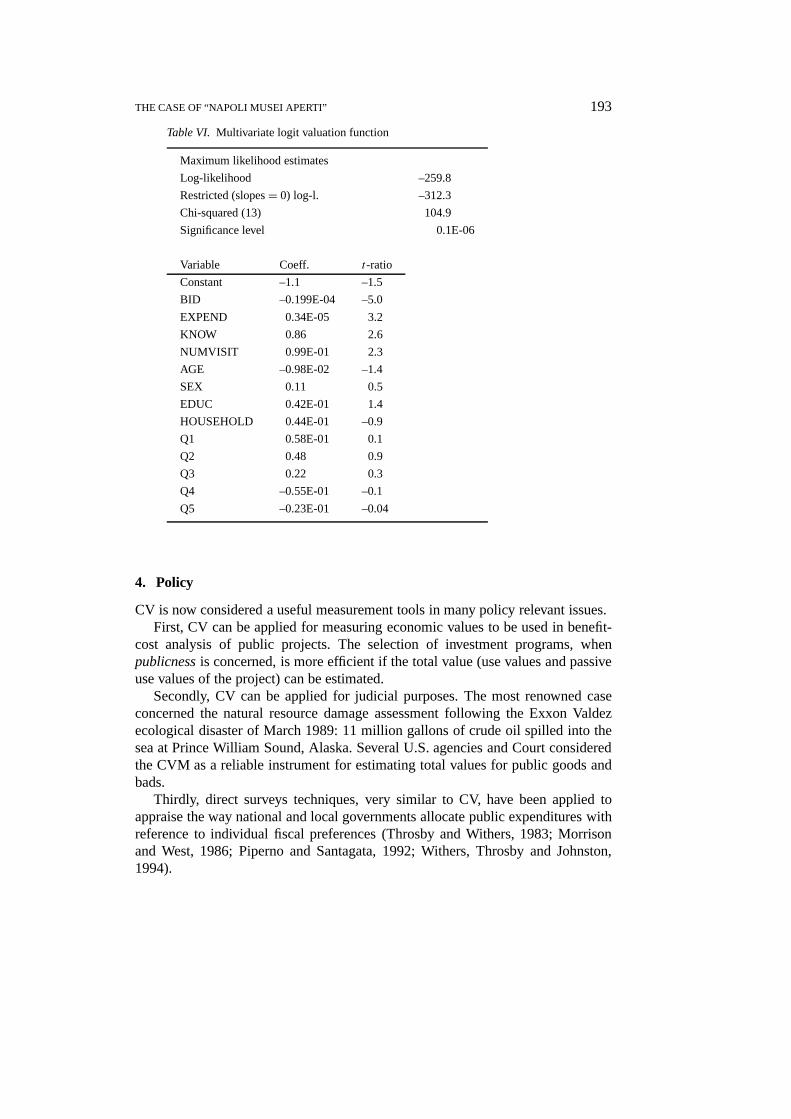
The multivariate logit equation is shown in Table VI. The coefficients on thebid amount BID, expenditure in cultural activities EXPEND, previous knowledgeof the NMA program KNOW and the number of past visit to the sites NUMVISITwere statistically significant at the one per cent level and of the expected signs. Thatmeans that individuals having general and motivated interest in cultural activitiesand recreation are more likely to contribute towards the continued provision ofNMA program. The age of respondent and the size of her household influencednegatively the attitude towards the contribution for the supply of public culturalgoods. The estimated equation shown a relatively high percentage (82.2%) of rightpredictions.
The open-ended valuation function is reported in Table VII. The multivariatelinear equations were estimated using a Tobit regression model as data were cen-sored at zero (Greene, 1987). Tobit models confirmed the signs and significancealready observed in the logit function. Thus, the WTP was higher for individualswho consume and dedicate part of their income and time to cultural activities.The variable AGE presents a negative significant coefficient revealing that olderrespondents were willing to donate less than younger respondents. Almost all othervariables were positively related to WTP.
THE CASE OF “NAPOLI MUSEI APERTI” 193
Table VI. Multivariate logit valuation function
Maximum likelihood estimates
Log-likelihood –259.8
Restricted (slopes= 0) log-l. –312.3
Chi-squared (13) 104.9
Significance level 0.1E-06
Variable Coeff. t-ratio
Constant –1.1 –1.5
BID –0.199E-04 –5.0
EXPEND 0.34E-05 3.2
KNOW 0.86 2.6
NUMVISIT 0.99E-01 2.3
AGE –0.98E-02 –1.4
SEX 0.11 0.5
EDUC 0.42E-01 1.4
HOUSEHOLD 0.44E-01 –0.9
Q1 0.58E-01 0.1
Q2 0.48 0.9
Q3 0.22 0.3
Q4 –0.55E-01 –0.1
Q5 –0.23E-01 –0.04
4. Policy
CV is now considered a useful measurement tools in many policy relevant issues.First, CV can be applied for measuring economic values to be used in benefit-
cost analysis of public projects. The selection of investment programs, whenpublicnessis concerned, is more efficient if the total value (use values and passiveuse values of the project) can be estimated.
Secondly, CV can be applied for judicial purposes. The most renowned caseconcerned the natural resource damage assessment following the Exxon Valdezecological disaster of March 1989: 11 million gallons of crude oil spilled into thesea at Prince William Sound, Alaska. Several U.S. agencies and Court consideredthe CVM as a reliable instrument for estimating total values for public goods andbads.
Thirdly, direct surveys techniques, very similar to CV, have been applied toappraise the way national and local governments allocate public expenditures withreference to individual fiscal preferences (Throsby and Withers, 1983; Morrisonand West, 1986; Piperno and Santagata, 1992; Withers, Throsby and Johnston,1994).

194 WALTER SANTAGATA AND GIOVANNI SIGNORELLO
Table VII. Multivariate tobit valuation function
CENSORED regression
Maximum likelihood estimates
Log-likelihood –3065.42
Threshold values for the model:
Lower= 0.0000 Upper= +Infinity
Variable Coeff. t-ratio
Constant –34,127 –2.108
EXPEND 0.57E-01 –3.219
KNOW 29,546 3.904
NUMVISIT 2,560 3.184
AGE –316.84 –2.105
SEX 531.25 0.110
EDUC 246.56 0.386
HOUSEHOLD 94.058 0.083
Q1 6,993 0.552
Q2 14,858 1.212
Q3 16,790 1.109
Q4 12,235 1.003
Q5 –2,923 –0.237
F 44,947
A further case for the CV as a policy instrument concerning the private supplyof public goods (Weisbrod, 1988; Andreoni, 1988) is developed in this paper.Given a standard consumer utility function for a public goodQ and a privatecomposite goodX, the Samuelsonian optimal condition for the efficient supplyof Q requires that the sum of individual marginal willingness to pay,6wi , equalsthe marginal cost of producing the public good. When the public good is discrete,like in the present study, total (aggregate) WTP must be equal or greater than thetotal (aggregate) cost,C, of the public good so that:6wi ≥ C.
In both cases, the failure of the market mechanism due to free riding behaviorhas been stressed, giving rise for a long time to a full rationale for the publicprovision of public goods (Throsby and Withers, 1986). Nevertheless, followingthe development of the literature on incentive compatible mechanisms (Green andLaffont, 1979), the accumulation of empirical evidence from experimental eco-nomics (Ledyard, 1995) and following also the improvements in survey design andin CV empirical implementation for controlling and limiting strategic behavior, the

THE CASE OF “NAPOLI MUSEI APERTI” 195
Table VIII. Open-ended willingness to pay
Citizens (%) Users (%) Non users (%)
WTP= 0 48.3 34.1 67.2
WTP> cost per capita 51.5 65.9 32.8
Average WTP (lire) 16,995 23,797 7,960
N. obs. 468 267 201
revelation of true fiscal preferences may be measured and the private supply ofpublic goods becomes feasible.
Nevertheless, as far as a cultural good likeNapoli Musei Apertiis concerned,the more serious problem seems to be individual overvaluation, rather a free ridingbehavior with undervaluation. This is because cultural activities are a good chargedwith positive value and the voluntary contribution is supplied in an hypotheticalsetting. In the following analysis we use WTP data from open-ended questions.As we already mentioned in the previous section, this source of the WTP couldunderestimate the true WTP, either for cognitive burden reasons or for anchoringbias. Nevertheless using open-ended WTP is the only way to work with individualdata.
4.1. MECHANISMS REGULATING THE PROVISION OF A CULTURAL PUBLIC
GOOD
As far as a cultural public good, likeNapoli Musei Aperti, is concerned, weconsider four stylised rules of supply.
Market. The cultural good is provided through private mechanisms. NMA islike a pure public good when consumed from the outside; but a mixed publicgood when users are visiting churches and palaces. Exclusion is possible. Ticket oradmission fee for personal consumption can be charged. The entrepreneur aims atprofit maximization.
State.The good is provided by public institutions and funding is achievedthrough direct taxation. Admittance to the good may be free or subject to anadmission fee, whose total amount is less than the total cost.
Non-profit.Provision is granted by patrons, foundations, and, less properly, bysponsors. Admission may be free and/or a fee can be charged.
Collective Ethic Cooperation.The good is provided through voluntary contri-butions. The admission is free.
Results from the CV study of NMA allow us to compare three of the abovesystems of regulation (information about the “non-profit institutions” scheme arenot available) and to reiterate an interesting finding by Willis (1994) concerningthe willingness to pay for the Durham Cathedral.
196 WALTER SANTAGATA AND GIOVANNI SIGNORELLO
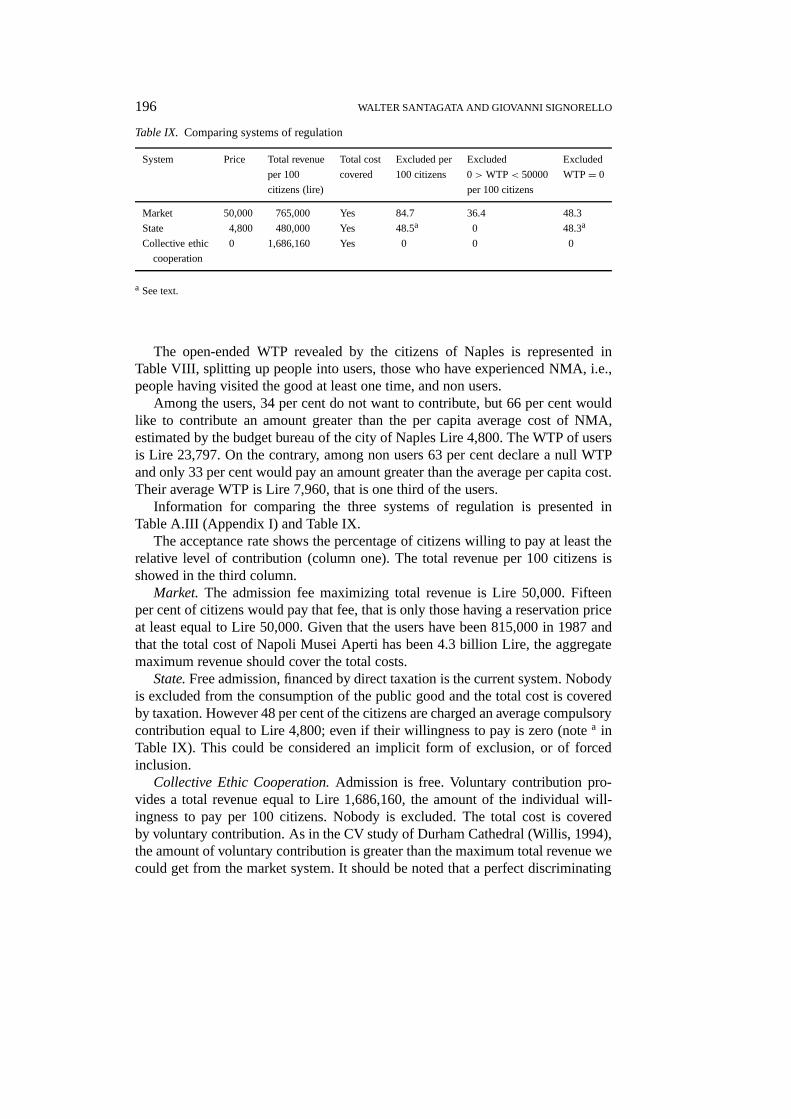
Table IX. Comparing systems of regulation
System Price Total revenue Total cost Excluded per Excluded Excluded
per 100 covered 100 citizens 0> WTP< 50000 WTP= 0
citizens (lire) per 100 citizens
Market 50,000 765,000 Yes 84.7 36.4 48.3
State 4,800 480,000 Yes 48.5a 0 48.3a
Collective ethic 0 1,686,160 Yes 0 0 0
cooperation
a See text.
The open-ended WTP revealed by the citizens of Naples is represented inTable VIII, splitting up people into users, those who have experienced NMA, i.e.,people having visited the good at least one time, and non users.
Among the users, 34 per cent do not want to contribute, but 66 per cent wouldlike to contribute an amount greater than the per capita average cost of NMA,estimated by the budget bureau of the city of Naples Lire 4,800. The WTP of usersis Lire 23,797. On the contrary, among non users 63 per cent declare a null WTPand only 33 per cent would pay an amount greater than the average per capita cost.Their average WTP is Lire 7,960, that is one third of the users.
Information for comparing the three systems of regulation is presented inTable A.III (Appendix I) and Table IX.
The acceptance rate shows the percentage of citizens willing to pay at least therelative level of contribution (column one). The total revenue per 100 citizens isshowed in the third column.
Market. The admission fee maximizing total revenue is Lire 50,000. Fifteenper cent of citizens would pay that fee, that is only those having a reservation priceat least equal to Lire 50,000. Given that the users have been 815,000 in 1987 andthat the total cost of Napoli Musei Aperti has been 4.3 billion Lire, the aggregatemaximum revenue should cover the total costs.
State.Free admission, financed by direct taxation is the current system. Nobodyis excluded from the consumption of the public good and the total cost is coveredby taxation. However 48 per cent of the citizens are charged an average compulsorycontribution equal to Lire 4,800; even if their willingness to pay is zero (notea inTable IX). This could be considered an implicit form of exclusion, or of forcedinclusion.
Collective Ethic Cooperation.Admission is free. Voluntary contribution pro-vides a total revenue equal to Lire 1,686,160, the amount of the individual will-ingness to pay per 100 citizens. Nobody is excluded. The total cost is coveredby voluntary contribution. As in the CV study of Durham Cathedral (Willis, 1994),the amount of voluntary contribution is greater than the maximum total revenue wecould get from the market system. It should be noted that a perfect discriminating

THE CASE OF “NAPOLI MUSEI APERTI” 197
and omniscient monopolist could get the same outcomes. The difference is that themonopolist would obtain this result by excluding those who reveal a zero WTP.
The system based on theCollective Ethic Cooperationseems to be superiorfrom several points of view:
• free admission does not compel anyone to contribute, either through taxationor fees;
• in relative terms, the total revenue is maximum (the whole consumer surpluswould be collected);
• the total cost of provision is covered;• nobody is excluded, either explicitly or implicitly, from the consumption of
the good;• through the voluntary contribution scheme, it is possible to collect money
from all components of the total value: use value and passive use values;• given that to declare a WTP equal zero is simply an economic evaluation it is
possible that free entry provides a positive incentive to further consumptionof cultural goods.
5. Conclusion
This paper aimed at testing the feasibility of the Contingent Valuation methodto assess the individual preferences for maintainingNapoli Musei Aperti, a localcultural public good, and to explore some alternative schemes of cultural policy.
The budget reminder device introduced into the questionnaire increased the reli-abiliy of the Contingent Valuation method. The estimates of the willingness to pay,obtained by using parametric and non-parametric techniques, appeared to have areasonable size both in the single-bounded discrete choice format and open-endedformat.
The “Collective Ethic Cooperation”, a system of provision based on individualvoluntary contributions for a public good, appears to be superior to other systemsof regulation.
198 WALTER SANTAGATA AND GIOVANNI SIGNORELLO
Appendix
A. Tables
Table A.I. Sample characteristics
Variable Mean St. dev.
SEX 0.49 0.50
AGE 43.33 17.58
EDUC 10.6 4.54
EXPEND 87,890 141.500
KNOW 0.80 0.40
PASTVIS 0.57 0.50
NUMVIS 1.68 3.00
HOUSEHOLD 3.48 2.31
Note: SEX = 1 for male, 0 for female;AGE= age of respondent (continuous variable);EDUC = years of instruction (continuous vari-able); EXPEND= expenditures in cultural activ-ities (lire); KNOW= knowledge of NMA (1 foryes, 0 for no); PASTVIS= visit to least one ofthe sites included in the NMA (1 for yes, 0 forno); NUMVIS = visits to the NMA in the pasttwelve months (continuous variable); HOUSE-HOLD = number of component of householdrespondents (continuous variable).
Table A.II. Comparison between “in market” and “outof market” sub-samples
Variable Sample A Sample B t-value
Mean Mean
SEX 0.50 0.45 1.68
AGE 40.8 46.06 –3.28
EDUC 11.7 9.47 5.35
EXPEND 124,115 49,105 5.93
KNOW 0.9 0.66 7.73
PASTVIS 0.7 0.40 7.48
NUMVIS 2.2 1.15 3.73
HOUSEHOLD 3.3 3.69 –1.94
Note:See Table I.

THE CASE OF “NAPOLI MUSEI APERTI” 199
Table A.III. Open-ended willingness to pay and total rev-enue
WTP (lire) Acceptance rate Total revenue
per 100 citizens (lire)
0 100 0
3000 51,7 155100
4800 51,5 247200
5000 51,3 256500
7000 45,1 315700
10000 42,7 427000
12000 32,3 387600
15000 31,8 477000
20000 25,6 512000
25000 20,9 522500
30000 18,3 549000
50000 15,3 765000 max
60000 7,8 468000
70000 7,6 532000
75000 6,7 502500
100000 6,1 610000
150000 1,0 150000
200000 0,6 120000
B. The Willingness to Pay Questions
“To face social emergencies that hit the city, the Naples local authority coulddecidenot to fund the NMA Program anymore. Let’s imagine that, as it hap-pens in other Italian cities of art, every citizen could supplya personal voluntarycontribution substituting current public funds provided by the collection of localtaxes.
− Would you like to offer a yearly voluntary monetary contribution in order topreserve the NMA Program? (yes/no).
− If yes, given that your expenditure in culture is estimated at Lire.. . . . . . , andassuming that it will be unchanged for the next year, would you like to offeryearly Lire.. . . . . . (one bid randomly selected from a bid vector)?
− In any case would you like to tell us which is your maximum wtp? Lire.. . . . . .”

200 WALTER SANTAGATA AND GIOVANNI SIGNORELLO
C. The Potential Easyrider and Overrider Respondents
In Section 1 of the paper we discussed a useful approach to investigate strategicbehavior by respondents in CVM surveys. Empirical analysis of our CVM data (seeTable C.I) reveals that potential easyriders are 127: they usually visit museums,visitNMA, and have a cultural expenditure above the sample mean. Their willingnessto pay is zero. Potential overriders are 68: their cultural expenditure is about 1/10of the sample mean, they state an open maximum willingness to pay greater thanthe sample mean (+142%).
Table A.III. Easyriding, overriding, freeriding
Behavior Obs. Max WTP Cultural No. of visits No. of visits
(open-ended format) expenditures (lire) to museums to NMA
(lire)
Easyriding 127 0 9,441 2.4 1.8
Overriding 68 41,132 9,235 2.1 1.2
Sub-sample C
(total – (easy + over) 273 18,871 106,300 3.6 1.8
Total sample 468 16,995 87,893 3.1 1.7
Taking easyriders and overriders aside from the whole sample we obtain a fur-ther sub-sample(N = 273) which is called C. Table C.II displays the maximumlikelihood estimation of univariate linear logit model based on this sub-sample Cand, for direct comparison purposes, also estimates of the same logit model basedon data coming from the whole sample.
As expected, sub-sample C provides an improvement in the statistical signifi-cance of coefficients, and in the general fitness of the econometeric logit model. Asit concerns the expected WTP, E(WTP), its value is now equal to Lire 138740, overthree times bigger than same parametric estimate calculated on the whole sample(Lire 44420, see Table VII in the text). The mean WTP value for sub-sample Ccould be identified as the upper limit of parametric benefit assessment.
Table A.III. Estimated logit models
Variable Whole sample Sub-sample C
Constant 0.65E-01 (0.45) 0.15 (3.2)
Bid –0.16342E-04 (–4.6) –0.5576E-04 (–4.7)
Log-likelihood –300.47 –174.43
N 468 273
Note:Asymtotic t-value in parentheses.
THE CASE OF “NAPOLI MUSEI APERTI” 201
Notes
? An earlier version of this paper was presented at the 10th International Conference on CulturalEconomics in Barcelona, Spain, 1998. The authors are grateful to Ruth Towse, Marco Causi,David Throsby and two anonymous referees for their helpful comments. The authors are alsograteful to Stefano Andreoli, Rinaldo Brau, Anna Maria Candela, Valeria De Magistris, PierLuigi Sacco, Michele Trimarchi, and Alberto Zanardi for their useful advice and assistanceduring the various phases of the research. Support for this project was provided by Researchgrant no. 96.03902.Ps.15 from Consiglio Nazionale delle Ricerche.
1. That is true either when the estimation involves the truncation at zero of the distribution of WTPfunction, or when the analysis is preliminarily conducted on data set coming from a sub-samplewith nonzero WTP. Findings also support the relative strength and flexibility of the Turnbullestimator in incorporating zero bidders. In relation to the effect of question formats on values,we obtained, as have others, a significant difference between discrete and continuous WTPestimates, with discrete format yielding a WTP larger than the open-ended format. However,we found that respondents to the follow up open-ended question considered the bid used in theearly discrete choice format as an implied value cue.
2. To acquire necessary information about bid range, we conducted a pilot test during June 1997. Asample of 52 individuals was randomly selected from the Telephone Directory and in such a wayas to represent all city districts. The WTP was elicited by an open-ended format. This pilot testserved also to further refine the wording of the questionnaire and to familiarize the interviewerswith the material and other practical difficulties prior to the full scale survey.
3. The selection was conducted using a systematic rule, and a quota design to ensure sex and dis-tricts balance among the respondents. Another sample, of the same size and selected accordingthe same criteria, was utilized as a substitute to replace individuals we never reached. To eachindividual we sent by mail a single-page letter on The University of Turin letterhead paper. Eachletter was addressed to the individual and personally signed by the project director.
4. PAVA works as follows. Order the bids from the lowest to the highest, and then calculate theproportions of yes answers. If the sequence of these proportions is non-increasing in bid, then theobserved proportion is an estimate of probability of yes answers. If the sequence is not monotonenon-increasing in some points, the violators are removed by averaging adjacent proportions. Thissmoothing procedure is repeated until the sequence of frequency assumes the requested featureto be considered as estimate of probability.
5. It is interesting to note that the conventional logit with truncation of the distribution at zeroprovides a good approximation to the spike logit model. Moreover, there is no appreciabledifference in the mean WTP values if the econometric analysis of conventional logit modelis preliminarily carried out on the data from those respondents willing to pay something.
6. We found that for the respondents who met the lowest bids, the mean values were lower than theoverall mean value; the opposite event happened for the high bid. The presence of anchoring wastested by regressing the open-ended WTP on the bid used in previous stage of the questioningscheme. Such a linear regression model revealed that the coefficient estimate of bid is statisticallydifferent from zero (t-value= 8.9). Further evidence of anchoring is given by the fact that open-ended WTP (Lire 32,870) approaches the mean of the bid vector (Lire 33,700). The anchoringeffect could be explained by applying the psychological prospect theory of economic beha-vior (Kahneman and Tversky, 1979). According to this theory (for further details see DeShazo(1996)) individuals identify a reference point and frame deviations from this reference pointas either losses or gains; the valuation function with respect to reference point is asymmetric,steeper in the domain of losses than in the domain of gains. When a respondent gives a “yes”answer to the single-bounded discrete choice question, he adopts a reference point equal to thedistance between the posed bid and his equivalent surplus. If the answer is “no”, the respondentdoes not form a reference point. Then, it is possible to suppose that open-ended questions
202 WALTER SANTAGATA AND GIOVANNI SIGNORELLO
preceded by a “yes” response were negatively framed and that questions preceded by a “no”response were unframed. According to the prospect theory respondents faced with negativelyframed questions adopt a risk seeking and loss averse response strategy, while respondents facedwith an unframed question are risk averse and could be truth revealing. Prospect theory predictsthat respondents who face a negatively-framed question are more likely to answer the open-ended question with the posed bid in the single-bounded discrete choice question. In practice,the framing model predicts that respondents negatively-framed will censor their stated WTP bysimply restating the value to which they answered yes. Conversely, respondents facing unframedquestion have an incentive to reveal truthful (uncensored) amounts. Inspection of our data setseems to empirically support these predictions. The percentage of cases in which the statedWTP was equal (censored) to the posed bid was rather high (on average around 47%).
7. For further details about this topic see Brown et al. (1996). If the two question formats had actedin the opposite direction (open-ended format downwards, and single-bounded discrete choiceupwards) then we could consider the estimated open-ended and discrete choice mean values as,respectively, lower bound and upper bound of the true mean WTP.
References
Andreoni, J. (1988) “Privately Provided Public Goods in a Large Economy: The Limits of Altruism”.Journal of Public Economics35: 57–73.
Antoci, A., and Sacco, P.-L. (1996) “Il futuro delle città d’arte: il ruolo della contribuzione volontarianelle politiche di ammortamento sociale”.Stato e Mercato48: 493–521.
Arrow, K., Solow, R., Portney, P.R., Leamer, E.E., Radner, R., and Schuman, H. (1993) “Report ofthe NOOA Panel on Contingent Valuation”.Federal Register58: 4601–4614.
Bishop, R., and Heberlein, T. (1979) “Measuring the Values of Extra-Market Goods: Are IndirectMeasures Biased?”American Journal of Agricultural Economics61: 926–930.
Brown, T.C., Champ, P.A., Bishop, R., and McCollum, D. (1996) “Which Response Format Revealsthe Truth about Donation to a Public Good?”Land Economics72: 152–166.
Carson, R.T., Wright, J., Carson, N., Alberini, A., and Flores, N. (1995)A Bibliography of ContingentValuation Studies and Papers. Natural Resource Damage Assessment Inc., La Jolla, Ca.
Carson, R.T., Michell, R.T., Conaway, M.B., and Navrud, S. (1997)Contingent Valuation ofthe Benefits of Conserving the Fez Medina, Quantification of Non-Moroccan’s Willingness toPay. Harvard University of Graduate School of Design, Unit of Housing and Urbanization,Cambridge, MA, U.S.A.
Cornes, R. and Sandler, T. (1986)The Theory of Externalities, Public Good, and Club Goods.Cambridge University Press, Cambridge, U.K.
Davis, R.K. (1964)The Value of Bird Game Hunting in a Private Forest. Transactions of the Twenty-Ninth North American Wildlife and Natural Resource Conference 9: 393–403.
DeShazo, J.R. (1996)Using Prospect Theory to Explain Path Dependence in Iterative Willingness-to-Pay Questions. Unpublished Paper, Harvard University, Graduate School of Arts and Sciences.
Fischoff, B. and Furby, L. (1988) “Measuring Values: A Conceptual Framework for InterpretingTransactions with Special Reference to Contingent Valuation”.Journal of Risk and Uncertainty1: 147–184.
Frey, B.S. (1997) “Evaluating Cultural Property: The Economic Approach”.International Journal ofCultural Property6: 231–246.
Green, J. and Laffont, J.J. (1979)Incentives in Public Decision Making. Amsterdam, North-Holland.Greene, W. (1997)Econometric Analysis, 3rd edition. Prentice Hall, U.S.A.Grosclaude, P. and Soguel, N.C. (1994) “Valuing Damage to Historic Buildings Using a Contingent
Market: A Case Study of Road Traffic Externalities”.Journal of Environmental Planning andManagement3: 279–287.
THE CASE OF “NAPOLI MUSEI APERTI” 203
Haab, T.C., and McConnell, K.E. (1997) “Referendum Models and Negative Willingness to Pay:Alternative Solutions”.Journal of Environmental Economics and Management32: 251–270.
Hanemann, M. (1984) "Welfare Evaluations in Contingent Valuation Experiments with DiscreteResponse Data”.American Journal of Agricultural Economics66: 332–341.
Hanemann, M. (1994) “Valuing the Environment through Contingent Valuation”.Journal ofEconomic Perspective8: 19–43.
Hansen, B.T. (1997) “The Willingness-to-Pay for the Royal Theater in Copenhagen”.Journal ofCultural Economics21: 1–28.
Hoehn, J.P. and Randall, A. (1987) “A Satisfactory Benefit Cost Indicator from ContingentValuation".Journal of Environmental Economics and Management3: 226–247.
Kahneman, D. and Tversky, A. (1979) “Prospect Theory: An Analysis of Decision under Risk”.Econometrica47: 263–291.
Kriström, B. (1990) “A Non-Parametric Approach to the Estimation of Welfare Measures in DiscreteResponse Contingent Valuation Studies”.Land Economics66: 135–139.
Kriström, B. (1997) “Spike Models in Contingent Valuation”.American Journal of AgriculturalEconomics79: 1013–1023.
Ledyard, J.O. (1995) “Public Goods: A Survey of Experimental Research", in J. Kagel and A. Roth(eds.),The Handbook of Experimental Economics, Princeton University Press, Princeton, NJ, pp.111–194.
Maggi, M. (1994) “Il valore dei beni culturali: un’applicazione empirica", in G. Brosio (ed.),Economia dei Beni culturali, La Rosa editrice, Torino.
Martin, F. (1994) “Determining the Size of Museum Subsides”.Journal of Cultural Economics18:255–270.
Mitchell, R.C., and R.T. Carson (1989)Using Surveys to Value Public Goods: The ContingentValuation Method. Resources for the Future, Washington, D.C.
Morey, E., Rossmann, K., Chestnut, L., and Ragland, S. (1997)Valuing Acid Deposition Injuries toCultural Resources. Center for Economic Analysis, University of Colorado, Boulder.
Morrison, W.G. and West, E.G. (1986) “Subsidies for the Performing Arts: Evidence on VoterPreferences”.Journal of Behavioral Economics15: 57–72
Navrud, S., ed. (1992)Pricing the European Environment. Oxford University Press, Oxford.Navrud, S., Pederson, P.-E., and Strand, J. (1992)Valuing Our Cultural Heritage: A Contingent
Valuation Survey. Center for Research in Economics and Business Administration, University ofOslo, Norway.
Piperno, S. and Santagata, W. (1992) “Revealed Preferences for Local Public Goods: The TurinExperiment”, in D. King (ed.),Local Government Economics in Theory and Practice, Routledge,London.
Pommerehne, W.W. (1987)Präferenzen für öffentliche Güter, Tubingen.Randall, A., Ives, B., and Eastman, C. (1974) “Bidding Games for Valuation of Aesthetic Environ-
mental Improvements”.Journal of Environmental Economics and Management1: 132–149.Roche, H. (1998)Teatro Colon. The Willingness to Pay for a Mixed Public Good. Economic
Department, Universidad de la Republica, Uruguay.Scarpa, R., Sirchia, G., and Bravi, M. (1998) “Kernel vs. Logit Modeling of Single Bounded CV
Responses: Valuing Access to Architectural and Visual Arts Heritage in Italy”, in R. Bishopand D. Romano (eds.),Environmental Resource Valuation: Applications of Contingent ValuationMethod in Italy. Kluwer Publisher, Dordrecht.
Signorello, G. (1998) “Valuing Bird Watching in a Mediterranean Wetland”, in R. Bishop and D. Ro-mano (eds.),Environmental Resource Valuation: Applications of Contingent Valuation Methodin Italy. Kluwer Publisher, Dordrecht.
Smith, V.K., Zhang, X., and Pamquist, R.B. (1997) “Marine Debris, Beach Quality, and Non-MarketValue”, Environmental and Resource Economics10: 223–247.
Starret, D.A. (1988)Foundations of Public Economics, Cambridge University Press, Cambridge.
204 WALTER SANTAGATA AND GIOVANNI SIGNORELLO
Throsby, C.D. and Withers, G.A. (1983) “Measuring the Demand for the Arts as a Public Good:Theory and Empirical Results”, in J.L. Shanahan et al. (eds.),Economic Support for the Arts.Association for Cultural Economics, Akron, Ohio.
Throsby, C.D. and Withers, G.A. (1986) “Strategic Bias and Demand for Public Goods”,Journal ofPublic Economics31: 307–327.
Turnbull, B.W. (1976) “The Empirical Distribution Function with Arbitrarily Grouped, Censored andTruncated Data”.Journal of the Royal Statistical Society38: 290–295.
Weisbrod, B.A. (1988)The Non Profit Economy. Harvard University Press, Cambridge.Whitehead, J., Chambers, C.M., and Chambers, P.E. (1998) “Contingent Valuation of Quasi-Public
Goods: Validity, Reliability and Application to Valuing a Historic Site”.Public Finance Review26: 137–154.
Whittington, D. (1998) “Administering contingent valuation surveys in developing countries”.WorldDevelopment26: 21–30.
Willis, K.G. (1994) “Paying for heritage: What price for Durham Cathedral”.Journal of Environ-mental Planning and Management3: 267–278.
Withers, G., Throsby, D., and Johnston, K. (1994)Public Expenditure in Australia. AustralianGovernment Publishing Service, Canberra.