Embed Size (px)
Citation preview
Continental Shelf Research ∎ (∎∎∎∎) ∎∎∎–∎∎∎
Contents lists available at ScienceDirect
Continental Shelf Research
http://d0278-43
n CorrE-m
Pleaswith
journal homepage: www.elsevier.com/locate/csr
Research papers
Estimation of typhoon-enhanced primary production in the South China Sea:A comparison with the Western North Pacific
Xiaoyan Chen a, Delu Pan a,n, Yan Bai a, Xianqiang He a,c, Chen-Tung Arthur Chen a,b, Yan Kang d,Bangyi Tao a
a State Key Laboratory of Satellite Ocean Environment Dynamics, Second Institute of Oceanography, State Oceanic Administration, Hangzhou 310012, Chinab Department of Marine Sciences, National Sun Yat-sen University, Kaohsiung 804, Taiwanc Ocean College, Zhejiang University, Hangzhou 310058, Chinad Center for Research of Marine Economy, Zhejiang University of Finance & Economics, Hangzhou 310012, China
a r t i c l e i n f o
Article history:Received 3 February 2015Received in revised form6 September 2015Accepted 8 October 2015
Keywords:TyphoonPrimary productionStatistical approachENSO
x.doi.org/10.1016/j.csr.2015.10.00343/& 2015 Elsevier Ltd. All rights reserved.
esponding author.ail address: [email protected] (D. Pan).
e cite this article as: Chen, X., et al.,the Western North Pacific. Continen
a b s t r a c t
Typhoon-enhanced primary production (PP) in the ocean has long been neglected, as it is a big challengeto estimate such PP due to the lack of ocean color data obscured by clouds and rainfall that accompanytyphoons and complicated biological responses. In this study, we developed a statistical approach, basedon all the typhoons passing though the South China Sea (SCS) and the Western North Pacific SubtropicalOcean (WNPSO) during 2003 and 2012. We then estimated the annual and interannual carbon fixationinduced by typhoons in the SCS and the WNPSO. The annual mean carbon fixation due to typhoons in thewhole SCS was estimated to be approximately 2.71670.304 Mt (1 Mt¼1012 g), equivalent to 5–15% ofthe new PP of the SCS. This suggests that typhoons contribute to the biological carbon fixation in the SCS.In terms of the WNPSO, the annual mean carbon fixation due to typhoons was only about 2.11270.640Mt, although the area is much larger and super typhoons occur more frequently. The main reason for thesmaller value in the WNPSO is that the cold nutrient-rich water is more difficult to be brought to theupper layer to support the growth of phytoplankton due to thicker mixed layer depth and deeper nu-tricline depth in the WNPSO in comparison with those in the SCS. In addition, typhoon-enhanced PPtended to be higher in the El Niño years in the WNPSO due to increased occurrence of super typhoons,while it was lower in the La Niña years. However, no obvious relationship with El Niño-Southern Os-cillation (ENSO) was found in the SCS during the study period.
& 2015 Elsevier Ltd. All rights reserved.
1. Introduction
Typhoons (also referred to as hurricanes or tropical cyclones)can enhance primary production (PP) in open oceans and coastalwaters (e.g., Lin et al., 2003, Lin, 2012; Babin et al., 2004; Siswantoet al., 2007, 2009; Zheng et al., 2010a; Hung et al., 2010, Hung andGong, 2011; Mei. et al., 2015). In the oligotrophic open ocean,vertical mixing and upwelling induced by typhoons (Price, 1981;Chen et al., 2003) can bring nutrients from a deep layer to thesurface layer to support the growth of phytoplankton. Lin et al.(2003) reported that the contribution of typhoons to the annualnew PP of the South China Sea (SCS) may be as much as 20–30%. Incoastal waters, nutrients can also come from terrestrial input asriver discharges increase due to heavy rainfall during typhoonpassages (Hung et al., 2013). As a result, excessive nutrients
Estimation of typhoon-enhtal Shelf Research (2015), h
brought by typhoons may be responsible for enhanced eu-trophication in coastal waters, which may further trigger excessivealgal blooms or red tides, causing hypoxia and other environ-mental problems (e.g., Zhou et al., 2012; Ernawaty et al., 2014).Therefore, the biogeochemical effects of typhoons on marineecosystems cannot be neglected in open oceans and coastalwaters.
How to quantify these biogeochemical changes (such as nu-trients, PP) induced by typhoons, however, remains a big chal-lenge. The reason is the difficulty in obtaining ship measurementsdue to bad weathers. Further, ocean color data are most likelyunavailable as satellite observations are often obscured by cloudsand rainfall that accompany typhoons. Since satellites can notmeasure nutrient concentrations at present, we have focused onPP in this study. The Vertically Generalized Production Modeldeveloped by Behrenfeld and Falkowski (1997) is often used toestimate PP enhancement (Lin et al., 2003, Lin, 2012; Mei. et al.,2015). However, this method can only be applied to the cases
anced primary production in the South China Sea: A comparisonttp://dx.doi.org/10.1016/j.csr.2015.10.003i
X. Chen et al. / Continental Shelf Research ∎ (∎∎∎∎) ∎∎∎–∎∎∎2
when ocean color data are available. Others developed empiricalalgorithms, such as the algorithm by Siswanto et al. (2007), whichrelates typhoon-enhanced PP to the parameters of the maximumsustained wind speed, typhoon translation speed, and ocean depthin the outer shelf of the East China Sea. Although the aforemen-tioned studies attempted to give quantitative results of typhoon-induced PP, the uncertainty was great as most of these resultswere evaluated based on a single typhoon event (Lin et al., 2003)or on a few limited cases (Siswanto et al., 2007; Lin, 2012). Also,the estimation method might be not applicable to other regions, asnoted by Siswanto et al. (2007).
In this study, we investigate all the typhoons passing throughthe SCS and Western North Pacific Subtropical Ocean (WNPSO)with the most active typhoons in the world during 2003 and 2012.We develop a statistical approach, which can be used to estimatetyphoon-induced PP enhancement even if the ocean color data isnot available in some typhoon cases. Then, we investigate the in-terannual variations of the annual production induced by all ty-phoons in the SCS and WNPSO during 2003 and 2012 based on thenewly developed algorithm. The contributions of all typhoons toPP are assessed in the SCS and WNPSO, respectively. Finally, weattempt to identify the possible factors that control the oceanbiological responses to typhoons in the SCS and WNPSO.
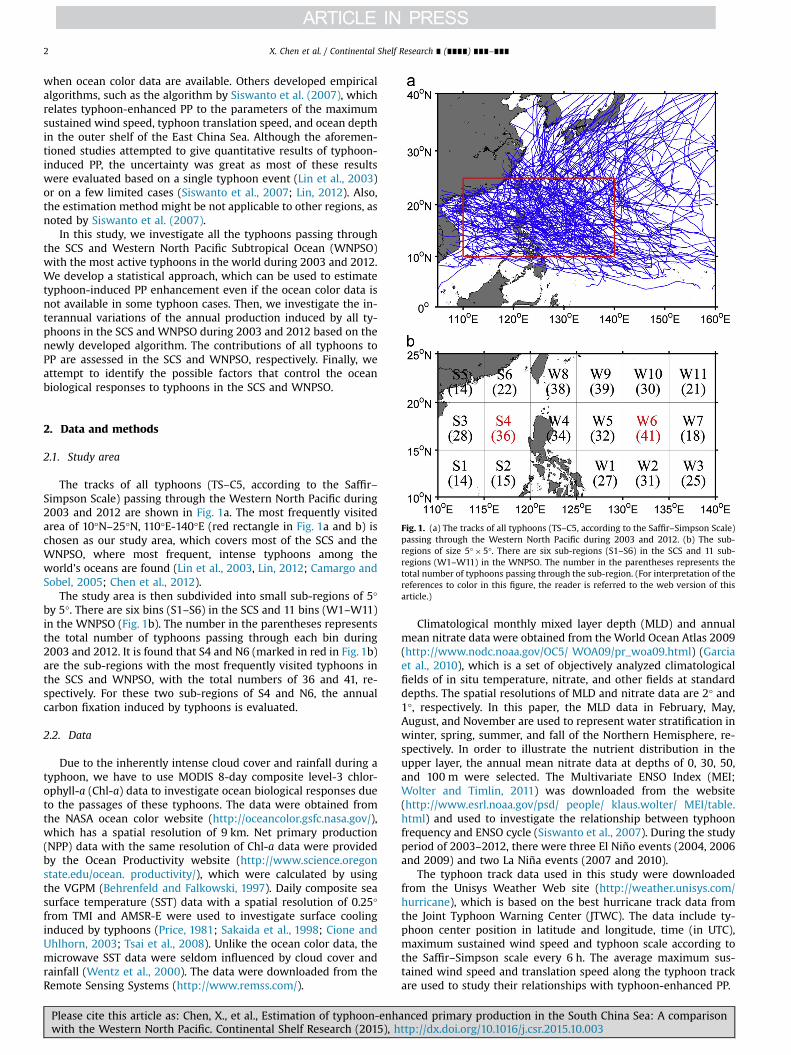
Fig. 1. (a) The tracks of all typhoons (TS–C5, according to the Saffir–Simpson Scale)passing through the Western North Pacific during 2003 and 2012. (b) The sub-regions of size 5°�5°. There are six sub-regions (S1–S6) in the SCS and 11 sub-regions (W1–W11) in the WNPSO. The number in the parentheses represents thetotal number of typhoons passing through the sub-region. (For interpretation of thereferences to color in this figure, the reader is referred to the web version of thisarticle.)
2. Data and methods
2.1. Study area
The tracks of all typhoons (TS–C5, according to the Saffir–Simpson Scale) passing through the Western North Pacific during2003 and 2012 are shown in Fig. 1a. The most frequently visitedarea of 10°N–25°N, 110°E-140°E (red rectangle in Fig. 1a and b) ischosen as our study area, which covers most of the SCS and theWNPSO, where most frequent, intense typhoons among theworld’s oceans are found (Lin et al., 2003, Lin, 2012; Camargo andSobel, 2005; Chen et al., 2012).
The study area is then subdivided into small sub-regions of 5°by 5°. There are six bins (S1–S6) in the SCS and 11 bins (W1–W11)in the WNPSO (Fig. 1b). The number in the parentheses representsthe total number of typhoons passing through each bin during2003 and 2012. It is found that S4 and N6 (marked in red in Fig. 1b)are the sub-regions with the most frequently visited typhoons inthe SCS and WNPSO, with the total numbers of 36 and 41, re-spectively. For these two sub-regions of S4 and N6, the annualcarbon fixation induced by typhoons is evaluated.
2.2. Data
Due to the inherently intense cloud cover and rainfall during atyphoon, we have to use MODIS 8-day composite level-3 chlor-ophyll-a (Chl-a) data to investigate ocean biological responses dueto the passages of these typhoons. The data were obtained fromthe NASA ocean color website (http://oceancolor.gsfc.nasa.gov/),which has a spatial resolution of 9 km. Net primary production(NPP) data with the same resolution of Chl-a data were providedby the Ocean Productivity website (http://www.science.oregonstate.edu/ocean. productivity/), which were calculated by usingthe VGPM (Behrenfeld and Falkowski, 1997). Daily composite seasurface temperature (SST) data with a spatial resolution of 0.25°from TMI and AMSR-E were used to investigate surface coolinginduced by typhoons (Price, 1981; Sakaida et al., 1998; Cione andUhlhorn, 2003; Tsai et al., 2008). Unlike the ocean color data, themicrowave SST data were seldom influenced by cloud cover andrainfall (Wentz et al., 2000). The data were downloaded from theRemote Sensing Systems (http://www.remss.com/).
Please cite this article as: Chen, X., et al., Estimation of typhoon-enhwith the Western North Pacific. Continental Shelf Research (2015), h
Climatological monthly mixed layer depth (MLD) and annualmean nitrate data were obtained from the World Ocean Atlas 2009(http://www.nodc.noaa.gov/OC5/ WOA09/pr_woa09.html) (Garciaet al., 2010), which is a set of objectively analyzed climatologicalfields of in situ temperature, nitrate, and other fields at standarddepths. The spatial resolutions of MLD and nitrate data are 2° and1°, respectively. In this paper, the MLD data in February, May,August, and November are used to represent water stratification inwinter, spring, summer, and fall of the Northern Hemisphere, re-spectively. In order to illustrate the nutrient distribution in theupper layer, the annual mean nitrate data at depths of 0, 30, 50,and 100 m were selected. The Multivariate ENSO Index (MEI;Wolter and Timlin, 2011) was downloaded from the website(http://www.esrl.noaa.gov/psd/ people/ klaus.wolter/ MEI/table.html) and used to investigate the relationship between typhoonfrequency and ENSO cycle (Siswanto et al., 2007). During the studyperiod of 2003–2012, there were three El Niño events (2004, 2006and 2009) and two La Niña events (2007 and 2010).
The typhoon track data used in this study were downloadedfrom the Unisys Weather Web site (http://weather.unisys.com/hurricane), which is based on the best hurricane track data fromthe Joint Typhoon Warning Center (JTWC). The data include ty-phoon center position in latitude and longitude, time (in UTC),maximum sustained wind speed and typhoon scale according tothe Saffir–Simpson scale every 6 h. The average maximum sus-tained wind speed and translation speed along the typhoon trackare used to study their relationships with typhoon-enhanced PP.
anced primary production in the South China Sea: A comparisonttp://dx.doi.org/10.1016/j.csr.2015.10.003i

Fig. 2. (a,b) Correlations of PP enhancement and maximum sustained wind in S4 and W6, respectively. (c,d) Correlations of PP enhancement and translation speed in S4 andW6, respectively.
X. Chen et al. / Continental Shelf Research ∎ (∎∎∎∎) ∎∎∎–∎∎∎ 3
2.3. A statistical approach
The maximum sustained wind and translation speed have beenshown to be the major factors affecting typhoon-induced oceanresponses (Siswanto et al., 2007; Mei. et al., (2015)). In order toestimate typhoon-induced PP enhancements, we first consider therelationships between PP enhancement and these two factors. ThePP enhancements were significantly correlated with the maximumsustained wind speed in both S4 (r¼0.789, po0.001) and W6(r¼0.535, po0.05) (Fig. 2a and b). Althoughit seems that PP en-hancement was negatively correlated with translation speed, therelationship was not statistically significant in both sub-regions(p40.1) (Fig. 2c and d). The above results reveal the dominance ofmaximum sustained wind speed in determining PP enhancementin our study area. Thus, we will estimate typhoon-induced PPenhancement by only considering typhoon intensity.
If the Chl-a data in the study area were not missing before andafter the passages of these typhoons, the overall PP enhancementcould be easily obtained by the sum of the PP enhancement in-duced by each typhoon. However, the missing data is not avoid-able. Therefore, we establish a statistical approach in this study toestimate typhoon-enhanced PP when the data is not available.First, we calculate the 8-day-averaged PP of the two sub-regions ofS4 and W6 before and after the passages of typhoons. Then, wepartition the typhoons to different scales according to the Saffir–Simpson Scale and calculate the average PP enhancements of ty-phoons with different scales. Note that the typhoon scale heremeans the maximum scale when it passed through the sub-region
Please cite this article as: Chen, X., et al., Estimation of typhoon-enhwith the Western North Pacific. Continental Shelf Research (2015), h
rather than the maximum scale during its lifetime. Finally, weconstruct the annual total PP enhancement E using
E Npp A D N Tpp AVG 1i i c cj j∑ ∑= Δ × × + × Δ _ ( )
where NppiΔ is the averaged PP enhancement of the bloom areawhen the Chl-a data is available, Ai is the bloom area which isdefined to be the area of the averaged PP enhancement over50 mg C/m2/d in this paper, D is assumed to be eight days in thispaper because of the temporal resolution of the data we used, cj
represents the typhoon scale, Ncj is the number of typhoons withscale cj passing through the sub-region when the Chl-a data ismissing, Tpp AVGcjΔ _ is the averaged total 8-day PP enhancementinduced by the typhoons of scale ci with available Chl-a data aftertheir passages. As typhoons could also induce surface cooling andincrease Chl-a concentration, the corresponding averaged ΔSSTand ΔChl-a are also given in this paper.
To ensure the reliability of these results, two criterions areapplied. First, the typhoon is excluded if the MODIS 8-day Chl-adata were severely affected by clouds or rainfall after its passage.Second, if two typhoons passed through the sub-region withineight days, we classify them as one event because the temporalresolution of the PP data used is eight days. Therefore, althoughthere were 36 typhoons passing through S4 during 2003 and 2012,the MODIS Chl-a data were available only for 19 events after ex-cluding 14 typhoons due to the unavailability of Chl-a data aftertheir passages and classifying three pairs of typhoons (Cimaron/Chebi, Nalgae/Nesat and Imbudo/Koni) as three events accordingto the second criterion (Table 1). Similarly, only 20 events were
anced primary production in the South China Sea: A comparisonttp://dx.doi.org/10.1016/j.csr.2015.10.003i

Table 1The typhoons passing through S4 during 2003 and 2012. The typhoons are arranged by descending order based on typhoon scale, and listed after applying the two principlesin Section 2.3.
No. Time Typhoonname
Typhoonscale*
Translationspeed (m/s)
Maximumwind speed(m/s)
ΔSST (°C) ΔChl-a (mg/m3) Bloom area(m2)
Daily averaged PP (mg C/m2/d) Total 8-dayproduction (MtC)
1 2006.05 Chanchu C4 4.4 55.9 �3.84 0.159 2.34eþ11 405.23 0.7582 2010.10 Megi C4 2.7 52.8 �3.27 0.507 2.26eþ11 517.01 0.9363 2012.12 Bopha C3 3.7 42.6 �1.54 0.083 2.30eþ11 157.07 0.2894** 2006.11 Cimaron/
ChebiC3/C1 2.1/5.5 38.1/39.6 �1.33 0.032 2.55eþ11 193.96 0.396
5** 2011.09 Nalgae /Nesat
C3/C2 3.8/5.1 35.5/38.0 �2.78 0.110 1.88eþ11 190.82 0.287
6** 2003.07 Imbudo/Koni
C2/C1 7.5/3.6 45.0/24.4 �2.42 0.055 2.46eþ11 111.05 0.219
7 2004.12 Nanmadol C2 5.3 43.7 �0.74 0.136 1.66eþ11 200.16 0.2678 2009.05 #2 C2 6.9 42.4 �0.32 0.083 1.53eþ11 119.08 0.1469 2003.08 Krovanh C1 5.7 36.0 �1.34 0.068 1.01eþ11 96.42 0.07810 2004.06 Conson C1 2.8 28.5 �0.82 0.036 5.60eþ10 103.24 0.04611 2007.11 Peipah C1 2.3 33.0 �0.75 0.113 1.90eþ11 182.24 0.27712 2008.05 #5 C1 2.7 30.0 �0.52 0.058 1.26eþ11 123.18 0.12413 2003.05 Linfa TS 1.9 20.1 �1.09 0.036 9.62eþ10 114.72 0.08814 2008.06 #7 TS 4.1 29.7 �1.47 0.040 1.23eþ11 103.33 0.10215 2008.11 #24 TS 3.9 23.1 �1.06 0.031 1.16eþ11 96.43 0.08916 2009.06 #3 TS 2.4 19.2 �1.34 0.081 1.27eþ11 151.37 0.15417 2009.09 #16 TS 5.2 21.2 �0.97 0.050 7.45eþ10 89.22 0.05318 2010.07 Conson TS 5.9 25.7 �0.67 0.028 6.84eþ10 84.68 0.04619 2011.07 Nock_ten TS 9.0 25.7 �0.97 0.030 7.63eþ10 83.2 0.051
* The typhoon scale is the maximum scale when it passed through S4 rather than the maximum scale during its lifetime.** These two typhoons passed through S4 within eight days; so they are classified as one event.
Table 2The typhoons passing through W6 during 2003 and 2012. The typhoons are arranged by the descending order based on typhoon scale, and listed after applying the twoprinciples in Section 2.3.
No. Time Typhoonname
Typhoonscale*
Translationspeed (m/s)
Maximumwind speed(m/s)
ΔSST (°C) ΔChl-a (mg/m3) Bloom area(m2)
Daily averaged PP (mg C/m2/d) Total 8-dayproduction (MtC)
1 2003.11 Lupit C5 3.9 67.5 �2.37 0.069 2.07eþ11 129.91 0.2152 2003.10 Ketsana C4 2.0 47.1 �2.96 0.093 1.74eþ11 172.33 0.2413 2004.04 Sudal C4 3.2 60.3 �1.87 0.051 2.35eþ11 127.38 0.2404** 2004.10 Tokage/
Nock_tenC4/C3 4.0 57.1 �2.52 0.069 1.26eþ11 139.76 0.141
5 2005.04 Sonca C4 4.8 55.8 �0.40 0.027 4.96eþ10 76.43 0.0306 2008.05 #3 C4 6.7 68.1 �1.86 0.018 1.04eþ11 78.92 0.0667 2008.05 #6 C4 3.3 52.5 �1.32 0.034 4.52eþ10 99.63 0.0368 2009.05 #1 C4 7.7 58.3 �1.23 0.017 8.57eþ10 78.71 0.0549 2009.10 #22 C4 3.4 60.4 �1.83 0.052 1.79eþ11 118.19 0.16910 2007.05 Yutu C3 4.9 48.4 �0.75 0.001 2.94eþ9 58.45 0.00111 2007.07 Man_yi C3 9.4 49.5 �1.79 0.018 2.30eþ10 64.45 0.01212 2010.10 Megi C3 7.4 50.1 �0.61 0.013 8.22eþ9 65.87 0.00413 2003.08 Dujuan C2 5.8 39.1 �0.63 0.024 3.05eþ10 71.03 0.01714 2006.07 Kaemi C2 17.1 45.0 �0.26 0.023 6.62eþ10 80.28 0.04215 2006.09 Shanshan C2 2.7 33.7 �1.02 0.027 5.25eþ10 77.74 0.03316 2005.09 Khanun C1 5.8 32.4 �0.45 0.033 3.12eþ10 72.81 0.01917 2011.09 Nalgae C1 4.9 35.5 �0.27 0.013 6.24eþ9 64.20 0.00318 2004.05 Omais TS 3.1 18.6 �1.87 0.022 5.22eþ10 79.93 0.03319 2008.08 #13 TS 9.0 24.8 �0.46 0.020 2.65eþ10 65.95 0.01420 2010.05 Omais TS 3.8 19.3 �0.02 0.017 1.68eþ10 58.98 0.008
* The typhoon scale means the maximum scale when it passed through W6 rather than the maximum scale from its generation to its landfall.** These two typhoons passed through W6 within eight days; so they are classified as one event.
X. Chen et al. / Continental Shelf Research ∎ (∎∎∎∎) ∎∎∎–∎∎∎4
available for W6 after excluding the 19 typhoons according to thefirst criterion and classifying one pair of typhoons (Tokage/Nock_ten) as one event according to the second criterion (Table 2).The averaged total PP enhancements of typhoons with differentscales were derived using all the selected typhoons in S4 and W6,respectively. Then, the annual total PP enhancements were cal-culated using Eq. (1) and all the selected typhoons passing throughS4 and W6 during each year of 2003–2012.
Please cite this article as: Chen, X., et al., Estimation of typhoon-enhwith the Western North Pacific. Continental Shelf Research (2015), h
3. Results and discussion
3.1. Typhoon-induced PP enhancement in the SCS
The typhoons passing through S4 in the SCS during 2003 and2012 are shown in Table 1. They are arranged by the descendingorder based on the typhoon scale. Table 1 shows that the max-imum scale of typhoons passing through S4 was Category 4 (C4). Ifwe define the typhoon with a scale C4 or C5 as a super typhoon,there were two super typhoons, Chanchu in May 2006 and Megi in
anced primary production in the South China Sea: A comparisonttp://dx.doi.org/10.1016/j.csr.2015.10.003i

Fig. 3. Typhoon-induced PP enhancement (Mt C) in S4 during 2003–2012. The bluedot indicates the number of typhoons passing through S4 each year.
X. Chen et al. / Continental Shelf Research ∎ (∎∎∎∎) ∎∎∎–∎∎∎ 5
October 2010. Both of them lingered in S4 for almost three daysand caused the averaged SST to decrease by more than 3 °C. At thesame time, the total 8-day PP enhancement which is calculatedbased on the bloom area and the daily averaged PP triggered bytyphoons is also shown in Table 1. The total 8-day PP enhance-ment reached 0.758 Mt C (1 Mt¼1012 g) of Chanchu and 0.936 MtC of Megi although the increments of the average Chl-a con-centration between them were quite different (Table 1). In fact,these two cases were investigated before (Fu et al., 2009; Chenet al., 2012) as they were among the most intense typhoonsreaching the SCS during the last decade. Fu et al. (2009) found thatthe maximum drop of SST was up to 7 °C and the averaged Chl-aconcentration increased over 20%. Chen et al. (2012) investigatedthe large phytoplankton bloom induced by Typhoon Megi in Oc-tober 2010 and reported the maximum Chl-a concentration in-creased about 30 times along the typhoon track in the SCS afterthe typhoon passage in comparison with the climatology. How-ever, they mainly focused on the changes of SST and Chl-a con-centration. In this study, we are mainly concerned about the PPenhancement induced by typhoons. The averaged total PP en-hancement of super typhoons was 0.84770.126 Mt C (Table 3). Inaddition, although the total PP enhancement varied greatly fromtyphoon to typhoon as it was influenced by many factors (Zhenget al., 2008, 2010b; Lin, 2012), it tended to change with the ty-phoon intensity based on our statistical results (Table 1). It seemsthat the stronger the typhoon was, the higher the PP enhancementwas. The averaged total PP enhancement was about 0.34270.076Mt C for the typhoons of C3, namely, Cimaron/Chebi in November2006, Nalgae/Nesat in October 2011, Bopha in December 2012.Similarly, the averaged total PP enhancements for C2, C1 and TSwere 0.23070.063, 0.13170.102 and 0.08370.038 Mt C, re-spectively (Table 3).
The annual contribution of typhoons to the total PP in S4 couldbe derived using Eq. (1). Since there were two C4 typhoons, one C3typhoon, one C1 typhoon and one tropical storm passing throughS4 in 2006, the total production of typhoon Chanchu in May 2006and typhoons Cimaron/Chebi in November were 0.758 and 0.396Mt C, respectively (Table 1). The unknown production induced bythe other two typhoons was using the respective averaged pro-duction of each typhoon scale as shown in Table 3. Therefore, thetotal carbon fixation for S4 in 2006 was estimated to be2.08470.164 Mt, as shown in Fig. 3 (the similar process was ap-plied to derive the total production induced by typhoons in otheryears). Note that the error is given by the sum of the standarddeviation of averaged PP enhancement when the PP data are notavailable after the passages of some typhoon cases. However, thecarbon fixations were less than 1 Mt in all other years during 2003and 2012. The least carbon fixation was only 0.16770.076 Mt in2005. Low carbon fixation also occurred in the years of 2004 and2007, with values of 0.313 and 0.277 Mt, respectively. The corre-sponding typhoons passing though S4 were no more than two in2004, 2005 and 2007, while there were five typhoons in 2006.Although the number of typhoons in 2009 was the same as that in2006, the estimated carbon fixation was only 0.43770.038 Mt in2009. The main reason was that the typhoon intensity was much
Table 3Averaged total PP enhancement and its standard deviation based on typhoons withdifferent scales in S4.
Typhoon Scale ΔAVG_TPP (Mt C) Standard Deviation (Mt C)
C4 0.847 0.126C3 0.342 0.076C2 0.230 0.063C1 0.131 0.102TS 0.083 0.038
Please cite this article as: Chen, X., et al., Estimation of typhoon-enhwith the Western North Pacific. Continental Shelf Research (2015), h
weaker in 2009 than in 2006 and that there were three tropicalstorms in 2009. From the above results, we can see that the in-terannual variation of the carbon fixation induced by typhoonswas large. We attributed this large variation to both intensity andnumber of typhoons in S4. Siswanto et al. (2007) correlated thetyphoon-induced PP enhancement to the Southern OscillationIndex (SOI) and found an inverse relationship between them.However, the relationship between the carbon fixation induced bytyphoons and ENSO cycle was not obvious in S4 during our studyperiod.
Based on the interannual results, the annual mean PP inducedby typhoons in S4 was 0.67970.076 Mt C. Thus, the carbon fixa-tion resulting from typhoons was estimated to be about2.71670.304 Mt in the entire SCS in accordance with the pro-portion of the typhoons in the other areas of SCS (almost threetimes of S4, in Fig. 1b). Lin et al. (2003) first reported that thecarbon fixation induced by Typhoon Kai-Tak in July 2000 was0.8 Mt, or 2–4% of the annual new production in the SCS. Thus,they concluded that the contribution of all typhoons to the annualnew production in the SCS might be as much as 20–30%. However,our result was much lower, only about 5–15%. One of the mostobvious reasons was that the result of Lin et al. (2003) was basedon one single strong typhoon Kai-Tak and the assumed conditionthat an average of 14 strong typhoons passing over the SCS an-nually. Our result is probably more reasonable as we used theactual typhoons passing through the SCS and considered eachtyphoon’s intensity individually.
3.2. Typhoon-induced PP enhancement in the WNPSO
The typhoons passing through W6 in the WNPSO during 2003and 2012 are shown in Table 2. They are also arranged by thedescending order based on the typhoon intensity. There were ninesuper typhoons passing through W6 during the study period.Typhoon Lupit in November 2003 was the only Category 5 ty-phoon, which induced the averaged SST reduction of 2.37 °C, the8-day averaged Chl-a concentration and PP enhancement of0.069 mg/m3 and 129.91 mg C/m2/d (Table 2), respectively. How-ever, the most significant SST cooling and Chl-a response wereinduced by Category 4 Typhoon Ketsana in October 2003, with theaveraged SST reduction of 2.96 °C and the averaged Chl-a increaseof 0.093 mg/m3 (Table 2). Lin (2012) suggested that the possiblereason was that the transit time of Typhoon Ketsana was muchlonger than that of Typhoon Lupit. Unlike in S4, the physical andbiological responses to the Category 4 typhoons in W6 varied
anced primary production in the South China Sea: A comparisonttp://dx.doi.org/10.1016/j.csr.2015.10.003i

Table 4Averaged total PP enhancement and its standard deviation based on typhoons withdifferent scales in W6.
Typhoon scale ΔAVG_TPP (Mt C) Standard Deviation (Mt C)
C4-C5 0.132 0.088TS-C3 0.017 0.014
Fig. 5. Relationship between MEI (left y-axis) and the number of super typhoons(right y-axis) in the WSNPO during 1997–2012.
X. Chen et al. / Continental Shelf Research ∎ (∎∎∎∎) ∎∎∎–∎∎∎6
greatly. The averaged SST cooling ranged from 0.40 to 2.96 °C, theaveraged change for Chl-a was 0.017–0.093 mg/m3 and that fortotal 8-day PP enhancement was 0.030–0.241Mt C. If Category4 Typhoon Sonca in April 2005 and #6 in May 2008 with PP en-hancement lower than 0.040 Mt C were excluded, all other Cate-gory 4 typhoons caused larger PP enhancements in comparisonwith weak typhoons from TS to C3. Since there was only one C5typhoon in the results, in order to reduce uncertainty we classifiedC5 and C4 typhoons in the WNPSO as one class. Therefore, theaveraged PP enhancement for super typhoons in W6 was about0.13270.088 Mt C (Table 4). However, the influence was veryweak by typhoons with intensity below C4 and the PP enhance-ment was no more than 0.040 Mt C. Therefore, we classified thetyphoons from TS to C3 as one class and the averaged PP en-hancement for this class was estimated to be 0.01770.014 Mt C(Table 4).
Similarly, the annual contribution of typhoons to the total PP inW6 was also derived using Eq. (1). The maximum carbon fixationwas 0.74770.231 Mt in 2004, while the minimum was only0.02970.014 Mt in 2010, as shown in Fig. 4. As super typhoonshad major contributions to the total typhoon-induced PP en-hancement in W6 from the above analysis, the interannual varia-tion in this sub-region was mainly related to the number of supertyphoons (Fig. 4). Previous studies revealed that super typhoonstended to be more frequent in El Niño years than in La Niña yearsin the Western North Pacific (Camargo and Sobel, 2005; Lee et al.,2012). Siswanto et al. (2007) reported an inverse relationship be-tween typhoon-induced PP enhancement to the Southern Oscil-lation Index (SOI), which was due to the tendency of typhoons tobe more frequent and intense during the ENSO warm phase. Fig. 5shows that the highest number of Category 5 typhoons occurred in1997, which was the strongest El Niño year in the last two decades.Similarly, 2004 was a moderate El Niño year with four super ty-phoons, which induced the maximum carbon fixation in W6during 2003–2012. As there were no super typhoons passingthough W6 in the La Niña years of 2007 and 2010, the carbonfixation was less than 0.1 Mt per year. Therefore, ENSO cyclesobviously affected the typhoon-enhanced PP in the WNPSO.
Fig. 4. Typhoon-induced PP enhancement (Mt C) in W6 during 2003–2012. Theblue dot indicates the number of super typhoons passing through W6 each year.
Please cite this article as: Chen, X., et al., Estimation of typhoon-enhwith the Western North Pacific. Continental Shelf Research (2015), h
Based on the interannual results, the annual mean PP inducedby typhoons in W6 was about 0.26470.080 Mt C. Thus, the carbonfixation resulting from typhoons was about 2.11270.640 Mt in theentire WNPSO in accordance with the proportion of the typhoonsin the other areas of the WNPSO (almost seven times of W6, inFig. 1b). Lin (2012) estimated that the total carbon fixation was3.27 Mt in 2003 in the WNPSO of 15°–25°N, 127°E-180°. Con-sidering that the area of her study region is about 1.5 times of ours,her estimation and ours can be considered to be consistent.
3.3. Comparison between SCS and WNPSO
From the results given in Sections 3.1 and 3.2, we can see thattyphoons' effects on SCS's PP could not be neglected and thecontribution of all typhoons to SCS's annual new production mightbe as much as 5–15%. However, the contribution of all typhoons tothe WNPSO's might be small as the annual carbon fixation wasonly 2.11270.640 Mt although the area is almost twice of that ofthe SCS. According to previous studies, the ocean's response to atyphoon is determined by many factors: typhoon's intensity,translation speed, typhoon-induced Ekman upwelling, and ocean’sprecondition (Zheng et al., 2008, Zheng et al., 2010a,b; Lin, 2012).As our results were based on the statistics of all typhoons ratherthan on one case, the ocean precondition (e.g., nutricline depthand MLD) should be the main contributors, which determinewhether the nutrients in the deep layer could be brought to theupper layer to sustain the growth of phytoplankton. Fig. 6 showsthe climatological annual mean nitrate concentration at depths of0, 30, 50, and 100 m. In the surface layer, the nitrate concentra-tions are less than 0.5 mM in the SCS except in the coastal regionswhile the concentrations are less than 0.2 mM in the WNPSO(Fig. 6a), one of the well-known ocean deserts. Therefore, thebiological productions in the upper layer of these two regions aremainly limited by the availability of nutrients. However, the nitrateconcentrations significantly increased with the deepening of waterdepth in the SCS (Fig. 6b–d). The concentration was almost twice(1–2 mM) at 50 m compared with that in the surface layer, and wasmore than 10 mM at 100 m. In contrast, there was almost nochange with nitrate concentrations in the WNPSO (Fig. 6b–d).Even if the depth reached 100 m, the nitrate concentration wasstill less than 1 mM. Although typhoons can induce vertical mixingand upwelling, bringing nutrient-rich water from the deep layerinto the euphotic zone (Price, 1981), the nutrients in the SCS couldobviously be brought to the surface layer more easily than in theWNPSO. The climatological monthly averaged MLDs in February,May, August, and November, are shown in Fig. 7. The MLD in the
anced primary production in the South China Sea: A comparisonttp://dx.doi.org/10.1016/j.csr.2015.10.003i

Fig. 6. Climatological annual mean nitrate concentration (mM) at depth of (a) 0 m, (b) 30 m, (c) 50 m, and (d) 100 m.
Fig. 7. Climatological monthly averaged mixed layer depth (m) in (a) February, (b) May, (c) August, and (d) November.
X. Chen et al. / Continental Shelf Research ∎ (∎∎∎∎) ∎∎∎–∎∎∎ 7
SCS is less than 40 m and is always shallower than that in theWNPSO in any season. In fall and winter, the MLD in the WNPSOeven reaches 60–100 m. This again suggests that the cold, nu-trient-rich water is more difficult to be brought to the upper layer
Please cite this article as: Chen, X., et al., Estimation of typhoon-enhwith the Western North Pacific. Continental Shelf Research (2015), h
in the WNPSO than in the SCS. Therefore, the deep MLD and nu-tricline depth determined that the annual carbon fixation by alltyphoons in the WNPSO was smaller than that in the SCS duringour study period.
anced primary production in the South China Sea: A comparisonttp://dx.doi.org/10.1016/j.csr.2015.10.003i
X. Chen et al. / Continental Shelf Research ∎ (∎∎∎∎) ∎∎∎–∎∎∎8
4. Summary and conclusions
A statistical approach was developed to estimate the annualand interannual typhoon-enhanced PP in the SCS and WNPSO,respectively, during 2003–2012. The annual mean carbon fixationin the whole SCS was estimated to be approximately 2.71670.304Mt, equivalent to 5–15% of the new PP of the SCS, while it was onlyabout 2.11270.640 Mt in the WNPSO, although the typhoon in-tensity was stronger in the latter and the area is larger in com-parison. The results suggest that frequently visited typhoonscontributed greatly to PP in the SCS. However, the effect in theWNPSO might be weak. The main reason is that the cold nutrient-rich water was more difficult to be brought to the upper layer tosupport the growth of phytoplankton due to the deep MLD andnutricline depth in the WNPSO than in the SCS. Although we havefocused on the SCS and WNPSO in this study, the biogeochemicaleffects of typhoons on coastal marine ecosystems in all China seasare worth studying in the future research.
Our statistical approach can be applied to all typhoons even ifthe PP data are not available in some typhoon cases due to cloudor rainfall, allowing us to determine the annual contribution oftyphoons to the local or global carbon cycle easily. This methoddoes not rely on any physical mechanism or empirical relationshipas in Siswanto et al. (2007) with typhoon features (intensity,translation speed, size, etc.) and ocean pre-existing conditions(negative sea surface height anomaly, etc.). The effects of me-soscale eddies on PP enhancement have not been separated fromthe actual mixing event that occurred following the passage ofeach typhoon although eddies can be intensified or generated insome typhoon cases in the study area (Chow et al., 2008; Sun et al.,2014). In addition, the subsurface chlorophyll maximum can becarried to the surface layer via vertical advection and mixing andresult in the overestimation of PP enhancement. Hence, the ac-curacy of PP enhancement estimation needs to be furtherimproved.
We identified an obvious relationship between the enhancedPP induced by typhoons and ENSO cycles in the WNPSO. Thecarbon fixation tended to be higher in the El Niño years and lowerin the La Niña years, which is mainly due to the more frequentsuper typhoons in the El Niño years than in the La Niña years.However, no obvious relationship between typhoon-enhanced PPand ENSO cycle was found in the SCS. Global warming has beenpredicted to decrease phytoplankton productivity in the tropicaland subtropical oceans as increasing stratification would limitnutrient supplies (Irwin and Oliver, 2009). However, the frequent,intensified typhoons under global warming may complicate thisprediction as they can produce transient shoaling of the thermo-cline/nutricline into the euphotic zone, and increase PP.
Acknowledgments
This study was supported by the National Basic Research Pro-gram (“973” Program) of China (Grants 2015CB954002 and2013CB430302), the Public Science and Technology Research FundProjects for Ocean Research (Grant 201505003), the NationalNatural Science Foundation of China (Grants 41406202, 41322039,41271378, 41321004, 41476155, and 91128212), and the “GlobalChange and Air–Sea Interaction” project of China (Grants GASI-03-03-01-01 and GASI-03-01-03-03). The authors thank the NASA,NOAA, the Remote Sensing Systems, and the Ocean Productivitysites for sharing their data. The authors also thank the threeanonymous reviewers for their comments and suggestions thathelped to improve the presentation of the paper.
Please cite this article as: Chen, X., et al., Estimation of typhoon-enhwith the Western North Pacific. Continental Shelf Research (2015), h
References
Babin, S.M., Carton, J.A., Dickey, T.D., Wiggert, J.D., 2004. Satellite evidence of hur-ricane-induced phytoplankton blooms in an oceanic desert. J. Geophys. Res.109, C03043.
Behrenfeld, M.J., Falkowski, P.G., 1997. Photosynthetic rates derived from satellite-based chlorophyll concentration. Limnol. Oceanogr. 42, 1–20.
Camargo, S.J., Sobel, A.H., 2005. Western North Pacific tropical cyclone intensity andENSO. J. Clim. 18, 2996–3006.
Chen, C.T.A., Liu, C.T., Chuang, W.S., Chuang, W.S., Yang, Y.J., Shiah, F.K., Tang, T.Y.,Chung, S.W., 2003. Enhanced buoyancy and hence upwelling of subsurfaceKuroshio waters after a typhoon in the southern East China Sea. J. Mar. Syst. 42,65–79.
Chen, X., Pan, D., He, X., Bai, Y., Wang, D., 2012. Upper ocean responses to category5 typhoon Megi in the western North Pacific. Acta Oceanol. Sin. 31, 51–58.
Chow, C.-H., Hu, J.-H., Centurioni, L.R., Niiler, P.P., 2008. Mesoscale Dongsha cycloniceddy in the northern South China Sea by drifter and satellite observations. J.Geophys. Res. 113, C04018.
Cione, J.J., Uhlhorn, E.W., 2003. Sea surface temperature variability in hurricanes:implications with respect to intensity change. Mon. Weather. Rev. 131,1783–1796.
Ernawaty, R., Takanobu, I., Shinichi, A., Kuriko, Y., Yoshitaka, M., Yoko, O., 2014.Nutrient enrichment and physical environmental effects caused by typhoons ina semi-enclosed Bay. J. Ecotechnol. Res. 17, 107–114.
Fu, D., Pan, D., Mao, Z., Ding, Y., Chen, J., 2009. The effects of chlorophyll-a and SSTin the South China Sea area by typhoon near last decade. In: Proceedings ofSPIE 7478, Remote Sensing for Environmental Monitoring, GIS Applications, andGeology, 74782E.
Garcia, H.E., Locarnini, R.A., Boycer, T.P., Antonov, J.I., Zweng, M.M., Baranova, O.K.,Jonhanson, D.R., 2010. Nutrients (phosphate, nitrate, and silicate), NOAA AtlasNEDIS, vol. 71. In: Levitus, S. (Ed.), World Ocean Atlas 2009 vol.4. NOAA, SilverSpring, Md..
Hung, C.C., Gong, G.C., Chou, W.C., Chung., C.C., Lee, M.A., Chang, Y., Chen, H.Y.,Huang, S.J., Yang, Y., Yang, W.R., Chung, W.C., Li, S.L., Laws, E., 2010. The effect oftyphoon on particulate organic carbon flux in the southern East Chinas Sea.Biogeosciences 7, 3007–3018.
Hung, C.C., Gong, G.C., 2011. Biogeochemical responses in the southern East ChinaSea after typhoons. Oceanography 24, 42–51.
Hung, C.C., Chung, C.C., Gong, G.C., Jan, S., Tsai, Y., Chen, K.S., Chou, W.C., Lee, M.A.,Chang, Y., Chen, M.H., Yang, W.R., Tseng, C.J., Gawarkiewicz, G., 2013. Nutrientsupply in the Southern East China Sea after Typhoon Morakot. J. Mar. Res. 71,133–150.
Irwin, A.J., Oliver, M.J., 2009. Are ocean deserts getting larger? Geophys. Res. Lett.36, L18609.
Lee, H.S., Yamashita, T., Mishima, T., 2012. Multi-decadal variations of ENSO, thePacific Decadal Oscillation and tropical cyclones in the western North Pacific.Prog. Oceanogr. 105, 67–80.
Lin, I.I., Liu, W.T., Wu, C.C., Wong, G.T.F., Hu, C., Chen, Z., Liang, W.D., Yang, Y., Liu, K.K., 2003. New evidence for enhanced ocean primary production triggered bytropical cyclone. Geophys. Res. Lett. 30, 1718.
Lin, I.I., 2012. Typhoon-induced phytoplankton blooms and primary productivityincrease in the western North Pacific subtropical ocean. J. Geophys. Res. 117,C03039.
Mei, W., Lien, C.C., Lin, I.I., Xie, S.P., 2015. Tropical cyclone-induced ocean response:a comparative study of the South China Sea and tropical Northwest Pacific. J.Clim. 28, 5952–5968. http://dx.doi.org/10.1175/JCLI-d-14-00651.1.
Price, J.F., 1981. Upper ocean response to a hurricane. J. Phys. Oceanogr. 11, 153–175.Sakaida, F., Kawamura, H., Toba, Y., 1998. Sea surface cooling caused by typhoons in
the Tohoku Area in August 1989. J. Geophys. Res. 103, 1053–1065.Siswanto, E., Ishizaka, J., Yokouchi, K., Tanaka, K., Tan, C.K., 2007. Estimation of
interannual and interdecadal variations of typhoon-induced primary produc-tion: A case study for the outer shelf of the East China Sea. Geophys. Res. Lett.34, L03604.
Siswanto, E., Morimoto, A., Kojima, S., 2009. Enhancement of phytoplankton pri-mary productivity in the southern East China Sea following episodic typhoonpassage. Geophys. Res. Lett. 36, L11603.
Sun, L., Li, Y.X., Yang, Y.J., Wu, Q., Chen, X.T., Li, Q.Y., Li, Y.B., Xian, T., 2014. Effects ofsuper typhoons on cyclonic ocean eddies in the Western North Pacific: a sa-tellite data-based evaluation between 2000 and 2008. J. Geophys. Res. 119,5585–5598.
Tsai, Y., Chern, C.S., Wang, J., 2008. Typhoon induced upper ocean cooling offnortheastern Taiwan. Geophys. Res. Lett. 35, L14605.
Wentz, F.J., Gentemann, C., Smith, D., Chelton, D., 2000. Satellite measurements ofsea surface temperature through clouds. Science 288, 847–850.
Wolter, K., Timlin, M.S., 2011. El Niño/Southern Oscillation behaviour since 1871 asdiagnosed in an extended multivariate ENSO index (MEI.ext). Int. J. Climatol. 31,1074–1087.
Zheng, Z.W., Ho, C.R., Kuo, N.J., 2008. Importance of pre-existing oceanic conditionsto upper ocean response induced by Super Typhoon Hai-Tang. Geophys. Res.Lett. 35, L20603.
Zheng, Z.W., Ho, C.R., Zheng, Q., Kuo, N.J., Lo, Y.T., 2010a. Satellite observation andmodel simulation of upper ocean biophysical response to Super Typhoon Nakri.Cont. Shelf Res. 30, 1450–1457.
Zheng, Z.W., Ho, C.R., Zheng, Q., Lo, Y.T., Kuo, N.J., Gopalakrishnan, G., 2010b. Effectsof preexisting cyclonic eddies on upper ocean responses to Category 5 ty-phoons in the western North Pacific. J. Geophys. Res. 115, C09013.
Zhou, W., Yin, K., Harrison, P.J., Lee, J.H.W., 2012. The influence of late summertyphoons and high river discharge on water quality in Hong Kong waters. Es-tuar. Coast. Shelf Sci. 111, 35–47.
anced primary production in the South China Sea: A comparisonttp://dx.doi.org/10.1016/j.csr.2015.10.003i