Embed Size (px)
Citation preview
Continental Shelf Research 34 (2012) 64–78
Contents lists available at SciVerse ScienceDirect
Continental Shelf Research
0278-43
doi:10.1
n Corr
E-m
journal homepage: www.elsevier.com/locate/csr
Research papers
Coupled physical, chemical, and microbiological measurements suggesta connection between internal waves and surf zone water qualityin the Southern California Bight
Simon H.C. Wong a, Alyson E. Santoro b, Nicholas J. Nidzieko b, James L. Hench c, Alexandria B. Boehm a,n
a Department of Civil and Environmental Engineering, Environmental and Water Studies, Stanford University, Stanford, CA 94305, USAb Horn Point Laboratory, University of Maryland Center for Environmental Science, Cambridge, MD 21613, USAc Nicholas School of the Environment Marine Laboratory, Duke University, Beaufort, NC 28516, USA
a r t i c l e i n f o
Article history:
Received 24 June 2011
Received in revised form
8 November 2011
Accepted 7 December 2011Available online 17 December 2011
Keywords:
Internal waves
Cross-shelf transport
Beach water quality
Fecal indicator bacteria
Nutrients
Southern California Bight
43/$ - see front matter & 2011 Elsevier Ltd. A
016/j.csr.2011.12.005
esponding author.
ail address: [email protected] (A.B. Boeh
a b s t r a c t
Internal waves have been implicated in the cross-shore transport of scalars such as larvae, nutrients,
and pollutants at locations around the world. The present study combines physical measurements with
a comprehensive set of surf zone water quality measurements to evaluate the possible impact of cross-
shore internal wave transport on surf zone water quality during two study periods. An array of
oceanographic moorings was deployed in the summer of 2005 and 2006 at 10–20 m depth offshore of
the beach to observe internal waves. Concurrently, surf zone water quality was assessed twice daily at
night at an adjacent station (Huntington State Beach) by measuring concentration of phosphate,
dissolved inorganic nitrogen (DIN), silicate, chlorophyll a, fecal indicator bacteria (FIB), and the human-
specific fecal DNA marker in Bacteroidales. The baroclinic component accounted for about 30% of the
total variance in water column velocity, indicating the importance of density-driven flow during the
summer when the water column was stratified. Arrival of cold subthermocline water in the very
nearshore (within 1 km of the surf zone) was characterized by strong baroclinic onshore flow near the
bottom of the water column. The near bottom, baroclinic, cross-shore current was significantly lag-
correlated with the near bottom temperature data along a cross-shore transect towards shore,
demonstrating shoreward transport of cold subthermocline water. Wavelet analysis of temperature
data showed that non-stationary temperature fluctuations were correlated with buoyancy frequency
and the near bottom cross-shore baroclinic current. During periods of large temperature fluctuations,
the majority of the variance was within the semi-diurnal band; however, the diurnal and high
frequency bands also contained a substantial fraction of total variance. The bottom cross-shore
baroclinic current was proposed as a proxy for shoreward transport potential by internal waves and
was positively correlated with phosphate concentration in both years, silicate in 2005, and fecal
indicator bacteria measurements in 2006. The results suggest internal waves are an important
transport mechanism of nutrient-rich subthermocline water to the very nearshore in the Southern
California Bight, and may facilitate the transport of FIB into the surf zone or enhance persistence of
land-derived FIB.
& 2011 Elsevier Ltd. All rights reserved.
1. Introduction
Pollution of the surf zone by fecal indicator bacteria (FIB) cancause beach advisories and closures (U.S. Environmental ProtectionAgency, 1986), and the presence of dense, sometimes harmful, algalblooms can drive away beach visitors and decrease ocean aes-thetics. The effects of land-based processes on coastal water quality,such as terrestrial runoff (Ahn et al., 2005; Reifel et al., 2009) and
ll rights reserved.
m).
groundwater discharge (Valiela et al., 1990; Lee and Kim, 2007; deSieyes et al., 2011) have been well documented. The present workaims to understand how oceanographic processes on the continen-tal shelf affect surf zone water quality. In particular, we investigatewhether the shoreward propagation of subthermocline water byinternal waves affects surf zone water quality at a beach in South-ern California.
Internal waves are produced by various mechanisms includingtraveling pressure fields, variable wind stress, and interactionsbetween the barotropic tide and bottom topography (Garrettand Munk, 1979) and can propagate in any stably stratified bodyof water (Turner, 1973). The interaction of propagating internal
S.H.C. Wong et al. / Continental Shelf Research 34 (2012) 64–78 65
waves with the continental slope can lead to wave breaking(Venayagamoorthy and Fringer, 2007), which can cause substan-tial net advection of mass and drive shoreward transportof nutrients and passive scalars (Shanks, 1983; Pineda, 1991;Leichter et al., 1996). The breaking of internal waves in shallowwaters also induces vigorous vertical mixing of water column(Munk and Wunsch, 1998) and can bring the cold water and anysubsurface materials to the surface (Pineda, 1994).
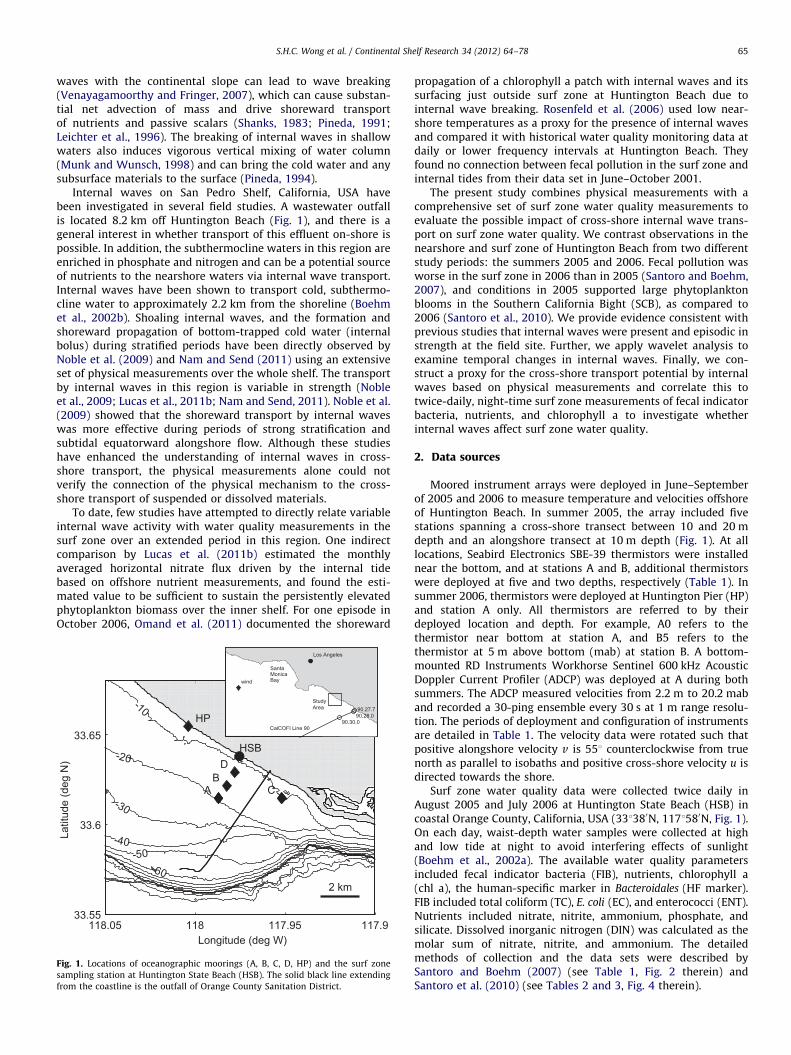
Internal waves on San Pedro Shelf, California, USA havebeen investigated in several field studies. A wastewater outfallis located 8.2 km off Huntington Beach (Fig. 1), and there is ageneral interest in whether transport of this effluent on-shore ispossible. In addition, the subthermocline waters in this region areenriched in phosphate and nitrogen and can be a potential sourceof nutrients to the nearshore waters via internal wave transport.Internal waves have been shown to transport cold, subthermo-cline water to approximately 2.2 km from the shoreline (Boehmet al., 2002b). Shoaling internal waves, and the formation andshoreward propagation of bottom-trapped cold water (internalbolus) during stratified periods have been directly observed byNoble et al. (2009) and Nam and Send (2011) using an extensiveset of physical measurements over the whole shelf. The transportby internal waves in this region is variable in strength (Nobleet al., 2009; Lucas et al., 2011b; Nam and Send, 2011). Noble et al.(2009) showed that the shoreward transport by internal waveswas more effective during periods of strong stratification andsubtidal equatorward alongshore flow. Although these studieshave enhanced the understanding of internal waves in cross-shore transport, the physical measurements alone could notverify the connection of the physical mechanism to the cross-shore transport of suspended or dissolved materials.
To date, few studies have attempted to directly relate variableinternal wave activity with water quality measurements in thesurf zone over an extended period in this region. One indirectcomparison by Lucas et al. (2011b) estimated the monthlyaveraged horizontal nitrate flux driven by the internal tidebased on offshore nutrient measurements, and found the esti-mated value to be sufficient to sustain the persistently elevatedphytoplankton biomass over the inner shelf. For one episode inOctober 2006, Omand et al. (2011) documented the shoreward
HP
HSB33.65
AB
C
D
-10
-20
117.9117.95118118.0533.55
33.6
2 km
Longitude (deg W)
Latit
ude
(deg
N)
-30
-40-50
-60
Fig. 1. Locations of oceanographic moorings (A, B, C, D, HP) and the surf zone
sampling station at Huntington State Beach (HSB). The solid black line extending
from the coastline is the outfall of Orange County Sanitation District.
propagation of a chlorophyll a patch with internal waves and itssurfacing just outside surf zone at Huntington Beach due tointernal wave breaking. Rosenfeld et al. (2006) used low near-shore temperatures as a proxy for the presence of internal wavesand compared it with historical water quality monitoring data atdaily or lower frequency intervals at Huntington Beach. Theyfound no connection between fecal pollution in the surf zone andinternal tides from their data set in June–October 2001.
The present study combines physical measurements with acomprehensive set of surf zone water quality measurements toevaluate the possible impact of cross-shore internal wave trans-port on surf zone water quality. We contrast observations in thenearshore and surf zone of Huntington Beach from two differentstudy periods: the summers 2005 and 2006. Fecal pollution wasworse in the surf zone in 2006 than in 2005 (Santoro and Boehm,2007), and conditions in 2005 supported large phytoplanktonblooms in the Southern California Bight (SCB), as compared to2006 (Santoro et al., 2010). We provide evidence consistent withprevious studies that internal waves were present and episodic instrength at the field site. Further, we apply wavelet analysis toexamine temporal changes in internal waves. Finally, we con-struct a proxy for the cross-shore transport potential by internalwaves based on physical measurements and correlate this totwice-daily, night-time surf zone measurements of fecal indicatorbacteria, nutrients, and chlorophyll a to investigate whetherinternal waves affect surf zone water quality.
2. Data sources
Moored instrument arrays were deployed in June–Septemberof 2005 and 2006 to measure temperature and velocities offshoreof Huntington Beach. In summer 2005, the array included fivestations spanning a cross-shore transect between 10 and 20 mdepth and an alongshore transect at 10 m depth (Fig. 1). At alllocations, Seabird Electronics SBE-39 thermistors were installednear the bottom, and at stations A and B, additional thermistorswere deployed at five and two depths, respectively (Table 1). Insummer 2006, thermistors were deployed at Huntington Pier (HP)and station A only. All thermistors are referred to by theirdeployed location and depth. For example, A0 refers to thethermistor near bottom at station A, and B5 refers to thethermistor at 5 m above bottom (mab) at station B. A bottom-mounted RD Instruments Workhorse Sentinel 600 kHz AcousticDoppler Current Profiler (ADCP) was deployed at A during bothsummers. The ADCP measured velocities from 2.2 m to 20.2 maband recorded a 30-ping ensemble every 30 s at 1 m range resolu-tion. The periods of deployment and configuration of instrumentsare detailed in Table 1. The velocity data were rotated such thatpositive alongshore velocity v is 551 counterclockwise from truenorth as parallel to isobaths and positive cross-shore velocity u isdirected towards the shore.
Surf zone water quality data were collected twice daily inAugust 2005 and July 2006 at Huntington State Beach (HSB) incoastal Orange County, California, USA (331380N, 1171580N, Fig. 1).On each day, waist-depth water samples were collected at highand low tide at night to avoid interfering effects of sunlight(Boehm et al., 2002a). The available water quality parametersincluded fecal indicator bacteria (FIB), nutrients, chlorophyll a(chl a), the human-specific marker in Bacteroidales (HF marker).FIB included total coliform (TC), E. coli (EC), and enterococci (ENT).Nutrients included nitrate, nitrite, ammonium, phosphate, andsilicate. Dissolved inorganic nitrogen (DIN) was calculated as themolar sum of nitrate, nitrite, and ammonium. The detailedmethods of collection and the data sets were described bySantoro and Boehm (2007) (see Table 1, Fig. 2 therein) andSantoro et al. (2010) (see Tables 2 and 3, Fig. 4 therein).
5 10 15 20 250
10
20
30
40
50
60
70
Temperature (°C)
Si,
10×P
O43−
, NO
3− (µM
)
Si
PO43−
NO3−
5 10 15 20 250
2
4
6
8
10
12
14
16
18
Temperature (°C)
NO
3−:P
O43−
July 2005July 2006
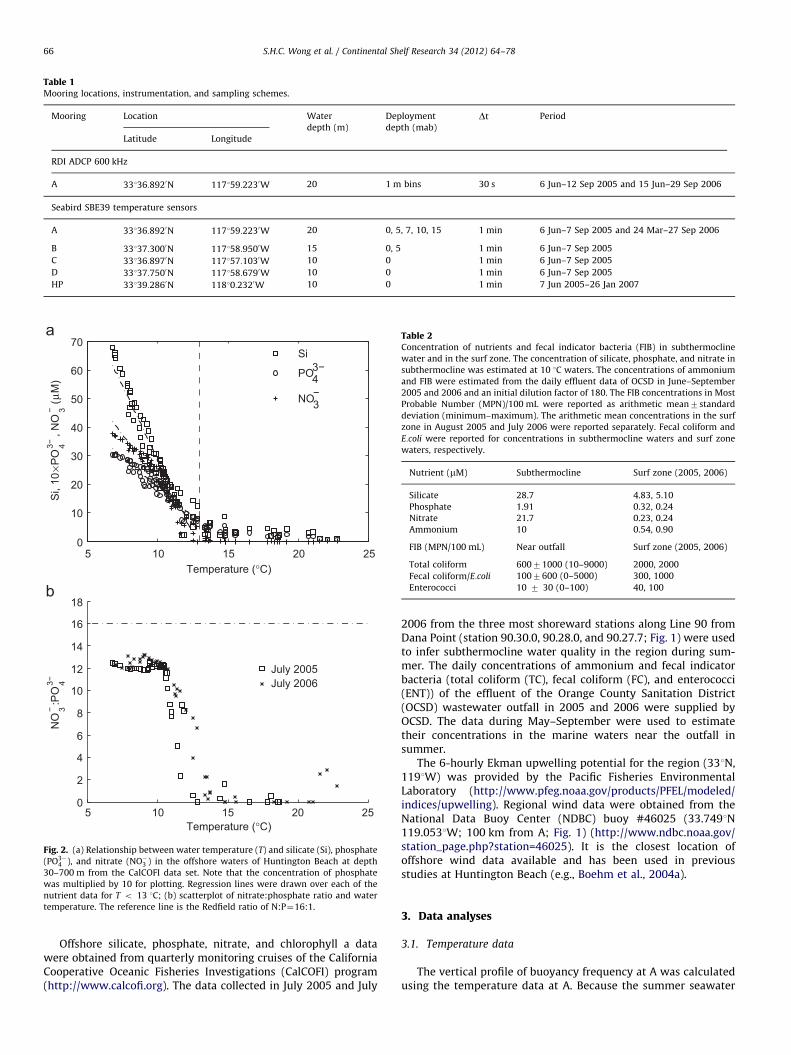
Fig. 2. (a) Relationship between water temperature (T) and silicate (Si), phosphate
(PO3�4 ), and nitrate (NO�3 ) in the offshore waters of Huntington Beach at depth
30–700 m from the CalCOFI data set. Note that the concentration of phosphate
was multiplied by 10 for plotting. Regression lines were drawn over each of the
nutrient data for T o 13 1C; (b) scatterplot of nitrate:phosphate ratio and water
temperature. The reference line is the Redfield ratio of N:P¼16:1.
Table 1Mooring locations, instrumentation, and sampling schemes.
Mooring Location Water
depth (m)
Deployment
depth (mab)Dt Period
Latitude Longitude
RDI ADCP 600 kHz
A 33136:8920N 117159:2230W 20 1 m bins 30 s 6 Jun–12 Sep 2005 and 15 Jun–29 Sep 2006
Seabird SBE39 temperature sensors
A 33136:8920N 117159:2230W 20 0, 5, 7, 10, 15 1 min 6 Jun–7 Sep 2005 and 24 Mar–27 Sep 2006
B 33137:3000N 117158:9500W 15 0, 5 1 min 6 Jun–7 Sep 2005
C 33136:8970N 117157:1030W 10 0 1 min 6 Jun–7 Sep 2005
D 33137:7500N 117158:6790W 10 0 1 min 6 Jun–7 Sep 2005
HP 33139:2860N 11810:2320W 10 0 1 min 7 Jun 2005–26 Jan 2007
Table 2Concentration of nutrients and fecal indicator bacteria (FIB) in subthermocline
water and in the surf zone. The concentration of silicate, phosphate, and nitrate in
subthermocline was estimated at 10 1C waters. The concentrations of ammonium
and FIB were estimated from the daily effluent data of OCSD in June–September
2005 and 2006 and an initial dilution factor of 180. The FIB concentrations in Most
Probable Number (MPN)/100 mL were reported as arithmetic mean7standard
deviation (minimum–maximum). The arithmetic mean concentrations in the surf
zone in August 2005 and July 2006 were reported separately. Fecal coliform and
E:coli were reported for concentrations in subthermocline waters and surf zone
waters, respectively.
Nutrient (mM) Subthermocline Surf zone (2005, 2006)
Silicate 28.7 4.83, 5.10
Phosphate 1.91 0.32, 0.24
Nitrate 21.7 0.23, 0.24
Ammonium 10 0.54, 0.90
FIB (MPN/100 mL) Near outfall Surf zone (2005, 2006)
Total coliform 60071000 (10–9000) 2000, 2000
Fecal coliform/E:coli 1007600 (0–5000) 300, 1000
Enterococci 10 7 30 (0–100) 40, 100
S.H.C. Wong et al. / Continental Shelf Research 34 (2012) 64–7866
Offshore silicate, phosphate, nitrate, and chlorophyll a datawere obtained from quarterly monitoring cruises of the CaliforniaCooperative Oceanic Fisheries Investigations (CalCOFI) program(http://www.calcofi.org). The data collected in July 2005 and July
2006 from the three most shoreward stations along Line 90 fromDana Point (station 90.30.0, 90.28.0, and 90.27.7; Fig. 1) were usedto infer subthermocline water quality in the region during sum-mer. The daily concentrations of ammonium and fecal indicatorbacteria (total coliform (TC), fecal coliform (FC), and enterococci(ENT)) of the effluent of the Orange County Sanitation District(OCSD) wastewater outfall in 2005 and 2006 were supplied byOCSD. The data during May–September were used to estimatetheir concentrations in the marine waters near the outfall insummer.
The 6-hourly Ekman upwelling potential for the region (331N,1191W) was provided by the Pacific Fisheries EnvironmentalLaboratory (http://www.pfeg.noaa.gov/products/PFEL/modeled/indices/upwelling). Regional wind data were obtained from theNational Data Buoy Center (NDBC) buoy #46025 (33.7491N119.0531W; 100 km from A; Fig. 1) (http://www.ndbc.noaa.gov/station_page.php?station=46025). It is the closest location ofoffshore wind data available and has been used in previousstudies at Huntington Beach (e.g., Boehm et al., 2004a).
3. Data analyses
3.1. Temperature data
The vertical profile of buoyancy frequency at A was calculatedusing the temperature data at A. Because the summer seawater
S.H.C. Wong et al. / Continental Shelf Research 34 (2012) 64–78 67
density in this region is mainly controlled by temperature (Joneset al., 2002), a constant salinity of 33.6 was assumed (OrangeCounty Sanitation District, 2006). Seawater density was calcu-lated from temperature and salinity through an equation of state(Fofonoff and Millard, 1983). The maximum buoyancy frequencyat A was taken as the representative measure of stratification andused in the following analysis.
Continuous wavelet transforms of temperature data were usedto investigate the non-stationary behavior of internal waves,resulting in the wavelet transform Wðs,tÞ at scale s and time t
(Torrence and Compo, 1998). The Morlet wavelet was used as themother function, with the parameter o0 (as in Torrence andCompo, 1998) set to be 6 (Farge, 1992). With these parameters,the wavelet scale s and the Fourier frequency are nearly identicaland can be used interchangeably. To obtain a single numericalmeasure of wavelet power at time t, the wavelet power wasaveraged between scales s1 to s2
/WSðtÞ ¼djdt
Cd
Xs2
s ¼ s1
9Wðs,tÞ92
sð1Þ
In this study the scale resolution dj¼ 2�3, the sampling timeinterval dt¼ 60 s, and the reconstruction constant Cd ¼ 0:776.Unless specified, all scale-averaged wavelet powers were aver-aged between the buoyancy frequency (approximately 0.03 Hz)and the inertial frequency (1.28�10�5 Hz), the permissiblefrequency range for unforced, freely propagating internal waves(Garrett and Munk, 1979). The inertial period at this latitude is21.7 h, so the power contained in the diurnal frequency is notincluded in calculating /WSðtÞ. Computer programs developedby Torrence and Compo (1998) were used for the analysis.
3.2. Velocity data
The 30-s velocity measurements were averaged into 15-minbins for analysis. Due to missing data near the water surface, onlythe data 2–16 m above bottom of the 20 m water column wereused. Complex Empirical Orthogonal Function (CEOF) Analysiswas used to decompose horizontal velocity (u þ iv) into theirprincipal components. Being a complex vector, the mode shape, oreigenvector, of each principal component was oriented such thatits bottom-most component pointed shoreward, and its cross-shore component of the mode shape was found by taking itsreal part. The barotropic, density-independent contribution wasdefined as the first principal component and the baroclinic,density dependent contribution as summation of the secondthrough fifth components (Stacey et al., 2001; Edwards andSeim, 2008).
To find the horizontal current ellipses of each principalcomponent, the mean velocity in each principal component wassubtracted, and the deviations from the mean were rotated totheir principal axes by finding the eigenvectors of their covariancematrix. The major and minor axes of a current ellipse representone standard deviation in the principal directions.
3.3. Correlation
All reported correlations refer to Spearman’s rank correlationr. Non-parametric correlations were used because a number ofthe variables (water temperature, current, buoyancy frequency,Ekman upwelling index, and wavelet power) were not normalbased on Lilliefors test of normality at the 5% significance level.Unless specified, significant correlations have po0:05. In calcu-lating statistical significance of correlations, the artificial ampli-fication of correlation due to autocorrelation was accounted forby using the effective degrees of freedom (Chelton, 1984).
4. Results
4.1. Subthermocline water quality
Concentrations of silicate, phosphate, and nitrate from theCalCOFI data increased approximately linearly with decreasingwater temperature (T) when T is below about 13 1C (Fig. 2; also,Hayward and Venrick, 1998). In this temperature range, a regres-sion line was drawn between each water quality parameter andwater temperature (R240:9). Near the shelf break (i.e., station90.28, depth¼60 m), the typical water temperature below thethermocline was about 10 1C. Using the regression equations, thenutrient concentrations in 10 1C water were estimated to be:silicate¼28:7 mM, nitrate¼21:7 mM, and phosphate¼1:9 mM. Forcomparison, Table 2 shows their arithmetic mean (AM) concen-tration in the surf zone of HSB in August 2005 and July 2006.Nitrate concentration in subthermocline water was 100 timeshigher than its surf zone concentration, and the concentrations ofsilicate and phosphate were an order of magnitude higher thansurf zone concentrations.
During the time of this study, the outfall discharged an averageof 8.97�108 L day�1 disinfected primary-treated sewage (OrangeCounty Sanitation District, 2006), which still contained fecalindicator organisms despite disinfection. The concentrations ofammonium and fecal indicator bacteria (FIB) in the marine watersnear the outfall were estimated by dividing their concentrationsin the effluent of the outfall by the outfall’s initial dilution factorof 1:180 (Noble et al., 2003, Chapter 1). We assumed that theEC:FC ratio was unity (Gannon and Busse, 1989) and used FC wasan estimate of EC near the outfall. Although the arithmetic meanconcentrations of TC, EC, ENT near the outfall were an order ofmagnitude smaller than their corresponding surf zone meanconcentrations (Table 2), FIB concentrations varied by 2–3 ordersof magnitude such that FIB concentrations near the outfall were attimes greater than the surf zone concentration for TC and EC. FIBdata from the surf zone can be found in Santoro and Boehm(2007) (Table 1, Fig. 2 therein).
4.2. Temperature structure
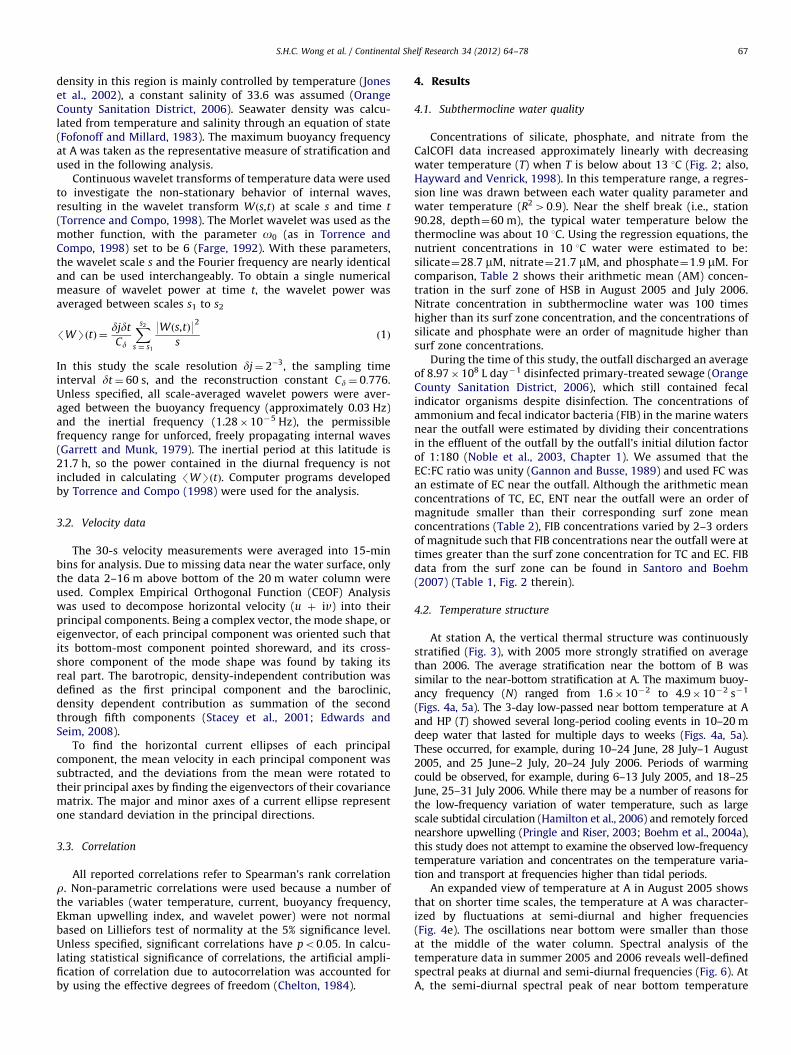
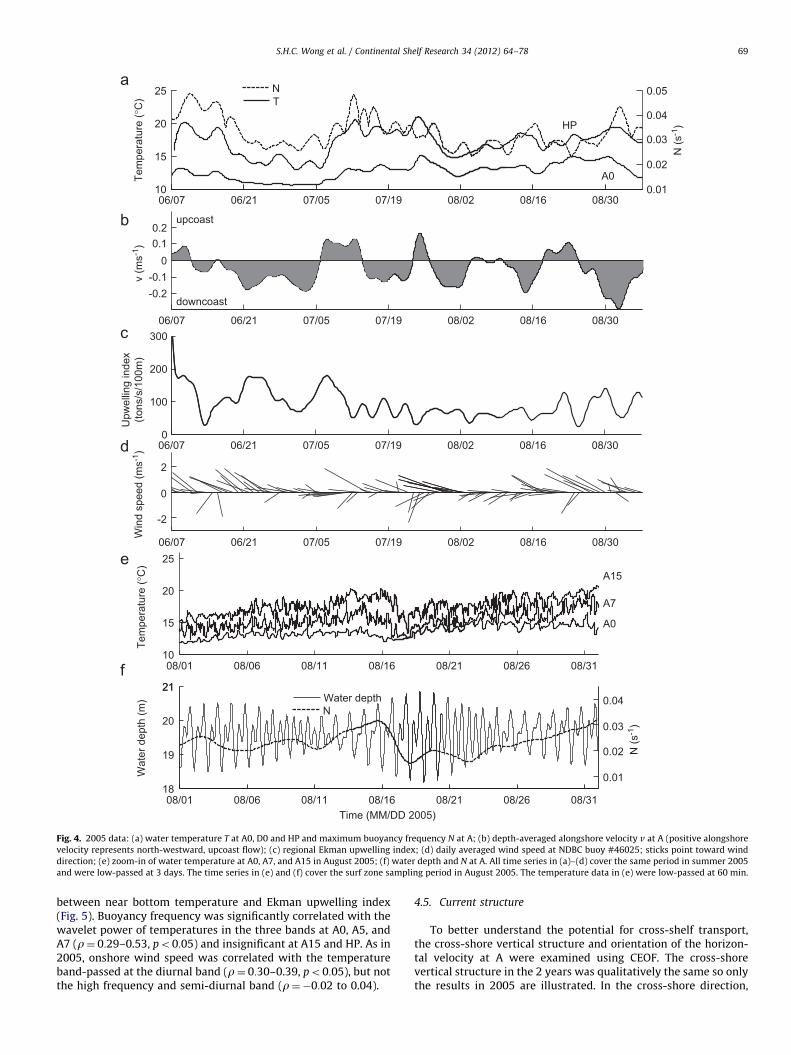
At station A, the vertical thermal structure was continuouslystratified (Fig. 3), with 2005 more strongly stratified on averagethan 2006. The average stratification near the bottom of B wassimilar to the near-bottom stratification at A. The maximum buoy-ancy frequency (N) ranged from 1.6�10�2 to 4.9�10�2 s�1
(Figs. 4a, 5a). The 3-day low-passed near bottom temperature at Aand HP (T) showed several long-period cooling events in 10–20 mdeep water that lasted for multiple days to weeks (Figs. 4a, 5a).These occurred, for example, during 10–24 June, 28 July–1 August2005, and 25 June–2 July, 20–24 July 2006. Periods of warmingcould be observed, for example, during 6–13 July 2005, and 18–25June, 25–31 July 2006. While there may be a number of reasons forthe low-frequency variation of water temperature, such as largescale subtidal circulation (Hamilton et al., 2006) and remotely forcednearshore upwelling (Pringle and Riser, 2003; Boehm et al., 2004a),this study does not attempt to examine the observed low-frequencytemperature variation and concentrates on the temperature varia-tion and transport at frequencies higher than tidal periods.
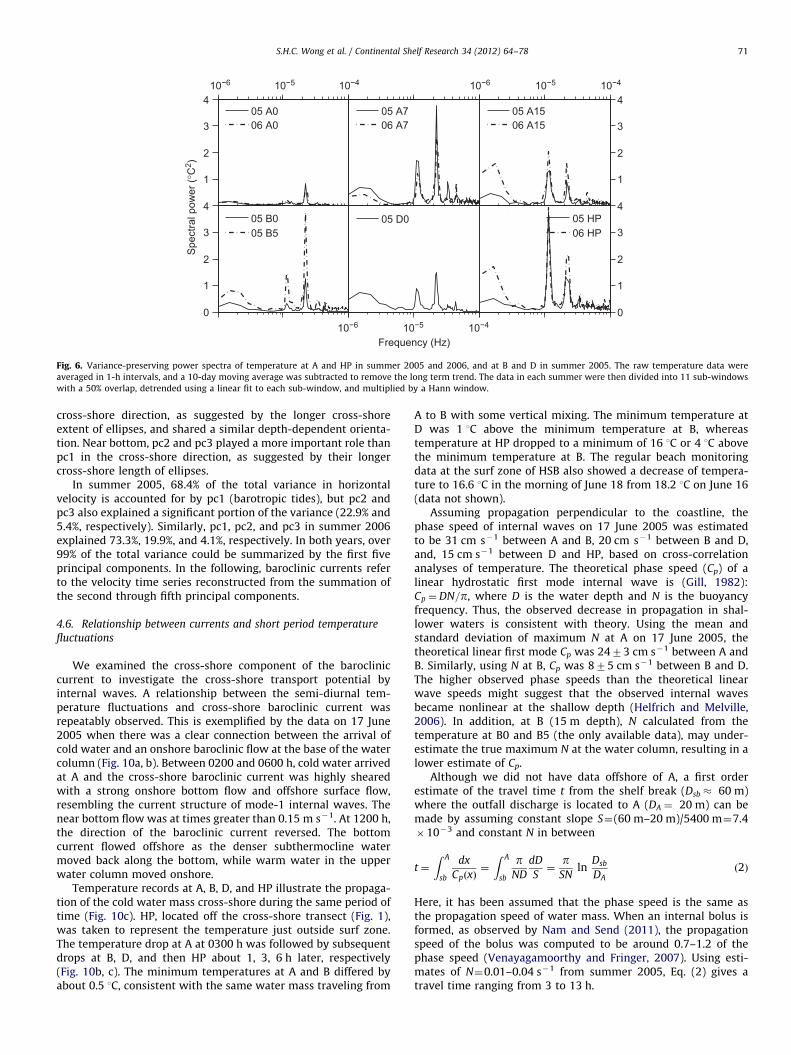
An expanded view of temperature at A in August 2005 showsthat on shorter time scales, the temperature at A was character-ized by fluctuations at semi-diurnal and higher frequencies(Fig. 4e). The oscillations near bottom were smaller than thoseat the middle of the water column. Spectral analysis of thetemperature data in summer 2005 and 2006 reveals well-definedspectral peaks at diurnal and semi-diurnal frequencies (Fig. 6). AtA, the semi-diurnal spectral peak of near bottom temperature
12 14 16 180
5
10
15
Temperature (°C)
Dep
th (m
ab)
A, 2005
A, 2006
B, 2005
Fig. 3. Vertical structure of mean water temperature at A in summer 2005 and
2006, and the near bottom mean water temperature at B in summer 2005.
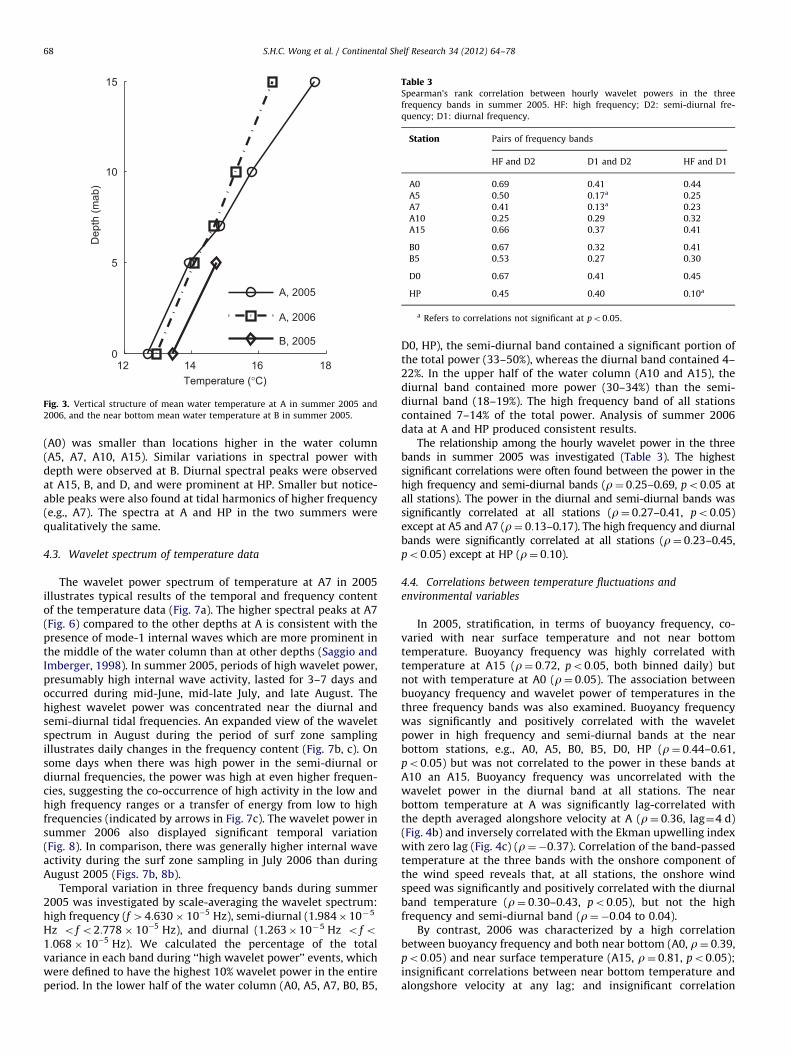
Table 3Spearman’s rank correlation between hourly wavelet powers in the three
frequency bands in summer 2005. HF: high frequency; D2: semi-diurnal fre-
quency; D1: diurnal frequency.
Station Pairs of frequency bands
HF and D2 D1 and D2 HF and D1
A0 0.69 0.41 0.44
A5 0.50 0.17a 0.25
A7 0.41 0.13a 0.23
A10 0.25 0.29 0.32
A15 0.66 0.37 0.41
B0 0.67 0.32 0.41
B5 0.53 0.27 0.30
D0 0.67 0.41 0.45
HP 0.45 0.40 0.10a
a Refers to correlations not significant at po0:05.
S.H.C. Wong et al. / Continental Shelf Research 34 (2012) 64–7868
(A0) was smaller than locations higher in the water column(A5, A7, A10, A15). Similar variations in spectral power withdepth were observed at B. Diurnal spectral peaks were observedat A15, B, and D, and were prominent at HP. Smaller but notice-able peaks were also found at tidal harmonics of higher frequency(e.g., A7). The spectra at A and HP in the two summers werequalitatively the same.
4.3. Wavelet spectrum of temperature data
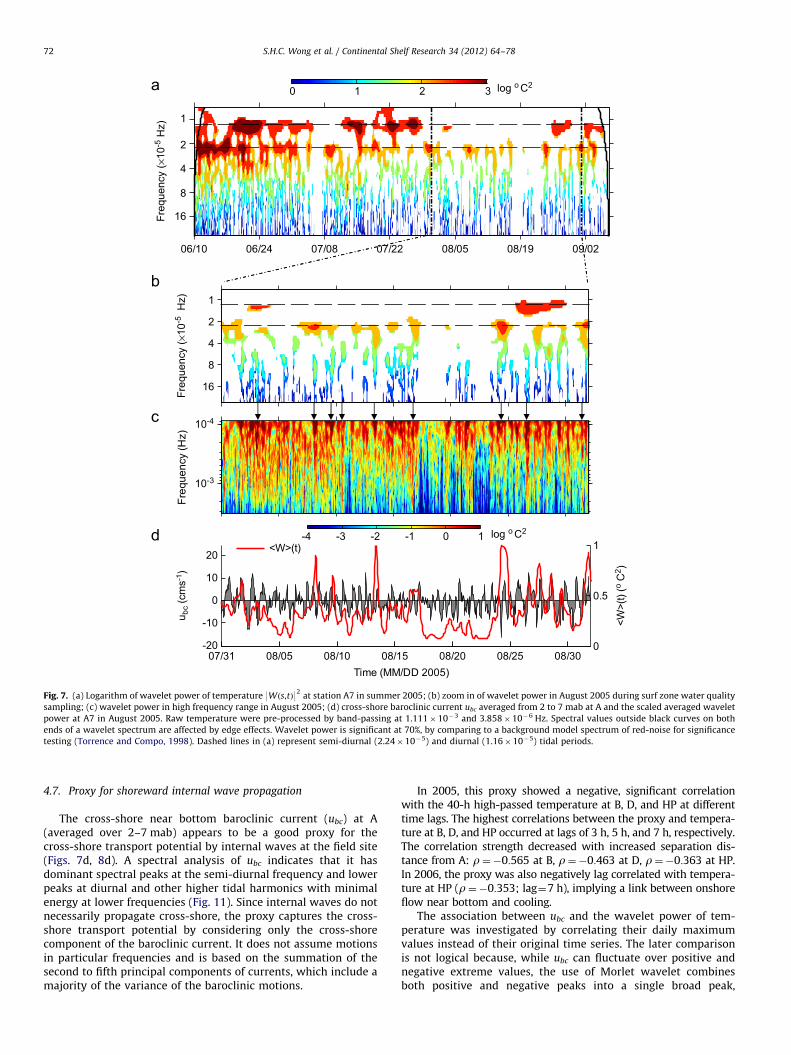
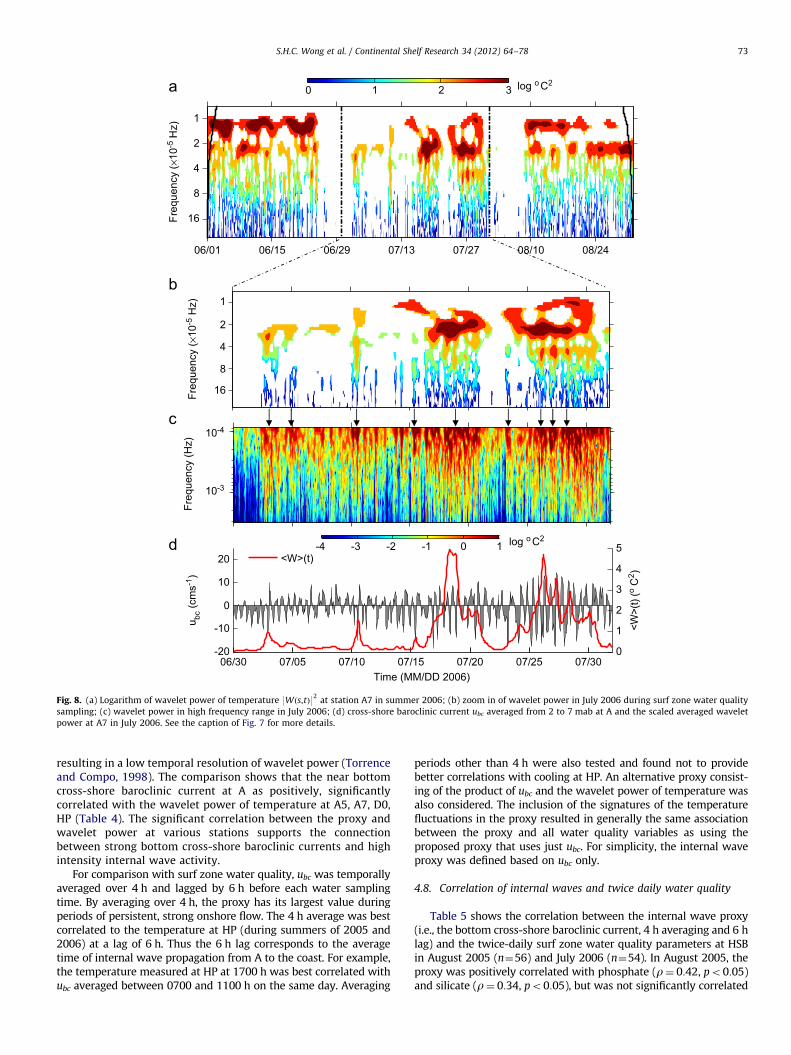
The wavelet power spectrum of temperature at A7 in 2005illustrates typical results of the temporal and frequency contentof the temperature data (Fig. 7a). The higher spectral peaks at A7(Fig. 6) compared to the other depths at A is consistent with thepresence of mode-1 internal waves which are more prominent inthe middle of the water column than at other depths (Saggio andImberger, 1998). In summer 2005, periods of high wavelet power,presumably high internal wave activity, lasted for 3–7 days andoccurred during mid-June, mid-late July, and late August. Thehighest wavelet power was concentrated near the diurnal andsemi-diurnal tidal frequencies. An expanded view of the waveletspectrum in August during the period of surf zone samplingillustrates daily changes in the frequency content (Fig. 7b, c). Onsome days when there was high power in the semi-diurnal ordiurnal frequencies, the power was high at even higher frequen-cies, suggesting the co-occurrence of high activity in the low andhigh frequency ranges or a transfer of energy from low to highfrequencies (indicated by arrows in Fig. 7c). The wavelet power insummer 2006 also displayed significant temporal variation(Fig. 8). In comparison, there was generally higher internal waveactivity during the surf zone sampling in July 2006 than duringAugust 2005 (Figs. 7b, 8b).
Temporal variation in three frequency bands during summer2005 was investigated by scale-averaging the wavelet spectrum:high frequency (f 44:630� 10�5 Hz), semi-diurnal (1.984�10�5
Hz o f o2:778� 10�5 Hz), and diurnal (1.263�10�5 Hz o f o1:068� 10�5 Hz). We calculated the percentage of the totalvariance in each band during ‘‘high wavelet power’’ events, whichwere defined to have the highest 10% wavelet power in the entireperiod. In the lower half of the water column (A0, A5, A7, B0, B5,
D0, HP), the semi-diurnal band contained a significant portion ofthe total power (33–50%), whereas the diurnal band contained 4–22%. In the upper half of the water column (A10 and A15), thediurnal band contained more power (30–34%) than the semi-diurnal band (18–19%). The high frequency band of all stationscontained 7–14% of the total power. Analysis of summer 2006data at A and HP produced consistent results.
The relationship among the hourly wavelet power in the threebands in summer 2005 was investigated (Table 3). The highestsignificant correlations were often found between the power in thehigh frequency and semi-diurnal bands (r¼ 0:25–0.69, po0:05 atall stations). The power in the diurnal and semi-diurnal bands wassignificantly correlated at all stations (r¼ 0:27–0.41, po0:05)except at A5 and A7 (r¼ 0:13–0.17). The high frequency and diurnalbands were significantly correlated at all stations (r¼ 0:23–0.45,po0:05) except at HP (r¼ 0:10).
4.4. Correlations between temperature fluctuations and
environmental variables
In 2005, stratification, in terms of buoyancy frequency, co-varied with near surface temperature and not near bottomtemperature. Buoyancy frequency was highly correlated withtemperature at A15 (r¼ 0:72, po0:05, both binned daily) butnot with temperature at A0 (r¼ 0:05). The association betweenbuoyancy frequency and wavelet power of temperatures in thethree frequency bands was also examined. Buoyancy frequencywas significantly and positively correlated with the waveletpower in high frequency and semi-diurnal bands at the nearbottom stations, e.g., A0, A5, B0, B5, D0, HP (r¼ 0:44–0.61,po0:05) but was not correlated to the power in these bands atA10 an A15. Buoyancy frequency was uncorrelated with thewavelet power in the diurnal band at all stations. The nearbottom temperature at A was significantly lag-correlated withthe depth averaged alongshore velocity at A (r¼ 0:36, lag¼4 d)(Fig. 4b) and inversely correlated with the Ekman upwelling indexwith zero lag (Fig. 4c) (r¼�0:37). Correlation of the band-passedtemperature at the three bands with the onshore component ofthe wind speed reveals that, at all stations, the onshore windspeed was significantly and positively correlated with the diurnalband temperature (r¼ 0:30–0.43, po0:05), but not the highfrequency and semi-diurnal band (r¼�0:04 to 0:04).
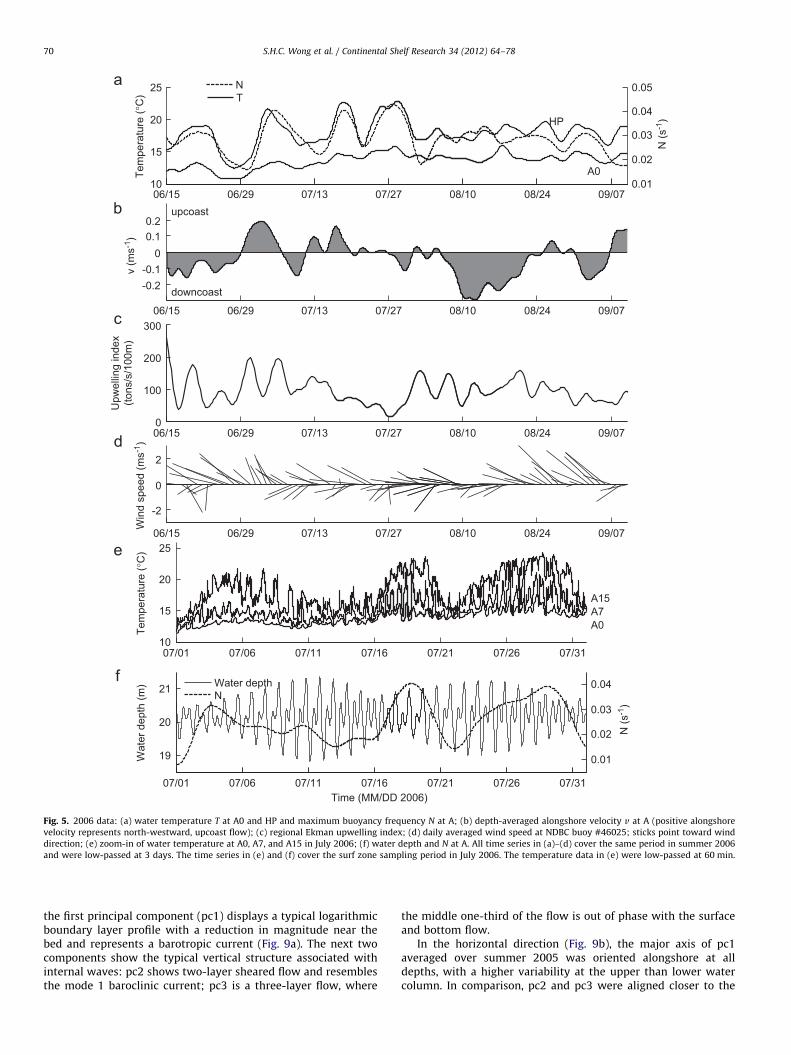
By contrast, 2006 was characterized by a high correlationbetween buoyancy frequency and both near bottom (A0, r¼ 0:39,po0:05) and near surface temperature (A15, r¼ 0:81, po0:05);insignificant correlations between near bottom temperature andalongshore velocity at any lag; and insignificant correlation
06/07 06/21 07/05 07/1910
15
20
25
Tem
pera
ture
(°C
) TN
06/07 06/21 07/05 07/19
-0.2-0.1
00.10.2
upcoast
downcoast
v (m
s-1)
300
06/07 06/21 07/05 07/19
-2
0
2
Win
d sp
eed
(ms-1
)
08/01 08/06 08/11 08/1610
15
20
25
Tem
pera
ture
(°C
)
21
06/07 06/21 07/05 07/190
100
200
Upw
ellin
g in
dex
(tons
/s/1
00m
)
08/01 08/06 08/11 08/1618
19
20
21
Time (MM/DD 2005)
Wat
er d
epth
(m) Water depth
N
08/02 08/16 08/300.01
0.02
0.03
0.04
0.05
N (s
-1)
08/02 08/16 08/30
A0
HP
08/02 08/16 08/30
08/21 08/26 08/31
A15
A7
A0
08/02 08/16 08/30
08/21 08/26 08/31
0.01
0.02
0.03
0.04
N (s
-1)
Fig. 4. 2005 data: (a) water temperature T at A0, D0 and HP and maximum buoyancy frequency N at A; (b) depth-averaged alongshore velocity v at A (positive alongshore
velocity represents north-westward, upcoast flow); (c) regional Ekman upwelling index; (d) daily averaged wind speed at NDBC buoy #46025; sticks point toward wind
direction; (e) zoom-in of water temperature at A0, A7, and A15 in August 2005; (f) water depth and N at A. All time series in (a)–(d) cover the same period in summer 2005
and were low-passed at 3 days. The time series in (e) and (f) cover the surf zone sampling period in August 2005. The temperature data in (e) were low-passed at 60 min.
S.H.C. Wong et al. / Continental Shelf Research 34 (2012) 64–78 69
between near bottom temperature and Ekman upwelling index(Fig. 5). Buoyancy frequency was significantly correlated with thewavelet power of temperatures in the three bands at A0, A5, andA7 (r¼ 0:29–0.53, po0:05) and insignificant at A15 and HP. As in2005, onshore wind speed was correlated with the temperatureband-passed at the diurnal band (r¼ 0:30–0.39, po0:05), but notthe high frequency and semi-diurnal band (r¼�0:02 to 0.04).
4.5. Current structure
To better understand the potential for cross-shelf transport,the cross-shore vertical structure and orientation of the horizon-tal velocity at A were examined using CEOF. The cross-shorevertical structure in the 2 years was qualitatively the same so onlythe results in 2005 are illustrated. In the cross-shore direction,
06/15 06/29 07/13 07/2710
15
20
25
Tem
pera
ture
(°C
) TN
30006/15 06/29 07/13 07/27
-0.2-0.1
00.10.2
upcoast
downcoast
v (m
s-1)
06/15 06/29 07/13 07/27
-2
0
2
Win
d sp
eed
(ms-1
)
06/15 06/29 07/13 07/270
100
200
Upw
ellin
g in
dex
(tons
/s/1
00m
)
07/01 07/06 07/11 07/1610
15
20
25
Tem
pera
ture
(°C
)
07/01 07/06 07/11 07/16
19
20
21
Time (MM/DD 2006)
Wat
er d
epth
(m) Water depth
N
08/10 08/24 09/070.01
0.02
0.03
0.04
0.05
N (s
-1)
08/10 08/24 09/07
A0
HP
08/10 08/24 09/07
08/10 08/24 09/07
07/21 07/26 07/31
A15A7A0
07/21 07/26 07/31
0.01
0.02
0.03
0.04
N (s
-1)
Fig. 5. 2006 data: (a) water temperature T at A0 and HP and maximum buoyancy frequency N at A; (b) depth-averaged alongshore velocity v at A (positive alongshore
velocity represents north-westward, upcoast flow); (c) regional Ekman upwelling index; (d) daily averaged wind speed at NDBC buoy #46025; sticks point toward wind
direction; (e) zoom-in of water temperature at A0, A7, and A15 in July 2006; (f) water depth and N at A. All time series in (a)–(d) cover the same period in summer 2006
and were low-passed at 3 days. The time series in (e) and (f) cover the surf zone sampling period in July 2006. The temperature data in (e) were low-passed at 60 min.
S.H.C. Wong et al. / Continental Shelf Research 34 (2012) 64–7870
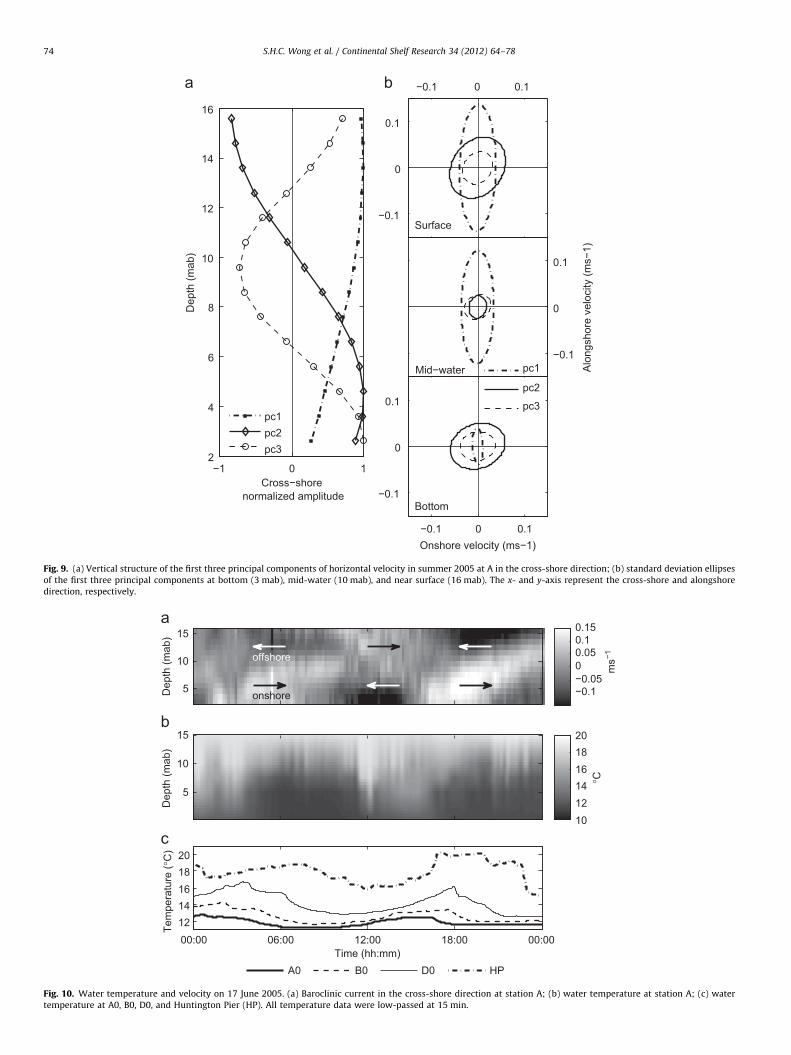
the first principal component (pc1) displays a typical logarithmicboundary layer profile with a reduction in magnitude near thebed and represents a barotropic current (Fig. 9a). The next twocomponents show the typical vertical structure associated withinternal waves: pc2 shows two-layer sheared flow and resemblesthe mode 1 baroclinic current; pc3 is a three-layer flow, where
the middle one-third of the flow is out of phase with the surfaceand bottom flow.
In the horizontal direction (Fig. 9b), the major axis of pc1averaged over summer 2005 was oriented alongshore at alldepths, with a higher variability at the upper than lower watercolumn. In comparison, pc2 and pc3 were aligned closer to the
10−6 10−5 10−4
1
2
3
405 A006 A0
10−6 10−5 10−4
1
2
3
405 A1506 A15
05 A706 A7
0
1
2
3
405 B005 B5
0
1
2
3
405 HP06 HP
10−6 10−5 10−4
Frequency (Hz)
05 D0
Spe
ctra
l pow
er (°
C2 )
Fig. 6. Variance-preserving power spectra of temperature at A and HP in summer 2005 and 2006, and at B and D in summer 2005. The raw temperature data were
averaged in 1-h intervals, and a 10-day moving average was subtracted to remove the long term trend. The data in each summer were then divided into 11 sub-windows
with a 50% overlap, detrended using a linear fit to each sub-window, and multiplied by a Hann window.
S.H.C. Wong et al. / Continental Shelf Research 34 (2012) 64–78 71
cross-shore direction, as suggested by the longer cross-shoreextent of ellipses, and shared a similar depth-dependent orienta-tion. Near bottom, pc2 and pc3 played a more important role thanpc1 in the cross-shore direction, as suggested by their longercross-shore length of ellipses.
In summer 2005, 68.4% of the total variance in horizontalvelocity is accounted for by pc1 (barotropic tides), but pc2 andpc3 also explained a significant portion of the variance (22.9% and5.4%, respectively). Similarly, pc1, pc2, and pc3 in summer 2006explained 73.3%, 19.9%, and 4.1%, respectively. In both years, over99% of the total variance could be summarized by the first fiveprincipal components. In the following, baroclinic currents referto the velocity time series reconstructed from the summation ofthe second through fifth principal components.
4.6. Relationship between currents and short period temperature
fluctuations
We examined the cross-shore component of the barocliniccurrent to investigate the cross-shore transport potential byinternal waves. A relationship between the semi-diurnal tem-perature fluctuations and cross-shore baroclinic current wasrepeatably observed. This is exemplified by the data on 17 June2005 when there was a clear connection between the arrival ofcold water and an onshore baroclinic flow at the base of the watercolumn (Fig. 10a, b). Between 0200 and 0600 h, cold water arrivedat A and the cross-shore baroclinic current was highly shearedwith a strong onshore bottom flow and offshore surface flow,resembling the current structure of mode-1 internal waves. Thenear bottom flow was at times greater than 0.15 m s�1. At 1200 h,the direction of the baroclinic current reversed. The bottomcurrent flowed offshore as the denser subthermocline watermoved back along the bottom, while warm water in the upperwater column moved onshore.
Temperature records at A, B, D, and HP illustrate the propaga-tion of the cold water mass cross-shore during the same period oftime (Fig. 10c). HP, located off the cross-shore transect (Fig. 1),was taken to represent the temperature just outside surf zone.The temperature drop at A at 0300 h was followed by subsequentdrops at B, D, and then HP about 1, 3, 6 h later, respectively(Fig. 10b, c). The minimum temperatures at A and B differed byabout 0.5 1C, consistent with the same water mass traveling from
A to B with some vertical mixing. The minimum temperature atD was 1 1C above the minimum temperature at B, whereastemperature at HP dropped to a minimum of 16 1C or 4 1C abovethe minimum temperature at B. The regular beach monitoringdata at the surf zone of HSB also showed a decrease of tempera-ture to 16.6 1C in the morning of June 18 from 18.2 1C on June 16(data not shown).
Assuming propagation perpendicular to the coastline, thephase speed of internal waves on 17 June 2005 was estimatedto be 31 cm s�1 between A and B, 20 cm s�1 between B and D,and, 15 cm s�1 between D and HP, based on cross-correlationanalyses of temperature. The theoretical phase speed (Cp) of alinear hydrostatic first mode internal wave is (Gill, 1982):Cp ¼DN=p, where D is the water depth and N is the buoyancyfrequency. Thus, the observed decrease in propagation in shal-lower waters is consistent with theory. Using the mean andstandard deviation of maximum N at A on 17 June 2005, thetheoretical linear first mode Cp was 2473 cm s�1 between A andB. Similarly, using N at B, Cp was 875 cm s�1 between B and D.The higher observed phase speeds than the theoretical linearwave speeds might suggest that the observed internal wavesbecame nonlinear at the shallow depth (Helfrich and Melville,2006). In addition, at B (15 m depth), N calculated from thetemperature at B0 and B5 (the only available data), may under-estimate the true maximum N at the water column, resulting in alower estimate of Cp.
Although we did not have data offshore of A, a first orderestimate of the travel time t from the shelf break (Dsb � 60 m)where the outfall discharge is located to A (DA ¼ 20 m) can bemade by assuming constant slope S¼(60 m–20 m)/5400 m¼7.4�10�3 and constant N in between
t¼
Z A
sb
dx
CpðxÞ¼
Z A
sb
pND
dD
S¼
pSN
lnDsb
DAð2Þ
Here, it has been assumed that the phase speed is the same asthe propagation speed of water mass. When an internal bolus isformed, as observed by Nam and Send (2011), the propagationspeed of the bolus was computed to be around 0.7–1.2 of thephase speed (Venayagamoorthy and Fringer, 2007). Using esti-mates of N¼0.01–0.04 s�1 from summer 2005, Eq. (2) gives atravel time ranging from 3 to 13 h.
Freq
uenc
y (×
10-5
Hz)
1
2
4
8
16
log o C2
log o C2
0 1 2 3a
10-4
06/10 06/24 07/08 07/22 08/05 08/19 09/02
Freq
uenc
y (×
10-5
Hz) 1
2
4
8
16
b
c
Freq
uenc
y (H
z)
10-3
-4 -3 -2 -1 0 1
07/31 08/05 08/10 08/15 08/20 08/25 08/30-20
-10
0
10
20
Time (MM/DD 2005)
u bc (
cms-1
)
0
0.5
1
<W>(
t) (o
C2 )
<W>(t)d
Fig. 7. (a) Logarithm of wavelet power of temperature 9Wðs,tÞ92at station A7 in summer 2005; (b) zoom in of wavelet power in August 2005 during surf zone water quality
sampling; (c) wavelet power in high frequency range in August 2005; (d) cross-shore baroclinic current ubc averaged from 2 to 7 mab at A and the scaled averaged wavelet
power at A7 in August 2005. Raw temperature were pre-processed by band-passing at 1.111�10�3 and 3.858�10�6 Hz. Spectral values outside black curves on both
ends of a wavelet spectrum are affected by edge effects. Wavelet power is significant at 70%, by comparing to a background model spectrum of red-noise for significance
testing (Torrence and Compo, 1998). Dashed lines in (a) represent semi-diurnal (2.24�10�5) and diurnal (1.16�10�5) tidal periods.
S.H.C. Wong et al. / Continental Shelf Research 34 (2012) 64–7872
4.7. Proxy for shoreward internal wave propagation
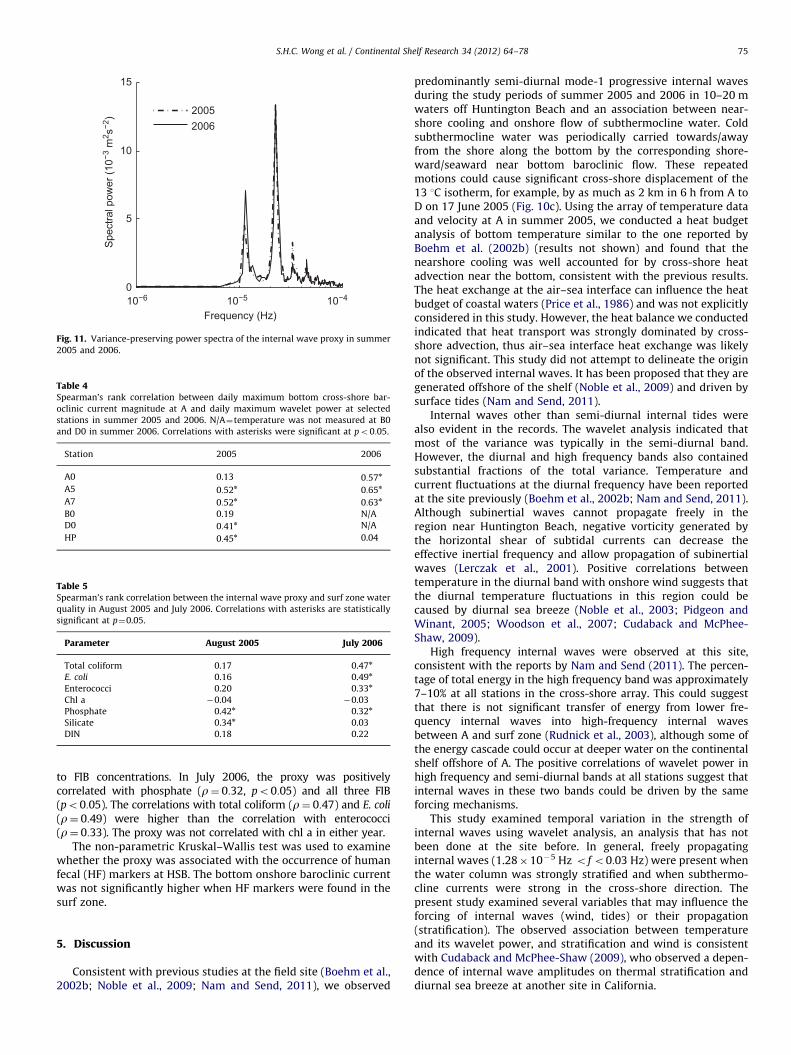
The cross-shore near bottom baroclinic current (ubc) at A(averaged over 2–7 mab) appears to be a good proxy for thecross-shore transport potential by internal waves at the field site(Figs. 7d, 8d). A spectral analysis of ubc indicates that it hasdominant spectral peaks at the semi-diurnal frequency and lowerpeaks at diurnal and other higher tidal harmonics with minimalenergy at lower frequencies (Fig. 11). Since internal waves do notnecessarily propagate cross-shore, the proxy captures the cross-shore transport potential by considering only the cross-shorecomponent of the baroclinic current. It does not assume motionsin particular frequencies and is based on the summation of thesecond to fifth principal components of currents, which include amajority of the variance of the baroclinic motions.
In 2005, this proxy showed a negative, significant correlationwith the 40-h high-passed temperature at B, D, and HP at differenttime lags. The highest correlations between the proxy and tempera-ture at B, D, and HP occurred at lags of 3 h, 5 h, and 7 h, respectively.The correlation strength decreased with increased separation dis-tance from A: r¼�0:565 at B, r¼�0:463 at D, r¼�0:363 at HP.In 2006, the proxy was also negatively lag correlated with tempera-ture at HP (r¼�0:353; lag¼7 h), implying a link between onshoreflow near bottom and cooling.
The association between ubc and the wavelet power of tem-perature was investigated by correlating their daily maximumvalues instead of their original time series. The later comparisonis not logical because, while ubc can fluctuate over positive andnegative extreme values, the use of Morlet wavelet combinesboth positive and negative peaks into a single broad peak,
Freq
uenc
y (×
10-5
Hz)
1
2
4
8
16
06/01 06/15 06/29 07/13 07/27 08/10 08/24
0 1 2 3
10-4
10-3
Freq
uenc
y (×
10-5
Hz)
Freq
uenc
y (H
z)
1
2
4
8
16
b
a
c
06/30 07/05 07/10 07/15 07/20 07/25 07/30-20
-10
0
10
20
Time (MM/DD 2006)
u bc (c
ms-1
)
0
1
2
3
4
5
<W>(
t) (o
C2 )
<W>(t)d log o C2
log o C2
-4 -3 -2 -1 0 1
Fig. 8. (a) Logarithm of wavelet power of temperature 9Wðs,tÞ92at station A7 in summer 2006; (b) zoom in of wavelet power in July 2006 during surf zone water quality
sampling; (c) wavelet power in high frequency range in July 2006; (d) cross-shore baroclinic current ubc averaged from 2 to 7 mab at A and the scaled averaged wavelet
power at A7 in July 2006. See the caption of Fig. 7 for more details.
S.H.C. Wong et al. / Continental Shelf Research 34 (2012) 64–78 73
resulting in a low temporal resolution of wavelet power (Torrenceand Compo, 1998). The comparison shows that the near bottomcross-shore baroclinic current at A as positively, significantlycorrelated with the wavelet power of temperature at A5, A7, D0,HP (Table 4). The significant correlation between the proxy andwavelet power at various stations supports the connectionbetween strong bottom cross-shore baroclinic currents and highintensity internal wave activity.
For comparison with surf zone water quality, ubc was temporallyaveraged over 4 h and lagged by 6 h before each water samplingtime. By averaging over 4 h, the proxy has its largest value duringperiods of persistent, strong onshore flow. The 4 h average was bestcorrelated to the temperature at HP (during summers of 2005 and2006) at a lag of 6 h. Thus the 6 h lag corresponds to the averagetime of internal wave propagation from A to the coast. For example,the temperature measured at HP at 1700 h was best correlated withubc averaged between 0700 and 1100 h on the same day. Averaging
periods other than 4 h were also tested and found not to providebetter correlations with cooling at HP. An alternative proxy consist-ing of the product of ubc and the wavelet power of temperature wasalso considered. The inclusion of the signatures of the temperaturefluctuations in the proxy resulted in generally the same associationbetween the proxy and all water quality variables as using theproposed proxy that uses just ubc. For simplicity, the internal waveproxy was defined based on ubc only.
4.8. Correlation of internal waves and twice daily water quality
Table 5 shows the correlation between the internal wave proxy(i.e., the bottom cross-shore baroclinic current, 4 h averaging and 6 hlag) and the twice-daily surf zone water quality parameters at HSBin August 2005 (n¼56) and July 2006 (n¼54). In August 2005, theproxy was positively correlated with phosphate (r¼ 0:42, po0:05)and silicate (r¼ 0:34, po0:05), but was not significantly correlated
−1 0 12
4
6
8
10
12
14
16
Cross−shore normalized amplitude
Dep
th (m
ab)
pc1pc2pc3
−0.1 0 0.1
−0.1
0
0.1
Onshore velocity (ms−1)
Bottom
−0.1 0 0.1
−0.1
0
0.1
Surface
−0.1
0
0.1
Alo
ngsh
ore
velo
city
(ms−
1)
Mid−water pc1
pc2
pc3
Fig. 9. (a) Vertical structure of the first three principal components of horizontal velocity in summer 2005 at A in the cross-shore direction; (b) standard deviation ellipses
of the first three principal components at bottom (3 mab), mid-water (10 mab), and near surface (16 mab). The x- and y-axis represent the cross-shore and alongshore
direction, respectively.
Dep
th (m
ab)
5
10
15
ms−1
−0.1−0.0500.050.10.15
Dep
th (m
ab)
5
10
15
°C
101214161820
00:00 06:00 12:00 18:00 00:001214161820
Time (hh:mm)
Tem
pera
ture
(°C
)
A0 B0 D0 HP
onshore
offshore
Fig. 10. Water temperature and velocity on 17 June 2005. (a) Baroclinic current in the cross-shore direction at station A; (b) water temperature at station A; (c) water
temperature at A0, B0, D0, and Huntington Pier (HP). All temperature data were low-passed at 15 min.
S.H.C. Wong et al. / Continental Shelf Research 34 (2012) 64–7874
10−6 10−5 10−40
5
10
15
Spe
ctra
l pow
er (1
0−3 m
2 s−2
)
Frequency (Hz)
20052006
Fig. 11. Variance-preserving power spectra of the internal wave proxy in summer
2005 and 2006.
Table 4Spearman’s rank correlation between daily maximum bottom cross-shore bar-
oclinic current magnitude at A and daily maximum wavelet power at selected
stations in summer 2005 and 2006. N/A¼temperature was not measured at B0
and D0 in summer 2006. Correlations with asterisks were significant at po0:05.
Station 2005 2006
A0 0.13 0:57n
A5 0:52n 0:65n
A7 0:52n 0:63n
B0 0.19 N/A
D0 0:41n N/A
HP 0:45n 0.04
Table 5Spearman’s rank correlation between the internal wave proxy and surf zone water
quality in August 2005 and July 2006. Correlations with asterisks are statistically
significant at p¼0.05.
Parameter August 2005 July 2006
Total coliform 0.17 0.47n
E. coli 0.16 0.49n
Enterococci 0.20 0.33n
Chl a �0.04 �0.03
Phosphate 0.42n 0.32n
Silicate 0.34n 0.03
DIN 0.18 0.22
S.H.C. Wong et al. / Continental Shelf Research 34 (2012) 64–78 75
to FIB concentrations. In July 2006, the proxy was positivelycorrelated with phosphate (r¼ 0:32, po0:05) and all three FIB(po0:05). The correlations with total coliform (r¼ 0:47) and E. coli
(r¼ 0:49) were higher than the correlation with enterococci(r¼ 0:33). The proxy was not correlated with chl a in either year.
The non-parametric Kruskal–Wallis test was used to examinewhether the proxy was associated with the occurrence of humanfecal (HF) markers at HSB. The bottom onshore baroclinic currentwas not significantly higher when HF markers were found in thesurf zone.
5. Discussion
Consistent with previous studies at the field site (Boehm et al.,2002b; Noble et al., 2009; Nam and Send, 2011), we observed
predominantly semi-diurnal mode-1 progressive internal wavesduring the study periods of summer 2005 and 2006 in 10–20 mwaters off Huntington Beach and an association between near-shore cooling and onshore flow of subthermocline water. Coldsubthermocline water was periodically carried towards/awayfrom the shore along the bottom by the corresponding shore-ward/seaward near bottom baroclinic flow. These repeatedmotions could cause significant cross-shore displacement of the13 1C isotherm, for example, by as much as 2 km in 6 h from A toD on 17 June 2005 (Fig. 10c). Using the array of temperature dataand velocity at A in summer 2005, we conducted a heat budgetanalysis of bottom temperature similar to the one reported byBoehm et al. (2002b) (results not shown) and found that thenearshore cooling was well accounted for by cross-shore heatadvection near the bottom, consistent with the previous results.The heat exchange at the air–sea interface can influence the heatbudget of coastal waters (Price et al., 1986) and was not explicitlyconsidered in this study. However, the heat balance we conductedindicated that heat transport was strongly dominated by cross-shore advection, thus air–sea interface heat exchange was likelynot significant. This study did not attempt to delineate the originof the observed internal waves. It has been proposed that they aregenerated offshore of the shelf (Noble et al., 2009) and driven bysurface tides (Nam and Send, 2011).
Internal waves other than semi-diurnal internal tides werealso evident in the records. The wavelet analysis indicated thatmost of the variance was typically in the semi-diurnal band.However, the diurnal and high frequency bands also containedsubstantial fractions of the total variance. Temperature andcurrent fluctuations at the diurnal frequency have been reportedat the site previously (Boehm et al., 2002b; Nam and Send, 2011).Although subinertial waves cannot propagate freely in theregion near Huntington Beach, negative vorticity generated bythe horizontal shear of subtidal currents can decrease theeffective inertial frequency and allow propagation of subinertialwaves (Lerczak et al., 2001). Positive correlations betweentemperature in the diurnal band with onshore wind suggests thatthe diurnal temperature fluctuations in this region could becaused by diurnal sea breeze (Noble et al., 2003; Pidgeon andWinant, 2005; Woodson et al., 2007; Cudaback and McPhee-Shaw, 2009).
High frequency internal waves were observed at this site,consistent with the reports by Nam and Send (2011). The percen-tage of total energy in the high frequency band was approximately7–10% at all stations in the cross-shore array. This could suggestthat there is not significant transfer of energy from lower fre-quency internal waves into high-frequency internal wavesbetween A and surf zone (Rudnick et al., 2003), although some ofthe energy cascade could occur at deeper water on the continentalshelf offshore of A. The positive correlations of wavelet power inhigh frequency and semi-diurnal bands at all stations suggest thatinternal waves in these two bands could be driven by the sameforcing mechanisms.
This study examined temporal variation in the strength ofinternal waves using wavelet analysis, an analysis that has notbeen done at the site before. In general, freely propagatinginternal waves (1.28�10�5 Hz o f o0:03 Hz) were present whenthe water column was strongly stratified and when subthermo-cline currents were strong in the cross-shore direction. Thepresent study examined several variables that may influence theforcing of internal waves (wind, tides) or their propagation(stratification). The observed association between temperatureand its wavelet power, and stratification and wind is consistentwith Cudaback and McPhee-Shaw (2009), who observed a depen-dence of internal wave amplitudes on thermal stratification anddiurnal sea breeze at another site in California.
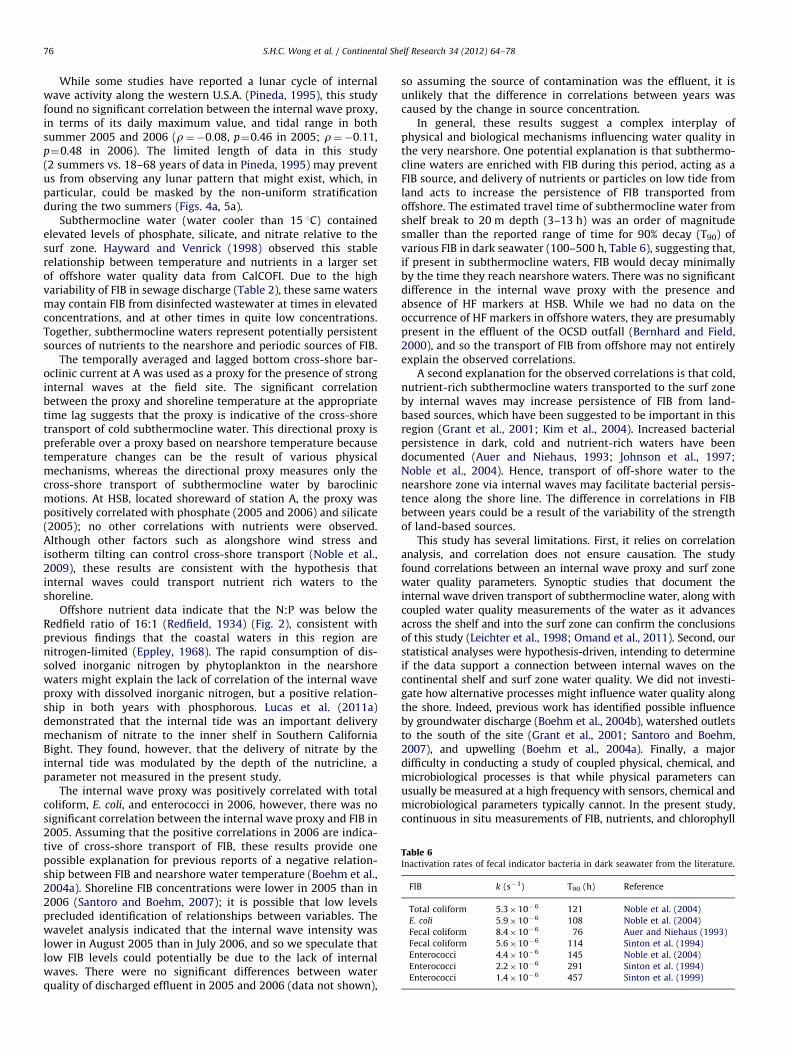
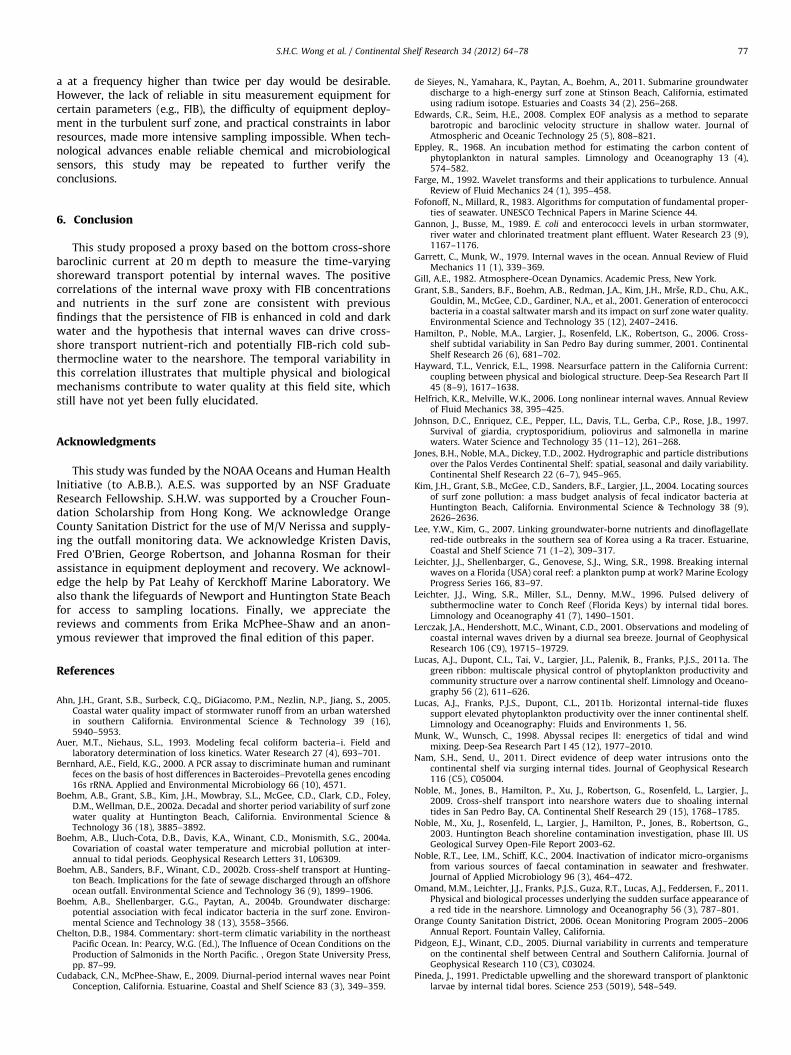
Table 6Inactivation rates of fecal indicator bacteria in dark seawater from the literature.
FIB k (s�1) T90 (h) Reference
Total coliform 5.3�10�6 121 Noble et al. (2004)
E. coli 5.9�10�6 108 Noble et al. (2004)
Fecal coliform 8.4�10�6 76 Auer and Niehaus (1993)
Fecal coliform 5.6�10�6 114 Sinton et al. (1994)
Enterococci 4.4�10�6 145 Noble et al. (2004)
Enterococci 2.2�10�6 291 Sinton et al. (1994)
Enterococci 1.4�10�6 457 Sinton et al. (1999)
S.H.C. Wong et al. / Continental Shelf Research 34 (2012) 64–7876
While some studies have reported a lunar cycle of internalwave activity along the western U.S.A. (Pineda, 1995), this studyfound no significant correlation between the internal wave proxy,in terms of its daily maximum value, and tidal range in bothsummer 2005 and 2006 (r¼�0:08, p¼0.46 in 2005; r¼�0:11,p¼0.48 in 2006). The limited length of data in this study(2 summers vs. 18–68 years of data in Pineda, 1995) may preventus from observing any lunar pattern that might exist, which, inparticular, could be masked by the non-uniform stratificationduring the two summers (Figs. 4a, 5a).
Subthermocline water (water cooler than 15 1C) containedelevated levels of phosphate, silicate, and nitrate relative to thesurf zone. Hayward and Venrick (1998) observed this stablerelationship between temperature and nutrients in a larger setof offshore water quality data from CalCOFI. Due to the highvariability of FIB in sewage discharge (Table 2), these same watersmay contain FIB from disinfected wastewater at times in elevatedconcentrations, and at other times in quite low concentrations.Together, subthermocline waters represent potentially persistentsources of nutrients to the nearshore and periodic sources of FIB.
The temporally averaged and lagged bottom cross-shore bar-oclinic current at A was used as a proxy for the presence of stronginternal waves at the field site. The significant correlationbetween the proxy and shoreline temperature at the appropriatetime lag suggests that the proxy is indicative of the cross-shoretransport of cold subthermocline water. This directional proxy ispreferable over a proxy based on nearshore temperature becausetemperature changes can be the result of various physicalmechanisms, whereas the directional proxy measures only thecross-shore transport of subthermocline water by baroclinicmotions. At HSB, located shoreward of station A, the proxy waspositively correlated with phosphate (2005 and 2006) and silicate(2005); no other correlations with nutrients were observed.Although other factors such as alongshore wind stress andisotherm tilting can control cross-shore transport (Noble et al.,2009), these results are consistent with the hypothesis thatinternal waves could transport nutrient rich waters to theshoreline.
Offshore nutrient data indicate that the N:P was below theRedfield ratio of 16:1 (Redfield, 1934) (Fig. 2), consistent withprevious findings that the coastal waters in this region arenitrogen-limited (Eppley, 1968). The rapid consumption of dis-solved inorganic nitrogen by phytoplankton in the nearshorewaters might explain the lack of correlation of the internal waveproxy with dissolved inorganic nitrogen, but a positive relation-ship in both years with phosphorous. Lucas et al. (2011a)demonstrated that the internal tide was an important deliverymechanism of nitrate to the inner shelf in Southern CaliforniaBight. They found, however, that the delivery of nitrate by theinternal tide was modulated by the depth of the nutricline, aparameter not measured in the present study.
The internal wave proxy was positively correlated with totalcoliform, E. coli, and enterococci in 2006, however, there was nosignificant correlation between the internal wave proxy and FIB in2005. Assuming that the positive correlations in 2006 are indica-tive of cross-shore transport of FIB, these results provide onepossible explanation for previous reports of a negative relation-ship between FIB and nearshore water temperature (Boehm et al.,2004a). Shoreline FIB concentrations were lower in 2005 than in2006 (Santoro and Boehm, 2007); it is possible that low levelsprecluded identification of relationships between variables. Thewavelet analysis indicated that the internal wave intensity waslower in August 2005 than in July 2006, and so we speculate thatlow FIB levels could potentially be due to the lack of internalwaves. There were no significant differences between waterquality of discharged effluent in 2005 and 2006 (data not shown),
so assuming the source of contamination was the effluent, it isunlikely that the difference in correlations between years wascaused by the change in source concentration.
In general, these results suggest a complex interplay ofphysical and biological mechanisms influencing water quality inthe very nearshore. One potential explanation is that subthermo-cline waters are enriched with FIB during this period, acting as aFIB source, and delivery of nutrients or particles on low tide fromland acts to increase the persistence of FIB transported fromoffshore. The estimated travel time of subthermocline water fromshelf break to 20 m depth (3–13 h) was an order of magnitudesmaller than the reported range of time for 90% decay (T90) ofvarious FIB in dark seawater (100–500 h, Table 6), suggesting that,if present in subthermocline waters, FIB would decay minimallyby the time they reach nearshore waters. There was no significantdifference in the internal wave proxy with the presence andabsence of HF markers at HSB. While we had no data on theoccurrence of HF markers in offshore waters, they are presumablypresent in the effluent of the OCSD outfall (Bernhard and Field,2000), and so the transport of FIB from offshore may not entirelyexplain the observed correlations.
A second explanation for the observed correlations is that cold,nutrient-rich subthermocline waters transported to the surf zoneby internal waves may increase persistence of FIB from land-based sources, which have been suggested to be important in thisregion (Grant et al., 2001; Kim et al., 2004). Increased bacterialpersistence in dark, cold and nutrient-rich waters have beendocumented (Auer and Niehaus, 1993; Johnson et al., 1997;Noble et al., 2004). Hence, transport of off-shore water to thenearshore zone via internal waves may facilitate bacterial persis-tence along the shore line. The difference in correlations in FIBbetween years could be a result of the variability of the strengthof land-based sources.
This study has several limitations. First, it relies on correlationanalysis, and correlation does not ensure causation. The studyfound correlations between an internal wave proxy and surf zonewater quality parameters. Synoptic studies that document theinternal wave driven transport of subthermocline water, along withcoupled water quality measurements of the water as it advancesacross the shelf and into the surf zone can confirm the conclusionsof this study (Leichter et al., 1998; Omand et al., 2011). Second, ourstatistical analyses were hypothesis-driven, intending to determineif the data support a connection between internal waves on thecontinental shelf and surf zone water quality. We did not investi-gate how alternative processes might influence water quality alongthe shore. Indeed, previous work has identified possible influenceby groundwater discharge (Boehm et al., 2004b), watershed outletsto the south of the site (Grant et al., 2001; Santoro and Boehm,2007), and upwelling (Boehm et al., 2004a). Finally, a majordifficulty in conducting a study of coupled physical, chemical, andmicrobiological processes is that while physical parameters canusually be measured at a high frequency with sensors, chemical andmicrobiological parameters typically cannot. In the present study,continuous in situ measurements of FIB, nutrients, and chlorophyll
S.H.C. Wong et al. / Continental Shelf Research 34 (2012) 64–78 77
a at a frequency higher than twice per day would be desirable.However, the lack of reliable in situ measurement equipment forcertain parameters (e.g., FIB), the difficulty of equipment deploy-ment in the turbulent surf zone, and practical constraints in laborresources, made more intensive sampling impossible. When tech-nological advances enable reliable chemical and microbiologicalsensors, this study may be repeated to further verify theconclusions.
6. Conclusion
This study proposed a proxy based on the bottom cross-shorebaroclinic current at 20 m depth to measure the time-varyingshoreward transport potential by internal waves. The positivecorrelations of the internal wave proxy with FIB concentrationsand nutrients in the surf zone are consistent with previousfindings that the persistence of FIB is enhanced in cold and darkwater and the hypothesis that internal waves can drive cross-shore transport nutrient-rich and potentially FIB-rich cold sub-thermocline water to the nearshore. The temporal variability inthis correlation illustrates that multiple physical and biologicalmechanisms contribute to water quality at this field site, whichstill have not yet been fully elucidated.
Acknowledgments
This study was funded by the NOAA Oceans and Human HealthInitiative (to A.B.B.). A.E.S. was supported by an NSF GraduateResearch Fellowship. S.H.W. was supported by a Croucher Foun-dation Scholarship from Hong Kong. We acknowledge OrangeCounty Sanitation District for the use of M/V Nerissa and supply-ing the outfall monitoring data. We acknowledge Kristen Davis,Fred O’Brien, George Robertson, and Johanna Rosman for theirassistance in equipment deployment and recovery. We acknowl-edge the help by Pat Leahy of Kerckhoff Marine Laboratory. Wealso thank the lifeguards of Newport and Huntington State Beachfor access to sampling locations. Finally, we appreciate thereviews and comments from Erika McPhee-Shaw and an anon-ymous reviewer that improved the final edition of this paper.
References
Ahn, J.H., Grant, S.B., Surbeck, C.Q., DiGiacomo, P.M., Nezlin, N.P., Jiang, S., 2005.Coastal water quality impact of stormwater runoff from an urban watershedin southern California. Environmental Science & Technology 39 (16),5940–5953.
Auer, M.T., Niehaus, S.L., 1993. Modeling fecal coliform bacteria–i. Field andlaboratory determination of loss kinetics. Water Research 27 (4), 693–701.
Bernhard, A.E., Field, K.G., 2000. A PCR assay to discriminate human and ruminantfeces on the basis of host differences in Bacteroides–Prevotella genes encoding16s rRNA. Applied and Environmental Microbiology 66 (10), 4571.
Boehm, A.B., Grant, S.B., Kim, J.H., Mowbray, S.L., McGee, C.D., Clark, C.D., Foley,D.M., Wellman, D.E., 2002a. Decadal and shorter period variability of surf zonewater quality at Huntington Beach, California. Environmental Science &Technology 36 (18), 3885–3892.
Boehm, A.B., Lluch-Cota, D.B., Davis, K.A., Winant, C.D., Monismith, S.G., 2004a.Covariation of coastal water temperature and microbial pollution at inter-annual to tidal periods. Geophysical Research Letters 31, L06309.
Boehm, A.B., Sanders, B.F., Winant, C.D., 2002b. Cross-shelf transport at Hunting-ton Beach. Implications for the fate of sewage discharged through an offshoreocean outfall. Environmental Science and Technology 36 (9), 1899–1906.
Boehm, A.B., Shellenbarger, G.G., Paytan, A., 2004b. Groundwater discharge:potential association with fecal indicator bacteria in the surf zone. Environ-mental Science and Technology 38 (13), 3558–3566.
Chelton, D.B., 1984. Commentary: short-term climatic variability in the northeastPacific Ocean. In: Pearcy, W.G. (Ed.), The Influence of Ocean Conditions on theProduction of Salmonids in the North Pacific. , Oregon State University Press,pp. 87–99.
Cudaback, C.N., McPhee-Shaw, E., 2009. Diurnal-period internal waves near PointConception, California. Estuarine, Coastal and Shelf Science 83 (3), 349–359.
de Sieyes, N., Yamahara, K., Paytan, A., Boehm, A., 2011. Submarine groundwaterdischarge to a high-energy surf zone at Stinson Beach, California, estimatedusing radium isotope. Estuaries and Coasts 34 (2), 256–268.
Edwards, C.R., Seim, H.E., 2008. Complex EOF analysis as a method to separatebarotropic and baroclinic velocity structure in shallow water. Journal ofAtmospheric and Oceanic Technology 25 (5), 808–821.
Eppley, R., 1968. An incubation method for estimating the carbon content ofphytoplankton in natural samples. Limnology and Oceanography 13 (4),574–582.
Farge, M., 1992. Wavelet transforms and their applications to turbulence. AnnualReview of Fluid Mechanics 24 (1), 395–458.
Fofonoff, N., Millard, R., 1983. Algorithms for computation of fundamental proper-ties of seawater. UNESCO Technical Papers in Marine Science 44.
Gannon, J., Busse, M., 1989. E. coli and enterococci levels in urban stormwater,river water and chlorinated treatment plant effluent. Water Research 23 (9),1167–1176.
Garrett, C., Munk, W., 1979. Internal waves in the ocean. Annual Review of FluidMechanics 11 (1), 339–369.
Gill, A.E., 1982. Atmosphere-Ocean Dynamics. Academic Press, New York.
Grant, S.B., Sanders, B.F., Boehm, A.B., Redman, J.A., Kim, J.H., Mrse, R.D., Chu, A.K.,Gouldin, M., McGee, C.D., Gardiner, N.A., et al., 2001. Generation of enterococcibacteria in a coastal saltwater marsh and its impact on surf zone water quality.Environmental Science and Technology 35 (12), 2407–2416.
Hamilton, P., Noble, M.A., Largier, J., Rosenfeld, L.K., Robertson, G., 2006. Cross-shelf subtidal variability in San Pedro Bay during summer, 2001. ContinentalShelf Research 26 (6), 681–702.
Hayward, T.L., Venrick, E.L., 1998. Nearsurface pattern in the California Current:coupling between physical and biological structure. Deep-Sea Research Part II45 (8–9), 1617–1638.
Helfrich, K.R., Melville, W.K., 2006. Long nonlinear internal waves. Annual Reviewof Fluid Mechanics 38, 395–425.
Johnson, D.C., Enriquez, C.E., Pepper, I.L., Davis, T.L., Gerba, C.P., Rose, J.B., 1997.Survival of giardia, cryptosporidium, poliovirus and salmonella in marinewaters. Water Science and Technology 35 (11–12), 261–268.
Jones, B.H., Noble, M.A., Dickey, T.D., 2002. Hydrographic and particle distributionsover the Palos Verdes Continental Shelf: spatial, seasonal and daily variability.Continental Shelf Research 22 (6–7), 945–965.
Kim, J.H., Grant, S.B., McGee, C.D., Sanders, B.F., Largier, J.L., 2004. Locating sourcesof surf zone pollution: a mass budget analysis of fecal indicator bacteria atHuntington Beach, California. Environmental Science & Technology 38 (9),2626–2636.
Lee, Y.W., Kim, G., 2007. Linking groundwater-borne nutrients and dinoflagellatered-tide outbreaks in the southern sea of Korea using a Ra tracer. Estuarine,Coastal and Shelf Science 71 (1–2), 309–317.
Leichter, J.J., Shellenbarger, G., Genovese, S.J., Wing, S.R., 1998. Breaking internalwaves on a Florida (USA) coral reef: a plankton pump at work? Marine EcologyProgress Series 166, 83–97.
Leichter, J.J., Wing, S.R., Miller, S.L., Denny, M.W., 1996. Pulsed delivery ofsubthermocline water to Conch Reef (Florida Keys) by internal tidal bores.Limnology and Oceanography 41 (7), 1490–1501.
Lerczak, J.A., Hendershott, M.C., Winant, C.D., 2001. Observations and modeling ofcoastal internal waves driven by a diurnal sea breeze. Journal of GeophysicalResearch 106 (C9), 19715–19729.
Lucas, A.J., Dupont, C.L., Tai, V., Largier, J.L., Palenik, B., Franks, P.J.S., 2011a. Thegreen ribbon: multiscale physical control of phytoplankton productivity andcommunity structure over a narrow continental shelf. Limnology and Oceano-graphy 56 (2), 611–626.
Lucas, A.J., Franks, P.J.S., Dupont, C.L., 2011b. Horizontal internal-tide fluxessupport elevated phytoplankton productivity over the inner continental shelf.Limnology and Oceanography: Fluids and Environments 1, 56.
Munk, W., Wunsch, C., 1998. Abyssal recipes II: energetics of tidal and windmixing. Deep-Sea Research Part I 45 (12), 1977–2010.
Nam, S.H., Send, U., 2011. Direct evidence of deep water intrusions onto thecontinental shelf via surging internal tides. Journal of Geophysical Research116 (C5), C05004.
Noble, M., Jones, B., Hamilton, P., Xu, J., Robertson, G., Rosenfeld, L., Largier, J.,2009. Cross-shelf transport into nearshore waters due to shoaling internaltides in San Pedro Bay, CA. Continental Shelf Research 29 (15), 1768–1785.
Noble, M., Xu, J., Rosenfeld, L., Largier, J., Hamilton, P., Jones, B., Robertson, G.,2003. Huntington Beach shoreline contamination investigation, phase III. USGeological Survey Open-File Report 2003-62.
Noble, R.T., Lee, I.M., Schiff, K.C., 2004. Inactivation of indicator micro-organismsfrom various sources of faecal contamination in seawater and freshwater.Journal of Applied Microbiology 96 (3), 464–472.
Omand, M.M., Leichter, J.J., Franks, P.J.S., Guza, R.T., Lucas, A.J., Feddersen, F., 2011.Physical and biological processes underlying the sudden surface appearance ofa red tide in the nearshore. Limnology and Oceanography 56 (3), 787–801.
Orange County Sanitation District, 2006. Ocean Monitoring Program 2005–2006Annual Report. Fountain Valley, California.
Pidgeon, E.J., Winant, C.D., 2005. Diurnal variability in currents and temperatureon the continental shelf between Central and Southern California. Journal ofGeophysical Research 110 (C3), C03024.
Pineda, J., 1991. Predictable upwelling and the shoreward transport of planktoniclarvae by internal tidal bores. Science 253 (5019), 548–549.
S.H.C. Wong et al. / Continental Shelf Research 34 (2012) 64–7878
Pineda, J., 1994. Internal tidal bores in the nearshore: warm-water fronts, seawardgravity currents and the onshore transport of neustonic larvae. Journal ofMarine Research 52 (3), 427–458.
Pineda, J., 1995. An internal tidal bore regime at nearshore stations along westernUSA: predictable upwelling within the lunar cycle. Continental Shelf Research15 (8), 1023–1041.
Price, J.F., Weller, R.A., Pinkel, R., 1986. Diurnal cycling: observations and models ofthe upper ocean response to diurnal heating, cooling, and wind mixing. Journalof Geophysical Research 91 (C7), 8411–8427.
Pringle, J.M., Riser, K., 2003. Remotely forced nearshore upwelling in SouthernCalifornia. Journal of Geophysical Research 108, 3131.
Redfield, A.C., 1934. On the Proportions of Organic Derivatives in Sea Water andTheir Relation to the Composition of Plankton. University Press of Liverpool.
Reifel, K.M., Johnson, S.C., DiGiacomo, P.M., Mengel, M.J., Nezlin, N.P., Warrick, J.A.,Jones, B.H., 2009. Impacts of stormwater runoff in the Southern CaliforniaBight: relationships among plume constituents. Continental Shelf Research 29(15), 1821–1835.
Rosenfeld, L.K., McGee, C.D., Robertson, G.L., Noble, M.A., Jones, B.H., 2006.Temporal and spatial variability of fecal indicator bacteria in the surf zoneoff Huntington Beach, CA. Marine Environmental Research 61 (5), 471–493.
Rudnick, D.L., Boyd, T.J., Brainard, R.E., Carter, G.S., Egbert, G.D., Gregg, M.C.,Holloway, P.E., Klymak, J.M., Kunze, E., Lee, C.M., et al., 2003. From tides tomixing along the Hawaiian Ridge. Science 301 (5631), 355.
Saggio, A., Imberger, J., 1998. Internal wave weather in a stratified lake. Limnologyand Oceanography 43 (8), 1780–1795.
Santoro, A., Boehm, A., 2007. Frequent occurrence of the human-specificBacteroides fecal marker at an open coast marine beach: relationship towaves, tides and traditional indicators. Environmental Microbiology 9 (8),2038–2049.
Santoro, A.E., Nidzieko, N.J., Van Dijken, G.L., Arrigo, K.R., Boehm, A.B., 2010.Contrasting spring and summer phytoplankton dynamics in the nearshoreSouthern California Bight. Limnology and Oceanography 55 (1), 264–278.
Shanks, A.L., 1983. Surface slicks associated with tidally forced internal waves maytransport pelagic larvae of benthic invertebrates and fishes shoreward. MarineEcology Progress Series 13 (2), 311–315.
Sinton, L., Davies-Colley, R., Bell, R., 1994. Inactivation of enterococci and fecalcoliforms from sewage and meatworks effluents in seawater chambers.Applied and Environmental Microbiology 60 (6), 2040.
Sinton, L., Finlay, R., Lynch, P., 1999. Sunlight inactivation of fecal bacteriophagesand bacteria in sewage-polluted seawater. Applied and Environmental Micro-biology 65 (8), 3605.
Stacey, M.T., Burau, J.R., Monismith, S.G., 2001. Creation of residual flows in a partiallystratified estuary. Journal of Geophysical Research 106 (17), 17013–17037.
Torrence, C., Compo, G., 1998. A practical guide to wavelet analysis. Bulletin of theAmerican Meteorological Society 79 (1), 61–78.
Turner, J.S., 1973. Buoyancy Effects in Fluids, 1st ed. Cambridge University Press.U.S. Environmental Protection Agency, 1986. Ambient water quality criteria for
bacteria. Washington, DC.Valiela, I., Costa, J., Foreman, K., Teal, J.M., Howes, B., Aubrey, D., 1990. Transport of
groundwater-borne nutrients from watersheds and their effects on coastalwaters. Biogeochemistry 10 (3), 177–197.
Venayagamoorthy, S.K., Fringer, O.B., 2007. On the formation and propagation ofnonlinear internal boluses across a shelf break. Journal of Fluid Mechanics 577,137–159.
Woodson, C.B., Eerkes-Medrano, D.I., Flores-Morales, A., Foley, M.M., Henkel, S.K.,Hessing-Lewis, M., Jacinto, D., Needles, L., Nishizaki, M.T., O’Leary, J., et al.,2007. Local diurnal upwelling driven by sea breezes in northern Monterey Bay.Continental Shelf Research 27 (18), 2289–2302.