Embed Size (px)
Citation preview

Continental Shelf Research 31 (2011) 340–355
Contents lists available at ScienceDirect
Continental Shelf Research
0278-43
doi:10.1
n Corr
E-m
journal homepage: www.elsevier.com/locate/csr
Research papers
Latitudinal patterns of export production recorded in surface sedimentsof the Chilean Patagonian fjords (41–551S) as a responseto water column productivity
Claudia Aracena a,n, Carina B. Lange b,c, Jose Luis Iriarte c,d, Lorena Rebolledo e, Silvio Pantoja b,c
a Programa de Postgrado en Oceanografıa, Departamento de Oceanografıa, Universidad de Concepcion, Casilla 160-C, Concepcion, Chileb Departamento de Oceanografıa and Centro de Investigacion Oceanografica en el Pacıfico Sur-Oriental (COPAS), Universidad de Concepcion, Casilla 160-C, Concepcion, Chilec Programa COPAS Sur-Austral, Universidad de Concepcion, Casilla 160-C, Concepcion, Chiled Instituto de Acuicultura, Universidad Austral de Chile, Casilla 1327, Puerto Montt, Chilee Instituto de Biologıa Marina, Facultad de Ciencias, Universidad Austral de Chile, Casilla 567, Valdivia, Chile
a r t i c l e i n f o
Article history:
Received 23 November 2009
Received in revised form
9 August 2010
Accepted 18 August 2010
Keywords:
Biogenic opal
Organic carbon
Stable carbon isotopes
Primary production
Fjords
Patagonia
43/$ - see front matter & 2010 Elsevier Ltd. A
016/j.csr.2010.08.008
esponding author. Tel.: +56 41 220 3557; fax
ail address: [email protected] (C. Arace
a b s t r a c t
The Chilean Patagonian fjords region (41–561S) is characterized by highly complex geomorphology and
hydrographic conditions, and strong seasonal and latitudinal patterns in precipitation, freshwater
discharge, glacier coverage, and light regime; all of these directly affect biological production in the
water column. In this study, we compiled published and new information on water column properties
(primary production, nutrients) and surface sediment characteristics (biogenic opal, organic carbon,
molar C/N, bulk sedimentary d13Corg) from the Chilean Patagonian fjords between 411S and 551S,
describing herein the latitudinal pattern of water column productivity and its imprint in the underlying
sediments. Based on information collected at 188 water column and 118 sediment sampling sites, we
grouped the Chilean fjords into four main zones: Inner Sea of Chiloe (411 to �441S), Northern Patagonia
(441 to �471S), Central Patagonia (48–511S), and Southern Patagonia (Magellan Strait region between
521 and 551S). Primary production in the Chilean Patagonian fjords was the highest in spring–summer,
reflecting the seasonal pattern of water column productivity. A clear north–south latitudinal pattern in
primary production was observed, with the highest average spring and summer estimates in the Inner
Sea of Chiloe (2427 and 5860 mg C m�2 d�1) and Northern Patagonia (1667 and 2616 mg C m�2 d�1).
This pattern was closely related to the higher availability of nutrients, greater solar radiation, and
extended photoperiod during the productive season in these two zones. The lowest spring value was
found in Caleta Tortel, Central Patagonia (91 mg C m�2 d�1), a site heavily influenced by glacier
meltwater and river discharge loaded with glacial sediments. Biogenic opal, an important constituent of
the Chilean fjord surface sediments (SiOPAL �1–13%), reproduced the general north–south pattern of
primary production and was directly related to water column silicic acid concentrations. Surface
sediments were also rich in organic carbon content and the highest values corresponded to locations far
away from glacier influence, sites within fjords, and/or semi-enclosed and protected basins, reflecting
both autochthonous (water column productivity) and allochthonous sources (contribution of terrestrial
organic matter from fluvial input to the fjords). A gradient was observed from the more oceanic sites to
the fjord heads (west–east) in terms of bulk sedimentary d13Corg and C/N ratios; the more depleted
(d13Corg �26%) and higher C/N (23) values corresponded to areas close to rivers and glaciers. A
comparison of the Chilean Patagonian fjords with other fjord systems in the world revealed high
variability in primary production for all fjord systems as well as similar surface sediment geochemistry
due to the mixing of marine and terrestrial organic carbon.
& 2010 Elsevier Ltd. All rights reserved.
1. Introduction
The Chilean Patagonian fjords region, located between 411 and561S, cover roughly 241,000 km2, an area characterized by an
ll rights reserved.
: +56 41 220 7254.
na).
extensive coastline composed of a large number of islands, fjords,sounds, and gulfs that were formed by glacial erosion during theQuaternary and tectonic sinking of the central Chilean valley(Borgel, 1970; Rabassa, 2008). The complex topography limits orcontrols the exchange of waters between coastal regions and theopen ocean, creating micro-environments with oceanographicconditions that sustain unique ecosystems. These are character-ized by complex marine–terrestrial–atmospheric interactions that
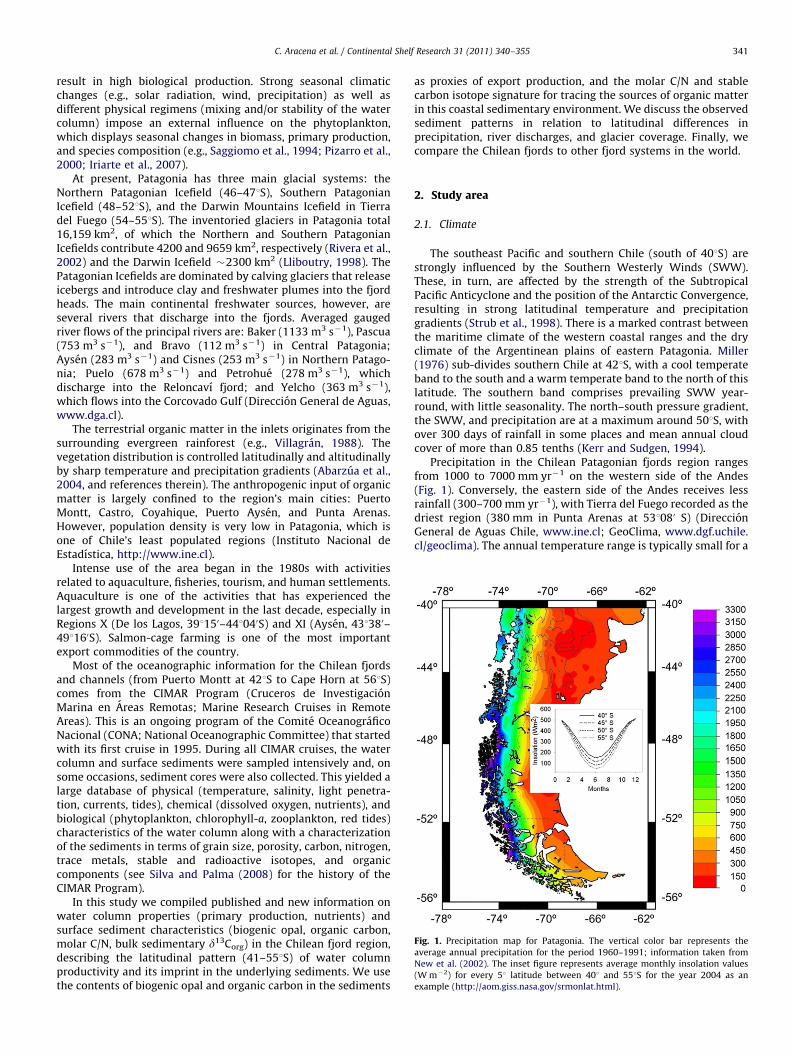
Fig. 1. Precipitation map for Patagonia. The vertical color bar represents the
average annual precipitation for the period 1960–1991; information taken from
New et al. (2002). The inset figure represents average monthly insolation values
(W m�2) for every 51 latitude between 401 and 551S for the year 2004 as an
example (http://aom.giss.nasa.gov/srmonlat.html).
C. Aracena et al. / Continental Shelf Research 31 (2011) 340–355 341
result in high biological production. Strong seasonal climaticchanges (e.g., solar radiation, wind, precipitation) as well asdifferent physical regimens (mixing and/or stability of the watercolumn) impose an external influence on the phytoplankton,which displays seasonal changes in biomass, primary production,and species composition (e.g., Saggiomo et al., 1994; Pizarro et al.,2000; Iriarte et al., 2007).
At present, Patagonia has three main glacial systems: theNorthern Patagonian Icefield (46–471S), Southern PatagonianIcefield (48–521S), and the Darwin Mountains Icefield in Tierradel Fuego (54–551S). The inventoried glaciers in Patagonia total16,159 km2, of which the Northern and Southern PatagonianIcefields contribute 4200 and 9659 km2, respectively (Rivera et al.,2002) and the Darwin Icefield �2300 km2 (Lliboutry, 1998). ThePatagonian Icefields are dominated by calving glaciers that releaseicebergs and introduce clay and freshwater plumes into the fjordheads. The main continental freshwater sources, however, areseveral rivers that discharge into the fjords. Averaged gaugedriver flows of the principal rivers are: Baker (1133 m3 s�1), Pascua(753 m3 s�1), and Bravo (112 m3 s�1) in Central Patagonia;Aysen (283 m3 s�1) and Cisnes (253 m3 s�1) in Northern Patago-nia; Puelo (678 m3 s�1) and Petrohue (278 m3 s�1), whichdischarge into the Reloncavı fjord; and Yelcho (363 m3 s�1),which flows into the Corcovado Gulf (Direccion General de Aguas,www.dga.cl).
The terrestrial organic matter in the inlets originates from thesurrounding evergreen rainforest (e.g., Villagran, 1988). Thevegetation distribution is controlled latitudinally and altitudinallyby sharp temperature and precipitation gradients (Abarzua et al.,2004, and references therein). The anthropogenic input of organicmatter is largely confined to the region’s main cities: PuertoMontt, Castro, Coyahique, Puerto Aysen, and Punta Arenas.However, population density is very low in Patagonia, which isone of Chile’s least populated regions (Instituto Nacional deEstadıstica, http://www.ine.cl).
Intense use of the area began in the 1980s with activitiesrelated to aquaculture, fisheries, tourism, and human settlements.Aquaculture is one of the activities that has experienced thelargest growth and development in the last decade, especially inRegions X (De los Lagos, 391150–441040S) and XI (Aysen, 431380–491160S). Salmon-cage farming is one of the most importantexport commodities of the country.
Most of the oceanographic information for the Chilean fjordsand channels (from Puerto Montt at 421S to Cape Horn at 561S)comes from the CIMAR Program (Cruceros de InvestigacionMarina en Areas Remotas; Marine Research Cruises in RemoteAreas). This is an ongoing program of the Comite OceanograficoNacional (CONA; National Oceanographic Committee) that startedwith its first cruise in 1995. During all CIMAR cruises, the watercolumn and surface sediments were sampled intensively and, onsome occasions, sediment cores were also collected. This yielded alarge database of physical (temperature, salinity, light penetra-tion, currents, tides), chemical (dissolved oxygen, nutrients), andbiological (phytoplankton, chlorophyll-a, zooplankton, red tides)characteristics of the water column along with a characterizationof the sediments in terms of grain size, porosity, carbon, nitrogen,trace metals, stable and radioactive isotopes, and organiccomponents (see Silva and Palma (2008) for the history of theCIMAR Program).
In this study we compiled published and new information onwater column properties (primary production, nutrients) andsurface sediment characteristics (biogenic opal, organic carbon,molar C/N, bulk sedimentary d13Corg) in the Chilean fjord region,describing the latitudinal pattern (41–551S) of water columnproductivity and its imprint in the underlying sediments. We usethe contents of biogenic opal and organic carbon in the sediments
as proxies of export production, and the molar C/N and stablecarbon isotope signature for tracing the sources of organic matterin this coastal sedimentary environment. We discuss the observedsediment patterns in relation to latitudinal differences inprecipitation, river discharges, and glacier coverage. Finally, wecompare the Chilean fjords to other fjord systems in the world.
2. Study area
2.1. Climate
The southeast Pacific and southern Chile (south of 401S) arestrongly influenced by the Southern Westerly Winds (SWW).These, in turn, are affected by the strength of the SubtropicalPacific Anticyclone and the position of the Antarctic Convergence,resulting in strong latitudinal temperature and precipitationgradients (Strub et al., 1998). There is a marked contrast betweenthe maritime climate of the western coastal ranges and the dryclimate of the Argentinean plains of eastern Patagonia. Miller(1976) sub-divides southern Chile at 421S, with a cool temperateband to the south and a warm temperate band to the north of thislatitude. The southern band comprises prevailing SWW year-round, with little seasonality. The north–south pressure gradient,the SWW, and precipitation are at a maximum around 501S, withover 300 days of rainfall in some places and mean annual cloudcover of more than 0.85 tenths (Kerr and Sudgen, 1994).
Precipitation in the Chilean Patagonian fjords region rangesfrom 1000 to 7000 mm yr�1 on the western side of the Andes(Fig. 1). Conversely, the eastern side of the Andes receives lessrainfall (300–700 mm yr�1), with Tierra del Fuego recorded as thedriest region (380 mm in Punta Arenas at 531080 S) (DireccionGeneral de Aguas Chile, www.ine.cl; GeoClima, www.dgf.uchile.cl/geoclima). The annual temperature range is typically small for a

C. Aracena et al. / Continental Shelf Research 31 (2011) 340–355342
maritime climate and the mean temperature oscillates between5.5 1C in the extreme south (541S) and 11 1C at 421S (Miller, 1976).
Insolation has a marked latitudinal and seasonal pattern.Annual mean values are the highest at 401S and the lowest at 551S(W m�2, Atmosphere–Ocean Model, http://aom.giss.nasa.gov/srmonlat.html). On a seasonal scale, insolation values are higherin austral spring–summer (October–January) than in winter(June–August) (Fig. 1, inset).
2.2. Oceanography
The southern Pacific coast of the South American continent isunder the oceanic influence of the West Wind Drift Current,which divides into two branches upon reaching the Chilean coast,transporting sub-Antarctic water along the coast. The northernbranch is known as the Humboldt or Peru–Chile Current and thesouthern branch as the Cape Horn Current (Silva and Neshyba,1979). Driven by the West Wind Drift, sub-Antarctic waterpenetrates the inlets (Silva et al., 1998).
The three main glacial fields and especially several majorrivers mentioned above incorporate fresh waters into the fjordsystem, inducing estuarine conditions with a stratified two-layerwater column (Silva et al., 1995), with net movement in thesurface layer towards the adjacent ocean and in the deep layertowards the fjords. This onshore flow delivers oceanic nutrients tothe nearshore region below the surface waters (sub-AntarcticWater, loaded with macronutrients). The upper 20–30 m of thewater column have very low salinity and are usually devoid ofnutrients other than dissolved silicon derived from river runoff(Silva and Neshyba, 1979; Iriarte et al., 2007); this surface layerdeepens offshore (Pickard, 1971; Strub et al., 1998; Davila et al.,2002). Strong vertical gradients (pycnocline, oxycline, nutricline)separate the upper layer from the deep layer (Sievers and Silva,2008), and mixing is necessary to bring nutrients up into theeuphotic zone (Montecino et al., 2004). The interaction betweensub-Antarctic waters and the diluted waters from the fjordsdefine a coastal salinity front between 421 and 561S (Silva andNeshyba, 1979; Davila et al., 2002). The front is present during thewhole year, with the strongest gradients in summer (Acha et al.,2004). Details on the water masses in the Chilean fjord region andschematic models of general circulation patterns can be found inSievers and Silva (2008).
It is important to remark that circulation and water massexchange between basins is limited by important submarinetopographical features (i.e., Desertores, Meninea, AngosturaInglesa, and Carlos III constrictions). These impose importantcontrasts among the four oceanographic zones in terms of organicmatter production due to differences in nutrient availability(Sievers and Silva, 2008).
2.3. Plankton
Published information on chlorophyll-a and primary produc-tivity show that the fjord area between 411 and 561 S is highlyvariable. Values reported for the Inner Sea of Chiloe and the headof the fjords (41–431S) range from 1–25 mg Chl-a m�3 and1–23 mg C m�3 h�1, respectively (Iriarte et al., 2007); furthersouth, values for the area between Penas Gulf and theMagellan Strait (47–501 S) range from 0.1–15 mg Chl-a m�3 to1.5–96 mg C m�3 h�1, respectively (Pizarro et al., 2000).
Phytoplankton assemblages show high spatial and temporalheterogeneity (Alves-de-Souza et al., 2008, and references therein).Diatoms are the most frequent and abundant group year-round(predominance of R-strategist species), whereas dinoflagellates areonly important on some occasions (when they form blooms), and
nanoflagellate abundances are highest in summer and autumn inthe most southern area. Paredes and Montecino (this issue) showthat the dominant size fraction depends on total chlorophyll-a:small phytoplankton cells dominate in winter or at stations withcontinental influence when total chlorophyll-a values are low,whereas the larger micro-phytoplankton fraction prevails in springwhen total chlorophyll-a values are high.
The high rates of phytoplankton growth in spring–summer(Avaria et al., 1999; Pizarro et al., 2000) favor the abundance ofplanktonic herbivores and carnivores (e.g., Palma and Silva, 2004).Planktonic crustaceans (copepods, euphausiids) are the mostabundant in the fjords and channels, followed by chaetognathsand gelatinous carnivores (Palma and Silva, 2004). A recent studyon the fate of primary production in the pelagic food web of theInner Sea of Chiloe (Gonzalez et al., 2010) reveals contrastinggrazing pressure of zooplankton and export production for springand winter: zooplankton grazing on diatom-dominated micro-plankton and the relative dominance of the classical food webwith increased export production vs. zooplankton grazing onnanoplankton and the relative dominance of the microbial loopwith lower export production, respectively.
2.4. Sediments
Silva and Prego (2002) spatially segregate the whole Patago-nian Region into three large macro-zones (each having severalsub-zones) according to the distribution of the carbon andnitrogen concentrations in the sediments: Northern (PuertoMontt to Penınsula Taitao), Central (Golfo de Penas to Strait ofMagellan), and Southern (Magellan to Cape Horn) zones. Thesemacro-zone have mean organic carbon values of 0.38–1.75%(Northern Zone), 0.44–1.43% (Central Zone), and 0.29–0.90%(Southern Zone) (see Silva, 2008). In general, the terrigenousorganic matter content in the sediments increases from theoceanic area to the heads of the fjords due to local river discharges(Pinto and Bonert, 2005). Sediments influenced by glaciers havevery low organic matter due to dilution by the large amounts ofinorganic matter contributed by glaciers (Silva, 2008, andreferences therein). Based on carbon:nitrogen ratios, Silva andPrego (2002) observe values between 5.4 and 11.4 (for the entirePatagonia fjords area), and Sepulveda et al. (this issue) reportsratios of 9.6–16.9 (in fjords from Northern Patagonia). Both worksshow that this ratio increases from the open ocean sediments toinner fjord areas.
Sedimentation rates are high in the Chilean fjords. Estimatedvalues based on 210Pb are 0.26–0.36 cm yr�1 for Aysen Fjordand Costa Channel (Rojas, 2002; Salamanca and Jara, 2003);0.15 cm yr�1 for Cupquelan Fjord, 0.67 cm yr�1 for QuitralcoFjord (Salamanca and Jara, 2003); and 0.25–0.75 cm yr�1 forPuyuhuapi Channel (Rebolledo et al., 2005; Sepulveda et al.,2005). For the oceanic area off Chiloe and the western entrance ofthe Magellan Strait, estimated sedimentation rates are 0.22–0.29 cm yr�1 (Munoz et al., 2004) and 0.25 cm yr�1 (Munoz, pers.comm.), respectively.
During the CIMAR 7 Fiordos cruise, sediment cores encom-passing the last 2000 years of sedimentation were retrieved fromNorthern Patagonia. The study of these records reveals periods ofvariable marine and continental contributions, temperature, andhumidity intimately linked to SWW intensity at interdecadal/multi-decadal scales (e.g., Rebolledo et al. 2008; Sepulveda et al.,2009). Recent works on marine and lake sediments from NorthernPatagonia and the adjacent oceanic area also demonstrate thatfluctuations in El Nino Southern Oscillation (ENSO) activity andassociated low-latitude climate systems have a strong control

C. Aracena et al. / Continental Shelf Research 31 (2011) 340–355 343
over the climatic variability of this region (e.g., Ariztegui et al.,2007; Mohtadi et al., 2007; Rebolledo et al., 2008).
In the past six years, several international cruises have takenplace in the Chilean fjords and adjacent oceanic area. Thesecruises, which aimed to recover high-resolution long sedimentcores encompassing the time period since the Last GlacialMaximum, were: JAMSTEC Beagle expedition 2003, Palmer cruiseNBP0505 2005, PACHIDERME cruise 2007, and Mirai MR08-06 leg 2in 2009, which also included present-day observations of watercolumn chemistry and biology as well as pelagic–benthiccoupling.
Fig. 2. Map of the Chilean Patagonia (NASA World Wind 1.4) and the locations
studied in each of the four zones, from N to S: Inner Sea of Chiloe; Northern,
Central, and Southern Patagonia.
3. Material and methods
Our study area covered 141 of latitude (41–551S) and includedwater column and surface sediment data (see below). Thediversity of the Chilean fjord system in terms of sedimentaryenvironment was mainly derived from its geomorphology, rainfalltype and patterns, glacier coverage, and productivity related tonutrient and light availability. Given this heterogeneity and basedon the initial spatial segregation defined by Silva and Prego(2002), we grouped the Chilean fjords into four main zones:(1) Inner Sea of Chiloe, from Reloncavı Fjord (411S) to the GuafoMouth (�441S); (2) Northern Patagonia, from the north entranceof Moraleda Channel to Cupquelan Fjord, also including oceanicsites (441–�471S); (3) Central Patagonia, from �481S to Concep-cion Channel (511S); and (4) Southern Patagonia, which includesthe Magellan Strait region between �521S and Marinelli Fjord(�551S) (Fig. 2).
In order to summarize and characterize each fjord, sound, and/or channel system, water column and sediment data wereaveraged first by location (using all stations within each location)and then locations were averaged by zone in order to describe ageneral zonal productivity pattern and its imprint in thesediments of the Chilean fjords. All locations in tables and figuresare organized from north to south.
3.1. Water column data
Primary production (PP) and/or nutrient concentration datawere available for a total of 188 water column stations. Thisinformation was summarized by location within each zone(Table 1), as mentioned above, in order to give an overview ofthe patterns of PP and nutrients in spring (and summer whenavailable) in the four zones of Patagonia. The Inner Sea of Chiloewas represented by 49 water column stations, whereas Northern,Central, and Southern Patagonia were composed of 101, 17, and21 water column stations, respectively.
Published data was obtained from the CENDHOC reports(Centro Nacional de Datos Hidrograficos y Oceanograficos deChile) for the spring legs of the CIMAR cruises 8, 9, and 10 (InnerSea of Chiloe); 4, 7, 8, and 9 (Northern Patagonia); 2 (CentralPatagonia); and 3 (Southern Patagonia) carried out in the Chileanfjord region between 1995 and 2004 onboard the AGOR Vidal
Gormaz (http://www.shoa.cl/cendhoc/organizacion/datareport_cimar.htm). In addition, we included new unpublished informationfrom the more recent spring CIMAR cruises: 12 (Inner Sea ofChiloe), 13 (Northern Patagonia), and 14 (Central Patagonia)carried out in 2006, 2007, and 2008, respectively. For the new PPestimates, water samples were collected at depths of 0, 5, 15, and30 m using 5-L PVC Go-Flo bottles. The retrieved samples wereincubated in 125-mL borosilicate polycarbonate bottles (twoclear+one dark bottle) and placed in a natural-light incubator forca. 4 h (mainly between 10:00 AM and 14:00 PM). Temperaturewas regulated by running surface seawater over the incubation
bottles. Sodium bicarbonate (20–40 mCi–NaH14CO3) was added toeach bottle. Primary production was measured using the methoddescribed by Steemann-Nielsen (1952). Samples were manipu-lated under subdued light conditions during pre- and post-incubation periods. Filters (0.7 mm) were placed in 20-mL plasticscintillation vials and kept at –15 1C until reading (15 days later).

Table 1Water column. Averaged primary production and nutrient concentrations for each location within each of the four zones: Inner Sea of Chiloe; Northern, Central, and
Southern Patagonia. Blank spaces¼no data.
Zone Location No. of stations PP (mg C m�2 d�1) Nutrients in spring
Spring Summer NO�3 (mM) PO�34 (mM) Si(OH)4 (mM)
Inner Sea of Chiloe Reloncavı Fjord 8 4754.41 9406.84 5.48 0.85 23.81
Reloncavı Sound 4 8.38 1.14 9.02
Comau Fjord 4 1147.83 2313.50 5.02 0.79 7.13
Ancud Gulf 18 5.97 1.17 3.74
Corcovado Gulf 6 2228.41 12.04 1.57 5.58
Guafo Mouth 4 134.10 6.11 0.96 3.42
Guafo Mouth (oceanic) 5 3875.13 4.32 0.70 2.25
Northern Patagonia N entrance Moraleda Channel 5 4812.64 7.81 0.91 6.75
Moraleda Channel 25 3504.43 2687.30 7.70 0.89 9.53
Costa Channel 2 1424.00 11.50 1.30 27.25
Jacaf Fjord 4 235.80 4.50 0.69 7.29
Jacaf/Puyuhuapi 1 289.80 2.36 0.47 9.60
Puyuhuapi Fjord 6 869.49 1975.14 2.43 0.47 13.28
Aysen Fjord 20 540.55 4381.00 9.29 0.95 34.03
Quitralco Fjord 5 2295.00 11.40 1.23 14.95
Elefantes Gulf 6 793.58 10.67 1.17 24.75
Cupquelan Fjord 1 7.58 0.87
Oceanic Sites 26 6.37 0.90 5.81
Central Patagonia Tortel 1 91.00 2.03 0.31 19.50
Steffen Fjord 2 345.29
Baker Channel 2 1.57 0.38 6.50
Messier Channel 4 463.16 4.20 0.47 1.75
Paso del Indio 1 994.50
Penguin Sound 1 0.30 1.52 4.00
Europa Sound 1 3.60 0.67 2.00
Eyre Sound 1 799.00 7.28 0.52 2.75
Icy Channel 1 1093.50 3.85 0.79 1.25
Concepcion Channel 3 977.58 5.64 0.97 1.00
Southern Patagonia W entrance Magellan Strait 3 344.61 5.70 0.78 6.88
Paso del Mar 5 106.00 407.43 5.64 0.78 7.25
Otway Sound 1 1704.00
Carlos III Island 3 238.64 5.83 0.75 2.50
Central Magellan Strait 7 1741.67 681.48 5.19 0.80 4.38
Inutil Bay 1 5.28 0.77 3.33
Marinelli Fjord 1 0.75 0.43 2.00
C. Aracena et al. / Continental Shelf Research 31 (2011) 340–355344
To remove excess inorganic carbon, filters were treated with HClfumes for 24 h. A cocktail (8 mL, Ecolite) was added to the vialsand radioactivity was determined in a liquid scintillation counter(Beckmann).
Depth-integrated values of PP (mg C m�2 h�1) were estimatedusing trapezoidal integration over the euphotic zone (25–30 m),with the exception of Central Patagonia, where the samplingdepth reached only the upper 10 m. Integrated production ratesper hour were multiplied by daily light hours for the Chileanfjords and are given in mg C m�2 d�1 (spring–summer: 9 h;Iriarte et al., 2001, 2007). Integrated production rates given perhour in the literature were multiplied by daily light hours. Fornutrients, nitrate, orthophosphate, and silicic acid concentrations(mM) were averaged for the upper 25 m of the water column in allfour zones.
Although most information on PP and nutrients was availablefor the spring period (September through December) in all areas,we also included summer PP data published by Magazz �u et al.(1996) for Southern Patagonia and unpublished summer PP datafor the Inner Sea of Chiloe and Northern Patagonia.
3.2. Sediment data
The sedimentological characterization of the Chilean fjordswas based on a total of 118 sediment stations. The majorcontribution to this information came from 74 stations sampled
by the CIMAR cruises 7 and 10 (Inner Sea of Chiloe); 4, 7, and 8
(Northern Patagonia); 2 (Central Patagonia), and 3 (MagellanStrait). Additionally, new data were included for 26 sedimentstations that were sampled by other cruises in the fjord region:Beagle expedition (2003), Palmer NBP0505 (2005), Gran Campo II
(2005 and 2007), PACHIDERME (2007), Reloncavı (2008),Baker/Tortel (2008), and Mirai MR08-06 leg 2 (2009) (Table 2).
Table 3 presents the stations and locations within each of thefour zones: 37 stations in the Inner Sea of Chiloe, 33 in NorthernPatagonia, and 24 stations each in Central and SouthernPatagonia. For the first two zones (Inner Sea of Chiloe, NorthernPatagonia), published data were used for biogenic opal (Rebolle-do, 2007; Silva et al., 2009), organic carbon (Corg), molar C/N(Sepulveda, 2005; Rojas and Silva, 2005; Silva, 2008; Silva et al.,2009), and bulk sedimentary d13Corg (Pinto and Bonert, 2005;Sepulveda, 2005; Silva et al., 2009; Rebolledo et al., this issue).Information for Central and Southern Patagonia relied on thepublications of Baeza (2005) and Silva (2008), and largely onunpublished data (Table 2). For these zones, biogenic opal datawere new and are reported as %SiOPAL.
Biogenic opal was determined following the methodology ofMortlock and Froelich (1989), which consists of the extraction ofsilica with an alkaline solution at 85 1C for 6 h, and measuringdissolved silicon concentrations in the extracts by spectrophoto-metry at 812 nm.
Most of the sediment information reported here refers tosurface sediments collected with box-, multi-, Rhumor-, or Haps

Table 2
Sediment stations and data sources used for biogenic opal, organic carbon (Corg), molar C/N, and carbon stable isotope d13C in surface sediments from Patagonia. Data
sources: 1: Silva et al. (2009), 2: Rebolledo et al. (this issue), 3: Rebolledo et al. (2005), 4: Rebolledo (2007), 5: Rebolledo et al. (2008), 6: Sepulveda (2005), 7: Silva (2008),
8: Caniupan (pers. comm.); 9: Harada (pers. comm.); 10: Kilian (pers. comm.); 11: Bertrand (pers. comm.); 12: Baeza (2005), 13: Rojas and Silva (2005; ndata taken from
figures); 14: Pinto and Bonert (2005).
Zone Location Cruise Station Ref opal Ref C/N and Corg Ref d13C
Inner Sea of Chiloe Reloncavı Fjord CIMAR 10 4 1 1 1
Reloncavı Fjord CIMAR 10 5 1 1
Reloncavı Fjord CIMAR 10 6 1 1 1
Reloncavı Fjord CIMAR 10 7 1 1 1
Reloncavı Fjord Reloncavı 6B This study This study 1
Reloncavı Sound CIMAR 10 1 1 1 1
Reloncavı Sound CIMAR 10 2 1 1
Reloncavı Sound CIMAR 10 3 1 1
Reloncavı Sound CIMAR 10 8 1 1 1
Reloncavı Sound PACHIDERME MD07-3102CQ This study This study
Ancud Gulf CIMAR 10 10 1 1 1
Ancud Gulf CIMAR 10 12 1 1 1
Ancud Gulf CIMAR 10 13 1 1
Ancud Gulf CIMAR 10 14 1 1
Ancud Gulf CIMAR 10 15 1 1
Ancud Gulf CIMAR 10 16 1 1 1
Ancud Gulf CIMAR 10 17 1 1 1
Ancud Gulf CIMAR 10 20 1 1 1
Ancud Gulf CIMAR 10 21 1 1
Ancud Gulf CIMAR 10 22 1 1 1
Ancud Gulf CIMAR 10 24 1 1 1
Ancud Gulf CIMAR 10 25 1 1
Ancud Gulf CIMAR 10 26 1 1
Ancud Gulf CIMAR 10 27 1 1 1
Ancud Gulf CIMAR 10 28 1 1
Ancud Gulf CIMAR 10 29 1 1 1
Ancud Gulf CIMAR 10 30 1 1
Ancud Gulf CIMAR 10 41 1 1
Ancud Gulf PACHIDERME MD07-3109H 2 2
Comau Fjord CIMAR 10 18 1 1 1
Comau Fjord CIMAR 10 19 1 1 1
Corcovado Gulf CIMAR 10 35 1 1 1
Corcovado Gulf CIMAR 10 37 1 1 1
Corcovado Gulf CIMAR 10 39 1 1 1
Corcovado Gulf CIMAR 10 43 1 1 1
Corcovado Gulf CIMAR 10 46 1 1
Guafo Mouth (oceanic) CIMAR 7 1 1 1 1
Northern Patagonia N entrance Moraleda Channel CIMAR 7 6 1 1 1
N entrance Moraleda Channel CIMAR 8n 6 13
N entrance Moraleda Channel CIMAR 4 6 14
Moraleda Channel CIMAR 8n 8 13
Moraleda Channel CIMAR 8n 9 13
Moraleda Channel CIMAR 8n 11 13
Moraleda Channel CIMAR 8n 14 13
Moraleda Channel CIMAR 4 11 14
Moraleda Channel CIMAR 4 14 14
Jacaf Fjord CIMAR 7 BC 33 3 6 6
Jacaf Fjord CIMAR 7 PC 33 5 6 6
Jacaf Fjord CIMAR 7 36 6 6
Puyuhuapi Fjord CIMAR 7 BC 35 3 6 6
Puyuhuapi Fjord CIMAR 7 BC 40 3 6 6
Puyuhuapi Fjord CIMAR 7 42 6 6
Puyuhuapi Fjord CIMAR 7 39 6 6
Aysen Fjord PACHIDERME MD07-3113H This study This study
Aysen Fjord CIMAR 8n 17A 13
Aysen Fjord CIMAR 4 17A 14
Aysen Fjord CIMAR 4 19 14
Aysen Fjord (head) CIMAR 4 21 14
Quitralco Fjord CIMAR 7 PC 29A 4 4
Quitralco Fjord CIMAR 7 BC 29 A 4 6 6
Quitralco Fjord CIMAR 7 29 6 6
Quitralco Fjord CIMAR 7 30A 6 6
Quitralco Fjord CIMAR 7 30 6 6
Cupquelan Fjord CIMAR 7 28 6 6
Cupquelan Fjord CIMAR 7 27 6 6
King Channel CIMAR 8n 51 13
King Channel (Oceanic) CIMAR 8n 53 13
Memory Channel CIMAR 8n 54 13
Chacabuco Channel CIMAR 8n 72 13
Pulluche Channel CIMAR 8n 76 13
Central Patagonia Tortel Baker/Tortel 8 This study This study This study
Steffen Fjord CIMAR 2 11 7
Steffen Fjord CIMAR 2 12 7
C. Aracena et al. / Continental Shelf Research 31 (2011) 340–355 345

Table 2 (continued )
Zone Location Cruise Station Ref opal Ref C/N and Corg Ref d13C
Steffen Fjord CIMAR 2 13 7
Steffen Fjord CIMAR 2 14 7
Mitchell Fjord (head) CIMAR 2 16 7
Baker Channel (head) CIMAR 2 10 7
Baker Channel Mirai MUC 40 This study This study This study
Baker Channel CIMAR 2 6 7
Baker Channel CIMAR 2 7 7
Baker Channel CIMAR 2 8 7
Baker Channel CIMAR 2 9 7
Baker Channel (oceanic) CIMAR 2 5 7
Penguin Sound CIMAR 2 34 7
Europa Sound CIMAR 2 36 7
Europa Sound CIMAR 2 39 7
Icy Channel Palmer JPC 42 This study 7
Icy Channel Palmer KC 41 This study 7
Icy Channel CIMAR 2 31 7
Icy Channel CIMAR 2 35 7
Concepcion Channel PACHIDERME MD07-3124 This study 8
Concepcion Channel CIMAR 2 40 7
Concepcion Channel CIMAR 2 42 7
Concepcion Channel (oceanic) CIMAR 2 43 7
Southern Patagonia W entrance Magellan Strait Beagle MUC 3 This study 9 9
W entrance Magellan Strait Beagle PC 3 This study 9 9
W entrance Magellan Strait CIMAR 3 12 7
W entrance Magellan Strait CIMAR 3 13 7
Paso del Mar Gran Campo II CHRR This study 10
Paso del Mar Gran Campo II TA-1 12
Skyring Sound Gran Campo II SKY-E1 12
Williams Bay Gran Campo II BW 12
Escarpada Gran Campo II ES 12
Vogel Gran Campo II VO-1 12
Inutil Bay in Skyring Sound Gran Campo II IN-1 12
Gajardo Channel Gran Campo II CG-1 12
Zanartu Island (central) Gran Campo II ZA-CE 12
Zanartu Island (south) Gran Campo II ZA-SU 12
Andres Inlet Gran Campo II AN-1 12
Carlos III Island CIMAR 3 10 7
Central Magellan Strait CIMAR 3 54 7
Central Magellan Strait CIMAR 3 55 7
Central Magellan Strait PACHIDERME MD07-3132 This study 10
Central Magellan Strait Beagle MUC 4 This study 7
Central Magellan Strait Beagle PC 4 This study 7
Inutil Bay CIMAR 3 56 7
Inutil Bay CIMAR 3 57 7
Marinelli Fjord Palmer JPC 67 This study 11 11
C. Aracena et al. / Continental Shelf Research 31 (2011) 340–355346
corers. In a few cases, it also includes the uppermost cm ofsediments collected with gravity and/or piston corers (e.g., MD07-3102CQ, MD07-3124, MD07-3132, JPC 42, JPC 67; Table 2).
In order to represent the spatial distribution of selectedvariables (i.e. silicic acid, %SiOPAL, %Corg, and bulk sedimentaryd13Corg) the software Ocean Data View 4 was used with a coastlineextracted from the optional package odvOP_coast_SouthAmer-ica_w32.exe. The graphic representation of the data was con-structed with a VG gridding. This exercise was restricted to theInner Sea of Chiloe and Northern Patagonia zones since these twozones have the best sampling coverage.
4. Results
4.1. Water column
Water column primary production (PP) and nutrient concen-trations are described for the four zones for the spring period(Table 1; Fig. 3). Water column data for each station wereaveraged by location: 7 locations in the Inner Sea of Chiloe, 11 inNorthern Patagonia, 10 in Central Patagonia, and 7 in SouthernPatagonia (Table 1).
Following the transect from 411 to 551S (Table 1; Fig. 3), veryhigh PP values were measured at locations within the Inner Sea ofChiloe (range in spring¼�1100–4800 mg C m�2 d�1; range insummer¼�2300–9000 mg C m�2 d�1) with the exception ofthe Guafo Mouth, where the lowest spring production wasobserved (134 mg C m�2 d�1). In Northern Patagonia, maxima(42200 mg C m�2 d�1) corresponded to Moraleda Channel(spring and summer), Aysen Fjord (summer), and Quitralco Fjord(spring), and the lowest spring values were observed in Jacaf fjordand in the confluence between the Jacaf and Puyuhuapi fjords(o300 mg C m�2 d�1). In Central Patagonia, the lowest spring PP(91 mg C m�2 d�1) was recorded in Caleta Tortel. Moderately lowvalues characterized Steffen Fjord and Messier Channel (345 and463 mg C m�2 d�1, respectively), whereas all other locationswithin this zone were more productive (Z800 mg C m�2 d�1).No data were available for the summer period in CentralPatagonia. Within the Magellan Strait region in SouthernPatagonia, PP values were high in spring (�1700 mg C m�2 d�1),with the exception of Paso del Mar, where estimates were oneorder of magnitude lower. Summer values ranged between 344and 681 mg C m�2 d�1.
With respect to the north–south spatial distribution ofnutrient concentrations in spring (Table 1; Fig. 3), nitrateand orthophosphate were highest in the Inner Sea of Chiloe

Table 3
Sediments. Averaged values of biogenic opal (%SiOPAL), organic carbon (Corg%), molar C/N, and carbon stable isotope d13C for surface sediments of each location within each
of the four zones: Inner Sea of Chiloe; Northern, Central, and Southern Patagonia. Blank spaces¼no data.
Zone Location No. of stations %SiOPAL Corg (%) C/N (molar) d 13C (%)
Inner Sea of Chiloe Reloncavı Fjord 5 6.47 1.26 10.73 �23.99
Reloncavı Sound 5 10.26 1.62 8.59 �20.81
Comau Fjord 2 5.56 1.89 12.10 �23.92
Ancud Gulf 19 6.29 1.18 8.71 �20.95
Corcovado Gulf 5 3.34 0.50 8.44 �21.09
Guafo Mouth (Oceanic) 1 1.00 9.59 �19.11
Northern Patagonia N entrance Moraleda Channel 3 1.57 8.42 �18.53
Moraleda Channel 6 1.54 7.70 �16.81
Jacaf Fjord 3 8.79 2.97 12.08 �22.76
Puyuhuapi Fjord 4 4.47 2.53 13.89 �24.60
Aysen Fjord 5 11.78 1.72 8.22 �22.90
Quitralco Fjord 5 12.75 1.62 12.07 �23.04
Cupquelan Fjord 2 0.67 15.06 �25.13
Oceanic Sites 5 1.00 7.06
Central Patagonia Tortel 1 1.25 0.79 22.93 �26.09
Steffen Fjord 4 0.25 11.10
Mitchell Fjord (head) 1 0.40 6.67
Baker Channel (head) 1 0.34 7.93
Baker Channel 5 3.51 0.77 10.80 �20.34
Baker Channel (oceanic) 1 1.07 7.80
Penguin Sound 1 0.45 6.56
Europa Sound 2 0.38 6.77
Icy Channel 4 4.24 1.10 8.00
Concepcion Channel 3 3.55 2.14 6.96
Concepcion Channel (oceanic) 1 0.92 6.31
Southern Patagonia W entrance Magellan Strait 4 1.38 1.23 8.21 �19.77
Paso del Mar 2 4.68 10.32 13.47
Skyring Sound Area 9 3.40
Carlos III Island 1 1.10 8.02
Central Magellan Strait 5 4.90 1.21 8.00
Inutil Bay 2 0.98 7.70
Marinelli Fjord 1 3.14 1.03 10.89 �22.17
C. Aracena et al. / Continental Shelf Research 31 (2011) 340–355 347
(Reloncavı Sound: 8.38 mM for NO�3 and 1.14 mM for PO�34 ;
Corcovado Gulf: 12.04 and 1.57 mM) and in Northern Patagonia(Costa Channel: 11.50 and 1.30 mM; Quitralco Fjord: 11.40 and1.23 mM; Elefantes Gulf: 10.67 and 1.17 mM). In Central Patagonia,Eyre Sound had the highest nitrate concentration (7.28 mM), andorthophosphate was maximal in Penguin Sound (1.52 mM). InSouthern Patagonia, these nutrients were higher in the westernand central section of the Magellan Strait (45 mM for NO�3 and40.7 mM for PO�3
4 ), whereas the lowest values corresponded toMarinelli Fjord in the eastern section of the strait. High silicic acidconcentrations characterized the locations at the fjord heads andclose to important river discharges in the Inner Sea of Chiloe andNorthern and Central Patagonia: Reloncavı (23.81 mM) and Aysenfjords (34.03 mM), and Tortel (19.50 mM). Compared to the previousthree zones, values were much lower (�2–7 mM) in SouthernPatagonia.
4.2. Sediments
The four zones were also described in terms of Corg and SiOPAL
contents, molar C/N, and the carbon stable isotope d13C of surfacesediments (Table 3; Fig. 4). Sediment data for each station wereaveraged by location, with 6 locations for the Inner Sea of Chiloe,eight for Northern Patagonia, 11 for Central Patagonia, and sevenfor Southern Patagonia (Table 3). All locations were organizedfrom N to S in the same fashion as was done for the water column(transect from 411 to 551S).
Corg and SiOPAL served as proxies of export production from thewater column to the sediments, whereas molar C/N and the stablecarbon isotope signature d13C were used as proxies of the origins
of sedimentary organic matter (Sepulveda et al., this issue). Stableisotope (d13C) information was very scarce and mainly restrictedto the sediments of the Inner Sea of Chiloe and NorthernPatagonia; only two values were available for each Central andSouthern Patagonia (Table 3).
The SiOPAL content was generally 45% in the Inner Sea ofChiloe and Northern Patagonia and 410% in Reloncavı Sound andthe fjords Aysen and Quitralco. In Central and Southern Patagonia,SiOPAL contents decreased abruptly (range 1–5%), with maximain the Icy Channel and in the Central Magellan Strait (Table 3;Fig. 4).
The Chilean fjords were rich in Corg and high values (Z1%)were observed in all zones except Central Patagonia, where suchvalues were limited to locations far away from glacier influence(e.g., Concepcion Channel). In each of the other three zones,locations within a fjord (e.g., Comau, Jacaf, Puyuhuapi, 41–3%)and/or in the semi-enclosed and protected basins of Paso del Marand Skyring Sound (43–10%) had the highest Corg contents(Table 3; Fig. 4).
Molar C/N showed the highest values (�10–23; Table 3) atlocations adjacent to the continent with an important riverinfluence and/or in the vicinity of glaciers, especially in theReloncavı (10.73), Comau (12.10), Jacaf (12.08), Puyuhuapi(13.89), Quitralco (12.07), and Cupquelan (15.06) fjords of theInner Sea of Chiloe and Northern Patagonia; in Caleta Tortel(22.93) and Steffen Fjord of Central Patagonia (11.10); and inMarinelli Fjord (10.89) and the protected area of Puerto Churruca(13.47) in Southern Patagonia. Bulk sediment d13Corg rangedbetween –16.81 (Moraleda Channel) and �26.09 (Caleta Tortel)(Table 3; Fig. 4); in general, more negative values were observedat the fjord heads.
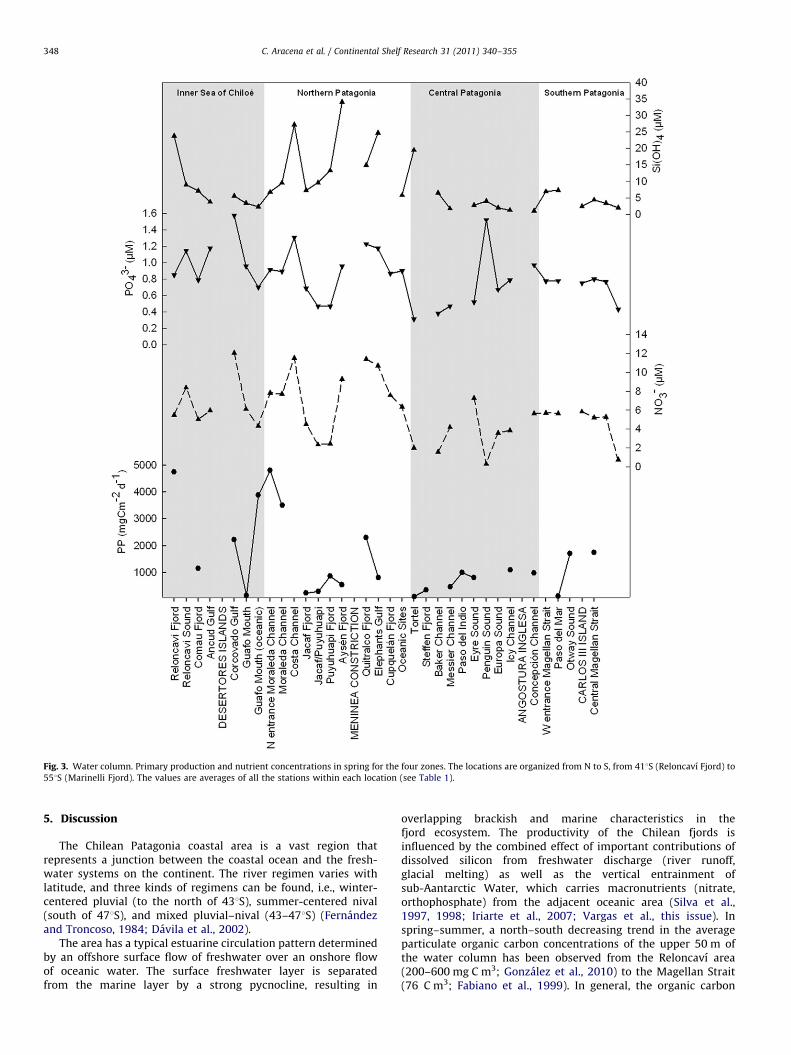
Fig. 3. Water column. Primary production and nutrient concentrations in spring for the four zones. The locations are organized from N to S, from 411S (Reloncavı Fjord) to
551S (Marinelli Fjord). The values are averages of all the stations within each location (see Table 1).
C. Aracena et al. / Continental Shelf Research 31 (2011) 340–355348
5. Discussion
The Chilean Patagonia coastal area is a vast region thatrepresents a junction between the coastal ocean and the fresh-water systems on the continent. The river regimen varies withlatitude, and three kinds of regimens can be found, i.e., winter-centered pluvial (to the north of 431S), summer-centered nival(south of 471S), and mixed pluvial–nival (43–471S) (Fernandezand Troncoso, 1984; Davila et al., 2002).
The area has a typical estuarine circulation pattern determinedby an offshore surface flow of freshwater over an onshore flowof oceanic water. The surface freshwater layer is separatedfrom the marine layer by a strong pycnocline, resulting in
overlapping brackish and marine characteristics in thefjord ecosystem. The productivity of the Chilean fjords isinfluenced by the combined effect of important contributions ofdissolved silicon from freshwater discharge (river runoff,glacial melting) as well as the vertical entrainment ofsub-Aantarctic Water, which carries macronutrients (nitrate,orthophosphate) from the adjacent oceanic area (Silva et al.,1997, 1998; Iriarte et al., 2007; Vargas et al., this issue). Inspring–summer, a north–south decreasing trend in the averageparticulate organic carbon concentrations of the upper 50 m ofthe water column has been observed from the Reloncavı area(200–600 mg C m3; Gonzalez et al., 2010) to the Magellan Strait(76 C m3; Fabiano et al., 1999). In general, the organic carbon

Fig. 4. Sediments. Percent biogenic opal (SiOPAL) and organic carbon (Corg), molar C/N, and bulk sedimentary d13C (black diamonds) for the four zones. The locations are
organized from N to S, from 411S (Reloncavı Fjord) to 551S (Marinelli Fjord). The values are averages of all stations within each location (see Tables 2 and 3).
C. Aracena et al. / Continental Shelf Research 31 (2011) 340–355 349
content in the surface sediments reflects this southerly decrease(Silva and Prego, 2002).
We summarize all water column and sediment data with theaim of characterizing each of the four zones (Inner Sea of Chiloe;Northern, Central, and Southern Patagonia) in terms of produc-tivity and its imprint in the surface sediments. For this purpose,all locations are averaged by zone (Table 4; Fig. 5).
5.1. Water column
The Inner Sea of Chiloe and Northern Patagonia are the zoneswith the highest PP spring and summer values (2428–5860 and1667–2617 mg C m�2 d�1, respectively), and also with the high-est nutrient concentrations (Table 4). In the literature, these twozones are considered to be very productive marine systems interms of phytoplankton and zooplankton biomass (e.g., Iriarteet al., 2007; Palma, 2008). Here, the latitudinal changes observedin PP seem to be tied to seasonal patterns in the light regime(Gonzalez et al., 2010). In the Inner Sea of Chiloe, for example,Gonzalez et al. (2010) show that the higher solar radiation and
extended photoperiod of spring promote the growth of chain-forming diatoms in the water column. During spring in the InnerSea of Chiloe, Iriarte et al. (2007) and Gonzalez et al. (2010) notethat micro-phytoplankton (mainly the chain-forming diatomsSkeletonema, Chaetoceros, and Thalassiosira) account for a sig-nificant portion of the biomass (460%), whereas nanoplanktondominate during post-bloom events and winter months. In Aysenfjord in Northern Patagonia, the micro-phytoplankton fractioncontributes 77% and 40% to the mean total chlorophyll concen-trations in spring (6.973.3 mg m�3) and summer (3.171.2mg m�3) and the dominant diatom species are Skeletonema
costatum and Guinardia delicatula (Pizarro et al., 2005).Central Patagonia, on the other hand, shows the lowest
average PP value for the entire Patagonia (spring PP¼�680 mgC m�2 d�1; Table 4), although this may be an underestimationsince information is only available for spring and the integrationdepth reaches only the upper 10 m of the water column (seeSection 3). In general, mean chlorophyll concentrations in springfor the area between 471 and 521S are lower (1.373.3 mg m�3)than further north, although highly variable (Pizarro et al., 2005).Given sufficient light for photosynthesis in spring–summer,
Table 4Summary of water column and sediment data in the four zones (mean, standard deviation, minimum,and maximum values). Primary production, nitrate, orthophosphate,
and silicic acid represent spring values. Summer primary production data are not available for Central Patagonia.
Zone PP (mg C m�2 d�1) Nutrients in spring %SiOPAL Corg (%) C/N (molar) d13C (%)
Spring Summer NO�3 (mM) PO�34 (mM) Si(OH)4 (mM)
Inner Sea of Chiloe Mean 2427.98 5860.17 6.76 1.03 7.85 6.39 1.24 9.69 �21.64
Std. dev. 1900.46 5015.75 2.65 0.30 7.41 2.50 0.48 1.46 1.93
Min. 134.10 2313.50 4.32 0.70 2.25 3.34 0.50 8.44 �023.99
Max. 4754.41 9406.84 12.04 1.57 23.81 10.26 1.89 12.10 �19.11
Northern Patagonia Mean 1667.66 2616.86 7.42 0.89 15.32 9.45 1.70 10.56 �21.97
Std. dev. 1702.03 1284.77 3.27 0.28 9.89 3.72 0.75 3.08 3.11
Min. 235.80 1424.00 2.36 0.47 5.81 4.47 0.67 7.06 �25.13
Max. 4812.64 4381.00 11.50 1.30 34.03 12.75 2.97 15.06 �16.81
Central Patagonia Mean 680.58 3.56 0.70 4.84 3.14 0.78 9.26 �23.21
Std. dev. 382.66 2.26 0.40 6.19 1.30 0.54 4.82 4.07
Min. 91.00 0.30 0.31 1.00 1.25 0.25 6.31 �26.09
Max. 1093.50 7.28 1.52 19.50 4.24 2.14 22.93 �20.34
Southern Patagonia Mean 1183.89 418.04 4.73 0.72 4.39 3.52 2.75 9.38 �20.97
Std. dev. 933.67 188.94 1.97 0.14 2.23 1.63 3.44 2.32 1.70
Min. 106.00 238.64 0.75 0.43 2.00 1.38 0.98 7.70 �22.17
Max. 1741.67 681.48 5.83 0.80 7.25 4.90 10.32 13.47 �19.77
Fig. 5. Comparison between spring primary production (PP) and silicic acid (Si(OH)4) in the water column, and biogenic opal (%SiOPAL) and organic carbon (%Corg) from
surface sediments in the four zones: Inner Sea of Chiloe, Northern, Central, and Southern Patagonia. All locations were averaged by zone (see Table 4).
C. Aracena et al. / Continental Shelf Research 31 (2011) 340–355350
diatom concentrations may reach 1.8�106 cells L�1, as they didin spring in Golfo Almirante Montt (511460S 721570W) (Alves-de-Souza et al., 2008). This value falls within the ranges of springvalues from the Inner Sea of Chiloe (3–10�106 cells L�1 inReloncavı Fjord) and between Desertores Islands and the GuafoMouth (0.1–1�106 cells L�1; Gonzalez et al., 2010).
Central Patagonia is an interesting area that differs fromthe Inner Sea of Chiloe and the Northern Patagonia zones in termsof its extensive ice coverage and major rivers. On the mountainside, this zone includes the Northern and Southern PatagonianIcefields, with several glaciers that descend towards the coastline,breaking up at the fjord heads and creating icebergs thatdilute the salty waters upon melting (Silva and Calvete, 2002).These icebergs release inorganic matter known as glacial silt(giving the appearance of milky fjord waters) that attenuates PPdue to decreased light penetration (Montecino and Pizarro, 2008).In fact, the lowest spring PP value is observed in CaletaTortel (91 mg C m�2 d�1; Table 4). The area also includes theBaker River (1133 m3 s�1), which empties into Baker Channelnear the village of Caleta Tortel and the Pascua River(753 m3 s�1), which flows into Mitchell Fjord. The Baker Riveris Chile’s largest river in terms of water volume, and its
characteristic turquoise-blue color is due to the glacial sedimentsdeposited therein.
Data for the Southern Patagonia zone includes the western(from the Pacific Ocean opening to Carlos III Island) and central(from Carlos III Island to Segunda Angostura) microbasins of theMagellan Strait and an adjacent sound (Otway), bay (Inutil), andfjord (Marinelli) (Fig. 2). The constriction-sill (about 100 m deep)located off Isla Carlos III acts as a physical barrier that impedes theentry of Modified sub-Antarctic Water and sub-Antarctic Waterfrom the Pacific into the central microbasin (Valdenegro and Silva,2003). The Magellan Strait region is affected by strong winds fromthe northwest or west and is characterized by a marked W–Egradient in precipitation and by light limitation (normally cloud-covered for 6–8 months) (Iriarte et al., 2001, and referencestherein; Schneider et al., 2003).
Average PP values for spring and summer are �1184 and418 mg C m�2 d�1, respectively. The lowest PP is observed in springin Paso del Mar (106 mg C m�2 d�1) and the highestoff Punta Arenas (3322 mg C m�2 d�1) (Table 4). The highestconcentrations of phytoplankton are recorded in spring–summer(�1�106 cells L�1; Alves-de-Souza et al., 2008). Iriarte et al. (1993)and Magazz �u et al. (1996) report dominant micro-phytoplankton in

C. Aracena et al. / Continental Shelf Research 31 (2011) 340–355 351
spring and pico- and nanoplankton in summer–autumn. In this area,the important diatom genera include Chaetoceros, Thalassiosira,Rhizosolenia, Leptocylindrus, Pseudo-nitzschia, and Thalassionema.Both biomass and primary production distributions are influencedby exchange mechanisms with the ocean at the western opening ofthe Magellan Strait and along the Pacific arm, tidal dynamics, glacio-fluvial contributions, and the presence of a thermohaline front nearCarlos III Island (Magazz �u et al., 1996; Torres et al., this issue). Thisphysical scenario might have direct effects on the structure andfunctioning of the phytoplankton assemblages (Torres et al., thisissue) and the export of PP out of the euphotic zone.
Nitrate and orthophosphate concentrations in the Magellanarea are rather uniform (�5 and �0.7 mM, respectively), with theexception of Marinelli Fjord, where the lowest concentrations aremeasured (Table 1). In contrast, silicic acid shows a W–E gradient,with relatively higher concentrations in the western section(�7 mM) than in the central Magellan microbasin (2.5–4.4 mM),and the lowest value in Marinelli Fjord (Table 1).
The data on inorganic nutrients in the four zones reveal waterswith a low NO�3 :PO�3
4 ratio (o9), as previously reported by Iriarteet al. (2007) for the Inner Sea of Chiloe; these authors suggest thatthe phytoplankton assemblages (diatoms) would first depleteNO�3 (as opposed to orthophosphate) from the water column.Therefore, nitrogen physiology may be important to the dynamicsof phytoplankton blooms in spring and summer in the Patagonianfjords. Iriarte et al. (2007) propose that the low concentration ofinorganic nitrogen through the water column may be explainedby phytoplankton uptake and/or by the mixing of freshwater withlow nutrient contents, as documented along the shelf margin ofsouthern Chile (Silva et al., 1997). On the other hand, the lowersilicic acid concentration in the Magellan area results in adecreased Si:N ratio (r1) in spring and summer, suggesting thatdiatoms could deplete silicic acid from the water column beforenitrate, thereby acting as a limiting nutrient for diatom growth inthese coastal waters of Southern Patagonia, probably leading toless silicified diatom cells (Iriarte et al., 2001) or to proliferationsof other phytoplankton groups such as dinoflagellates (Torreset al., this issue).
5.2. The sedimentary signal
Surface sediment Corg content for the entire study area rangebetween 0.25% (Steffen Fjord) and 10.32% (Paso del Mar) (Table 3).Previous studies in the Patagonian fjords system conclude that thesurface sediments are mostly marine in origin, with contributionsfrom terrestrial materials that increase towards the heads of thefjords (e.g., Silva et al., 2001; Rojas and Silva, 2005). A recent studyby Sepulveda et al. (this issue) in Northern Patagonia shows thatthe contribution of marine-derived organic carbon varies widely,from 13% in Puyuhuapi Fjord at the Cisnes River outlet, to 75–90%at the mouths of the Jacaf, Puyuhuapi, and Quitralco fjords, to amaximum of 96% of the organic pool (at the northern entrance ofMoraleda Channel). It is very common to find zones with highconcentrations of organic matter in the sediments associated withhigh water column primary productivity (Silva and Prego, 2002).
Our results indicate that the overall PP pattern follows thepatterns of organic carbon and biogenic opal contents in thesediments, i.e., the two zones with highest PP (Inner Sea of Chiloeand Northern Patagonia) are associated with high concentrationsof Corg and SiOPAL (Fig. 5). This overall picture agrees with thefindings of Silva and Prego (2002). The exception is SouthernPatagonia, where the average Corg is higher than in any other zone(2.75%; Table 4) due to the high organic carbon contents in Pasodel Mar (Table 3), specifically at two sheltered sites: Tamar Islandand Puerto Churruca. SiOPAL contents in the surface sediments are
almost twice as high in the Inner Sea of Chiloe and NorthernPatagonia (6.39% and 9.45%, respectively) as in the other twozones (Table 4), and follow the latitudinal trend of Corg (except forSouthern Patagonia) and the nutrients in the water column.Specifically, the silicic acid concentration agrees with the SiOPAL inthe sediments, showing the highest values in Northern Patagonia(Fig. 5), probably due to the close relation of diatoms with watercolumn productivity and, hence, the preservation of SiOPAL in thesediments. The water column silicic acid–sediment %SiOPAL
relation is also graphically represented in the maps of Fig. 6(upper panel) for the Inner Sea of Chiloe and Northern Patagoniazones.
Organic carbon is lowest (o0.5%) in the sediments of theCentral Patagonian channels and fjords influenced by glaciers(Table 3) that deliver both cold freshwater (enhancing verticalstratification) and large amounts of clay and silt (diluting theorganic content of the sediments) (Silva et al., 2001). On the otherhand, Corg values Z1% characterize the sites beyond the glacialinfluence and adjacent to the ocean (e.g., Baker, Icy, andConcepcion channels). The environmental conditions in thiswestern area are less extreme than those previously mentioned:the western sites are free of cold freshwater and silt, lightpenetration is greater, and important nutrient input from theocean favors primary production (Silva and Neshyba, 1979;Pizarro et al., 2000; Silva et al., 2001).
Circulation and water mass exchange between fjords andchannels is limited by the presence of shallow sills (i.e.,Desertores, Meninea, Angostura Inglesa, and Carlos III constric-tions; Sievers and Silva, 2008), which may impose importantcontrasts among the four zones in terms of nutrient availability,primary production, and its export to the seafloor. Our compila-tion of data, however large, is too spotty and composed of manymeasurements taken in different years. Thus, it does not allow usto discuss the impacts that these topographic features may exerton both water column productivity and the imprint of this in thesurface sediments. According to previous works, the signal oforganic matter in the sediments seems to be more associated withthe sediment texture than with the physical settings (e.g., Pintoand Bonert, 2005; Silva, 2008) – coarse sediments with low levelsof total organic matter vs. fine sediments with high levels of totalorganic matter – except for clay–mud sediments in the vicinity ofglaciers, where the contribution of inorganic matter from theerosion of rocks is highly significant (Silva, 2008 and referencestherein).
The elemental (C/N ratio) and stable isotope composition oforganic carbon (d13C) in the surface sediments can be used totrace the provenance of organic matter (e.g., Meyers, 1994, 1997).Although these two parameters are highly variable in the InnerSea of Chiloe and the Northern Patagonian zones (Table 4), asimple linear regression shows a significant, positive associationbetween molar C/N and d13Corg (r2
¼0.76, p¼0). These two zonesinclude stations located at the fjord heads (e.g., Comau, Puyu-huapi) with important rivers that discharge allochthonous organicand inorganic material, translating into high C/N ratios and amore negative isotopic signal in the surface sediments (Table 3).This is clearly visualized in Fig. 6 (lower panel). Our results agreewith previous studies that have shown that the carbon isotopicsignal becomes lower towards the fjord heads (Pinto and Bonert,2005), proving that the main input of organic matter at those sitesoriginates in the fluvial discharge, whereas at sites with anoceanic influence, the prevailing source is marine (Table 3; Silva,2008; Sepulveda et al., this issue; Silva et al., this issue). In CentralPatagonia, the highest molar C/N and most negative d13Corg valuesare found in Caleta Tortel (22.93% and �26.09%, respectively;Table 3), a site directly influenced by the Steffen and Baker riversand the Steffen Glacier. Relatively high C/N values (10.89) also

Fig. 6. Graphic representation (ODV 4) of the spatial distribution of silicic acid (Si(OH)4, mM) in the water column, and sediment proxies percent biogenic silica (%SiOPAL),
percent organic carbon (%Corg), and bulk sedimentary d13Corg (%) in the Inner Sea of Chiloe and Northern Patagonia zones.
C. Aracena et al. / Continental Shelf Research 31 (2011) 340–355352
characterize the Marinelli Fjord location in Southern Patagonia,where the Marinelli and Ainsworth glaciers are found, and thehighest C/N corresponds to the Puerto Churruca site in Paso del
Mar (13.47). The only two carbon isotopic values available for theMagellan Strait area show a strong influence of marine organicmatter (�19.77% to �22.17%; Table 3).

Table 5Comparison of spring primary production (PP) and geochemistry of surface sediments from the Chilean fjord region (41–551S, oceanic sites excluded) with other selected
fjord systems. Primary production comparisons are limited to those areas where PP was measured in spring and given as integrated daily values over the euphotic zone
since measurements from other fjord systems are very difficult to convert due to variable light and ice coverage.
Location Reference PP
(mg C m�2 d�1)
%SiOPAL %Corg C/N d13C (%)
Balsfjord (Norway) Archer et al. (2000) 1902–3820
Malangen Fjord (Norway) Archer et al. (2000) 1350–2480
Ullsfjord (Norway) Archer et al. (2000) 2060–4310
Korsfjorden (Norway) Erga and Heimdal (1984) 1200–1400
Boknafjorden (Norway) Erga (1989) 100–900a
Gullmar Fjord (Sweden) Lindahl et al. (1998) 600–1200
Saanich Inlet (Canada) Grundle et al. (2009) 1650–2440
Inner fjords and off Spitsbergen
(Norway)
Winkelmann and Knies, 2005 0.5–2.7 6.3–14.8 �21.1 to �25.2
Nordasvannet Fjord (Norway) Muller (2001) �2b,c 12.4 12.7 �23.9
Framvaren Fjord (Norway) Velinsky and Fogel (1999) 11.9 9.3 �25.1
Koljo Fjord (Sweden) McQuoid and Nordberg (2003) 6
Havsters Fjord (Sweden) Gustafsson and Nordberg
(2000)
2–4.1 9.6–11.4
Kiel Fjord (SW Baltic Sea) Nikulina et al. (2008) 0.1–8 1–7.8 4–15
Flensburg Fjord (Germany and
Denmark)
Nikulina and Dullo (2009) 2.3–5.2 7.1 10.5
Upper Muir Inlet (SE Alaska) Walinsky et al. (2009) 1.9b 0.3 11.5 �20.4
Lower Muir Inlet (SE Alaska) Walinsky et al. (2009) 1.2b 0.3 9.9 �21.4
Upper Lynn Canal (SE Alaska) Walinsky et al. (2009) 6.1b 0.8 10 �21.2
Lynn Canal (SE Alaska) Walinsky et al. (2009) 15b 2.4 9.6 �20.4
Effingham Inlet (Canada) Hay et al. (2009) �18c 7.6 12.2 �23.3c
Saanich Inlet (Canada) Calvert et al. (2001) 45c 3 9
Saguenay Fjord (Canada) St-Onge and Hillaire-Marcel
(2001)
1.2–2.0c 15–25c�20.4 to �26.5c
Chilean fjords
Inner Sea of Chiloe This study 1147–4754
(5476d)
3.3–10.3 0.5–1.9 8.4–12.1 �20.8 to �23.9
Northern Patagonia This study 235–4812 4.5–12.8 (0.5e) 0.7–
2.9 (3.4e)
7.7–15.0
(20.5e)
�16.8 to �25.1
(�28.2e)
Central Patagonia This study 91–1094 1.3–4.2 0.2–2.1 6.3–22.9 �20.3 to �26.1
Southern Patagonia This study 106–1742 1.4–4.9 0.9–10.3 7.7–13.4 �19.7 to �22.1
a Taken from graph (April through June).b Reported as OPAL¼2.4�%SiOPAL.c Surface sediment data taken from graphs.d From Gonzalez et al. (accepted).e From Sepulveda et al. (this issue).
C. Aracena et al. / Continental Shelf Research 31 (2011) 340–355 353
5.3. Comparison with other fjord systems
Given the importance of high-latitude fjords as sites for carbonburial and CO2 sequestration (e.g. Silva and Prego, 2002; Winkel-mann and Knies, 2005; Sepulveda et al., this issue; Torres et al.,submitted), we compare our results from the Chilean fjord regionwith those of other fjord systems in the world (Table 5). Althoughpublished water column production data are scarce, high variabilityin primary production is evident for all fjord systems. The range ofthe Norwegian fjords (100–4310 mg C m�2 d�1) falls within that ofthe spring values for the Chilean fjords (91–4812 mg C m�2 d�1).High variability is also seen in the Corg contents of the surfacesediments of most fjords, and the overall range in the Chileanfjords (0.2–10.3%) is most similar to that of the Norwegianfjords (0.5–12.4%). On the other hand, it is interesting to note thatthe Corg range in Central Patagonia resembles that of the Alaskaninlets, both fjord areas being strongly influenced by glaciatedterrain (Table 5).
Biogenic silica produced by organisms with a siliceousskeleton (e.g., diatoms, silicoflagellates, radiolarian, sponges) isan important constituent of the Chilean fjord sediments (SiOPAL
overall average for all locations: 5.773.4%, range: 1.3–12.8%)since diatoms are the most abundant group in the plankton(Alves-de-Souza et al., 2008, and references therein). The averageSiOPAL value is comparable to that of Flensburg Fjord, higher thanat the sites in SE Alaska, and much lower than the values recorded
in laminated sediments from Canada’s Saanich and Effinghaminlets (Table 5).
The C/N ratios and the d13C signature of surface sediments inthe Chilean fjords are very variable and similar to those reportedfor other fjords (Table 5), where marine and terrestrial organiccarbon mix, and a clear gradient from the open ocean to the fjordheads reflects the increased contribution of terrestrial organicmatter.
6. Concluding remarks
We aimed at describing a general latitudinal pattern ofproductivity and its imprint in the sediments of the ChileanPatagonian fjords region between 411S and 551S. Based on watercolumn properties (primary production, nutrients) and surfacesediment characteristics (biogenic opal, organic carbon, molarC/N, bulk sedimentary d13Corg), we grouped the study area intofour main zones: the Inner Sea of Chiloe and Northern, Central,and Southern Patagonia. A clear north–south decreasing trend inspring–summer primary production emerged (highest in theInner Sea of Chiloe and in Northern Patagonia). Biogenic opalcontents in the surface sediments mimicked this overall latitu-dinal pattern in primary production and were directly related towater column silicic acid concentrations. Thus, biogenic opal maybe considered to be a suitable proxy for reconstructing climate-induced productivity changes during the Holocene. The higher

C. Aracena et al. / Continental Shelf Research 31 (2011) 340–355354
C/N values and the more negative carbon isotopic signal reflectedan important influence from the continent, especially at the headof the fjords.
The surface silicate:nitrogen ratio ranged from 41 in thefjords of the Inner Sea of Chiloe and Northern and CentralPatagonia to �1 in Southern Patagonia, suggesting that a nitrate-deficiency may be responsible for the spring bloom shutdown.Experimental studies are required to establish the surface waternutrients (nitrate, silicic acid) that favor the occurrence of keyphytoplankton species in the Patagonian fjords and channels.
Finally, significant reductions in the hydrological regimes ofPatagonian rivers have already taken place (Lara et al., 2008) andthe rapid increment of anthropogenic activity in the ChileanPatagonia may lead to changes in the fjord’s nutrient inputs,primary production, key species, and the magnitude of theparticulate organic carbon exported to the sediments.
Acknowledgements
This work was funded by the Center for OceanographicResearch in the eastern South Pacific (COPAS) of the Universityof Concepcion through the FONDAP (Project no. 150100007) andBase Financing programs (Project no. PFB-31/2007 COPAS Sur-Austral). Financial support for primary productivity data fromFONDECYT Grants 1050487, 1080187, and 1070713, and FIP Grant2007-21 is acknowledged. Funding for geochemical measure-ments on some PACHIDERME cores was provided by FONDECYTGrant 3085045. We are grateful to our colleagues S. Bertrand, M.Caniupan, N. Harada, R. Kilian, and P. Munoz, who providedunpublished sediment information. We sincerely thank ourpersonnel – Alejandro Avila, Rodrigo Castro, and Victor Acuna –for field and laboratory work. We also acknowledge the NationalOceanographic Committee (CONA) for supporting our researchduring the CIMAR Program scientific cruises and the crews of theAGOR Vidal Gormaz, RV Marion Dufresne, RVIB Nathaniel Palmer,and RV Mirai for sampling onboard. We appreciate reviews byP. Meyers and D. Winkelmann whose corrections and suggestionshelped to improve this final version. We are especially indebted toD. Winkelmann and R. Schlitzer for the high resolution maps ofthe Chilean Patagonia coastline and for encouraging us to use theODV software to visualize the data. We thank Eduardo Tejos forhelping with the construction of Fig. 6.
References
Abarzua, A.M., Villagran, C., Moreno, P.I., 2004. Deglacial and postglacial climatehistory in east-central Isla Grande de Chiloe, southern Chile (431 S).Quaternary Res. 62, 49–59.
Acha, E.M., Mianzan, H.W., Guerrero, R., Favero, M., Bava, J., 2004. Marine fronts atthe continental shelves of austral South America: physical and ecologicalprocesses. J. Mar. Syst. 44 (1–2), 83–105.
Alves-de-Souza, C., Gonzalez, M.T., Iriarte, J.L., 2008. Functional groups in marinephytoplankton assemblages dominated by diatoms in fjords of southern Chile.J. Plankton Res. 30 (11), 1233–1243.
Archer, S.D., Verity, P.G., Stefels, J., 2000. Impact of microzooplankton on theprogression and fate of the spring bloom in fjords of northern Norway. Aquat.Microb. Ecol. 22, 27–41.
Ariztegui, D., Bosch, P., Davaud, E., 2007. Dominant ENSO frequencies during theLittle Ice Age in Northern Patagonia: the varved record of proglacial Lago Frıas,Argentina. Quaternary Int. 161, 46–55.
Avaria, S., Jorquera, L., Munoz, P., Vera, P., 1999. Distribucion de microfitoplanctonmarino en la zona de aguas interiores comprendida entre el golfo de Penas y elestrecho de Magallanes, Chile, en la primavera de 1996 (Crucero Cimar-Fiordo2). Cienc. Tecnol. Mar. 22, 81–110.
Baeza, O., 2005. Lake and fjord sediments as Late Glacial to Holocene environ-mental and climate archives of the Southernmost Andes at 531S, Chile. Ph.D.Thesis, University Trier, Germany, 278 pp.
Borgel, R., 1970. Geomorfologıa de las regiones australes de Chile. Rev. Geol. Chile21, 135–140.
Calvert, S.E., Pedersen, T.F., Karlin, R.E., 2001. Geochemical and isotopic evidencefor post-glacial palaeoceanographic changes in Saanich Inlet, British Columbia.Mar. Geol. 174, 287–305.
Davila, P., Figueroa, D., Muller, E., 2002. Freshwater input into the coastal oceanand its relation with the salinity distribution off austral Chile (351–551S). Cont.Shelf Res. 22, 521–534.
Erga, S.R., 1989. Ecological studies on the phytoplankton of Boknafjorden, westernNorway. II. Environmental control of photosynthesis. J. Plankton Res. 11 (4),785–812.
Erga, S.R., Heimdal, B.R., 1984. Ecological studies on the phytoplankton ofKorsfjorden, western Norway. The dynamics of a spring bloom seen inrelation to hydrographical conditions and light regime. J. Plankton Res. 6 (1),67–90.
Fabiano, M., Povero, P., Danovaro, R., Misic, C., 1999. Particulate organic mattercomposition in a semi-enclosed Periantarctic system: the Straits of Magellan.Sci. Mar. 63 (1), 89–98.
Fernandez, H.N., Troncoso, P.C., 1984. Hidrografıa. Geografıa de Chile, Tomo VIII,Instituto Geografico Militar de Chile, 320 pp.
Gonzalez, H.E., Calderon, M.J., Castro, L., Clement, A., Cuevas, L.A., Danieri, G., Iriarte,J.L., Lizarraga, L., Martınez, R., Menschel, E., Silva, N., Carrasco, C., Valenzuela, C.,Vargas, C.A., Molinet, C., 2010. Primary production and its fate in the pelagic foodweb of the Reloncavı Fjord and plankton dynamics of the Interior Sea of Chiloe,Northern Patagonia. Chile. Mar. Ecol. Prog. Ser. 402, 13–30.
Grundle, D.S., Timothy, D.A., Varela, D.E., 2009. Variations of phytoplanktonproductivity and biomass over an annual cycle in Saanich Inlet, a BritishColumbia fjord. Cont. Shelf Res. 29 (19), 2257–2269.
Gustafsson, M., Nordberg, K., 2000. Living (stained) benthic foraminifera and theirresponse to the seasonal hydrographic cycle, periodic hypoxia and to primaryproduction in Havstens fjord on the Swedish West Coast. Estuar. Coast. ShelfSci. 51, 743–761.
Hay, M.B., Calvert, S.E., Pienitz, R., Dallimore, A., Thomson, R.E., Baumgartner, T.R.,2009. Geochemical and diatom signature of bottom water renewal events inEffingham Inlet, British Columbia (Canada). Mar. Geol. 262, 50–61.
Iriarte, J.L., Uribe, J.C., Valladares, C., 1993. Biomass of size-fractionatedphytoplankton during the spring–summer season in Southern Chile. Bot.Mar. 36, 443–450.
Iriarte, J.L., Kush, A., Osses, J., Ruiz, M., 2001. Phytoplankton biomass in the sub-Antarctic area of the Straits of Magellan (531S), Chile during spring–summer1997/1998. Polar Biol. 24, 154–162.
Iriarte, J.L., Gonzalez, H.E., Liu, K.K., Rivas, C., Valenzuela, C., 2007. Spatial andtemporal variability of chlorophyll and primary productivity in surface watersof southern Chile (41.5–431S). Estuar. Coast. Shelf Sci. 74, 471–480.
Kerr, A., Sudgen, D., 1994. The sensitivity of the South Chilean Snowline to climaticchange. Clim. Change 28, 255–272.
Lara, A., Villalba, R., Urrutia, R., 2008. A 400-year tree-ring record of the Puelo Riversummer–fall streamflow in the Valdivian Rainforest eco-region, Chile. Clim.Change 86, 331–356.
Lindahl, O., Belgrano, A., Davidsson, L., Hernroth, B., 1998. Primary production,climatic oscillations, and physico-chemical process: the Gullmar fjord time-series data set (1985–1996). J. Mar. Sci. 55, 723–729.
Lliboutry, L., 1998. Glaciers of Chile and Argentina. In: Williams, R.S., Ferrigno, J.G.(Eds.), Satellite Image Atlas of Glaciers of the World, United States GeologicalSurvey Professional Paper 1386-I, pp. I109–I206.
Magazz �u, G., Panella, S., Decembrini, F., 1996. Seasonal variability of fractionatedphytoplankton, biomass and primary production in the Straits of Magellan.J. Mar. Syst. 9, 249–267.
McQuoid, M.R., Nordberg, K., 2003. Environmental influence on the diatom andsilicoflagellate assemblages in Koljo fjord (Sweden) over the last two centuries.Estuaries 26, 927–937.
Meyers, P.A., 1994. Preservation of elemental and isotopic source identification ofsedimentary organic matter. Chem. Geol. 114, 289–302.
Meyers, P.A., 1997. Organic geochemical proxies of paleoceanographic, paleolim-nologic, and paleoclimatic processes. Org. Geochem. 27, 213–250.
Miller, A., 1976. The climate of Chile. In: Schwerdtfeger, W. (Ed.), World Survey ofClimatology, vol. 12. Elsevier, Amsterdam, pp. 113–145.
Mohtadi, M., Romero, O.E., Kaiser, J., Hebbeln, D., 2007. Cooling of the southernhigh latitudes during the Medieval Period and its effect on ENSO. QuaternarySci. Rev. 26, 1055–1066.
Montecino, V., Pizarro, G., 2008. Primary productivity, biomass, and phytoplanktonsize in the austral Chilean channels and fjords: spring–summer patterns. In:Silva, N., Palma, S. (Eds.), Progress in the Oceanographic Knowledge of ChileanInterior Water, from Puerto Montt to Cape Horn. Comite OceanograficoNacional-Pontificia Universidad Catolica de Valparaıso, pp. 93–97.
Montecino, V., Paredes, M.A., Vargas, C., Uribe, P., Giglio, S., Manley, M., Pizarro, G.,2004. Caracterısticas bio-opticas asociadas con productividad biologica en laRegion de Aysen: absorcion in vivo y abundancia de las fracciones de tamanosdel fitoplancton en agosto y noviembre 2003. Resumenes del crucero CIMAR 9Fiordos. Inform. Prelimin., 89–101.
Mortlock, R., Froelich, P., 1989. A simple method for the rapid determination ofbiogenic opal in pelagic marine sediments. Deep-Sea Res. 36, 1415–1426.
Muller, A., 2001. Geochemical expressions of anoxic conditions in Nordasvannet, aland-locked fjord in Western Norway. Appl. Geochem. 16, 363–374.
Munoz, P., Lange, C.B., Gutierrez, D., Hebbeln, D., Salamanca, M.A., Dezileau, L.,Reyss, J.L., Benninger, L.K., 2004. Recent sedimentation and mass accumulationrates based on 210Pb along the Peru–Chile continental margin. Deep-Sea Res.Pt. II 51 (20–21), 2523–2541.

C. Aracena et al. / Continental Shelf Research 31 (2011) 340–355 355
New, M., Lister, D., Hulme, M., Makin, I., 2002. A high-resolution data set of surfaceclimate over global land areas. Clim. Res. 21, 1–25.
Nikulina, A., Dullo, W.-C., 2009. Eutrophication and heavy metal pollution in theFlensburg Fjord: a reassessment after 30 years. Mar. Pollut. Bull. 58, 905–915.
Nikulina, A., Polovodova, I., Schonfeld, J., 2008. Foraminiferal response toenvironmental changes in Kiel Fjord, SW Baltic Sea. eEarth 3, 37–49.
Palma, S., 2008. Zooplankton distribution and abundance in the austral Chileanchannels and fjords. In: Silva, N., Palma, S. (Eds.), Progress in the Oceano-graphic Knowledge of Chilean Interior Waters, from Puerto Montt to CapeHorn. Comite Oceanografico Nacional-Pontificia Universidad Catolica deValparaıso, Valparaıso, pp. 107–113.
Palma, S., Silva, N., 2004. Distribution of siphonophores, chaetognaths, euphausiidsand oceanographic conditions in the fjords and channels of southern Chile.Deep-Sea Res. Pt. II 51, 513–535.
Paredes, M.A., Montecino, V., this issue. Size diversity as an expression ofphytoplankton structure and the identification of its patterns on the scale offjords and channels. Cont. Shelf Res.
Pickard, G.L., 1971. Some physical oceanographic features of Inlets of Chile. J. Fish.Res. Board Can. 28, 1077–1106.
Pinto, L., Bonert, C., 2005. Origen y distribucion espacial de hidrocarburos alifaticosen sedimentos de Seno Aysen y Canal Moraleda, Chile Austral. Cienc.Tecnol.Mar. 28 (1), 35–44.
Pizarro, G., Iriarte, J.L., Montecino, V., Blanco, J.L., Guzman, L., 2000. Distribucion dela biomasa fitoplanctonica y productividad primaria maxima de fiordos ycanales australes (47–501S) en octubre de 1996. Comite Oceanogr. Nacional23, 25–48.
Pizarro, G., Montecino, V., Guzman, L., Munoz, V., Chacon, V., Pacheco, H.,Frangopulos, M., Retamal, L., Alarcon, C., 2005. Patrones locales recurrentesdel fitoplancton en fiordos y canales australes (461-561 S) en primavera yverano. Cienc. Tecnol. Mar. 28 (2), 63–83.
Rabassa, J., 2008. Late Cenozoic Glaciations in Patagonia and Tierra del Fuego. In:Rabassa, J. (Ed.), The Late Cenozoic of Patagonia and Tierra delFuego. Developments in Quaternary Science 11 series Elsevier, Amsterdam,pp. 151–204.
Rebolledo, L., 2007. Variabilidad temporal en la productividad durante los ultimos�1800 anos en los fiordos chilenos de Patagonia Norte (44–461S). Ph.D. Thesis,Universidad de Concepcion, 162 pp.
Rebolledo, L., Lange, C.B., Figueroa, D., Pantoja, S., Munoz, P., Castro, R., 2005. 20thcentury fluctuations in the abundance of siliceous microorganisms preservedin the sediments of the Puyuhuapi Channel (441S), Chile. Rev. Chil. Hist. Nat. 78(3), 469–488.
Rebolledo, L., Sepulveda, J., Lange, C.B., Pantoja, S., Bertrand, S., Hughen, K.,Figueroa, D., 2008. Late Holocene marine productivity changes in NorthernPatagonia-Chile inferred from a multi-proxy analysis of Jacaf channelsediments. Estuar. Coast. Shelf Sci. 80, 314–322.
Rebolledo, L., Gonzalez, H.E., Munoz, P., Iriarte, J., Lange, C.B., Pantoja, S., Salamanca,M., this issue. Siliceous productivity changes in Gulf of Ancud sediments (421S,721W), southern Chile, over the last �150 years. Cont. Shelf Res.
Rivera, A., Acuna, C., Casassa, G., Bown, F., 2002. Use of remote sensing and fielddata to estimate the contribution of Chilean glaciers to the sea level rise. Ann.Glaciol. 34, 367–372.
Rojas, N., 2002. Distribucion de materia organica, carbono y nitrogeno, y diagenesistemprana en sedimentos de la zona de canales australes entre los golfosCorcovado y Elefantes, Chile. Undergraduate Thesis, Universidad Catolica deValparaıso, Valparaıso, Chile, 76 pp.
Rojas, N., Silva, N., 2005. Early diagenesis and vertical distribution of organiccarbon and total nitrogen in recent sediments of the Chilean fjords: Boca delGuafo (43147’ S) to canal Pulluche (451 49’ S). Invest. Mar. 33 (2), 183–194.
Saggiomo, V., Goffart, A., Carrada, G.C., Hecq, J.H., 1994. Spatial patterns ofphytoplanktonic pigments and primary production in a semi-enclosedperiantarctic ecosystem: the Straits of Magellan. J. Mar. Syst. 5, 119–142.
Salamanca, M.A., Jara, B., 2003. Distribucion y acumulacion de plomo (Pb y 210Pb) ensedimentos de los fiordos de la XI region, Chile. Cienc. Tecnol. Mar. 26, 61–71.
Schneider, C., Glaser, M., Kilian, R., Santana, A., Butorovic, N., 2003. Weatherobservations across the southern Andes at 531S. Phys. Geog. 24 (2), 97–119.
Sepulveda, J., 2005. Aporte de material terrıgeno en fiordos de Patagonia del Norte:Evidencia geoquımica en sedimentos recientes y del Holoceno tardıo. M.Sc.Thesis, Universidad de Concepcion, Chile, 143 pp.
Sepulveda, J., Pantoja, S., Hughen, K., Lange, C., Gonzalez, F., Munoz, P., Rebolledo,L., Castro, R., Contreras, S., Avila, A., Rossel, P., Lorca, G., Salamanca, M., Silva, N.,2005. Fluctuations in export productivity over the last century from sedimentsof a southern Chilean fjord (441S). Estuar. Coast. Shelf Sci. 65, 587–600.
Sepulveda, J., Pantoja, S., Hughen, K.A., Bertrand, S., Figueroa, D., Leon, T., Drenzek,N.J., Lange, C., 2009. Late Holocene sea-surface temperature and precipitationvariability in northern Patagonia, Chile (Jacaf Fjord, 441S). Quaternary Res. 72(3), 400–409.
Sepulveda, J., Pantoja, S., Hughen, K. A., this issue. Sources and distribution oforganic matter in northern Patagonian fjords, Chile (�44–471S): a multi-tracerapproach for carbon cycling assessment. Cont. Shelf Res.
Sievers, H.A., Silva, N., 2008. Water masses and circulation in austral Chilean channelsand fjords. In: Silva, N., Palma, S. (Eds.), Progress in the Oceanographic Knowledgeof Chilean Interior Water, from Puerto Montt to Cape Horn. ComiteOceanografico Nacional-Pontificia Universidad Catolica de Valparaıso, pp. 53–58.
Silva, N., 2008. Physical and chemical characteristics of the surface sediments inthe austral Chilean channels and fjords. In: Silva, N., Palma, S. (Eds.), Progressin the Oceanographic Knowledge of Chilean Interior Waters, from PuertoMontt to Cape Horn. Comite Oceanografico Nacional-Pontificia UniversidadCatolica de Valparaıso, Valparaıso, pp. 69–75.
Silva, N., Calvete, C., 2002. Caracterısticas oceanograficas fısicas y quımicas decanales australes chilenos entre el golfo Penas y el estrecho de Magallanes(Crucero CIMAR Fiordo 2). Cienc. Tecnol. Mar. 25 (1), 23–88.
Silva, N., Neshyba, S., 1979. On the southernmost extension of the Peru–ChileUndercurrent. Deep-Sea Res. 26A, 1378–1393.
Silva, N., Palma, S., 2008. The CIMAR Program in the austral Chilean channels andfjords. In: Silva, N., Palma, S. (Eds.), Progress in the Oceanographic Knowledgeof Chilean Interior waters, from Puerto Montt to Cape Horn. ComiteOceanografico Nacional-Pontificia Universidad Catolica de Valparaıso, Valpar-aıso, pp. 11–15.
Silva, N., Prego, R., 2002. Carbon and nitrogen spatial segregation and stoichio-metry in the surface sediments of southern Chilean inlets (41–561S). Estuar.Coast. Shelf Sci. 55, 763–775.
Silva, N., Sievers, H., Prado, R., 1995. Caracterısticas oceanograficas y unaproposicion de circulacion, para algunos canales australes de Chile entre 41120’ y 46140’ S. Rev. Biol. Mar. 30 (2), 207–254.
Silva, N., Calvete, C., Sievers, H.A., 1997. Caracterısticas oceanograficas fısicas yquımicas de canales australes chilenos entre Puerto Montt y laguna San Rafael(Crucero CIMAR-Fiordo 1). Cienc. Tecnol. Mar. 20, 23–106.
Silva, N., Calvete, C., Sievers, H.A., 1998. Masas de agua y circulacion general paraalgunos canales australes entre Puerto Montt y Laguna San Rafael, Chile(Crucero Cimar-Fiordo 1). Cienc. Tecnol. Mar. 21, 17–48.
Silva, N., De Vidts, V., Sepulveda, J., 2001. Materia organica, C y N y su distribuciony estequiometrıa en sedimentos superficiales de la region central de los fiordosy canales australes de Chile (Crucero CIMAR Fiordo 2). Cienc. Tecnol. Mar. 24,23–40.
Silva, N., Haro, J., Prego, R., 2009. Metals background and enrichment in the ChiloeInterior Sea sediments (Chile). Is there any segregation between fjords,channels and sounds? Estuar. Coast. Shelf Sci. 82 469–476.
Silva, N., Vargas, C.A., Prego, R., this issue. Land–ocean distribution of allochtho-nous organic matter in the surface sediments of the Chiloe and Aysen InteriorSeas (Chilean Northern Patagonia). Cont. Shelf Res..
Steemann-Nielsen, E., 1952. The use of radiocarbon (14C) for measuringorganic production in the sea. J. Conseil Permanent Inte. l’ Explo. Mer. 18,117–140.
St-Onge, G., Hillaire-Marcel, G., 2001. Isotopic constraints of sedimentary inputsand organic carbon burial rates in the Saguenay fjord, Quebec. Mar. Geol. 176,1–22.
Strub, P.T., Mesias, J., Montecino, V., Rutllant, J., Salinas, S., 1998. Coastalocean circulation off Western South America Coastal segment (6, E). In:Robinson, A.R., Brink, K.H. (Eds.), The Sea, vol. 11. John Wiley & Sons, Inc.,New York, pp. 273–313.
Torres, R., Frangopulos, M., Hamame, M., Montecino, V., Maureira, C., Pizarro, G.,Reid, B., this issue. Nitrate to silicate ratio variability and the composition ofmicro-phytoplankton blooms in the inner-fjord of Seno Ballena (Strait ofMagellan, 541S). Cont. Shelf Res.
Torres, R., Pantoja, S., Harada, N., Gonzalez, H., Daneri, G., Frangopulos, M.,.Rutllant, J., Duarte, C., Ruiz-Halpern, S., Mayol, E., Fukasawa, M. Air–sea CO2
fluxes along the coast of Chile: from CO2 outgassing in central–northernupwelling waters to CO2 sequestering in southern Patagonian fjords.J. Geophys. Res, submitted for publication.
Valdenegro, A., Silva, N., 2003. Caracterizacion fısica y quımica de la zona decanales y fiordos australes de Chile entre el Estrecho de Magallanes y Cabo deHornos (CIMAR 3 Fiordos). Cienc. Tecnol. Mar. 26 (2), 19–60.
Vargas, C.A., Martinez, R.A., San Martin, V., Aguayo, M., Silva, N., Torres, R., thisissue. Allochthonous subsides of organic matter across a lake–river–fjordlandscape in the Chilean Patagonia: implication for marine plankton foodwebs. Cont. Shelf Res.
Velinsky, D.J., Fogel, M.L., 1999. Cycling of dissolved and particulate nitrogen andcarbon in the Framvaren Fjord, Norway: stable isotopic variations. Mar. Chem.67, 161–180.
Villagran, C., 1988. Expansion of magellanic moorland during the late pleistocene:palynological evidence from Northern Isla de Chiloe, Chile. Quaternary Res. 30,304–314.
Walinsky, S.E., Prahl, F.G., Mix, A.C., Finney, B.P., Jaeger, J.M., Rosen, G.P., 2009.Distribution and composition of organic matter in surface sediments of coastalSoutheast Alaska. Cont. Shelf Res. 29, 1565–1579.
Winkelmann, D., Knies, J., 2005. Recent distribution and accumulation of organiccarbon on the continental margin west off Spitsbergen. Geochem. Geophys.Geosyst., 6. doi:10.1029/2005GC000916.