Embed Size (px)
Citation preview

Contextualized Learning Activities (CLAs) For the “other required credits” in the bundle of credits, students in a Specialist High Skills Major program must complete learning activities that are contextualized to the knowledge and skills relevant to the economic sector of the SHSM. Contextualized learning activities (CLAs) address curriculum expectations in these courses.
This CLA has been created by teachers for teachers.
It has not undergone an approval process by the Ministry of Education.
Contact Information
Board Waterloo Catholic District School Board
Development date
August 2009
Contact person
Sue Sawchuk Christine Stockie
Phone
(519) 621-4050 ext. 616 (519) 621-4050 ext. 623
Fax
(519) 621-4057
[email protected] [email protected]
Specialist High Skills Major
Manufacturing, Transportation or Health and Wellness
Course code and title
MCR 3U – Grade 11 Functions – University Preparation
Name of contextualized learning activity
Modelling with Periodic Functions
Brief description of contextualized learning activity.
Students will review and consolidate skills for graphing and interpreting periodic functions. They will apply this knowledge to real-life examples from the transportation, manufacturing, and health & wellness sectors, while studying and learning about modelling in a practical environment.
Duration Approximately 11 hours: Lesson 1 – Introduction to Periodicity (60 min) Lesson 2 – Trigonometric Functions (60 min) Lesson 3 – The CAST Rule (60 min) Lesson 4 – Trigonometric Transformations (60 min) Lesson 5 – Trigonometric Transformations (cont’d) (60 min) Lesson 6 – Trigonometric Transformations (cont’d) (60 min) Lesson 7 – Modelling Periodic Phenomena (60 min)
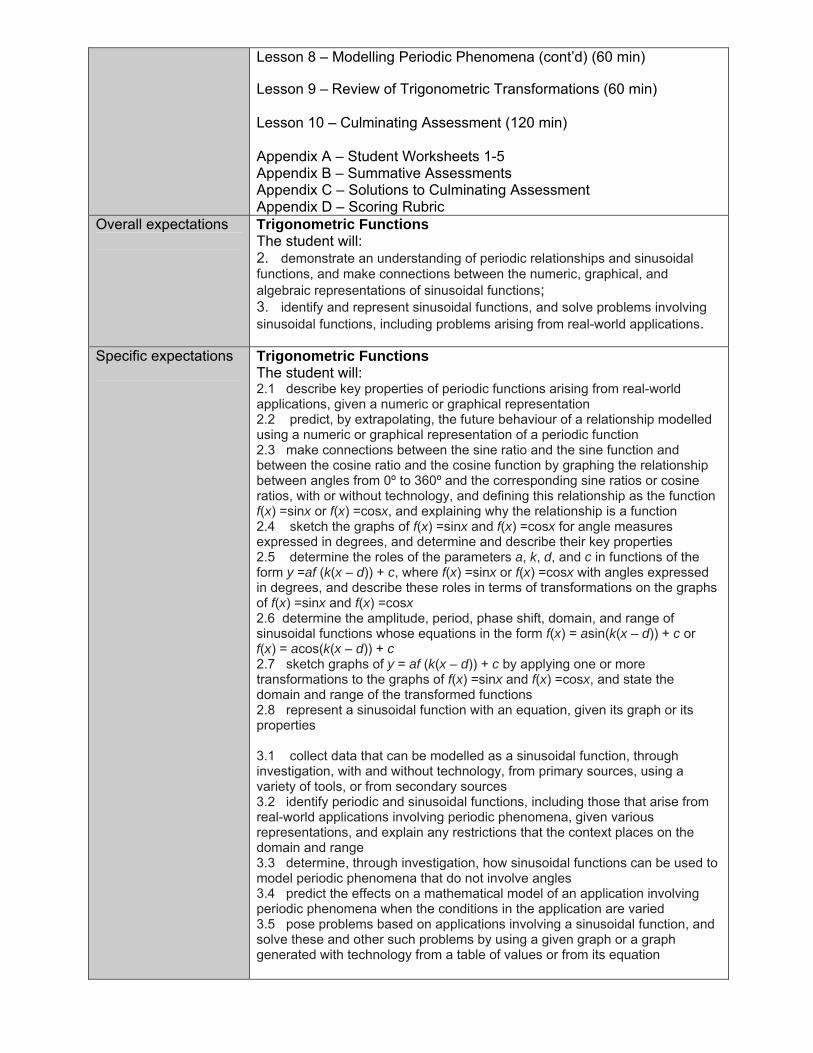
Lesson 8 – Modelling Periodic Phenomena (cont’d) (60 min) Lesson 9 – Review of Trigonometric Transformations (60 min) Lesson 10 – Culminating Assessment (120 min) Appendix A – Student Worksheets 1-5 Appendix B – Summative Assessments Appendix C – Solutions to Culminating Assessment Appendix D – Scoring Rubric
Overall expectations
Trigonometric Functions The student will: 2. demonstrate an understanding of periodic relationships and sinusoidal functions, and make connections between the numeric, graphical, and algebraic representations of sinusoidal functions; 3. identify and represent sinusoidal functions, and solve problems involving sinusoidal functions, including problems arising from real-world applications.
Specific expectations
Trigonometric Functions The student will: 2.1 describe key properties of periodic functions arising from real-world applications, given a numeric or graphical representation 2.2 predict, by extrapolating, the future behaviour of a relationship modelled using a numeric or graphical representation of a periodic function 2.3 make connections between the sine ratio and the sine function and between the cosine ratio and the cosine function by graphing the relationship between angles from 0º to 360º and the corresponding sine ratios or cosine ratios, with or without technology, and defining this relationship as the function f(x) =sinx or f(x) =cosx, and explaining why the relationship is a function 2.4 sketch the graphs of f(x) =sinx and f(x) =cosx for angle measures expressed in degrees, and determine and describe their key properties 2.5 determine the roles of the parameters a, k, d, and c in functions of the form y =af (k(x – d)) + c, where f(x) =sinx or f(x) =cosx with angles expressed in degrees, and describe these roles in terms of transformations on the graphs of f(x) =sinx and f(x) =cosx 2.6 determine the amplitude, period, phase shift, domain, and range of sinusoidal functions whose equations in the form f(x) = asin(k(x – d)) + c or f(x) = acos(k(x – d)) + c 2.7 sketch graphs of y = af (k(x – d)) + c by applying one or more transformations to the graphs of f(x) =sinx and f(x) =cosx, and state the domain and range of the transformed functions 2.8 represent a sinusoidal function with an equation, given its graph or its properties 3.1 collect data that can be modelled as a sinusoidal function, through investigation, with and without technology, from primary sources, using a variety of tools, or from secondary sources 3.2 identify periodic and sinusoidal functions, including those that arise from real-world applications involving periodic phenomena, given various representations, and explain any restrictions that the context places on the domain and range 3.3 determine, through investigation, how sinusoidal functions can be used to model periodic phenomena that do not involve angles 3.4 predict the effects on a mathematical model of an application involving periodic phenomena when the conditions in the application are varied 3.5 pose problems based on applications involving a sinusoidal function, and solve these and other such problems by using a given graph or a graph generated with technology from a table of values or from its equation

Essential Skills:
Reading Text Understanding text in the form of sentences or paragraphs Document Use Using information displays including drawings, technical readouts, and graphs Numeracy Use of graphs, numbers and quantities Writing Completing solutions of multi-step problem-solving questions Continuous Learning Ongoing process of learning and acquiring skills Thinking Skills Cognitive ability, problem solving
Work Habits:
Teamwork Work willingly and cooperatively with others Initiative Starts work with little or no prompting Work Habits Punctual, time effective, and able to follow directions Organization Written work is well laid out and neat Working Independently Accomplishes tasks independently
Instructional/Assessment Strategies Teacher’s notes
The Math teacher should communicate with the Technology teacher on a regular basis. Both teachers should be kept up to date on developments that correspond to each other’s courses.
The teacher should become familiar with the use of mathematics in the Manufacturing and Transportation courses.
Providing applicable real life examples from the manufacturing, transportation or health and wellness sectors can be beneficial for student learning.
Constant diagnostic and formative feedback is important for consistent learning and student development (ie. through use of student worksheets).
If the class is a split group (not all SHSM students) it may be advantageous to group the SHSM students together, however, this CLA has benefits for all MCR students, not just those enrolled in the SHSM program.
Allow students to supplement their learning with applicable computer programs. Context This CLA is designed for students that plan on entering an apprenticeship or college or university program in the Manufacturing or Transportation or Health and Wellness sectors.
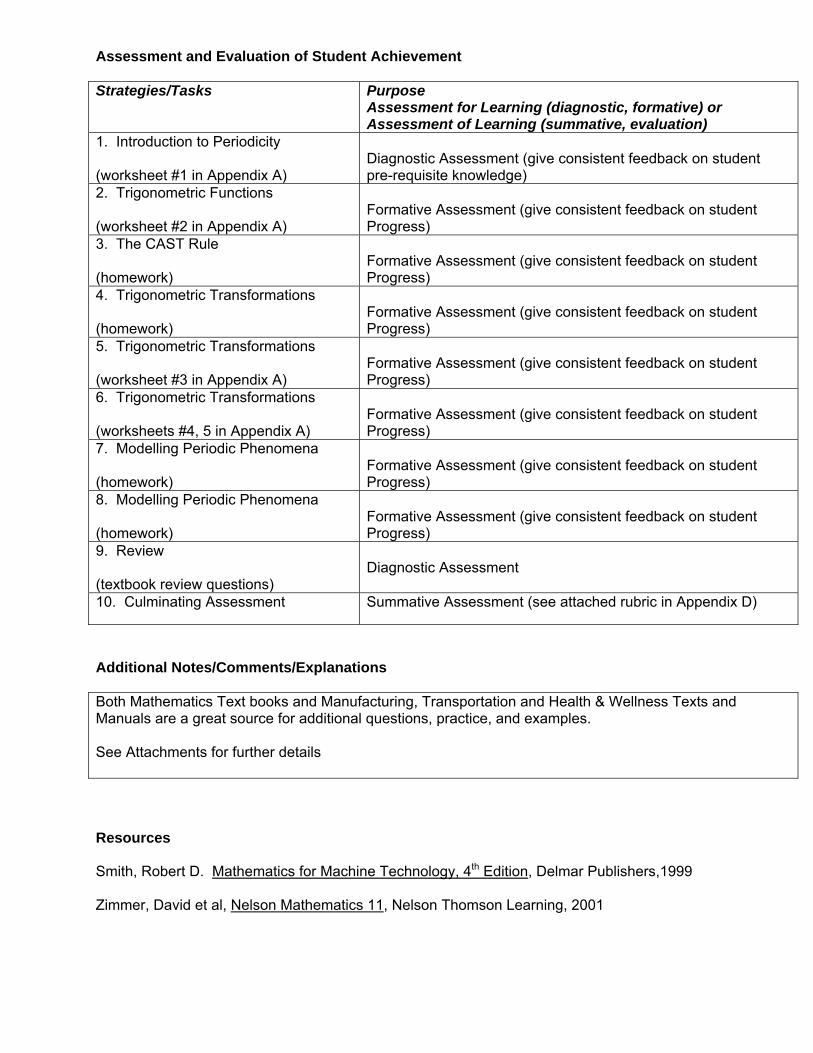
Assessment and Evaluation of Student Achievement Strategies/Tasks
Purpose Assessment for Learning (diagnostic, formative) or Assessment of Learning (summative, evaluation)
1. Introduction to Periodicity (worksheet #1 in Appendix A)
Diagnostic Assessment (give consistent feedback on student pre-requisite knowledge)
2. Trigonometric Functions (worksheet #2 in Appendix A)
Formative Assessment (give consistent feedback on student Progress)
3. The CAST Rule (homework)
Formative Assessment (give consistent feedback on student Progress)
4. Trigonometric Transformations (homework)
Formative Assessment (give consistent feedback on student Progress)
5. Trigonometric Transformations (worksheet #3 in Appendix A)
Formative Assessment (give consistent feedback on student Progress)
6. Trigonometric Transformations (worksheets #4, 5 in Appendix A)
Formative Assessment (give consistent feedback on student Progress)
7. Modelling Periodic Phenomena (homework)
Formative Assessment (give consistent feedback on student Progress)
8. Modelling Periodic Phenomena (homework)
Formative Assessment (give consistent feedback on student Progress)
9. Review (textbook review questions)
Diagnostic Assessment
10. Culminating Assessment Summative Assessment (see attached rubric in Appendix D)
Additional Notes/Comments/Explanations Both Mathematics Text books and Manufacturing, Transportation and Health & Wellness Texts and Manuals are a great source for additional questions, practice, and examples. See Attachments for further details Resources Smith, Robert D. Mathematics for Machine Technology, 4th Edition, Delmar Publishers,1999 Zimmer, David et al, Nelson Mathematics 11, Nelson Thomson Learning, 2001

Accommodations
Individual Education Plans (IEP) should be followed at all times. Be sure to consult the SERT for additional information and suggestions;
additional time may be needed for diagnostic, formative and summative assignments; the activities and lessons outlined in this CLA allow for flexibility in the delivery of the
material. Alternating teaching strategies can help students who are not progressing at the appropriate level;
font can be increased for those students that have vision problems; class rules, behaviours, and due dates should be posted in the classroom and talked
about so that all students are aware of the expectations; if possible, more individual instruction time can be allotted to students in need; can account for student work habits when considering assignments; provide opportunities for enrichment for exceptional students; provide time for peer-to-peer teaching; use audio aids if needed; provide alternate assessment opportunities that are geared towards students strengths
or areas of interest; if available, many computer programs can be used to supplement student learning.
List of Attachments
Lessons 1 - 9 Appendix A – Student Worksheets 1 - 5 Appendix B – Summative Assessments Appendix C – Solutions for Culminating Assessment Appendix D – Scoring Rubric
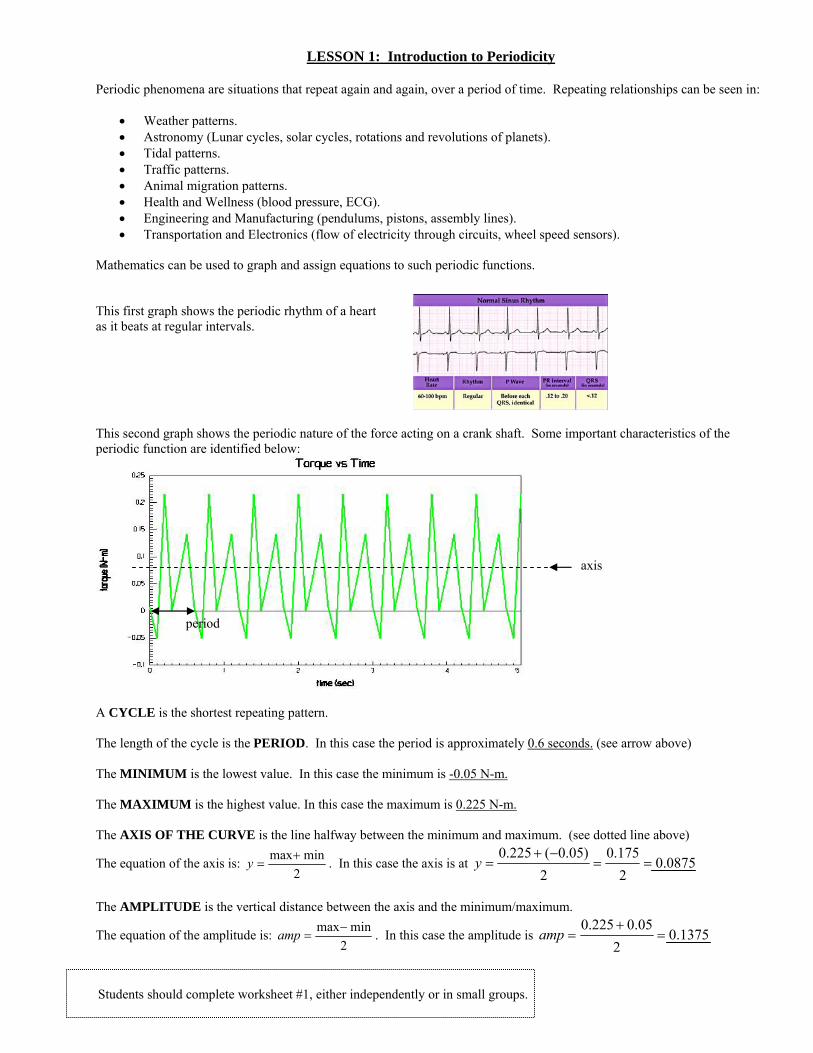
LESSON 1: Introduction to Periodicity
Periodic phenomena are situations that repeat again and again, over a period of time. Repeating relationships can be seen in:
• Weather patterns. • Astronomy (Lunar cycles, solar cycles, rotations and revolutions of planets). • Tidal patterns. • Traffic patterns. • Animal migration patterns. • Health and Wellness (blood pressure, ECG). • Engineering and Manufacturing (pendulums, pistons, assembly lines). • Transportation and Electronics (flow of electricity through circuits, wheel speed sensors).
Mathematics can be used to graph and assign equations to such periodic functions. This first graph shows the periodic rhythm of a heart as it beats at regular intervals. This second graph shows the periodic nature of the force acting on a crank shaft. Some important characteristics of the periodic function are identified below:
A CYCLE is the shortest repeating pattern. The length of the cycle is the PERIOD. In this case the period is approximately 0.6 seconds. (see arrow above) The MINIMUM is the lowest value. In this case the minimum is -0.05 N-m. The MAXIMUM is the highest value. In this case the maximum is 0.225 N-m. The AXIS OF THE CURVE is the line halfway between the minimum and maximum. (see dotted line above)
The equation of the axis is: 2
minmax+=y . In this case the axis is at 0875.0
2175.0
2)05.0(225.0
==−+
=y
The AMPLITUDE is the vertical distance between the axis and the minimum/maximum.
The equation of the amplitude is: 2
minmax−=amp . In this case the amplitude is 1375.0
205.0225.0
=+
=amp
axis
period
Students should complete worksheet #1, either independently or in small groups.

Lesson 2 – Trigonometric Functions Students should add the following relevant characteristic information to the trigonometric functions that appear on the attached student handout (appendix A). The functions θsin)( =xf , θcos)( =xf , θtan)( =xf are periodic functions. Sine and Cosine Functions
θsin)( =xf and θcos)( =xf have a maximum of 1, a minimum of –1, an amplitude of 1, a period of o360 and an axis of .0=y Graphs with the shape of θsin)( =xf and θcos)( =xf are said to be sinusoidal. Tangent Function
θtan)( =xf has no minimum, maximum or amplitude but has an asymptote every o180 beginning with o90 . The period of θtan)( =xf is o180 . Extending the Primary Trigonometric Ratios Beyond Triangles: Let a straight line of length r sweep out an angle θ in standard position and let the co-ordinates of its extremity be point P (x,y).
The question is: How shall we now define the trigonometric ratios of this new angle θ, since it is too big to be simply an angle inside of a triangle?!?!?
We will take our cue from the first quadrant. In that quadrant, a radius r will terminate at a point (x,y). Those co-ordinates define a right triangle.
For any point P(x,y) on the terminal arm of an angle in standard position, the trigonometric functions are
ry
=θsin rx
=θcos xy
=θtan 0≠x
As θ changes, the magnitude and sign of x and y also change. On worksheet #2, students should refer to graphs for the three primary trig ratios, and consolidate skills from periodicity to complete the characteristics of these repeating functions.
Recall the primary trig ratios for triangles: SOH CAH TOA
hypopp
=θsin hypadj
=θcos adjopp
=θtan
x
y
• P
Lesson 3 – The CAST Rule A positive sign for trigonometric functions is summarized using the CAST rule.
C indicates that θcos is positive.
A indicates all trig ratios are positive.
S indicates that θsin is positive.
T indicates that θtan is positive.
θsin is θcos is θtan is In Quadrant 1 + + + In Quadrant 2 + - - In Quadrant 3 - - + In Quadrant 4 - + -
Summary of Special Angles (found Using Unit circles) o0 o30 o45 o60 o90 o180 o270 o360 sin 0
21
2
1
23
1 0 -1 0
cos 1
23
21
21
0 -1 0 1
tan 0
31
1 3 undefined 0 undefined 0
The CAST Rule
S A
T C
2 1 3 4
Homework : from textbook (choose contextualized examples)
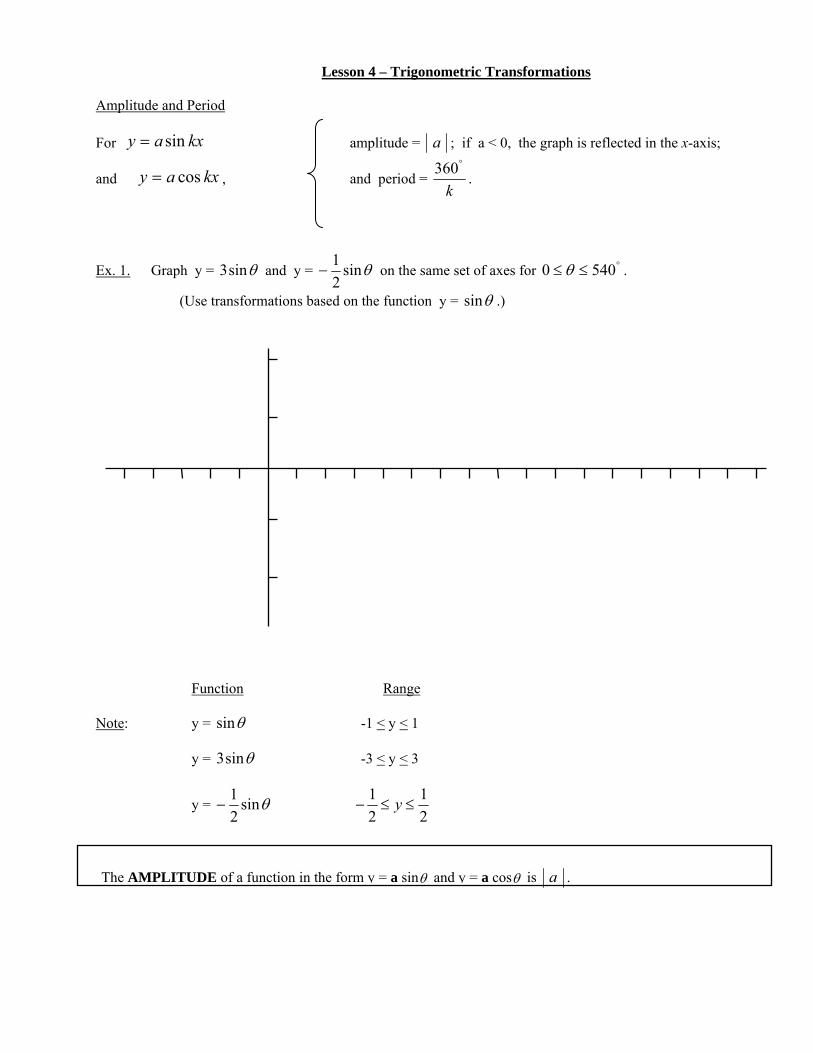
Lesson 4 – Trigonometric Transformations
Amplitude and Period For kxay sin= amplitude = a ; if a < 0, the graph is reflected in the x-axis;
and kxay cos= , and period = k
°360.
Ex. 1. Graph y = θsin3 and y = θsin21
− on the same set of axes for °≤≤ 5400 θ .
(Use transformations based on the function y = θsin .)
Function Range
Note: y = θsin -1 < y < 1 y = θsin3 -3 < y < 3
y = θsin21
− − ≤ ≤12
12
y
The AMPLITUDE of a function in the form y = a sinθ and y = a cosθ is a .
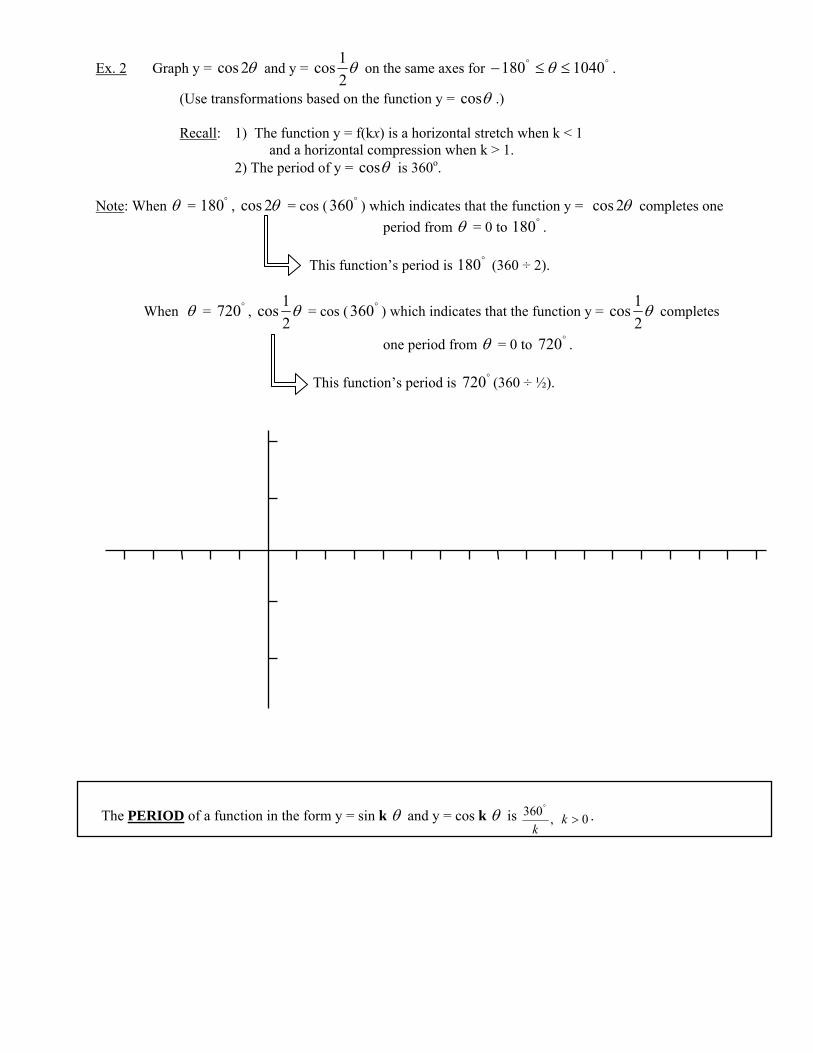
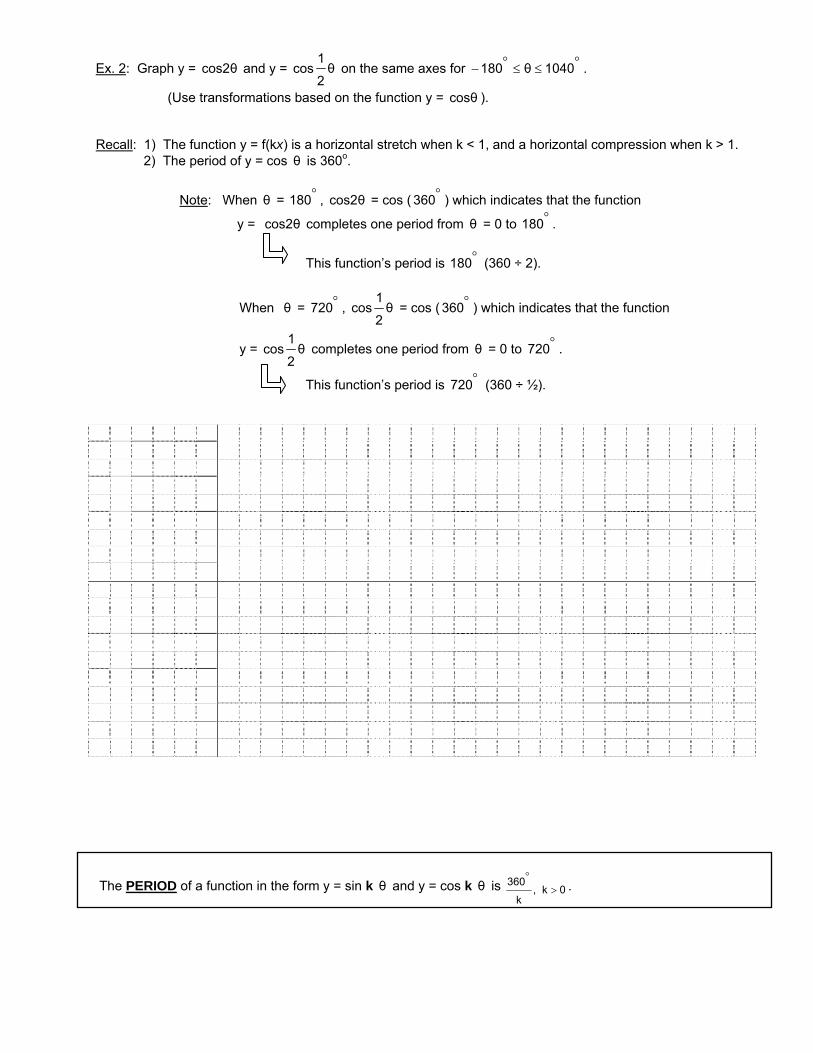
Ex. 2 Graph y = θ2cos and y = θ21cos on the same axes for °° ≤≤− 1040180 θ .
(Use transformations based on the function y = θcos .) Recall: 1) The function y = f(kx) is a horizontal stretch when k < 1
and a horizontal compression when k > 1. 2) The period of y = θcos is 360o.
Note: When θ = °180 , θ2cos = cos ( °360 ) which indicates that the function y = θ2cos completes one
period from θ = 0 to °180 . This function’s period is °180 (360 ÷ 2).
When θ = °720 , θ21cos = cos ( °360 ) which indicates that the function y = θ
21cos completes
one period from θ = 0 to °720 . This function’s period is °720 (360 ÷ ½).
The PERIOD of a function in the form y = sin k θ and y = cos k θ is 0,360
>°
kk
.
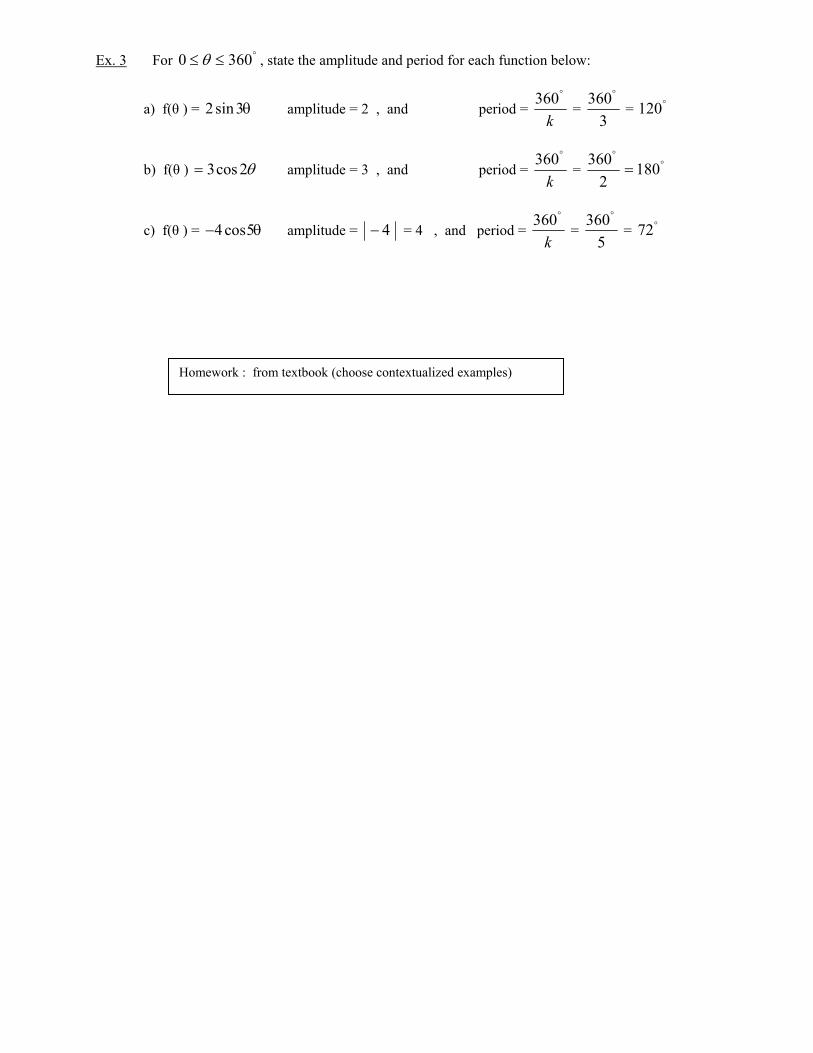
Ex. 3 For °≤≤ 3600 θ , state the amplitude and period for each function below:
a) f(θ ) = 2 3sin θ amplitude = 2 , and period = k
°360 =
3360°
= °120
b) f(θ ) θ2cos3= amplitude = 3 , and period = k
°360 = °
°
= 1802
360
c) f(θ ) = −4 5cos θ amplitude = − 4 = 4 , and period = k
°360 =
5360°
= °72
Homework : from textbook (choose contextualized examples)
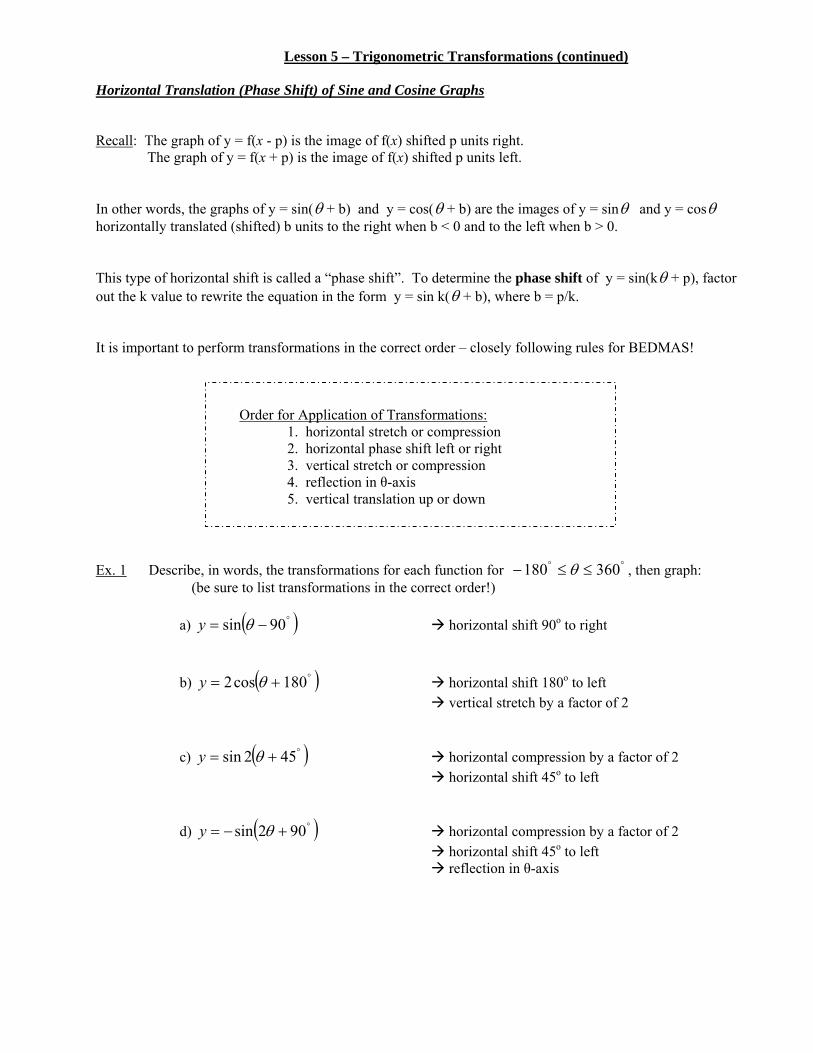
Lesson 5 – Trigonometric Transformations (continued) Horizontal Translation (Phase Shift) of Sine and Cosine Graphs Recall: The graph of y = f(x - p) is the image of f(x) shifted p units right.
The graph of y = f(x + p) is the image of f(x) shifted p units left. In other words, the graphs of y = sin(θ + b) and y = cos(θ + b) are the images of y = sinθ and y = cosθ horizontally translated (shifted) b units to the right when b < 0 and to the left when b > 0. This type of horizontal shift is called a “phase shift”. To determine the phase shift of y = sin(kθ + p), factor out the k value to rewrite the equation in the form y = sin k(θ + b), where b = p/k. It is important to perform transformations in the correct order – closely following rules for BEDMAS!
Order for Application of Transformations: 1. horizontal stretch or compression 2. horizontal phase shift left or right 3. vertical stretch or compression 4. reflection in θ-axis 5. vertical translation up or down
Ex. 1 Describe, in words, the transformations for each function for °° ≤≤− 360180 θ , then graph: (be sure to list transformations in the correct order!)
a) ( )°−= 90sin θy horizontal shift 90o to right b) ( )°+= 180cos2 θy horizontal shift 180o to left
vertical stretch by a factor of 2 c) ( )°+= 452sin θy horizontal compression by a factor of 2
horizontal shift 45o to left d) ( )°+−= 902sin θy horizontal compression by a factor of 2
horizontal shift 45o to left reflection in θ-axis

Vertical Translation of Sine and Cosine Graphs Recall: The function y = f(x) + q is the image of y = f(x) shifted q units upward when q is positive and q units
downward when q is negative. In other words, the graphs of the functions y = sinθ + d and y = cosθ + d are the images of y = sinθ and y = cosθ shifted “d” units upwards when d > 0 and “d” units downwards when d < 0. Ex2. Describe, in words, the transformations for each function for °° ≤≤− 360180 θ , then graph: (be sure to list transformations in the correct order!)
a) y = +2 3cosθ vertical stretch by a factor of 2 vertical translation up 3
b) ( ) 260sin −−= °θy horizontal shift 60o to right vertical translation down 2
c) ( ) 5.11203cos ++−= °θy horizontal compression by a factor of 3 horizontal shift 120o to left reflection in θ-axis vertical translation up 1.5
d) ( ) 21802cos3 +−= °xy horizontal compression by a factor of 2 horizontal shift 90o to right vertical stretch by a factor of 3 vertical translation up 2
Students should complete Worksheet #3, either independently, or in pairs.

Lesson 6 – Trigonometric Transformations (continued) Students will work through related handouts (Student Worksheets #4 and 5) in pairs to consolidate understanding of trigonometric transformations. Worksheets should be corrected and/or assessed in a formative way.
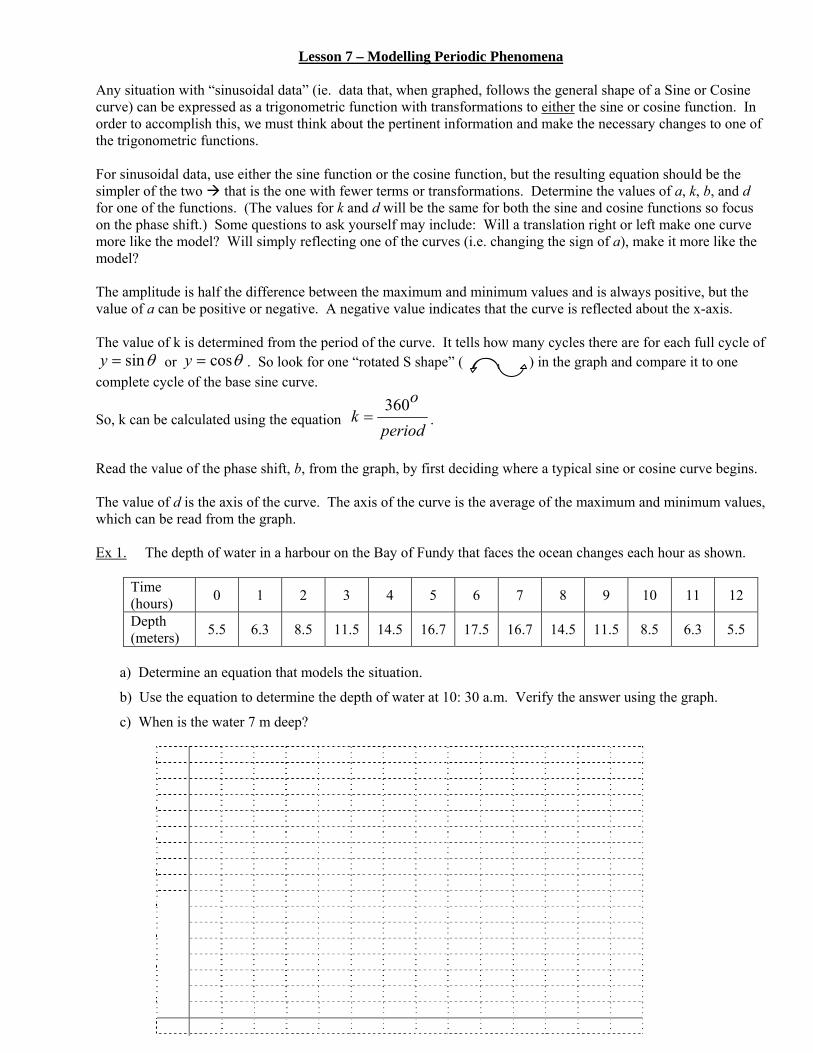
Lesson 7 – Modelling Periodic Phenomena Any situation with “sinusoidal data” (ie. data that, when graphed, follows the general shape of a Sine or Cosine curve) can be expressed as a trigonometric function with transformations to either the sine or cosine function. In order to accomplish this, we must think about the pertinent information and make the necessary changes to one of the trigonometric functions. For sinusoidal data, use either the sine function or the cosine function, but the resulting equation should be the simpler of the two that is the one with fewer terms or transformations. Determine the values of a, k, b, and d for one of the functions. (The values for k and d will be the same for both the sine and cosine functions so focus on the phase shift.) Some questions to ask yourself may include: Will a translation right or left make one curve more like the model? Will simply reflecting one of the curves (i.e. changing the sign of a), make it more like the model? The amplitude is half the difference between the maximum and minimum values and is always positive, but the value of a can be positive or negative. A negative value indicates that the curve is reflected about the x-axis. The value of k is determined from the period of the curve. It tells how many cycles there are for each full cycle of
θsin=y or θcos=y . So look for one “rotated S shape” ( ) in the graph and compare it to one complete cycle of the base sine curve.
So, k can be calculated using the equation period
ok
360= .
Read the value of the phase shift, b, from the graph, by first deciding where a typical sine or cosine curve begins. The value of d is the axis of the curve. The axis of the curve is the average of the maximum and minimum values, which can be read from the graph. Ex 1. The depth of water in a harbour on the Bay of Fundy that faces the ocean changes each hour as shown.
Time (hours) 0 1 2 3 4 5 6 7 8 9 10 11 12
Depth (meters) 5.5 6.3 8.5 11.5 14.5 16.7 17.5 16.7 14.5 11.5 8.5 6.3 5.5
a) Determine an equation that models the situation.
b) Use the equation to determine the depth of water at 10: 30 a.m. Verify the answer using the graph.
c) When is the water 7 m deep?
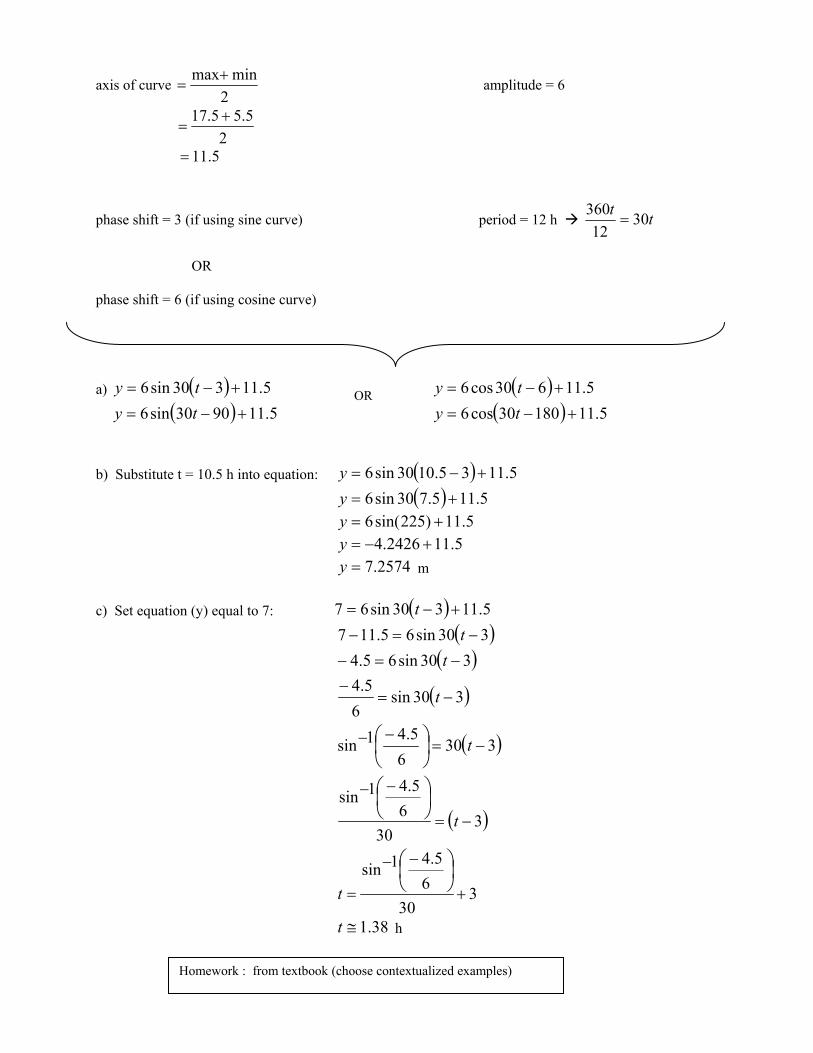
axis of curve 2
minmax+= amplitude = 6
2
5.55.17 +=
5.11=
phase shift = 3 (if using sine curve) period = 12 h tt 3012
360=
OR phase shift = 6 (if using cosine curve)
a) ( ) 5.11330sin6 +−= ty ( ) 5.11630cos6 +−= ty
( ) 5.119030sin6 +−= ty ( ) 5.1118030cos6 +−= ty
b) Substitute t = 10.5 h into equation: ( ) 5.1135.1030sin6 +−=y
( ) 5.115.730sin6 +=y 5.11)225sin(6 +=y
5.112426.4 +−=y 2574.7=y m
c) Set equation (y) equal to 7: ( ) 5.11330sin67 +−= t
( )330sin65.117 −=− t
( )330sin65.4 −=− t
( )330sin6
5.4−=
−t
( )3306
5.41sin −=−− ⎟
⎠⎞
⎜⎝⎛ t
( )330
65.41sin
−=
−− ⎟⎠⎞
⎜⎝⎛
t
330
65.41sin
+
−−
=⎟⎠⎞
⎜⎝⎛
t
38.1≅t h
OR
Homework : from textbook (choose contextualized examples)
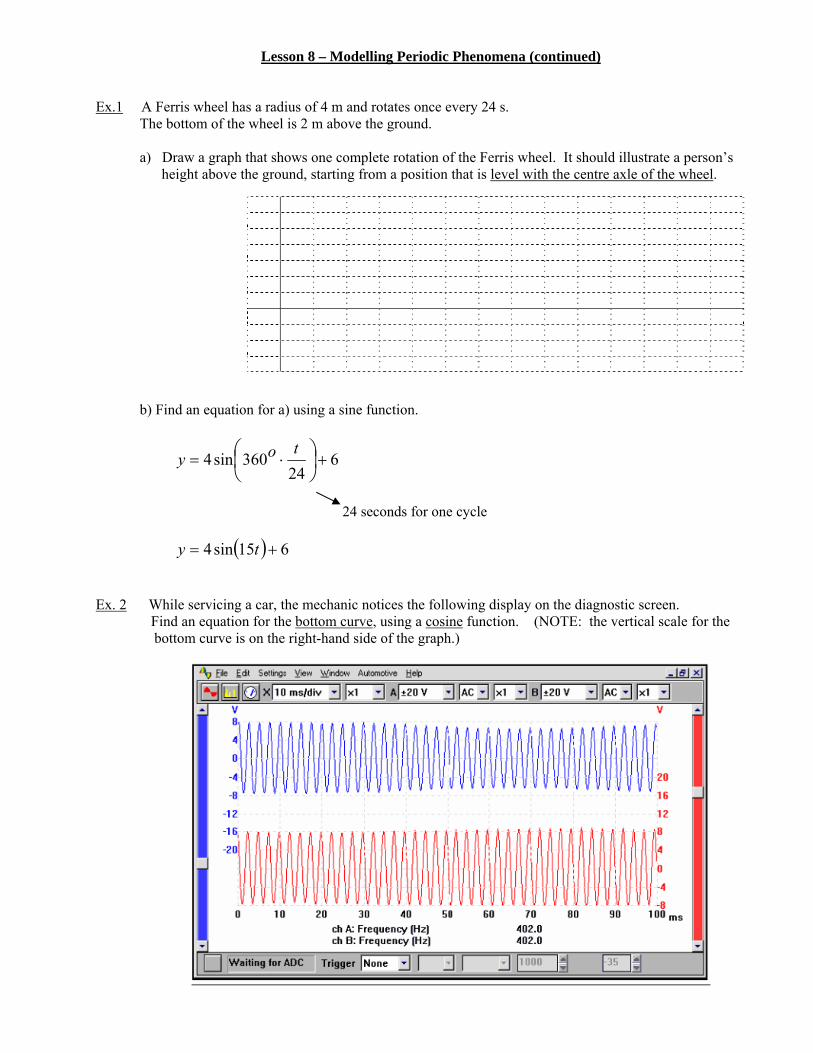
Lesson 8 – Modelling Periodic Phenomena (continued) Ex.1 A Ferris wheel has a radius of 4 m and rotates once every 24 s. The bottom of the wheel is 2 m above the ground.
a) Draw a graph that shows one complete rotation of the Ferris wheel. It should illustrate a person’s height above the ground, starting from a position that is level with the centre axle of the wheel.
b) Find an equation for a) using a sine function.
624
360sin4 +⋅= ⎟⎠⎞
⎜⎝⎛ toy
24 seconds for one cycle
( ) 615sin4 += ty
Ex. 2 While servicing a car, the mechanic notices the following display on the diagnostic screen. Find an equation for the bottom curve, using a cosine function. (NOTE: the vertical scale for the
bottom curve is on the right-hand side of the graph.)
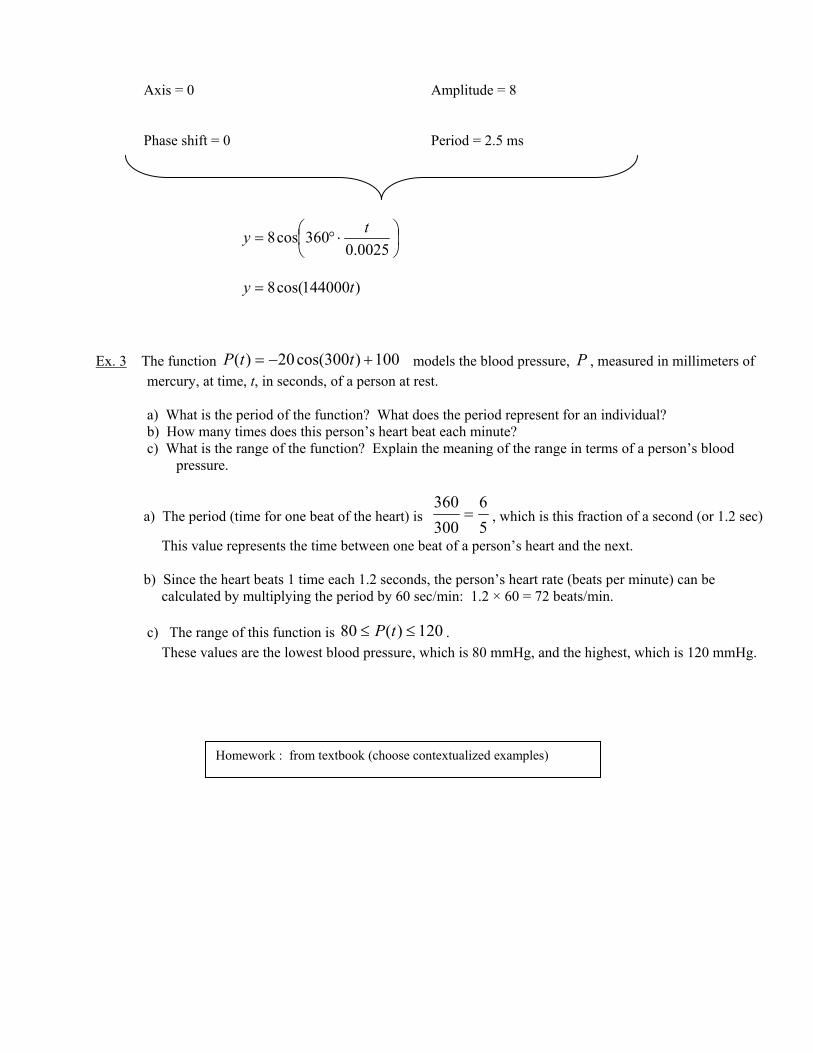
Axis = 0 Amplitude = 8
Phase shift = 0 Period = 2.5 ms
⎟⎠⎞
⎜⎝⎛ ⋅°=
0025.0360cos8 ty
)144000cos(8 ty =
Ex. 3 The function 100)300cos(20)( +−= ttP models the blood pressure, P , measured in millimeters of
mercury, at time, t, in seconds, of a person at rest.
a) What is the period of the function? What does the period represent for an individual? b) How many times does this person’s heart beat each minute? c) What is the range of the function? Explain the meaning of the range in terms of a person’s blood
pressure.
a) The period (time for one beat of the heart) is 56
300360
= , which is this fraction of a second (or 1.2 sec)
This value represents the time between one beat of a person’s heart and the next.
b) Since the heart beats 1 time each 1.2 seconds, the person’s heart rate (beats per minute) can be calculated by multiplying the period by 60 sec/min: 1.2 × 60 = 72 beats/min.
c) The range of this function is 120)(80 ≤≤ tP .
These values are the lowest blood pressure, which is 80 mmHg, and the highest, which is 120 mmHg.
Homework : from textbook (choose contextualized examples)
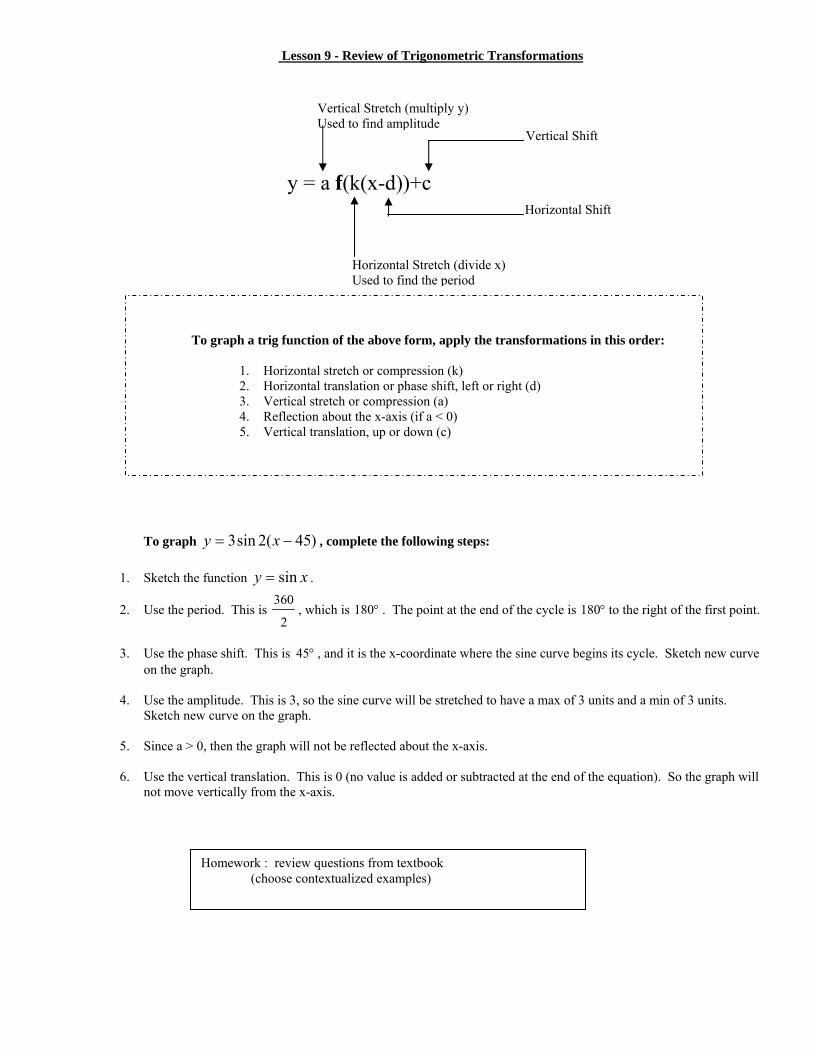
Lesson 9 - Review of Trigonometric Transformations
y = a f(k(x-d))+c To graph a trig function of the above form, apply the transformations in this order:
1. Horizontal stretch or compression (k) 2. Horizontal translation or phase shift, left or right (d) 3. Vertical stretch or compression (a) 4. Reflection about the x-axis (if a < 0) 5. Vertical translation, up or down (c)
To graph )45(2sin3 −= xy , complete the following steps:
1. Sketch the function xy sin= .
2. Use the period. This is 2
360, which is °180 . The point at the end of the cycle is °180 to the right of the first point.
3. Use the phase shift. This is °45 , and it is the x-coordinate where the sine curve begins its cycle. Sketch new curve
on the graph.
4. Use the amplitude. This is 3, so the sine curve will be stretched to have a max of 3 units and a min of 3 units. Sketch new curve on the graph.
5. Since a > 0, then the graph will not be reflected about the x-axis.
6. Use the vertical translation. This is 0 (no value is added or subtracted at the end of the equation). So the graph will
not move vertically from the x-axis.
Vertical Stretch (multiply y) Used to find amplitude
Vertical Shift
Horizontal Shift
Horizontal Stretch (divide x) Used to find the period
Homework : review questions from textbook (choose contextualized examples)
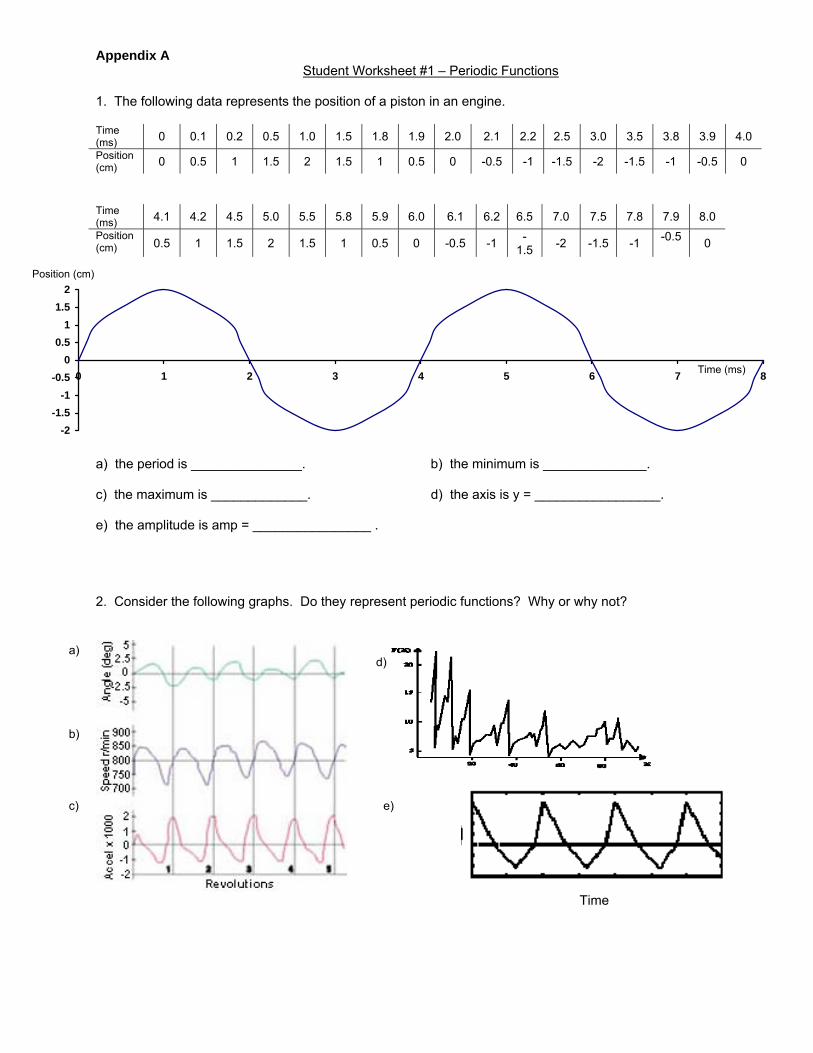
Appendix A Student Worksheet #1 – Periodic Functions
1. The following data represents the position of a piston in an engine. Time (ms) 0 0.1 0.2 0.5 1.0 1.5 1.8 1.9 2.0 2.1 2.2 2.5 3.0 3.5 3.8 3.9 4.0 Position (cm) 0 0.5 1 1.5 2 1.5 1 0.5 0 -0.5 -1 -1.5 -2 -1.5 -1 -0.5 0
Time (ms) 4.1 4.2 4.5 5.0 5.5 5.8 5.9 6.0 6.1 6.2 6.5 7.0 7.5 7.8 7.9 8.0 Position (cm) 0.5 1 1.5 2 1.5 1 0.5 0 -0.5 -1 -
1.5 -2 -1.5 -1 -0.5 0
a) the period is _______________. b) the minimum is ______________. c) the maximum is _____________. d) the axis is y = _________________. e) the amplitude is amp = ________________ . 2. Consider the following graphs. Do they represent periodic functions? Why or why not?
-2-1.5
-1-0.5
00.5
11.5
2
0 1 2 3 4 5 6 7 8
a)
b)
d)
e) c)
Time
Time (ms)
Position (cm)
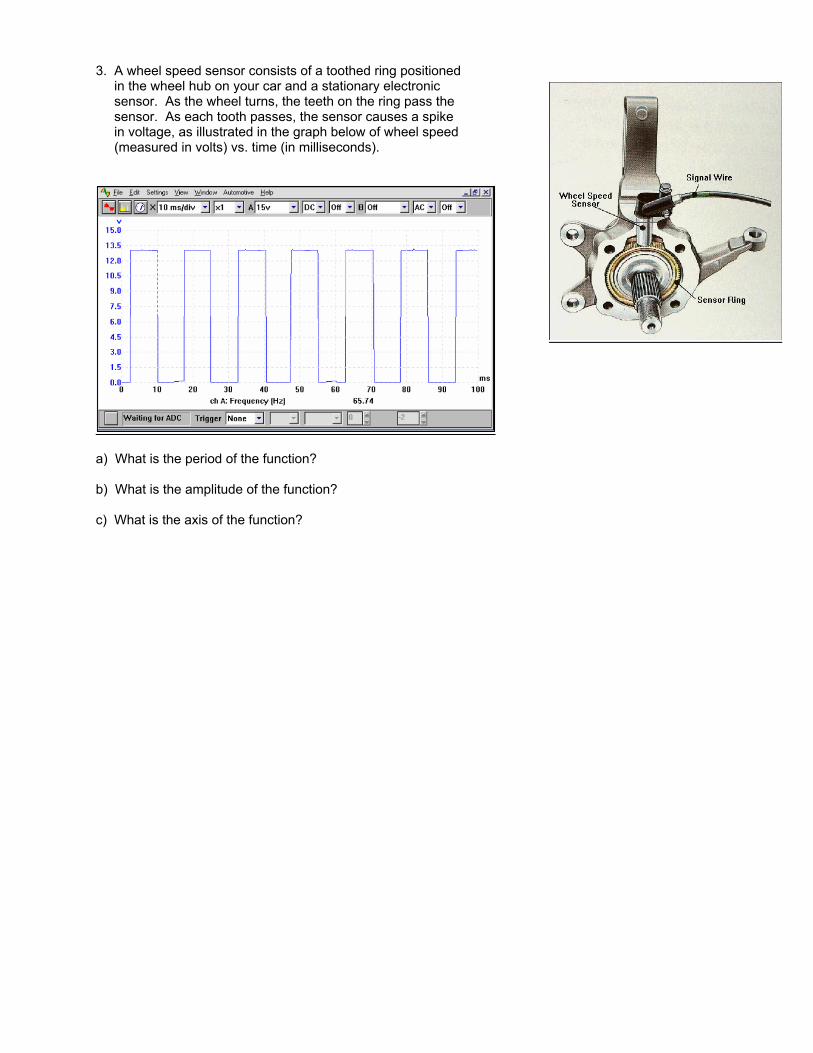
3. A wheel speed sensor consists of a toothed ring positioned in the wheel hub on your car and a stationary electronic sensor. As the wheel turns, the teeth on the ring pass the sensor. As each tooth passes, the sensor causes a spike in voltage, as illustrated in the graph below of wheel speed (measured in volts) vs. time (in milliseconds).
a) What is the period of the function? b) What is the amplitude of the function? c) What is the axis of the function?
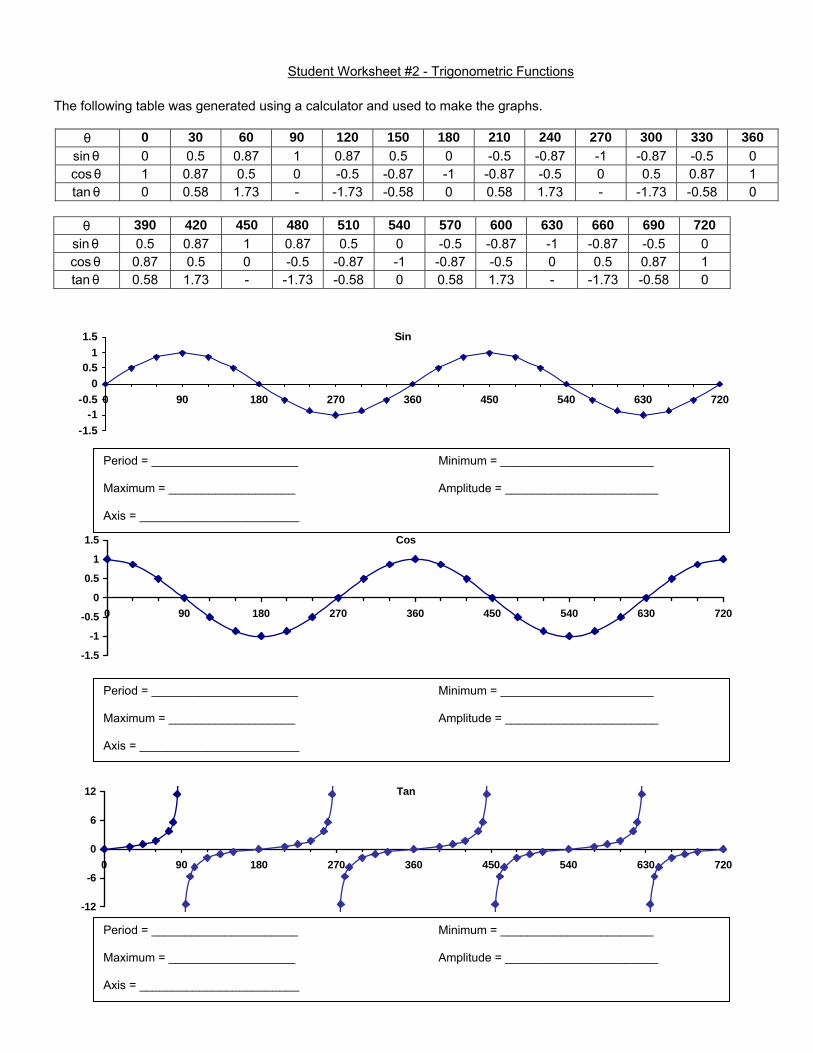
Student Worksheet #2 - Trigonometric Functions
The following table was generated using a calculator and used to make the graphs.
θ 0 30 60 90 120 150 180 210 240 270 300 330 360 sinθ 0 0.5 0.87 1 0.87 0.5 0 -0.5 -0.87 -1 -0.87 -0.5 0 cosθ 1 0.87 0.5 0 -0.5 -0.87 -1 -0.87 -0.5 0 0.5 0.87 1 tanθ 0 0.58 1.73 - -1.73 -0.58 0 0.58 1.73 - -1.73 -0.58 0
θ 390 420 450 480 510 540 570 600 630 660 690 720
sinθ 0.5 0.87 1 0.87 0.5 0 -0.5 -0.87 -1 -0.87 -0.5 0 cosθ 0.87 0.5 0 -0.5 -0.87 -1 -0.87 -0.5 0 0.5 0.87 1 tanθ 0.58 1.73 - -1.73 -0.58 0 0.58 1.73 - -1.73 -0.58 0
Sin
-1.5-1
-0.50
0.51
1.5
0 90 180 270 360 450 540 630 720
Cos
-1.5
-1
-0.5
0
0.5
1
1.5
0 90 180 270 360 450 540 630 720
Tan
-12
-6
0
6
12
0 90 180 270 360 450 540 630 720
Period = ______________________ Minimum = _______________________ Maximum = ___________________ Amplitude = _______________________ Axis = ________________________
Period = ______________________ Minimum = _______________________ Maximum = ___________________ Amplitude = _______________________ Axis = ________________________
Period = ______________________ Minimum = _______________________ Maximum = ___________________ Amplitude = _______________________ Axis = ________________________
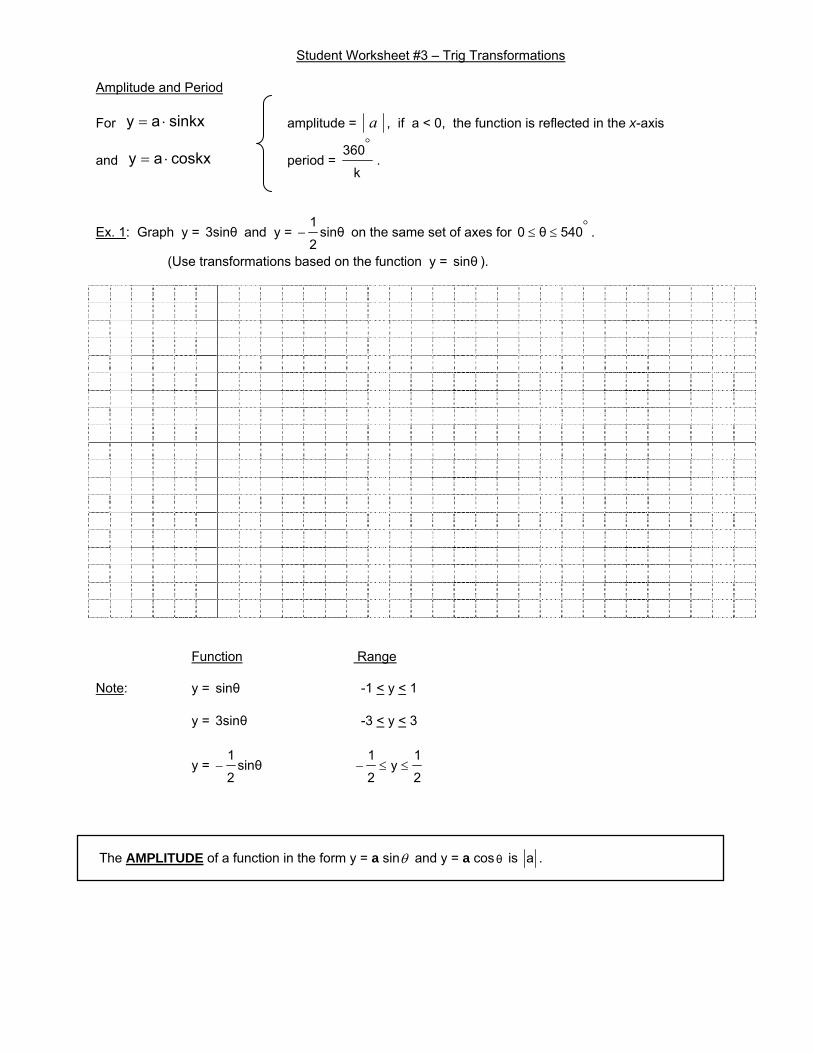
Student Worksheet #3 – Trig Transformations Amplitude and Period For sinkxay ⋅= amplitude = a , if a < 0, the function is reflected in the x-axis
and coskxay ⋅= period = k
360°.
Ex. 1: Graph y = 3sinθ and y = sinθ2
1− on the same set of axes for °≤≤ 540θ0 .
(Use transformations based on the function y = sinθ ).
Function Range
Note: y = sinθ -1 < y < 1 y = 3sinθ -3 < y < 3
y = sinθ2
1−
2
1y
2
1≤≤−
The AMPLITUDE of a function in the form y = a sinθ and y = a cosθ is a .
Ex. 2: Graph y = cos2θ and y = θ2
1cos on the same axes for °≤≤°− 1040θ180 .
(Use transformations based on the function y = cosθ ).
Recall: 1) The function y = f(kx) is a horizontal stretch when k < 1, and a horizontal compression when k > 1. 2) The period of y = cos θ is 360o.
Note: When θ = °180 , cos2θ = cos ( °360 ) which indicates that the function
y = cos2θ completes one period from θ = 0 to °180 .
This function’s period is °180 (360 ÷ 2).
When θ = °720 , θ2
1cos = cos ( °360 ) which indicates that the function
y = θ2
1cos completes one period from θ = 0 to °720 .
This function’s period is °720 (360 ÷ ½).
The PERIOD of a function in the form y = sin k θ and y = cos k θ is 0k,k
360>
°.
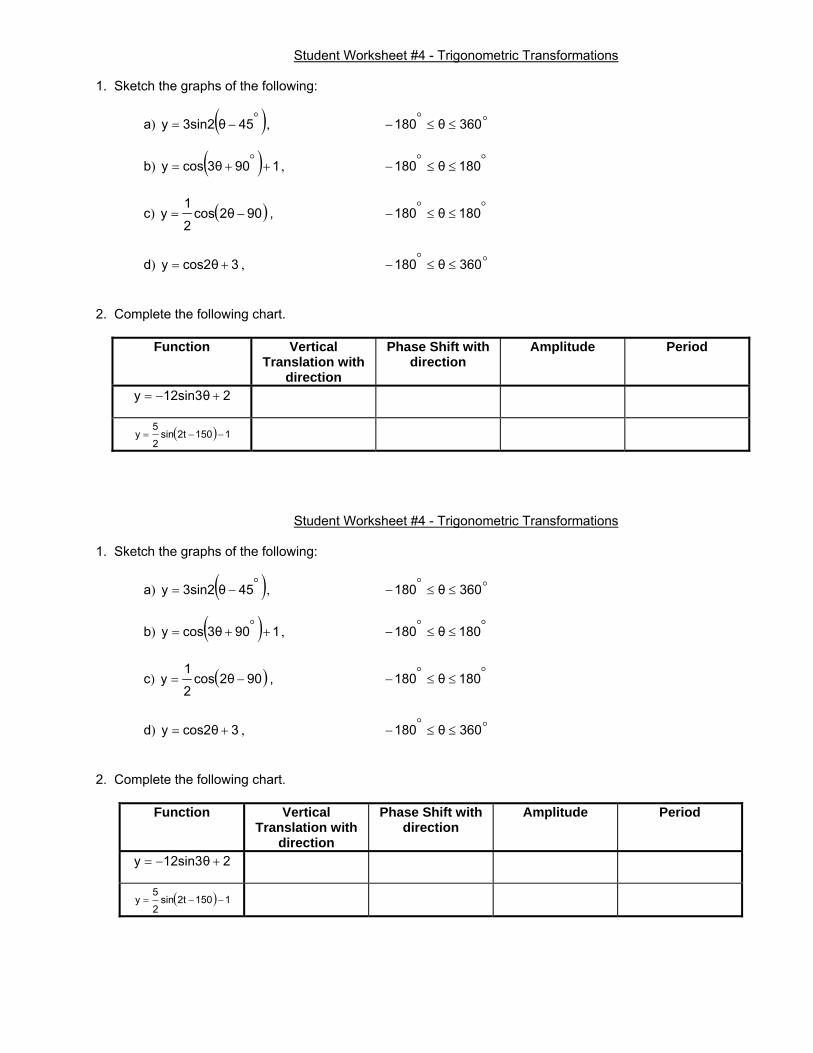
Student Worksheet #4 - Trigonometric Transformations 1. Sketch the graphs of the following:
a) ( )°−= 45θ3sin2y , o360θ180 ≤≤°−
b) ( ) 1903θcosy +°+= , °≤≤°− 180θ180
c) ( )902θcos2
1y −= , °≤≤°− 180θ180
d) 3cos2θy += , o360θ180 ≤≤°− 2. Complete the following chart.
Function Vertical Translation with
direction
Phase Shift with direction
Amplitude Period
212sin3θy +−=
( ) 11502tsin2
5y −−=

Student Worksheet #5 - Trig Transformations Practice
1. Graph each function and complete the information that follows each graph. a) f(θ) 1)453sin(θ +°−= b) f(θ) 2)30cos(θ −°+−=
Period: Amplitude: Equation of the Axis:
Period: Amplitude: Equation of the Axis:
c) f(θ) )1202cos(2θ °+−= d) f(θ) 4)900.5cos(3θ −°+=
Period: Amplitude: Equation of the Axis:
Period: Amplitude: Equation of the Axis:
2. Graph the data in each table. Then find the equation for each using f(θ) dc)asin(kθ ++= .
a) f(θ) ________________________=
°θ -60 30 120 210 300
f(θ) -1 0 -1 -2 -1
b) f(θ) ________________________=
°θ 45 135 225 315 405
f(θ) 2 -1 2 5 2
Page 27 of 28
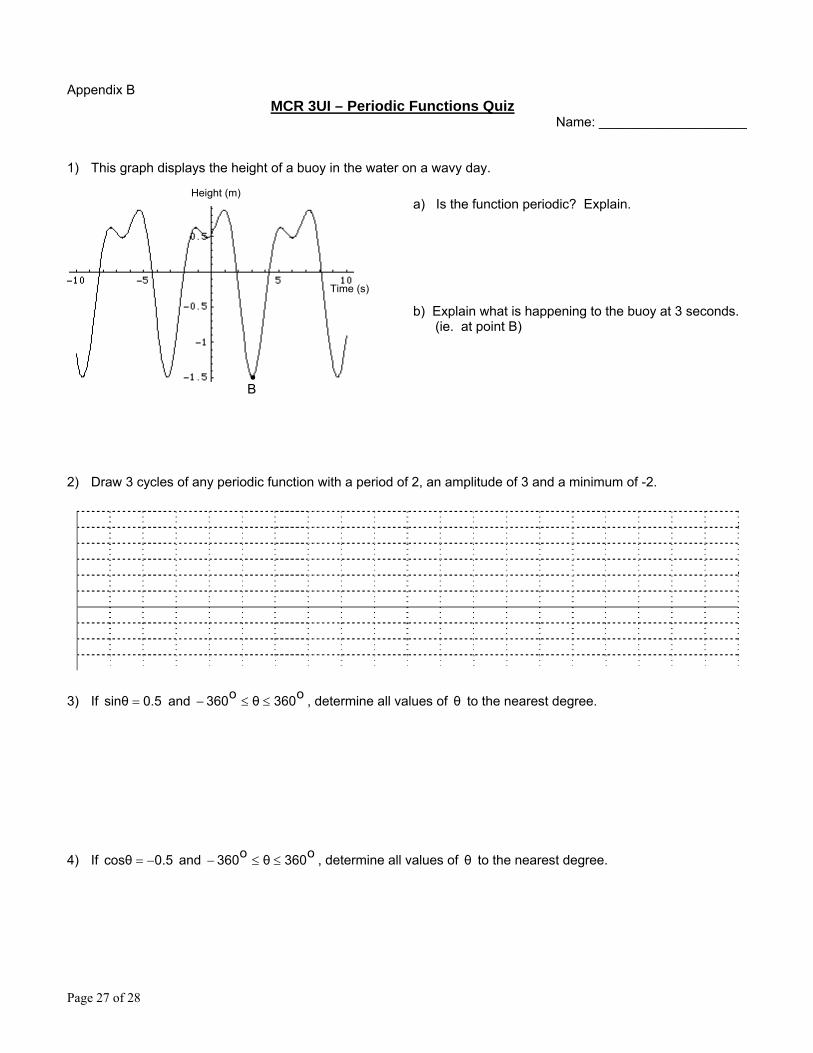
Appendix B
MCR 3UI – Periodic Functions Quiz Name: ____________________ 1) This graph displays the height of a buoy in the water on a wavy day.
2) Draw 3 cycles of any periodic function with a period of 2, an amplitude of 3 and a minimum of -2. 3) If 0.5sinθ = and o360θo360 ≤≤− , determine all values of θ to the nearest degree. 4) If 0.5cosθ −= and o360θo360 ≤≤− , determine all values of θ to the nearest degree.
Height (m) a) Is the function periodic? Explain. b) Explain what is happening to the buoy at 3 seconds. (ie. at point B)
Time (s)
B •
Page 28 of 28
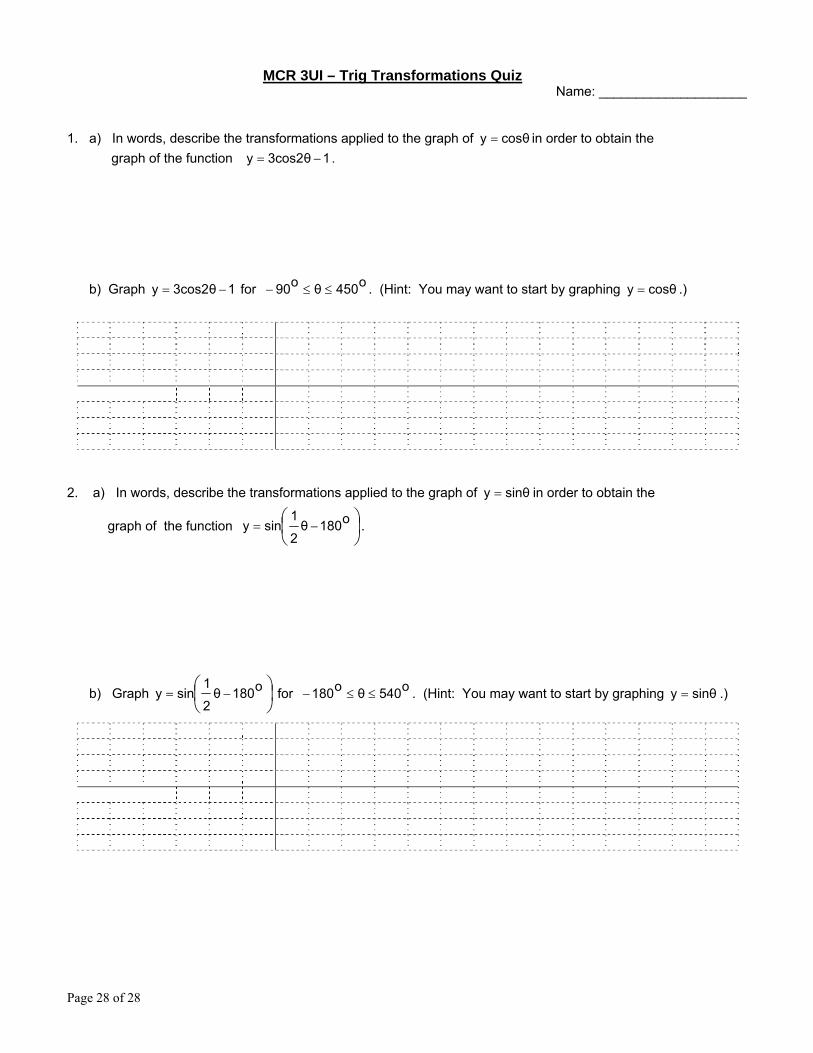
MCR 3UI – Trig Transformations Quiz Name: ____________________ 1. a) In words, describe the transformations applied to the graph of cosθy = in order to obtain the graph of the function 13cos2θy −= . b) Graph 13cos2θy −= for o450θo90 ≤≤− . (Hint: You may want to start by graphing cosθy = .) 2. a) In words, describe the transformations applied to the graph of sinθy = in order to obtain the
graph of the function ⎟⎠⎞
⎜⎝⎛
−= o180θ2
1siny .
b) Graph ⎟⎠⎞
⎜⎝⎛
−= o180θ2
1siny for o540θo180 ≤≤− . (Hint: You may want to start by graphing sinθy = .)


![Designing Contextualized Learning · Designing Contextualized Learning Marcus Specht [marcus.specht@ou.nl], Educational Technology Expertise Centre, Open Universiteit Nederlands,](https://img.pdfslide.us/doc/110x75/600a6e9f96d1e569916acb11/designing-contextualized-learning-designing-contextualized-learning-marcus-specht.jpg)