Embed Size (px)
Citation preview
Contextual Verification for False Alarm Reduction in Maritime Anomaly Detection
Aungon Nag Radon∗, Ke Wang†, Uwe Glasser‡, Hans Wehn§ and Andrew Westwell-Roper¶∗†‡ School of Computing Science, Simon Fraser University, Burnaby, BC, Canada
Email: {aradon∗, wangk†,glaesser‡}@cs.sfu.ca§¶ MDA Systems Ltd, Research & Development, Richmond, BC, Canada
Email: {hw§, awr¶ }@mdacorporation.com
Abstract—Automated vessel anomaly detection is immenselyimportant for preventing and reducing illegal activities (e.g.,drug dealing, human trafficking, etc.) and for effective emer-gency response and rescue in a country’s territorial waters.A major limitation of previously proposed vessel anomalydetection techniques is the high rate of false alarms as thesemethods mainly consider vessel kinematic information which isgenerally obtained from AIS data. In many cases, an anomalousvessel in terms of kinematic data can be completely normal andlegitimate if the “context” at the location and time (e.g., weatherand sea conditions) of the vessel is factored in. In this paper,we propose a novel anomalous vessel detection framework thatutilizes such contextual information to reduce false alarmsthrough “contextual verification”. We evaluate our proposedframework for vessel anomaly detection using massive amountof real-life AIS data sets obtained from U.S. Coast Guard.Though our study and developed prototype is based on themaritime domain the basic idea of using contextual informationthrough “contextual verification” to filter false alarms can beapplied to other domains as well.
Keywords-Contextual Verification; False Alarm Reduction;Anomaly Detection; Trajectory Clustering; AIS Data
I. INTRODUCTION
Maritime transportation represents approximately 90% ofglobal trade by volume, placing safety and security chal-lenges as a high priority for nations across the globe [1].According to the U.S. Department of Homeland Security,anomaly detection is one of many enabling technologiesfor Maritime Domain Awareness (MDA) that impacts thesecurity, safety, environment and economy of a country [2].Anomalous vessel detection (i.e. finding abnormal vesselmovement) is immensely important for protecting sea lanes,ports, harbours, fisheries and infrastructure against threatsand illegal activities, including contraband smuggling, drug,weapon and human trafficking, piracy, and terrorism. Earlyanomaly detection is also critical for emergency responseand rescue at sea.
Automatic Identification System (AIS) technology1 pro-vides a vast amount of near real-time vessel movement(i.e. kinematic) information. As an example, the Centrefor Maritime Research and Experimentation (CMRE) iscurrently receiving an average of 600 Million AIS messagesper month from multiple sources, and the rate is increasing
1http://www.imo.org/OurWork/Safety/Navigation/Pages/AIS.aspx
[1]. Observed AIS messages over time for a particular vesselrenders a trajectory for that vessel. This vast amount ofvessel trajectory data calls for an ever-increasing degreeof automation to extract meaningful information from thisbig data to support operational decision makers. Automatedanomaly detection by extracting normal vessel routes fromvast amount of historical vessel trajectory data and sendingalerts in real-time for possible movement deviation of aparticular vessel is a promising big data mining researchdirection.
A. Importance of Contextual Information
So far the main source of data for automated anomalydetection in the maritime domain has been AIS data. Amajor limitation of this approach is the high number offalse alarms as contextual information is ignored in thedetection process [3]. As an example, approximately 20%false alarms were generated from the real world AIS mes-sages (approximately 28 Million) in the Western coast ofSweden during January 2008 [4]. As a result, for CoastGuard, filtering the large number of false alarms is one ofthe most important tasks in big data application because thisis a time consuming process. This situation motivates us toconsider “contextual information” in the automated vesselanomaly detection process in order to reduce false alarms.
In many cases, an anomalous vessel in terms of kinematicdata can be completely normal and legitimate if the contextat the location and time is taken into account. In principle,the context could include any factor that potentially impactsthe movement of a vessel, including marine currents, waves,weather conditions, oil price, change or cancellation ofcontracts, change of destinations and routes, and seaportmaintenance, to name a few. For example, high waves orpoor weather conditions could be the cause of an abnormallyslow vessel; a hike in oil prices could be the reason fortaking a shorter, but more dangerous route; and a severedisaster, such as a hurricane could cause a vessel to deviatesignificantly from its normal route [5]. In this paper, theterm “contextual information” refers to information aboutevents or factors that are external to the kinematic data buthave impact in the movement of vessels. We propose to usecontextual information to reduce false alarms.
B. Challenges
Reducing high number of false alarms is extremely impor-tant for vessel anomaly detection. However, reducing falseof alarms is a big challenge. First, it requires consideringother external information sources apart from AIS data andthe cost of false negatives is high for the safety and securityof a country. Second, this is accelerated by the fact thatthe collected AIS data is often incomplete to start withanomaly detection. For example, vessels engaging in illegalactivities may turn off broadcasting AIS data for sometime. In addition, vessel trajectories are long (over manyhours) and densely sampled (typically 1 min). Resamplingthe entire trajectory at a coarser time resolution may missan anomalous movement if such movement occurs duringthe time between sampled points. Third, required data foranomaly detection may come from diverse sources (e.g., AISdata and weather centers) and often certain information isnot available at all, calling for an efficient data cleaningtechnique. Fourth, real-time anomaly notification throughanalyzing big AIS data stream is a challenge if the systemis expected to adapt to the changes and new contextualknowledge.
C. Contribution
• We propose a novel vessel anomaly detection frame-work for minimizing false alarms in the maritimedomain with the help of contextual information. Toour knowledge, we are the first to combine both vesselkinematic information and contextual information in theautomated vessel anomaly detection process to supportmaritime situation analysis.
• Our framework is able to extract normal vessel move-ment patterns from long vessel trajectories even if thetrajectories are incomplete. We have written scriptsfor cleaning the data that comes from diverse sourcesfollowing the convention in maritime domain.
• Our anomaly detection method can incorporate newcontextual knowledge provided by domain experts orobtained from external sources which is a major crite-rion for false alarm reduction. We evaluate the proposedframework through empirical studies on real life AISdata sets obtained from the U.S. Coast Guard, whichsuggests that the framework is able to reduce falsealarms.
• Our developed prototype provides visualization of nor-mal patterns and anomalies for user support throughGoogle Earth.
D. Paper Organization
We describe the preliminaries and the high level problemstatement in Section II. In Section III, we review researchrelated to maritime anomaly detection and discuss how ourwork is different from other works in the literature. Thenwe provide an overview of our proposed framework with a
high level approach for anomaly detection in Section IV.The core components of the framework, i.e. normal patternextractor and anomaly detector, are described in Sections Vand VI respectively. Empirical studies that include evaluationof the framework are provided in Section VII. Concludingremarks are provided in Section VIII.
II. PRELIMINARIES & PROBLEM STATEMENT
We first describe several frequently used terms in thispaper and then define the problem that we studied.
A. Preliminaries
1) Vessel Position Report: A Vessel Position Report(also called an AIS data point) provides vessel kine-matic information at a certain time interval (1 min inour data set, though AIS transponders send data morefrequently, but the data set we are using has been pre-processed by U.S. Coast Guard). The four kinematic fea-tures Longitude, Latitude, SpeedOverGround (SOG)and CourseOverGround (COG) form a vessel positionreport at each time instant BaseDateT ime. These valuesare extracted from the Broadcast Features table of an AISMessage (see Fig. 1). The position of a vessel can be trackedfrom Longitude and Latitude attributes, whereas velocity anddirection can be obtained from SOG and COG, respectively.The Voyage Table and Vessel Table of the AIS Messageprovide voyage and vessel related information, respectively.For example, the Destination attribute of Voyage Table pro-vides port of destination information and the V esselTypeattribute of a Vessel Table provides information about thetype of vessel (cargo, tanker, passenger ship, etc.).
Voyage Table
VoyageID
Destination
ETA
StartTime
EndTime
MMSI
Broadcast Features
Longitude
Latitude
SpeedOverGround(SOG)
CourseOverGround(COG)
Heading
RateOfTurn(ROT)
BaseDateTime
Status
MMSI
VoyageID
Vessel Table
MMSI
IMO
CallSign
VesselName
VesselType
Length
Width
Figure 1: AIS Message Structure
2) Vessel Track: We represent a vessel’smovement by a track (can also be called trajectory)Ti =< t1, t2, t3, . . . , tn > from a port of origin to a portof destination, where ti denotes the Vessel Position Reportreceived at the ith time point into the voyage. Notice thatthe absolute time at the ith point is not required to be thesame for different tracks. For example, if one voyage fromVancouver to Seattle starts at 1 p.m. and another starts at
3 p.m., t1 for the first voyage corresponds to the data at 1p.m. and t1 for the second voyage corresponds to the dataat 3 p.m. In the Broadcast Features table, each vessel trackis associated with a unique VoyageID, whereas each vesselis associated with a 9-digit MMSI.
3) Track Segment: A track segment is formed byconsecutive Vessel Position Reports that are a subset ofthe full vessel track. For example, a vessel going fromVancouver to Seattle may be completely normal for mostparts, but deviates from normal movement patterns onlyfor a short < t1, t2, t3, t4 > segment of the full track Ti.If the entire track is considered, it is difficult to detectthe anomalous movement because typically anomalousbehaviour of a vessel in the sea is observed for a shortperiod of time. This anomalous behaviour can be efficientlydetected if the system analyzes the observed track segmentinstead of the full vessel track as large portion of the trackgenerally behaves normally.
4) Normal Movement Pattern: A normal vesselmovement pattern is discovered by clustering the set ofhistorical vessel tracks between a particular origin anddestination. Each normal pattern represents a typical routethat is followed by many vessels. Note that the origin anddestination do not necessarily refer to the actual port oforigin and port of destination of the tracks. Instead, theoperator can select any geographically bounded polygons(via visualization tools) of interest to specify the origin anddestination of the tracks for mining the movement patterns.In general, such tracks can be a part of the entire journeyof a vessel, in which case the actual departure port anddestination port may not be needed.
5) Potential Anomaly: A vessel track segment is apotential anomaly if the movement of the track segmentdeviates from the normal movement patterns. This deviationcan be in one or more of the four kinematic features.
6) Anomaly: A potentially anomalous vessel is signaledas an anomaly if the contextual features are within thenormal range for the duration of that vessel’s movement.For example, if wind speed at the location and time ofthe movement deviation is within the normal range in thedirection of the deviation, then wind speed is not a factor inthe deviation, so the potential anomaly is confirmed.
B. Problem Statement
Our objective is to detect anomalous track segments inreal-time within operator’s geographical area of interestfrom a received AIS data stream and on-demand contextualinformation with the focus on reducing false alarms.
Our problem significantly differs from other studiedanomaly detection problems in the maritime domain infollowing two aspects.
• How to minimize the high number of false alarmswhich is a major concern for end user (e.g., CoastGuard)?
• How to combine both AIS data and contextual informa-tion in the automated vessel anomaly detection process?
Note that not all anomalies necessarily exhibit kinematicdeviation. In this paper, we focus on those vessel anomaliesthat have observable kinematic deviations. A taxonomy of16 different types of anomalies due to kinematic deviationis listed in [3].
III. RELATED WORKS
Although we have found different approaches (see [6])in the literature for anomaly detection, most of them aredomain specific such as Cyber-Intrusion Detection, MedicalAnomaly Detection, Textual Anomaly Detection, to name afew. Our problem particularly relates to the general anoma-lous trajectory detection problem, where the goal is to findout the outlier trajectories that significantly differ from thenormal trajectories in the underlying data. For an overviewof solution strategies for the anomalous trajectory detectionproblem, reader is referred to [7].
Detecting anomalous vessel tracks in the maritime domainhas unique challenges as discussed in Section I-B and hasbeen studied mostly in the context of homeland securityand maritime surveillance. In this paper, we confine ourliterature review to vessel anomaly detection approaches inthe maritime domain. Anomaly detection approaches in themaritime domain can be categorized into three classes: datadriven, knowledge driven, and hybrid approaches. Mainly,data generated from AIS sensors installed in vessels has beenused in these anomaly detection techniques.
Knowledge driven techniques construct rules based onmaritime experts’ knowledge regarding suspicious behaviourof vessels at sea [8], [9]. Whenever a new vessel violatesany pre-defined rules stored in a database, the system alertsthe operator about that vessel. A drawback of this techniqueis that the detection process is fully dependent on staticrules. Over the course of time, it will become necessaryto incorporate new rules and update old ones, but makingsure that the resulting rules are consistent is non-trivial.Moreover, this approach does not take into account thecontextual information at the vessels’ specific location andtime.
Data driven methods build normal patterns from historicalvessel track data and if any vessel deviates from normalpatterns, the system alerts the operator that a vessel is apotential anomaly [10], [11]. Many instances of suspiciousbehaviour may not be detected using only data drivenmethods. Inclusion of expert knowledge would be beneficial
for detecting the vast majority of anomalies which are notdetected using only data driven approaches [12].
Hybrid approaches are the combination of both knowledgedriven and data driven methods. A normal model of vesselbehaviour from AIS data using Self Organizing Map andGaussian mixture model was built, and expert knowledgewas incorporated through IF-THEN rules in [13]. Anydeviation from constructed rules and the normal model issignaled as an anomaly.
Unlike static information or rules which is determined inadvanced (see [14]), the contextual information we considerrefers to real-time information from external sources that arespecific to the time and location of vessels, such as sea andweather conditions experienced by the vessel under anomalydetection, which is not previously stored in a data storageused by the system. Reducing false alarms using on-demandcontextual information while not missing true anomalies isan important and challenging task. To our knowledge, thereis very little work in this direction.
IV. FRAMEWORK OVERVIEW
Data Preprocessor
Anomaly Detector
AIS Data Stream
Contextual Data
Normal Movement Patterns
Normal Pattern
Extractor
Vessel Tracks
Maritime Data Warehouse
Contextual Information
Graphical User Interface
Websites, Blogs, etc.
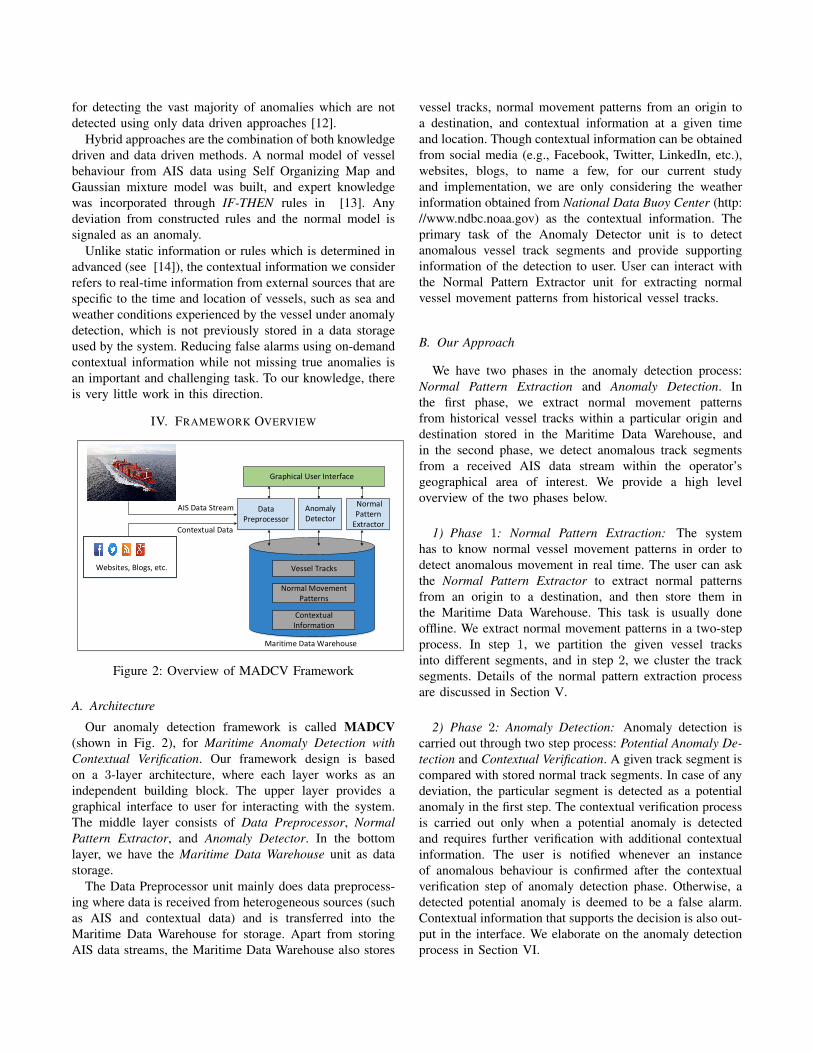
Figure 2: Overview of MADCV Framework
A. Architecture
Our anomaly detection framework is called MADCV(shown in Fig. 2), for Maritime Anomaly Detection withContextual Verification. Our framework design is basedon a 3-layer architecture, where each layer works as anindependent building block. The upper layer provides agraphical interface to user for interacting with the system.The middle layer consists of Data Preprocessor, NormalPattern Extractor, and Anomaly Detector. In the bottomlayer, we have the Maritime Data Warehouse unit as datastorage.
The Data Preprocessor unit mainly does data preprocess-ing where data is received from heterogeneous sources (suchas AIS and contextual data) and is transferred into theMaritime Data Warehouse for storage. Apart from storingAIS data streams, the Maritime Data Warehouse also stores
vessel tracks, normal movement patterns from an origin toa destination, and contextual information at a given timeand location. Though contextual information can be obtainedfrom social media (e.g., Facebook, Twitter, LinkedIn, etc.),websites, blogs, to name a few, for our current studyand implementation, we are only considering the weatherinformation obtained from National Data Buoy Center (http://www.ndbc.noaa.gov) as the contextual information. Theprimary task of the Anomaly Detector unit is to detectanomalous vessel track segments and provide supportinginformation of the detection to user. User can interact withthe Normal Pattern Extractor unit for extracting normalvessel movement patterns from historical vessel tracks.
B. Our Approach
We have two phases in the anomaly detection process:Normal Pattern Extraction and Anomaly Detection. Inthe first phase, we extract normal movement patternsfrom historical vessel tracks within a particular origin anddestination stored in the Maritime Data Warehouse, andin the second phase, we detect anomalous track segmentsfrom a received AIS data stream within the operator’sgeographical area of interest. We provide a high leveloverview of the two phases below.
1) Phase 1: Normal Pattern Extraction: The systemhas to know normal vessel movement patterns in order todetect anomalous movement in real time. The user can askthe Normal Pattern Extractor to extract normal patternsfrom an origin to a destination, and then store them inthe Maritime Data Warehouse. This task is usually doneoffline. We extract normal movement patterns in a two-stepprocess. In step 1, we partition the given vessel tracksinto different segments, and in step 2, we cluster the tracksegments. Details of the normal pattern extraction processare discussed in Section V.
2) Phase 2: Anomaly Detection: Anomaly detection iscarried out through two step process: Potential Anomaly De-tection and Contextual Verification. A given track segment iscompared with stored normal track segments. In case of anydeviation, the particular segment is detected as a potentialanomaly in the first step. The contextual verification processis carried out only when a potential anomaly is detectedand requires further verification with additional contextualinformation. The user is notified whenever an instanceof anomalous behaviour is confirmed after the contextualverification step of anomaly detection phase. Otherwise, adetected potential anomaly is deemed to be a false alarm.Contextual information that supports the decision is also out-put in the interface. We elaborate on the anomaly detectionprocess in Section VI.
V. NORMAL PATTERN EXTRACTOR
Input: A set of historical vessel tracks T = {T1, . . . , Tn}between an origin and destination, where each Ti denotes avessel track.Output: The normal movement patterns for T to be storedin the Maritime Data Warehouse.
Normal movement patterns are extracted by clustering thetracks in T. However, clustering the tracks in full length iscomputationally difficult and challenging (see Section I-B).In fact, full length clustering is undesirable in terms ofdetecting anomalous movement. Typically an instance ofanomalous movement is confined to a small portion of atrack and a large portion of the voyage is similar to othernormal tracks. In this case, full length clustering may tend totreat an anomalous track as a normal track. A better approachis to partition each vessel track into shorter segments, i.e.a subset of consecutive Vessel Position Reports, and extractnormal patterns and detect anomalous movement within theshorter segments.
We describe the partitioning of T into segments in SectionV-A which is followed by the illustration of the proposedclustering algorithm TSC: Track Segment Clustering in Sec-tion V-B. Algorithm TSC: Track Segment Clustering is usedto extract normal patterns within each segment of T.
T1
T2
T3
2 3 4 5 6 7 81 9i:
Origin Destination
Longitude,Latitude,SOG,COG ti
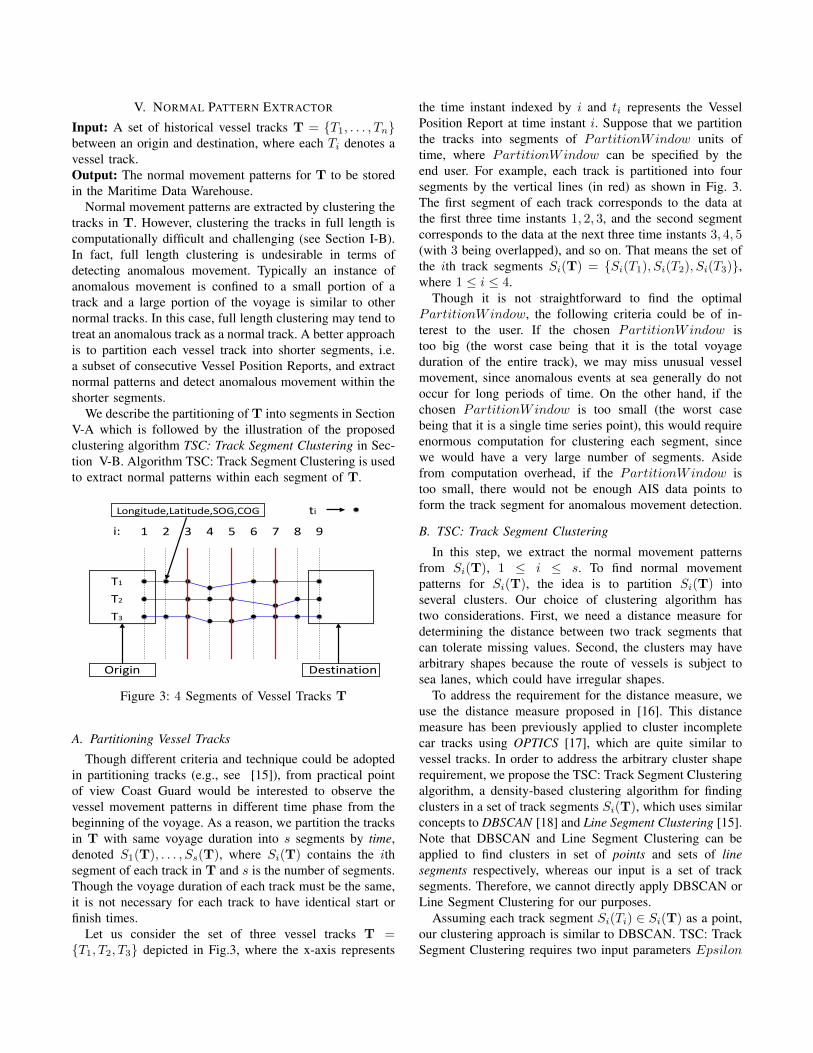
Figure 3: 4 Segments of Vessel Tracks T
A. Partitioning Vessel Tracks
Though different criteria and technique could be adoptedin partitioning tracks (e.g., see [15]), from practical pointof view Coast Guard would be interested to observe thevessel movement patterns in different time phase from thebeginning of the voyage. As a reason, we partition the tracksin T with same voyage duration into s segments by time,denoted S1(T), . . . , Ss(T), where Si(T) contains the ithsegment of each track in T and s is the number of segments.Though the voyage duration of each track must be the same,it is not necessary for each track to have identical start orfinish times.
Let us consider the set of three vessel tracks T ={T1, T2, T3} depicted in Fig.3, where the x-axis represents
the time instant indexed by i and ti represents the VesselPosition Report at time instant i. Suppose that we partitionthe tracks into segments of PartitionWindow units oftime, where PartitionWindow can be specified by theend user. For example, each track is partitioned into foursegments by the vertical lines (in red) as shown in Fig. 3.The first segment of each track corresponds to the data atthe first three time instants 1, 2, 3, and the second segmentcorresponds to the data at the next three time instants 3, 4, 5(with 3 being overlapped), and so on. That means the set ofthe ith track segments Si(T) = {Si(T1), Si(T2), Si(T3)},where 1 ≤ i ≤ 4.
Though it is not straightforward to find the optimalPartitionWindow, the following criteria could be of in-terest to the user. If the chosen PartitionWindow istoo big (the worst case being that it is the total voyageduration of the entire track), we may miss unusual vesselmovement, since anomalous events at sea generally do notoccur for long periods of time. On the other hand, if thechosen PartitionWindow is too small (the worst casebeing that it is a single time series point), this would requireenormous computation for clustering each segment, sincewe would have a very large number of segments. Asidefrom computation overhead, if the PartitionWindow istoo small, there would not be enough AIS data points toform the track segment for anomalous movement detection.
B. TSC: Track Segment Clustering
In this step, we extract the normal movement patternsfrom Si(T), 1 ≤ i ≤ s. To find normal movementpatterns for Si(T), the idea is to partition Si(T) intoseveral clusters. Our choice of clustering algorithm hastwo considerations. First, we need a distance measure fordetermining the distance between two track segments thatcan tolerate missing values. Second, the clusters may havearbitrary shapes because the route of vessels is subject tosea lanes, which could have irregular shapes.
To address the requirement for the distance measure, weuse the distance measure proposed in [16]. This distancemeasure has been previously applied to cluster incompletecar tracks using OPTICS [17], which are quite similar tovessel tracks. In order to address the arbitrary cluster shaperequirement, we propose the TSC: Track Segment Clusteringalgorithm, a density-based clustering algorithm for findingclusters in a set of track segments Si(T), which uses similarconcepts to DBSCAN [18] and Line Segment Clustering [15].Note that DBSCAN and Line Segment Clustering can beapplied to find clusters in set of points and sets of linesegments respectively, whereas our input is a set of tracksegments. Therefore, we cannot directly apply DBSCAN orLine Segment Clustering for our purposes.
Assuming each track segment Si(Ti) ∈ Si(T) as a point,our clustering approach is similar to DBSCAN. TSC: TrackSegment Clustering requires two input parameters Epsilon
and MinTrs. Note that we renamed the input parameters ofDBSCAN (i.e. Eps and MinPts) to Epsilon and MinTrsrespectively. Epsilon is the radius of the neighborhoodregion of a track segment and MinTrs is the minimumthreshold for number of track segments within the Epsilonneighborhood region of a track segment. Unlike a circularneighborhood region of a point in DBSCAN, the shape ofthe neighborhood region for a track segment is a polygon.The user can set the value of MinTrs, which is dependenton an experimental data set. However, the value of Epsiloncan be obtained following the approach to finding the valueof Eps in DBSCAN. At the end of the clustering process,the normal vessel tracks of each segment Si(T) with thecorresponding Epsilon of that segment are stored in theMaritime Data Warehouse.
VI. ANOMALY DETECTOR
Input: A segment of vessel track Tq i.e. Si(Tq) withinoperator’s geographical area of interest.Output: A decision whether Si(Tq) is an anomaly withrespect to the known normal movement patterns within thatparticular geographical area of interest.
Assuming we have the full track Tq within the geograph-ical area of interest, first, we describe two main steps inthe anomaly detection process: Potential Anomaly Detectionand Contextual Verification in Subsections VI-A and VI-B,respectively, for detecting anomalous track segments of Tq .After that, we discuss how this detection process can beadapted in real time when the input is an individual tracksegment, i.e. Si(Tq), instead of a full track Tq .
A. Potential Anomaly Detection
We assume that Normal Pattern Extraction in SectionV has been applied to extract the normal patterns forSi(T) within the geographical area of interest, where eachnormal pattern for Si(T) is represented by a cluster Cl. For1 ≤ i ≤ s, we check if Si(Tq) belongs to some cluster Cl
of Si(T), that is, if Si(Tq) is within the Epsilon distancefrom any track in the cluster. Note that Cl is called thereference cluster for Si(Tq). The distance measure is thesame one that is used by the clustering algorithm in SectionV-B. If Si(Tq) does not belong to any cluster Cl of Si(T),then it is considered a potential anomaly. The AnomalyDetector collects all potential anomalies Si(Tq), 1 ≤ i ≤ sfor contextual verification purposes, which is carried outimmediately after this Potential Anomaly Detection step ifany potential anomalies are detected.
B. Contextual Verification
Input: Potential anomaly Si(Tq).Output: For every potential anomaly Si(Tq), a decisionwhether Si(Tq) is an anomaly and the contextual informa-tion that supports the decision.
The main objective of contextual verification is to verifywhether a potential anomaly Si(Tq) detected by the methodin Section VI-A is an anomaly using contextual featuresCFi, where CFi represents features of contextual infor-mation at the ith segment of Tq . In principle, contextualinformation refers to any factor that could potentially impactthe normal movement of a vessel. Most such info comesfrom external sources such as weather, oil prices, etc. Inthe current implementation CFi contains WindDirection,WindSpeed, GustSpeed, and WaveHeight, but this canbe extended to include any known factors that might con-tribute to anomalous vessel movement. WindDirection,WindSpeed, GustSpeed and WaveHeight represent thewind direction, wind speed, gust speed and wave height atthe location and time in which the instance of anomalousvessel behaviour was detected.
Essentially, CFi is used to explain the anomalous be-haviour of the vessel track segment Si(Tq). To this end, amatch function f(CFi, Si(Tq)) can be specified to measurethe match degree between CFi and Si(Tq), such that abetter match represents a better explanation of the anomalousbehaviour of the vessel by the factors captured in CFi.The choice of CFi and f is application dependent, becausethey reflect domain knowledge about possible factors foranomalous vessel behaviour.
In our current experiment we followed rule-based strategyfor specifying the match function f that is illustrated inthe following example. Suppose that the potential anomalySi(Tq) is sailing on less than usual average speed (SOG),and if WindDirection is opposite to the movement di-rection (COG) of the vessel during the movement andWindSpeed exceeds a specified range (provided by expertsor obtained from external sources), the deviation due tospeed is likely caused by the wind. Otherwise, the anomalousdeviation remains unexplained, and therefore, would betagged as an anomaly. In both cases, the operator is informedof the result.
Unlike the knowledge driven approach discussed in Sec-tion III, the values for CFi are dependent on the time andlocation of the query track segment Si(Tq) and have to beobtained from external sources as an on-demand query. SuchCFi cannot be stored as static rules as in the knowledgedriven approach because queries are not known in advance.
Flexibility of this method can be addressed through theaddition of new domain specific contextual features (seeSection VII-C), where we just need to add or update therules for explaining the match between CFi and Si(Tq). Forexample, if oil price becomes a new contextual informationfor anomalous movement, a new handle will be created forextracting such information from relevant sources and amatch function f will be provided by this feature.
Real-Time Detection: In real time, we do not have theentire vessel track Tq in advance, but one segment Si(Tq)
of Tq at a time, as the vessel is moving, where the segmentis determined by the chosen PartitionWindow. We collectone segment of Tq at a time as it becomes available. Infact, our detection methods in Sections VI-A and VI-B areapplied to a single segment, thus do not require the entiretrack Tq to be available.
VII. EMPIRICAL STUDIES
At first, we describe our experimental data set in Sec-tion VII-A. Then we quantitatively evaluate our proposedframework in Section VII-B followed by a discussion ofother contextual information for possible inclusion in theMaritime Data Warehouse in Section VII-C. After that wedescribe the implementation of the developed prototype inSection VII-D. We conclude our empirical studies with adiscussion in Section VII-E.
A. Data Set Description
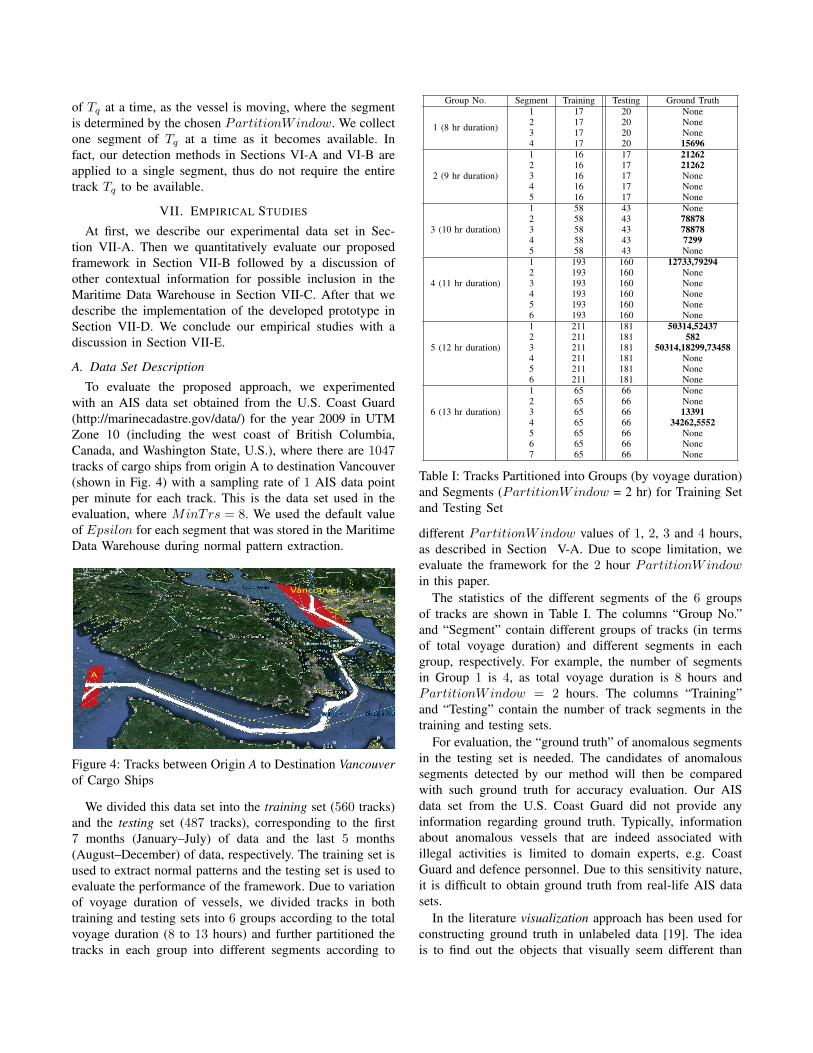
To evaluate the proposed approach, we experimentedwith an AIS data set obtained from the U.S. Coast Guard(http://marinecadastre.gov/data/) for the year 2009 in UTMZone 10 (including the west coast of British Columbia,Canada, and Washington State, U.S.), where there are 1047tracks of cargo ships from origin A to destination Vancouver(shown in Fig. 4) with a sampling rate of 1 AIS data pointper minute for each track. This is the data set used in theevaluation, where MinTrs = 8. We used the default valueof Epsilon for each segment that was stored in the MaritimeData Warehouse during normal pattern extraction.
A
Vancouver
Figure 4: Tracks between Origin A to Destination Vancouverof Cargo Ships
We divided this data set into the training set (560 tracks)and the testing set (487 tracks), corresponding to the first7 months (January–July) of data and the last 5 months(August–December) of data, respectively. The training set isused to extract normal patterns and the testing set is used toevaluate the performance of the framework. Due to variationof voyage duration of vessels, we divided tracks in bothtraining and testing sets into 6 groups according to the totalvoyage duration (8 to 13 hours) and further partitioned thetracks in each group into different segments according to
Group No. Segment Training Testing Ground Truth
1 (8 hr duration)
1 17 20 None2 17 20 None3 17 20 None4 17 20 15696
2 (9 hr duration)
1 16 17 212622 16 17 212623 16 17 None4 16 17 None5 16 17 None
3 (10 hr duration)
1 58 43 None2 58 43 788783 58 43 788784 58 43 72995 58 43 None
4 (11 hr duration)
1 193 160 12733,792942 193 160 None3 193 160 None4 193 160 None5 193 160 None6 193 160 None
5 (12 hr duration)
1 211 181 50314,524372 211 181 5823 211 181 50314,18299,734584 211 181 None5 211 181 None6 211 181 None
6 (13 hr duration)
1 65 66 None2 65 66 None3 65 66 133914 65 66 34262,55525 65 66 None6 65 66 None7 65 66 None
Table I: Tracks Partitioned into Groups (by voyage duration)and Segments (PartitionWindow = 2 hr) for Training Setand Testing Set
different PartitionWindow values of 1, 2, 3 and 4 hours,as described in Section V-A. Due to scope limitation, weevaluate the framework for the 2 hour PartitionWindowin this paper.
The statistics of the different segments of the 6 groupsof tracks are shown in Table I. The columns “Group No.”and “Segment” contain different groups of tracks (in termsof total voyage duration) and different segments in eachgroup, respectively. For example, the number of segmentsin Group 1 is 4, as total voyage duration is 8 hours andPartitionWindow = 2 hours. The columns “Training”and “Testing” contain the number of track segments in thetraining and testing sets.
For evaluation, the “ground truth” of anomalous segmentsin the testing set is needed. The candidates of anomaloussegments detected by our method will then be comparedwith such ground truth for accuracy evaluation. Our AISdata set from the U.S. Coast Guard did not provide anyinformation regarding ground truth. Typically, informationabout anomalous vessels that are indeed associated withillegal activities is limited to domain experts, e.g. CoastGuard and defence personnel. Due to this sensitivity nature,it is difficult to obtain ground truth from real-life AIS datasets.
In the literature visualization approach has been used forconstructing ground truth in unlabeled data [19]. The ideais to find out the objects that visually seem different than
rest of the objects. The following two steps for constructingground truth has been verified by our industrial partner MDA(http://www.mdacorporation.com).
• At first, we visualized the track segments using GoogleEarth and flagged those track segments as “PotentialGround Truth” which visually seemed to exhibit un-usual movement.
• Then we factor in contextual information (e.g., windspeed, wave height, etc.) at the location and time foreach potential ground truth. If contextual features arewithin specified range (provided by experts), we markthe particular potential ground truth as “Ground Truth”.This is how we obtained the numbers in the “GroundTruth” column of Table I representing the VoyageIDs oftrue anomalies in a segment of the testing set. “None”means that particular segment did not contain any trueanomalies.
B. EvaluationWe quantitatively evaluate MADCV for the 487 testing
tracks based on the number of False Alarm Reduction, FMeasure and Execution Time for anomaly detection. Weconclude the evaluation of MADCV with a case study onanomaly detection within the fourth segment of Group 6 ofthe testing set in Section VII-B4.
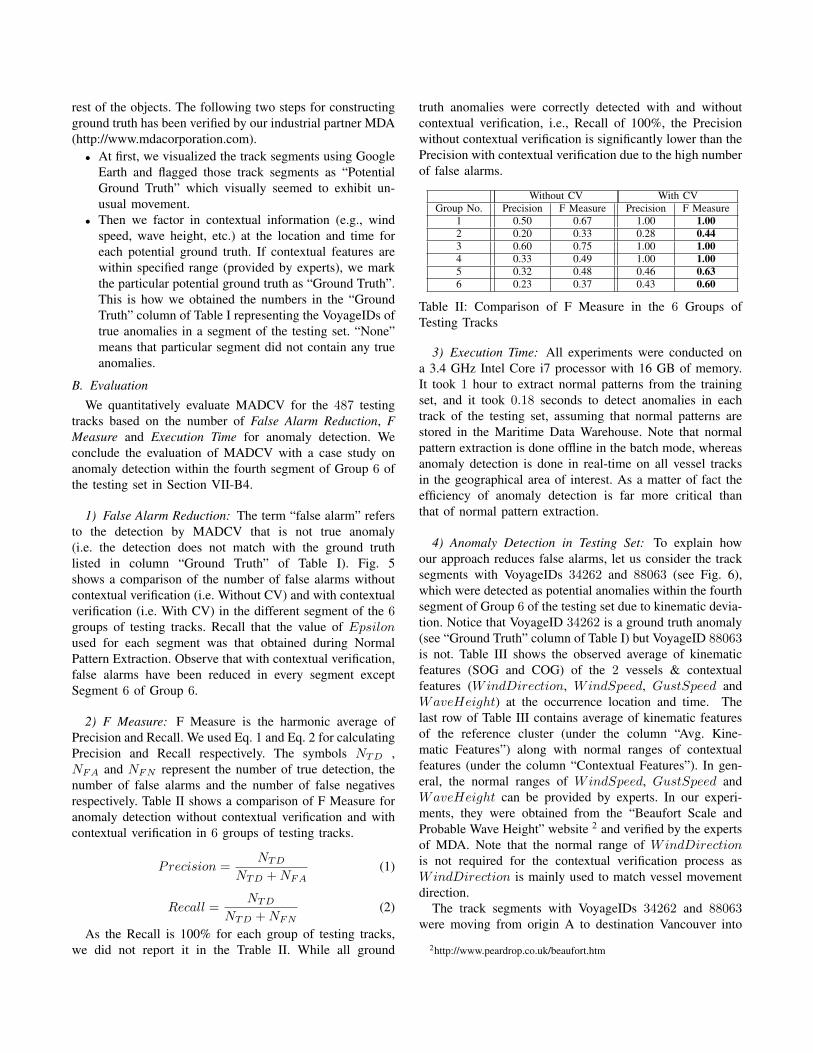
1) False Alarm Reduction: The term “false alarm” refersto the detection by MADCV that is not true anomaly(i.e. the detection does not match with the ground truthlisted in column “Ground Truth” of Table I). Fig. 5shows a comparison of the number of false alarms withoutcontextual verification (i.e. Without CV) and with contextualverification (i.e. With CV) in the different segment of the 6groups of testing tracks. Recall that the value of Epsilonused for each segment was that obtained during NormalPattern Extraction. Observe that with contextual verification,false alarms have been reduced in every segment exceptSegment 6 of Group 6.
2) F Measure: F Measure is the harmonic average ofPrecision and Recall. We used Eq. 1 and Eq. 2 for calculatingPrecision and Recall respectively. The symbols NTD ,NFA and NFN represent the number of true detection, thenumber of false alarms and the number of false negativesrespectively. Table II shows a comparison of F Measure foranomaly detection without contextual verification and withcontextual verification in 6 groups of testing tracks.
Precision =NTD
NTD +NFA(1)
Recall =NTD
NTD +NFN(2)
As the Recall is 100% for each group of testing tracks,we did not report it in the Trable II. While all ground
truth anomalies were correctly detected with and withoutcontextual verification, i.e., Recall of 100%, the Precisionwithout contextual verification is significantly lower than thePrecision with contextual verification due to the high numberof false alarms.
Without CV With CVGroup No. Precision F Measure Precision F Measure
1 0.50 0.67 1.00 1.002 0.20 0.33 0.28 0.443 0.60 0.75 1.00 1.004 0.33 0.49 1.00 1.005 0.32 0.48 0.46 0.636 0.23 0.37 0.43 0.60
Table II: Comparison of F Measure in the 6 Groups ofTesting Tracks
3) Execution Time: All experiments were conducted ona 3.4 GHz Intel Core i7 processor with 16 GB of memory.It took 1 hour to extract normal patterns from the trainingset, and it took 0.18 seconds to detect anomalies in eachtrack of the testing set, assuming that normal patterns arestored in the Maritime Data Warehouse. Note that normalpattern extraction is done offline in the batch mode, whereasanomaly detection is done in real-time on all vessel tracksin the geographical area of interest. As a matter of fact theefficiency of anomaly detection is far more critical thanthat of normal pattern extraction.
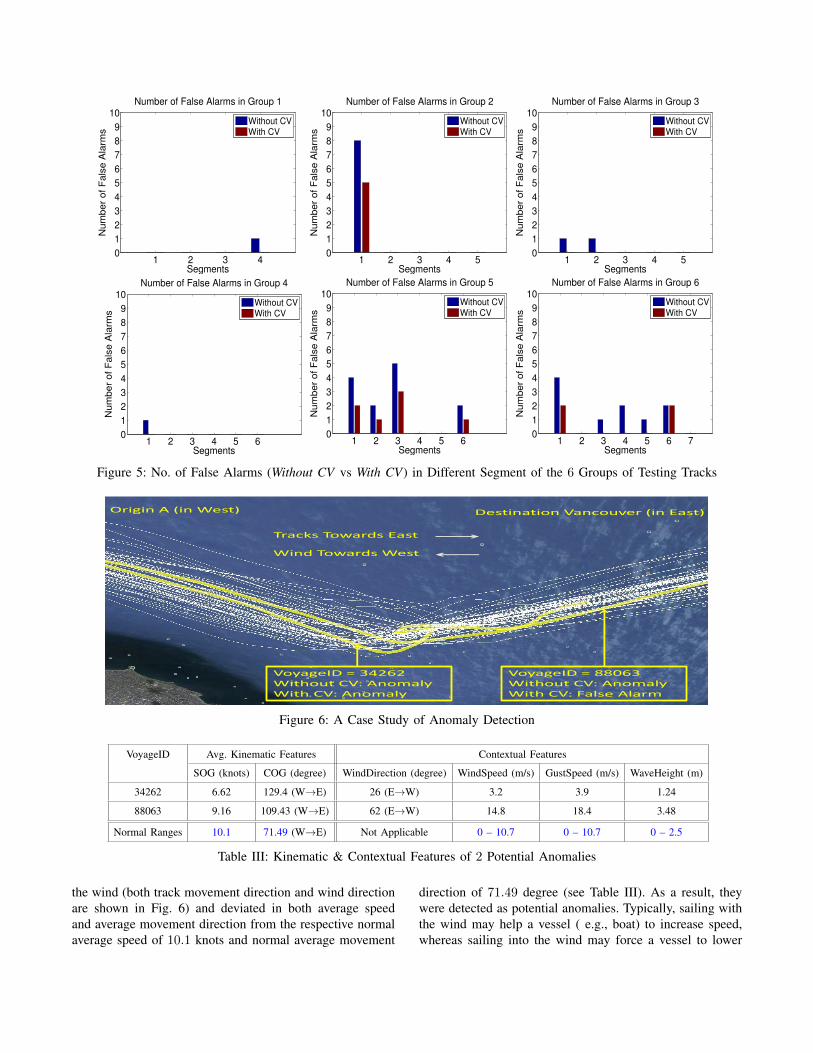
4) Anomaly Detection in Testing Set: To explain howour approach reduces false alarms, let us consider the tracksegments with VoyageIDs 34262 and 88063 (see Fig. 6),which were detected as potential anomalies within the fourthsegment of Group 6 of the testing set due to kinematic devia-tion. Notice that VoyageID 34262 is a ground truth anomaly(see “Ground Truth” column of Table I) but VoyageID 88063is not. Table III shows the observed average of kinematicfeatures (SOG and COG) of the 2 vessels & contextualfeatures (WindDirection, WindSpeed, GustSpeed andWaveHeight) at the occurrence location and time. Thelast row of Table III contains average of kinematic featuresof the reference cluster (under the column “Avg. Kine-matic Features”) along with normal ranges of contextualfeatures (under the column “Contextual Features”). In gen-eral, the normal ranges of WindSpeed, GustSpeed andWaveHeight can be provided by experts. In our experi-ments, they were obtained from the “Beaufort Scale andProbable Wave Height” website 2 and verified by the expertsof MDA. Note that the normal range of WindDirectionis not required for the contextual verification process asWindDirection is mainly used to match vessel movementdirection.
The track segments with VoyageIDs 34262 and 88063were moving from origin A to destination Vancouver into
2http://www.peardrop.co.uk/beaufort.htm
1 2 3 40
1
2
3
4
5
6
7
8
9
10N
um
be
r o
f F
als
e A
larm
s
Segments
Number of False Alarms in Group 1
Without CVWith CV
1 2 3 4 50
1
2
3
4
5
6
7
8
9
10
Nu
mb
er
of
Fa
lse
Ala
rms
Segments
Number of False Alarms in Group 2
Without CVWith CV
1 2 3 4 50
1
2
3
4
5
6
7
8
9
10
Nu
mb
er
of
Fa
lse
Ala
rms
Segments
Number of False Alarms in Group 3
Without CVWith CV
1 2 3 4 5 60
1
2
3
4
5
6
7
8
9
10
Nu
mb
er
of
Fa
lse
Ala
rms
Segments
Number of False Alarms in Group 4
Without CVWith CV
1 2 3 4 5 60
1
2
3
4
5
6
7
8
9
10
Nu
mb
er
of
Fa
lse
Ala
rms
Segments
Number of False Alarms in Group 5
Without CVWith CV
1 2 3 4 5 6 70
1
2
3
4
5
6
7
8
9
10
Nu
mb
er
of
Fa
lse
Ala
rms
Segments
Number of False Alarms in Group 6
Without CVWith CV
Figure 5: No. of False Alarms (Without CV vs With CV) in Different Segment of the 6 Groups of Testing Tracks
VoyageID = 34262 Without CV: Anomaly With CV: Anomaly
VoyageID = 88063 Without CV: Anomaly With CV: False Alarm
Tracks Towards East
Wind Towards West
Origin A (in West) Destination Vancouver (in East)
Figure 6: A Case Study of Anomaly Detection
VoyageID Avg. Kinematic Features Contextual Features
SOG (knots) COG (degree) WindDirection (degree) WindSpeed (m/s) GustSpeed (m/s) WaveHeight (m)
34262 6.62 129.4 (W→E) 26 (E→W) 3.2 3.9 1.24
88063 9.16 109.43 (W→E) 62 (E→W) 14.8 18.4 3.48
Normal Ranges 10.1 71.49 (W→E) Not Applicable 0 – 10.7 0 – 10.7 0 – 2.5
Table III: Kinematic & Contextual Features of 2 Potential Anomalies
the wind (both track movement direction and wind directionare shown in Fig. 6) and deviated in both average speedand average movement direction from the respective normalaverage speed of 10.1 knots and normal average movement
direction of 71.49 degree (see Table III). As a result, theywere detected as potential anomalies. Typically, sailing withthe wind may help a vessel ( e.g., boat) to increase speed,whereas sailing into the wind may force a vessel to lower
speed. More detailed information can be obtained from thissite3.
However, with contextual verification, VoyageID 88063is discarded as an anomaly because the vessel was movinginto the wind, where observed WindSpeed (14.8 m/s),GustSpeed (18.4 m/s) and WaveHeight (3.48 m) wereabove the normal range of WindSpeed (0 – 10.7 m/s),GustSpeed (0 – 10.7 m/s) and WaveHeight (0 – 2.5 m) atthe relevant region and time, which caused the vessel to sailat less than usual average speed and deviate from the usualmovement direction. On the other hand, VoyageID 34262remains an anomaly after contextual verification because itssignificant deviation in average SOG (6.62 knots) and COG(129.4 degree) from normal averages cannot be explainedby the normal wind and sea conditions at the relevant timeand location.
C. Other Contextual Information
So far, we have mainly used weather information (winddirection, wind speed, gust speed and wave height) ascontextual information to improve the precision of anomalydetection through the reduction of false alarms. The preci-sion can be further improved by including other contextualinformation such as crew information, oil price, and seaportdata. This only requires extending the contextual featuresCFi for segment i and modifying the match function fbetween CFi and the segment i of a query track; the restof the approach remains unchanged. Thus, our approach ishighly adaptive to new background knowledge.
Though we consider contextual information in a structuredform, contextual information can be unstructured such astext. For example, consider the tweet by @IHS4Maritimeon 27th March, 2015: “Nigeria closes borders for electionperiod: Nigeria’s sea and land borders are currently closedas the country...”, where the key information is “sea border isclosed in Nigeria”. If any vessel does not arrive at the seaportin Nigeria within the scheduled time, the system shouldnot flag this vessel as an anomaly because the sea borderis closed. Note that structured queries can be performedto extract structured information from unstructured texts,e.g. tweets as mentioned in [20], and can be stored intoany relational database i.e. the Maritime Data Warehousefor contextual verification. While it is highly interesting toconsider unstructured contextual information, that topic isbeyond the scope of this paper.
D. Prototype Development
As a proof of concept we have built a prototype ofthe proposed framework for solving the vessel anomalydetection problem discussed in this paper. The potential endusers of a fully developed system could be Coast Guards,Defence Department, and other private and public sector
3http://newt.phys.unsw.edu.au/∼jw/sailing.html
organizations related to the safety and security of a country.We have implemented major components of different layersof the framework using C# programming language. Bottomlayer of the framework i.e. Maritime Data Warehouse hasbeen developed using Microsoft SQL Server 2014. In orderto provide visualization support to user through GoogleEarth, we have written scripts in Matlab utilizing theGoogle Earth toolbox for Matlab4.
E. Discussion
We provide a discussion on following two issues.• How will the variation in the segment size (i.e. dif-
ferent choice of PartitionWindow setting) affect theperformance of the framework?
• Can our framework detect anomalies from irregularlysampled AIS data?
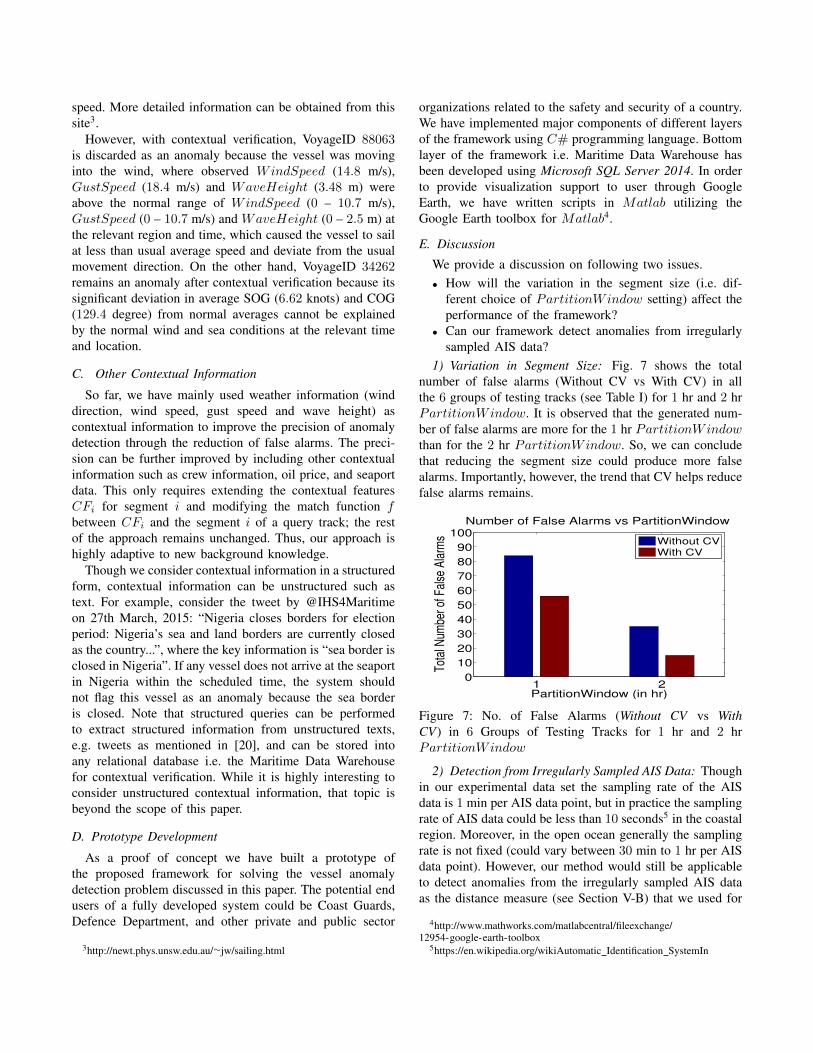
1) Variation in Segment Size: Fig. 7 shows the totalnumber of false alarms (Without CV vs With CV) in allthe 6 groups of testing tracks (see Table I) for 1 hr and 2 hrPartitionWindow. It is observed that the generated num-ber of false alarms are more for the 1 hr PartitionWindowthan for the 2 hr PartitionWindow. So, we can concludethat reducing the segment size could produce more falsealarms. Importantly, however, the trend that CV helps reducefalse alarms remains.
1 20
10
20
30
40
50
60
70
80
90
100
Tota
l Num
ber o
f Fal
se A
larm
s
PartitionWindow (in hr)
Number of False Alarms vs PartitionWindow
Without CVWith CV
Figure 7: No. of False Alarms (Without CV vs WithCV) in 6 Groups of Testing Tracks for 1 hr and 2 hrPartitionWindow
2) Detection from Irregularly Sampled AIS Data: Thoughin our experimental data set the sampling rate of the AISdata is 1 min per AIS data point, but in practice the samplingrate of AIS data could be less than 10 seconds5 in the coastalregion. Moreover, in the open ocean generally the samplingrate is not fixed (could vary between 30 min to 1 hr per AISdata point). However, our method would still be applicableto detect anomalies from the irregularly sampled AIS dataas the distance measure (see Section V-B) that we used for
4http://www.mathworks.com/matlabcentral/fileexchange/12954-google-earth-toolbox
5https://en.wikipedia.org/wikiAutomatic Identification SystemIn
the normal pattern extraction and anomaly detection purposecan handle the irregular sampling rate of AIS data. Note thatif the rate of missing point is too much in a trajectory thenthe detection performance may degrade.
VIII. CONCLUSION
A major challenge in automated anomalous vessel de-tection in the maritime domain is the high rate of falsealarms (due to the use of mainly kinematic information).Existing knowledge driven approaches may address thisproblem by incorporating domain knowledge in the formof pre-defined rules. Since rules are largely static, they cannot capture the scenarios of individual vessels, such as theweather and sea conditions at the time and location of apotential anomaly. In this paper, we proposed contextualverification that incorporates contextual information to filterfalse alarms. “Contextual information” refers to any factorsthat potentially impact a vessel’s behaviour (e.g., weatherand sea conditions) and is specific to the location and timeof a vessel. Empirical studies using an AIS data set obtainedfrom the U.S. Coast Guard suggest the potential of thisapproach in reducing false alarms as an important task inbig data application. This approach can easily adapt to newcontextual information.
The basic strategy of “contextual verification” is appli-cable to any domain for reducing false alarms. The keyrequirement here is the particular domain knowledge thatcan help in identifying contextual features i.e. certain factorsat the time of data collection that might affect the featuresof an anomalous instance. As long as such contextualfeatures can be captured and a match function betweencontextual features and features of an anomalous instancecan be defined, our proposed approach can be applied toany domain of interest.
ACKNOWLEDGMENT
We would like to thank Canada’s Natural Sciences andEngineering Research Council (NSERC) and our industrialpartner MDA Corporation for providing generous fundingunder the Collaborative Research and Development Grantsfor the project “Anomaly Detection in Spatiotemporal Datain Maritime Security”.
REFERENCES
[1] S. H. G. Cimino, G. Ancieri and K. Bryan, “Sensor datamanagement to achieve information superiority in maritimesituational awareness,” CMRE Scientific Reports, CMRE-FR-2014-017, NATO Science and Technology Organization,Tech. Rep., 2014.
[2] Department of Homeland Security, “National strategy formaritime security: National plan to achieve maritime domainawareness,” U.S. Government, Tech. Rep., 2005.
[3] E. Martineau and J. Roy, “Maritime anomaly detection: Do-main introduction and review of selected literature,” DefenceR&D CanadaValcartier, Tech. Rep., 2011.
[4] M. Riveiro, Visual analytics for maritime anomaly detection.Orebro University, 2011, ch. 6, pp. 118–121.
[5] O. Kessler, “Maritime anomaly detection,” in Workshop onDetection of Anomalous Behaviors in Maritime Environments,Carnegie Mellon University, June 2009.
[6] V. Chandola, A. Banerjee, and V. Kumar, “Anomaly detection:A survey,” ACM Computing Surveys (CSUR), vol. 41, no. 3,July 2009.
[7] C. C. Aggarwal, Data Mining: The Textbook. SpringerPublishing Company, 2015, ch. 16, pp. 551–552.
[8] T. Z. Maria Nilsson, Joeri van Laere and J. Edlund, “Extract-ing rules from expert operators to support situation awarenessin maritime surveillance,” in Information Fusion. IEEE,2008, pp. 1–8.
[9] J. Roy, “Rule-based expert system for maritime anomalydetection,” in SPIE, May 2010.
[10] A. Dahlbom and L. Niklasson, “Trajectory clustering forcoastal surveillance,” in Information Fusion, 2007.
[11] R. Laxhammar, “Anomaly detection for sea surveillance,” inInformation Fusion, 2008.
[12] M. Riveiro and G. Falkman, “Supporting the analytical rea-soning process in maritime anomaly detection: Evaluation andexperimental design,” in Information Visualisation, 2010.
[13] M. Riveiro and G. Falkman, “Interactive visualization of nor-mal behavioral models and expert rules for maritime anomalydetection,” in Computer Graphics, Imaging and Visualization.IEEE, 2009.
[14] H. Y. Shahir, U. Glasser, N. Nalbandyan, and H. Wehn,“Maritime situation analysis: A multi-vessel interaction andanomaly detection framework,” in IEEE Joint Intelligence andSecurity Informatics Conference (JISIC), 2014, pp. 192–199.
[15] J. H. Jae-Gil Lee and K.-Y. Whang, “Trajectory clustering: Apartition-and-group framework,” in SIGMOD. ACM, June2007.
[16] G. Andrienko, N. Andrienko, P. Bak, D. Keim, and S. Wrobel,Visual analytics of movement. Springer Publishing Company,2013, ch. , pp. 147–149.
[17] H.-P. K. Mihael Ankerst, Markus M. Breunig and J. Sander,“Optics: Ordering points to identify the clustering structure,”in SIGMOD International Conference on Management ofData. ACM, 1999, pp. 49–60.
[18] J. S. Martin Ester, Hans-Peter Kriegel and X. Xu, “A density-based algorithm for discovering clusters in large spatialdatabases with noise,” in International Conference on Knowl-edge Discovery and Data Mining. ACM, 1996.
[19] F. de Morsier, D. Tuia, M. Borgeaud, V. Gass, and J.-P.Thiran, “Semi-supervised novelty detection using svm entiresolution path,” IEEE Transactions on Geoscience and RemoteSensing, vol. 51, no. 4, 2013.
[20] E. Chu, A. Baid, T. Chen, A. Doan, and J. Naughton, “Arelational approach to incrementally extracting and queryingstructure in unstructured data,” in VLDB, 2007.


![REGULAR PAPER - link.springer.comnumber of false positives and show that this improves the post-retrieval verification for many queries. In [7], the authors combine three types of](https://img.pdfslide.us/doc/110x75/5f48aa1b183a2456fe6f0bf4/regular-paper-link-number-of-false-positives-and-show-that-this-improves-the.jpg)