Embed Size (px)
Citation preview

CONTENTS
CHAPTER 1 PAGE NO.
INTRODUCTION 3
NEED FOR THE STUDY 8
OBJECTIVES OF THE STUDY 9
METHODOLOGY 10
LIMITATIONS 11
CHAPTER 2
INDUSTRIAL PROFILE 13
CHAPTER 3
COMPANY PROFILE 21
CHAPTER 4
THEORTICAL FRAME WORK 28
CHAPTER 5
ANALYSIS AND INTERPRETATION 65
CHAPTER 6
SUMMARY 87
FINDINGS 88
SUGGESTIONS 89
CONCLUSION 90
ANNEXURES 91
BIBLIOGRAPHY 95
1

CHAPTER – I
INTRODUCTION NEED FOR THE STUDY OBJECTIVES OF THE STUDY METHODOLOGY LIMITATIONS
2

INTRODUCTION
Employee satisfaction is a measure of how happy workers are with their job
and working environment. Keeping morale high among workers can be of tremendous
benefit to any company, as happy workers will be more likely to produce more, take
fewer days off, and stay loyal to the company. There are many factors in improving or
maintaining high employee satisfaction, which wise employers would do well to
implement.
DEFINITION:
“Employee satisfaction is the individual employee’s general attitude towards
the job. It is also an employee’s cognitive and affective evaluation of his or her job”.
To measure employee satisfaction, many companies will have mandatory
surveys or face-to-face meetings with employees to gain information. Both of these
tactics have pros and cons, and should be chosen carefully. Surveys are often
anonymous, allowing workers more freedom to be honest without fear of
repercussion. Interviews with company management can feel intimidating, but if done
correctly can let the worker know that their voice has been heard and their concerns
addressed by those in charge. Surveys and meetings can truly get to the centre of the
data surrounding employee satisfaction, and can be great tools to identify specific
problems leading to lowered morale.
Many experts believe that one of the best ways to maintain employee
satisfaction is to make workers feel like part of a family or team. Holding office
events, such as parties or group outings, can help build close bonds among workers.
Many companies also participate in team-building retreats that are designed to
strengthen the working relationship of the employees in a non-work related setting.
Camping trips, paintball wars and guided backpacking trips are versions of this type
of team-building strategy, with which many employers have found success.
Few workers will not experience a boost in morale after receiving more money.
Raises and bonuses can seriously affect employee satisfaction, and should be given
when possible. Yet money cannot solve all morale issues, and if a company with
3

widespread problems for workers cannot improve their overall environment, a bonus
may be quickly forgotten as the daily stress of an unpleasant job continues to mount.
If possible, provide amenities to your workers to improve morale. Make certain
they have a comfortable, clean break room with basic necessities such as running
water. Keep facilities such as bathrooms clean and stocked with supplies. While an air
of professionalism is necessary for most businesses, allowing workers to keep family
photos or small trinkets on their desk can make them feel more comfortable and
nested at their workstation. Basic considerations like these can improve employee
satisfaction, as workers will feel well cared for by their employers.
Employee satisfaction, while generally a positive in organization, can also be
a downer if mediocre employees stay because they are satisfied with work
environment.
The backbone of employee satisfaction is respect for workers and the job
they perform. In every interaction with management, employees should be treated
with courtesy and interest. An easy avenue for employees to discuss problems with
upper management should be maintained and carefully monitored. Even if
management cannot meet all the demands of employees, showing workers that they
are being heard and putting honest dedication into compromising will often help to
improve morale.
HISTORY:
One of the biggest preludes to the study of employee satisfaction was
theHawthorne studies. These studies (1924-1933), primarily credited to Elton Mayo
of the Harvard Business School, sought to find the effects of various conditions (most
notably illumination) on workers’ productivity. These studies ultimately showed that
novel changes in work conditions temporarily increase productivity (called the
Hawthorne Effect). It was later found that this increase resulted, not from the new
conditions, but from the knowledge of being observed. This finding provided strong
evidence that people work for purposes other than pay, which paved the way for
researchers to investigate other factors in employee satisfaction.
4

Scientific management (aka Taylorism) also had a significant impact on the
study of employee satisfaction. Frederick Winslow Taylor’s 1911 book, Principles of
Scientific Management, argued that there was a single best way to perform any given
work task. This book contributed to a change in industrial production philosophies,
causing a shift from skilled labor and piecework towards the more modern approach
of assembly lines and hourly wages. The initial use of scientific management by
industries greatly increased productivity because workers were forced to work at a
faster pace. However, workers became exhausted and dissatisfied, thus leaving
researchers with new questions to answer regarding employee satisfaction. It should
also be noted that the work of W.L. Bryan, Walter Dill Scott, and Hugo Munsterberg
set the tone for Taylor’s work.
Some argue that Maslow’s hierarchy of needs theory, a motivation theory,
laid the foundation for employees satisfaction theory. This theory explains that people
seek to satisfy five specific needs in life – physiological needs, safety needs, social
needs, self-esteem needs, and self-actualization. This model served as a good basis
from which early researchers could develop employee satisfaction theories.
Employee satisfaction can also be seen within the broader context of the
range of issues which affect an individual's experience of work, or their quality of
working life. Employee satisfaction can be understood in terms of its relationships
with other key factors, such as general well-being, stress at work, control at work,
home-work interface, and working conditions.
IMPORTANCE OF EMPLOYEE SATISFACTION IN THE
ORGANISATION: Employee satisfaction is supremely important in an organization because it is
what productivity depends on. If employees are satisfied they would produce superior
quality performance in optimal time and lead to growing profits. Satisfied employees
are also more likely to be creative and innovative and come up with breakthroughs
that allow a company to grow and change positively with time and changing market
conditions.
It is a precious thing to an employer. Businesses realize that low satisfaction
leads to decreased productivity, increased absenteeism and reduced motivation in the
workplace, so it is essential to measure employee satisfaction as a means to identify
5

concerns before low satisfaction plagues the workforce. As such, employers come up
with a variety of ways to recognize the signs and symptoms of low satisfaction in
order to make organizational improvements.
EMPLOYEE SATISFACTION SURVEY
An employee satisfaction survey is one method for employers to discover how
employee-centered their business is. Such a survey, which is usually conducted
anonymously, gauges the level of employee contentment by asking questions of
employees on a number of fronts that could have to do with training, development,
effective management, lack of discrimination, compensation, and work environment
or peer relationships. Many employers look to these surveys especially if they are
having difficulty retaining workers, but they may also be interested in hearing from
employees to get ideas on how to improve relationships between employees and
employers.
There are lots of different ways in which an employee satisfaction survey
might be conducted. Often the employer works with people like independent human
resource consultants who actually administer the survey and then interpret the results
for the company. A slightly less expensive approach is to conduct online surveys
where findings suggest certain pre-determined remedies. When companies can afford
the more expensive scenario, it may prove most helpful because any solutions will be
tailored to the specific company and its employees.
One of the things of greatest concern to an employee who is asked to
participate in a survey is whether results will be kept confidential. In the best surveys
they are confidential, but anyone concerned about this should get verification,
preferably in writing, that negative comments on an employee satisfaction survey
cannot be use in punitive ways. When a company is truly interested in increasing
satisfaction, they should hear not just good reviews but also bad ones. With only
positive comments, they will have nothing to improve. To get these results, employers
should use surveys that guarantee confidentiality of responses, or they may just end
up with dishonest statements that aren't productive.
6

The quality of the employee satisfaction survey is probably best determined by
how it helps the company make improvements that increase satisfaction. When
employers aren’t willing to make real changes, there isn’t much point in having a
survey. Employees tend to know what their co-workers have to say about work, and
most can identify several problem areas creating things like poor worker retention. If
they don’t see such areas improved over time after a survey, retention could sink
lower, though other factors like a poor job market may keep workers at jobs they
really don’t like.
NEED FOR THE STUDY
1. To study the basic concepts of employee satisfaction.
7

2. To study the detail description of how employee satisfaction is being
Implement in companies.
3. To analyze the effect of employee satisfaction in organization.
4. To study the process of achieving employee satisfaction and its
practical application in organizations.
5. To know how cordial relations can be maintained with employees.
.
OBJECTIVES
8
To study the importance of employee satisfaction.
To give an overview on the factors effecting employee satisfaction.
To study how employee satisfaction is maintained in CMR FAMILY
SHOPPING MALL.
To conduct a employee satisfaction survey on the employees in CMR
FAMILY SHOPPING MALL.
To study the methods of employee satisfaction in CMR FAMILY
SHOPPING MALL.
To come up with the suggestions and recommendations on Employee
satisfaction methods.
To study the SWOT analysis of the company.
METHODOLOGY
9
The methodology of collecting data is an important part of the study. The
sources of data can be divided into two parts.
PRIMARY DATA: Information of the primary data for the study is collected through
questionnaire and by personal interaction with the officers and persons of
various departments of Human Resources of the organization especially with its
top and middle level executives provides a deep insight into the problem under the
study.
SECONDARY DATA:
Information of the secondary data for the study is taken from printed material of the organization and also data required for the study is collected
from magazines, newspapers and Internet.
SAMPLE SIZE:
A sample of 100 employees from all the departments was chosen on a
simple random sampling method.
STUDY TOOL:
A well structured questionnaire of 20 questions was designed based on the
information received from the organization regarding HR practices. It was circulated
among the sample of employees. The responses given by them are taken as bases for
analysis. Pie charts and graphs are used for graphical representation and question wise
analysis.
LIMITATIONS OF THE STUDY
10
Though the project is completed successfully a few limitations can be
observed in the study.
The time allotted for the project study is too short to depict a clear and real picture of
the company and its operations.
Reliabilities on usage of secondary data.
The study was conducted with the available data and the analysis was made
accordingly.
Employees may not respond properly to the Questionnaire.
Information given by the employees may not be trust worthy.
Interpretations are based on the validity of the data collection.
This work is confidential to the published data available. It became very difficult to
get valuable information about the organization.
11

CHAPTER – II INDUSTRY PROFILE
12
INDUSTRY PROFILE
RETAIL INDUSTRY:
The retail industry is responsible for the distribution of finished products to the
public. The retail sector comprises of general retailers (managed by
individuals/families), departmental stores, specialty stores and discount stores.
The activities of the retail industry can be broadly classified into:
Personal goods store retailing
Hard goods: This covers deals in goods such as electronics, electrical
appliances, furniture and sporting goods.
Soft goods: This includes apparel retailing.
Non-store retailing
This includes infomercials, catalogue sales, vending machines and
ecommerce.
Food retailing (restaurants)
Automotive services and retailing
Retail Industry: History
The retail industry emerged in the US in the eighteenth century, restricted to
general stores. Specialty stores were developed only in those areas that had a
population of above 5,000. Supermarkets flourished in the US and Canada with the
growth of suburbs after World War II. The modern retail industry is booming across
the world. Revenues from retail sales in the US alone stood at $4.48 trillion in 2007,
according to a report by the US Census Bureau.
Retail Industry: Major Players
Of the world’s top ten retail companies in terms of total sales, six are
American. Combined sales of the top ten companies, computed by Delloite, were
13
$978.5 billion in 2007. Major retail giants include Wal-Mart, Target, Home Depot and
Tesco.
Retail Industry: Statistics
The total sales from store retailers stood at €108,449.8 million in 2007 and the
sales value of non-store retailers was €469.9 million. The percent composition of store
and non-store retailers in 2007 was:
Store Retailers Non-Store Retailers Supermarkets 32.83 Vending 26.60 Small
grocery retailers 24.46 Internet retailing 25.93 Hypermarkets 19.09 Home shopping
24.04 Food/beverage/tobacco specialists 15.68 Direct selling 23.43 Discounters 7.57
Others 0.36 Total 100 Total 100
The retail sector is vital to the world economy, as it provides large scale
employment to skilled and unskilled labor, minors and casual and part-time workers.
Employment in the retail sector in the US and Europe surpassed 32 million in 2007
INDIAN RETAIL INDUSTRY
Evolution of Indian retail Industry:
Indian Retail Industry is standing at its point of inflexion, waiting for the boom
to take place. The inception of the retail industry dates back to times where retail
Stores were found in the village fairs , Melas or in the weekly markets. These stores
were highly unorganized. The maturity of the retail sector took place with the
establishment of retail stores in the locality for convenience. With the government
intervention the retail industry in India took a new shape. Outlets for Public
Distribution System, Cooperative stores and Khadi stores were set up. These retail
Stores demanded low investments for its establishment.
The retail industry in India gathered a new dimension with the setting up of
the different International Brand Outlets, Hyper or Super markets, shopping malls and
departmental stores.
14

Key Players in the Indian Retail Sector:
The untapped scope of retailing has attracted superstores like Wal-Mart into
India, leaving behind the kiranas that served for years. Such companies are basically
IT based. The other important participants in the Indian Retail sector are Bata, Big
Bazaar, Pantaloons, Archies, Cafe Coffee Day, landmark, Khadims, Crosswords etc.
Retailing in India: a forecast:
Future of organized retail in India looks bright. According to recent
researches it is projected to grow at a rate of about 37% in 2007 and at a rate of 42%
in 2008. It will capture a share of 10% of the total retailing by the end of 2010.
According to the Union Minister of Commerce & Industry, Shri Kamal Nath,
the organized retail sector is expected to grow to a value of R s. 2,00,000 crore
(US$45 billion) and may generate 10 to15 million jobs in next 5 years. This can
happen in two forms- 2.5 million of these people may be associated directly with
retailing and the rest 10 million people may be gainfully employed in related sectors
that will be pulled up through the strong forward and backward linkage effects.
However to compete in this sector one needs to have up-to-date market
information for planning and decision making. The second most important
requirement is to manage costs widely in order to earn at least normal profits in face
of stiff competition.
Different Segments in the Indian Retail Industry
The retailing sector of India can be split into two segments. They are the
informal and the formal retailing sector. The informal retailing sector is comprised of
small retailers. For this sector, it is very difficult to implement the tax laws. There is
widespread tax evasion. It is also cumbersome to regulate the labour laws in this
sector. As far as the formal retailing sector is concerned, it is comprised of large
retailers. Stringent tax and labour laws are implemented in this sector.
If the retail industry is divided on the basis of retail formats then it can be
split into the modern format retailers and the traditional format retailers. The modern
15

format retailers comprise of the supermarkets, Hypermarkets, Departmental Stores,
Specialty Chains and company owned and operated retail stores.
The traditional format retailers comprise of Kiranas, Kiosks, Street Markets
and the multiple brand outlets.
The retail industry can also be subdivided into the organized and the
unorganized sector. The organized retail sector occupies about 3% of the aggregate
retail industry in India.
Size and contribution of the retail industry in India
In terms of value, the Indian Retail industry is worth $300 billion. Its
contribution to the Gross Domestic Product is about 10%, the highest compared to all
other Indian Industries. The retail sector has also contributed to 8% of the
employment of the country. The organized retail sector is expected to triple its size by
2010. The food and grocery retail sector is expected to multiply five times in the same
time frame. The major reason behind the low participation in the Indian retail sector is
the need for lumpy investments that cannot match up their break even points. The
government policies are being revised from time to time to attract investments in this
sector.
The Indian Retail Industry—Sky is the limit
In terms of the retail development index India ranks fifth. In Asia it occupies
the second position, next to China. Among all the global markets, the Indian retail
market is the most expanding. This is owing to absence in restriction at the entry
level. So the large foreign companies can reap the benefits of economies scale by
entering the green retail fields of India. There are many reasons why the retail
industry in India can reach the zenith.
Firstly the organized retail sector in India has a very low contribution to the
entire retail sector in the country. Hence there is ample scope for the new players to
achieve success in the backdrop of soaring disposable income of the upcoming
generation. Secondly, not only have the incomes increased but there has been a sea
change in the preferences of the consumers. These factors have acted as a stimulus for
16

the ushering of foreign players retailing in apparels, accessories, electronic appliances
etc. Large shopping malls have already mushroomed in the metropolitan cities. There
still lies untapped potential in the Indian Retail Market.
Scope for employment opportunities:
It is small wonder then that retail sector has open the floodgates of
employment opportunities to the Indian youth. Statistics reveal that the organized
retail sector has increasing employee base burgeoning from 5.4 lakh to an awesome
16 lakh over the last couple of years.
About 11.5 lakh jobs in the organized retail sector and 2 million jobs in the
unorganized retail sector will be thrown open by 2010 what with the likes of key
players in including Pantaloon India, RPG Retail, Lifestyle, Wills lifestyle, Shoppers
shop, Trent Ltd, Crosswords Bookstores Ltd., Ebony Retail Ltd. and Reliance Retail
Ltd. And the retail sector has abundant opportunities for part time positions as well
due to the long working hours.
Compensation packages:
In general, hefty salary packages with attractive perks and allowances are
offered by the employers luring the talent of this country into the retail industry.
Surprisingly the average salary of even a fresher could be up to Rs.20,000/- with an
assured average salary hike of 16% per annum. In some organizations the growth in
salary ranges from Rs.60,000/- to Rs.70,000/- annually.
HR practices in some of the most successful retail verticals in India:
Apparels: Pantaloon India:
Here is a retail giant which hires at least 250 MBAs for operations and
merchandising profiles. The candidates go through an induction period and a short
training thereon. Individuals are allotted projects for the next five months under the
supervision of project guides. They are placed in suitable positions thereafter, with
progressive authority and responsibility.
17

Indian software industry:
The challenge for HR professionals in software industry is sheer shortage of
high intellectual human capital both in numbers and skills. Recruitment of world class
workforce and their retention is a serious challenge posed in HR industry. The
yawning gap between the demand and supply of professionals has increased the cost
of delivering the technology. The incentive compensation is based on performance
keeping the long term organizational objectives in mind. Optimized compensation
packages are offered as a motivator for retention of manpower.
Food and grocery:
It is estimated that the food and grocery market in India is an astounding
$236 billion, and it is the sixth largest grocery market in the world today. No doubt
that human resources are an important asset in this food and grocery retail industry.
Many top companies have made HR a strategic partner in their operations. One
famous example is Nestle, the global giant in consumer packaged goods. Nestle has a
strong internally developed employee backing which gives a major push to the
company's lead position in the retail industry.
Attrition rates and retention of personnel:
There seems to be a high level of attrition in the retail sector which is almost
40% according to a recent study. Front end jobs are facing an attrition rate as high as
even 80%.
Under the present circumstances, retention and motivation of personnel has
become the major concern of HR. A congenial working atmosphere, support learning
and training facilities, a highly competitive pay structure are some of the effective
retention practices followed by the retail sector.
While money is the main attraction for freshers and starters, career
satisfaction is the main reason with experienced personals. Assigning the "right
project to the right person" is the organizational motto these days with companies
setting up Manpower Allocation Cells (MAC) to carry out this agenda.
18

Looking at the current scenario, it could be said that there is an acute
shortage of middle level management professionals in the Indian Retail Industry. The
current trend is to hire from a smaller organization tempting the incumbent with a
better pay package. It is imperative that suitable talent be hired in various areas such
as technology, supply chain, logistics, product development and marketing in order to
stay abreast of the hectic race for success among MNCs.
The call is for HR practitioners to play a more proactive and prominent role in
order to retain the high tech skilled employees who are constantly looking for greater
gains and prospects in their work. This is the real HR challenge to retain the
"knowledge workers" and "knowledgeable workers" by introducing new processes
and procedures and still ride high in implementing organizational effectiveness
Function of HR in retail industry:
The function of HR in any industry is to recruit and hire skilled labor force
which can be competent in that specific industry. In Retails industry the same
functions of HR can be applied. For example, in the retail sector, HR can be required
to select and hire good salesmen for the company because the sales pitch of a
salesman is very necessary for the success of the retail business. It can also show the
good records and evaluation of a specific employee in a particular region, which can
show the fitness of a specific person in a specific area. The complete process of
retailing can be made successful through the services of the front line employees and
it is the responsibility of HR to increase their efficiencies by providing them good and
attractive policies.
19
CHAPTER – III
COMPANY PROFILE
20

CMR FAMILY SHOPPING MALL
ORIGIN:
C.M.R stands for Chandana Mohan Rao.Ram Chandra textile was started in
Rajahmundry in the year 1971.This is the only wholesale shop for clothes. After six
years a retail shop Ram Chandra cloth show room was started in 1977 and kanchi
sarees in the year 1980.Later the business was spread all over Andhra
Pradesh.Chandana Bros Textiles & Jewellers (P) Ltd. was started in 2004.Its branches
are Chandana Bros Textiles & Jewellers (Patnycenter), C.M.R exclusive
(Nellore),C.M.R shopping mall(Secundrabad),Chandana Bros Textiles & Jewellers
(Kakinada),C.M.R shopping mall (Nellore).
ABOUT CMR:
Large and with enough variety to be a department store, CMR specializes in
everything a woman will need to complete a special occasion. Or even a trip to the
Movies. Because here there are everything from silk saris to glittery party tops, from
silver gift items to Ray-Ban sunglasses, and from cosmetics to pure 24-carat
jewellery.
The store is taken up by the silks and jewellery sections. We will find just as
much variety at the saris counter as there is in any Chandana Brothers showroom,
with Kanchi silks, Dharamavarams and Benaras sarees being the most favoured.
Embroidered, hand-painted and elaborately sequined sarees for up to Rs. 60,000.
The jewellery section is bigger, and has so much choice. CMR specializes in
higher-end jewellery and in gold sets in antique designs. There's also a special section
just for diamonds, plus a gift counter for Ray-Bans and gold watches from Titan. On
the first level, there is silver gift ideas and three fully-stocked cosmetics counters,
with every shade and hue under the sun.
A spacious store with enough room and choice to browse endlessly, CMR is a great
place to visit if one can enjoy the experience of shopping. Beautifully lit, comfortably
furnished four floors and with salespeople who know their range inside out.
21

There are different varieties of products available in each of the floors.
Ground floor: Cosmetics, watches of different brands and other accessories
including gold and silver section occupy this floor.
First floor: This floor constitutes soft toys, leather goods, gift articles, paintings,
fancy items, ladies wear etc.
Second floor: Kids and ladies wear.
Third floor: Gents ready mades of different brands, suiting and shirtings and leather
accessories.
Fourth floor: Home appliances, crockery, copper, brass, steel items, plastic items,
micro oven products, melamine items, luggage and kitchen items.
Chandana Brothers Textiles & Jewellers (CMR Shopping Mall) is a Private Sector
Organisation that offers services in Retail with Annual Total Turnover of 0-10 Crores.
Working Staff:
There is 150 to 200 staff employed in CMR shopping mall. The staff draws a
salary basing on the cadre they are employed. The salaries in CMR vary from
Rs.3000 to Rs.30000 per month basing on the cadre of the employee.
Employee Recruitment:
In CMR, the top managements select the candidate and the letter of
appointment or rejection is sent to the Board of Directors. The Directors do the
placement in CMR. The placement can either be in the Head Office or in any other
branches of CMR.
22

Planning:
It involves planning of Human Resource Department i.e. recruitment,
selection, training etc. it also involves forecasting of personnel changing values,
attitudes and behavior of employees.
Directing:
In this company, the personnel manager co-ordinates various managers at
different levels as the personnel functions are concerned. The wilting and effective
co-operation of employees for the attainment of organization goals is possible through
proper direction.
Controlling:
In CMR, the top management does the controlling. In this aspect, they do
auditing training programmes; directing moral surveys are some of the functions of
the top management.
Recruitment:
It is the process of searching for prospective employees and simulating them
to apply for jobs in the organization. In CMR, if they want any person, they will give
notification in newspaper in order to simulate eligible persons to apply for that job.
Employee Relation:
The employee relations at all levels remains cordial. Training, Promotion and
Transfers are done in CMR to motivate and increase the morale of the staff. All the
employees in CMR from top to bottom perform their services with sincerity, hard
work, dedication and with team spirit due to which CMR is considered as one of the
best shopping mall in Andhra Pradesh.
23

Selection, Placement and Training:
The top management shall do the selections. Placement is in the head office
and in the branches of CMR, which are in different places. Selected candidates are
placed in one of the branches of CMR and gives proper training.
Customer satisfaction:
The prices are reasonable and service is also good. It also maintains a vehicle
that drops the customers at Chandana Bros, if they are not satisfied with the varieties
available in CMR. This tells that customers are how important for them.
During the festive seasons the customers are availed with discounts on the
purchase and are given offers.
SISTER CONSTRAINTS:
Chandana Bros Textiles & Jewellers (P) Ltd. Chandana Bros Textiles & Jewellers
(Patnycenter, Secundrabad)
Chandana Bros Textiles & Jewellers (P) Ltd. C.M.R Exclusive (Nellore)
Chandana Bros Textiles & Jewellers (P) Ltd. C.M.R mall (R.P.road)
Chandana Bros Textiles & Jewellers (P) Ltd. Chandana Bros Textiles & Jewellers
(kakinada)
Chandana Bros Textiles & Jewellers (P) Ltd.C.M.R shopping mall (Nellore)
Chandana Bros Textiles & Jewellers (P) Ltd. Chandana Bros (Ameerpet)
(Gold section only)
24

BOARD OF DIRECTORS
1. CHANDANA MOHAN RAO CHAIRMAN AND MANAGING
DIRECTOR
2. JANA RAMA RAO DIRECTOR
3. MAVURI VENKATA RAMANA DIRECTOR
4. ALLAKA SATYANARAYANA DIRECTOR
5. CHANDANA SUBBALAKSHMI DIRECTOR
6. JANA NAGAMANI DIRECTOR
7. MAVURI VENKATA PADMA
VATHI DIRECTOR
8. ALLAKA SUNITHA KUMARI DIRECTOR
CEO
DIRECTORS
MANAGERS
SUPERVISOR
SALESMEN
HELPERS
BOYS
ORGANISATIONAL CHART
25

DEPARTMENT CHART
C.E.O
DIRECTORS
FINANCE MARKETING PURCHACE SALES H.R
EXECUTIVES EXECUTIVES EXECUTIVES
GOLD CLOTH OTHERS GOLD
EXECUTIVES
HELPER
EXECUTIVES
HELPER
CLOTH OTHERS
EXECUTIVES
HELPER
ACTIVITIES ENHANCING EMPLOYEE SATISFACTION AT
CMR:
CMR is enhancing Employee Satisfaction by the following ways:
Providing uniforms to employees.
Providing good working environment and safety measures.
Freedom is given to the employees by their supervisors.
Organization regularly exchange and share ideas with the employees.
Maintaining good relationship with the employees.
Recognizing employees for their performance and promoting them.
Giving training programs to the employees for their overall development.
Fare salary administration and pay policies.
Giving counseling to the employees and motivating them by giving
incentives and fringe benefits.
Manager and supervisory staff take keen interest in developing their sub-
ordinates.
26
CHAPTER– IV
THEORETICAL FRAME WORK
THEORETICAL FRAME WORK
27

DEFINITION:
Employee satisfaction is the terminology used to describe whether employees
are happy and contented and fulfilling their desires and needs at work. Many
measures purport that employee satisfaction is a factor in employee motivation,
employee goal achievement, and positive employee morale in the workplace.
Employee satisfaction, while generally a positive in your organization, can
also be a downer if mediocre employees stay because they are satisfied with your
work environment.
Factors contributing to employee satisfaction include treating employees with
respect, providing regular employee recognition, empowering employees, offering
above industry-average benefits and compensation, providing employee perks and
company activities, and positive management within a success framework of goals,
measurements, and expectations.
Employee satisfaction is often measured by anonymous employee
satisfaction surveys administered periodically that gauge employee satisfaction in
areas such as:
management,
understanding of mission and vision,
empowerment,
teamwork,
communication, and
Coworker interaction.
The facets of employee satisfaction measured vary from company to
company.
A second method used to measure employee satisfaction is meeting with
small groups of employees and asking the same questions verbally. Depending on the
28
culture of the company, either method can contribute knowledge about employee
satisfaction to managers and employees.
Exit interviews are another way to assess employee satisfaction in that
satisfied employees rarely leave companies.
FACTORS EFFECTING EMPLOYEE SATISFACTION:
It can include factors as following:
1. Organization development factors
Brand of organization in business field and comparison with leading
competitor.
Missions and Vision of organization
Potential development of organization
2. Policies of compensation and benefits factors
Wage and salary
Benefits
Rewards and penalties
3. Promotions and career development factors
Opportunities for promotion.
Training program participated or will do.
Capacity of career development
4. Work task factors
Quantity of task
Difficult level of task
5. Relationship with supervisor factors
29

Level of coaching
Level of assignment for employee
Treatment to employee etc
6. Working conditions and environment factors
Tools and equipment
working methods
Working environment
7. Corporate culture factors
Relationship with co-workers
Level of sharing etc
8. Competencies, Personalities and Expectations of employee factors
Competencies and personalities of employee are suitable for job?
Expectations of employee are suitable for policies of organization?
NEED OF EMPLOYEE SATISFACTION
1. Need of employee satisfaction for organization
Enhance employee retention.
Increase productivity.
Increase customer satisfaction
Reduce turnover, recruiting, and training costs
Enhance customer satisfaction and loyalty
More energetic employees
30
Improve teamwork
Higher quality products and/or services due to more competent, energized
employees.
2. Need of employee satisfaction for employee
Employee will believe that the organization will be satisfying in the long
run
They will care about the quality of their work.
They will create and deliver superior value to the customer
Their works are more productive.
They are more committed to the organization
HOW TO MAINTAIN EMPLOYEE SATISFACTION
To maintain employee satisfaction, two solutions can be used as follows:
1. Determining suitable frequency of appraisal
Appraisal frequency should be at least 3 or 6 months / time. This help
regularly to review satisfaction trends of employees.
Many organizations only perform appraisal satisfaction of employees 1 time
per year, simply by applying the standard management rather than the needs of the
organization. This is a very long time because the dissatisfaction of employees can
occur at any time.
2. Implementation of feedback program regularly
Satisfaction of employees can not be assessed every month because it is very
time-consuming. So implementation of the program has to be done on the response of
employees monthly or suddenly when a problem happened.
31

The feedback of the staff is their comments, attitudes about problems that will
occur or has occurred.
The feedback can conduct independent or attached to the assessment of the work
monthly.
NINE STEPS TO IMPROVE EMPLOYEE SATISFACTION:
Employee satisfaction can be improved by nine steps. They are:
1. Shared mission or vision
2. Regular Employee input and feedback programs
3. Clearly Defined and Communicated job Expectations
4. Regular and Fair Performance Feedback
5. Compensation, Benefits and Rewards Programs that are Aligned With
Mission Accomplishment
6. Promotion of a Diversified Work Force
7. Hiring the Right Employees
8. Comprehensive Employee Orientation and Integration Programs
9. Strong Commitment to Training and Development Programs
DIFFERENT METHODS USED TO MEASURE EMPLOYEE SATISFACTION:
Employee satisfaction can be measured by following methods:
1. Satisfaction Surveys These surveys are presented in a questionnaire format, can gauge whether
employee satisfaction is high or low based on how employees answer the questions.
32
2. Data Collection
Employers can collect data to evaluate if there seems to be a satisfaction
problem in the workplace. Human resource departments typically keep this
information in personnel records. They may also use the data to generate a report.
3. Visual Observation
Measuring employee satisfaction is something that can be done by visual
observation. If employers wish to see things for themselves, it is a good idea to open
the eyes and watch what goes on in the workplace.
EMPLOYEE SATISFACTION INDEX:
Employee satisfaction index is a index to measure satisfaction of employee in
an organization.
How to calculate ESI?
There is a five-point scale in the questionnaire or survey from employee
responses. They are
• Strongly Agree,
• Agree,
• Undecided,
• Disagree,
• Strongly Disagree.
Numbers should be remarked which include strongly agree (5) to strongly disagree
(1).
Then, total number of questions with answers against each response is calculated (5,
4, 3, 2, 1).
33

Identify total point of each response.
Identify total number of questions answered
ESI = (total point / total question) * 100.
Analyze employee satisfaction index
Identifying ESI can be done by company, department, field and then, 80/20
principle or Pateto tool can be used to analyze employee satisfaction.
SOURCES OF EMPLOYEE SATISFACTION
Several job elements contribute to employee satisfaction.
They are:
1) wage
2) Nature of work
3) Promotion
4) Supervision
5) Work group
6) Working condition
7) Motivation
1) Wage:
Wages play a vital role in influencing job satisfaction. This is based on two
reasons.
i) Money is an important instrument in fulfilling ones needs.
ii) Employees often see pay as a reflection of managements concern for them
employees want a pay system, which is simple, fair and in line with their
expectations. When pay in seen as fair, based on job demands, individuals
skill level and community pay standards, satisfaction is likely to result.
2) Nature of work:
34
Most employees crave intellectual challenges on jobs. They tend to prefer
being given opportunities to use their skills and abilities and being offered a variety of
talks, freedom and feedback on how well they are doing. These characteristics make
jobs mentally challenging jobs that have too little challenge create burden. But too
much challenge creates frustration and a failure, order conditions of moderate
challenge, employees, experience, pleasure and satisfaction.
3) Promotions:
Promotional opportunities affect job sati’s faction considerably. The desire for
promotion is generally strong among employees as it involves change in job content,
pays, responsibilities, independence status and the like and average in his entree
service, through changes of promotions are better in the private sector. It is no
surprise that the employees take promotion as the ultimate achievement in his carver
and when if it is realized he feels extremely satisfied.
4) Supervision:
There is a positive relationship between the quality of supervision and job
satisfaction the quantity of supervision and job satisfaction supervision that establish a
supportive personal relationship with sub-ordinates and take a employee satisfaction
supervisor actions for maintaining job satisfaction.
Create a good physical environment.
Transport discounted employees.
Change the perception of dissatisfied employee.
Maintaining open lines of communication.
Display concern of employees.
Given ample recognition
Allow for participative, management.
Conduct morale building programs.
5) Work Group:
35

The work group does serves as source of job satisfaction to individual and
group members with opportunities for inter. It is will known that for many employees
work fills the need for social interaction.
The work group is as even stronger source of satisfaction when member have
similar attitudes caused less eviction on a day to day basis co-workers with similar
attitudes and values can also provided some confirmation of a person self concept.
“We are ok and you are ok”
6) Working Conditions:
Working conditions that are compatible with employees physical comforts and
that facilities doing a good job contribution to job satisfaction, temperature, humidity,
ventilation, lighting and nose, hours of works, cleanliness of he work place and
adequate tools and equipments are the features which affect job satisfaction.
Benefits of employee Satisfaction:-
1) One benefit of employee satisfaction survey is that the give management and
indication of general levels of satisfaction in a company. Survey also indicate
specific areas of satisfaction or dissatisfaction (as with employee service) in
other words, a survey tells how employees tell about their jobs, what part of
their jobs these feelings are for used on which departments are, particularly
affected, and whose feelings are involved (for example supervisors, employees
staff specialists). The survey is a powerful diagnostic instrument for assessing
employee problems.
2) Improve communications is another benefit of he surveys communications
flows in all directory a people plan the survey talk, and discuss its results,
particularly beneficial to the company is the parade communication when
employees are encouraged to comment about what they really have in their
minds.
36

3) An unexpected benefit from job satisfaction surveys in improved attitudes for
some employees, the survey is a safety value, an emotional release, a chance
to get things off their chest for others, the survey is tangible expression of
managements interest in employee welfare, which gives employees a reason to
feed better to wards management.
4) The Employee satisfaction survey can help discover the causes of indirect
productivity problems, such as absenteeism turnover are highly conflated with
job satisfaction. It also noted that these in turn affect productivity it night
appropriately turn to job satisfaction survey to diagnose the cause. The cause
could be low pay back of promotional opportunities, unchallenging jobs,
unjust treatment, and the like with out proper surveys there could be random
guessing on the part of management both to get a letter, handle on was
employees are lagging and to plan better solutions to problems.
5) Another benefit of satisfaction survey as that help management to assess
training need usually employees are given an opportunity to report how they
feel the supervisor performs action parts of jobs such as delegating work and
giving adequate job instruction. Since employees experience these supervisory
acts, their perceptions may provide useful data about the training of their
supervisors.
CONSEQUENCES SEEN THROUGH EMPLOYEE
SATISFACTION
Of all the behaviors employee satisfaction or dissatisfaction and effect, there
in none so important to managers as performance. First the relationship bet wean job
satisfaction and job performance is weak other factors besides and job satisfaction for
instance the condition of the work equipment or the workers much a person can
produce that his or hire job satisfaction does second there is substantial evidence to
suggest that job performance leads to job satisfaction rather than vice versa employees
who perform well should receive both more intrinsic rewards and more extrinsic
37

rewards as result of their efforts. As result of these rewards, the best performance will
also be most satisfied workers.
TURNOVER:
The relationship between job satisfaction and turnover is strong.
Organizational with the lowest average satisfaction levels tend to have the highest
turnover rates.
ABSENTEEISM:
Employee satisfaction is highly related to absenteeism in work units where job
satisfaction are likely to expert the high level of effort necessary to get to work
workers who are dissatisfied are more likely to take “Mental health”.
EMPLOYEE SATISFACTION SURVEY:
The method used to measure employee satisfaction in this study is
SATISFACTION SURVEY.
According to the National Business Research Institute (NBRI), satisfaction
surveys are an effective way to measure how happy employees are at work. These
surveys, which are presented in a questionnaire format, can gauge whether employee
morale is high or low based on how employees answer the questions. The NBRI
explains that employers use information provided by satisfaction surveys to evaluate
what employee motivation is like, whether they are satisfied with their jobs, what the
organization's weaknesses are and whether employees feel loyal and committed to
their company.
Employee satisfaction surveys give staff the chance to communicate openly
38

and honestly about their perception of the health of the organization. When employees
can hide behind an anonymous question sheet, such as a satisfaction survey, they are
more inclined to be candid.
METHODS OF EMPLOYEE SATISFACTION SURVEY:
Employee satisfaction survey can be measured by methods as follows:
1. Job Descriptive Index (JDI)
Job Descriptive Index is a scale used to measure five major factors associated
with job satisfaction: Work itself, Supervision, Pay, Promotion, Co-workers. The JDI
was first introduced in 1969 and since then has been used by over 1,000 organizations
in many sectors.
2. Job in General Scale (JIG)
Job In General Scale is a method of employee satisfaction and developed as a
global measure of job satisfaction.
JIG is similar to JDI, it introduced 1969 by Smith, Kendall, & Hulin, was
modified in 1985 by the JDI Research Group.
3. Minnesota Satisfaction Questionnaire (MSQ)
The Minnesota Satisfaction Questionnaire (MSQ) is designed to measure an
employee’s satisfaction with particular job.
Method includes 100 items measuring 20 facets of job satisfaction.
There are three version are available: two long forms (1977 version and 1967
version) and a short form.
4. Satisfied / dissatisfied method
39

This method questions like:
What is good thing in the company?
What is not good one in the company?
This method is suitable for “emergency events” and result is needed in a short time.
5. Interview method
This method is used for:
Review all data collected from other method.
Review key person.
STEPS IN EMPLOYEE SATISFACTION SURVEY PROCESS:
40

Determining the need to survey.
Selling the survey to management.
Determining what to ask.
Selecting the methodology.
When to require questions.
41
Marketing the survey.
Proofing and Testing.
DETERMINING THE NEED TO CONDUCT AN EMPLOYEE
SATISFACTION SURVEY
This is a fairly simple tip. There are two questions to ask your self.
Interpreting the results.
Sharing the results.
Acting on the results.
Inviting the employees.
Selecting the norms to use
42
When to repeat the survey.

1. Do you have employees?
2. Do you know how they feel about their jobs and their work environments?
If the answer to the first question is yes and the answer to the second question is no,
you need to conduct an employee satisfaction survey, even if you have only a few
employees and gather the information through informal discussions.
The urgency of the matter is another thing entirely. The need to survey is greater
when one or more of the following factors are present.
1. Rapidly growing organization. When an organization is growing quickly, it
is critical to find out how employees feel about their jobs, the organization,
and their fit and future within it.
2. High or growing turnover rate. While some industries have a naturally high
turnover, growing turnover is a problem for any organization. If your absolute
level of turnover exceeds the industry average, you have a problem that an
employee satisfaction survey is the first step to solving.
3. Excessive rumors. A strong rumor mill is symptomatic of other problems in
the organization. These can include communications, trust, and fear. Only a
survey can uncover the extent to which any of these issues exists.
4. Planned or recent organizational changes, including change of leadership.
Change can be difficult for many people. If not handled properly, productivity
and profits can decline.
5. Highly competitive industry. In a highly competitive industry, turnover
minimization and productivity and creativity maximization are keys to
success. Staying in touch with employees is necessary to facilitate continued
competitiveness.
6. Contemplated changes in pay and benefits. You must know what needs to
be "fixed" and how much "fixing" it needs to maximize return on invested
money and people resources.
At first glance, this may look like a daunting process, but it isn't. It actually takes only
a few weeks from start to finish. Committees, however, can slow the process
considerably, and in some cases result in poor decisions.
43

SELLING THE SURVEY TO MANAGEMENT
It is common for one farsighted person in an organization to realize the need for an
employee satisfaction survey. The task then becomes convincing critical decision
makers of the need for such a survey. If the survey is unbudgeted, the task may seem
formidable - but it is not.
In the absence of information about how employees view the workplace, decisions
affecting productivity, morale, turnover, pay, and benefits costs are made in an
information vacuum. Money and resources directed toward items that don't need
improvement (or, worse yet, result in decline) in these items are essentially wasted. If
a company were to focus resources on improving a particular benefit when the real
need employees have is more training and better communication, the end result would
be a more costly benefits program than necessary and continued employee frustration.
One client of ours reduced turnover in the organization from more than 50% to less
than 30% after acting on the survey results we provided. Their estimated annual cost
savings are $2 million per year. Their investment? Approximately $10,000. The
survey paid for itself 200 times over.
Estimates of how much is saved by reducing turnover vary depending upon the
amount of training needed for someone to reach full productivity. Organizations with
more highly-skilled workforces will realize the greatest cost savings and increases in
productivity. Harvard Business Review reports that a 5% decrease in retention results
in a 10% decline in costs and a productivity boost of between 25% and 65%.
The above represent the "hard" benefits. There also are "soft" benefits, which are
somewhat more difficult to quantify. Employees appreciate being asked for their
opinions, and appreciate it all the more when survey results are acted upon. When
changes are made that make employees feel better about coming to work, several
benefits, aside from decreased turnover, can result. These include:
More energetic employees,
Increased productivity, as happier employees will tend to "go the extra mile,"
44

Improved teamwork, as employees get to know each other better (since they
are staying longer),
Higher quality products and services, due to a more competent, energized
workforce and improved processes (processes identified in need of
improvement in the survey),
More satisfied customers, due to the higher quality products, services, and
service levels provided by the energized workforce.
Advances in technology have made it possible for management to act on survey
results in a very timely manner. It is common for our clients to have survey results,
(including an analysis of strengths and weaknesses, and recommendations), in hand
within four weeks after contacting us.
DETERMINING WHAT TO ASK IN AN EMPLOYEE SATISFACTION
SURVEY
This is a much simpler process than it used to be just a few years ago. The old model
was to have a consultant visit your physical location, interview employees for several
days or weeks, and create a questionnaire. This approach had many drawbacks;
among them:
It was time consuming,
It was expensive,
Although many of the same issues were addressed in questionnaires for
different clients, inconsistency in question wording made normative
comparisons nearly impossible.
Our approach both simplifies and improves this old process. We developed a base
questionnaire containing core questions necessary for substantially all employers;
questions addressing issues such as supervisor fairness, corporate communication, and
physical work environment. Starting with this core document, we customize the
questionnaire to fit it to the particular needs of the client, adding and deleting items as
appropriate. Periodically, we review recent projects to see whether any of the custom
items merit inclusion into the base questionnaire and whether any of the standard
45

questions can be dropped (based on low importance, lack of differentiation between
scores, etc.). This enables all clients to benefit from the creativity that has gone into
other questionnaires, and makes possible the establishment of normative results
against which to benchmark individual organizational results.
To determine what customization is required, we ask questions of the key client
contact (and of others, as the contact deems necessary) during telephone
conversations. These questions include:
What is the reason for conducting the survey at this time?
What hypotheses do the contact have about what is working well in the
organization and what is not?
What rumors are in the rumor mill?
Are there any special concerns this business has because of the line of work?
(Safety, ethics, quality, etc.)
What is the corporate mission statement?
Are there any prior employee satisfaction survey results? If so, can we review
them?
What benefits are included in the benefits package?
We then craft a first draft of the questionnaire for the client's review. We exchange
drafts via email until the client is happy with the document.
Some clients bring question wordings of their own to the survey process. We review
these and suggest any wording changes we feel are appropriate.
The entire process usually takes a few days. It can take just a day or two for an
organization with 200 or fewer employees, especially if the CEO is directly involved.
It can take longer if the organization is either very large, has a culture of risk aversion,
is highly political, or if a committee is involved in the process.
Larger organizations can expedite the process if they have a comprehensive list of
departments and employee counts readily available. Much of the effort in
questionnaire design when a few thousand or more people are employed by an
46

organization goes into the layout of the department question, making sure there are no
ambiguous department descriptions and that all departments are included.
The process, though simplified from the olden days, may sound daunting. However, it
actually works quite well, and our clients always are pleased with the resulting
questionnaire, the speed with which it is assembled, and with its ability to uncover the
key issues in need of improvement.
SELECTING THE METHODOLOGY FOR YOUR EMPLOYEE
SATISFACTION SURVEY
There are two primary methodologies for conduction employee satisfaction surveys --
Internet and paper-and-pencil. The choice of methodology should be based on what is
best for the respondents -- best in terms of convenience, ease of use, trust in the
method. There is little difference in price between either method until the sample size
numbers in the thousands, in which case Internet is more cost effective.
If all employees or substantially all employees have access to the Internet from work,
Internet is our recommended methodology. It generally results in a higher response
rate and is faster than paper-and-pencil. It also give a bit more control in terms of how
the questions are presented and gives the ability to require that certain questions must
be answered. We have a secure server, so there is no issue with regard to
confidentiality of sending results when an Internet survey is done with us.
If only a small percentage of employees have Internet access from work, we
recommend using the traditional paper-and-pencil methodology. Even if cost savings
could be realized by forcing employees to a central location to complete the survey, it
is better to use paper-and-pencil in this circumstance to avoid user errors caused by a
lack of familiarity with the Internet medium on the part of some users.
In some cases, it is appropriate to mix methodologies. This is the preferred approach
when there are large contingents of employees with Internet access and large
contingents without. The mixed method generally will yield a higher response rate
than will the paper-and-pencil method.
47
WHEN TO REQUIRE QUESTIONS IN AN EMPLOYEE
SATISFACTION SURVEY
One of the advantages of conducting a survey via the Internet is that you can require
that certain questions be answered. There is an inclination upon the part of some
clients to, when they realize this is possible, want to make every question required.
However, we don't recommend this.
There are a number of reasons employees do not answer particular questions. These
include:
1. They don't feel qualified to answer,
2. They are afraid to answer, lest someone at the company find out how they
responded.
3. They are apathetic about the issue being raised in the question.
4. They forget to answer.
Let's address these issues one at a time.
If employees don't feel qualified to answer, their answers may well be uniformed
guesses. Such guesses only serve to muddy the data, making insightful analysis more
difficult.
If employees are afraid to answer, but are required to do so, they may intentionally
select an answer which does not reflect their real feelings. This will result in findings
that do not represent the true feelings of a subset of the subject population.
If employees are apathetic about the issue being raised, they may answer randomly if
an answer is required. This also serves to muddy the data.
The fourth issue to be addressed is that of employees who forget to answer a
particular question. This rarely occurs with regard to the ratings scale questions in an
employee satisfaction survey. The lion's share of scale questions are answered by 97%
to 100% of the employee base. The main exception to this is the overall satisfaction
question, which 5% to 10% of employees typically forget to answer if not so required.
48

It is probable that most leave it blank until they have completed the remainder of the
questionnaire, meaning to review their responses before reaching a decision on the
question, and they simply forget to go back and complete it. Consequently, we always
require the overall satisfaction question in an online employee satisfaction
questionnaire.
Another question employees often do not answer is the one in which they are asked to
indicate their department. This is not a case of forgetfulness - it is a conscious effort
upon the part of some employees to avoid being identified. We, upon consulting with
the client, sometimes require that this question be answered. When we do, we
recommend that the client remove as many of the other demographic questions as
possible to mitigate the fears employees have that they will be identified.
The remaining demographic questions often are not completed by many (10% or so)
employees. We usually do not require that these questions be answered. (In fact, we
cannot recall making them required in any survey.) It is more important to know the
department in which an employee resides than it is to know their age, sex, income,
etc.
We have not yet discussed one other possible impact of requiring that questions be
answered - that of respondent frustration. When employees are repeatedly sent back to
the questionnaire to complete answers, some will get upset. Some may respond
randomly, and some may just give up. To minimize respondent frustration, whenever
a question is required, we state this in bold red type and remind employees of which
questions are required in text immediately preceding the "submit" button.
PROOFING AND TESTING THE EMPLOYEE SATISFACTION
SURVEY
In the first part of this stage, both we and the client proof the questionnaire (whether
paper or Internet). This is not just a check for misspelled words - we are looking for
proper skip patterns, question numbering, grammar, and format.
49

Once proofing has been completed for a paper-and-pencil survey, the questionnaire
goes straight to the printer. Internet Surveys, however, still need to be programmed
and tested.
After programming, we conduct a series of tests to ensure that the questionnaire is
working properly and that it is populating the correct file. We like to allow one day
for this.
Once the questionnaire has been completely tested, the next step is - MORE
TESTING.
One of the biggest potential GOTCHAS for an Internet survey is the email invitation.
In most cases, the employer (our client) sends the email invitation to employees. It is
critical that the link properly work. Just because the link seems to have the proper
URL, it is no guarantee that it will link to the correct URL. There could be a very
minor typo, or there could be underlying code that does not match the wording of the
URL. the only way to make certain that the proper url is being referenced is to
actually send the email to someone and click on the link. We like to review each
invitation email a client plans on sending before it is sent.
If changes are made to an Internet questionnaire (other than typographical errors and
minor cosmetic adjustments), the survey will have to be retested.
MARKETING YOUR EMPLOYEE SATISFACTION SURVEY
Your employee satisfaction survey should be treated as seriously as would any of
your products or services. It must be of high quality, and it must be marketed
correctly. This tip discusses the marketing aspect of the process.
50

As in every marketing campaign, several things are necessary. Among these are:
Determining the target audience,
Creating awareness of the product or service,
Communicating the benefits of the product or service,
Letting people know how to obtain the product or service.
Before you even begin, you will need to have appointed someone to manage the
communication process. This often is the project manager for the entire program, but
it can be a different individual.
Determining the Target Audience
There really are two target audiences for your Employee Satisfaction Survey
Marketing Campaign.
Employees,
Managers of employees.
The reason for employees being a target is self-evident. Managers also are a necessary
target -- their support is essential in the communication and facilitation of the
employee satisfaction survey program. A manager can make or break response rate in
his/her area.
Creating Awareness
Two to three weeks before the survey invitation goes out, you should begin creating
awareness of it.
Step 1. Communicate to Senior Managers the importance of participation, the
confidential nature of the survey, and that it is a priority for the top manager(s) of the
company.
Step 2. Senior managers communicate to the remaining managers in the organization.
Step 3. Begin disseminating information about the survey to employees via the most
effective means available. The method you use should depend upon how you
51

communicate important matters to the entire employee base. Multiple methods should
be used if possible. Consider email, memorandums, newsletters and bulletin boards.
Draft and disseminate a Q & A sheet to all managers for use in employee meetings.
All managers should schedule meetings with the employees immediately reporting to
them to discuss the survey process.
COMMUNICATING THE BENEFITS OF THE EMPLOYEE
SATISFACTION SURVEY
In all pre-survey communications, including meetings with employees, the following
should be addressed.
The importance of responding. "We can't fix things if you don't tell us what is
broken."
The confidentiality and anonymity of the process and the data.
How the results will be disseminated to employees.
How the information will be used.
Letting People Know How to Obtain the Product (the Survey)
In all pre-survey communications, the timeline for participating needs to be
communicated. People need to be told that they can complete the survey during work
hours. (Managers need to understand that their support is needed in letting people
complete the survey during work hours.)
The actual invitation, which can be in email, letter, or memorandum form, should
reiterate all of the items in these last two sections, as well as outlining the start and
end dates of the survey. The invitation should come from a person high in
management, the CEO or person in charge of the local operation, if possible. Details
of the invitation are included Inviting the Employees.
INVITING THE EMPLOYEES TO YOUR EMPLOYEE
SATISFACTION SURVEY
52

The invitation to employees to participate in the survey can be done via either email
or memorandum.
In both cases, certain key information must be communicated.
What is happening. E.g., "We are conducting an employee satisfaction
survey."
Why it is happening. E.g., ". . . as our changes and faces new challenges, it
becomes increasingly important to gauge the level of satisfaction of our
employees."
The survey is anonymous and confidential. Assure employees that their
responses will be held in the strictest confidence. If using an outside supplier,
mention that only the supplier will see the completed responses.
How the results will be used. Anything you can share with employees in this
regard will make it more likely that people will respond.
How long the survey will take to complete. Most surveys of this type, if
properly designed, will take only 15 or 20 minutes to complete. If this is the
case with your survey, be sure to mention it.
Give a deadline.
Thank the employees for their time.
If the invitation is an email for an Internet survey, the email should contain the URL.
Care must be taken to ensure that the URL is a hot link (employees should simply be
able to click on the link to go to the survey) and that the link actually leads people to
the correct URL. The message should appear within the text of the email itself, rather
than in an attachment.
If the invitation is a memorandum inviting people to participate in a paper-and-pencil
survey, the questionnaire and a return envelope should accompany it. The
memorandum should tell people how to return their completed questionnaires.
Optional information to consider including in the invitation:
Tell people the survey can be completed on company time
53

If there is some sort of group incentive for a high response rate, mention what
it is.
If it is an Internet survey and your research supplier is using a secure server,
mention this.
To maximize response rate, the invitation should come from within the organization
itself, and should be signed by a senior manager (the CEO if possible). For a paper-
and-pencil survey, the questionnaire packet should be delivered to people at their
places of work instead of mailing it to their homes.
We keep on file samples of successful invitations (with the company names removed,
of course), and make these available to clients.
OBTAINING A HIGH RESPONSE RATE IN YOUR EMPLOYEE
SATISFACTION SURVEY
Here are the steps to take to obtain a high response rate.
Market the employee satisfaction survey to the employees and managers
before the survey begins.
Make it clear that the survey can be completed on company time, and make
sure all supervisors support this. (We have seen complaints in employee
comments when this is promised but one or more supervisors do not support
it.)
Make sure employees understand their responses will be confidential. Support
your statements to the best extent possible, e.g., "Your questionnaires will be
received directly by the research firm doing the tabulations. Nobody in our
organization will see your ratings and comments."
Let employees know how many people have responded at various points in
time.
Establish an overall response rate goal and give all employees "something
extra" if the goal is reached.
Send reminder messages.
When the results come in, let the employees know what they were. This will
help the next survey's response rate.
54

Act on the results. This also will help the next survey's response rate.
SELECTING THE NORMS TO USE IN YOUR EMPLOYEE
SATISFACTION SURVEY
In the value of normative data in employee survey analysis, we discussed how
norms add significant value to the interpretation of results. The question often comes
up - "against what types of organizations should I compare my organization?" For
most of our clients, the entire normative database is the most appropriate base to use
for comparison. The reasons for this are as follows.
In many industries, employees jump between industries. Thus, you compete
for employees with industries outside your own. As such, you need to know
how your organization compares with the real competition for your "people"
resources.
In most cases, the differences between industries are slight in terms of how
employees feel about where they work. For example, Table 1 contains the
scores for one attribute, "my supervisor treats me fairly," for three industries
and for the database as a whole.
Using too small a small subset of a normative database makes it more difficult
to determine whether observed differences to the norm are statistically
significant. This causes uncertainty with regard to how different your
organizations results really are, and can lead to erroneous decision making if
the user ignores any lack of statistically significant differences.
As is the case in much of life, there are exceptions. People in the healthcare industry
tend to stay in the industry and the results do tend to differ slightly from those of
employers as a whole. Also, we know that employees of very small organizations tend
to be happier than employees of very large organizations.
When a client does not want to compare against the entire normative database, we try
to strike a sense of balance between using organizations substantially identical to the
one for which we are conducting the employee satisfaction survey and benefiting
55
from the large sample sizes associated with using the entire database. Sometimes this
means eliminating organizations above or below a certain size or organizations in
particular industries from the database against which we compare the results.
In some instances, it is appropriate to only compare against organizations in the same
industry as the client. Fortunately, we have a large enough sample to do this for many
industries, including, but not limited to, healthcare, high technology, and
manufacturing.
Some of our clients have very high aspirations and levels of employee satisfaction.
For such clients, it can be appropriate to "set the bar high" by comparing against only
the top 10% or 20% of all organizations (based on overall satisfaction with an
organization as a place to work).
The most important thing to remember is that norms add an extra layer of analytical
capability and value to the employee satisfaction survey process.
INTERPRETING THE RESULTS OF YOUR EMPLOYEE
SATISFACTION SURVEY
It is astounding how much "data" can be created by a survey. Each scale question has
multiple possible answers, each of which must be reported along with each item's
average score; there are results for various subgroups, and there is statistical analysis.
The data must first be packaged into information (via proper presentation of tables,
graphs, and statistical analysis). Then, it must be properly interpreted. Different
analysts may take different approaches. Here is one approach.
1. Analysis of Strengths and Weaknesses. In this step, we look at the intra-
survey strengths and weaknesses, i.e., how the items in the survey compare to
each other, and the extra-survey strengths and weaknesses, i.e., how the results
compare to other results from similar surveys (norms). This can be done on the
attribute (individual question) level as well as on the section (groups of
questions) level.
2. Look for Patterns. Typically, common themes will emerge. For example, it is
common to find problems in inter-departmental communication when
56

teamwork scores are low. These patterns give clues to the underlying
circumstances in existence at the organization.
3. Leverage Analysis. Limited company resources require companies to be able
to quickly identify those areas that are most important (leverageable) to its
employees. Leverage analysis provides a way of selecting areas to focus on,
by calculating each area's leverage on a "bottom line" measure - overall
satisfaction. The high-priority targets identified by quadrant analysis (see chart
below) are those areas which meet two criteria:
1. They need improvement, and
2. Their improvement will strongly leverage the bottom line - overall
satisfaction.
We look at the statistical relationship between each attribute measured and
overall satisfaction. Items with high leverage (correlation to overall
satisfaction) will have more impact on satisfaction than will items with low
leverage. By plotting the leverage (correlation) scores and the performance
scores (the percentages or average scores for each attribute) in two-
dimensional space, it becomes apparent which items need immediate attention.
SHARING THE RESULTS OF AN EMPLOYEE SATISFACTION
SURVEY
It is critical to share results in a timely manner for at least two reasons:
1. Everyone must know where the organization as a whole and their individual
areas stand if you are going to fully leverage the creativity and efforts of the
employee base.
2. Employees need to know that the time they spent in completing the survey
was worthwhile.
Each organization has its own information-sharing culture in place. While in some
cases, particularly if the survey showed communication to be a problem, the process
will need some adjustment, we recognize that each organization will have an
approach to information dissemination that it typically leverages. As such,
57

modifications to our recommended approach may be in order to account for an
organization's information-sharing culture.
The Basic Principles of Sharing Employee Satisfaction Survey Results
1. Be honest. An organization must be willing to share both its strengths and its
areas in need of improvement. Employees will see through attempts to hide or
"spin" information.
2. Be timely. The sooner you release results, the sooner the organization can
begin to move toward positive change.
3. Share appropriate information at each level. Senior management will need
encapsulated results and access to detailed results for the organization as a
whole and differences between divisions/departments. Division managers will
need to know how their division compares to the organization as a whole and
how departments in the division compare to each other. Department managers
will need to know how their results compare to the organization as a whole
and to the division to which they belong.
4. Don't embarrass people in front of their peers. Teamwork and morale can
be harmed if, for example, a division manager shows all department scores to
the department managers in a group setting. Rather than pointing out low-
scoring departments to all department managers, let all department managers
know how they fared compared to other departments via one-on-one meetings.
5. Discuss what happens next. After the results have bee presented, let the
audience know what steps will be taken to improve those items in need of
improvement.
6. Respect confidentiality. Don't present information that would make people
feel that their responses are not confidential. For example, it would not be
appropriate for anyone in the organization to have access to comments for a
small department, since some people may be able to accurately guess who
made what comment. Your research supplier should assist in this by not
providing information that could breach, or could be perceived to breach,
confidentiality.
Process Considerations
58
1. Have a plan in place to disseminate information before the survey has been
completed.
2. The CEO/president should be briefed by the internal project manager and/or
the research supplier.
3. The CEO/president should share the results with division managers. Overall
results should be shared in a group setting. Individual results should be shared
in one-on-one meetings.
4. Division managers should share results with department managers in a similar
manner to the approach the CEO/president took with them.
5. Key findings and implications should be highlighted in each presentation.
Detailed results also should be presented. However, take care to avoid
drowning people in information. This can be done by relying more heavily on
graphics than on detailed tables to communicate.
6. Give employees an overview of overall results through the best means
possible. For some organizations, this will be in a group setting. For others, it
will be via email, Intranet, or newsletter. Consider using multiple methods.
7. Department managers should share departmental results with employees in a
group meeting. It may be helpful to have an HR manager assist in the
presentation. If HR managers will be part of this process, planning ahead will
help the meetings to proceed smoothly and take place in a timely manner.
8. In all communications, make sure the communication is "two way." Questions
should be encouraged.
ACTING ON THE RESULTS OF AN EMPLOYEE SATISFACTION
SURVEY
Your company has committed the resources to survey its employees, the employees
were enthusiastic about participating and now you have the survey results in your
hand. What do you do with the survey data? What are the next steps in improving the
satisfaction of your employees? How should the results be distributed? How do you
59

identify the most important areas to focus on? Once the areas are identified, what's the
most effective method of realizing improvements in those areas?
While the answers to many of these questions are largely the product of a company's
organizational culture, it's crucial that the employees be actively involved in the post
survey phase if an organization is to attain significant improvements in employee
satisfaction with minimal resources.
Distribution of Survey Results
From the beginning, senior executives must determine who gets what type of report.
Should department managers receive reports from other departments? Are divisional
reports needed and who should receive them? Should supervisors receive specific
reports and line managers receive reports? Who should review employee comments?
See sharing the results for more information on this.
Once the survey results are distributed, an action plan must be created to decide which
areas are most important to the employees and how best to improve those areas.
COMMUNICATE SURVEY RESULTS AND ACTION PLANS TO
YOUR EMPLOYEES
One of the biggest mistakes organizations can make in the survey process is to fail to
communicate to everyone the findings of the survey and the plans created to improve
weak areas. While we do not suggest distribution of the complete survey report to
everyone, we do recommend an open and honest discourse of both organizational
strengths and areas for improvement at the department level if possible. Along with
the survey findings, dialogue of what action the company plans to take to address
those organizational weaknesses also must occur.
Admittedly, the method of company communication and the content of those
messages are again, influenced by the company's culture. Failing to reveal the results
of the survey and to take action to correct shortcomings can prove detrimental to
company satisfaction. In fact, companies are better off not surveying at all if they
don't plan to take action. Inaction by company decision makers results in an almost
immediate decline of employee morale and a general feeling of apathy. Furthermore,
60

failing to act can severely impact future attempts to gauge the satisfaction of your
employees in the future. It's been our experience, however, that those organizations
that solicit input from its employees both in terms of deciding which areas to focus on
and creating novel approaches to deal with those areas are the ones that achieve the
greatest amount of improvement in the shortest amount of time with minimal
resources.
DEVELOP ACTION PLANS TO IMPROVE EMPLOYEE
SATISFACTION
Once the survey results have been distributed and critical areas identified,
organizations must decide upon the most effective means to improve those items.
Some executives charge the individual department managers with creating and
implementing improvement processes. Other more culturally dynamic organizations
involve employee in the process by making them part of task forces and focus groups
to better understand and act upon the survey findings. Effective use of employee
groups creates new levels of employee trust and organizational commitment. In
addition, focus groups facilitate the implementation of meaningful changes, which
have a real impact on employee satisfaction. A recent client in the pharmaceutical
industry which surveys its employees semi-annually has realized valuable gains in
employee satisfaction using focus groups, decreasing employee turnover by nearly
50% in a 2-year period. Whichever method is used, there are three keys to success:
1. Goals and incentive setting at the lowest possible organizational level,
2. Periodic follow through by senior executives to ensure improvement plans are
effectively created and implemented,
3. Rapid deployment.
Also, don't forget to have a plan in place to bring new managers up to speed on
the survey findings and resulting action plans.
WHEN TO REPEAT THE EMPLOYEE SATISFACTION SURVEY
61
We often hear the question, "how often should I conduct an employee satisfaction
survey?" Our recommendation is once a year for most organizations.
Depending upon methodology and the size of the organization being measured, it
usually takes three to four weeks from the implementation of a survey until the
issuance of the final report and departmental reports. (It can be done more quickly,
especially if the Internet is used and the organizational culture encourages rapid
response.) If a good post-survey communication plan is in place, results should be
disseminated throughout the organization in approximately two weeks. The time it
takes to design action plans will vary from organization to organization, but two to
four weeks following the dissemination of results throughout the organization is a
good target. This means that an organization can begin to make progress toward
improving the items found in need of improvement within two to three months
following the commission of the survey. This leaves at least nine months for
improvement to take hold.
Nine months is a sufficient time for improvement to be seen. If the efforts are
effective, a survey one year after the prior survey will show that efforts to improve
have been successful. If the efforts are not effective, conducting another one year after
the previous one will give the organization a chance to alter course before waiting two
years to do so.
There are instances when an organization might choose to repeat at time intervals
other than one year. If an organization's culture is such that results can be
disseminated and acted upon more quickly than the schedule outlined above, a six-
month schedule can be considered. However, this is too quick for most organizations,
as it does not give sufficient time for improvement before the next measurement. It
would be good for us monetarily if all clients went to a six-month timeframe, but we
do not recommend this in the lion's share of circumstances because we feel most
clients will not receive sufficient value from such an aggressive schedule.
An eighteen-month interval may be appropriate in an organization that is slow to act
on the survey results. If six or eight months (or more!) go by before improvement
efforts begin, it will be disheartening to see that little change has taken place after one
year. This does beg the question, however -- "is there something in the processes and
62

culture of the organization that should be improved if it takes this long to implement
change?" In this day and age, competition is fierce and organizations need to be
nimble.
A two-year interval simply is too long for several reasons.
It is such a long length of time that an organization could actually improve in
targeted areas, and then relapse. The subsequent survey then might show no
change, when in fact two changes had taken place -- one positive and one
negative. In such a circumstance, the erroneous conclusion might be that the
efforts to change had no impact.
It can be difficult for an organization to maintain focus for two years. Other
competing priorities will inevitably arise, and it will be easy for some people
to shelve, at least mentally, employee satisfaction improvement programs
when the next measurement is in the distant future.
People move around. In two years you might expect to have many new people
and many people in new positions. The people responsible for implementing
change may no longer be in their old positions. The new people may be
unaware of how they should be contributing to the organization's planned
changes which resulted from the previous employee satisfaction survey.
We recognize that, even though employee satisfaction surveys can pay for
themselves, it can be difficult for some organizations to set aside the funds needed to
complete a program annually. Our recommendation in such circumstances is to
consider a "pulsed" approach, where in the first year and every other report the
organization goes with our (or the equivalent of our) Gold program (with full written
analysis), and in the off years the organization goes with a Silver program (where
there is no written analysis, but there are complete charts and graphs at all appropriate
levels). This saves money, while still enabling an organization to reap the benefits that
come with an annual employee satisfaction measurement program.
63
64
CHAPTER – V ANALYSIS AND INTERPRETATION
ANALYSIS AND INTERPRETATION
1. How were you recruited in this organization?
SL.
NO
OPTION RESPONSE %RESPONSE
A EMPLOYEE REFERRAL 88 88%
B PAPER
ADVERTISEMENT
12 12%
65
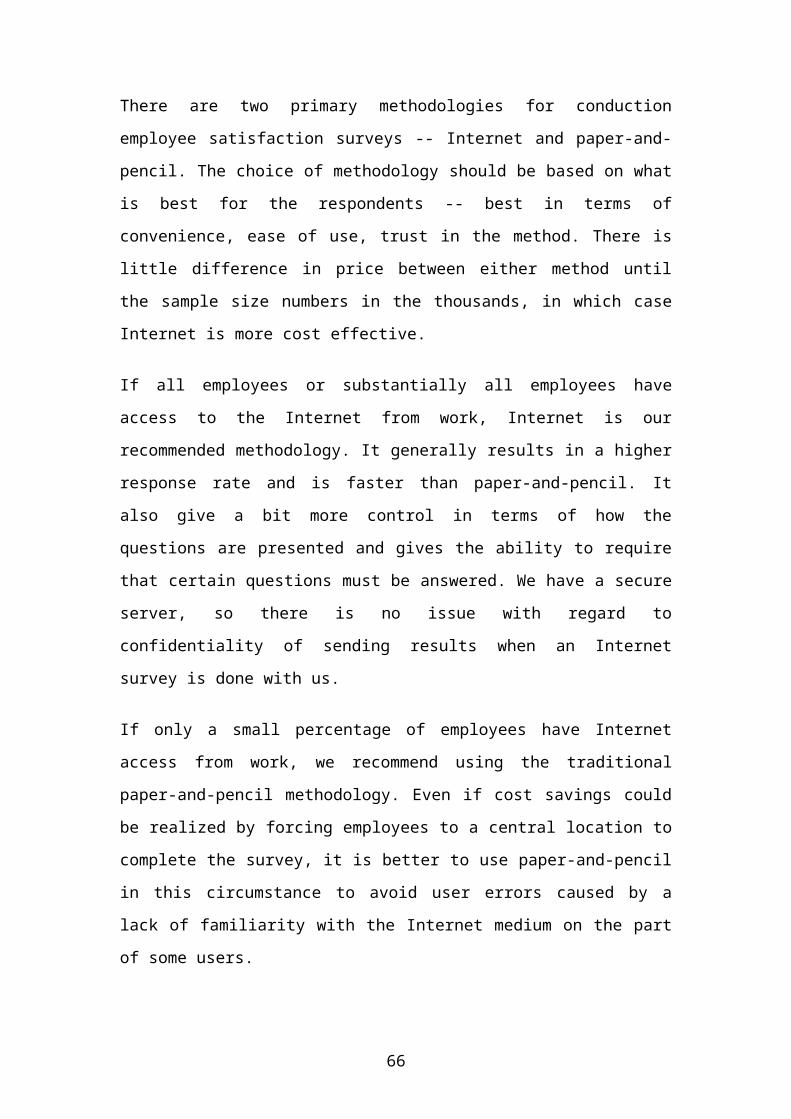
TOTAL 100 100%
NUMBER OF RESPONDENTS
A EMPLOYEE REFERRALB PAPER ADVERTISEMENT
INTERPRETATION
From the above pie chart, it is observed that about 88% of employees
appointed by employee referral and 12% of them appointed by paper
advertisement.
ANALYSIS
From the above table we can see that most of employees are recruited through
employee referral. It shows good employee and management relations in the
organization.
2. Motivation level of the work environment in the organization is
SNO OPTION RESPONSE %RESPONSE
A Satisfactory 65 65%
B Neutral 25 25%
C Dissatisfactory 10 10%
TOTAL 100 100%
66

RESPONSE
A SatisfactoryB Neutral
C Dissatisfactory
INTERPRETATION
From the above pie chart, it is observed that about 65% of the respondents
feel that the working environment is motivating . While 25% are undecided and
10% do not feel that the working environment is motivating.
ANALYSIS
From the above table we can see that the working environment is admiring. It shows
that majority of the employees are satisfied with the working environment of the
organization.
3. Freedom given by the supervisor to do your job is
SNO OPTION RESPONSE %RESPONSE
A Satisfactory 55 55%
B Neutral 25 25%
C Dissatisfactory 20 20%
TOTAL 100 100%
67
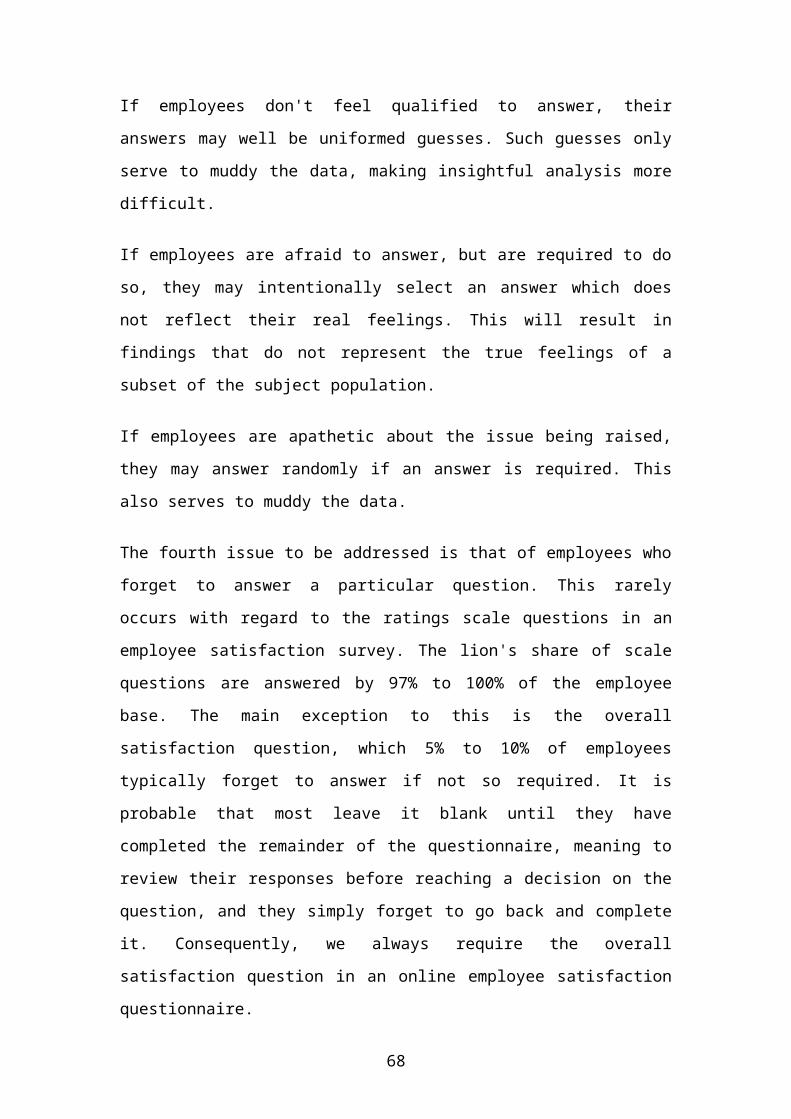
RESPONSE
A SatisfactoryB Neutral
C Dissatisfactory
INTERPRETATION
It was observed that 55% of employees are satisfied with the freedom given to do
their job. While 25% are neutral and 20% are not satisfied.
ANALYSIS
From the above table we can assume that the employees are satisfied with the
superior’s behavior and are given work freedom. Thus the employees are put under
pressure to work by the superiors.
4. Does Employees in this organization regularly share and exchange ideas with
management?
SNO OPTION RESPONSE %RESPONSE
A YES 60 60%
B NO 40 40%
TOTAL 100 100%
68
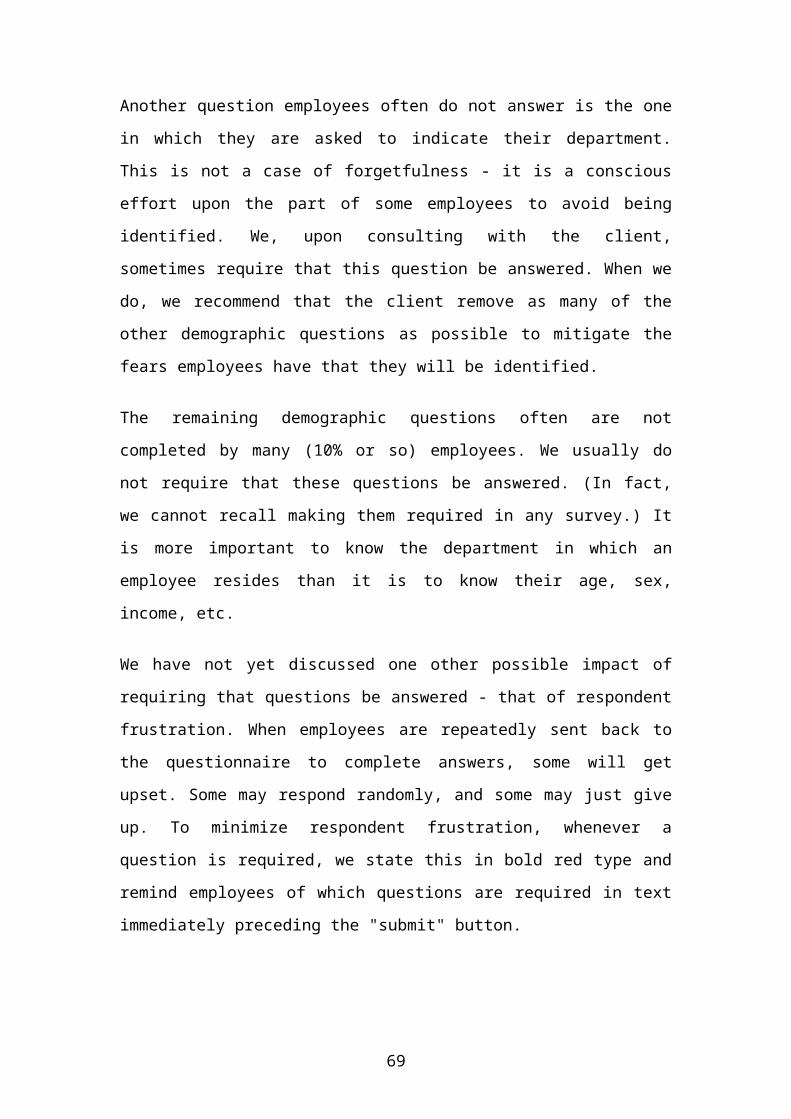
RESPONSE
A YESB NO
INTERPRETATION
It was found that 60% of employees agree that they regularly share and exchange
their ideas with management, while 40% do not agree.
ANALYSIS
From the above table we can assume that more than half of the employees participate
in management decisions by sharing ideas, but management should encourage and see
that all the employees should participate by sharing their views and ideas.
5 The employee relations in this organization are
SNO OPTION RESPONSE %RESPONSE
A Satisfactory 63 63%
B Neutral 17 17%
C Dissatisfactory 20 20%
TOTAL 100 100%
69
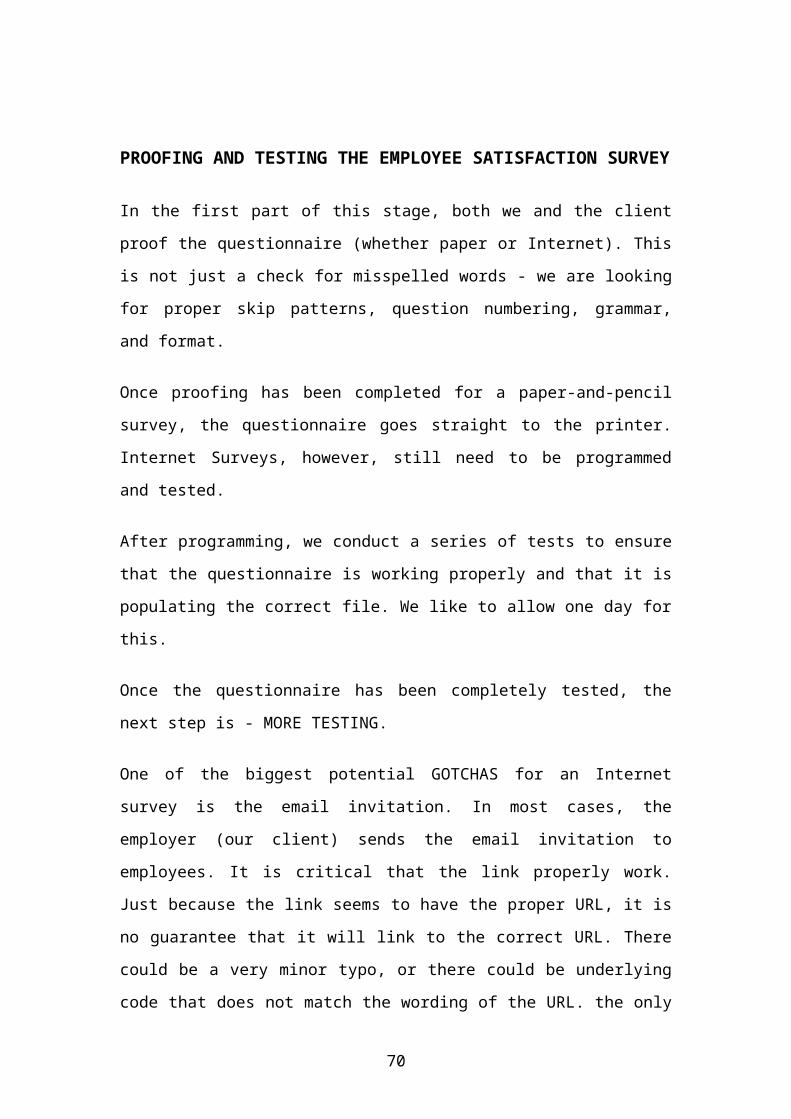
RESPONSE
A SatisfactoryB Neutral
C Dissatisfactory
INTERPRETATION
From the above pie chart its is found that 63% of employees are satisfied with
the employee relations, while 17% of them are neutral and 20% of them expressed
their dissatisfaction
ANALYSIS
Employee relations in the organization are good and it should see that all the
employees are maintaining healthy relations. It is concluded that human relations are
given much priority in the organization.
6. Fairness and respect in the interactions with employees by the manager are
SNO OPTION RESPONSE %RESPONSE
A SATISFACTORY 58 58%
B NEUTRAL 32 32%
C DISSATISFACTORY 10 10%
TOTAL 100 100%
70

RESPONSE
ASATISFACTORY
B NEUTRAL
CDISSATISFACTORY
INTERPRETATION
It was found that 58% of the respondents are satisfied with the fairness and
respect shown by the manager in the interaction with the employees. While 32%
are undecided and 10% of them are not satisfied.
ANALYSIS
We can see that the manager judges the individual performance fairly and interacted
with the employees fairly. Thus the employees are respected in the organization and
are hence motivated.
7 How often managers communicate honestly about the issues affecting employee’s?
SL. NO OPTION RESPONSE %RESPONSE
A VERY FREQUENTLY 1 4%
B FREQUENTLY 6 24%
C SOMETIMES 15 60%
D OCCASIONALLY
RARELY
2 8%
E RARELY 1 4%
71

TOTAL 25 100%
NUMBER OF RESPONDENTS
A VERY FREEQUENTLY
B FREQUENTLY
C SOMETIMES
D OCCASIONALLYRARELY
E RARELY
INTERPRETATION
It was found that 60% of the respondents agree that managers sometimes
communicate honestly about the issues affecting employees. While 24% of them
say frequently , 8% of them say occasionally, 4% have responded saying very
frequently, rarely.
ANALYSIS
From the response of the employees we can see that managers communicate about the
problems affecting employee’s performance and it has to communicate much with
unsatisfied employees so as to counsel them and improve their performance
8. Does the HR communicate changes in policies and procedures in a timely manner?
SL. NO OPTION RESPONSE %RESPONSE
A YES 96 96%
B NO 4 4%
TOTAL 100 100%
72

INTERPRETATION
It was found that 96% of employees feel that HR communications on policies
and procedures are in timely manner 4% of them disagree.
ANALYSISFrom the above table we can assume that most of the employees are satisfied with the
management in communicating the policies. HR manager performs his job effectively
in communicating about changes in policies and procedures.
9. Do your management provides you with continuous feed back to help you
achieve target?
SL. NO OPTION RESPONSE %RESPONSE
A YES 92 92%
B NO 8 8%
TOTAL 100 100%
NUMBER OF RESPONDENTS
YESNO
73
NUMBER OF RESPONDENTS
A YES
B NO
INTERPRETATION
It is found that 92% of the respondents feel management provides them with
continuous feed back to help them to achieve target 8% of them feel that feed
back is not given.
ANALYSIS
From the above table we can assume that most of the employees are satisfied with the
management for motivating them in achieving their targets. Management is helping
the employees constantly in performing their job and responds to the feedback given
by the employees.
10. Does Employees in this organization are recognized for good work performance?
SNO OPTION RESPONSE %RESPONSE
A YES 68 68%
B NO 32 32%
TOTAL 100 100%
74
NO OF RESPONDENTS
A YESB NO
INTERPRETATION
It is found that 68% of employees in this organization agree that they are
recognized for good work performance and 32% of them are saying that they are
not recognized.
ANALYSIS
From the above table we found that the management recognizes the performance of
employees and management should see that all employees should be evaluated about
their performance and give suggestions to excel their performance of unsatisfied
employees.
11. How does the training programs are focused towards employee overall
development?
SNO OPTION RESPONSE %RESPONSE
A Satisfactory 70 70%
B Neutral 22 22%
C Dissatisfactory 8 8%
TOTAL 100 100
75

NO OF RESPONDENTS
A SatisfactoryB Neutral
C Dissatisfactory
INTERPRETATION
It is found from the above pie chart that 70% of employees are satisfied with
the training programs focused towards employee overall development. While 22% of
employees are undecided and 8% are dissatisfied.
ANALYSIS
From the above table we can assume that most of the employees are satisfied with the
training given to them. The training process is effective and it effects the individual
development of performance.
12. With the ethical values of the organization the employees are.
SNO OPTION RESPONSE %RESPONSE
A SATISFIED 60 60%
B NEUTRAL 20 20%
C DISSATISFIED 20 20%
TOTAL 100 100%
76

NO OF RESPONDENTS
A SATISFIEDB NEUTRAL
C DISSATISFIED
INTERPRETATION
It is found that 60% of the employees are satisfied with the ethical values that
are prevailing in the organization. While 20% are undecided and 20% are not
satisfied.
ANALYSIS
From the above table we can assume that management informs the ethical issues to
employee and it has to take care that all employees in the organization should be
aware of ethical issues.
13. How the salary administration and pay polices are in this organization?
SL. NO OPTION RESPONSE %RESPONSE
A EXCELLENT 8 8%
B GOOD 12 12%
C SATISFACTORY 32 32%
D FAIR 44 44%
E POOR 4 4%
77

TOTAL 100 100%
NUMBER OF RESPONDENT
A STRONGLY AGREE
B AGREE
C UNDECIDED
D DISAGREE
E STRONGLY DISAGREE
INTERPRETATION
It is found that 44% of respondents feel that salary administration and pay
Policies are fair. Where as 32% feel that it is satisfactory. 12% feel it is good, 8%
excellent , 4% feel it is poor.
ANALYSIS
We can see that half of the employees are not satisfied and this leads to demotivation.
So the management should take steps to motivate the unsatisfied employees by
correcting their salary administration and pay policies.
14. Does this organization follow performance appraisal system and counseling
methods?
SL. NO OPTION RESPONSE %RESPONSE
A YES 92 92%
B NO 8 8%
TOTAL 100 100%
78

NUMBER OF RESPONDENTS
A YES
B NO
INTERPRETATION
From the above data it is found that about 92% of employees feel that
Organization has both performance appraisal and counseling methods. Whereas about
8% feel that counseling methods are not present.
ANALYSIS
We can clearly understand that the organization’s performance appraisal system and
counseling methods are excellent. Thus the employees are appraised for their
performance and are encouraged.
15. Interest shown by the manager and supervisory staff in developing their
subordinate are
SNO OPTION RESPONSE %RESPONSE
A Satisfactory 70 70%
B Neutral 13 13%
C Dissatisfactory 17 17%
79

TOTAL 100 100%
NO OF RESPONDENTS
A SatisfactoryB Neutral
C Dissatisfactory
INTERPRETATION
70% Of the respondents agree that managers and supervisory staff take key
interest in developing their sub-ordinates . 13% are undecided and 17% are not
satisfied.
ANALYSIS
From the response of the employees it is clear that the organization is taking care that
manager and supervisory staff takes key interest in developing their sub-ordinates.
This is helping the sub-ordinates in giving their best in serving the organization.
16. Safety measures in the organization are.
SNO OPTION RESPONSE %RESPONSE
A Satisfactory 62 62%
B Neutral 23 23%
C Dissatisfactory 15 15%
80

TOTAL 100 100%
NO OF RESPONDENTS
A SatisfactoryB Neutral
C Dissatisfactory
INTERPRETATION
62% of respondents are satisfied with the safety measures taken by the
organizations. While 23% of them are undecided and 15% of them are dissatisfied.
ANALYSIS
From the above table we can assume that the safety measures are given much more
importance by the organization and employees are secured.
17. Are employees provided fair chances while framing organization policies?
SNO OPTION RESPONSE %RESPONSE
A YES 65 65%
B NO 35 35%
81

TOTAL 100 100%
INTERPRETATION
From the above pie chart 65% agree that employees are given chance while
framing out strategies and objectives of the organization. While 35% don not
agree.
ANALYSIS
From the above table it is clearly understood that employees are given chance while
framing out strategies and objectives of the organization and the management
should encourage the remaining employees are given chance while framing out
strategies and objectives of the organization.
18. Do you feel the objectives/targets set by the management are realistic and
satisfactory?
SNO OPTION RESPONSE %RESPONSE
A YES 75 75%
NO OF RESPONDENTS
A YES
B NO
82
B NO 25 25%
TOTAL 100 100%
NO OF RESPONDENTS
A YESB NO
INTERPRETATION
From the above pie chart, 75% of employees are satisfied with the
targets/objectives set while 25% are not satisfied.
ANALYSIS
From the table employees agree that the targets/objectives set are realistic and
management should evaluate the individual performance and set targets and
objectives depending on that evaluation.
19. Are you adaptive to the changes in the organization climate?
SNO OPTION RESPONSE %RESPONSE
A YES 65 65%
B NO 35 35%
83
TOTAL 100 100%
NO OF RESPONDENTS
A YES
B NO
INTERPRETATION
It is found that 65% of employees agree to adapt the changes in the
organizational climate. While 35% disagree.
ANALYSIS
It is found that from the above table employees agree to adapt the changes in the
Organizational climate and the management should take care of the culture changes
and explain why changes are made and its merits to employees and motivate them.
20. Do sufficient training/induction is provided before actual work starts?
SL. NO OPTION RESPONSE %RESPONSE
A YES 92 92%
B NO 8 8%
84
TOTAL 100 100%
NUMBER OF RESPONDENTS
A YES
B NO
INTERPRETATION
It is found that 92% of the respondents feel training is given before the actual
work starts. 8% of them feel that sufficient training is not given.
ANALYSIS
From the above data we can see that the training is given before the actual work
starts. It shows that the employees are satisfied with the training given to them and
made skilful.
85

CHAPTER – VI SUMMARY
FINDINGS
SUGGESTIONS
CONCLUSION
BIBLIOGRAPHY
ANNEXURES
86

SUMMARY
Employee satisfaction is the individual employee’s general attitude towards
the job. It is also an employee’s cognitive and affective evaluation of his or
her job.
It is generally positive in organization, can also be a downer if mediocre
employees stay because they are satisfied with work environment.
It can also be seen within the broader context of the range of issues which
affect an individual's experience of work, or their quality of working life.
Many internal and external factors impact the satisfaction of the employee in
the organization.
Implementation of feed back program regularly helps to maintain employee
satisfaction.
Satisfaction survey is one of the best methods to measure employee
satisfaction.
It gauges the level of employee contentment by asking questions of employees
on a number of fronts that could have to do with training, development,
effective management, lack of discrimination, compensation, and work
environment or peer relationships.
There are five different methods to conduct satisfaction survey, out of which
satisfied/dissatisfied method is followed here.
Results are then analyzed with the help of pie diagrams.
87
FINDINGS
It is found that most of the recruitment done in the organization is through
paper advertisement and through recruitment agencies.
The work environment is motivating for employees to achieve organization
goals.
The supervisor provides freedom to employees to do their job in the way, how
they see the best.
It was found that, Employees does not share/exchange ideas on regular basis.
Employee relations in the organization are good.
Manager shows fairness and respect in the interactions with the employees.
HR communicates changes in policies and procedures in a timely manner.
Workers participation in the organization is satisfactory.
It is observed that managers do not communicate issues effecting employees on
a regular basis.
Training programs are focused towards employee overall development.
Employees are aware of ethical values of the organization.
It was found that organization provides employees with good career
advancement and leadership development program.
Salary administration and pay polices in this organization are fair enough.
It was found that organization follows performance appraisal system and
counseling methods.
Top management is co-operative towards its personal.
Analysis show that employees are not recognized for their work that they have
done.
Safety measures are given much priority in the organization.
Employees are provided fair chances while framing organizational polices.
Objective’s / Targets set by the management are realistic and satisfactory.
SUGGESTIONS
88
Encourage employees to provide employee referrals.
Management should allow the employees to share and exchange/ideas at
regular meetings.
Top management should conduct regular training sessions to managers in order
to improve public relations.
Managers should communicate honestly about the issues effecting employees
on regular basis.
Manager should improve their effectiveness in communicating policies and
procedures in timely manner.
HR should consider updating internal websites with regular policy changes.
Workers participation can be improved effectively by reconsidering or
introducing rewards, incentives which will motivate the employees.
Career development programs should be conducted frequently so that
employees can improve themselves.
Salary administration and pay policies should be re-constructed in order to
satisfy the employees and make their work excellent.
Organization should think of recreational facilities so that employees feel free
from work pressure.
Employee should be given much priority while framing the policies of the
organization.
On-Going and regular training, induction programs should be conducted
regularly before actual work starts.
CONCLUSION
Human Resource Department can provide employees with required freedom to work
as they see the best and if found appropriate. Steps can be taken to implement the
89

policy of freedom towards work. As a regular practice and delegation of authority and
building employees moral should be given much priority to improve efficiency and
productivity in work place.
The efficiency of work can be increased or optimized by providing more congenial
work atmosphere with fully functional equipment and providing challenging task and
responsibility. Can increase productivity by providing right information at right time
at right place by reducing communication hindrances between teams, can increase
efficiency of employees by increasing the team spirit at organization level and to meet
the organizational growth.
All the employees must be made aware of organizational objectives. In this overview
it is the responsibility of the organization to implement management development and
training programs of individuals to make both mentally and physically fit for
rendering present job effectively and also make them capable of shouldering higher
responsibility of the jobs higher positions (Opportunities for promotion). Performance
based promotional polices may motivate the employees to reach the performance
levels and performance appraisal practices can be more widely applied in all the areas
of functioning, for overall development of the organization. The organization can
make optimum utilization of available human capital. Management can make
employees aware of the ethical values of the organization. So they can be more
conscious towards their responsibility. Employees can be provided with adequate
recreational facilities such as play grounds, fitness centers etc. which would bring
sense of belongingness among the employees.
Diagnosis of employee’s strengths and weaknesses would help in planning and
designing training needs to improve strengths and reduce witnesses to fulfill their own
career aspirations. For better interpersonal relationships the superiors should
participate actively in informal get-together and parties, so that their behavior would
be acceptable by the employees at work place. Thus supervisor can inspire
confidence, respect enthusiasm among their subordinates.
ANNEXURE
90

QUESTIONNAIRE
Name : ____________________
Department : ___________________
Age / Gender : ____________________
Designation : ___________________
Income Level : ____________________
Working Since : ___________________
1. How were you recruited in this organization?
a. Employee Referralb. Paper Advertisement
2. Motivation level of the work environment in the organization is
a. Satisfactory
b. Neutral
c. Dissatisfactory
3. Freedom given by the supervisor to do your job is
a. Satisfactory
b. Neutral
c. Dissatisfactory
4. Does Employees in this organization regularly share and exchange ideas with
management?
a. Satisfactory
b. Neutral
c. Dissatisfactory
5 The employee relations in this organization are
a. Satisfactory
b. Neutral
91

c. Dissatisfactory
6. Fairness and respect in the interactions with employees by the manager are
a. Satisfactory
b. Neutral
c. Dissatisfactory
7 How often managers communicate honestly about the issues affecting employee’s?
a. Frequently
b. Sometimes
c. Rarely
8. Does the HR communicate changes in policies and procedures in a timely manner?
a. YES
b. NO
9. Do Your management provides you with continuous feed back to help you
achieve target?
a. YES
b. NO
10. Does Employees in this organization are recognized for good work performance?
a. YES
b. NO
11. How does the training programs are focused towards employee overall
development?
a. Satisfactory
b. Neutral
c. Dissatisfactory
12. With the ethical values of the organization the employees are.
a. Satisfactory
92
b. Neutral
c. Dissatisfactory
13. How the salary administration and pay polices are in this organization?
a. Satisfactory
b. Neutral
c. Dissatisfactory
14. Does this organization follow performance appraisal system and counseling
methods?
a. YES
b. NO
15. Interest shown by the manager and supervisory staff in developing their
subordinate are
a. Satisfactory
b. Neutral
c. Dissatisfactory
16. Safety measures in the organization are.
a. Satisfactory
b. Neutral
c. Dissatisfactory
17. Are employees provided fair chances while framing organization policies?
a. YES
b. NO
18. Do you feel the objectives/targets set by the management are realistic and
satisfactory?
a. YES
93

b. NO
19. Are you adaptive to the changes in the organization climate?
a. YES
b. NO
20. Do sufficient training/induction is provided before actual work starts?
a. YES
b. NO
BIBLIOGRAPHY
Books referred:
94

Human Resource Management: V.S.P.Rao, P.Jyothi, P.Subba Rao, Himalaya
publishing company.
Personnel management: K.Ashwathappa, A.Shankaraiah
Journals:
ICFAI- Journal of organizational behavior
ICFAI- Introduction to management
Websites:
www.naukrihub.com
www.cmrshoppingmall.com
www.hr-webs.com/cgi-local/q.cgi
95