Embed Size (px)
Citation preview

SOUTHERN NEVADA REAL ESTATE REPORT 2014 4th Quarter • Release date May 21, 2015 • IN PARTNERSHIP WITH
CONTENTS
Executive Summary 1
Southern Nevada Economic Situation 2 Household Sector 5 Tourism & Hospi tal i ty Industry
Residential Trends 7 Exis t ing Home Sales 11 Property Management Market 12 Foreclosure Si tuat ion
Commercial Trends 13 Industr ia l Market 14 Office Market 15 Retai l Market 16 Apartment Market
SOUTHERN NEVADA REA L ES TATE REPORT 2014 4 t h Qua r t e r • R e l ea s e da t e May 21, 2015 • Note: Sources on last page1
EXECUTIVE SUMMARYSouthern Nevada’s employment situation showed steady improvement throughout all of 2014. This quarter saw improvements in total number of jobs, the unemployment rate, and average weekly earnings. There were over 4,000 new jobs this quarter, helping bring the unemployment rate down to 6.93 percent. This is the first time the unemployment rate has been below 7 percent in Southern Nevada since 2008. The unemployment rate in Southern Nevada is still not quite at it’s prerecession level as the unemployment rate was typically about 5.5 percent in the early 2000’s. Average weekly earnings only increased a dollar from last quarter and are now at $704.
Spending on local goods has shown much improvement on a year over year basis. Quarterly taxable sales were higher this quarter than they were before the recession and are now at $9.6 billion. Spending on motor vehicles and car parts declined this quarter but are still up $80 million dollars on a year over year basis.
Southern Nevada tourism was also much stronger in 2014 than the previous few years. Visitor volume, conventions held, and transportation services are all up on a year over year basis for Southern Nevada. However, gross gaming revenue declined through most of 2014 and there was only $2.39 billion of gross gaming revenue for Clark County in 2014Q4.
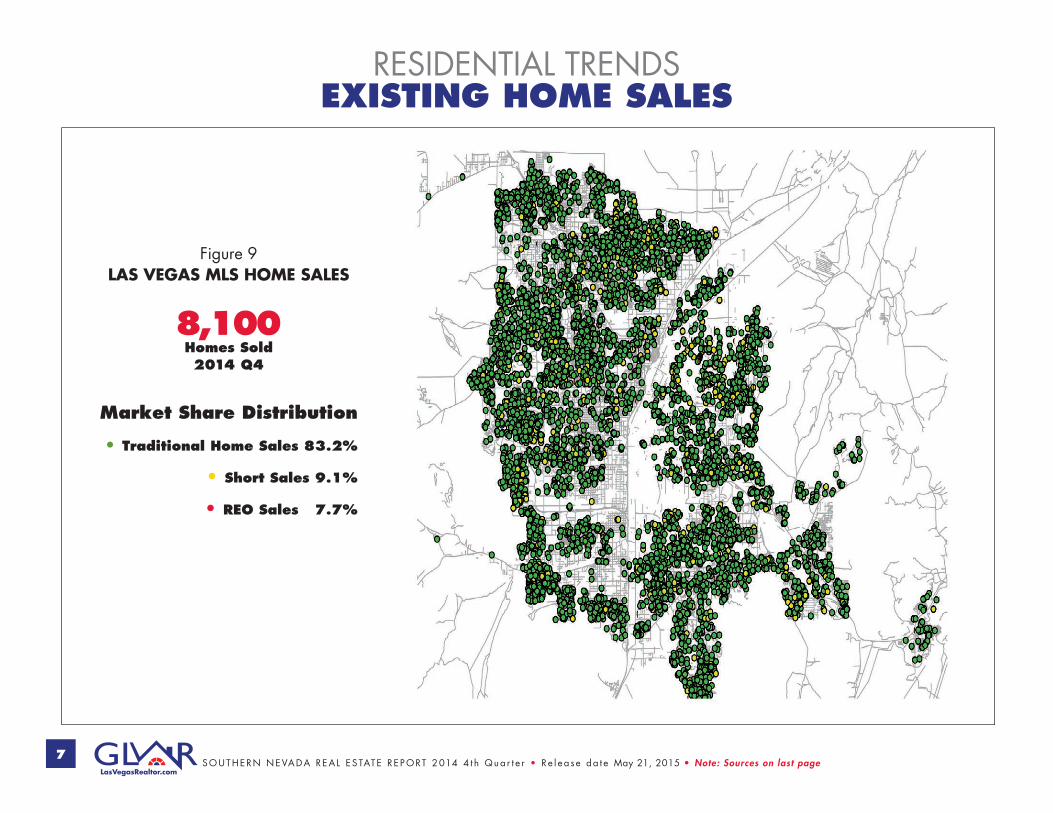
Southern Nevada saw 8,100 homes sold through the MLS system this quarter, 1,300 less than last quarter (9,400). This large decrease in the fourth quarter is not unusual as the fourth quarter typically has the least amount of home sales of the year. Southern Nevada saw about 4,600 less homes sold through the MLS in 2014(35,600) than 2013(40,200).
Southern Nevada saw slightly less distress in the housing market this quarter as traditional home sales now make up an 83.2
percent share of all homes sold through the MLS system. The share of homes being sold as short sales saw a small decrease this quarter as the share of short sales is now at 9.5 percent. The share of homes sold as REO’s increased slightly this quarter and is now at 7.7 percent. Both total REO sales and total short sales are the lowest they have been since 2008.
Home prices continue to steadily increase each quarter, according to the Case-Shiller Home Price Index for the Las Vegas metropolitan area. However, home prices are still well below what they were prior to the recession. The median price of homes sold through the MLS at the end of 2014 was $204,000.
Economic conditions in the commercial market have seen little change this quarter, but significant changes on a year over year basis. Since this time last year, asking rents in the industrial sector and office sector are up 10 percent and 4 percent, respectively. However, asking rents in the retail market are down 15 percent since this time last year. All three sectors have seen an annual decrease in the vacancy rate, and the industrial sector vacancy rate has decreased by nearly 5 percentage points since last year. All three sectors are also experiencing annual growth in employment .
The residential rental market saw a slight decrease in both asking rents and the vacancy rate this quarter. The average asking rent for apartments is now $796 and the vacancy rate is 8.3 percent. Meanwhile, the rental rate for MLS leased homes decreased this quarter to $0.72 per square foot and the residential vacancy rate decreased to 7.8 percent. Nonetheless, both the apartment market and MLS leased homes have shown in improvements in both asking rents and vacancy rates on a year over year basis.
Edward Coulson, Director, Lied Institute for Real Estate StudiesPeter Counts, Graduate Assistant, Lied Institute for Real Estate Studies
Note: Sources on last page • IN PARTNERSH I P W I TH 2
Figu
re 1
PRIV
ATE
JO
BS
(in
thou
sand
s)
Tabl
e 1
JOBS
IN L
AS
VEG
AS
SIN
CE
JULY
201
4
(in
thou
sand
s)
* Total may not add up to the reported private employment due to rounding. This includes workers with multiple jobs. Source: DETR
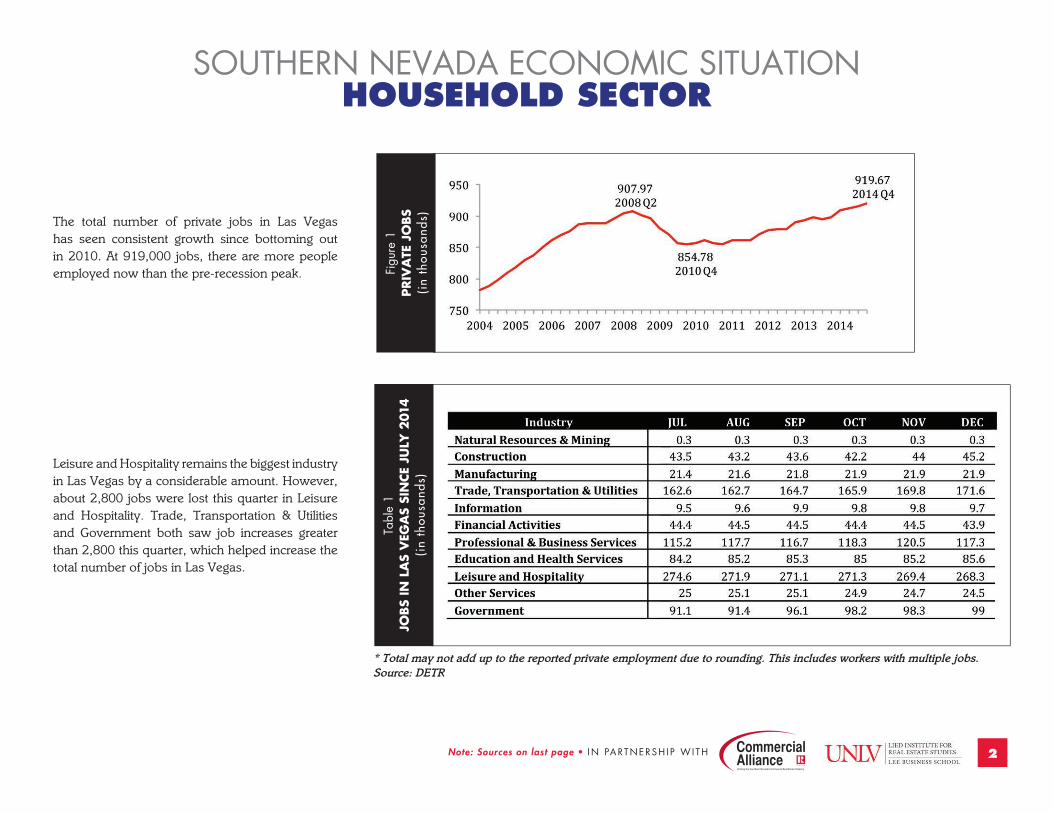
The total number of private jobs in Las Vegas has seen consistent growth since bottoming out in 2010. At 919,000 jobs, there are more people employed now than the pre-recession peak.
Leisure and Hospitality remains the biggest industry in Las Vegas by a considerable amount. However, about 2,800 jobs were lost this quarter in Leisure and Hospitality. Trade, Transportation & Utilities and Government both saw job increases greater than 2,800 this quarter, which helped increase the total number of jobs in Las Vegas.
SOUTHERN NEVADA ECONOMIC SITUATIONHOUSEHOLD SECTOR
3SOUTHERN NEVADA REA L ES TATE REPORT 2014 4 t h Qua r t e r • R e l ea s e da t e May 21, 2015 • Note: Sources on last page
SOUTHERN NEVADA ECONOMIC SITUATIONHOUSEHOLD SECTOR
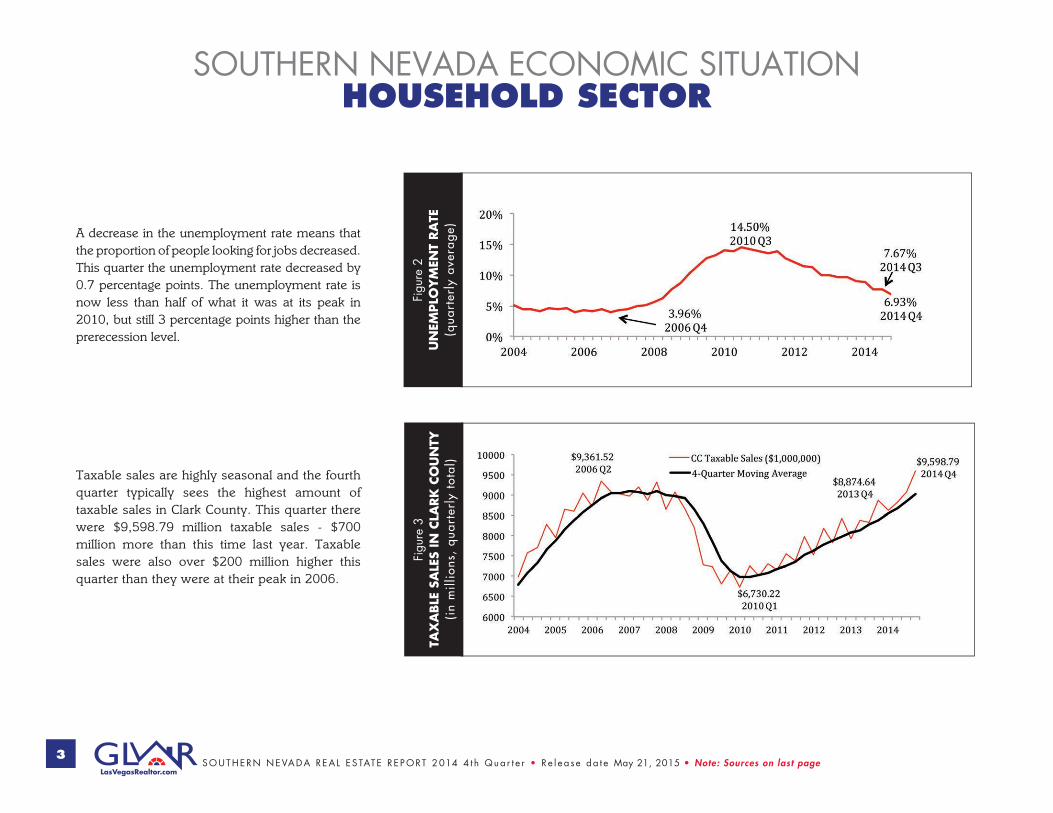
A decrease in the unemployment rate means that the proportion of people looking for jobs decreased. This quarter the unemployment rate decreased by 0.7 percentage points. The unemployment rate is now less than half of what it was at its peak in 2010, but still 3 percentage points higher than the prerecession level.
Taxable sales are highly seasonal and the fourth quarter typically sees the highest amount of taxable sales in Clark County. This quarter there were $9,598.79 million taxable sales - $700 million more than this time last year. Taxable sales were also over $200 million higher this quarter than they were at their peak in 2006.
Figu
re 2
UN
EMPLO
YM
ENT
RA
TE
(qua
rter
ly a
vera
ge)
Figu
re 3
TAX
ABLE
SA
LES
IN C
LARK
CO
UN
TY
(in
mill
ions
, qu
arte
rly
tota
l)
4 Note: Sources on last page • IN PARTNERSH I P W I TH
SOUTHERN NEVADA ECONOMIC SITUATIONHOUSEHOLD SECTOR
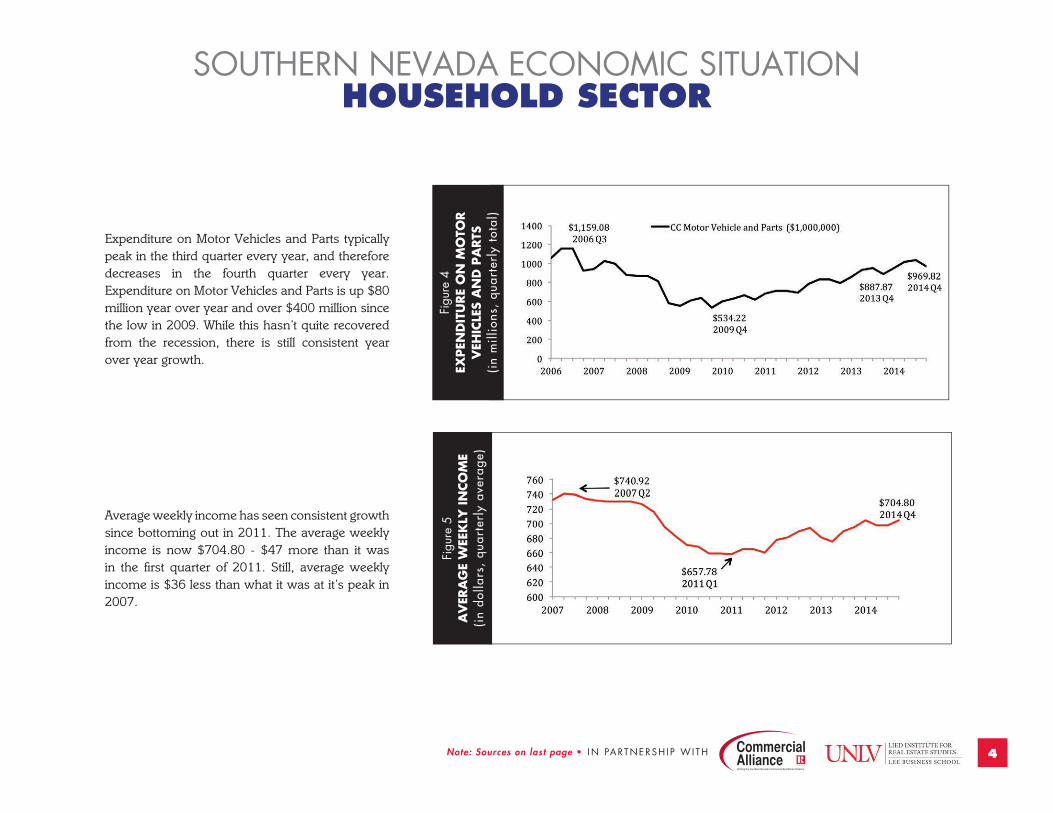
Expenditure on Motor Vehicles and Parts typically peak in the third quarter every year, and therefore decreases in the fourth quarter every year. Expenditure on Motor Vehicles and Parts is up $80 million year over year and over $400 million since the low in 2009. While this hasn’t quite recovered from the recession, there is still consistent year over year growth.
Average weekly income has seen consistent growth since bottoming out in 2011. The average weekly income is now $704.80 - $47 more than it was in the first quarter of 2011. Still, average weekly income is $36 less than what it was at it’s peak in 2007.
Figu
re 4
EXPEN
DIT
URE
ON
MO
TOR
VEH
ICLE
S A
ND
PA
RTS
(i
n m
illio
ns,
quar
terl
y to
tal)
Figu
re 5
AV
ERA
GE
WEE
KLY
IN
CO
ME
(in
dolla
rs,
quar
terl
y av
erag
e)
SOUTHERN NEVADA REA L ES TATE REPORT 2014 4 t h Qua r t e r • R e l ea s e da t e May 21, 2015 • Note: Sources on last page5
SOUTHERN NEVADA ECONOMIC SITUATIONTOURISM & HOSPITALITY INDUSTRY
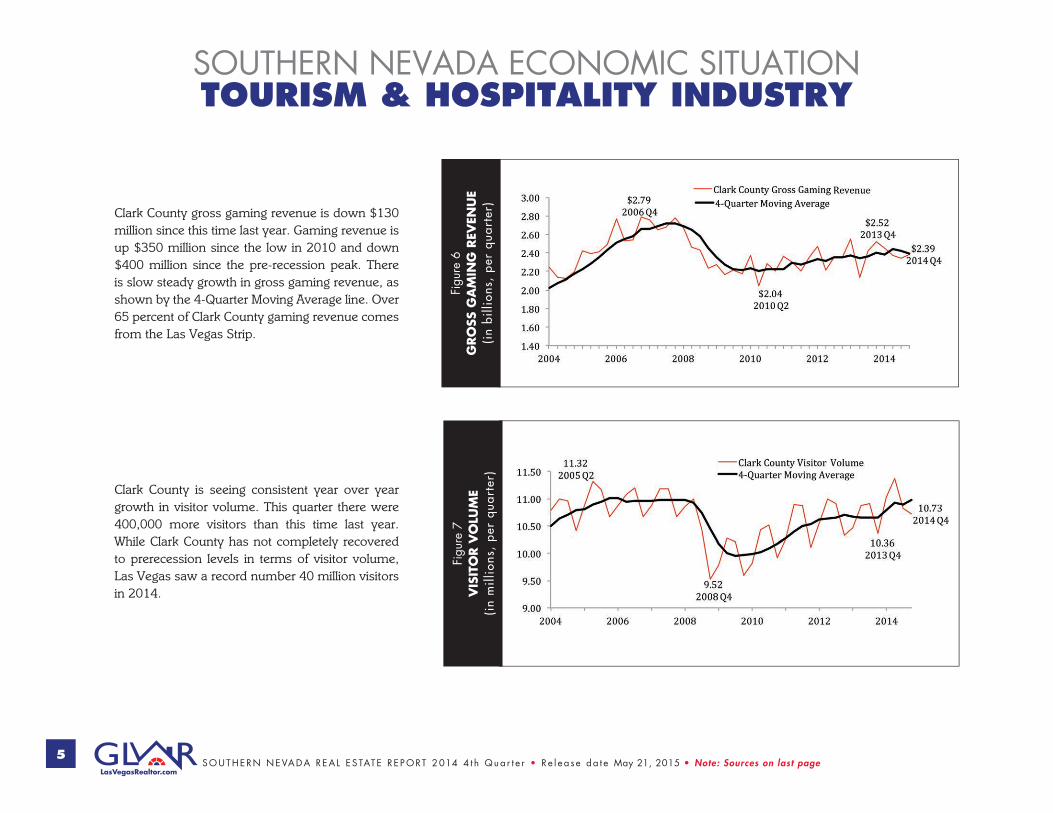
Clark County gross gaming revenue is down $130 million since this time last year. Gaming revenue is up $350 million since the low in 2010 and down $400 million since the pre-recession peak. There is slow steady growth in gross gaming revenue, as shown by the 4-Quarter Moving Average line. Over 65 percent of Clark County gaming revenue comes from the Las Vegas Strip.
Clark County is seeing consistent year over year growth in visitor volume. This quarter there were 400,000 more visitors than this time last year. While Clark County has not completely recovered to prerecession levels in terms of visitor volume, Las Vegas saw a record number 40 million visitors in 2014.
Figu
re 6
GRO
SS G
AM
ING
REV
ENU
E (i
n bi
llion
s, p
er q
uart
er)
Figu
re 7
VIS
ITO
R V
OLU
ME
(in
mill
ions
, pe
r qu
arte
r)
Note: Sources on last page • IN PARTNERSH I P W I TH 6
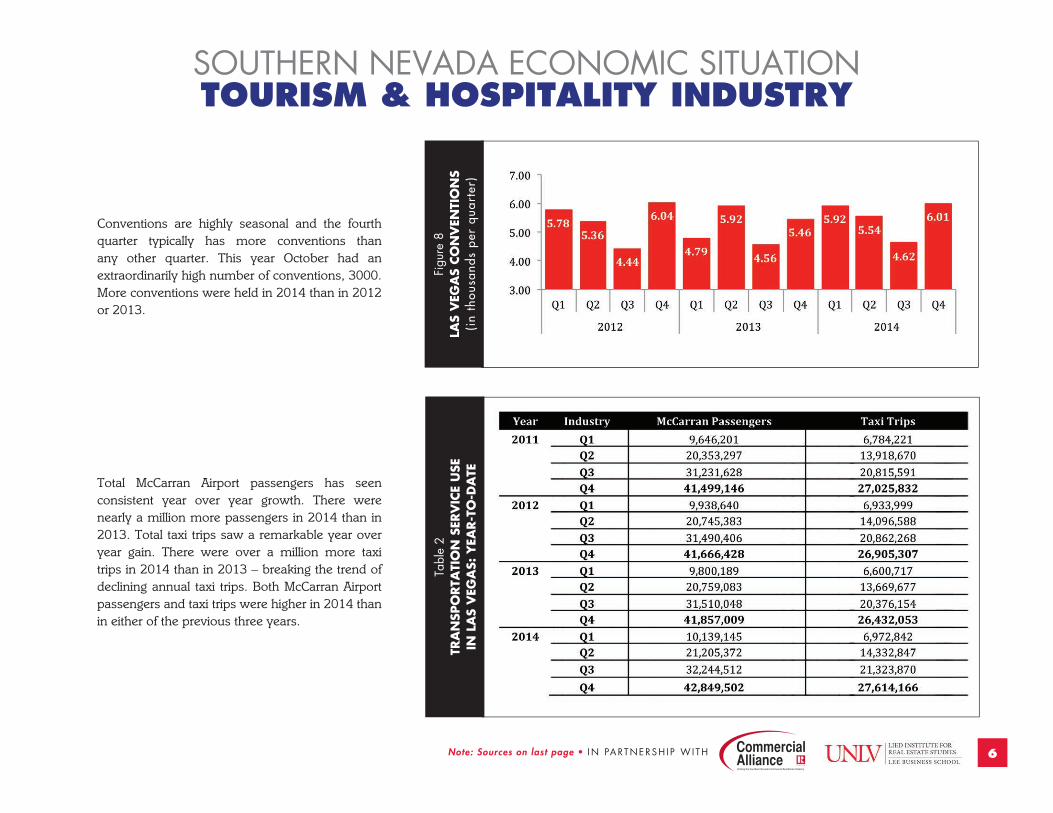
Conventions are highly seasonal and the fourth quarter typically has more conventions than any other quarter. This year October had an extraordinarily high number of conventions, 3000. More conventions were held in 2014 than in 2012 or 2013.
Total McCarran Airport passengers has seen consistent year over year growth. There were nearly a million more passengers in 2014 than in 2013. Total taxi trips saw a remarkable year over year gain. There were over a million more taxi trips in 2014 than in 2013 – breaking the trend of declining annual taxi trips. Both McCarran Airport passengers and taxi trips were higher in 2014 than in either of the previous three years.
Figu
re 8
LAS
VEG
AS
CO
NV
ENTI
ON
S (i
n th
ousa
nds
per
quar
ter)
Tabl
e 2
TRA
NSP
ORTA
TIO
N S
ERV
ICE
USE
IN
LA
S V
EGA
S: Y
EAR-T
O-D
ATE
SOUTHERN NEVADA ECONOMIC SITUATIONTOURISM & HOSPITALITY INDUSTRY
SOUTHERN NEVADA REA L ES TATE REPORT 2014 4 t h Qua r t e r • R e l ea s e da t e May 21, 2015 • Note: Sources on last page7
RESIDENTIAL TRENDSEXISTING HOME SALES
Figure 9 LAS VEGAS MLS HOME SALES
8,100Homes Sold2014 Q4
Market Share Distribution
• Traditional Home Sales 83.2%
• Short Sales 9.1%
• REO Sales 7.7%
Note: Sources on last page • IN PARTNERSH I P W I TH 8
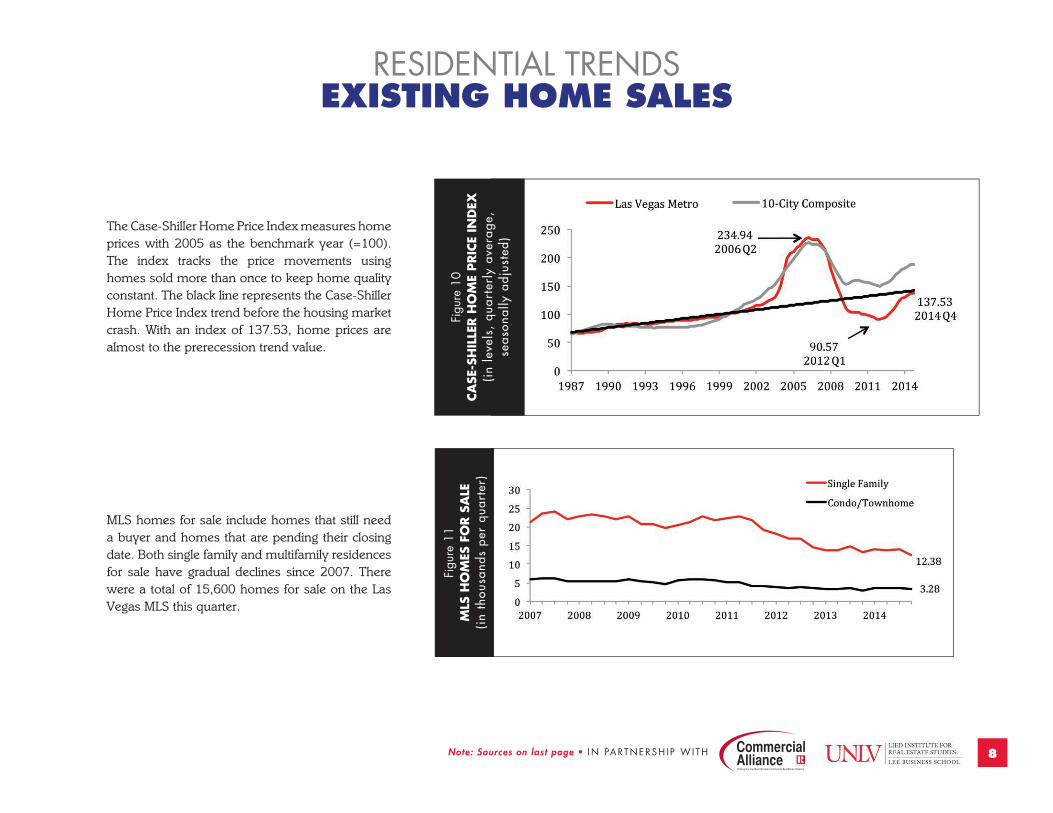
The Case-Shiller Home Price Index measures home prices with 2005 as the benchmark year (=100). The index tracks the price movements using homes sold more than once to keep home quality constant. The black line represents the Case-Shiller Home Price Index trend before the housing market crash. With an index of 137.53, home prices are almost to the prerecession trend value.
MLS homes for sale include homes that still need a buyer and homes that are pending their closing date. Both single family and multifamily residences for sale have gradual declines since 2007. There were a total of 15,600 homes for sale on the Las Vegas MLS this quarter.
Figu
re 1
0CA
SE-S
HIL
LER H
OM
E PRIC
E IN
DEX
(i
n le
vels
, qu
arte
rly
aver
age,
se
ason
ally
adj
uste
d)
Figu
re 1
1M
LS H
OM
ES F
OR S
ALE
(i
n th
ousa
nds
per
quar
ter)
RESIDENTIAL TRENDSEXISTING HOME SALES
SOUTHERN NEVADA REA L ES TATE REPORT 2014 4 t h Qua r t e r • R e l ea s e da t e May 21, 2015 • Note: Sources on last page9
RESIDENTIAL TRENDSEXISTING HOME SALES
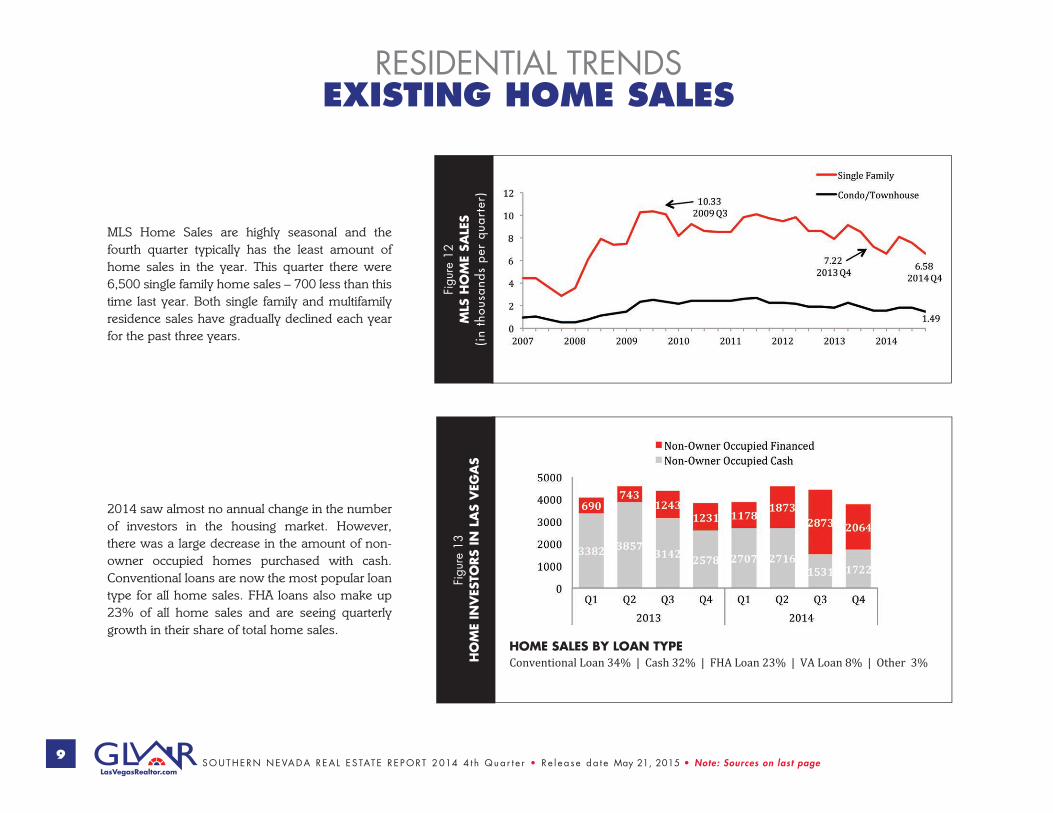
HOME SALES BY LOAN TYPEConventional Loan 34% | Cash 32% | FHA Loan 23% | VA Loan 8% | Other 3%
MLS Home Sales are highly seasonal and the fourth quarter typically has the least amount of home sales in the year. This quarter there were 6,500 single family home sales – 700 less than this time last year. Both single family and multifamily residence sales have gradually declined each year for the past three years.
2014 saw almost no annual change in the number of investors in the housing market. However, there was a large decrease in the amount of non-owner occupied homes purchased with cash. Conventional loans are now the most popular loan type for all home sales. FHA loans also make up 23% of all home sales and are seeing quarterly growth in their share of total home sales.
Figu
re 1
2M
LS H
OM
E SA
LES
(in
thou
sand
s pe
r qu
arte
r)
Figu
re 1
3H
OM
E IN
VES
TORS
IN L
AS
VEG
AS
Note: Sources on last page • IN PARTNERSH I P W I TH 10
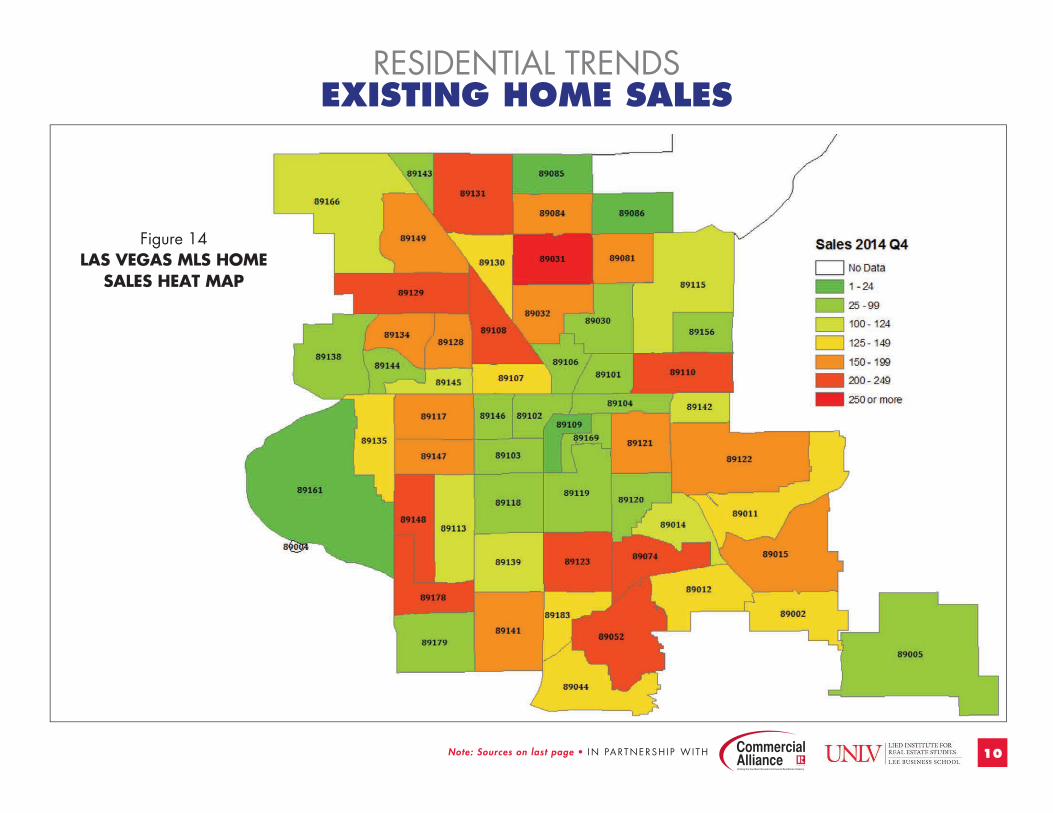
Figure 14 LAS VEGAS MLS HOME
SALES HEAT MAP
RESIDENTIAL TRENDSEXISTING HOME SALES
SOUTHERN NEVADA REA L ES TATE REPORT 2014 4 t h Qua r t e r • R e l ea s e da t e May 21, 2015 • Note: Sources on last page11
RESIDENTIAL TRENDSPROPERTY MANAGEMENT MARKET
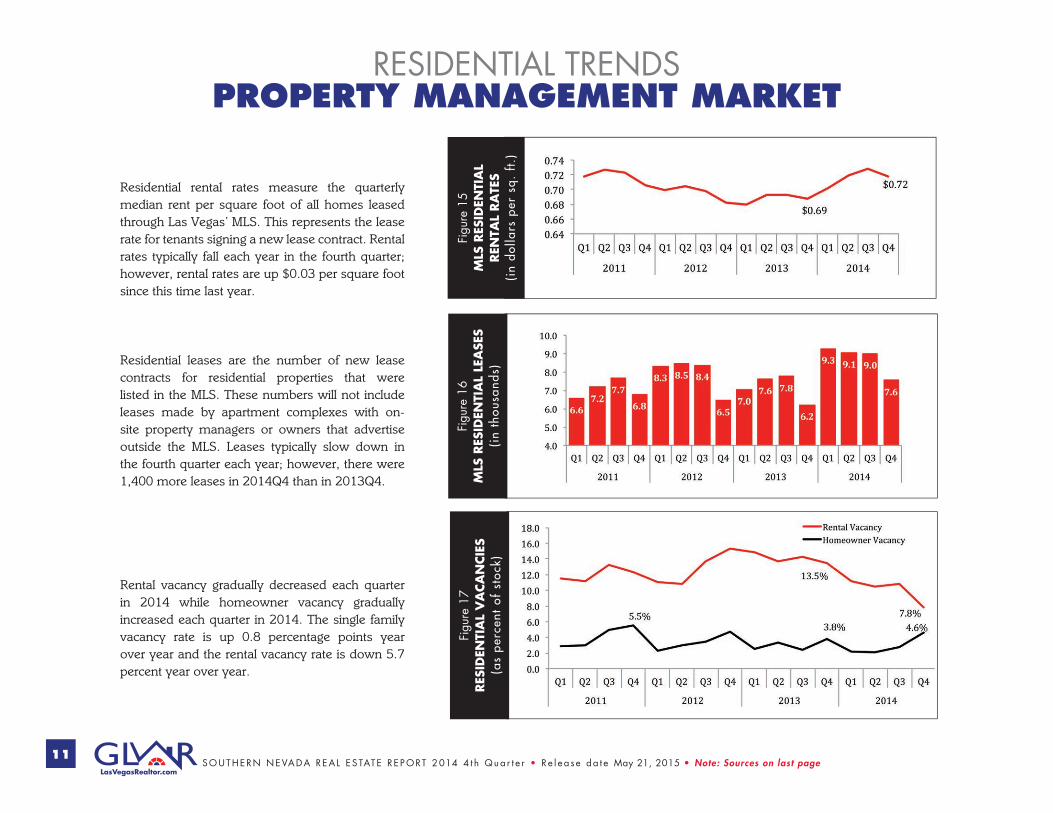
Residential rental rates measure the quarterly median rent per square foot of all homes leased through Las Vegas’ MLS. This represents the lease rate for tenants signing a new lease contract. Rental rates typically fall each year in the fourth quarter; however, rental rates are up $0.03 per square foot since this time last year.
Residential leases are the number of new lease contracts for residential properties that were listed in the MLS. These numbers will not include leases made by apartment complexes with on-site property managers or owners that advertise outside the MLS. Leases typically slow down in the fourth quarter each year; however, there were 1,400 more leases in 2014Q4 than in 2013Q4.
Rental vacancy gradually decreased each quarter in 2014 while homeowner vacancy gradually increased each quarter in 2014. The single family vacancy rate is up 0.8 percentage points year over year and the rental vacancy rate is down 5.7 percent year over year.
Figu
re 1
5M
LS R
ESID
ENTI
AL
REN
TAL
RA
TES
(in
dolla
rs p
er s
q. f
t.)
Figu
re 1
6M
LS R
ESID
ENTI
AL
LEA
SES
(in
thou
sand
s)
Figu
re 1
7RES
IDEN
TIA
L V
ACA
NCIE
S (a
s pe
rcen
t of
sto
ck)
Note: Sources on last page • IN PARTNERSH I P W I TH 12
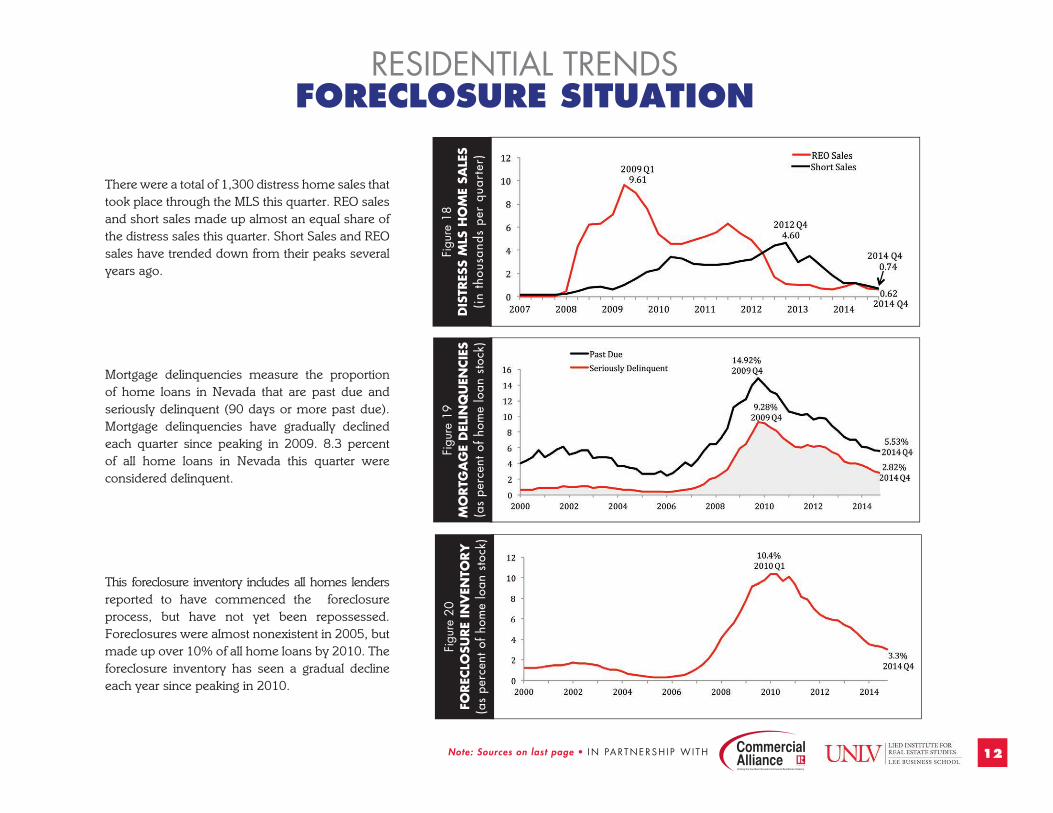
There were a total of 1,300 distress home sales that took place through the MLS this quarter. REO sales and short sales made up almost an equal share of the distress sales this quarter. Short Sales and REO sales have trended down from their peaks several years ago.
Mortgage delinquencies measure the proportion of home loans in Nevada that are past due and seriously delinquent (90 days or more past due). Mortgage delinquencies have gradually declined each quarter since peaking in 2009. 8.3 percent of all home loans in Nevada this quarter were considered delinquent.
This foreclosure inventory includes all homes lenders reported to have commenced the foreclosure process, but have not yet been repossessed. Foreclosures were almost nonexistent in 2005, but made up over 10% of all home loans by 2010. The foreclosure inventory has seen a gradual decline each year since peaking in 2010.
Figu
re 1
8D
ISTR
ESS
MLS
HO
ME
SALE
S (i
n th
ousa
nds
per
quar
ter)
Figu
re 1
9M
ORTG
AG
E D
ELIN
QU
ENCIE
S (a
s pe
rcen
t of
hom
e lo
an s
tock
)
Figu
re 2
0FO
REC
LOSU
RE
INV
ENTO
RY
(a
s pe
rcen
t of
hom
e lo
an s
tock
)
RESIDENTIAL TRENDSFORECLOSURE SITUATION
SOUTHERN NEVADA REA L ES TATE REPORT 2014 4 t h Qua r t e r • R e l ea s e da t e May 21, 2015 • Note: Sources on last page13
COMMERCIAL TRENDSINDUSTRIAL MARKET
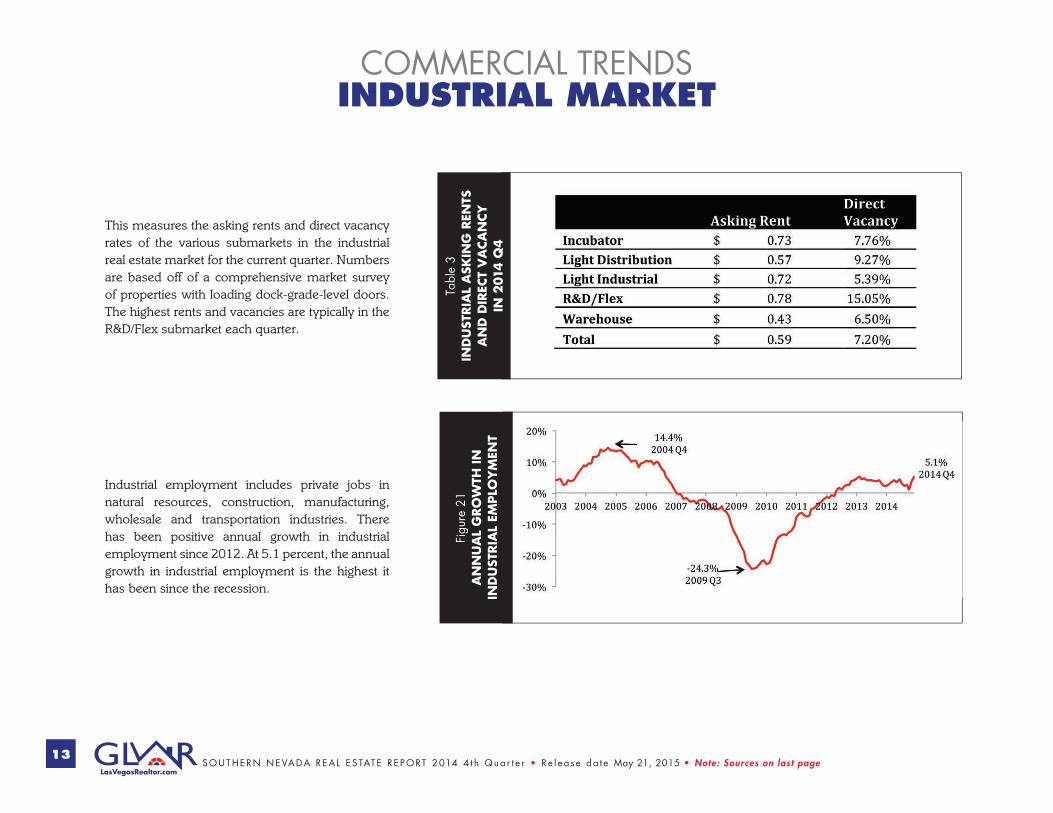
This measures the asking rents and direct vacancy rates of the various submarkets in the industrial real estate market for the current quarter. Numbers are based off of a comprehensive market survey of properties with loading dock-grade-level doors. The highest rents and vacancies are typically in the R&D/Flex submarket each quarter.
Industrial employment includes private jobs in natural resources, construction, manufacturing, wholesale and transportation industries. There has been positive annual growth in industrial employment since 2012. At 5.1 percent, the annual growth in industrial employment is the highest it has been since the recession.
Tabl
e 3
IND
UST
RIA
L A
SKIN
G R
ENTS
A
ND
DIR
ECT
VA
CA
NCY
IN
201
4 Q
4
Figu
re 2
1A
NN
UA
L G
RO
WTH
IN
IN
DU
STRIA
L EM
PLO
YM
ENT
Note: Sources on last page • IN PARTNERSH I P W I TH 14
COMMERCIAL TRENDSOFFICE MARKET
Tabl
e 4
OFF
ICE
ASK
ING
REN
TS A
ND
DIR
ECT
VA
CA
NCY
IN
201
4 Q
4
Figu
re 2
2PER
CEN
T CH
AN
GE
IN
OFF
ICE
EMPLO
YM
ENT
BY
QU
ARTE
R
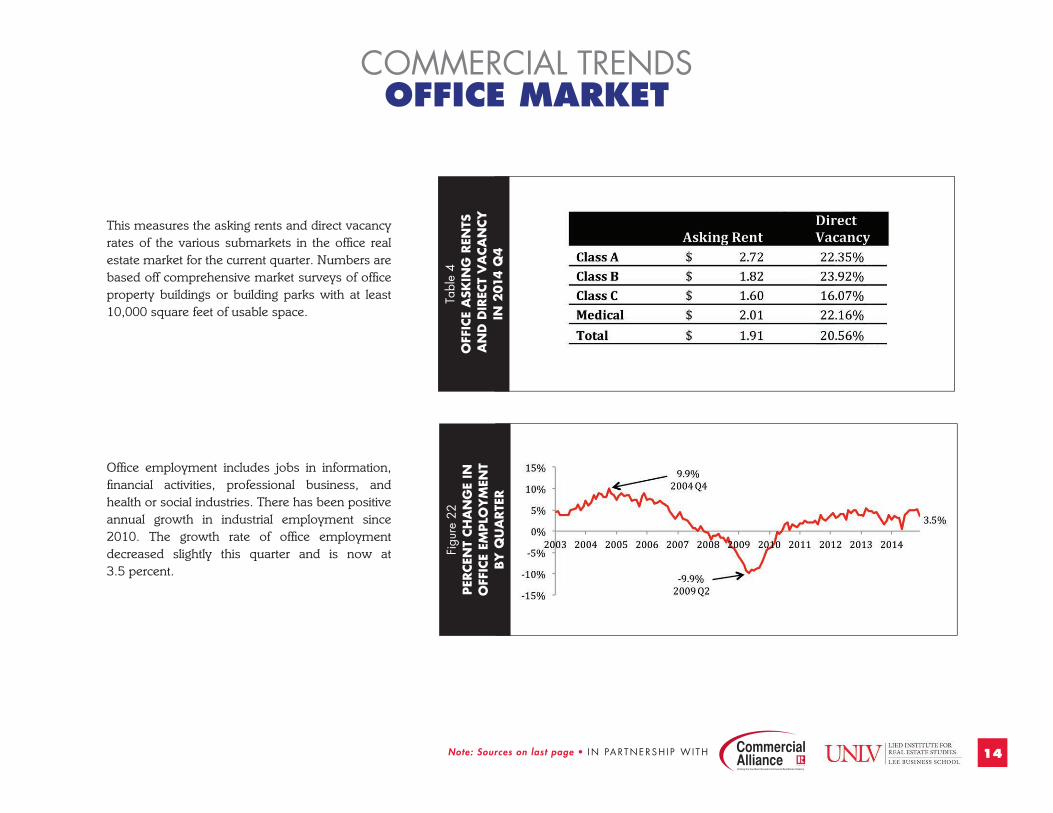
This measures the asking rents and direct vacancy rates of the various submarkets in the office real estate market for the current quarter. Numbers are based off comprehensive market surveys of office property buildings or building parks with at least 10,000 square feet of usable space.
Office employment includes jobs in information, financial activities, professional business, and health or social industries. There has been positive annual growth in industrial employment since 2010. The growth rate of office employment decreased slightly this quarter and is now at 3.5 percent.
SOUTHERN NEVADA REA L ES TATE REPORT 2014 4 t h Qua r t e r • R e l ea s e da t e May 21, 2015 • Note: Sources on last page15
COMMERCIAL TRENDSRETAIL MARKET
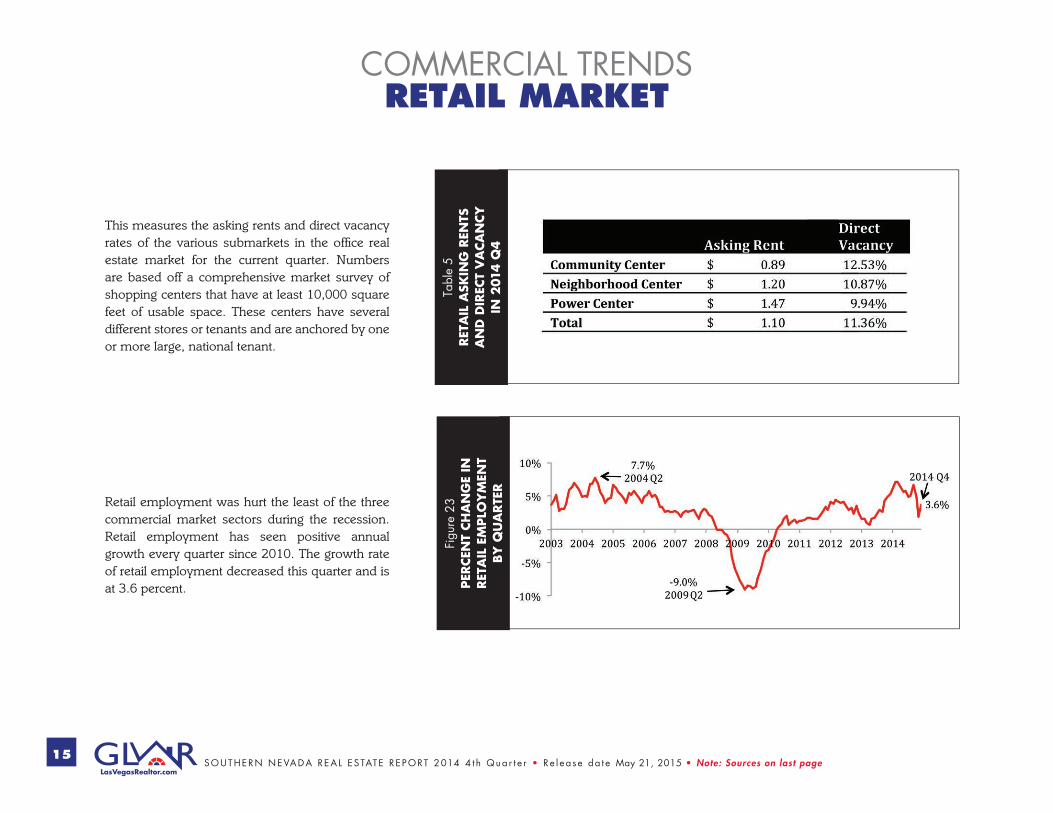
This measures the asking rents and direct vacancy rates of the various submarkets in the office real estate market for the current quarter. Numbers are based off a comprehensive market survey of shopping centers that have at least 10,000 square feet of usable space. These centers have several different stores or tenants and are anchored by one or more large, national tenant.
Retail employment was hurt the least of the three commercial market sectors during the recession. Retail employment has seen positive annual growth every quarter since 2010. The growth rate of retail employment decreased this quarter and is at 3.6 percent.
Tabl
e 5
RET
AIL
ASK
ING
REN
TS
AN
D D
IREC
T V
ACA
NCY
IN 2
014
Q4
Figu
re 2
3PER
CEN
T CH
AN
GE
IN
RET
AIL
EM
PLO
YM
ENT
BY
QU
ARTE
R
Note: Sources on last page • IN PARTNERSH I P W I TH 16
COMMERCIAL TRENDSAPARTMENT MARKET
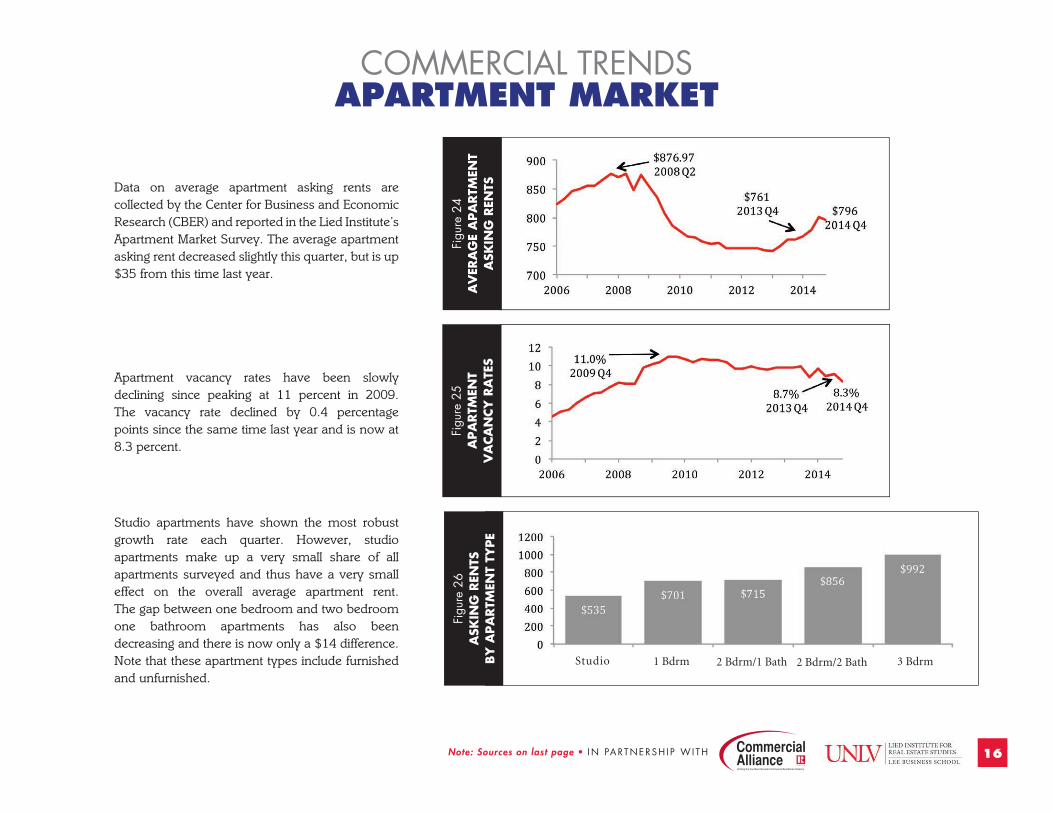
Data on average apartment asking rents are collected by the Center for Business and Economic Research (CBER) and reported in the Lied Institute’s Apartment Market Survey. The average apartment asking rent decreased slightly this quarter, but is up $35 from this time last year.
Apartment vacancy rates have been slowly declining since peaking at 11 percent in 2009. The vacancy rate declined by 0.4 percentage points since the same time last year and is now at 8.3 percent.
Studio apartments have shown the most robust growth rate each quarter. However, studio apartments make up a very small share of all apartments surveyed and thus have a very small effect on the overall average apartment rent. The gap between one bedroom and two bedroom one bathroom apartments has also been decreasing and there is now only a $14 difference. Note that these apartment types include furnished and unfurnished.
Figu
re 2
4A
VER
AG
E A
PA
RTM
ENT
ASK
ING
REN
TS
Figu
re 2
5A
PA
RTM
ENT
VA
CA
NCY
RA
TES
Figu
re 2
6A
SKIN
G R
ENTS
BY
APA
RTM
ENT
TYPE
Studio 1 Bdrm 2 Bdrm/1 Bath 2 Bdrm/2 Bath 3 Bdrm
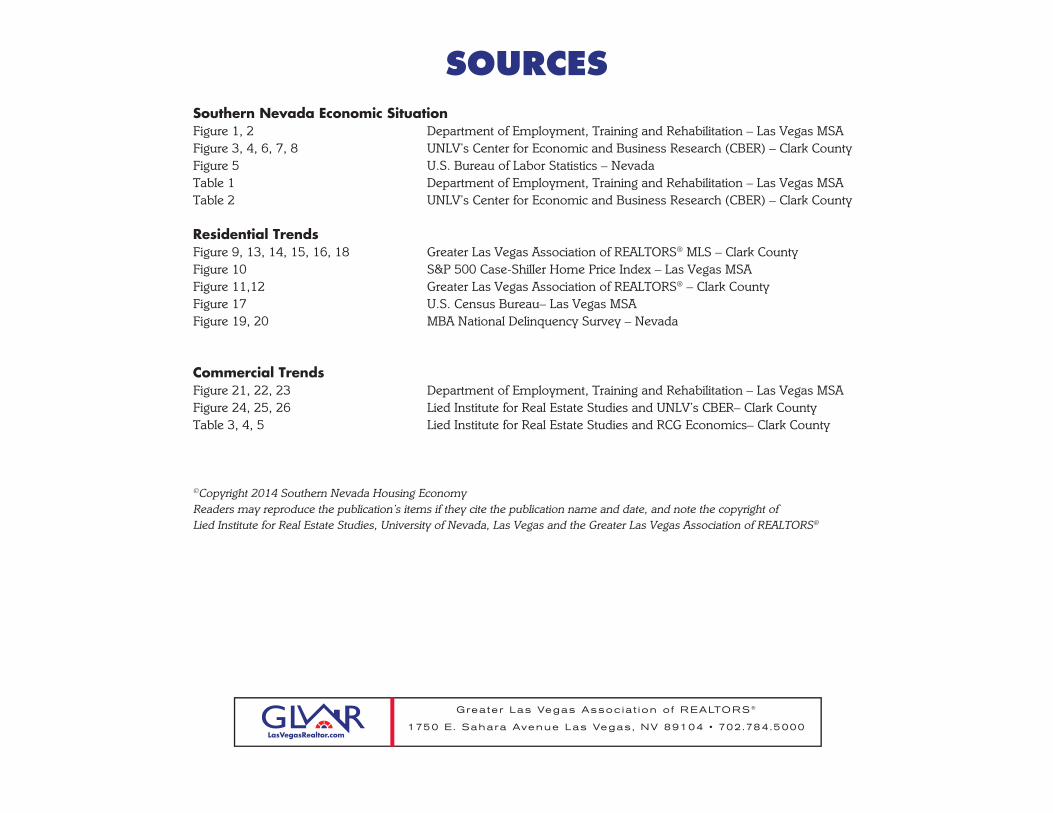
SOURCESSouthern Nevada Economic Situation Figure 1, 2 Department of Employment, Training and Rehabilitation – Las Vegas MSAFigure 3, 4, 6, 7, 8 UNLV’s Center for Economic and Business Research (CBER) – Clark CountyFigure 5 U.S. Bureau of Labor Statistics – NevadaTable 1 Department of Employment, Training and Rehabilitation – Las Vegas MSATable 2 UNLV’s Center for Economic and Business Research (CBER) – Clark County
Residential TrendsFigure 9, 13, 14, 15, 16, 18 Greater Las Vegas Association of REALTORS® MLS – Clark County Figure 10 S&P 500 Case-Shiller Home Price Index – Las Vegas MSAFigure 11,12 Greater Las Vegas Association of REALTORS® – Clark CountyFigure 17 U.S. Census Bureau– Las Vegas MSAFigure 19, 20 MBA National Delinquency Survey – Nevada
Commercial TrendsFigure 21, 22, 23 Department of Employment, Training and Rehabilitation – Las Vegas MSAFigure 24, 25, 26 Lied Institute for Real Estate Studies and UNLV’s CBER– Clark CountyTable 3, 4, 5 Lied Institute for Real Estate Studies and RCG Economics– Clark County
©Copyright 2014 Southern Nevada Housing EconomyReaders may reproduce the publication’s items if they cite the publication name and date, and note the copyright of Lied Institute for Real Estate Studies, University of Nevada, Las Vegas and the Greater Las Vegas Association of REALTORS®
Greater Las Vegas Assoc ia t ion o f R EALTORS ®
1750 E . Sahara Avenue Las Vegas , NV 89104 • 702 .784 .5000