Embed Size (px)
Citation preview

EVIDENCE BASE REPORTADVICE ON AUTOMATED AND ZERO EMISSIONS VEHICLES INFRASTRUCTURE
August 2018
1
CONTENTSEXECUTIVE SUMMARY: 3 TERMS OF REFERENCE: 6 HOW: 6 WHEN: 6 WHAT'S OUT OF SCOPE AND WHY: 7 OUR APPROACH: 8 METHODOLOGY IN BRIEF: 8 CONSULTATION APPROACH: 8DEVELOPING OUR EVIDENCE BASE: 10ASSUMPTIONS: 10LITERATURE REVIEW: 11SCENARIOS: 11TECHNICAL ADVICE: 14WHAT THE EVIDENCE TELLS US: 18 BASE CASE – VICTORIA IN 2046: 18 ELECTRIC AVENUE: 25 PRIVATE DRIVE: 44 FLEET STREET: 69 HYDROGEN HIGHWAY: 90 SLOW LANE: 100 HIGH SPEED: 113 CONSISTENT THEMES ACROSS ALL SCENARIOS: 123GETTING INVOLVED: 128 NEXT STEPS: 129 DEVELOPING OUR ADVICE: 129 APPENDIX A: SUMMARY OF IMPACTS BY SCENARIO: 130 FIGURES: 134 ACKNOWLEDGEMENTS: 136 SOURCES: 138
2
EXECUTIVE SUMMARYAutomated and zero emissions vehicles could be the biggest thing to happen to transport since the car itself.
In October 2017, the Victorian Government asked Infrastructure Victoria to provide advice on what infrastructure is required to pave the way for highly automated and zero emissions vehicles in Victoria.
This paper provides an overview of the evidence Infrastructure Victoria will consider in developing its final advice to the Victorian Government, which will be delivered in October 2018.
While there's a lot of existing local and international information about automated and zero emissions vehicles, much of it is highly uncertain. The data and evidence we have collected and developed aims to address these uncertainties and enable us to provide a well-considered and transparent response to government.
To develop this evidence base, we engaged subject matter experts to conduct technical research and modelling in areas such as transport, energy, ICT and land use, specific to the Victorian context.
We undertook a comprehensive literature review to find out what research had already been published on infrastructure and automated and zero emissions vehicles, and what might be relevant to Victoria. We also consulted with leading jurisdictions to find out what lessons could be learned for Victoria.
The evidence base discussed in this paper considers the seven scenarios outlined in the Future Scenarios report, released in May 2018. The Future Scenarios report outlined seven scenarios to allow us to isolate and test the impacts of different elements of technologies and market models. The scenarios were designed to complement rather than compete with each other, and no one scenario is intended to be the most probable outcome. It's likely that we will see a mix of all of the scenarios on the road in the future.
What we've foundIf automated and zero emissions technologies develop as predicted, there will be clear societal, economic and environmental benefits for all Victorians. How and when the introduction of these vehicles happens will determine the scale of these benefits.
The potential impacts across key areas can be summarised as follows:
Transport networkUnder all scenarios there is an improvement to our road network – up to 91% improvement if we moved to all automated vehicles. This could have significant implications for future road investment, such as deferring or avoiding some additional road construction. Our roads will not likely need to be changed to accommodate driverless vehicles, aside from good
3

quality and regular maintenance and ensuring lines and signs can be `read' by these vehicles.
Access to servicesAutomated and zero emissions vehicles are likely to improve people's access to services such as education, health care and activity centres. Regions that currently have low levels of access to services, which also tend to have high numbers of people on low incomes, have the most to gain from automated vehicles.
HealthAutomated vehicles could reduce road deaths by up to 94% or 400 per year in 2046, while eliminating vehicle exhaust emissions could deliver an annual health dividend to Victorians worth between $270 and $735 million.
Environment and wasteZero emissions vehicles would eliminate all vehicle tailpipe emissions, with the potential reduction in greenhouse gas emissions up to 27 million tonnes in 2046 – the equivalent of around 25% of Victoria's total greenhouse gas emissions in 2015. Waste infrastructure would also need to adapt to new waste streams and patterns, with electric vehicle batteries posing a challenge for the future.
Land useMiddle ring and outer suburbs with good access to the freeway network and arterial roads could become more attractive places to live and work. The way Victoria's neighbourhoods and streets are designed could also be reimagined, particularly if there is a large take-up of shared automated vehicle services. If no-one owns a car, parking could be relegated to fleet depots in industrial areas with up to 96% of parking space in populated areas potentially repurposed for recreation, pedestrian use, cycling or parks.
EnergyIf our vehicle fleet moves towards battery electric, Victoria's electricity consumption will increase by between 23 and 56%, depending on the mix of vehicles and zero emissions technologies. Electricity distribution networks, which carry electricity to local areas, are the most exposed to capacity bottlenecks.ICTOur existing and planned IT infrastructure is largely sufficient to support the introduction of automated vehicles in Victoria, but further investment in connecting vehicles to the world around them could bring more benefits.
EconomicThe economic benefits of automated vehicles could be worth up to $14.9 billion per year to the Victorian economy in 2046.
FinancialWe expect automated and zero emissions vehicles to be cheaper over their lifecycle than a traditional car for the 97% of Victorians who drive fewer than 43,000 kilometres a year. It
4
should also be cheaper for most Victorians to use an on-demand automated vehicle than to own their own car.
What does this mean for Victoria?Automated and zero emissions vehicles represent a potential opportunity for all Victorians to enjoy a better quality of life through improved road safety, cleaner air, better health, less traffic congestion and a stronger economy.
Enabling a future for Victoria with automated and zero emissions vehicles could have significant infrastructure and land use implications. While these technologies and the market models that come with them are still uncertain, this report helps to quantify some of the potential impacts under a range of future scenarios – in many cases for the first time.
We are now inviting feedback from the community and stakeholders on this evidence base to establish if we've got it right and what else we should consider in developing our final advice, which will be delivered to the Victorian Government in October 2018.
5
TERMS OF REFERENCEThe Special Minister of State formally requested that Infrastructure Victoria provide advice on the infrastructure requirements to enable highly automated and zero emissions vehicles to operate in Victoria.
There were three key elements of the request:
Enabling the operation of highly automated vehicles (at Society of Automotive Engineers (SAE) levels 4 and 5).
Responding to the ownership and market models that may emerge from the availability of highly automated vehicles.
Enabling zero emissions vehicles as a high proportion of the Victorian fleet.
We have also been asked to advise on the potential sequencing, timing and scope of infrastructure delivery.
You can find the full terms of reference on our website infrastructurevictoria.com.au/AVadvice.
HowInfrastructure Victoria was asked to undertake comprehensive engagement with industry and other key stakeholders, draw on international comparators and research, and develop our own modelling and analysis to inform our advice.
We were asked to present the advice in two parts:
1. A scenarios report, setting out potential future scenarios for the uptake of automated and zero emissions vehicles in Victoria to form the basis of the advice (published in May 2018).
2. A final report, supported by evidence and analysis, detailing potential infrastructure requirements for automated and zero emissions vehicles. The final report will analyse the current situation, recommend delivery pathways and identify key decision or trigger points for the infrastructure.
WhenThe Future scenarios report was delivered to the Minister in late April 2018 and released in early May 2018, fulfilling the first part of the Minister's request for advice.
This report – our evidence base – will provide the foundation for our final advice, which will be submitted to the Minister in October 2018.
SAE levels of automationThe Society of Automotive Engineers has defined six levels of automation for motor vehicles ranging from no driving automation at level 0 to full driving automation at level 5.
6
Level 0 No automation Level 1 Limited automation Level 2 Partial automation Level 3 Conditional automation Level 4 High automation Level 5 Full automation
At levels 0 to 3, people are required to perform most of the driving and/or to intervene if needed when the vehicle is in control. At levels 4 and 5, a human driver is not needed. The difference between levels 4 and 5 is that at level 5, the vehicle is capable of being driverless anywhere, under any conditions, whereas at level 4, vehicles are limited in where and when they can operate without a driver. Our advice focuses on the infrastructure required to support vehicles operating at levels 4 and 5. The infrastructure required for levels 4 and 5 is expected to be the same, so they are not differentiated in our analysis.
For more details on the levels of automation and their definitions, see our Future scenarios report.
A note on terminologyWe're used to hearing automated and zero emissions vehicles being described as driverless and electric cars in the media, and the terms are often interchangeable. But not always.
For the purposes of this advice:
Vehicles can be cars, trucks, buses or any form of motorised, road-based transportation. Automated trams and trains are not a primary focus of this advice.
Zero emissions vehicles emit no emissions from the tailpipe, charging or fuel source. Currently, vehicles powered by electric batteries and hydrogen fuel cells have the potential to be zero emissions.
Highly or fully automated vehicles at SAE levels 4 and 5 are capable of driving without the involvement of a human driver. They are likely to be cooperative, with connections to other vehicles, infrastructure and the internet.
What's out of scope and whyThe focus of the request for advice is on automated and zero emissions road vehicles. As such, a number of related emerging transport technologies have been scoped out of the advice, including airborne or footpath-based vehicles (e.g. delivery drones) and vehicles operating primarily on private land (e.g. agricultural, mining, industrial or construction machinery).
An in-depth consideration of automated or zero emissions trains and trams was also considered out of scope. Trains and trams operate on fixed rails and would require a different strategic and technical analysis to that of road-based motor vehicles. We have, however, considered the potential effects of automated and zero emissions road vehicles on the public transport system.
7
We have been specifically asked for advice on the infrastructure and land use implications of automated and zero emissions vehicles. Therefore, we do not intend to cover every possible policy issue related to the introduction of these vehicles, such as providing industry support or addressing complex ethical and legal questions related to vehicle accidents. Work on these issues is being undertaken by Australian and state government agencies, such as the National Transport Commission and AustRoads.
OUR APPROACHGiven the uncertainties associated with automated and zero emissions vehicles, our work is driven less by problems that need solving, and more by questions that need answering. We don't know how the future will unfold, but through the evidence we've collected, we are seeking to identify the ways in which it could.
Methodology in briefThe first phase of the project, which was completed in April 2018, focused on the development of potential future scenarios for automated and zero emissions vehicles. The Future scenarios report is available at: infrastructurevictoria.com.au/AVadvice.
The second phase, which is the focus of this report, was to develop an evidence base through modelling and analysis, in addition to seeking out international examples for comparison.
The final phase will be to articulate the advice and recommendations for the Victorian Government on the basis of this evidence. Advice will be provided on the basis of alignment to the strategic objectives identified in Infrastructure Victoria's 30-year strategy. Recommendations will include both decisions and triggers for when they need to be taken.
OCTOBER 2017: REQUEST FOR ADVICE OCTOBER 2017 to APRIL 2018: CONSULTATION APRIL 2018: SCENARIOS REPORT AUGUST 2018: EVIDENCE BASE AUGUST 2018 to OCTOBER 2018: CONSULTATION OCTOBER 2018: FINAL REPORT
Consultation approachInfrastructure Victoria is committed to consultation and creating recommendations through an open, evidence-based and transparent process. The consultation program for this advice includes two main phases.
First phase of consultation – what we didThe first phase ran from November 2017 to March 2018 and commenced with early engagement, where we identified and met with a range of companies, industry groups, academic institutions and other relevant stakeholders to build the basis of the scenarios and the advice. We also called for online feedback from 7 February to 7 March 2018 in response to our target outcomes and key areas of focus. We received 25 submissions from a broad range of
8
stakeholders. To complement the online submission process, we also ran three stakeholder workshops with stakeholders in Melbourne and regional Victoria. These workshops aimed to ensure we heard a wide range of views, encouraged stakeholders from different industries to exchange views, and allowed as many people as possible to provide input to the development of the research program for the advice.
A report that summarises what we heard in the first phase of consultation and our response to new information that was raised is available at: infrastructurevictoria.com.au/AVadvice.
In December 2017 and May 2018, we also conducted a program of direct international engagement to draw on international comparators, as outlined in the terms of reference. Through this program we identified and met with jurisdictions that are leaders in the strategic planning and implementation of automated and zero emissions vehicles. We met with government, private sector, industry and community groups in the United Arab Emirates, the Netherlands, Finland, Sweden, Japan, Singapore, and the state of Arizona in the US. Our discussions with leaders in these jurisdictions helped us to further test and refine our understanding of the issues, evidence and opportunities surrounding automated and zero emissions vehicles. Case studies on these international comparators can be found throughout this report.
Have your sayWe now welcome responses from stakeholders to our evidence base, including this report and our range of technical reports, and a set of questions for response is below.
All of the technical research and analysis that forms our evidence base is available to download on our consultation website, where you can also submit your feedback. We will also run a series of information sessions to present key findings from each of our research streams.
We will accept submissions via our consultation website until 5pm (AEST) on 31 August 2018. Late submissions will not be accepted due to timelines for completing our final advice. To download our evidence base reports or send us a submission, please visit: yoursay.infrastructurevictoria.com.au/vehicles-advice.
Evidence base – questions for response
1. Are our key assumptions correct? If not, why? 2. Is our analysis of the findings correct? If not, why? 3. What further research into automated and/or zero emissions vehicles might be
required beyond what we have already completed or identified? 4. What are the local or international trends government should be monitoring to help
inform future decisions on automated and zero emissions vehicles? 5. What key decisions need to be made about the infrastructure required for
automated and zero emissions vehicles?
9
DEVELOPING OUR EVIDENCE BASEAssumptionsAutomated and zero emissions vehicles come with a high degree of uncertainty. To test the implications of our scenarios, we have made a number of assumptions about how these technologies will evolve, when they will emerge, how much they will cost, and how people will respond to them. Many of these assumptions are deliberately conservative, and have been sensitivity tested in our modelling, where possible.
Major assumptions we've made for the purposes of developing our evidence base include:
Uptake of automated and zero emissions vehicles is linear in each relevant scenario between 2015 and 2046 (or 2031), as this is as accurate (or as flawed) as any other potential assumption, given the low global penetration of these vehicles to date.
Automated vehicles may make vehicle travel more attractive. Researchers have estimated that people could value time in an automated vehicle at between 34 and 70% as much as time spent in a normal car. To test the potential impact of this, we have modelled two approaches to how people value their time (their marginal utility of travel time) for the purposes of our advice. We modelled a marginal utility of travel time (MUTT) factor of 1, which represents no change from today, and a factor of 0.5, which represents a willingness to travel twice as long in an automated vehicle than a non-automated one.
Fuel, battery and hydrogen efficiency and prices remain constant in real terms between now and 2046. While likely inaccurate, suitable evidence to predict exactly how these will change is not available.
Victoria will have net zero greenhouse gas emissions in 2050, as per the Victorian Government's target.
Fares for on-demand fleet vehicles will be approximately 30% of current Uber fares. While the exact business model for on-demand vehicles is uncertain, we have assumed that due to the lower cost of battery electric vehicles and the removal of the driver, fares would be reduced by an equivalent amount in a competitive market. This is in line with international modelling of shared automated vehicles.
The `flow factor' for automated vehicles is 1.75. That is, 1.75 automated vehicles can move through the same point on the road as 1 non-automated vehicle, and so are 75% more efficient. This applies to all roads and intersections, as automated vehicles are assumed to be more efficient due to connectedness both from a standing start and while moving. However, we also tested a `flow factor' of 1.25 in the transport modelling to provide a point of comparison. This assumption is based on analysis by Technische Universität Berlin, suggesting the flow capacity factor for automated vehicles is likely to be between 1.5 and 2.0. We chose 1.75 as the mid-point of this range.
Driverless vehicles will eliminate all of the estimated 94% of vehicle crashes for which human error is the main cause, and are not expected to introduce any new causes of accidents. This assumption is broadly in line with local research, which estimated around 90% of accidents are due to a `minor mistake', such as being distracted or fatigued.
10
We welcome stakeholder views on these underlying assumptions. Please refer to our consultation questions for more information.
Literature reviewWhile automated and zero emissions vehicles are relatively new technologies, there is a significant body of literature from academia, governments, industry, think-tanks and the media on the uncertainties and implications of these emerging technologies. We reviewed available literature to understand current perspectives and identify areas where further investigation was needed.
During the process of key issue identification, we noted that the introduction of automated and zero emissions vehicles comes with uncertainties that may have implications for Victoria around vehicle technologies, market models and regulatory approaches.
Recognising that these uncertainties may have widespread implications, we focused on issues that are likely to be significantly affected by automated and zero emissions vehicles. Some of these issues relate directly to our technical investigations for the advice, while others cut across many technical areas and scenarios. The 10 focus issues of the literature review included land use planning, safety and ethics, governance, human behaviour and infrastructure. Key areas where further investigation on the introduction of zero emissions and automated vehicles to Victoria is needed have also been identified.
To find out more, read the Infrastructure Victoria advice on automated and zero emissions vehicles infrastructure literature review report.
ScenariosThe future could play out in many different ways. Infrastructure planning must embrace and reflect this uncertainty, particularly when considering a rapidly emerging field like automated and zero emissions vehicles. By imagining alternative futures, scenarios can be a powerful tool for testing different variables, preparing for a range of possibilities, determining how government can respond to and influence the path ahead, and identifying decisions and trigger points for action.
Creating our scenariosThe purpose of our advice is to determine how and when land use might change and infrastructure should be deployed in Victoria to support automated and zero emissions vehicles. Therefore, we needed a set of scenarios that would allow us to assess a range of uncertainties and determine the best course of action for the state.
Our scenarios deliberately test extremes to help us isolate and analyse the impact of different variables. They are designed to complement rather than compete with each other. The most probable outcome is likely to be some combination of the scenarios presented, with a mix of different vehicle technologies on the road.
For most of our scenarios, we picked 2046 as the reference year. This year aligns with existing Victorian Government modelling and forecasting approaches, such as the Victorian Integrated Transport Model and the Victoria in Future population forecasts, and is
11
consistent with Infrastructure Victoria's most recent 30-year strategy. It is also consistent with expert predictions that developed countries could see large numbers of these vehicles on the road somewhere between 2020 and 2050.
All of our scenarios are assumed to apply equally to urban, regional and rural areas, including the shared ownership scenarios, though we assume more vehicles are required to serve more dispersed areas. The scenarios also apply across all types of vehicles, with the exception of ownership of buses and heavy freight, where current ownership by public transport operators and commercial freight companies is assumed to continue.
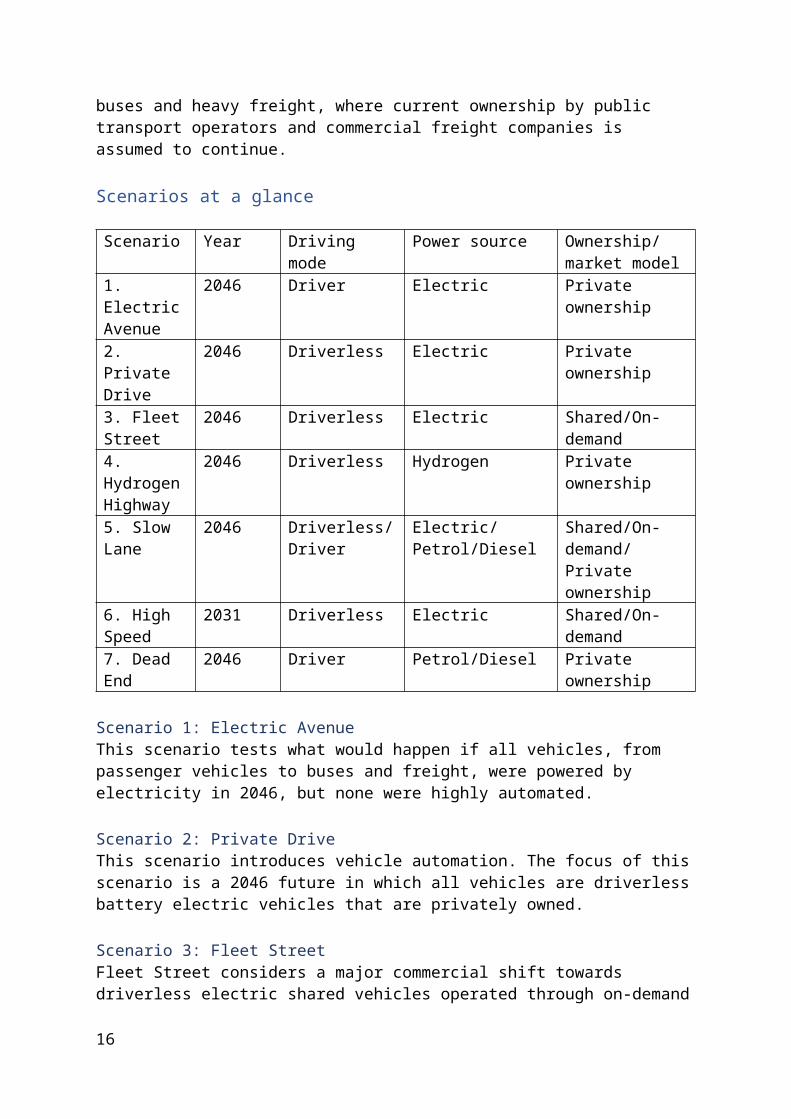
Scenarios at a glance
Scenario Year Driving mode Power source Ownership/market model
1. Electric Avenue
2046 Driver Electric Private ownership
2. Private Drive
2046 Driverless Electric Private ownership
3. Fleet Street
2046 Driverless Electric Shared/On-demand
4. Hydrogen Highway
2046 Driverless Hydrogen Private ownership
5. Slow Lane 2046 Driverless/Driver Electric/Petrol/Diesel Shared/On-demand/Private ownership
6. High Speed
2031 Driverless Electric Shared/On-demand
7. Dead End 2046 Driver Petrol/Diesel Private ownership
Scenario 1: Electric AvenueThis scenario tests what would happen if all vehicles, from passenger vehicles to buses and freight, were powered by electricity in 2046, but none were highly automated.
Scenario 2: Private DriveThis scenario introduces vehicle automation. The focus of this scenario is a 2046 future in which all vehicles are driverless battery electric vehicles that are privately owned.
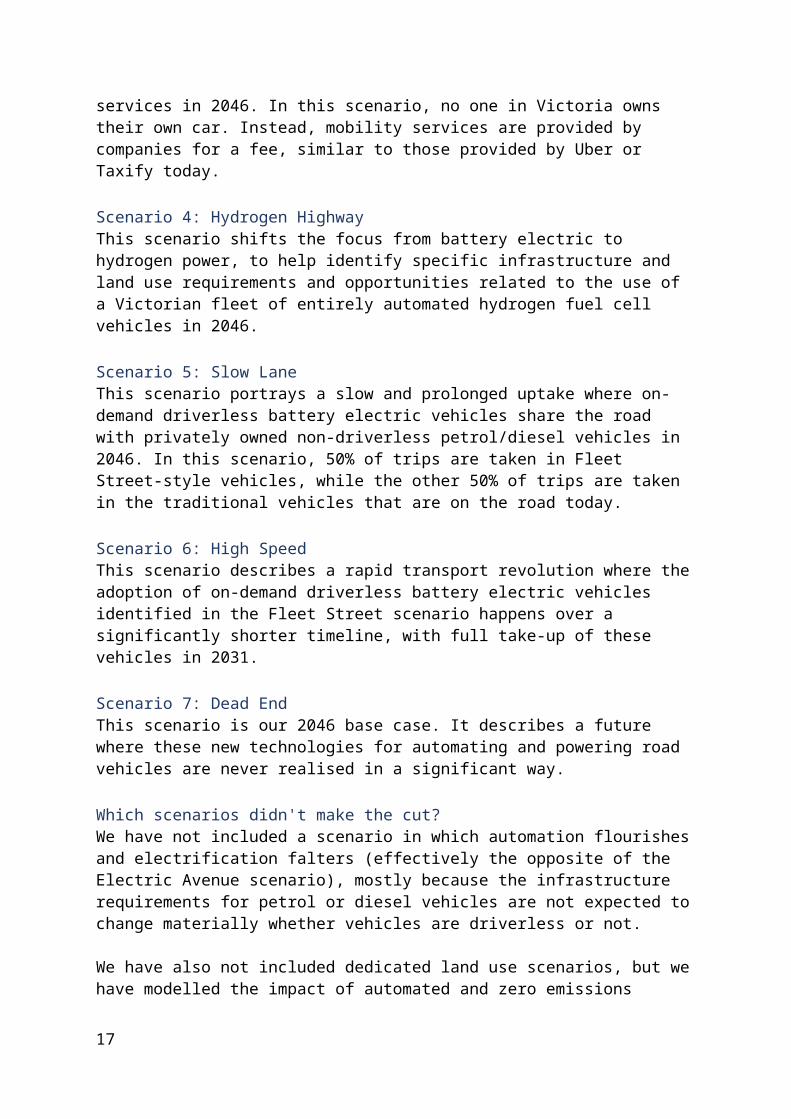
Scenario 3: Fleet StreetFleet Street considers a major commercial shift towards driverless electric shared vehicles operated through on-demand services in 2046. In this scenario, no one in Victoria owns their own car. Instead, mobility services are provided by companies for a fee, similar to those provided by Uber or Taxify today.
12
Scenario 4: Hydrogen HighwayThis scenario shifts the focus from battery electric to hydrogen power, to help identify specific infrastructure and land use requirements and opportunities related to the use of a Victorian fleet of entirely automated hydrogen fuel cell vehicles in 2046.
Scenario 5: Slow LaneThis scenario portrays a slow and prolonged uptake where on-demand driverless battery electric vehicles share the road with privately owned non-driverless petrol/diesel vehicles in 2046. In this scenario, 50% of trips are taken in Fleet Street-style vehicles, while the other 50% of trips are taken in the traditional vehicles that are on the road today.
Scenario 6: High SpeedThis scenario describes a rapid transport revolution where the adoption of on-demand driverless battery electric vehicles identified in the Fleet Street scenario happens over a significantly shorter timeline, with full take-up of these vehicles in 2031.
Scenario 7: Dead EndThis scenario is our 2046 base case. It describes a future where these new technologies for automating and powering road vehicles are never realised in a significant way.
Which scenarios didn't make the cut?We have not included a scenario in which automation flourishes and electrification falters (effectively the opposite of the Electric Avenue scenario), mostly because the infrastructure requirements for petrol or diesel vehicles are not expected to change materially whether vehicles are driverless or not.
We have also not included dedicated land use scenarios, but we have modelled the impact of automated and zero emissions vehicles on the population distribution (e.g. more or less density) for Melbourne.
To read our Future scenarios report visit: infrastructurevictoria.com.au/AVadvice.
What about a mix of scenarios?While each of the scenarios is addressed independently in our analysis, we also explored an option of a `mix of scenarios' in our transport modelling. This included elements of Private Drive, Fleet Street, Electric Avenue and Hydrogen Highway. In this mix, we assumed that shared automated vehicles would be most popular in areas with good public transport, with the popularity diminishing the further one lives from the centre of Melbourne. All the vehicles under this scenario were zero emissions, with freight vehicles using hydrogen and passenger vehicles using electricity for power. We also assumed that a small part of the population would still want to drive their own vehicle. The results are presented in KPMG's transport modelling report.
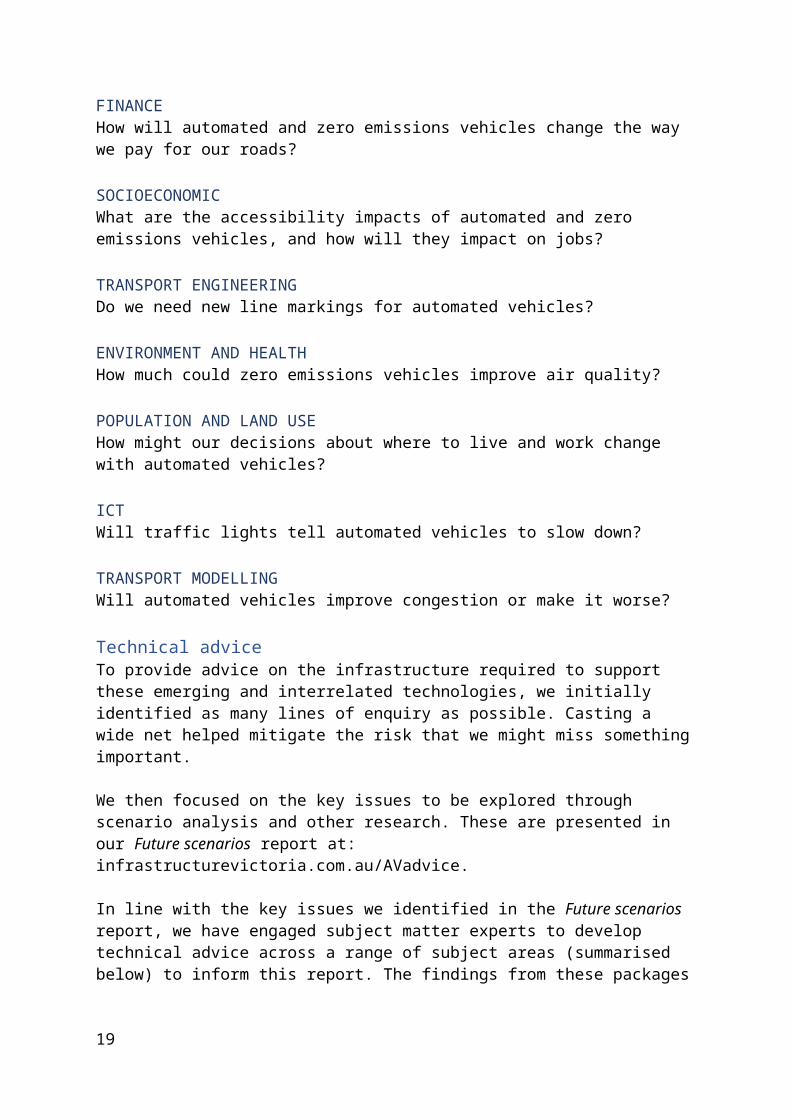
Research focus areasThis image illustrates a high level overview of the packages of technical advice we commissioned to build our evidence base for this advice. A summary of each element of this technical work follows.
13
INTERNATIONAL MARKETS What influence will the decisions of international markets have on which vehicles we can access?
ENERGY When and where will zero emissions vehicles charge or refuel?
URBAN DESIGN How will automated and zero emissions vehicles change the way we designour streetscapes?
FINANCE How will automated and zero emissions vehicles change the way we pay for our roads?
SOCIOECONOMIC What are the accessibility impacts of automated and zero emissions vehicles, and how will they impact on jobs?
TRANSPORT ENGINEERING Do we need new line markings for automated vehicles?
ENVIRONMENT AND HEALTHHow much could zero emissions vehicles improve air quality?
POPULATION AND LAND USE How might our decisions about where to live and work change with automated vehicles?
ICT Will traffic lights tell automated vehicles to slow down?
TRANSPORT MODELLING Will automated vehicles improve congestion or make it worse?
Technical adviceTo provide advice on the infrastructure required to support these emerging and interrelated technologies, we initially identified as many lines of enquiry as possible. Casting a wide net helped mitigate the risk that we might miss something important.
We then focused on the key issues to be explored through scenario analysis and other research. These are presented in our Future scenarios report at: infrastructurevictoria.com.au/AVadvice.
In line with the key issues we identified in the Future scenarios report, we have engaged subject matter experts to develop technical advice across a range of subject areas
14
(summarised below) to inform this report. The findings from these packages are discussed in the following sections and a summary of impacts can be found at Appendix A.
Transport modellingTo understand the impact of automated and zero emissions vehicles on Victoria's transport network in 2031 and 2046, we worked with KPMG to update the Melbourne Activity Based Model (MABM). This transport model differs from traditional transport modelling by focusing on individuals and their response to change. Using MABM we were able to model how people's travel behaviour might change in each of the seven scenarios, and what the flow-on effect of these changes would be on the performance of the transport network.
To find out more about how the model works and to review the detailed results of the modelling, read the KPMG Automated and Zero Emission Vehicle Infrastructure Advice – 2046 Reference Scenario and AZEVIA Model Development and Automated And Zero Emission Vehicle Infrastructure Advice Transport Modelling reports.
Population and land useWe modelled land use changes to understand how people's choices of where to live and work in Melbourne and Victoria could change as a result of the emergence of automated and zero emissions vehicles. The modelling predicts how people and businesses may move as changes to accessibility and travel are brought about by automated and zero emissions vehicles. To find out more about how the model works and to review the detailed results of the modelling, read the SGS Economics & Planning Automated & Zero Emission Vehicle Land Use Scenarios report.
Energy networkTo allow us to understand the likely impacts of automated and zero emissions vehicles on electricity generation, transmission and distribution, we commissioned the development of a model for the Victorian energy network in 2046. The model provides insights into the gap between supply and demand, areas of the network likely to come under stress and opportunities to improve the resilience of the energy network through greater usage of distributed generation and storage.
To find out more about how the model works and to see the detailed results of the modelling, read the KPMG Automated and Zero Emission Vehicle Infrastructure Advice Energy Impacts Modelling report.
ICT infrastructureTo consider the requirements for information and communications technology (ICT) infrastructure, we commissioned work on the ICT and data requirements of automated and zero emissions vehicles, as well as the known pipeline of ICT investment, drawing on local and international information.
To find out more about the results of this work, read the WSP ICT Infrastructure Advice for Automated and Zero Emission Vehicles report.
15
Environment and population healthWe commissioned specialist technical advice on the impact of automated and zero emissions vehicles on vehicle emissions and air quality, active transport and the flow-on impacts on population health. Using the detailed results from the transport modelling, including number of trips, number of vehicles on the road, types of vehicles and speed, this work measures the changes to these in each of our scenarios.
To find out more about the results of the modelling, read the Aurecon AV/ZEV Environmental & Health Impact Assessment report.
Socioeconomic impactsWe set out to understand the social and economic impacts of automated and zero emissions vehicles on Victorians, focusing on how these impacts might differ for people in different income groups and locations. This modelling demonstrates how automated and zero emissions vehicles may affect Victorians' ability to access public transport, education, health care and activity centres, and also provides insights into the impact on jobs, as well as on the Victorian economy overall.
To learn more about the modelling approach and the results, read the Deloitte Access Economics Automated and Zero Emissions Vehicles Infrastructure Advice Socio-economic impact analysis report.
Financial analysisWe undertook financial modelling to identify the nature and scope of potential impacts of automated and zero emissions vehicles on government, and on how they could change the way we value infrastructure projects. This work also assessed the consumer cost of owning these vehicles compared to a traditional vehicle, and to using a shared fleet vehicle.
To review the results of this modelling, read the KPMG Vehicles Advice – financial analysis report.
International market analysisWe commissioned research on trends in emerging technologies and standards in international jurisdictions to better understand the risks and opportunities these technologies present for Victoria, and what might need to happen to enable these technologies to be introduced here.
For more details on the findings of this work, read the L.E.K and Arup Infrastructure Victoria AV/ZEV International Scan report.
Transport engineeringTo understand how automated and zero emissions vehicles will affect Victorian roads, we commissioned research on what road and road corridor construction or design changes will be required, if any. We also sought to understand the impact of automated and zero emissions vehicles on car parking and opportunities to repurpose unused parking space for alternative uses.
16
For more information on the methodology and outcomes of this research, read the Arup Infrastructure Victoria Automated and Zero Emission Vehicles Transport Engineering Advice report.
Urban designWe commissioned urban designers to illustrate the impacts of future vehicles on streets, precincts, neighbourhoods and freeways across Victoria. Building on evidence and research gathered from a number of sources, case studies for key locations across Victoria were developed with specific reference to two of our scenarios: Fleet Street and Slow Lane.
The intention for this work was not to depict the most likely or preferred future state, but rather to show a mix of possible futures and what they could look like.
To find out more about this work and see how automated and zero emissions vehicles could change the design of Victorian streets and precincts, see Urban Circus and Ethos Urban Automated and Zero Emission Vehicles – how they might reshape our streets report.
17

WHAT THE EVIDENCE TELLS US
The Terms of Reference for this advice asked us to frame our analysis through potential future scenarios (detailed in our Future scenarios report).
We have used these scenarios as an analytical tool to isolate and test the impacts of automated and zero emissions vehicles technologies. The scenarios are not intended to represent likely outcomes, but instead provide an opportunity to test the most extreme impacts of automated and zero emissions vehicles. The most likely future could be a combination of some or all scenarios.
Much of the technical analysis we commissioned to form our evidence base was also done on a scenario-by-scenario basis. Most of this analysis is forward looking, and so focuses heavily on fledgling technologies for which limited evidence currently exists. Therefore, the scenario definitions and underlying assumptions are substitutes for real-world observations.
Base case – Victoria in 2046In our Future scenarios report, we described a `Dead End' scenario in 2046. This is the future in which new technologies for automating and powering vehicles stall. In this scenario, automated and zero emissions vehicles don't `take off' in any meaningful way. Current technological trends around vehicle safety and fuel efficiency continue, but the anticipated benefits of automated and zero emissions vehicles do not materialise. In other words, vehicles are still powered by fossil fuels and are still privately owned and driven by people. If this scenario is realised, there is a risk of over-investment in infrastructure to support automated and zero emissions vehicles.
This presents the `no change' pathway and is useful for identifying the opportunity costs for any recommended investments. In much of our modelling work this scenario is also the `base case' for Victoria in 2046, and provides a useful reference point for us to isolate the impacts of each scenario.
Where do Victorians want to live and work?Even without automated and zero emissions vehicles, Victoria will look very different in 2046. The Victoria in Future forecast projects that there will be 64% more people living in Melbourne compared to 2015. Melbourne's population alone is forecast to grow at 1.6% a year between 2015 and 2046 to a total of 7.4 million people, while Victoria's population is forecast to reach 9.4 million.
Over the next 15 years, 42.6% of Melbourne's population growth is forecast to occur within predefined `New Growth Areas'. This is likely to decrease over time, falling to 29.8% of growth over the period 2031 to 2046. At the same time, infill development will provide opportunities for significant population growth within the existing urban footprint. Approximately 9.7% of Melbourne's population growth will occur in the inner city, with half of that growth occurring within the City of Melbourne over the next 15 years.
18
However, jobs are not projected to follow the same pattern as population growth. Jobs growth is forecast to be slightly faster than population growth, at an average of 1.7% a year between 2015 and 2046.
The types of jobs Victorians do are also projected to change, but mostly in line with changes already underway. Between now and 2046, the economy is projected to continue moving away from traditional manufacturing-based sectors to those based on services – health, education, professional and retail.
This transition has major implications for the location of new jobs, as these types of service-based industries tend to congregate around major hubs and population growth areas. Much like today, more than 10% of all jobs in Greater Melbourne will likely be in Melbourne's CBD in 2046, predominantly in knowledge-intensive industries. This means that, with more people living in outer metropolitan areas, people would increasingly need to travel to inner areas to work. However, as Melbourne increases in size, more significant employment hubs are likely to be established outside the central core.
While the forecasts show population growth across regional Victoria, most of this is concentrated in major centres, such as Geelong, Ballarat and Bendigo. Regional Victoria's economy is projected to become more diversified, with more services-based employment, strong growth in knowledge-intensive industries, and a falling share of jobs in services such as hospitality, retail and industrial sectors.
2046
DRIVER PETROL/ DIESEL PRIVATE OWNERSHIP
Key findings
Victorian population of 9.4 million Assumes 25% more road kilometres built and an extended public transport network 37% more car trips than today 81% of trips made by car, 19% by public transport 27 million tonnes of CO2 equivalent from vehicle emissions
An expanded transport networkHow well does Melbourne's transport network operate in 2046? To find out, we worked with KPMG to update MABM to include forecasts for Melbourne's population and the transport network in 2046. After updating the model, KPMG then worked with the Technische Universität Berlin on functionality that allows us to simulate automated vehicles in MABM. With the updated model, we then tested each of our scenarios against the base case.
The strategic infrastructure assumed to be in place in 2046 reflects the reference case that is used by Transport for Victoria. While it is not government policy, it is used consistently as
19
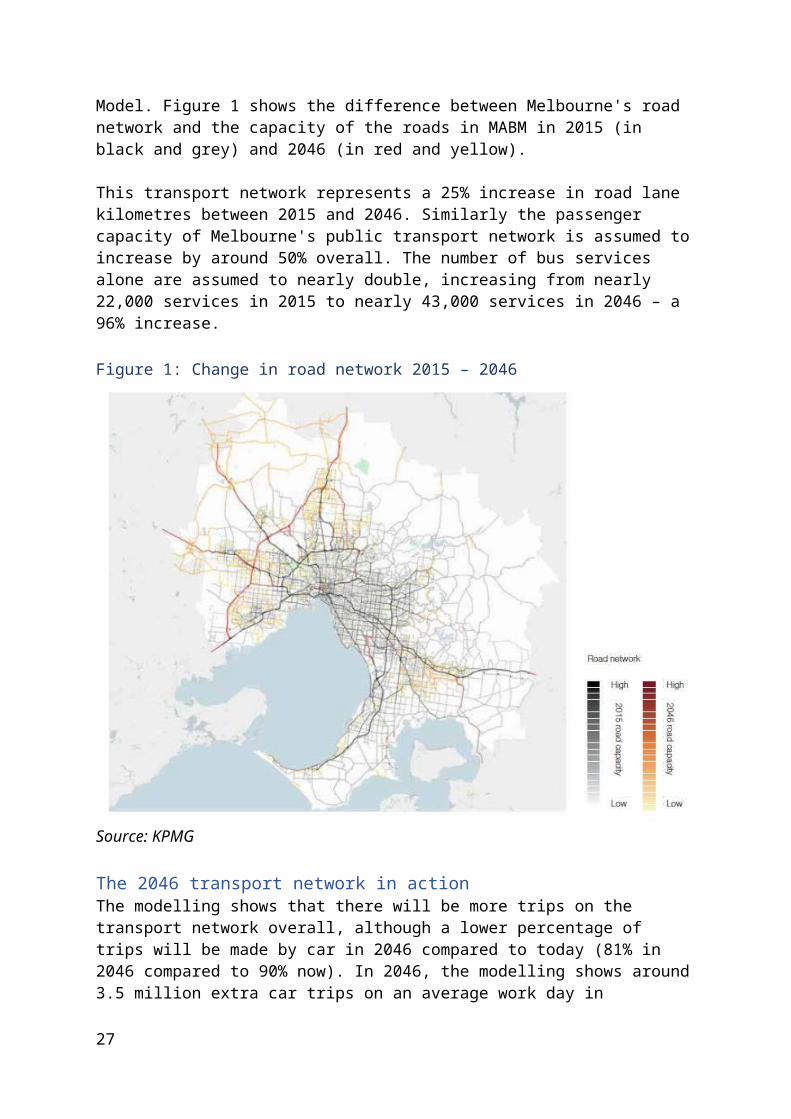
a projection of the future to enable business cases to be tested on a common basis. Some minor modifications have been included based on the recommendations in Infrastructure Victoria's 30-year strategy, such as the Doncaster Bus Rapid Transit project and expected updates to the next iteration of the Victorian Integrated Transport Model. Figure 1 shows the difference between Melbourne's road network and the capacity of the roads in MABM in 2015 (in black and grey) and 2046 (in red and yellow).
This transport network represents a 25% increase in road lane kilometres between 2015 and 2046. Similarly the passenger capacity of Melbourne's public transport network is assumed to increase by around 50% overall. The number of bus services alone are assumed to nearly double, increasing from nearly 22,000 services in 2015 to nearly 43,000 services in 2046 – a 96% increase.
Figure 1: Change in road network 2015 – 2046
Source: KPMG
The 2046 transport network in actionThe modelling shows that there will be more trips on the transport network overall, although a lower percentage of trips will be made by car in 2046 compared to today (81% in 2046 compared to 90% now). In 2046, the modelling shows around 3.5 million extra car trips on an average work day in Melbourne (a 37% increase from 2015). This growth in vehicle use would likely have a significant environmental impact in 2046. Modelling undertaken by Aurecon projects that Victoria's vehicle fleet will generate 27 million tonnes of CO2
20
equivalent in vehicle exhaust emissions in 2046, which is equal to approximately 25% of Victoria's greenhouse gas emissions in 2015.
Along with a growing population and its associated travel needs, it's not surprising that the pressure on Melbourne's road network is projected to increase over time. The modelling shows that this will lead to increased congestion on the road network at peak times, even after accounting for new road and public transport projects. Congestion is forecast to be worse at peak times, when the effects of a geographically uneven population and employment growth are most acutely felt. The morning peak period shows the most congestion and delays, caused by a greater number of people commuting for work. This finding is in line with our recent research on transport demand and opportunities to manage congestion on Victoria's roads, detailed in our report Five-year focus: Immediate actions to tackle congestion.1
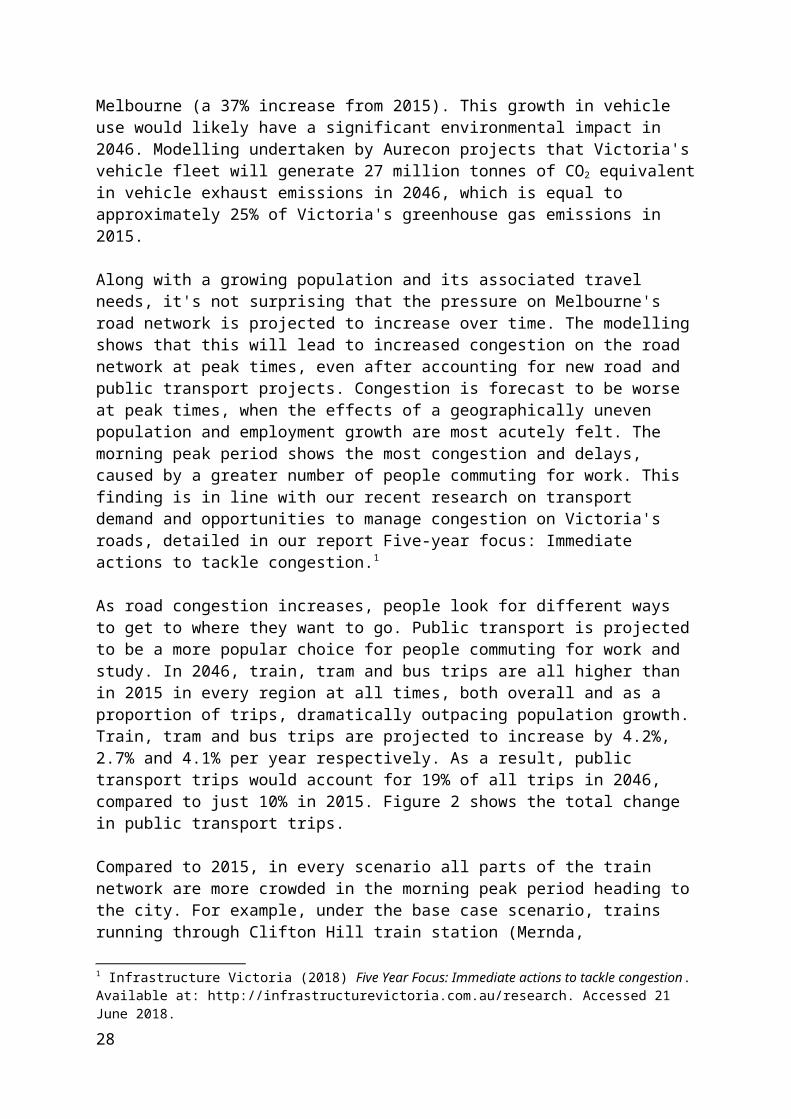
As road congestion increases, people look for different ways to get to where they want to go. Public transport is projected to be a more popular choice for people commuting for work and study. In 2046, train, tram and bus trips are all higher than in 2015 in every region at all times, both overall and as a proportion of trips, dramatically outpacing population growth. Train, tram and bus trips are projected to increase by 4.2%, 2.7% and 4.1% per year respectively. As a result, public transport trips would account for 19% of all trips in 2046, compared to just 10% in 2015. Figure 2 shows the total change in public transport trips.
Compared to 2015, in every scenario all parts of the train network are more crowded in the morning peak period heading to the city. For example, under the base case scenario, trains running through Clifton Hill train station (Mernda, Hurstbridge, Wollert) are projected to be 13% more full than they are today.
For car travel, only journeys to school are projected to become more common, growing from 55% today to 64% in 2046. This is most likely due to an increasingly dispersed population and the fact that schools are less likely to be clustered around public transport hubs than universities and employment centres.
Our modelling shows that, on average, people will travel further and for longer to get to jobs, education and health care in 2046 than they do today. This is important for the rest of the scenarios, as better access to these locations generally improves the quality of life for Victorians. The outcomes for each scenario are presented and discussed in more detail throughout this document.
1 Infrastructure Victoria (2018) Five Year Focus: Immediate actions to tackle congestion. Available at: http://infrastructurevictoria.com.au/research. Accessed 21 June 2018.
21
Figure 2: Public transport use: 2015 – 2046
Source: KPMG Transport modelling (MABM)
Victoria's energy network in 2046We appointed a separate team at KPMG to model the impacts of automated and zero emissions vehicles on Victoria's energy network. To understand how things might change, we needed a picture of what Victoria's energy network might look like in 2046, without automated and zero emissions vehicles. To do this, KPMG took the Australian Energy Market Operator's (AEMO) existing 2018 Forecasting insights, which extend until 2037, and extrapolated these to 2046 using AEMO's methodology. However, unlike the AEMO forecasts, KPMG's base case model does not include any energy consumption from battery electric vehicles, to be consistent with the assumption that they don't exist in our base case scenario.
For the purposes of this advice, KPMG's forecasts assume all new energy generation is renewable. This is broadly in line with AEMO's forecasts, which do not include any additional coal generation, and reflects the intent of the Victorian Government's goal of reaching net zero emissions in 2050. This is also consistent with our definition that zero emissions vehicles emit no emissions from the tailpipe or charging or fuel source, and therefore that the additional electricity demand generated by battery electric vehicles will come from zero emissions sources.
It is important to note that the emergence of zero emissions vehicles alone is not likely to be the sole catalyst to decarbonisation of the national energy market. The future energy generation mix will be determined by a number of factors, including national energy policy, national and state emissions targets, and cost. Some fossil fuel generation is likely to realistically remain in the mix for Victoria's energy grid in 2046. Therefore, while it will not be possible to say for sure that battery electric vehicles are powered by zero emissions electricity, our approach seeks to demonstrate what would be required for their marginal impact on demand to justifiably be described as zero emissions.
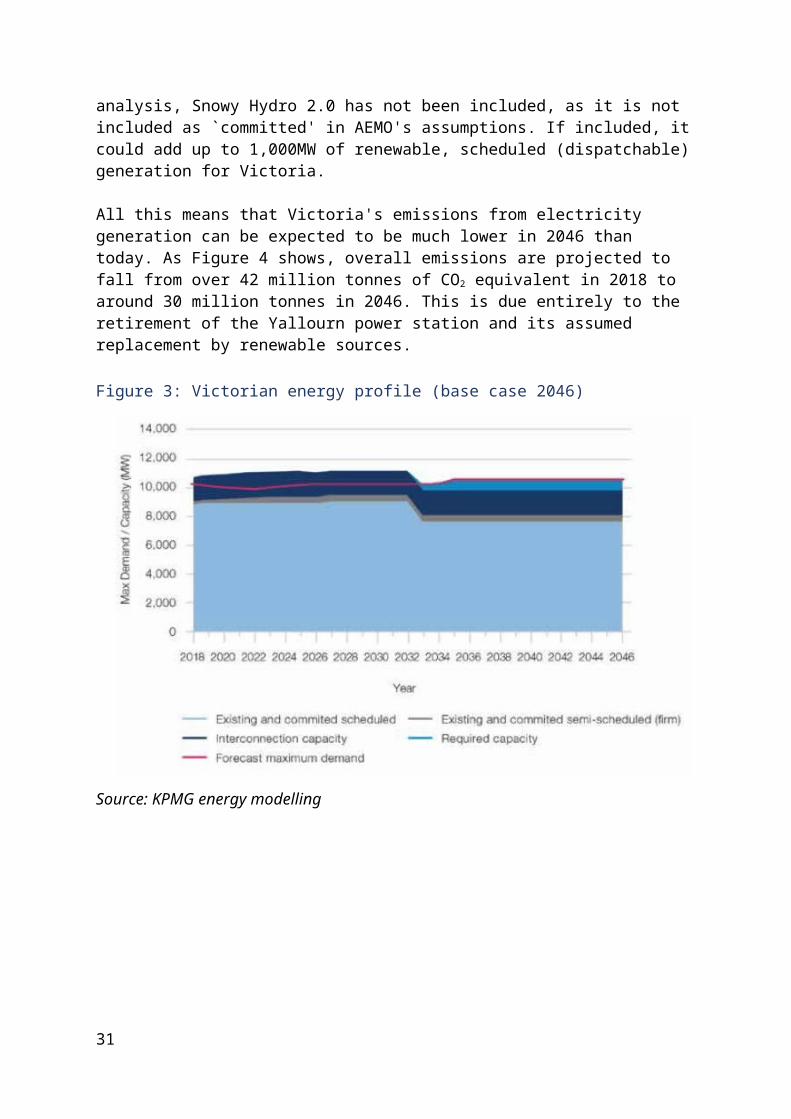
Figure 3 shows the projected change in maximum demand and capacity between now and 2046.
22

What this figure shows us is that `baseline' maximum demand is not forecast to change very much between now and 2046, most likely due to improvements in energy efficiency over time offsetting population growth. Even so, with the retirement of the Yallourn power station in 2032, an additional 800 megawatts (MW) of additional capacity is required to meet maximum demand in the base case. On the basis that we assume this gap to be filled by renewable sources, KPMG forecasts that it will be filled with a combination of pumped hydro, solar, wind and battery storage. For the purposes of this analysis, Snowy Hydro 2.0 has not been included, as it is not included as `committed' in AEMO's assumptions. If included, it could add up to 1,000MW of renewable, scheduled (dispatchable) generation for Victoria.
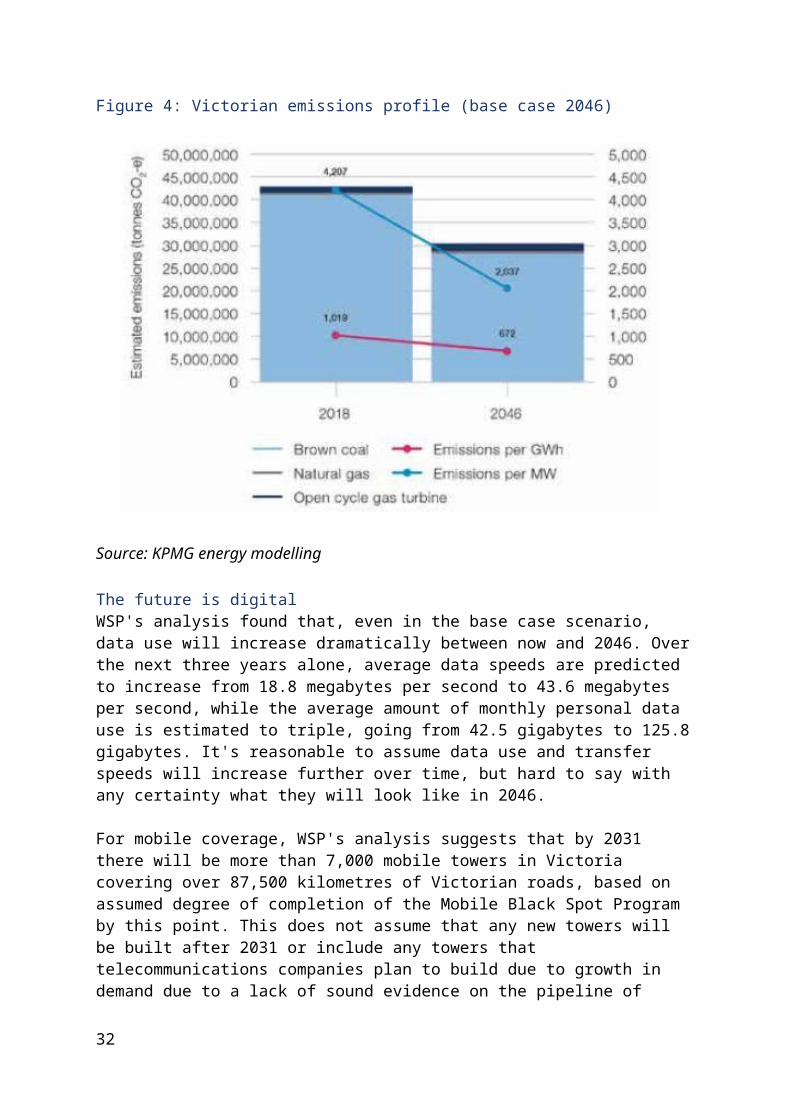
All this means that Victoria's emissions from electricity generation can be expected to be much lower in 2046 than today. As Figure 4 shows, overall emissions are projected to fall from over 42 million tonnes of CO2 equivalent in 2018 to around 30 million tonnes in 2046. This is due entirely to the retirement of the Yallourn power station and its assumed replacement by renewable sources.
Figure 3: Victorian energy profile (base case 2046)
Source: KPMG energy modelling
23

Figure 4: Victorian emissions profile (base case 2046)
Source: KPMG energy modelling
The future is digitalWSP's analysis found that, even in the base case scenario, data use will increase dramatically between now and 2046. Over the next three years alone, average data speeds are predicted to increase from 18.8 megabytes per second to 43.6 megabytes per second, while the average amount of monthly personal data use is estimated to triple, going from 42.5 gigabytes to 125.8 gigabytes. It's reasonable to assume data use and transfer speeds will increase further over time, but hard to say with any certainty what they will look like in 2046.
For mobile coverage, WSP's analysis suggests that by 2031 there will be more than 7,000 mobile towers in Victoria covering over 87,500 kilometres of Victorian roads, based on assumed degree of completion of the Mobile Black Spot Program by this point. This does not assume that any new towers will be built after 2031 or include any towers that telecommunications companies plan to build due to growth in demand due to a lack of sound evidence on the pipeline of investment, so we expect this is a conservative estimate of the network of mobile coverage for both 2031 and 2046. WSP suggests that all mobile towers in Victoria will have 5G cellular technology or better by 2046 regardless of automated vehicle uptake, with 3G mobile towers likely to be phased out between 2022 and 2030, and 4G mobile towers likely to start phasing out from 2030.
Even without automated vehicles, Victoria's roads are also likely to become increasingly connected over time. In Victoria, there are currently around 4,600 roadside infrastructure
24
sites, including traffic signals, overhead lane control signs, variable speed limit signs, ramp metering signals and roundabout signals, most of which are already `connected' using telecommunication links to central operators for reporting and control purposes. With planned infrastructure and existing signal growth, WSP estimates there would be 6,626 such roadside infrastructure sites by 2046.
What does the story of Victoria in 2046 tell us?Throughout this report, we discuss the potential impacts of each scenario on areas such as the transport network, energy networks, land use and the environment. These impacts (such as more trips, higher energy demand or lower CO2 emissions) will almost always be discussed with reference to the base case. Having a clear picture of the state of our infrastructure in 2046 also gives us a starting point for comparison of the change in infrastructure needed in our scenarios. Infrastructure responses discussed in each scenario show what is needed beyond the base case. This helps us to isolate the infrastructure needs of each scenario and to identify and compare the opportunity cost of specific investments.
The base case is also important because it helps to frame our expectations of the future. The modelling suggests that even with considerable investment in the capacity of Victoria's road and rail networks over the coming years, the performance of Victoria's transport network is likely to come under pressure. Victoria's growing and expanding population will also place more pressure on supporting infrastructure in areas that are already feeling the effects of high population growth. This raises questions about what else could be done to improve journeys and whether automated and zero emissions vehicles might add to the problem or provide a solution. The base case allows us to compare the relative merits of different government responses and develop a picture of things government could (or should) do, regardless of what the future holds.
Electric AvenueAll vehicles are privately owned, electric and non-automated.
Battery electric vehicles are already familiar to many Victorians. They are already on our roads, some charging stations already exist and the opportunities they provide for distributed generation and storage are being widely discussed. In this scenario, non-automated battery electric vehicles are everywhere and there are no petrol, diesel or driverless vehicles on the road.
Battery electric vehicles present both opportunities and challenges, particularly when it comes to the resilience of Victoria's energy sector. A significant roll out of battery electric vehicles could mean that a lot of charging infrastructure is needed. It is likely to put a lot of extra pressure on our energy generation, transmission and distribution networks if everyone installs a charger and plugs in when they get home from work.
On the other hand, battery electric vehicles could change the quality of our environment, with life expectancy improvements as a result.
25
How have other countries introduced battery electric vehicles?Battery electric vehicles are by far the most developed of the technologies considered in this advice, but remain below 2 to 3% penetration in almost all markets, with the exception of Norway. With a 29% market share, Norway has achieved the highest electric car market share globally, and is targeting 100% of car sales to be zero emissions vehicles by 2025.
It is unlikely that Norway would be as advanced as it is in battery electric vehicle uptake without government intervention. Norway has some of the largest incentives in the world to encourage zero emissions vehicles uptake. Key incentives employed include reduced taxes for consumers on toll roads, reduced import taxes for manufacturers and reduced company tax. Norway also has a large number of charging stations, allowing long distance electric vehicle trips. All of these incentives come at a significant cost, however, with government funding per trip spent on battery electric vehicles exceeding that for public transport. For more information, read the L.E.K. Infrastructure Victoria AV/ZEV International Scan report.
A charging station is also available every 50 kilometres on all main roads in the country. In addition, the European Union has invested 10 million Euros for a network of 180 charging stations, allowing electric vehicle owners to travel from Norway to Italy. While charging infrastructure may seem to be a contributing factor to driving electric vehicle uptake, analysis of trends in international markets by L.E.K. and Arup found that around 80% of battery electric vehicle owners charge their vehicles at home. They also looked at the correlation between charging infrastructure roll out and battery electric vehicle uptake in 12 countries and found that it appears to have had little effect in encouraging early adoption of battery electric vehicles.
There is evidence, however, that public charging infrastructure does have its place where there are practical or market limitations. For example, low population densities in rural and remote areas might mean it is not commercially viable for private operators to provide charging infrastructure. This could discourage battery electric vehicle uptake in these areas, or prevent people from taking long trips.
Data from the transport modelling shows that the average daily distance driven would be around 43 kilometres in this scenario. With many electric vehicle models currently claiming around 300 kilometres range on a full charge, this means that, for most people, battery range is unlikely to be an issue for day to day use.
2046
DRIVER ELECTRIC PRIVATE OWNERSHIP
Key findings
Assumes driving an electric car costs less, leading to slightly more congestion $706 million of economic benefits per year from 3,632 more years of healthy life due
to emissions reductions
26
Energy network upgrades could cost $6.4 billion to $8.8 billion
Figure 5: Battery electric vehicle international take-up
Source: L.E.K.
What do Victoria's planning regulations say about electric vehicle chargers?Evidence suggests that people are most likely to charge their electric vehicles at home, particularly if private car ownership and human drivers remain the norm.
Cities such as London, Beijing and San Francisco have introduced building and parking regulations for electric vehicles. London, for example, requires new residential developments to have a charge point for electric vehicles in 20% of parking spaces.
Victoria does not have equivalent development standards, but the planning scheme requires permits for chargers, including for publicly visible chargers under particular planning overlays. Precedent for similar changes does exist in Victoria, with car parking to dwelling ratios as an example.
However, as planning in Victoria only governs new uses and developments, it has little or no impact on existing housing stock. Many inner Melbourne dwellings also do not have off-street car parking. This makes it unlikely that amending the planning scheme alone would ensure equitable and comprehensive coverage of electric vehicle charging points on private properties.
When do we expect to see battery electric vehicles take off in Victoria?Both Victoria and Australia are lagging in the adoption of battery electric vehicle technology when compared to other countries.
27
As noted in the Parliament of Victoria's report on the Inquiry into Electric Vehicles,2 668 fully battery electric vehicles were purchased in Australia in 2016, which made up 0.1% of Australian new car sales.3 The Electric Vehicle Council also reported that "Victorians have purchased the highest number of battery electric vehicles over the last six years compared to other states, with 1,017 vehicles (excluding Teslas) purchased from 2011 to 2016".4
According to Bloomberg, Australian battery electric vehicle sales are forecast to steadily rise over the next few years, from 2,400 in 2018 to 27,000 by 2022, or more than 2% of all new car sales.5 Bloomberg predicts that the purchase price of battery electric vehicles will be competitive without subsidies by 2024 and the same as traditional cars by 2029, leading to 28% of all new car sales being electric by 2030. Further, 33% of all cars in the world are forecast to be electric by 2040.6 A recent report by the CSIRO also projects that electric vehicle sales will account for over 40% of new sales in 2040.7 This is consistent with the findings in L.E.K's technical report.
Bloomberg further predicts that the bus fleet will become fully electric more quickly than passenger vehicles, due to savings in total costs as shown in Figure 6.
Figure 6: Cost comparison for e-buses and diesel buses, with different annual distance travelled
Source: Bloomberg New Energy Finance. Note: Diesel price at $0.66/litre ($2.5/gallon), electricity price at $0.10/kWh, annual kilometres traveled - variable. Bus route length will not always correspond with city size.
2 Parliament of Victoria (May 2018) Inquiry into battery electric vehicles. Available at https://www.parliament.vic. gov.au/file_uploads/EIC_58-13_Text_WEB_1MNYcV8K.pdf. Accessed 20 June 2018.3 Electric Vehicle Council and ClimateWorks Australia (2017), The state of battery electric vehicles in Australia.4 Ibid. The report noted that Tesla does not release its sales figures to the public.5 Wiggins, J. (2018), Charging bases key to spark electric car sales, Australian Financial Review, 19 June.6 Bloomberg New Energy Finance (2018), Electric Vehicle Outlook 2018.7 Graham, P., Reedman, L., Gargett, D., and Cosgrove, D. (2017). Australian road revenue and expenditure: scenarios to 2050, Commonwealth Scientific and Industrial Research Organisation.
28
Figure 7: Battery electric and plug-in hybrid vehicles as a proportion of the Australian vehicle fleet
Source: CEFC
Recent analysis undertaken by Energeia for the Clean Energy Finance Corporation is even more optimistic about the potential of electric vehicles. Energeia estimates that, with only `moderate' intervention, battery electric and plug-in hybrid vehicles will account for 100% of new vehicle sales in Australia by 2040 and 95% of vehicles on the road by 2050, as shown in Figure 7. This analysis assumes an uncoordinated mix of policy support across several layers of government, including potential federal policy changes to luxury car tax, fringe benefits tax and vehicle emissions standards, but no long-term decarbonisation target.8
Overall, there is consistency across sources that battery electric vehicles as a proportion of the total number of vehicles will increase significantly in the coming decade, with a turning point sometime between 2025 and 2030 when the vehicles are projected to reach cost parity with traditional petrol and diesel vehicles.
However, these forecasts must be tempered with the reality of the models available for sale in Victoria today. The question of when most Victorians will be able to take up electric vehicles is largely dependent on when models at a comparable price to current petrol vehicles will be available locally. According to DriveZero, there are 11 different models of battery electric vehicles in Australia in 2018 out of over 400 vehicle models in total, and many of these models are luxury brands, like BMW and Tesla.910 Manufacturers may be reluctant to bring zero emissions vehicle models to Australia without further encouragement of their uptake, and without a range of options a wide take-up by consumers is highly unlikely. These forecasts therefore depend heavily on the resolution of this `chicken and egg' dilemma, with manufacturers and consumers each relying on the other for these forecasts to become reality.
8 Energeia (2018), Australian Electric Vehicle Market Study.9 Car Advice (n.d.), Best Car, Available at: https://www.caradvice.com.au/top-5/. Accessed July 3, 2018.10 Drive Zero (2018), A full list of Electric Cars (EVs and PHEVs) available or coming to Australia, Available at: https://www.drivezero.com.au/electric-vehicles-available-in-australia-list/. Accessed July 3, 2018.
29

The price of travelBattery electric vehicles are likely to make using a car much cheaper. In developing our transport modelling work, KPMG estimated that instead of it costing nearly 18 cents per kilometre ($17.60 per 100 kilometres) to drive a petrol vehicle, on average it could cost as little as 5 cents ($5.00 per 100 kilometres) to run a battery electric vehicle in 2046. If it is cheaper to drive an electric rather than a fossil-fuelled vehicle, people may take a longer route to work if it means avoiding congestion. Our modelling suggests that this would lead to a slight (2%) increase in travel speeds in the outer suburbs as people avoid congested areas. However, congestion would be slightly worse in the inner areas, with travel speeds falling by 3%.
Because some people are willing to avoid congestion, the transport modelling shows that average travel speeds are marginally faster (less than 1 kilometre per hour) than in the base case, despite the distance travelled on Melbourne's roads being 1% higher (or around 1.8 million kilometres) than in the base case.
The proportion of public transport trips as a share of all trips is projected to increase by less than one percentage point compared to the base case. Trains and buses are forecast to have minor (less than 1%) growth in patronage, while tram patronage is projected to remain approximately unchanged. We expect this is because roads are viewed as being slightly more congested making trains, trams and buses a slightly more attractive option for getting to work.
Electricity and accessibilityAs it is projected to cost less to drive a battery electric vehicle, schools, hospitals and jobs are a little easier to access than in the base case. When we talk about `access to services' (in this section and throughout the report), we are referring to the `price' people have to pay to get to where they want to go, be it schools, work or health care.
This price is calculated using a combination of the monetary and nonmonetary costs of travelling, such as time, parking costs and out-of-pocket costs (e.g. fuel). A lower price means better access, while a higher price reduces it. Each scenario changes these costs in a variety of ways. The Electric Avenue scenario reduces the out-of-pocket costs aspect of using a car by lowering fuel costs, resulting in better access to services across Victoria on a population-weighted basis of between 5% for primary schools to 9% for train and tram stations. The accessibility improvements of this scenario are not as large as those seen in other scenarios, which we'll discuss later in this report.
Vehicles: 1, emissions: 0As the name suggests, the emergence of zero emissions vehicles would eliminate all vehicle exhaust emissions in Victoria to the tune of around 27 million tonnes of carbon dioxide (CO2) equivalent in 2046. This represents a significant benefit to all Victorians through improved air quality, which would reduce the incidence and severity of health issues caused by high vehicle exhaust concentrations and, subsequently, reduce health care costs. According to the OECD, air pollution from road transport cost the Australian economy close
30
to $6 billion in health costs in 2010.11 In all full zero emissions vehicles uptake scenarios (Electric Avenue, Private Drive, Fleet Street and Hydrogen Highway) vehicle exhaust emissions are completely removed.
The magnitude of the vehicle emissions reduction would equate to approximately 25% of Victoria's greenhouse gas emissions in 201512, which is equal to the amount of emission reduction required to meet Victoria's 2020 emissions reduction target.
While this is a great news story for carbon emissions, it isn't the whole picture. Like all vehicles, battery electric vehicles will still generate some non-exhaust emissions – often referred to as `particulate matter' – from things such as tyre wear, road wear and braking. In Electric Avenue, more frequent and longer trips mean that vehicles would generate more particulate matter from these sources than in the base case. However, this is more than balanced out by the fact that battery electric vehicle motors don't emit harmful particulate matter in the way traditional petrol and diesel engines currently do, resulting in a decline in particulate matter emissions from over 2.8 million kilograms per year in the base case to around 1.6 million kilograms per year.
Emissions in contextThe analysis of the health benefits of zero emissions shows that a very large reduction in the health impacts from vehicle emissions is possible in all scenarios where the entire vehicle fleet is zero emissions (Electric Avenue, Private Drive, Fleet Street, Hydrogen Highway and High Speed). In these scenarios, the health impact of vehicle use is projected to fall by 70–75% as compared to the base case. Since some non-exhaust emissions remain, the modelling shows that the magnitude of the health benefits will vary according by scenario (mostly due to fleet size and overall road use) and by population group.
It will be a major challenge for zero emissions vehicles to ever truly be 100% zero emissions. Victorians will need to be aware of the environmental footprint of manufacturing, whether the manufacturing takes place in Victoria or elsewhere. Considering the trends in global environment policy, the environmental impacts of manufacture may be `internalised' in the price of imports. While exhaust emissions are eliminated in zero emissions vehicles, manufacturing components for battery electric vehicles and hydrogen fuel cell vehicles (FCVs) are likely to be a significant contributor to global emissions, in the same way manufacturing traditional vehicles are today. In all scenarios, zero emissions vehicles would contribute to global emissions, with the environmental impacts due to battery production greatest in the full private ownership scenarios (Electric Avenue and Private Drive), due to the size of the vehicle fleet. In these scenarios, vehicle manufacturing could contribute the equivalent of more than 1% of Victoria's CO2 equivalent emissions in 2015.
11 Organisation for Economic Co-operation and Development (2014), The Cost of Air Pollution - Health Impacts of Road Transport.12 Victoria was estimated to have produced Land, Water and Planning (2016), Victoria's Department of Environment, Land, Water and Planning (2016), Victoria’s Climate Change Framework.
31
Electric cars are good for your healthThe benefits of battery electric vehicles to population health can be illustrated by estimating how many years of healthy life lost from death or illness are avoided (or the years of healthy life that are gained) from a given intervention. This measure is called avoided `disability-adjusted life years' (DALYs).13 DALYs measure the total burden of illness experienced by a population. A life year lost due to an external health risk (e.g. pollution) represents one DALY.
In this case, the intervention is the emissions reductions resulting from the emergence of zero emissions vehicles. In the case of Electric Avenue, the ubiquity of battery electric vehicles results in 3,632 avoided DALYs in 2046 (3,464 of which are in metropolitan Melbourne) as compared to the base case. Taking the widely used `Value of a Statistical Life Year' framework, the avoided DALYs represent an annual economic benefit valued at $706 million in 2046 alone.14 These benefits would be realised annually for every year the effects of vehicle exhaust emissions are removed.
The health benefits of reduced emissions are forecast to be greatest in urban areas with high density populations. This finding is consistent with results of previous studies by EPA Victoria and the Commonwealth Department of Infrastructure and Transport,15 and is unsurprising given that the sources and effects of emissions are spread across a greater number of people in a smaller area.
Aurecon also found that, while the health benefits vary by location and population density, they are felt evenly among different socioeconomic status (SES) groups. Aurecon grouped locations into high, medium and low SES categories using the Australian Bureau of Statistics' Socio-Economic Indexes for Areas and found that each SES category benefits from a reduction in DALYs (or avoided DALYs) of between 66 and 68%.
For more information of the methodology underpinning this analysis, see the Aurecon report AV/ZEV Environmental & Health Impact Assessment.
Gridlock – electric cars and the Victorian energy marketOne of the most significant impacts of zero emissions vehicles is expected to be on the energy grid. By their very nature, battery electric vehicles will lead to greater demand for electricity. We expect battery electric vehicles to place considerable pressure on Victoria's energy grid compared with the base case – particularly when we require the energy source to be zero emissions to the greatest extent possible.
In the Electric Avenue scenario, Victoria's vehicle fleet is made up entirely of battery electric vehicles, with more than 3.5 million in Melbourne alone. The results of the transport modelling show that these 3.5 million vehicles travel nearly 169 million kilometres a day – an average of nearly 48 kilometres each.
13 Australian Institute of Health and Welfare (2018), Burden of Disease.14 Australian Safety and Compensation Council (2008), The Health of Nations: The Value of a Statistical Life.15 Department of Infrastructure and Transport (2010). Final regulation impact statement for review of euro 5 / 6 light vehicle emissions standards, and EPA Victoria Future air quality in Victoria – Final report, Publication 1535, July 2013.
32
To determine the overall energy usage of the residential and commercial vehicle fleet in this scenario, these results were combined with an assumed rate of energy use of 20 kilowatt hours per 100 kilometres.16 Freight vehicles have been given a higher energy usage weighting of 112 kilowatt hours (kWh) per 100 kilometres based on the average efficiency of a number of example freight vehicles (since no electric heavy freight vehicles are commercially available). Taking the number of kilometres driven by the energy usage of different vehicle types, KPMG estimates that this vehicle fleet would add 22,000GWh to energy consumption in 2046 (Victoria's total electricity demand in 2018 is around 43,000GWh). In today's terms the generation, transmission and distribution investment required to meet this additional demand is forecast to be around $6.4 billion compared to the base case. This significant investment required from the private sector would most likely be ultimately be recovered from consumers through electricity bills.
However, calculating the overall impact on Victoria's energy grid is more nuanced than simply looking at the extra electricity demand generated by the vehicle fleet annually. The impact of battery electric vehicles on Victoria's energy market also depends on how, when and where vehicles are charged, and how these factors relate to existing energy demand peaks (maximum demand).
As part of the modelling work to understand the effect of battery electric vehicles on Victoria's energy network, KPMG developed a variety of load profiles to reflect different vehicle usage patterns, charging patterns and pricing structures and how they will contribute to maximum demand.
The profiles reflect different charging locations and ownership models, specifically residential (at home), commercial (at work), out of home (roadside/charging stations) and shared (fleet) charging. The profiles also include sensitivities for incentivised and non-incentivised charging. Incentivised charging occurs when a price signal encourages vehicle owners to charge outside peak periods or a central network operator remotely controls charging times. A non-incentivised charging profile assumes no financial incentive or central control.
The shape of the load profiles helps us understand the degree to which battery electric vehicle charging coincides with peak demand in the energy network. Although the overall energy consumption of vehicles remains constant regardless of the load profile in each scenario, their contribution to maximum demand can change dramatically. This could have significant implications for Victoria's energy network. For example, a non-incentivised load profile would reflect users plugging their cars in at night as soon as they get home, leading to demand peaking in the early evening to an even greater extent than in the base case.Figure 8 shows an example load profile for non-incentivised charging in Electric Avenue.
16 KPMG used this energy use figure because it provided a vehicle operating cost of electric vehicles for transport modelling purposes. 20kWh/100km equates to 5c/km, which was chosen because it is significantly lower than the base case (17.6c/km), but not so low that it pushes the bounds of what is reasonable with a model. Extremely low vehicle operating costs could have unpredictable influences on people's routing behaviour.
33
Figure 8: Non-incentivised Electric Avenue load profile
Source: KPMG energy modelling
Figure 9: Incentivised Electric Avenue load profile
Source: KPMG energy modelling
34

Electricity explainer – maximum demand vs total consumptionWhen talking about electricity demand from zero emissions vehicles in this report, we talk about it in two ways: total consumption and maximum demand.
When we refer to `total consumption' we mean the amount of energy consumed over time, which, in the case of this report, will be in the year 2046 (with the exception of High Speed, which will be in 2031) and is always shown in gigawatt hours (GWh). This is how much generation is required for overall consumption for a day.
When we refer to `maximum demand' we mean the amount of electricity required at any one point in time. For the purposes of our advice, this means how much electricity the grid must be able to provide to meet the battery charging needs of the vehicle fleet at a point in time. This will always be referred in megawatts (MW).
When we talk about generation requirements to meet battery electric vehicle demand, we assume all new generation will be from renewable sources and will generate zero emissions, consistent with our definition of zero emissions from both the source and the tailpipe.
As non-incentivised charging aligns with existing demand peaks, it is forecast to place significantly more pressure on the grid, further increasing the need for additional generation capacity to meet peak demand. KPMG estimates this requirement could be over 6,200MW.
To mitigate the impacts on the energy network, incentives could be introduced to shift some of the charging away from peak times, reducing the overall contribution of battery electric vehicle charging to peak energy demand. For example, reducing the cost of energy during off-peak times could encourage battery electric vehicle owners to delay charging their vehicles and reduce the overall impact on energy demand, as in Figure 9.
The implication of an incentivised charging profile is that the additional amount of energy generation capacity required to meet maximum demand is significantly less than when no incentives are provided. This means that the additional generation capacity requirement could be reduced to around 3,300MW. This represents a significant reduction in the amount of additional network investment required, with the savings estimated at around $2.4 billion in today's terms. The use of incentives is a departure from current pricing approaches, but could represent a significant opportunity to mitigate the impact of battery electric vehicles on peak electricity demand.
A fleet of battery electric vehicles could also, in the right circumstances, act as a fleet of mobile batteries that charge during peak renewable generation periods and feed energy back into the network at times of high demand, enhancing the overall resilience of the Victorian energy grid. However, vehicle-to-grid (V2G) technology will also require additional investment in new charging technologies, such as a bi-directional charger, smart inverters and new metering systems. V2G technologies are also likely to create new challenges concerning policy and regulatory arrangements, such as rules around minimum power `export' requirements and tariff structures. In addition, there is evidence that V2G technologies may reduce the lifetime of batteries used in vehicles, so this may not be the most effective use of their storage capacity.
35
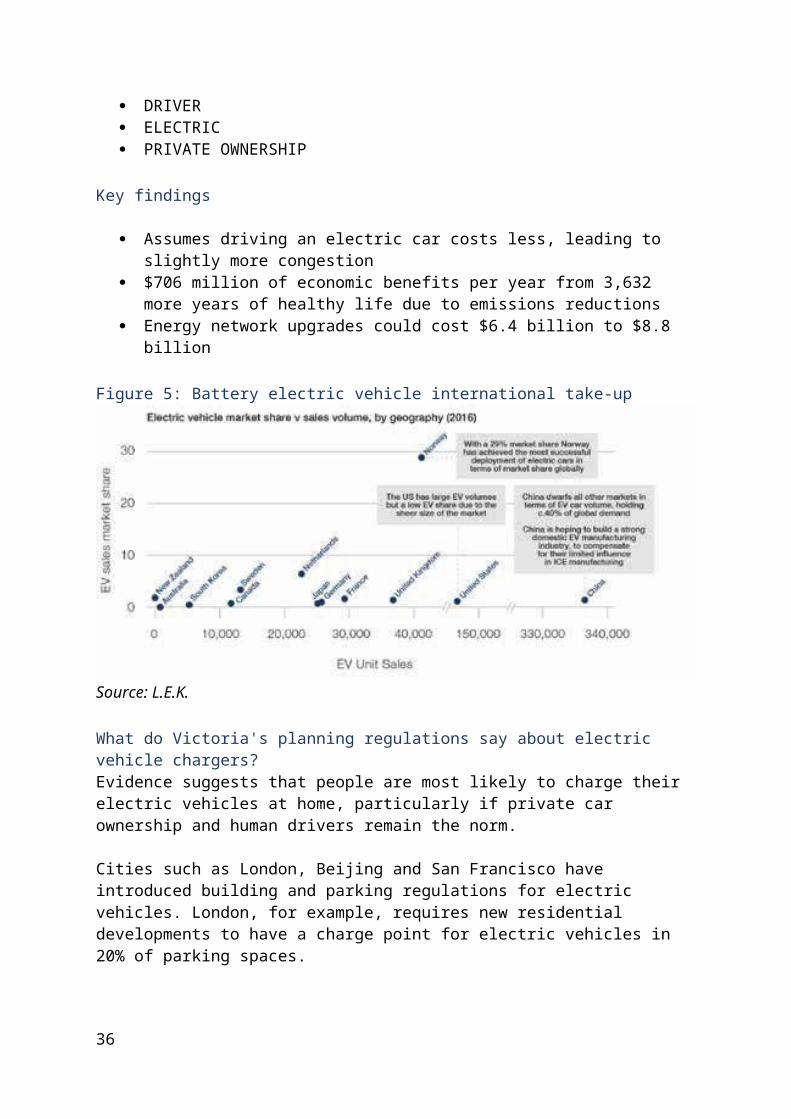
More detailed information on approaches to optimising battery electric vehicle charging, including system architecture and communications requirements can be found in the KPMG Automated and Zero Emission Vehicle Infrastructure Advice Energy Impacts Modelling report.
Charge!The emergence of battery electric vehicles could represent a paradigm shift for drivers in how they keep their vehicles fuelled. Drivers currently drive to a petrol station to refuel their car, with a refill taking a matter of minutes. Battery electric vehicles generally take much longer to charge than filling a tank with petrol. However, drivers may have many opportunities to `top up' their car, whether at work, at home, at the local shopping centre or along the road, which could potentially deliver time savings. But for all of these opportunities to actually materialise, a lot of new charging infrastructure will be needed.
Figure 10 sets out the current classification of charging infrastructure. Because these definitions vary by source, a range of power draw for each classification is included. It is important to note that faster chargers place a greater load on the energy network. For example, KPMG's analysis suggests that a charging unit of 240kW is the equivalent of approximately 80 homes being added to the network.
Figure 10: Vehicle charging indicative power drawType Indicative
power drawCharging speed Cost Use case
Slow 1.9kW to 3kW Red Green HomeFast 7kW to 22kW Amber Amber Home or destinationRapid 50kW to 120kW Green Red Service or shared fleetUltra 120kW to 1MW Green Red Service or shared fleet
Source: KPMG energy modelling
A highly charged discussion about battery swapping
PowerSwap, a Swedish company that has received support from the Swedish energy agency and the European Commission, aims to make charging much simpler for drivers and eliminate charging time and range issues through its battery swap system. PowerSwap told us its developing automated system aims to locate a car's battery, take the empty battery out and send it for charging and replace it with a fully charged one, all within about three minutes.
Battery swapping has the potential to avoid `range anxiety' and concerns relating to long charge times for batteries. But this approach isn't without its challenges – batteries would need to be standardised across car makes and models. Batteries and battery charging technologies and design are likely to be treated in much the same way as vehicle manufacturers currently treat engine design – as core intellectual property and a source of competitive advantage. For example, the images shown show the different battery designs of the Tesla Model S and the Nissan Leaf.
36
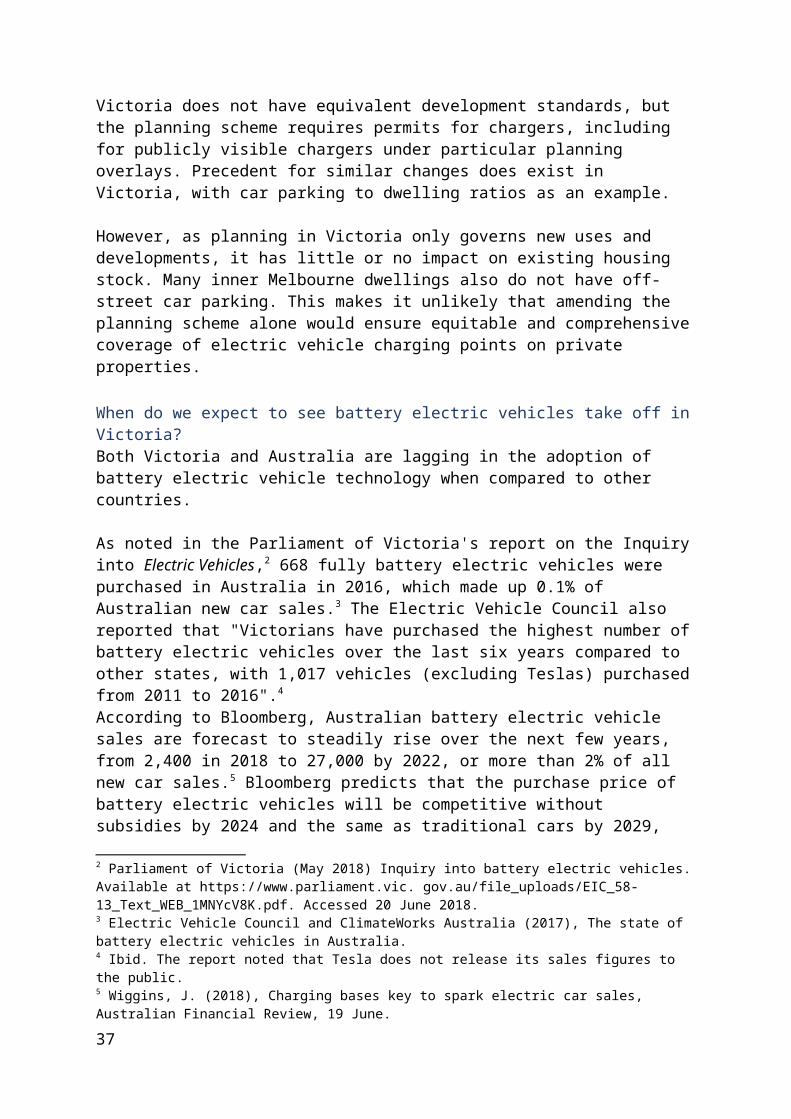
On top of this, battery swap technology also has technical challenges relating to vehicle design and safety standards. Since the evidence does not suggest that a clear trend towards adoption of battery swapping technology has begun, battery swapping has not been considered as a core part of this advice.
Figure 11: Tesla battery
Figure 12: Nissan Leaf battery
Slow chargers are typically connected to household mains power and take six to 12 hours to fully recharge a battery electric vehicle. Fast chargers could charge most current battery electric vehicles in one to five hours, depending on the power draw. These are more likely to be seen at shopping centres or movie theatres, although some vehicle owners might install them at home.
Rapid charging infrastructure is a broad category, and includes some proprietary infrastructure (e.g. Tesla Superchargers) and competing charging standards. Rapid chargers can use either alternating current (AC), which can deliver 80% charge to a typical battery electric vehicle in less than an hour, or direct current (DC), which can deliver 80% in 30 minutes. Rapid chargers are the most likely solution for roadside charging stations or shared vehicle fleets. Due to the cost, it is unlikely that a vehicle owner would install their own rapid charger at home. Ultra chargers could potentially reduce charging time to around five to 10 minutes. A 100kWh battery electric vehicle with a range of nearly 500 kilometres could charge in eight minutes with a 750kW charger.17
Ultra charging is likely to be attractive to owners of vehicle fleets undertaking regular, heavy mileage, such as freight operators.
17 Ewbank, J (2017), The Tipping Point for Electric Vehicle Charging, Available at: https://www.engineering.com/ ElectronicsDesign/ElectronicsDesignArticles/ArticleID/16172/The-Tipping-Point-for-Electric-Vehicle-Charging.aspx.
37
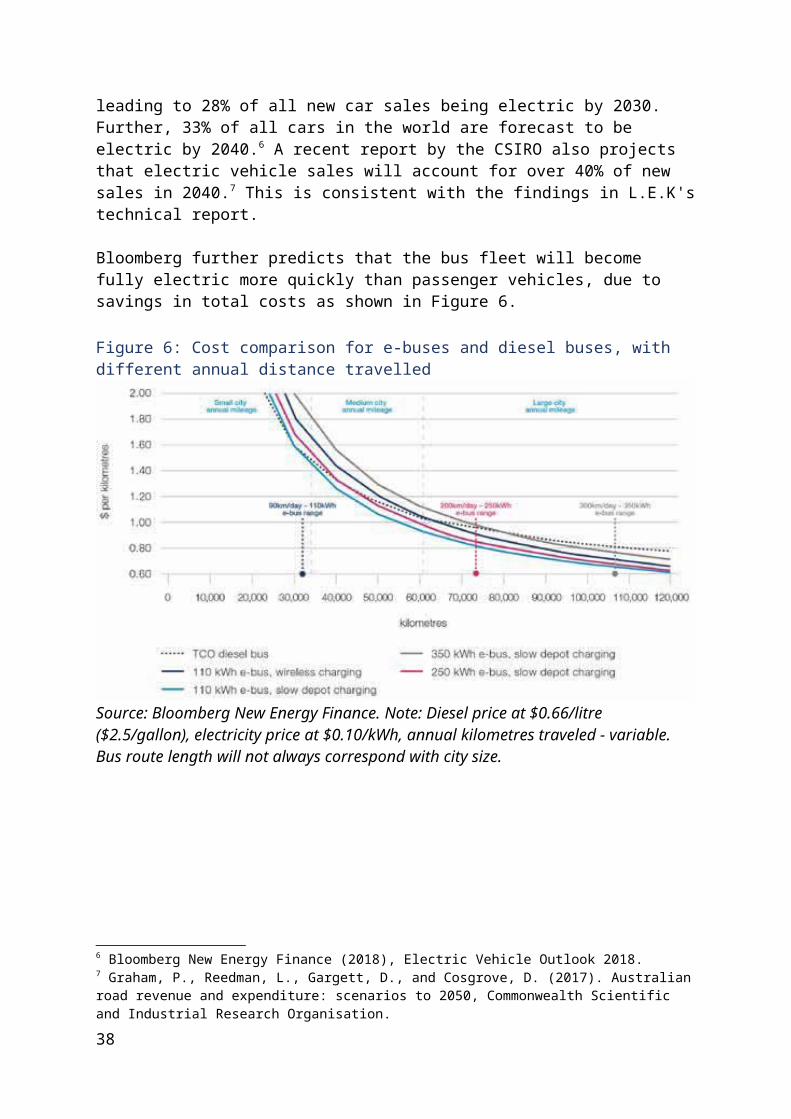
Residential chargingKPMG's modelling predicts that 90% of charging for privately owned vehicles will happen at home, as this is most convenient for drivers. On arriving at home, a driver plugs their car in to charge, ready for the next trip.
According to the 2016 Census, there are 1.8 vehicles per dwelling in Victoria across a total of 2.1 million dwellings. It is still very unclear what type of residential chargers households will choose, but KPMG has estimated an even split of fast and slow chargers for the purposes of its analysis. This proportion of fast and slow chargers would result in over one million fast charging units being installed in residential properties. Adding a 9.5kW fast charger to a local grid is the equivalent of more than three new homes being connected to the local network. The actual impact of each additional charging unit on the local network is heavily dependent on the proximity of the charger to the local transformer. One local study found that one charger located at a relatively weak point in the network could have the same impact as 45 charging loads located close to a local transformer.18 This could have significant implications on the ability of local networks to support the uptake of battery electric vehicles.
Out of home chargingThe remaining 10% of charging is predicted to occur `out of home' using ultra chargers. These types of chargers would be able to charge the daily requirement for cars in the Electric Avenue and Private Drive scenarios in less than five minutes (9.25kWh and 10.4kWh respectively). The amount of out of home charging infrastructure required depends on how many cars are trying to use it at once.
It is reasonable to assume that the ratio of charging stations to vehicles wouldn't need to be as high as the current petrol station to vehicle ratio, as many vehicles would be charged at home. However, in Electric Avenue, 10% of the vehicle fleet is approximately 341,500 cars. The charging profile for out of home charging assumes that just over 28,000 of these cars would charge between 7.00am and 9.00am. KPMG estimates the minimum amount of chargers needed to charge these vehicles with zero wait time, assuming demand is evenly spread, would be around 1,100. The maximum number of chargers needed for all cars to charge simultaneously would be just over 28,000. The most likely number is somewhere in between.
Arup's work suggests that other charging solutions, such as in-road charging-in-motion systems, are not likely to have a high benefit-to-cost ratio in the Australian context in the near future. However, there are some cases that may have value, such as the coupling of inductive charging with on-street parking to avoid cables and trip hazards, and heavy vehicle `top-up' systems such as overhead pantograph-based fast charging.
18 de Hoog, J. et al. (2015), The importance of spatial distribution when analysing the impact of electric vehicles on voltage stability in distribution networks, Energy Systems, 6(1):63-84.
38
What is the role of government in providing advice about charging infrastructure?People are uncertain about installing battery electric vehicle charging infrastructure in different development contexts. During our consultation, uncertainty was expressed by developers about appropriate installation in new developments, consumers on retrofitting existing buildings for chargers, and local government about charging infrastructure on council land.
We reviewed the currently available guidance on charging infrastructure installation in Victoria and found that the majority of information available online is from commercial interests, such as charger providers and vehicle manufacturers. There is also a practice note from the Queensland Government for government, landowners and developers, which outlines many important factors related to the installation of battery electric vehicle charging infrastructure, such as safety, charger types and regulation.
Therefore, more information on factors affecting charger installation in the Victorian context may be needed to guide the installation of battery electric vehicle charging infrastructure.
Freight chargingCharging requirements for heavy vehicles are likely to be very different than for light vehicles. Freight operators are likely to require ultra chargers at freight depots or key delivery points. Freight vehicles are likely to require more frequent and faster charging due to the commercial imperatives of vehicle use and the expected size of heavy duty battery packs.
For example, the battery packs required to support interstate or other long-haul freight trips would need to be in excess of 3,000kWh, for approximately 1,500 kilometres of range.19 A battery pack of this size would require over eight hours of charging with 350kW `ultra charging' to fully recharge. Beyond this, vehicles themselves may limit the potential of charging. For example, the metal plates between a vehicle and a charging plug are at risk of being damaged when high currents are delivered. It is likely that batteries and charging infrastructure will evolve over time, improving the charging capacity of vehicles.
Localised impactsKPMG's analysis looked at the three major elements of the energy supply chain – generation, transmission and distribution. Figure 13 represents a stylised version of the energy supply chain.20
To understand the local impacts of battery electric vehicles, we asked KPMG to identify areas of the distribution network that may require upgrades to cope with the extra demand generated by battery electric vehicles.
19 Sripad, S. and Viswanathan, V. (2017), Performance Metrics Required of Next-Generation Batteries to Make a Practical Electric Semi Truck, ACS Energy Letters, 2(7):1669-1673.20 Solar Choice (2013), The impact of rising wholesale fuel costs on Queensland's electricity prices (and the rest of Australia). Available at: https://www.solarchoice.net.au/blog/impact-of-rising-fossil-fuel-costs-on-qldelectricity-prices/. Accessed 20 June 2018.
39
Figure 13: Components of the energy supply chain
Source: Solar Choice
There are 228 zone substations across Victoria, which can be broadly mapped to locations across Victoria. Using transport modelling data for the origin and destination of vehicle trips, KPMG was able develop a picture of where each vehicle `lives' and is likely to charge. Using this information, KPMG has estimated how many vehicles will be charging in each zone substation area and identified potential `pinch points' in the network. It should be noted that there are some limitations to this approach, as exact data on each zone substation's coverage area is not available.
Based on this approach and noting the limitations of the analysis, KPMG estimates that around 114 zone substations would exceed their rated capacity with non-incentivised charging in an Electric Avenue future (see Figure 14), while with incentivised charging this number is reduced to 86. Regardless of incentives, the modelling shows the bulk of the pressure would be felt in the western and outer metropolitan regions of Melbourne, where high population growth and a greater reliance on cars could further exacerbate the pressure on the network.
For more information on the load profiles, spatial analysis and the methodology underpinning them, see the KPMG `Automated and Zero Emission Vehicle Infrastructure Advice Energy Impacts Modelling' report.
40

Figure 14: Projected capacity and maximum demand of zone substations – Electric Avenue (non-incentivised)
Source: KPMG energy modelling
Employment impacts of flicking the switchMuch of the discussion around automated and zero emissions vehicles includes the potential changes to jobs associated with automated vehicles. However, the emergence of battery electric vehicles is where the employment impacts of new vehicle technologies may begin to be felt.
Battery electric vehicles have fewer parts in their design and operation compared to petrol and diesel vehicles. Research undertaken by Deloitte Access Economics on the employment impacts of automated and zero emissions vehicles suggests a 25% reduction in ongoing maintenance requirements for battery electric vehicles in a workforce forecast to employ 16,300 people in 2046, which may lead to some job losses. In addition, nearly 11,000 jobs in the fuelling sector may also be affected, as the evidence suggests battery electric vehicles will mostly be charged at home. Overall, however, new employment opportunities are likely to emerge alongside battery electric vehicles that may offset these potential employment impacts.
The budget impacts of going electricElectric Avenue would also present a challenge to governments due to the shift in spending away from petrol and diesel towards electricity, reducing the amount of fuel excise revenue collected by the Australian Government.
Revenue collected from the fuel excise is not explicitly allocated to road funding or distributed directly back to the states that it was collected from. For the purposes of this
41
advice we asked KPMG to estimate the amount of fuel excise that could be lost in Victoria. Assuming a distribution of fuel excise based on Victoria's share of total population, KPMG forecasts that the value of foregone fuel excise in Victoria would be approximately $6.5 billion in 2046.
Reduced fuel excise revenue is not the only direct financial cost. Zero emissions vehicles currently receive a registration discount in Victoria compared to traditional vehicles. If this policy was to remain in place with a 100% electric fleet, it would cost the Victorian Government around $1.7 billion in foregone revenue in 2046 compared to the base case.
It is important to note that, while we have not quantified the direct government health expenditure savings resulting from eliminating vehicle exhaust emissions, separate analysis of the health impacts of zero emissions vehicles by Aurecon found the health benefit to Victorians is estimated to be valued at around $700 million in 2046.
An electric future?Electric Avenue shows us that, even without automation, a fleet of battery electric vehicles may deliver a range of positive outcomes for Victorians. Completely eliminating vehicle exhaust emissions would deliver real benefits such as cleaner air and improved health outcomes. Governments and the community would see the benefits in the form of health expenditure savings, better environmental outcomes and achieving emissions reduction targets. Likewise, if battery electric vehicles substantially reduce the cost of driving, it would be cheaper to access education and jobs. This is good news for everyone, but especially for Victorians on lower incomes.
This scenario also illustrates some major challenges that lie ahead if zero emissions vehicles are to become a reality. While cheaper car travel may seem like a good outcome, the impact on the performance of the transport network due to the cheaper operation costs of a car may actually offset some of the accessibility benefits of battery electric vehicles. In this case, the government may need to look more to initiatives that tackle congestion.
Based on the assumption that the additional electricity generation capacity requirements for battery electric vehicles comes from zero emissions sources, significant extra demand for electricity will mean a lot more investment is likely to be required in zero emissions generation and storage technologies. Some of the impact of additional energy demand could be managed through smart charging mechanisms sending the right price signals to consumers.
KPMG also found that current regulatory schemes could also hinder the ability of electricity distribution businesses to respond to growth in battery electric vehicles by financially discouraging them from incurring additional costs to upgrade their network without prior approval. Under current regulatory settings, electricity distributors can cover the costs of the additional infrastructure requirements, but are required to submit infrastructure investment plans for prior approval. If additional infrastructure is required in between approval periods, this planning cycle may prevent distributors from being able to respond quickly to changes in patterns of demand.
42
A fleet of electric cars is predicted to result in a change to the waste streams entering the Victorian waste and resource recovery system. Vehicle batteries in particular will present a new type of waste to be managed. Lithium-ion battery waste could present a challenge to governments if battery recycling is not managed and promoted well. In this scenario, the amount of battery electric vehicle waste generated by vehicles in Victoria alone would more than double current projections for nationwide lithium-ion battery waste.21
Further research by the CSIRO recently found that lithium-ion battery waste is currently growing at a rate of over 20% each year. Battery electric vehicles are likely to further accelerate this growth. The majority of lithium-ion battery waste in Australia ends up in landfill, with only 2% of Australia's annual 3,300 tonnes of lithium-ion battery waste being recycled. This represents both a significant challenge, in the form of the environmental and human health impacts of lithium-ion waste, and a lost opportunity in the form of potential to recycle battery components for other uses. If recycled, 95% of the components can be turned into new batteries or used in other industries.22
Case study: The Netherlands – charging forward on battery electric vehicles
The Netherlands is making a push towards a zero emissions future, with electric buses, commercial chargers and hydrogen all making up different pieces of the puzzle.Zero emissions vehicles are being prioritised as a way to meet the Netherlands' air quality and Paris Agreement targets. The Dutch Government initially set attractive incentives to drive sales of battery electric vehicles, but when targets were met two years ahead of schedule, those incentives were wound back. Today, roughly 2% of Dutch cars (about 125,000) are battery electric or plug-in hybrids.
To support this fleet, a significant network of tens of thousands of public, semi-public and private charging stations has been installed across the Netherlands. Government's role in installing these chargers has varied, with some governments seeing battery electric vehicle charging as a revenue opportunity. Some Dutch city and local governments have installed on-street charging stations where there are high levels of public street parking, and private operators have then bid to operate them. Government sets the cost per kilowatt hour, creating a potentially lucrative revenue stream from car owners. Battery electric vehicle charging accounts that `roam' across countries like mobile phones could become the norm in years ahead.
In the Netherlands, bus fleets are increasingly being required to go electric for amenity, health and environmental reasons. These modern buses provide a quiet and comfortable ride, with no diesel exhaust emissions. Dutch bus operator Connexxion told us the strain on the electricity grid from electric bus charging is an emerging issue, as charging depots require huge amounts of electrical power to run. The bus fleet at Schiphol Airport now includes 100 electric buses, the largest zero emissions bus fleet in Europe. It has also rapidly
21 Randell, P. (2016), Waste lithium-ion battery projections. Victoria: Randell Environmental Consulting.22 Lithium battery recycling in Australia Current status and opportunities for developing a new industry A CSIRO Report, Sarah King, Naomi J. Boxall, Anand I. Bhatt April 2018.
43
become one of the top 10 power users in the Netherlands. This can pose challenges during power outages, especially given the proximity of other priority users, like the airport itself.
The Netherlands is also looking at a diverse range of fuel technologies, including hydrogen, to build resilience. A technology-neutral `green deal' approach is in place to make all buses zero emissions by 2025, and eight hydrogen fuel cell buses are already running across the country. This is compared to 180 battery electric buses, with a national target for 680 by the end of 2019. Gothenburg in Sweden appears to be following suit, recently ordering 30 all-electric Volvo buses to be rolled out in mid-2019. While these numbers are eclipsed by Shenzhen in China, where the city's fleet of more than 16,000 buses has been converted to electric, the Netherlands is leading Europe and taking a zero emissions approach to transport. Another option being considered is a project to import hydrogen generated from solar arrays in Dubai.
The Netherlands shows how progress can be made with supportive policies, commitments to charging infrastructure and zero emissions public transport.
Private DriveAll vehicles are privately owned, electric and automated.
Automated vehicles are a fledgling technology. Concrete evidence on when they will emerge, how they will be used and the benefits they can bring is still limited. What is clear is that automated vehicles have the potential to radically change the way people travel, where people choose to live and work, and how neighbourhoods and streets are designed.
In Private Drive, we've assumed that all vehicles in 2046 are automated and electric, but they're still privately owned.
When will automated vehicles be commercially available in Victoria?
While battery electric vehicles are already on our roads, when automated vehicles will be commercially available is a big question. Announcements of agreements between traditional automobile companies, major technology companies and brand new start-ups are occurring nearly every day, and a range of promises and projections have been made, as shown in Figure 15.
On the basis of the discussions and research that we've undertaken over the last few months, we believe that driverless vehicles are likely to emerge in stages. Early applications of level 4 technologies are likely to be on fixed routes that can be clearly mapped, with the vehicle moving on an `invisible tram track'. This is already happening in trials at a number of universities in Victoria, such as the Autonobus at LaTrobe University. We observed similar automated shuttle technologies in Rotterdam, Helsinki and Singapore. Further commercial applications of this technology are likely to appear within five years in well-defined public transport and shuttle opportunities, though likely with limited scale.
44
Figure 15: Vehicle manufacturers' plans for vehicle automation
Source: Bloomberg New Energy Finance's analysis of company announcements, logos from company webpages and seeklogo.net.
2046
DRIVERLESS ELECTRIC PRIVATE OWNERSHIP
Key findings
Automated vehicles likely to be designed to work on current roads 86% of trips by car, 14% by public transport More people in Victoria can access services more easily Gross State Product $14.9 billion (2%) higher in 2046 Net jobs growth resulting from automated vehicles of around 11,000 3,250 avoided DALYs annually, worth $632 million per year
The next stage is less certain, but many major companies are forming plans for driverless taxi fleets to be deployed in limited areas. Waymo, Google's self-driving car company, is currently testing and planning to open a driverless taxi service in Chandler, a suburb of Phoenix in the US state of Arizona by the end of 2018. The vehicles are likely to be limited to a specific area, with this grid extending over time. Testing has been conducted by Waymo in
45
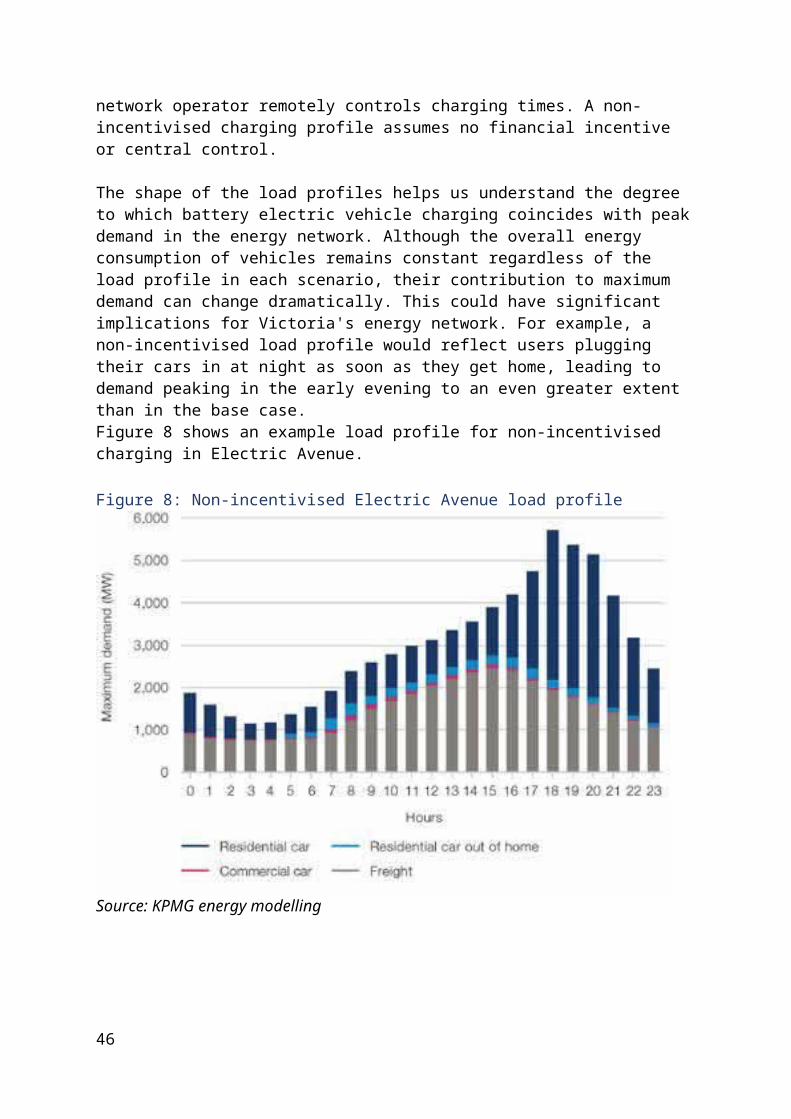
a 10-kilometre by 10-kilometre grid in Chandler. It is reasonable to assume that a similar type of service could appear in Victoria sometime between 2020 and 2025, depending on market conditions and the interest of automated vehicle manufacturers to customise software to the particular road conditions in Victoria. This technology will likely take some time to fully develop and add specific routes or services outside of a dedicated area.
Private cars with driverless features are also being aggressively developed by a number of companies. While many cars have automated features at some level (e.g. cruise control), others are starting to offer vehicles with advanced level 2 capabilities. Tesla is one such example, with a system marketed as `Autopilot'. However, early data has suggested that some people are driving these vehicles as if they were capable of level 3 operation. In the UK, for example, a motorist was recorded riding in the passenger seat of his vehicle while the Tesla Autopilot system was engaged.23
It is not clear whether manufacturers will provide vehicles with level 3 automation for private purchase or whether private vehicle sales will jump directly from level 2 to level 4. While many trials have used a retrofitting approach to fit out their vehicles, the extent to which kits will be made available to retrofit existing vehicles is also unclear.
Levels of automation – why not level 3?While the focus of this advice is on highly automated vehicles (SAE levels 4 and 5), level 3 automated vehicles have some additional risks that warrant discussion. Level 3 is often referred to as `conditional automation', where the vehicle can drive itself in certain areas for part of a journey, but expects the human driver to intervene on request.
Our research suggests that when travelling at level 3 for longer periods, maintaining vigilance over an automated driving system becomes a secondary task and alerts may not draw the attention of drivers away from other activities like emailing or watching videos. Studies from the US National Highway Traffic Safety Administration studies have shown that when operating a vehicle with level 3 automation, the best-case driver response time is 1.08 seconds, but can be as high as 2.5 seconds.24 Others have found that 20 seconds is required for a driver to recover from distractions and focus on the road.25 One study in particular found that alerts could result in fatal outcomes as drivers may not have the appropriate context and awareness to take the right action.26
Given the risks, it is unsurprising that some vehicle manufacturers have publicly stated their intent to move directly from level 2 automated systems to level 4 systems to avoid issues when vehicles suddenly hand control back to a human driver.
23 BBC News (2018), Tesla driver banned for M1 autopilot seat-switch, 28 April. Available at: https://www.bbc. com/news/uk-england-beds-bucks-herts-43934504. Accessed 18 June 2018.24 National Highway Traffic Safety Administration (2015), Human Factors Evaluation of Level 2 and Level 3 Automated Driving Concepts.25 van der Heiden, RMA., Iqbal, ST. and Janssen, CP. (2017), Priming Drivers before Handover in SemiAutonomous Cars.26 ibid.
46
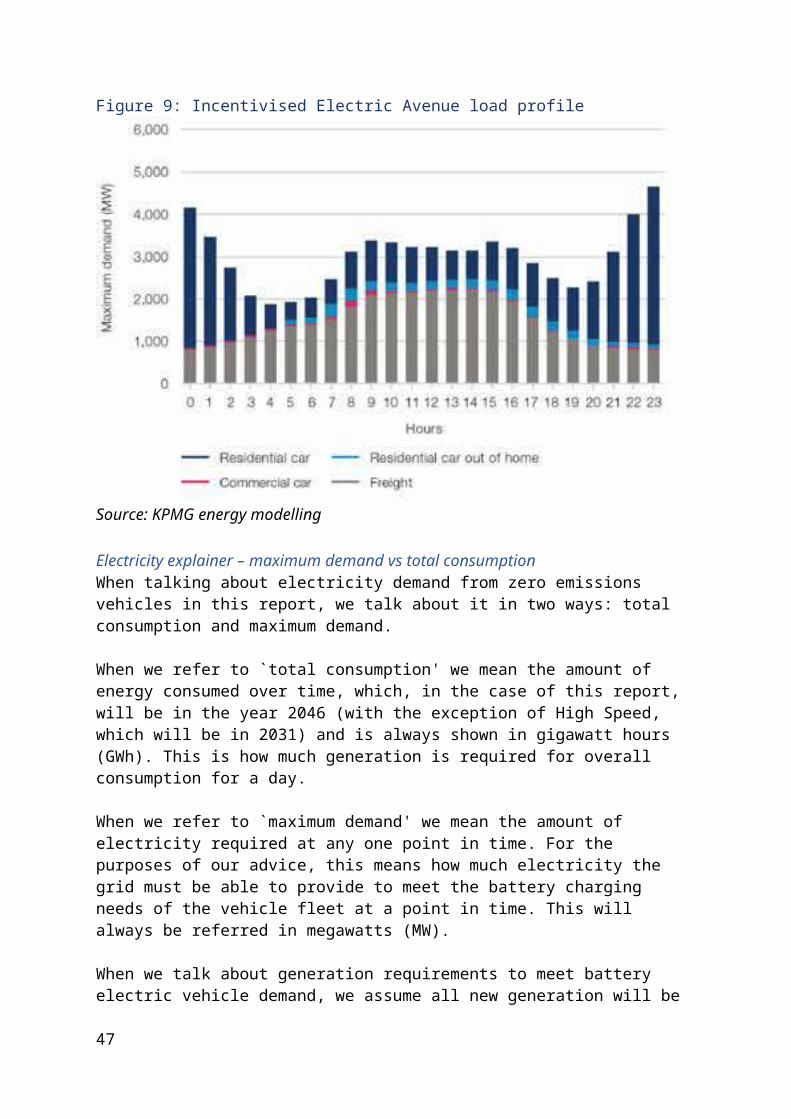
How quickly will automated vehicles take off?While shared or private vehicles may be present on our roads in the next few years, their future market share is anyone's guess. Figure 16 shows the adoption curves for a number of well-known technologies in the US,27 from the telephone, electricity and automobiles to mobile phones, computers and the internet. While the rate of adoption for more recent technologies appears to have increased, there is no guarantee of how long the introduction period will be before automated driving technology is adopted.
That said, if the safety and convenience benefits of highly automated vehicles are realised, it is not difficult to imagine that they may attract a lot of followers very quickly. In particular, if fleet-based services lead the introduction of automated vehicles, we could see a significant shift in the market through the import of vehicles for commercial launches, as compared to individuals choosing to purchase a new driverless car upon retirement of their existing vehicles.
Technical advice on socioeconomic impacts for these vehicle technologies has suggested that take-up is likely to be uneven, with early adoption concentrated in the highest income brackets (groups 4 and 5 in Figure 17 with annual incomes greater than $78,000), followed sometime later by those earning $33,800– $77,999, and finally by those earning less than $33,799 (groups 1 and 2). For more information on the specifics of this analysis, please see the Deloitte Access Economics report Automated and Zero Emissions Vehicles Infrastructure Advice Socio-economic impact analysis.
While this chart shows 100% adoption in 2046 (as per our scenarios), this is an assumption rather than a projection. Reality is likely to be much messier than the smooth curves shown above. Adoption will also depend heavily on the market models available; for example, on-demand automated buses would have a very different uptake profile to privately owned driverless vehicles.
Nevertheless, vehicles with driverless capabilities are likely to be offered for private sale in Victoria in the not-too-distant future. Given current targets by global manufacturers, Victorians could have access to vehicles with highly automated (level 4) capabilities within 10 years.28
27 Felton, N. (2008), Consumption Spreads Faster Today, New York Times. Available at: https://www.nytimes. com/2008/02/10/opinion/10cox.html. Accessed 11 July 2018.28 McCowen, D. (2017a), Australian Government: fully self-driving cars. Available at: https://www.drive.com.au/ motor-news/australian-government-fully-selfdriving-cars-decades-away-20170301-gunyh6. Accessed 11 July 2018.
47
Figure 16: Technology uptake trends
Source: Nicholas Felton
But having access to these vehicles doesn't answer the question of how soon we might see a significant number of them on our roads. Opinions are divergent on this question, especially since widespread adoption will be driven largely by consumers' willingness to take up the technology, and there are equally divergent opinions on how comfortable people will be with using automated vehicles.
However, Insurance Australia Group Limited estimated in April 2018 that 48% of vehicles in Australia will be mainly driverless (level 4 or 5) by 2040.29 While it is impossible for us to state with certainty that this is a likely outcome, it does seem to be a reasonable projection given current market information.
Figure 17: Automated and zero emissions uptake curves in Victoria by income group
Source: Deloitte Access Economics
A fully automated road networkAutomated vehicles are assumed to operate much more efficiently than human-driven vehicles, especially when they are connected to each other. Our research has assumed an efficiency improvement of 75% on our road network for automated vehicles. In the Private Drive scenario, where 100% of vehicles are automated, the efficiency improvements (or
29 Harrington, D. (2018), Future of Motor Insurance, IAG Investor Day.
48
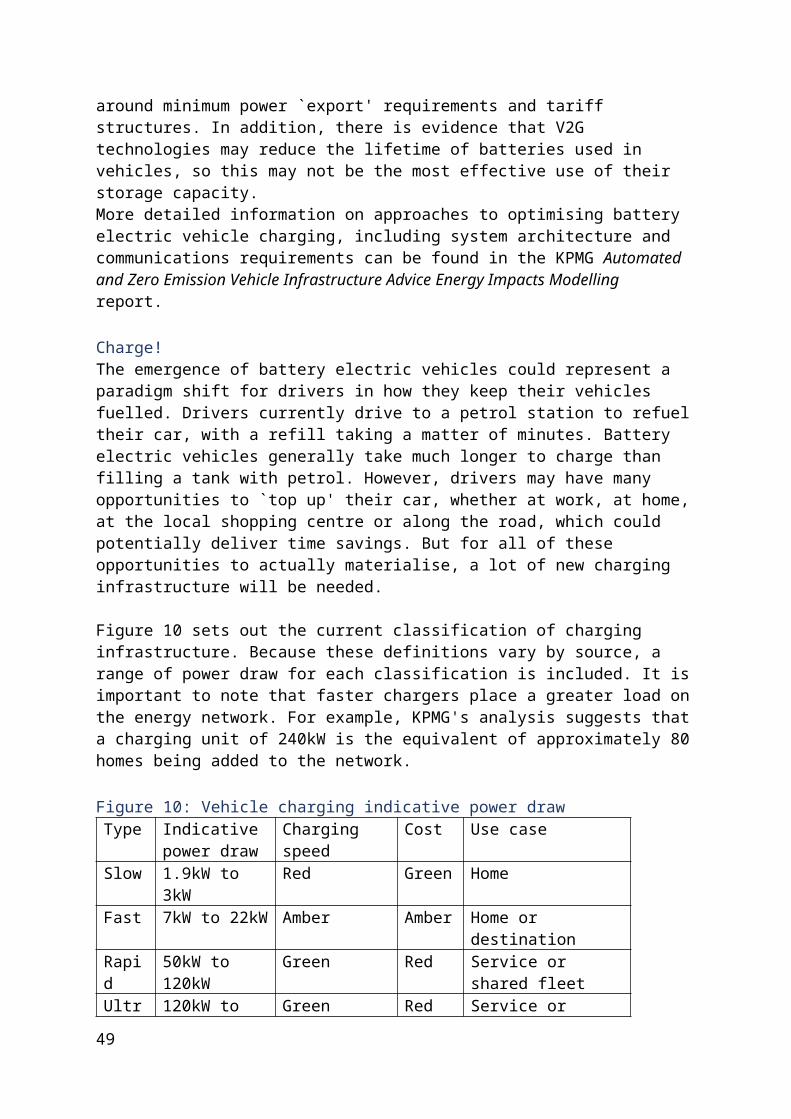
`flow factor') of automated vehicles mean that 75% more vehicles can move through part of the network at a given point in time compared to the base case. We would expect that this efficiency improvement would lead to dramatic improvements in the level of congestion on Victoria's roads in 2046, and this is what we see in our transport modelling results. Overall network congestion is reduced by 31% on average compared to the base case, despite an 8% increase in the number of trips taken. All of these factors combine to make driving to and from work a more attractive option than in the base case, particularly when the occupant of the vehicle is no longer required to focus on the task of driving.
With driving becoming a more attractive option, both in relative and absolute terms, private cars become even more ubiquitous. Our transport modelling illustrates that in the Private Drive scenario, the number of cars in use would be 7% higher than in the base case, while at the same time public transport use declines across all modes. Public transport trips as a share of motorised trips fall from 19% in the base case to 14% in Private Drive. Buses are forecast to see the most significant fall in use (32%), but tram (28%) and train (22%) use also declines significantly in this scenario compared to the base case.
However, there are still nearly 3.7 million public transport trips in Private Drive. This is a significant increase compared to 2015, with 1.7 million public transport trips accounting for 10% of all motorised trips.
The full MABM results can be found in KPMG's report, Automated And Zero Emission Vehicle Infrastructure Advice Transport Modelling.
What is the vehicle flow factor?Automated vehicles have the potential to increase the effective capacity of roads by using road space more efficiently than non-automated vehicles (also referred to as conventionally driven vehicles or `CDVs' in Figure 18). Examples of more efficient behaviour include smaller gaps between vehicles and improved take-off at intersections, with reduced lag time for automated vehicles to respond to a traffic light change.30 31 The flow capacity of automated vehicles is assumed to be between 1.5 and two times that of non-automated vehicles. Figure 18 illustrates the difference in flow capacity between automated and non-automated vehicles, and a mix of both.
For the purposes of developing our evidence base, we have assumed a flow capacity increase of 1.75, or 75%. We also sensitivity tested this assumption by testing the impact of a smaller increase in flow capacity of 25% in MABM.
30 Friedrich, B. (2016), The Effect of Autonomous Vehicles on Traffic31 Levin, MW. and Boyles, SD. (2015), A multiclass cell transmission model for shared human and autonomous vehicle roads.
49
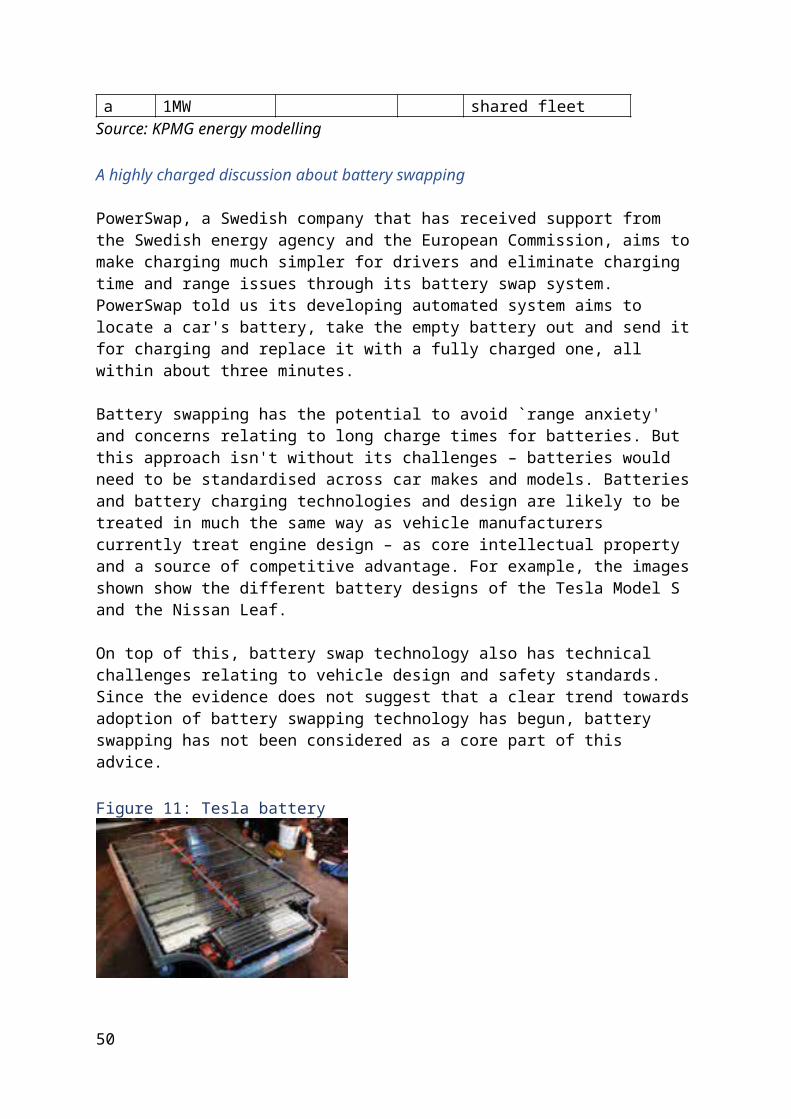
Figure 18: Flow capacity of conventional and automated vehicles in a queue model
Source: KPMG Model Development Report
Robot roadThe network-wide benefits of automated vehicles mask some potentially significant challenges.
Since automated vehicles don't need a driver, they have the ability to return home to avoid parking costs, to recharge themselves after dropping their occupant off at work or at school, or possibly to conduct courier-like tasks. All of these empty vehicles are projected to increase traffic in the inner areas of Melbourne, where most of the jobs are but fewer people live. We call this phenomenon `empty running'.
MABM shows that empty running could cause large increases in congestion in the inner areas of Melbourne (and large reductions in parking revenue for inner urban areas). Because of this, the network-wide efficiency gains are not realised in the Melbourne CBD and surrounds. In fact, traffic speeds in this area are projected to fall by 29% compared to the base case because of empty running, meaning people in cars and buses could be delayed around five and a half minutes extra per kilometre on average. Figure 19 shows a snapshot of the increased vehicle use in the inner areas and empty running during the morning peak period.
MABM also showed some increases in congestion on local and arterial roads during the inter-peak period (between 9am-3pm) from empty running. This is likely driven by automated vehicles running empty in the morning after dropping their owners at work and returning in the afternoon to pick them up, all the while using local and arterial roads to avoid tolls.
Melbourne's parking levies play an important role in managing congestion in busy inner-urban areas by sending a price signal for drivers in the CBD and surrounds, but with vehicles able to return home to avoid this charge, this demand management function is reduced. An area-based cordon charge could be introduced to replace this effect of the parking levy and mitigate some of the impacts of empty running.
We asked KPMG to test the impact of an area-based charge by applying a charge of $5.00 to drive in inner urban areas, within about 5km of the CBD, during peak times (7–9am and 3–
50
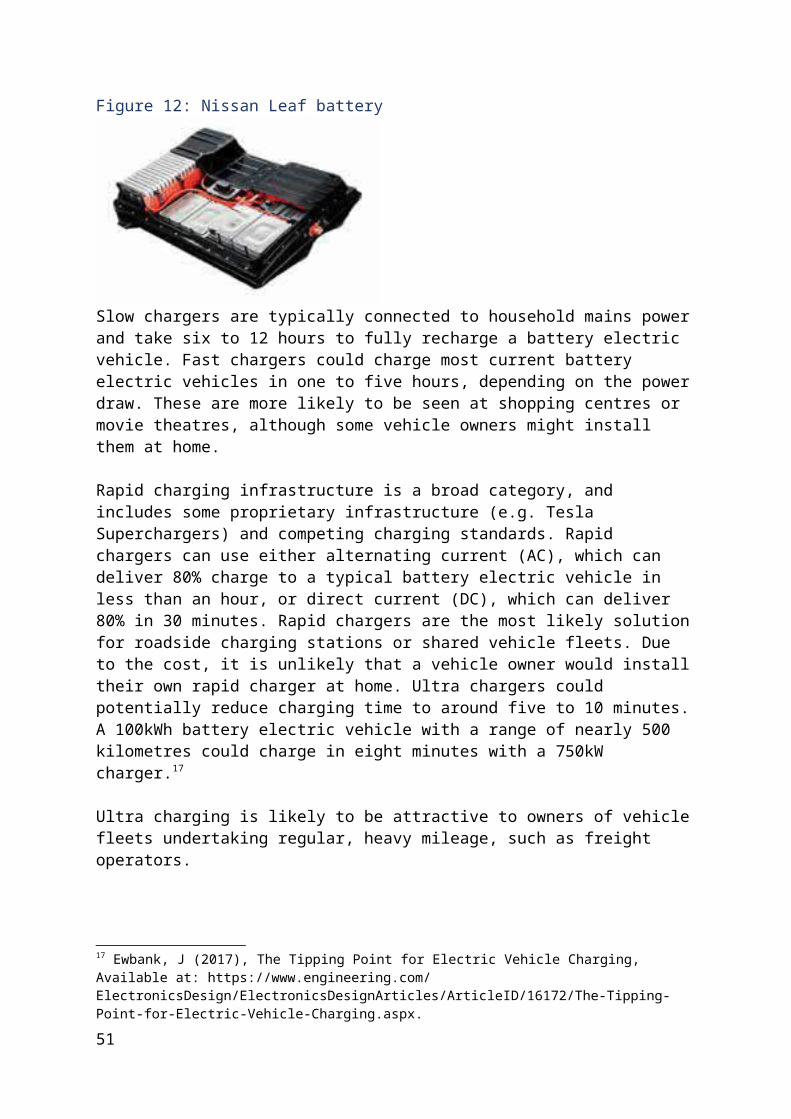
6pm) and $2.50 at all other times. The modelling showed network delays in the inner city falling by 6 seconds per kilometre as a result of this charge. This suggests that an area-based charge may be an effective way to counteract the congestion caused by empty running.
Figure 19: Change in speed from the base case – Private Drive
Source: KPMG Transport modelling (MABM)
Automated vehicles and population dispersionThe impacts of quicker, more convenient journeys to work and a greater number of cars on inner city and inner suburban streets are expected to work in concert to affect the distribution of people and jobs in Melbourne. Automated vehicles have the potential to fuel population dispersion by reducing the inconvenience of long commutes. But they also offer new possibilities to increase the density and appeal of cities by making them more convenient, safe and efficient.
Modelling of land use in Victoria shows that the increased congestion from empty trips in inner urban areas would most likely significantly reduce the amenity of these locations, making them a relatively less appealing place to live. At the same time, the general shift in preference towards car travel makes access to major roads especially important for businesses and households.
SGS predicts that the combination of faster commuting times and more congestion in inner urban areas would cause people to move from inner urban areas to the middle ring suburbs with good arterial roads and access to freeways, as shown in the map below.
Some jobs are forecast to follow this pattern of movement, with Sunbury, Maroondah and Frankston projected to experience some of the biggest spikes in jobs growth in this scenario.
51
However, jobs in knowledge-intensive industries like financial services are still likely to cluster in the CBD, leading to additional commuting trips to the CBD from these suburbs.
To understand the impact of a more dispersed or consolidated city on the transport network, we ran two alternative land use outcomes for the Private Drive scenario in MABM based on those created by Infrastructure Australia for their Future Cities: Planning for our growing population report. MABM showed that these different patterns of land use do not materially change the traffic modelling results of the Private Drive scenario. This result gives us confidence that the results of our modelling will hold no matter how Melbourne grows.
Figure 20: Dwelling change from the base case – Private Drive (empty running)
Source: SGS Economics & Planning
Automatic for the regionsSGS's modelling also predicts consolidation of population and jobs in major regional centres, most notably Geelong and the surrounding areas to the west, Barwon-West and the Surf Coast. The table below shows the predicted growth in dwellings in these areas in the Private Drive scenario, with a number of different assumptions, including removing `empty running', and a different value of travel time (low marginal utility of travel time (MUTT), as described in the assumptions section). Low MUTT is intended to reflect the possibility that people will be prepared to accept more time in an automated vehicle, because they are free to focus on tasks other than driving.
In all versions of Private Drive, Geelong and its surrounds are forecast to grow considerably. Geelong's population is forecast to be 275,000 in 2046. Assuming an average household size
52
of 1.9, adding up to 12,000 additional households to the base population could represent a population increase of around 8% in this scenario.
These changes are likely to be driven by access to jobs. As automated vehicles are likely to make commuting more appealing, Geelong becomes more accessible from the Barwon-West and Surf Coast areas. Geelong itself is already well-connected to Melbourne. Baw Baw could grow thanks to its proximity to job centres in Melbourne's south east. Heathcote, Castlemaine and Kyneton could also see some growth as these towns are located between the jobs in Melbourne, Ballarat and Bendigo. Bendigo is projected to see very little change in Private Drive compared to the base case. This is likely the result of Bendigo's distance from Melbourne when compared to Geelong and Ballarat, meaning automated vehicles are unlikely to provide significantly greater access to jobs in Melbourne.
Figure 21: Change in dwellings – regional Victoria
Source: SGS Economics & Planning
Automated is accessibleThe lower cost of battery electric vehicles (as outlined previously in Electric Avenue) and the convenience of automated driving could also dramatically improve accessibility for all Victorians. Deloitte Access Economics' analysis of the impacts on access to services of automated and zero emissions vehicles predicts that Private Drive will deliver the greatest accessibility benefits of all the scenarios.
Access to schools, hospitals, public transport and activity centres is projected to be considerably better due to the combination of increased convenience and low out-of-pocket costs. However, even though automated vehicles improve access to services in all areas across all demographic groups, there are still pockets of people in the most remote areas of
53

Victoria with relatively poor access to schools, hospitals, public transport and jobs. These are predominately larger rural regions that are characterised by being further away from areas of dense population and that already experience low levels of accessibility to services, such as East Gippsland.
Safer, healthier, but with more complex wasteIn addition to running more efficiently, automated vehicles are widely assumed to deliver improved safety outcomes. A widely cited study in the US found that in 94% of crashes, human error is the primary causative factor.32 This finding has been used as an assumption across all of our work, meaning that our analysis assumes a 94% reduction in road accidents per kilometre travelled. This evidence is supported by local research, which estimates that around 90% of accidents are due to a `minor mistake', such as being distracted or fatigued.33 Compared to the base case (and assuming no other road safety improvements between now and 2046), a 94% reduction would mean up to 17,900 road accidents could be avoided across Victoria in 2046 as a result of automated vehicles.34 This assumption is yet to be proven through verifiable results from a commercial deployment of automated vehicles. However, we consider it a reasonable assumption to make for the purposes of this analysis, acknowledging it may be a `best case' reduction in accidents.
A fleet comprised of automated, zero emissions vehicles could also substantially reduce emissions of pollutants harmful to human health, resulting in health benefits for all Victorians. Using the DALYs approach discussed in Electric Avenue, the benefits of this scenario are projected to be as high as 3,250 avoided DALYs annually, worth $632 million per year in 2046.
However, automated vehicles will further complicate the waste challenges raised by the transition to battery electric vehicles as discussed in Electric Avenue. For the purposes of this analysis, a typical automated vehicle is estimated to generate an extra 10kg of e-waste in 2046. This includes on-board computers, additional wiring, sensors and radars – roughly 79,800 tonnes of e-waste per year overall. To put this into perspective, Victoria's total estimated e-waste in 2016 was 130,000 tonnes.
Case study: Singapore – curbing growing pains with automationWith a population of five million people living and working on an island of just 700 square kilometres, Singapore is facing some unique urban mobility challenges that it is hoping to solve with automated vehicles.
In addition to its land constraints (roads already take up 12% of Singapore's land area), a shortage of drivers, an ageing workforce and increasing and more diverse travel demands are driving Singapore to look to increase active and public transport, as well as introducing automated vehicles.
32 National Highway Traffic Safety Administration (2015), Human Factors Evaluation of Level 2 and Level 3 Automated Driving Concepts.33 QBE (2017), The most common causes of car accidents in Australia.34 Calculated using VicRoads crash statistics from the 2016-17 financial year, applied to the 2046 population.
54

The transition is backed by a coordinated, government-led approach, with relevant public agencies and private organisations combining to achieve the vision of a `car-lite Singapore', with urban mobility delivered as efficiently as possible.Driverless trains are already a feature of the island nation's public transport backbone, Mass Rapid Transit, and on-demand and fixed route automated bus trials are underway at Gardens by the Bay and Nanyang Technological University. Grab, South East Asia's Uber equivalent, told us it has plans to run automated taxi services in some areas alongside its traditional ride-sharing and taxi services by 2020.
Singapore already combats congestion through peak and off-peak road user pricing and a heavily regulated vehicle licensing scheme. While land constraints are causing some headaches, Singapore's small land mass combined with a clear government mandate creates ideal conditions for testing and rolling out new systems and technologies.Victoria can learn from countries like Singapore and Japan, where an ageing population and driver shortages are creating opportunities to allow driverless vehicles to play an important role in connecting their regional and rural citizens.
In Japan, driverless buses are viewed as a potential solution to unprofitable rural bus services that may be the only connection to larger towns and community services for elderly residents. Softbank Drive, the automated driving arm of technology giant Softbank Corporation, told us that more than 80% of Japanese bus companies are currently struggling to make a profit, requiring about $11 million of government support in 2016. This may be one reason why the reaction to automated bus services has been especially positive in rural areas, where residents may be underserved by existing local routes compared to Tokyo, where the public transport network already runs like clockwork.
But while in Singapore and Japan the government's approach to implementing automated vehicles may look like a modern well-oiled machine, it's clear that even with strong government intervention and an ideal testbed location, rolling out automation is no simple task. Both countries' driverless bus trials are currently running on magnetic sensors to help guide vehicles, and one industry figure told us "if you really want to go to the `Wild West' on public roads, there's still a long way to go".
More productive, but in different sectorsOverall, our research suggests that the impact of automated vehicles could deliver a range of benefits to Victoria. Computable General Equilibrium (CGE) modelling undertaken by Deloitte Access Economics on our behalf suggests that a Private Drive scenario would drive productivity improvements in the Victorian economy, leading to an increase in Gross State Product (GSP) of 2% in 2046 – a $14.9 billion improvement over the base case (see Figure 22). These productivity improvements reflect the economy's ability to produce greater outputs from the same set of inputs. It can reflect better methods of production, higher quality inputs or technological advancements.
Automated vehicles could fundamentally reshape specific sectors, ultimately eliminating the need for some jobs. In the base case, up to 188,000 people are forecast to be working in industries that could be affected by the emergence of automated vehicles, 75,000 of which fall into the freight, taxi/hire car and road public transport sectors. In Private Drive, we
55

assume that all trucks, cars and buses are automated. The modelling shows a fully automated vehicle fleet would lead to the loss of around 72,000 jobs in these industries. While this is a large number, it only makes up a very small proportion of Victoria's total workforce and is likely to be offset by productivity gains and jobs growth economy-wide. Deloitte Access Economics' modelling shows that these initial job losses would most likely be offset by employment growth of around 83,000 jobs in other industries as the overall economy adjusts to the productivity benefits of automated vehicles. Figure 23 shows the projected employment impact on the most affected industries.
It is important to note that these GSP and employment changes represent the impact of automated and zero emissions vehicles at a point in time. Higher GSP is an annual benefit, which will lead to further jobs and income growth over time. Conversely, the initial negative employment shock from automated and zero emissions vehicles is a one-time occurrence. The offsetting employment growth will further contribute to the strength of the Victorian economy over time.
Figure 22: Change in Victorian GSP, Private Drive
Source: Deloitte Access Economics
56

Figure 23: Employment impacts – key industries 2046
Source: Deloitte Access Economics
Automated vehicles and electricity demandThe Private Drive scenario is forecast to have the largest impact on peak electricity demand in Victoria. Of all the scenarios, Private Drive has the highest number of vehicles travelling the most kilometres. Energy network modelling undertaken by KPMG shows that the vehicle fleet would generate an additional 24,000GWh of demand in 2046. This is equivalent to the combined capacity of approximately 30 wind farms at 140MW each, and 81 solar farms at 75MW each.
The charging profiles for this scenario are projected to be largely the same as in Electric Avenue, since both scenarios reflect 100% private ownership, but overall electricity demand is slightly higher in Private Drive. The total consumption is the same regardless of load profile, but the contribution to maximum demand differs considerably. With incentivised charging, the vehicle fleet is forecast to add slightly more than 3,500MW to maximum demand during peak hours (see Figure 24). Without incentivised charging, this would increase to over 6,700MW of electricity demand during the peak (Figure 25).
57
Figure 24: Private Drive load profile – incentivised
Source: KPMG energy modelling
Figure 25: Private Drive load profile – non-incentivised
Source: KPMG energy modelling
58
Figure 26: Projected capacity and maximum demand – Private Drive (incentivised)
Source: KPMG energy modelling
Private Drive is predicted to place even more pressure on local distribution networks than Electric Avenue. Figure 26 illustrates the zone substations KPMG projects to exceed their projected capacity with an incentivised profile, which is the best-case assumption for Private Drive.
As the map shows, a number of zone substations would exceed their rated capacity in this scenario – 89 in total. As with Electric Avenue, the majority of affected substations are located in the outer west and regional areas. Where no incentives are in place, this number increases to 120 in broadly the same pattern.
Automation and Victorian roadsAutomated vehicles are not likely to require wholesale changes to road network design to operate in Victoria. Arup's analysis of the effect of automated vehicles on road design found that the design, operation and maintenance of road assets, such as pavement and structures (like bridges) are influenced by a number of factors, primarily expected maximum axle weights and the configurations of heavy freight vehicles. At present, there is no evidence that automation will lead to significant increases in the weight of heavy vehicles beyond levels currently permitted on Victorian roads.
However, to enable early take-up across the broadest range of automated vehicles, some physical infrastructure and maintenance regimes may need to change. We heard from numerous stakeholders that early introduction of vehicles with high levels of automation is
59
likely to be heavily dependent on roads being of good quality with clear lines and signs, and no pot holes.
Victoria could also undertake changes proactively. For example, in-vehicle Traffic Sign Recognition (TSR) systems would benefit from reductions in text-based signs on roads, such as time-based 40km/h speed zones, with varying time limitations. For automated vehicles to respond appropriately, machine-readable stickers or other digital solutions are likely to be required. Alternatively, this information may be able to be provided digitally to automated vehicles if reliable information could be provided from a single authoritative source (such as VicRoads). Any changes to signs would need to be planned carefully due to the number and complexity of existing signs in use throughout the state.
AustRoads and Standards Australia are working to develop a consistent and uniform approach to line marking in Australia, as well as investigating technologies to prolong the life of line markings. This research is expected to be concluded in 2019. At present, the quality of line markings on Victorian roads is not subject to a routine survey process. This lack of current data and future specifications makes it impossible to estimate the total budget required for upgrading lines at present.
Are there any roads in Victoria that are unsuitable for automated vehicle use?According to VicRoads, there are approximately 150,000 kilometres of roads open for general traffic and a further 50,000 kilometres of other minor roads and tracks in parks and forests.35 The Australian Bureau of Infrastructure, Transport and Regional Economics (BITRE) estimated that in 2015, 63,132 kilometres out of a total 145,736 kilometres in Victoria are unpaved, or about 43%.36 Will automated vehicles be able to travel on these roads?
Internationally, the deployment of automated vehicles has tended to focus on urban areas, though there are a few notable exceptions. In our discussions with the Japanese Government, for example, they highlighted that improving access and connection for rural residents is one of the primary objectives of their automated vehicle trials. New South Wales is also conducting regional trials of automated vehicles.
What we've found through our discussions with stakeholders is that the technology in automated vehicles is likely to be able to cope with unsealed roads – eventually. Three main factors will determine how quickly this happens.
First, automated vehicles are currently being designed to `read' our roads using sensors that, for now, rely heavily on visual feedback from existing lines and signs. Unsealed roads without line markings are therefore likely to pose a challenge for these technologies. However, we also heard from some manufacturers that their vehicles are operating on roads without lines now, though they may be slightly less accurate in their positioning on the road without this data.35 Vicroads (n.d.), Victoria's road network. Available at: https://www.vicroads.vic.gov.au/traffic-and-road-use/road-network-andperformance/types-of-roads/victorias-road-network. Accessed 21 June 2018.36 Department of Infrastructure and Regional Development (2017), Growth in the Australian Road System. Available at: https://bitre.gov.au/publications/2017/files/is_092.pdf.
60
Second, automated vehicles are currently being designed to address the most pressing priorities for operation, which, from a business point of view, means those that are most commercially viable. Commercial viability in the car industry generally means high density locations. However, deployments in some major cities in North America and Europe will need to be able to operate in snowy conditions, which will require vehicles to rely on similar sources of information that they would need to operate on unsealed roads. This commercially lucrative market may therefore act as a training bed for the vehicles to develop the required skills for unsealed road navigation.
Third, operating driverless vehicles on unsealed roads is likely to require detailed mapping of these routes, possibly with a driver behind the wheel before they can be operate autonomously. While possible, this is likely to take time.
Therefore, while unsealed roads are not likely to be a barrier to uptake of automated vehicles in the long term, it may take some time to get there.
Automated vehicles – driving data usageWe expect automated vehicles to collect and transmit data as they travel to help them understand the world around them and communicate with other vehicles on the road. Analysis undertaken by WSP estimates that automated vehicles will send and receive approximately 20 megabytes per driving hour – half of which is data communicated by the vehicle (sent), while the other half is received by the vehicle. Freight vehicles are likely to have similar ICT requirements to passenger vehicles. The projected data use of automated vehicles in 2046 is around 0.4% of what WSP forecasts personal data usage to reach in the next three years. In this context, automated vehicles are not likely to require additional investment in data capacity.
Based on the number of vehicles on the network in this scenario, WSP predicts that additional data generated by the vehicle fleet will be around 184 terabytes a day. It estimates that around 3,300 terabytes of this vehicle data per year will need to be stored by fleet operators in case it is needed to assist with legal queries. WSP estimates that stored data could be held for a month before it is compressed and transferred elsewhere for long-term storage.
How does an automated vehicle know where it is?There's a lot of confusion about the various types of technologies that may be required to support automated vehicles on Victorian roads. Our research suggests that automated vehicles will be designed to operate on roads without having to be connected to each other, to infrastructure or to a remote or cellular network. Instead, in-vehicle systems are used to `read' our current infrastructure, including lines, signs and traffic lights with a variety of sensors, including cameras, radar and LIDAR. The vehicle then determines the correct behaviour around these objects using an on-board computer to bring together and interpret the various inputs.
However, there is a potential advantage in mobile connectivity for automated vehicles in providing another source of information for the vehicle to improve its understanding of its
61

surroundings and realising the potential efficiency gains of automation. For example, in addition to reading a traffic light, the traffic light could send a signal to an automated vehicle to let it know that it is about to change, or a signal could help the vehicle to confirm that it should continue travelling along its current path if there is a break in the lines on the road, like at an exit ramp from the freeway.
WSP has found that, to achieve a minimum level of connectivity, automated vehicles are likely to require the complementary technologies of cellular data coverage and the ability to communicate with roadside infrastructure at critical intersections on all roads with high rates of traffic or where they are desired to operate at full functionality. The existing roadside infrastructure is likely to be able to support the minimum connectivity required for automated vehicles in 2046 either by design or through retrofitting. However, the preferred technology for short-range vehicle-to-vehicle and vehicle-to-infrastructure communication in the longer term is still unclear.
Metropolitan Melbourne and regional Victorian towns and cities are likely to already have sufficient cellular data coverage for automated vehicles to operate, but in some rural areas coverage is patchy. Mobile network coverage would need to be extended to support the operation of automated vehicles in rural areas. WSP's analysis identifies a minimum of 134 additional mobile towers in rural and regional areas to provide a minimum level of coverage, outlined in Figure 27.
Figure 27: Minimum mobile coverage requirements for automated vehicles
Source: WSP
62
To fully realise the benefits of automated vehicles across Victoria, WSP suggests that the cellular data network would need to be extended to all sealed roads. This is projected to increase the number of towers required 15-fold to 2,098 towers covering an additional 14,731 kilometres of road network at an estimated cost of about $1.1–$1.7 billion. The Victorian Mobile Black Spot Project and Australian Mobile Black Spot Program, which invest in telecommunications infrastructure to improve mobile coverage along major regional transport routes and in regional communities, thereby have the potential to also support the operation of automated vehicles in rural and regional Victoria.
We have not included unsealed roads in the assessment of ICT infrastructure or cellular data requirements because it is still unclear whether vehicles might be able to operate on unsealed roads using a combination of other systems or satellite positioning. For example, improved positioning systems for automated vehicles could help navigation on roads without line markings, as improved satellite precision (within 1–10 centimetres) would allow automated vehicles to use a remote signal as a primary input to establish their location on a road. However, vehicles would still need to use sensors to identify and navigate around objects near the vehicle, like cars parked on the road, trees or animals. Further, the potential cost required to install mobile towers on all unsealed roads means that this would be unlikely to happen solely for the purposes of enabling automated vehicles.
In the long term, if automated vehicles completely replace conventional vehicles, developments in positioning technology could evolve to be a primary source of positioning data, reducing the need for in-vehicle positioning capabilities. For example, Satellite Based Augmentation Systems, currently being trialled by the Australian Government for other purposes, may provide this function, where available. Improvements in positioning technologies may make it possible to remove some visual infrastructure in favour of more flexible, demand-responsive traffic management that communicates directly with connected vehicles. Speeds, lane directions and road network prices could be updated to respond to the immediate needs of the transport network and communicated directly to the vehicles or their occupants to make decisions about how best to move around.
Coverage, reliability, safety, redundancy and cyber security issues would need to be resolved for this to eventuate. This would include things like the roll out of ubiquitous mobile coverage with `safety' level reliability, roadside infrastructure where mobile data or positioning coverage is typically inadequate (such as in tunnels and dense urban areas), or using overlapping systems to increase redundancy in communications. However, the timeframe for full deployment of automated vehicles is far enough in the future that we expect that these issues can be addressed incrementally.
For more information on the technical ICT infrastructure requirements, see WSP's `ICT Infrastructure Advice for Automated and Zero Emission Vehicles' report.
Talking cars will require roadside infrastructure that listensThe technology that enables cars to `talk' to road infrastructure, other vehicles and even other road users is often referred to as `vehicle-to-everything' or V2X. For example, a communications unit installed along the side of the road could help provide improved location services to vehicles, control traffic signalling and optimise traffic flow. Roadworks
63
sites are an example where V2X technologies will likely be essential, at least in the medium term. Roadworks are one of the highest risk work and transport environments. At present, Victoria has a system to register and manage roadworks that is linked to mapping systems, but it does not always reflect road conditions on a given day. A V2X infrastructure response would be able to provide information to automated vehicles encountering roadworks, allowing them to respond appropriately.
Figure 28 illustrates the relationship between `vehicle-to-infrastructure' or V2I roadside units, mobile towers, vehicles and the cloud. Vehicles can communicate with roadside infrastructure directly, and with each other via mobile networks. The V2I infrastructure can provide essential information on things such as road conditions and traffic flows, while vehicles communicating with each other provide an additional layer of safety. Other road users, such as pedestrians and cyclists, may `opt in' to the connected network for efficiency purposes, but it is essential that safety should be guaranteed regardless of whether they decide to use this technology. Options could include embedding transmitting devices in bicycle helmets or using mobile phones to indicate their position.
WSP's analysis suggests that by 2046 there would be a minimum of around 1,280 sites where V2X infrastructure would be critical to network function, and up to 6,626 sites to fully optimise the network. The ICT infrastructure requirements for the Private Drive scenario reflect the highest level required from a maximum data use perspective, as this scenario represents the largest fully automated vehicle fleet of all the scenarios. WSP found that the overall ICT infrastructure requirements don't vary significantly from scenario to scenario, with variations only in the amount of data generated by the vehicle fleet.
Figure 28: Connected automated and roadside infrastructure
Source: WSP
64
Ground control to automated vehicleExisting road network control systems will need to be supported in the short to medium future. Both WSP and Arup have found that, for the efficiency and flow gains of automated vehicles to be fully realised, vehicles will need to be connected to the transport system. This includes not only an optimum level of ICT infrastructure, but also some form of proactive overall fleet routing control and optimisation. This is likely to require a centralised traffic management centre that provides network monitoring, could monitor vehicle routing and provide critical updates on unexpected changes in traffic conditions and natural disasters, for example in the event of a road accident, new pothole, flooding or a tree falling across the road. In some circumstances, road operations may get worse without connectivity, for example if automated vehicles allow more conservative headways or are unable to use complex intersections and road layouts. Figure 29 illustrates what a future network management system might look like.
A centralised network management approach would require new ICT infrastructure to collect, integrate and manage the different control and reporting systems. WSP's analysis suggests that doing so would require a high level of coordination between public and private organisations in sharing data. New technologies based on the principles of open data and using application programming interfaces (APIs) are needed, and likely to be able to address the technological requirements to do so.
The policy settings to encourage this data sharing need to be carefully considered and recognise that data sharing should be a two-way street. To fully realise the benefits of automated vehicles, vehicles and fleet operators will need up-to-date information on the traffic network, while network operators will require access to vehicle data for network management and optimal routing purposes. Data privacy and security will be a key consideration in any future open data arrangements.
Cyber security is another concern for automated vehicles. The Commonwealth Department of Infrastructure, Regional Development and Cities is responsible for the development of a national cyber security strategy. While this strategy will have implications for Victoria, as it is not directly related to the infrastructure requirements for automated and zero emissions vehicles, we consider it outside of the scope of our work.
65
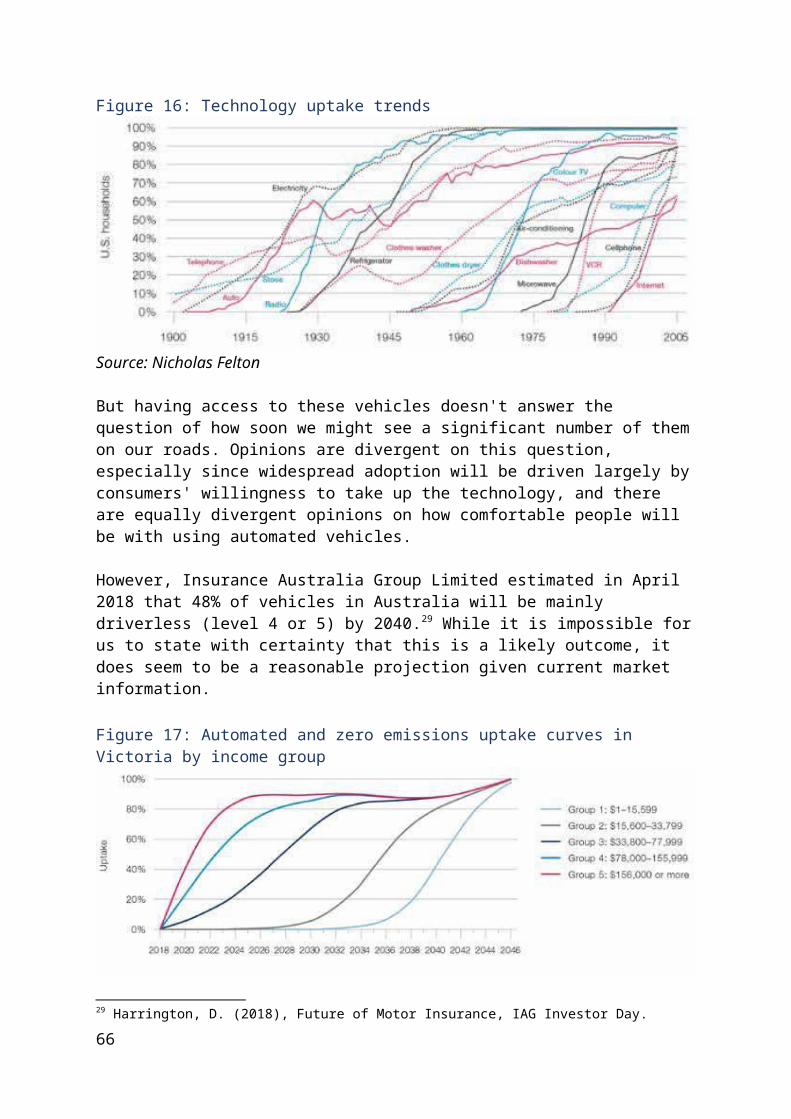
Figure 29: Connected transport system design
Source: WSP
Automated vehicles and your neighbourhoodAutomated vehicles have the potential to radically reshape the way we design our cities and neighbourhoods. A fully automated vehicle fleet connected digitally to infrastructure could ultimately require less or no visual infrastructure, such as road signs, line markings and traffic lights.
The ability of automated vehicles to drop their occupant off at their school or workplace and then return home (or travel somewhere with no parking costs) could also free up much of the car parking space currently provided in space-constrained urban areas like inner Melbourne, suburban town centres and regional centres. This presents opportunities to repurpose unused space for other uses. However, residential parking would still be needed in the Private Drive scenario. Streetscapes may need to change, where existing on-street parking is changed to kerbside access for pick-up and drop-off. Chargers on the footpath could actually reduce pedestrian space if not well planned.
We examine these opportunities in more detail in our discussion of the Fleet Street scenario.
So what do we know about private automated vehicles?Private Drive shows the benefits of a fully automated vehicle fleet, and the effect is dramatic. If the potential improvements in the flow of automated vehicles are actually translated into on-road gains, the modelling shows that the capacity and efficiency of Victoria's road network would be greatly improved, particularly Victoria's freeways. The appeal of automated cars is forecast to pull a large number of people off public transport and into cars relative to the base case. This may or may not be a bad thing if automated and
66
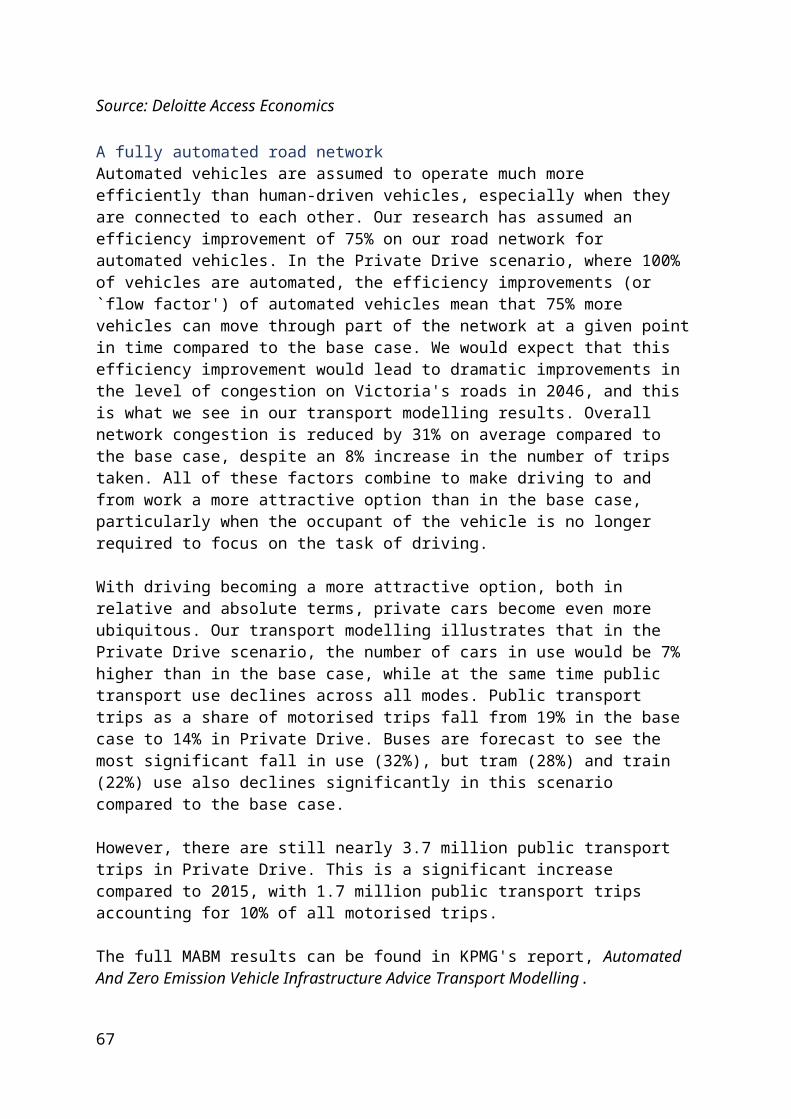
zero emissions vehicles deliver significant environmental benefits and provide improved mobility for people. This would lead to travel time savings for commuters, and could present an opportunity for government to delay or avoid some major road capital investments.
Further, traffic accidents could be almost entirely eliminated and access to services could be improved across Victoria. In this scenario, all of these benefits would be added to the already significant environmental and population health benefits we described in the Electric Avenue scenario.
Automated vehicles could also provide significant productivity improvements that could deliver ongoing economic dividends to Victoria through more jobs and higher economic growth.
Unfortunately, these benefits would not be evenly felt, and automated vehicles could lead to some unexpected and potentially unwanted outcomes.
The ability of automated vehicles to drop off an occupant and return home to charge or go elsewhere to avoid parking fees – commonly referred to as `empty running' – is predicted to cause large amounts of congestion in the inner areas of Melbourne, as outlined earlier. The extra congestion resulting from this empty running may contribute further to emerging patterns of land use, in which the population of Melbourne becomes more dispersed due to people being prepared to accept longer commutes. From greater population dispersion in Melbourne to significant changes in the distribution of people and jobs in a number of regional Victorian centres, the changes in travel behaviour brought about by automated vehicles in this scenario would likely place strained infrastructure under greater pressure.
What if automated vehicles are not zero emissions?While we expect to see automated and zero emissions vehicles progress in tandem, there is a possibility that some automated vehicles could be petrol or diesel fuelled. As the focus of our advice is on zero emissions vehicles, we have not undertaken an in-depth consideration of this scenario. However, if automated vehicles were still petrol fuelled, the projected increases in travel resulting from automation could lead to a significant increase in vehicle emissions. Based on the assumed operating cost of a traditional petrol vehicle, we would expect a 14% increase in kilometres driven over the base case, leading to a similar increase in vehicle emissions. This would have flow-on effects for a number of environmental and population health measures, including:
additional DALYs from airborne emissions challenges in meeting emissions targets continued reliance on fossil fuels.
Case study: Arizona, US – government and private sector driving AV progress
67
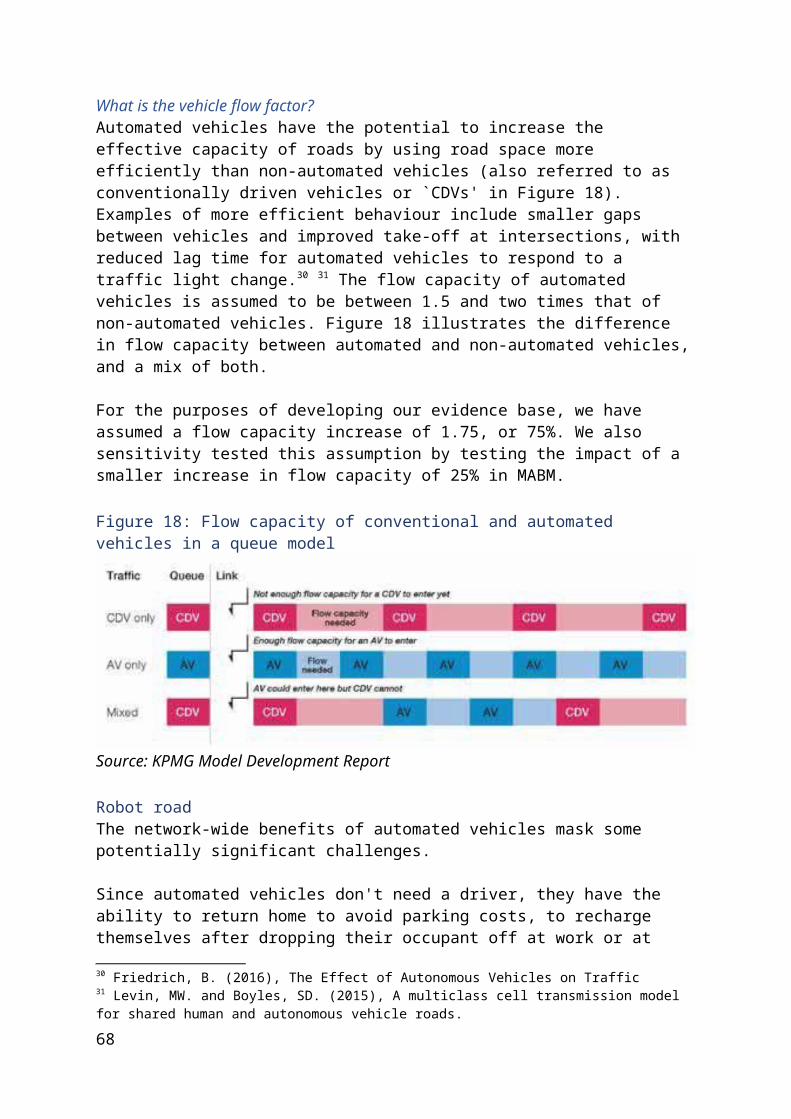
The state of Arizona in the US has implemented a strategy to attract automated vehicle companies to the state, and the experience has lessons – good and bad – for other governments.When the incumbent Governor Doug Ducey took office in 2015, automated vehicle technology was identified as a key economic growth priority for the state. Compared to other US states, Arizona decided to partner with automated vehicle companies rather than regulate them. A number of companies leapt at the opportunity, and Waymo (formerly the Google self-driving car project) was among them.
In 2015, Arizona decided to legally define `driver' as human or computer, whereas in other states like California, a back-up driver is always required. In the race to develop automated vehicles, being able to test on public roads is a major advantage, which has driven investment in Arizona. In other jurisdictions, automated vehicle trials are predominantly running on short, pre-programmed routes with safety personnel in abundance, whereas Waymo is testing vehicles in automated modes on public roads without back-up drivers.Looking to the future, a fully automated vehicle fleet has some obvious challenges to overcome. How will an automated vehicle refuel or charge? Who will maintain the cars? To address these issues, Waymo signed a deal in 2017 with rental car company Avis in Phoenix to service and store its automated vehicles. This deal shows the potential for new industries to spring up as the share of automated vehicles grows – and Arizona has a foot firmly in the door of this growing market.
The perception of automated vehicles in Arizona is notably different than in other jurisdictions. One government representative told us he felt his children would be safer in an automated vehicle than in one he was driving, when he can be distracted by emails, his children or the behaviour of other drivers. In his view, automated vehicles are safer because they are always 100% focused on the task at hand. The general community reaction to automated vehicles in Chandler has also been a bit of an anti-climax – they are seen as `boring' drivers, with one person we met with telling us it's "like driving behind my Grandma".
No changes o infrastructure have been needed to operate automated vehicles in Chandler. Instead, the first step for Waymo when launching in a new city is to compile hyperdetailed 3D maps of the operating area before moving to testing and simulation. While Waymo told us that smart infrastructure would be used if it were available and better lane markings would assist with navigation, the company is assuming no changes will be made to accommodate its vehicles.
However, several high profile accidents in the first half of 2018 have caused some trials to stall, and had an impact on community confidence. In March 2018, a woman was struck and killed by a self-driving Uber while crossing a road in Tempe, Arizona. A Tesla operating in Autopilot mode crashed in the same month, killing its driver. Following the Tempe accident, Uber suspended its driverless car fleet across the US and Canada, and shut down its program in Arizona. The government also hasn't been immune to criticism in these incidents; US non-profit group Consumer Watchdog labelled Arizona "the wild west of robot car testing".
68
Arizona's approach to relaxing regulation and partnering with the private sector to support the automated vehicle industry has shown the rapid progress that can be made. The accidents in the first half of 2018, however, highlight some challenges on the road to progress.
Fleet StreetA shared fleet of electric and automated vehicles.
On-demand vehicle services are an emerging market model where fleets of vehicles owned by companies are used by individuals on short trips for a fee. On-demand vehicle services are becoming an increasingly popular alternative to vehicle ownership, particularly for trips in urban areas. In this scenario, nobody owns their own car, and instead are required to use on-demand automated vehicles that effectively function like taxis, with a similar fare structure. While people might share the trip with a friend or partner, we have not assumed they would share with strangers, and have not tested carpooling in the transport modelling. However, we separately surveyed Victorian motorists to find out how they might use a driverless car in the future, including the potential to ride-share. The results of this survey are discussed later in this report.
A 100% shared automated vehicle fleet represents the most radical departure from our base case scenario.
The Fleet Street FleetOn-demand automated vehicles are expected to have the most dramatic impact on Victoria out of all the scenarios we considered. International evidence suggests that, in a shared fleet scenario, all of Melbourne's transport demand could be met with a much smaller vehicle fleet, and our transport modelling supported this.
In the Fleet Street scenario, the transport modelling shows the vehicle fleet shrinking from 3.5 million to 260,000 – a 93% decrease. Individual vehicles go from being in use only 4.8% of the day to 36% of the day. This seemingly dramatically reduced vehicle fleet could meet Melbourne's travel needs because not everybody travels at the same time. A rule of thumb is that the maximum number of trips occurring in any five-minute interval is only about 5% of all daily travel.
How busy is Fleet Street?In this scenario, the total amount of kilometres travelled by car is forecast to fall. KPMG's modelling shows a 15% reduction in the amount of vehicle kilometres travelled over the course of an average day, as people switch from cars to public transport due to the higher perceived cost of using on-demand vehicles. Congestion is significantly lower and peak time delays are almost entirely eliminated. Average network delays are reduced by 91% while morning peak delays are reduced by 93% compared to the base case. However, the number of automated vehicles `empty running' from one trip to the next keeps traffic volumes high – especially in the inner city. A much smaller vehicle fleet does lead to some additional delays in waiting for a vehicle to arrive. MABM shows that the median wait time across the day is less than two minutes, although this is forecast to increase to just over three minutes during the morning peak.
69
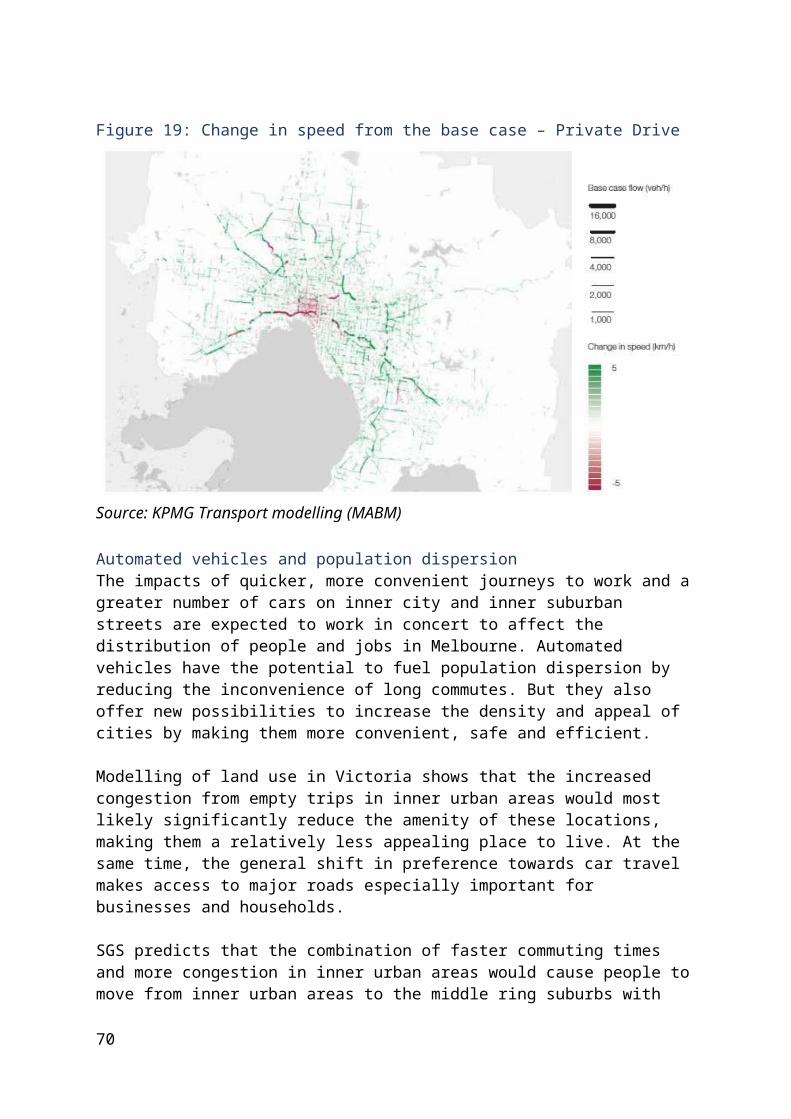
Like in the Private Drive scenario, the effective capacity of Victoria's roads is assumed to significantly increase in Fleet Street, meaning the same road network would operate more efficiently. This could deliver ongoing benefits to Victorians through reduced congestion and faster trips. Governments may also be able to avoid some infrastructure investment and road maintenance costs.
We tested this hypothesis by running the Fleet Street scenario in MABM without any additional road infrastructure that is not already under construction in 2018. This showed that, even without additional investment in the road network, congestion is still lower than the base case. Peak time delays, while worse than with the additional roads, would still be 82% lower than the base case. We chose to test this hypothesis in the Fleet Street scenario because it is the scenario in which the network performs the best, providing us with an opportunity to test possible responses to an unexpected future. It is important to note that this analysis does not necessarily suggest that new major roads are not needed, as the Fleet Street scenario entails very significant change. There may be infrastructure requirements for new roads during the transition period to such a future in which transport demand is increasing and automated vehicles are yet to emerge.
2046
DRIVERLESS ELECTRIC SHARED/ ON-DEMAND
Key findings
93% smaller vehicle fleet 72% of trips by car, 28% public transport Demand for some public transport services at peak time is 41% over capacity Subscription fare reduces public transport share to 18% Fleet trips cheaper than private ownership for consumer 3,781 DALYS avoided valued at $735 million in 2046
Public transport coming under increasing pressurePublic transport demand is likely to be much higher in the Fleet Street scenario. In this scenario, public transport accounts for 28% of motorised trips compared to 19% in the base case. This is because public transport is perceived as relatively more cost-effective than shared automated vehicles.
Even with an expanded public transport network in the 2046 base case, this places significant pressure on the capacity of our public transport networks – particularly buses. The Fleet Street scenario has more use of public transport for a broad range of everyday activities, and these diverse trips are better served by buses and trams. In this scenario, the number of individual bus trips is forecast to almost double to 2.9 million per day (Figure 30).It's not just the buses that are affected by increased public transport use. What looks like a relatively small increase in train use presents particular challenges for specific parts of the
70
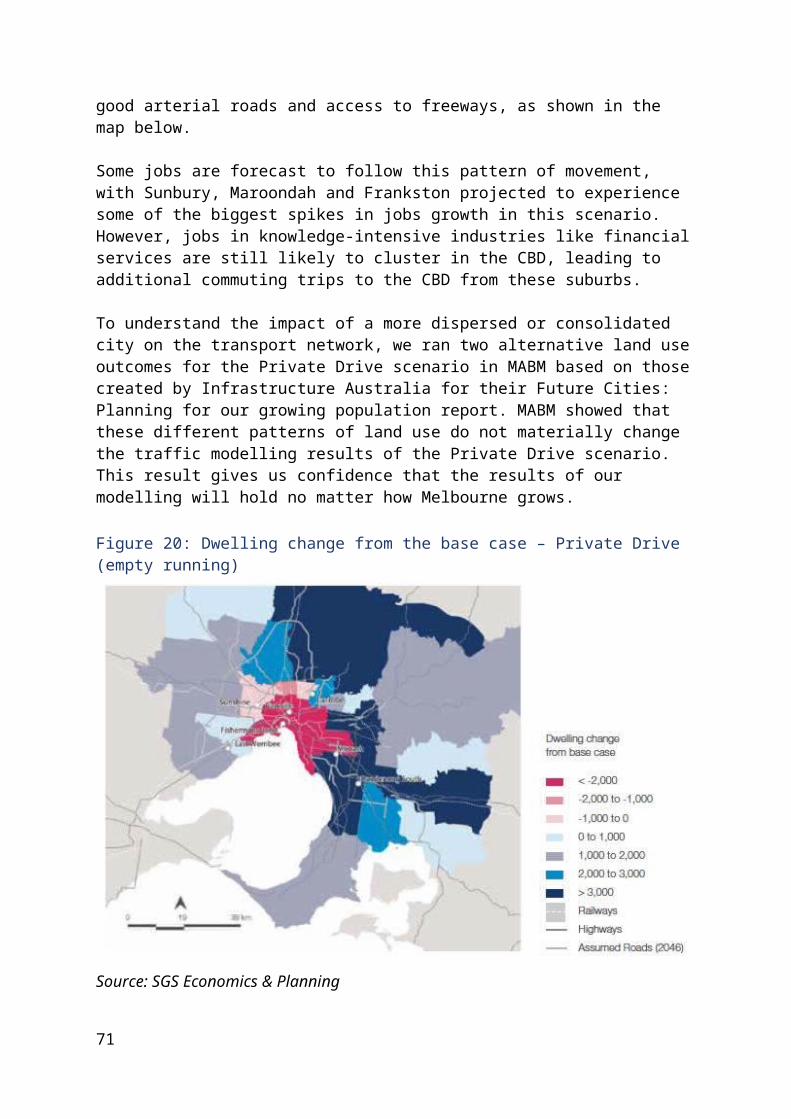
rail network at key times of day. In this scenario, the Clifton Hill, Caulfield and Metro (Parkville) rail groups are all projected to be over capacity during the morning peak period. Figure 31 shows the capacity of the rail network and the projected demand in the Fleet Street scenario. A blue line indicates there is additional capacity in that part of the network and a red line means a line is at or over capacity.
Often, higher public transport usage means more people walking as part of their commute, usually to get to or from their closest public transport option (or both). The modelling for Fleet Street shows this scenario is no exception. There is a 38% increase in walking trips overall, which equates to people walking an extra 400 metres per day. This may not seem like much, but any increase in `active transport' is generally considered positive because of the health benefits associated with a more active population.
Figure 30: Fleet Street – change in public transport use from base case
Source: KPMG Transport modelling (MABM)
Figure 31: Fleet Street train volume capacity ratio – morning peak period
Source: KPMG Transport modelling (MABM)
On-demand vehicles – a fare outcomeAt first glance, the decline in car use and the increasing reliance on public transport seems counterintuitive, given the cost savings associated with no longer owning a vehicle.
71

However, this is a function of how people typically make decisions about travel choices. MABM models this observed behaviour by allowing agents to make travel decisions based on a range of factors, including price.
Although we expect the average annual cost of owning a car, including purchase price, maintenance costs and registration fees, to be much higher than using on-demand automated vehicles, much of this cost is `sunk', and not considered by individual agents in the model when they make travel decisions. On the other hand, fares for using on-demand automated vehicles build in these sunk costs in addition to fuel costs, and are incurred every time a trip is made, just like taxi services do now. The result is that each individual trip is perceived to be more expensive in Fleet Street than in Private Drive.
In this scenario, we also asked KPMG to test a `subscription-style' pricing model to better understand the potential for on-demand vehicle use under different business models. The subscription model assumes a user has paid an upfront cost for an on-demand vehicle `membership' (either monthly or annually) and then a much smaller per-trip cost. The table below shows the differences in vehicle operating or use cost between Private Drive, Fleet Street and Fleet Street (subscription).
Figure 32: Vehicle operating and use costs – Private Drive and Fleet StreetPrivate Drive Fleet Street Fleet Street
(subscription)Fuel cost/km $0.05 - -Flagfall - $2.00 $0.50Fare ($/km) - $0.22 $0.05Fare ($/min) - $0.07 -
Using the costs from the table above, a 5 kilometre trip taking 20 minutes in Private Drive has a perceived cost of $0.25. The same trip in Fleet Street would have a perceived cost of $4.50 using the base fare or $0.75 under the subscription fare.
The modelling confirms that the subscription fare would make people much more likely to use on-demand automated vehicles in comparison to the original Fleet Street fare structure. The number of daily on-demand vehicle trips increased from just over 11 million with the original fares to over 13 million with subscription fares, as the lower perceived cost of use entices people to use fleet cars. The size of the fleet is also forecast to increase to meet this increased demand, as Figure 33 shows.
72
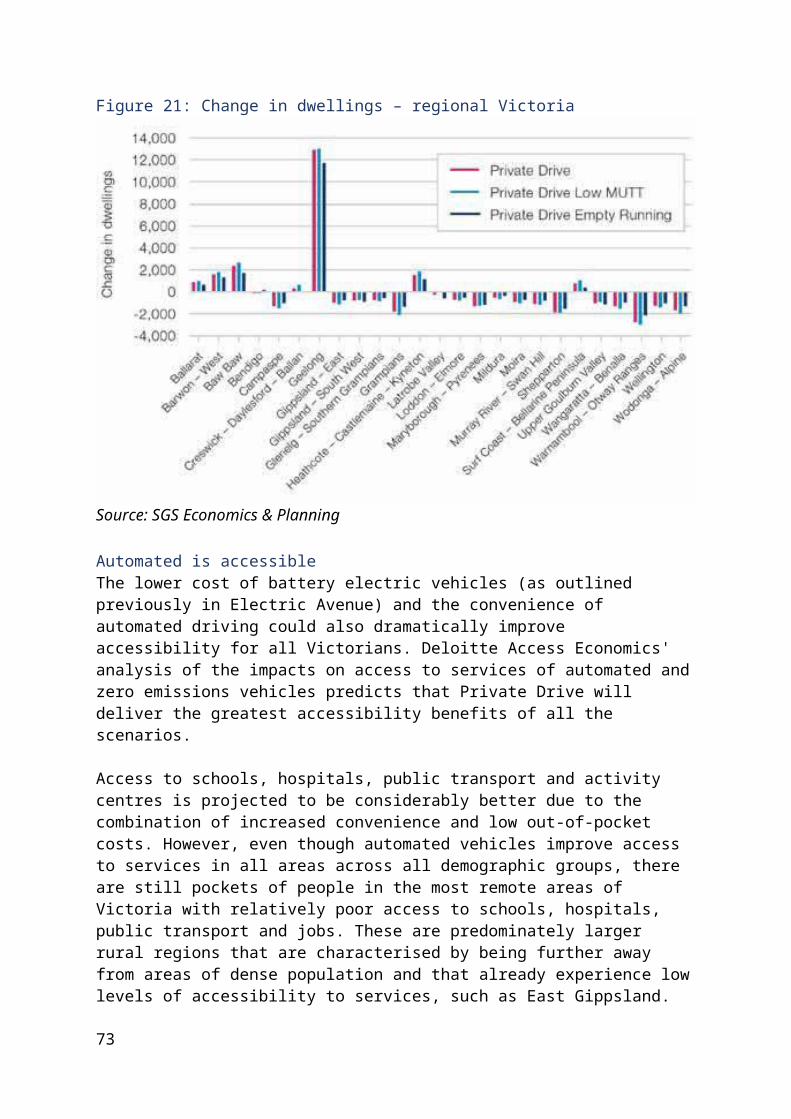
Figure 33: Fleet Street vehicle fleet
Source: KPMG Transport modelling (MABM)
The shared vehicle fleet could offer a door-to-door service on a relatively congestion-free road network, so these extra car trips come mostly at the expense of public transport use. Public transport as a share of motorised trips falls from 28% under the original fare structure to 18% with the subscription fare – which is even lower than the base case at 19%.
We also asked KPMG to test a different model for buses in the Fleet Street scenario, known as demand-responsive transport (DRT), where smaller on-demand buses replaced the traditional bus fleet. This scenario showed that the amount of distance travelled by buses increased by nearly 9% due to DRT vehicles travelling further to pick up passengers. Not having to walk to a bus stop meant that the amount of walking done by Victorians fell by 1.5%. Overall, accessibility improved for residents of outer areas under this model, with nondriving adults the largest beneficiaries. This is due to the greater convenience and faster travel times of DRT vehicles, which make fewer stops and travel on more flexible routes than traditional buses.
Why use on-demand transport?Analysis of the financial impacts of automated and zero emissions vehicles undertaken by a different KPMG team compared the costs of private vehicle ownership and on-demand automated vehicle use. KPMG found that, for the average Victorian who travels 15,000 kilometres a year, it would be around 40% cheaper in 2046 to use a fleet-style service than to own their own vehicle. Figure 34 expands on this, showing the results of KPMG's analysis of lifetime vehicle ownership costs, assuming 15,000 kilometres of travel per year, compared to using an on-demand automated vehicle for the same amount of travel.
This analysis included all fixed and variable costs of vehicle ownership, including purchase price, fuel, insurance and registration fees, in 2046 dollars. As Figure 34 illustrates, even the upper bound of cost for the on-demand vehicle service is likely to be less than the lower bound (cheapest) cost for private vehicle usage, assuming a flagfall fare of $2.00, a per-kilometre cost of $0.22 and a per-minute cost of $0.07.
73

Figure 34: Private and fleet vehicle cost comparison
Source: KPMG financial modelling
KPMG's analysis also found it would be cheaper to use a fleet service for anyone travelling up to 43,000 kilometres a year, or 118 kilometres a day, beyond which private ownership is cheaper. This is because the cost per kilometre of using an on-demand vehicle increases faster than for a private vehicle. While private vehicles have high fixed costs, their variable costs are much lower and the fixed costs of ownership fall on a per-kilometre basis as distance travelled increases.
On-demand vehicles and where Victorians live and workChanging transport patterns also tend to lead to changes in land use. SGS's modelling shows similar land use patterns in Fleet Street as in Private Drive, but with some subtle differences. In Fleet Street, the higher cost of using an on-demand vehicle leads to greater public transport use and encourages people to cluster in areas that are accessible by public transport and roads. Figures 35 and 36 show changes in households and jobs for Melbourne in the Fleet Street scenario, as compared to the base case.
74
Figure 35: Employment change from base case – Fleet Street
Source: SGS Economics & Planning
Figure 36: Dwelling change from base case – Fleet Street
Source: SGS Economics & Planning
75
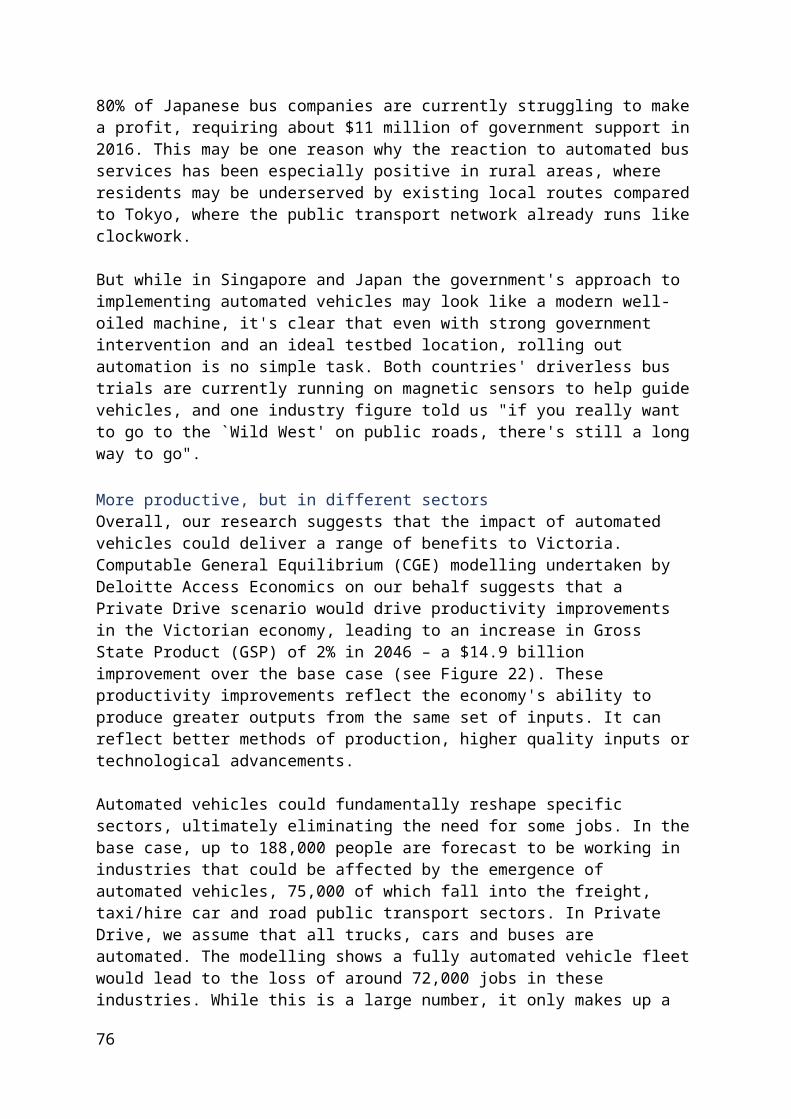
A smaller automated vehicle fleet reduces congestion (except in the inner urban areas) and makes people generally more willing to accept longer commutes, resulting in higher rates of growth in the outer north and south east. However, the increasing perceived cost of car travel makes public transport relatively more attractive, meaning growth in these areas is less concentrated around major roads and more around public transport. The areas that are projected to see the most uplift under Fleet Street are in the outer west (Wyndham and Brimbank) and from the outer north (Whittlesea-Wallan) and east (Casey-North and Banyule). The number of households in inner Melbourne is forecast to fall by 5.8% in this scenario compared to the base case, likely as a result of the congestion impact of high traffic volumes in inner urban areas.
In regional Victoria, the Fleet Street scenario produces similar results to Private Drive, but with some important differences. Geelong sees the most growth in households and jobs, but there are drops in its surrounds in Barwon-West and Baw Baw. The Kyneton corridor, which saw significant uplift under Private Drive, is likely to see a reduction in dwelling and employment growth under Fleet Street. Bendigo increases slightly from the base case. Mildura is the only other area predicted to grow, as shown in Figure 37.
The regional results are a contrast to Greater Melbourne, where the largest shifts were seen in the Fleet Street scenarios. This difference is potentially due to efficiency savings of on-demand vehicles being limited in regional areas. This would result in more cars on the road, in addition to the empty running vehicles that are moving between pick-ups.
76
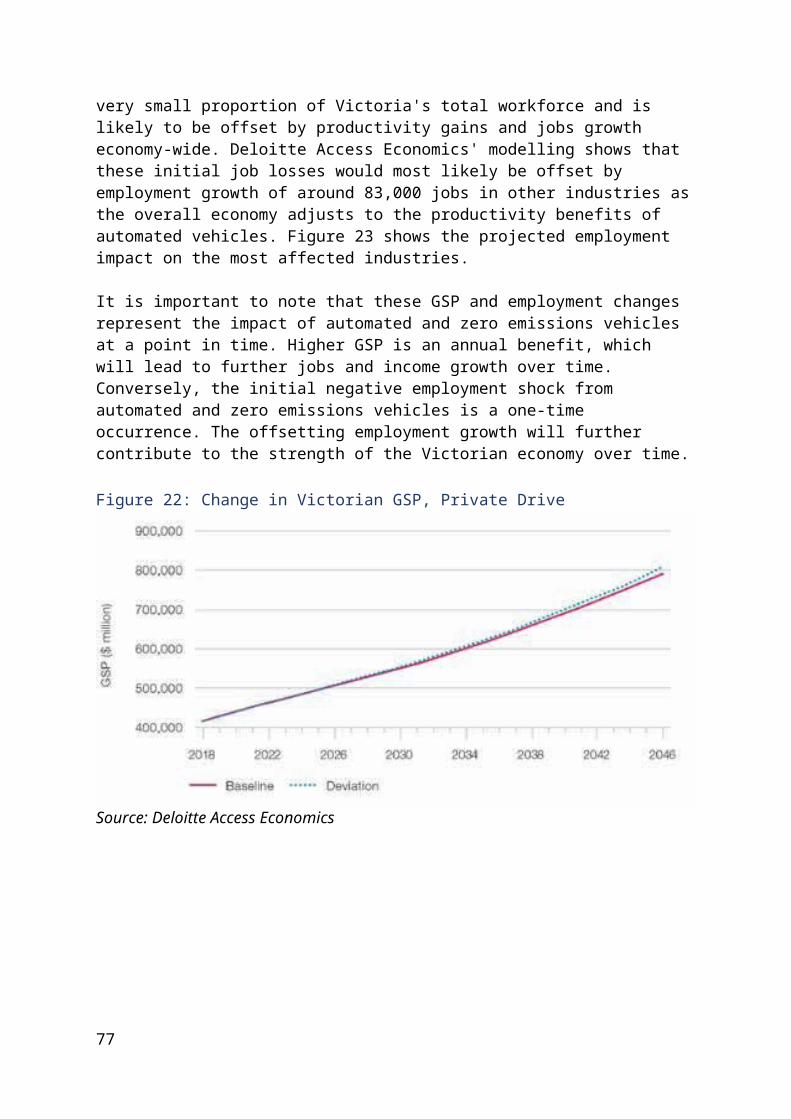
Figure 37: Regional SA3 dwelling change from the base case – Fleet Street
Source: SGS Economics & Planning
A more accessible fleet?
The higher perceived cost of using on-demand fleet vehicles means that Victorians' access to services would likely be very different. Modelling by Deloitte Access Economics predicts that in the Fleet Street scenario access to services would be much worse than the base case for Victorians on lower incomes and regional Victorians. However, as discussed previously, subscription pricing represents one potential model of addressing this challenge. A subscription-based fare structure is forecast to significantly improve accessibility outcomes for all Victorians in the Fleet Street scenario compared to the base case. Figures 38 and 39 show the improvements in access to train stations between the base case scenario and Fleet Street scenario with subscription pricing in 2046, with the areas in blue representing `catchment areas' (that is, the distance people are willing to travel) for train and tram stations. (Train stations are represented as blue dots on the maps and the tram network is shown in red.)
However, these maps also show that, even with a fully on-demand fleet, large parts of regional Victoria will still lack easy access to trains and trams. Most regional centres have access to the regional rail network, while areas without access to trains would be likely to be served by buses in this extreme scenario.
Access to public transport is particularly important for lower income groups, those living significant distances from urban areas and those without a driver's licence. Large increases
77
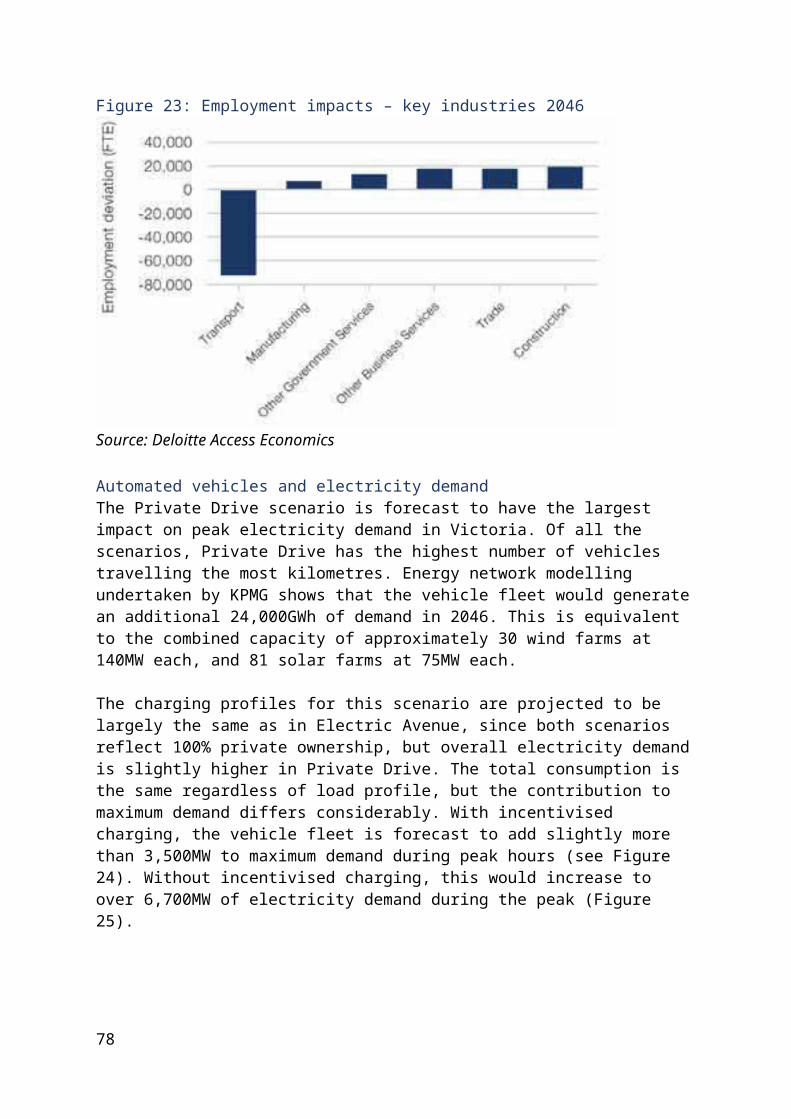
in access to public transport mean that these groups have the most to gain from the introduction of automated and zero emissions vehicles, since they are the groups most likely to lack access to public transport in the base case, and access to public transport can greatly improve people's ability to access jobs. On the other hand, there is a risk that this scenario may lead to gaps in coverage or discriminatory pricing in areas where there is limited demand, such as in low density outer suburbs and regional and rural Victoria.
Figure 38: Access to train stations – base case
Source: Deloitte Access Economics
Figure 39: Access to train stations – Fleet Street
Source: Deloitte Access Economics
Non-drivers in automated vehiclesBoth KPMG's transport modelling and Deloitte Access Economics' socioeconomic analysis found that automated vehicles are likely to make it easier, cheaper and more appealing for people to use their cars. Automated vehicles could also improve accessibility for people who couldn't previously use a car at all such as older children, the elderly and people with a
78
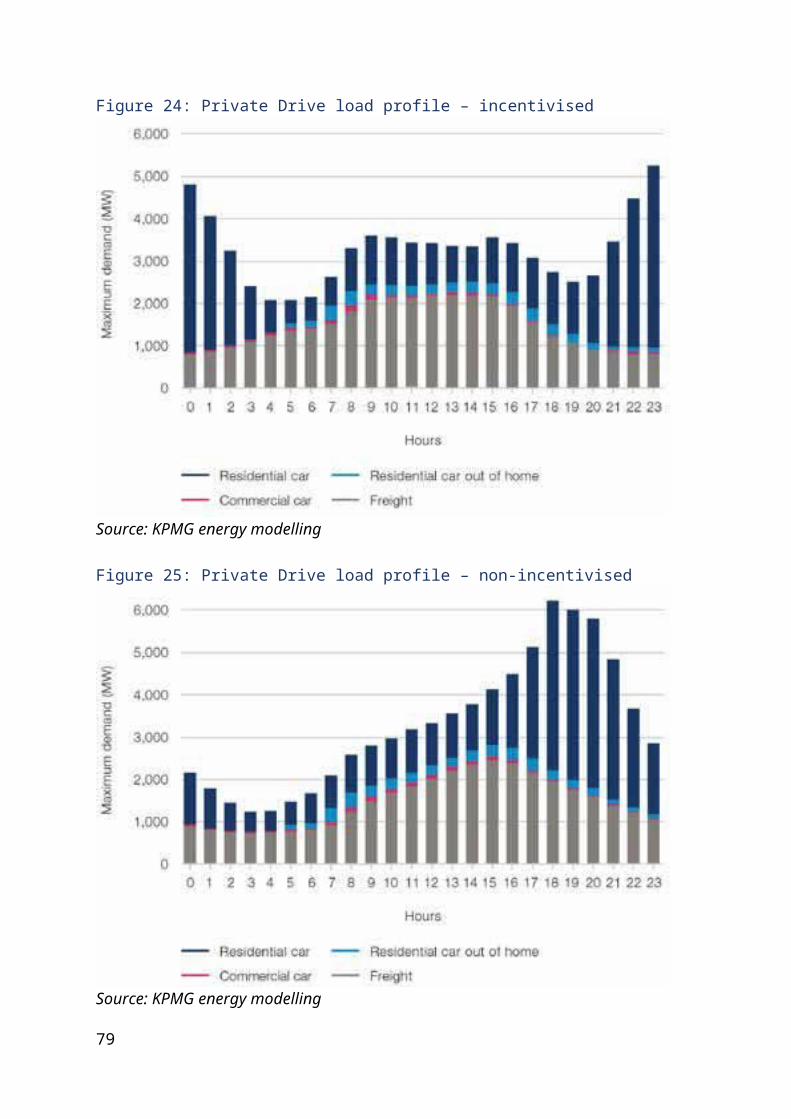
mobility impairment. We call this potential outcome `expanded markets'. Modelling the impact of expanded markets was important because we think it is entirely possible that automated vehicles will lead to people using cars who weren't doing so before. While this is a good thing when it comes to overcoming accessibility barriers, it could lead to greater pressure on our road network.
Using MABM, KPMG tested the impact of expanded markets on the transport networks by allowing a proportion of children and adults without licences to access automated vehicles as `drivers' under the Private Drive scenario. What the modelling showed was that, when the model allowed these groups of people to use automated vehicles, the overall vehicle fleet grew by 7%, the number of kilometres driven increased by 2%, and congestion was slightly worse than in the Private Drive scenario.
The model also showed that the trips taken by these drivers were relatively short. The average distance travelled each day per vehicle across all private vehicles falls from 44.2 to 42.5 kilometres, likely because the model can't show us how people change their travel plans when given the opportunity to use automated vehicles. It is possible that, over time, the accessibility benefits of automated vehicles would lead to this portion of the population using vehicles more to access education, jobs or recreational activities – bringing their pattern of use closer to the average.
Work by Stanley, Hensher, Stanley, Currie, Greene and Vella-Brodrick37 has estimated the value of a trip to a person at risk of social exclusion to be approximately $20 for a person from a median income household. KPMG used data from the Victorian Integrated Survey of Travel and Activity38 to estimate the potential for expanded markets due to automated vehicles as part of its work on transport modelling and predicted that 8.9% of the population of Melbourne will be old enough to drive but will not have a driver's licence in 2046. Depending on how many of these people are at risk of social exclusion, the value of automated technologies for this population could be significant.
On-demand vehicles and the future shape of neighbourhoodsTaking over three million vehicles out of circulation would have an unprecedented impact on the way our towns, cities, neighbourhoods and streets are designed. For example, since no one would own their own car, car parking could be greatly reduced, freeing up large amounts of space in dedicated parking buildings and kerbside parking for other uses. According to analysis by Arup, the amount of car parking that could be repurposed in urban areas could be as high as 97%. Fleets of on-demand vehicles could be parked at depots in areas where the cost of land is relatively low when not in use, rather than high-value land in inner urban areas.
Parking at or near destinations would need to be replaced with appropriate pick-up and drop-off areas. Arup's work on road engineering notes that this will likely lead to a new focus on kerbside access issues to ensure there are no equity impacts. For example, this
37 Stanley, J. K., Hensher, D., Stanley J. R., and Vella-Brodrick, D., (2011), `Mobility, social exclusion and well-being: exploring the links', Transportation Research A, 45(8):789-801.38 VISTA travel data is available at: https://transport.vic.gov.au/data-and-research/vista/vista-data-andpublications/. Accessed 3 July 2018.
79
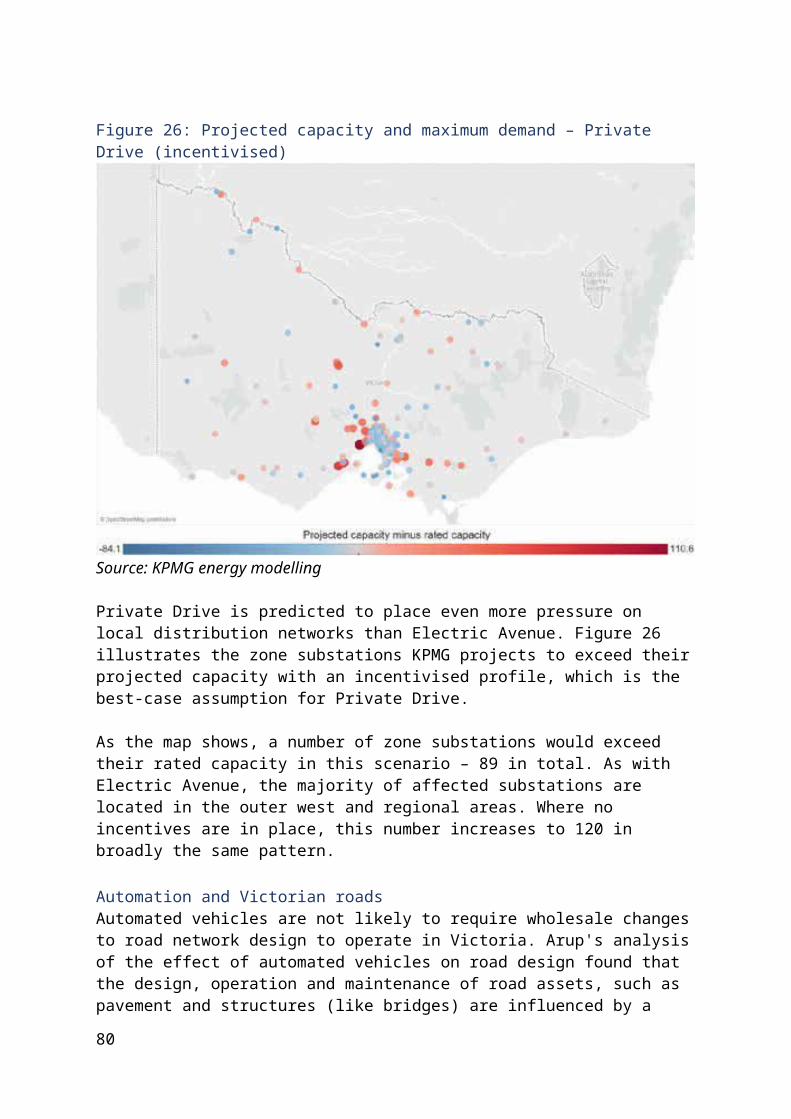
could include providing drop-off points close to key locations to ensure mobility impaired people can access education, employment or other opportunities.
We also assume automated vehicles will require less road space since they are capable of driving closer to each other. Streets would also be safer for other road users, as automated vehicles are predicted to reduce accidents. Streets that currently allocate significant amounts of space for parking, have multiple lanes for traffic and that prioritise car access could be reimagined in the Fleet Street scenario.
Take, for example, Sturt Street in Ballarat as shown in Figure 40, which has been redesigned by Urban Circus as part of our urban design technical analysis. This image represents a vision for what could be achieved in the Fleet Street scenario. In this concept, a petrol station is eliminated and a significant amount of street space has been reclaimed for pedestrian, cycling and recreational uses. Since automated vehicles may not need street signs, line markings or traffic lights to operate safely, the amount of visual clutter in the area has also been reduced.
Current-day Sturt Street is an example that could be replicated across a number of regional Victorian towns, with wide streets and significant amounts of parking. To see more examples across Victoria, see the Urban Circus and Ethos Urban `Automated and Zero Emission Vehicles – how they might reshape our streets' report.
Smaller fleet, less waste?Many of the waste management issues that arise from the emergence of automated and zero emissions vehicles are lessened in Fleet Street due to the dramatic reduction in the number of cars in circulation. As discussed earlier, the vehicle fleet is projected to be much smaller in the Fleet Street scenario, with nearly 3.3 million fewer vehicles needed to meet Victoria's transport needs. This could reduce vehicle waste by up to four million tonnes in 2046 – equating to roughly 3.3 million tonnes of waste no longer needing to be recycled, and around 700,000 tonnes of landfill avoided. A smaller vehicle fleet also means fewer vehicles being manufactured. This could also deliver significant financial and environmental benefits, albeit outside of Victoria.
This analysis does not take into consideration the potential that higher vehicle use may reduce the lifespan of vehicles. It also does not consider the challenges associated with disposing of 3.3 million vehicles. The waste management implications of a smaller vehicle fleet are outlined in more detail in the High Speed scenario discussion.
New waste streamsThe environmental `side-effects' of automated and zero emissions vehicles extend beyond their manufacture. Victoria's waste and resource recovery system handled approximately 13 million tonnes of material in 2015–16. Demand on the system is forecast to grow in line with population growth, and by 2046 is projected to reach approximately 20 million tonnes. Car bodies contribute to 4% of all metals recovered for reprocessing in Victoria.
The volume of e-waste is growing three times faster than general municipal waste in Australia. The Victorian Government has committed $16.5 million to augment collection
80
infrastructure to allow the safe disposal of e-waste by Victorians. However, analysis on the environmental and population health impacts of automated and zero emissions vehicles by Aurecon and ERM has found that the volumes of lithium battery waste and other e-waste from these vehicles are likely to accelerate growth beyond current projections and management plans. There also appears to be a gap in these projections and plans with respect to handling waste from the disposal of hydrogen vehicles. On the positive side, Aurecon notes that used batteries that are deemed `unfit for service' for battery electric vehicles still contain a majority of their original capacity, and so could be reused in other residential or industrial applications.
Figure 40: Sturt Street Ballarat – Fleet Street concept
Source: Urban Circus & Ethos Urban
This implication is that the new types of waste – or greater amounts of existing types of waste – are likely to exceed the capacity of existing and/or planned waste infrastructure, which could lead to issues such as illegal dumping, stockpiling or illegal exporting without a permit. Sustainability Victoria has noted that these are already issues of concern for e-waste.
Significant increases in illegal dumping or stockpiling waste could present a challenge to environmental regulators, which would need to closely monitor the waste industry given
81
the risks that these types of waste carry. Equally, if the volume of waste continues to be underestimated, there is also the potential to miss opportunities to develop local industries that could process the waste in a more economically and socially viable manner.
Smaller fleet, healthier populationFleet Street is forecast to deliver considerable population health benefits due to the elimination of all vehicle exhaust emissions and the relatively low particulate matter emissions resulting from a smaller vehicle fleet. Over 3,700 DALYs could be avoided in this scenario in 2046 alone, with a value of $735 million. As with most scenarios, the benefits are felt most in areas of higher population density, as shown in Figure 41 and Figure 42.
What these maps show is that the benefits are concentrated around population centres. This is almost entirely due to the fact that there are both more people to realise the benefits of emissions reductions and more vehicles that are no longer generating exhaust emissions.
Figure 41: Estimated avoided DALYs – Melbourne (Fleet Street scenario)
Source: Aurecon
82
Figure 42: Estimated avoided DALYs – rest of Victoria (Fleet Street scenario)
Source: Aurecon
Electricity, on-demandLike our earlier scenarios, the vehicles in Fleet Street are electric, but the way that the vehicles interact with the electricity network is likely to be very different in the Fleet Street scenario than in the private ownership scenarios (Electric Avenue and Private Drive). Although the vehicle fleet is much smaller, the energy needs of the fleet are still significant due to the much higher utilisation of each vehicle in the fleet throughout the day. The on-demand fleet vehicles are projected to travel, on average, 568 kilometres per day and consume approximately 21,800GWh of electricity per year, a 50% increase over the base case. Since the average vehicle travel per day is beyond the projected range of around 300km, it is likely that most vehicles will need to charge at some point during the day. The projected charging profile for the on-demand fleet, (in blue) as shown in Figure 43, reflects the timing of trips in the transport model. The bulk of charging for on-demand vehicles in this scenario can be done at off-peak times, when many of the vehicles will not be in use.
Battery electric freight (in grey) is forecast to contribute a similarly large amount to overall electricity consumption as the on-demand vehicle fleet, due to its increased proportion of the overall fleet (since freight vehicles are already `shared' and the quantity of goods to be moved is assumed not to change, their total number is the same as the base case).
83
This load profile reflects the expectation that passenger vehicles are most heavily in use during peak commuting periods, which also mostly aligns with peak energy demand, especially during the evening. Conversely, the fleet is relatively less utilised during the day when renewable generation is typically highest and late at night (when household demand is at its lowest). As a result, KPMG's modelling shows that, despite still contributing a relatively significant amount to total consumption, this scenario should have a much lower impact on maximum demand – requiring just over 1,400MW of additional generation capacity at the peak.
Figure 43: Fleet Street vehicle charging profile
Source: KPMG energy modelling
But how will they charge?Our research suggests that on-demand fleet vehicle operators are likely to charge their vehicles at a depot when not in use. KPMG has assumed on-demand vehicles will use `fast' chargers (between 7–22kW) for depot charging.
Fleet operators will have to weigh up customer demand characteristics and locations, access to customers, cost of electricity, network charges and number of vehicles in deciding their charging strategy. For example, an operator may decide to have more vehicles in order to have some redundancy in the fleet and flexibility for when the fleet is charged. Or alternatively, the operator could invest in on-site battery storage to help manage electricity costs.
As the shared depot will be classified as a large load, the fleet operator would likely be liable for all the network connection costs under the current energy sector rules. This would include any costs needed to augment or reinforce the network upstream of the connection to support the depot charging. The magnitude of cost could be quite substantial depending
84

on the existing capacity at the connection point and the number of vehicles assigned to the depot.
Further, shared depots may want to connect into medium to high voltage lines (such as 66kV) instead of distribution feeders for reliability and speed of charging reasons. The distribution network may want to encourage the operator to locate depots close to such lines for network security and cost reasons and could seek to prevent depots connecting at low voltages. However, the location of these high voltage lines could be further away from the customer base.
On-demand vehicles and government financesOf all the scenarios we developed, Fleet Street will have the most significant financial impact on governments (local, state and federal). This is not surprising, given that this scenario is the most different from the base case. For example, automated fleet vehicles no longer require people to hold driver's licences, on-demand vehicles don't park and battery electric vehicles don't generate fuel excise revenue. Our financial modelling shows that the combination of these, and other contributing factors such as changes in Transport Accident Commission (TAC) premiums (and related payments), drives an estimated net financial reduction across all three levels of government of over $12.7 billion in 2046. This assumes no change to current government policies, such as changes to vehicle registration fees for fleet operators, or transport network pricing.
Automation, safety and the TAC schemeOne element of KPMG's modelling of the financial impact of automated and zero emissions vehicles is TAC premiums and payments. Victorians pay a TAC premium as part of their vehicle registration fee. These premiums support the TAC scheme, which provides payments for treatment and benefits for people injured in road transport accidents in Victoria.
For the purposes of this analysis, KPMG have applied a simplified premium setting process, through which TAC premiums are assumed to be tied to the number of individuals injured on Victoria's roads. In reality, TAC premiums are set through a more complex formula that reflects the need to sustainably fund the TAC scheme. Changes in KPMG's simplified estimate of TAC revenue from the base case reflect both changes in the amount of vehicle travel in each scenario, the number of automated vehicles on the road, and the assumption that automated vehicles will reduce the number of accidents by 94% (which is likely to be a best case assumption).
TAC expenditure is modelled by KPMG using the same simplified approach, with the level of expenditure projected to decline broadly in line with decreases in the number of vehicle accidents. However, TAC expenditure includes the cost of medical care and benefits for people lodging a claim in a given year, in addition to ongoing payments to people injured in previous years who require ongoing care. In reality this could be expected to lead to a lag in any changes to TAC expenditure.
A new value proposition?Regardless of the scenario, automated and zero emissions vehicles are likely to have a big impact on the way governments plan and deliver infrastructure projects. Automated and
85
zero emissions vehicles could unlock major economic, social and environmental benefits for Victorians, if well managed. Alternatively, there is a risk that these benefits might not materialise if we don't plan appropriately for their arrival. We've already discussed a number of changes to the way vehicles could be used in our scenario discussions, and the flow-on impacts of these changes, including:
vehicle automation and the lower operating costs of battery electric vehicles leading to people being more willing to take longer car trips and use less public transport
traffic flow improvements from automated vehicles significantly increasing the capacity of the existing road network and reducing congestion
the ability of automated vehicles to return home after dropping their occupant at their destination (or empty running) leading to significant increases in congestion in the inner areas
the potential for people who could not previously use cars (children, the elderly or people with mobility impairments) to induce even more car trips
the price associated with on-demand vehicle use leading people to use more public transport.
These changes, or any combination of them, could significantly shift the value proposition of future infrastructure investments and require changes to the way governments evaluate infrastructure projects. Key components of the economic analysis of infrastructure projects, such as productivity benefits and value of travel time savings, would need to be rethought with the emergence of automated vehicles, while environmental impacts will also change, with certain parameters (such as greenhouse gas emissions) significantly reduced or entirely eliminated as zero emissions vehicles become ubiquitous.
Why is this scenario important?The Fleet Street scenario is the most different to today. As with Electric Avenue and Private Drive, emissions are eliminated and the safety and vehicle efficiency benefits of Private Drive are also realised. Unlike these scenarios, however, a Fleet Street-style vehicle fleet is projected to be much smaller (though possibly somewhat larger than we've modelled if there are multiple companies providing competing services), leading to the expectation that the impact on Victoria's electricity network will be lower. Fleet Street also provides an opportunity to free up unused car parking space for other uses.
While this scenario could deliver significant benefits, it is not without its costs and there are some issues that could benefit from further consideration.
The projected productivity improvements and overall employment growth more than offset the potential loss of up to 72,000 jobs in transport-related industries. However, it is worth noting that some of these workers may not have easily transferrable skills and might need some help transitioning into new roles.
There are also concerns about fair access to shared automated vehicles across Victoria. Commercial models of shared automated vehicles could favour the denser parts of Victoria like Melbourne and the inner areas of regional centres, leaving the outer and rural areas with long wait times and more expensive journeys. While it is unlikely that such an extreme
86
scenario will occur, equity impacts for different populations will need to be front of mind for the introduction of any fleet-based automated vehicle services.
Dropping off and picking up people at the beginning and end of trips will also require a different solution and scale to how taxis and ride-sharing (such as Uber or Ola) vehicles currently operate. Even today, taxis can dominate whole city blocks. Imagine the chaos on Collins Street if every car trip was made in a taxi-style service without carefully designed pick-up and drop-off locations.
Depending on the fare structure for on-demand vehicles, growth in public transport demand in this scenario could also place significant pressure on public transport capacity, particularly at peak times on key routes. As discussed above, some train routes in our analysis showed `crush loads' of up to 140% of capacity, which could significantly affect people's satisfaction with travel by public transport.
Our Fleet Street modelling showed that on-demand vehicle use could be perceived as more costly to use due to the taxi or Uber-like fare structure. However, a Mobility as a Service (MaaS) platform could be used for innovative (and possibly more appealing) payment models, like subscription services. MaaS allows users to plan, book and pay for different modes of transport (bus, train, light rail and on-demand vehicles) within a single platform – often in the form of smartphone app.
Mobility as a service, data as an enablerThe evidence suggests that open data and application programming interfaces (APIs) that support third party providers and integrators are a key requirement to enabling MaaS and related services. Mobile-based payments, timetables and services, ticketing and validation, mobile device integration with physical barriers, and allowing third parties to execute transactions on behalf of the end user could also be enabled by greater data sharing. Where these systems are not supported by open data and APIs, there may be challenges to the emergence of new market models such as MaaS. This may, in turn, hinder the implementation of automated on-demand vehicles that are likely to leverage off MaaS systems.
The changes that need to be made to implement on-demand transport and MaaS without automation are also likely preconditions for the emergence of the on-demand automated vehicle scenarios (and have merit in their own right). Through our engagement with international jurisdictions, we heard that an optimal routing system, multiple booking channels, standardised payment system (through one platform or integrated APIs) and integration with the mainstream public transport system are key ingredients for success of on-demand transport.
Figure 44 is a summary of the key attributes of a MaaS system and reflects the preconditions that would be needed to be met to implement an optimised MaaS model.
87
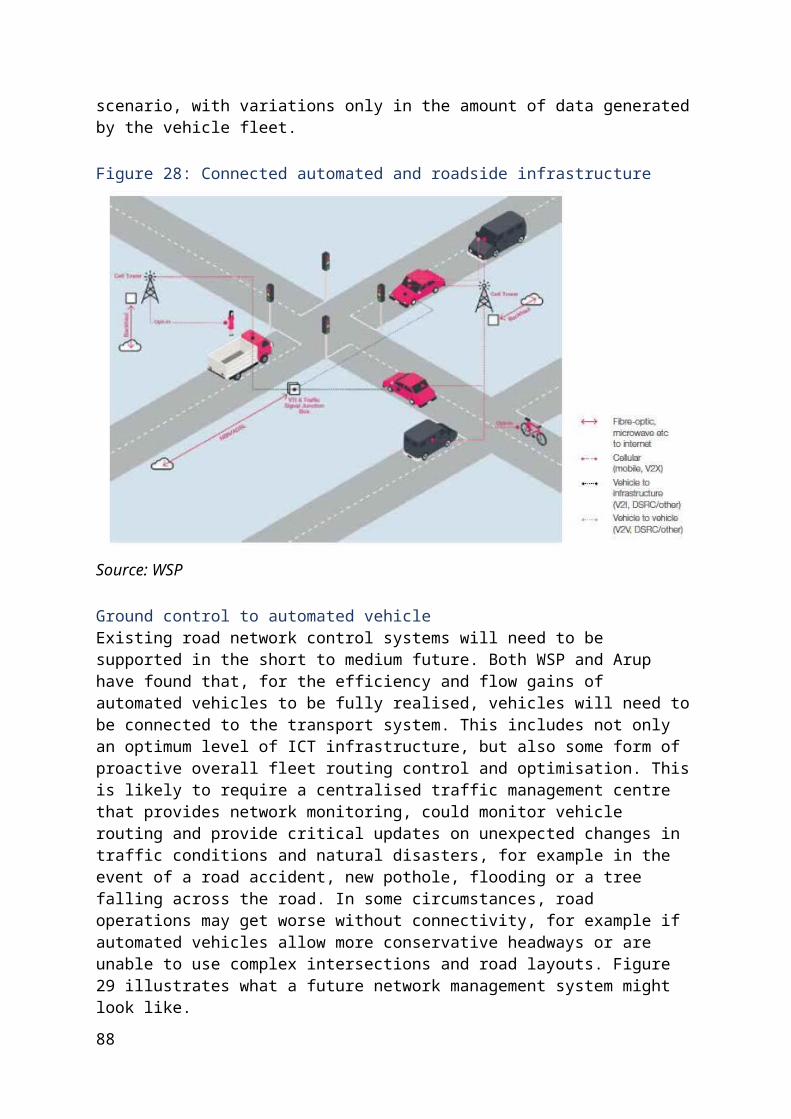
Figure 44: Mobility as a service ecosystem
Source: L.E.K
Government can enable MaaS by implementing or requiring data sharing arrangements, brokering agreements between stakeholders (particularly involvement of large public transport providers) and possibly incentivising certain travel choices.
Practically, the rise of an on-demand business model would require a real behavioural shift from today. Although on-demand and car sharing services are becoming more prominent, it is still hard to imagine a world in which no one owns their own car. In fact, the need for work-related vehicles and the fact that people enjoy treating their vehicles as a personal space mean that a fully shared ondemand fleet may never actually happen. To better understand people's attitudes to on-demand vehicles, we surveyed Victorian motorists on how they might use a driverless car in the future. The results are discussed later in this report (see page 109).
Case study: Sweden and Finland – sharing, pricing and on-demand promise better transport for all
Nordic neighbours Sweden and Finland are known for being socially progressive, safe and stylish, but they are also shining examples of innovative transport and urban planning.
Considerable government policy and private sector innovation is currently taking place to implement on-demand transport and mobility services. One private company making
88
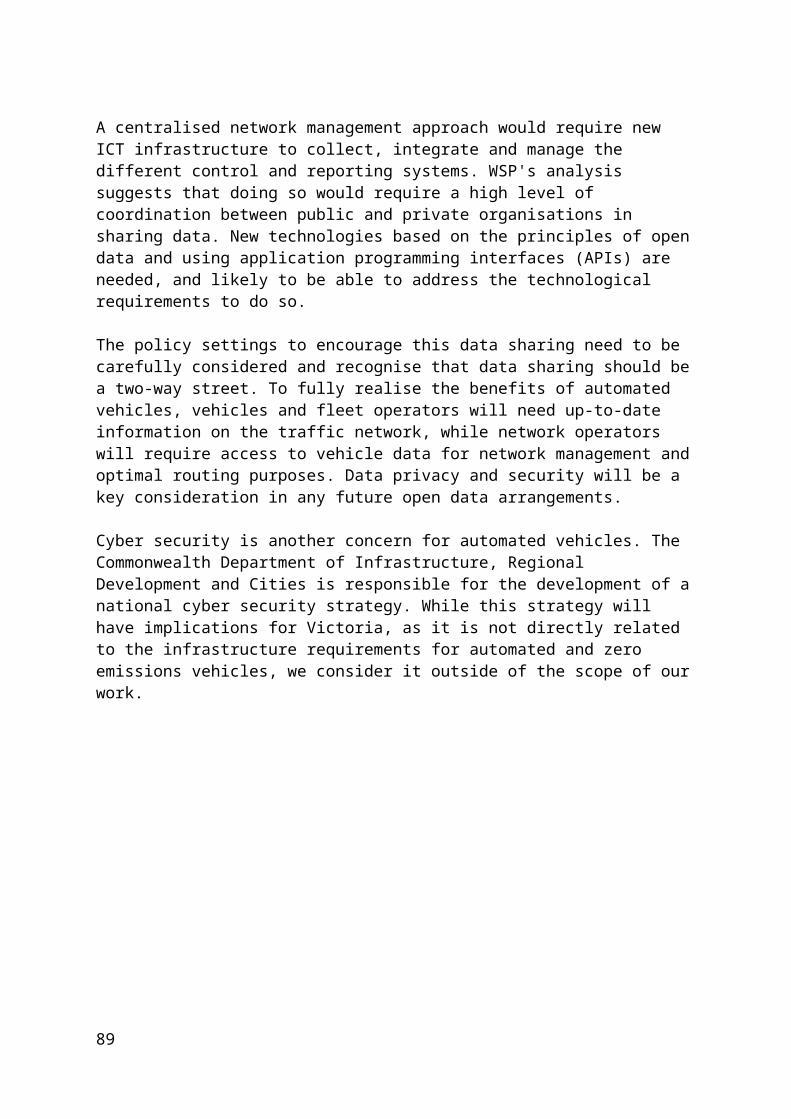
inroads is MaaS Global, a Finnish start-up looking to provide mobility across all modes of transport – including public transport, taxis, car rental, bicycles and ferries – on a subscription basis via its Whim app. In Finland, Whim currently has 36,000 registered users and 5,000 subscribers, and has spread to the UK. Soon, it will be in Singapore and other European cities.
So what is required to enable such a service? According to MaaS Global, commercial arrangements between suppliers, open application program interfaces (or APIs), open data rules and mobile-compatible ticketing systems are all key. In our discussions, it was suggested that governments and cities can assist by setting appropriate regulations around data and brokering agreements between public transport operators and private sector players.
The infrastructure and regulatory changes to enable on-demand transport and mobility services are also positive steps towards realising a shared, automated future – including appropriate 4G or 5G mobile coverage, efficient routing systems, open data and consistent standards across borders.
While moving towards more shared transport could mean fewer cars on the roads, road pricing in Sweden has been used to address growing traffic congestion. According to the City of Stockholm's Transport Planning Department, a seven-month congestion charge pilot that commenced in 2006 became permanent following a referendum of city residents. The charge led to a permanent 20% reduction in inner city traffic. Another benefit is 10–14% less vehicle emissions in the inner city, with `environmentally friendly' cars exempt from the charge. However, when the high uptake of battery electric vehicles meant they were creating further congestion, this exemption was abolished.
With automated vehicles on the horizon, both road transport authorities and businesses throughout Sweden and Finland told us that defining the `operational design domain' (i.e. where and when the vehicle can operate) is crucial. Sensible4, an automated shuttle operator in Finland, expects different applications and requirements to emerge such as taxis, last mile services and personal vehicles. A northern European issue is also rain and snow – light detection and ranging (LIDAR) technologies were not developed for that environment, and there's work to do to ensure safety and reliability in all conditions using positioning and connectivity services. If these applications can be addressed, this technology could also be used for other applications, like unsealed roads.
The challenges are clear, but so are the benefits – the Swedish Transport Administration told us that lane departure warnings have been found to reduce head-on and singlevehicle injury crashes by 50%. The administration's main goals over the next 10 years are to double public transport use, be carbon neutral and increase active transport. The City of Gothenburg is looking to reclaim road space for other users and sees the potential in dynamic traffic signalling at different times of day, and reclaiming carparks for other users.
Sweden and Finland's approach to implementing automated and zero emissions vehicles has positive societal outcomes at its core, with careful planning key. In this way, automated vehicles can bring good mobility and urban planning outcomes along for the ride.
89
Hydrogen HighwayAll vehicles are privately owned, hydrogen fuelled and automated.
In many ways, the Hydrogen Highway scenario is similar to Private Drive, in that all vehicles are automated and privately owned, but with a different set of energy challenges associated with the production and distribution of hydrogen fuel.
Hydrogen fuel cell vehicles could emerge due to the potential range benefits that these vehicles provide over battery electric vehicles, particularly for heavy freight. However, a significant take-up of hydrogen vehicles would require a very different approach to infrastructure than that required for battery electric vehicles.
Hydrogen, hydro-when?Hydrogen fuel cell vehicles (FCVs) are still a fledgling market. While there are hydrogen passenger vehicles for sale in some markets, the latest estimates put total uptake at less than 7,000 vehicles worldwide. Such a small market means there is little evidence around FCV uptake rates and ways to encourage uptake. Beyond Japan's target of 800,000 FCVs by 2030, we have not found any other FCV uptake targets.
In Victoria, there are currently a handful of FCVs, which are owned by vehicle manufacturers and are used for demonstration purposes. However, several companies are planning to launch light passenger vehicles for purchase in Victoria within the next one to two years.
International jurisdictions focusing on hydrogen – most notably Japan, the Netherlands and Dubai – appear to be doing so for reasons other than the benefits from reduced vehicle emissions. FCVs are seen as good energy security and diversity drivers, which is an important energy policy consideration in these jurisdictions.
Although hydrogen generation is currently a relatively expensive process, both heavy freight and buses lend themselves to a potential model of industrial-scale hydrogen generation and use. Current battery technologies are generally considered too heavy to be a truly commercially viable solution for payload-sensitive uses such as trucks and buses. This could make FCV technology a more feasible option, according to many vehicle manufacturers.
As such, we expect that the conversion of freight vehicles could act as the catalyst for the Hydrogen Highway scenario due to the range-to-weight efficiencies of heavy FCVs compared to battery electric heavy vehicles. Through our research, it seems likely that hydrogen would have to be taken up by a commercial heavy vehicle operator (either freight or buses) in order to provide the impetus and possibly the funding to develop a network of hydrogen fuelling stations.
However, this could also happen on a smaller scale. The Moreland City Council, for example, has announced a plan to generate hydrogen from solar-generated electrolysis to fuel a fleet of FCV rubbish trucks.
90
2046
DRIVERLESS HYDROGEN PRIVATE OWNERSHIP
Key findings
Hydrogen is estimated to be more suitable for heavy vehicles Could need energy network upgrades of up to $14.5 billion Hydrogen production likely to be very energy intensive Public transport accounts for 14% of all trips Congestion mostly eliminated, but travel speeds lower in inner areas due to empty
running
How quickly could hydrogen FCVs achieve price parity?While FCVs are not currently available for purchase in Australia, the Toyota Mirai currently retails in the US for around A$60,000.39 It is estimated that the Hyundai Nexo will be marketed in Australia for around $80,000.40 However, analysis published in the Energy Policy journal suggested "that in 2030, FCEVs could achieve lifecycle cost parity with conventional gasoline vehicles", with "powertrain lifecycle costs of FCEVs [likely to] range from $7,360 to $22,580, whereas those for BEVs range from $6,460 to $11,420" in their 2030 projections.41
From a consumer perspective, KPMG's financial analysis has estimated that the total lifecycle cost of ownership for an automated hydrogen vehicle in 2046 is likely to be more than an equivalent automated battery electric vehicle, but less than a traditional petrol or diesel vehicle, as shown in Figure 45.
Depending on the availability of hydrogen fuelling stations, some vehicle users, particularly those with heavier vehicles (such as tradespeople), might be happier to pay a slightly higher cost premium for the convenience of hydrogen efficiency and refuelling.
It should be noted that the cost savings associated with hydrogen vehicles in this analysis are driven entirely by assumed savings associated with vehicle automation and current Victorian Government policy that provides subsidised vehicle registration fees for zero emissions vehicles. When compared to battery electric vehicles, hydrogen FCVs are still likely to be more costly.
39 Blackburn, R. (2017), Toyota to bring hydrogen fuel-cell car to Australia, Herald Sun, 26 October.40 McCowen, D. (2017b), Hyundai reveals Australia's first fuel cell vehicle, Drive, 17 August.41 Offer, G. J., Howey, D., Contestabile, M., Clague R., and Brandon, N.P., (2010), Comparative analysis of battery electric, hydrogen fuel cell and hybrid vehicles in a future sustainable road transport system. Energy Policy, 38(1): 24-29.
91
Figure 45: Cumulative cost comparison between fuel sources (2046 AUD)
Source: KPMG financial modelling
Highways on hydrogenIn this scenario, we see transport network outcomes similar to Private Drive but on a slightly reduced scale, as the cost of operating vehicles is higher. Compared to Private Drive, where all automated vehicles are electric and cost $0.05 per kilometre, automated hydrogen vehicles are assumed to cost the same to operate as traditional vehicles at $0.176 per kilometre.
When compared to the base case, congestion is improved across the network due to the efficiency impacts of automated vehicles. Figure 46 illustrates the impact of automated vehicles on the flow of traffic across Melbourne during the morning peak period, where green indicates an improvement in vehicle flow in the number of vehicles per hour, and red a decrease, with thickness showing the magnitude of change.
This map shows that there are more vehicles travelling per hour across most of the network than in the base case. This increase in flow, coupled with an increase in average speed across the network of 8 kilometres per hour compared to the base case, indicates a significant reduction in network-wide congestion.
Like Private Drive, the road network efficiency improvements of automation are forecast to make public transport less attractive relative to driving, with the transport modelling predicting it will account for just 14% of motorised trips, compared to 19% in the base case.As in Private Drive, automated vehicles would be able to return home (or to another location) to avoid parking costs. In our transport modelling this leads to greater congestion in inner Melbourne, and actually reduces average travel speeds in inner city areas by 12%. Conversely, average speeds in the middle and outer suburbs increase by 37–38%.
This scenario will also have financial impacts to government, as is the case in the other automated scenarios. Parking revenue, registration fees, licence fees and fuel excise
92
revenue will all decline in this scenario, leading to an estimated overall net cost to government of over $12.5 billion, assuming no changes to current policies.
Figure 46: Change in flow: Hydrogen Highway vs base case (morning peak period)
Source: KPMG Transport modelling (MABM)
Victorians' access to services is greatly improved over the base case. Travel time savings and avoided parking costs improves accessibility to hospitals, schools, public transport and activity centres by 20–30% over the base case across the state. The impact of this is that, as the cost of travel is lower than in the base case, people are willing to travel much further to access key services.
Hydrogen, hydrogen everywhereThere are some differences in the outcomes we expect to see from this scenario compared to the automated and battery electric scenarios. Unlike battery electric vehicles, which the evidence suggests will mostly charge at home, hydrogen FCV fuelling stations would look very similar to the petrol stations of today. No kerbside charging is required, and existing petrol stations would probably remain to serve hydrogen fuel.
The impact of hydrogen FCVs on the energy network comes down to ensuring enough hydrogen is produced over a given period to meet demand. KPMG's energy analysis found that nearly 800 million kilograms of hydrogen would be needed per year to fuel all trips in Victoria using hydrogen FCVs in 2046. For context, the US currently consumes 7.3 million kilograms of hydrogen per year in total (mostly for applications other than vehicles).42
For the purposes of our advice, KPMG has examined three different primary methods of producing this required volume of hydrogen:42 Environmental Clean Technologies Limited (2018), Why should investors care about hydrogen?
93
Electrolysis – an electrical current is passed through a water solution, creating a chemical reaction and producing hydrogen and oxygen. The electrolyser can be powered through the energy grid or through a local renewable source, such as solar panels.
Coal `gasification' – coal is used to produce `syngas', consisting of hydrogen, carbon monoxide and CO2, from which the hydrogen is captured.
Natural gas reforming – currently the cheapest form of hydrogen production. Natural gas is heated to high temperatures, breaking down the gas to produce hydrogen.
Electrolysis is the cleanest source of hydrogen as it does not generate any CO2 emissions from production. However, it is the most expensive and energy-intensive method of production and can generate emissions through increased energy usage. Alternatively, coal gasification and natural gas reforming are much more cost-effective, but both generate significant amounts of CO2 emissions in the process of producing hydrogen. This means some form of carbon abatement, such as carbon capture and storage (CCS), would be needed to make hydrogen from these sources a `zero emissions' fuel.
The Victorian Government has established the CarbonNet Project to investigate the potential for establishing a commercial CCS network, with potential applications for hydrogen production from the Latrobe Valley's abundant brown coal reserves. The viability of CCS at the scale required for this scenario is currently unclear. The high cost of CCS and large deposits required for long-term storage are significant challenges that would need to be overcome for coal gasification or natural gas reforming to represent a viable zero emissions source of hydrogen. Figure 47 represents an overview of the potential hydrogen supply chain under these three approaches.
94
Figure 47: Hydrogen supply chain concept
Source: KPMG energy modelling
Analysis conducted by KPMG has estimated the annual resource requirements for each of the different processes and applied it to the estimated hydrogen demand in 2046, as outlined below.
Resource Electrolysis Coal gasification Natural gas reforming
Electricity (gigawatt hours)
63,600GWh 2,700GWh 1,700GWh
Water (litres) 19.04 billion 14.25 billion 23.2 billionBrown coal (tonnes) 0 14.3 million 0
Natural gas (terajoules)
0 0 207,700tJ
Source: Adapted from KPMG energy modelling analysis
While at first glance the water use for hydrogen seems significant, it should be noted that this is only 2–4% of the current total potable water consumption for the Melbourne region of around 516 billion litres per year.
Since hydrogen can be generated and stored for future use, its generation does not affect peak demand in the same way electricity usage does in the battery electric vehicle scenarios, essentially making it the same as the base case in terms of maximum demand.
95
However, the nearly 64,000GWh of electricity required to meet the hydrogen demand using electrolysis is the equivalent of nearly one and a half times total forecast energy consumption from all Victorian households and businesses in 2046. This means electricity generation capacity would have to nearly grow by 147% on top of the base case for 2046. The generation, distribution and transmission infrastructure cost of meeting this demand would be over $14.5 billion in net present value. More detail of KPMG's energy modelling approach is in the Automated and Zero Emission Vehicle Infrastructure Advice Energy Impacts Modelling report.
Freight-led hydrogenHydrogen FCVs are likely to emerge as a result of their potential range-to-weight benefits over battery electric vehicles, particularly for heavy freight. Automated freight presents a range of considerations about the impacts of automated vehicles (on top of the employment impacts, discussed in Private Drive), particularly on the way roads are designed, built and maintained.
As we've highlighted previously, evidence suggests that automated vehicles that are connected to vehicles around them have the potential to travel much closer together. This potential gives rise to the concept of automated freight `platooning', in which a number of freight vehicles form a `road train', travelling in close formation behind a lead vehicle to achieve greater efficiencies in moving freight. The concept of having a single driver in a lead truck with automated trucks following is already being tested in some countries. In a fully automated future, even a single driver might not be required.
However, Arup's advice on the transport engineering impacts of automated vehicles has found that the benefits of platooning in an automated, zero emissions future might not actually be significant, particularly given some of the alternative technologies currently being developed in the logistics industry. The main benefits of platooning are lower fuel consumption, CO2 emissions reductions, improved safety, optimisation of the transport network and the potential to reduce labour. In an automated, zero emissions future, many of these benefits could be realised by default, potentially rendering platooning redundant.
If platooning did eventuate, there are concerns about concentrated road wear or `rutting' due to vehicles travelling on exactly the same paths on the road, or `uniform lane positioning', and about the effect on pavement strengths and bridge loading. Arup's work suggests that the effect of these features may not be significant. A future in which freight vehicles are platooning is not likely to generate additional demands on road strength compared to current conditions. However, this assumption will need to be monitored as knowledge of automated freight platooning evolves. For more detail on Arup's findings, see the Infrastructure Victoria Automated and Zero Emission Vehicles Transport Engineering Advice report.
While the impact of uniform lane positioning has the potential to be much greater than today, we heard that existing automated freight projects operating on private land in Western Australia have found that programming vehicles to travel on slightly varied paths from the vehicle ahead of them could address this challenge without the need to modify infrastructure. However, if lower freight costs lead to an increased relative demand and
96

freight volumes grow, road asset maintenance costs will likely rise as well. We are not currently in a position to quantify these costs.
As we mentioned in our summary of the Private Drive scenario results, WSP's analysis suggests that freight vehicles will have similar ICT requirements to private vehicles. Platooning is not predicted to change this. If platooning were to emerge, then fine vehicle positioning with LIDAR and vehicle-to-vehicle communications would be sufficient to enable it. Additional ICT infrastructure may be needed if government or other roads operators wanted to impose conditions on the road network, such as specifying segments of the road network where platooning is permitted.
How will automated and zero emissions vehicles change the way freight is moved?While the modelling assumed a freight task proportionally similar to today, it is hard to estimate what, if any, induced freight demand may arise through automated or zero emissions freight movement. While automation is already present in many ports, freight vehicles on the road network are likely to be subject to similar rules and regulations as today. The evidence suggests that we are unlikely to see changes in freight vehicle types, at least from a pavement and axle loading perspective, but that automated freight may replace human driven freight over time.
There are additional challenges represented by autonomous delivery of freight. Distribution hubs and warehouses may experience some changes in their loading and offloading needs. First and last mile delivery, such as `white van' deliveries, may require specific kerbside access or make use of pick-up and drop-off areas.
Seen, but not heardZero emissions vehicles, including hydrogen FCVs, are also likely to generate much less noise than traditional petrol or diesel vehicles, particularly at lower speeds. Aurecon and ERM's analysis of environmental and population health impacts found that zero emissions vehicle technologies could reduce traffic noise at low speeds in dense urban areas, or where high quantities of low speed and start-stop driving are common. This benefit would apply to high density areas where there are a number of traffic lights and intersections with high levels of engine braking and acceleration. Figure 48 illustrates the difference in sound pressure level (SPL) – measured in decibels between a hydrogen FCV (HV) and two comparable generic traditional internal combustion engine vehicles (ICEV1 and ICEV2).43
This clearly shows the significant difference in sound pressure at lower speeds, but a convergence in vehicle noise above 20km/h, due to tyre noise and aerodynamics. This could potentially increase the attractiveness of residential properties otherwise subject to noise pollution in urban environments in some circumstances.
43 Sakamoto, I. et al., (2010), Reviews On Countermeasure To Safety Risk Associated With Quietness Of Hybrid Or Electric Vehicles In Japan, INTER-NOISE 2010; 2:1048-1055.
97
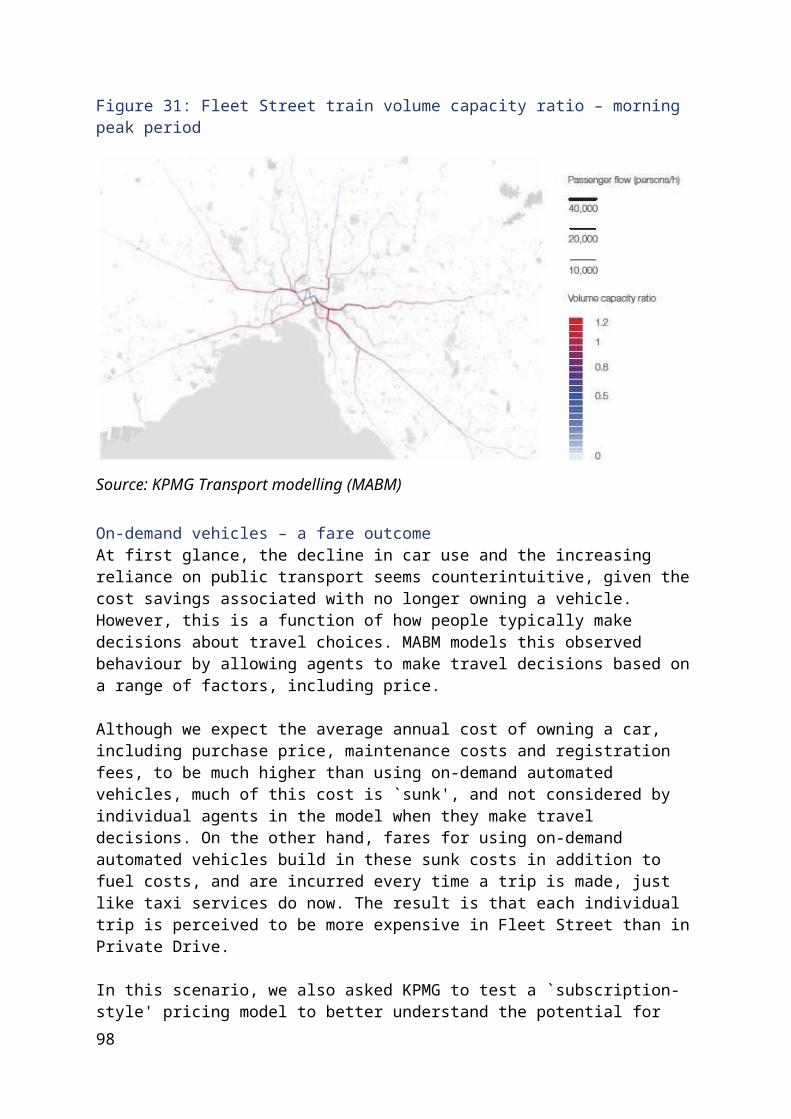
Figure 48: Noise output – hydrogen FCV and two comparable internal combustion engine vehicles
Source: Aurecon
Reduction in vehicle noise has the potential to change road use. Road freight operations, which are typically restricted at night, could potentially increase their operating timetable as their noise impact on urban areas could be mitigated.
The combination of reduced labour costs from automation and reduced vehicle noise from FCV technology led us to test the potential to model moving some of Victoria's freight operations to night in MABM. KPMG's modelling found that, when the total proportion of freight trips made between 7pm and 7am is increased to 50% it makes little difference to the performance of the network under the Hydrogen Highway scenario. This is due mostly to the considerable improvements that automated vehicles bring to the performance of the network in 2046 in this scenario, and the relatively low proportion of freight compared to private vehicles.
In the meantime, however, moving more freight to night operations in congested areas is likely to remain important (at least as a transitional measure).
Zero emissions freight, ports and youThe introduction of zero emissions and automated vehicles could be very important to ensure the ongoing social licence and capacity of the Port of Melbourne in the coming decades.
98
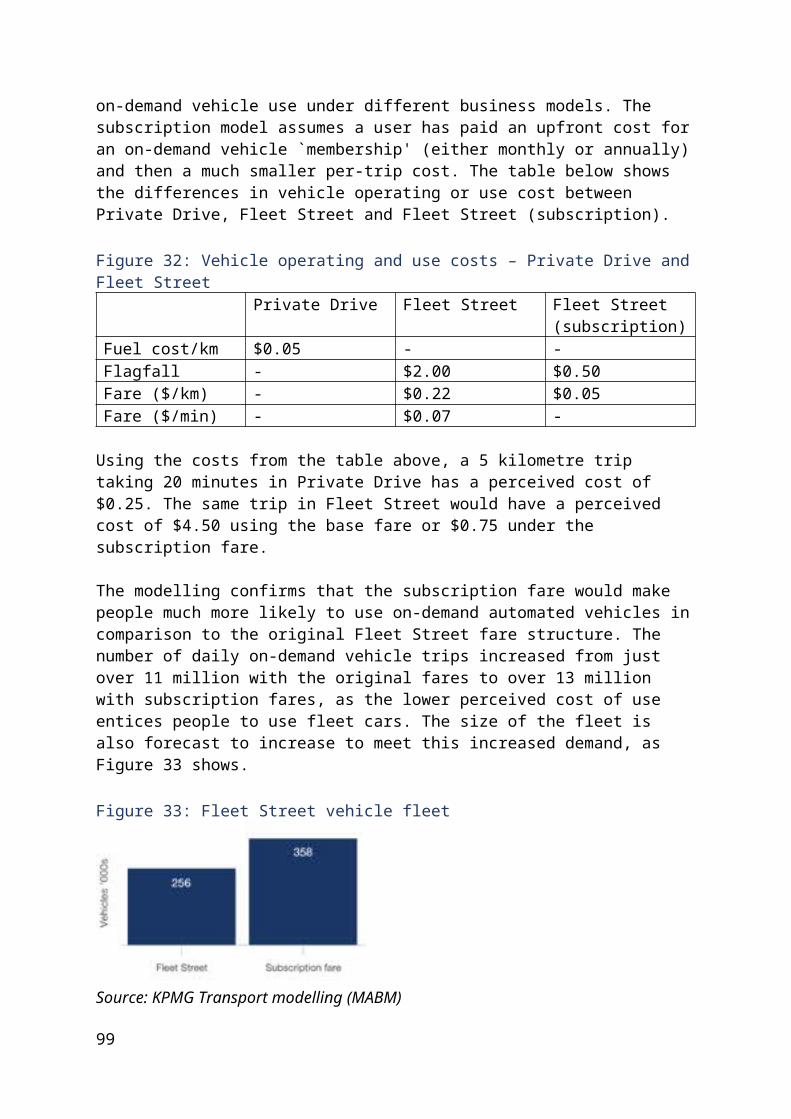
Infrastructure Victoria's previous advice on Securing Victoria's ports capacity stressed the importance of minimising impacts of increasing capacity at the Port of Melbourne on residents who live near the port and key transport corridors. Reducing noise and emissions is a key element of this, which hydrogen FCVs could potentially deliver.
What would a hydrogen future mean?A hydrogen future would not be without its challenges. Producing hydrogen is likely to be relatively resource intensive, at least using current generation techniques. Producing enough hydrogen to fuel the entire vehicle fleet would, depending on the method, use vast amounts of electricity, coal or natural gas. This would potentially generate significant CO2 emissions, which would subsequently need to be captured using carbon capture and storage technologies to make them `zero emissions'. While it's likely that the efficiency of hydrogen production technologies could improve with scale, there would still be challenges with largescale distribution and storage of hydrogen. For these reasons, it may not make practical sense to transition the entire vehicle fleet to hydrogen.
However, this does not mean that hydrogen is without merit. Much of the evidence suggests that for heavy vehicles, hydrogen FCV technology is more commercially viable because it can deliver much more range by weight, can carry a larger amount of fuel, and can be refuelled more quickly than a battery. For the freight sector, which is likely to seek to maximise the carrying capacity of its vehicles, this may make hydrogen FCVs a more compelling proposition than battery electric vehicles, and would deliver the same environmental benefits if the hydrogen was produced from a zero emissions source.
There are also strategic considerations that support hydrogen production. Hydrogen technology has the potential to provide greater energy security and build resilience in Victoria's electricity network by adding storage capacity, essentially acting like a battery. In much the same way as pumped hydro or battery storage, excess renewable energy from solar or wind can be used to generate hydrogen, which can then be stored and deployed as a source of energy when demand is higher and generation from these renewable sources is low. An example of this approach can already be seen in South Australia with the announcement of its `Hydrogen Hub'.
Case study: Japan's `hydrogen society'While the world grapples with how to address climate change and meet the Paris Agreement target of limiting global warming to less than 2 degrees by 2030, Japan has firmly staked its future on hydrogen.
Japan's government-backed plan to become a `hydrogen society' is ambitious. A three-phase approach is currently in progress, with the first phase involving a dramatic increase in fuel cell investment, including for residential use and commercial vehicles.
While hydrogen emits no CO2 when used, Japan is betting on emerging technologies such as carbon capture and storage to move to the second and third phases of its hydrogen society plan and secure a full-scale zero emissions energy source from around 2040. As part of this plan, Japan is backing the Victorian-based Hydrogen Energy Supply Chain project, a pilot that aims to produce and transport hydrogen from the Latrobe Valley to Japan.
99

The logistics of rolling out hydrogen fuel cell passenger vehicles are just as challenging. Japan has about 2,200 hydrogen-fuelled cars on the road today, and the Japanese Government told us they plan to have 40,000 similar vehicles on the road by 2020, when the Tokyo Olympic Games will showcase Japan's technology and vision to the world. By 2030, they plan for this to increase to a whopping 800,000 hydrogen fuel cell cars. By 2020, 100 fuel cell buses are also planned to be on the road as a demonstration during the Olympics. While these numbers might be a small proportion of the 60 million passenger vehicles on Japan's roads today, the refuelling infrastructure required is significant.
The Japanese Ministry for Transport told us that in early 2018, 101 hydrogen refuelling stations were in operation across Japan. Expanding that network to the target of 160 by 2020 won't come cheaply. Japanese gas and energy company Iwatani put the cost of building its first refuelling station at around A$6 million, with half the funds coming from government coffers. Industry is calling for restrictive (and costly) regulations to be eased to allow for more refuelling stations to be built.
The method of transport is another challenge that is looming. Should the 40,000 vehicles by 2020 target be achieved, moving beyond that will require a significant scaling up of the transport infrastructure, which currently relies on trucks. Adding a network of hydrogen pipelines to a densely populated and built-up metropolis like Tokyo would require careful land use planning and the easing of safety regulations. Road transport of liquid hydrogen is also under consideration. Iwatani, which dominates the domestic market for liquid hydrogen, plans to increase annual output by 50% within two years.
Japan has set its sights on more than just hydrogen – battery electric vehicles are also receiving strong government support. In addition to national subsidy programs, the Tokyo Metropolitan Government told us they have set a goal for more than 80% electric or hybrid battery electric vehicles by 2030, which is supported by a range of programs targeted at small businesses, government and taxi fleets, and Tokyo residents.
One thing is for sure – with the world's third-largest economy fixing its sights on hydrogen, the potential for fuel cell vehicles shouldn't be underestimated.
Slow LaneHalf of the trips taken use a shared fleet of electric automated vehicles, while the other half uses conventional cars.
Slow Lane represents a transitional scenario. Any path to having 100% automated vehicles on the roads will involve a mix of automated and nonautomated vehicles for some time. How receptive people are to driverless technologies will also determine the length of the transition and if consumer acceptance is low, the Slow Lane scenario could be the reality for quite a long time. In this situation, we would need to find a way to do the best that we can with our infrastructure to serve all road users.
This scenario gives us an opportunity to examine the transitional effects on transport, energy and infrastructure networks. We can also gain insight into the potential transition
100
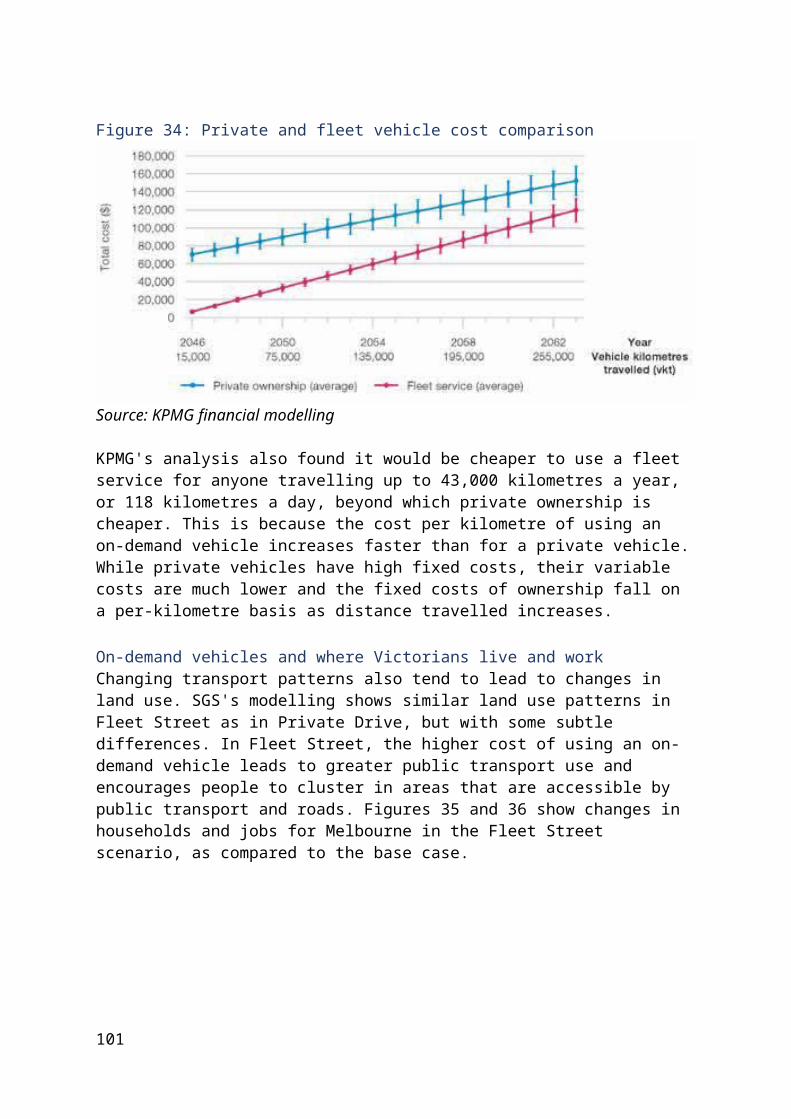
issues for Victorians in rural and regional areas, people in lower income brackets, and Victorians who may not otherwise have access to automated vehicles.
Mixed businessA mix of automated and conventional vehicles would clearly dilute the network efficiency benefits of automated vehicles, but it's not projected to eliminate them entirely.
The transport modelling shows that automated vehicles improve the overall performance of the network, even with a mix of cars on the road. This is particularly due to the assumption that the automated fleet in this scenario is a shared on-demand fleet, meaning the number of vehicles is greatly reduced. The transport modelling suggests that the number of cars in this scenario will fall to around two million, compared to 3.5 million in the base case. This, in turn, leads to significantly less road congestion than in the base case, with average speeds projected to increase by 39%.
The modelling shows that public transport is relatively more attractive in this scenario, accounting for 22% of motorised trips, compared to 19% in the base case and just 14% in Private Drive. Just like in the Fleet Street scenario, in which on-demand automated vehicles operate on a fare structure similar to traditional taxis, on-demand vehicles have a higher perceived cost to use than the conventional vehicle fleet. The impact of this is that those using the on-demand vehicle fleet (half the population) may actually choose public transport because, in some cases, it will be a cheaper. This plays out differently in different parts of Victoria, and is sensitive to factors such as overall trip length and availability of public transport.
2046
DRIVERLESS ELECTRIC SHARED/ ON-DEMAND DRIVER PETROL/ DIESEL PRIVATE OWNERSHIP
Key findings
43% fewer vehicles if half are shared Congestion improves, with speeds 39% faster on average Equity could be an issue, with higher income areas likely to benefit first 1,388 DALYs avoided, valued at $270 million in 2046
Automated and non-automated vehicles – playing niceFigure 49 provides an illustration of how mixed automated and conventional vehicles could operate on the Monash Freeway in 2046.
In one interpretation of this scenario, the inner lanes of the freeway could be designated to automated vehicle use, allowing automated vehicles to fully realise their efficiency benefits
101
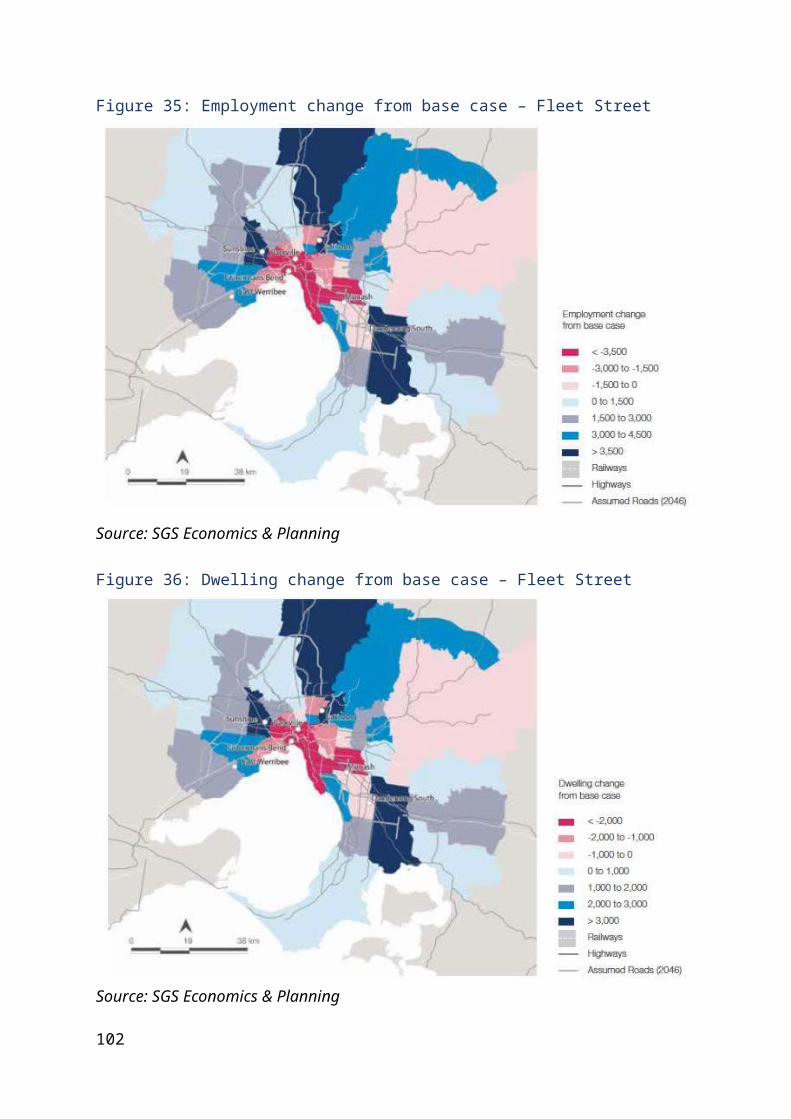
and improve travel speeds. Arup's research on the road infrastructure requirements for automated vehicles found no evidence to suggest that segregating automated vehicles in separate lanes would be necessary. However, we've chosen to illustrate this potential outcome to reflect the possible differences in the way automated and non-automated vehicles could operate on Victoria's roads.
What this scenario also highlights is that anything less than 100% uptake of automated vehicles will likely mean that roads will need to retain all the infrastructure for humans to use the road, including visual infrastructure (traffic lights, line markings and signs), barriers and kerbs. For example, `passive' roadside infrastructure, such as variable message signs, would need to be maintained in the medium term.
The potential infrastructure benefits of a fully automated fleet, including traffic optimisation, flexible road space use and increased greening of roadways, would probably not be possible with a mixed fleet. However, it is important for the government to be able to recognise and realise any opportunities if we do see a mixed fleet for an extended period of time (for example, if the fleet mix reaches an equilibrium at less than 100% automated vehicles). Repurposing some parking space or designating space for automated vehicles could improve the way our roads operate and further encourage automated vehicle uptake.
Mixed fleet, mixed accessibilityWhile Victorians will get the accessibility benefits of automated and zero emissions vehicles under all scenarios, the benefits are slightly reduced in the Slow Lane scenario. There are two contributing factors to this. The first is the higher relative cost of use of the on-demand vehicle fleet, as modelled in the Fleet Street scenario.
The second factor is uneven rates of technology uptake among Victorians in different income or socioeconomic groups. Because different income groups tend to live in different parts of the state, this means that different locations will have different outcomes in terms of take-up of automated vehicles and, ultimately, in accessibility.
While in all of our scenarios we assumed a linear uptake of automated and zero emissions vehicles, we also commissioned Deloitte Access Economics to examine the socioeconomic effects of different take-up rates across different regions and income groups in Victoria.
102
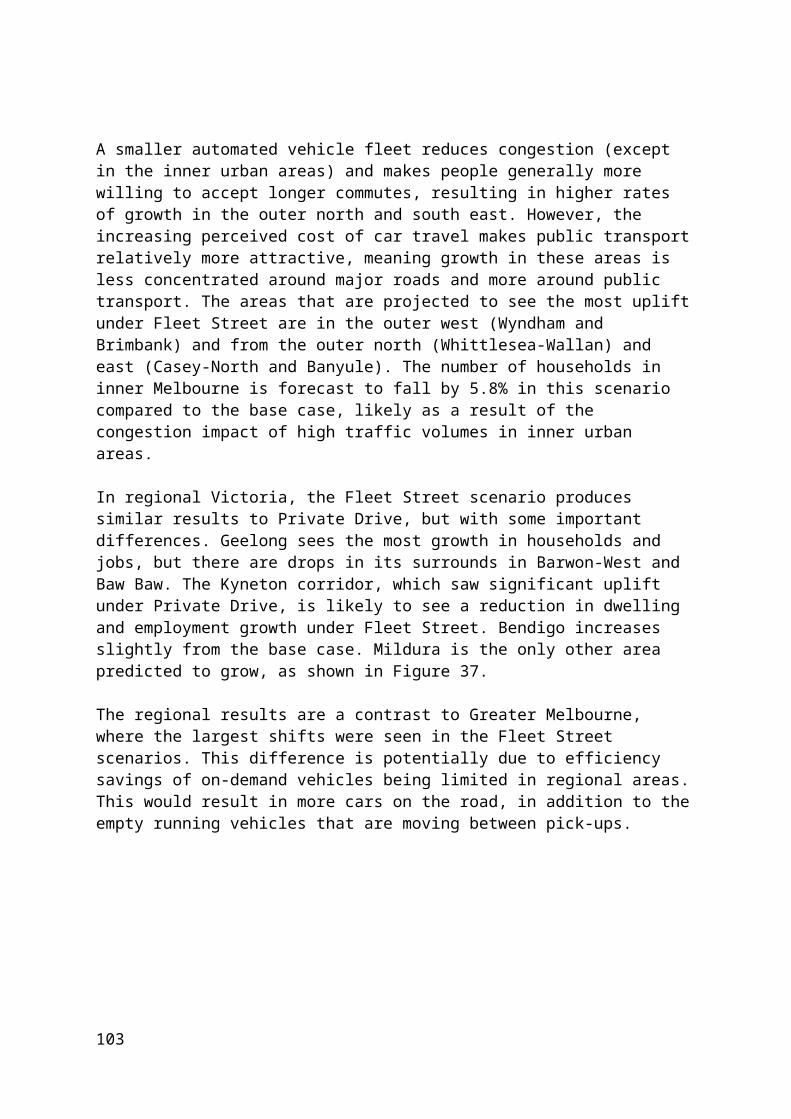
Figure 49: Monash freeway – Slow Lane concept
Source: Urban Circus & Ethos Urban
In this research, much of the evidence suggested that education and income were likely to be key influencing factors for the early uptake of automated and on-demand vehicles. For the purposes of modelling the accessibility impacts of automated vehicles, Deloitte Access Economics used income as the primary factor determining automated vehicle adoption, noting that income and education tend to be highly correlated.
Using Australian Bureau of Statistics incomes data and research on technology diffusion, Deloitte Access Economics grouped the population into five different income segments, and allocated each segment a different rate of uptake. High income groups (groups 4 and 5 in Figure 50) are assumed to adopt the vehicles earlier and at a faster rate than low-income groups (groups 1 and 2 in Figure 50).
For all scenarios other than Slow Lane, all population groups reach 100% take-up by 2046, but at different rates (Figure 50).
What this figure shows is that, at 50% take-up in 2031 (the dotted line), the lowest two income groups, representing 44% of the population, would only represent 3% of automated vehicle users. This is representative of what the differences in automated vehicle uptake
103
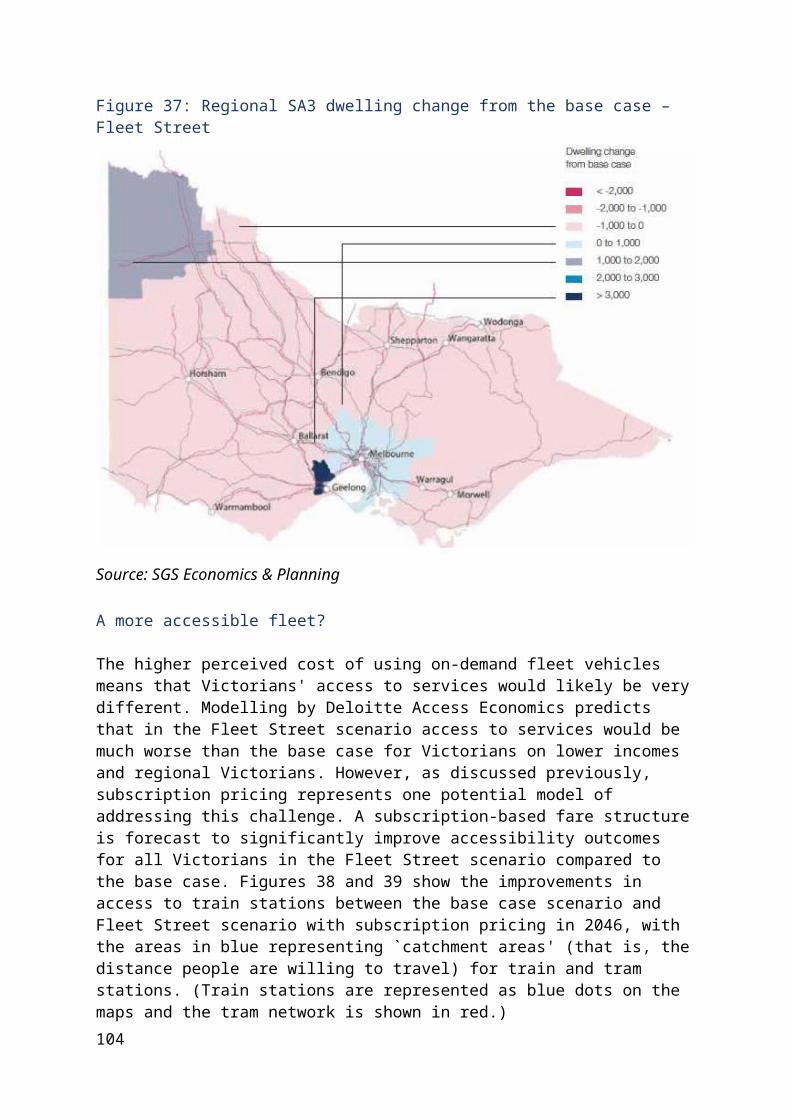
among income groups might look like in Slow Lane, meaning that, in the medium to long term, there could be significant ongoing disparities in access to automated vehicles in this scenario.
Using this approach, modelling showed that improvements would be most prominent in areas with higher uptake rates of automated vehicles, which tend to be areas with higher incomes. Figure 51, Figure 52 and Figure 53, which show the percentage of each area that has access to a local train station, illustrate the impact of uneven uptake on accessibility by comparing the base case, Fleet Street (subscription fare) and Slow Lane (subscription fare) scenarios.
Figure 50: Technology uptake by income cohort
Source: Deloitte Access Economics
These maps show that with 100% adoption of automated on-demand vehicles and a cheaper fare structure (Fleet Street with a subscription fare), there is an almost uniform improvement in access to train stations relative to the base case in almost all of the middle ring areas of Melbourne. When only 50% of the population has access to automated on-demand vehicles (Slow Lane), some areas in the south east, north and west, where a higher proportion of people have lower incomes, don't see such improvements.
104
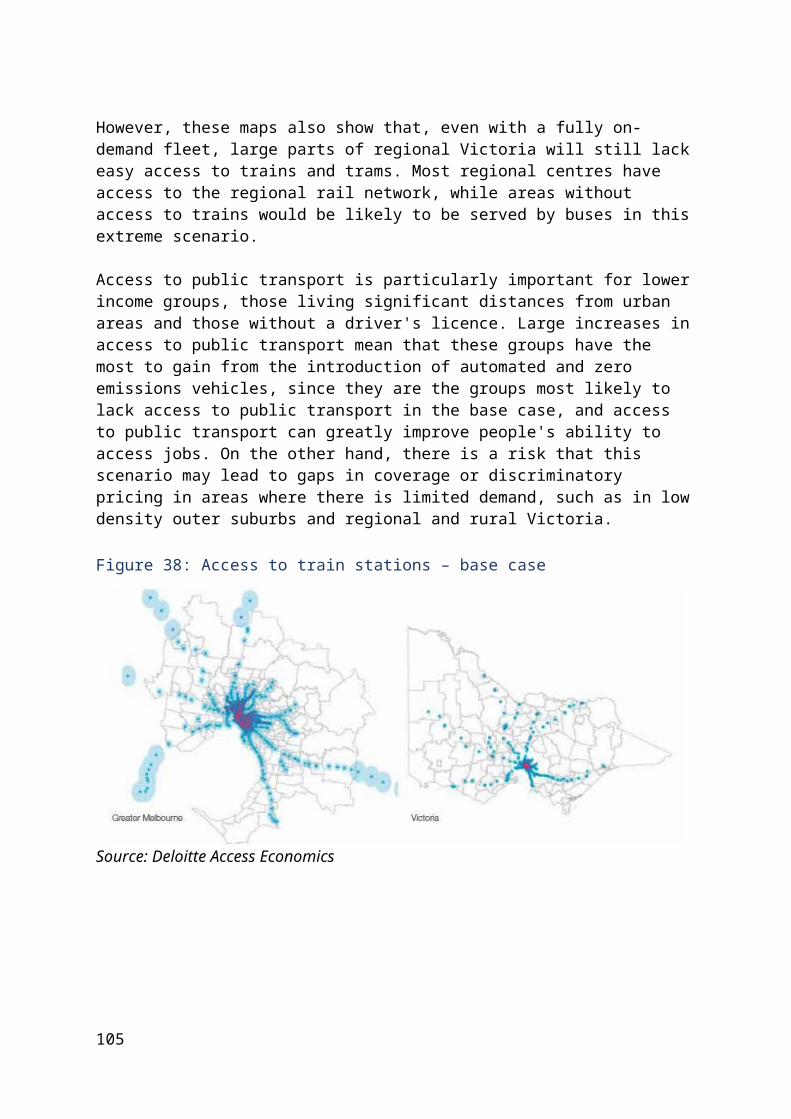
Figure 51: Base case train access
Source: Deloitte Access Economics
105

Figure 52: Fleet Street train access
Source: Deloitte Access Economics
106
Figure 53: Slow Lane train access
Source: Deloitte Access Economics
Land use in the Slow LaneSGS's analysis shows that the effects of mixed take-up and ownership are reflected in the movement of people and jobs. The modelling shows that this scenario is likely to see the lowest overall shift in employment and households, but still lead to fewer people and jobs located in the inner city than in the base case.
This pattern of growth reflects the improved performance of the road network. The impact of the EastLink, and improved motorway access to it through the North East Link and the E6, can be seen in strong dwelling growth in Melbourne's east, including in Knox and Casey-
107
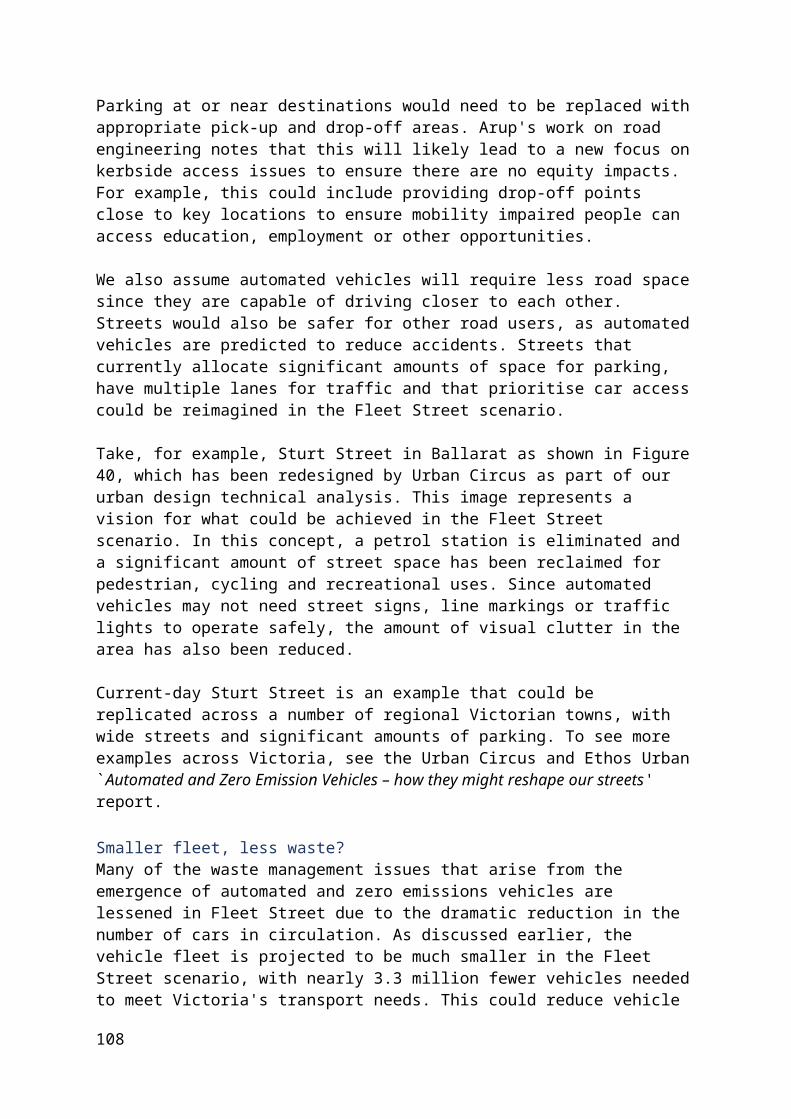
North and South. In the west, it can be seen in the uplift at Brimbank, which contains the junction of the Western Ring Road, Western Freeway and Calder Freeway (see Figure 54). The freeway corridors in outer areas are where automated and zero emissions vehicles could provide significant increases in accessibility.
As in the other automated scenarios, congestion in inner Melbourne is forecast to lead to fewer dwellings and jobs in inner city areas compared to the base case. This pattern reflects increasing inner city congestion, likely resulting from fleet empty running and lower marginal costs of travel for private automated vehicle owners. The decline in inner city jobs is in all industries, most notably in health and education.
SGS's modelling shows regional Victoria would experience very little change in land use at all in the Slow Lane scenario. Only Geelong and Bendigo experience noticeable changes. This is likely a continuation of the slower uptake of technologies, as observed in Deloitte Access Economics' socioeconomic analysis.
Figure 54: Slow Lane – employment change from base case
Source: SGS Economics & Planning
108

Figure 55: Slow Lane – dwelling change from base case
Source: SGS Economics & Planning
Slow Lane still has some vehicle emissionsSlow Lane delivers some, but not all, of the environmental and population health benefits of zero emissions vehicles. Because 50% of the fleet is still traditional internal combustion engine vehicles, there are still vehicle exhaust emissions, albeit to a smaller extent than in the base case. Using the avoided DALY approach, the emissions reductions from this scenario are projected to deliver a benefit of 1,388 DALYs avoided compared to the base case scenario, which represents an annual economic benefit of $270 million in 2046.
Mixed fleet and the energy marketIn the same way that this scenario has the potential to deliver some but not all of the benefits of automated and zero emissions vehicles, it may lead to some but not all of the challenges associated with automated vehicles. A prime example of this is the impact on Victoria's energy grid. Because the on-demand automated vehicle fleet is much smaller and driving relatively fewer kilometres than in the other automated vehicle scenarios, the additional energy demand is forecast to be significantly lower. Modelling undertaken by KPMG shows that the vehicle fleet would consume a total of approximately 10,100GWh of electricity in 2046, a 23% increase over base case consumption.
As we discussed earlier in reference to the Fleet Street scenario, the charging profile of an on-demand vehicle fleet is such that a good proportion of vehicle charging can occur when overall energy demand is lower. This means fleet charging is not forecast to contribute as much to maximum demand, mitigating the overall impact on the energy network. In this scenario, the vehicle fleet only adds 1,100MW to maximum demand during peak hours at a total cost to the network of $2.1 billion compared to the base case.
109
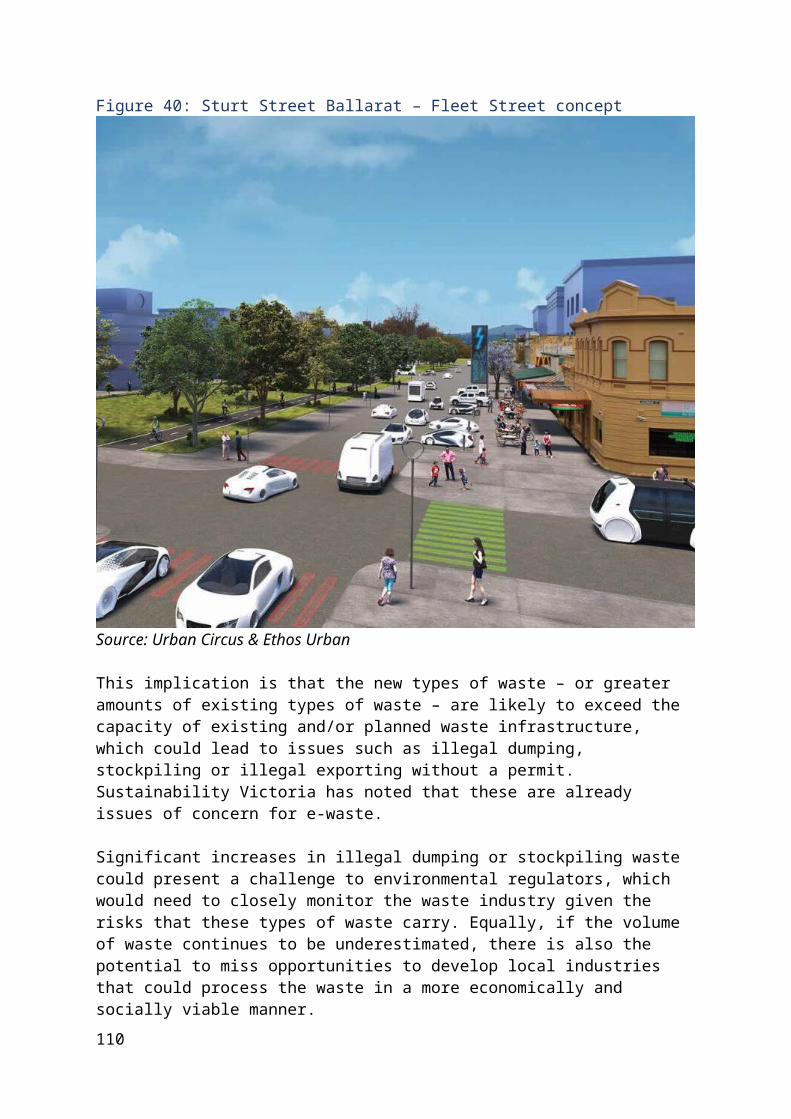
Slow Lane, lower government financial impactsThe range of financial impacts on governments would also be lessened by a smaller proportion of people moving to on-demand automated vehicles. Unsurprisingly, this scenario is estimated to have the least financial impact on government revenues, including our estimates of Victoria's share of fuel excise revenue, with a $5.1 billion reduction in 2046. This is because half of the impacts associated with the emergence of automated on-demand battery electric vehicles aren't realised. Driver's licence and registration fees are still being paid, fuel excise is still collected and parking fees are still being paid by drivers of traditional vehicles. Similarly, the economic and employment impacts of this scenario are likely to be less than the fully automated scenarios.
What have we learned from Slow Lane?We expect that a mix of traditional vehicles and automated, zero emissions, on-demand vehicles is a probable outcome for Victoria in the medium term. What the evidence we've gathered on this scenario shows us is, even if only some people adopt these technologies, there will be wide-ranging (albeit slightly smaller) benefits for most Victorians. This is promising, and might encourage governments to consider the benefits of automated and zero emissions vehicle uptake as the technologies develop.
However, some of the challenges highlighted by this scenario are a reminder that any move to incentivise automated and zero emissions vehicle uptake should be carefully considered and targeted. Given the evidence around how new technologies tend to be adopted, there is a real risk that most of the benefits of automated vehicles will go to relatively wealthy, well-educated people living in inner urban areas. Lower-income people living in outer metropolitan and regional areas may not see as many of the benefits.
Because this scenario could be a reality for quite some time, it's worth considering how infrastructure planning, energy market investment and urban design rules could maximise the benefits of automated and zero emissions vehicles and/or further encourage their uptake.
The consultant reports also highlight that there are some no-regrets actions that governments could take regardless of automated vehicle uptake rates. For example, the benefits to road space allocation and street and neighbourhood design that could be achieved by automated vehicles could still be pursued by repurposing parking space or designating space for automated vehicles. Changes like these could serve the dual purpose of simultaneously capturing the benefits of automated vehicles and encouraging their uptake. In the same vein, certainty around emissions reductions targets and renewable energy policy, as well as investment in `smart' network infrastructure, could deliver significant benefits. Even a small fleet of battery electric vehicles, if well managed, could improve the resilience of Victoria's energy network.
Local insights – how Victorians might use driverless cars
To help better understand how people might value their time differently in a driverless or shared car, we ran an online survey for two weeks in May and June 2018. The survey asked Victorian motorists how they might use a driverless car in the future, and what trade-offs
110
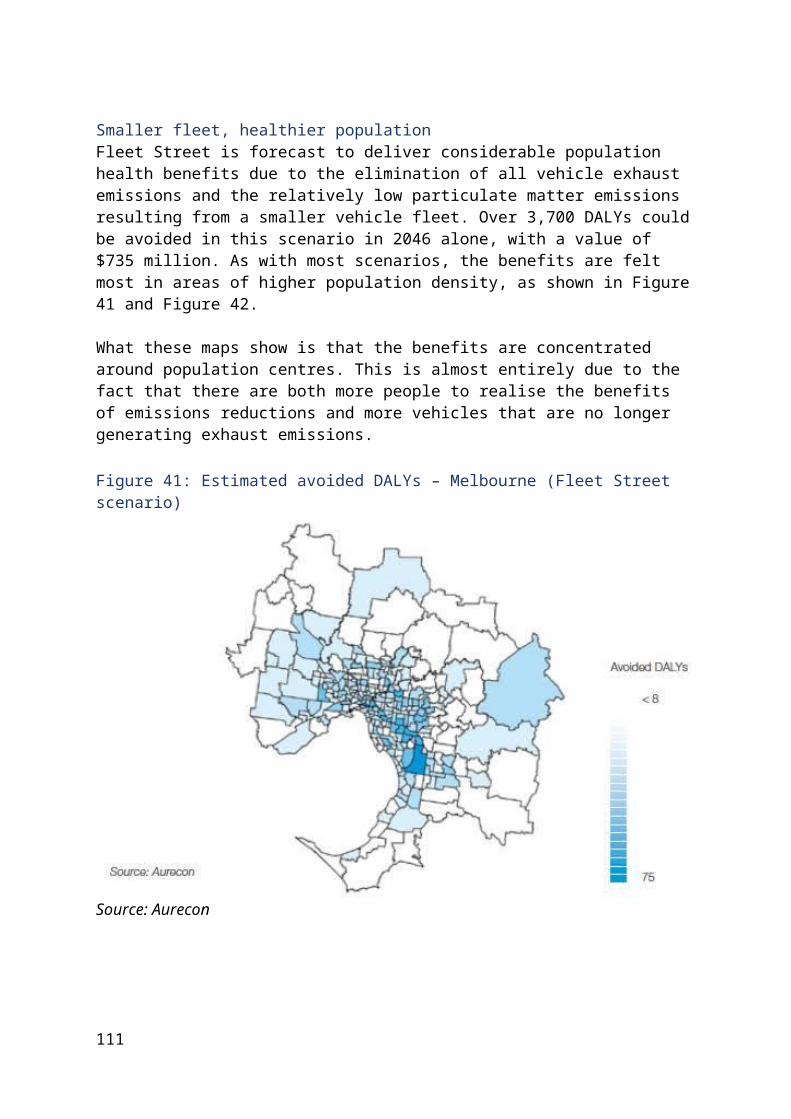
they'd be willing to accept to use a shared vehicle. Respondents were allowed to select more than one response to each question.
Of the 992 respondents, most people (64%) said they would `relax and do nothing' on a short trip in a driverless car, but 43% would use the internet and 26% would work in that time. On longer journeys of more than 30 minutes, people started to think about what they might do differently in a driverless car. About half (49%) of respondents said they would use the internet, one-third would watch television or movies and around 30% would either work or sleep.
There were differences in these choices across demographic groups. For example, a higher percentage of people aged under 55 said they would use the internet for leisure in a driverless car. Similarly, people aged under 45 were more likely to say they would use that time to work.
We also asked what types of journeys people might take in a driverless car compared to how they use their car today. The same amount of people who currently use their car for work trips during business hours would also consider using a driverless car for this purpose (23%), and 70% of respondents would consider using a driverless car for social outings. Roughly two-thirds of people would think about taking a driverless car to run errands, and 13% would consider sending their children to school on their own in a driverless car.
What would you do on a driverless car trip
of less than 30 minutes? of more than 30 minutes?
Use the internet for leisure (e.g. Facebook or online shopping)
43% 49%
Work (including using the internet for work)
26% 29%
Watch TV or movies 13% 33%Sleep 13% 30%Just relax and do nothing 64% 55%Other 38% 40%
Activity Percentage of respondents who would consider using driverless cars for this activity
Commuting 39%Work trips during business hours 23%School run 17%Unaccompanied school run 13%Running errands 64%Social outings 70%Long trips or holidays 45%None of the above 18%Other 13%
Imagine a future where you own Definitely would Might Definitely would not
111
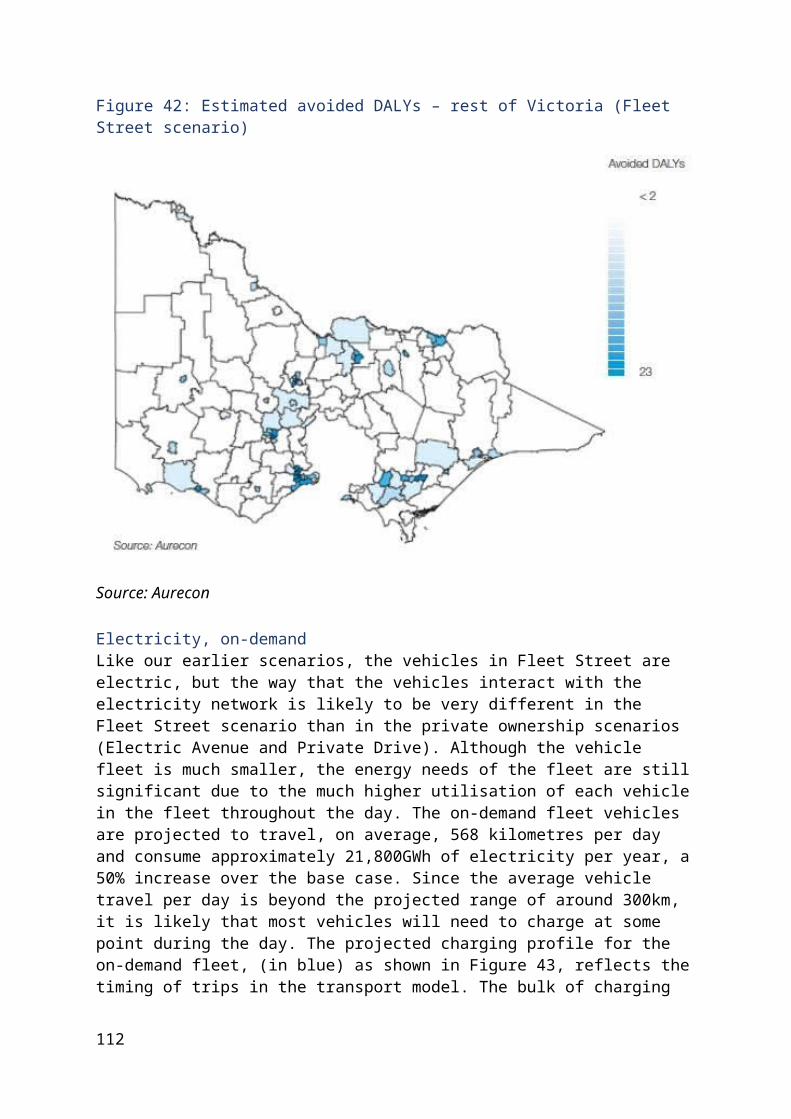
your own driverless car. To what extent might you do the following?Have your driverless car drop you off, then park somewhere nearby for current parking rates, so it's nearby when you need it
21% 50% 29%
Have your driverless car drop you off, then send it elsewhere to avoid paying for parking where you are, before calling it back later
42% 38% 20%
Generate an income for yourself by letting other passengers use your driverless car when you are not using it
15% 35% 49%
Approximately 58% of people aged 55–64 said they currently travel by car for their commute, either as a driver or a passenger, but only 42% would consider travelling in a driverless car for these trips. Comparatively, 67% of people aged under 54 would consider travelling in a driverless car for their commute. However, a majority of people aged over 65 were open to using a driverless vehicle to run errands (56%) and attend social outings (58%).
In terms of sharing taxi rides, a slim majority of people would be driven by their hip pocket, opting to share with one or two other passengers in order to save money, even if it meant the trip took slightly longer. This was true in both traditional and driverless vehicles, although people were slightly less comfortable sharing a vehicle when there was no driver present. However, among people aged 34 or younger, over 65% would share a driverless vehicle with one or two other passengers to benefit from the lower cost, while over 70% would share a traditional car. There was little difference in the preference for sharing a driverless vehicle between women (52%) and men (49%).
Money was also a motivator when it came to paying for parking, with 42% of people saying that if they had their own driverless car, they would `definitely' send it elsewhere to avoid paying for parking (compared to 21% of people opting to park nearby and pay current rates). However, just 15% of people said they would definitely consider generating an income for themselves by allowing their driverless car to run as a `robotaxi' when not being used.
These decisions are also different across age groups, with 34% of people aged under 34 stating they would definitely generate an income through hiring out their driverless car when they weren't using it. Conversely, less than 9% of people aged over 65 would definitely do this.
While the focus of our survey was not people's willingness to use driverless cars or features, a number of respondents commented that they wouldn't use one. Attitudes to driverless vehicles was the focus of a Victorian survey conducted in 2017 by ConnectEast in partnership with VicRoads, the Australian Road Research Board, La Trobe University and RACV to help road operators and car manufacturers understand the needs of motorists. The
112
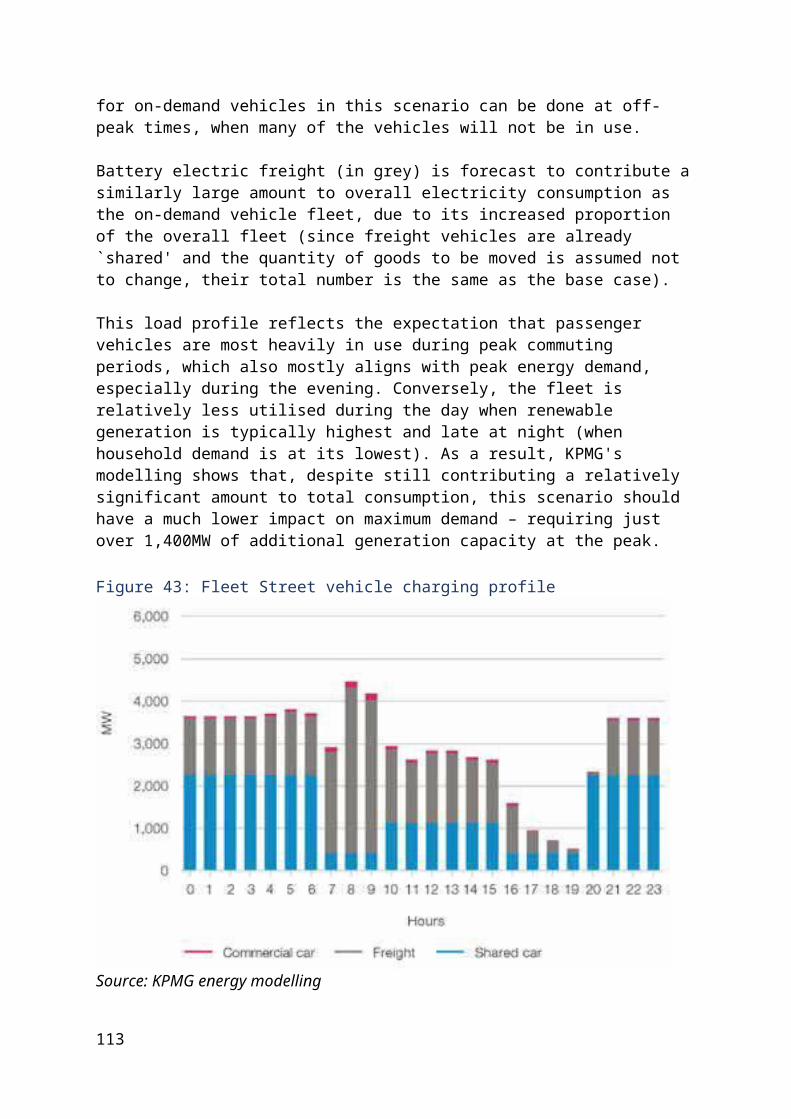
results from more than 15,000 people polled showed that, despite the majority of respondents stating they have very little or no knowledge of driverless cars, 55% of people want lane keeping assistance technology in their next car and 35% of people would like their next car to be fully self-driving on freeways. The majority of respondents were also in favour of having their next car connected to a data network for the purposes of communicating real-time traffic and safety information.
A separate poll by global market research firm Ipsos, released in 2018, found that while the vast majority of Australians are at least interested in driverless cars, we are less optimistic than other countries about the benefits. Less than half of us believe driverless cars will make driving safer. We also bucked the international trend on who we trust to regulate driverless cars, with government seen as the most trusted regulatory player, versus the rest of the world who trusted car manufacturers and designers.
Victorians may be sceptical about the potential for driverless cars, but the market is already clearly calling for automated features, such as lane keeping assistance. As more and more people are exposed to and become familiar and comfortable with automated technologies, how we plan and use our time in cars could change considerably.
High SpeedA shared fleet of electric and automated vehicles in 2031.
If automated technologies prove themselves to be safe and reliable, they may become common on our roads much sooner than we expect.
Transitioning to 100% automated on-demand vehicles is projected to have the most dramatic impact on Victoria's transport network. In the High Speed scenario, the impact is just as dramatic as that outlined in the Fleet Street scenario, but with all of the effects felt 15 years earlier.
Cars are a significant purchase for many people, and not something to be replaced as soon as the newest technology comes around. On-demand services provided by commercial fleets, however, aren't likely to have the same constraints. The rapid emergence of automated vehicle technologies could present an opportunity for car-sharing businesses to roll out fleets of automated on-demand vehicles. In this scenario, we tested the effects of a rapid roll out of shared on-demand vehicles, where 100% of the vehicle fleet is made up of automated on-demand vehicles in 2031.
This could mean that the market for second-hand conventional vehicles collapses, which may lead people to `dump' their vehicles. While this scenario might minimise the growing pains of the Slow Lane, it would also mean that governments have to move rapidly to implement any required infrastructure changes to support this new approach to transportation.
Victoria in 2031: a High Speed base caseBefore we discuss the impacts of the High Speed scenario, it is useful to understand what the base case for Victoria looks like in 2031. Between 2015 and 2031, Victoria's population is
113
forecast to grow by 30% to a total of 7.7 million, with Melbourne forecast to grow slightly faster at 33% to six million. Jobs growth is forecast to be quicker than population growth over the same period, by 31% in Victoria and 34% in Melbourne.
Along with population growth, the demands on the transport network also increase. Public transport is projected to take a greater share of the load, accounting for 14% of all motorised trips in 2031 – up from 10% in 2015. In line with growth in public transport use, people are projected to be walking an extra 300 metres per day. This equates to about five minutes of extra walking every day. In 2031, many of the current transport infrastructure projects have not yet been completed, which means that the efficiency of the network is slightly lower than either present day (but with fewer vehicles) and in 2046. The vehicle fleet is projected to generate 24 million tonnes of CO2 equivalent in 2031 (compared to 27 million tonnes in 2046).
2031
DRIVERLESS ELECTRIC SHARED/ ON-DEMAND
Key findings
80% of trips by car, 20% by public transport 93% fewer cars, with average speed increased by 43% Benefits of automation realised sooner and for longer, including GSP growth and
health benefits Waste impacts more severe as they happen more quickly
Rapid transport revolutionAs with Fleet Street, the modelling found that Victoria's transport demands could be met by a much smaller fleet of automated on-demand vehicles in 2031. The 2031 base case vehicle fleet is projected to be 2.9 million vehicles, which could reduce to 210,000 in the High Speed scenario (a 93% reduction). As the number of vehicles falls, their utilisation rates increase. Although there is a smaller vehicle fleet in the High Speed scenario, the number of trips and distance travelled remains relatively unchanged. Since the vehicle fleet is entirely automated, the efficiency of the network is significantly increased and congestion almost entirely eliminated.
In line with the Fleet Street and Slow Lane scenarios, we assumed a price for automated vehicle trips of a $2.00 flagfall, a per-kilometre cost of $0.22 and a per-minute cost of $0.07. The high cost of on-demand vehicles and the lack of new transport infrastructure projects are likely to make public transport a much more cost effective option, particularly for longer journeys. The modelling for this scenario supports this. Public transport use is projected to increase across all modes and all regions in High Speed, but particularly in the middle ring suburbs.
114
Overall public transport is projected to account for 20% of all motorised transport trips in this scenario, compared to the 2031 base case of 14%.
The increase in public transport demand seen in the modelling could lead to some key routes or services facing severe capacity constraints, particularly at peak times. The speed of the transition will likely mean that public transport will need to adjust rapidly. Train and tram networks can't be easily expanded in the short term, so buses would be expected to become increasingly important. Figure 56 shows the forecast growth in public transport by mode in this scenario, further highlighting the potential importance of buses in future.
The impact of a subscription-style fare model like in Fleet Street would mitigate the pressure on public transport, with a 13% share of all trips.
All of the above factors contribute to a significant reduction in road congestion. Average speeds on the network increase from 34km/h in the base case to 53km/h. Depending on the commercial models of a scenario like High Speed, the rapid uptake of automated vehicles may therefore have significant implications for future road infrastructure investments, such as deferring the need for some additional road capacity.
Figure 56: Increase in public transport use between 2015 and 2031 (High Speed)
Source: Adapted from KPMG transport modelling (MABM)
Healthier, soonerThe environmental and population health benefits of this scenario are significant. In High Speed, these benefits are slightly lower than the other scenarios with zero emissions vehicles, as they apply to a smaller population base (2031 as opposed to 2046), but this doesn't lessen their significance. In fact, realising the population health benefits sooner means that Victorians would receive the benefits for longer. Overall, 3,099 DALYs are avoided in this scenario in 2031, delivering an economic benefit of $603 million. These
115
benefits are generated annually for every year the effects of vehicle exhaust emissions are removed, so earlier realisation of these in the High Speed scenario translates into more significant overall benefits as well.
Equally, Victoria is more likely to achieve its emissions reductions targets sooner. The projected 24 million tonnes of CO2 equivalent emitted from Victoria's vehicle fleet in 2031 would be entirely eliminated.
While this scenario would deliver some significant benefits through reduced congestion, improved access to services for many Victorians and lower vehicle emissions, there will likely be some challenges associated with the speed of the transition.
No littering, pleaseAs we discussed in the Fleet Street scenario, moving to a smaller vehicle fleet can be expected to deliver long-term benefits to Victoria's waste management system by reducing the amount of vehicle waste needing to be recycled and going to landfill. While this still holds true in the High Speed scenario, such a radical reduction in the vehicle fleet (93%) by 2031 means that a large number of vehicles will need to be disposed of in a very short time. A large-scale move to a shared fleet would mean that the value of second-hand cars collapses and many individuals would be left with vehicles of little or no value.
This means that Victoria's waste infrastructure would not only have to deal with a spike in vehicle disposal, but would also have to less time to do so, relative to the Fleet Street scenario. We expect this combination of factors to make investment in waste capacity both more urgent and more costly. However, because the spike in vehicles needing to be disposed of would only be temporary, there is limited incentive for the waste management sector to invest in extra capacity, which tends to be a long-term investment. This could lead to stockpiling, illegal dumping or other unwanted outcomes.
The government is already making changes to address future waste challenges and is taking steps to expand the local recycling sector through a recently announced Recycling Industry Strategic Plan. However, it is unlikely that a significant increase in vehicle disposals is within their sights.
The grid in transitionA rapid transition to automated on-demand and battery electric vehicles also has implications for Victoria's energy network. As discussed in the Fleet Street scenario, the impact of the vehicle fleet on maximum energy demand could potentially be mitigated by price signals to incentivise fleet operators to charge at off-peak times or times when renewable generation is highest. However, a faster uptake of these vehicles would give the energy market less time to adjust its supply mix and there would likely be more fossil fuel-based electricity production in 2031 than there would be in the longer-term scenarios (2046).
For example, Figure 57 shows that in 2031, the additional consumption requirements of the fleet could be met within existing generation capacity. This baseload capacity is more likely
116

to be fossil fuel based, even though additional renewable capacity may be required to meet maximum demand at peak times.
Although generation capacity may not be an issue in 2031, localised distribution networks might still come under pressure from increased vehicle charging. Given that expenditure plans and tariff schedules are set every five years, electricity distributors and Victorian regulators would most likely need to start planning for the High Speed scenario in 2024–25. If adequate plans aren't in place to support the transition to battery electric vehicles charging, the reliability of distribution networks could be affected.
Figure 57: Generation investment requirements – High Speed
Source: KPMG energy modelling
The High Speed economyThe employment and economic impacts of automation will also be felt sooner. A rapid transition to a fully automated vehicle fleet could, like Fleet Street, affect a number of jobs in the road transport sector. The on-demand fleet scenarios are estimated to have the largest overall employment impact of the scenarios, as they combine the impacts of automation, vehicle electrification and significant fleet consolidation. Employment forecasts developed by Deloitte Access Economics predict a one-off employment impact in these sectors of around 50,000 job losses in the High Speed scenario, as shown in Figure 58.
As with the other automated scenarios, the initial job losses are likely to be offset by employment growth in other parts of the transport sector and other industries due to productivity growth associated with automated vehicles. Deloitte Access Economics' modelling predicts that over 60,000 jobs will be added in 2031. Like in the Fleet Street scenario, automated vehicles are forecast to add around 2% to Victorian GSP, worth around $10 billion in 2031. These employment and productivity benefits would be felt on an annual basis, as Figure 59 shows, meaning the Victorian economy could be stronger for a longer period of time. The cumulative benefit of an earlier transition to a stronger economy and more jobs is projected to be worth approximately $30 billion in today's terms.
117
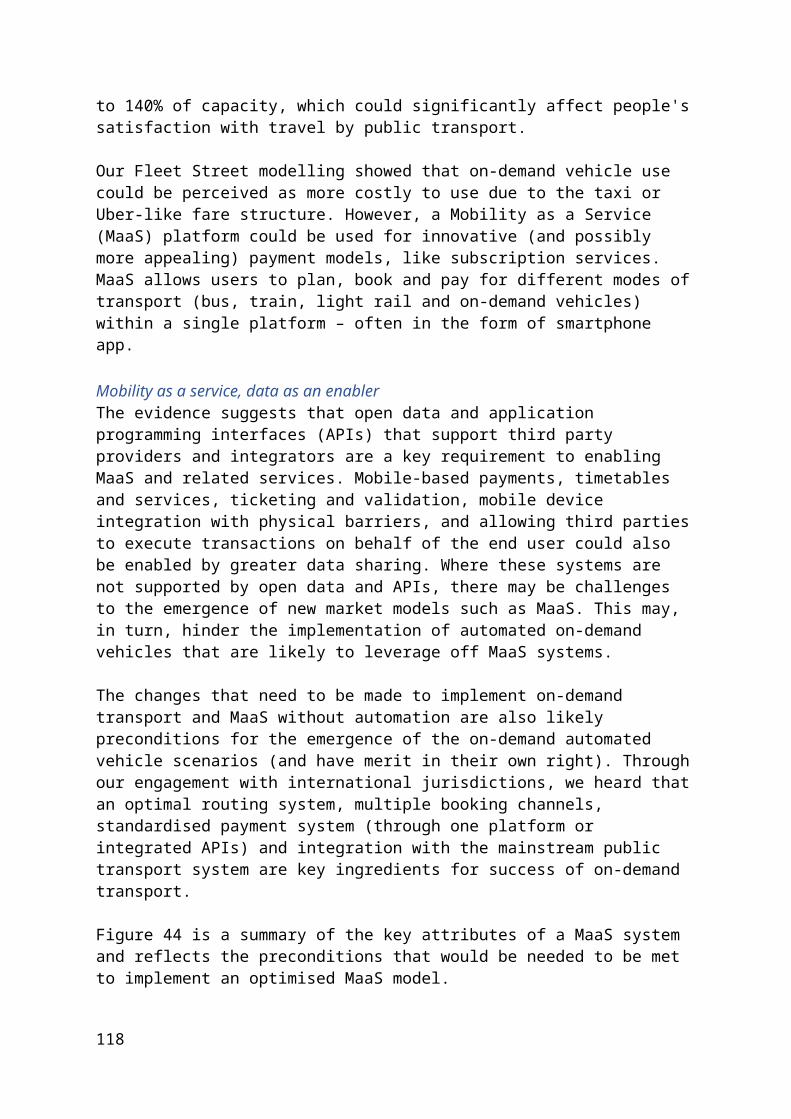
Figure 58: Change in employment in key industries – Victoria 2031
Source: Deloitte Access Economics
Figure 59: Deviation in GSP between High Speed and Fleet Street
Source: Deloitte Access Economics
Fast-tracked urban redesignLike in the Fleet Street scenario, taking around 2.2 million cars off the road would present an opportunity to fundamentally rethink the way we design neighbourhoods and streets. Arup's research suggests automated vehicles will be designed to operate within the existing infrastructure constraints, meaning wholesale upgrades of road infrastructure wouldn't necessarily be required. However, the opportunity to reshape our streets by reclaiming unused parking spaces and extra road space made available by the operating improvements of automated vehicles is significant.
118
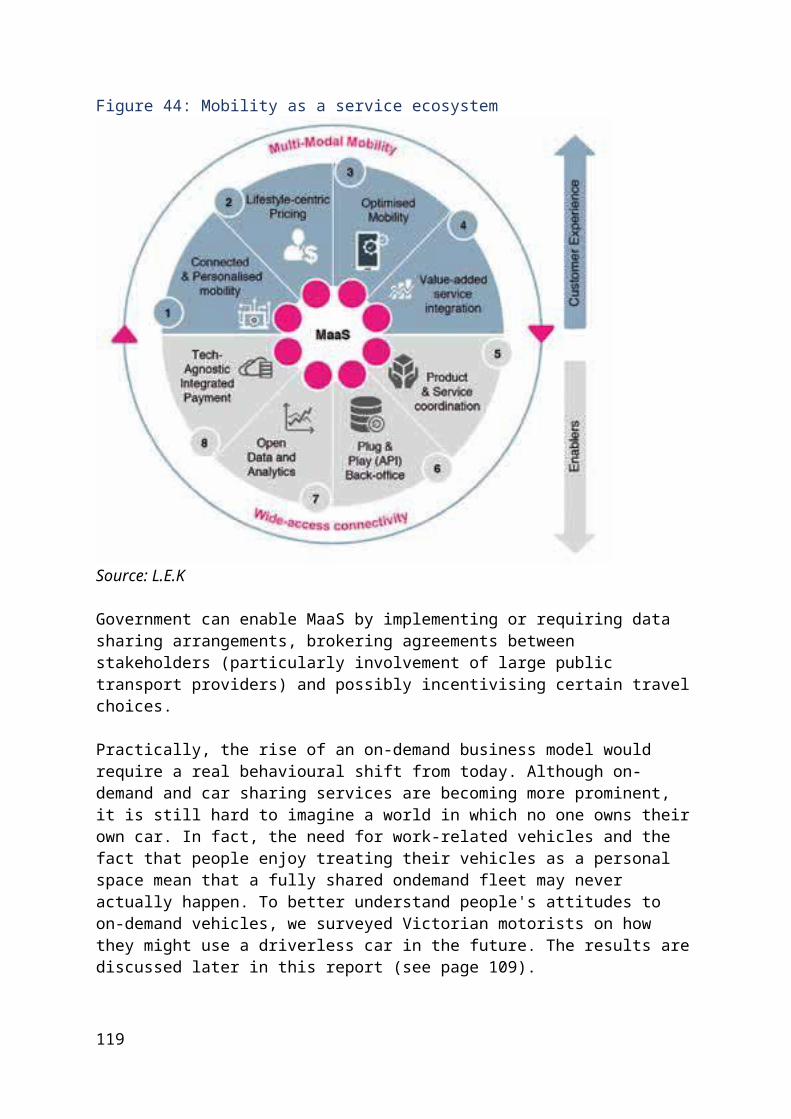
In Figure 60, Chapel Street, South Yarra has been redesigned as part of our urban design analysis. This image represents a vision for what could be achieved in a busy inner-urban street with a much smaller on-demand vehicle fleet. In this concept, all on-street parking has been removed and footpaths have been widened to provide extra space for pedestrians, recreational use and urban greening.
Some space that was previously used for parking is now a pick-up and drop-off zone for on-demand vehicles, but this is limited. Automated vehicles and trams communicate remotely with one another and can share the centre lane without incident.
Figure 60: Chapel Street – Fleet Street concept
Source: Urban Circus & Ethos Urban
Automatic for the peopleWe talk a lot about the potential of automated and zero emissions vehicles to be a catalyst for a fundamental reshaping of cities, neighbourhoods and streets, but, so far, we haven't discussed in detail what this means for other road users – pedestrians and cyclists. Any changes to street design should consider the amenity and safety impacts for all road users. Automated vehicles probably won't need line markings to help with lane positioning in the same way traditional vehicles do, but it's likely that pedestrians and cyclists will still need
119
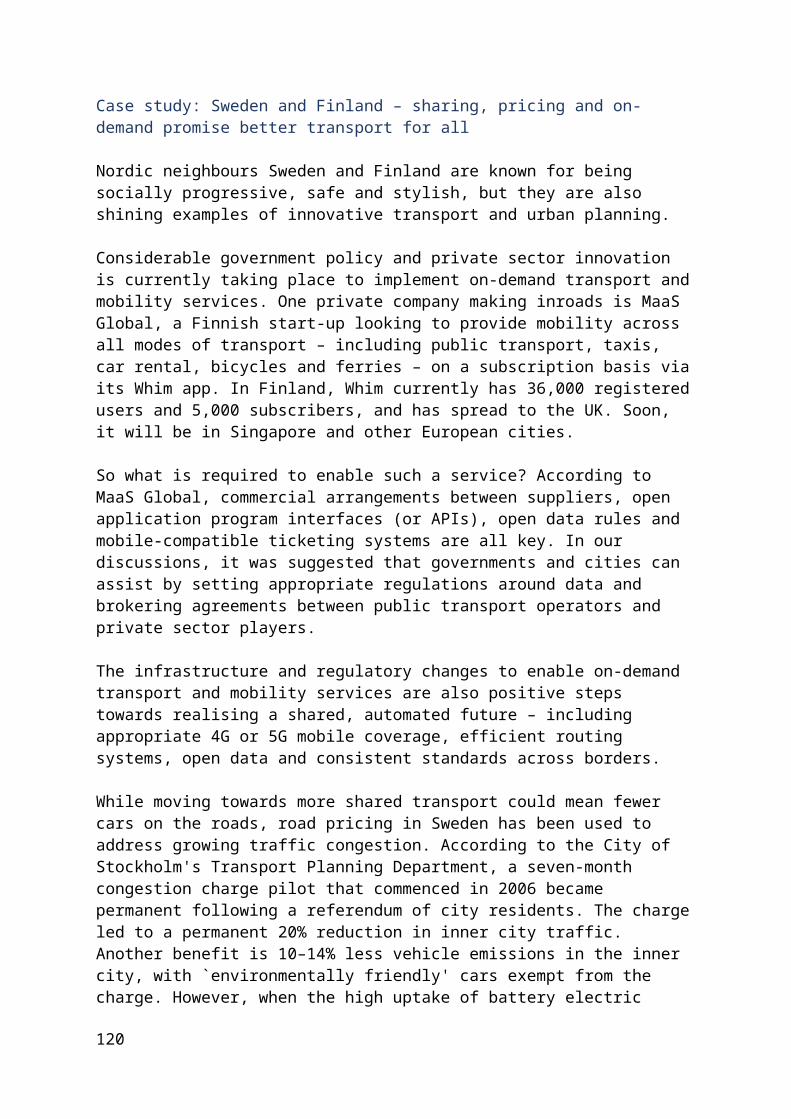
infrastructure in areas like road crossings. Pedestrians and cyclists, understandably, might feel uncomfortable crossing an intersection without some kind of signal telling them that it is safe to cross. In this instance, traffic signals could be retained as a redundancy system to provide pedestrians and cyclists comfort that they are able to cross, or reimagined in a way that is pedestrian-centric, as in Figure 61, which shows lighting embedded in street crossings.
WSP's technical report on ICT infrastructure notes that, ideally, cyclists and pedestrians would passively broadcast their location and planned route so automated vehicles could adjust their behaviour to provide maximum protection. To facilitate this, vehicle-to-person (V2P) and vehicle-to-cyclist (V2C) communications are both being explored in international trials. However, WSP also noted that any requirement for vulnerable road users to self-select the technology they use for protection is likely to be controversial, and Arup's technical report notes that automated vehicles need to detect cyclists (and pedestrians) whether or not they are connected, with any system that could be worn or installed to be used only as a back-up. The Blueprint for Autonomous Urbanism developed by the US National Association of City Transportation Officials states simply that "people walking or biking should not have to carry sensors or signals to stay safe".44
What active transport infrastructure might be required to allow active transport and automated vehicles to interact safely?We know that people have safety concerns about automated vehicles and this may deter people from walking, cycling or engaging in other forms of active transport where interaction with automated vehicles may occur. Introducing some infrastructure to ensure people feel safe, especially during the transition period to an automated vehicle future, could help encourage active transport.
Effective measures for the promotion of active transport may include lower motor vehicle speeds, lower motor vehicle traffic volumes, protected infrastructure such as footpaths and protected bike lanes, provision of direct routes with minimal delay, and crossing infrastructure such as protected medians and signalised crossings.
In the future, even if automated vehicles are proven to interact safely with pedestrians, cyclists and motorcyclists and avoid collisions, people in 2046 will still make mistakes. In many high risk locations like routes to schools, infrastructure requirements for active transport will remain important.
44 National Association of City Transportation Officials (2017), Blueprint for Autonomous Urbanism. Available at: https://nacto.org/publication/bau/blueprint-for-autonomous-urbanism. Accessed 22 June 2018.
120
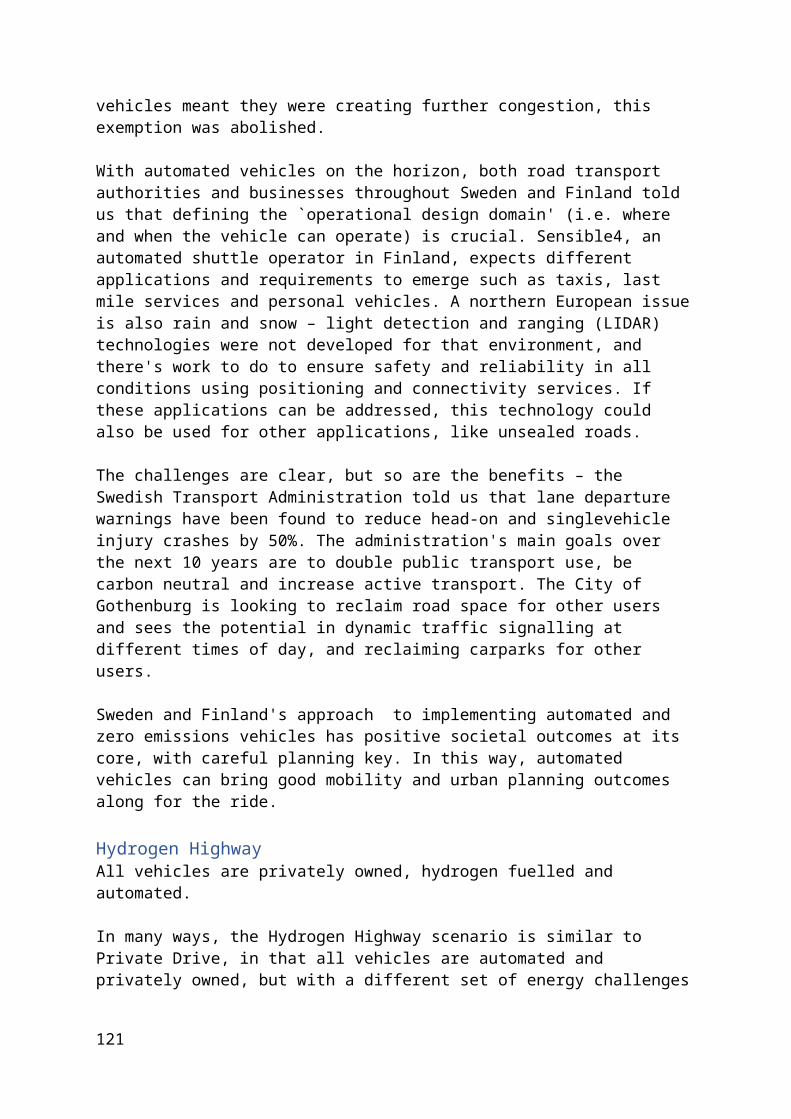
Figure 61: Potential pedestrian crossing at Ringwood Station in a fully automated future
Source: Urban Circus & Ethos Urban
Lessons from a rapid transitionHigh Speed is a scenario in which all of the benefits of Fleet Street – reduced emissions, improved productivity, improved safety and lower congestion – are realised sooner and for longer.
The rapid uptake of automated on-demand vehicles would likely improve the performance of the road network to such an extent that the government could defer or altogether avoid some infrastructure investments. Equally, the health-related savings and environmental benefits would accumulate year on year.
However, it is important for governments to be prepared for the emergence of these technologies to ensure their benefits are fully realised. The High Speed scenario could also present a case study of what might happen if a transformative technology evolved very quickly. Monitoring technological trends will be particularly important in this scenario to ensure that policy, regulation and supporting ICT infrastructure is in place and doesn't hinder automated vehicle uptake.
121
Like many disruptive technologies of the past, this scenario is more likely to be market led than state led. There is a risk of government being forced to respond to these technologies, rather than being prepared for them. The rapid emergence of new mobility models such as Uber and oBike are examples of market-led developments that had significant and, at times, undesirable consequences. Uber provided a service for which there was considerable consumer demand and, in doing so, caused significant disruption to an existing industry already regulated by government. This had financial consequences for the taxi industry, which protested Uber's arrival and unsuccessfully sought to protect their industry from disruption. Uber's emergence led to a significant change to the regulatory framework and government compensation for affected stakeholders. Dockless bike share service oBike also generated disruption when it arrived in Melbourne in 2017. The unintended consequences of oBike were felt very quickly, with dumped bikes becoming a common sight around Melbourne. Local governments responded with attempts to regulate the scheme. Within 12 months of its emergence, oBike announced its withdrawal from Victoria.
Similarly, Victoria's waste management system and energy market may be caught off guard by the speed of the transition, leading to negative outcomes ranging from illegal disposal of vehicle waste to increased greenhouse gas emissions from the electricity generation sector.
Case study: Dubai's high speed approach to automated vehicle roll out
Dubai, the most populous city in the United Arab Emirates, knows how to get things done quickly and at scale. The business and transport hub has grown rapidly over the past half century to become a metropolis in the desert, and its plans for the future of automated transport are just as ambitious.
Dubai's Sheikh Mohammed bin Rashid Al Maktoum has often stated that "Dubai will never settle for anything less than first place". This sentiment is reflected in the city's target of 25% of all transport to be automated by 2030, and its aim to have the world's first automated bus rapid transit system. The bus system is touted as being capable of reaching metro-style capacity, taking 30,000 to 40,000 passengers per hour in each direction, at a much lower cost than the train system.
Dubai isn't only aiming high on automation. The Dubai Roads and Transport Authority (RTA) told us its Green Mobility Initiative is promoting the use of sustainable transport and battery electric vehicles, rolling out charging stations and setting battery electric vehicle targets for new car sales and government fleets. The RTA is leading the development of a battery electric vehicle inspection regime, linked to vehicle registrations to ensure proper service and maintenance. Dubai also aims to have the lowest carbon footprint in the world by 2050 and to cut carbon emissions by 16% in 2021, demonstrating its shift away from oil and resources.
Dubai will host the next World Expo in 2020, where it will showcase its commitment to sustainable materials and design to thousands of visitors.
The Sustainable City in Dubai is one example of how the city is turning ambition into reality. When we visited the 500 residential villa development, we saw a car-less, rooftop solar-
122
powered township, with an automated shuttle bus to get around and a `green spine' with biodomes for growing food. Battery electric vehicle charge points are offered for free in the city's carparks, and they've set a target of 20% battery electric vehicles by 2020. Sustainable building features like structural insulation, efficient air conditioning and reflective paint keep energy costs low, which is critical in a city where average temperatures over summer are over 40 degrees Celsius.
Importantly, Dubai hasn't lost sight of bringing its residents along for the ride as its moves towards an automated transport future. When the Dubai metro train system first went driverless, a `driver' or attendant was still present for the first six months to help people feel safe and adjust to the change. A similar approach is being considered for automated bus trials. In the Sustainable City, when residents raised questions about the safety of the automated shuttle bus, community engagement formed a key pillar of ensuring its success today.
With Dubai's track record for high speed infrastructure roll out, it is also investigating Hyperloop technologies. Hyperloop is a developing transport system where passengers are transported at speeds of up to 1,200 kilometres per hour in floating pods within low-pressure tubes. The UAE is testing and seriously investigating its potential, including a possible 15-minute connection from Dubai to Abu Dhabi.
Whatever the future brings, with Dubai's mindset of never settling for less than first place, it will be a key city to watch for high speed transport technology roll out.
Consistent themes across all scenariosThere are some consistent themes that have emerged through gathering the evidence for this report, where the modelling suggests changes to occur regardless of the scenario being examined.
Land useAll of our scenarios show that automated and zero emissions vehicles would change where people choose to live and work. The extent of these changes varies according to the ownership model (private or shared), how travellers value their time, and rate of take-up of new types of vehicle technology. However, what all scenarios have in common is that they show automated and zero emissions vehicles, and the business models that might emerge alongside them are likely to lead to a more dispersed population.
Broadly, the scenarios show more reliance on major roads and freeways and on public transport infrastructure, particularly that which connects outer and middle ring suburbs. The modelling shows that some areas consistently see additional growth in population and jobs compared to the base case. The greenfield area of Casey-North appears in the top five areas in all land use scenarios for both dwellings and employment changes. Similarly, Whittlesea-Wallan is a greenfield area that appears in the top five in three scenarios.
The change in land use patterns projected in these scenarios is an order of magnitude larger than what is typically seen by major transport projects, which tend to be more localised in their impact. The emergence of automated and zero emissions vehicles will affect the whole
123
of Victoria in a more profound way than any one major project affecting a particular part of the network.
However, across all of the scenarios, the change is relatively small compared to the overall growth in population and employment in the base case. For example, areas which are projected to experience the highest growth compared to the base case are generally forecast to see population boosted by around 3–8% in 2046 on a much higher base, with an overall doubling of the population between 2016 and 2046. Similarly, employment is more dispersed under all scenarios. The modelling shows between 2–8% fewer jobs in the inner and inner south east regions in 2046 depending on scenario, but this is in the face of overall jobs growth in these areas of 75% in the intervening period.
The scale of land use change seen as a result of the scenarios could also be reduced if measures were taken to address congestion and public transport crowding in inner Melbourne. The modelling of the scenarios has not sought to adjust the transport network in any way to match the demand changes posed by the scenarios. The resulting impacts on inner Melbourne congestion and public transport crowding are likely a key `push factor' which, combined with the `pull factor' of the improved accessibility offered in the middle and outer suburbs and some areas of regional Victoria, triggers a change in land use. With a different transport network service offering or other policies to manage demand, a different pattern of land use could result.
Planning for automated and zero emissions vehiclesOur modelling shows that automated vehicles make living further away from the central city more attractive. With a more dispersed Melbourne, planning rules in different areas are likely to come under pressure.
The current metropolitan strategy, Plan Melbourne 2017–2050, aims to maintain a permanent urban growth boundary to reduce fringe development, encourage more consolidated residential development in established areas and protect agricultural land and biodiversity. Plan Melbourne also identifies peri-urban towns under development pressure and proposes introducing urban growth boundaries to protect surrounding agricultural and environmental land. Several regional Victorian centres have introduced growth policies, but Macedon Ranges is the only area that has legislative requirements for boundary modifications.
InfrastructureAutomated vehicles represent both an opportunity and a challenge for the future of Victoria's transport network. On the one hand, automated vehicles have the potential to increase the effective capacity of our roads, presenting an opportunity to defer or avoid future capital investment in road infrastructure.
Regardless of the scenario, autonomous vehicles are predicted to increase the effective capacity of Victoria's roads. Even some automated vehicles mixed in with non-automated vehicles will reduce congestion. The modelling shows us that in the Slow Lane scenario, in which over half of the vehicle fleet are non-automated, average speeds are much higher than in the base case (39%), and average delays are much lower (75%). In the fully
124
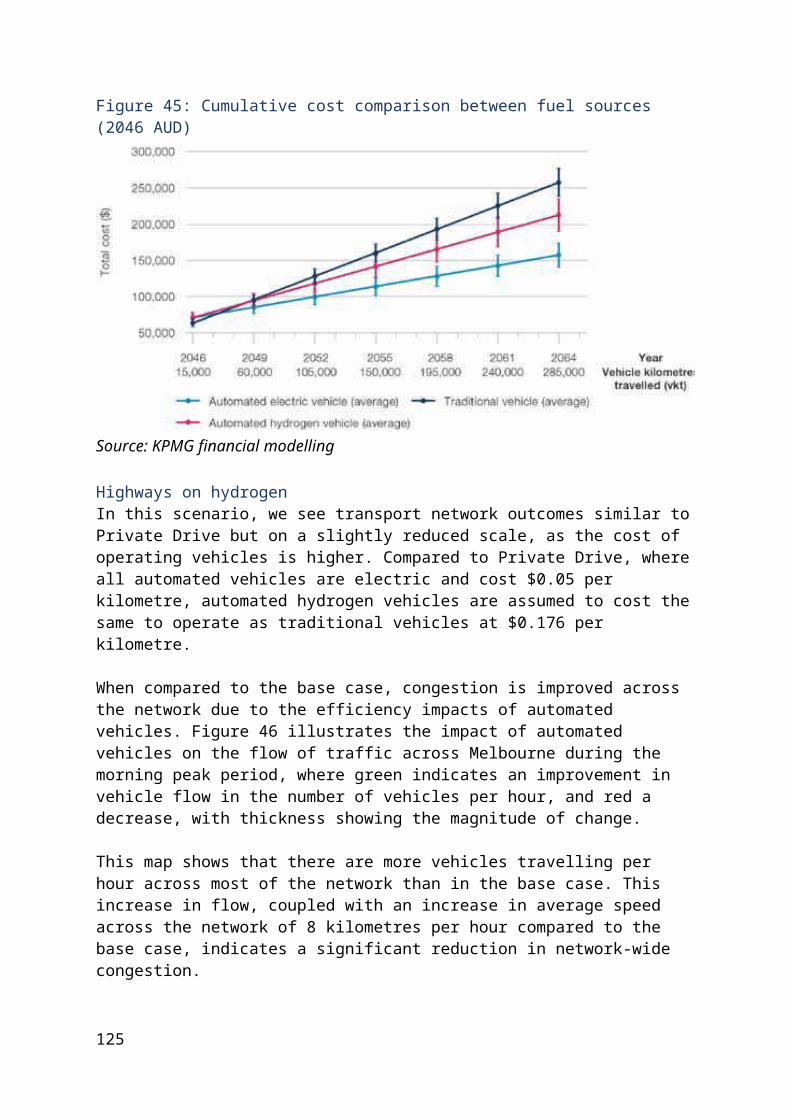
automated on-demand scenario of Fleet Street, average speeds are 17 kilometres per hour higher, a 54% increase, while average delays are reduced by 32 seconds per kilometre (a 90% reduction).
On the other hand, Victoria's public transport network is likely to face increasing demand pressures.
All scenarios have much higher levels of public transport use across all modes than today. Even the scenario with the lowest usage (Private Drive) has more than double today's public transport patronage, and the scenario with the highest usage (Fleet Street) has over four times today's patronage. Figure 62 shows the projected increase in public transport use in all 2046 scenarios.
In addition, the High Speed scenario, which assumes automated vehicles are ubiquitous in 2031, is predicted to have two and a half times the public transport demand of today, but 15 years sooner. Regardless of scenario, public transport is likely to remain a vital part of Victoria's transport mix in future.
Figure 62: Public transport patronage – all scenarios
Source: KPMG Transport modelling (MABM)
Should we wait for automated and zero emissions technologies to be perfect?This report focuses on the technological challenges and infrastructure requirements for automated and zero emissions vehicles, and not on human behaviour change or acceptance. This is because our scenarios are deliberately future focused, and assume that the challenges of user acceptance have already been overcome. Infrastructure and land use planning is long term by nature, given the time required to plan and carry out most major projects.
However, the tragic death of a woman in the US state of Arizona by an Uber autonomous test vehicle in March 2018 has brought to the fore questions about user acceptance. A recent survey by the American Automobile Association45 found a 10% increase in respondents who said they would be `too afraid' to ride in a driverless car, which reversed
45 Smith, A., (2018), Distrust in self-driving cars on the rise after crashes, CNN, 23 May.
125
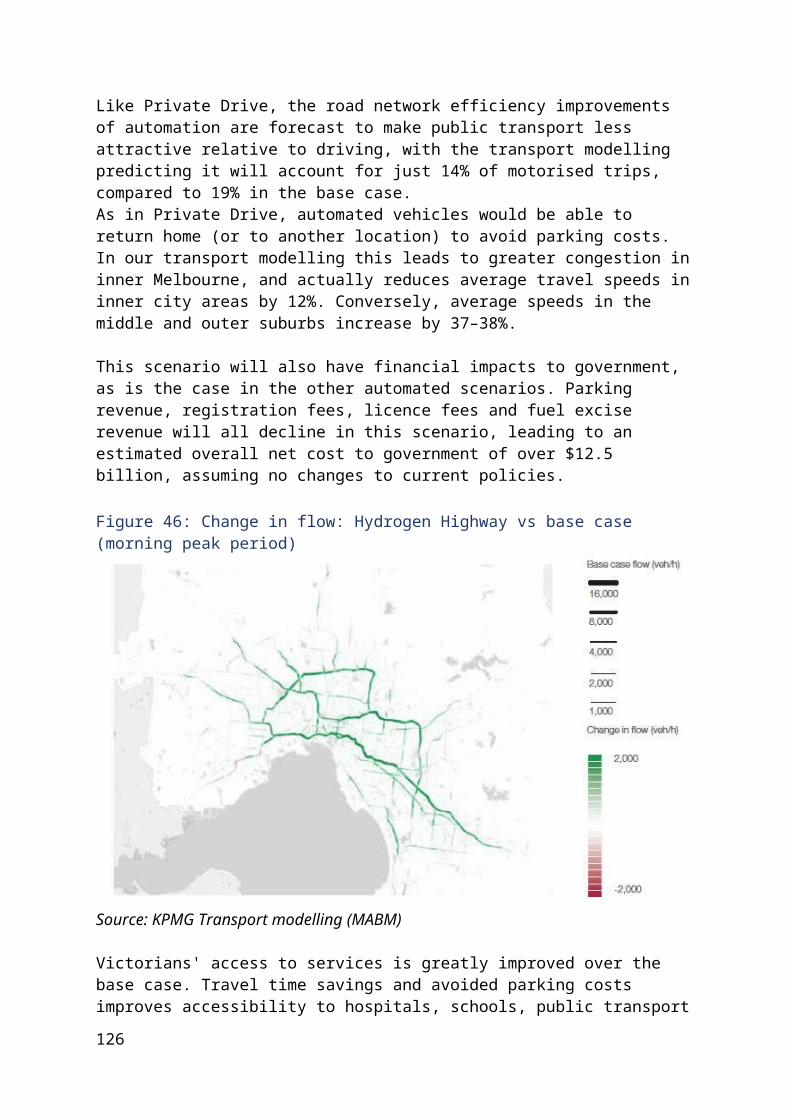
the previous trend where acceptance of driverless cars had increased. The Uber crash could have been a factor in this heightened distrust of automated vehicle technology.
Yet, the potential safety benefits of automated vehicles are compelling, if they can be realised. Even if the proposed 94% reduction in accidents doesn't eventuate, a 50% reduction would return staggering benefits to society. Arup highlighted in its report:
"It is expected that in the 30-year period since 1989, over 50,000 Australians will have been killed on the road network...When considering the number of people killed in the last 30 years is similar to the population of Shepparton, there is a huge incentive to eliminate the errors leading to these events."
Aurecon also estimated in its analysis that the reduced crash fatality benefit for our scenarios is estimated at nearly $1 billion in 2046, based on the 276 deaths and thousands of serious vehicle accidents that occurred on Victoria's roads in 2016.
The RAND corporation, an American think-tank, has assessed the impact of waiting for automated vehicles to be perfected as compared to introducing the technology earlier and acknowledging that these vehicles may contribute to some road injuries. It found that a delay of 20 years in approving automated technology could equate to hundreds of thousands more lives lost due to accidents than a more permissive policy.46
It should also be noted that many of these safety benefits could be achieved sooner than when we have a fully automated fleet. Level 2 automation could bring a significant proportion of the benefits of driverless vehicles with a combination of advanced driver assistance systems. In the wake of the Uber crash in March 2018, many people noted that automated emergency braking alone could have prevented the crash (it was disabled at the time of the accident).
Therefore, while we have not focused on the immediate implications of human behaviour or acceptance on the uptake of these vehicles, we believe that this should be a focus for other organisations working on these challenges, such as the National Transport Commission and AustRoads.
Physical and digital road infrastructure will need to adapt to a future with automated and zero emissions vehicles, though the specific changes to be made are still uncertain at this stage of development of the technology. We do know that there is little evidence at the moment to suggest that physical road assets need to be changed to accommodate automated vehicles (such as road strengths, road design approach, bridge strengths or barrier design), other than keeping current roads in good condition, standardising approaches to roadworks and ensuring lines and signs are able to be read by automated vehicles.
We know that the existing and planned ICT infrastructure is largely sufficient to support the introduction of automated vehicles in Victoria, though there are a lot of benefits to be gained through further investment in connecting vehicles to the world around them. We
46 RAND Corporation (2017), Why Waiting for Perfect Autonomous Vehicles May Cost Lives.
126
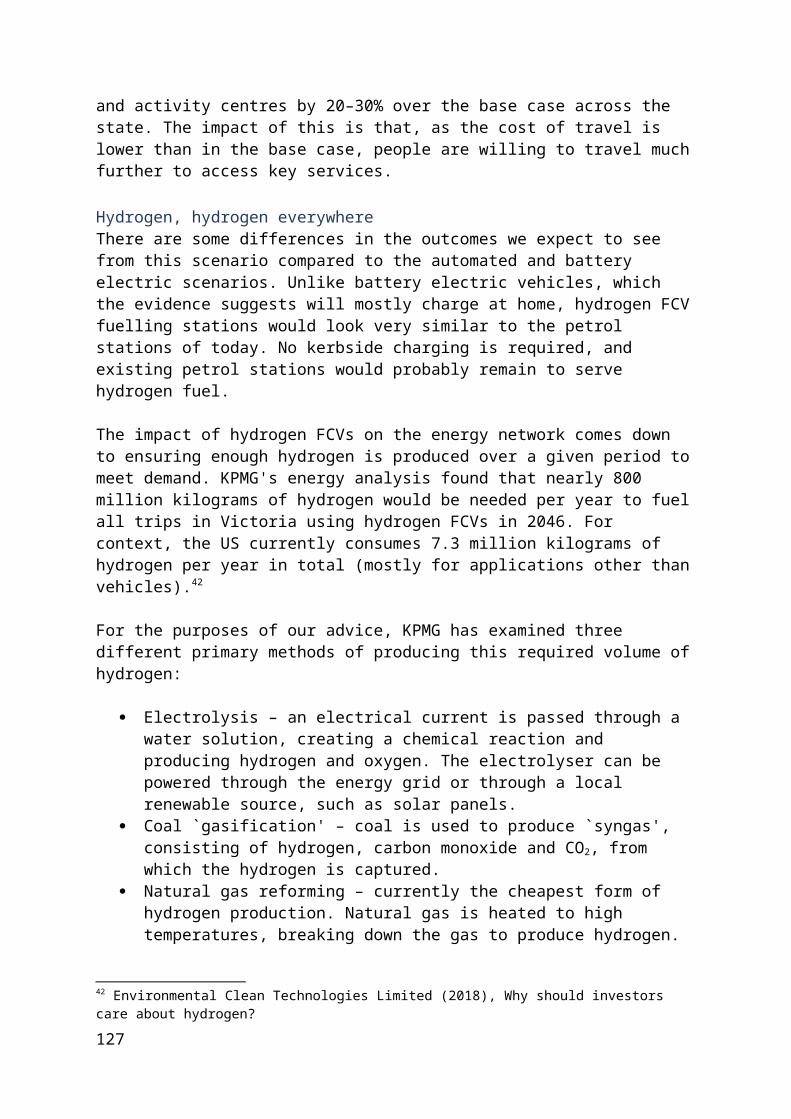
also know that there is an inverse relationship between investment in digital infrastructure and investment in physical infrastructure in the future to support automated vehicles, with digital infrastructure likely to reduce the need for physical infrastructure in some applications.
To a certain extent, the impacts of automated and zero emissions vehicles on energy infrastructure in Victoria vary by scenario. The amount of generation capacity required to meet the energy demand of zero emissions vehicles depends on the number of vehicles in the fleet and how much they're used. Total consumption of electricity is projected to be between 23% and 56% higher in all battery electric vehicle scenarios.
Electricity demand, and therefore cost, is highest where vehicles are privately owned and there is no mechanism to influence charging behaviour, such as an incentive to charge at off-peak times. Taking steps to influence charging behaviours, for example through price incentives or controlled charging, could mitigate the amount of additional investment required and provide cost savings to Victorian consumers.
Hydrogen Highway presents a different range of considerations. This scenario could potentially fundamentally change energy markets in Australia, and would require an entirely new supply chain including new production and distribution infrastructure.
What is consistent is the forecast impact on distribution networks. In all scenarios other than Hydrogen Highway, there is a likely need to upgrade a substantial number of the current 228 zone substations, compared to the base case. It is also important to note that, while not included in the scope of KPMG's analysis, the potential impact of battery electric vehicles on local networks is likely to vary significantly at local `street level'. If not adequately planned for by distributors, this could have implications for the future uptake of zero emissions vehicles.
Economic, social and environmental impactsAll scenarios are forecast to deliver enduring economic, social and environmental impacts. Automation brings productivity and efficiency benefits that are projected to lead to more jobs and a stronger economy. Despite the likelihood that automated vehicles will cause some initial job losses in key transport sectors, such as freight and passenger transport, our evidence suggests that the enduring benefit of automated vehicles will be a stronger economy and an overall increase in employment. Victoria's economy is forecast to perform 2% better in 2046 in the fully automated vehicle scenarios than in the base case. The value of this benefit is projected to be worth $14.9 billion in 2046, and will increase over time in line with economic growth. What's more, these benefits will be felt every year, while any initial job losses would likely be one-off.
It's not just the Victorian economy that could benefit from automated and zero emissions vehicles. Many Victorians could also benefit from better access to services and reduced vehicle emissions. Consumers are also projected to benefit from lower costs for automated and zero emissions vehicles, with the average Victorian who travels 15,000 kilometres saving 13–30% if they owned their own vehicle, with an additional 40% benefit for those who use shared fleet services instead of owning their own car.
127
Overall, the introduction of automated and zero emissions vehicles has the potential to improve all Victorians' access to schools, jobs, health care services and public transport services, assuming a subscription-based fare model is in place for the on-demand scenarios. This is mostly due to either lower out-of-pocket costs associated with battery electric vehicles, or lower time costs associated with vehicle automation, or a combination of these factors.
Automated vehicles have the potential to deliver significant accessibility benefits to individuals currently unable to operate a vehicle, such as Victorians with a mobility impairment or the elderly. If 50% of the people in these cohorts at risk of social exclusion benefit from the emergence of automated vehicles, the potential value of automated vehicles to this group of people alone could be $6–7 million.
Automated and zero emissions vehicles are also projected to substantially reduce adverse health outcomes from exposure to pollutants harmful to human health. The estimated net reduction for all scenarios relative to the base case scenario ranges from 1,343 DALYs to 3,737 DALYs, valued at between $270 and $735 million. Like the economic and accessibility benefits outlined above, these benefits could be realised annually and would only increase over time as Victoria's population grows.
Similarly, the potential reduction in greenhouse gas exhaust emissions, estimated to be up to 27 million tonnes CO2 equivalent, would make a large contribution towards meeting Victoria's overall greenhouse gas emissions targets.
While the future of automated and zero emissions vehicles is still uncertain, one thing is clear: there are many compelling reasons to introduce them to Victoria, and we need to be sure we have the infrastructure and land use planning in place to support them.
GETTING INVOLVEDThis report summarises the evidence we've gathered on automated and zero emissions vehicles, and the infrastructure required to enable their operation on Victorian roads.
All the technical reports underpinning this evidence base can be found at: yoursay.infrastructurevictoria.com. au/vehicles-advice
We now want to receive responses from stakeholders to specific questions, listed below. Stakeholders are also welcome to respond to aspects of our evidence base that are not covered by the questions below. We will run a series of information sessions in Melbourne and online to present key findings from each of our research streams and allow people to ask questions.
1. Are our key assumptions correct? If not, why?2. Is our analysis of the findings correct? If not, why?
128
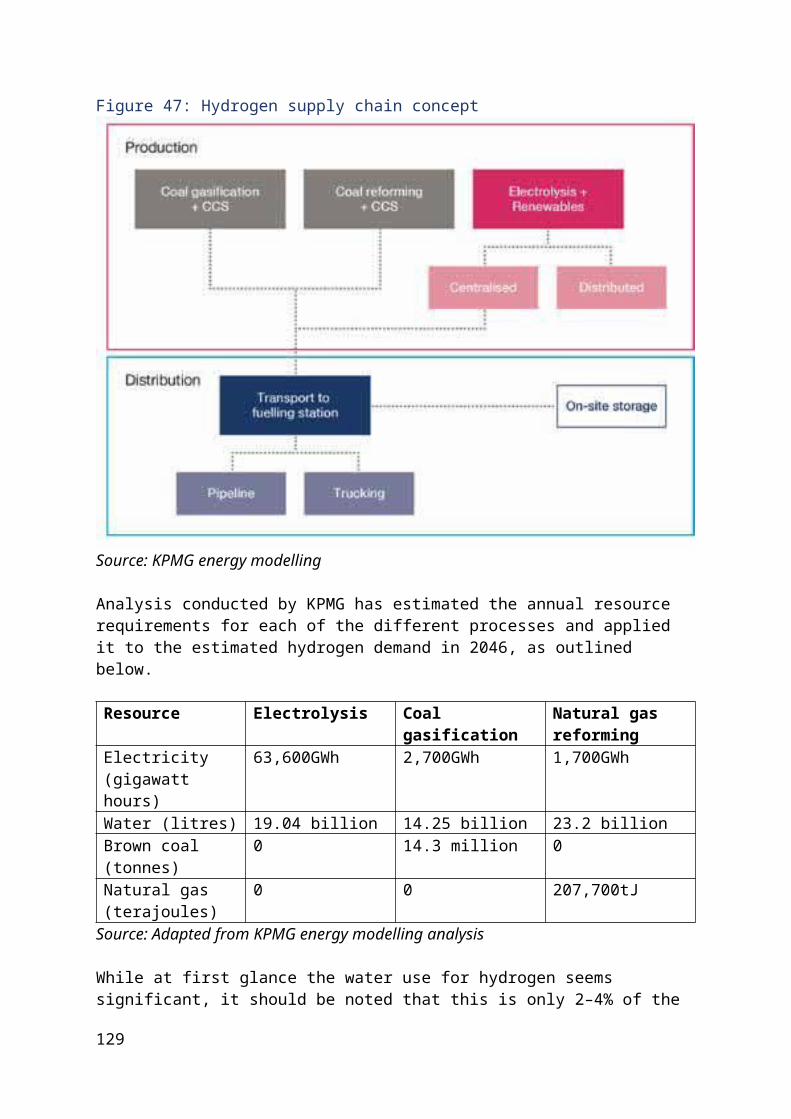
3. What further research into automated and/or zero emissions vehicles might be required beyond what we have already completed or identified?
4. What are the local or international trends government should be monitoring to help inform future decisions on automated and zero emissions vehicles?
5. What key decisions need to be made about the infrastructure required for automated and zero emissions vehicles?
We will accept submissions in response to these questions via our consultation website until 5.00pm on 31 August 2018. Late submissions will not be accepted due to timelines for completing our final advice. To send us a submission, please visit: yoursay.infrastructurevictoria.com. au/vehicles-advice.
NEXT STEPS
Developing our adviceWe intend to use the insights gained from this process to inform our final advice to the Special Minister of State, which we will deliver in October 2018. The advice will address pathways of potential sequencing, timing and scoping of infrastructure delivery and identify key decisions and trigger points. Our findings and recommendations will in turn influence the next update of Victoria's 30-year infrastructure strategy in 2019.
129
APPENDIX A: SUMMARY OF IMPACTS BY SCENARIO
Technical advice topicTransport modelling Land use modelling Energy Environment and
population healthFinancial analysis Socioeconomic impacts
ScenarioCompared to 2015
2046 base case
37% more car trips 3 times more trips on
PT 81% of trips by car,
19% by PT Average journey time
is 20 minutes
2.5m more jobs and 3.4m more people
Most growth in Melbourne suburbs
Regional growth mainly in towns
800MW of additional dispatchable generation required
NPV of $588m investment needed
Current DALYs due to emissions of 5425
96% of these in metro area and most for people with high or medium SES
Current trends of vehicle registration, licensing and accidents continue
70% of population has sufficient access to services
2.2m jobs forecast to be in transport, trade and travel-related business
Compared to 2046 base case
Electric Avenue
Virtually no change from base case
Assumed similar to base case
51% increase in GWh ~6200MW extra
required for non-incentivised use
$6.4–8.8b additional investment needed
3632 DALYs avoided $706m annual
economic benefit
Net impact of -$8.1b per year
Fuel excise impact of -$6.5b
Increase in TAC revenue of $70m
10% improvement in access to services
No change in GSP
Private Drive
8% more car trips Slower CBD traffic 24% fewer PT trips Average journey takes
16 minutes
11-15% shift in household locations
13-17% shift in job locations
Lower marginal utility of travel time doesn't result in greater movement
56% increase in GWh~6700MW extra
required for non-incentivised use $6.9
9.7b additional investment needed
3250 DALYs avoided $632m annual
economic benefit
Net impact of -$12.7b per year
Fuel excise impact of -$6.5b
Decrease in TAC revenue of -$5.6b
32% improvement in access to services
$14.9 billion (2%) increase in GSP
Fleet Street
28% of trips by PT 91-93% fewer cars
needed 54% higher average
12-14% shift in household locations
14-15% shift in job locations
50% increase in GWh $5.2b additional
investment needed
3781 DALYs avoided $735m annual
economic benefit
Net impact of $12.8b per year
Fuel excise impact of -$6.5b
7% improvement in access to services
$14.9 billion (2%) increase in GSP
130
road speed Average journey takes
18 minutes
Lower marginal utility of travel time doesn't result in greater movement
Decrease in TAC revenue of -$5.6b
Hydrogen Highway
22% increase in road speeds
8% more car trips Average journey
takes 16 minutes
Assumed similar to Private Drive
147% increase in GWh (for hydrogen from electrolysis)
$8-14.5b additional investment needed
3430 DALYs avoided $667m annual
economic benefit
Net impact of -$12.6b per year
Fuel excise impact of -$6.5b
Decrease in TAC revenue of -$5.6b
27% improvement in access to services
$14.9 billion (2%) increase in GSP
Slow Lane
39% increase in average road speed
43% fewer cars needed 22% trips by PT Average journey takes
16 minutes
11% shift in household locations
12% shift in job locations
23% increase in GWh $2.2b additional
investment needed
1388 DALYs avoided$270m annual
economic benefit
Net impact of -$5.1b per year
Fuel excise impact of -$2.3b
Decrease in vehicle registration of -$2b
8% improvement in access to services
Likely <2% GSP growth
Compared to 2031 base case
High Speed
20% of trips by PT 38% more walking trips 93% fewer cars needed 4% fewer trips overall
Assumed similar to Fleet Street
37% increase in GWh $2.1b additional
investment needed
3099 DALYs avoided $603m annual
economic benefit
Net impact of $8.1b per year
Fuel excise impact of -$4b
Decrease in TAC revenue of -$3.4b
7% improvement in access to services
$10 billion (2%) increase in GSP
131
APPENDIX A (continued)Transport engineering
The design of existing road infrastructure is largely expected to be sufficient as automated vehicles are currently being designed to operate on most roads without the need for modifications. Instead, in-vehicle systems are used to `read' our current infrastructure, including lines, signs and traffic lights with a variety of sensors, including cameras, radar and LIDAR. The vehicle then determines the correct behaviour around these objects using an on-board computer to bring together and interpret the various inputs.
However, in the short to medium term, as the technology is still in development, clear and consistent infrastructure (e.g. lines and signs) and approaches to road operations (e.g. maintenance) are useful for enabling operations of automated vehicles on our roads.
While heavy vehicle platooning is seen as a significant benefit of automation, its logic is premised on achieving two benefits: a reduction in labour costs and a reduction in fuel costs. In an automated and zero emissions vehicle future with no drivers and low fuel costs, the benefits of platooning could be largely eliminated. This calls into question whether automated heavy vehicle platooning will occur, unless we see the development of automated vehicles without zero emissions technology, or vice versa.
ICT infrastructure At a minimum level, existing ICT infrastructure is largely expected to be sufficient,
where minimum is defined as the least amount of ICT infrastructure required to ensure safe automated vehicle operation on critical Victorian roads while minimising over-investment or technical obsolescence risks.
There are opportunities for vehicle-to-infrastructure (V2I) technology to improve network performance of automated vehicles, at an estimated cost of $40m for the minimum scenario and $204m for the optimum scenario ($2018), though these would need further scoping and trials before they were implemented.
Connections to mobile networks are not a base requirement for most automated vehicles to operate. However, the breadth of mobile network coverage may limit their reliability and cooperation in some areas of Victoria, especially outside of urban areas. The cost for upgrading these facilities to a minimum level of coverage is estimated at $76-109m ($2018), while optimal coverage of all sealed roads in Victoria is estimated at $1.1-1.7b ($2018).
While not necessary to enable the introduction of automated vehicles on Victorian roads, central operations/traffic management systems could require radical change in order to optimise the deployment and movement of automated vehicles by introducing machine learning or even artificial intelligence into traffic management.
International markets
132
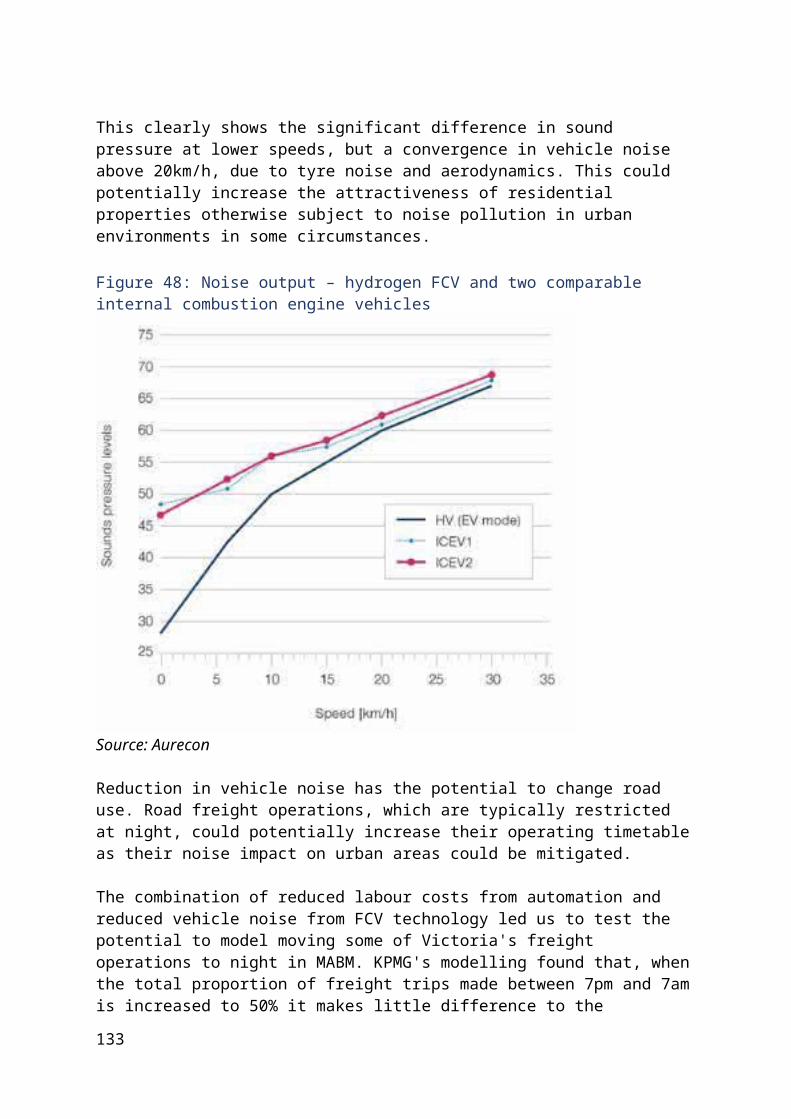
Battery electric vehicles are currently below 2-3% penetration in almost all markets, with the exception of Norway. Zero emissions electricity production has been identified as the greatest opportunity for investment.
Water electrolysis (using zero emissions energy sources) is currently the only mature technology to deliver zero emissions hydrogen for vehicles. If Victoria wishes to enable hydrogen fuel cell vehicles, facilitating zero emissions hydrogen production is identified as the best opportunity available.
There are no clear international examples of what infrastructure investment is required to support automated vehicles. Targeted investments in infrastructure may serve to attract automated vehicle manufacturers to release vehicles in the Victorian market. Standardisation of variable infrastructure within and across jurisdictions is seen as a key enabler in the longer term.
`Mobility as a service' participation, on-demand public transport and ridesharing are developing rapidly, though it is as yet unclear what the best model is to adopting these new mobility market models. Victoria will need to monitor these developments carefully to determine the best way to act, and to move quickly when it is identified.
Urban design
Major opportunities highlighted include reduced parking, which results in increased footpath space, opportunities for development, urban greening due to reduced emissions, and shared lanes for automated vehicles and public transport due to increased communication potential.
In a Fleet Street future, further opportunities highlighted include flexibility in lane sizes and directions, reduction in visual infrastructure through connected infrastructure technology, and more flexible shared street space due to the increased safety of automated vehicles, and reduced health implications of zero emissions vehicles.
FIGURESFigure 1: Change in road network 2015 – 2046: 20Figure 2: Public transport use: 2015 – 2046: 22Figure 3: Victorian energy profile (base case 2046): 23 Figure 4: Victorian emissions profile (base case 2046): 24Figure 5: Battery electric vehicle international take-up: 27 Figure 6: Cost comparison for e-buses and diesel buses, with different annual distance travelled: 28 Figure 7: Battery electric and plug-in hybrid vehicles as a proportion of the Australian vehicle fleet: 29 Figure 8: Non-incentivised Electric Avenue load profile: 34Figure 9: Incentivised Electric Avenue load profile: 34 Figure 10: Vehicle charging indicative power draw: 36 Figure 11: Tesla Battery: 37 Figure 12: Nissan Leaf battery: 37
133
Figure 13: Components of the energy supply chain: 40 Figure 14: Projected capacity and maximum demand of zone substations – Electric Avenue (non-incentivised): 41 Figure 15: Vehicle manufacturers' plans for vehicle automation: 45 Figure 16: Technology uptake trends: 48 Figure 17: Automated and zero emissions uptake curves in Victoria by income group: 48 Figure 18: Flow capacity of conventional and automated vehicles in a queue model: 50 Figure 19: Change in speed from the base case – Private Drive: 51 Figure 20: Dwelling change from the base case – Private Drive (empty running): 52 Figure 21: Change in dwellings – regional Victoria: 53 Figure 22: Change in Victorian GSP, Private Drive: 56 Figure 23: Employment impacts – key industries 2046: 57 Figure 24: Private Drive load profile – incentivised: 58 Figure 25: Private Drive load profile – non-incentivised: 58 Figure 26: Projected capacity and maximum demand – Private Drive (incentivised): 59 Figure 27: Minimum mobile coverage requirements for automated vehicles: 62 Figure 28: Connected automated and roadside infrastructure: 64 Figure 29: Connected transport system design: 66 Figure 30: Fleet Street – change in public transport use from base case: 71 Figure 31: Fleet Street train volume capacity ratio – morning peak period: 71 Figure 32: Vehicle operating and use costs – Private Drive and Fleet Street: 72 Figure 33: Fleet Street vehicle fleet: 73 Figure 34: Private and fleet vehicle cost comparison: 74 Figure 35: Employment change from base case – Fleet Street: 75 Figure 36: Dwelling change from base case – Fleet Street; 75 Figure 37: Regional SA3 dwelling change from the base case – Fleet Street: 77 Figure 38: Access to train stations – base case: 78 Figure 39: Access to train stations – Fleet Street: 78 Figure 40: Sturt Street Ballarat – Fleet Street concept: 81 Figure 41: Estimated Avoided DALYs – Melbourne (Fleet Street scenario): 82 Figure 42: Estimated Avoided DALYs – Rest of Victoria (Fleet Street scenario): 83 Figure 43: Fleet Street vehicle charging profile: 84 Figure 44: Mobility as a service ecosystem: 88 Figure 45: Cumulative cost comparison between fuel sources (2046 AUD): 91 Figure 46: Change in flow: Hydrogen Highway vs base case (morning peak period): 93Figure 47: Hydrogen supply chain concept: 95Figure 48: Noise output – Hydrogen FCV and two comparable internal combustion engine vehicles: 98 Figure 49: Monash freeway – Slow Lane concept: 103 Figure 50: Technology uptake by income cohort: 104 Figure 51: Base Case train access: 105 Figure 52: Fleet Street train access: 106 Figure 53: Slow Lane train access: 107 Figure 54: Slow Lane – employment change from base case: 108 Figure 55: Slow Lane – dwelling change from base case: 109 Figure 56: Increase in public transport use between 2015 and 2031 (High Speed): 115 Figure 57: Generation investment requirements – High Speed: 117
134
Figure 58: Change in employment in key industries – Victoria 2031: 118 Figure 59: Deviation in GSP between High Speed and Fleet Street: 118 Figure 60: Chapel Street – Fleet Street concept: 119 Figure 61: Potential pedestrian crossing at Ringwood Station in a fully automated future: 121 Figure 62: Public transport patronage - all scenarios: 125
ACKNOWLEDGEMENTSSingapore
Ministry of Transport Land Transport Authority Singapore Technologies Kinetics Singapore Technologies Engineering 2getthere Nanyang Technological University Grab
Japan Softbank Drive Ministry of Economy, Trade and Industry Ministry of Land, Infrastructure, Transport and Tourism Tokyo Metropolitan Government Association for the Promotion of Electric Vehicles (APEV) Iwatani Corporation
Dubai
Ebtikaar Hyperloop Transportation Technologies The Sustainable City Dubai Roads and Transport Authority
The Netherlands
Transdev/Connexxion City of Amsterdam Pakhuis de Zwijger Netherlands Organisation for Applied Scientific Research (TNO) Traffic Innovation Centre Automotive Campus Helmond Amsterdam Smart City Daimler/EvoBus Connekt
135
2getthere
Finland
Business Finland Sensible 4 Trafi (Finland Road Safety) Finnish Transport Agency City of Helsinki MaaS Global
Sweden
PowerSwap City of Stockholm Ericsson City of Gothenburg Swedish Transport Administration (Trafikverket) RISE Research Institutes of Sweden
US
City of Chandler – Mayor's office Waymo Arizona Governor's office
Peer reviewers
Brian Negus Gary Liddle Geoffrey Lawler
Expert reviewers
Professor Hugh Bradlow Dr Julian de Hoog Andrew Somers
Consulting teams
KPMG – Transport modelling SGS – Land use modelling WSP – ICT infrastructure Arup – Transport engineering KPMG – Energy modelling Aurecon and ERM – Environment and population health
136
Deloitte Access Economics – Socioeconomic impacts KPMG – Financial analysis LEK and Arup – International markets Urban Circus and Ethos Urban – Urban design
Survey partner
RACV
SourcesAustralian Institute of Health and Welfare, 2018, Burden of Disease
Australian Safety and Compensation Council, 2008, The Health of Nations: The Value of a Statistical Life
BBC News, 2018, Tesla driver banned for M1 autopilot seat-switch, 28 April
Blackburn, R., 2017, Toyota to bring hydrogen fuel-cell car to Australia, Herald Sun, 26 October
Bloomberg New Energy Finance, 2018, Electric Vehicle Outlook 2018
de Hoog, J., Muenzel, V., Jayasuriya, DC, Alpcan, T.,Brazil, M., Thomas, DA., Mareels, I., Dahlenburg, G. and Jegatheesan, R., 2015, The importance of spatial distribution when analysing the impact of electric vehicles on voltage stability in distribution networks, Energy Systems, vol. 6, iss. 1, pp. 63-84
Department of Environment, Land, Water and Planning, 2016, Victoria's Climate Change Framework
Department of Infrastructure and Transport, 2010, Final Regulation Impact Statement for Review of Euro 5/6 Light Vehicle Emissions Standards
Drive Zero, 2018, A full list of Electric Cars (EVs and PHEVs) available or coming to Australia
Electric Vehicle Council and ClimateWorks Australia, 2017, The state of battery electric vehicles in Australia
Energeia, 2018, Australian Electric Vehicle Market Study
Environmental Clean Technologies Limited, 2018, Why should investors care about hydrogen?EPA Victoria Future air quality in Victoria – Final report, Publication 1535, July 2013Ewbank, J, 2017, The Tipping Point for Electric Vehicle Charging
137
Felton, N., 2008, Consumption Spreads Faster Today, New York Times, 10 February
Friedrich B., 2016, The Effect of Autonomous Vehicles on Traffic, Autonomous Driving, pp. 317-334
Graham, P., Reedman, L., Gargett, D., and Cosgrove, D., 2017, Australian road revenue and expenditure: scenarios to 2050, Commonwealth Scientific and Industrial Research Organisation
Harrington, D., 2018, Future of Motor Insurance, Investor Day
International Council on Clean Transportation, 2017, Electric vehicle capitals of the world: What markets are leading the transition to electric?
Levin, MW. and Boyles, SD., 2015, A multiclass cell transmission model for shared human and autonomous vehicle roads, Transportation Research Part C Emerging Technologies, vol. 62, pp. 103-116.
McCowen, D., 2017a, Australian Government: fully self-driving cars, Drive, 1 March
McCowen, D., 2017b, Hyundai reveals Australia's first fuel cell vehicle, Drive, 17 AugustNational Association of City Transportation Officials, 2017, Blueprint for Autonomous Urbanism
National Highway Traffic Safety Administration, 2015, Human Factors Evaluation of Level 2 and Level 3 Automated Driving Concepts
Offer, G. J., Howey, D., Contestabile, M., Clague R., and Brandon, N.P., 2010, Comparative analysis of battery electric, hydrogen fuel cell and hybrid vehicles in a future sustainable road transport system. Energy Policy, vol. 38, no. 1, pp. 24-29.
Parliament of Victoria, 2018, Inquiry into battery electric vehicles
QBE, 2017, The most common causes of car accidents in Australia
Randell, P., 2016, Waste lithium-ion battery projections, Victoria: Randell Environmental Consulting.
Sakamoto, I., Tanaka, T., Sekine, M., Morita, K., Shima, M., Korenori, T. and Yoshiike, A., 2010, Reviews On Countermeasure To Safety Risk Associated With Quietness Of Hybrid Or Electric Vehicles In Japan, INTERNOISE 2010; vol, 2, pp. 1048-1055
Smith, A., 2018, Distrust in selfdriving cars on the rise after crashes, CNN, 23 May
Solar Choice, 2013, The impact of rising wholesale fuel costs on Queensland's electricity prices (and the rest of Australia)
138
Sripad, S. and Viswanathan V., 2017, Performance Metrics Required of Next-Generation Batteries to Make a Practical Electric Semi Truck, ACS Energy Letters, vol. 2, no. 7. pp. 1669-1673
Stanley, J. K., Hensher, D., Stanley J. R., and Vella-Brodrick, D., 2011, `Mobility, social exclusion and well-being: exploring the links', Transportation Research A, vol. 45, no. 8, pp. 789-801
van der Heiden, RMA., Iqbal, ST. and Janssen, CP., 2017, Priming Drivers before Handover in SemiAutonomous Cars, published in Proceedings of the 2017 CHI Conference on Human Factors in Computing Systems, pp. 392-404
Wiggins, J., 2018, Charging bases key to spark electric car sales, Australian Financial Review, 19 June
ABOUT USInfrastructure Victoria is an independent advisory body operating under the Infrastructure Victoria Act 2015.
It has three main functions:
preparing a 30-year infrastructure strategy for Victoria, to be refreshed every three to five years
providing written advice to government on specific infrastructure matters publishing original research on infrastructure-related issues.
Infrastructure Victoria also supports the development of sectoral infrastructure plans by government departments and agencies.
The aim of Infrastructure Victoria is to take a long-term, evidence-based view of infrastructure planning and raise the level of community debate about infrastructure provision.
Infrastructure Victoria does not directly oversee or fund infrastructure projects.
This publication may be of assistance to you, but Infrastructure Victoria and its employees do not guarantee that the publication is without flaw of any kind or is wholly appropriate for your particular purposes and therefore disclaims all liability for any error, loss or other consequence that may arise from you relying on any information in this publication. You should seek appropriately qualified advice before making any decisions regarding your particular project.
Printed by Infrastructure Victoria
August 2018
139
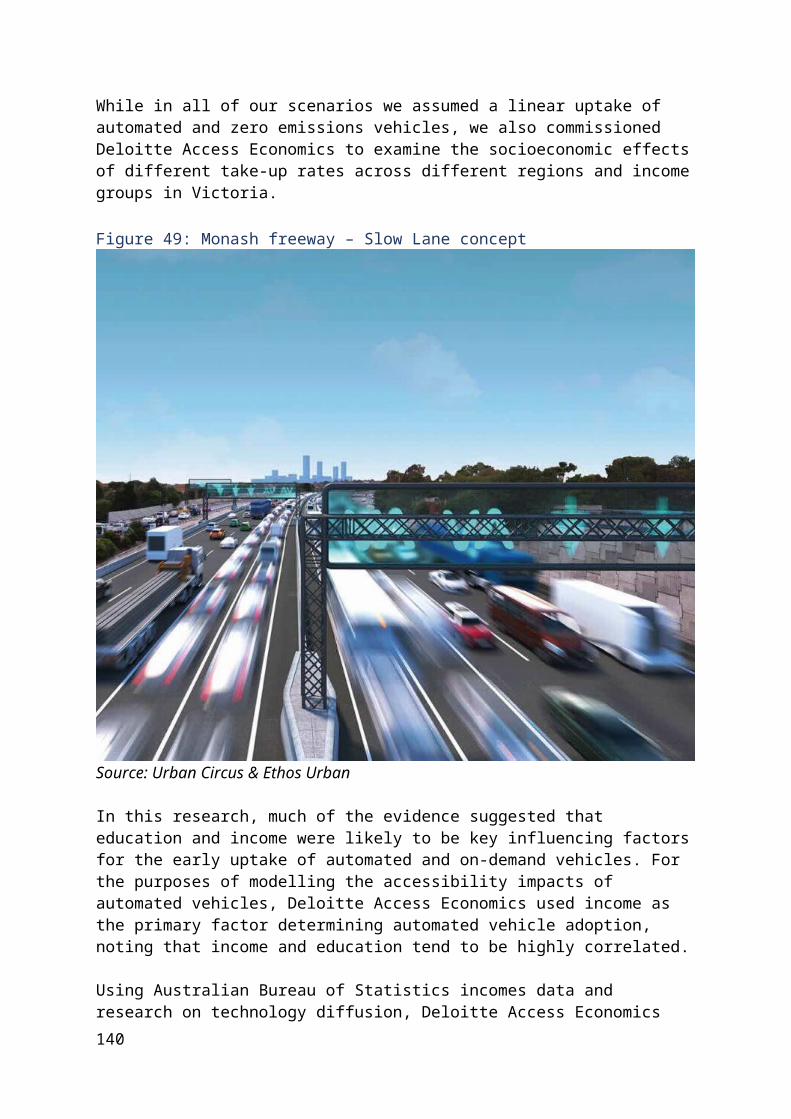
© Copyright Infrastructure Victoria 2018
Except for any logos, emblems, trademarks, figures and photography, this document is made available under the terms of the Creative Commons Attribution 3.0 Australia licence. It is a condition of this Creative Commons Attribution 3.0 licence that you must give credit to the original author, who is Infrastructure Victoria.
This document is also available in PDF and accessible Word format at www.infrastructurevictoria.com.au.
140