Embed Size (px)
Citation preview

Contents
Page 2
Meeting with share analysts 23/08/02
• Performance development 2nd quarter and 1st half year 2002• Strategy• DFDS ro-pax• Ro-ro – capacity expansion in the North Sea• Focus on the Baltic Sea• OPTIMIZE – Group structure• Profit forecast 2002

Profit and loss account Q2
DKK millions Q2 2002 Q2 2001
Net turnover 1.276 1.046
Profit on sale of ships, buildings and terminals 14 124
Profit before depreciation (EBITDA) 261 288
Depreciation -123 -96
Operating profit (EBITA) 138 192
Goodwill amortization and depreciation -1 0
Profit before financing, etc. (EBIT) 137 192
Financing, net -48 -9
Profit before tax 89 183
Page 3
Meeting with share analysts 23/08/02
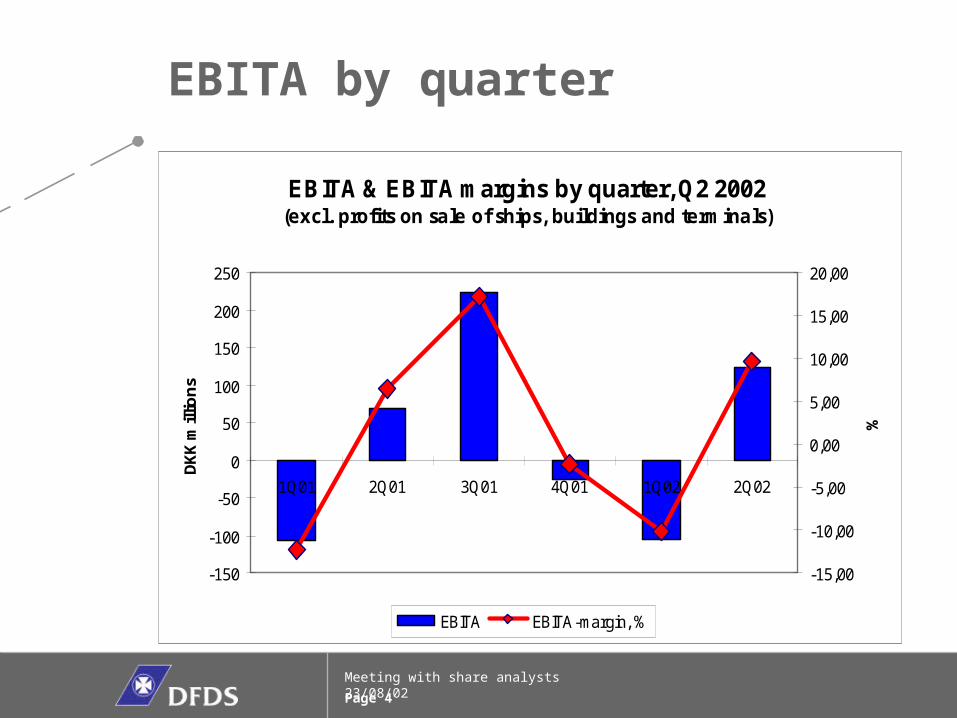
EBITA by quarter
Page 4
Meeting with share analysts 23/08/02
EBITA & EBITA margins by quarter, Q2 2002(excl. profits on sale of ships, buildings and terminals)
-150
-100
-50
0
50
100
150
200
250
1Q01 2Q01 3Q01 4Q01 1Q02 2Q02
DK
K m
illio
ns
-15,00
-10,00
-5,00
0,00
5,00
10,00
15,00
20,00
%
EBITA EBITA-margin, %

Profit and loss account Q1-Q2
DKK millions Q1-Q2 2002 Q1-Q2 2001
Net turnover 2.326 1.911
Profit on sale of ships, buildings and terminals 14 124
Profit before depreciation (EBITDA) 279 276
Depreciation -247 -191
Operating profit (EBITA) 32 85
Goodwill amortization and depreciation -3 0
Profit before financing, etc. (EBIT) 29 85
Financing, net -78 -2
Profit before tax -49 83
Page 5
Meeting with share analysts 23/08/02

1.800
1.850
1.900
1.950
2.000
2.050
2.100
2.150
2.200
2.250
2.300
2.350
2.400
1 2 3 4 5
Turnover development Q1-Q2
DFDS Group,Q1-Q2, 2001DKK 1,911 million
DFDS Seaways,Q1-Q2, 2002Growth in turnoverDKK 159 million
DFDS Tor Line,Q1-Q2, 2002Growth in turnoverDKK 248 million
Elimination, etc.Q1-Q2, 2002DKK 8 million
DFDS Group,Q1-Q2, 2002DKK 2,326 million
2001 DFDS Seaways DFDS Tor Line Elimination, etc. 2002
19%
23%
22%
Page 6
Meeting with share analysts 23/08/02

-50
-40
-30
-20
-10
0
10
20
Development in EBITA Q1-Q2(excl. profit on sale of ships, buildings and terminals)
DFDS Group,Q1-Q2, 2001DKK -39 mio.
DFDS SeawaysQ1-Q2, 2002EBITA improvement:DKK 6 mio.
DFDS Tor Line,Q1-Q2, 2002EBITA improvement:DKK 51 million
DFDS Group ManagementQ1-Q2, 2002EBITA change:DKK 0 million
DFDS GroupQ1-Q2, 2002DKK 18 million
2001 DFDS Seaways DFDS Tor Line DFDS Group Mgt 2002
+6
+51
Page 7
Meeting with share analysts 23/08/02

Cash flow Q1-Q2
DKK millions Q1-Q2 2002 Q1-Q2 2001
Profit before depreciation (EBITDA) 279 276
Net w orking capital 166 325
Taxes paid -21 -1
Cash flow from operations before financing 424 600
Financing, net -79 -2
Cash flow from operations 345 598
Cash flow from investments -173 -1.674
Cash flow after investments 172 -1.076
Proceeds from loans, etc. -53 1.130
Dividend paid to shareholders -68 -1.763
Cash flow from financial items -121 -633
Total cash flow 51 -1.709
Page 8
Meeting with share analysts 23/08/02

Accounting policies
• Changes in accounting policies in accordance with the new Financial Statements Act:– development costs– derivative financial instruments– proposed dividend
• Changes in accounting estimates related to ships in accordance with Danish accounting standard no. 10:– ships divided into two components– reassessment of useful lives– adjustment of book value at beginning of year
Page 9
Meeting with share analysts 23/08/02

Accounting policies
DKK millionsDFDS
SeawaysDFDS
Tor LineDFDS Group
DFDS Seaways
DFDS Tor Line
DFDS Group
Capitalization of development costs 1,4 0,0 1,4 3,0 0,0 3,0
Depreciation of development costs 0,0 -1,8 -1,8 0,0 -3,9 -3,9
Value adjustment on ships -6,5 1,5 -5,0 -13,0 3,1 -9,9
Changes in ship depreciation 0,2 -2,0 -1,8 2,8 -3,9 -1,1
Profit on sale of King 5,0 0,0 5,0 5,0 0,0 5,0
Total profit impact 0,1 -2,3 -2,2 -2,2 -4,7 -6,9
Q1-Q2 2002 Full year 2002
Profit impact of changes in accounting policies and changes in accounting estimates of ships
Page 10
Meeting with share analysts 23/08/02

DFDS Seaways
• Continuing growth in turnover on Amsterdam-Newcastle route
• Satisfactory growth in turnover and earnings on Copenhagen-Helsingborg-Oslo route
• Passenger terminal in Esbjerg sold
• KING OF SCANDINAVIA sold
• ADMIRAL OF SCANDINAVIA sold
DKK millions Q1-Q2 2002 Q1-Q2 2001
Net turnover 1.018 859
Operating profit (EBITA) -50 -70
Operating profit margin, % -4,9 -8,1
Invested capital 2.211 1.944Return on invested capital (ROIC), % -2,6 -7,1
Passengers, '000 845 765
Page 11
Meeting with share analysts 23/08/02

DFDS Seaways – EBITA by quarter
EBITA & EBITA margins by quarter, Q2 2002(excl. profit on sale of ships, buildings and terminals)
-175
-125
-75
-25
25
75
125
175
225
1Q01 2Q01 3Q01 4Q01 1Q02 2Q02DK
K m
illio
ns
-40
-30
-20
-10
0
10
20
30
%
EBITA EBITA-margin, %
Page 12
Meeting with share analysts 23/08/02

DFDS Tor Line• Profit performance in the North
Sea as expected
• DFDS Lys-Line Rederi in line with expectations
• LISCO’s profit performance slightly better than expected for the second quarter
• NorBridge again recorded an operating profit in the second quarter
• EuroBridges stabilized its performance
DKK millions Q1-Q2 2002 Q1-Q2 2001
Net turnover 1.324 1.076
Operating profit (EBITA) 101 50
Operating profit margin, % 7,6 4,6
Invested capital 3.502 2.899Return on invested capital(ROIC), % 5,3 3,3
Lane metres, '000 3.659 3.401
Page 13
Meeting with share analysts 23/08/02

DFDS Tor Line – EBITA by quarter
EBITA & EBITA margins by quarter, Q2 2002(excl. profit on sale of ships, buildings and terminals)
0
10
20
30
40
50
60
70
1Q01 2Q01 3Q01 4Q01 1Q02 2Q02
DK
K m
illio
ns
0
1
2
3
4
5
6
7
8
9
10
%
EBITA EBITA-margin, %
Page 14
Meeting with share analysts 23/08/02

DFDS Seaways
DFDS Tor LineTonnage
Salesagencies
Terminals Routes
Passenger fleet renewal:• Average age: 15 years• 75% ownership share • Two older ships sold
Ro-ro fleet renewal:• Average age: 10 years• 50% ownership share• Sell older ships• Five newbuildings
New customer concepts:• Ro-pax• Transport-pax
New customer concepts:• Auto Logistics• Shipping Logistics
Route development:• Focus on Baltic Sea• Increased capacity in North Sea
Route development:• New route to Poland• Exploit route network• Ro-pax route concept
Terminals:• Esbjerg terminal sold
Terminals:• Maasvlakte• Value-added services
DFDS’ strategy
THE DFDS VALUE CHAIN
Page 15
Meeting with share analysts 23/08/02

DFDS ro-pax – Esbjerg-Harwich
• DANA GLORIA to replace DANA ANGLIA on 3 October 2002
• Two ro-pax ships to replace DANA GLORIA in April 2003
• Sailing schedule adjusted
• Ro-pax concept:– pax capacity: 600 passengers, approx. 200 cabins– freight capacity: 2,200 lane metres– crossing time: 17 hours– three weekly departures in each direction
Page 17
Meeting with share analysts 23/08/02

Ro-ro – capacity increase in the North Sea• Expected delivery dates for five newbuildings from
Flensburg shipyard:– 721: September 2003– 722: January 2004– 723: May 2004– 724: August 2004– 725: January 2005
• 721-3 is planned to enter into service on AngloBridge, approx. 40% capacity increase
• 724-5 is planned to enter into service on BritanniaBridge, approx. 50% capacity increase
Page 20
Meeting with share analysts 23/08/02

Ro-ro – higher productivity in the North Sea
• faster service speed: 22 knots
• higher capacity: 4,000 lane metres per ship
• marginal increase in cost of capital
• lower operating costs, e.g., oil consumption and maintenance
• general reduction in level of costs
Page 20
Meeting with share analysts 23/08/02

Focus on the Baltic Sea• DFDS Seaways: Copenhagen-Trelleborg-Gdansk to open
at the beginning of October with the DANA ANGLIA
• DFDS Tor Line: route opened between Kiel and Riga in May 2002, offering two weekly departures in each direction
• DFDS Tor Line: activity expansion being considered in the region of Kaliningrad, Estonia and the east coast of Sweden
• LISCO: the DANA GLORIA is planned to enter into service on the Kiel-Klaipeda route, replacing two ships
Page 23
Meeting with share analysts 23/08/02

Expected fleet renewal 2002
No. of ships Owned ships
Ownership share, %
Targeted ownership share, %
Average age of owned ships
Targeted average age
DFDS Seaways 6 6 100 75 19,8 15
DFDS Tor Line 19 15 79 50 14,7 10
LISCO Baltic Service 13 13 100 50 12,9 10
DFDS Lys-Line Rederi 18 8 44 50 10,4 10
Total, DFDS Tor Line 50 36 72 50 13,1 10
Page 24
Meeting with share analysts 23/08/02

OPTIMIZE – Group structure
• Restructuring of headquarter functions:– HR functions integrated
– financial functions integrated
– decision made to integrate IT functions – implementation planned for 2nd half of 2002
– others
• New IT director appointed
• Focus on reducing corporate costs
Page 25
Meeting with share analysts 23/08/02

Tonnage tax• Danish tonnage tax regime adopted on 18 April 2002
• Shipping companies have to decide between the new tonnage tax regime and the current tax scheme
• Shipping can choose the tonnage tax regime with effect from 2001
• The decision is binding for 10 years
• DFDS is favourable to the new regime but has not yet made its final decision
Page 26
Meeting with share analysts 23/08/02

Profit forecast 2002
• Profit impact of the fire on board the PRINCESS OF SCANDINAVIA
is expected to be slightly less negative than previously announced
• The sale of the ADMIRAL OF SCANDINAVIA is expected to result in
a loss in the region of DKK 12 million
• The purchase of two ro-pax ships is expected to have a small
negative impact on the profit for 2002
Page 27
Meeting with share analysts 23/08/02

Profit forecast 2002
• DFDS Seaways continues to expect a significant improvement in
operating profit (EBITA) for 2002
• DFDS Tor Line continues to expect a somewhat better operating
profit (EBITA), adjusted for the profit on the sale of ships, for 2002
• The DFDS Group continues to expect a profit before tax of
approx. DKK 130 million for 2002
Page 28
Meeting with share analysts 23/08/02