Embed Size (px)
Citation preview
CONTENTS
Notice of Annual General Meeting 2
Statement Accompanying Notice of Annual General Meeting 4
Corporate Information 5
Profile of the Board of Directors 6
Audit Committee Report 8
Statement of Corporate Governance 12
Statement of Risk Management and Internal Controls 17
Directors’ Responsibility Statement and Other Information 19
Chairman’s Statement 21
Directors’ Report 23
Consolidated Statement of Financial Position 27
Statements of Profit or Loss and Other Comprehensive Income 29
Statements of Changes in Equity 30
Statements of Cash Flows 31
Notes to the Financial Statements 34
Supplementary Information on the Breakdown of Realised and Unrealised Profits or Losses 93
Statement by Directors / Statutory Declaration 94
Independent Auditors’ Report 95
Analysis of Shareholdings 97
List of Group Properties 99
Form of Proxy Enclosed
2
Notice of Annual General Meeting
NOTICE IS HEREBY GIVEN that the Forty-First Annual General Meeting of the Company will be held at The Hwa Tai Grand Conference Room, Ground Floor, No. 12, Jalan Jorak, Kawasan Perindustrian Tongkang Pecah, 83010 Batu Pahat, Johor Darul Takzim, Malaysia on Saturday, 18 June 2016 at 11.30 a.m.
AGENDA RESOLUTION NO.
1. To present the Audited Financial Statements for the financial year ended 31 December 2015 together with the Directors’ and Auditors’ Reports thereon.
–
2. To approve payment of Directors’ fee for the financial year ended 31 December 2015. 1
3. To re-appoint the Director, YBhg. Col. (Rtd.) Dato’ Ir. Cheng Wah, who retires in accordance with Section 129(6) of the Companies Act, 1965.
2
4. To re-elect the following Directors who retire in accordance with the Company’s Articles of Association:-
4.1 Mr. Soo Thien Ming @ Soo Thien See4.2 Mr. Soo Wei Chian
34
5. To re-elect the following Directors, who each had served as an Independent Non-Executive Director of the Company for a cumulative term of more than nine (9) years, to continue to act as Independent Non-Executive Directors of the Company in accordance with the Malaysian Code on Corporate Governance 2012:-
5.1 YBhg. Col. (Rtd.) Dato’ Ir. Cheng Wah5.2 Mr. Soo Wei Chian
56
6. To appoint Auditors and authorise the Directors to fix their remuneration. 7
7. To transact any other business appropriate to an Annual General Meeting, for which due notice shall have been given in accordance with the Company’s Articles of Association and/or the Companies Act, 1965.
–
8. As SPECIAL BUSINESS, to consider and, if thought fit, pass the following resolution:-
ORDINARY RESOLUTION - AUTHORITY TO ALLOT AND ISSUE SHARES IN GENERAL PURSUANT TO SECTION 132D OF THE COMPANIES ACT, 1965
“That, subject to the Companies Act, 1965 and the Articles of Association of the Company and approvals from the Securities Commission and Bursa Malaysia Securities Berhad and other relevant governmental or regulatory authorities, the Directors be and are hereby empowered pursuant to Section 132D of the Companies Act, 1965 to allot and issue shares in the capital of the Company from time to time upon such terms and conditions and for such purposes as the Directors may in their discretion deem fit provided that the aggregate number of shares issued pursuant to this resolution does not exceed 10% of the issued share capital of the Company for the time being and that such authority shall continue in force until the conclusion of the next Annual General Meeting of the Company.”
8
By Order of the BoardJESSICA CHIN TENG LI (MAICSA 7003181)Company Secretary
Johor Darul Takzim, Malaysia29 April 2016
3HWA TAI INDUSTRIES BERHAD I Annual Report 2015
Notice of Annual General Meeting (cont’d)
NOTES:
Entitlement to Attend and Proxy
A member entitled to attend and vote at the Meeting is entitled to appoint at least 1 proxy to attend and vote instead of him/her. Where a member is an authorised nominee as defined under the Securities Industry (Central Depositories) Act 1991, it may appoint at least 1 proxy in respect of each securities account it holds with ordinary shares of the Company standing to the credit of the said securities account. A proxy need not be a member of the Company. The instrument appointing a proxy must be deposited at the Registered Office of the Company at No. 12, Jalan Jorak, Kawasan Perindustrian Tongkang Pecah, 83010 Batu Pahat, Johor Darul Takzim, Malaysia, not less than 48 hours before the time appointed for holding the Meeting.
For the purpose of determining a member who shall be entitled to attend the Meeting, the Company shall be requesting Bursa Malaysia Depository Sdn. Bhd. in accordance with Article 49(B) of the Company’s Articles of Association and Section 34(1) of the Securities Industry (Central Depositories) Act 1991, to issue a Record of Depositors as at 13 June 2016. Only a depositor whose name appears on the Record of Depositors as at 13 June 2016 shall be entitled to attend the Meeting or appoint proxies to attend and vote on his/her behalf.
Audited Financial Statements (Agenda No. 1)
Item 1 of the Agenda is meant for discussion only, as the provision of Section 169(1) of the Companies Act, 1965 requires the Directors to only lay before the Company at its annual general meeting its annual financial statements and thus, does not require a formal approval of the Shareholders for the audited financial statement. Hence, this item of the Agenda is not put forward for voting.
Directors’ Fee (Agenda No. 2)
The details of the proposed Directors’ Fee for the financial year ended 31 December 2015 are set out in Note 18(a) of the Audited Financial Statements for the financial year ended 31 December 2015.
Auditors (Agenda No. 6)
The Auditors, Messrs. Baker Tilly Monteiro Heng, have expressed their willingness to continue in office.
Ordinary Resolution – Authority to the Directors to issue and allot shares pursuant to Section 132D of the Companies Act, 1965 (Agenda No. 8)
The proposed Ordinary Resolution on Authority to the Directors to issue and allot shares pursuant to Section 132D of the Companies Act, 1965, if passed, will give a renewed mandate to the Directors of the Company with full power to issue shares in the Company up to an amount not exceeding in total 10% of the issued share capital of the Company for such purposes as the Directors consider would be in the interest of the Company. This would enable the Directors to take swift action in case of a need for any possible fund raising corporate exercise or in the event of business opportunities arise which involve the issuance of new shares, thus avoiding any delay and cost involved in convening a general meeting to specifically approve such an issue of shares. This renewed mandate, unless revoked or varied at a general meeting, will expire at the next Annual General Meeting of the Company.
As at the date of this Notice, no new shares of the Company were issued pursuant to the mandate granted to the Directors at the last Annual General Meeting held on 20 June 2015, which mandate will lapse at the conclusion of the forthcoming Annual General Meeting.
4
Statement AccompanyingNotice of Annual General Meeting(Pursuant to Paragraph 8.27(2) of the Main Market Listing Requirements of Bursa Malaysia Securities Berhad)
No individual other than the retiring Directors is seeking appointment / election as a Director at the forthcoming Forty-First Annual General Meeting of the Company. The details of the retiring Directors standing for re-appointment / re-election are set out in the Directors’ Profile appearing on pages 6 and 7 of this Annual Report. An assessment on all the retiring Directors had been conducted by the Nomination Committee.
5HWA TAI INDUSTRIES BERHAD I Annual Report 2015
Corporate Information
BOARD OF DIRECTORS
Soo Thien Ming @ Soo Thien See (Chairman)
Soo Chung Yee (Group Chief Executive Director)
Col. (Rtd.) Dato’ Ir. Cheng Wah
Soo Wei Chian
COMPANY SECRETARY
Jessica Chin Teng Li (MAICSA 7003181)
REGISTERED OFFICE & PRINCIPAL BUSINESS ADDRESS
No. 12, Jalan JorakKawasan Perindustrian Tongkang Pecah83010 Batu PahatJohor Darul TakzimMalaysiaTel. No.: 607-4151688Fax No.: 607-4151135
CORPORATE OFFICE
No. L9, Jalan ML 16ML-16 Industrial Park43300 Seri KembanganSelangor Darul EshanMalaysiaTel. No.: 603-8964 5600 Fax No.: 603-8964 5400
SHARE REGISTRAR
Tricor Investor & Issuing House Services Sdn BhdUnit 32-01, Level 32, Tower AVertical Business Suite, Avenue 3Bangsar SouthNo. 8, Jalan Kerinchi59200 Kuala LumpurMalaysiaTel. No.: 603-2783 9299Fax No.: 603-2783 9222
AUDITORS
Baker Tilly Monteiro HengChartered AccountantsBaker Tilly MH TowerLevel 10, Tower 1, Avenue 5Bangsar South City59200 Kuala LumpurMalaysia
PRINCIPAL BANKERS
RHB Bank BerhadBank Muamalat Malaysia BerhadAmBank (M) BerhadBangkok Bank BerhadBank of China (Malaysia) Berhad
LISTING
Bursa Malaysia Securities Berhad, Main Market – Listed since 1992
WEBSITE
www.hwatai.com
6
Profile of the Board of Directors
MR. SOO THIEN MING @ SOO THIEN SEE – Non-Independent Non-Executive Director Mr. Soo Thien Ming, Malaysian, aged 68, is the Chairman on the Board of the Company. He was appointed to the Board on 26 April 1996. Mr. Soo is a Barrister-At-Law of Lincoln’s Inn, London. He is an advocate and solicitor by profession and has been in practice for 40 years. He is also a Notary Public. He holds several directorships in private companies in Malaysia and abroad.
He is the Chairman of the Nomination Committee and Remuneration Committee.
Mr. Soo has a direct shareholding of 30,949,567 ordinary shares of RM1/- each in the Company as at 31 March 2016. He is deemed to have an interest in the equity holdings held by the Company in its subsidiaries by virtue of his controlling interest in the Company.
He is the father of Mr. Soo Chung Yee, the Group Chief Executive Director of the Company.
Mr. Soo does not have any conflict of interest with the Company nor any conviction for any offence.
MR. SOO CHUNG YEE– Non-Independent Executive Director
Mr. Soo Chung Yee, Malaysian, aged 37, is the Group Chief Executive Director. He was appointed to the Board on 16 August 2004. Mr. Soo holds a Bachelor of Arts from the University of Derby, United Kingdom. He was awarded the Asia Pacific Entrepreneurship Award (Emerging Entrepreneur – Malaysia) in 2007 and the JCI Creative Young Entrepreneur Award (Junior Chamber International – Malaysia) in 2008. He also holds several directorships in private companies in Malaysia and abroad.
He is a member of the Remuneration Committee.
He is the son of Mr. Soo Thien Ming, the Chairman of the Company.
Mr. Soo does not have any interest in the securities of the Company or its subsidiaries. He also does not have any conflict of interest with the Company nor any conviction for any offence.
YBHG. COL. (RTD.) DATO’ IR. CHENG WAH - Independent Non-Executive Director
YBhg. Col. (Rtd.) Dato’ Ir. Cheng Wah, Malaysian, aged 77, was appointed to the Board on 1 August 2005. He holds a Bachelor of Engineering degree in Civil Engineering from the University of Malaya. He is a Professional Engineer with the Board of Engineers, Malaysia. He is also a graduate of the Royal Military Academy Sandhurst, United Kingdom and the Command and General Staff College, Fort Leavenworth, United States of America.
He served the Malaysian Armed Forces for 26 years. Amongst the appointments he held was Director of Armed Forces Works, Logistic Division, Ministry of Defence in 1978 and Director of Logistic, Ministry of Defence in 1980 before retiring in September 1983. On retirement he joined Genting Group, became Director of Development and later a Senior Vice President (Property Development) in Resorts World Berhad until his retirement in 2004. Currently, he is also a Director of Brahim’s Holdings Berhad and Kien Huat Berhad. Earlier, he had served as a Director in Koperasi Angkatan Tentera Malaysia Bhd (1978-1983), Chocolate Products (Malaysia) Berhad (1986-1989), Pacific Bank Berhad (1983-2000) and PacificMas Berhad (2001-2007).
YBhg. Col. (Rtd.) Dato’ Ir. Cheng Wah is the Chairman of the Audit Committee.
He has a direct shareholding of 50,000 ordinary shares of RM1/- each in the Company as at 31 March 2016. He does not have any interest in the securities of its subsidiaries.
He does not have any family relationship with any directors and/or major shareholders of the Company. He does not have any conflict of interest with the Company nor any conviction for any offence.
7HWA TAI INDUSTRIES BERHAD I Annual Report 2015
MR. SOO WEI CHIAN – Independent Non-Executive Director
Mr. Soo Wei Chian, Malaysian, aged 47, was appointed to the Board on 1 August 2005. He holds a Masters of Business Administration, University of Strathclyde, United Kingdom. He is a fellow member of the Chartered Institute of Management Accountants, United Kingdom and a member of the Malaysian Institute of Accountants. He held financial positions in public listed companies for the period between 1991 and 1995. He joined NV Multi Corporation Berhad as the Finance Manager in 1995 and he now holds the position of Executive Director in Nirvana Asia Ltd, a company listed on the Hong Kong Stock Exchange.
Mr. Soo sits on the Audit Committee, Nomination Committee and Remuneration Committee.
He does not have any family relationship with any directors and/or major shareholders of the Company. He does not have any interest in the securities of the Company or its subsidiaries. He does not have any conflict of interest with the Company nor any conviction for any offence.
DETAILS OF ATTENDANCE OF DIRECTORS AT BOARD MEETINGS DURING THE FINANCIAL YEAR ENDED 31 DECEMBER 2015
During the financial year ended 31 December 2015, a total of six (6) Directors’ Meetings were held. The details of attendance of Directors at these Meetings are as follows:
Name of DirectorNumber of Meetings
Attended
Soo Thien Ming @ Soo Thien See 6 of 6
Soo Chung Yee 6 of 6
Col. (Rtd.) Dato’ Ir. Cheng Wah 6 of 6
Soo Wei Chian 5 of 6
Mohamed Razif Bin Tan Sri Abdul Aziz (Deceased - 28 March 2016) 5 of 6
Profile of the Board of Directors (cont’d)
8
Audit Committee Report
1. COMPOSITION OF AUDIT COMMITTEE
Col. (Rtd.) Dato’ Ir. Cheng Wah (Chairman) Independent Non-Executive Director
Soo Wei Chian * Independent Non-Executive Director
Mohamed Razif Bin Tan Sri Abdul Aziz Independent Non-Executive Director (Deceased – 28 March 2016)
* A member of the Malaysian Institute of Accountants
2. TERMS OF REFERENCE OF AUDIT COMMITTEE
MEMBERSHIP
1. An Audit Committee shall be appointed by the Directors from among their number (except Alternate Directors) pursuant to a resolution of the Board of Directors which fulfils the following requirements:
(a) The Audit Committee must be composed of no fewer than 3 Members;(b) All Members of the Audit Committee must be Non-Executive Directors, with majority of them being
Independent Directors; and(c) At least one Member of the Audit Committee:
(i) Must be a member of the Malaysian Institute of Accountants; or(ii) If he is not a member of the Malaysian Institute of Accountants, he must have at least 3 years’
working experience and:(1) He must have passed the examinations specified in Part 1 of the 1st Schedule of the
Accountants Act, 1967; or(2) He must be a member of one of the associations of accountants specified in Part II of the
1st Schedule of the Accountants Act, 1967; or(iii) Fulfils such other requirements as prescribed or approved by Bursa Malaysia.
2. The Members of the Audit Committee shall elect a Chairman from among their number who shall be an Independent Director.
3. If a Member of the Audit Committee resigns, dies or for any other reason ceases to be a Member with the result that the number of Members is reduced below 3, the Board of Directors shall, within 3 months of that event, appoint such number of new Members as may be required to make up the minimum of 3 Members.
4. The terms of office and performance of the Audit Committee and each of its Members shall be reviewed by the Board of Directors no less than once every 3 years.
9HWA TAI INDUSTRIES BERHAD I Annual Report 2015
2. TERMS OF REFERENCE OF AUDIT COMMITTEE (CONT’D)
MEETINGS
1. Meetings shall be held not less than 4 times a year.
2. Upon the request of the External Auditor, the Chairman of the Audit Committee shall convene a meeting of the Committee to consider any matters the External Auditor believes should be brought to the attention of the Directors or Shareholders. The External Auditor has the right to appear and be heard at any meeting of the Audit Committee and shall appear before the Committee when required to do so by the Committee.
3. The Chairman shall convene a meeting whenever any Member of the Audit Committee requests for a meeting.
4. Written notice of the meeting together with the agenda shall be given to the Members of the Audit Committee and the External Auditor, where applicable.
5. The quorum for a meeting shall be 2 Provided Always that the majority of Members present must be Independent Directors and any decision shall be by a simple majority. The Chairman shall not have a casting vote.
6. The other Board Members, Accounts Manager, the Head of Internal Audit (if any), any employee of the Company and a representative of the External Auditors may be invited to attend meetings. If necessary, the Audit Committee shall meet with the External Auditors without any Executive Board Member present.
7. The Company Secretary shall be the secretary of the Audit Committee.
AUTHORITY
The Audit Committee is authorised by the Board of Directors to:
a) Investigate any activity within its terms of reference. b) Seek any information it requires from any employee and all employees are directed to co-operate with any
request made by the Audit Committee.c) Obtain outside legal or other independent professional advice and to secure the attendance of outsiders
with relevant experience and expertise if it considers this necessary.
The Audit Committee shall have direct access to the External Auditor and person(s) carrying out the internal audit function or activity and be able to convene meetings with the External Auditor, Internal Auditor or both, excluding the attendance of other members of the Board and employees of the Company, whenever necessary.
The Audit Committee shall be empowered to appoint and remove the Internal Auditor. The internal audit function shall report directly to the Audit Committee.
Audit Committee Report (cont’d)
10
2. TERMS OF REFERENCE OF AUDIT COMMITTEE (CONT’D)
DUTIES
The duties of the Audit Committee shall be:
1. To recommend the nomination of a person or persons as External Auditors.
2. To review the following and report the same to the Board of Directors:-a. With the External Auditor, the audit plan;b. With the External Auditor, his evaluation of the system of internal controls;c. With the External Auditor, his audit report;d. The assistance given by the employees of the Company to the External Auditor;e. The adequacy of the scope, functions, competency and resources of the Internal Audit functions and
that it has the necessary authority to carry out its work;f. The Internal Audit programme, processes, the results of the Internal Audit programme, processes or
investigation undertaken and whether or not appropriate action is taken on the recommendations of the Internal Audit function;
g. The quarterly results and year end financial statements, prior to the approval by the Board of Directors, focusing particularly on:-i) Changes in or implementation of major accounting policy changes;ii) Significant and unusual events; andiii) Compliance with accounting standards and other legal requirements;
h. Any related party transaction and conflict of interest situation that may arise within the Company or group including any transaction, procedure or course of conduct that raises questions of management integrity;
i. Any letter of resignation from the External Auditors of the Company; andj. Whether there is reason (supported by grounds) to believe that the Company’s External Auditor is
not suitable for re-appointment.
3. To discuss problems and reservations arising from the interim and final audits, and matters the External Auditor may wish to discuss (in the absence of management where necessary).
4. To keep under review the effectiveness of internal control systems, and in particular review the External Auditor’s management letter and management’s response.
5. To consider other topics, as agreed to by the Audit Committee and the Board of Directors.
PROCEDURES
Each Audit Committee may regulate its own procedure and in particular the calling of meetings, the notice to be given of such meetings, the voting and proceedings thereat, the keeping of minutes and the custody, production and inspection of such minutes.
Audit Committee Report (cont’d)
11HWA TAI INDUSTRIES BERHAD I Annual Report 2015
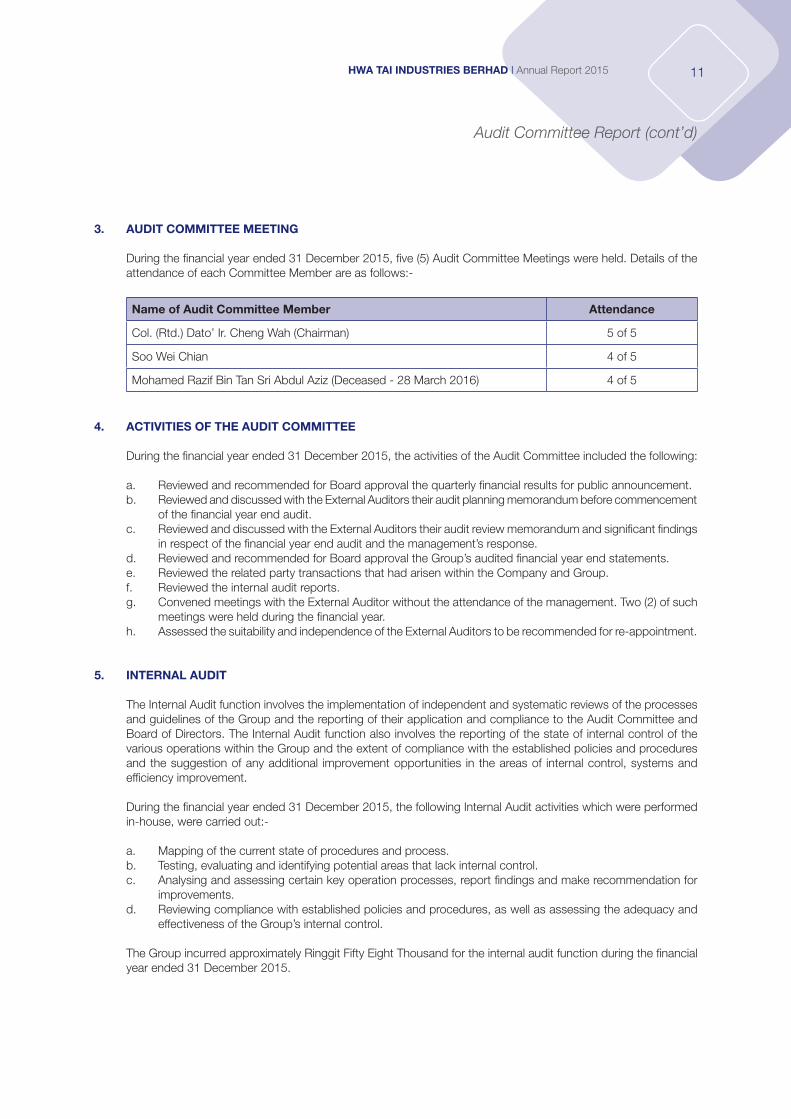
3. AUDIT COMMITTEE MEETING
During the financial year ended 31 December 2015, five (5) Audit Committee Meetings were held. Details of the attendance of each Committee Member are as follows:-
Name of Audit Committee Member Attendance
Col. (Rtd.) Dato’ Ir. Cheng Wah (Chairman) 5 of 5
Soo Wei Chian 4 of 5
Mohamed Razif Bin Tan Sri Abdul Aziz (Deceased - 28 March 2016) 4 of 5
4. ACTIVITIES OF THE AUDIT COMMITTEE
During the financial year ended 31 December 2015, the activities of the Audit Committee included the following:
a. Reviewed and recommended for Board approval the quarterly financial results for public announcement.b. Reviewed and discussed with the External Auditors their audit planning memorandum before commencement
of the financial year end audit. c. Reviewed and discussed with the External Auditors their audit review memorandum and significant findings
in respect of the financial year end audit and the management’s response.d. Reviewed and recommended for Board approval the Group’s audited financial year end statements.e. Reviewed the related party transactions that had arisen within the Company and Group.f. Reviewed the internal audit reports.g. Convened meetings with the External Auditor without the attendance of the management. Two (2) of such
meetings were held during the financial year.h. Assessed the suitability and independence of the External Auditors to be recommended for re-appointment.
5. INTERNAL AUDIT
The Internal Audit function involves the implementation of independent and systematic reviews of the processes and guidelines of the Group and the reporting of their application and compliance to the Audit Committee and Board of Directors. The Internal Audit function also involves the reporting of the state of internal control of the various operations within the Group and the extent of compliance with the established policies and procedures and the suggestion of any additional improvement opportunities in the areas of internal control, systems and efficiency improvement.
During the financial year ended 31 December 2015, the following Internal Audit activities which were performed in-house, were carried out:-
a. Mapping of the current state of procedures and process. b. Testing, evaluating and identifying potential areas that lack internal control. c. Analysing and assessing certain key operation processes, report findings and make recommendation for
improvements.d. Reviewing compliance with established policies and procedures, as well as assessing the adequacy and
effectiveness of the Group’s internal control.
The Group incurred approximately Ringgit Fifty Eight Thousand for the internal audit function during the financial year ended 31 December 2015.
Audit Committee Report (cont’d)
12
Statement of Corporate Governance
BOARD RESPONSIBILITY
The Board of Directors is committed and continues to ensure the compliance with the principles and best practices as set out in the Malaysian Code on Corporate Governance 2012 to ensure high standards of corporate governance are practiced in the Group. The Board is pleased to provide the following statement on how the Group has applied the principles and best practices as set out in the Malaysian Code on Corporate Governance.
BOARD OF DIRECTORS
A. The Board.
The Board leads and controls the Group. The Board is bestowed with the duty and responsibility to ensure the interests of the shareholders are protected. The duties and responsibilities of the Board which are separated from that of the management, are spelt out in the Board Charter.
Where appropriate, formal structures and committees are in place to facilitate the Board in carrying out its duties. All Board committees report to the Board.
The Board meets on a regular and scheduled basis, at least 4 times a year.
B. Composition and Board Balance.
The Board comprises 4 members to reflect the interests of the major shareholder, management, and minority shareholders.
The Chairman, who is a Non Independent Non Executive Director, heads the Board with an Executive Director and 2 Independent Non Executive Directors.
The Directors together bring a wide range of business, financial, industrial and legal experience to lead the Group in the area of business strategies, performance, utilization of resources and standards of conduct.
Generally, the Executive Director is responsible for carrying out the day to day operational functions while the Non Executive Directors will play the supporting role by contributing their knowledge and experience in the business strategic plans.
Where areas of conflict of interest arise, the Director concerned will have to declare his/her interest and abstain from participating in the decision making process.
C. Board Meetings and Supply of Information.
A Board report is prepared prior to the Board meeting and sufficient notice is given to the Directors to review the papers and agenda for the meeting.
Generally, the Board papers provide information on the operating results, financial, corporate development, minutes of Board Committees and acquisitions and disposals proposals, if any.
In furtherance of the Directors’ duties, all members, either as full Board or in their individual capacities, will have
access to all information of the Group.
Directors are also free to seek independent advice should the need arise and have direct access to the advice and services of the Company Secretary.
13HWA TAI INDUSTRIES BERHAD I Annual Report 2015
BOARD OF DIRECTORS (CONT’D)
C. Board Meetings and Supply of Information. (cont’d)
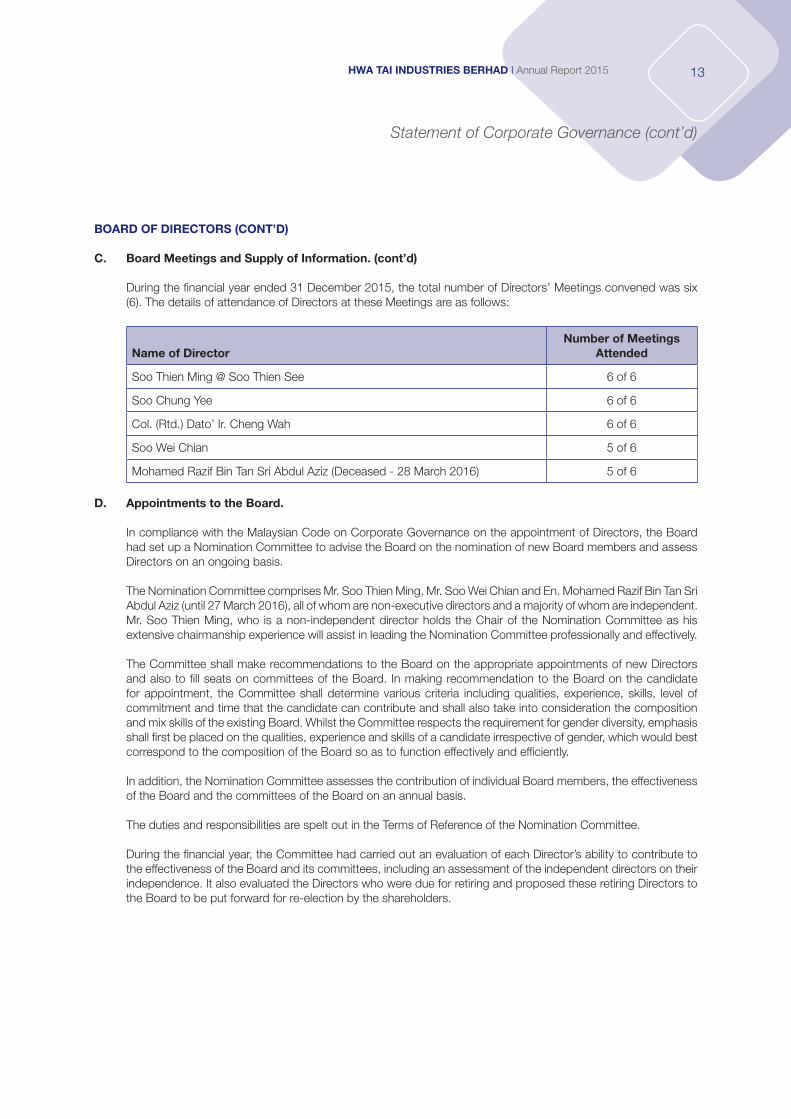
During the financial year ended 31 December 2015, the total number of Directors’ Meetings convened was six (6). The details of attendance of Directors at these Meetings are as follows:
Name of DirectorNumber of Meetings
Attended
Soo Thien Ming @ Soo Thien See 6 of 6
Soo Chung Yee 6 of 6
Col. (Rtd.) Dato’ Ir. Cheng Wah 6 of 6
Soo Wei Chian 5 of 6
Mohamed Razif Bin Tan Sri Abdul Aziz (Deceased - 28 March 2016) 5 of 6
D. Appointments to the Board.
In compliance with the Malaysian Code on Corporate Governance on the appointment of Directors, the Board had set up a Nomination Committee to advise the Board on the nomination of new Board members and assess Directors on an ongoing basis.
The Nomination Committee comprises Mr. Soo Thien Ming, Mr. Soo Wei Chian and En. Mohamed Razif Bin Tan Sri Abdul Aziz (until 27 March 2016), all of whom are non-executive directors and a majority of whom are independent. Mr. Soo Thien Ming, who is a non-independent director holds the Chair of the Nomination Committee as his extensive chairmanship experience will assist in leading the Nomination Committee professionally and effectively.
The Committee shall make recommendations to the Board on the appropriate appointments of new Directors and also to fill seats on committees of the Board. In making recommendation to the Board on the candidate for appointment, the Committee shall determine various criteria including qualities, experience, skills, level of commitment and time that the candidate can contribute and shall also take into consideration the composition and mix skills of the existing Board. Whilst the Committee respects the requirement for gender diversity, emphasis shall first be placed on the qualities, experience and skills of a candidate irrespective of gender, which would best correspond to the composition of the Board so as to function effectively and efficiently.
In addition, the Nomination Committee assesses the contribution of individual Board members, the effectiveness of the Board and the committees of the Board on an annual basis.
The duties and responsibilities are spelt out in the Terms of Reference of the Nomination Committee.
During the financial year, the Committee had carried out an evaluation of each Director’s ability to contribute to the effectiveness of the Board and its committees, including an assessment of the independent directors on their independence. It also evaluated the Directors who were due for retiring and proposed these retiring Directors to the Board to be put forward for re-election by the shareholders.
Statement of Corporate Governance (cont’d)
14
BOARD OF DIRECTORS (CONT’D)
E. Re-election.
In accordance to the Company’s Articles of Association, an election of Directors shall take place each year at an Annual General Meeting and all Directors shall retire from office at least once in every 3 years. In addition, a Director who attains the age over 70 retires at every Annual General Meeting pursuant to the Companies Act, 1965. Directors appointed by the Board are subject to retirement at the next Annual General Meeting held following their appointments in accordance with the Company’s Articles of Association. All retiring Directors are eligible for re-election.
The tenure of an independent director should not exceed a cumulative term of 9 years. Upon completion of the 9 years, the independent director may continue to serve on the Board subject to the director’s re-designation as a non-independent director. The Board must justify and seek shareholders’ approval in the event it retains, as an independent director, a person who has served in that capacity for more than 9 years.
DIRECTORS’ TRAINING
The Nomination Committee is tasked to facilitate Board induction and training programmes.
All the Directors had attended the Mandatory Accreditation Programme.
During the financial year, certain Directors have attended trainings in a various areas to enhance their skills so as to contribute more effectively to the Company. Directors who were unable to attend any formal training during the financial year, are well-informed of the latest developments on the various relevant rules and regulations as all Directors were updated by the Management, by providing them with reading materials on such new developments.
The conferences, seminars and training programmes attended by various Directors during the financial year were as follows:-
• BringingtheBestoutinBoardrooms.• FutureofAuditorReporting–TheGameChangerforBoardroom.• BoardRewards&Recognition.• AcademicsatCentralBankswhodon’tunderstandEconomicProblemswillalwayshaveSolutions.• China:InclusionpathwayanditsimpactonAsiaandemerging-marketmandates.• ForensicAccounting:TheevolutionofShortSellingandAccountingFraud.• Impossibleisjustanopinion:Thestoryofthelongest-everpolarjourneyonfoot.
DIRECTORS’ REMUNERATION
The Board set up the Remuneration Committee to review the policy and make recommendations to the Board on the remuneration package and benefits annually as accorded to the Executive Directors. The Executive Directors shall not participate in the decision makings relating to their own remunerations.
The members of the Remuneration Committee comprises Mr. Soo Thien Ming, Mr. Soo Chung Yee and Mr. Soo Wei Chian, a majority of whom are non-executive directors. Mr. Soo Thien Ming is the Chairman of the Committee.
Fees payable to the Directors are proposed by the Remuneration Committee to the Board who will then recommend for shareholders’ approval at the Annual General Meeting.
Generally, the remuneration package will be structured according to the skills, experience and performance of the Executive Directors to ensure the Group attracts and retains the Directors needed to run the Group successfully, whereas the remuneration package for the Non Executive Directors will hinge on their contribution to the Group in terms of their knowledge and experience.
The breakdown of the Directors’ remuneration including the estimated monetary value of benefit in kind for the financial year under review is disclosed in Note 18(a) to the financial statements.
Statement of Corporate Governance (cont’d)
15HWA TAI INDUSTRIES BERHAD I Annual Report 2015
SHAREHOLDERS
Dialogue between the Group and Investors
The Group recognizes the importance of accountability to the shareholders and as such conveys information on the Group’s performance, directions, other matters of interest to the shareholders by way of annual reports, relevant circulars, public announcements, the Company’s website and the issuance of press releases.
Annual General Meeting
Annual General Meeting is used as a primary mode of communication to report on the Group’s performance. Notice of Annual General Meeting is issued at least 21 days before the date of meeting.
At the Annual General Meeting, shareholders are encouraged to raise any questions pertaining to any issues regarding the Group.
The Chairman, assisted by the Directors are available to answer any queries and discuss matters pertaining to the business activities of the Group.
Where appropriate, the Chairman shall put substantive resolutions to vote by poll, and the results of such votes shall be announced to the public detailing the number of votes cast for and against.
ACCOUNTABILITY AND AUDIT
Financial Reporting
In preparing the annual financial statements and quarterly financial results, the Directors take steps to ensure a clear, balanced and understandable assessment of the Group’s positions and prospects.
The Audit Committee is tasked to review and recommend for Board approval the Group’s annual financial statements and quarterly financial results.
The Statement by Directors pursuant to section 169 of the Companies Act, 1965 is set out on page 94 of this Annual Report.
Risk Management and Internal Controls
The Board recognizes its responsibilities to maintain a sound system of risk management and internal controls to safeguard shareholders’ investment and Group’s assets.
The review of the system of risk management and internal controls is set out under the Statement on Risk Management and Internal Controls set out on pages 17 and 18 of this Annual Report. The Statement on Risk Management and Internal Controls had been reviewed by the external auditors.
Statement of Corporate Governance (cont’d)
16
ACCOUNTABILITY AND AUDIT (CONT’D)
Audit Committee / Relationship with Auditors.
The Audit Committee works closely with the external auditors and maintains a transparent professional relationship with them.
A summary of the activities of the Audit Committee during the year are set out in the Audit Committee Report on pages 8 to 11 of this Annual Report.
Ethical Conduct and Sustainability
Employees are introduced to the ethical corporate culture of the Group during employee induction and thereafter, employees are constantly monitored to ensure the culture is upheld in their dealings within the Group and also in their association with our customers, distributors, suppliers, governmental and regulatory authorities and other business associates. Any employee may report directly to the Chairman of any ethical misconduct discovered within the Group.
The Group consistently conducts its business in a manner which underpins sustainability.
A written code of conduct on ethical standards and a formal policy on promoting sustainability are currently being established.
Statement of Corporate Governance (cont’d)
17HWA TAI INDUSTRIES BERHAD I Annual Report 2015
Statement of Risk Managementand Internal Controls
INTRODUCTION
The Board of Directors of Hwa Tai Industries Berhad (“HTIB”) is pleased to present its Statement of Risk Management and Internal Controls for the financial year ended 31 December 2015, which has been prepared pursuant to paragraph 15.26(b) of Bursa Malaysia Securities Berhad (“Bursa Securities”) Main Market Listing Requirements and guided by the Statement on Risk Management and Internal Control: Guidelines for Directors of Listed Issues.
BOARD RESPONSIBILITY
The Board of Directors recognises its overall responsibility for maintaining the Group’s system of Risk Management and Internal Controls to safeguard shareholders’ investment and the Group’s assets, as well as for regularly reviewing the adequacy and integrity of the internal control system. Due to limitations inherent in any system of internal control, it is important to note that the system is designed to manage rather than eliminate risk of failure to achieve corporate objectives. Therefore, the system can only provide reasonable and not absolute assurance against material misstatement or loss.
The Board has received verbal assurance from the Group Chief Executive Director and Financial Controller that, to their best knowledge and belief, the Group’s risk management and internal control system is operating adequately and effectively, in all material aspects, based on the risk management and internal control system of the Group.
RISK MANAGEMENT
The Board also recognises that risk management should be an integral part of the Group culture and is a continuous on going process of identifying, evaluating, minimising and managing of significant risk faced by the Group. The management is responsible for creating risk awareness culture and to build the necessary environment for effective risk management. In addition, the Heads of Department are responsible for managing the risk of their department on a day to day basis. Significant issues related to risk management and internal controls are highlighted to the Board. If deemed necessary, assistance from external parties shall be consulted on issues in which the Board needs to seek an opinion.
KEY ELEMENTS OF INTERNAL CONTROLS
Key elements of the Group’s internal controls that have been in place for the financial year which include the following:
1. The Group has a well defined organisation structure with clear lines of reporting, responsibilities and level of authority.
2. There are clear definition of authorisation procedures for major operating functions including purchases, capital expenditures, payments, credit control and stock control. Authority of the Directors is required for key treasury matters which include loan and trade financing, cheque signatories and opening of bank accounts.
3. There is a budgeting and business planning process in each financial year to establish plans and targets for each operating units. The performance of each operating unit is monitored through monthly reports.
4. The Group’s management team meets at least once a month to review and monitor the business development, discuss and resolve key operational and management issues and review the performance against the business plan and budget for each operating units within the Group.
The management also highlights any significant issues and changes in the business, major policy matters, external environment affecting the Group and financial performance of each operating unit to the Board of Directors and Audit Committee when the Board and Committee meet quarterly.
5. Adequate financial and operational information systems are in place to capture and present timely and pertinent business information.
18
KEY ELEMENTS OF INTERNAL CONTROLS (CONT’D)
6. The Audit Committee reviews the quarterly financial results and yearly audited financial statements prior to the approval by the Board of Directors.
7. The Audit Committee also reviews the internal auditor’s reports and monitors the status of the implementation of corrective actions to address internal control weaknesses.
8. In addition to the internal controls, the Board of Directors and management have ensured that safety and health regulations have been considered and complied with.
9. The Company was accredited ISO 9002 since 1996 and upgraded to MS ISO 9001:2008 quality management systems since year 2010. Documented internal procedures and standard operating procedures have been put in place and surveillance audits are conducted by the assessors of the ISO certification body to ensure that the system is adequately implemented.
10. Emphasis is given to food safety. The Company was accredited the Hazard Analysis Critical Control Point (HACCP) system certification since year 2000 and upgraded to Integrated Quality Management & HACCP System certificate since 2002. Good Manufacturing Practice is documented and practiced to ensure food safety.
11. In ensuring each operating unit is functioning efficiently, much emphasis is placed on personnel employed. The professionalism and competence of the staff are maintained through a structural recruitment process, performance appraisal system and wide variety of training and development programs.
As required by Paragraph 15.23 of Bursa Securities Listing Requirements, the External Auditors have conducted a limited assurance engagement on this Statement on Risk Management and Internal Controls. Their limited assurance engagement was performed in accordance with ISAE3000, Assurance Engagement other than Audits or Review of Historical Financial Information and Recommended Practice Guide (“RPG”) 5, Guidance for Auditors on the Review of Directors’ Statement on Internal Control included in the Annual Report.
Based on their procedures performed, the External Auditors have reported to the Board that nothing has come to their attention that causes them to believe that this statement is not prepared, in all material aspects, in accordance with disclosure required by paragraphs 41 and 42 of the Statement of Risk Management and Internal Controls: Guidance for Directors of Listed Issuers to be set out, nor is factually inaccurate. RPG 5 does not require the External Auditors to consider whether this Statement covers all risks and controls, or to form an opinion on the adequacy and effectiveness of the Group’s risk and control system.
Statement of Risk Management and Internal Controls (cont’d)
19HWA TAI INDUSTRIES BERHAD I Annual Report 2015
Directors’ Responsibility Statementand Other Information
DIRECTORS’ RESPONSIBILITY STATEMENT
The Board of Directors is required under Paragraph 15.26(a) of the Listing Requirements of the Bursa Malaysia Securities Berhad (“Bursa Malaysia”) to issue a statement explaining their responsibility for preparing the annual audited financial statements.
The Directors are required by law to prepare financial statements for each financial year which give a true and fair view of the state of affairs of the Company and of the Group as at the financial year end and of the results and cashflows of the Company and of the Group for the financial year then ended.
The Directors consider that, in preparing the financial statements of the Company and of the Group for the financial year ended 31 December 2015 as set out herein on pages 27 to 92 of this Annual Report, the Company and the Group have used appropriate accounting policies, consistently applied and supported by reasonable and prudent judgements and estimates. The Directors also consider that all applicable approved accounting standards have been followed in respect of the preparation of the financial statements.
The Directors are responsible for ensuring that the Company keeps accounting records which disclose with reasonable accuracy at any time the financial position of the Company and which enable them to ensure that the financial statements comply with the provisions of the Companies Act, 1965.
The Directors are also responsible for taking such steps that are reasonably open to them to safeguard the assets of the Group and to prevent and detect fraud and other irregularities.
OTHER INFORMATION
Sanctions and/or Penalties
There were no sanctions and/or penalties imposed on the Company and its subsidiaries, Directors or management by any relevant regulatory bodies during the financial year.
Material Contracts
There were no material contracts entered into by the Company and its subsidiaries involving Directors and major shareholders’ interests, either still subsisting at the end of the financial year end or entered into since the end of the previous financial year end.
Non-Audit Fees
The amount of non-audit fees incurred for services rendered to the Group by the Auditors, Messrs. Baker Tilly Monteiro Heng, or a firm or corporation affiliated to them totalled approximately RM20,900.00 during the financial year.
20
OTHER INFORMATION (CONT’D)
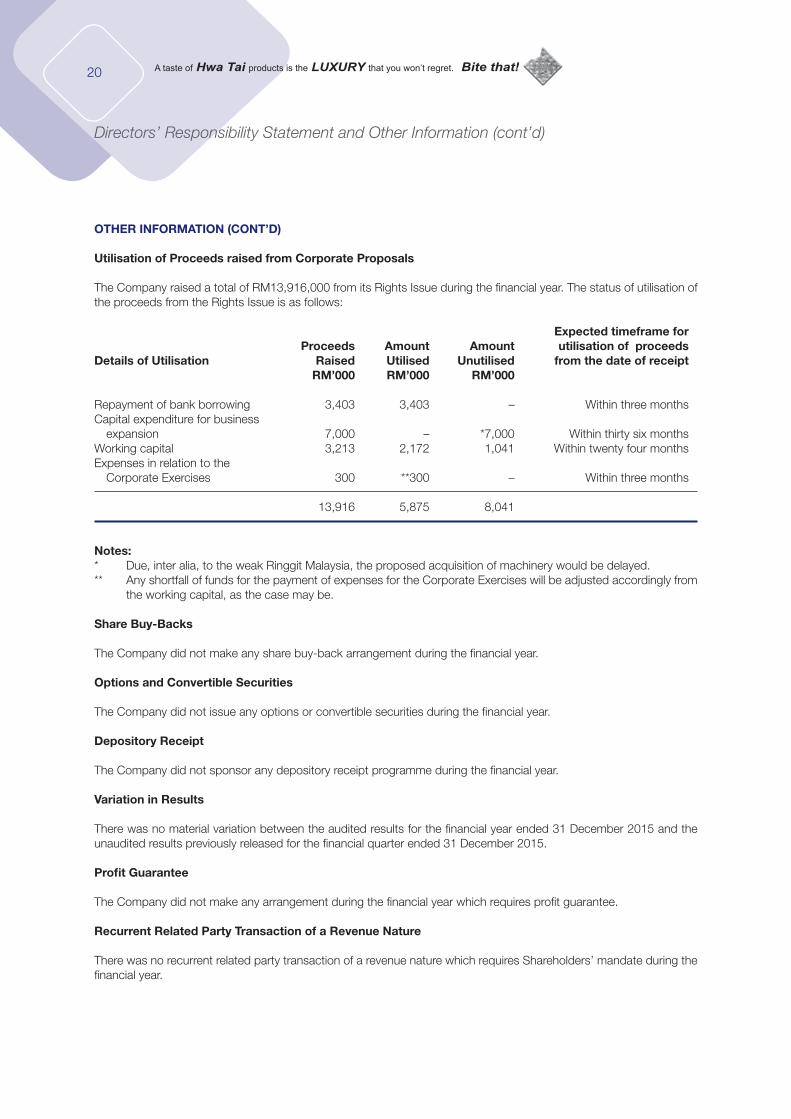
Utilisation of Proceeds raised from Corporate Proposals
The Company raised a total of RM13,916,000 from its Rights Issue during the financial year. The status of utilisation of the proceeds from the Rights Issue is as follows:
Expected timeframe for Proceeds Amount Amount utilisation of proceedsDetails of Utilisation Raised Utilised Unutilised from the date of receipt RM’000 RM’000 RM’000
Repayment of bank borrowing 3,403 3,403 – Within three monthsCapital expenditure for business expansion 7,000 – *7,000 Within thirty six monthsWorking capital 3,213 2,172 1,041 Within twenty four monthsExpenses in relation to the Corporate Exercises 300 **300 – Within three months
13,916 5,875 8,041
Notes:* Due, inter alia, to the weak Ringgit Malaysia, the proposed acquisition of machinery would be delayed.** Any shortfall of funds for the payment of expenses for the Corporate Exercises will be adjusted accordingly from
the working capital, as the case may be.
Share Buy-Backs
The Company did not make any share buy-back arrangement during the financial year.
Options and Convertible Securities
The Company did not issue any options or convertible securities during the financial year.
Depository Receipt
The Company did not sponsor any depository receipt programme during the financial year.
Variation in Results
There was no material variation between the audited results for the financial year ended 31 December 2015 and the unaudited results previously released for the financial quarter ended 31 December 2015.
Profit Guarantee
The Company did not make any arrangement during the financial year which requires profit guarantee.
Recurrent Related Party Transaction of a Revenue Nature
There was no recurrent related party transaction of a revenue nature which requires Shareholders’ mandate during the financial year.
Directors’ Responsibility Statement and Other Information (cont’d)
21HWA TAI INDUSTRIES BERHAD I Annual Report 2015
Chairman’s Statement
Dear Shareholders,
On behalf of the Board of Directors, I am pleased to present the Annual Report and the Audited Financial Statements of Hwa Tai Industries Berhad and its group of companies for the financial year ended 31 December 2015.
BUSINESS ENVIRONMENT IN 2015
The Group operated in yet another year of challenging global business environment in 2015 which to a large extent had been reinforced by the significantly higher degree of uncertainties prevailing the world. These uncertainties included insecurity about the prospects for global growth in the aftermath of the global financial crisis and volatility in prices of commodity which have impacted market sentiment and confidence.
FINANCIAL REVIEW
Relying on strong fundamentals in its operations and resilience, the Group improved in its performance amidst the difficult global economic background.
The Group recorded an improved revenue of RM66.34 million as compared to RM61.33 million in the preceding year. The increase in revenue was contributed by better sales from both the domestic and international markets.
A profit after tax of RM0.32 million was registered for the Group against a loss after tax of RM2.44 million in the preceding year. The improved results was mainly due to higher margin resulted from an increase in revenue both from domestic and international markets and also contributed by interest income earned on deposits placed with financial institutions.
CORPORATE DEVELOPMENT
The Company’s following corporate exercises were fully completed on 14 April 2015:-
1. The reduction of the issued and paid-up share capital of the Company pursuant to Section 64(1) of the Companies Act, 1965 involving the cancellation of RM0.60 of the par value of each ordinary share of RM1.00 in the Company. As such, the par value of each existing ordinary share in the Company has been reduced from RM1.00 to RM0.40 each (“Par Value Reduction”);
2. The amendment to the Memorandum of Association of the Company to facilitate the Par Value Reduction;
3. The renounceable rights issue of up to 60,063,600 new shares of the Company of RM0.40 each (Rights Shares) at an issue price of RM0.40 per Rights Shares on the basis of three (3) Rights Shares for every two (2) existing shares of the Company held after the Par Value Reduction based on a minimum subscription level of 30,031,800 Rights Shares (“Rights Issue”); and
4. The exemption to the major shareholder, Mr. Soo Thien Ming @ Soo Thien See (Mr. Soo) and persons acting in concert with Mr. Soo (PACS) from the obligation to undertake a mandatory take-over offer to acquire all the remaining shares of the Company not already owned by Mr. Soo and his PACS upon completion of the Rights Issue pursuant to Practice Note 9, Paragraph 16.1 of the Malaysian Code on Take-Overs and Mergers 2010.
22
CORPORATE DEVELOPMENT (CONT’D)
Funds raised from the Rights Issue, which was approximately 57.92% subscribed, amounted to RM13,916,348.00. Arising from the corporate exercises, the current issued and paid-up share capital of the Company stands at RM29,933,308.00 comprising 74,833,270 ordinary shares of RM0.40 each.
On 9 November 2015, the Company announced the purchase of a new wholly-owned subsidiary, Absolute Palmers Food Sdn. Bhd., comprising 2 ordinary shares of RM1/- each at par for a total cash consideration of RM2/-. The intended principal activity of Absolute Palmers Food Sdn. Bhd. is the trading of confectionery.
CORPORATE SOCIAL RESPONSIBILITY
Despite the economic downturn, the Company continued to provide product sponsorships to various sectors of society particularly school children and organisations which promote sports, as part of the Company’s corporate social responsibility efforts.
OUTLOOK AND FUTURE PROSPECTS FOR 2016
Looking ahead, medium-term prospects for the global economy remain on bumpy road. Although a modest recovery is expected in advanced economies, a more protracted slowdown across large emerging markets amid weakening commodity prices, global trade and capital flows could have substantial spillovers to other developing economies, and eventually hold back the recovery in advanced economies.
Malaysia’s 2016 economic growth rate is expected to remain challenging, fueled by the volatility of the global financial market, the drop in commodity prices and the strengthening US dollar. Private consumption faces headwinds from slumping consumer confidence, slowing growth in credit to households as well as signs of softening in the labour market.
Amidst these challenges, we will continue to push for increased productivity and improvements in operational efficiency.
ACKNOWLEDGEMENT
It is with sadness to note the recent demise of our loyal Board member, Encik Mohamed Razif Bin Tan Sri Abdul Aziz, who had served the Company as Independent Director for 10 years. All of us at Hwa Tai will always remember his valuable contributions to the Company. On behalf of the Board, I also take this opportunity to convey our gratitude to all stakeholders including employees, shareholders, customers, distributors, business associates, financiers, suppliers and governmental and regulatory authorities for their unwavering support of the Group.
SOO THIEN MING @ SOO THIEN SEEChairman
8 April 2016
Chairman’s Statement (cont’d)
23HWA TAI INDUSTRIES BERHAD I Annual Report 2015
The directors hereby submit their report together with the audited financial statements of Hwa Tai Industries Berhad (“the Company”) and its subsidiary companies (“the Group”) for the financial year ended 31st December 2015.
PRINCIPAL ACTIVITIES
The principal activities of the Company are that of a biscuit manufacturer and investment holding. The principal activities of the subsidiary companies are disclosed in Note 7 to the financial statements.
There have been no significant changes in the nature of these principal activities during the financial year.
RESULTS
Group Company RM RM
Profits for the financial year attributable to: Owners of the Company 322,382 327,363 Non-controlling interest 1,714 –
324,096 327,363
DIVIDENDS
No dividend was paid or declared by the Company since the end of the previous financial year.
The directors do not recommend the payment of any dividends in respect of the financial year ended 31st December 2015.
RESERVES AND PROVISIONS
All material transfers to and from reserves and provisions during the financial year have been disclosed in the financial statements.
BAD AND DOUBTFUL DEBTS
Before the statements of profit or loss and other comprehensive income and statements of financial position of the Group and of the Company were made out, the directors took reasonable steps to ascertain that proper action had been taken in relation to the writing off of bad debts and the making of allowance for doubtful debts, and had satisfied themselves that all known bad debts had been written off and adequate allowance had been made for doubtful debts.
At the date of this report, the directors are not aware of any circumstances which would render the amount written off for bad debts or the amount of the allowance for doubtful debts, in the financial statements of the Group and of the Company inadequate to any substantial extent.
Directors’ Report
24
CURRENT ASSETS
Before the statements of profit or loss and other comprehensive income and statements of financial position of the Group and of the Company were made out, the directors took reasonable steps to ensure that any current assets, other than debts, which were unlikely to be realised in the ordinary course of business, their values as shown in the accounting records of the Group and of the Company had been written down to an amount that they might be expected to be realised.
At the date of this report, the directors are not aware of any circumstances that would render the values attributed to the current assets in the financial statements of the Group and of the Company misleading.
VALUATION METHODS
At the date of this report, the directors are not aware of any circumstances which have arisen which render adherence to the existing methods of valuation of assets or liabilities of the Group and of the Company misleading or inappropriate.
CONTINGENT AND OTHER LIABILITIES
At the date of this report, there does not exist:-
(i) any charge on the assets of the Group and of the Company that has arisen since the end of the financial year which secures the liabilities of any other person, or
(ii) any contingent liabilities in respect of the Group and of the Company that has arisen since the end of the financial year.
No contingent liabilities or other liabilities of the Group and of the Company have become enforceable, or is likely to become enforceable within the period of twelve months after the end of the financial year which, in the opinion of the directors, will or may substantially affect the ability of the Group and of the Company to meet their obligations as and when they fall due.
CHANGE OF CIRCUMSTANCES
At the date of this report, the directors are not aware of any circumstances, not otherwise dealt with in this report or the financial statements of the Group and of the Company that would render any amount stated in the financial statements misleading.
ITEMS OF AN UNUSUAL NATURE
In the opinion of the directors,
(i) The results of the operations of the Group and of the Company for the financial year were not substantially affected by any item, transaction or event of a material and unusual nature.
(ii) No item, transaction or event of a material and unusual nature has arisen in the interval between the end of the financial year and the date of this report which is likely to affect substantially the results of the operations of the Group and of the Company for the financial year in which this report is made.
Directors’ Report (cont’d)
25HWA TAI INDUSTRIES BERHAD I Annual Report 2015
ISSUE OF SHARES AND DEBENTURES
During the financial year, the Company
a) changed its authorised share capital from 1,000,000,000 ordinary shares of RM1.00 each to 2,500,000,000 ordinary shares of RM0.40 each as a result of the par value reduction;
b) reduced the issued and paid up capital of the Company via the cancellation of RM0.60 of the par value of each existing ordinary share of RM1.00 each; and
c) issued 34,790,870 new ordinary shares of RM0.40 each at a price of RM0.40 per ordinary share via rights issue on the basis of three (3) rights share for every two (2) existing ordinary shares held by existing shareholders after par value reduction.
The new ordinary shares issued during the financial year ranked pari-passu in all respects with the existing ordinary shares of the Company.
The Company did not issue any debentures during the financial year.
DIRECTORS
The names of the directors of the Company in office since the date of the last report and at the date of this report are:-
Soo Thien Ming @ Soo Thien SeeSoo Chung YeeCol. (Rtd.) Dato’ Ir. Cheng Wah Soo Wei Chian Mohamed Razif Bin Tan Sri Abdul Aziz (Deceased on 28th March 2016)
DIRECTORS’ INTERESTS
According to the register of directors’ shareholdings kept by the Company under Section 134 of the Companies Act, 1965 in Malaysia, the interests of those directors who held office at the end of the financial year in shares in the Company during the financial year ended 31st December 2015 are as follows:-
Number of ordinary shares of RM0.40/- each At At 1.1.2015 Subscribed Sold 31.12.2015
The CompanyDirect interests
Soo Thien Ming @ Soo Thien See 12,379,827 18,569,740 – 30,949,567 Col. (Rtd.) Dato’ Ir. Cheng Wah 20,000 30,000 – 50,000
Soo Thien Ming @ Soo Thien See is deemed to have an interest in the shares held by the Company in its subsidiary companies by virtue of his controlling interest in the Company.
Other than as disclosed above, none of the other directors in office at the end of the financial year had any interest in shares in the Company or its related corporations during the financial year.
Directors’ Report (cont’d)
26
DIRECTORS’ BENEFITS
Since the end of the previous financial year, no director of the Company has received or become entitled to receive a benefit (other than benefits included in the aggregate amount of emoluments received or due and receivable by the directors of the Company as shown in Note 18 to the financial statements) by reason of a contract made by the Company or a related corporation with the director or with a firm of which the director is a member, or with a company in which the director has a substantial financial interest, except for any deemed benefits which may arise from transactions entered into in the ordinary cause of business as disclosed in Note 21 to the financial statements.
Neither during nor at the end of the financial year was the Company or any of its related corporations a party to any arrangement, whose object was to enable the directors to acquire benefits by means of the acquisition of shares in, or debentures of, the Company or any other body corporate.
AUDITORS
The auditors, Messrs. Baker Tilly Monteiro Heng, have expressed their willingness to continue in office.
On behalf of the Board,
SOO THIEN MING @ SOO THIEN SEEDirector
SOO CHUNG YEEDirector
Kuala Lumpur
Date: 8th April 2016
Directors’ Report (cont’d)
27HWA TAI INDUSTRIES BERHAD I Annual Report 2015
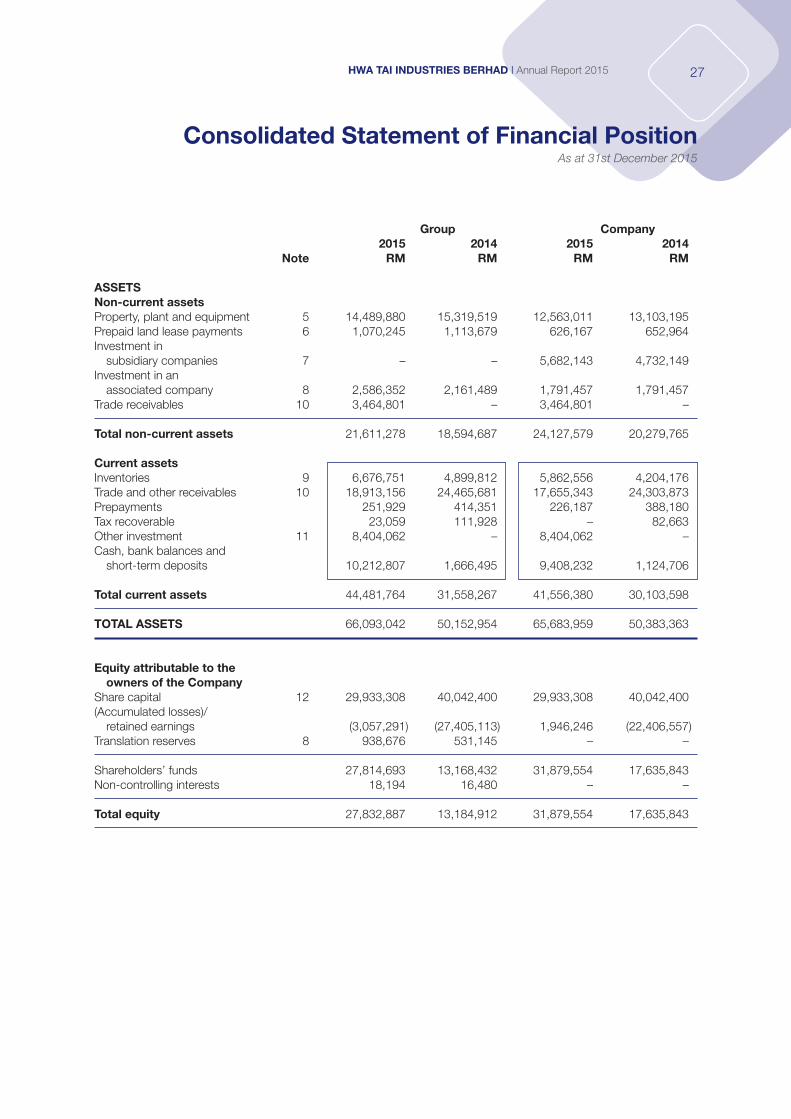
Consolidated Statement of Financial PositionAs at 31st December 2015
Group Company 2015 2014 2015 2014 Note RM RM RM RM
ASSETSNon-current assetsProperty, plant and equipment 5 14,489,880 15,319,519 12,563,011 13,103,195 Prepaid land lease payments 6 1,070,245 1,113,679 626,167 652,964 Investment in subsidiary companies 7 – – 5,682,143 4,732,149 Investment in an associated company 8 2,586,352 2,161,489 1,791,457 1,791,457 Trade receivables 10 3,464,801 – 3,464,801 –
Total non-current assets 21,611,278 18,594,687 24,127,579 20,279,765
Current assetsInventories 9 6,676,751 4,899,812 5,862,556 4,204,176 Trade and other receivables 10 18,913,156 24,465,681 17,655,343 24,303,873 Prepayments 251,929 414,351 226,187 388,180 Tax recoverable 23,059 111,928 – 82,663Other investment 11 8,404,062 – 8,404,062 –Cash, bank balances and short-term deposits 10,212,807 1,666,495 9,408,232 1,124,706
Total current assets 44,481,764 31,558,267 41,556,380 30,103,598
TOTAL ASSETS 66,093,042 50,152,954 65,683,959 50,383,363
Equity attributable to the owners of the CompanyShare capital 12 29,933,308 40,042,400 29,933,308 40,042,400 (Accumulated losses)/ retained earnings (3,057,291) (27,405,113) 1,946,246 (22,406,557)Translation reserves 8 938,676 531,145 – –
Shareholders’ funds 27,814,693 13,168,432 31,879,554 17,635,843Non-controlling interests 18,194 16,480 – –
Total equity 27,832,887 13,184,912 31,879,554 17,635,843
28
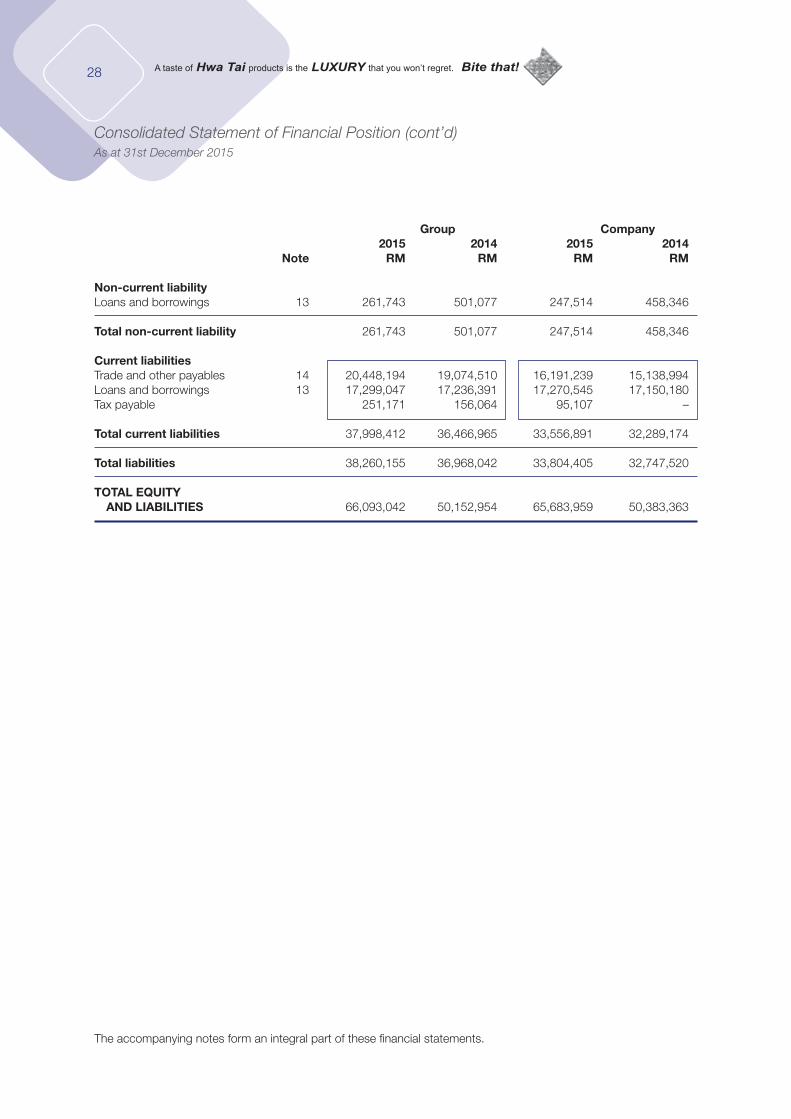
Group Company 2015 2014 2015 2014 Note RM RM RM RM
Non-current liabilityLoans and borrowings 13 261,743 501,077 247,514 458,346
Total non-current liability 261,743 501,077 247,514 458,346
Current liabilitiesTrade and other payables 14 20,448,194 19,074,510 16,191,239 15,138,994 Loans and borrowings 13 17,299,047 17,236,391 17,270,545 17,150,180 Tax payable 251,171 156,064 95,107 –
Total current liabilities 37,998,412 36,466,965 33,556,891 32,289,174
Total liabilities 38,260,155 36,968,042 33,804,405 32,747,520
TOTAL EQUITY AND LIABILITIES 66,093,042 50,152,954 65,683,959 50,383,363
The accompanying notes form an integral part of these financial statements.
Consolidated Statement of Financial Position (cont’d)As at 31st December 2015
29HWA TAI INDUSTRIES BERHAD I Annual Report 2015
The accompanying notes form an integral part of these financial statements.
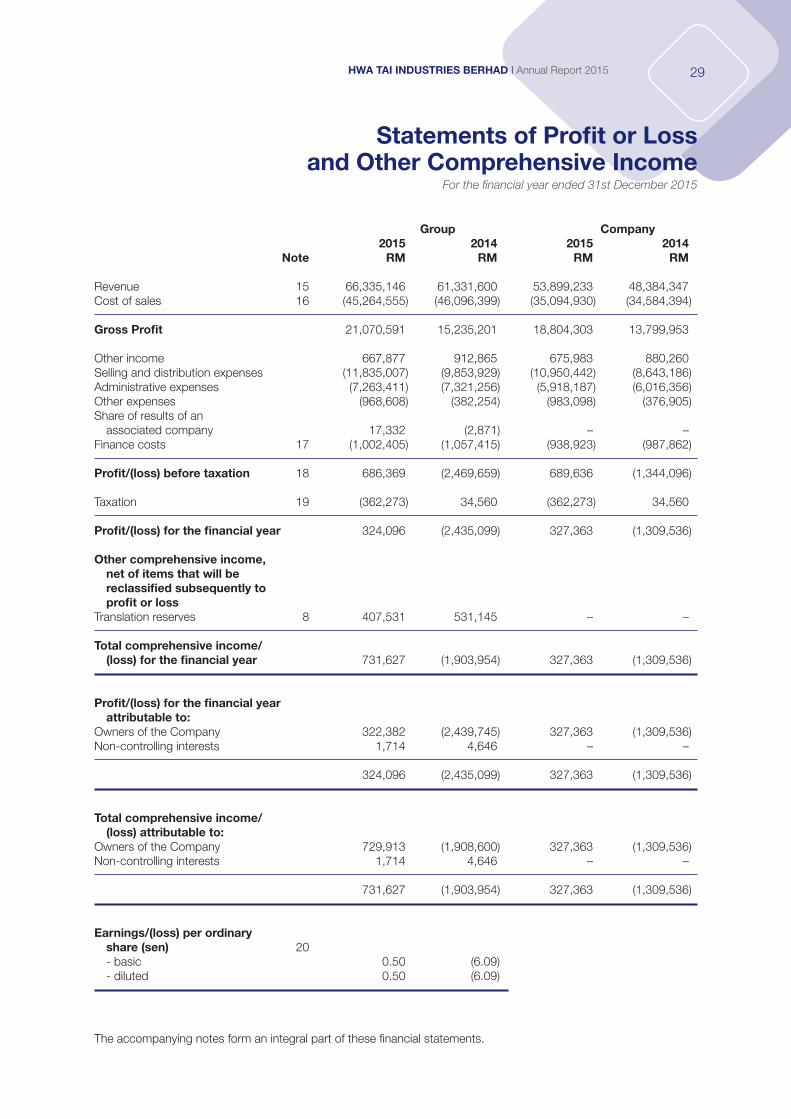
Statements of Profit or Lossand Other Comprehensive Income
For the financial year ended 31st December 2015
Group Company 2015 2014 2015 2014 Note RM RM RM RM
Revenue 15 66,335,146 61,331,600 53,899,233 48,384,347 Cost of sales 16 (45,264,555) (46,096,399) (35,094,930) (34,584,394)
Gross Profit 21,070,591 15,235,201 18,804,303 13,799,953
Other income 667,877 912,865 675,983 880,260 Selling and distribution expenses (11,835,007) (9,853,929) (10,950,442) (8,643,186)Administrative expenses (7,263,411) (7,321,256) (5,918,187) (6,016,356)Other expenses (968,608) (382,254) (983,098) (376,905)Share of results of an associated company 17,332 (2,871) – –Finance costs 17 (1,002,405) (1,057,415) (938,923) (987,862)
Profit/(loss) before taxation 18 686,369 (2,469,659) 689,636 (1,344,096)
Taxation 19 (362,273) 34,560 (362,273) 34,560
Profit/(loss) for the financial year 324,096 (2,435,099) 327,363 (1,309,536)
Other comprehensive income, net of items that will be reclassified subsequently to profit or lossTranslation reserves 8 407,531 531,145 – –
Total comprehensive income/ (loss) for the financial year 731,627 (1,903,954) 327,363 (1,309,536)
Profit/(loss) for the financial year attributable to:Owners of the Company 322,382 (2,439,745) 327,363 (1,309,536)Non-controlling interests 1,714 4,646 – –
324,096 (2,435,099) 327,363 (1,309,536)
Total comprehensive income/ (loss) attributable to: Owners of the Company 729,913 (1,908,600) 327,363 (1,309,536)Non-controlling interests 1,714 4,646 – –
731,627 (1,903,954) 327,363 (1,309,536)
Earnings/(loss) per ordinary share (sen) 20 - basic 0.50 (6.09) - diluted 0.50 (6.09)
30
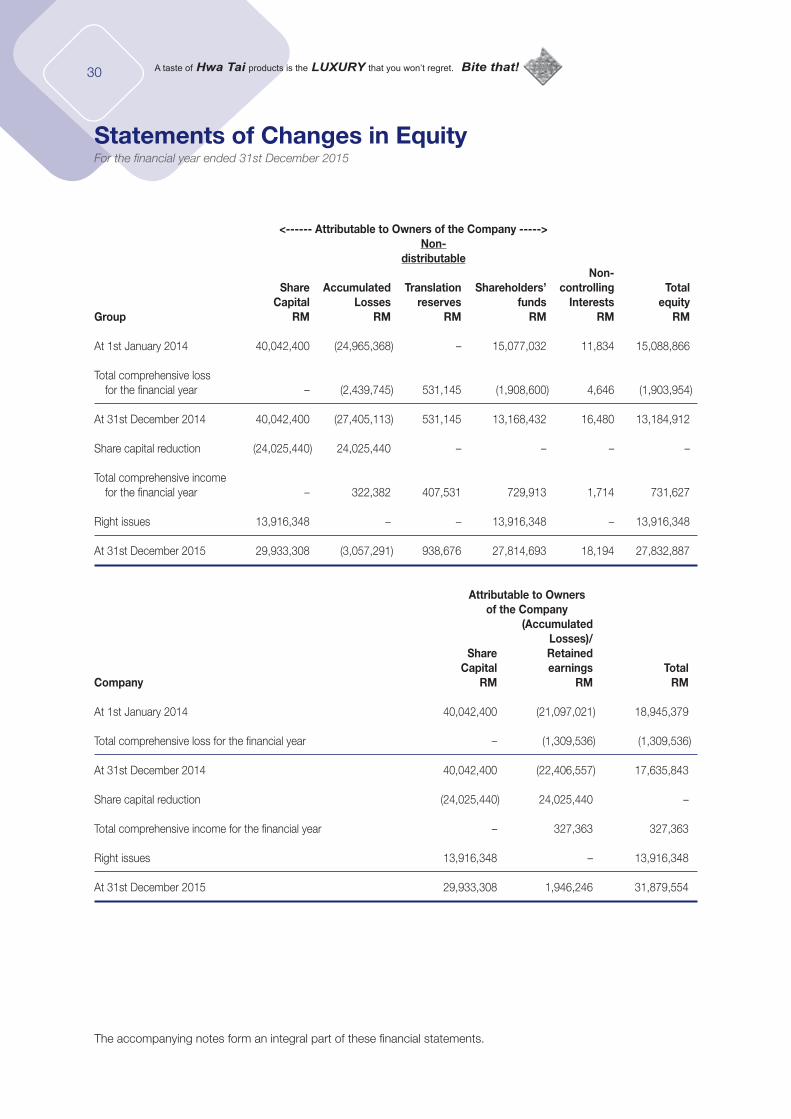
Statements of Changes in EquityFor the financial year ended 31st December 2015
<------ Attributable to Owners of the Company -----> Non- distributable Non- Share Accumulated Translation Shareholders’ controlling Total Capital Losses reserves funds Interests equity Group RM RM RM RM RM RM
At 1st January 2014 40,042,400 (24,965,368) – 15,077,032 11,834 15,088,866
Total comprehensive loss for the financial year – (2,439,745) 531,145 (1,908,600) 4,646 (1,903,954)
At 31st December 2014 40,042,400 (27,405,113) 531,145 13,168,432 16,480 13,184,912
Share capital reduction (24,025,440) 24,025,440 – – – –
Total comprehensive income for the financial year – 322,382 407,531 729,913 1,714 731,627
Right issues 13,916,348 – – 13,916,348 – 13,916,348
At 31st December 2015 29,933,308 (3,057,291) 938,676 27,814,693 18,194 27,832,887
Attributable to Owners of the Company (Accumulated Losses)/ Share Retained Capital earnings Total Company RM RM RM
At 1st January 2014 40,042,400 (21,097,021) 18,945,379 Total comprehensive loss for the financial year – (1,309,536) (1,309,536)
At 31st December 2014 40,042,400 (22,406,557) 17,635,843
Share capital reduction (24,025,440) 24,025,440 –
Total comprehensive income for the financial year – 327,363 327,363
Right issues 13,916,348 – 13,916,348
At 31st December 2015 29,933,308 1,946,246 31,879,554
The accompanying notes form an integral part of these financial statements.
31HWA TAI INDUSTRIES BERHAD I Annual Report 2015
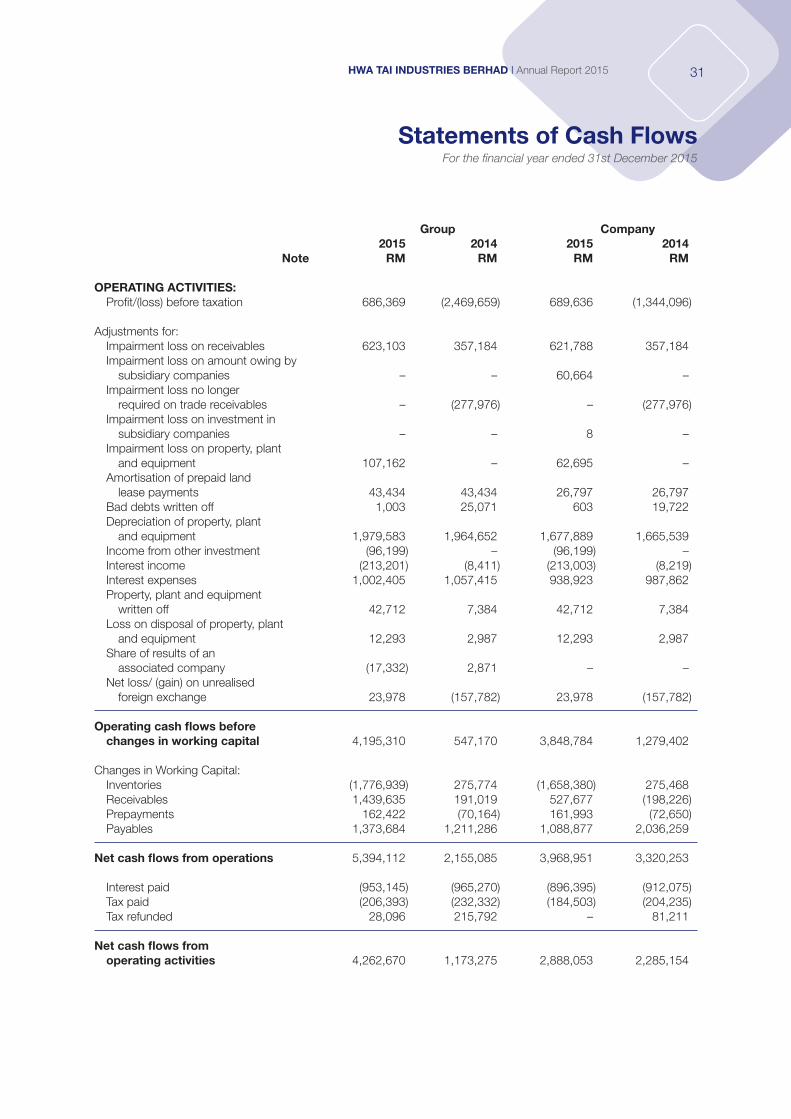
Statements of Cash FlowsFor the financial year ended 31st December 2015
Group Company 2015 2014 2015 2014 Note RM RM RM RM
OPERATING ACTIVITIES: Profit/(loss) before taxation 686,369 (2,469,659) 689,636 (1,344,096) Adjustments for: Impairment loss on receivables 623,103 357,184 621,788 357,184 Impairment loss on amount owing by subsidiary companies – – 60,664 – Impairment loss no longer required on trade receivables – (277,976) – (277,976) Impairment loss on investment in subsidiary companies – – 8 – Impairment loss on property, plant and equipment 107,162 – 62,695 – Amortisation of prepaid land lease payments 43,434 43,434 26,797 26,797 Bad debts written off 1,003 25,071 603 19,722 Depreciation of property, plant and equipment 1,979,583 1,964,652 1,677,889 1,665,539 Income from other investment (96,199) – (96,199) – Interest income (213,201) (8,411) (213,003) (8,219) Interest expenses 1,002,405 1,057,415 938,923 987,862 Property, plant and equipment written off 42,712 7,384 42,712 7,384 Loss on disposal of property, plant and equipment 12,293 2,987 12,293 2,987 Share of results of an associated company (17,332) 2,871 – – Net loss/ (gain) on unrealised foreign exchange 23,978 (157,782) 23,978 (157,782)
Operating cash flows before changes in working capital 4,195,310 547,170 3,848,784 1,279,402
Changes in Working Capital: Inventories (1,776,939) 275,774 (1,658,380) 275,468 Receivables 1,439,635 191,019 527,677 (198,226) Prepayments 162,422 (70,164) 161,993 (72,650) Payables 1,373,684 1,211,286 1,088,877 2,036,259
Net cash flows from operations 5,394,112 2,155,085 3,968,951 3,320,253
Interest paid (953,145) (965,270) (896,395) (912,075) Tax paid (206,393) (232,332) (184,503) (204,235) Tax refunded 28,096 215,792 – 81,211
Net cash flows from operating activities 4,262,670 1,173,275 2,888,053 2,285,154
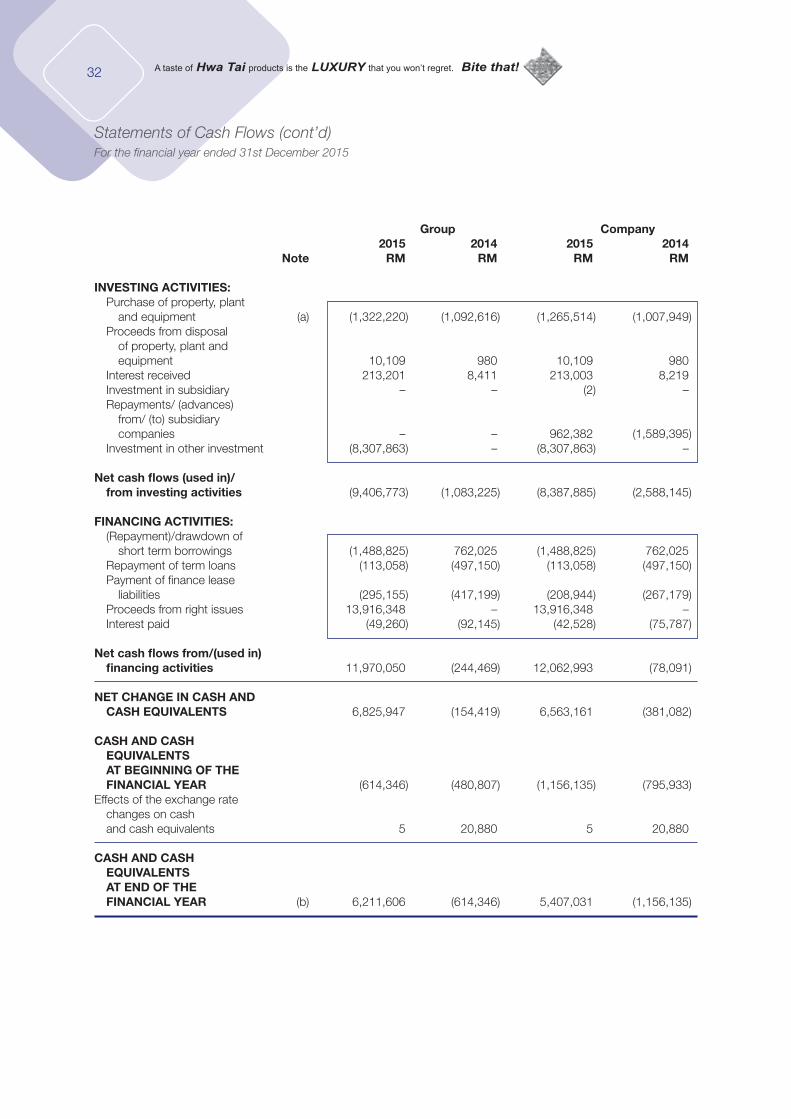
32
Group Company 2015 2014 2015 2014 Note RM RM RM RM INVESTING ACTIVITIES: Purchase of property, plant and equipment (a) (1,322,220) (1,092,616) (1,265,514) (1,007,949) Proceeds from disposal of property, plant and equipment 10,109 980 10,109 980 Interest received 213,201 8,411 213,003 8,219 Investment in subsidiary – – (2) – Repayments/ (advances) from/ (to) subsidiary companies – – 962,382 (1,589,395) Investment in other investment (8,307,863) – (8,307,863) –
Net cash flows (used in)/ from investing activities (9,406,773) (1,083,225) (8,387,885) (2,588,145)
FINANCING ACTIVITIES: (Repayment)/drawdown of short term borrowings (1,488,825) 762,025 (1,488,825) 762,025 Repayment of term loans (113,058) (497,150) (113,058) (497,150) Payment of finance lease liabilities (295,155) (417,199) (208,944) (267,179) Proceeds from right issues 13,916,348 – 13,916,348 – Interest paid (49,260) (92,145) (42,528) (75,787)
Net cash flows from/(used in) financing activities 11,970,050 (244,469) 12,062,993 (78,091)
NET CHANGE IN CASH AND CASH EQUIVALENTS 6,825,947 (154,419) 6,563,161 (381,082)
CASH AND CASH EQUIVALENTS AT BEGINNING OF THE FINANCIAL YEAR (614,346) (480,807) (1,156,135) (795,933)Effects of the exchange rate changes on cash and cash equivalents 5 20,880 5 20,880
CASH AND CASH EQUIVALENTS AT END OF THE FINANCIAL YEAR (b) 6,211,606 (614,346) 5,407,031 (1,156,135)
Statements of Cash Flows (cont’d)For the financial year ended 31st December 2015
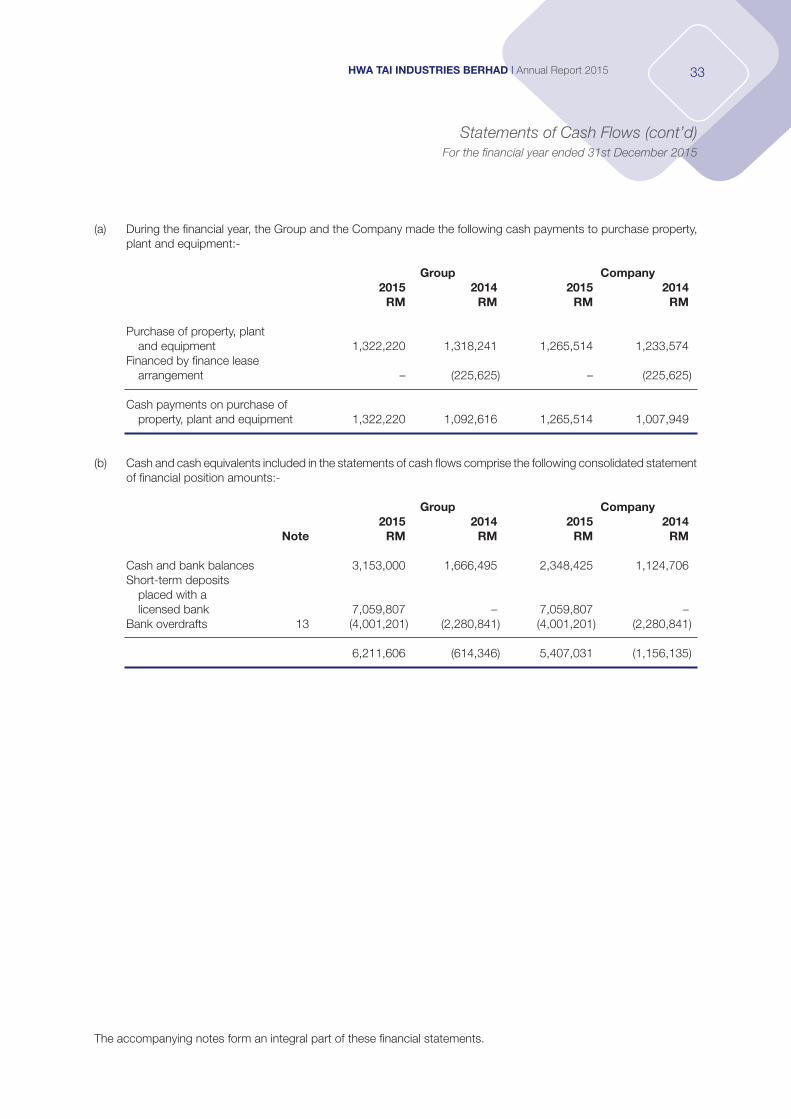
33HWA TAI INDUSTRIES BERHAD I Annual Report 2015
(a) During the financial year, the Group and the Company made the following cash payments to purchase property, plant and equipment:-
Group Company 2015 2014 2015 2014 RM RM RM RM
Purchase of property, plant and equipment 1,322,220 1,318,241 1,265,514 1,233,574 Financed by finance lease arrangement – (225,625) – (225,625)
Cash payments on purchase of property, plant and equipment 1,322,220 1,092,616 1,265,514 1,007,949
(b) Cash and cash equivalents included in the statements of cash flows comprise the following consolidated statement of financial position amounts:-
Group Company 2015 2014 2015 2014 Note RM RM RM RM
Cash and bank balances 3,153,000 1,666,495 2,348,425 1,124,706 Short-term deposits placed with a licensed bank 7,059,807 – 7,059,807 – Bank overdrafts 13 (4,001,201) (2,280,841) (4,001,201) (2,280,841)
6,211,606 (614,346) 5,407,031 (1,156,135)
The accompanying notes form an integral part of these financial statements.
Statements of Cash Flows (cont’d)For the financial year ended 31st December 2015
34
Notes to the Financial Statements
1. CORPORATE INFORMATION
The principal activities of the Company are that of a biscuit manufacturer and investment holding. The principal activities of the subsidiary companies are disclosed in Note 7 to the financial statements. There have been no significant changes in the nature of these principal activities during the financial year.
The Company is a public limited liability company, incorporated and domiciled in Malaysia, and listed on Main Market of Bursa Malaysia Securities Berhad.
The registered office and the principal place of business of the Company are both located at No. 12, Jalan Jorak, Kawasan Perindustrian Tongkang Pecah, 83010 Batu Pahat, Johor Darul Takzim.
The financial statements were authorised for issue by the Board of Directors in accordance with a resolution of the directors on 8th April 2016.
2. BASIS OF PREPARATION
2.1 Statement of Compliance
The financial statements of the Group and of the Company have been prepared in accordance with the Malaysian Financial Reporting Standards (“MFRSs”), International Financial Reporting Standards and the requirements of the Companies Act, 1965 in Malaysia.
2.2 Basis of Measurement
The financial statements of the Group and of the Company have been prepared under the historical cost basis, other than as disclosed in the significant accounting policies in Note 3 to the financial statements.
2.3 Use of Estimates and Judgement
The preparation of financial statements in conformity with MFRSs requires the use of certain critical accounting estimates and assumptions that affect the reported amounts of assets and liabilities and disclosures of contingent assets and liabilities at the date of the financial statements, and the reported amounts of the revenue and expenses during the reported period. It also requires Directors to exercise their judgement in the process of applying the Group’s and the Company’s accounting policies. Although these estimates and judgement are based on the Directors’ best knowledge of current events and actions, actual results may differ.
The areas involving a higher degree of judgement or complexity, or areas where assumptions and estimates
are significant to the financial statements are disclosed in Note 4 to the financial statements.
2.4 Functional and presentation currency
The individual financial statements of each entity in the Group are measured using the currency of the primary economic environment in which they operates (“the functional currency”). The consolidated financial statements are presented in Ringgit Malaysia (“RM”), which is also the Company’s functional currency.
35HWA TAI INDUSTRIES BERHAD I Annual Report 2015
Notes to the Financial Statements (cont’d)
2. BASIS OF PREPARATION (CONT’D)
2.5 Adoption of Amendments/Improvements to MFRSs and New IC Int
The Group and the Company had adopted the following amendments/improvements to MFRSs that are mandatory for the current financial year:
Amendments/Improvements to MFRSsMFRS 1 First-time Adoption of Malaysian Financial Reporting StandardsMFRS 2 Share-based PaymentsMFRS 3 Business CombinationsMFRS 8 Operating SegmentsMFRS 13 Fair Value MeasurementMFRS 116 Property, Plant and EquipmentMFRS 119 Employee BenefitsMFRS 124 Related Party DisclosureMFRS 138 Intangible AssetsMFRS 140 Investment Property
The adoption of the above amendments/improvements to MFRSs did not have any significant effect on
the financial statements of the Group and of the Company, and did not result in significant changes to the Group’s and the Company’s existing accounting policies, except for those as discussed below.
Amendments to MFRS 1 First-time Adoption of Malaysian Financial Reporting Standards
Amendments to MFRS 1 relate to the IASB’s Basis for Conclusions which is not an integral part of the Standard. The Basis for Conclusions clarifies that a first-time adopter is permitted but not required to apply a new or revised Standard that is not yet mandatory but is available for early application.
Amendments to MFRS 3 Business Combinations
Amendments to MFRS 3 clarify that when contingent consideration meets the definition of financial instrument, its classification as a liability or equity is determined by reference to MFRS 132. They also clarify that contingent consideration that is classified as an asset or a liability shall be subsequently measured at fair value at each reporting date and changes in fair value shall be recognised in profit or loss.
In addition, Amendments to MFRS 3 clarify that MFRS 3 excludes from its scope the accounting for the formation of all types of joint arrangements (as defined in MFRS 11) in the financial statements of the joint arrangement itself.
Amendments to MFRS 8 Operating Segments
Amendments to MFRS 8 require an entity to disclose the judgements made by management in applying the aggregation criteria to operating segments. This includes a brief description of the operating segments that have been aggregated and the economic indicators that have been assessed in determining that the aggregated operating segments share similar economic characteristics.
The amendments also clarify that an entity shall provide reconciliations of the total of the reportable segments’ assets to the entity’s assets if the segment assets are reported regularly to the chief operating decision maker.
36
Notes to the Financial Statements (cont’d)
2. BASIS OF PREPARATION (CONT’D)
2.5 Adoption of Amendments/Improvements to MFRSs and New IC Int (cont’d)
Amendments to MFRS 13 Fair Value Measurement
Amendments to MFRS 13 relate to the IASB’s Basis for Conclusions which is not an integral part of the Standard. The Basis for Conclusions clarifies that when IASB issued IFRS 13, it did not remove the practical ability to measure short-term receivables and payables with no stated interest rate at invoice amounts without discounting, if the effect of discounting is immaterial.
The amendments also clarify that the scope of the portfolio exception of MFRS 13 includes all contracts accounted for within the scope of MFRS 139 or MFRS 9, regardless of whether they meet the definition of financial assets or financial liabilities as defined in MFRS 132.
Amendments to MFRS 116 Property, Plant and Equipment
Amendments to MFRS 116 clarify the accounting treatment for the accumulated depreciation when an asset is revalued. They clarify that:
• thegrosscarryingamountisadjustedinamannerthatisconsistentwiththerevaluationofthecarryingamount of the asset; and
• theaccumulateddepreciationiscalculatedasthedifferencebetweenthegrosscarryingamountandthe carrying amount of the asset after taking into account accumulated impairment losses.
Amendments to MFRS 124 Related Party Disclosures
Amendments to MFRS 124 clarify that an entity providing key management personnel services to the reporting entity or to the parent of the reporting entity is a related party of the reporting entity. Amendments to MFRS 138 Intangible Assets
Amendments to MFRS 138 clarify the accounting treatment for the accumulated amortisation when an asset is revalued. They clarify that:
• thegrosscarryingamountisadjustedinamannerthatisconsistentwiththerevaluationofthecarryingamount of the asset; and
• theaccumulatedamortisationiscalculatedasthedifferencebetweenthegrosscarryingamountandthe carrying amount of the asset after taking into account accumulated impairment losses.
37HWA TAI INDUSTRIES BERHAD I Annual Report 2015
Notes to the Financial Statements (cont’d)
2. BASIS OF PREPARATION (CONT’D)
2.6 New MFRSs and Amendments/Improvements to MFRSs that are issued, but not yet effective and have not been early adopted
The Group and the Company have not adopted the following new MFRSs and amendments/improvements to MFRSs that have been issued by the Malaysian Accounting Standards Board (“MASB”) as at the date of authorisation of these financial statements but are not yet effective for the Group and the Company:-
Effective for financial periods beginning on or after
New MFRSsMFRS 9 Financial Instruments 1 January 2018MFRS 15 Revenue from Contracts with Customers 1 January 2018 Amendments/Improvements to MFRSsMFRS 5 Non-current Assets Held for Sales and Discontinued Operations 1 January 2016MFRS 7 Financial Instruments: Disclosure 1 January 2016MFRS 10 Consolidated Financial Statements Deferred/ 1 January 2016MFRS 11 Joint Arrangements 1 January 2016MFRS 12 Disclosure of Interest in Other Entities 1 January 2016MFRS 101 Presentation of Financial Statements 1 January 2016MFRS 116 Property, Plant and Equipment 1 January 2016MFRS 119 Employee Benefits 1 January 2016MFRS 127 Separate financial statements 1 January 2016MFRS 128 Investments in Associates and Joint Ventures Deferred/ 1 January 2016MFRS 138 Intangible Assets 1 January 2016MFRS 141 Agriculture 1 January 2016
A brief discussion on the above significant new MFRSs and amendments/improvements to MFRSs are summarised below. Due to the complexity of these new MFRSs and amendments/improvement to MFRSs, the financial effects of their adoption are currently still being assessed by the Group and the Company.
38
Notes to the Financial Statements (cont’d)
2. BASIS OF PREPARATION (CONT’D)
2.6 New MFRSs and Amendments/Improvements to MFRSs that are issued, but not yet effective and have not been early adopted (cont’d)
MFRS 9 Financial Instruments
Key requirements of MFRS 9:-
• MFRS9introducesapackageofimprovementswhichincludesaclassificationandmeasurementmodel, a single forward-looking ‘expected loss’ impairment model and a substantially-reformed approach to hedge accounting.
In essence, if a financial asset is a simple debt instrument and the objective of the entity’s business model within which it is held is to collect its contractual cash flows, the financial asset is measured at amortised cost. In contrast, if that asset is held in a business model the objective of which is achieved by both collecting contractual cash flows and selling financial assets, then the financial asset is measured at fair value in the statement of financial position, and amortised cost information is provided through profit or loss. If the business model is neither of these, then fair value information is increasingly important, so it is provided both in the profit or loss and in the statement of financial position.
• MFRS9introducesanew,expected-lossimpairmentmodelthatwillrequiremoretimelyrecognitionof expected credit losses. Specifically, this Standard requires entities to account for expected credit losses from when financial instruments are first recognised and to recognise full lifetime expected losses on a more timely basis. The model requires an entity to recognise expected credit losses at all times and to update the amount of expected credit losses recognised at each reporting date to reflect changes in the credit risk of financial instruments. This model eliminates the threshold for the recognition of expected credit losses, so that it is no longer necessary for a trigger event to have occurred before credit losses are recognised.
• MFRS9introducesasubstantially-reformedmodelforhedgeaccounting,withenhanceddisclosuresabout risk management activity. The new model represents a significant overhaul of hedge accounting that aligns the accounting treatment with risk management activities, enabling entities to better reflect these activities in their financial statements. In addition, as a result of these changes, users of the financial statements will be provided with better information about risk management and the effect of hedge accounting on the financial statements.
MFRS 15 Revenue from Contracts with Customers
The core principle of MFRS 15 is that an entity recognises revenue to depict the transfer of promised goods or services to customers in an amount that reflects the consideration to which the entity expects to be entitled in exchange for those goods or services. An entity recognises revenue in accordance with the core principle by applying the following steps:
• Identifythecontractswithacustomer.• Identifytheperformanceobligationinthecontract.• Determinethetransactionprice.• Allocatethetransactionpricetotheperformanceobligationsinthecontract.• Recogniserevenuewhen(oras)theentitysatisfiesaperformanceobligation.
39HWA TAI INDUSTRIES BERHAD I Annual Report 2015
Notes to the Financial Statements (cont’d)
2. BASIS OF PREPARATION (CONT’D)
2.6 New MFRSs and Amendments/Improvements to MFRSs that are issued, but not yet effective and have not been early adopted (cont’d)
MFRS 15 Revenue from Contracts with Customers (cont’d)
MFRS 15 also includes new disclosures that would result in an entity providing users of financial statements about the nature, amount, timing and uncertainty of revenue and cash flows from contracts with customers.
The following MFRSs and IC Interpretations will be withdrawn on the application of MFRS 15:
MFRS 111 Construction ContractsMFRS 118 RevenueIC Interpretation 13 Customer Loyalty ProgrammesIC Interpretation 15 Agreements for the Construction of Real EstateIC Interpretation 18 Transfers of Assets from CustomersIC Interpretation 131 Revenue – Barter Transactions Involving Advertising Services
Amendments to MFRS 7 Financial Instruments: Disclosures
Amendments to MFRS 7 provide additional guidance to clarify whether servicing contracts constitute continuing involvement for the purposes of applying the disclosure requirements of MFRS 7.
The Amendments also clarify the applicability of Disclosure – Offsetting Financial Assets and Financial Liabilities (Amendments to MFRS 7) to condensed interim financial statements.
Amendments to MFRS 101 Presentation of Financial Statements
Amendments to MFRS 101 improve the effectiveness of disclosures. The amendments clarifies guidance on materiality and aggregation, the presentation of subtotals, the structure of financial statements and the disclosure of accounting policies.
Amendments to MFRS 116 Property, Plant and Equipment
Amendments to MFRS 116 clarify the accounting for the accumulated depreciation/amortisation when an asset is revalued. It clarifies that:
• thegrosscarryingamountisadjustedinamannerthatisconsistentwiththerevaluationofthecarryingamount of the asset; and
• theaccumulateddepreciation/amortisationiscalculatedasthedifferencebetweenthegrosscarryingamount and the carrying amount of the asset after taking into account accumulated impairment losses.
Amendments to MFRS 116 prohibit revenue-based depreciation because revenue does not reflect the way in which an item of property, plant and equipment is used or consumed.
Amendments to MFRS 127 Separate Financial Statements
Amendments to MFRS 127 allow a parent and investors to use the equity method in its separate financial statements to account for investments in subsidiaries, joint ventures and associates, in addition to the existing options.
40
Notes to the Financial Statements (cont’d)
2. BASIS OF PREPARATION (CONT’D)
2.6 New MFRSs and Amendments/Improvements to MFRSs that are issued, but not yet effective and have not been early adopted (cont’d)
Amendments to MFRS 138 Intangible Assets
Amendments to MFRS 138 introduce a rebuttable presumption that the revenue-based amortisation method is inappropriate. This presumption can be overcome only in the limited circumstances:
• whentheintangibleassetisexpressedasameasureofrevenue,i.e.inthecircumstanceinwhichthe predominant limiting factor that is inherent in an intangible asset is the achievement of a revenue threshold; or
• whenitcanbedemonstratedthatrevenueandtheconsumptionoftheeconomicbenefitsoftheintangible asset are highly correlated.
Amendments to MFRS 10 Consolidated Financial Statements and MFRS 128 Investments in Associates and Joint Ventures
These Amendments address an acknowledged inconsistency between the requirements in MFRS 10 and those in MFRS 128, in dealing with the sale or contribution of assets between an investor and its associate or joint venture.
The main consequence of the Amendments is that a full gain or loss is recognised when a transaction involves a business, as defined in MFRS. A partial gain or loss is recognised when a transaction involves assets that do not constitute a business.
3. SIGNIFICANT ACCOUNTING POLICIES
Unless otherwise stated, the following accounting policies have been applied consistently to all the financial years presented in the financial statements of the Group and of the Company.
3.1 Basis of consolidation
The consolidated financial statements comprise the financial statements of the Company and its subsidiaries. The financial statements of the subsidiaries, associates, and joint ventures used in the preparation of the consolidated financial statements are prepared for the same reporting date as the Company. Consistent accounting policies are applied to like transactions and events in similar circumstances.
(a) Subsidiaries and business combination
Subsidiaries are entities over which the Group is exposed, or has rights, to variable returns from its involvement with the acquirees and has the ability to affect those returns through its power over the acquirees.
The financial statements of subsidiaries are included in the consolidated financial statements from the date the Group obtains control of the acquirees until the date the Group loses control of the acquirees.
The Group applies the acquisition method to account for business combinations from the acquisition date.
41HWA TAI INDUSTRIES BERHAD I Annual Report 2015
Notes to the Financial Statements (cont’d)
3. SIGNIFICANT ACCOUNTING POLICIES (CONT’D)
3.1 Basis of consolidation (cont’d)
(a) Subsidiaries and business combination (cont’d)
For a new acquisition, goodwill is initially measured at cost, being the excess of the following:
• thefairvalueoftheconsiderationtransferred,calculatedasthesumoftheacquisition-datefairvalue of assets transferred (including contingent consideration), the liabilities incurred to former owners of the acquiree and the equity instruments issued by the Group. Any amounts that relate to pre-existing relationships or other arrangements before or during the negotiations for the business combination, that are not part of the exchange for the acquiree, will be excluded from the business combination accounting and be accounted for separately; plus
• therecognisedamountofanynon-controllinginterestsintheacquireeeitheratfairvalueorat the proportionate share of the acquiree’s identifiable net assets at the acquisition date (the choice of measurement basis is made on an acquisition-by-acquisition basis); plus
• ifthebusinesscombinationisachievedinstages,theacquisition-datefairvalueofthepreviouslyheld equity interest in the acquiree; less
• thenetfairvalueoftheidentifiableassetsacquiredandtheliabilitiesassumedattheacquisitiondate.
When the excess is negative, a bargain purchase gain is recognised immediately in profit or loss at
the acquisition date.
Transaction costs, other than those associated with the issue of debt or equity securities, that the Group incurs in connection with a business combination are expensed as incurred.
If the business combination is achieved in stages, the Group remeasures the previously held equity interest in the acquiree to its acquisition-date fair value, and recognises the resulting gain or loss, if any, in profit or loss. Amounts arising from interests in the acquiree prior to the acquisition date that have been previously been recognised in other comprehensive income are reclassified to profit or loss or transferred directly to retained earnings, on the same basis as could be required if the acquirer had disposed directly of the previously held equity interest.
If the initial accounting for a business combination is incomplete by the end of the reporting period in which the business combination occurs, the Group uses provisional fair value amounts for the items for which the accounting is incomplete. The provisional amounts are adjusted to reflect new information obtained about facts and circumstances that existed as of the acquisition date, including additional assets or liabilities identified in the measurement period. The measurement period for completion of the initial accounting ends as soon as the Group receives the information it was seeking about facts and circumstances or learns that more information is not obtainable, subject to the measurement period not exceeding one year from the acquisition date.
Upon the loss of control of subsidiary, the Group derecognises the assets and liabilities of the former subsidiary, any non-controlling interests and the other components of equity related to the former subsidiary from the consolidated statement of financial position. Any surplus or deficit arising on the loss of control is recognised in profit or loss. If the Group retains any interest in the former subsidiary, then such interest is measured at fair value at the date that control is lost. Subsequently, it is accounted for as an associate, joint venture, an available-for-sale financial asset or a held for trading financial asset.
Changes in the Group’s ownership interest in a subsidiary that do not result in a loss of control are accounted for as equity transactions. The difference between the Group’s share of net assets before and after the change, and the fair value of the consideration received or paid, is recognised directly in equity.
42
Notes to the Financial Statements (cont’d)
3. SIGNIFICANT ACCOUNTING POLICIES (CONT’D)
3.1 Basis of consolidation (cont’d)
(b) Non-controlling interest
Non-controlling interests represent the equity in subsidiaries not attributable, directly or indirectly, to owners of the Company and are presented separately in the consolidated statement of financial position within equity.
Losses attributable to the non-controlling interests are allocated to the non-controlling interests even if the losses exceed the non-controlling interests.
(c) Associates
Associates are entities over which the Group has significant influence, but not control, to the financial and operating policies.
Investments in associates are accounted for in the consolidated financial statements using the equity method.
Under the equity method, the investments in associates are initially recognised at cost. The cost of investment includes transaction costs. Subsequently, the carrying amount is adjusted to recognise changes in the Group’s share of net assets of the associate.
When the Group’s share of losses exceeds its interest in an associate, the carrying amount of that interest including any long-term investments is reduced to zero, and the recognition of further losses is discontinued except to the extent that the Group has an obligation or has made payments on behalf of the associate.
When the Group ceases to have significant influence over an associate, any retained interest in the former associate at the date when significant influence is lost is measured at fair value and this amount is regarded as the initial carrying amount of a financial asset. Any difference between the carrying amount of the associate upon loss of significant influence and the fair value of the retained investment and proceeds from disposal is recognised in profit or loss.
When the Group’s interest in an associate decreases but does not result in a loss of significant influence, any retained interest is not remeasured. Any gain or loss arising from the decrease in interest is recognised in profit or loss. Any gains or losses previously recognised in other comprehensive income are also reclassified proportionately to the profit or loss if that gain or loss would be required to be reclassified to profit or loss on the disposal of the related assets or liabilities.
(d) Transactions eliminated on consolidation
Intra-group balances and transactions, and any unrealised income and expenses arising from intra-group transactions are eliminated in preparing the consolidated financial statements.
Unrealised gains arising from transactions with equity-accounted associates and joint ventures are eliminated against the investment to the extent of the Group’s interest in the investee. Unrealised losses are eliminated in the same way as unrealised gains, but only to the extent that there is no evidence of impairment.
43HWA TAI INDUSTRIES BERHAD I Annual Report 2015
Notes to the Financial Statements (cont’d)
3. SIGNIFICANT ACCOUNTING POLICIES (CONT’D)
3.2 Separate financial statements
In the Company’s statement of financial position, investments in subsidiaries and associates are measured at cost less any impairment losses, unless the investment is classified as held for sale or distribution. The cost of investment includes transaction costs. The policy for the recognition and measurement of impairment losses shall be applied on the same basis as could be required for impairment of non-financial assets as disclosed in Note 3.13.
3.3 Property, plant and equipment and depreciation
(a) Recognition and measurement
Property, plant and equipment are stated at cost less accumulated depreciation and impairment loss, if any except for freehold land. The policy of recognition of impairment losses is in accordance with Note 3.13 to the financial statements. Cost includes expenditure that is directly attributable to the acquisition of the asset. When significant parts of an item of property, plant and equipment have different useful lives, they are accounted for as separate items of property, plant and equipment.
(b) Subsequent costs
The cost of replacing part of an item of property, plant and equipment is recognised in the carrying amount of the item if it is probable that the future economic benefits embodied within the part will flow to the Group and its cost can be measured reliably. The costs of the day-to-day servicing of property, plant and equipment are recognised in the profit or loss as incurred.
(c) Depreciation
No depreciation is provided on the freehold land as it has infinite useful life. Capital work-in-progress will be depreciated when the property, plant and equipment are ready for their intended use. Depreciation of other property, plant and equipment is provided on the straight line basis to write off the cost or valuation of each asset to its residual value over their estimated useful life at the following rates:-
Leasehold land and buildings 2%Renovation 10%Plant and machinery 5% - 10%Office equipment, furniture and fittings and motor vehicles 10% - 20%
The residual values, useful life and depreciation method are reviewed at each financial year end to ensure that the amount, method and period of depreciation are consistent with previous estimates and the expected pattern of consumption of the future economic benefits embodied in the items of property, plant and equipment.
Fully depreciated assets are retained in the accounts until the assets are no longer in use.
(d) Derecognition
An item of property, plant and equipment is derecognised upon disposal or when no future economic benefits are expected from its use or disposal. The difference between the net disposals proceeds and the net carrying amount, if any, is recognised in the profit or loss.
44
Notes to the Financial Statements (cont’d)
3. SIGNIFICANT ACCOUNTING POLICIES (CONT’D)
3.4 Inventories
Inventories are measured at the lower of cost and net realisable value.
Cost incurred in bringing the inventories to their present location and condition are accounted for as follows:• Rawmaterials,packingmaterialsandconsumables:purchasecostsonafirst-infirst-outbasis• Finishedgoodsandwork-in-progress:costincludedirectmaterials,directlabourandanallocation
of manufacturing overheads.
Net realisable value is the estimated selling price in the ordinary course of business less the estimated costs of completion and the estimated costs necessary to make the sale.
3.5 Financial Instruments
Financial instruments are recognised in the statements of financial position when, and only when, the Group and the Company become a party to the contract provisions of the financial instruments.
A financial instrument is recognised initially, at its fair value, plus, in the case of a financial instrument not at fair value through profit or loss, transaction costs that are directly attributable to the acquisition or issue of the financial instrument.
(a) Subsequent measurement
The Group and the Company categorise the financial instruments as follows: (i) Financial Assets
Financial assets at fair value through profit or loss
Financial assets are classified as financial assets at fair value through profit or loss when the financial assets are held for trading, including derivatives or are designated into this category upon initial recognition.
Subsequent to initial recognition, financial assets at fair value through profit or loss are measured at fair value with the gain or loss recognised in profit or loss.
Derivatives that are linked to and must be settled by delivery of unquoted equity instruments whose fair values cannot be reliably measured are measured at cost.
Loans and receivables
Financial assets with fixed or determinable payments that are not quoted in an active market are classified as loans and receivables.
Subsequent to initial recognition, loans and receivables are measured at amortised cost using the effective interest method less accumulated impairment losses, if any. The policy for the recognition and measurement of impairment losses is in accordance with Note 3.13. Gains and losses are recognised in profit or loss through the amortisation process.
45HWA TAI INDUSTRIES BERHAD I Annual Report 2015
Notes to the Financial Statements (cont’d)
3. SIGNIFICANT ACCOUNTING POLICIES (CONT’D)
3.5 Financial Instruments (cont’d)
(a) Subsequent measurement (cont’d)
(i) Financial Assets (cont’d)
Held-to-maturity investments
Financial assets with fixed or determinable payments and fixed maturities are classified as held-to-maturity when the Group has the positive intention and ability to hold them to maturity.
Subsequent to initial recognition, held-to-maturity investments are measured at amortised cost using the effective interest method less accumulated impairment losses, if any. The policy for the recognition and measurement of impairment losses is in accordance with Note 3.13. Gains and losses are recognised in profit or loss through the amortisation process.
Available-for-sale financial assets
Available-for-sale financial assets comprise investment in equity and debt securities that are designated as available-for-sale or are not classified in any of the three preceding categories.
Subsequent to initial recognition, available-for-sale financial assets are measured at fair value. Gains or losses from changes in fair value of the financial assets are recognised in other comprehensive income, except for impairment losses and foreign exchange gains and losses arising from monetary items and gains and losses of hedged items attributable to hedge risks of fair values hedges which are recognised in profit or loss. The cumulative gain or loss previously recognised in other comprehensive income is reclassified from equity to profit or loss as a reclassification adjustment when the financial asset is derecognised. Interest income calculated using the effective interest method is recognised in profit or loss. Dividends on an available-for-sale equity instrument are recognised in profit or loss when the Group’s and the Company’s right to receive the payment is established.
(ii) Financial liabilities
Financial liabilities at fair value through profit or loss
All financial liabilities are subsequently measured at amortised cost other than those categorised as fair value through profit or loss.
Fair value through profit or loss category comprises financial liabilities that are derivatives or financial liabilities that are specifically designated into this category upon initial recognition.
Derivatives that are linked to and must be settled by delivery of equity instruments that do not have a quoted price in an active market for identical instruments whose fair values otherwise cannot be reliably measured are measured at cost.
Other financial liabilities
Other financial liabilities categorised as fair value through profit or loss are subsequently measured at their fair values with the gain or loss recognised in profit or loss.
46
Notes to the Financial Statements (cont’d)
3. SIGNIFICANT ACCOUNTING POLICIES (CONT’D)
3.5 Financial Instruments (cont’d)
(b) Financial Guarantee Contracts
A financial guarantee contract is a contract that requires the issuer to make specified payments to reimburse the holder for a loss it incurs because a specified debtor fails to make payment when due in accordance with the original or modified terms of a debt instrument.
Financial guarantee contracts are recognised initially as a liability at fair value, net of transaction costs that are directly attributable to the issuance of the guarantee. Subsequent to initial recognition, the liability is measured at the higher of the best estimate of the expenditure required to settle the present obligation at the reporting date and the amount initially recognised less cumulative amortisation.
(c) Derecognition
A financial asset or a part of it is derecognised when, and only when, the contractual rights to receive the cash flows from the financial asset expire or control of the asset is not retained or substantially all of the risks and rewards of ownership of the financial asset are transferred to another party. On derecognition of a financial asset, the difference between the carrying amount and the sum of the consideration received (including any new asset obtained less any new liability assumed) and any cumulative gain or loss that had been recognised in other comprehensive income is recognised in profit or loss.
A financial liability or a part of it is derecognised when, and only when, the obligation specified in the
contract is discharged, cancelled or expires. On derecognition of a financial liability, the difference between the carrying amount and the consideration paid, including any non-cash assets transferred or liabilities assumed, is recognised in profit or loss.
(d) Offsetting of financial instruments
Financial assets and financial liabilities are offset and the net amount is presented in the statements of financial position if there is a currently enforceable legal right to offset the recognised amounts and there is an intention to settle on a net basis, to realise the assets and settle the liabilities simultaneously.
3.6 Leases
The determination of whether an arrangement is, or contains, a lease is based on the substance of the arrangement at the inception of the lease. The arrangement is, or contains, a lease if fulfilment of the arrangement is dependent on the use of a specific asset or assets and the arrangement conveys a right to use the asset or assets.
A lease is classified as a finance lease if it transfers substantially all the risks and rewards incidental to ownership. All other leases that do not meet this criterion are classified as operating leases.
(a) Lessee accounting
If an entity in the Group is a lessee in a finance lease, it capitalises the leased asset and recognises the related liability. The amount recognised at the inception date is the fair value of the underlying leased asset or, if lower, the present value of the minimum lease payments. Subsequent to initial recognition, the asset is accounted for in accordance with the accounting policy applicable to that assets.
47HWA TAI INDUSTRIES BERHAD I Annual Report 2015
Notes to the Financial Statements (cont’d)
3. SIGNIFICANT ACCOUNTING POLICIES (CONT’D)
3.6 Leases (cont’d)
(a) Lessee accounting (cont’d)
Minimum lease payments are apportioned between the finance charge and the reduction of the outstanding liability. The finance charge is allocated to each period during the lease term so as to produce a constant periodic rate of interest on the remaining balance of the liability. Contingent lease payments are charged as expenses in the periods in which they are incurred.
The capitalised leased asset is classified by nature as property, plant and equipment or investment property.
For operating leases, the Group does not capitalise the leased asset or recognise the related liability. Instead lease payments under an operating lease are recognised as an expense on the straight-line basis over the lease term unless another systematic basis is more representative of the time pattern of the user’s benefits.
Any upfront lease payments are classified as land use rights within intangible assets.
(b) Lessor accounting
If an entity in the Group is a lessor in a finance lease, it derecognises the underlying asset and recognises a lease receivable at an amount equal to the net investment in the lease. Finance income is recognised in profit or loss based on a pattern reflecting a constant periodic rate of return on the lessor’s net investment in the finance lease.
If an entity in the Group is a lessor in an operating lease, the underlying asset is not derecognised but is presented in the statement of financial position according to the nature of the asset. Lease income from operating leases is recognised in profit or loss on a straight-line basis over the lease term, unless another systematic basis is more representative of the time pattern in which use benefit derived from the leased asset is diminished.
3.7 Borrowing Costs
Borrowing costs are interests and other costs that the Group and the Company incur in connection with borrowing of funds.
Borrowing costs that are not directly attributable to the acquisition, construction or production of a qualifying asset are recognised in profit or loss using the effective interest method.
Borrowing costs that are directly attributable to the acquisition, construction or production of qualifying assets, which are assets that necessarily take a substantial period of time to get ready for their intended use or sale, are capitalised as part of the cost of those assets, until such time as the assets are substantially ready for their intended use or sale.
The Group and the Company begin capitalising borrowing costs when the Group and the Company have incurred the expenditures for the asset, incurred related borrowing costs and undertaken activities that are necessary to prepare the asset for its intended use or sale.
Investment income earned on the temporary investment of specific borrowings pending their expenditure on qualifying assets is deducted from the borrowing costs eligible for capitalisation.
48
Notes to the Financial Statements (cont’d)
3. SIGNIFICANT ACCOUNTING POLICIES (CONT’D)
3.8 Employee benefits
(a) Short term employee benefits
Wages, salaries, social security contribution, bonuses and non-monetary benefits are accrued in the period in which the associated services are rendered by the employees. Short-term accumulating compensated absences such as paid annual leave are recognised when services are rendered by employees that increase their entitlement to future compensated absences. Short-term non-accumulating compensated absences sick leave, maternity and paternity leave are recognised when absences occur.
(b) Defined contribution plans
As required by law, the Group and the Company contribute to the Employees Provident Fund (“EPF”), the national defined contribution plan. Such contributions are recognised as an expense in the profit or loss in the period in which the employees render their services.
3.9 Foreign Currencies
(a) Translation of foreign currency transactions
Foreign currency transactions are translated to the respective functional currencies of the Group entities at the exchange rates prevailing at the dates of the transactions.
At the end of each reporting date, monetary items denominated in foreign currencies are retranslated at the exchange rates prevailing at the reporting date.
Non-monetary items denominated in foreign currencies that are measured at fair value are retranslated at the rates prevailing at the dates the fair values were determined. Non-monetary items denominated in foreign currencies that are measured at historical cost are translated at the historical rates as at the dates of the initial transactions.
Foreign exchange differences arising on settlement or retranslation of monetary items are recognised in profit or loss. When settlement of a monetary item receivable from or payable to a foreign operation is neither planned nor likely to occur in the foreseeable future, exchange differences are recognised in profit or loss in the separate financial statements of the parent company or the individual financial statements of the foreign operation. In the consolidated financial statements, the exchange differences are considered to form part of a net investment in a foreign operation and are recognised initially in other comprehensive income until its disposal, at which time, the cumulative amount is reclassified to profit or loss.
The gain or loss arising on translation of non-monetary items measured at fair value is treated in line with the recognition of the gain or loss on the change in fair value of the item (i.e. translation differences on items whose fair value gain or loss is recognised in other comprehensive income or profit or loss are also recognised in other comprehensive income or profit or loss, respectively).
49HWA TAI INDUSTRIES BERHAD I Annual Report 2015
Notes to the Financial Statements (cont’d)
3. SIGNIFICANT ACCOUNTING POLICIES (CONT’D)
3.9 Foreign Currencies (cont’d)
(b) Translation of foreign operations
The assets and liabilities of foreign operations denominated in the functional currency different from the presentation currency, including goodwill and fair value adjustments arising on acquisition, are translated into the presentation currency at exchange rates prevailing at the reporting date. The income and expenses of foreign operations are translated at exchange rates at the dates of the transactions.
Exchange differences arising on the translation are recognised in other comprehensive income. However, if the foreign operation is a non-wholly owned subsidiary, then the relevant proportionate share of the translation difference is allocated to the non-controlling interests.
When a foreign operation is disposed of such that control, significant influence or joint control is lost, the cumulative amount in foreign exchange translation reserves related to that foreign operation is reclassified to profit or loss. For a partial disposal not involving loss of control of a subsidiary that includes a foreign operation, the proportionate share of cumulative amount in foreign exchange translation reserve is reattributed to non-controlling interests. For partial disposals of associates or joint ventures that do not result in the Group losing significant influence or joint control, the proportionate share of the cumulative amount in foreign exchange translation reserve is reclassified to profit or loss.
3.10 Provision
Provision are recognised when the Group has a present obligation (legal or constructive) as a result of a past event, it is probable that an outflow of resources embodying economic benefits will be required to settle the obligation and the amount of the obligation can be estimated reliably.
If the effect of the time value of money is material, provisions that are determined based on the expected future cash flows to settle the obligation are discounted using a current pre-tax rate that reflects current market assessments of the time value of money and the risks specific to the liability. When discounting is used, the increase in the provisions due to passage of time is recognised as finance costs.
Provisions are reviewed at each reporting date and adjusted to reflect the current best estimate. If it is no longer probable that an outflow of economic resources will be required to settle the obligation, the provision is reversed.
3.11 Income tax
Income tax expense in profit or loss comprises current and deferred tax. Current and deferred tax are recognised in profit or loss except to the extent that it relates to a business combination or items recognised directly in equity or other comprehensive income.
(a) Current tax
Current tax is the expected taxes payable or receivable on the taxable income or loss for the financial year, using the tax rates that have been enacted or substantively enacted by the end of the reporting period, and any adjustment to tax payable in respect of previous financial years.
50
Notes to the Financial Statements (cont’d)
3. SIGNIFICANT ACCOUNTING POLICIES (CONT’D)
3.11 Income tax (cont’d)
(b) Deferred tax
Deferred tax is recognised using the liability method on temporary differences at the reporting date between the tax bases of assets and liabilities and their carrying amounts in the statements of financial position. Deferred tax liabilities are generally recognised for all taxable temporary differences. Deferred tax assets are generally recognised for all deductible temporary differences, unutilised tax losses and unused tax credits, to the extent that it is probable that future taxable profit will be available against which the deductible temporary differences, unused tax losses and unused tax credits can be utilised.
Deferred tax is not recognised if the temporary differences arise from the initial recognition of assets
and liabilities in a transaction which is not a business combination and that affects neither the taxable profit nor the accounting profit. In addition, deferred tax liabilities are not recognised if the temporary difference arises from the initial recognition of goodwill.
Deferred tax liabilities are recognised for taxable temporary differences associated with investments in subsidiaries, branches, associates and interests in joint ventures, except where the Group is able to control the reversal timing of the temporary differences and it is probable that the temporary differences will not reverse in the foreseeable future. Deferred tax assets arising from deductible temporary differences associated with such investments and interests are only recognised to the extent that it is probable that there will be sufficient taxable profits against which to utilise the benefits of the temporary differences and they are expected to reverse in the foreseeable future.
The carrying amount of deferred tax assets is reviewed at each reporting date and reduced to the extent that it is no longer probable that sufficient taxable profit will be available to allow the benefit of part or all of that deferred tax asset to be utilised. Unrecognised deferred tax assets are reassessed at each reporting date and are recognised to the extent that it has become probable that future taxable profit will allow the deferred tax assets to be utilised.
Deferred tax is measured at the tax rates that are expected to apply in the period when the asset is realised or the liability is settled, based on tax rates and tax laws that have been enacted or substantively enacted at the reporting date.
Deferred tax relating to items recognised outside profit or loss is recognised outside profit or loss. Deferred tax items are recognised in correlation to the underlying transaction either in other comprehensive income or directly in equity.
Deferred tax assets and deferred tax liabilities are offset if there is a legally enforceable right to offset current tax assets against current tax liabilities and when they relate to income taxes levied by the same taxation authority on the same taxable entity, or on different tax entities, but they intend to settle their income tax recoverable and income tax payable on a net basis or their tax assets and liabilities will be realised simultaneously.
51HWA TAI INDUSTRIES BERHAD I Annual Report 2015
Notes to the Financial Statements (cont’d)
3. SIGNIFICANT ACCOUNTING POLICIES (CONT’D)
3.12 Revenue Recognition
Revenue is recognised to the extent that it is probable that the economic benefits will flow to the Group, the amount of revenue can be reliably measured and specific criteria have been met for each of the Group’s activities as described below.
(a) Sale of goods
Revenue from sale of goods is measured at the fair value of the consideration receivable and is recognised in the profit or loss when the significant risks and rewards of ownership have been transferred to the buyer.
(b) Rental income
Rental income is accounted for on a straight-line basis over the lease terms. The aggregate cost of incentives provided to lessees are recognised as a reduction of rental income over the lease term on a straight-line basis.
(c) Interest income
Interest income is recognised using the effective interest rate method.
3.13 Impairment of Assets
(a) Impairment and uncollectibility of financial assets
At each reporting date, all financial assets (except for financial assets categorised as fair value through profit or loss and investment in subsidiaries and associates) are assessed whether there is any objective evidence of impairment as a result of one or more events having an impact on the estimated future cash flows of the financial asset that can be reliably estimated. Losses expected as a result of future events, no matter how likely, are not recognised.
Evidence of impairment may include indications that the debtors or a group of debtors are experiencing significant financial difficulty, default or delinquency in interest or principal payments, the probability that they will enter bankruptcy or other financial reorganisation, and where observable data indicates that there is a measurable decrease in the estimated future cash flows, such as changes in arrears or economic conditions that correlate with defaults.
Loans and receivables and held-to-maturity investments
The Group and the Company first assess whether objective evidence of impairment exists individually for financial assets that are individually significant, and individually or collectively for financial assets that are not individually significant. If no objective evidence for impairment exists for an individually assessed financial asset, whether significant or not, the Group and the Company may include the financial asset in a group of financial assets with similar credit risk characteristics and collectively assess them for impairment. Financial assets that are individually assessed for impairment for which an impairment loss is or continues to be recognised are not included in the collective assessment of impairment.
The amount of impairment loss is measured as the difference between the financial asset’s carrying amount and the present value of estimated future cash flows discounted at the financial asset’s original effective interest rate. The carrying amount of the financial asset is reduced through the use of an allowance account and the loss is recognised in profit or loss.
52
Notes to the Financial Statements (cont’d)
3. SIGNIFICANT ACCOUNTING POLICIES (CONT’D)
3.13 Impairment of Assets (cont’d)
(a) Impairment and uncollectibility of financial assets (cont’d)
Loans and receivables and held-to-maturity investments (cont’d)
If, in a subsequent period, the amount of the impairment loss decreases due to an event occurring after the impairment that was recognised, the previously recognised impairment loss is then reversed by adjusting an allowance account to the extent that the carrying amount of the financial asset does not exceed what the amortised cost would have been had the impairment not been recognised.
Loans together with the associated allowance are written off when there is no realistic prospect of future recovery and all collateral has been realised or has been transferred to the Group and the Company. If a write-off is later recovered, the recovery is credited to the profit or loss.
Unquoted equity instruments carried at cost
In the case of unquoted equity instruments carried at cost, the amount of the impairment loss is measured as the difference between the carrying amount of the financial asset and the present value of estimated future cash flows discounted at the current market rate of return for a similar financial asset. Such impairment losses shall not be reversed.
(b) Impairment of non-financial assets
The carrying amounts of non-financial assets (except for inventories) are reviewed at the end of each reporting period to determine whether there is any indication of impairment. If any such indication exists, the Group and the Company make and estimate of the asset’s recoverable amount.
For the purpose of impairment testing, assets are grouped together into the smallest group of assets that generates cash inflows from continuing use that are largely independent of the cash inflows of non-financial assets or cash-generating units (“CGUs”).
The recoverable amount of an asset or a CGU is the higher of its fair value less costs of disposal and its value-in-use. In assessing value-in-use, the estimated future cash flows are discounted to their present value using a pre-tax discount rate that reflects current market assessments of the time value of money and the risks specific to the asset or CGU. In determining the fair value less costs of disposal, recent market transactions are taken into account. If no such transactions can be identified, an appropriate valuation model is used.
Where the carrying amount of an asset exceed its recoverable amount, the carrying amount of asset is reduced to its recoverable amount.
Impairment loss on goodwill is not reversed in a subsequent period. An impairment loss for an asset other than goodwill is reversed if, and only if, there has been a change in the estimates used to determine the asset’s recoverable amount since the last impairment was recognised. The carrying amount of an asset other than goodwill is increased to its revised recoverable amount, provided that this amount does not exceed its carrying amount that would have been determined (net of amortisation or depreciation) had no impairment loss been recognised for the asset in prior years. A reversal of impairment loss for an asset other than goodwill is recognised in the profit or loss.
3.14 Cash and Cash Equivalents
For the purpose of statement of cash flows, cash and cash equivalents comprise cash in hand, bank balances, demand deposits and other short term, highly liquid investments that are readily convertible to known amounts of cash and which are subject to an insignificant risk of changes in value. Cash and cash equivalents are stated net of bank overdrafts which are repayable on demand.
53HWA TAI INDUSTRIES BERHAD I Annual Report 2015
Notes to the Financial Statements (cont’d)
3. SIGNIFICANT ACCOUNTING POLICIES (CONT’D)
3.15 Share Capital
Ordinary Shares
Ordinary shares are equity instruments. An equity instrument is a contract that evidences a residual interest in the assets of the Company after deducting all of its liabilities. Ordinary shares are recorded at the proceeds received, net of directly attributable incremental transaction costs. Dividends on ordinary shares are recognised in equity in the period in which they are declared.
3.16 Operating segments
Operating segments are reported in a manner consistent with the internal reporting provided to the chief operating decision-maker. The Group Chief Executive Director, who is responsible for allocating resources and assessing performance of the operating segments, has been identified as the chief operating decision maker that makes strategic decisions.
3.17 Fair Value Measurements
Fair value of an asset or a liability, except for share-based payment and lease transactions, is determined as the price that would be received to sell an asset or paid to transfer a liability in an orderly transaction between market participants at the measurement date. The measurement assumes that the transaction to sell the asset or transfer the liability takes place either in the principal market or in the absence of a principal market, in the most advantageous market.
For a non-financial asset, the fair value measurement takes into account a market participant’s ability to generate economic benefits by using the asset in its highest and best use or by selling it to another market participant that would use the asset in its highest and best use.
When measuring the fair value of an asset or a liability, the Group and the Company use observable market data as far as possible. Fair value is categorised into different levels in a fair value hierarchy based on the input used in the valuation technique as follows:
Level 1: Quoted prices (unadjusted) in active markets for identical assets or liabilities that the Group can access at the measurement date.
Level 2: Inputs other than quoted prices included within Level 1 that are observable for the asset or liability, either directly or indirectly.
Level 3: Unobservable inputs for the asset or liability.
The Group and the Company recognise transfers between levels of the fair value hierarchy as of the date of the event or change in circumstances that caused the transfers.
3.18 Contingencies
A contingent liability or asset is a possible obligation or asset that arises from past events and whose existence will be confirmed only by the occurrence or non-occurrence of uncertain future event(s) not wholly within the control of the Group and of the Company.
Contingent liability is also referred as a present obligation that arises from past events but is not recognised because:
(a) it is not probable that an outflow of resources embodying economic benefits will be required to settle the obligation; or
(b) the amount of the obligation cannot be measured with sufficient reliability.
Contingent liabilities and assets are not recognised in the statements of financial position.
54
Notes to the Financial Statements (cont’d)
3. SIGNIFICANT ACCOUNTING POLICIES (CONT’D)
3.19 Earnings Per Ordinary Share
The Group presents basic and diluted earnings per share data for its ordinary shares (“EPS”).
Basic EPS is calculated by dividing the profit or loss attributable to ordinary shareholders of the Company by the weighted average number of ordinary shares outstanding during the period, adjusted for own shares held.
Diluted EPS is determined by adjusting the profit or loss attributable to ordinary shareholders and the weighted average number of ordinary shares outstanding, adjusted for own shares held, for the effects of all dilutive potential ordinary shares.
4. SIGNIFICANT ACCOUNTING JUDGEMENTS, ESTIMATES AND ASSUMPTIONS
Significant areas of estimation, uncertainty and critical judgements in applying accounting policies that have significant effect in determining the amount recognised in the financial year include the following:
(a) Classification between operating lease and finance lease for leasehold land
The Group has developed certain criteria based on MFRS 117 Leases in making judgement whether a leasehold land should be classified either as operating lease or finance lease.
Finance lease is a lease that transfers substantially all the risks and rewards incidental to ownership of an assets and operating lease is a lease that does not transfer substantially all the risks and rewards incidental to ownership. If the leasehold land meets the criteria of the financial lease, the lease will be classified as property, plant and equipment if it is for own use. Judgements are made on the individual leasehold land to determine whether the leasehold land qualifies as operating lease or finance lease.
The Group has classified the leases period of more than 50 years as finance leases as they have met the criteria of a finance lease under MFRS 117.
(b) Depreciation and useful lives of property, plant and equipment
As disclosed in Note 3.3, the Group and the Company review the residual values, useful lives and depreciation methods at the end of each reporting period. Estimates are applied in the selection of the depreciation method, the useful lives and the residual values. The actual consumption of the economic benefits of the property, plant and equipment may differ from the estimates applied and therefore, future depreciation charges could be revised.
The carrying amounts of the Group’s and the Company’s property, plant and equipment are disclosed in Note 5.
(c) Impairment of investment in subsidiary companies and recoverability of amount owing by subsidiary companies
The Company tests investment in subsidiary companies and amount owing by subsidiary companies for impairment in accordance with its accounting policy. The assessment of the net tangible assets of the subsidiary companies affects the result of the impairment test. Costs of investments in subsidiary companies which have ceased operations were impaired up to net assets of the subsidiary companies. The impairment made on investment in subsidiary companies entails an impairment to be made to the amount owing by these subsidiary companies.
55HWA TAI INDUSTRIES BERHAD I Annual Report 2015
Notes to the Financial Statements (cont’d)
4. SIGNIFICANT ACCOUNTING JUDGEMENTS, ESTIMATES AND ASSUMPTIONS (CONT’D)
(c) Impairment of investment in subsidiary companies and recoverability of amount owing by subsidiary companies (cont’d)
Significant judgement is required in the estimation of the present value of future cash flows to be generated by the subsidiary companies, which involve uncertainties and are significantly affected by assumptions used and judgement made regarding estimates of future cash flows and discount rates. Changes in assumptions could significantly affect the results of the Company’s tests for impairment of investment in subsidiary companies and amount owing by subsidiary companies. The carrying amounts of the Company’s investment in subsidiaries are disclosed in Note 7.
(d) Impairment of property, plant and equipment
The Group and the Company review the carrying amount of its property, plant and equipment, to determine whether there is an indication that those assets have suffered an impairment loss in accordance with relevant accounting policies on the property, plant and equipment. Independent professional valuations to determine the carrying amount of these assets will be procured when the need arise.
As at the end of the financial years under review, the directors are of the view that there is no indication of impairment to these assets and therefore no independent professional valuation was procured by the Group during the financial year to determine the carrying amount of these assets. The carrying amounts of property, plant and equipment are disclosed in Note 5 to the financial statements.
(e) Write-down of obsolete or slow moving inventories
The Group and the Company write down their obsolete or slow moving inventories based on the assessment of their estimated net selling price. Inventories are written down when events or changes in circumstances indicate that the carrying amounts may not be recoverable. The management specifically analyses sales trend and current economic trends when making a judgement to evaluate the adequacy of the write-down of obsolete or slow moving inventories. Where expectations differ from the original estimates, the differences will impact the carrying amount of inventories. The carrying amounts of the Group’s and the Company’s inventories are disclosed in Note 9.
(f) Impairment of receivables
The Group assesses at each reporting date whether there is any objective evidence that a financial asset is impaired. To determine whether there is objective evidence of impairment, the Group considers factors such as the probability of insolvency or significant financial difficulties of the debtor and default or significant delay in payments.
Where there is objective evidence of impairment, the amount and timing of future cash flows are estimated based on historical loss experience for assets with similar credit risk characteristics. The carrying amount of the Group’s receivable at the reporting date is disclosed in Note 10 to the financial statements.
(g) Taxation
Significant judgement is required in determining the capital allowances and deductibility of certain expenses during the estimation of the provision for income taxes. There are many transactions and calculations for which the ultimate tax determination is uncertain during the course of business. Where the final tax outcome of these matters is different from the amounts that were initially recorded, such differences will impact the income tax and deferred income tax provisions in the period in which such determination is made. The income tax expense of the Group and the Company are disclosed in Note 19.
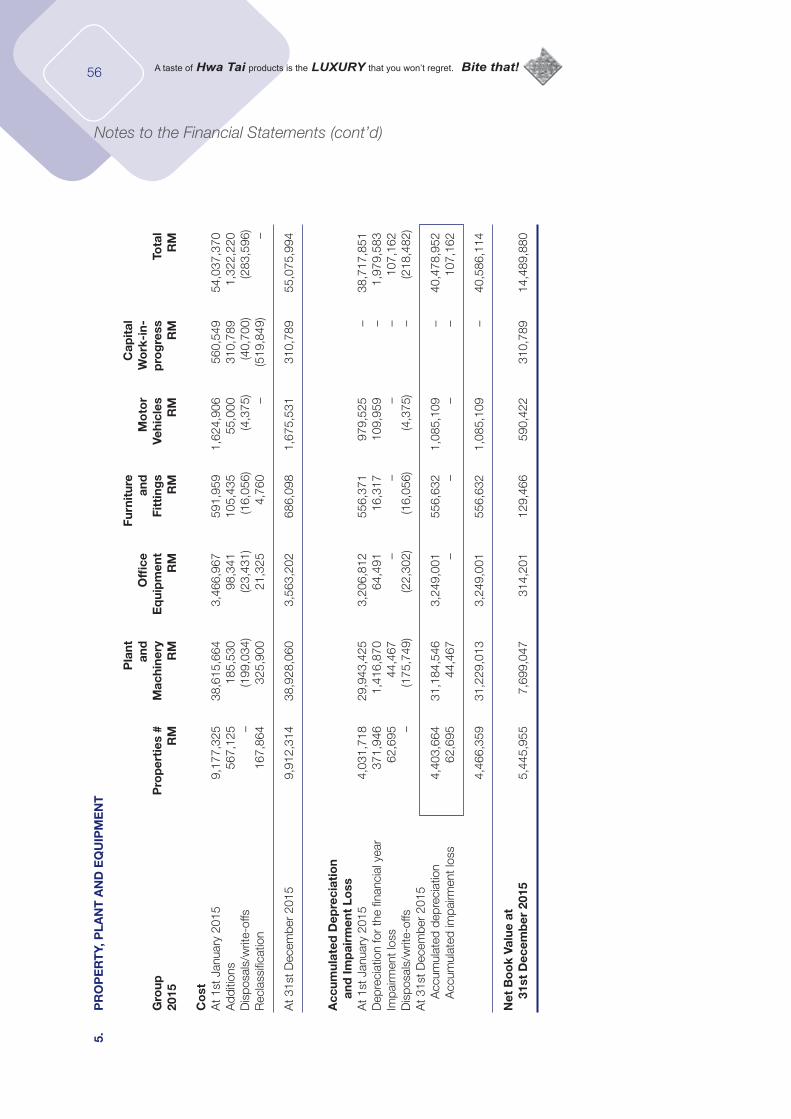
56
Notes to the Financial Statements (cont’d)
5.
PR
OP
ER
TY,
PLA
NT
AN
D E
QU
IPM
EN
T
P
lant
Furn
itur
e
Cap
ital
and
O
ffice
an
d
Mo
tor
Wo
rk-i
n-
Gro
up
Pro
per
ties
#
Mac
hine
ry
Eq
uip
men
t Fi
ttin
gs
Vehi
cles
p
rog
ress
To
tal
2015
R
M
RM
R
M
RM
R
M
RM
R
M
Co
stA
t 1st
Jan
uary
201
5 9
,177
,325
3
8,61
5,66
4
3,4
66,9
67
591
,959
1
,624
,906
5
60,5
49
54,
037,
370
Add
ition
s 5
67,1
25
185
,530
9
8,34
1
105
,435
5
5,00
0
310
,789
1
,322
,220
D
ispo
sals
/writ
e-of
fs
–
(199
,034
) (2
3,43
1)
(16,
056)
(4
,375
) (4
0,70
0)
(283
,596
)R
ecla
ssifi
catio
n 1
67,8
64
325
,900
2
1,32
5
4,7
60
–
(519
,849
) –
At 3
1st D
ecem
ber
2015
9
,912
,314
3
8,92
8,06
0
3,5
63,2
02
686
,098
1
,675
,531
3
10,7
89
55,
075,
994
Acc
umul
ated
Dep
reci
atio
n
and
Imp
airm
ent
Loss
At 1
st J
anua
ry 2
015
4,0
31,7
18
29,
943,
425
3
,206
,812
5
56,3
71
979
,525
–
38,
717,
851
Dep
reci
atio
n fo
r th
e fin
anci
al y
ear
371
,946
1
,416
,870
6
4,49
1
16,
317
1
09,9
59
–
1,9
79,5
83
Impa
irmen
t los
s 6
2,69
5
44,
467
–
– –
– 1
07,1
62
Dis
posa
ls/w
rite-
offs
–
(1
75,7
49)
(22,
302)
(1
6,05
6)
(4,3
75)
– (2
18,4
82)
At 3
1st D
ecem
ber
2015
Acc
umul
ated
dep
reci
atio
n 4
,403
,664
3
1,18
4,54
6
3,2
49,0
01
556
,632
1
,085
,109
–
4
0,47
8,95
2
Acc
umul
ated
impa
irmen
t los
s 6
2,69
5
44,
467
–
– –
–
107
,162
4,46
6,35
9
31,
229,
013
3
,249
,001
5
56,6
32
1,0
85,1
09
–
40,
586,
114
Net
Bo
ok
Valu
e at
31
st D
ecem
ber
201
5 5,
445,
955
7
,699
,047
3
14,2
01
129
,466
5
90,4
22
310
,789
1
4,48
9,88
0
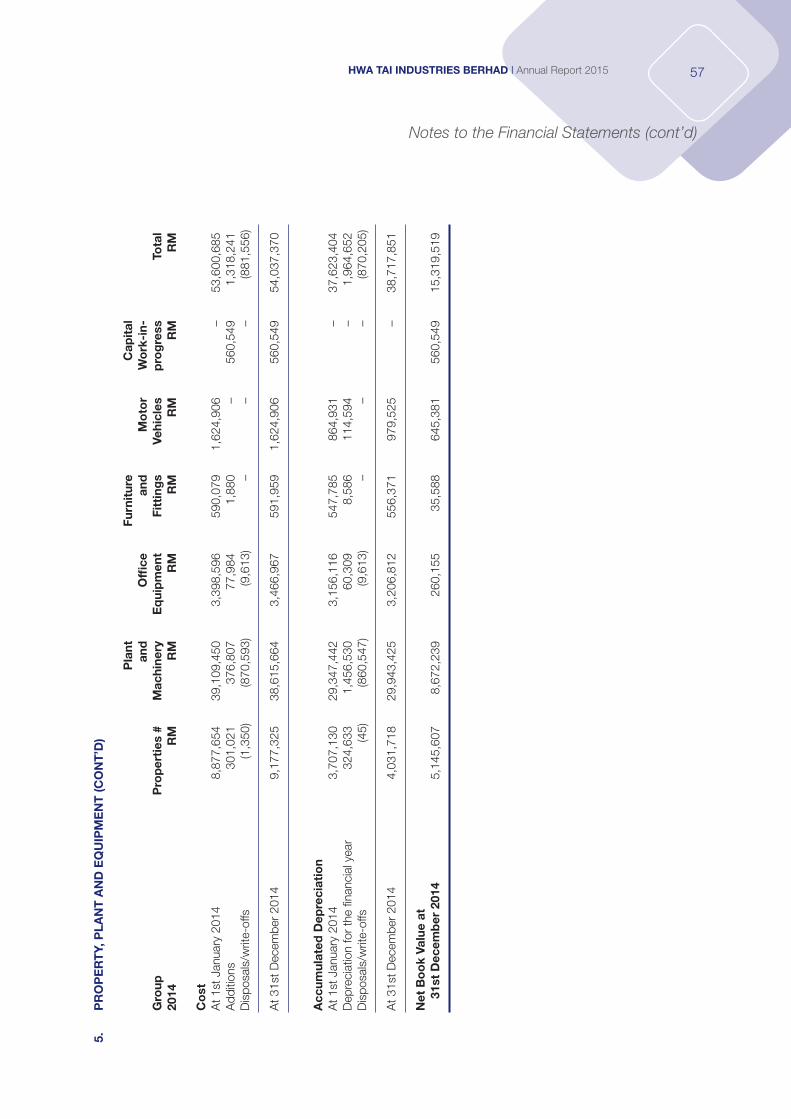
57HWA TAI INDUSTRIES BERHAD I Annual Report 2015
Notes to the Financial Statements (cont’d)
5.
PR
OP
ER
TY,
PLA
NT
AN
D E
QU
IPM
EN
T (C
ON
T’D
)
P
lant
Furn
itur
e
Cap
ital
and
O
ffice
an
d
Mo
tor
Wo
rk-i
n-
Gro
up
Pro
per
ties
#
Mac
hine
ry
Eq
uip
men
t Fi
ttin
gs
Vehi
cles
p
rog
ress
To
tal
2014
R
M
RM
R
M
RM
R
M
RM
R
M
Co
st
A
t 1st
Jan
uary
201
4 8
,877
,654
3
9,10
9,45
0
3,3
98,5
96
590
,079
1
,624
,906
–
53,6
00,6
85
Add
ition
s 3
01,0
21
376
,807
7
7,98
4
1,8
80
–
560
,549
1
,318
,241
D
ispo
sals
/writ
e-of
fs
(1,3
50)
(870
,593
) (9
,613
) –
–
–
(881
,556
)
At 3
1st D
ecem
ber
2014
9
,177
,325
3
8,61
5,66
4
3,4
66,9
67
591
,959
1
,624
,906
5
60,5
49
54,
037,
370
Acc
umul
ated
Dep
reci
atio
nA
t 1st
Jan
uary
201
4 3
,707
,130
2
9,34
7,44
2
3,1
56,1
16
547
,785
8
64,9
31
–
37,
623,
404
Dep
reci
atio
n fo
r th
e fin
anci
al y
ear
324
,633
1
,456
,530
6
0,30
9
8,5
86
114
,594
–
1
,964
,652
D
ispo
sals
/writ
e-of
fs
(45)
(8
60,5
47)
(9,6
13)
– –
–
(870
,205
)
At 3
1st D
ecem
ber
2014
4
,031
,718
2
9,94
3,42
5
3,2
06,8
12
556
,371
9
79,5
25
–
38,
717,
851
Net
Bo
ok
Valu
e at
31
st D
ecem
ber
201
4 5
,145
,607
8
,672
,239
2
60,1
55
35,
588
6
45,3
81
560
,549
1
5,31
9,51
9
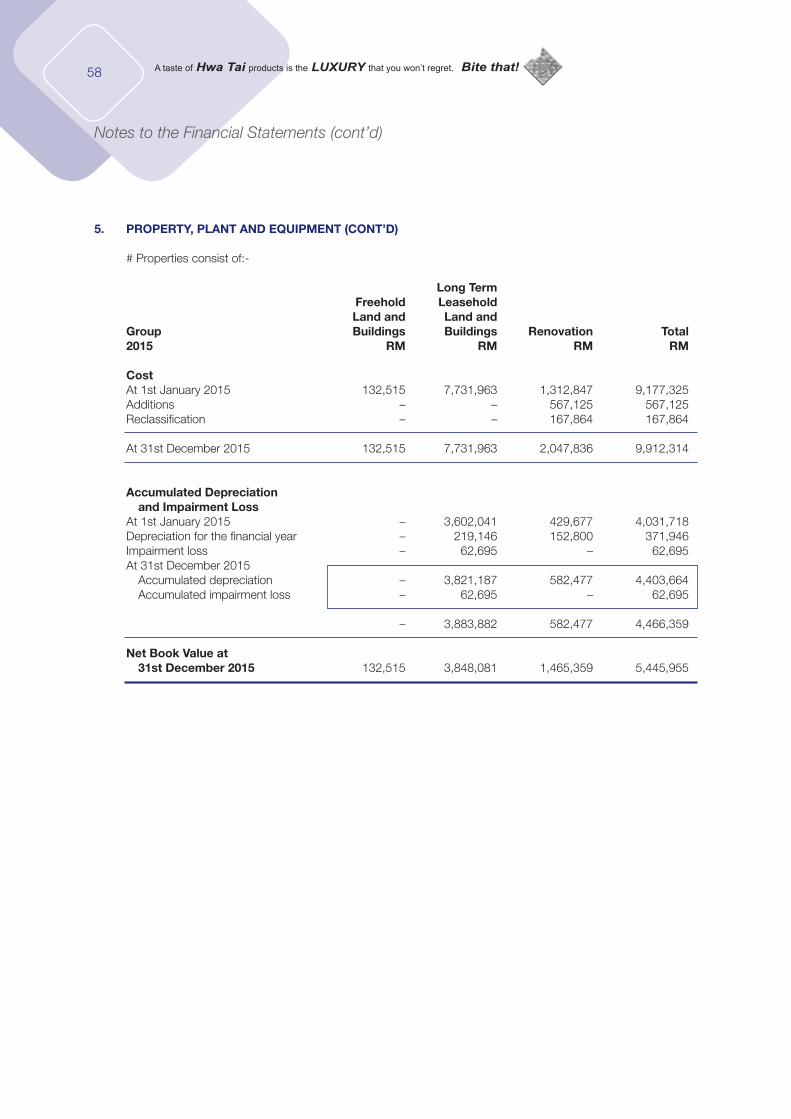
58
Notes to the Financial Statements (cont’d)
5. PROPERTY, PLANT AND EQUIPMENT (CONT’D)
# Properties consist of:-
Long Term Freehold Leasehold Land and Land and Group Buildings Buildings Renovation Total2015 RM RM RM RM CostAt 1st January 2015 132,515 7,731,963 1,312,847 9,177,325 Additions – – 567,125 567,125 Reclassification – – 167,864 167,864
At 31st December 2015 132,515 7,731,963 2,047,836 9,912,314
Accumulated Depreciation and Impairment Loss At 1st January 2015 – 3,602,041 429,677 4,031,718 Depreciation for the financial year – 219,146 152,800 371,946 Impairment loss – 62,695 – 62,695 At 31st December 2015 Accumulated depreciation – 3,821,187 582,477 4,403,664 Accumulated impairment loss – 62,695 – 62,695
– 3,883,882 582,477 4,466,359
Net Book Value at 31st December 2015 132,515 3,848,081 1,465,359 5,445,955
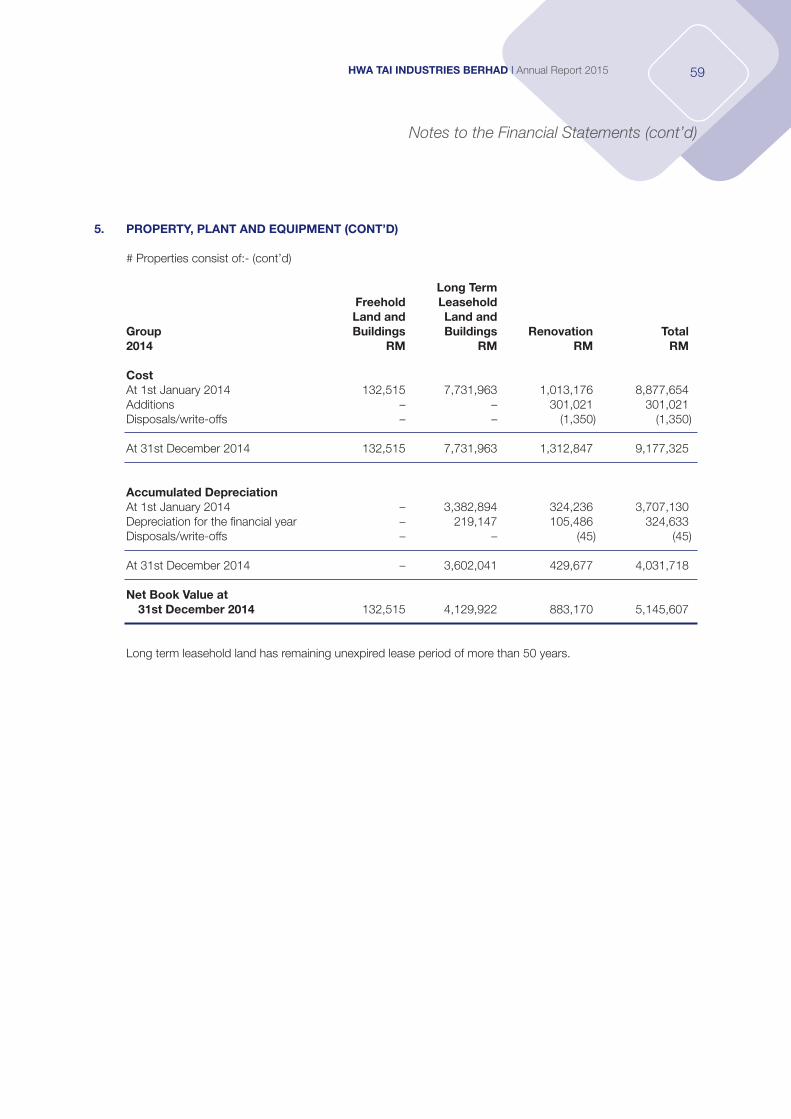
59HWA TAI INDUSTRIES BERHAD I Annual Report 2015
Notes to the Financial Statements (cont’d)
5. PROPERTY, PLANT AND EQUIPMENT (CONT’D)
# Properties consist of:- (cont’d)
Long Term Freehold Leasehold Land and Land and Group Buildings Buildings Renovation Total2014 RM RM RM RM
Cost At 1st January 2014 132,515 7,731,963 1,013,176 8,877,654 Additions – – 301,021 301,021 Disposals/write-offs – – (1,350) (1,350)
At 31st December 2014 132,515 7,731,963 1,312,847 9,177,325 Accumulated DepreciationAt 1st January 2014 – 3,382,894 324,236 3,707,130 Depreciation for the financial year – 219,147 105,486 324,633 Disposals/write-offs – – (45) (45)
At 31st December 2014 – 3,602,041 429,677 4,031,718
Net Book Value at 31st December 2014 132,515 4,129,922 883,170 5,145,607
Long term leasehold land has remaining unexpired lease period of more than 50 years.
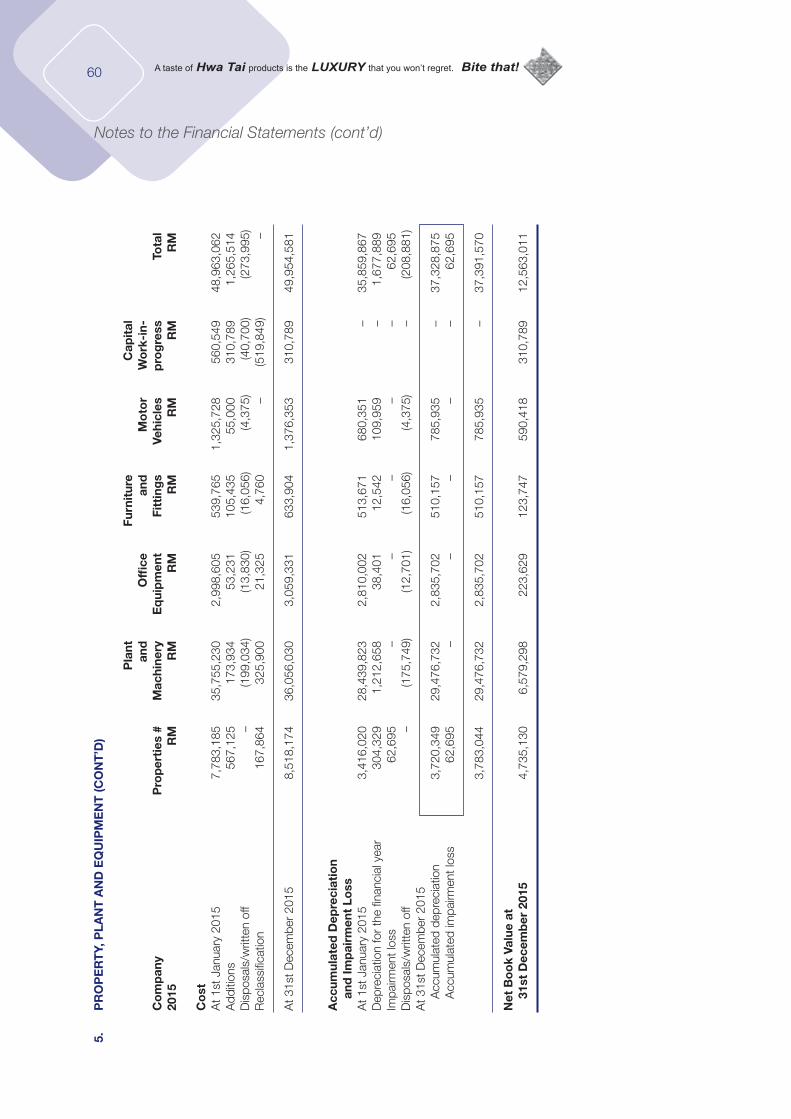
60
Notes to the Financial Statements (cont’d)
5.
PR
OP
ER
TY,
PLA
NT
AN
D E
QU
IPM
EN
T (C
ON
T’D
)
P
lant
Furn
itur
e
Cap
ital
and
O
ffice
an
d
Mo
tor
Wo
rk-i
n-
Co
mp
any
Pro
per
ties
#
Mac
hine
ry
Eq
uip
men
t Fi
ttin
gs
Vehi
cles
p
rog
ress
To
tal
2015
R
M
RM
R
M
RM
R
M
RM
R
M
Co
stA
t 1st
Jan
uary
201
5 7
,783
,185
3
5,75
5,23
0
2,9
98,6
05
539
,765
1
,325
,728
5
60,5
49
48,
963,
062
Add
ition
s 5
67,1
25
173
,934
5
3,23
1
105
,435
5
5,00
0
310
,789
1
,265
,514
D
ispo
sals
/writ
ten
off
–
(199
,034
) (1
3,83
0)
(16,
056)
(4
,375
) (4
0,70
0)
(273
,995
)R
ecla
ssifi
catio
n 1
67,8
64
325
,900
2
1,32
5
4,7
60
–
(519
,849
) –
At 3
1st D
ecem
ber
2015
8
,518
,174
3
6,05
6,03
0
3,0
59,3
31
633
,904
1
,376
,353
3
10,7
89
49,
954,
581
Acc
umul
ated
Dep
reci
atio
n
and
Imp
airm
ent
Loss
At 1
st J
anua
ry 2
015
3,4
16,0
20
28,
439,
823
2
,810
,002
5
13,6
71
680
,351
–
3
5,85
9,86
7 D
epre
ciat
ion
for
the
finan
cial
yea
r 3
04,3
29
1,2
12,6
58
38,
401
1
2,54
2
109
,959
–
1,6
77,8
89
Impa
irmen
t los
s 6
2,69
5
–
–
– –
–
6
2,69
5 D
ispo
sals
/writ
ten
off
–
(175
,749
) (1
2,70
1)
(16,
056)
(4
,375
) –
(2
08,8
81)
At 3
1st D
ecem
ber
2015
Acc
umul
ated
dep
reci
atio
n 3
,720
,349
2
9,47
6,73
2
2,8
35,7
02
510
,157
7
85,9
35
– 3
7,32
8,87
5
Acc
umul
ated
impa
irmen
t los
s 6
2,69
5
–
– –
– –
6
2,69
5
3,78
3,04
4
29,
476,
732
2
,835
,702
5
10,1
57
785
,935
–
37,
391,
570
Net
Bo
ok
Valu
e at
31st
Dec
emb
er 2
015
4,7
35,1
30
6,5
79,2
98
223
,629
1
23,7
47
590
,418
3
10,7
89
12,
563,
011

61HWA TAI INDUSTRIES BERHAD I Annual Report 2015
Notes to the Financial Statements (cont’d)
5.
PR
OP
ER
TY,
PLA
NT
AN
D E
QU
IPM
EN
T (C
ON
T’D
)
P
lant
Furn
itur
e
Cap
ital
and
O
ffice
an
d
Mo
tor
Wo
rk-i
n-
Co
mp
any
Pro
per
ties
#
Mac
hine
ry
Eq
uip
men
t Fi
ttin
gs
Vehi
cles
p
rog
ress
To
tal
2014
R
M
RM
R
M
RM
R
M
RM
R
M
Co
stA
t 1st
Jan
uary
201
4 7
,483
,514
3
5,86
1,55
0
2,9
53,8
50
537
,885
1
,325
,728
–
4
8,16
2,52
7 A
dditi
ons
301
,021
3
23,2
19
46,
905
1
,880
–
560
,549
1
,233
,574
D
ispo
sals
/writ
e-of
fs
(1,3
50)
(429
,539
) (2
,150
) –
–
–
(433
,039
)
At 3
1st D
ecem
ber
2014
7
,783
,185
3
5,75
5,23
0
2,9
98,6
05
539
,765
1
,325
,728
5
60,5
49
48,
963,
062
Acc
umul
ated
Dep
reci
atio
n
A
t 1st
Jan
uary
201
4 3
,159
,047
2
7,60
3,93
6
2,7
78,4
16
508
,860
5
65,7
57
–
34,
616,
016
Dep
reci
atio
n fo
r th
e fin
anci
al y
ear
257
,018
1
,255
,380
3
3,73
6
4,8
11
114
,594
–
1,6
65,5
39
Dis
posa
ls/w
rite-
offs
(4
5)
(419
,493
) (2
,150
) –
– –
(4
21,6
88)
At 3
1st D
ecem
ber
2014
3
,416
,020
2
8,43
9,82
3
2,8
10,0
02
513
,671
6
80,3
51
–
35,
859,
867
N
et B
oo
k Va
lue
at
31st
Dec
emb
er 2
014
4,3
67,1
65
7,3
15,4
07
188
,603
2
6,09
4
645
,377
5
60,5
49
13,
103,
195
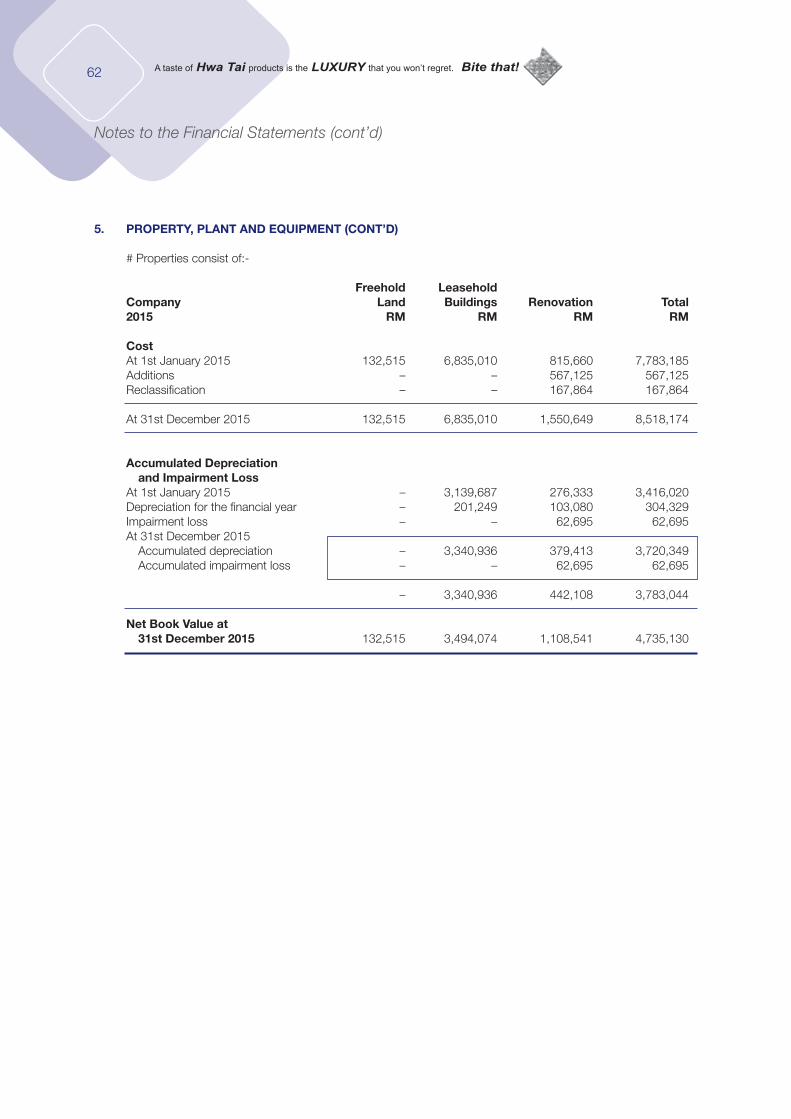
62
Notes to the Financial Statements (cont’d)
5. PROPERTY, PLANT AND EQUIPMENT (CONT’D)
# Properties consist of:-
Freehold Leasehold Company Land Buildings Renovation Total2015 RM RM RM RM
CostAt 1st January 2015 132,515 6,835,010 815,660 7,783,185 Additions – – 567,125 567,125 Reclassification – – 167,864 167,864
At 31st December 2015 132,515 6,835,010 1,550,649 8,518,174
Accumulated Depreciation and Impairment LossAt 1st January 2015 – 3,139,687 276,333 3,416,020 Depreciation for the financial year – 201,249 103,080 304,329 Impairment loss – – 62,695 62,695 At 31st December 2015 Accumulated depreciation – 3,340,936 379,413 3,720,349 Accumulated impairment loss – – 62,695 62,695
– 3,340,936 442,108 3,783,044
Net Book Value at 31st December 2015 132,515 3,494,074 1,108,541 4,735,130
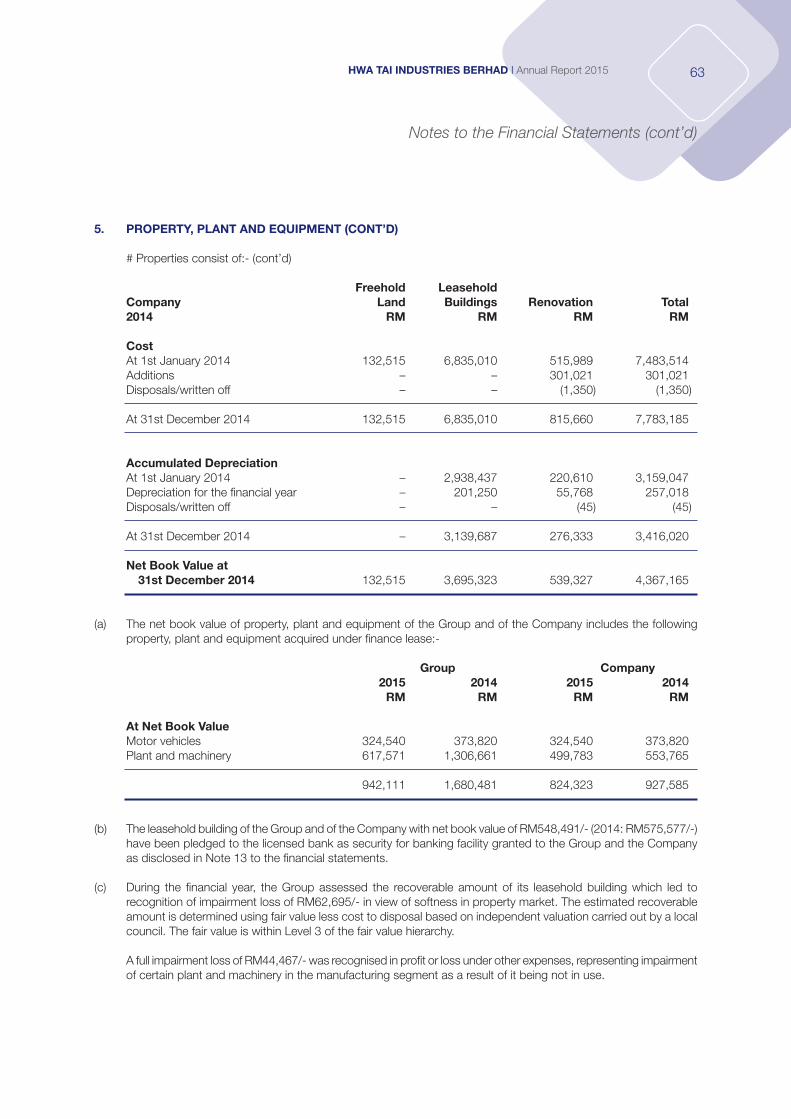
63HWA TAI INDUSTRIES BERHAD I Annual Report 2015
Notes to the Financial Statements (cont’d)
5. PROPERTY, PLANT AND EQUIPMENT (CONT’D)
# Properties consist of:- (cont’d)
Freehold LeaseholdCompany Land Buildings Renovation Total2014 RM RM RM RM
Cost At 1st January 2014 132,515 6,835,010 515,989 7,483,514 Additions – – 301,021 301,021 Disposals/written off – – (1,350) (1,350)
At 31st December 2014 132,515 6,835,010 815,660 7,783,185
Accumulated DepreciationAt 1st January 2014 – 2,938,437 220,610 3,159,047 Depreciation for the financial year – 201,250 55,768 257,018 Disposals/written off – – (45) (45)
At 31st December 2014 – 3,139,687 276,333 3,416,020
Net Book Value at 31st December 2014 132,515 3,695,323 539,327 4,367,165
(a) The net book value of property, plant and equipment of the Group and of the Company includes the following property, plant and equipment acquired under finance lease:-
Group Company 2015 2014 2015 2014 RM RM RM RM
At Net Book Value Motor vehicles 324,540 373,820 324,540 373,820 Plant and machinery 617,571 1,306,661 499,783 553,765
942,111 1,680,481 824,323 927,585
(b) The leasehold building of the Group and of the Company with net book value of RM548,491/- (2014: RM575,577/-) have been pledged to the licensed bank as security for banking facility granted to the Group and the Company as disclosed in Note 13 to the financial statements.
(c) During the financial year, the Group assessed the recoverable amount of its leasehold building which led to recognition of impairment loss of RM62,695/- in view of softness in property market. The estimated recoverable amount is determined using fair value less cost to disposal based on independent valuation carried out by a local council. The fair value is within Level 3 of the fair value hierarchy.
A full impairment loss of RM44,467/- was recognised in profit or loss under other expenses, representing impairment of certain plant and machinery in the manufacturing segment as a result of it being not in use.
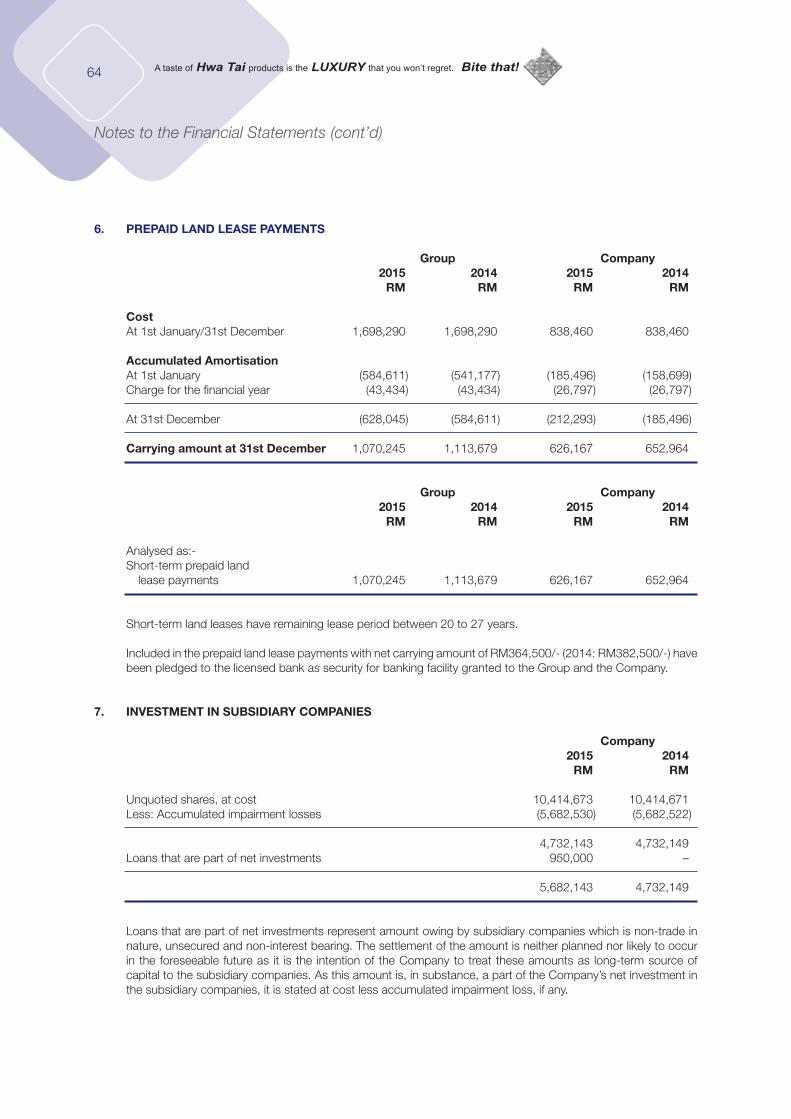
64
Notes to the Financial Statements (cont’d)
6. PREPAID LAND LEASE PAYMENTS
Group Company 2015 2014 2015 2014 RM RM RM RM
Cost At 1st January/31st December 1,698,290 1,698,290 838,460 838,460
Accumulated AmortisationAt 1st January (584,611) (541,177) (185,496) (158,699)Charge for the financial year (43,434) (43,434) (26,797) (26,797)
At 31st December (628,045) (584,611) (212,293) (185,496)
Carrying amount at 31st December 1,070,245 1,113,679 626,167 652,964
Group Company 2015 2014 2015 2014 RM RM RM RM
Analysed as:-Short-term prepaid land lease payments 1,070,245 1,113,679 626,167 652,964
Short-term land leases have remaining lease period between 20 to 27 years.
Included in the prepaid land lease payments with net carrying amount of RM364,500/- (2014: RM382,500/-) have been pledged to the licensed bank as security for banking facility granted to the Group and the Company.
7. INVESTMENT IN SUBSIDIARY COMPANIES
Company 2015 2014 RM RM
Unquoted shares, at cost 10,414,673 10,414,671 Less: Accumulated impairment losses (5,682,530) (5,682,522)
4,732,143 4,732,149 Loans that are part of net investments 950,000 –
5,682,143 4,732,149
Loans that are part of net investments represent amount owing by subsidiary companies which is non-trade in nature, unsecured and non-interest bearing. The settlement of the amount is neither planned nor likely to occur in the foreseeable future as it is the intention of the Company to treat these amounts as long-term source of capital to the subsidiary companies. As this amount is, in substance, a part of the Company’s net investment in the subsidiary companies, it is stated at cost less accumulated impairment loss, if any.
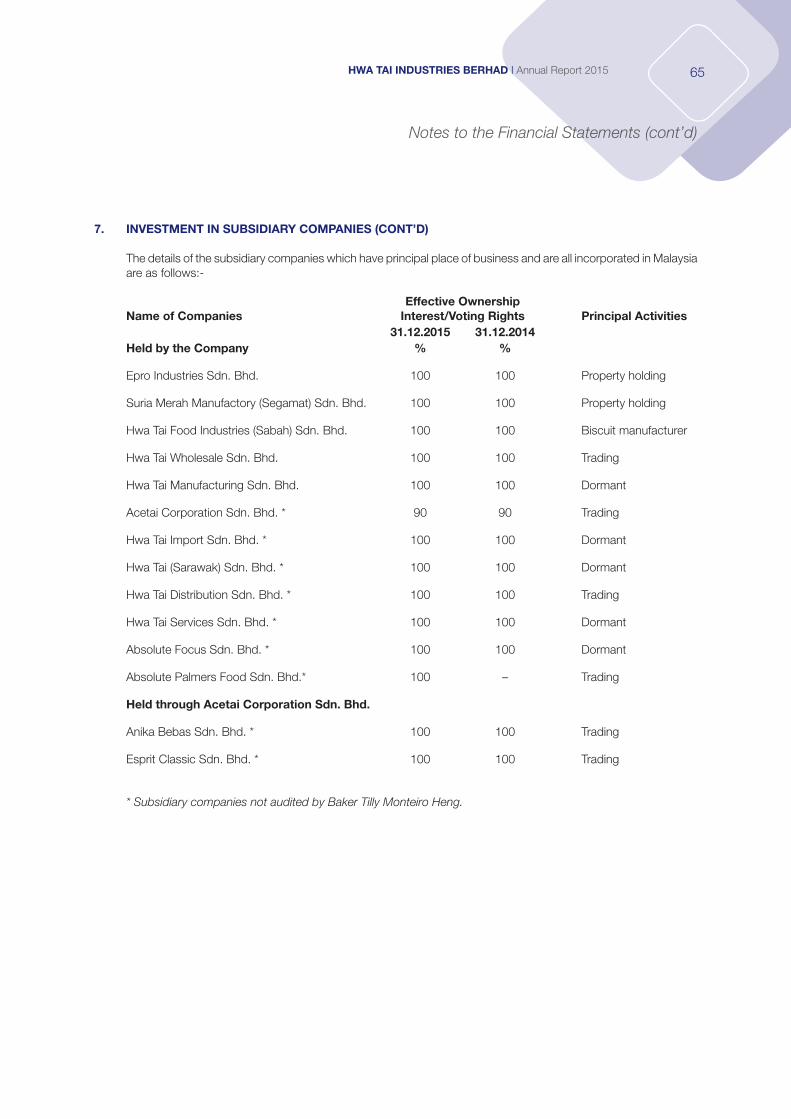
65HWA TAI INDUSTRIES BERHAD I Annual Report 2015
Notes to the Financial Statements (cont’d)
7. INVESTMENT IN SUBSIDIARY COMPANIES (CONT’D)
The details of the subsidiary companies which have principal place of business and are all incorporated in Malaysia are as follows:-
Name of CompaniesEffective Ownership
Interest/Voting Rights Principal Activities31.12.2015 31.12.2014
Held by the Company % %
Epro Industries Sdn. Bhd. 100 100 Property holding
Suria Merah Manufactory (Segamat) Sdn. Bhd. 100 100 Property holding
Hwa Tai Food Industries (Sabah) Sdn. Bhd. 100 100 Biscuit manufacturer
Hwa Tai Wholesale Sdn. Bhd. 100 100 Trading
Hwa Tai Manufacturing Sdn. Bhd. 100 100 Dormant
Acetai Corporation Sdn. Bhd. * 90 90 Trading
Hwa Tai Import Sdn. Bhd. * 100 100 Dormant
Hwa Tai (Sarawak) Sdn. Bhd. * 100 100 Dormant
Hwa Tai Distribution Sdn. Bhd. * 100 100 Trading
Hwa Tai Services Sdn. Bhd. * 100 100 Dormant
Absolute Focus Sdn. Bhd. * 100 100 Dormant
Absolute Palmers Food Sdn. Bhd.* 100 – Trading
Held through Acetai Corporation Sdn. Bhd.
Anika Bebas Sdn. Bhd. * 100 100 Trading
Esprit Classic Sdn. Bhd. * 100 100 Trading
* Subsidiary companies not audited by Baker Tilly Monteiro Heng.
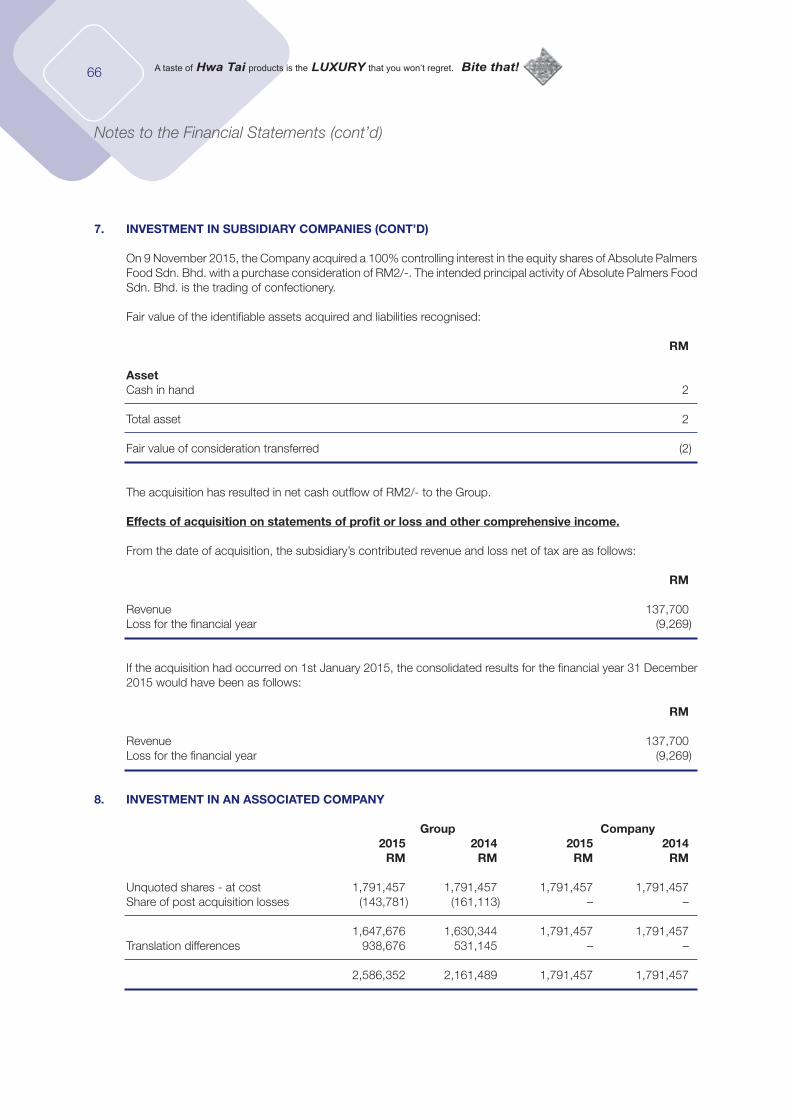
66
Notes to the Financial Statements (cont’d)
7. INVESTMENT IN SUBSIDIARY COMPANIES (CONT’D)
On 9 November 2015, the Company acquired a 100% controlling interest in the equity shares of Absolute Palmers Food Sdn. Bhd. with a purchase consideration of RM2/-. The intended principal activity of Absolute Palmers Food Sdn. Bhd. is the trading of confectionery.
Fair value of the identifiable assets acquired and liabilities recognised:
RM
Asset Cash in hand 2
Total asset 2
Fair value of consideration transferred (2)
The acquisition has resulted in net cash outflow of RM2/- to the Group.
Effects of acquisition on statements of profit or loss and other comprehensive income.
From the date of acquisition, the subsidiary’s contributed revenue and loss net of tax are as follows:
RM
Revenue 137,700 Loss for the financial year (9,269)
If the acquisition had occurred on 1st January 2015, the consolidated results for the financial year 31 December 2015 would have been as follows:
RM
Revenue 137,700 Loss for the financial year (9,269)
8. INVESTMENT IN AN ASSOCIATED COMPANY
Group Company 2015 2014 2015 2014 RM RM RM RM
Unquoted shares - at cost 1,791,457 1,791,457 1,791,457 1,791,457 Share of post acquisition losses (143,781) (161,113) – –
1,647,676 1,630,344 1,791,457 1,791,457 Translation differences 938,676 531,145 – –
2,586,352 2,161,489 1,791,457 1,791,457
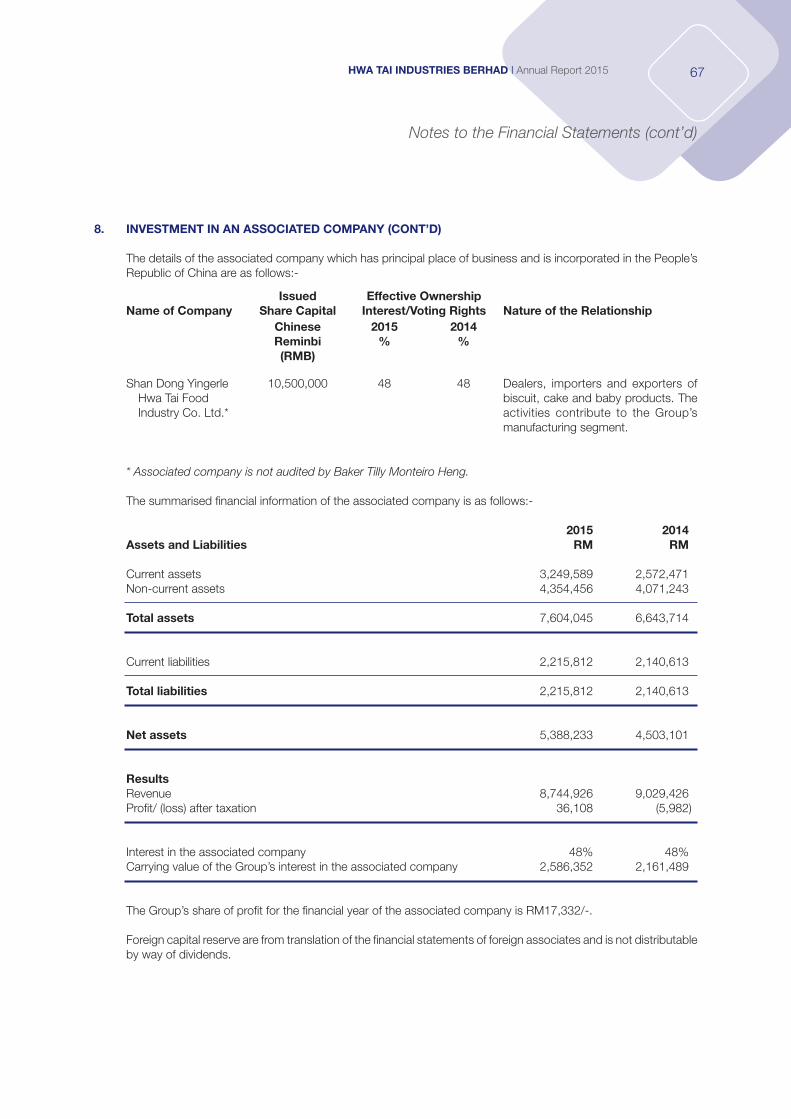
67HWA TAI INDUSTRIES BERHAD I Annual Report 2015
Notes to the Financial Statements (cont’d)
8. INVESTMENT IN AN ASSOCIATED COMPANY (CONT’D)
The details of the associated company which has principal place of business and is incorporated in the People’s Republic of China are as follows:-
Name of CompanyIssued
Share CapitalEffective Ownership
Interest/Voting Rights Nature of the RelationshipChineseReminbi (RMB)
2015%
2014%
Shan Dong Yingerle Hwa Tai Food Industry Co. Ltd.*
10,500,000 48 48 Dealers, importers and exporters of biscuit, cake and baby products. The activities contribute to the Group’s manufacturing segment.
* Associated company is not audited by Baker Tilly Monteiro Heng. The summarised financial information of the associated company is as follows:-
2015 2014Assets and Liabilities RM RM
Current assets 3,249,589 2,572,471 Non-current assets 4,354,456 4,071,243
Total assets 7,604,045 6,643,714
Current liabilities 2,215,812 2,140,613
Total liabilities 2,215,812 2,140,613
Net assets 5,388,233 4,503,101
ResultsRevenue 8,744,926 9,029,426 Profit/ (loss) after taxation 36,108 (5,982)
Interest in the associated company 48% 48%Carrying value of the Group’s interest in the associated company 2,586,352 2,161,489
The Group’s share of profit for the financial year of the associated company is RM17,332/-.
Foreign capital reserve are from translation of the financial statements of foreign associates and is not distributable by way of dividends.
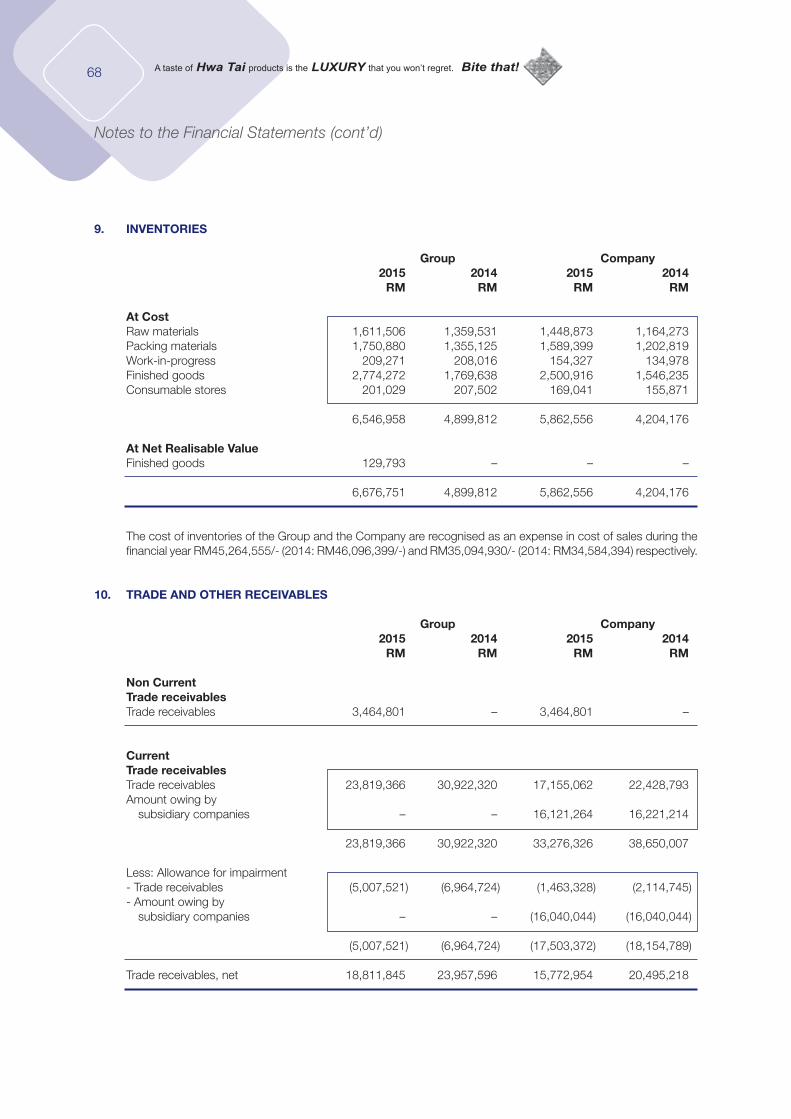
68
Notes to the Financial Statements (cont’d)
9. INVENTORIES
Group Company 2015 2014 2015 2014 RM RM RM RM
At CostRaw materials 1,611,506 1,359,531 1,448,873 1,164,273 Packing materials 1,750,880 1,355,125 1,589,399 1,202,819 Work-in-progress 209,271 208,016 154,327 134,978 Finished goods 2,774,272 1,769,638 2,500,916 1,546,235 Consumable stores 201,029 207,502 169,041 155,871
6,546,958 4,899,812 5,862,556 4,204,176
At Net Realisable ValueFinished goods 129,793 – – –
6,676,751 4,899,812 5,862,556 4,204,176
The cost of inventories of the Group and the Company are recognised as an expense in cost of sales during the financial year RM45,264,555/- (2014: RM46,096,399/-) and RM35,094,930/- (2014: RM34,584,394) respectively.
10. TRADE AND OTHER RECEIVABLES
Group Company 2015 2014 2015 2014 RM RM RM RM
Non CurrentTrade receivablesTrade receivables 3,464,801 – 3,464,801 –
CurrentTrade receivablesTrade receivables 23,819,366 30,922,320 17,155,062 22,428,793Amount owing by subsidiary companies – – 16,121,264 16,221,214
23,819,366 30,922,320 33,276,326 38,650,007
Less: Allowance for impairment - Trade receivables (5,007,521) (6,964,724) (1,463,328) (2,114,745)- Amount owing by subsidiary companies – – (16,040,044) (16,040,044)
(5,007,521) (6,964,724) (17,503,372) (18,154,789)
Trade receivables, net 18,811,845 23,957,596 15,772,954 20,495,218
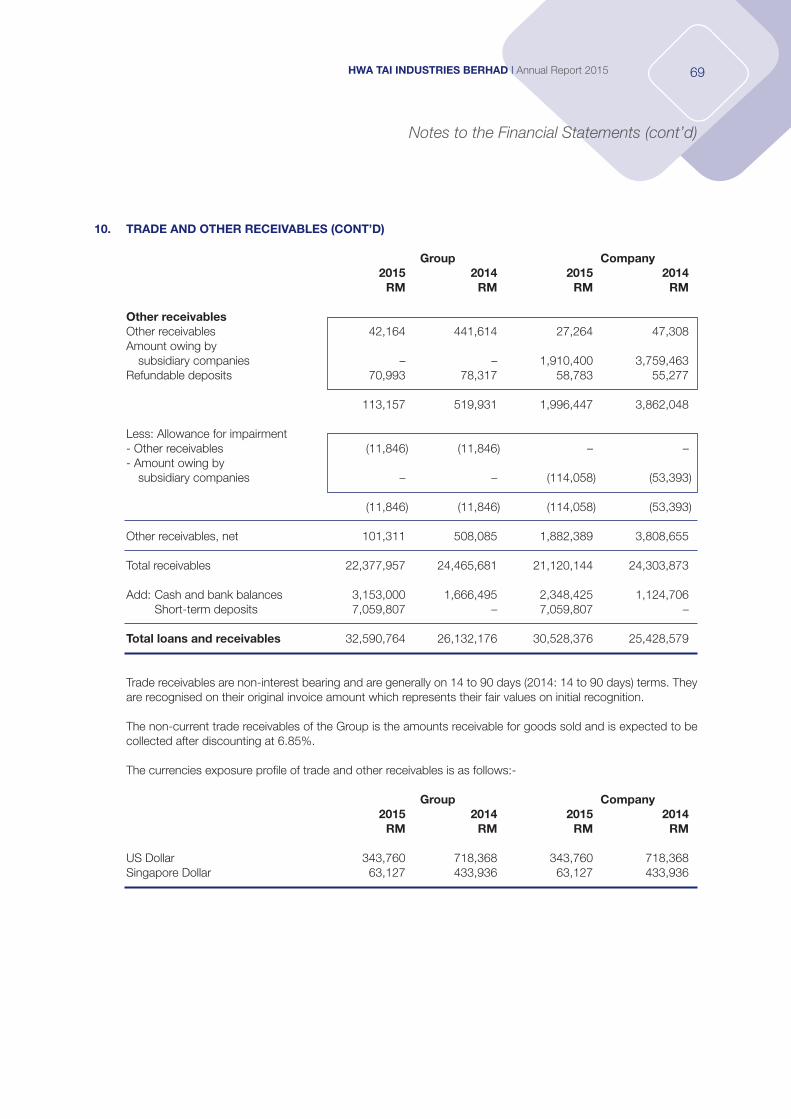
69HWA TAI INDUSTRIES BERHAD I Annual Report 2015
Notes to the Financial Statements (cont’d)
10. TRADE AND OTHER RECEIVABLES (CONT’D)
Group Company 2015 2014 2015 2014 RM RM RM RM
Other receivables Other receivables 42,164 441,614 27,264 47,308Amount owing by subsidiary companies – – 1,910,400 3,759,463Refundable deposits 70,993 78,317 58,783 55,277
113,157 519,931 1,996,447 3,862,048
Less: Allowance for impairment- Other receivables (11,846) (11,846) – –- Amount owing by subsidiary companies – – (114,058) (53,393)
(11,846) (11,846) (114,058) (53,393)
Other receivables, net 101,311 508,085 1,882,389 3,808,655
Total receivables 22,377,957 24,465,681 21,120,144 24,303,873
Add: Cash and bank balances 3,153,000 1,666,495 2,348,425 1,124,706 Short-term deposits 7,059,807 – 7,059,807 –
Total loans and receivables 32,590,764 26,132,176 30,528,376 25,428,579
Trade receivables are non-interest bearing and are generally on 14 to 90 days (2014: 14 to 90 days) terms. They are recognised on their original invoice amount which represents their fair values on initial recognition.
The non-current trade receivables of the Group is the amounts receivable for goods sold and is expected to be collected after discounting at 6.85%.
The currencies exposure profile of trade and other receivables is as follows:-
Group Company 2015 2014 2015 2014 RM RM RM RM
US Dollar 343,760 718,368 343,760 718,368 Singapore Dollar 63,127 433,936 63,127 433,936
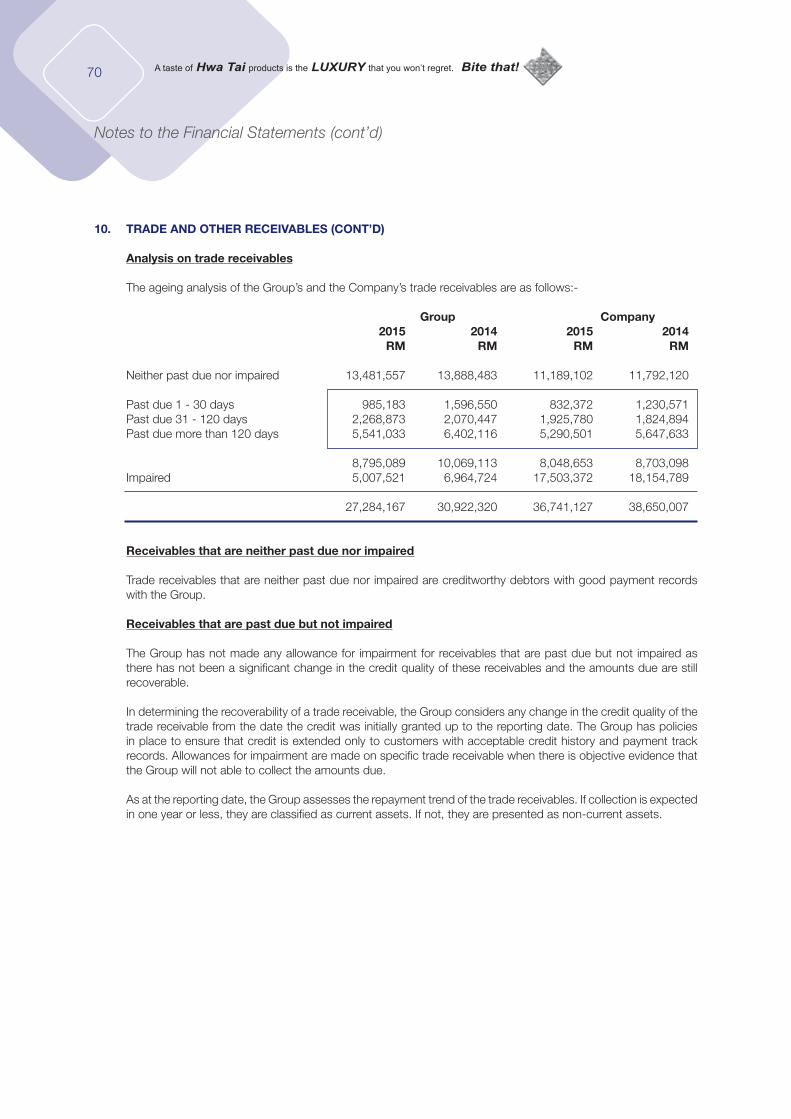
70
Notes to the Financial Statements (cont’d)
10. TRADE AND OTHER RECEIVABLES (CONT’D)
Analysis on trade receivables
The ageing analysis of the Group’s and the Company’s trade receivables are as follows:-
Group Company 2015 2014 2015 2014 RM RM RM RM
Neither past due nor impaired 13,481,557 13,888,483 11,189,102 11,792,120
Past due 1 - 30 days 985,183 1,596,550 832,372 1,230,571Past due 31 - 120 days 2,268,873 2,070,447 1,925,780 1,824,894Past due more than 120 days 5,541,033 6,402,116 5,290,501 5,647,633
8,795,089 10,069,113 8,048,653 8,703,098Impaired 5,007,521 6,964,724 17,503,372 18,154,789
27,284,167 30,922,320 36,741,127 38,650,007
Receivables that are neither past due nor impaired
Trade receivables that are neither past due nor impaired are creditworthy debtors with good payment records with the Group.
Receivables that are past due but not impaired
The Group has not made any allowance for impairment for receivables that are past due but not impaired as there has not been a significant change in the credit quality of these receivables and the amounts due are still recoverable.
In determining the recoverability of a trade receivable, the Group considers any change in the credit quality of the trade receivable from the date the credit was initially granted up to the reporting date. The Group has policies in place to ensure that credit is extended only to customers with acceptable credit history and payment track records. Allowances for impairment are made on specific trade receivable when there is objective evidence that the Group will not able to collect the amounts due.
As at the reporting date, the Group assesses the repayment trend of the trade receivables. If collection is expected in one year or less, they are classified as current assets. If not, they are presented as non-current assets.
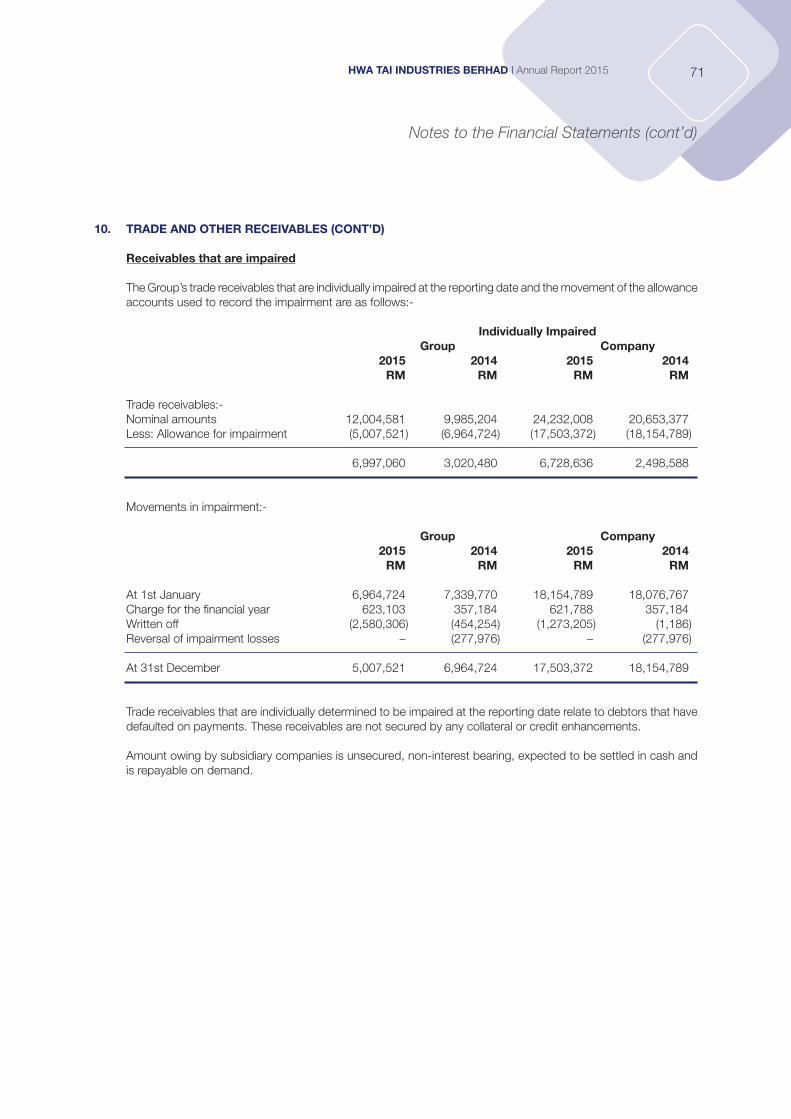
71HWA TAI INDUSTRIES BERHAD I Annual Report 2015
Notes to the Financial Statements (cont’d)
10. TRADE AND OTHER RECEIVABLES (CONT’D)
Receivables that are impaired
The Group’s trade receivables that are individually impaired at the reporting date and the movement of the allowance accounts used to record the impairment are as follows:-
Individually Impaired Group Company 2015 2014 2015 2014 RM RM RM RM
Trade receivables:-Nominal amounts 12,004,581 9,985,204 24,232,008 20,653,377 Less: Allowance for impairment (5,007,521) (6,964,724) (17,503,372) (18,154,789) 6,997,060 3,020,480 6,728,636 2,498,588
Movements in impairment:-
Group Company 2015 2014 2015 2014 RM RM RM RM
At 1st January 6,964,724 7,339,770 18,154,789 18,076,767 Charge for the financial year 623,103 357,184 621,788 357,184 Written off (2,580,306) (454,254) (1,273,205) (1,186)Reversal of impairment losses – (277,976) – (277,976)
At 31st December 5,007,521 6,964,724 17,503,372 18,154,789
Trade receivables that are individually determined to be impaired at the reporting date relate to debtors that have defaulted on payments. These receivables are not secured by any collateral or credit enhancements.
Amount owing by subsidiary companies is unsecured, non-interest bearing, expected to be settled in cash and is repayable on demand.
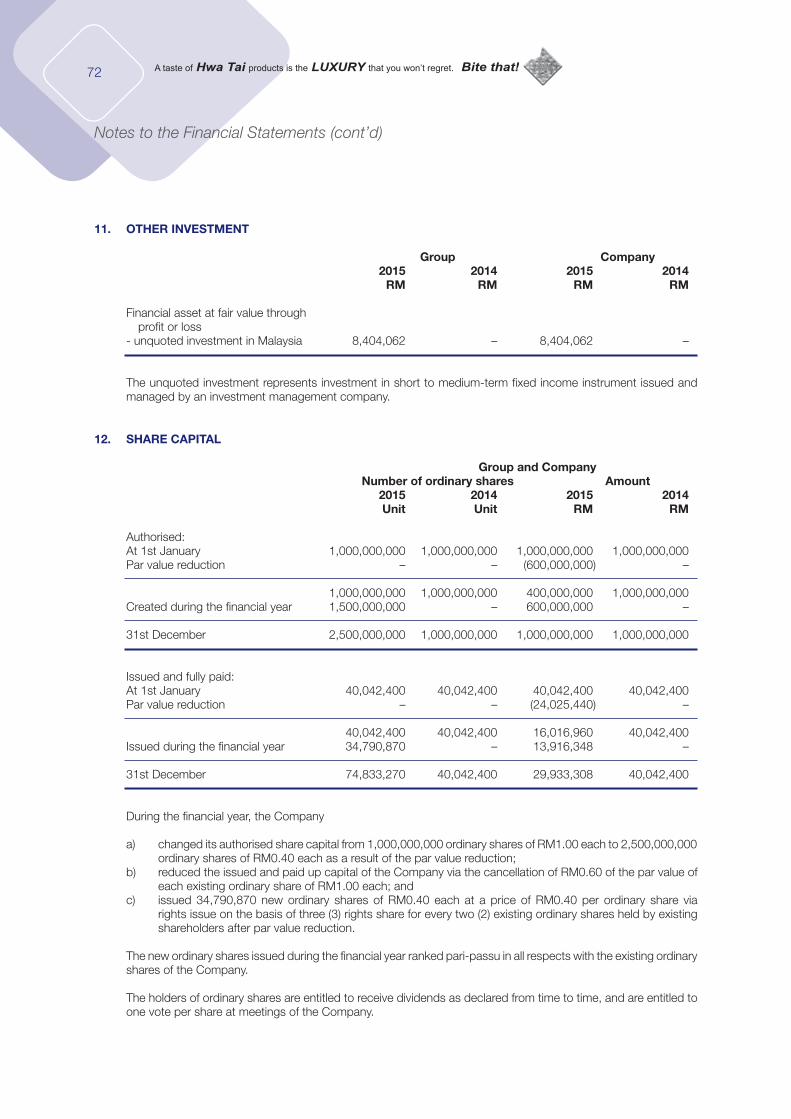
72
Notes to the Financial Statements (cont’d)
11. OTHER INVESTMENT
Group Company 2015 2014 2015 2014 RM RM RM RM
Financial asset at fair value through profit or loss- unquoted investment in Malaysia 8,404,062 – 8,404,062 –
The unquoted investment represents investment in short to medium-term fixed income instrument issued and
managed by an investment management company.
12. SHARE CAPITAL
Group and Company Number of ordinary shares Amount 2015 2014 2015 2014 Unit Unit RM RM
Authorised: At 1st January 1,000,000,000 1,000,000,000 1,000,000,000 1,000,000,000 Par value reduction – – (600,000,000) –
1,000,000,000 1,000,000,000 400,000,000 1,000,000,000 Created during the financial year 1,500,000,000 – 600,000,000 –
31st December 2,500,000,000 1,000,000,000 1,000,000,000 1,000,000,000
Issued and fully paid:At 1st January 40,042,400 40,042,400 40,042,400 40,042,400 Par value reduction – – (24,025,440) –
40,042,400 40,042,400 16,016,960 40,042,400 Issued during the financial year 34,790,870 – 13,916,348 – 31st December 74,833,270 40,042,400 29,933,308 40,042,400
During the financial year, the Company
a) changed its authorised share capital from 1,000,000,000 ordinary shares of RM1.00 each to 2,500,000,000 ordinary shares of RM0.40 each as a result of the par value reduction;
b) reduced the issued and paid up capital of the Company via the cancellation of RM0.60 of the par value of each existing ordinary share of RM1.00 each; and
c) issued 34,790,870 new ordinary shares of RM0.40 each at a price of RM0.40 per ordinary share via rights issue on the basis of three (3) rights share for every two (2) existing ordinary shares held by existing shareholders after par value reduction.
The new ordinary shares issued during the financial year ranked pari-passu in all respects with the existing ordinary shares of the Company.
The holders of ordinary shares are entitled to receive dividends as declared from time to time, and are entitled to one vote per share at meetings of the Company.
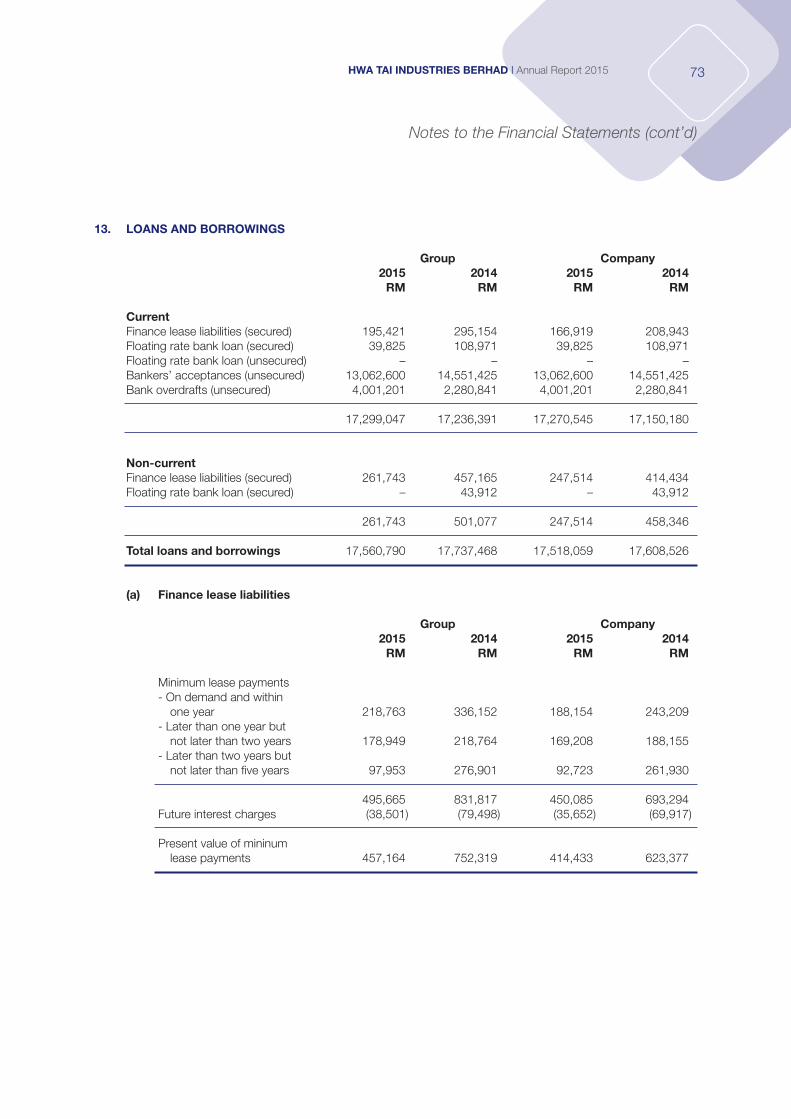
73HWA TAI INDUSTRIES BERHAD I Annual Report 2015
Notes to the Financial Statements (cont’d)
13. LOANS AND BORROWINGS
Group Company 2015 2014 2015 2014 RM RM RM RM
CurrentFinance lease liabilities (secured) 195,421 295,154 166,919 208,943 Floating rate bank loan (secured) 39,825 108,971 39,825 108,971Floating rate bank loan (unsecured) – – – –Bankers’ acceptances (unsecured) 13,062,600 14,551,425 13,062,600 14,551,425 Bank overdrafts (unsecured) 4,001,201 2,280,841 4,001,201 2,280,841
17,299,047 17,236,391 17,270,545 17,150,180
Non-currentFinance lease liabilities (secured) 261,743 457,165 247,514 414,434 Floating rate bank loan (secured) – 43,912 – 43,912
261,743 501,077 247,514 458,346
Total loans and borrowings 17,560,790 17,737,468 17,518,059 17,608,526
(a) Finance lease liabilities
Group Company 2015 2014 2015 2014 RM RM RM RM
Minimum lease payments- On demand and within one year 218,763 336,152 188,154 243,209 - Later than one year but not later than two years 178,949 218,764 169,208 188,155 - Later than two years but not later than five years 97,953 276,901 92,723 261,930
495,665 831,817 450,085 693,294 Future interest charges (38,501) (79,498) (35,652) (69,917)
Present value of mininum lease payments 457,164 752,319 414,433 623,377
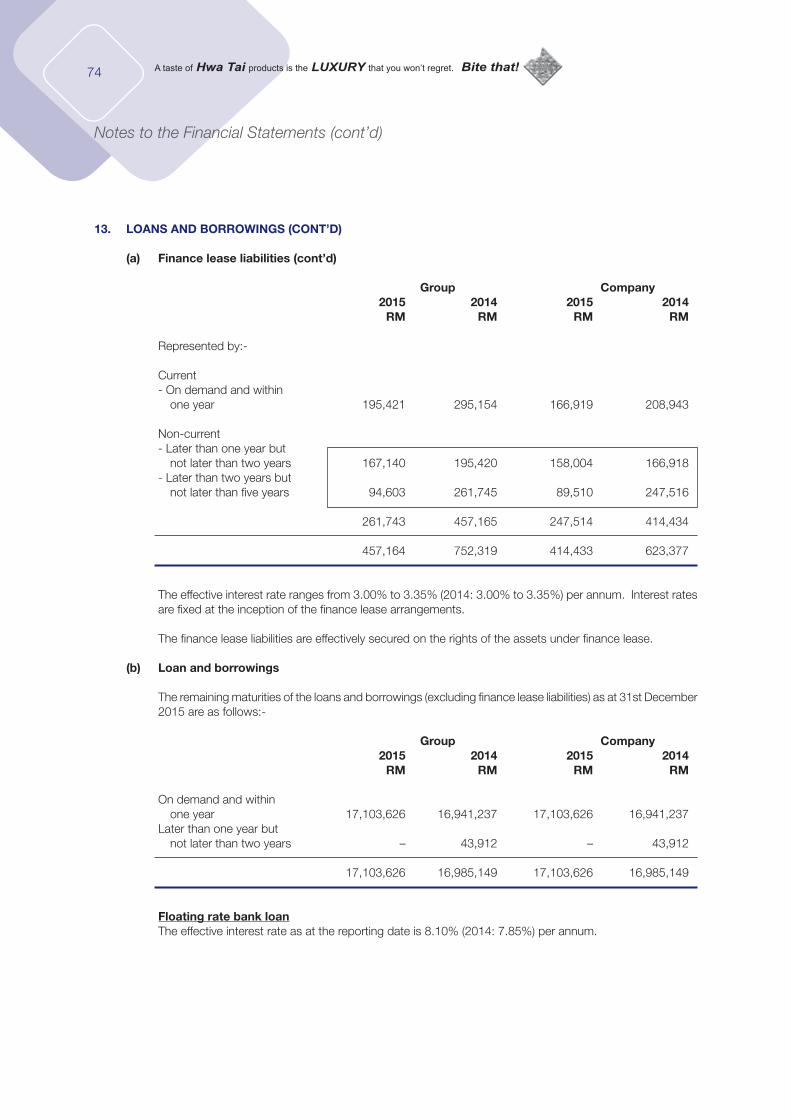
74
Notes to the Financial Statements (cont’d)
13. LOANS AND BORROWINGS (CONT’D)
(a) Finance lease liabilities (cont’d)
Group Company 2015 2014 2015 2014 RM RM RM RM
Represented by:-
Current- On demand and within one year 195,421 295,154 166,919 208,943
Non-current- Later than one year but not later than two years 167,140 195,420 158,004 166,918- Later than two years but not later than five years 94,603 261,745 89,510 247,516
261,743 457,165 247,514 414,434
457,164 752,319 414,433 623,377
The effective interest rate ranges from 3.00% to 3.35% (2014: 3.00% to 3.35%) per annum. Interest rates are fixed at the inception of the finance lease arrangements.
The finance lease liabilities are effectively secured on the rights of the assets under finance lease.
(b) Loan and borrowings
The remaining maturities of the loans and borrowings (excluding finance lease liabilities) as at 31st December 2015 are as follows:-
Group Company 2015 2014 2015 2014 RM RM RM RM
On demand and within one year 17,103,626 16,941,237 17,103,626 16,941,237 Later than one year but not later than two years – 43,912 – 43,912
17,103,626 16,985,149 17,103,626 16,985,149
Floating rate bank loanThe effective interest rate as at the reporting date is 8.10% (2014: 7.85%) per annum.
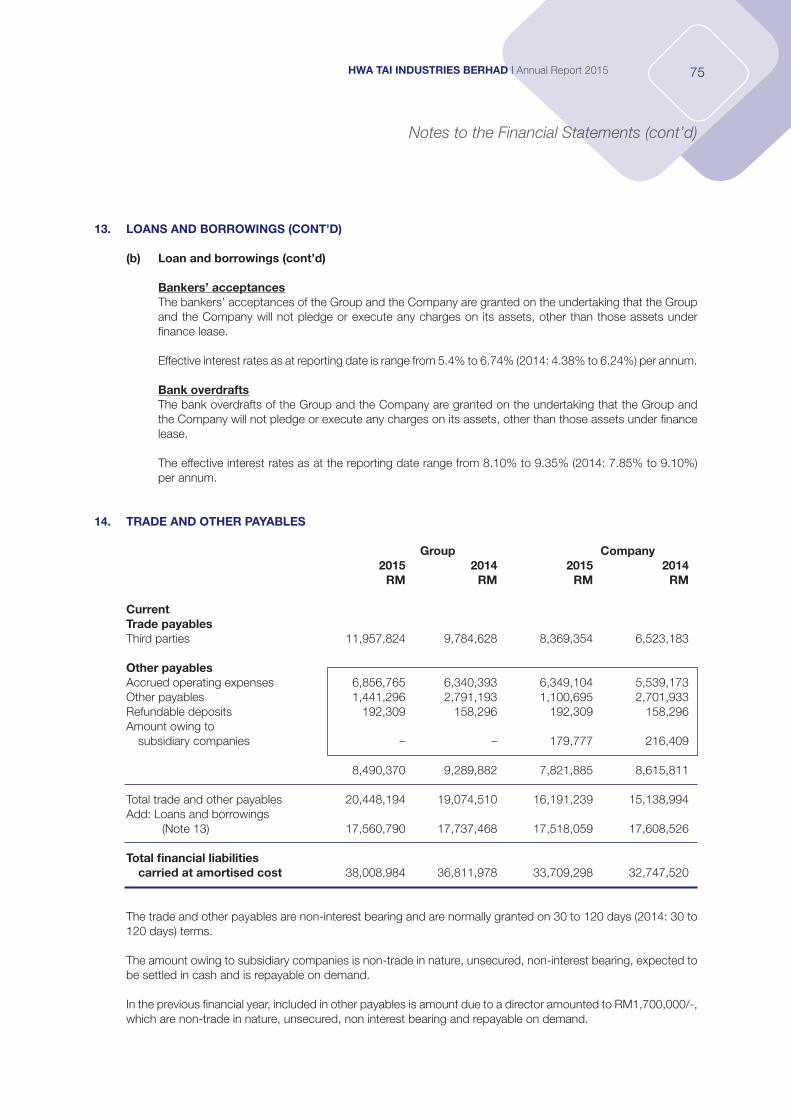
75HWA TAI INDUSTRIES BERHAD I Annual Report 2015
Notes to the Financial Statements (cont’d)
13. LOANS AND BORROWINGS (CONT’D)
(b) Loan and borrowings (cont’d)
Bankers’ acceptances The bankers’ acceptances of the Group and the Company are granted on the undertaking that the Group
and the Company will not pledge or execute any charges on its assets, other than those assets under finance lease.
Effective interest rates as at reporting date is range from 5.4% to 6.74% (2014: 4.38% to 6.24%) per annum.
Bank overdrafts The bank overdrafts of the Group and the Company are granted on the undertaking that the Group and
the Company will not pledge or execute any charges on its assets, other than those assets under finance lease.
The effective interest rates as at the reporting date range from 8.10% to 9.35% (2014: 7.85% to 9.10%) per annum.
14. TRADE AND OTHER PAYABLES
Group Company 2015 2014 2015 2014 RM RM RM RM
CurrentTrade payablesThird parties 11,957,824 9,784,628 8,369,354 6,523,183
Other payablesAccrued operating expenses 6,856,765 6,340,393 6,349,104 5,539,173 Other payables 1,441,296 2,791,193 1,100,695 2,701,933 Refundable deposits 192,309 158,296 192,309 158,296 Amount owing to subsidiary companies – – 179,777 216,409
8,490,370 9,289,882 7,821,885 8,615,811
Total trade and other payables 20,448,194 19,074,510 16,191,239 15,138,994 Add: Loans and borrowings (Note 13) 17,560,790 17,737,468 17,518,059 17,608,526
Total financial liabilities carried at amortised cost 38,008,984 36,811,978 33,709,298 32,747,520
The trade and other payables are non-interest bearing and are normally granted on 30 to 120 days (2014: 30 to 120 days) terms.
The amount owing to subsidiary companies is non-trade in nature, unsecured, non-interest bearing, expected to be settled in cash and is repayable on demand.
In the previous financial year, included in other payables is amount due to a director amounted to RM1,700,000/-, which are non-trade in nature, unsecured, non interest bearing and repayable on demand.
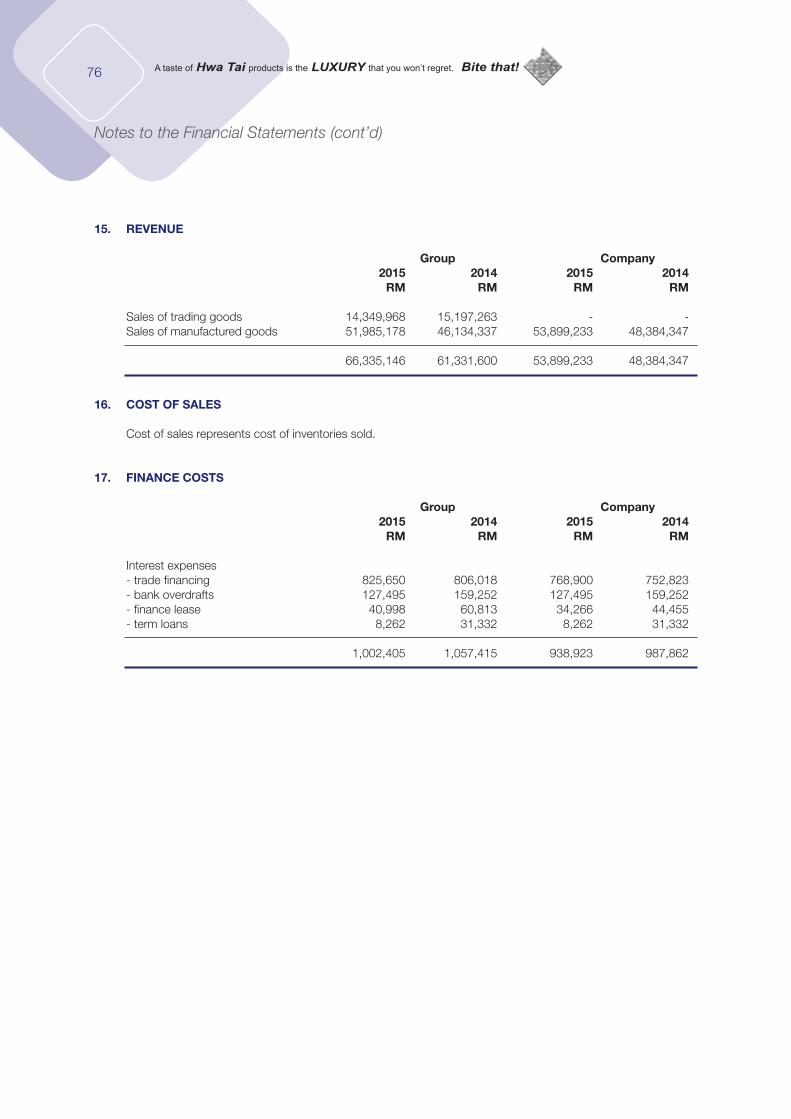
76
Notes to the Financial Statements (cont’d)
15. REVENUE
Group Company 2015 2014 2015 2014 RM RM RM RM
Sales of trading goods 14,349,968 15,197,263 - - Sales of manufactured goods 51,985,178 46,134,337 53,899,233 48,384,347
66,335,146 61,331,600 53,899,233 48,384,347
16. COST OF SALES
Cost of sales represents cost of inventories sold.
17. FINANCE COSTS
Group Company 2015 2014 2015 2014 RM RM RM RM
Interest expenses- trade financing 825,650 806,018 768,900 752,823 - bank overdrafts 127,495 159,252 127,495 159,252 - finance lease 40,998 60,813 34,266 44,455 - term loans 8,262 31,332 8,262 31,332
1,002,405 1,057,415 938,923 987,862
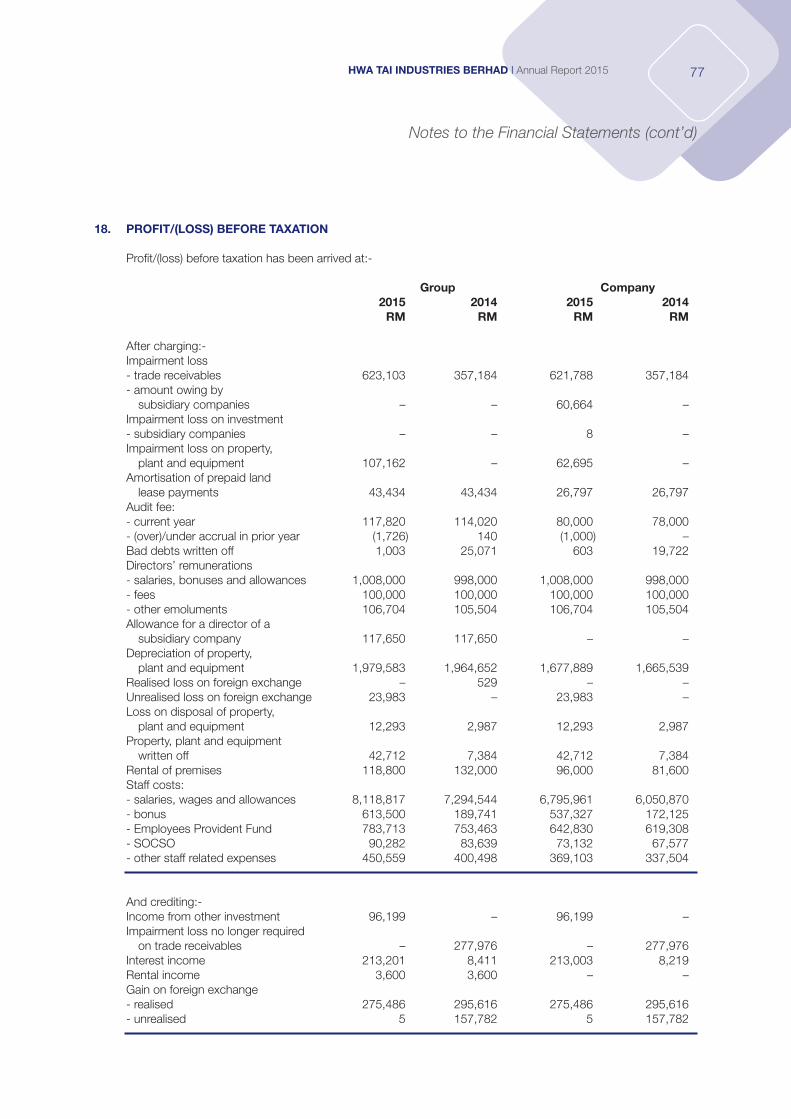
77HWA TAI INDUSTRIES BERHAD I Annual Report 2015
Notes to the Financial Statements (cont’d)
18. PROFIT/(LOSS) BEFORE TAXATION
Profit/(loss) before taxation has been arrived at:-
Group Company 2015 2014 2015 2014 RM RM RM RM
After charging:-Impairment loss - trade receivables 623,103 357,184 621,788 357,184 - amount owing by subsidiary companies – – 60,664 –Impairment loss on investment - subsidiary companies – – 8 –Impairment loss on property, plant and equipment 107,162 – 62,695 –Amortisation of prepaid land lease payments 43,434 43,434 26,797 26,797 Audit fee:- current year 117,820 114,020 80,000 78,000 - (over)/under accrual in prior year (1,726) 140 (1,000) – Bad debts written off 1,003 25,071 603 19,722 Directors’ remunerations- salaries, bonuses and allowances 1,008,000 998,000 1,008,000 998,000 - fees 100,000 100,000 100,000 100,000 - other emoluments 106,704 105,504 106,704 105,504 Allowance for a director of a subsidiary company 117,650 117,650 – –Depreciation of property, plant and equipment 1,979,583 1,964,652 1,677,889 1,665,539 Realised loss on foreign exchange – 529 – –Unrealised loss on foreign exchange 23,983 – 23,983 –Loss on disposal of property, plant and equipment 12,293 2,987 12,293 2,987 Property, plant and equipment written off 42,712 7,384 42,712 7,384 Rental of premises 118,800 132,000 96,000 81,600 Staff costs:- salaries, wages and allowances 8,118,817 7,294,544 6,795,961 6,050,870 - bonus 613,500 189,741 537,327 172,125 - Employees Provident Fund 783,713 753,463 642,830 619,308 - SOCSO 90,282 83,639 73,132 67,577 - other staff related expenses 450,559 400,498 369,103 337,504
And crediting:-Income from other investment 96,199 – 96,199 –Impairment loss no longer required on trade receivables – 277,976 – 277,976 Interest income 213,201 8,411 213,003 8,219 Rental income 3,600 3,600 – –Gain on foreign exchange- realised 275,486 295,616 275,486 295,616 - unrealised 5 157,782 5 157,782
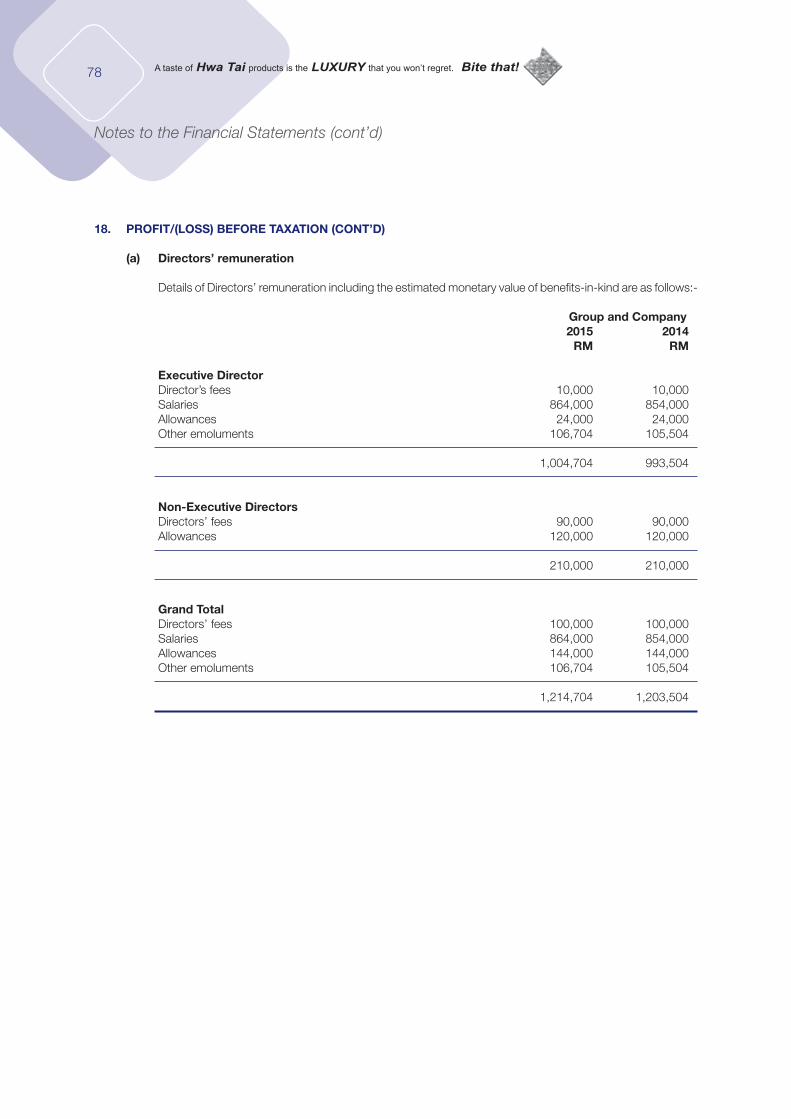
78
Notes to the Financial Statements (cont’d)
18. PROFIT/(LOSS) BEFORE TAXATION (CONT’D)
(a) Directors’ remuneration
Details of Directors’ remuneration including the estimated monetary value of benefits-in-kind are as follows:-
Group and Company 2015 2014 RM RM
Executive DirectorDirector’s fees 10,000 10,000 Salaries 864,000 854,000 Allowances 24,000 24,000 Other emoluments 106,704 105,504
1,004,704 993,504
Non-Executive DirectorsDirectors’ fees 90,000 90,000 Allowances 120,000 120,000
210,000 210,000
Grand TotalDirectors’ fees 100,000 100,000 Salaries 864,000 854,000 Allowances 144,000 144,000 Other emoluments 106,704 105,504
1,214,704 1,203,504
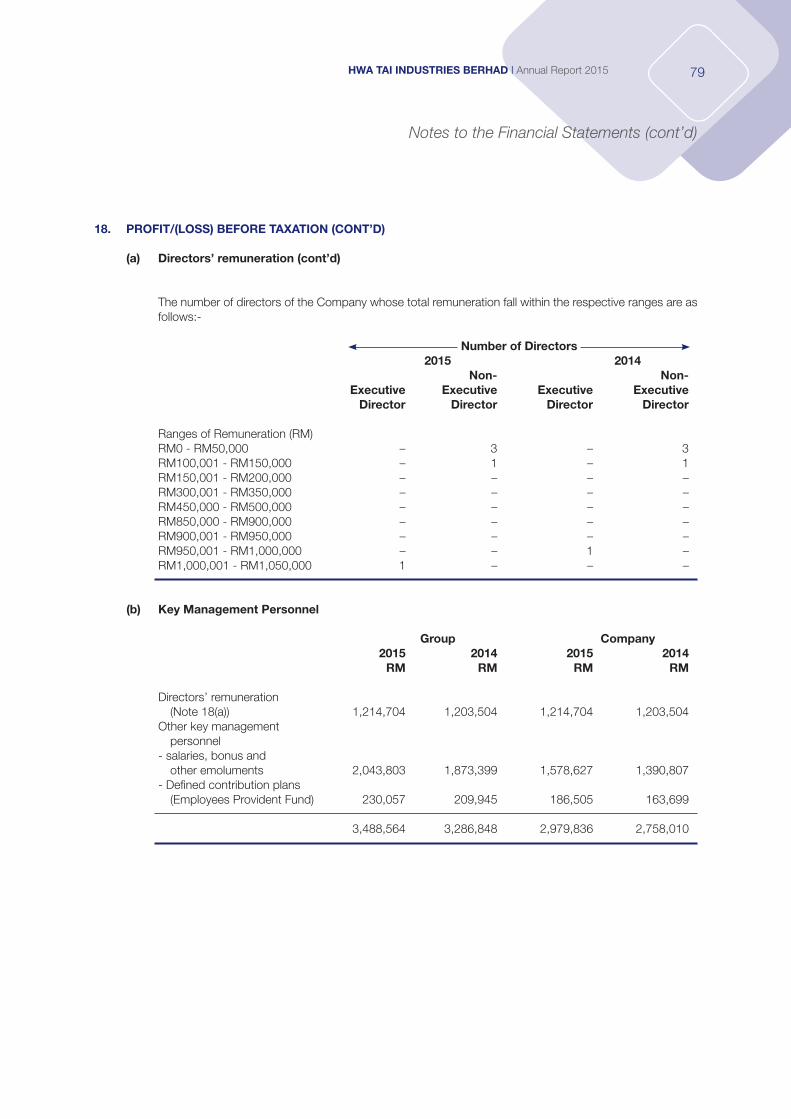
79HWA TAI INDUSTRIES BERHAD I Annual Report 2015
Notes to the Financial Statements (cont’d)
18. PROFIT/(LOSS) BEFORE TAXATION (CONT’D)
(a) Directors’ remuneration (cont’d)
The number of directors of the Company whose total remuneration fall within the respective ranges are as follows:-
Number of Directors 2015 2014 Non- Non- Executive Executive Executive Executive Director Director Director Director
Ranges of Remuneration (RM)RM0 - RM50,000 – 3 – 3RM100,001 - RM150,000 – 1 – 1RM150,001 - RM200,000 – – – –RM300,001 - RM350,000 – – – –RM450,000 - RM500,000 – – – –RM850,000 - RM900,000 – – – –RM900,001 - RM950,000 – – – –RM950,001 - RM1,000,000 – – 1 –RM1,000,001 - RM1,050,000 1 – – –
(b) Key Management Personnel
Group Company 2015 2014 2015 2014 RM RM RM RM
Directors’ remuneration (Note 18(a)) 1,214,704 1,203,504 1,214,704 1,203,504 Other key management personnel- salaries, bonus and other emoluments 2,043,803 1,873,399 1,578,627 1,390,807 - Defined contribution plans (Employees Provident Fund) 230,057 209,945 186,505 163,699 3,488,564 3,286,848 2,979,836 2,758,010
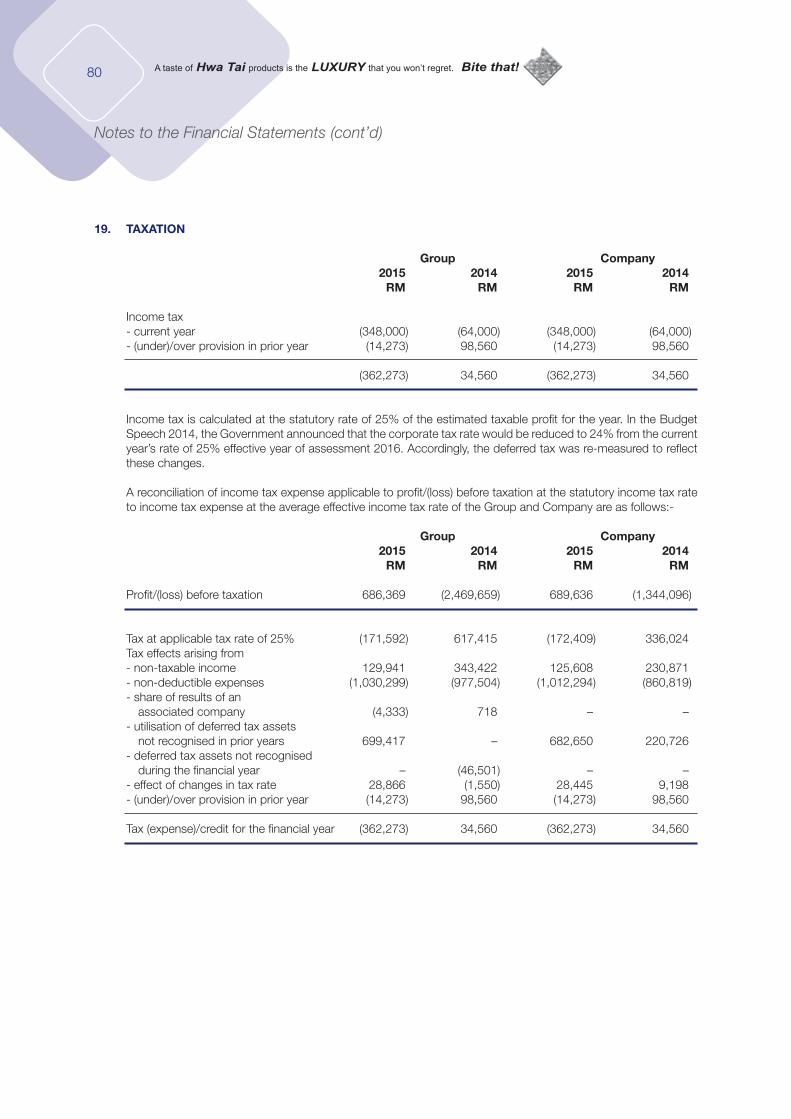
80
Notes to the Financial Statements (cont’d)
19. TAXATION
Group Company 2015 2014 2015 2014 RM RM RM RM
Income tax- current year (348,000) (64,000) (348,000) (64,000)- (under)/over provision in prior year (14,273) 98,560 (14,273) 98,560
(362,273) 34,560 (362,273) 34,560
Income tax is calculated at the statutory rate of 25% of the estimated taxable profit for the year. In the Budget Speech 2014, the Government announced that the corporate tax rate would be reduced to 24% from the current year’s rate of 25% effective year of assessment 2016. Accordingly, the deferred tax was re-measured to reflect these changes.
A reconciliation of income tax expense applicable to profit/(loss) before taxation at the statutory income tax rate to income tax expense at the average effective income tax rate of the Group and Company are as follows:-
Group Company 2015 2014 2015 2014 RM RM RM RM
Profit/(loss) before taxation 686,369 (2,469,659) 689,636 (1,344,096)
Tax at applicable tax rate of 25% (171,592) 617,415 (172,409) 336,024 Tax effects arising from- non-taxable income 129,941 343,422 125,608 230,871 - non-deductible expenses (1,030,299) (977,504) (1,012,294) (860,819)- share of results of an associated company (4,333) 718 – –- utilisation of deferred tax assets not recognised in prior years 699,417 – 682,650 220,726 - deferred tax assets not recognised during the financial year – (46,501) – –- effect of changes in tax rate 28,866 (1,550) 28,445 9,198 - (under)/over provision in prior year (14,273) 98,560 (14,273) 98,560
Tax (expense)/credit for the financial year (362,273) 34,560 (362,273) 34,560
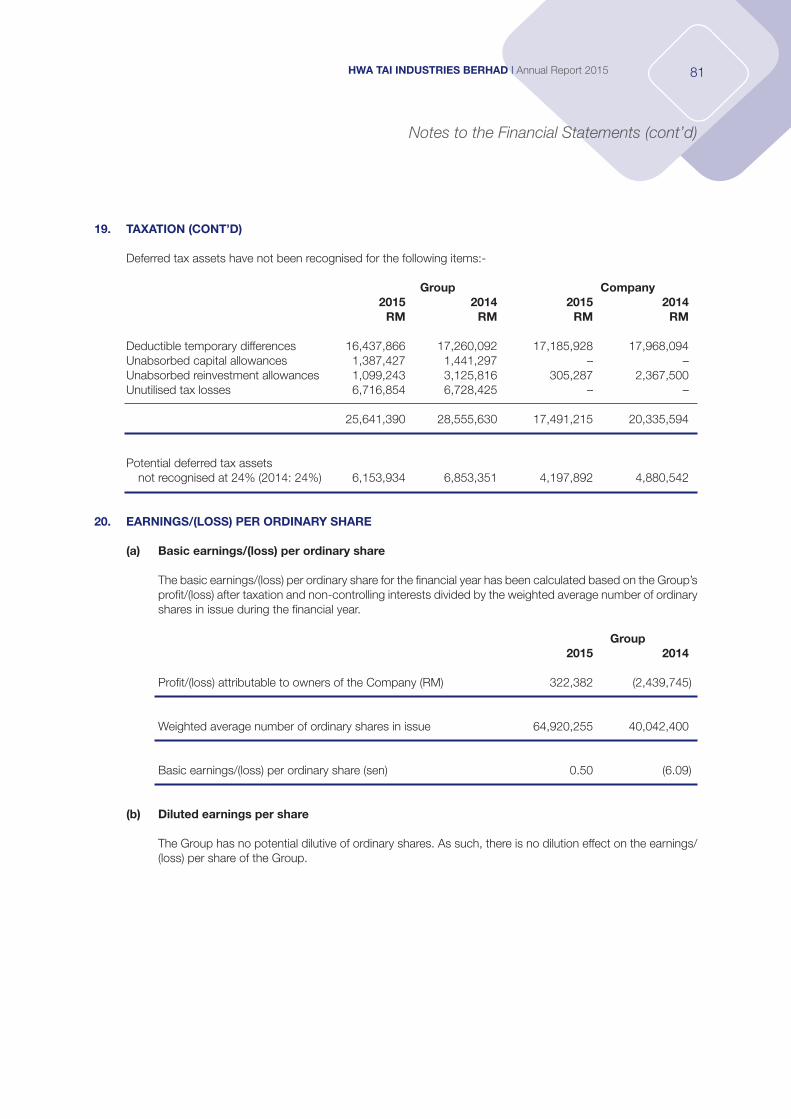
81HWA TAI INDUSTRIES BERHAD I Annual Report 2015
Notes to the Financial Statements (cont’d)
19. TAXATION (CONT’D)
Deferred tax assets have not been recognised for the following items:-
Group Company 2015 2014 2015 2014 RM RM RM RM
Deductible temporary differences 16,437,866 17,260,092 17,185,928 17,968,094 Unabsorbed capital allowances 1,387,427 1,441,297 – –Unabsorbed reinvestment allowances 1,099,243 3,125,816 305,287 2,367,500 Unutilised tax losses 6,716,854 6,728,425 – –
25,641,390 28,555,630 17,491,215 20,335,594
Potential deferred tax assets not recognised at 24% (2014: 24%) 6,153,934 6,853,351 4,197,892 4,880,542
20. EARNINGS/(LOSS) PER ORDINARY SHARE
(a) Basic earnings/(loss) per ordinary share
The basic earnings/(loss) per ordinary share for the financial year has been calculated based on the Group’s profit/(loss) after taxation and non-controlling interests divided by the weighted average number of ordinary shares in issue during the financial year.
Group 2015 2014
Profit/(loss) attributable to owners of the Company (RM) 322,382 (2,439,745)
Weighted average number of ordinary shares in issue 64,920,255 40,042,400
Basic earnings/(loss) per ordinary share (sen) 0.50 (6.09)
(b) Diluted earnings per share
The Group has no potential dilutive of ordinary shares. As such, there is no dilution effect on the earnings/(loss) per share of the Group.
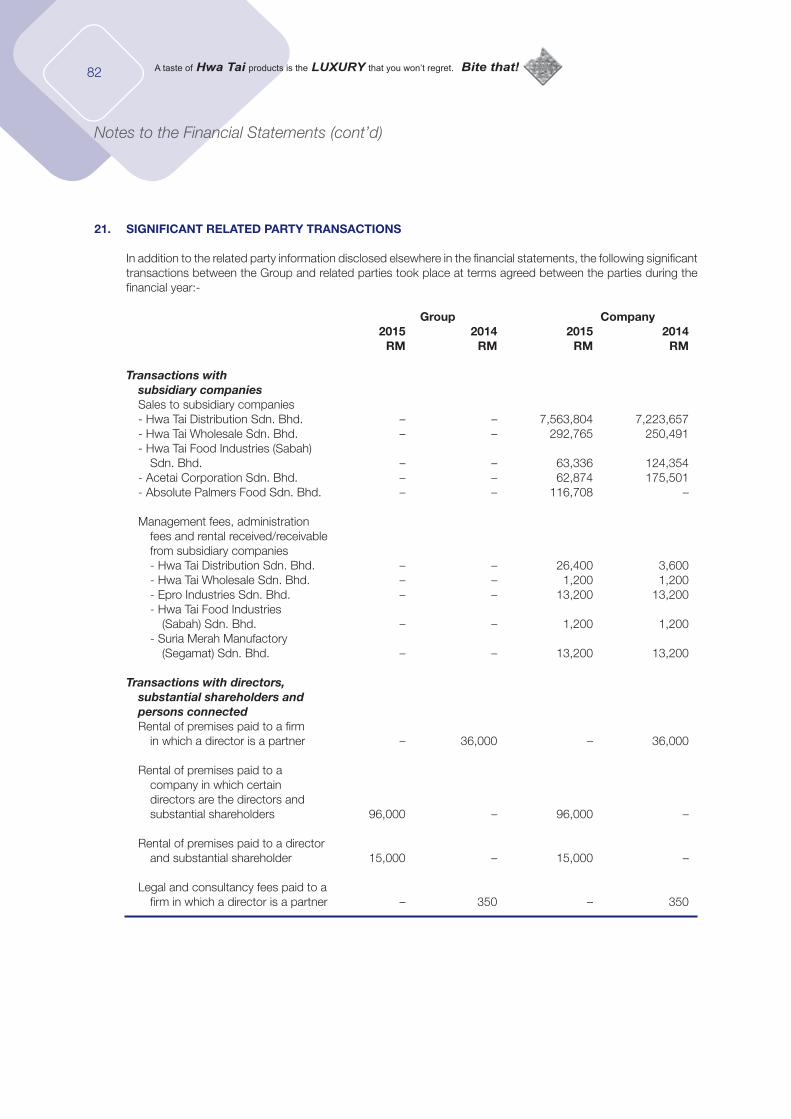
82
Notes to the Financial Statements (cont’d)
21. SIGNIFICANT RELATED PARTY TRANSACTIONS
In addition to the related party information disclosed elsewhere in the financial statements, the following significant transactions between the Group and related parties took place at terms agreed between the parties during the financial year:-
Group Company 2015 2014 2015 2014 RM RM RM RM
Transactions with subsidiary companies Sales to subsidiary companies - Hwa Tai Distribution Sdn. Bhd. – – 7,563,804 7,223,657 - Hwa Tai Wholesale Sdn. Bhd. – – 292,765 250,491 - Hwa Tai Food Industries (Sabah) Sdn. Bhd. – – 63,336 124,354 - Acetai Corporation Sdn. Bhd. – – 62,874 175,501 - Absolute Palmers Food Sdn. Bhd. – – 116,708 –
Management fees, administration fees and rental received/receivable from subsidiary companies - Hwa Tai Distribution Sdn. Bhd. – – 26,400 3,600 - Hwa Tai Wholesale Sdn. Bhd. – – 1,200 1,200 - Epro Industries Sdn. Bhd. – – 13,200 13,200 - Hwa Tai Food Industries (Sabah) Sdn. Bhd. – – 1,200 1,200 - Suria Merah Manufactory (Segamat) Sdn. Bhd. – – 13,200 13,200
Transactions with directors, substantial shareholders and persons connected Rental of premises paid to a firm in which a director is a partner – 36,000 – 36,000
Rental of premises paid to a company in which certain directors are the directors and substantial shareholders 96,000 – 96,000 –
Rental of premises paid to a director and substantial shareholder 15,000 – 15,000 –
Legal and consultancy fees paid to a firm in which a director is a partner – 350 – 350
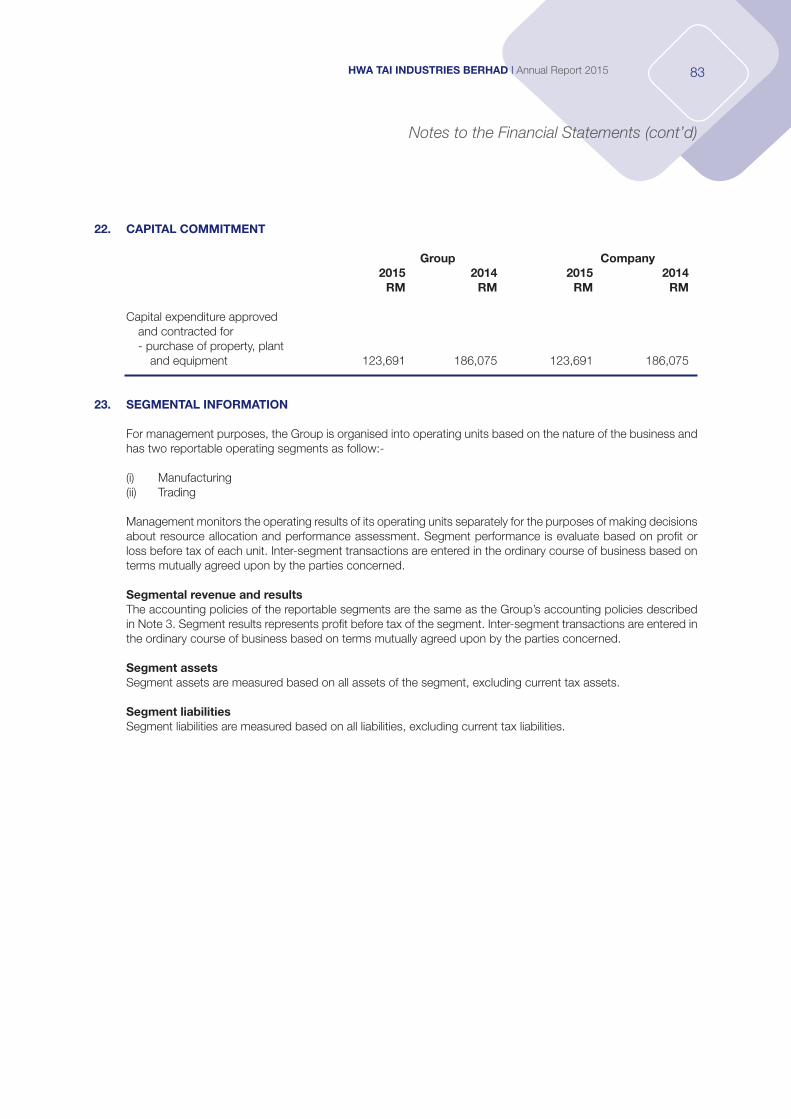
83HWA TAI INDUSTRIES BERHAD I Annual Report 2015
Notes to the Financial Statements (cont’d)
22. CAPITAL COMMITMENT
Group Company 2015 2014 2015 2014 RM RM RM RM
Capital expenditure approved and contracted for - purchase of property, plant and equipment 123,691 186,075 123,691 186,075
23. SEGMENTAL INFORMATION
For management purposes, the Group is organised into operating units based on the nature of the business and has two reportable operating segments as follow:-
(i) Manufacturing(ii) Trading
Management monitors the operating results of its operating units separately for the purposes of making decisions about resource allocation and performance assessment. Segment performance is evaluate based on profit or loss before tax of each unit. Inter-segment transactions are entered in the ordinary course of business based on terms mutually agreed upon by the parties concerned.
Segmental revenue and results The accounting policies of the reportable segments are the same as the Group’s accounting policies described
in Note 3. Segment results represents profit before tax of the segment. Inter-segment transactions are entered in the ordinary course of business based on terms mutually agreed upon by the parties concerned.
Segment assetsSegment assets are measured based on all assets of the segment, excluding current tax assets.
Segment liabilitiesSegment liabilities are measured based on all liabilities, excluding current tax liabilities.
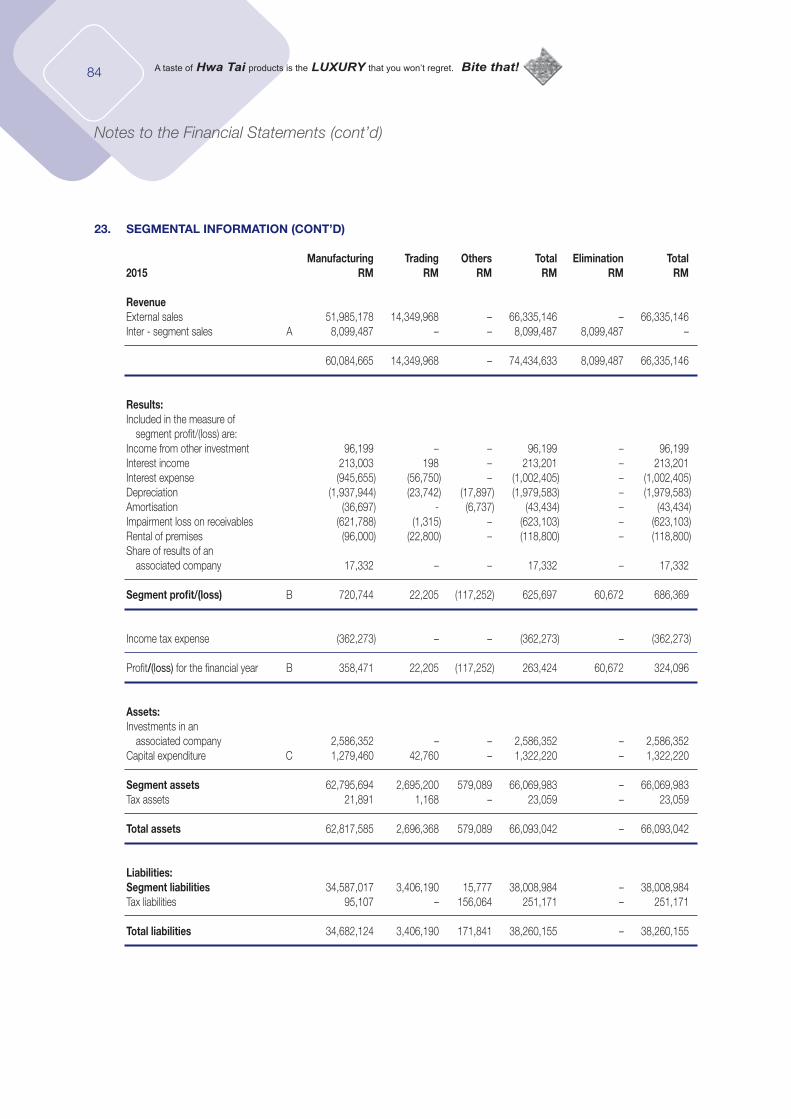
84
Notes to the Financial Statements (cont’d)
23. SEGMENTAL INFORMATION (CONT’D)
Manufacturing Trading Others Total Elimination Total2015 RM RM RM RM RM RM
RevenueExternal sales 51,985,178 14,349,968 – 66,335,146 – 66,335,146 Inter - segment sales A 8,099,487 – – 8,099,487 8,099,487 –
60,084,665 14,349,968 – 74,434,633 8,099,487 66,335,146
Results:Included in the measure of segment profit/(loss) are:Income from other investment 96,199 – – 96,199 – 96,199Interest income 213,003 198 – 213,201 – 213,201 Interest expense (945,655) (56,750) – (1,002,405) – (1,002,405)Depreciation (1,937,944) (23,742) (17,897) (1,979,583) – (1,979,583)Amortisation (36,697) - (6,737) (43,434) – (43,434)Impairment loss on receivables (621,788) (1,315) – (623,103) – (623,103)Rental of premises (96,000) (22,800) – (118,800) – (118,800)Share of results of an associated company 17,332 – – 17,332 – 17,332
Segment profit/(loss) B 720,744 22,205 (117,252) 625,697 60,672 686,369
Income tax expense (362,273) – – (362,273) – (362,273)
Profit/(loss) for the financial year B 358,471 22,205 (117,252) 263,424 60,672 324,096 Assets:Investments in an associated company 2,586,352 – – 2,586,352 – 2,586,352 Capital expenditure C 1,279,460 42,760 – 1,322,220 – 1,322,220 Segment assets 62,795,694 2,695,200 579,089 66,069,983 – 66,069,983 Tax assets 21,891 1,168 – 23,059 – 23,059
Total assets 62,817,585 2,696,368 579,089 66,093,042 – 66,093,042 Liabilities:Segment liabilities 34,587,017 3,406,190 15,777 38,008,984 – 38,008,984 Tax liabilities 95,107 – 156,064 251,171 – 251,171 Total liabilities 34,682,124 3,406,190 171,841 38,260,155 – 38,260,155
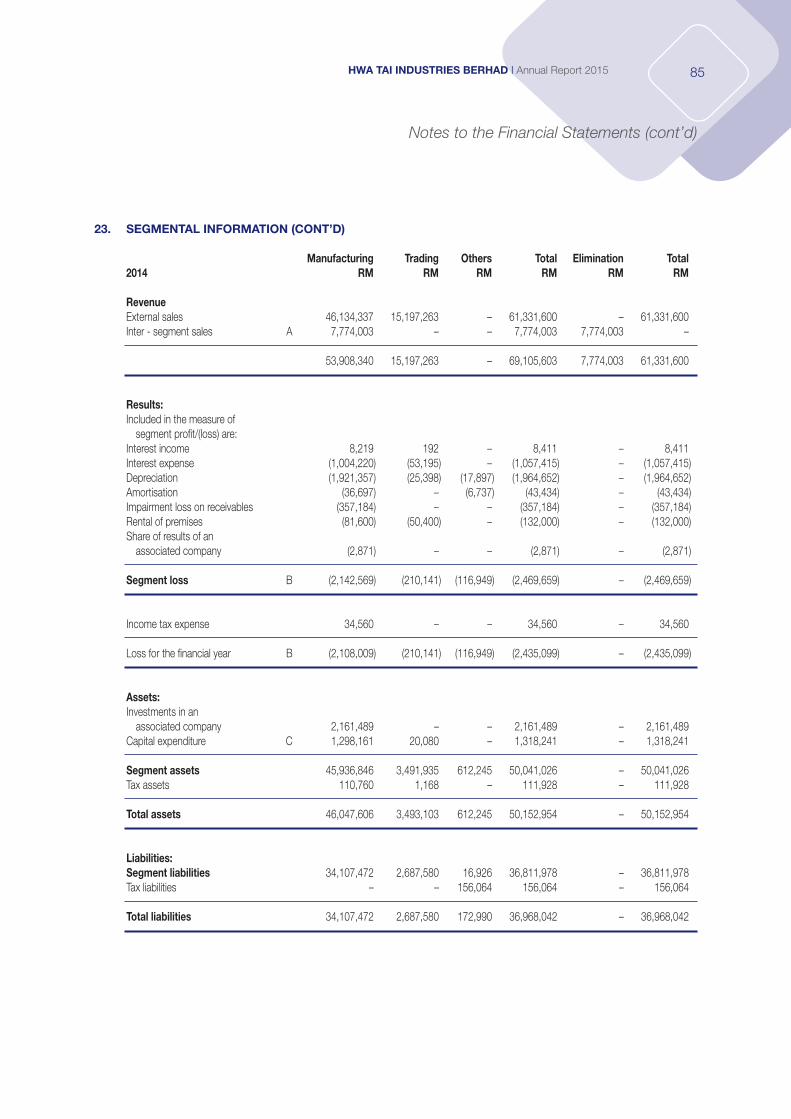
85HWA TAI INDUSTRIES BERHAD I Annual Report 2015
Notes to the Financial Statements (cont’d)
23. SEGMENTAL INFORMATION (CONT’D)
Manufacturing Trading Others Total Elimination Total2014 RM RM RM RM RM RM
RevenueExternal sales 46,134,337 15,197,263 – 61,331,600 – 61,331,600 Inter - segment sales A 7,774,003 – – 7,774,003 7,774,003 –
53,908,340 15,197,263 – 69,105,603 7,774,003 61,331,600
Results:Included in the measure of segment profit/(loss) are:Interest income 8,219 192 – 8,411 – 8,411 Interest expense (1,004,220) (53,195) – (1,057,415) – (1,057,415)Depreciation (1,921,357) (25,398) (17,897) (1,964,652) – (1,964,652)Amortisation (36,697) – (6,737) (43,434) – (43,434)Impairment loss on receivables (357,184) – – (357,184) – (357,184)Rental of premises (81,600) (50,400) – (132,000) – (132,000)Share of results of an associated company (2,871) – – (2,871) – (2,871)
Segment loss B (2,142,569) (210,141) (116,949) (2,469,659) – (2,469,659)
Income tax expense 34,560 – – 34,560 – 34,560
Loss for the financial year B (2,108,009) (210,141) (116,949) (2,435,099) – (2,435,099)
Assets:Investments in an associated company 2,161,489 – – 2,161,489 – 2,161,489 Capital expenditure C 1,298,161 20,080 – 1,318,241 – 1,318,241
Segment assets 45,936,846 3,491,935 612,245 50,041,026 – 50,041,026 Tax assets 110,760 1,168 – 111,928 – 111,928 Total assets 46,047,606 3,493,103 612,245 50,152,954 – 50,152,954
Liabilities: Segment liabilities 34,107,472 2,687,580 16,926 36,811,978 – 36,811,978 Tax liabilities – – 156,064 156,064 – 156,064 Total liabilities 34,107,472 2,687,580 172,990 36,968,042 – 36,968,042
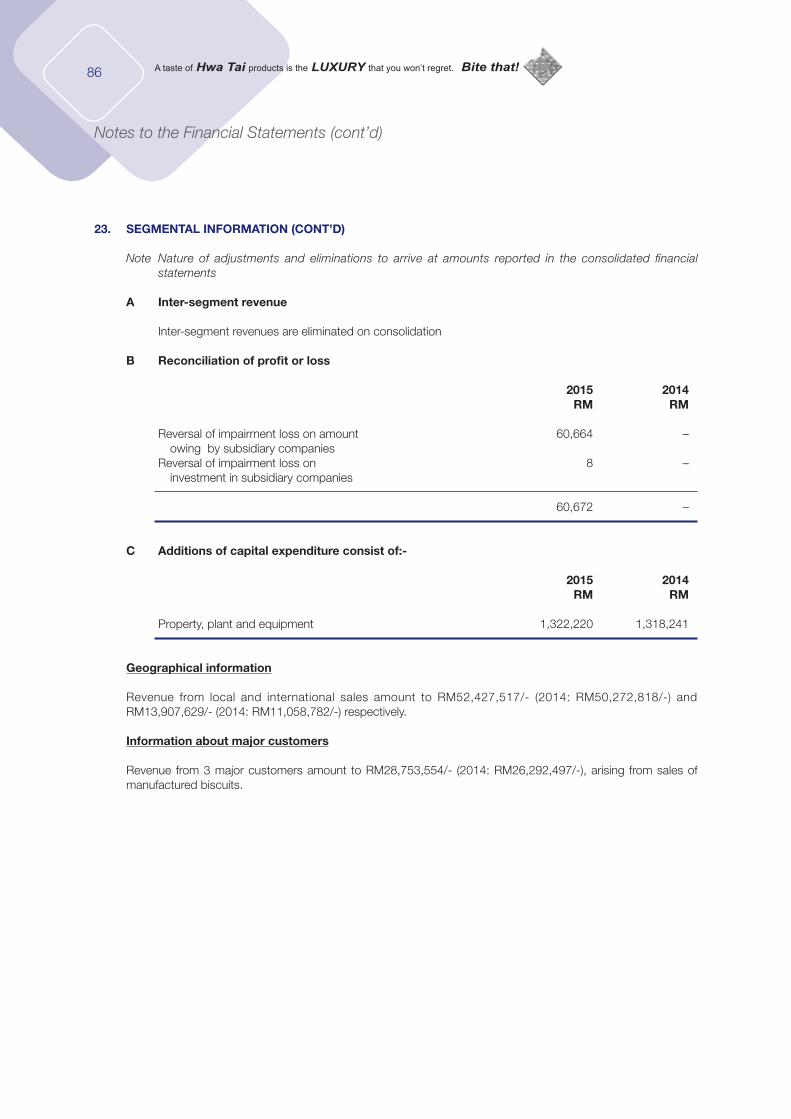
86
Notes to the Financial Statements (cont’d)
23. SEGMENTAL INFORMATION (CONT’D)
Note Nature of adjustments and eliminations to arrive at amounts reported in the consolidated financial statements
A Inter-segment revenue
Inter-segment revenues are eliminated on consolidation B Reconciliation of profit or loss
2015 2014 RM RM
Reversal of impairment loss on amount 60,664 – owing by subsidiary companies Reversal of impairment loss on 8 – investment in subsidiary companies
60,672 –
C Additions of capital expenditure consist of:-
2015 2014 RM RM
Property, plant and equipment 1,322,220 1,318,241
Geographical information
Revenue from local and international sales amount to RM52,427,517/- (2014: RM50,272,818/-) and RM13,907,629/- (2014: RM11,058,782/-) respectively.
Information about major customers
Revenue from 3 major customers amount to RM28,753,554/- (2014: RM26,292,497/-), arising from sales of manufactured biscuits.
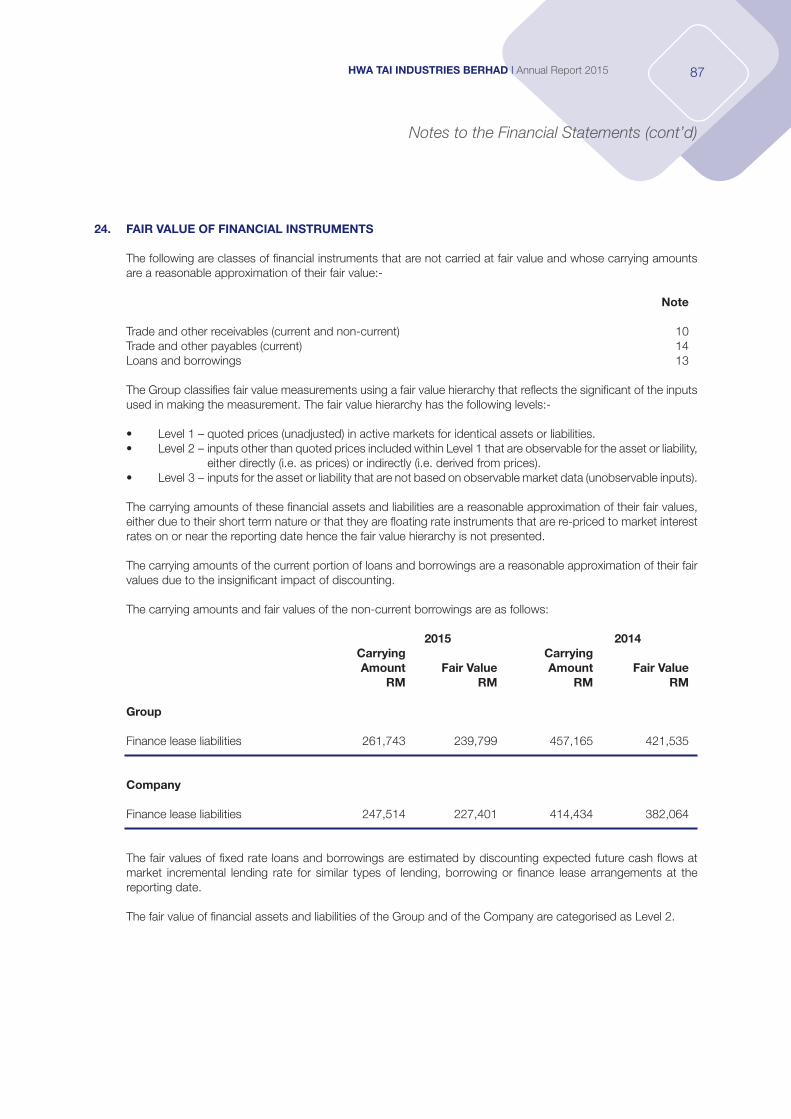
87HWA TAI INDUSTRIES BERHAD I Annual Report 2015
Notes to the Financial Statements (cont’d)
24. FAIR VALUE OF FINANCIAL INSTRUMENTS
The following are classes of financial instruments that are not carried at fair value and whose carrying amounts are a reasonable approximation of their fair value:-
Note
Trade and other receivables (current and non-current) 10Trade and other payables (current) 14Loans and borrowings 13
The Group classifies fair value measurements using a fair value hierarchy that reflects the significant of the inputs used in making the measurement. The fair value hierarchy has the following levels:-
• Level1–quotedprices(unadjusted)inactivemarketsforidenticalassetsorliabilities.• Level2–inputsotherthanquotedpricesincludedwithinLevel1thatareobservablefortheassetorliability,
either directly (i.e. as prices) or indirectly (i.e. derived from prices).• Level3–inputsfortheassetorliabilitythatarenotbasedonobservablemarketdata(unobservableinputs).
The carrying amounts of these financial assets and liabilities are a reasonable approximation of their fair values, either due to their short term nature or that they are floating rate instruments that are re-priced to market interest rates on or near the reporting date hence the fair value hierarchy is not presented.
The carrying amounts of the current portion of loans and borrowings are a reasonable approximation of their fair values due to the insignificant impact of discounting.
The carrying amounts and fair values of the non-current borrowings are as follows:
2015 2014 Carrying Carrying Amount Fair Value Amount Fair Value RM RM RM RM
Group
Finance lease liabilities 261,743 239,799 457,165 421,535
Company
Finance lease liabilities 247,514 227,401 414,434 382,064
The fair values of fixed rate loans and borrowings are estimated by discounting expected future cash flows at market incremental lending rate for similar types of lending, borrowing or finance lease arrangements at the reporting date.
The fair value of financial assets and liabilities of the Group and of the Company are categorised as Level 2.
88
Notes to the Financial Statements (cont’d)
25. FINANCIAL RISK MANAGEMENT OBJECTIVES AND POLICIES
The operations of the Group and of the Company are subject to a variety of financial risks, including credit risk, liquidity risk, interest rate risk and foreign currency risk. The Group and the Company have formulated a financial risk management framework whose principal objective is to minimise the Group’s and the Company’s exposure to risks and/or costs associated with the financing, investing and operating activities of the Group and of the Company.
(i) Credit risk
Credit risk is the risk of loss that may arise on outstanding financial instruments should a counterparty default on its obligations. The Group’s and the Company’s exposure to credit risk arises primarily from trade and other receivables. For other financial assets (including cash and bank balances), the Group and the Company minimise credit risk by dealing exclusively with high credit rating counterparties.
The Group and the Company does not hold any collateral as security and other credit enhancements for the above financial assets.
The management has a credit policy in place to monitor and minimise the exposure of default. The Group trades only with recognised and credit worthy third parties. Trade receivables are monitored on an ongoing basis.
At the reporting date, approximately 52% (2014: 49%) of the Group’s trade receivables are due from 3 major customers. The maximum exposure to credit risk for the Group is represented by the carrying amount of each financial instrument.
Financial guarantee
The Company provides unsecured financial guarantees to banks in respect of banking facilities granted to third parties.
The Company monitors on an ongoing basis the repayments made by the Company and their financial performance.
The maximum exposure to credit risk amounts to RM23,534/- (2014: RM186,636/-) representing the outstanding credit facilities guaranteed by the Company at the reporting date. At the reporting date, there was no indication that the Company would default on its repayment.
The financial guarantees have not been recognised since the fair value on initial recognition was not material.
Financial assets that are neither past due nor impaired Information regarding trade and other receivables that are neither past due nor impaired is disclosed in Note
10 to the financial statements. Deposits with banks that are neither past due nor impaired are placed with reputable financial institutions with no history of default.
Financial assets that are either past due or impaired Information regarding financial assets that are past due or impaired is disclosed in Note 10 to the financial
statements.
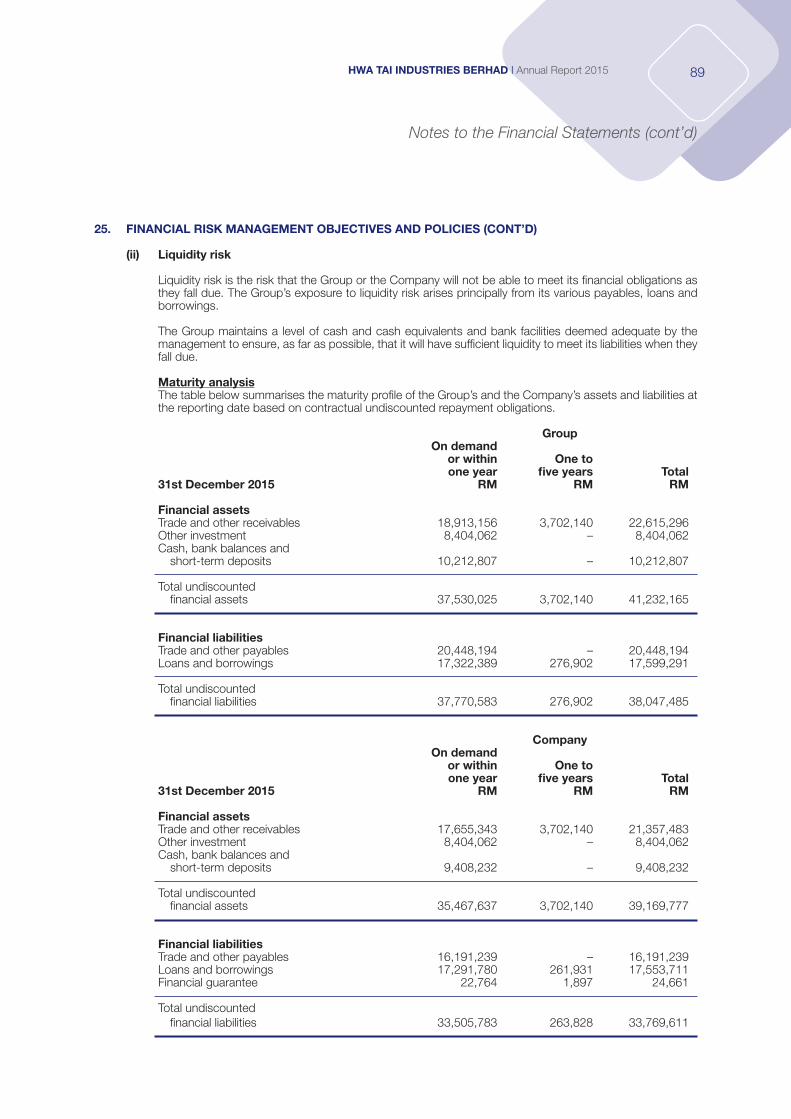
89HWA TAI INDUSTRIES BERHAD I Annual Report 2015
Notes to the Financial Statements (cont’d)
25. FINANCIAL RISK MANAGEMENT OBJECTIVES AND POLICIES (CONT’D)
(ii) Liquidity risk
Liquidity risk is the risk that the Group or the Company will not be able to meet its financial obligations as they fall due. The Group’s exposure to liquidity risk arises principally from its various payables, loans and borrowings.
The Group maintains a level of cash and cash equivalents and bank facilities deemed adequate by the management to ensure, as far as possible, that it will have sufficient liquidity to meet its liabilities when they fall due.
Maturity analysis The table below summarises the maturity profile of the Group’s and the Company’s assets and liabilities at
the reporting date based on contractual undiscounted repayment obligations.
Group On demand or within One to one year five years Total 31st December 2015 RM RM RM
Financial assetsTrade and other receivables 18,913,156 3,702,140 22,615,296 Other investment 8,404,062 – 8,404,062 Cash, bank balances and short-term deposits 10,212,807 – 10,212,807
Total undiscounted financial assets 37,530,025 3,702,140 41,232,165
Financial liabilitiesTrade and other payables 20,448,194 – 20,448,194 Loans and borrowings 17,322,389 276,902 17,599,291
Total undiscounted financial liabilities 37,770,583 276,902 38,047,485
Company On demand or within One to one year five years Total 31st December 2015 RM RM RM
Financial assetsTrade and other receivables 17,655,343 3,702,140 21,357,483 Other investment 8,404,062 – 8,404,062 Cash, bank balances and short-term deposits 9,408,232 – 9,408,232
Total undiscounted financial assets 35,467,637 3,702,140 39,169,777
Financial liabilitiesTrade and other payables 16,191,239 – 16,191,239 Loans and borrowings 17,291,780 261,931 17,553,711 Financial guarantee 22,764 1,897 24,661
Total undiscounted financial liabilities 33,505,783 263,828 33,769,611
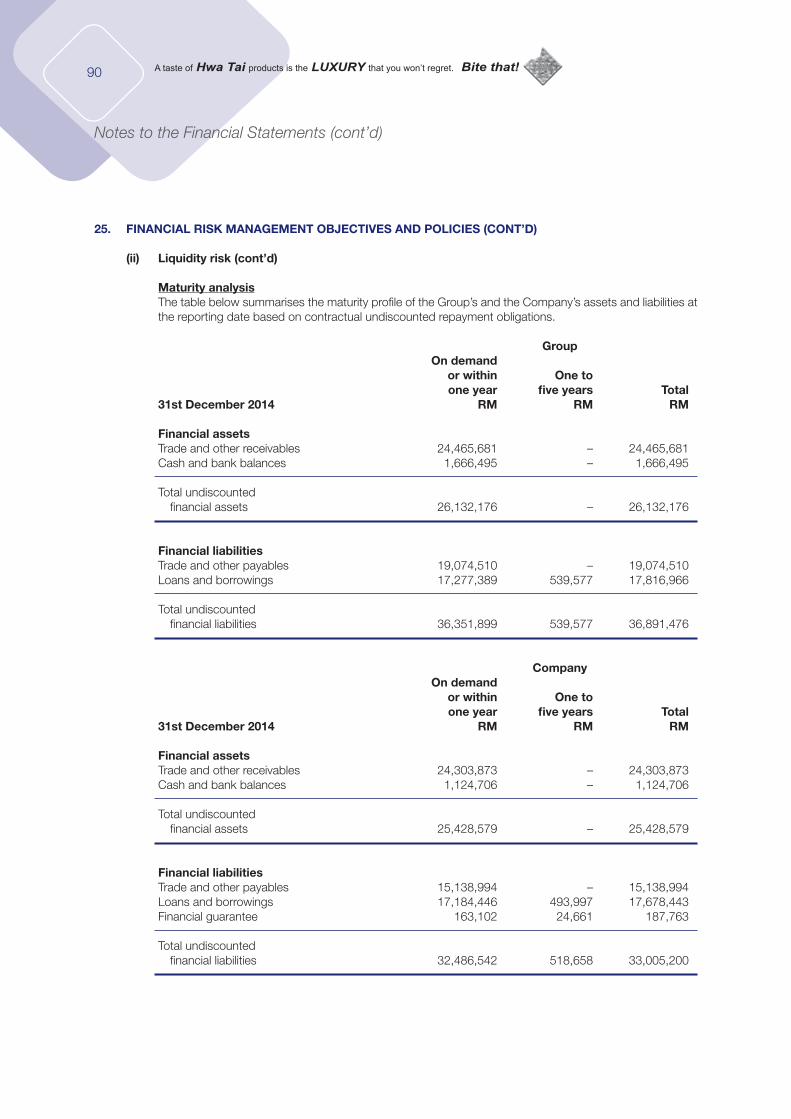
90
Notes to the Financial Statements (cont’d)
25. FINANCIAL RISK MANAGEMENT OBJECTIVES AND POLICIES (CONT’D)
(ii) Liquidity risk (cont’d)
Maturity analysis The table below summarises the maturity profile of the Group’s and the Company’s assets and liabilities at
the reporting date based on contractual undiscounted repayment obligations.
Group On demand or within One to one year five years Total 31st December 2014 RM RM RM
Financial assetsTrade and other receivables 24,465,681 – 24,465,681 Cash and bank balances 1,666,495 – 1,666,495
Total undiscounted financial assets 26,132,176 – 26,132,176
Financial liabilitiesTrade and other payables 19,074,510 – 19,074,510 Loans and borrowings 17,277,389 539,577 17,816,966
Total undiscounted financial liabilities 36,351,899 539,577 36,891,476
Company On demand or within One to one year five years Total 31st December 2014 RM RM RM
Financial assetsTrade and other receivables 24,303,873 – 24,303,873 Cash and bank balances 1,124,706 – 1,124,706
Total undiscounted financial assets 25,428,579 – 25,428,579
Financial liabilitiesTrade and other payables 15,138,994 – 15,138,994 Loans and borrowings 17,184,446 493,997 17,678,443 Financial guarantee 163,102 24,661 187,763
Total undiscounted financial liabilities 32,486,542 518,658 33,005,200
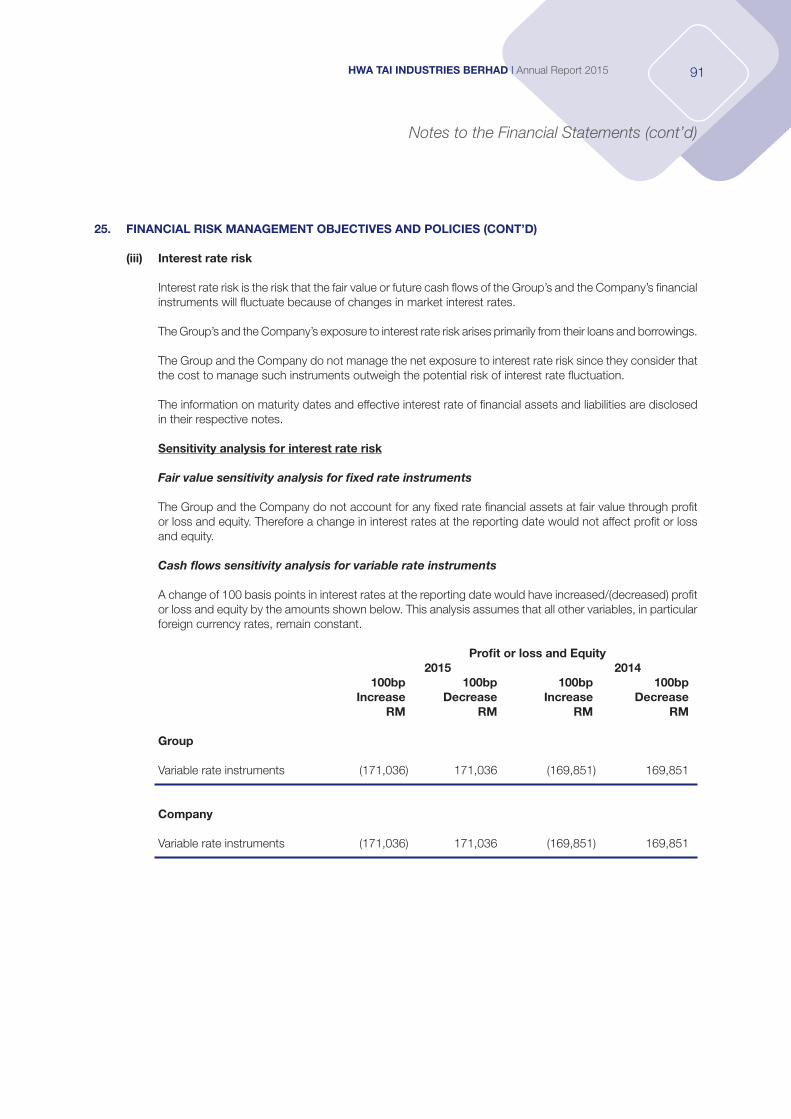
91HWA TAI INDUSTRIES BERHAD I Annual Report 2015
Notes to the Financial Statements (cont’d)
25. FINANCIAL RISK MANAGEMENT OBJECTIVES AND POLICIES (CONT’D) (iii) Interest rate risk
Interest rate risk is the risk that the fair value or future cash flows of the Group’s and the Company’s financial instruments will fluctuate because of changes in market interest rates.
The Group’s and the Company’s exposure to interest rate risk arises primarily from their loans and borrowings.
The Group and the Company do not manage the net exposure to interest rate risk since they consider that the cost to manage such instruments outweigh the potential risk of interest rate fluctuation.
The information on maturity dates and effective interest rate of financial assets and liabilities are disclosed in their respective notes.
Sensitivity analysis for interest rate risk
Fair value sensitivity analysis for fixed rate instruments
The Group and the Company do not account for any fixed rate financial assets at fair value through profit or loss and equity. Therefore a change in interest rates at the reporting date would not affect profit or loss and equity.
Cash flows sensitivity analysis for variable rate instruments
A change of 100 basis points in interest rates at the reporting date would have increased/(decreased) profit or loss and equity by the amounts shown below. This analysis assumes that all other variables, in particular foreign currency rates, remain constant.
Profit or loss and Equity 2015 2014 100bp 100bp 100bp 100bp Increase Decrease Increase Decrease RM RM RM RM
Group
Variable rate instruments (171,036) 171,036 (169,851) 169,851
Company
Variable rate instruments (171,036) 171,036 (169,851) 169,851
92
Notes to the Financial Statements (cont’d)
25. FINANCIAL RISK MANAGEMENT OBJECTIVES AND POLICIES (CONT’D)
(iv) Foreign currency risk
Foreign currency risk is the risk that the fair value or future cash flows of a financial instrument will fluctuate because of changes in foreign exchange rates.
The Group has transactional currency exposures arising from sales or purchases that are denominated in a currency other than the respective functional currency of Group entities, primarily Ringgit Malaysia (“RM”). The foreign currency in which these transactions are denominated are mainly US Dollar (“USD”) and Singapore Dollar (“SGD”).
The Group and the Company ensure that the net exposure to this risk is kept to an acceptable level by buying or selling foreign currencies at spot rates where necessary to address short-term imbalances. Management does not enter into currency hedging transactions since it considers that the cost of such instruments outweigh the potential risk of exchange rate fluctuations.
Sensitivity analysis for foreign currency risk
A 10% strengthening of the USD and SGD against the RM at the end of the financial year would have increased/(decreased) profit or loss and equity by the amounts shown below. This analysis assumes that all other variable, in particular interest rates, remain constant.
2015 2014Effect of profit or loss and equity RM RM
USD- strengthen 10% 39,788 86,917 - weakened 10% (39,788) (86,917)
SGD- strengthen 10% 6,313 42,516 - weakened 10% (6,313) (42,516)
26. CAPITAL MANAGEMENT
The primary objective of the Group’s capital management is to ensure that it maintains a strong capital base and safeguard the Group’s ability to continue as a going concern, so as to maintain investor, creditor and market confidence and to sustain future development of the business. The directors monitor and determine to maintain an optimal debt-to-equity ratio that complies with debt covenants and regulatory requirements.
During the financial year, the Group’s strategy, which was unchanged from year 2014, was to maintain the debt-to-equity ratio at an appropriate level. The debt-to-equity ratio is calculated as net debts divided by total capital of the Group. The debt-to-equity ratios at 31st December 2015 and 31st December 2014 were as follows:-
Group 2015 2014 RM RM
Total liabilities 38,260,155 36,968,042Equity attributable to owners of the Company 27,814,693 13,168,432
Debt-to-equity ratio 1.38 2.81
There were no changes in the Group’s approach to capital management during the financial year.
93HWA TAI INDUSTRIES BERHAD I Annual Report 2015
On 25th March 2010, Bursa Malaysia Securities Berhad (“Bursa Malaysia”) issued a directive to all listed issuers pursuant to Paragraphs 2.06 and 2.23 of Bursa Malaysia Main Market Listing Requirements. The directive requires all listed issuers to disclose the breakdown of the retained earnings or accumulated losses as at the end of the reporting period, into realised and unrealised profits and losses.
On 20th December 2010, Bursa Malaysia further issued guidance on the disclosure and the format required.
Pursuant to the directive, the amounts of realised and unrealised profits or losses included in the accumulated losses/(retained earnings) of the Group and the Company as at 31st December 2015 and 31st December 2014 are as follows:-
Group Company 2015 2014 2015 2014 RM RM RM RM
(Accumulated losses)/retained earnings of the Group and its subsidiary companies:-- realised (2,889,532) (27,401,782) 1,970,224 (22,564,339)- unrealised (23,978) 157,782 (23,978) 157,782
As at 31st December (2,913,510) (27,244,000) 1,946,246 (22,406,557)
An associated company- realised (143,781) (161,113) – –
Total Group (accumulated losses)/ retained earnings as, per consolidated statement of financial position (3,057,291) (27,405,113) 1,946,246 (22,406,557)
The determination of realised and unrealised profits or losses is based on Guidance of Special Matter No. 1, Determination of Realised and Unrealised Profits and Losses in the Context of Disclosure Pursuant to Bursa Malaysia Securities Berhad Listing Requirements, issued by the Malaysian Institute of Accountants on 20th December 2010.
The disclosure of realised and unrealised profits or losses above is solely for complying with the disclosure requirements stipulated in the directive of Bursa Malaysia and should not be applied for any other purposes.
Supplementary Information on the Breakdownof Realised and Unrealised Profits or Losses
94
Statement by DirectorsPursuant to Section 169(16) of the Companies Act, 1965
We, SOO THIEN MING @ SOO THIEN SEE and SOO CHUNG YEE, being two of the directors of Hwa Tai Industries Berhad, do hereby state that, in the opinion of the directors, the financial statements set out on pages 27 to 92 are drawn up so as to give a true and fair view of the state of affairs of the Group and of the Company as at 31st December 2015 and of the financial performance and cash flows of the Group and of the Company for the financial year ended on that date in accordance with the Malaysian Financial Reporting Standards, International Financial Reporting Standards and the requirements of the Companies Act, 1965 in Malaysia.
The supplementary information set out on page 93 have been prepared in accordance with the Guidance of Special Matter No. 1, Determination of Realised and Unrealised Profits or Losses in the Context of Disclosure Pursuant to Bursa Malaysia Securities Berhad Listing Requirements, issued by the Malaysian Institute of Accountants.
On behalf of the Board,
SOO THIEN MING @ SOO THIEN SEEDirector
SOO CHUNG YEEDirector
Kuala Lumpur
Date: 8th April 2016
Statutory DeclarationPursuant to Section 169(16) of the Companies Act, 1965
I, LEE KIM HONG, being the officer primarily responsible for the financial management of Hwa Tai Industries Berhad, do solemnly and sincerely declare that to the best of my knowledge and belief, the financial statements set out on pages 27 to 92, and the supplementary information set out on page 93 are correct, and I make this solemn declaration conscientiously believing the same to be true, and by virtue of the provisions of the Statutory Declarations Act, l960.
LEE KIM HONG
Subscribed and solemnly declared by the abovenamed at Kuala Lumpur in the Federal Territory on 8th April 2016
Before me,
ZULKIFLA MOHD DAHLIM (W541)Commissioner for Oaths
95HWA TAI INDUSTRIES BERHAD I Annual Report 2015
Independent Auditors’ ReportTo the members of Hwa Tai Industries Berhad (Incorporated in Malaysia)
REPORT ON THE FINANCIAL STATEMENTS
We have audited the financial statements of Hwa Tai Industries Berhad, which comprise the statements of financial position as at 31st December 2015 of the Group and of the Company, and the statements of profit or loss and other comprehensive income, statements of changes in equity and statements of cash flows of the Group and of the Company for the financial year then ended, and a summary of significant accounting policies and other explanatory information, as set out on pages 27 to 92.
Directors’ Responsibility for the Financial Statements
The directors of the Company are responsible for the preparation of financial statements so as to give a true and fair view in accordance with the Malaysian Financial Reporting Standards, International Financial Reporting Standards and the requirements of the Companies Act, 1965 in Malaysia. The directors are also responsible for such internal controls as the directors determine are necessary to enable the preparation of financial statements that are free from material misstatement, whether due to fraud or error.
Auditors’ Responsibility
Our responsibility is to express an opinion on these financial statements based on our audit. We conducted our audit in accordance with approved standards on auditing in Malaysia. Those standards require that we comply with ethical requirements and plan and perform the audit to obtain reasonable assurance about whether the financial statements are free from material misstatement.
An audit involves performing procedures to obtain audit evidence about the amounts and disclosures in the financial statements. The procedures selected depend on our judgement, including the assessment of risks of material misstatement of the financial statements, whether due to fraud or error. In making those risk assessments, we consider internal controls relevant to the Company’s preparation of financial statements that give a true and fair view in order to design audit procedures that are appropriate in the circumstances, but not for the purpose of expressing an opinion on the effectiveness of the Company’s internal controls. An audit also includes evaluating the appropriateness of accounting policies used and the reasonableness of accounting estimates made by the directors, as well as evaluating the overall presentation of the financial statements.
We believe that the audit evidence we have obtained is sufficient and appropriate to provide a basis for our audit opinion.
Opinion
In our opinion, the financial statements give a true and fair view of the financial position of the Group and of the Company as at 31st December 2015 and of their financial performance and cash flows for the financial year then ended in accordance with the Malaysian Financial Reporting Standards, International Financial Reporting Standards and the requirements of the Companies Act, 1965 in Malaysia.
96
REPORT ON OTHER LEGAL AND REGULATORY REQUIREMENTS
In accordance with the requirements of the Companies Act, 1965 in Malaysia, we also report the following:-
(a) In our opinion, the accounting and other records and the registers required by the Companies Act, 1965 in Malaysia to be kept by the Company and its subsidiaries of which we have acted as auditors have been properly kept in accordance with the provisions of the Companies Act, 1965 in Malaysia.
(b) We have considered the financial statements and the auditors’ reports of the subsidiaries of which we have not acted as auditors, which are indicated in Note 7 to the financial statements.
(c) We are satisfied that the financial statements of the subsidiaries that have been consolidated with the Company’s financial statements are in form and content appropriate and proper for the purposes of the preparation of the financial statements of the Group and we have received satisfactory information and explanations required by us for those purposes.
(d) The auditors’ reports on the financial statements of the subsidiaries did not contain any qualification, or any adverse comment made under Section 174(3) of the Companies Act, 1965 in Malaysia.
OTHER REPORTING RESPONSIBILITIES
The supplementary information set out on page 93 is disclosed to meet the requirement of Bursa Malaysia Securities Berhad and is not part of the financial statements. The directors are responsible for the preparation of the supplementary information in accordance with the Guidance on Special Matter No.1, Determination of Realised and Unrealised Profits or Losses in the Context of Disclosure Pursuant to Bursa Malaysia Securities Berhad Listing Requirements, as issued by the Malaysian Institute of Accountants (“MIA Guidance”) and the directive of Bursa Malaysia Securities Berhad. In our opinion, the supplementary information is prepared, in all material respects, in accordance with the MIA Guidance and the directive of Bursa Malaysia Securities Berhad.
OTHER MATTERS
This report is made solely to the members of the Company, as a body, in accordance with Section 174 of the Companies Act, 1965 in Malaysia and for no other purpose. We do not assume responsibility to any other person for the contents of this report.
Baker Tilly Monteiro Heng Ong Teng YanNo. AF 0117 No. 3076/07/17(J)Chartered Accountants Chartered Accountant
Kuala Lumpur
Date: 8th April 2016
Independent Auditors’ Report (cont’d)
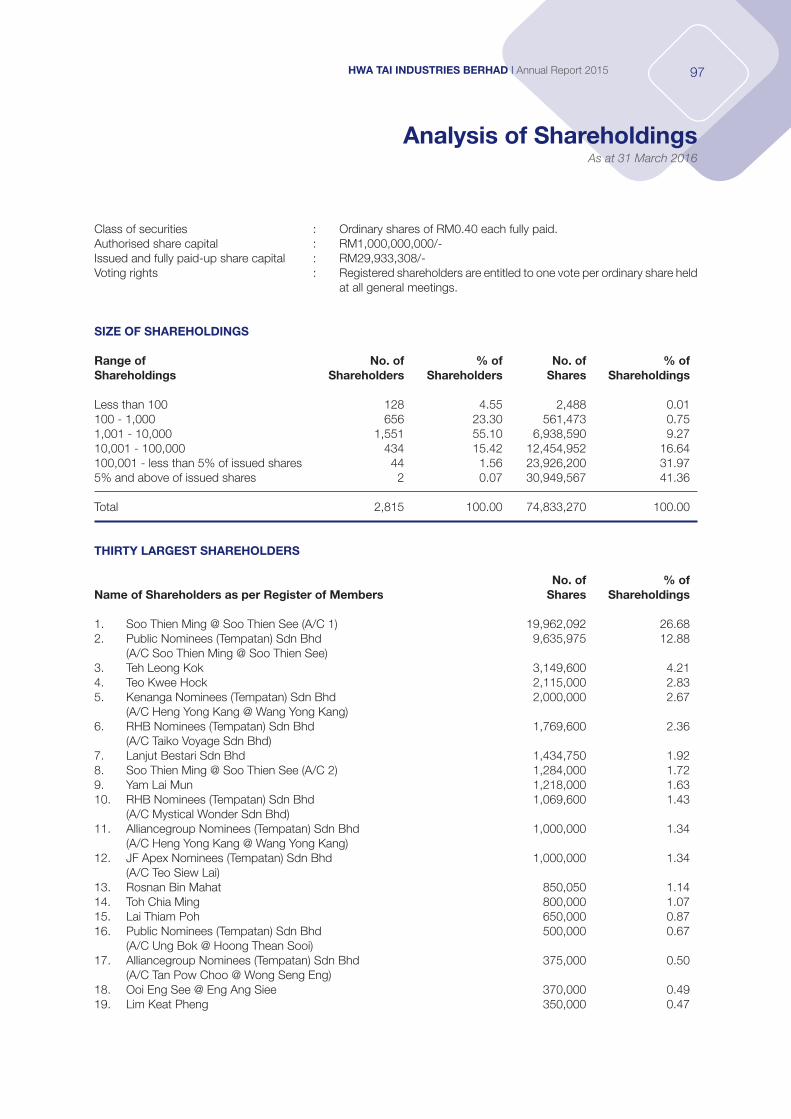
97HWA TAI INDUSTRIES BERHAD I Annual Report 2015
Analysis of ShareholdingsAs at 31 March 2016
Class of securities : Ordinary shares of RM0.40 each fully paid.Authorised share capital : RM1,000,000,000/-Issued and fully paid-up share capital : RM29,933,308/-Voting rights : Registered shareholders are entitled to one vote per ordinary share held
at all general meetings.
SIZE OF SHAREHOLDINGS
Range of No. of % of No. of % of Shareholdings Shareholders Shareholders Shares Shareholdings
Less than 100 128 4.55 2,488 0.01100 - 1,000 656 23.30 561,473 0.751,001 - 10,000 1,551 55.10 6,938,590 9.2710,001 - 100,000 434 15.42 12,454,952 16.64 100,001 - less than 5% of issued shares 44 1.56 23,926,200 31.975% and above of issued shares 2 0.07 30,949,567 41.36
Total 2,815 100.00 74,833,270 100.00
THIRTY LARGEST SHAREHOLDERS
No. of % ofName of Shareholders as per Register of Members Shares Shareholdings
1. Soo Thien Ming @ Soo Thien See (A/C 1) 19,962,092 26.682. Public Nominees (Tempatan) Sdn Bhd 9,635,975 12.88 (A/C Soo Thien Ming @ Soo Thien See) 3. Teh Leong Kok 3,149,600 4.214. Teo Kwee Hock 2,115,000 2.835. Kenanga Nominees (Tempatan) Sdn Bhd 2,000,000 2.67 (A/C Heng Yong Kang @ Wang Yong Kang)6. RHB Nominees (Tempatan) Sdn Bhd 1,769,600 2.36 (A/C Taiko Voyage Sdn Bhd) 7. Lanjut Bestari Sdn Bhd 1,434,750 1.928. Soo Thien Ming @ Soo Thien See (A/C 2) 1,284,000 1.729. Yam Lai Mun 1,218,000 1.6310. RHB Nominees (Tempatan) Sdn Bhd 1,069,600 1.43 (A/C Mystical Wonder Sdn Bhd) 11. Alliancegroup Nominees (Tempatan) Sdn Bhd 1,000,000 1.34 (A/C Heng Yong Kang @ Wang Yong Kang)12. JF Apex Nominees (Tempatan) Sdn Bhd 1,000,000 1.34 (A/C Teo Siew Lai) 13. Rosnan Bin Mahat 850,050 1.1414. Toh Chia Ming 800,000 1.0715. Lai Thiam Poh 650,000 0.8716. Public Nominees (Tempatan) Sdn Bhd 500,000 0.67 (A/C Ung Bok @ Hoong Thean Sooi) 17. Alliancegroup Nominees (Tempatan) Sdn Bhd 375,000 0.50 (A/C Tan Pow Choo @ Wong Seng Eng)18. Ooi Eng See @ Eng Ang Siee 370,000 0.4919. Lim Keat Pheng 350,000 0.47
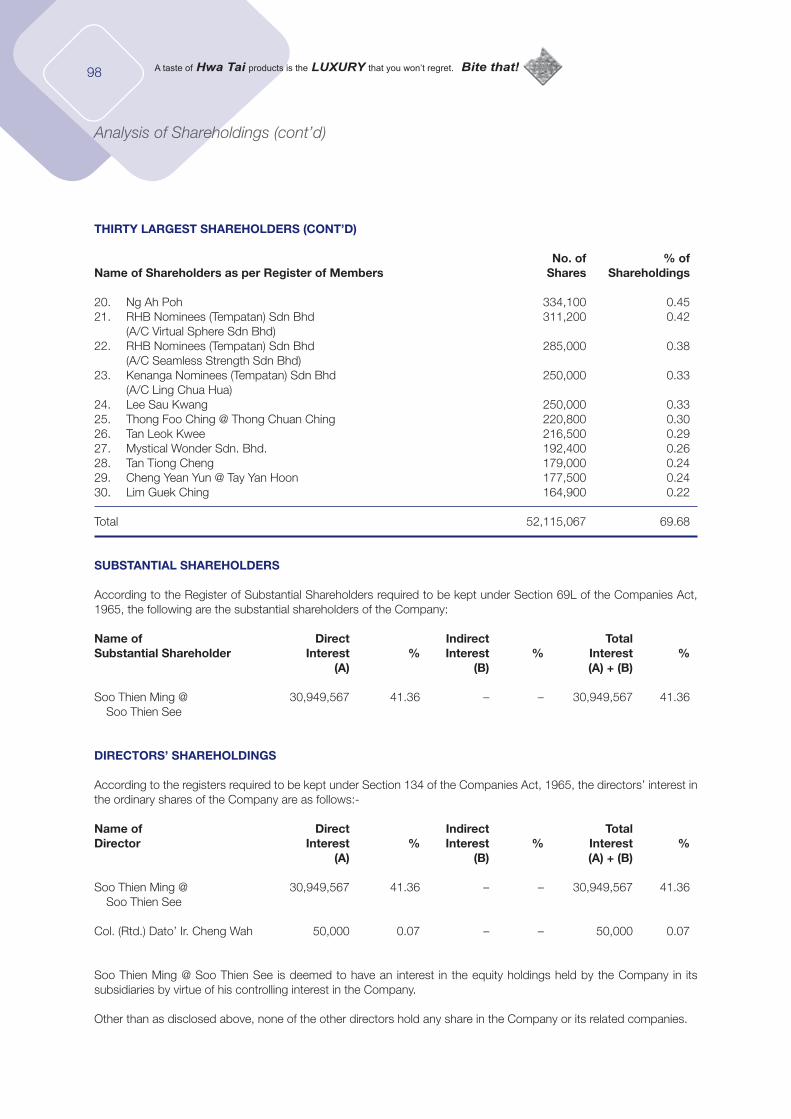
98
THIRTY LARGEST SHAREHOLDERS (CONT’D)
No. of % ofName of Shareholders as per Register of Members Shares Shareholdings
20. Ng Ah Poh 334,100 0.4521. RHB Nominees (Tempatan) Sdn Bhd 311,200 0.42 (A/C Virtual Sphere Sdn Bhd) 22. RHB Nominees (Tempatan) Sdn Bhd 285,000 0.38 (A/C Seamless Strength Sdn Bhd) 23. Kenanga Nominees (Tempatan) Sdn Bhd 250,000 0.33 (A/C Ling Chua Hua) 24. Lee Sau Kwang 250,000 0.3325. Thong Foo Ching @ Thong Chuan Ching 220,800 0.3026. Tan Leok Kwee 216,500 0.2927. Mystical Wonder Sdn. Bhd. 192,400 0.2628. Tan Tiong Cheng 179,000 0.2429. Cheng Yean Yun @ Tay Yan Hoon 177,500 0.2430. Lim Guek Ching 164,900 0.22 Total 52,115,067 69.68
SUBSTANTIAL SHAREHOLDERS
According to the Register of Substantial Shareholders required to be kept under Section 69L of the Companies Act, 1965, the following are the substantial shareholders of the Company:
Name of Direct Indirect TotalSubstantial Shareholder Interest % Interest % Interest % (A) (B) (A) + (B)
Soo Thien Ming @ 30,949,567 41.36 – – 30,949,567 41.36 Soo Thien See
DIRECTORS’ SHAREHOLDINGS
According to the registers required to be kept under Section 134 of the Companies Act, 1965, the directors’ interest in the ordinary shares of the Company are as follows:-
Name of Direct Indirect TotalDirector Interest % Interest % Interest % (A) (B) (A) + (B)
Soo Thien Ming @ 30,949,567 41.36 – – 30,949,567 41.36 Soo Thien See Col. (Rtd.) Dato’ Ir. Cheng Wah 50,000 0.07 – – 50,000 0.07
Soo Thien Ming @ Soo Thien See is deemed to have an interest in the equity holdings held by the Company in its subsidiaries by virtue of his controlling interest in the Company.
Other than as disclosed above, none of the other directors hold any share in the Company or its related companies.
Analysis of Shareholdings (cont’d)
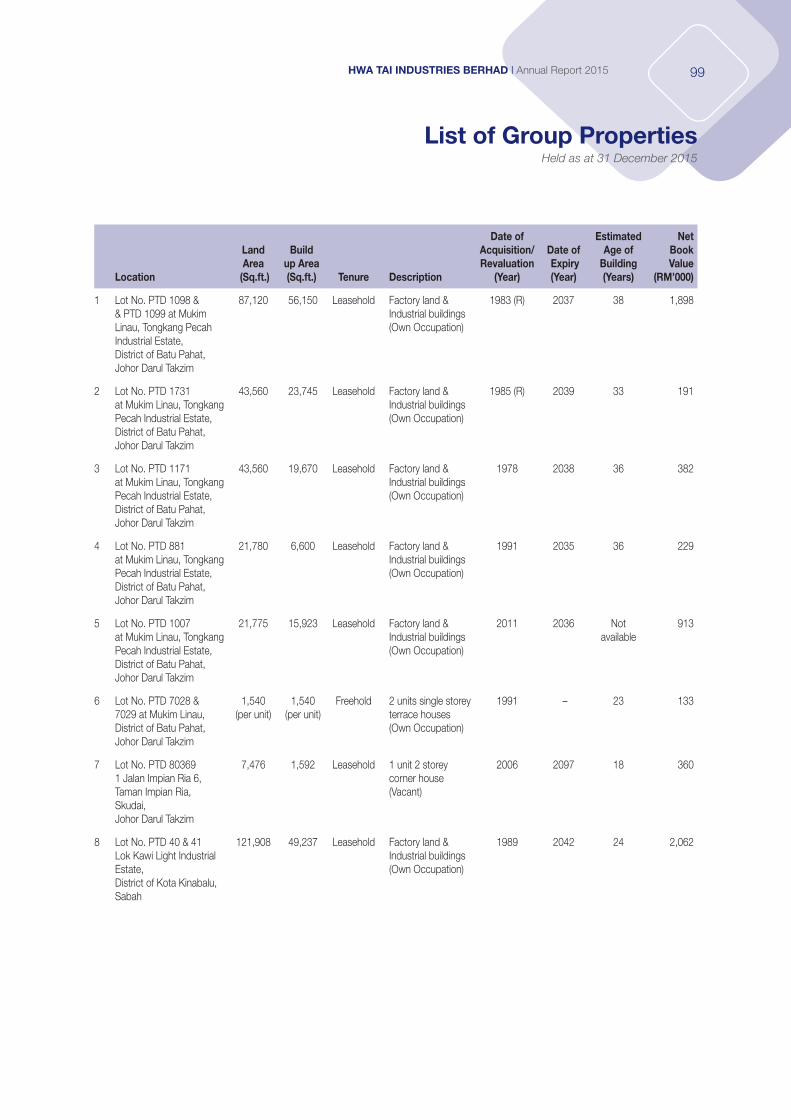
99HWA TAI INDUSTRIES BERHAD I Annual Report 2015
List of Group PropertiesHeld as at 31 December 2015
Location
Land Area
(Sq.ft.)
Build
up Area (Sq.ft.) Tenure Description
Date of Acquisition/Revaluation
(Year)
Date of Expiry (Year)
Estimated Age of
Building (Years)
Net Book Value
(RM’000)
1 Lot No. PTD 1098 && PTD 1099 at Mukim Linau, Tongkang Pecah Industrial Estate,District of Batu Pahat,Johor Darul Takzim
87,120 56,150 Leasehold Factory land &Industrial buildings(Own Occupation)
1983 (R) 2037 38 1,898
2 Lot No. PTD 1731at Mukim Linau, Tongkang Pecah Industrial Estate,District of Batu Pahat,Johor Darul Takzim
43,560 23,745 Leasehold Factory land &Industrial buildings(Own Occupation)
1985 (R) 2039 33 191
3 Lot No. PTD 1171at Mukim Linau, Tongkang Pecah Industrial Estate,District of Batu Pahat,Johor Darul Takzim
43,560 19,670 Leasehold Factory land &Industrial buildings(Own Occupation)
1978 2038 36 382
4 Lot No. PTD 881at Mukim Linau, Tongkang Pecah Industrial Estate,District of Batu Pahat,Johor Darul Takzim
21,780 6,600 Leasehold Factory land &Industrial buildings(Own Occupation)
1991 2035 36 229
5 Lot No. PTD 1007at Mukim Linau, Tongkang Pecah Industrial Estate,District of Batu Pahat,Johor Darul Takzim
21,775 15,923 Leasehold Factory land &Industrial buildings(Own Occupation)
2011 2036 Notavailable
913
6 Lot No. PTD 7028 & 7029 at Mukim Linau,District of Batu Pahat,Johor Darul Takzim
1,540 (per unit)
1,540 (per unit)
Freehold 2 units single storey terrace houses(Own Occupation)
1991 – 23 133
7 Lot No. PTD 803691 Jalan Impian Ria 6,Taman Impian Ria,Skudai,Johor Darul Takzim
7,476 1,592 Leasehold 1 unit 2 storeycorner house(Vacant)
2006 2097 18 360
8 Lot No. PTD 40 & 41Lok Kawi Light Industrial Estate,District of Kota Kinabalu,Sabah
121,908 49,237 Leasehold Factory land &Industrial buildings(Own Occupation)
1989 2042 24 2,062

(This page has been intentionally left blank)
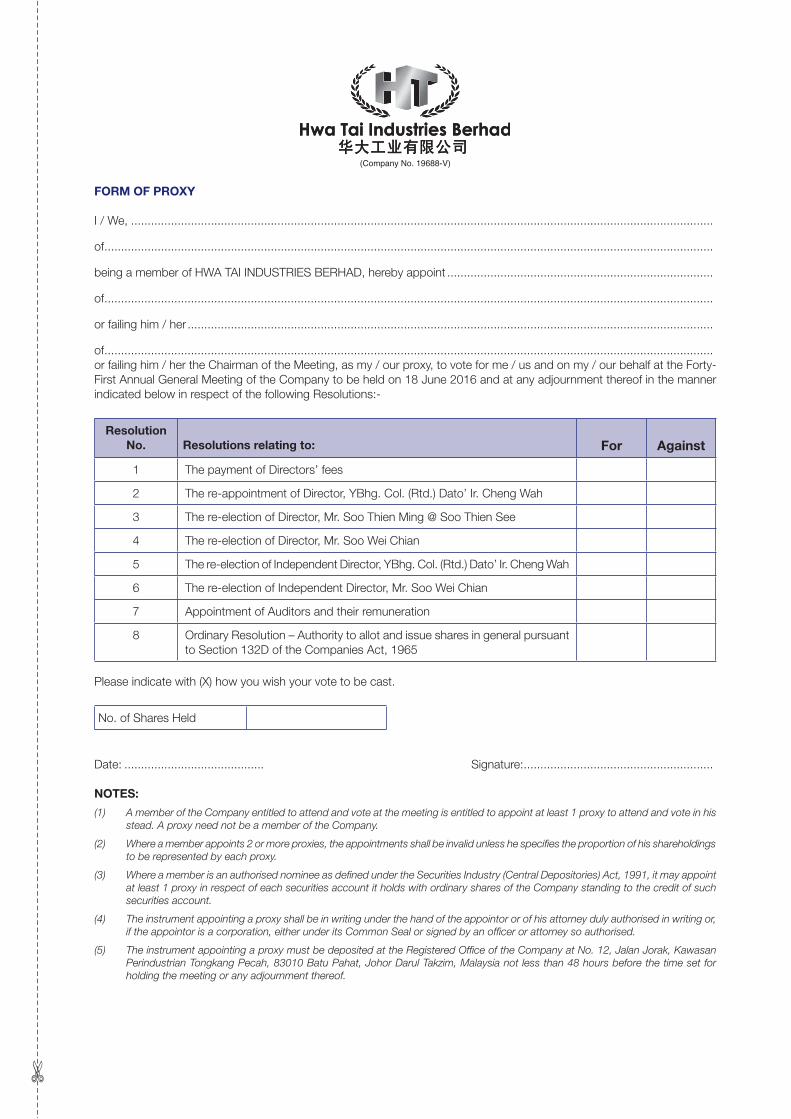
✄
FORM OF PROXY
I / We, ...............................................................................................................................................................................
of .......................................................................................................................................................................................
being a member of HWA TAI INDUSTRIES BERHAD, hereby appoint ................................................................................
of .......................................................................................................................................................................................
or failing him / her ..............................................................................................................................................................
of .......................................................................................................................................................................................or failing him / her the Chairman of the Meeting, as my / our proxy, to vote for me / us and on my / our behalf at the Forty-First Annual General Meeting of the Company to be held on 18 June 2016 and at any adjournment thereof in the manner indicated below in respect of the following Resolutions:-
ResolutionNo. Resolutions relating to: For Against
1 The payment of Directors’ fees
2 The re-appointment of Director, YBhg. Col. (Rtd.) Dato’ Ir. Cheng Wah
3 The re-election of Director, Mr. Soo Thien Ming @ Soo Thien See
4 The re-election of Director, Mr. Soo Wei Chian
5 The re-election of Independent Director, YBhg. Col. (Rtd.) Dato’ Ir. Cheng Wah
6 The re-election of Independent Director, Mr. Soo Wei Chian
7 Appointment of Auditors and their remuneration
8 Ordinary Resolution – Authority to allot and issue shares in general pursuant to Section 132D of the Companies Act, 1965
Please indicate with (X) how you wish your vote to be cast.
No. of Shares Held
Date: .......................................... Signature: .........................................................
NOTES:
(1) A member of the Company entitled to attend and vote at the meeting is entitled to appoint at least 1 proxy to attend and vote in his stead. A proxy need not be a member of the Company.
(2) Where a member appoints 2 or more proxies, the appointments shall be invalid unless he specifies the proportion of his shareholdings to be represented by each proxy.
(3) Where a member is an authorised nominee as defined under the Securities Industry (Central Depositories) Act, 1991, it may appoint at least 1 proxy in respect of each securities account it holds with ordinary shares of the Company standing to the credit of such securities account.
(4) The instrument appointing a proxy shall be in writing under the hand of the appointor or of his attorney duly authorised in writing or, if the appointor is a corporation, either under its Common Seal or signed by an officer or attorney so authorised.
(5) The instrument appointing a proxy must be deposited at the Registered Office of the Company at No. 12, Jalan Jorak, Kawasan Perindustrian Tongkang Pecah, 83010 Batu Pahat, Johor Darul Takzim, Malaysia not less than 48 hours before the time set for holding the meeting or any adjournment thereof.
THE SECRETARYHWA TAI INDUSTRIES BERHAD
NO. 12 JALAN JORAKKAWASAN PERINDUSTRIAN TONGKANG PECAH
83010 BATU PAHATJOHOR DARUL TAKZIM
MALAYSIA
Postage
Please fold here
Please fold here
Please fold this flap for sealing


![ANNUAL REPORT 2014 – 15 · hindusthan safety glass industries limited [cin no: l52399wb1982plc035375] annual report 2014-15 1 contents notice](https://img.pdfslide.us/doc/110x75/5f8e3dd793ca09544519e8b9/annual-report-2014-a-15-hindusthan-safety-glass-industries-limited-cin-no-l52399wb1982plc035375.jpg)
![TABLE OF CONTENTS - pegasusheights.com€¦ · NOTICE OF ANNUAL GENERAL MEETING Naim Indah Corporation Berhad (19727-P) [Annual Report 2008] 1 [Incorporated in Malaysia] NOTICE IS](https://img.pdfslide.us/doc/110x75/5d63339c88c993f97d8b9282/table-of-contents-notice-of-annual-general-meeting-naim-indah-corporation.jpg)