Embed Size (px)
Citation preview


Contents
1 INTRODUCTION AND POLICY CONTEXT 1
1.1 Introduction 1
1.2 Policy and Strategy Context 3
1.3 Network Overview 8
1.4 Overview of Current and Planned Metro Improvements 16
1.5 Benchmarking and Case Studies 17
2 CURRENT AND FUTURE DEMAND 20
2.1 Introduction 20
2.2 Historical and Current Drivers of Demand 20
2.3 Metro Demand Modelling 23
2.4 Impact of Land-use Planning on Future Demand 26
2.5 Metro Demand Study 29
2.6 Demand for Potential Station Sites on Existing Network 30
2.7 Demand for Local Rail Services 32
2.8 Conclusions and Recommendations 34
3 METRO FLEET RENEWAL 35
3.1 Context 35
3.2 Summary and Recommendations 39
4 METRO TECHNICAL OPTIONS APPRAISAL 41
4.1 Introduction 41
4.2 Metro Power Supply and Energy Recovery 42
4.3 Metro Depot Assessment 44
4.4 Signalling and Control 46
4.5 Energy Supply, Efficiency and Renewables 48
4.6 Essential Renewals post-2021 49
5 DELIVERING EXCELLENT CUSTOMER SERVICE 50
5.1 Introduction 50
5.2 Customer Satisfaction 51
5.3 Train Service Requirements 53
5.4 Passenger Journeys 54
5.5 Fares and Ticketing 56
5.6 Information Provision 58
5.7 Station Facilities 60
5.8 Park and Ride 61
5.9 Recommendations 63

6 FUTURE OPERATING STRUCTURES 65
6.1 Context 65
6.2 New Metro Operating Structures 66
6.3 Conclusions and Recommendations 70
7 METRO AND LOCAL RAIL NETWORK EXTENSIONS 71
7.1 Potential Extension Corridors 71
7.2 Routes to the Airport 73
7.3 The ‘Leamside line’ 73
7.4 South East Northumberland 74
7.5 Cobalt Corridor 74
7.6 Sunderland re-electrification 75
7.7 South Tyneside Track Dualling 75
7.8 New Routes to and from South Tyneside 76
7.9 New Routes in the Sunderland area 76
7.10 Durham Belmont – Sunderland / South Shields / Newcastle 78
7.11 Team Valley and A1 Gateshead Park and Ride 79
7.12 West Newcastle 79
7.13 Metro to Metrocentre 80
7.14 Local Rail Network Improvements 80
7.15 Network Integration Opportunities 81
7.16 Conclusions and Recommendations 82
8 FUNDING ARRANGEMENTS 84
8.1 Context 84
8.2 Potential Funding Sources 85
8.3 Conclusions and Recommendations 85
9 SUMMARY OF RECOMMENDATIONS 86
APPENDIX 1 CASE STUDIES OF UK URBAN LIGHT RAIL NETWORKS 89
APPENDIX 2 POTENTIAL FUNDING SOURCES 103
APPENDIX 3 NEW FLEET SPECIFICATION 108
TABLES
Table 1 2011 Census Mode of Travel to Work 11 Table 2 Metro Passengers by Age 20

Table 3 Tyne and Wear Population 1981 – 2014 21
Table 4 Gross Value Added 1981 – 2011 21
Table 5 Workplace Commuting Trips into Newcastle upon Tyne, 2011 Census 22
Table 6 Workplace Commuting Trips into Sunderland, 2011 Census 22
Table 7 Characteristics of UK Light Rail Networks 24
Table 8 Metrocar Technical Specification 36
Table 9 UK Light Rail Network Service Frequencies 54
Table 10 Estimated Impacts on Metro Patronage and Revenue of Varying Fares Increases 57
Table 11 Journey Purpose of Park and Ride Users 62
Table 12 Operating Arrangements on UK Light Rail Networks 68
CHARTS
Chart 1 Projected Metro Demand to 2030 – Current Network 30
Chart 2 Northern Rail Network Patronage Change 2006/07 to 2014/15 33
Chart 3 Train Control Automation Options 46
Chart 4 Metro Passenger Satisfaction Scores 51
Chart 5 Relative Importance of Metro Service Attributes 52
Chart 6 Passenger Satisfaction with Punctuality and Reliability 2010-15 52
Chart 7 Metro Trips by Distance Bands 55
FIGURES
Figure 1 Metro Network 2016 9
Figure 2 Annual Metro Passenger Movements 2015 10
Figure 3 2015 Indices of Multiple Deprivation in Tyne and Wear 13
Figure 4 Locations within 400m Walk Distance of Metro Stations 14
Figure 5 Northern Service Network 2016 15
Figure 6 Track Renewals at West Jesmond Metro 17
Figure 7 Existing Metrocar Side View 35
Figure 8 Existing Metrocar Overhead View 36
Figure 9 Metro Service at Airport Station 41
Figure 10 Metro Electrical Sub-station 44
Figure 11 Metro Depot, Gosforth 45
Figure 12 Factors Determining Passenger Satisfaction 53
Figure 13 ‘Longitudinal’ Seating on London Overground Train 55
Figure 14 Metro Smart Ticketing Infrastructure 58
Figure 15 Indicative Future Metro and Local Rail Network 72
Figure 16 Manchester Metrolink Bombardier M5000 Tram 90
Figure 17 Manchester Metrolink Network 2016 90
Figure 18 Stadler Variobahn Tram, Croydon Tramlink 92
Figure 19 Croydon Tramlink Network 92
Figure 20 NET Tram in Nottingham City Centre 93
Figure 21 DLR Train on Segregated Track 95
Figure 22 Docklands Light Railway Network 95
Figure 23 Glasgow Subway Route Map 97

Figure 24 Current Glasgow Subway Rolling Stock 98
Figure 25 Merseyrail Network 98
Figure 26 Merseyrail Class 507 Train 98
Figure 27 Sheffield Supertram Network 100
Figure 28 Tram in Sheffield City Centre 100
Figure 29 Vossloh Tram Train Vehicle 102
Figure 30 Future Supertram network showing tram train extension to Rotherham 102
Figure 31 Flexity Swift Vehicle as used in Rotterdam 108
1
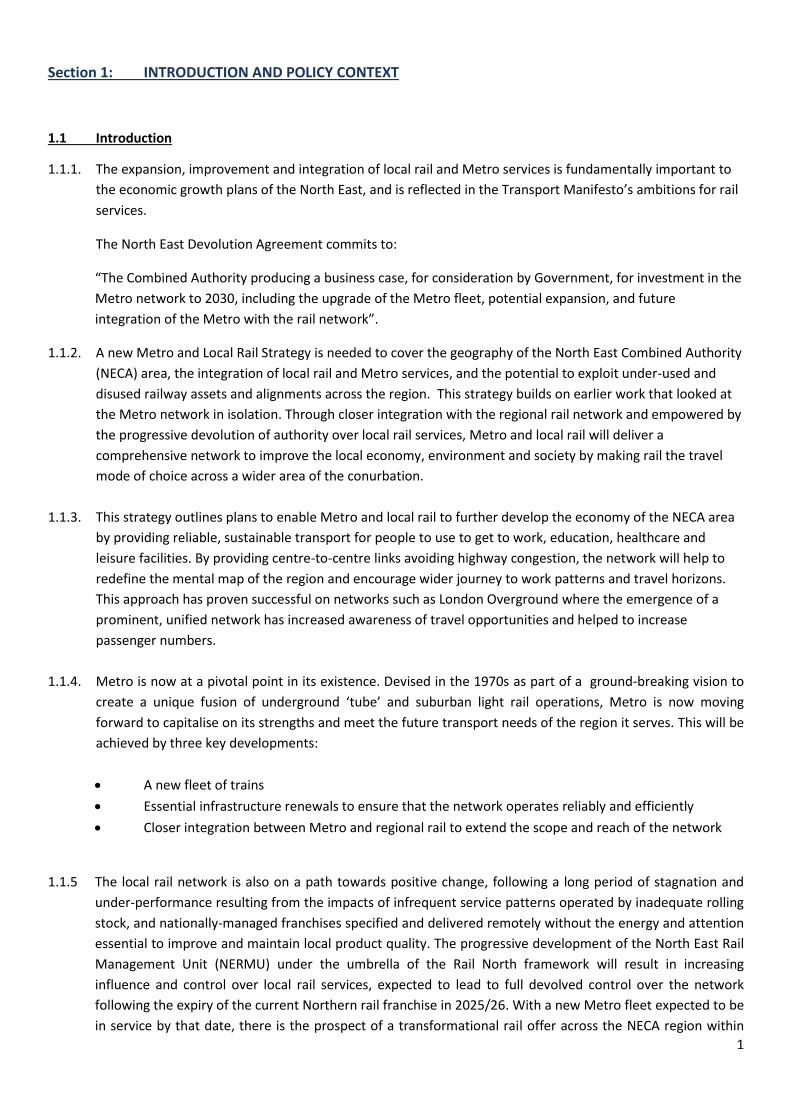
Section 1: INTRODUCTION AND POLICY CONTEXT
1.1 Introduction
1.1.1. The expansion, improvement and integration of local rail and Metro services is fundamentally important to
the economic growth plans of the North East, and is reflected in the Transport Manifesto’s ambitions for rail
services.
The North East Devolution Agreement commits to:
“The Combined Authority producing a business case, for consideration by Government, for investment in the
Metro network to 2030, including the upgrade of the Metro fleet, potential expansion, and future
integration of the Metro with the rail network”.
1.1.2. A new Metro and Local Rail Strategy is needed to cover the geography of the North East Combined Authority
(NECA) area, the integration of local rail and Metro services, and the potential to exploit under-used and
disused railway assets and alignments across the region. This strategy builds on earlier work that looked at
the Metro network in isolation. Through closer integration with the regional rail network and empowered by
the progressive devolution of authority over local rail services, Metro and local rail will deliver a
comprehensive network to improve the local economy, environment and society by making rail the travel
mode of choice across a wider area of the conurbation.
1.1.3. This strategy outlines plans to enable Metro and local rail to further develop the economy of the NECA area
by providing reliable, sustainable transport for people to use to get to work, education, healthcare and
leisure facilities. By providing centre-to-centre links avoiding highway congestion, the network will help to
redefine the mental map of the region and encourage wider journey to work patterns and travel horizons.
This approach has proven successful on networks such as London Overground where the emergence of a
prominent, unified network has increased awareness of travel opportunities and helped to increase
passenger numbers.
1.1.4. Metro is now at a pivotal point in its existence. Devised in the 1970s as part of a ground-breaking vision to
create a unique fusion of underground ‘tube’ and suburban light rail operations, Metro is now moving
forward to capitalise on its strengths and meet the future transport needs of the region it serves. This will be
achieved by three key developments:
A new fleet of trains
Essential infrastructure renewals to ensure that the network operates reliably and efficiently
Closer integration between Metro and regional rail to extend the scope and reach of the network
1.1.5 The local rail network is also on a path towards positive change, following a long period of stagnation and
under-performance resulting from the impacts of infrequent service patterns operated by inadequate rolling
stock, and nationally-managed franchises specified and delivered remotely without the energy and attention
essential to improve and maintain local product quality. The progressive development of the North East Rail
Management Unit (NERMU) under the umbrella of the Rail North framework will result in increasing
influence and control over local rail services, expected to lead to full devolved control over the network
following the expiry of the current Northern rail franchise in 2025/26. With a new Metro fleet expected to be
in service by that date, there is the prospect of a transformational rail offer across the NECA region within
2
the next decade. Work has already started to achieve this and there is much more to do in terms of planning,
investment and co-ordination to achieve this vital goal. In combination, a revitalised Metro and local rail
network has the capacity to transform how people travel across the region, widening horizons by making it
easy to access jobs, training and education and leisure, and connecting the region in a coherent and
sustainable way. Investment in Metro and local rail will reduce the wider impact of transport on the
environment, and help to improve levels of health.
Vision
1.1.6. The vision for the strategy is:
“An integrated, modern and sustainable Metro and local rail network for the NECA region that supports
the local economy, environment and society”
Objectives
1.1.7 The objectives of the Metro and Local Rail Strategy are:
(a) To provide reliable, accessible and comfortable Metro and Local Rail services with high levels
of customer satisfaction within available resources;
(b) To grow the Metro and Local Rail network and their modal share as part of an integrated
public transport network; and
(c) To achieve value for money.
1.1.8 To help achieve these objectives, the following areas are being developed:
• Specify, procure and introduce a new Metro fleet;
• Design new operating models and procure suppliers;
• Continue essential renewals works for the period 2020-2030;
• Expand the Metro and Local Rail network;
• Secure short and long-term financial arrangements, and
• Improve integration.
1.1.9 The strategy explains how these objectives will be achieved in the following sections.
Introduction and Policy Context:-Describes how the strategy will help to achieve national, regional and local
policy objectives and summarises the Metro and local rail networks.
Current and Future Demand:- Sets out the main drivers of demand for Metro and local rail both now and in
the future.
Fleet Replacement: – Describes the process which Nexus intends to follow to replace the existing Metro
rolling stock with a new fleet of trains.
Metro Technical Options Appraisal: - Evaluates various technical areas that will determine how a versatile
and reliable fleet can operate across a resilient network.
3
Customer Requirements:- Ensure that the requirements of future Metro and local rail customers are
anticipated and provided-for across all aspects of the strategy.
Operating Frameworks:- Identify future operational models for Metro, taking account of financial, fleet
replacement, network and passenger demand considerations.
Network Extensions Appraisal:- Evaluation of recommendations for Combined Authority consideration and
potential subsequent business cases for network extensions.
Financing:- Identifies potential investment, funding, development and asset opportunities that will enable the
successful delivery of the strategy.
1.1.10 At the heart of this strategy is the essential replacement of the existing fleet of life-expired Metrocars and
sub-optimal Pacer trains with a reliable new Metro fleet and new and refurbished regional rail trains that will
deliver the standards of service the NECA area requires, as well as expanding the scope and reach of an
integrated Metro and local rail network.
1.2 Policy and Strategy Context
National
1.2.1. The Government’s transport vision is “to make journeys better: simpler, faster and more reliable. Our plan
will support jobs, enable business growth, and bring our country closer together”. (DfT Single Departmental
Plan, 2015-2020). Its objectives to deliver this vision are:
Objective 1 - Boosting economic growth and opportunity;
Objective 2 - Building a One Nation Britain;
Objective 3 - Improving journeys; and
Objective 4 - Safe, secure and sustainable transport.
1.2.2 Under each of these objectives there are statements of what the Government will do to achieve them, for
example under Objective 2 – Building a One Nation Britain, the Government commits to greater devolution
to areas and working with Transport for the North to deliver the Northern Transport Strategy.
National Planning Policy Framework
1.2.3 The National Planning Policy Framework states, as one of its 12 core planning principles, the need to actively
manage patterns of growth to make the fullest possible use of public transport, walking and cycling, and
focus significant development in locations which are or can be made sustainable. It goes on to define
sustainable transport modes as any efficient, safe and accessible means of transport with overall low impact
on the environment, including walking and cycling, low and ultra-low emission vehicles, car sharing and
public transport. Metro has the possibility to further meet the aspirations set out in this framework by
becoming more energy efficient, more accessible and more reliable, all made possible through the
introduction of a new fleet of Metrocars.
4
Northern Transport Strategy Objectives
1.2.4 The DfT’s Northern Transport Strategy policy paper, published in March 20151 sets out the aspirations to
improve connectivity across the Cities of the North to drive economic growth. The paper sets out that “the
North will take a lead in prioritising and planning transformative transport interventions, right across and
beyond the North to: transform connectivity; improve journey times; improve capacity and resilience; and
simplify the user experience. Our strategy is about using transport to aid change in future patterns of land
use and economic growth, with the goal of creating a single economy in the North” (Northern Transport
Strategy, 2015, p4).
1.2.5 The Northern Transport Strategy also recognises the importance of better city region connectivity at a local
level. It states:
• “Better local connectivity to the priority areas for jobs growth. Improved connectivity between
communities and key employment growth areas, links to and from high speed rail stations and
international gateways, increased local rail/Metro/quality bus capacity and frequency
improvements and network extensions;
• Better local rail, rapid transit and bus - Good quality public transport fleets and infrastructure.
Good customer information, connections that work and a positive journey experience…providing
door-to-door local sustainable transport; and
• City regions where people and goods can travel reliably on road and public transport networks,
helped by better real time traffic management and driver information, well maintained roads,
metro and local rail, and simplified fare structures”.
1.2.6 This strategy advocates the creation of a ‘Northern Powerhouse’ which harnesses the collective strengths of
the North of England’s major urban areas by targeted investment to improve the Northern economy, in part
through the provision of better communications. In part this aim will be met by better transport links
between the different areas of the North, which will be a major element of the activities of Transport for the
North and Rail North as described below.
1.2.7 But good public transport within the North’s city regions is also important, a point highlighted in recent
Centre for Cities report2 which uses case studies from elsewhere in Europe to demonstrate that
conurbations such as the Rhine-Ruhr in Germany and The Netherlands’ Randstad out-perform their national
economies by the presence of strong agglomeration benefits which are derived in part from excellent public
transport links within these major urban areas. The report argues that successful city regions require a
combination of increased city density and a larger pool of skilled workers. To facilitate these, investment in
sustainable transport links is essential to provide reliable, affordable mass transit links. 93% of the NECA
area’s workforce live and work within the same city region, a notably higher proportion than areas such as
the Sheffield and Liverpool city regions (84% and 83% respectively).
1.2.8 Higher levels of agglomeration and ‘knowledge spillovers’ tend to occur those in areas of greatest density of
economic activity, which are often locations prone to traffic congestion. The report suggests that the
problems and solutions of such areas are best understood and addressed by those involved in their
governance, and that good urban transport links are a critical part of the route towards success.
1.2.9 The Centre for Cities report recommends that the best way to improve the economic performance of
individual city regions is to focus investment on removing the barriers to the creation of a wider labour pool 1 The Northern Powerhouse: one agenda, one economy, one North – a report on the Northern Transport Strategy
2 Building the Northern Powerhouse - Lessons from the Rhine-Ruhr and Randstad. Centre for Cities June 2016.

5
and to increase economic and social agglomeration. It suggests that the high-performing city regions of
Rhine-Ruhr and the Randstad do not act as one labour market, but as a number of them. This means that
transport systems within city regions are more important for enabling businesses to access workers and
workers to access jobs than transport links between cities, and that if the Northern Powerhouse is to be
successful, then it must primarily focus on making its cities more attractive to business investment. The
Metro network will play a key role in this evolving process.
1.2.10 Further support of the Northern Powerhouse concept has arisen from the recent publication of the Northern
Powerhouse Independent Economic Review3, a suite of documents which set out the North’s strengths, and
the some of the weaknesses, that need to be addressed in order that these can be exploited. The review
describes how transport connectivity has a role in promoting a higher employment rate, by improving access
to centres of employment, and in promoting higher productivity, by improving the attractiveness of an area
for investment, improving access to markets, increasing the pool of workers available to work in higher
productivity urban locations, and increasing the effective scale of cities and the associated benefits of
agglomeration. The review states that for city centre employment to grow to the maximum extent and the
full scale of agglomeration benefits realised, it will need to be accommodated by enhanced public transport
connectivity within city regions. This will entail coherent, user-friendly joined-up networks, involving
frequent rail services (including cross-city operations), light rail and bus, all supported by smart, multi-modal
ticketing with simplified fares. Metro and Local Rail will therefore act as key enablers in this process.
DfT Rail Objectives
1.2.11 Local rail is also an important priority of national government policy. This this is reflected by the
commitment to remove Class 142 and 144 Pacer trains from services operated under the Northern rail
franchise by the end of 2019, and to inject new rolling stock into network operations - although not for the
time being within the NECA area. Of greater long-term significance is the DfT’s commitment to the
progressive devolution of the day-to-day management of franchised rail operations to a regional rail
management unit within the framework of Rail North, with input and influence developing within the
current franchise period leading to full devolution of franchise specifications within the next decade.
Potential long-term proposals for sections of the national rail network such as electrification of the Durham
Coast line, (to include Pelaw – Sunderland), the introduction of passenger services on the Ashington Blyth
and Tyne line, and the re-use of the Leamside rail corridor are of particular significance to Metro’s and local
rail’s future operations.
1.2.12 Rail North is the organisation that has been set up to facilitate the transition from central DfT oversight of
the Northern franchise to devolved responsibility. It brings together Local Transport Authorities across the
North of England into one cohesive and proactive body, which represents the regional and local economic,
transport and strategic objectives for the rail industry. Rail North will enable the 29 local authorities across
the North to develop their understanding of rail industry processes and to provide their local experience and
expertise to influence franchising outcomes. At present Rail North and the DfT jointly manage the Northern
and Transpennine rail franchises; over the coming years, control over decision-making and financial risk will
progressively pass from national to regional hands. Rail North has published a Long Term Rail Strategy4
which sets out an ambitious blueprint for improvements across the North of England. Four key themes -
Connectivity; Coherence; Capacity and Cost-effectiveness, are the basis of the strategy.
1.2.13 As a further step, in the North East, the North East Rail Management Unit (NERMU), the first of its kind in the
country, will see Northern’s services in the North East, marketing, development and investment decisions
3 Northern Powerhouse Independent Economic Review. Transport for the North June 2016.
4 Long Term Rail Strategy. Rail North September 2015.

6
developed in partnership with the NECA and Tees Valley Unlimited for the first time, within the wider Rail
North structure. As a result there will be increased local accountability for operational performance, and a
strong local focus for further investment. The overall outcome will be the transition from national to regional
control of local rail services within the next decade. This is covered in more detail in Section 6.
North East Local Enterprise Partnership Strategic Economic Plan
1.2.14 The North East Local Enterprise Partnership (NELEP) is one of a national network of enterprise partnerships
set up by government to make the North East a place where more businesses invest, grow and prosper,
delivering more and better jobs for everyone. The NELEP is responsible for delivering the North East
Strategic Economic Plan, bringing investment into the area including the £330m Local Growth Deal and
championing the North East nationally and globally, to influence and shape the continued economic growth
of the area.
1.2.15 The Strategic Economic Plan5 sets out how the North East economy can, and will, grow in the coming years.
The Economic Plan is broken down into six key themes:
1. Innovation: Creating competitive advantage through innovation – building a platform for local
businesses to contribute to their own future with the support to excel in whatever area they choose.
2. Business Support & Access to Finance: Providing the framework for business to access the
information, advice and finance they need to thrive and grow.
3. Skills: Improving the North East skills base – making sure every subsequent workforce has the right
skills to support business growth and to move forward in the most self-sufficient way.
4. Economic Assets and Infrastructure: Developing the areas in which businesses can invest and grow,
and people can train and excel.
5. Employability & Inclusion: Sourcing the skills from within the North East by supporting those who
can’t easily access training and employment.
6. Transport & Connectivity: Creating the best networks – connecting the North East to the national
and international economy.
1.2.16 The role of Metro and local rail is significant in assisting the region to deliver its aspirations for economic
growth. The Strategic Economic Plan recognises the importance of the Metro system, highlighting that the
overriding objectives for the Metro moving forward “are to replace the fleet of Metrocars and extend the
reach of Metro beyond its current sphere of operation and the boundaries of Tyne and Wear. Work needs to
commence in the medium term to plan for the design and procurement of the replacement fleet”.
1.2.17 There is some evidence that light rail networks can stimulate additional growth. The investment case for
Manchester Metrolink extensions (discussed in greater detail in Appendix 2) is partially predicated upon
additional light rail corridors across the Greater Manchester conurbation being linked to higher levels of
Gross Value Added6 (GVA) than would otherwise occur. A study into the economic impacts of light rail7
suggested that light rail can improve the image of a city and contribute to economic regeneration, and that
installing a new tram/light rail system could provide a visible, permanent way of showing that an area is
being invested in for the future. It suggests that urban renewal enhances economic activity and brings more
5 Strategic Economic Plan. North East Local Enterprise Partnership 2014
6 Gross value added (GVA) is the measure of the value of goods and services produced in an area, industry or sector of an
economy. 7 What Light Rail Can Do For Cities: A Review Of The Evidence: SDG 2005.

7
visitors, which provides the basis for improvements to public transport, which in turn has the potential to
impact positively on property prices, which then stimulates further renewal and regeneration in a “virtuous
spiral” thus linking growth in light rail demand with economic growth.
1.2.18 The NELEP is in the process of refreshing their Strategic Economic Plan to ensure that it reflects changing
circumstances, taking into account new evidence of the region’s economic position and an evolving public
policy environment including a national innovation plan, a new national infrastructure commission and an
emerging devolution deal. An evidence update8 document suggests that to achieve the 1 million jobs target
by 2024 as set out in the Plan will require an additional 89,000 jobs over those predicted by current
trajectories, requiring greater investment in higher growth ‘smart specialisation’ industries, and a higher rate
of workplace participation.
Regional Policy and Devolution
1.2.19 Regional transport policy-making now takes place at the Combined Authority and Local Enterprise
Partnership level (LEP). The NECA Transport Plan, currently in preparation, complements the Strategic
Economic Plan and will build upon the key messages in the North East Transport Manifesto9 which envisages
an important role for Metro and local rail in establishing the key principles that transport should be easy to
use, reliable, affordable and accessible. Four themes underpin this vision
• Easy to use. It should be easy to plan safe journeys, find out the best way to travel, pay for tickets
and get all the essential information for your journey;
• Reliable. The transport network should be one that we can rely on to work, with buses and trains
running on time and congestion at a minimum;
• Affordable. Transport should be provided at a reasonable cost relative to the journey being made;
• Accessible. Transport should run as near as possible to where people live and want to travel to, and
where businesses are (or want to be) located. It should be usable by everyone.
1.2.20 These themes have been expanded into a set of guiding principles that govern what the NECA is trying to
achieve. In terms of local rail and Metro, the Manifesto commits to:
replace outdated Pacer trains and deliver an essential new fleet for the Tyne and Wear Metro
create a regional express network, with high quality, faster trains and more routes electrified;
open new local stations on current lines, re-open key disused lines, consider more Park and Ride
stations, upgrade freight-only sections to passenger use and build new routes;
devolve greater control to the region, so local rail and Metro can be managed together to deliver a
higher standard for stations, information and customer service; and
work with rail industry partners to address overcrowding and improve cycle access on trains.
1.2.21 The government is negotiating ‘devolution agreements’ with several areas of the UK which, if implemented,
will see the transferral of powers and funding relating to transport and other areas, to regional Combined
Authorities. This strategy has been prepared in the expectation that devolution in the NECA area will be
progressively implemented. The draft Devolution Agreement between the NECA and Government in relation
to transport states:
8 The North East Strategic Economic Plan Evidence Base May 2016. NELEP/NECA
9 Our Journey: A 20 Year Transport Manifesto for the North East. North East Combined Authority 2016.

8
“The Mayor and the Combined Authority, will create the UK’s first fully integrated transport system,
with the ambition to bring together responsibilities for rail, local highways, metro, buses and ferries,
for both urban, sub-urban and rural communities. To achieve this ambition Government will consider
establishing and devolving a long-term funding programme to support investment in the Metro. This
will include:
• Considering, through the spending review, setting a multi-year funding allocation for Metro
reinvigoration phase 2, committed up to 2020-21; and
• The Combined Authority producing a business case, for consideration by Government, for
investment in the Metro network to 2030, including the upgrade of the Metrocar fleet , potential
expansion, and future integration of the Metro with the rail network.
Longer-term, the Mayor and the Combined Authority, will bring forward a business case, for
consideration by Government, for the unification and full devolution (beyond the forthcoming
Northern franchise) of the management of rail and metro services within the North East, with the
aim of creating the UK’s first integrated regional rail network combining light and conventional rail”
1.2.22 These national and regional policy objectives set a coherent framework for the development of a strong and
influential Metro and local rail network that will deliver the key aims of both rail and local government
devolution, as well as a wide range of local transport benefits.
1.3 Network Overview
Metro
1.3.1 The current Metro network can be summarised by the following three key statistics:
40 million passenger trips per year
90 trains
60 stations
1.3.2 The majority of stations were purpose-built in the 1980s and vary from large city centre transport
interchanges to local suburban stations. Some of the North Tyneside coastal stations are former North
Eastern Railway structures adapted to meet present-day requirements. Sunderland station is currently an
exception in that it is owned by Network Rail, and operated by Arriva Rail North Ltd.

9
Figure 1: Metro Network 2016
1.3.3 Metro connects the key centres of population in Tyne and Wear, as shown in the network map above. Metro
is readily accessible (defined as those who live within 800m of a Metro Station) to 350,000 individuals.
Passenger surveys (Nexus Business Intelligence patronage figures, adjusted for the frequency of Metro
travel) suggest that approximately one quarter of the Tyne and Wear population (297,600 i.e. 27% of 1.1m)
uses Metro, with many Metro stations serving as interchanges with other modes of public transport, mainly
local bus services but also taxi, national and local rail services and also air transportation.
1.3.4 Figure 2 below shows the passenger movements by Metro by Local Authority area in 2015/16. They
demonstrate the importance of Metro for providing connectivity and accessibility, across the geography of
Tyne and Wear, but also highlight the number of journeys taken within Local Authority boundaries as well,
which in most cases is significant.

10
Figure 2: Annual Metro Passenger Movements 2015

11
1.3.5 Metro operations began in 1980, and services to South Shields began in 1984. The system was extended to Newcastle Airport in 1991, providing a 23 minute link to Newcastle city centre. A further extension of the Metro was then undertaken, in 2002, to Sunderland mainly using Railtrack (now Network Rail) infrastructure. Metro was the UK’s first modern light rail service, the first to be designed with disabled people in mind, the first to be non-smoking and the first to provide mobile phone and internet reception throughout its underground sections.
1.3.6 The Sunderland line extends 18.5km through Sunderland city centre to South Hylton of which 14km is on existing heavy rail line between Pelaw and Sunderland and 4.5km - south of Sunderland along the south bank of the river Wear, to South Hylton - on a previously disused railway alignment. The work entailed signalling work, to allow for ‘double blocking’ (an additional block behind the first train is kept empty to increase the safety margin between trains, therefore a train cannot enter a section block until the two blocks ahead have been vacated by the preceding train), the electrification of the line which required some track lowering and the reconstruction of four bridges. Other areas of work saw new stations developed as well. It was the culmination of eight years development and planning work involving a very broad range of activities and a pioneer in the practice of joint running between heavy rail and light rail stock, requiring the safety measures described above.
1.3.7 Metro plays an important role in multi-modal journeys. Bus and taxi interchanges at locations such as Heworth, Sunderland Park Lane, Regent Centre, Gateshead and Four Lane Ends enable integrated journeys to be made, with through-ticketing products available. Over ten Metro Stations provide car parking for Park and Ride, and almost all have bicycle storage facilities. Interchange with national and local rail services is provided at Newcastle Central Station, Sunderland and Heworth. Metro provides a direct link between town and city centres across Tyne and Wear and Newcastle Airport, from where there are flights to the USA, the Middle East and a range of domestic and European destinations.
Home Light
Rail
Train Bus Car Foot Bike Other Not
Working
England
&
Wales
6.6% 2.4% 0.7% 4.6% 38.3% 6.3% 1.8% 0.8% 35.5%
North
East
4.8% 1.5% 3.2% 5.5% 39.3% 5.9% 1% 0.9% 40.1%
Tyne
and
Wear
4.1% 3.3% 0.7% 8% 35.7% 5.8% 1.2% 0.6% 35.5%
Table 1: 2011 Census Mode of Travel to Work

12
1.3.8 The table above shows the mode of travel to work in the 2011 Census of those aged 16 – 74. The proportion of people using light rail for travel to work in 2011 in Tyne and Wear is not only significantly higher than the light rail figure for England and Wales, but it also overshadows the national figure for travel to work by train. The proportion of people travelling to work by car is the lowest in the UK outside of London, with 27.91% of households in Tyne and Wear having no access to a car. This makes reliance on public transport more important than in other areas, and requiring that the transport network continues to be accessible, reliable, affordable and available.
1.3.9 Metro plays a role in offering transport choice for people with mode options. It assists in helping to reduce levels of urban road congestion in Tyne and Wear. Its dedicated infrastructure means that it places no reliance on the highway network, ensuring reliable, congestion-free journeys. This advantage particularly applies along the corridors into urban centres, for shopping, services, education and employment. Metro also provides direct access to major employment sites such as the Department for Work and Pensions (DWP) facility in Longbenton, and the Port of Tyne together with the urban centres. With an interchange, employment locations at Cobalt and Silverlink in North Tyneside are also accessible by Metro.
1.3.10 From the outset, Metro was designed to be accessible for wheelchair users, with lifts and ramps and level boarding on to Metrocars. Accessibility standards have risen and significant expenditure in the Asset Renewal Plan is focused on meeting and in many cases surpassing national station access standards including the refurbishment of the current Metrocars to meet the requirements of the Rail Vehicle Accessibility Regulations 2010, pending their replacement by a new fleet of trains.
1.3.11 Metro is central to future decisions on land-use planning and transport infrastructure investment. The National Planning Policy Framework states as one of its 12 core planning principles, the need to actively manage patterns of growth to make the fullest possible use of public transport, walking and cycling, and focus significant development in locations which are or can be made sustainable, for example in urban centres. It goes on to define sustainable transport modes as any efficient, safe and accessible means of transport with overall low impact on the environment. Although rail services are not cheap to provide, capital investment in the Metro network has already been made and the benefits it provides are substantial and durable. Metro is an instantly recognisable brand. It is popular and easily understood by the people who use it, and the plans outlined in this strategy for further investment and closer integration with the local rail network will keep delivering benefits to users and non-users alike in terms of reducing congestion and providing sustainable accessibility.
Indices of Multiple Deprivation 2015
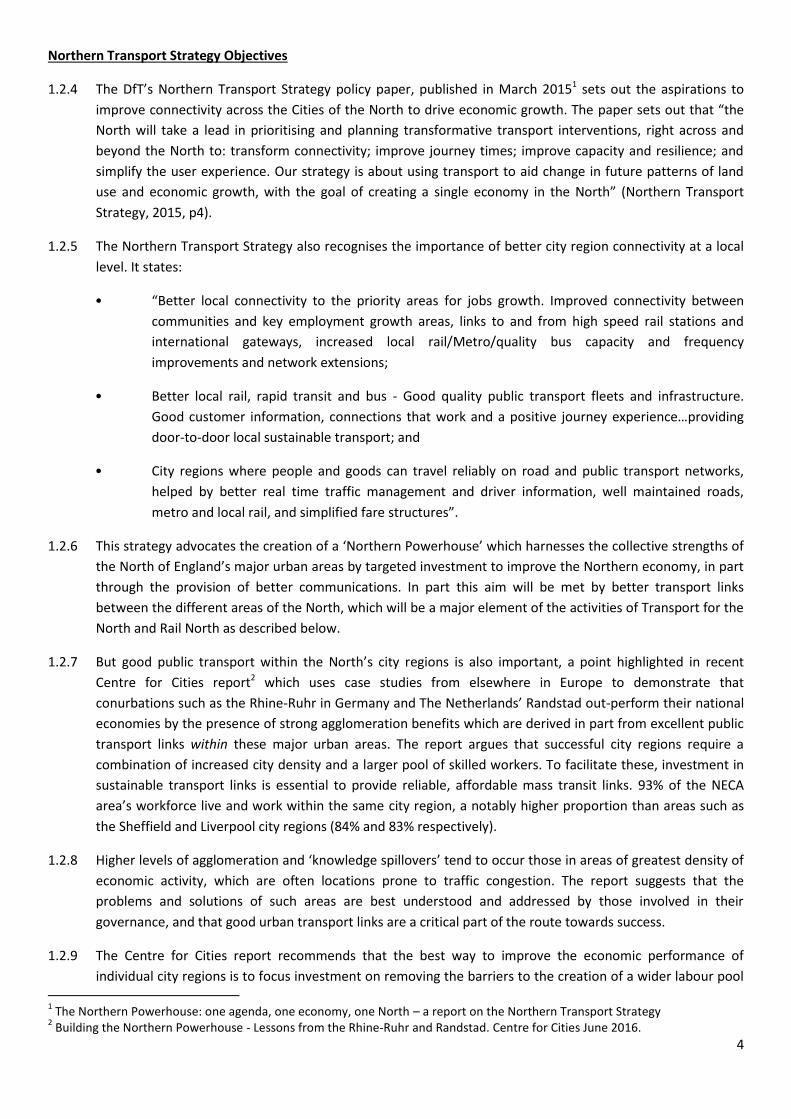
1.3.12 Metro continues to link areas of deprivation with areas of opportunity, as highlighted in Figure xxx below. 23
of the 60 Metro stations on the network are located in the bottom 20% of nationally defined areas of
deprivation. The contribution Metro makes to providing good levels of accessibility from these areas to jobs,
education and training, health and social facilities and shops must therefore be regarded as very significant.
Figure 3 shows the distribution of the Index of Multiple Deprivation (IMD) across Tyne and Wear, with the
greater concentration of deprivation along the banks of both the River Tyne and River Wear. In particular,
South Tyneside has seen the steepest increase in the country in levels of deprivation over the past five years,
compared to the last IMD results in 2010. The borough has seen a 10% increase in deprivation which takes
South Tyneside’s figure to 28%, and ranks the area as the 23rd most deprived part of England. Alongside this,
the North East also showed the highest unemployment rates across Great Britain in 2015 at 8.5%, against the
average of just 5.8%.
13
Figure 3 - 2015 Indices of Multiple Deprivation in Tyne and Wear
1.3.13 Metro supports community regeneration, economic development and public health by providing long-term,
high-quality accessibility. Many developers plan around Metro as a key means of access because they believe
it will be there for the long term. Nexus has built two new stations at Northumberland Park and Simonside in
recent times, partly using funding sourced from developer contributions. Developers continue to explore
more opportunities for new stations, linked to major planned developments. Providing developments with

14
close access to the Metro system can assist in integrating planning and transport, making them more
sustainable from the outset.
Figure 4 - Locations within 800 metres walk distance of Metro stations
Local Rail
1.3.14 The local rail network in the NECA region is surprisingly sparse in relation to population. This is for two
reasons – the predominance of Metro on much of the former British Rail local rail network, and the long-
distance, high speed focus of the East Coast Main Line (ECML). The routes within the NECA area are listed
below and are shown on the network diagram below:
Chathill – Morpeth - Newcastle
Newcastle – Metrocentre – Hexham – Carlisle
Middlesbrough – Hartlepool – Sunderland – Newcastle

15
Bishop Auckland – Darlington
Newcastle – Chester-le-Street – Durham - Darlingon
1.3.15 Other routes are operated in the Tees Valley which lie outside the area considered by this strategy, but
which are within the NERMU area of responsibility and are part of the same Northern business unit centred
upon Heaton depot in Newcastle. Nexus and the NECA will work with colleagues in the Tees Valley Combined
Authority, which has similar shared aspirations for improved rail services, to ensure that each area’s plans
enhance and complement the other. The routes listed above all form part of the Northern franchise;
however services along the ECML corridor are also provided by Transpennine and Intercity rail operators.
Train services between Sunderland, Heworth and Newcastle are specified and funded by Nexus, with joint
ticketing, providing a fast hourly service to augment the basic 12-minute Metro frequency.
1.3.16 Currently all Northern services are operated by diesel-powered Pacer and Sprinter multiple unit trains, as has
been the case since network privatisation. From 2019 a ‘Northern Connect’ service will be overlain over the
existing pattern between Teesside, Newcastle and Carlisle featuring limited-stop services provided by
refurbished trains, and additional Transpennine services will extend to and from Edinburgh providing
additional services at some stations in Northumberland.
1.3.17 Most Northern stations are unstaffed, and there are no smart ticketing facilities other than between
Sunderland and Newcastle. Most services operate to an hourly or half-hourly frequency, and other than
ECML services are formed of two or three-car trains. The local rail network clearly has unmet potential and it
will be the task of Rail North, the NERMU, NECA and Nexus to ensure that it plays a greater future role in
local sustainable transport provision. In the NECA area, closer integration with the Metro network will be a
key part of this proposition.
Figure 5 - Northern service network 2016
Rail Freight
1.3.18 Although the amount of freight carried on the region’s rail network is a small proportion of its historical
volume, that which remains is vitally important to the local and national economy. Freight has equal network
rights with passenger trains, therefore any prospectus for improved Metro and local rail services must take
account of current and known future flows, which can be difficult to predict. Over the last three decades,
centuries of coal shipments from the region reversed to become flows of imported coal, and these have also
subsequently reduced considerably as the UK’s dependence on coal for electricity production continues to
diminish. Flows of imported wood pulp (biomass) for power station use have partly replaced coal, but it is
not known for how long these will continue. At present there is comparatively little traffic in raw materials or
finished goods processed within the North East, with most of the tonnage consisting of transit traffic.

16
1.3.19 The main freight flows within the NECA region in 2016 are summarised below. Some are seasonal in nature
and most are infrequent by comparison with passenger services.
Coal for Lynemouth power station via the Blyth and Tyne line (the power station will shortly be
converted to biomass operation).
Coal traffic between Port of Tyne and North Blyth via the Blyth and Tyne line.
Alumina trains between North Blyth and Fort William via the Blyth and Tyne.
Biomass imports from Port of Tyne mainly for Drax Power Station via Pelaw and/or Sunderland.
Nuclear flask traffic between Hartlepool Power Station and Sellafield.
Cement traffic from Dunbar to Seaham Harbour via Sunderland.
Opencast coal traffic from Ayrshire to Yorkshire/ Nottinghamshire power stations via Hexham.
Occasional oil traffic from Lincolnshire to Jarrow oil terminal via Pelaw.
Long-distance freight flows using the ECML through Newcastle and Durham.
1.3.20 Freight paths to accommodate some of the flows listed above exist to and from the Port of Tyne via Boldon
East and West Junctions, sharing the available track capacity between Pelaw and Sunderland with Metro,
Northern and other non-passenger services. The capacity of the line from Pelaw to Sunderland is restricted
due to the slower acceleration and deceleration of freight trains and the ‘double blocking’ that is required
for shared use of this section. ‘Double blocking’ refers to the additional space that is required between trains
and is enabled by the signalling system, to create an additional layer of safety for Metro services.
1.3.21 Despite rail freight currently standing at a low ebb, there is every possibility that flows could increase in
future as part of a concerted shift from road to rail. NECA and its partners will therefore take cognisance of
this when planning the technologies and the network capacity required to deliver a step-change in the
provision of Metro and local rail services.
1.4 Overview of Current and Planned Metro Improvements
1.4.1 This section provides a brief overview of investment already under way and in planning that will ensure that
Metro’s assets are maintained and improved for the long-term.
1.4.2 The Metro Reinvigoration Programme comprises three phases. Phase 1 is now complete and involved
provision of a ticketing and gating programme alongside the introduction of smart ticketing products. Phase
2 encompasses the bulk of the asset renewal programme that is currently under way across the network,
ensuring that tracks, buildings, systems and stations are maintained and renewed in the best possible
condition. Phase 3 comprises fleet renewal and potential signalling and depot improvements. Feasibility
work on potential network enhancements and extensions will proceed in parallel with this programme.
1.4.3 Phase 2 of the Metro reinvigoration programme reflects the need to renew many of the essential assets
necessary to the safe and efficient operation of the network. It covers an 11-year period from 2009/10 to
2020/2021, covering the network’s operating, renewal and maintenance costs with certain enhancements.
90%-funded by the Department for Transport, it provides the base budget and consequent financial security
for a decade of Metro operations, in return for the attainment of demanding operational, commercial and
renewals targets. With Nexus now at the midway point of the programme, the DfT has indicated its
satisfaction with progress to date by confirming the availability of a further three-year roll-forward of
funding.
1.4.4 Between 2010 and 2016, £218million has been invested in the current Metro system. 24km of track has
been re-laid, 44km of new signal cables and 31km of troughing installed in order to accommodate modern

17
communications systems for public address, CCTV and Customer Help Points. Stations have been
modernised and 18 escalators and 12 lifts replaced across the network with more energy efficient models.
The fleet of Metrocars has also been refurbished and there has been investment in safety critical systems
such as the in-cab radio and traffic management systems. This investment has improved the operational
performance of the system’s infrastructure; resulted in no delays caused by rail breaks over the last two
years, point failures now occurring every nine years rather than every three, and a 30% reduction in
signalling failures. Due to the investment, resilience of the network to extreme weather and the climate has
improved.
1.4.5 Successful delivery of the Metro reinvigoration programme has relied on the collection and interpretation of
full and accurate asset information, thus ensuring that investments are made in the required areas of the
business at the most appropriate time. The successful implementation to date of the programme confirms
the ability of Nexus to manage and deliver complex and expensive renewals projects. The non-fleet element
of the programme covers earthworks, bridges and permanent way, where the guiding principle is to adopt a
risk-based and condition-based approach. The overhead line system is being upgraded to an improved
specification. Station monitored communication equipment is being replaced during station refurbishment
projects, with signalling maintained and upgraded as appropriate pending a decision as to future signalling
and control requirements.
1.4.6 The programme will safeguard the operation of Metro at its current levels and future-proof the network for
expansion, providing a strong foundation for the network to accommodate additional future demands.
1.5 Benchmarking and Case Studies
1.5.1 Nexus is a member of the international NOVA group of metro networks which aims to share best practice
and achieve world-wide collaboration across the industry. In 2012, Nexus participated in an international
benchmarking exercise which compared key performance indicators across a range of subjects, involving 14
medium-sized light rail networks.
Figure 6 - Track Renewal at West Jesmond Metro

18
1.5.2 Key performance indicators enable performance to be compared on a universally consistent and
understandable basis between organisations. Structured KPI comparisons, based on the Harvard Business
School balanced scorecard model, can be used for:
Direct comparisons – to better understand the differences between operators
Internal motivation – setting targets for improved performance
Identifying high priority problems, strengths and weaknesses
Supporting dialogue with government, regulators, and other stakeholders
1.5.3 Benchmarking was undertaken around the following key themes:
Growth, learning and innovation
Financial
Capacity provision and utilisation
Service quality
Reliability and availability
Safety and security
Environment
1.5.4 In terms of passengers carried per network kilometre, Metro’s performance reflects the comparatively low
density of population, longer than average distances between stations on sections of the network compared
with other light rail networks, and competition from other modes of transport. This demonstrates the
potential for the existing Metro network to accommodate significantly increased patronage levels.
1.5.5 In the context of other UK rail networks, a high-level of Metro comparison with the passenger rail network
across Scotland is as follows, this highlights the intensive operation of Metro within a small geographical
area:
Around 50% of annual patronage
Around 20% of the number of the stations
Around 20% of the number of daily weekday departures
1.5.6 Metro scores amongst the lowest in terms of operated passenger capacity in relation to network size,
indicating the capacity for potential extensions to feed into the existing network, and the comparatively low
frequency of services outside of the central Newcastle/Gateshead corridor. This is in itself reflective of the
lower than average levels of population density within accessible distances of the network as a whole. This
highlighted spare capacity represents a major opportunity for Metro to extend its operations, often at
marginal incremental cost, by making best use of existing spare network and infrastructure capacity.
1.5.7 Comparing network staff numbers with total numbers of passengers carried, Metro also fares well, reflecting
the substantially unstaffed nature of the network, but here operational factors come into play to a greater
extent; for instance the London Underground could only function to the intensity it does with the level of
station staff it employs. Nevertheless Metro’s position in the study as the lowest-cost operator in terms of
staff costs across a range of metrics per revenue car kilometre including maintenance, train service and
station operations indicates that the network as a whole performs efficiently when benchmarked with its
peers.
1.5.8 Energy usage by Metro was greater than the study average, both in term of kilowatt hours per train
kilometre operated and per passenger carried. This reflects the traction technology used on the network and
the disproportionate influence of ‘fixed’ energy consumption on a network with relatively few train

19
movements. Carbon emissions per passenger kilometre are also high, again reflecting passenger load factors
and the use of outmoded rolling stock. Again this highlights the potential within the existing network to
accommodate more passengers, and the benefits to be gained from the early introduction of a fleet of more
energy efficient trains.
1.5.9 Metro has a higher than average level of incidence of crimes per million passenger journeys, although the
actual figures are lower than are often perceived by users and non-users. Nevertheless the comparative data
highlight the need for continued vigilance to achieve the safest possible conditions for customers and staff.
1.5.10 In terms of levels of fare evasion, Metro had historically one of the higher incidences, but the proportion
decreased markedly over the period of the study, from around 8% of journeys in 2002 to around 4%. This
has fallen further with the implementation of the gating programme at key Metro stations.
1.5.11 Fares revenue per passenger journey for Metro is around the average of the networks included within the
study. When compared with the cost per passenger journey, it gives a quick view of the degree to which
passengers fund its operations. This indicator is affected to a greater extent than others by the influence of
national and local government policies towards the funding of light rail networks, alongside the
demographics of the areas they serve.
1.5.12 In summary Metro currently performs well in terms of operational efficiency and costs; less so in terms of
efficiency of use of the available network and passenger capacity, and energy consumption. Details of the
outcomes of the benchmarking study have been used to inform various aspects of the strategy and to
outline how these areas for improvement will be addressed by its implementation.
1.5.13 Included as Appendix 1 are case studies which provide background context on similar light rail networks
elsewhere in the UK, the tram-train pilot, and one heavy rail urban network which has similarities with
Metro. In each case, an outline of its history and operation provides a fuller picture of UK light rail
development and the future plans for each network. They demonstrate how the development of new UK
light networks has evolved since Metro opened in 1980, and what is planned for the future.
1.5.14 The case studies show that light rail is playing an ever–greater role in the delivery of urban transport
solutions, and that new technology can enable Metro to employ proven solutions to deliver future demand
requirements and customer expectations. Of particular relevance are the experiences of networks which are
challenging conventional thinking on the boundaries between ‘light rail’ and ‘heavy rail’ operation.

20
Section 2: CURRENT AND FUTURE DEMAND
2.1 Introduction
2.1.1 Metro currently carries 40 million journeys per annum. Nexus’ monitoring data shows that the main journey
purpose for Metro passengers is work (42%), followed by shopping (20%), education (11%) and leisure (11%).
The age profile of Metro users is shown in the table below. Nexus research shows that 47% of people travel
five times a week or more by Metro, emphasising its importance for work and education trips. 18% of people
use the network three or four times a week and a further 18% once or twice a week, showing the
importance of the system to commuters and regular travellers.
Age Percentage
Under 16 8%
17 – 24 20%
25 – 34 24%
35 – 44 14%
45 – 59 17%
60 + 17%
Table 2 - Metro Passengers by Age
2.1.2 Forecast increases in demand for Metro and local rail over the period to 2030 suggest that the existing
networks will experience a continuing increase in passenger numbers, as has been the case in recent years
following a period of falling demand for Metro. Whilst off-peak capacity is ample, peak-time trains are
already at or approaching capacity over parts of the network. The future capacity challenge requires the
flexibility to invest in additional or longer trains when needed to provide more frequent services to and from
a more diverse range of destinations, and in infrastructure to cope with greater passenger numbers.
2.1.3 Any changes to the Metro network may generate potential issues of route capacity and increased pressure
at key points on the existing network; hence the need for robust forecasting techniques to paint as accurate
a picture as possible of how many people can be expected to use Metro in the future.
2.2 Historical and current drivers of demand
2.2.1 The main factors influencing past and present demand for Metro can be summarised as:
Population levels
GVA as a measure of economic activity
Levels of employment
Rates of car ownership
Road fuel costs
Level of Metro fares relative to bus fares and fuel prices
Size of the economic travel-to-work area
Impacts of congestion
Impacts of behavioural change

21
2.2.2 Population: Tyne and Wear’s population dropped steadily from 1981 to 2001 before stabilising during 2001-
2011. Recent census data shows that the population is now slowly increasing. The populations of
Northumberland and County Durham have been similarly stable over the period.
1981 1.156 million
1991 1.123 million
2001 1.087 million
2011 1.104 million
2014 1.118 million (est.) Table 3- Tyne and Wear population 1981 - 2014
2.2.3 An indication of GVA trends over time is provided by work undertaken by Durham Business School into long-
term population and economic trends10. A trend of regional GVA over the period 1981-2011 is as follows11:
GVA Index (2010 = 100)
1981 61
1986 63
1991 74
1996 79
2001 86
2006 100
2011 101 Table 4 – North East Gross Value Added 1981-2011
Despite the disparity in levels of economic activity between the North East and the UK as a whole over this
period, GVA has consistently increased over this 30-year period. One of the main historical correlations with
heightened levels of GVA is higher rates of car ownership.
2.2.4 Historical unemployment rates have fluctuated between 4% and 12% over the period of Metro operation,
with the median closer to the upper end of this range. The periods of highest unemployment were 1982-87;
1991-94, and 2008-12. Although there is some inverse correlation between rates of unemployment and
propensity to travel, this is complicated by historic trends towards higher rates of car ownership during
periods of lower unemployment.
2.2.5 The historical relationship between road fuel costs and Metro patronage is also partial. Lower petrol and
diesel costs are normally accompanied by lower electricity costs due to commodity market linkages, so that
driving costs fall at the same time as lower energy costs for Metro. There is some evidence that large
increases in road fuel costs may create additional patronage on public transport, although the nominal 30%
reduction in retail petrol and diesel prices between 2012 and 2016 does not appear to have had the reverse
impact. Recently it is possible that the marginal cost of car use may vary from that historically observed, with
the more widespread introduction of hybrid and electrically-powered vehicles, and a higher proportion of
motoring costs being accounted for by servicing, insurance and parking.
2.2.6 The size of the economic travel to work area has increased over time as employees show a willingness to
commute further to work, or need to because of the closure of local industries. This strengthens the case for
Metro and local rail service extensions and enhancements corridors which extend the reach of the networks
beyond traditional boundaries. The trend is quantified by a historic 28% increase in commuting into Tyne
10
Long Term Employment and Demographic Projections - Report prepared for the Joint Planning Teams of Newcastle City Council and
Gateshead Council Prepared by the Policy Research Group (PRG) Durham Business School/St Chad’s College 11
These figures refer to the wider North East rather than specifically to the NECA area.

22
and Wear between the 1991 and 2001 censuses – from 64,500 to 82,60012. There remain some issues of
labour mobility caused by some people being unwilling to consider job opportunities in unfamiliar locations,
a concern which the simplicity of Metro and local rail as a travel concept can help to address.
2.2.7 Data from the 2011 census gives an indication of the market for Metro and local rail services into two key
regional centres, Newcastle and Sunderland. The tables give details of commuting trips from other districts
within the NECA area13 by main mode of transport. The data describes journey-to-work flows into local
authority areas: not necessarily into city centres.
Originating Area All Trips Metro Rail Bus % by Public Transport
% of Public Transport trips by Metro and Rail
County Durham 8682 93 726 862 19.3 48.7
Gateshead 19941 2215 164 4487 34.4 34.6
North Tyneside 24932 5016 321 3309 34.7 61.7
Northumberland 19289 340 739 2173 16.8 33.1
South Tyneside 6484 2703 143 278 48.1 91.1
Sunderland 6161 1277 111 713 34.1 34.1
TOTALS 85489 11644 2204 11822 31.2 53.9 Table 5- Workplace Commuting Trips into Newcastle upon Tyne, 2011 Census
Originating Area All Trips Metro Rail Bus % by Public Transport
% of Public Transport trips by Metro and Rail
County Durham 15709 14 38 1000 6.6 4.9
Gateshead 5883 249 37 562 14.4 33.7
Newcastle 3220 360 36 244 19.9 61.8
North Tyneside 2207 163 20 75 11.7 70.9
Northumberland 1677 24 19 29 4.3 59.7
South Tyneside 8749 434 50 1039 17.4 31.7
TOTALS 37445 1244 200 2949 11.7 32.8 Table 6 - Workplace Commuting Trips into Sunderland, 2011 Census
2.2.8 The data provides some interesting insight into the strengths and weaknesses of the existing Metro and local
rail offer, for instance the strong market performance of Metro on key corridors into Newcastle – notably
from South Tyneside, where census data suggests that 41.6% of all workplace commuting trips are made
using Metro as main mode, and the weaker performance for trips into Sunderland, where rail-based trips lag
behind bus and car journeys. This highlights the potential that exists for Metro and local rail to make a
greater contribution towards sustainable mobility across the urban area of the combined authority.
2.2.9 Congestion on the highway network is increasing, if not yet as serious or widespread as elsewhere. The
worst delays often occur at those locations where there are the greatest level of job opportunities, such as
the NewcastleGateshead Accelerated Development Zone and the Cobalt and Doxford business parks, Team
Valley and Metrocentre. These are amongst the locations where network extensions could alleviate
congestion and provide sustainable access for all. In central Newcastle, total traffic volumes have not
changed significantly over a 30-year period, but this masks a 14% increase in car traffic and a 26% fall in bus
movements. By contrast, traffic on the A19 close to the Nissan car plant has increased by 30% in the last 15
12
Workplace and Commuting in the North East. Prof. Alan Townsend. International Centre for Regional Regeneration & Development Studies
2009. 13
Source: NOMIS Official Labour Market Statistics

23
years, and on the A1 by 13%. Changes of this magnitude have resulted in greater congestion on the main
Tyne and Wear river crossings, and on the approach to main town and city centres.
2.2.10 Sections of the heavy rail network, such as the ECML are also experiencing congestion due to insufficient
capacity; these pressures will increase as demand for inter-city rail travel continues to rise and longer-term
with the compelling requirements of HS2 and HS3. The proposals outlined in this strategy offer the
opportunity to address both issues: more rail capacity through examination of the use of disused alignments
adjacent to major transport corridors, such as the Leamside line and parallel Metro operations in the Team
Valley area, whilst the use of redundant ‘curves and spurs’ by Metro in locations such as the Cobalt and
Doxford business parks would address local accessibility issues in areas not hitherto well served by public
transport.
2.2.11 Other potential influences of future demand include:
Low/zero carbon futures – despite current oil price volatility, the long-term trend suggests towards
higher prices linked to reduced supply. Just as significant is the related reduction in demand for oil-
based fuels, as alternative, more sustainable energy supplies become more prevalent.
Less reliance on cars, however powered, in urban areas – current high levels of congestion may be
an intermediate condition pending more general acceptance of the need to move around our cities
and towns in different ways. There is evidence that under-25s display different attitudes towards car
ownership to those held by previous generations; should this behavioural trend continue then
expectations of urban mobility will alter from existing norms.
An increase in urban and suburban living – a drift towards rural areas has reversed and may continue
to do so as more new housing is built on brownfield sites and in town and city centres.
Population growth is likely to continue to increase – since Metro opened in 1980 the UK population
has increased by 16%; in Tyne and Wear the increase has been around 3%, but could rise more
quickly in future given existing pressures on housing and services across London and the south east.
Changes in planning policy – national guidance states that “plans and decisions should ensure
developments that generate significant movement are located where the need to travel will be
minimised and the use of sustainable transport modes can be maximised”. All NECA planning
authorities aim to locate new developments within walking distance of major public transport
corridors where possible.
Changes in retailing with the rise of internet-based transaction activity.
The potential impact of disruptive technologies such as Uber and driverless vehicles.
2.3 Metro Demand Modelling
2.3.1 Modelling of demand for new and additional public transport facilities has been extensively refined over
time, with a standard suite of models and processes used to define levels of predicted demand which then
form the basis for the production of a full business case. Modelling techniques appropriate to Metro are a
fusion of general transport models and those specific to light rail networks. The principal modelling
techniques used to appraise the demand for public transport and the rationale behind the methods applied
in the production of a Metro demand study are described briefly below.
Census-based catchment area trip-rate estimation
2.3.2 A basic method of demand estimation is provided by applying average trip rates based upon the population
and number of jobs in 800 metre catchment areas surrounding new and existing stations. The Tyne and

24
Wear Metro Extensions Feasibility Study14applied a weighted average annual trip rate of 98 per year across
comparable UK light rail networks15 to apply to network extension corridors as follows:
Network Route length
(2005)
Population within
800m of a stop (census
uplifted by Tempro
database)
Annual
patronage
(million)
Trips per person
per year
Tyne and Wear
Metro
78 315,555 37 117
Croydon
Tramlink
38 205,712 22 107
Manchester
Metrolink
39 190,823 20 103
Midland Metro 23 121,250 5 41
Sheffield
Supertram
48 160,835 13 80
Nottingham
Express Transit
14 81,872 9 104
TOTAL - 1,076,047 105 98
Table 7 - Characteristics of UK Light Rail Networks
2.3.3 For the existing Metro network, a trip rate of 117 per year was produced by this method of demand
estimation. This method provides an historical proxy of average demand but does not take account of
location-specific factors, or of the impact of known future developments.
Passenger Demand Forecasting Handbook (PDFH)
2.3.4 PDFH is the product of decades of research on rail demand forecasting on the national rail network,
providing guidance on aspects such as the effects of service quality, fares and external factors on rail
demand. It is recognised within the industry as the key source of evidence in this area, but it is not wholly
compatible with light rail networks because of their differing characteristics. In the case of the Tyne and
Wear network, its ‘heavy rail’ ancestry and the longer distances between stations render PDFH potentially
more relevant than to other light rail networks. ‘Heavy rail’ trips between Sunderland and Newcastle Central
are estimated via PDFH, for example. In the background work for Metro demand which inform this strategy
the PDFH has not been used, although some of the assumptions which underpin it have been included
within the parameters of the Metro demand forecasting model. Any improvements to the North East Rail
network as identified by this strategy would legitimately be assessed according to PDFH criteria.
Tyne and Wear Transport Planning Model (TPM3)
2.3.5 Transport planning across the Tyne and Wear area has been based for some time on a modelling system
comprising a demand model, a highway assignment model and a public transport assignment model forming
14
Tyne & Wear Metro Extensions Feasibility Study. Arup 2011. 15
DfT statistics for Light Rail Patronage 2004/05
25
a unified multi-modal modelling system. The public transport model uses CUBE/TRIPS software and the same
zoning system as the other models listed above. A model such as TPM would have a role in providing
evidence on the social and environmental benefits of new stations and extensions i.e. changes to the
existing Metro network. In a critique16 of TPM3 on the basis of its use as supporting information for a future
business case, it was noted that it can be used alongside the direct demand model, as the outputs of the
latter are unlikely to be comprehensive enough to provide the sole source of modelling assumptions.
2.3.6 It is for these reasons that the direct demand model is proposed to inform future business cases for
additional Metro stations and potential network extensions. TPM3 could be used to provide contributing
data in its capacity as a multi-modal validation tool.
2.3.7 Fundamental changes to the role and function of the local highway network, such as route closures and
road-user charging, cannot be predicted at this time and will reflect future political, economic and
environmental trends. They are considered as unlikely to take place over the short to medium-term.
Changes of this scale would require recalibration of TPM3 to assess the resulting impact upon future
demand for public transport. For the purposes of the strategy, no major changes to the local and strategic
highway network going forward are assumed, however the aggregate impact across a wider area of
individual network changes and road-space reallocation measures should not be under-estimated.
Additional Park and Ride provision is under consideration at several locations; should this be implemented
for instance then existing parking and traffic patterns could alter, with a likely outcome being a reduction in
the amount of commuter car trips into urban centres.
2.3.8 There are currently no plans within the NECA area to introduce a hypothecated revenue flow linking parking
receipts with enhanced public transport provision. An example of this elsewhere is the Nottingham
Workplace Parking Levy, introduced under the enabling legislation of the Transport Act 2000. Here the
2016/17 levy is £379 per parking space and it is estimated that it will generate in an average of £14 million
per year in nominal terms over a 23-year period (approx. £322 million).
Road user charging and other demand-management measures
2.3.9 UK transport authorities continue to gauge public attitudes towards the concept of road user charging. In
central London, the daytime congestion charge is now an accepted element of public policy and both its
scope and reach have extended over time, however in Manchester and Edinburgh local referenda led to
public rejection of the proposals, despite the prospect of an accompanying funding package for transport
improvements. Whilst the potentially major implications of area-wide road-user charging for Metro and local
rail investment are noted, for the purposes of this strategy it is assumed that it will not be introduced in the
NECA area for the foreseeable future.
2.3.10 Short of the introduction of a workplace levy or congestion charge, there is evidence that other measures in
relation to parking and road-space reallocation may alter commuters’ behaviour, in particular meaningful
reductions in the amount of all-day parking. These could be introduced within the context of a
complementary package of policy instruments.
Energy policy and transport costs
2.3.11 Future energy policy and supply changes in relation to Metro demand are anticipated to be at worst neutral
and on balance favourable as resources become more constrained, and Metro is able to benefit from
security of supply of electricity generated from a range of energy sources. European Union targets for road
vehicle emissions of Nitrogen Dioxide and PM10 concentrations are likely to become increasingly stringent,
16
Tyne and Wear Transport Planning Model – The Denvil Coombe Practice 2012

26
with particular implications for the use of diesel-powered road vehicles within designated Air Quality
Management Areas; this will help to boost the competitive position of Metro in these areas, where future
economic activity is also expected to be concentrated.
2.4 Impact of Land-use Planning upon Future Demand
2.4.1 Future decisions about land use are critical to the future of Metro and local rail, both in terms of the success
of the existing networks and the potential and need for service and network enhancements. The NECA area,
along with many others, has spent decades dealing with the consequences of new developments located in
places that are hard to reach by public transport – this has resulted in unnecessary increased road
congestion, and the under-performance of a fixed-track network that may no longer be located as close to as
many trip generators as when it was originally planned. Thankfully there is now more awareness of the
importance of aligning major developments with the required sustainable transport infrastructure, at both
the national and regional level.
2.42 Alongside the decentralisation of centrally-imposed planning targets through the publication of the National
Planning Policy Framework, land-use planning and the economic development agenda is now more closely
linked at a regional and sub-regional level through the Local Enterprise Partnership framework. The North
Eastern LEP area is coterminous with that of the NECA, so the future development of Metro and local rail
networks needs to be planned and delivered in line with both the LEP’s growth agenda and travel-to-work
areas, and the strategic direction of the Combined Authority. In this regard the conclusions of the North East
Independent Economic Review and the implementation of the Strategic Economic Plan are relevant to the
development of robust business cases for Metro and local enhancements, aligned closely to the region’s
economic and planning priorities.
2.4.3 Land-use policy and the future development of the Metro and local rail network must therefore be mutually
connected at all stages of development. The permanence and visibility of rail-based transport should be a
powerful influence favouring the sustainable development of locations within easy walking distance of
stations. Where major new development is proposed, wherever possible it should be located within reach of
existing corridors; where this cannot be achieved then consideration needs to be given as to whether Metro
or local rail is the best sustainable accessibility solution and, if so, how it can be accommodated and funded
as part of the development process. This process has recently been undertaken during initial planning for the
construction of the International Advanced Manufacturing Park (IAMP) on the boundaries of Sunderland and
South Tyneside. The expansion of the further and higher education sector across the NECA area at locations
well-served by public transport, in Newcastle and Sunderland in particular, has increased the level of travel
demand by students considerably, with currently about 90,000 students and staff in central Newcastle and
15,000 in Sunderland17 visiting daily in term-times, a substantial proportion of whom regularly use Metro
and local rail.
High-level analysis of major land-use proposals adjacent to existing Metro network corridors
2.4.4 This section considers existing Metro corridors. Potential network extensions are considered in Section 7.
These proposals were taken account of in the preparation of the Metro demand forecasting study.
Airport – Regent Centre
17
Telegraph University Guide, 2011

27
Airport - Increases in passenger and freight flows leading to further development at Newcastle
International Airport (passenger numbers estimated to increase to 8.5 million passengers per year
by 2030)18
Callerton Parkway / Bank Foot – Proposed residential development of up to 3200 dwellings in three
areas south and west of the Metro corridor by 203019
Kingston Park / Bank Foot- proposed neighbourhood growth area of up to 850 additional dwellings
Regent Centre - potential redevelopment of the existing under-utilised office complex
South Gosforth – Coast
Four Lane Ends - Quorum Business Park - build-out to completion of the business park
Northumberland Park – further development of Cobalt Business Park and land north of station for
residential purposes
Substantial residential development between Shiremoor and West Monkseaton and north and
south of Holystone, with new Metro stations at ‘Killingworth Moor’ and ‘Murton’ posited in the draft
North Tyneside local plan
Coast – Wallsend
North Shields – Smith’s Dock area residential and retail development
Hadrian Road / Wallsend – Tyne North Bank Enterprise Zone industrial development
Wallsend – St James
Ouseburn Valley commercial and residential development
Science City development
Manors - further student and associated developments surrounding/above the station and at King’s
Manor
Central Station
Development south of the station and substantial hotel and student accommodation provision
across the city centre
Gateshead – Heworth
Town Centre/East Gateshead/Baltic redevelopment completion
400 new houses in the Felling area
Hebburn –Jarrow
Industrial and residential development on brownfield sites
18
Source Newcastle International Airport Limited Masterplan 2013. 19
Source: NewcastleGateshead One Core Strategy 2015.
28
Jarrow - South Shields
South Shields town centre 365 regeneration
Pelaw – Sunderland
Mixed-use development at Monkton
Sunderland – South Hylton
City centre redevelopment
Pallion - Claxheugh substantial residential development
2.4.5 Known major land-use planning proposals which are in prospect in south east Northumberland and north
and east Durham have also been examined in the context of the additional demand that could be
forthcoming for Metro and local rail services. In Durham the County Durham Plan suggests the following area
of development that is potentially relevant:
Seaham – 950 dwellings by 2030
2.4.6 Northumberland is proposing the following, either related to the Ashington Blyth & Tyne corridor, the
Airport branch or the existing route at Northumberland Park/Four Lane Ends Park and Ride:
South East Northumberland New Growth Point – incorporating the Blyth and Wansbeck districts
and the Blyth Estuary Enterprise Zone.
Large-scale residential development proposed in the Ponteland area
Analysis
2.4.7 Forecasting land-use patterns helps to define future movement patterns across the region. The emphasis in
planning terms needs to be on ensuring the active support of stakeholders at all levels that will help ensure
that sustainable development is concentrated along corridors easily accessible by Metro, and that any
network extensions are planned and promoted in the knowledge that Metro will facilitate access
requirements arising from future land-use planning decisions. One of the trends since the opening of Metro
has been an increase in the amount of development in locations which Metro cannot serve. The future
priority in terms of large-scale development should be to maximise the use of brownfield and greenfield
sites close to the existing network, then along corridors where there is consensus that the nature and scale
of development is proportionate to a network extension, or where Metro would be key to opening-up
sustainable transport opportunities. To strengthen the future prospects of the Metro and local rail network
it is proposed that accessibility targets be established for major new development - i.e. easy and convenient
access on foot to stations - thus ranking the accessibility of locations according to their ease of access to a
frequent rail service.
2.4.8 In conclusion, there is likely to be substantial development across the NECA region in decades to come; this
is reflected in the background data underpinning the Metro demand forecast. Wherever possible such
development should be concentrated in areas that are currently served by Metro or local rail, or are capable
of being served at a later date. This will be achieved through effective liaison between transport and
planning disciplines regarding the individual and collective impact of land-use planning decisions.

29
2.5. Metro Demand Study
2.5.1 To provide an independent forecast of future demand for Metro, Nexus commissioned a demand forecasting
study in 2012 to provide a range of forecasting scenarios for the existing network and identified potential
network extensions. The introduction of new route corridors has an impact upon flows along existing
network corridors, mainly in terms of higher frequencies and increased journey opportunities.
2.5.2 The forecasting approach adopted in the preparation of the Metro demand study model was that of a direct
demand, elasticity-based model which employs observed (historical) relationships between demand and
explanatory variables from historic data on the existing network, combined with additional evidence as
required from comparable UK networks to estimate future-year demand. In basic terms, the demand
between any Metro station pair for a given ticket type is a function of the following variables:
• Fares
• In-vehicle time for Metro
• Headway for Metro
• Endogenous variables, such as Metro punctuality, reliability, number of interchanges
• Exogenous variables related to population characteristics and land-use such as employment, retail
sales, regional GVA
• Explanatory variables related to competing modes such as bus fares, car parking charges and supply,
car times
• Regular or one-off or regular events which have a predictable effect on Metro demand such as
sporting events and engineering works
2.5.3 Station catchments were produced using the lowest level of spatial detail, Census Lower Super Output areas,
with overlaps dealt with in individual circumstances. Each market segment was subjected to econometric
modelling to identify statistically significant drivers of Metro demand with plausible behavioural properties.
This process safeguards against importing behavioural evidence from elsewhere, and highlights the
importance of specific local factors upon demand for Metro, such as student travel and concessionary travel.
2.5.4 Three separate scenarios were modelled as follows:
High Growth – envisaging faster economic growth in certain industrial sectors
Core forecast – assuming a policy neutral environment and a return to economic growth
Low Growth – where employment and population stagnate at 2011 (base year) levels
2.5.5 The forecast change in passenger numbers on the existing network is shown below, excluding the impact of
any subsequent network extensions. At the time of writing, the core forecast is almost exactly as predicted
in terms of recorded passenger numbers.

30
Chart 1- Projected Metro Demand to 2030 - Current Network
2.5.6 In terms of the existing network, the demand study ascribed routes as follows:
Corridor 1 North Tyne loop
Corridor 2 South Shields
Corridor 3 South Hylton
Corridor 4 Airport
2.5.7 Predicted rates of growth varied according to the predicted changes to population and land-use that relate
to each corridor. The highest rate of growth was attributed to the South Shields corridor because of known
development proposals located along it, with the highest growth in percentage terms – across all growth
scenarios – anticipated for the Airport corridor, where continued growth in passenger numbers and
associated employment has been forecast by the airport operator. The Pelaw to South Hylton corridor
displays the lowest rate of passenger growth across all scenarios.
2.5.8 Translated into revenues, the demand picture alters, largely due to the assumption made that concessionary
travel will comprise one of the strongest growth components. Whilst welcome in terms of social inclusion, an
unbalanced growth in the number of reduced-fare passengers could impact upon network profitability in the
long-term.
2.6. Demand for Potential New Station Sites on Existing Network
2.6.1 Alongside the network extension possibilities described in Section 7 there is some potential for additional
stations on the existing Metro network. Stations such as Palmersville, Pelaw and Northumberland Park were
inserted into the original network, although none have opened since Simonside in 2008, or are currently in
planning.
31
2.6.2 New stations may be desirable for a number of reasons. The most common is that they respond to demand
from adjacent housing or retail development that has taken place since the network opened. In other
locations there may be strategic interchange opportunities that justify the provision of a station on a green-
field site, whilst at others it may have been seen as too difficult or too expensive to introduce a new station
at the time the network was originally planned.
2.6.3 The aggregate impact of additional stations has to be considered in terms of line capacity, signalling,
additional operational costs, potential abstraction from adjacent stations and journey times for non-station
users. The positive side of the case for additional stations in defined locations is in terms of the potential for
developer contributions towards construction costs and net additional revenue, and associated economic,
environmental and social benefits.
2.6.4 The sites identified in district plans are described below in alphabetical order. There are no firm plans to
develop these further at present although they are kept under review particularly where there are potential
event triggers such as adjacent developments or improvements to railway capacity.
High Lane Row
2.6.5 This site was referenced in the Tyne and Wear Local Transport Plan as a ‘highway congestion intervention’
and in Policy SA2 of the South Tyneside Local Development Framework as a location where the site will be
safeguarded for the purposes of Metro station construction. The location lies midway between Hebburn and
Jarrow stations, and could be potentially abstractive from both given the distances between them. The
proposal has the support of South Tyneside Council and would improve sustainable access to this area of
Hebburn. Dual-tracking of the South Shields route would provide a potential trigger for consideration of a
station at this location; at present the single line formation with passing loops does not allow for any
additional station calls. Dualling of the South Shields route is a strategy recommendation, and the
circumstances surrounding this location will be reviewed as a business case for track dualling is developed.
Monkton Fell
2.6.6 A site between Pelaw and Fellgate at Monkton Fell on the Network Rail-owned Pelaw - Sunderland line is
identified within South Tyneside Council’s LDF, primarily as a means of improving public transport access to
the adjacent Monkton Business Park. Were this to be progressed further it would require an analysis of line
capacity as well as forecast levels of demand, because the route is currently operating close to its maximum
capacity. Approval in principle from Network Rail would therefore be required before the proposal could
proceed further.
Pallion area
2.6.7 The current Sunderland Unitary Development Plan – to be superseded by the LDF Core Strategy during 2016
- identifies two locations to the east and west of the existing Pallion station that the UDP considers may be
appropriate to serving the accessibility needs of potential new development. It is understood that these will
not be specifically identified within the adopted LDF.
Murton Gap and Killingworth Moor, North Tyneside
2.6.8 The North Tyneside Local Plan is proceeding towards legal adoption, and major housing developments are
planned in green-field locations between West Monkseaton and Shiremoor, and between the A19 and
Palmersville. The council is keen to maximise the use of sustainable access modes and two additional Metro
stations funded through developer contributions have been suggested as a way to achieve this, if feasible in
operational terms. The proposed site serving the Killingworth Moor development lies on a stretch of line
32
where Metro and the Ashington, Blyth & Tyne lines run parallel, presenting both potential opportunities and
implementation issues in terms of the location of a station here.
Additional stations on the local rail network
2.6.9 The potential also exists to open new stations located on the Northern rail network. Proposals exist for
stations at Belford on the ECML north of Chathill, and at Gilsland west of Haltwhistle, and other locations
where interest also exists include Killingworth and adjacent to the Baltic Business Park in Gateshead.
2.7 Demand for Local Rail Services
2.7.1 The previous Northern rail strategy was predicated upon a ‘zero growth’ basis by the DfT which subsequent
patronage increases demonstrated to be an inaccurate assumption, with growth of 33% on Northern Rail
and 71% on Transpennine between 2004/05 and 2012/13. Franchised Intercity services have shown a similar
rate of increase, as have Grand Central open access services to and from Sunderland. Firm estimates of
future demand are not available over comparable periods with those for Metro; however the industry is
continuing to plan for future increases in demand through the procurement of additional rolling stock and
infrastructure improvements, from station enhancements to planning for the High Speed Rail network. Data
supplied by the Office of Rail and Road shows that the number of local rail journeys within the North East
decreased between 2013/14 and 2014/15 to 5.7 million but that this was mainly a result of methodological
changes. In 1995/96, the corresponding figure was 3.2 million journeys. Tyne & Wear is the origin or
destination point for almost 40% of journeys as it covers the two largest cities, Newcastle and Sunderland20.
2.7.2 The chart below illustrates the numbers of people using selected stations across the NECA area. It shows an
average increase of around 25%, with Morpeth station experiencing a 77% increase. Some stations in the
NECA area, such as Dunston, have witnessed even higher increases however these can be attributed to
service improvements from a very low baseline figure. Some of the largest patronage increases have been
recorded at locations such as Morpeth and Sunderland, where better long-distance services have been
introduced over this period. At Chester-le-Street, rail journey times are the fastest of any travel mode
especially during peak hours and this factor is likely to have encouraged demand for commuter trips.
Elsewhere, the lower than average increase in trips relative to other area of the Northern network recorded
over the period may be reflective of suppressed demand resulting from low frequencies and sub-optimal
rolling stock.
20
Regional Rail Services Passenger Usage. ORR 2016.
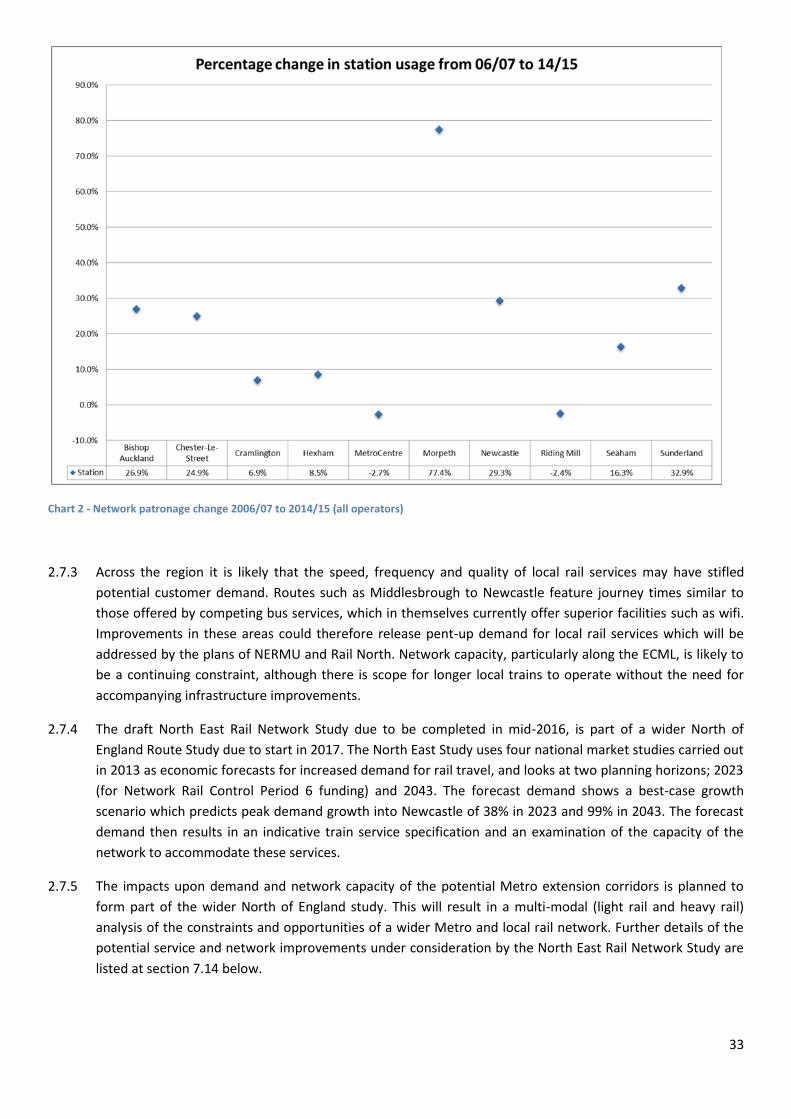
33
Chart 2 - Network patronage change 2006/07 to 2014/15 (all operators)
2.7.3 Across the region it is likely that the speed, frequency and quality of local rail services may have stifled
potential customer demand. Routes such as Middlesbrough to Newcastle feature journey times similar to
those offered by competing bus services, which in themselves currently offer superior facilities such as wifi.
Improvements in these areas could therefore release pent-up demand for local rail services which will be
addressed by the plans of NERMU and Rail North. Network capacity, particularly along the ECML, is likely to
be a continuing constraint, although there is scope for longer local trains to operate without the need for
accompanying infrastructure improvements.
2.7.4 The draft North East Rail Network Study due to be completed in mid-2016, is part of a wider North of
England Route Study due to start in 2017. The North East Study uses four national market studies carried out
in 2013 as economic forecasts for increased demand for rail travel, and looks at two planning horizons; 2023
(for Network Rail Control Period 6 funding) and 2043. The forecast demand shows a best-case growth
scenario which predicts peak demand growth into Newcastle of 38% in 2023 and 99% in 2043. The forecast
demand then results in an indicative train service specification and an examination of the capacity of the
network to accommodate these services.
2.7.5 The impacts upon demand and network capacity of the potential Metro extension corridors is planned to
form part of the wider North of England study. This will result in a multi-modal (light rail and heavy rail)
analysis of the constraints and opportunities of a wider Metro and local rail network. Further details of the
potential service and network improvements under consideration by the North East Rail Network Study are
listed at section 7.14 below.
34
2.8 Conclusions and Recommendations
2.8.1 The conclusions of the Metro demand study suggest that future demand is likely to increase, but that the
scale of that increase could vary considerably and could occur randomly or be linked to identifiable trends.
Trends in land-use policy will be important in encouraging growth in demand for the existing network. Rail’s
greatest strength and greatest weakness are certainty, and immobility. It is normally much easier to locate
development alongside an existing rail corridor than to build new lines to access remote sites. Close liaison
with local planning authorities will be important to ensure that the Metro and local rail network can play a
full part in meeting the region’s sustainable transport needs.
2.8.2 The Metro Demand Study is currently being updated and linked into a wider model which will also assess the
likely future demand for local rail services, providing a picture of aggregate demand for the wider network.
The results of this exercise will be used to assess future requirements in terms of rolling stock and station
requirements, and network enhancements.
2.8.3 The following recommendations therefore relate to demand for the existing Metro and local rail network:
Monitor existing and predicted future demand for Metro and local rail closely.
Monitor regional and national economic and planning trends.
Maximise demand through the delivery of reliable services that meet customer requirements.
Liaise closely with the Local Economic Partnership and the local planning authorities across the
Combined Authority area to ensure the optimum locations of development proposed within the
Strategic Economic Plan and district local plans.
Liaise with district planning authorities to ensure that the principles and detailed design of
developments are planned so as to maximise accessibility, with accessibility targets to Metro and
local rail services applying to large developments.
Work with local authorities on the introduction of new stations on the existing network where these are
justified by demand, sought by local communities, and are operationally feasible.

35
Section 3: METRO FLEET RENEWAL
3.1 Context
3.1.1 A key outcome of this strategy will be the replacement of the life-expired existing Metro fleet with new
trains which can deliver improved customer benefits, increased operational flexibility and operating cost
savings, therefore ensuring the long-term future of the network. Analysis of the costs of further
refurbishment of the existing fleet versus fleet replacement21 suggests that a new fleet will be cost-effective
over its design life, as well as being the only way of ensuring that Metro continues to meet user
requirements, and takes advantage of new technology across every aspect of the journey experience. The
study showed that the present fleet will offer continually diminishing returns over time, and alongside this
trend the study cites the possibility of the unforeseen failure of key components across the fleet, once a
critical age has been reached.
3.1.2 This section summarises work completed and in progress to identify the optimal new rolling stock
specification, taking account of customer requirements, network constraints and possibilities, and new
technologies. The rolling stock specification will focus on providing a new fleet of Metro cars which will
provide a step change in customer experience and be future proofed to provide reliable and affordable
Metro services for the next 30 years. In order to achieve policy objectives Metro must achieve high levels of
reliability and comfort in order to build passenger satisfaction with the system. However given the Metro
system’s reliance on public subsidy and, because of the important role Metro plays in underpinning the local
economy and the need to maintain fares at affordable levels, on-going operating costs also need to be kept
to a minimum to deliver value for money.
3.1.3 The current Metro fleet was constructed in the mid-to-late- 1970s and has served its purpose well. During its
35-year lifespan to date the fleet has undergone two significant refurbishments, to renew technical
equipment and improve the passenger experience. The second (‘¾ Life refurbishment’), completed in 2015,
has provided a further short-term lease of life, however current levels of reliability make it clear that the
fleet is now approaching the end of its useful life and no longer meets the expectations of its users. The
current fleet can also only be used on those routes where 1500V dc overhead lines are present, as it does
not have dual-voltage capability. Whilst the maximum design life of the fleet is 2025 without substantial
further investment, it is clear that the earlier the fleet can be replaced, the sooner the network can meet
those expectations. Nexus is therefore aiming to replace the fleet in advance of this date, so that the wider
strategy can be implemented as soon as possible, and in conjunction with the fundamental changes planned
for the regional and local rail network in the 2020s.
Figure 7 - Existing Metrocar side view
21
NEXUS Rolling Stock Consultancy NEX 14/30 Option 1- Fleet Life Extension

36
Figure 8 - Existing Metrocar overhead view
Table 8 – Existing Metrocar Technical Specification
3.1.4 The existing Metro has inherent characteristics that could prevent an ‘off the shelf’ solution during
procurement. Unique attributes of the Metro network which need additional consideration are the 1500V dc
overhead line voltage and the 3.15m car body height. The latter presents a particular difficulty as no other
light rail vehicle networks are currently utilising high floor vehicles of a similar structural gauge. Typically,
other light rail networks have car-body heights of around 3.60m – 3.70m, 500mm more than the Metro
fleet, highlighting the unique requirements of the Metro network, when compared to standard and readily
available stock.
3.1.5 The cost of a new train fleet capable of replicating the current timetable is estimated to be in the region of
£300 million. An associated upgrade to the signalling system may cost an additional £100 million, updated
depot facilities could cost in the order of £50 million, and upgrades to the electrification equipment could
add further £100 million: the total cost of a new like-for-like fleet could therefore be around £550 million.
Although more detailed consideration of the opportunity for further fleet life extension measures had to be
considered as part of a fleet renewal business case process (in order to demonstrate that a new fleet offers
best long-term value for money across a range of metrics), the remainder of this section works on the basis
that a new Metro fleet will be specified and procured to meet the aspirations and expectations of future
customers.
Parameter Value
Length 28.4m
Width 2.65m
Height (excl. pantograph) 3.15m
Track Gauge 1432mm
Max Speed 80Km/h
Power Supply 1500V DC OLE
Vehicle Configuration High Floor 2 Car Vehicle
Standing Capacity (6p/m2) 230
Seating Capacity 68
Tare Weight 40 Tonnes

37
3.1.6 A series of issues and ideas related to a new fleet is described below. These will be subject to further
detailed technical assessment and design as the business case and technical specification works continue.
Overall vehicle construction
3.1.7 New vehicles will probably be constructed of lightweight, potentially composite, material in line with current
best practice, so as to reduce traction energy demand. Nevertheless, they will need to meet the crash-
worthiness requirements of joint ‘tram-train’ type operation on Network Rail lines.
3.1.8 New vehicles will be of standard track gauge (1435mm), up to the maximum permissible width (2665mm),
and capable of fitting within the Nexus network kinematic envelope in order to be used across the system,
including underground. This latter criterion is a significant constraint to the use of ‘off the shelf’ rolling stock
types as described above. The dimensions would also need to conform to Network Rail group standards, in
order to be certified for use on that network.
3.1.9 Vehicle length is affected by a number of factors:
Passenger demand, both now and in the future: should changing demand be satisfied by more trains, or
longer/shorter trains?
Market research indicating passenger demand for more frequent services and better actual/perceived
personal security.
Technical issues such as articulation, number of bogies and amount of maintenance required as trains get
longer or shorter, as well as whether the signalling and control systems could accommodate additional trains
if required.
Platform lengths; current minimum platform length on Nexus stations is 65m.
3.1.10 The length of light rail vehicles currently in operation varies widely between networks; some examples are
discussed further in Appendices 1 and 3. In summary, trains similar to those currently operated offer the
flexibility to be used singly or in pairs to meet passenger demands at various times of day, or on lightly-
trafficked branches. Longer single-unit trains offer visibility throughout the train and reduced costs related
to drivers’ cabs, but are less operationally flexible in meeting varying levels of demand, and in terms of
maintenance and performance regimes. As the fleet replacement business case is finalised, a preferred
option or options will be identified which meets strategic requirements and customer needs.
Internal layout
3.1.11 Current Nexus Metro vehicles are 28 metres long, and can carry around 230 passengers at ‘crowded’ levels
of 6 persons/m2.
3.1.12 It is recognised that there is always a trade-off between amounts of seating and standing, and that naturally
most passengers would prefer to have a seat. However, as the median time for Metro journeys is slightly less
than 10 minutes, and given the forecasts for increased patronage in future, a case could be made for a lower
ratio of seating to overall capacity. Alternatively, seating could be made more space-efficient, such as being
100% longitudinal, or with a proportion being ‘fold down’ seats, to assist with peak hour loadings.
3.1.13 The current fleet has 64 seats per carriage in their 28m length, or 2.3 seats per linear metre. This figure is
somewhat higher than UK comparators, again supporting the potential for a reduced seating level in a new
fleet, should this prove feasible (sometimes technical issues such as under-floor equipment can preclude
this). However, Metro customers’ requirements must be taken into account, before deciding the seating to
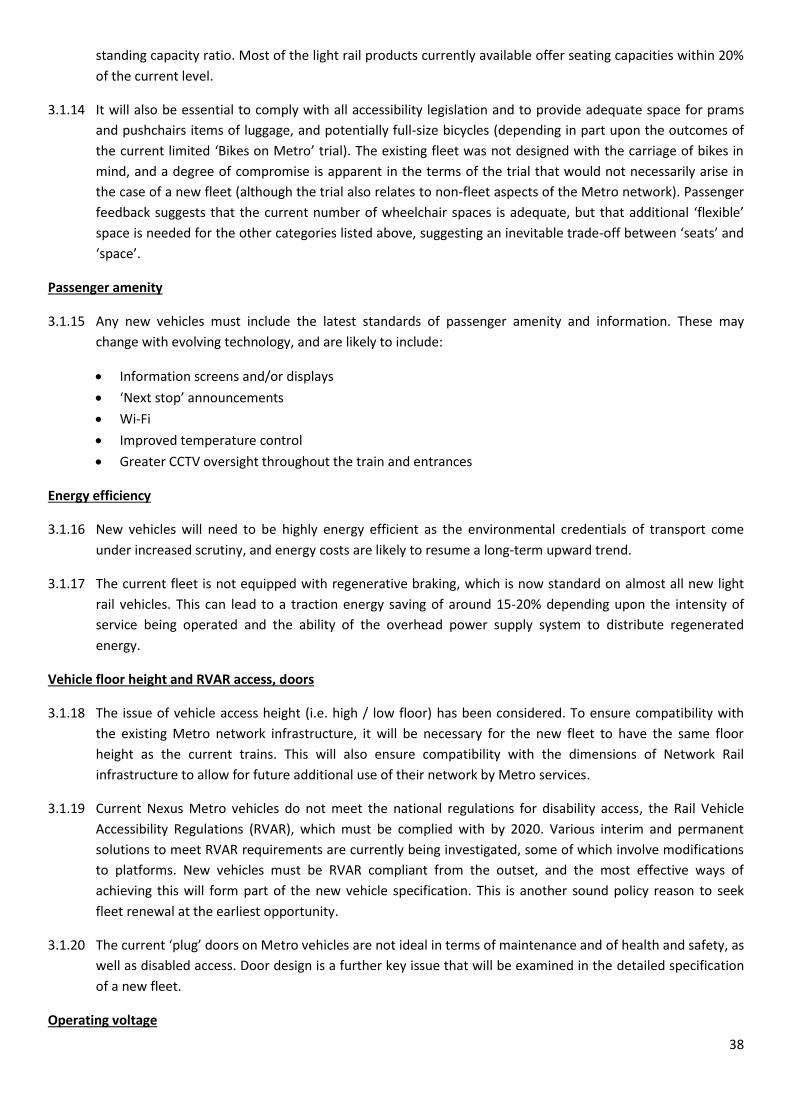
38
standing capacity ratio. Most of the light rail products currently available offer seating capacities within 20%
of the current level.
3.1.14 It will also be essential to comply with all accessibility legislation and to provide adequate space for prams
and pushchairs items of luggage, and potentially full-size bicycles (depending in part upon the outcomes of
the current limited ‘Bikes on Metro’ trial). The existing fleet was not designed with the carriage of bikes in
mind, and a degree of compromise is apparent in the terms of the trial that would not necessarily arise in
the case of a new fleet (although the trial also relates to non-fleet aspects of the Metro network). Passenger
feedback suggests that the current number of wheelchair spaces is adequate, but that additional ‘flexible’
space is needed for the other categories listed above, suggesting an inevitable trade-off between ‘seats’ and
‘space’.
Passenger amenity
3.1.15 Any new vehicles must include the latest standards of passenger amenity and information. These may
change with evolving technology, and are likely to include:
Information screens and/or displays
‘Next stop’ announcements
Wi-Fi
Improved temperature control
Greater CCTV oversight throughout the train and entrances
Energy efficiency
3.1.16 New vehicles will need to be highly energy efficient as the environmental credentials of transport come
under increased scrutiny, and energy costs are likely to resume a long-term upward trend.
3.1.17 The current fleet is not equipped with regenerative braking, which is now standard on almost all new light
rail vehicles. This can lead to a traction energy saving of around 15-20% depending upon the intensity of
service being operated and the ability of the overhead power supply system to distribute regenerated
energy.
Vehicle floor height and RVAR access, doors
3.1.18 The issue of vehicle access height (i.e. high / low floor) has been considered. To ensure compatibility with
the existing Metro network infrastructure, it will be necessary for the new fleet to have the same floor
height as the current trains. This will also ensure compatibility with the dimensions of Network Rail
infrastructure to allow for future additional use of their network by Metro services.
3.1.19 Current Nexus Metro vehicles do not meet the national regulations for disability access, the Rail Vehicle
Accessibility Regulations (RVAR), which must be complied with by 2020. Various interim and permanent
solutions to meet RVAR requirements are currently being investigated, some of which involve modifications
to platforms. New vehicles must be RVAR compliant from the outset, and the most effective ways of
achieving this will form part of the new vehicle specification. This is another sound policy reason to seek
fleet renewal at the earliest opportunity.
3.1.20 The current ‘plug’ doors on Metro vehicles are not ideal in terms of maintenance and of health and safety, as
well as disabled access. Door design is a further key issue that will be examined in the detailed specification
of a new fleet.
Operating voltage

39
3.1.21 It is proposed that the new fleet will have dual voltage capabilities, with the existing 1500V dc capability
augmented by 25kV ac, to enable operation across the national rail network, as all new electrification will be
to this national standard. An innovative hybrid ‘bi-mode’ solution may be required for Metro operation over
non-electrified routes, and the availability of such technology will form a part of the vehicle variant option
specification process.
Vehicle top speed
3.1.22 Current Metro vehicles have a top speed of 80km/h, though this speed is only attained on certain sections of
the network. The scheduled average speed over a full run is 36km/h, including station stops, on both Yellow
and Green lines.
3.1.23 In terms of flexibility of operation, there may be some benefit in specifying a higher top speed of up to 100
km/h in a new vehicle. While recognising that worldwide Metro vehicles are generally designed for modest-
speed, frequent-stop operation, a higher top speed could allow:
Shorter journey times encouraging more longer-distance trips.
The potential of operating more Metro trains on the Sunderland extension which has wider station spacing,
or better compatibility with other future Network Rail joint operations elsewhere in the NECA region.
Improved capability to recover in the event of network disruption.
3.1.24 The Sheffield ‘tram-train pilot’ vehicles, discussed in Appendix 1, are designed to operate on-street at
standard traffic speeds, but then have a maximum speed on Network Rail tracks of 110 km/h. However, a
higher top speed for a new Metro fleet would involve many technical considerations such as the impact
upon permanent way, bridge structures, changes to braking and signalling systems, and an anticipated trade-
off between maximum speed and rates of acceleration.
Economic assessment
3.1.25 All options for a new Metro vehicles design, overall fleet numbers etc., will need to be assessed in terms of
their ‘whole life’ economic cost/benefit ratio, and take into account the operational requirements and
characteristics of the Nexus Metro network. As the business case evolves, the optimum number of new
trains initially required will be based upon vehicle configuration, anticipated demand and the overall benefit-
to-cost ratio. The initial business case is predicated upon a ‘like-for-like’ replacement of the existing fleet and
current service patterns, with any network extensions considered separately at a later date on their own
merits. The ability to call-off further batches of new vehicles in the future to meet evolving requirements will
be an important part of the forthcoming vehicle procurement process.
3.2 Summary and Recommendations
3.2.1 A new Metro fleet is essential to meet the wider objectives of this strategy and to address the shortcomings
of the existing fleet which is now almost life-expired, with neither the reliability nor the flexibility required to
meet customers’ expectations and the wider objectives of this strategy. New trains will be equipped to travel
over new areas of the local rail network with the ability to operate at different voltages, and be designed
with customer requirements first and foremost to offer safety, accessibility and reliability.
3.2.2 The regional rail network of the future will be served by a variety of different train types, each of which
display fitness for purpose for the journeys they will be undertaking. Drawn together by a visible and

40
complementary brand, these trains will meet demand for urban rail across the conurbation, with the existing
Metro network at its core, reflecting the previous and continuing investment into its infrastructure.
3.2.3 Recommendations
Replacement of the life-expired existing Metro fleet with new trains which can deliver improved customer
benefits, increased operational flexibility and operating cost savings.
Development of a technical specification to achieve Metro fleet renewal.
Development of a robust business case to secure funding for a new Metro fleet.

41
Section 4: METRO TECHNICAL OPTIONS APPRAISAL
4.1 Introduction
4.1.1 This section summarises those areas, other than fleet renewal, that Nexus is assessing on behalf of the
combined authority as part of continuing work into defining the specification of a refurbished Metro system
with greater compatibility with the wider regional rail network. Elements covered in this section build on the
work taking place as part of the on-going Asset Renewal Programme (Metro Reinvigoration Phase 2).
Completion of this essential renewals process will see the delivery of a network that supports the operation
of robust and reliable services, and which can accommodate future customer requirements and increased
demand.
4.1.2 The main areas covered are:
Power supply and energy recovery
Depot – options for future stabling, servicing and overhaul facilities
Signalling and control – the safe and flexible operation of the network
Energy supply, efficiency and renewables – ensuring sustainable continuity of operation
4.1.3 Throughout this process Nexus will examine a range of options to deliver Metro safely and efficiently, with
the capacity to increase its future sphere of operation both in terms of increased demand, any potential
network extensions, and integration with regional rail operations. Decisions made will reflect safety,
customer needs, growing the regional economy, value for money, safety and the intelligent use of new
technology to add value and reduce operating costs.
Figure 9- Metro service at Airport station

42
4.2 Metro Power Supply and Energy Recovery
4.2.1 Metro vehicles are currently powered by 1500 volts DC from an overhead line power supply, the only
remaining example of this voltage in use in the UK. The other main power supplies in UK operation are:
(a) 25kV AC overhead, used on all electrified mainline routes, including the East Coast Main Line, and many local
rail routes.
(b) 750V DC ‘third rail’, used on the Southern network south of London for historical reasons, and on the
Merseyrail network; it is proposed to progressively upgrade these to 25kV AC in the coming years due to
operational and safety issues and is not an option for Metro to consider
(c) 750V DC overhead; used by almost all tram networks in the UK, e.g. Nottingham, Manchester, Edinburgh etc.
(Blackpool and Glasgow are the only exceptions at 600V DC).
Current situation at Metro
4.2.2 The nine traction substations and ten distribution substations are all working satisfactorily but are
approaching the end of their design life; crucially, they are not equipped to cope with energy regenerated
from train braking which in more recent light rail networks can be fed back into the network for other trains,
as described below.
4.2.3 Nexus has commenced the renewal of Metro’s existing overhead line equipment (OLE) on a ‘like for like’
basis, i.e. replacing worn catenaries and power cables with ones of identical design and cross-sectional area,
using funds allocated from the ARP Phase 2. It is recognised that there will be a need for a further OLE
upgrade in future, once sub-stations have been equipped with energy regeneration capabilities.
Energy Regeneration by Rolling Stock
4.2.4 Trains require electrical energy to accelerate away from stations, but some of this energy can be recovered
(or ‘regenerated’) from the braking system when they brake approaching the next station. With the current
fleet, this energy is dissipated as heat, some of which is used to provide interior heating, but most of which is
wasted.
4.2.5 Modern light rail networks worldwide seek to recover electrical energy from braking, which can be quite
considerable, and can also helpfully smooth out ‘spikes’ in power demand on the OLE.
4.2.6 The energy is recovered by using motors and electrical/electronic systems designed to do so. The recovered
energy can be re-used to feed recovered energy directly into the overhead line, for use by other trains. It is
therefore proposed to bid for funding to install ‘reversible substations’, which will feed recovered energy
from the OLE not required by trains running within the same electrical section, back into the National Grid.
Initial estimates suggest that regenerative braking could reduce traction power consumption by 26%,
however additional air conditioning units, if fitted to new trains and in use, would raise the consumption by
6%, leading to a potential net reduction of 19%.
Voltage change
4.2.7 Consideration has been given to altering the Metro overhead cable voltage on the existing network from
1500V DC to a more typical value, either 750V DC or 25kV AC, at the time of fleet and substation renewal.
However, both options would require substantial capital costs over and above those already required, and a
significant period of total shutdown of the network. For example, conversion to 750V would require at least
twice the number of substations, full replacement of all overhead cables, and most or all masts. 25kV AC

43
operation on the existing Metro network is not possible due to the increased ‘air gaps’ required between the
cables and any surrounding structures, which could not be achieved on the Nexus-owned network,
particularly in the tunnels due to the system’s loading gauge.
4.2.8 There is no UK precedent for the use of 1500V DC OLE in the context of on-street light rail operations,
although informal discussions with the then Office of Rail Regulation suggested that it may not be explicitly
ruled out. However as there are currently no plans within the strategy for on-street operation, this option
has not been considered further at the present time as if this were to proceed, then a separate low-floor
fleet would be required.
Fleet operating voltage
4.2.9 Metro operation on the national 25kV network holds considerable strategic potential. Apart from the Metro
network, only the ECML is currently electrified in the NECA area but this is unlikely to remain the case as
national network electrification increases with time, and certainly by the Year 2060 design life of the new
Metro fleet. Electrification of the existing Network Rail regional rail network to Ashington, Hexham or
Teesside would offer opportunities for Metro to integrate more closely with longer-distance electric trains
operated by other providers.
4.2.10 Nexus’ access agreement over Network Rail infrastructure between Pelaw and South Hylton expires in 2032;
this timeframe is also one during which the existing electrification infrastructure may need substantial
renewal, 30 years after installation. Network Rail would be likely to consider the existing 1500V DC
electrification to South Hylton (owned and operated by them with Metro as sole user) as an obstacle to
completion of the Durham Coast route electrification through to Newcastle, therefore requiring conversion
of the route used by Metro to 25kV AC in any event.
4.2.11 Converting the OLE infrastructure on the line from Pelaw to South Hylton to 25kV AC and electrifying the
Durham Coast line south of Sunderland would create substantial benefits for all rail services using this
corridorr. Electrification leads to faster journey times due to the improved acceleration and braking
performance of electrically-powered rolling stock which would benefit regional rail services if diesel-
powered rolling stock is replaced. Currently, both long distance operators running services to Sunderland,
Virgin Trains and Grand Central, have no option but to use diesel trains. 25kV AC electrification would enable
these trains to also be formed of electric rolling stock, especially as the rest of the ECML is already
electrified. It would also allow for more services to be diverted away from the ECML in times of disruption or
engineering works as currently electric trains have to be “dragged” by a “Thunderbird” diesel locomotive. As
benefits would therefore accrue at a national as well as regional level, the electrification of the Durham
Coast at 25kV AC from Newcastle via Sunderland to Teesside is a NECA priority and it is important that future
Metro rolling stock of the future is complementary to this objective in terms of its technical specification.
4.2.12 Dual-voltage trains exploit the capital cost-effectiveness of retaining 1500V dc on the existing Metro network
while also allowing operation at 25kV AC, by easily and automatically changing between voltages when
moving from one network to another. This facility is commonly found on Continental trains and light rail
vehicles, such as those in Karlsruhe in Germany. It is also planned on the new Sheffield tram-train and an
option for new Merseyrail vehicles (albeit at 750V/25kV rather than 1500V/25kV). The high capital costs and
inflexibility involved in converting or providing different voltages on the overhead power supply are
swapped for a more modest capital cost for the provision of dual-voltage equipment on the vehicles.
4.2.13 Whilst it is possible that routine 25kV operations may not come into effect for some time after a new Metro
fleet enters service, installing dual voltage capability at the point of manufacture will be more cost-effective
than a later retrofit, and offer full ‘future-proofing’. The new fleet base case will justify the inclusion of dual-
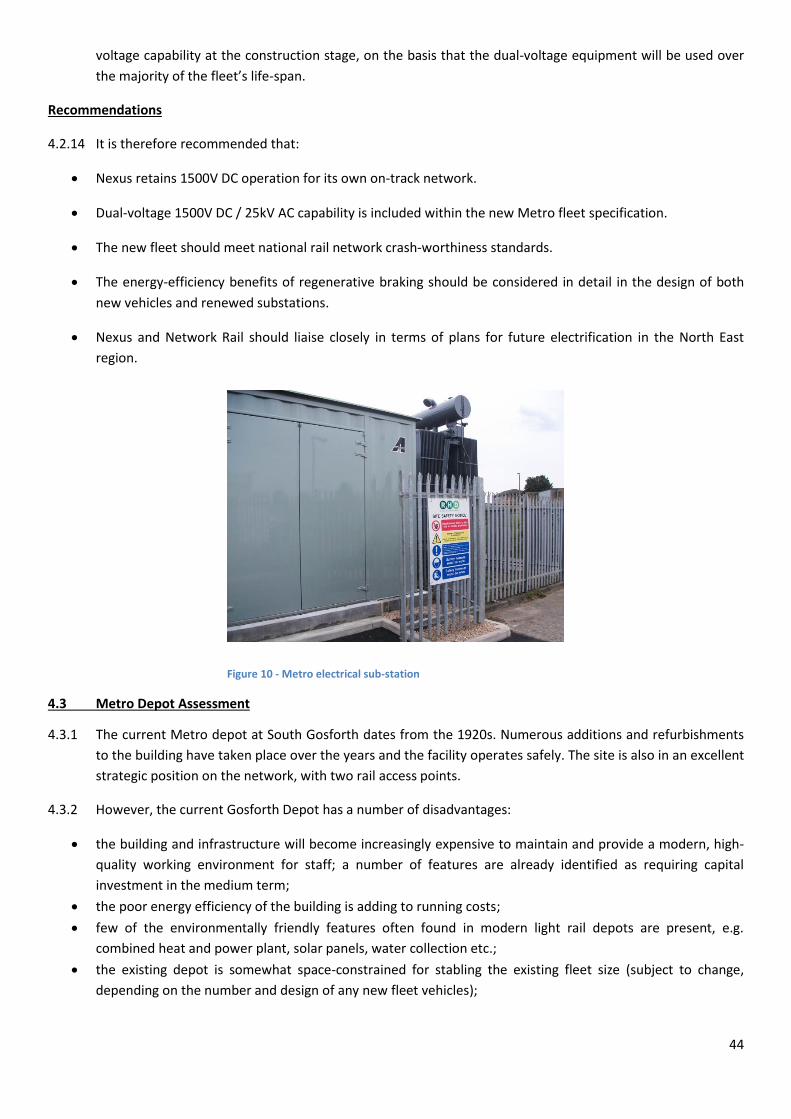
44
voltage capability at the construction stage, on the basis that the dual-voltage equipment will be used over
the majority of the fleet’s life-span.
Recommendations
4.2.14 It is therefore recommended that:
Nexus retains 1500V DC operation for its own on-track network.
Dual-voltage 1500V DC / 25kV AC capability is included within the new Metro fleet specification.
The new fleet should meet national rail network crash-worthiness standards.
The energy-efficiency benefits of regenerative braking should be considered in detail in the design of both
new vehicles and renewed substations.
Nexus and Network Rail should liaise closely in terms of plans for future electrification in the North East
region.
Figure 10 - Metro electrical sub-station
4.3 Metro Depot Assessment
4.3.1 The current Metro depot at South Gosforth dates from the 1920s. Numerous additions and refurbishments
to the building have taken place over the years and the facility operates safely. The site is also in an excellent
strategic position on the network, with two rail access points.
4.3.2 However, the current Gosforth Depot has a number of disadvantages:
the building and infrastructure will become increasingly expensive to maintain and provide a modern, high-
quality working environment for staff; a number of features are already identified as requiring capital
investment in the medium term;
the poor energy efficiency of the building is adding to running costs;
few of the environmentally friendly features often found in modern light rail depots are present, e.g.
combined heat and power plant, solar panels, water collection etc.;
the existing depot is somewhat space-constrained for stabling the existing fleet size (subject to change,
depending on the number and design of any new fleet vehicles);

45
road access for staff and visitors is not ideal; there is no station attached to the depot as is the case with
many modern depots, and car parking is limited, and
low-loader access for taking train vehicles on and off the network is not possible at Gosforth.
4.3.3 Options to reconfigure Nexus’ depot provision include:
Retaining the existing Gosforth Depot, with significant refurbishment to keep it ‘fit for purpose’, or even
large-scale reconstruction.
Construction of a brand new ‘like for like’ main depot in another location, with disposal of Gosforth.
Provision of additional train ‘out-stabling’ facilities, irrespective of the main depot’s location, to increase
engineering capability and improve service flexibility, such as earlier starts and later finishes.
4.3.4 The new Blackpool Trams depot and the replacement Metrolink depot at Trafford are two recent examples
of new depot facilities. Should a substantially reconstructed or completely new depot for Metro be required,
this best practice may help to design a suitable facility. A new or altered depot may also offer the
opportunity to consolidate all Metro operational and management functions onto a single site.
4.3.5 One or more smaller ‘out-stabling’ facilities will also be investigated. These could help to relieve space
pressure on the main depot, while also (depending on location) providing additional flexibility in scheduling,
or resilience in the case of major network disruption. Potentially different functions could operate at
different sites, e.g. heavy maintenance at the main depot and light maintenance at an out-stabling facility.
The rationale for housing an entire Metro fleet at a single location may be less strong in the future with
increased train reliability and the possibility of network extensions providing the opportunity for additional
stabling locations. There may be scope for smaller secure stabling facilities at termini such as South Shields.
Recommendations
4.3.6 It is recommended that further work be undertaken to evaluate options for the long-term depot and stabling
requirements of a Metro fleet. This work should be split into the following work-streams:
Establishment of options and outline costings to refurbish the existing Gosforth Depot to provide long-term
sustainability of operations.
Estimate the costs of a brand new main depot.
Identify a policy position about alternative sites for a new main depot, or additional out-stabling facilities.
4.3.7 The conclusions of these work-streams will then be fed into detailed modelling of timetables, staff rostering,
resilience issues, and the requirements of the new fleet, with a view to making a final recommendation as to
the preferred solution as part of the full business case for fleet renewal.
Figure 11 - Metro Depot, Gosforth

46
4.4 Signalling and control
4.4.1 Decisions around signalling and control technology will be based on the following key principles:
Total compliance with safety requirements.
Best use of assets by facilitating maximum throughput of services.
Appropriate use of new technologies, where justified through cost benefit analysis, and the improvements
that can be safely delivered through their use.
Compatibility with Network Rail protocols and equipment, and / or the flexibility to move safely and
seamlessly between different systems.
4.4.2 Several ‘grades’ of signalling and control automation exist on light rail networks, which have been defined by
the International Association of Public Transport (UITP) as shown in the chart below. These categorisations
are ‘in principle’, and do not specify any particular technology to deliver each grade of automation.
4.4.3 GoA0 is typically used in tram/on-street operation. GoA1 is the ‘traditional’ heavy-rail mode of operation.
GoA2 is operated on many London Underground lines. A driverless GoA3 system operates at the Docklands
Light Railway. GoA4 Metro networks exist in many countries outside the UK, but there are currently none in
the UK, although Glasgow Subway operations will switch from the current GoA2 to GoA4 over time, once the
signalling and control systems have been fully tested and the new train fleet is in service.
Current Nexus Metro Operation
4.4.4 Metro currently operates on a standard track-circuit-based fixed-block signalling system with 2- or 3-aspect
lit signals, inherited from the former heavy rail network on which it is based.
Chart 3 - Train Control Automation Options

47
4.4.5 Metro vehicle control is currently fully driver-operated (UITP: GoA1). Automatic Train Protection (ATP) is
provided by a system-specific ‘INDUSI’ braking system which applies the emergency brakes if a signal is
passed at red. This differs from the standard Network Rail TPWS/AWS system, and INDUSI trackside
equipment was installed additionally to TPWS on the Sunderland extension, as the two systems do not
interfere with each other.
4.4.6 A ‘Positive Train Identification’ system (PTI) controls the signals at Metro stations, and also the various
switches and crossings around the network. Elsewhere signals operate automatically using a standard fixed-
block track-circuit operation.
4.4.7 There is currently a minimum headway of 3 minutes on the central corridor during peak times. It is
understood that the current Metro signalling system could permit 2½ minute headways, but this would
require a technical study to confirm: passenger alighting and boarding behaviours also contribute towards
overall route capacity.
Infrastructure and Systems Replacement
4.4.8 Asset Renewal Programme (Phase 2) funds are being used to:
Replace the radio communications system with a “Tetra” system, with a 10-15 year lifespan.
Replace the PTI system – again the new system’s lifespan will be 10-15 years.
Fund an on-going programme of testing and replacement of signalling cables where necessary, both
along the track and within interlocking control boxes.
4.4.9 Nexus anticipates the requirement for a more substantial renewal of the signalling system in the mid-2020s.
It is also anticipated that the INDUSI ATP system will need to be replaced in the mid-2020s, following an
earlier refurbishment in the mid-2000s.
4.4.10 There is a convergence of requirements for signalling and communications systems renewal and
replacement in the mid-2020s, around the same time that any new fleet would be likely to enter service.
This offers the opportunity to consider the need for any changes to the existing signalling, control and
communications system for Metro. There is potential for increased capacity and more efficient operation,
while also allowing for a considerable reduction in lineside equipment and hence maintenance costs, as well
as driver staffing costs. A new fleet in service in the 2020s will have a life-span of several decades and while
it is possible to retrofit vehicles as part of a complete change of signalling/control system, this would be
more cost-effective if done at the time of manufacture. However any significant change in this area would
involve significant capital expenditure and potential service disruption, and will only be proposed if there is
clear justification in terms of increased passenger demand, requirement for reduced operational costs, or
both.
4.4.11 Evaluation of technical options is under way as an element of the business case process. Driverless train
operation presents significant challenges on the Metro network, as it is not ‘closed’ or segregated like the
Docklands or Glasgow systems – there are six level crossings, further footway and bridleway crossings, and
substantial interfaces with neighbouring public and private property. On the national rail network, the
future-standard European Train Control System (ETCS) has been pushed back to a 2022 implementation
along the East Coast main line at the earliest, with roll-out starting in southern England and progressing
northwards. ETCS involves in-cab signalling with no line-side signals, and this Network Rail programme
includes the retro-fitting of freight engines with cab equipment, indicating that the subsequent fitment of
modern cab signalling is less costly and intrusive than previous versions. In this scenario Nexus can afford to
be more ‘technology-agnostic’ in terms of vehicle specification, and there may be a better case for renewing

48
the existing signalling on Nexus-owned infrastructure on a like-for-like basis, taking account of the delays in
ECTS roll-out and the need for driver vigilance against potential track incursions. Also, the varied nature of
future network operations envisaged by this strategy suggests the need for driver-operated trains to deal
with different standards and protocols that system extensions will necessitate.
4.4.12 Nexus has recently commissioned a condition survey of the existing signalling infrastructure, and has sought
independent advice as to the signalling and control options available for future Metro operation. The
outcomes of this work will be used to evaluate which option or combination of the options discussed above
is likely to be most appropriate.
Recommendations
4.4.13 Research into the optimum signalling and control protocols for Metro will need to continue as part of the
new train fleet business case specification, ensuring that the chosen solution is safe, value for money,
flexible, and not incompatible with similar control systems as may be introduced in the future by Network
Rail.
4.5 Energy Supply, Efficiency and Renewables
4.5.1 The amount of energy consumed by Metro per passenger-kilometre is consistently amongst the highest of
its worldwide peer group22. This is a result of:
lack of regenerative braking and general inefficiency of Metro’s 1970s-design vehicles
relatively low service frequency
relatively low passenger loadings on Metro outside peak hours
Metro performs better in statistics on its energy usage per train-kilometre, and is in the best-performing
third in terms of overall energy efficiency (i.e. lowest losses) of its operations.
4.5.2 In the medium/long term, as a large consumer of electricity, Nexus faces a potential financial threat from
electricity price rises; the Community of Metros (CoMET) reported in 201223 that almost all member Metro
networks worldwide expect electricity prices to increase substantially in the medium to long term.
4.5.3 How Nexus uses energy for operating Metro will be important in terms of containing costs, demonstrating
environmental sustainability, and possibly in terms of attracting future public sector funding. There is an
opportunity for Metro to become a light rail exemplar in sustainable energy use, and energy efficiency
across all aspects of its operations as the infrastructure is progressively renewed and older less efficient
assets are retired from service. The performance of new rolling stock offers the opportunity for substantial
energy cost savings due to its increased energy efficiency, especially if regenerative technologies are
employed. There is also the opportunity to increase the environmental performance of other network
infrastructure, for instance through the installation of solar panels.
Recommendations
4.5.4 It is recommended that:
Work continues on an on-going basis to identify and implement cost-effective energy-saving opportunities
on Metro’s existing network and infrastructure
More work be carried out on the opportunities for renewable energy generation
22
CoMET/NOVA report “CO2 Competitiveness” 2009, and later updates 23
CoMET “Energy Saving Strategies” 2012
49
Given its long-term criticality to Metro operation, a formal Energy Strategy be established
4.6 Essential Renewals post-2021
4.6.1 Repair, refurbishment and replacement of the Metro network is an ongoing process, as is the case with all
railway networks. The Metro Reinvigoration Programme is designed to progressively replace and renew life-
expired assets to reduce the risks of infrastructure failure, improve operational reliability and efficiency, and
ensure that the system can continue to operate in perpetuity. Despite the large amount of investment
during the period since 2010, Nexus has identified that further essential renewals will be required in the
period beyond 2021, when the current government-funded £350m programme comes to an end.
4.6.2 Nexus is therefore preparing a business case to obtain government funding for investment in the Metro
infrastructure it owns, for a further period. This investment will continue to be based on asset condition, as
has been the case throughout the renewals process to date. The preferred option under development
outlines the need for a further £518.5m of funding over the period 2021-2035, covering the following key
areas: civil engineering works; permanent way; signalling; level crossings; depot equipment; plant;
mechanical and electrical; stations; power; capital maintenance, and ticketing and gating. Expenditure on
signalling, taking account of the options outlined above is expected to form a major element of this draft
programme.
4.6.3 By attracting further long-term investment for essential renewals and maintenance of the Metro
infrastructure, the network will maintain its resilience, help ensure future reliability, and support NECA’s
aspirations for reducing congestion and encouraging more sustainable forms of transport.
Recommendations
4.6.4 It is recommended that work continues to full business case status on the continuation of the Metro
essential renewals programme post-2021.

50
Section 5: DELIVERING EXCELLENT CUSTOMER EXPERIENCE
5.1 Introduction
5.1.1 Expanding the Metro and local rail customer base is critical to the region’s economic and social future, but
without a stable and expanding customer base, the economic rationale for service improvements and
network extensions can be weakened. Metro has built up a strong brand and reputation with its customers
across four decades: the challenge is to maintain and build on this, and to extend this into a clear Metro and
local rail brand across the region, through the closer integration of light rail and local rail services portraying
a distinctive and positive image. This will be accompanied by a policy of continuous improvement to the
range and quality of facilities offered to customers.
5.1.2 This section of the strategy explains how customer service requirements will be identified and implemented
so as to continually develop the market for rail-based transport across a wider area of the NECA region.
Required improvements will be identified through the outcomes of customer research, including the views
of non-users, and the application of best practices from other urban rail networks world-wide. A blueprint
for all customer-facing elements will be established to ensure a consistent and high quality product across
the current network and any future network extensions. This section examines the areas of customer
requirements; fares and ticketing; information provision; station facilities, and Park and Ride.
5.1.3 Establishing and maintaining customer loyalty across all activities is essential:
“With rising competition, keeping them satisfied may not be enough; organisations should rather work
towards maximising customers’ satisfaction as literature proves that only the “very satisfied” customers will
be loyal”24
5.1.4 Although all aspects of customer service are important, some factors are consistently rated more highly than
others over a period of time. Comparison of the relative importance of customer service attributes cited by
Metro users has revealed the most consistently significant were:
(i) Reliability
(ii) Punctuality
(iii) Station cleanliness
(iv) Value for money
(v) Train cleanliness
(vi) Station condition
(vii) Staff availability
(viii) Passenger behaviour
(ix) Train running information
24
Understanding Customer Relationships. Ipsos MORI 2008

51
Research undertaken by Transport Focus on other train operators results in similar findings, with personal security also an important factor.
5.2 Customer Satisfaction
5.2.1 Nexus undertakes passenger satisfaction surveys across the Metro system to gauge what passengers are
thinking about the Metro service. The chart below shows overall satisfaction, marked as overall scores out of
10, from 2012/13 through to 2015/16. This corresponds with an increasing number of incidents and
reliability issues on the system.
Chart 4 - Metro Passenger Satisfaction Scores
5.2.2 The chart below adds to this by ranking the satisfaction of various elements of customer service. It shows the
importance of the reliability and punctuality of services in determining customer satisfaction.

52
Chart 5 - Relative Importance of Metro Service Attributes
5.2.3 The chart below sets out passenger satisfaction with the reliability of Metro between 2010/11 and 2015/16.
The key issue arising is the increase in the proportion of people who have become more dissatisfied with
reliability, from 2% in 2010 to 17% in 2015. Above all else, passengers want trains that are reliable. The
reliability of trains is extremely important to passengers, and this feeds through to overall views on service
reliability, with consequential adverse effects on the reputation of the Metro due to the unreliability of the
current fleet. This highlights the urgent need for a new Metro fleet that will restore train reliability to the
standards rightly expected by customers.
Chart 6 - Passenger Satisfaction with Punctuality and Reliability 2010-2015

53
5.2.4 These trends are amplified in research undertaken by Transport Focus25 which shows that the biggest driver
for passenger satisfaction scores was the reliability and punctuality of the train, but that the way in which
train companies deal with these delays is more significant in affecting users’ dissatisfaction with service
delivery. This area of customer service will be an important priority for the delivery of the future Metro and
local rail network.
Figure 12- Factors Determining Passenger Satisfaction
5.3 Train Service Requirements
5.3.1 Customers are always likely to express a preference for service improvements that offer more frequent
services, or over a longer period of each day than at present. Some customer aspirations, such as 24-hour
operation, may not be justified by demand or practicable, given the need for network maintenance. Other
requests, such as for earlier trains to Newcastle Airport or increases in service frequencies over certain
routes or at particular times of day may potentially be justified, and should then be considered on their
merits and feasibility.
Constraints for Metro service changes
5.3.2 The following constraints are currently assumed as fixed for the purposes of future service patterns and
frequencies. They can be altered or removed in future if justified by customer demand or operational
requirements, but at present form part of the base case demand and operating scenario. Signalling options
could be varied to meet future requirements, and platform lengths could also be increased, although if not
all can be altered, then the rationale for lengthening any must be questionable. The assumed base-case
constraints are therefore:
Maximum signalling capacity in the central corridor of 20 trains per hour in each direction.
Existing platform lengths are retained, capable of accommodating train lengths of up to 60m.
25
Rail users’ drivers of satisfaction; Transport Focus 2015.

54
5.3.3 Taking the existing fleet as a benchmark, the above constraints indicate a maximum of 2560 seats and a
theoretical total capacity of around 12600 passengers per hour (crush loading) in each direction through the
central South Gosforth to Pelaw corridor. In practice the maximum hourly capacity will be substantially
lower, as services operating full and standing would not exploit the maximum theoretical line capacity
because of extended station dwell times. Such levels of crush loading would also result in unpleasant
conditions in which to travel for any length of time, particularly for more vulnerable passengers.
Nevertheless this level of capacity offers some scope for accommodating increased levels of demand – whilst
recognising that central Newcastle and Gateshead are not the focus of all trips made on Metro.
5.3.4 Fewer constraints would exist on other sections of the network where levels of demand are historically
lower. In terms of comparisons with other UK networks, most of which include elements of street-running
operations, individual route and combined route frequencies are generally comparable. Over the central
sections of the Manchester, Sheffield, Docklands, Tramlink and Tyne and Wear networks, routes combine to
at least double the frequencies within central sections, as shown in the table below.
Network Services per hour (daytime)
Services per hour (evening)
Glasgow Subway 15 7.5
Manchester Metrolink 5 4
Sheffield Supertram 6 3
West Midlands Metro 7.5 4
Nottingham Tram 10 6
Docklands Light Railway 6 to 15 6
London Tramlink 4 to 8 4
Tyne and Wear Metro 5 4
Table 9 – UK Light Rail network service frequencies
5.3.5 The table above shows a wide variation in frequencies along light rail corridors and a broad average across
these networks of eight services per hour daytime and five services per hour during evenings. On the local
Northern rail network by comparison, service frequencies are less frequent, with only Metrocentre to
Newcastle offering four trains per hour during daytimes. Working with Rail North and the NERMU, a future
priority will be to ensure that wherever justified by demand and operationally feasible, more of the local rail
network within the NECA area operates at frequencies comparable to those operated across the Metro
network.
5.4 Passenger journeys

55
Chart 7 – Metro trips by distance bands
5.4.1 The chart above shows the recent distribution of Metro journeys grouped into distance bands. The mean
distance travelled on the current Metro network is 8.2kms. The median distance is 5.8 km; based on an
average 36km/h travel time; this results in a median on-board time of slightly less than 10 minutes (in
addition to a median platform wait time of approx. 4-5 minutes).
5.4.2 This highlights the key function of the existing Metro network as a mover of large volumes of people over
relatively short distances. This suggests the need for easy access vehicles with swift acceleration and plenty
of non-seating space for passengers’ luggage, buggies and wheelchairs. Were all of the network to share
these characteristics then the customer requirement for vehicle specification would be straightforward;
something along the lines of the ‘Docklands model’ with a large proportion of doors to body length, wide
vestibules and a comparatively low number of mainly sideways-facing seats. The new trains used on London
Overground, below, typify this configuration.
Figure 13 - 'Longitudinal' seating on London Overground Train
5.4.3 However the variety of journey patterns made by Metro makes for a more complex set of requirements.
Although most journey lengths are short, there are significant longer-distance flows along such corridors
56
those linking the North Tyneside coast, South Shields, Sunderland city centre and Airport with central
Newcastle and Gateshead. Passengers on these flows pay higher than average fares, and may expect a seat
for most if not all of their journey. In addition, over a fifth of Metro passengers are classified as older and/or
disabled persons, with a more urgent requirement for seats wherever possible.
5.4.4 Competitive journey times can also increase levels of customer demand, especially if they are market-
beating as are Metro and local rail links to and from central Newcastle at peak times. One corridor where
higher speeds could potentially be a catalyst for growth in customer demand is the Pelaw to Sunderland
corridor, where both station spacing and the Network Rail signalling configuration appear suitable for
higher-speed Metro operations (heavy rail passenger services here operate at up to 70 mph / 110 km/h). The
same rationale would apply to any future extensions using Network Rail infrastructure where there may be
track-sharing with potentially faster services
5.5 Fares and Ticketing
5.5.1 Customers expect a simple and affordable range of tickets that makes travelling around the region easy and
intuitive, and helps to make public transport a practical choice. This will require products that are widely
available to buy both on and off the network, and which can be used for integrated journeys across all forms
of public transport, maximising the benefits of smart ticketing technology.
5.5.2 Metro has a comprehensive range of tickets for travel on the network, these have been simplified in recent
years and the introduction of smart ticketing will further help in this regard. The current structure of Metro
ticketing differs from those in place on local rail and bus operations. Bus operators each have their own
range of tickets tailored to their own commercial needs, and the structure of fares zones varies significantly.
Those local rail fares other than the Sunderland to Newcastle fares set by Nexus fall within DfT and
franchisees’ rules for the national rail network. In addition to operator and mode specific tickets, Network
Ticketing26 offers a range of multi-modal tickets, priced at a premium to those of single operators and
applying to a further set of zones. Most Network Ticketing products apply to the Tyne and Wear area only,
except for the region-wide Explorer product (which in itself is not valid on most rail services).
5.5.3 The overall effect is to offer numerous ticketing options that could apply to various journeys, an over-arching
picture of complexity and potential confusion. This is partly due to the workings of the deregulated bus
market, but even on the rail-based network the option to buy one ticket from Hexham to Tynemouth, for
instance, is not currently available. The full implementation of smart ticketing, where the customer interface
is simple and intuitive, will help to alleviate this problem, but it can only be fully removed through the
implementation of a zone-based, modally-agnostic fares network across the NECA area and potentially
beyond, in line with the longer-term aspirations of Transport for the North.
Proposed future ticketing structure
5.5.4 Product simplification will focus upon single tickets, day tickets, monthly and annual tickets with Metro or
local rail only, as well as multi-mode options. Depending on any future changes made to the way bus
services are delivered across the NECA area, there may also be opportunities to align bus and Metro/local
rail fares zones such that they are common to all public transport modes. The potential for bus franchising
through the provisions of the Bus Services Bill once enacted could make fares and multi-modal product
availability simpler, through the introduction of one set of fares zones and greater product harmonisation. In
26
Network Ticketing Limited is a federation of public transport operators in North East England offering multi-modal ticketing products. Nexus as Metro and Ferry owner holds a 37% share in the company.

57
any event there is a clear requirement for a single fares and ticketing regime for Metro and local rail services
across the NECA area. This framework could also accommodate potential niche products to stimulate
additional custom during times of lower demand.
Under-21 fares
5.5.5 Proposals will also seek to improve the affordability and flexibility of Metro and local rail travel for
customers under the age of 21. As the school leaving age increases and the size of the population cohort in
further and higher education also rises, then the need to cater for this market, the public transport
passengers of the future, will become more urgent.
Fare reviews
5.5.6 Fares charged will be reviewed from time to time with NECA agreement and in partnership with the NERMU
to reflect market conditions, customer affordability and operational costs. If the Metro and local rail network
is extended to new corridors, then it is proposed that the zone-based fare structure will apply also to these
new services.
5.5.7 For several years, NECA and its forebears have taken a position to only increase Metro fares in line with
inflation in contrast to the National Rail network, where fares have generally increased at a rate of Retail
Price Index (RPI)+1%. Work undertaken by Nexus to assess the impact of above-inflation fare increases
found that revenue would grow despite a negative patronage impact as a direct result of the increase. In the
scenario below, inflation is assumed to be 1%, therefore a 2% flat % change applied is the equivalent to
RPI+1.
Flat % change applied Revenue change Patronage impact
2% £650k (+1.8%) -77k
5% £1.291m (+3.6%) -301k
10% £2.656m (+7.4%) -685k
Table 10 – Estimated impacts on Metro patronage and revenue of varying fares increases
Smart Ticketing
5.5.8 Smart ticketing makes it easier to apply innovative solutions to meet customers’ requirements, such as a
daily price cap where the cost of a customer’s daily travel will not exceed the price of the relevant day ticket
for the trips they have undertaken.
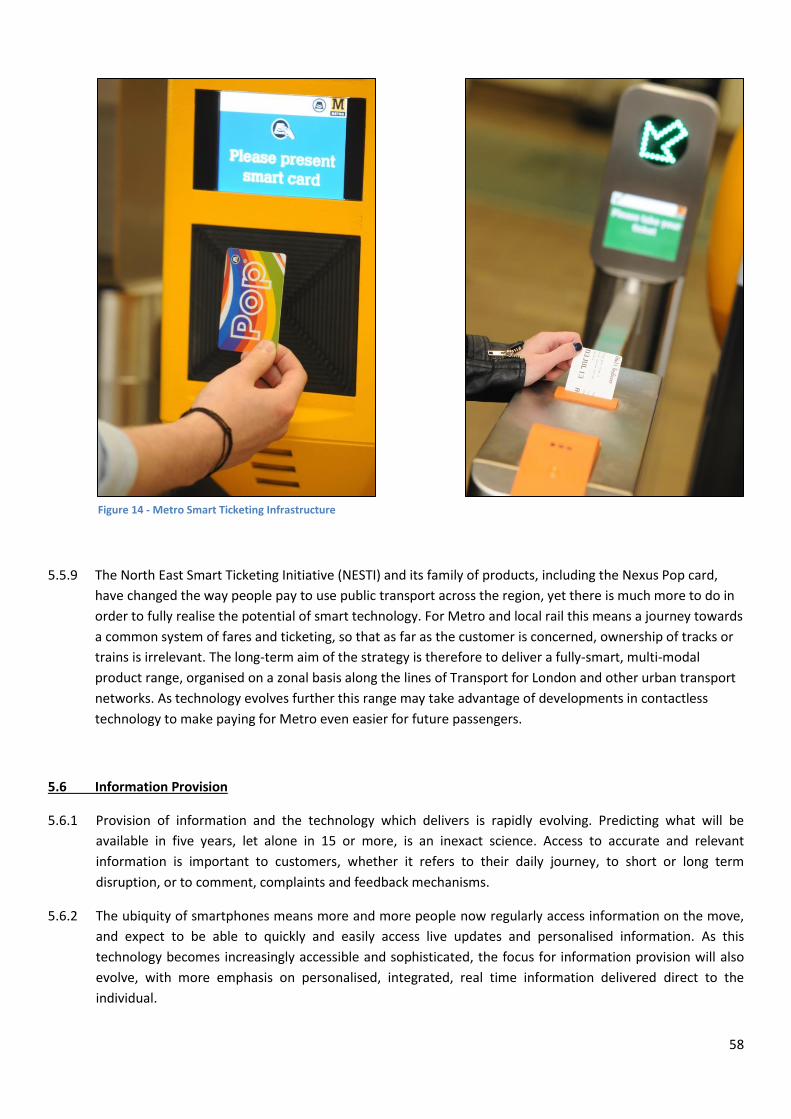
58
5.5.9 The North East Smart Ticketing Initiative (NESTI) and its family of products, including the Nexus Pop card,
have changed the way people pay to use public transport across the region, yet there is much more to do in
order to fully realise the potential of smart technology. For Metro and local rail this means a journey towards
a common system of fares and ticketing, so that as far as the customer is concerned, ownership of tracks or
trains is irrelevant. The long-term aim of the strategy is therefore to deliver a fully-smart, multi-modal
product range, organised on a zonal basis along the lines of Transport for London and other urban transport
networks. As technology evolves further this range may take advantage of developments in contactless
technology to make paying for Metro even easier for future passengers.
5.6 Information Provision
5.6.1 Provision of information and the technology which delivers is rapidly evolving. Predicting what will be
available in five years, let alone in 15 or more, is an inexact science. Access to accurate and relevant
information is important to customers, whether it refers to their daily journey, to short or long term
disruption, or to comment, complaints and feedback mechanisms.
5.6.2 The ubiquity of smartphones means more and more people now regularly access information on the move,
and expect to be able to quickly and easily access live updates and personalised information. As this
technology becomes increasingly accessible and sophisticated, the focus for information provision will also
evolve, with more emphasis on personalised, integrated, real time information delivered direct to the
individual.
Figure 14 - Metro Smart Ticketing Infrastructure

59
5.6.3 Information provision on the future Metro and local rail network will cover three elements:
journey planning;
reassurance,
general information which adds value to the product
5.6.4 One of the key complaints of customers across all aspects of public transport is the provision of information
in times of disruption. The provision of timely and accurate information is key to satisfaction with the service
when there is a delay, whether planned or otherwise. Transport Focus found that:
“information greatly influences the impact that delays and disruption have on passengers, empowering
them to make practical decisions about their journey and reduce stress”27.
5.6.5 Passengers want to know:
About any disruption that will be or is occurring
What the change is
The scale of the disruption
Any alternatives
Impact on journey time, even if it is an estimate
Anticipated duration of the problem.
5.6.6 Metro and Northern currently provides this information via social media in addition to visual and audio
announcements made at stations for passengers. Transport Focus found that preferred channels for
information were electronic real time information and on-board electronic announcements. Internet and
social media communications was recognised as a useful source, but should complement other channels and
not replace them.
Journey Planning
5.6.7 Information provision should enable individual journey planning, providing integrated travel information for
all modes, aiming to minimise waiting times and interchange penalties. It is critical that information
provision considers public transport as an integrated network and that journey information links closely to
ticketing information to give full information and reassurance during the journey. Nexus will continue to
develop apps for smartphones and other mobile devices, enabling individuals to undertake individual
journey planning across Metro, local rail and other modes.
5.6.8 All transport providers must take account of the needs of those who for whatever reason may be unwilling
or unable to access information in the ways described above. Alternative provision should include face-to-
face information via customer service staff who are able to provide information to travelling customers, but
also advice and reassurance where required. Staff presence on the Metro network is highly valued by
customers, not only for provision of information but also in terms of perceptions of safety and security. Also,
in times of disruption, reliance on apps or similar channels might not always be the best way of
communicating with customers. Passenger Focus found that whilst passengers were positive about apps
which provided this information, they felt they would need an alert to prompt them to look at this section of
the app in the first place.28 Nexus will continue to maximise staff presence on the Metro network,
27
Passenger Focus; Bus passengers experience of delay and disruption, Jan 2013 28
Passenger Focus; Bus passengers experience of delay and disruption, Jan 2013

60
particularly during evenings, and incentivise them to provide high quality customer service and information
provision, within available budgets.
5.6.9 Information should also be accessible throughout the full operational hours of Metro and local rail; and this
is particularly important in times of disruption. Therefore Nexus and other providers will continue to
monitor, manage and update real time sources of information via streams such as Facebook, Twitter and
new outlets throughout operational hours.
Adding Value
5.6.10 Digital media and information sources can give significant opportunities to add value to transport
information provided to the travelling public, but also to generate revenue to support investment in Metro
and local rail . As journey planning develops, such systems should offer genuine multi-modal door-to-door
journey planning allowing opportunities to also provide destination information to users, and in doing so
may create revenue generation opportunities through advertising of attractions.
5.6.11 Opportunities to ‘push’ information to users, subject to opt-in by passengers, will be investigated, through
Bluetooth-enabling stations, and the provision of Wi-Fi on train and at stations.
5.7 Station Facilities
Current situation
5.7.1 Metro in 2016 serves 60 stations, a combination of halt stations, larger interchanges, and substantial city
centre stations. These are a mix of ages, styles and designs, depending on when they were built, but as part
of ARP Phase 2, significant work is being undertaken to ensure that all stations meet accessibility
requirements through installation of items such as tactile surfaces and dual hand-railing. Additionally
stations have been rebranded with new furniture and where necessary updates to CCTV and public address
systems. All stations are also equipped with help points, passenger information systems and ticket machines,
which accept payment by card, cash and pay-wave as well as top-up facilities for smartcards. 13 of the
busiest stations have gate-lines installed and in operation; additional CCTV has been installed at these
stations as part of this project. Validators are installed at stations which are not gated.
5.7.2 There are 31 local rail stations within the NECA area, ranging from remote rural stations to major Intercity
stations. Most are unstaffed and the level of passenger facilities varies considerably with a staff presence at
some or all times at six stations, to be increased to eight locations by 2019.
5.7.3 Nexus received funding through the Local Sustainable Travel Fund to install cycle parking at all Metro
stations during 2012-15. This includes ‘Cycle Pod’ storage at all stations, with more secure solutions such as
individual lockers, accessed via Pop cards, at stations where justified by levels of demand. Significant
improvements have been made to lighting at the stations, helping not only to improve the appearance of the
station, but also improving safety and security by eliminating dark areas. Northern Rail also undertook
substantial cycle parking provision across its network of stations during its tenure of the Northern rail
franchise.
5.7.4 Metro passenger feedback most commonly relates to provision of toilet facilities and the availability of staff,
particularly in the evenings. The installation of gate-lines at the 13 busiest stations increases the staffing
presence at busy times and also allows for staff previously involved in revenue protection duties at these
stations to take a more mobile role around the wider network. Arising from this, the aim is that satisfaction
with staffing on the network and safety and security will improve from now onwards. It is not currently

61
proposed to staff the full network as it does not offer value for public money. Further station gating would
increase perceptions of safety and security and will be kept under review as required by possible changes to
ticketing technology and where justified by a positive business case resulting from lower levels of fraudulent
travel. Toilets will not generally be provided at stations due to the on-going costs of maintenance and the
potential for anti-social behaviour, impacting on perceptions of safety and security. This is in line with the
policies of most urban rail networks where journey times are short.
5.7.5 Priorities for station improvements include:
additional measures to improve safety and security including CCTV coverage of help points, and
CCTV repeater screens;
integration with bus services where feasible and required;
improvements to facilities catering for new customer requirements;
further accessibility improvements above and beyond required standards where funding is available
and site constraints permit;
real time information provided at all stations and at major interchange points,
Wifi provision at stations to match on-train provision.
New stations
5.7.6 Any new stations will be designed to facilitate clear and simple integration between Metro and other forms
of transport, including bus, cycling and walking. Parking spaces will be provided where space permits, but
not be at the expense of interchange with sustainable transport modes. Stations will be constructed to
standards outlined in the DfT publication ‘Accessible Train Station Design for Disabled People: A Code of
Practice’ (as may be amended over time) and will be fully compliant with Rail Vehicle Accessibility
Regulations in respect of platform / train gap interfaces, once a new train fleet is in operation.
5.7.7 New stations will provide high-quality covered waiting facilities for bus where appropriate, with level access
where possible between the two modes by providing raised kerbs at bus stands. There is no set template for
the design of new Metro stations; the last new station opened in 2008 and in any event the design and
facilities at each location are governed primarily by legislation and then by the constraints and opportunities
of each location.
5.7. 8 All new stations will have cycle parking provision, in line with Nexus policy, with StreetPod facilities at
smaller, halt stations and more secure provision at larger stations with higher footfall, and major
interchange points.
5.7.9 Signage to safe cycling and walking routes will be clear from the station and within the design phase Nexus
will work with the local authorities to investigate opportunities to improve safe walking and cycling routes
surrounding stations.
5.7.10 Additional Park and Ride facilities will be considered at specific station locations linked to areas of road
congestion as covered in more detail below.
5.8 Park and Ride
5.8.1 Metro and local rail networks can often offer a step change in quality, offering journey time reliability that
encourages modal shift from car, and Park and Ride facilities are often seen as attractive by car users29.
29
What can light rail do for cities, a review of the evidence, SDG for pteg February 2005
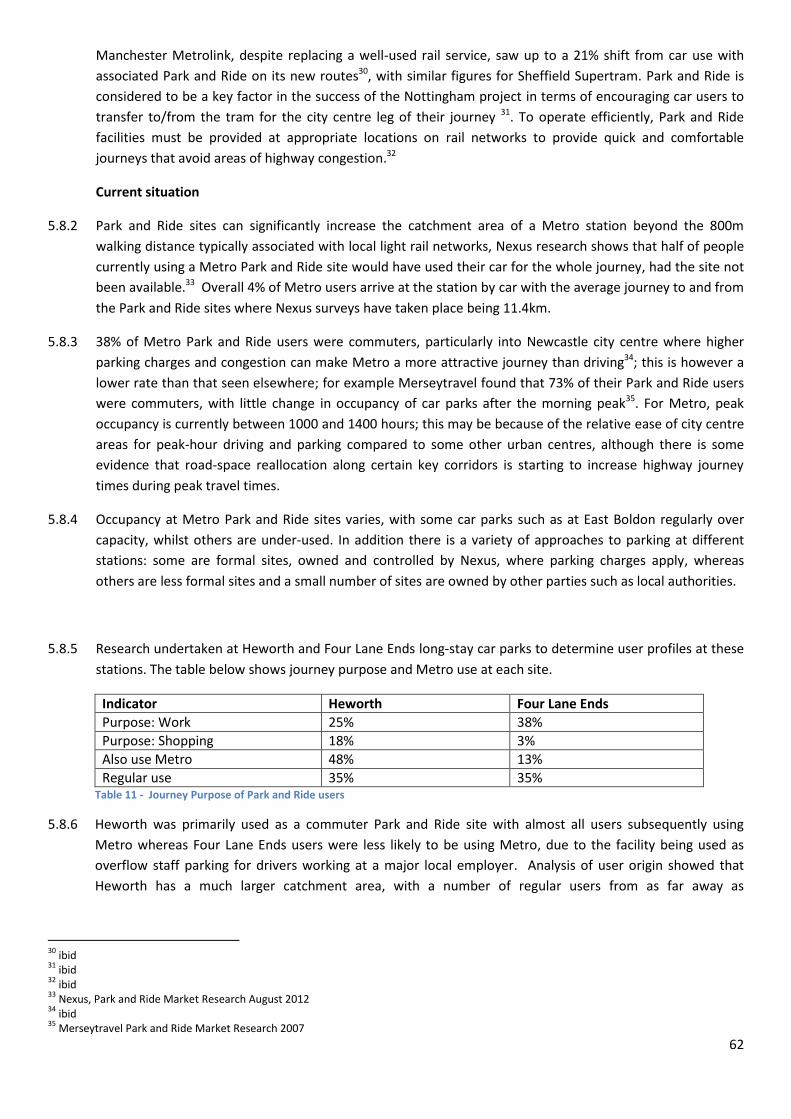
62
Manchester Metrolink, despite replacing a well-used rail service, saw up to a 21% shift from car use with
associated Park and Ride on its new routes30, with similar figures for Sheffield Supertram. Park and Ride is
considered to be a key factor in the success of the Nottingham project in terms of encouraging car users to
transfer to/from the tram for the city centre leg of their journey 31. To operate efficiently, Park and Ride
facilities must be provided at appropriate locations on rail networks to provide quick and comfortable
journeys that avoid areas of highway congestion.32
Current situation
5.8.2 Park and Ride sites can significantly increase the catchment area of a Metro station beyond the 800m
walking distance typically associated with local light rail networks, Nexus research shows that half of people
currently using a Metro Park and Ride site would have used their car for the whole journey, had the site not
been available.33 Overall 4% of Metro users arrive at the station by car with the average journey to and from
the Park and Ride sites where Nexus surveys have taken place being 11.4km.
5.8.3 38% of Metro Park and Ride users were commuters, particularly into Newcastle city centre where higher
parking charges and congestion can make Metro a more attractive journey than driving34; this is however a
lower rate than that seen elsewhere; for example Merseytravel found that 73% of their Park and Ride users
were commuters, with little change in occupancy of car parks after the morning peak35. For Metro, peak
occupancy is currently between 1000 and 1400 hours; this may be because of the relative ease of city centre
areas for peak-hour driving and parking compared to some other urban centres, although there is some
evidence that road-space reallocation along certain key corridors is starting to increase highway journey
times during peak travel times.
5.8.4 Occupancy at Metro Park and Ride sites varies, with some car parks such as at East Boldon regularly over
capacity, whilst others are under-used. In addition there is a variety of approaches to parking at different
stations: some are formal sites, owned and controlled by Nexus, where parking charges apply, whereas
others are less formal sites and a small number of sites are owned by other parties such as local authorities.
5.8.5 Research undertaken at Heworth and Four Lane Ends long-stay car parks to determine user profiles at these
stations. The table below shows journey purpose and Metro use at each site.
Indicator Heworth Four Lane Ends
Purpose: Work 25% 38%
Purpose: Shopping 18% 3%
Also use Metro 48% 13%
Regular use 35% 35% Table 11 - Journey Purpose of Park and Ride users
5.8.6 Heworth was primarily used as a commuter Park and Ride site with almost all users subsequently using
Metro whereas Four Lane Ends users were less likely to be using Metro, due to the facility being used as
overflow staff parking for drivers working at a major local employer. Analysis of user origin showed that
Heworth has a much larger catchment area, with a number of regular users from as far away as
30
ibid 31
ibid 32
ibid 33
Nexus, Park and Ride Market Research August 2012 34
ibid 35
Merseytravel Park and Ride Market Research 2007
63
Middlesbrough 34 miles away. Four Lane Ends however saw its furthest regular user living only 15 miles
away.
5.8.7 Ticketing and pricing of Park and Ride facilities are also important considerations that can influence levels of
use. Prices should be attractive enough to encourage commuters to break their journey and not drive into
city centres, whilst helping to support the costs of providing the facilities. Both users and non-users stated in
research that the need to pay twice, once for parking and then again for Metro, was inconvenient and there
was a strong feeling that the cost of parking should be integrated into a one-ticket price36.This will be
addressed as the functionality of smart ticketing increases.
5.8.8 Additional sites close to the A1 and A19 trunk roads would be likely to attract the support of the DfT and
Highways England. This suggests the potential for Park and Ride facilities to form a component of future
business cases for Metro extension corridors, however this would need to be accompanied by robust
forecasts of patronage, as past investment in such facilities has not been always been matched by predicted
levels of use at certain locations. Depending on the extent of enhancements to the local Metro and rail
networks, there may be scope for park and ride facilities to be considered at locations such as at
Washington, Follingsby, A1/Team Valley and A695 Scotswood Road, if can be shown that they strengthen
individual business cases.
5.8.9 Currently there is a mixed offering of Park and Ride at Metro stations, with different ownerships, charging
regimes and qualities of facilities. The aim will be to achieve greater consistency of offering at all sites,
including across the local rail network where there is the opportunity to do so, with simplified smart
ticketing covering both parking and travel payment, and enhanced levels of safety and security to achieve
Parkmark safety accreditation or similar. All sites will be equipped with correctly marked, adequately
provisioned disabled parking, drop-off points, electric vehicle charge points, and cycle parking.
5.8.10 New facilities will be developed along new corridors where justified, aligned to relieving pockets of
congestion on the highway network. These will be high quality facilities, which as well as allowing Park and
Ride will provide bus facilities where possible to assist with integration between modes. This should include
off-highway facilities, covered waiting areas and options for off-bus ticketing and located conveniently for
the entrance to the station. New Metro stations may also have park and ride potential.
5.9 Recommendations
5.9.1 Customer requirements are central to many aspects of this strategy. Failure to anticipate and respond to
customer needs and preferences risks losing ground in markets where choice exists. Keeping in close touch
with Metro and local rail customers, understanding their travel requirements and preferences and
continually reshaping the product offer at all levels is essential if the network is to grow in a competitive
marketplace. The Metro essential renewals programme will have a positive impact, and new trains and
stations are likely to improve customer perceptions further. Not all improvements for customers need to
involve major expenditure. Responsiveness, flexibility and attention to detail are all essential attributes for
maintaining and enhancing customer loyalty. Establishing contact with non-users and understanding their
needs is also important to be successful in increasing the proportion of people choosing to travel by public
transport.
5.9.2 High-level recommendations for customer requirements can be summarised as follows:
36
Future of Metro, Woodholmes Research 2012

64
Develop and maintain close contact with Metro and local rail users and non-users to establish a deep
understanding of customer requirements.
Focus on increasing service reliability and on the management of service disruption
Incorporate customer requirements into the design of new trains as far as practicable.
Ensure that fares and ticketing products are simple to understand and relate to users’ needs.
Continue to provide accurate and timely proactive and reactive service information in formats that
customers want, taking account of wider accessibility needs.
Create stations that are modern, safe and welcoming.
Promote Park and Ride facilities where feasible and justified by demand.
Develop a seamless Metro and local rail customer service that offers product and service consistency across
locations and providers.

65
Section 6: FUTURE OPERATING STRUCTURES
6.1 Context
6.1.1 Achievement of the objectives of this strategy will require major changes to the ways in which Metro and
local rail are specified and delivered, with the aim of operating a service which is unified and seamless as far
as the user is concerned, and which benefits from a single framework of strategy and oversight. The future
arrangement for Metro operations is likely to be built around the acquisition and deployment of a new fleet
of trains, to be operational in the early part of the 2020’s. This is likely to be a very different proposition to
the one in place today, in which the operator is responsible for delivering a wide range of operational and
customer-related activities.
6.1.2 The OJEU process to procure a new operator effective from 1 April 2019 would need to commence around
June 2017, by which time funding for the new fleet and on-going revenue support would need to be
confirmed. An outline business case for investment in a new train fleet has been produced and discussions
are under way with the government to identify funding options.
6.1.3 The current concession arrangement is proposed to end in March 2017. Nexus is developing an interim
arrangement to cover the period April 2017 to March 2019, which will involve Nexus managing the Metro
system directly. During the two year period of direct management, the Metro business will be re-shaped so
that it is ready for the introduction of new trains.
6.1.4 Local rail services in the North East are provided by a franchise operator, currently Arriva Rail North.
Through the process of devolution, this rail franchise (along with TransPennine Express) is jointly managed
through a formal partnership arrangement between the Department for Transport (DfT) and Rail North Ltd
(RNL). Rail North Ltd is a new body made up of 25 local transport authorities in the North of England,
including the NECA. It is expected that over the next seven years control over decision-making and financial
risk will progressively pass from the DfT to RNL through this arrangement.
6.1.5 A further devolutionary step has been agreed for the North East of England, which is that Arriva will create a
Business Unit dedicated to the area, and this will have a strong interface with a North East Rail Management
Unit (NERMU) representing the NECA, the Tees Valley, Cumbria and North Yorkshire. The purpose of this
arrangement is to have local accountability for operational performance, and to create a local focus for
further investment.
6.1.6 As part of the formation of Transport for the North as a statutory sub-regional transport body, it is proposed
to seek the full devolution of franchising powers from the Secretary of State to the North East Rail
Management Unit. This would allow the North East to take full control of its local rail services by direct
management of the franchise arrangement beyond 2025/26. This would allow local rail and Metro services
to work alongside each other, with a common set of passenger standards and ticketing arrangements. It
could also potentially see some routes transferred between Metro and local rail or vice versa, or wholly new
journey opportunities created. This would be particularly facilitated by the introduction of a new Metro fleet
that could operate in various different modes, including different electrification and signalling standards and
on non-electrified routes.
6.1.7 The challenges that accompany the delivery of this aim can be illustrated by outlining the current
operational frameworks for Metro and local rail, and the changes that will need to be made by 2025 if the
wider objectives of the strategy are to be realised.

66
Metro
Rolling stock owned outright by Nexus.
Operations (train services and customer service) undertaken by DB Regio Tyne and Wear under a
concession agreement until March 2017.
All other infrastructure owned and maintained by Nexus.
Local Rail
Northern rail franchise specified and overseen by DfT until franchise expiry in 2025/26.
Transpennine rail franchise specified and overseen by DFT; franchise expires in 2023/25.
Northern franchise operated by Arriva Rail North.
Transpennine franchise operated by FirstGroup plc.
Rolling stock owned by Rolling Stock Operating Companies (ROSCOs)
North East management unit (Tyne, Tees and Wear area) managed by Arriva, with oversight from
the developing North East Rail Management Unit (NERMU)37.
Changes by 2025
The following changes are anticipated between now and 2025:
From April 2017 to March 2019 Metro will be operated entirely in-house by Nexus, once the current
concession expires.
New Metro operating structures are to apply from April 2019, as a precondition of continued central
government investment.
A new Metro fleet will be in service.
Pacer trains will be withdrawn from the regional rail network
Additional Northern Connect regional express services will be overlain upon the current service
pattern
The NERMU will take on progressively greater oversight of the North East operations of the
Northern and Transpennine Rail franchises, with full devolution of the oversight and specification of
new, post-2025/26 services in the North East passing to NERMU.
6.1.8 The nature and scale of these changes to operating structures will be a catalyst for many of the aims and
objectives of this strategy to be achieved, with a new dual-voltage Metro fleet delivering greater operational
flexibility for instance, and a fully-devolved NERMU operating under the auspices of Rail North bringing the
planning of all local rail services under the control of the region for the first time. These will be essential
building blocks for service enhancements, alongside sound business cases and adequate network capacity.
6.2 New Metro operating structures
6.2.1 At present Nexus maintains ownership of all Metro assets. The maintenance and renewal of tracks and
stations is undertaken in-house, with the operation of Metro services outsourced via a concession
agreement to DB Regio Tyne & Wear until March 2017. The concession operates on the basis that Nexus
takes revenue risk, i.e. that it sets the fares and retains revenues, with the concessionaire responsible for the
operation of the service according to contractually agreed targets.
37
NERMU consists of representatives of NECA and Tees Valley Unlimited, plus North Yorkshire and Cumbria County Councils in respect of Whitby - Middlesbrough and Carlisle – Newcastle services respectively.
67
6.2.2 Work is now underway to define new operating structures for Metro post-2019, following the cessation of
the current operating concession, proposed for March 2017, and a bridging period of in-house operations.
Details of these as at present are as follows:
Issuance of a Prior Information Notice (PIN) for a contract for the future delivery of Metro
operations, in June 2016. The tendering for this contract will be subject to OJEU regulations and
will be dependent upon securing a long term funding commitment from DfT; the current revenue
grant funding arrangement expires in March 2019. The OJEU process to procure a new operator
effective from April 2019 will need to commence around June 2017, by which time funding for the
new fleet and ongoing revenue support would need to be confirmed. During the two-year period
of direct management, the Metro business will be re-shaped so that it is ready for the introduction
of new trains.
Identification of a preferred scenario for the introduction to service of a new fleet of trains within a
business case to be submitted to DfT for central government funding. Two options have been
examined that can be followed to deliver a new fleet of trains – direct procurement of new rolling
stock by Nexus, or a ‘build operate and maintain’ contract whereby a contract is issued to maintain
and operate the existing fleet, supply a new train fleet, manage the transition between the
operations of the old and new fleets, and maintain and operate the new fleet. Risks associated
with the latter option include restrictions on optimum concession length, the need for adequate
fall-back arrangements in the event of financial failure of the concessionaire, and the possibility of
Nexus having to underwrite the agreement beyond the duration of the contract.
6.2.3. An indicative timeline for these processes is:
Prior Information Notice Issued June 2016
Official Journal of the European Union (OJEU) notice issued by June 2017 – Pre Qualification
Pre-qualification questionnaire evaluation complete November 2017
Invitation to Tender Notice issued by January 2018
Tender Evaluation Commences April 2018
Contract Award December 2018
Contract Start April 2019
6.2.4 Other potential operating options for Metro that have been examined during the option selection process
include:
Franchising – under current legislation only the DfT can let rail operating franchises. Metro is not a train
operating company within the meaning of the Railways Act 1993, as a publicly-owned body corporate and
not a private organisation – although it is an ‘open access’ operator for the purposes of operations over
Network Rail infrastructure between Pelaw and South Hylton.
Operating Concession – this is the current arrangement applying until 2017 which involves more rigid terms
than a franchise and less commercial risk to the franchisee with an agreed payment structure in return for
tightly-specified service delivery. Elsewhere the Merseyrail concession is a similar example of an operating

68
concession let by a Passenger Transport Executive. Most UK light rail networks use some form of concession
arrangement, primarily as a means of accessing additional private sector investment to fund infrastructure
improvements and rolling stock. The main disadvantage of this option in the current environment of change
is that it does not make provision for the introduction of a new train fleet.
Combined Infrastructure and Operations Concession - this option is common in the light rail sector but is
unusual in heavy rail. It could be appropriate to revisit this option if, given the greater asset knowledge
which now exists, there are potential cost savings from this approach, however it would mark a radical
departure from the current operating frameworks, requiring major changes to the status of the existing
Nexus infrastructure function.
Separate Infrastructure and Operator Concessions - this model is used by UK networks such as Manchester
Metrolink where both the provision and maintenance of infrastructure and service delivery are the subject
of separate concession agreements, retaining the wheel/rail interface separation. The decision to proceed
on a separate infrastructure concession is in effect separate from the decision on the new concession and
would be subject to separate evaluation.
Integration with North East Rail Management Unit operations post-2025/26 - the parameters of the North
East rail franchise following the termination of the existing franchise have yet to be determined. Given the
extent of inter-working proposed between Metro and local rail operations there may be advantages to be
gained from closer integration of operating arrangements between the two networks. At this time however
it is premature to speculate how this might be delivered, given the length of time before this could be
implemented.
6.2.5 Concession arrangements currently in place on other UK light rail networks are summarised in the table
below. Networks such as Metrolink have introduced different concession arrangements relating to the
opening of subsequent network extensions and this is an option that could potentially apply to any Metro
extensions.
Network Concession Type Scope Duration Comments
Tyne and
Wear Metro -
Nexus
Revenue risk with
network owner
Operations,
train
maintenance
7 years expiring
2017
Operator DB Regio
Tyne & Wear
Sheffield
Supertram -
SYPTE
Revenue risk with
operator
Operations and
maintenance
17 years expiring
2024
Stagecoach plc.
Nottingham
Express Transit
Revenue risk with
operator (PPP)
Operations and
maintenance
23 years to 2034 Tramlink
Nottingham
Croydon
Tramlink
TfL contract (not a
concession), London
Tramlink operator
Operations and
maintenance
Not applicable London Tramlink is
a division of TfL
Midlands
Metro -
Centro
Revenue risk with
network owner
Centro
Operations and
maintenance
23 years to 2018 National Express
Midland Metro
Manchester DBFO risk-sharing Operations and Varies according M-Pact Thales

69
Metrolink -
TfGM
with RATP. M-Pact
Thales to construct
Phase 3b routes
maintenance to Phase
Docklands
Light Railway
Revenue-share.
(Lewisham different)
Operations and
maintenance
7/9 years to
2021/23.
Keolis Amey
Docklands
Table 12 - Operating Arrangements on UK Light Rail Networks
6.2.6 In many local rail concessions, revenue risk lies with the client or is shared with the concessionaire. The only
current example of the operator taking revenue risk on the heavy rail urban network is the Merseyrail
franchise where as part of the 2002 Concession Agreement, Merseyrail has responsibility for revenue risk for
journeys on Northern and Wirral Line rail services and as such has responsibility for setting fares on these
services. Transfer of revenue risk to an operator could reduce the ability of Nexus to maintain an overview of
the impact of pricing changes on the overall provision of transport within the area at odds with wider
transport or social policy objectives.
Concession Length
6.2.7 The average length of an operating concession at around 7-10 years represents a compromise between
being long enough to make it worth the concessionaire’s while in terms of investment and subsequent
returns, and short enough to take account of changing market circumstances. Where Build, Maintain and
Operate arrangements are in place the duration of concessions is often considerably longer to allow for an
adequate return on initial investment by the concessionaire. Legally, the maximum period over which a
concession can currently be let is 22 years. With the associated costs of a new Metro fleet likely to be
included within a future operating contract, the duration of such a contract will reflect this.
Other fleet vehicle procurement options
6.2.8 Other methods of fleet procurement include:
Outright purchase - Ownership of a fleet of new trains has advantages in terms of low on-going asset costs
and freedom to operate and maintain without any constraints imposed by third party contractual
arrangements. Upfront costs are an obvious disadvantage to this option, alongside the loss of procurement
experience and knowledge that may be offered by external contractors. It would also rule out a number of
combined framework options including build, operate and maintain arrangements which often offer greater
procurement flexibility and lower lifetime costs than would be available via the outright purchase route, plus
potentially greater economies of scale and a wider variety of funding and finance options which are available
to potential contractors.
Leasing outside of an operating contract - Leasing companies (known in the rail industry as ROSCOs) such as
Angel Trains, Porterbrook Leasing and Eversholt Rail Group are responsible for providing the vast majority of
trains used by British train operating companies, although other organisations may also be keen to enter the
market. Leasing would offer cash-flow advantages over outright purchase and procurement outside of an
operating contract would allow maintenance to be undertaken by specialist contractors. The main
disadvantage of this approach is that it would preclude the ability to achieve economies of scale offered by a
build, operate and maintain framework.
70
‘Bulk-buying’/joint ownership with other transport authorities – this option may be superficially attractive
however in practice the fleet replacement schedules of urban transport authorities tend not to be aligned,
and the bespoke nature of a new fleet required to operate on existing Metro infrastructure also effectively
rules it out.
6.3 Conclusions and Recommendations
6.3.1 Operational models for light rail networks are constantly evolving. Prior to the expiry of the current Metro
operating concession, Nexus will identify the solution that best delivers the key aims and objectives of this
strategy. This work is already well under way, and is being guided by key factors including:
customer requirements;
availability of finance;
build, operate and maintain options;
opportunities to achieve economies of scale, and
the flexibility to respond to changing circumstances such as network opportunities and technological
changes that dual-voltage Metro trains would introduce.
6.3.2. Discussions are taking place with the DfT to gauge expectations in terms of governance, value for money and
passenger benefits anticipated from future operating arrangements. Rail North and the North East Rail
Management Unit are also important partners in the process going forward, as decisions taken in respect of
the new Metro fleet will have significant impacts upon the specification and operation of a future fully
devolved, integrated regional rail network.
71
Section 7: METRO AND LOCAL RAIL NETWORK EXTENSIONS
7.1. Potential Extension Corridors
7.1.1 Our industrial heritage has left behind it a network of disused railways that thread across the region. Some
are former passenger lines, although many are freight routes connecting mines and factories to ports. As
new developments take place around them some could once again become important transport arteries,
helping to move people around the North East along unobstructed, uncongested route corridors. Most
disused routes remain free from intrusion along their path with many being maintained as footpaths and
cycleways, although in some cases new roads and buildings cross the alignments and would require business
case feasibility work to establish the costs of restoring a route versus the expected benefits.
7.1.2 Nexus believes that existing and disused local rail corridors can be combined with the Metro network to
create a single Metro and local rail network, at a lower cost than new-build railways. There are also a
number of areas where the existing Metro network can be upgraded to create a more effective service. This
can only happen if a strong blueprint is developed by the NECA and its partners, and used to co-ordinate
land use and transport planning actions by a wide range of players over the forthcoming years and decades:
economic and strategic plans for housing, business and industrial growth; investment decisions by Network
Rail, Nexus and local authorities; funding plans from the NECA, the national government, the NELEP, the EU,
and local businesses; and train service developments by Nexus, Rail North, Train Operating Companies and
Freight Operating Companies.
7.1.3 The following sections describe opportunities to grow the Metro and local rail system. Some of these are
relatively simple to introduce and could be achieved within five years if funding were to be made available.
Others will take many more years to plan and achieve because of their cost and complexity.
7.1.4 Almost since the opening of Metro in the 1980s, there have been aspirations to extend the network to
increase the proportion of the population who have easy access to the system. This was reflected in
subsequent Metro extensions to the Airport and from Pelaw to South Hylton, both of which were achieved
using the original 90-strong fleet. Further network extensions have regularly been considered, particularly to
areas where there is clear evidence of demand, but which are some distance away from existing stations.
7.1.5 In response to these requests, various studies have been commissioned which by and large have
recommended the investigation of street-running services, either as extensions of the current network by
building discrete on-street routes or mini-networks. The main disadvantages to this approach are threefold –
the disproportionately greater cost of establishing on-street operations, the disruption caused to existing
road users during the construction phase, and the detachment of such routes from the remainder of the
network. Although not abandoning the principle of street running altogether over short distances under
clearly defined circumstances, the thrust of this strategy has now moved towards a closer examination of
how the same goal described above can be met through other, more cost-effective means.
7.1.6 The combination of new train technology and changes in how regional railways will be planned and
delivered through rail devolution will allow the Metro and local rail network to integrate and expand. The
region contains a legacy of disused rail corridors, curves, junctions and spurs, and some freight-only lines.
These could allow the expansion of the local passenger rail network, linked to the Metro network in places,
at a fraction of the cost of new-build railway or tram lines. In some cases, Metro extensions identified in the
former draft Metro Strategy could be delivered using this approach. It also gives rise to new options, not
previously considered, including to parts of the area that are currently a long way from the Metro system.

72
7.1.7 The upshot of these changes is that it allows the Metro network, the local rail network and the trains that
operate on them to be considered as a single local rail system when developing plans for the future, subject
to making proper provision for other services such as inter-city and freight. The following pages describe
opportunities to grow the Metro and local rail system. Some of these are relatively simple to introduce and
could be achieved in the short to medium-term, if funding were to be made available – others will take many
more years to plan due to their cost and complexity.
7.1.8 Following NECA approval, work will start immediately to assess the feasibility of these options, funded
through the DfT’s Local Major Schemes process, and to create the plans necessary for them to be funded
and built. The results of an updated demand model for Metro and local rail will inform this process.
7.1.9 The graphic below shows a possible future Metro and local rail network, and shows the relationship
between the Metro, local and long-distance rail networks. At this stage the map is indicative and for
illustrative purposes only and other routes may be considered.
Figure 15 - Indicative Future Metro and Local Rail Network (note: not all stations shown for clarity)
73
7.2 Routes to the Airport
7.2.1 Newcastle International Airport is a hugely important strategic transport asset for our area, and quality,
sustainable transport links to it are integral to our area’s future economic success, as is the expansion of its
catchment area. The airport currently hosts over 3,200 jobs on site and around 7,800 in the wider region38,
with around 4,100 and 10,000 jobs respectively predicted by 2021. By 2030 more than 8 million passenger
trips per year are forecast, with an estimated regional impact of £1.3 billion per year. The 2013 mode share
for Metro at the airport was 18% which compares to 54% by car and 23% by taxi, indicating the potential for
further gains in response to better services.
7.2.2 The existing Metro service provides a fast, frequent and direct link to Newcastle and Sunderland city centres.
Many of the other opportunities described below could provide new rail links to serve the Airport – for
example to Washington and Belmont in Durham, and to South Tyneside. In these situations the capacity of
the Metro network through the underground sections in Gateshead and Newcastle and the regularity of
service patterns will be important considerations in determining future service patterns.
7.2.3 Three further opportunities are worthy of exploration:
expanding the ‘depot avoiding line’ behind the current Metro depot in South Gosforth, so that direct
services could be provided between the Airport and North Tyneside, and potentially to South East
Northumberland;
reinstating a disused curve east of Benton Metro to connect the west-facing Metro line to the
southbound ECML, and onward access to the mainline rail network. The frequency of any service
accessing the ECML would be dependent upon the availability of paths along the route to and from
Newcastle station, which are expected to be sought after by Intercity and potentially Ashington,
Blyth and Tyne line services,
considering whether the current airport line could be extended to serve Ponteland.
7.3 The ‘Leamside line’
7.3.1 The disused Leamside alignment is important for a number of the NECA’s ambitions for rail-based
connectivity. The current alignment runs from Pelaw Junction to Ferryhill in County Durham, and passes
through several locations that currently lack rail services; in particular, Washington. Another disused
alignment, running west from the current Metro terminus at South Hylton, joins the Leamside alignment just
south of the River Wear at Penshaw. Acting together, these two alignments offer the potential to provide:
• A ‘Wearside loop’ Metro-style service connecting Sunderland and Washington (described below);
• Local rail links between Durham (Belmont), Sunderland, South Shields and Newcastle (described
below);
• Along with an upgraded Durham Coast line, additional capacity for passenger and freight services to
relieve pressure on the ECML; and
• In the longer term, a potential route for a high speed rail link from the North East to Yorkshire and
beyond.
7.3.2 The Leamside alignment remains in Network Rail’s ownership and is relatively free from obstructive
development, although much of its condition is not currently known to any great degree and there has been 38
Newcastle Airport Masterplan 2013.

74
some adjacent development since it closed to rail traffic in 1991, since when it has been the subject of much
discussion as to its future use. As part of the national rail network, at least in terms of ownership, wider
planning considerations may come into play. Nexus and NECA through their involvement with Rail North and
Transport for the North will continue to monitor any such developments, whilst continuing to develop
proposals for regional rail and Metro services where appropriate.
7.4 South East Northumberland
7.4.1 Restoring passenger train services to the Blyth, Bedlington and Ashington areas is an agreed priority for the
NECA because of its potential to regenerate the area it serves by connecting people to a wide range of jobs,
services and training. Northumberland County Council is currently leading a project with Network Rail to
examine re-opening the route for passenger traffic by 2020.
7.4.2 The project would upgrade an existing freight-only route which begins in Woodhorn (with an option to
extend north to Newbiggin-by-the-Sea) and then passes through Ashington, Bedlington, Bebside, Newsham
(for Blyth), Seaton Delaval and Seghill, before arriving at Northumberland Park where an interchange station
would enable easy access to the Metro system and local bus services; park and ride facilities already exist
there. The route then joins the ECML seven kilometres north of Newcastle city centre.
7.4.3 The line is a mixture of single and double-track and is not electrified, but over the longer term Nexus believes
that it should be double-tracked and electrified to the Network Rail standard of 25kv AC, as well as there
being a physical link to the Metro network constructed in the Northumberland Park area.
7.4.4 This would allow the route to be served by dual-voltage Metro trains and link onto the Metro system, in
addition to the initial offering of conventional rail services to Newcastle Central station – and possibly
further, for example to the Metrocentre and Hexham. It would also increase freight capacity and offer
efficient diversionary routes via Choppington or Butterwell to the East Coast Main Line.
7.4.5 The project currently has Network Rail GRIP239 status and is progressing through the five-stage pre-
construction governance process which is taking place in parallel with the wider Metro and local rail changes
outlined elsewhere in the strategy. As the project progresses towards delivery the future options for
integration with Metro will be kept under review.
7.5 Cobalt Corridor
7.5.1 The Cobalt and Silverlink areas are major growth engines of the North Tyneside economy, housing around
20,000 jobs, but they are poorly located in relation to rail-based links. Despite being located between the
northern and southern loops of the Metro in North Tyneside, they are not particularly close to Metro
stations and have therefore been served by bus services to date, some of which connect with Metro at
Northumberland Park and Percy Main. Substantial further jobs growth is expected as Cobalt is built out and
fully occupied. Further residential development is also committed in the Northumberland Park area. This
potential network extension would therefore offer the prospect of achieving substantial economic benefits
by linking an existing and growing area of major employment.
39
Governance for Railway Investment Projects – the Network Rail management and control process for delivering projects on the operational railway.
75
7.5.2 An opportunity exists to deliver Metro services through the centre of these employment areas through the
re-use of an old freight alignment formerly used to transport coal to the Tyne. By linking to the existing
Metro route east of Northumberland Park Metro and to the west of Percy Main through services to Cobalt
and Silverlink could be introduced, and also potentially from the Ashington, Blyth and Tyne corridor. A new
route through the Cobalt area would also facilitate new service patterns such as an ‘inner Metro loop’
connecting the Wallsend, Cobalt and Four Lane Ends areas. The route also serves further employment
locations in the south of the corridor at Tyne Tunnel Trading Estate and West Chirton Industrial Estate.
7.5.3 A provisional study of a possible route suggests that a number of level crossings would be required, and as
elsewhere the route would be subject to extensive further engineering and financial feasibility, however it
would ensure that this major area of jobs growth is served by Metro in its own right, as well as offering
possibilities for new patterns of service operations in the North Tyneside area.
7.6 Sunderland Re-electrification
7.6.1 A key part of the Metro system provides services in the Sunderland area, using track and infrastructure
owned and operated by Network Rail. This section was converted to Metro and the South Hylton extension
opened in 2002, and is electrified using Metro’s 1500v DC overhead power standard; the stations are
managed by Metro (except Sunderland itself). All other aspects of the section, including signalling and
operating standards, are in line with normal Network Rail practices. Nexus operates Metro services under a
track access agreement with Network Rail, valid until 2032.
7.6.2 Nexus and the NECA believe that the best long-term approach is to convert the electrification of this line to
the Network Rail standard of 25kv AC. This should make it easier and more cost effective for Network Rail to
maintain and manage, and would have wider benefits by enabling the Durham Coast line (including the
section from the south side of the High Level Bridge in Gateshead to Pelaw Junction) to be electrified in the
longer term; at present, the 1500V dc wiring from Sunderland station northwards is an impediment to the
electrification of the whole Durham Coast route that would provide better inter-city and regional services, as
well as becoming a valuable main line diversion at times when the route through Durham is closed.
7.6.3 Electrification south from Sunderland, through Ryhope and Seaham towards the Horden/Peterlee area
would allow these centres of population and business to be served by a Metro-style service appropriate to
levels of demand and required destinations. It could also facilitate better connectivity through long-distance
links from cities and towns along the Durham Coast line to other parts of the North.
7.6.4 The nature and timing of any changes to Network Rail assets are not known. The electrification equipment is
now 15 years old and unlikely to be life-expired, and future decisions may be governed by national as well as
local transport priorities. A new Metro fleet will therefore require dual voltage specification, so that it is able
to operate under both existing and future electrification equipment through the Sunderland area.
7.7 South Tyneside Track Dualling
7.7.1 Despite operating at very high frequency throughout the day, the Metro system currently includes lengthy
sections of single track at the core of its operation between Bede and Pelaw stations. These limit the
timetable that can be offered to and from South Shields, severely hamper service recovery when disruption
occurs, and limit growth – for example, new stations sought after by local stakeholders in the Jarrow and
76
Hebburn areas cannot be placed on the single-track sections, because the route is running at almost full
capacity with no way of accommodating the longer journey times that additional station calls would create.
7.7.2 In the past a variety of possible engineering solutions have been considered in response to this problem,
including shared use of the adjacent single-track Network Rail freight line that connects the Jarrow oil
terminal with the rest of the national rail network. Ownership of the oil terminal has recently changed hands
and freight trains now use the route once more, following a period during which the line was disused. Nexus
believes that it should be possible to convert the freight-only line to become part of the Metro system,
although account will need to be taken of future freight traffic requirements.
7.7.3 Removal of the single-track sections will ensure that this area of South Tyneside receives better Metro
connectivity with the rest of the region, which is important in the context of ensuring the economic
regeneration of the borough and enabling a wider range of services in the future. Nexus is currently
exploring sources of finance to enable this work to proceed as a priority, subject to a positive business case
and clarity as to freight requirements.
7.8 New Routes to and from South Tyneside
7.8.1 South Tyneside is already well served by the Metro network in terms of links towards Gateshead, Newcastle
and beyond, but direct links between the borough and the south of the area by rail are absent. The South
Shields and Sunderland Metro routes are within 3km of each other in the Tyne Dock and Brockley Whins
area. Running between them is a single-track freight branch serving Port of Tyne from Boldon East and West
Junctions, east of Brockley Whins Metro. There is therefore the potential to use this existing alignment so
that Metro services could be provided between these locations.
7.8.2 In the Tyne Dock area, a connection with the present Metro route could be achieved on existing railway land.
The continuation of freight traffic along the route to and from Port of Tyne as well as Metro would be
achieved through twin-tracking. At Boldon East Junction, the Network Rail line towards Sunderland could be
used, whilst the Boldon West Junction opens up the possibility of direct journeys between South Shields and
the new International Advanced Manufacturing Park (IAMP), Washington and Durham Belmont, through the
construction of a new spur heading west of Fellgate Metro, as described below. Existing and planned
employment opportunities in the area include Sunderland Software City, Port of Tyne, and the regeneration
of South Shields town centre.
7.8.3 Whilst another potential alignment exists in the area – the former West Harton mineral line between South
Shields and the Tilesheds area of Boldon – re-use of this route would require another junction with the
Sunderland line in close proximity to the existing Boldon East and West junctions. For this reason, and the
currently operational status of the Network Rail Port of Tyne route, it is considered that the Brockley Whins
option is preferable, especially as it offers potential Metro service options to both the Sunderland and
Washington areas from South Tyneside.
7.9 New routes in the Sunderland area
Sunderland ‘Circular’
7.9.1 The need to link the Washington area to the Metro and local rail network has been evident since the early
days of Metro operation, given its population and the need for better public transport links with Sunderland
city centre in particular. Various options including re-use of the Leamside rail corridor and street-running

77
trams have been considered in the past, but none have gained the necessary momentum towards delivery.
However in the context of the strategic development of disused alignments and connecting spurs and
curves, there is now the potential to deliver a circular Metro-style service covering Sunderland and
Washington.
7.9.2 The existing route from the South Hylton Metro terminus could be extended westwards towards Penshaw
using the railway formerly linking Sunderland with Durham, and then connecting with the Leamside corridor
via a new curve heading northwards over the River Wear and through Washington towards Wardley. In the
Wardley area a new spur would be built towards the east, joining up with the existing Network Rail line west
of Fellgate Metro then heading back towards Sunderland via East Boldon. Similar new connections are
feasible with the South Shields and Newcastle Metro routes east of Pelaw.
7.9.3 In the Washington area, preliminary survey work indicates the potential to serve the Galleries area of the
town centre, and/or the area to the west of the new 5,000-jobs+ IAMP within the A19 Ultra Low Carbon
Enterprise Zone, and also the area close to the Nissan car plant. It is acknowledged that the proximity of the
Leamside corridor to the IAMP is not ideal. The designation of the site adjacent to the A19 trunk road results
in the potential Metro corridor being situated some way to the west, with the need for a connecting bus link
from the Sulgrave area at the former Usworth level crossing. Once more details of the proposed layout of
the IAMP are available, Nexus will examine the potential for alternative Metro provision to and from this key
area of future employment.
7.9.4 Because of the possibility of changes to the electrification of the existing Pelaw to Sunderland/South Hylton
Network rail routes, any planned new routes in the Sunderland area should be assumed to be electrified at
25kV AC; this would also align with any national rail proposals to re-open and electrify the Leamside route as
a through route capable of accommodating main-line services. There could also be the potential to connect
Sunderland with the ECML via South Hylton and Fencehouses.
7.9.5 There will be a number of major engineering issues to address before this option can be finalised, including
the crossing of the A19 trunk road west of South Hylton, and the adequacy of the Victoria Viaduct over the
Wear to handle anticipated traffic levels. Nevertheless the majority of the proposed route, including possible
routes through Washington town centre, is relatively free of physical obstacles.
7.9.6 This service pattern could open up a large number of new journey opportunities across the Sunderland and
South Tyneside areas and beyond and would create a second Metro corridor connecting Wearside with
Tyneside, also delivering additional network capacity and operational flexibilities.
Sunderland City Centre to Doxford Park
7.9.7 Consideration of a route between Sunderland city centre and Doxford Park suggests it may be possible to
provide rail connections between the two by the use of the former Hetton Colliery railway which used to
transport coal to the banks of the River Wear and which latterly has been preserved as a footpath and
cycleway.
7.9.8 Doxford Park is an established Sunderland suburb, and is also home to the city’s biggest business park,
Doxford International, a 51 ha site that provides 8,000 jobs. The area surrounding the site experiences peak-
time traffic congestion which impacts upon the adjacent A19 trunk road. Bringing Metro-style services to the
Doxford area would offer an attractive alternative to car use.
7.9.9 Most of the route between Doxford and the city centre is free from development, however structures
beneath or over Durham Road and Premier Road would need to be constructed, as well as a spur connecting
with the existing Metro network west of University. This proposal requires further feasibility work, but it

78
offers potential of bringing rail services to Doxford International and to areas of south Sunderland that are
not currently served by Metro.
Sunderland South Estates
7.9.10 A swathe of land between Doxford Park, Tunstall and Ryhope has been identified as being suitable for large-
scale housing development. This is referred to as the South Sunderland Growth Area. Other than the
historical Hetton Colliery Railway which has been identified as being potentially suitable for a Metro
extension to Doxford, as referred to above, the only other former railway alignment in this area was the
Silksworth Colliery Railway between Silksworth and Ryhope which has subsequently been built over for some
of its length and incorporated elsewhere into a golf course.
7.9.11 House-building is expected to begin shortly in the Chapelgarth area, with development taking place in phases
towards Ryhope. Options to serve this growth area as part of this strategy include a Park and Ride site with
connecting bus links as part of a new Ryhope Interchange on the Durham Coast line towards Seaham
described at section 7.6.3 above, with connecting bus links. Nexus will also investigate any potential
opportunities to provide Metro network coverage along this development corridor, within the constraints
described above.
Sunderland North Estates
7.9.12 A large area of the city to the north of the River Wear is located some distance from the existing Metro
network. Communities such as Witherwack, Hylton Castle, Downhill and parts of Castletown developed
between the 1930s and 1970s and have since been served by buses other than by a tram route as far west as
Southwick which was removed in 1954. There were fewer colliery lines in this area than south of the Wear,
and the only former railways in the area, the LNER Hylton, Southwick & Monkwearmouth railway and a
branch over the Queen Alexandra Bridge towards Millfield have since been largely built over by the A1231
Wessington Way and the A1290 Kier Hardie Way.
7.9.13 This makes the identification of a possible new Metro alignment in the area particularly challenging,
however the sizeable population of the North Estates requires that further work into potential options be
undertaken, with a view to assessing whether network extensions into this area are feasible. Nexus will
undertake this work as part of the wider examination of Metro network enhancements.
7.10 Durham Belmont to Sunderland/South Shields/Newcastle
7.10.1 Using some of the routes described in section 7.8 above, the former Leamside line could be used to
introduce direct local links between Durham Belmont, Fencehouses and Penshaw, with options to link to
South Hylton and Sunderland city centre; or to the Washington, International Advanced Manufacturing Park,
Pelaw and South Shields areas. There may also be other former alignments in the area that are potentially
suitable.
7.10.2 Durham County Council’s existing Park and Ride site at the A1/A690 junction at Durham Belmont is ideal for
bus interchange and bus and rail-based Park and Ride, with a catchment area including the eastern side of
Durham City and also a wide area of east and central County Durham. Fencehouses and Penshaw along the
route are areas of substantial new housing construction and would also benefit from new local transport
links that avoid the need to use the congested A1 and A19 trunk roads.
7.10.3 Work undertaken for the IAMP development suggests a high level of demand from County Durham residents
for links to jobs in this area, and this route option opens up a number of new commuting possibilities along a
79
corridor under-served by existing public transport. Much of the north of County Durham is within easy
commuting distance of Tyne and Wear, and the existence of this corridor makes the creation of local rail
links with the Sunderland and South Tyneside areas a realistic possibility.
7.10.4 The development of route and service options along this corridor will be aided by the evolving capabilities of
the NERMU and Rail North to work closely with the NECA and Nexus to understand all of the options for the
future use of the Leamside corridor and their inter-dependencies and any potential conflicts.
7.11 Team Valley and A1 Gateshead Park and Ride
7.11.1 An opportunity exists to leverage existing Network Rail infrastructure to provide direct train services to and
from the Team Valley area. This would require the reinstatement of the short ‘Bensham curve’, disused rail
alignment connecting two existing rail corridors in the Gateshead area to enable rail access down an existing
freight-only line to the east side of Team Valley, then running parallel to the East Coast Main Line (ECML)
without conflict with Intercity services. This new route could also provide another freight route between Port
of Tyne and the ECML.
7.11.2 The Team Valley area is one of the largest employment sites in the NECA area with 20,000+ jobs but is
affected by increasing highway congestion along the A1 trunk road corridor. The proposed route would serve
the eastern side of the Team Valley area and continues south towards Lamesley where proximity to both the
ECML and the A1 offers the potential of a parkway-style interchange, “A1 Park & Ride” with a large parking
capacity accessed almost directly from the trunk road. This could offer strategic benefits for the relief of
trunk road congestion - the A1 in the Team Valley area is one of the worst congestion hotspots in the
country, although an improvement scheme has recently been completed by Highways England, it is not
considered likely that any further capacity enhancements will be possible. Heading south from Lamesley
there is potentially space adjacent to and west of the ECML to allow local rail services to continue towards
Birtley and Chester-le-Street area where new housing development is planned. Local environmental impacts
and the impacts of ECML improvements to increase line capacity will need to be taken into account.
7.11.3 This option could be further developed by greater use of the section of line running parallel to the south
bank of the Tyne through Gateshead. This line offers a southbound route from Newcastle using the High
Level Bridge over the Tyne, feeding onto the Tyne Valley Line with minimal conflict with the ECML. It could
also facilitate the development of a railway station in central Gateshead, and offer through services between
Sunderland, South Tyneside, Gateshead, Metrocentre and Team Valley.
7.11.4 The use of the line running alongside the ECML should not come at the expense of increased capacity and
resilience of the ECML itself. The ECML is of the highest strategic importance to the economic aims of the
NECA, and it already struggles to meet the demands currently placed upon it. The NECA will continue to
work with Transport for the North, Network Rail and the government to make the case for major investment
in the line’s capacity and resilience for carrying long-distance passenger and freight traffic.
7.12 West Newcastle
7.12.1 The inner west of Newcastle upon Tyne is one of the most densely populated areas of Tyne and Wear, but
has yet to gain from the benefits of Metro services in spite of its close proximity to the existing network.
When the original network was designed, provision was made at St James for future westward extensions
80
underground. Recent construction developments in the St James area with deep foundations mean that the
potential to tunnel further westwards is greatly reduced, and would be prohibitively expensive in any case.
7.12.2 However with a future integrated rail and Metro network, and dual-voltage trains, options exist to use the
original Carlisle line out of Newcastle Central station to the north of the Metro Radio Arena, then at the
Newcastle Business Park via a new alignment north of the A695 Scotswood Road. This would provide direct
links into the national rail network, and Metro services could also be linked to the Metro Centre via a new
bridge across the Tyne around 2km east of Scotswood Bridge, providing new journey opportunities between
west Newcastle and this major retail and leisure destination.
7.13 Metro to Metrocentre
7.13.1 The Metrocentre is a major leisure, retail and employment site, as well as acting as a public transport hub for
Western Gateshead. Further development in the Metrocentre area is likely to increase future levels of
transport demand. A number of sites east, north and west of the Metrocentre are included within the
Metrogreen Strategic Growth Area which forms a component of the NewcastleGateshead One Core Strategy.
Gateshead Council is currently preparing an Area Action Plan to facilitate the regeneration of and investment
in vacant and underused brownfield land around the Metrocentre. The Plan will look at how public transport
can be fully exploited to minimise the impact of additional traffic and congestion generated by new
development and improve access to the surrounding area and beyond. Additionally, existing and future
pressures on the A1 trunk road corridor may highlight a requirement for more sustainable transport
alternatives which Metro and local rail can fulfil.
7.13.2 The existing Northern rail service provides frequent links to Newcastle and Hexham, and hourly to
Sunderland. Several of the network extension opportunities described above could provide new through
local rail links to serve Metrocentre – for example, to and South East Northumberland in addition to existing
services to and from Morpeth. The preferred solutions for Metro to serve the Metrocentre are based upon
existing use of the Tyne Valley line via Dunston, or via a new Tyne crossing as described in section 7.11
above.
7.13.3 Two further new route options may be worthy of more detailed consideration - using the line through
Gateshead to access Heworth, South Tyneside and Sunderland directly, avoiding the congested Newcastle
Central Station; and using an existing freight spur between Bensham and the Team Valley area to connect to
the route to the proposed new A1 Park and Ride site described above.
7.14 Local Rail Network Improvements
7.14.1 The draft North East Rail Network Study (NERNS), referred to in Section 2 above, sets out a number of
service enhancements required by forecast demand, as well as the capacity and network improvements
expected to be required to accommodate them. The outputs of the finalised report and the proposals within
this study will be mutually informative in order to assess what physical changes – from platform lengthening
to new route construction – may be required to achieve the Metro Futures vision.
7.14.2 The draft NERN study identifies that most medium-term demand flows for the period to 2023 can be met by
more frequent local rail services, or longer trains, or a combination of both. Routes which fall into these
categories include those that will benefit from the additional Northern Connect limited-stop services
connecting Carlisle, Hexham, Metrocentre, Newcastle and Teesside, also the Tyne Valley and Durham Coast
81
services that are not Northern Connect services. Stations along the ECML between Berwick-upon-Tweed and
Durham are likely to be mostly served by long-distance express and semi-fast services as at present, with
Chester-le-Street, Cramlington and Morpeth requiring a more intensive local service.
7.14.3 In the period to 2023 the NERN study assumes a requirement for network enhancements as follows:
Ashington, Blyth and Tyne corridor upgraded for passenger services
Newcastle to Sunderland re-electrified at 25kV ac40
Improved route capacity at Darlington to accommodate Bishop Auckland services
Tyne Valley platform lengthening as required
7.14.4 Beyond 2023, the draft study has identified a number of major and minor capacity constraints on the
regional network that will require a variety of interventions. These are indicative at this stage and will be
examined further as the study and its successors are developed further:
Sunderland to Newcastle – headway improvements through signalling improvements
Improved route capacity at Darlington to accommodate Bishop Auckland services
7.14.5 The indicative Metro and local network shown as Figure 15 above will bring its own challenges and
opportunities. The plans do not directly impinge upon the ECML, and with advances in signalling technology
anticipated during the coming decades, there is every likelihood of being able to achieve greater capacity
across the network. One area of potential concern is that of station capacity, particularly at Newcastle and
Sunderland stations where there is currently little or no surplus platform capacity to accommodate increased
service levels.
7.15 Network Integration Opportunities
7.15.1 The planned expansion of the Metro and local rail network will deliver improved connectivity in itself, but
the effect of this will be magnified by growth in interchange with private cars (through both park and ride
and passenger drop-off points), taxis, bicycles (through high quality cycle storage), walking (through safe
walking routes), buses, and longer-distance rail services. Therefore interchange points will be designed into
expanded Metro and local rail routes wherever possible, offering a wide range of onward travel
opportunities.
7.15.2 The Metro system has always maintained the highest accessibility standards for disabled people and people
with reduced mobility, and this will continue to be the case as the new fleet is specified and new stations
constructed. In addition the acquisition of a new fleet offers an opportunity to explore whether the carriage
of bicycles and mobility scooters can be achieved. The Metro system already benefits from a smart ticketing
system through use of the Pop card, and wherever possible this will be expanded onto other modes of travel
in particular local rail and bus services. In the longer term, Nexus expects to develop contactless payment on
public transport, and by working with Transport for the North, ‘account-based ticketing’ will be able to offer
an integrated travel payment system that joins up transport across the North of England.
7.15.3 The following integration opportunities have been identified at this stage relating to the network extension
opportunities that are discussed above.
Ryhope Park & Ride - linked to the extension of Metro-style services south of Sunderland.
40
Also dependent upon the withdrawal date of the existing Metro train fleet.

82
A19 Doxford Park, Park and Ride – there may be opportunities adjacent to a Metro terminus to attract A19
users.
Washington, Sulgrave area – interchange for local bus links for IAMP and Nissan employees.
Follingsby Park and Ride – depending upon route selection there may be scope for a combined Metro/local
rail and bus park and ride facility at the northern end of the Leamside corridor.
Metrocentre Interchange – further development of the existing Intu-owned public transport interchange to
accommodate improved local rail/Metro links.
A1 Lamesley Park and Ride – served by a new Team Valley extension and to support the Eighton Lodge
facility in removing city centre traffic at a site close to the A1.
Northumberland Park – improvement of existing facilities reflecting the opportunity to develop the
Ashington Blyth and Tyne and Cobalt corridors.
7.15.4 Effective integration should also go beyond the above and also include provision for electric car users, car
club users, cyclists and pedestrians, with the emphasis on ensuring that all of the real and perceived barriers
to integration are removed or reduced as far as possible.
7.15.5 There is already limited provision for the carriage of cycles on the local Northern trains network, with up to
two carried free of charge at any time without reservations on a first come, first served basis. An increase on
this capacity in the future would be a positive move towards facilitating more multi-modal journeys.
7.16 Conclusions and Recommendations
7.16.1 The opportunities outlined in this chapter are those considered at this stage to have potential for future
development, based upon anticipated demand, land-use changes and the availability of disused alignments
and freight routes that could realistically be brought back into use.
7.16.2 The identified corridors represent exciting opportunities to extend the reach of Metro and local rail into
areas not currently served, or with limited journey opportunities. They will however be subjected to rigorous
business case analysis with further detailed technical work to assess their financial and operational viability.
7.16.3 Any extensions to the existing network will require extensive consultation and stakeholder engagement
involving the NECA, the LEP, local planning authorities and Rail North. The relationship with the regional
land-use planning process will be particularly important in helping to define future Metro and local rail
requirements linked to strategic developments, and in ensuring that transport corridors are reserved as
required.
7.16.4 Recommendations are:
• To undertake further technical feasibility work with key stakeholders in respect of those additional Metro
and local rail corridors that appear to have the best prospects in terms of demand, deliverability and
financing.
Collect and assess the economic evidence in order to develop and prioritise business cases for new routes.

83
• Ensure that these corridors are incorporated as appropriate into long-term transport plans and economic
plans.
• Monitor these corridors for forthcoming developments that could be a catalyst for implementation.
NECA and its partners to take cognisance of current and expected future requirements of rail freight when
planning the technologies and the network capacity required to deliver changes to the provision of Metro
and local rail services.
84
Section 8: FUNDING ARRANGEMENTS
8.1 Context
8.1.1 Identifying and securing adequate funding is essential to the delivery of this strategy. Renewal of the Metro
fleet and the funding of the next phase of asset renewals will be major developments for the NECA and for
Nexus. Given the extent of public funding – over £350m – that is already being invested in the ongoing
renewals programme, it is vital that further funding is sourced to guarantee the long-term future security
and growth of Metro, and to ensure that both fleet and infrastructure are fit for purpose to meet customer
demands and to facilitate closer integration with the local rail network.
8.1.2 Metro is a vital public service which will cost £95.0m to operate in 2016/17. Whilst almost half of Metro’s
total operating costs are covered by fare income, it places heavy reliance on a sizeable amount of public
subsidy in the form of revenue grant from central government and the NECA (£24.7m and £4.2m
respectively in 2016/17). In addition, capital investment in Metro has traditionally been funded from capital
grants, meaning that £21.7m of depreciation chargeable to Metro operations in 2016/17 is also financed
from central government. Looking ahead, it will be important to secure an on-going long-term commitment
to a continuation of this level of public subsidy, and discussions are underway to understand the
government’s position.
8.1.3 Phase 2 of Metro Reinvigoration has provided a step change in investment in essential renewals through the
Asset Renewal Programme since 2010; 90% of the current level of capital investment is provided in the form
of capital grant from the government, with a 10% local contribution sourced from a combination of ‘IT Block’
grant and reserves held by the NECA on Nexus’ behalf. As planning starts for the renewals programme for
2021/22 onwards, discussions are also taking place with the government about future funding arrangements
for this important work.
8.1.4 Investment in a new fleet will be significant as described above. The current fleet is almost fully depreciated
and to the extent that it is not, depreciation costs are fully funded; therefore unless the acquisition of a new
fleet can be funded in its entirety from capital grant, any future financing costs will represent a new, on-
going cost that is not currently a feature of Metro’s operational budget. It is therefore anticipated that,
subject to a suitable business case, the government will make a significant contribution towards the
acquisition of a new fleet. Lower operating costs will be sought through lower energy usage and more
efficient fleet utilisation, which together with additional fare revenue associated with a more reliable
service, may provide some flexibility for a local contribution.
8.1.5 The cost of expanding the Metro system will also be significant. Although the options identified in this
strategy aim to explore the opportunity of using existing assets wherever possible, nevertheless the capital
construction costs of any new railway lines are likely to run in the hundreds of millions of pounds, and new
operating costs will be added to existing levels of expenditure. To achieve expansion of the system,
investment decisions by Network Rail, Nexus and local authorities will need to be aligned and a clear
demand identified for each addition to the network.
8.1.6 As part of the work to develop feasibility, Nexus will develop funding options looking at a wide variety of
local, national and international sources of finance for both capital investment and associated operational
costs. These could potentially include developer contributions, planning gain, and investment from private
sector partners.

85
8.2 Potential funding sources
8.2.1 Other UK light rail networks have used a variety of funding sources to achieve fleet renewals and system
extensions. No decisions have yet been taken as to which, if any, of these options Nexus will pursue in order
to achieve the key objectives of the strategy. A distinction also needs to be made between grants and loans,
with the latter imposing potentially significant downstream costs upon the network unless revenues increase
by a greater margin.
8.2.2 In other conurbations extensions to existing networks are more likely to be funded through a portfolio of
funding consisting of grants and/or loans from a variety of sources depending on individual circumstances,
including such as the following:
Central government funding.
‘Planning gain’ and developer contributions.
Borrowing against future fares revenue, where there is demonstrable demand evidenced by a sound
business case.
EU funding for specific objectives, such as through the European Regional Development Fund
programme.
Regional funding streams, such as the Single Growth Fund.
European Investment Bank loan finance.
Commercial sponsorship opportunities.
Local government funding.
8.2.3 For the duration of the existing Northern franchise, local rail services will be funded by the Department for
Transport, with the scale of overall subsidy support decreasing sharply over the lifetime of the franchise
from £275m per year in 2016/17 to £73m in 2024/25. With the full devolution of North East rail services
beckoning from 2025/26 onwards, it will be important to ensure that its funding is sufficient to support the
delivery of strategic objectives related to a single Metro and local rail network.
8.2.4 A more detailed assessment of potential funding options set out in Appendix 2.
8.3 Conclusions and Recommendations
8.3.1 Nexus will actively investigate all options for the future financing of Metro that offer the best combination of
security, flexibility and value for public money.
8.3.2 NECA and Nexus will work closely with the NERMU, Rail North and the DfT to obtain the highest possible
levels of funding to help deliver a high quality integrated local rail network.
86
Section 9: SUMMARY OF RECOMMENDATIONS
Current and Future Demand
Monitor existing and predicted future demand for Metro and local rail closely.
Monitor regional and national economic and planning trends.
Maximise demand through the delivery of reliable services that meet customer requirements.
Liaise closely with the Local Economic Partnership to ensure the optimum locations of development
proposed within the Strategic Economic Plan and district local plans. Liaise with district planning authorities
to ensure that the principles and detailed design of developments are planned so as to maximise
accessibility, with accessibility targets to Metro and local rail services applying to large developments.
Work with local authorities on the introduction of new stations on the existing network where these are
justified by demand, sought by local communities and are operationally feasible.
Metro Fleet Renewal
Replacement of the life-expired existing Metro fleet with new trains which can deliver improved customer
benefits, increased operational flexibility and operating cost savings.
Development of a technical specification to achieve Metro fleet renewal.
Development of a robust business case to secure funding for a new Metro fleet.
Metro Power Supplies
Nexus retains 1500V DC operation for its own on-track network.
Dual-voltage 1500V DC / 25kV AC capability is included within the new Metro fleet specification.
The new Metro fleet should meet national rail network crash-worthiness standards.
The energy-efficiency benefits of regenerative braking should be considered in detail in the design of both
new vehicles and renewed substations.
Nexus and Network Rail should liaise closely in terms of plans for future electrification in the North East
region.
Metro Depot Facilities
Establishment of options and outline costings to refurbish the existing Gosforth Depot to provide long-term
sustainability of operations.
Estimate the costs of a brand new main depot.
Identify a policy position about alternative sites for a new main depot, or additional out-stabling facilities.
Signalling and Control
Research into the optimum signalling and control protocols for Metro should continue as part of the new
train fleet business case specification, ensuring that the chosen solution is safe, value for money, flexible,
and not incompatible with similar control systems as may be introduced in the future by Network Rail.

87
Energy Supply, Efficiency and Renewables
Continue to identify and implement cost-effective energy-saving opportunities on Metro’s existing network
and infrastructure
Undertake more work be carried out on the opportunities for renewable energy generation
Given its long-term criticality to Metro operation, develop a formal Energy Strategy
Essential Renewals post-2021
It is recommended that work continues to full business case status on the continuation of the Metro
essential renewals programme post-2021.
Customer Requirements
Develop and maintain close contact with Metro and local rail users and non-users to establish a deep
understanding of customer requirements.
Focus on increasing service reliability and on the management of service disruption
Incorporate customer requirements into the design of new trains as far as practicable.
Ensure that fares and ticketing products are simple to understand and relate to users’ needs.
Continue to provide accurate and timely proactive and reactive service information in formats that
customers want, taking account of wider accessibility needs.
Create stations that are modern, safe and welcoming.
Promote Park and Ride facilities where feasible and justified by demand.
Develop a seamless Metro and local rail customer service that offers product and service consistency across
locations and providers.
Concession
Nexus will identify the solution that best delivers the key aims and objectives of this strategy taking account of
the following key factors:
customer requirements;
availability of finance;
build, operate and maintain options;
opportunities to achieve economies of scale, and
flexibility to respond to changing circumstances such as network opportunities and technological changes
that dual-voltage Metro trains would introduce.
Network Extension Corridors
Undertake further technical feasibility work with key stakeholders in respect of those corridors Metro and
local rail corridors that appear to have the best prospects in terms of demand, deliverability and financing.

88
Ensure that these corridors are incorporated as appropriate into long-term transport plans and economic
plans.
Monitor these corridors for forthcoming developments that could be a catalyst for implementation.
NECA and its partners to take cognisance of current and expected future requirements of rail freight when
planning the technologies and the network capacity required to deliver changes to the provision of Metro
and local rail services.
Finance
Nexus will actively investigate all options for the future financing of Metro that offer the best combination of
security, flexibility and value for public money.
NECA and Nexus will work closely with the NERMU, Rail North and the DfT to obtain the highest possible
levels of funding to help deliver a high quality integrated local rail network.
89
Appendix 1: CASE STUDIES OF OTHER UK URBAN RAIL NETWORKS
A1.1 Manchester Metrolink
A1.1.1 Manchester Metrolink is a light rail network which serves an increasing proportion of the Transport for
Greater Manchester (TfGM) area including central Manchester, Altrincham, Bury, Oldham, Eccles, Rochdale
and Manchester International Airport. It is an example of a network built in response to a need identified
during the 1980s for a more integrated and efficient network of public transport due to the poor north-south
connections across Manchester city centre. Due to the vagaries of 19th century railway development, two
almost independent networks came into being north and south of the city centre. At the time the Tyne and
Wear Metro was being built, serious consideration was given to a ‘Picc-Vic Tunnel’ connecting the two
Manchester railway hubs, however nothing was progressed and it was not until a decade later that firm
plans were made for a surface-level network, part street-running, partly on former suburban rail routes that
would plug the accessibility gaps existing between areas of the Greater Manchester conurbation. In this
respect there are similarities with the Tyne and Wear Metro; although Metrolink has no deep-level tunnels
and Metro does not operate on-street, both use high-floor trains resulting from their legacy of former British
Rail routes.
A1.1.2 The first phase opened in 1992 at a cost of £154 million connecting Bury with Altrincham via the streets of
central Manchester. It has since grown organically and is now a major urban light rail network with 92 stops,
running through 8 out of 10 boroughs of Greater Manchester. The network operates on a mixture of
designated light railway alignments (segregated from other traffic) and as an on-street tramway (shared with
pedestrians and vehicles). All trams are monitored by CCTV, as well as there being an emergency call point
on both trams and platforms. Like Nexus Metro the network is unstaffed apart from train drivers, but is
regularly patrolled by a dedicated Metrolink police unit.
A1.1.3 Transport for Greater Manchester (TfGM) owns the network, and RATP Dev UK Ltd operates and maintains
the Metrolink network under a 10-year contract with TfGM which runs until July 2017. The network operates
approximately 19 hours per day. Extensions to the network throughout the past five years included to
MediaCityUK and Chorlton in 2011, with the most recent extensions to East Didsbury, Ashton-under-Lyne
and Manchester International Airport opening during 2013 - 2014. The second city crossing via Deansgate
was approved in 2013 and is now under construction, relieving the bottleneck caused by all routes funnelling
into the existing Piccadilly route. Once the current expansion programme is due to be completed, Greater
Manchester will have one of the largest light rail networks in the UK, with forecasts of 45 million passengers
per year comparable with those for Nexus Metro. Annual passenger journeys in 2014/15 were 31.2 million.
A1.1.4 Network details
Number of trains 120 (by 2017)
Power supply 750V DC with overhead line equipment
Maximum speed 80 km/h
Tram capacity 206 per train (52-60 seated)
Gauge 1435mm
Park and Ride At 12 sites across the network
Operating Mode Driver operated, with line-of-sight signalling (GoA0)

90
Depots Trafford Park and Queens Road
Figure 16 - Manchester Metrolink Bombardier M5000 tram
Figure 17- Manchester Metrolink Network 2016
91
A1.2 London Tramlink
A1.2.1 London Tramlink is a light rail network in south London operated by London Tramlink, an arm of Transport
for London (TfL). It serves seven National Rail stations en route and one interchange with the London
Underground. Tramlink runs on a mixture of on-street tracks shared with other traffic, dedicated tracks on
public roads and off street tracks consisting of new alignments, former railway lines and one section of
alignment (but not track) shared with a third-rail electrified Network Rail line.
A1.2.2 Traffic began to create serious traffic congestion problems in Croydon area during the 1980s and to help
counteract these effects the Croydon Tramlink Act received Royal Assent in 1994 and Tramlink Croydon
Limited (TCL) was awarded a 99-year lease to design, finance, build and operate the network. The total
project cost around £200 million of which around £125 million was government-funded. In 2008 TfL reached
an agreement to buy the Tramlink concession for £98 million and TfL now owns and operates the network
outright.
A1.2.3 The network comprises four routes with an overall track length of 28km. There are 39 stations in total which
are unstaffed with automated ticket machines. All stops are fully accessible and include CCTV and a
passenger help point.
A1.2.4 Annual passenger journeys in 2014/15 were 32.3 million. All TfL ticket products are valid on Tramlink. Cash
fares and pay as you go Oyster card fares are available as on London buses, although special fares may apply
when using Tramlink feeder buses.
A1.2.5 Tramlink operates at speeds up to 80 km/h on the “line of sight” principle. Signalling is only provided to
regulate the movement of trams at junctions and at single line sections. All street running signalling is
controlled by the highway traffic signal controllers provided by London Streets. Off street signalling follows
highway principles and is managed by LT’s Engineering team.
A1.2.6 The Mayor’s Transport Strategy for London includes possible extensions to the Tramlink network which
could be developed at relatively modest cost. An initial review of potential Tramlink extensions has been
prepared and as a result TfL has expressed a wish to carry out initial development on evaluation work on six
routes.
A1.2.7 Network details
Number of trains 34 (24 Flexity Swift CR4000 & 10 Variobahn)
Power 750 V DC overhead line supply
Maximum Speed 80 km/h
Capacity 200 (72 seats in newest trams)
Gauge 1435 mm
Park and Ride No
Operating Mode Driver operated (GoA0)
Depots Therapia Lane depot

92
Figure 18 Stadler Variobahn tram, Croydon Tramlink
Figure 19 - Croydon Tramlink Network

93
A1.3 Nottingham Express Transit
A1.3.1 Nottingham Express Transit is a light rail network which runs on a mixture of on-street running and reserved
track. The network is 32km long and currently serves 50 stations within the City of Nottingham area.
A1.3.2 Construction of the scheme lasted 16 years from inception to implementation, opening in 2004 at a cost of
£200 million. The building of the network was influenced by high population density, and complex road
network due to Trent river crossings and road congestion. A special purpose company consortium, Arrow
Light Ltd, was created to design, build, fund, operate and maintain NET Line 1.
A1.3.3 Nottingham Express Transit is day-to-day funded through the proceeds of the Nottingham Workplace
Parking Levy, which is also the main source of funding for network extensions. Further details of the
principles and practicalities of the levy are covered in section 2 of the strategy.
A1.3.4 Annual patronage is currently 8.1 million. Tickets were formerly sold on-board by conductors, but since 2014
they have been replaced with a combination of station based ‘ambassadors’, platform ticket machines and
electronic ticketing.
A1.3.5 A recent development of the network comprised a two-line extension serving the southern and western
suburbs of Nottingham. The two lines created an additional 17.4km of track with 28 new stops at a total cost
of £570 million. The expansion of Park and Ride policy continues with 2500 new spaces divided between the
Chilwell and Clifton terminals.
A1.3.6 Network details
Number of trains 15 Incento AT6/5
22 Citadis 302
Power 750V DC overhead line supply
Maximum speed 70-80 km/h
Capacity 191-202 (58-62 seated)
Park and Ride 7 sites with over 5000 spaces
Operating mode Driver operated (GoA0)
Depots One
Figure 20 - NET Tram in Nottingham city centre

94
A1.4 Docklands Light Railway
A1.4.1 Docklands Light Railway (DLR) is an automated network which opened in 1987 at an initial cost of £77 million
to serve the Docklands area of east London. DLR emerged as to serve the need for cost effective public
transport to the former Thames docks to stimulate a major programme of regeneration.
A1.4.2 The initial network comprised two routes but due to the Docklands area developing more quickly than
anticipated, trams were extended to 2-car units and the network expanded into the heart of the City of
London. There have been additional extensions to the network including to Woolwich Arsenal, Lewisham,
London City Airport, and a line from Canning Town to Stratford.
A1.4.3 Although the majority of the stations are elevated, from the outset the network has been fully accessible.
The stations have high platforms, level with the tram floors. Due to the trams being automated (GoA3), a
Passenger Service Agent (PSA) is on board every tram and is responsible for patrolling the train, checking
tickets, making announcements and controlling the doors. They can also take control of the train if there is
equipment failure or in an emergency.
A1.4.4 The network is 40km long with 45 stations. There are seven main routes, although two routes only operate
at certain times of day. Average frequencies of the services are between 6-8 minutes. Passenger journeys
for 2014/15 were 110.2 million per annum, up 8.5% compared to the previous year. The network is part of
the TfL London ticketing network, which includes Oyster pay as you go. There are no ticket barriers at DLR
stations; correct ticketing is enforced by PSAs.
A1.4.5 Following a successful six-month trial, DLR now allows cyclists to take their bikes on the network outside of
peak hours on Mondays to Fridays and without restrictions at weekends and on bank holidays.
A1.4.6 A future potential extension is from Gallions Reach via Barking to Dagenham Dock, designed to include the
provision of five new stations designed to ensure integration with re-development of the area.
A1.4.7 Network details
Number of cars 149 (2 or 3 cars per train)
Power 750V DC
Maximum speed 80 km/h
Capacity Total capacity per car of 284 (70 seating)
Gauge 1435mm
Park and Ride None
Operating mode Automated with driver-controlled option (GoA3)
Depots 2

95
Figure 21 - DLR train on segregated track
Figure 22 - Docklands Light Railway network

96
A1.5 Glasgow Subway
A1.5.1 The Glasgow Subway, known locally as the ‘Clockwork Orange’ has some similarities with Metro in terms of
its role in carrying large number of people short distances in inner-city areas; in other respects it is a unique
network.
A1.5.2 The Subway has non-standard 1219mm-gauge tracks, and comprises twin tunnels on a 10.6 km circular route
north and south of the River Clyde serving inner-city areas of Glasgow. Each circuit takes 24 minutes to
complete and at peak times 4-minute headways apply. Smart ticketing technology was in place prior to the
2014 Commonwealth Games. It is owned and operated by the Strathclyde Partnership for Transport (SPT)
with approximately 12.5 million journeys made on the network each year. The route is fully underground.
Flat fares are used with one fare for each of single, return, day and season tickets regardless of distance
travelled.
A1.5.3 The Scottish Government will majority-fund a £300 million revamp of the Subway which will see the
replacement of 37 year-old rolling stock. A £200 million contract has been awarded to Stadler Bussnang
AG/Ansaldo STS Consortium to supply new trains, signalling and equipment. Due to the unique dimensions
of the subway, the 17 new trains will be the same size as the existing stock. However the trains will be four-
car sets as opposed to the current three-car sets. This contract is envisaged to deliver the move from
partially automatic trains to Unmanned Train Operation (GoA4) using a Communications-Based Train Control
(CBTC) network; as the Subway is 100% underground and completely segregated this should be fairly
straightforward to implement. Subway trains currently use Automatic Train Operation (GoA2) technology.
A1.5.4 Network details
Number of cars 33 (3 cars per train)
Power 600V DC
Maximum speed 80 km/h
Capacity Total capacity per car of 284 (70 seating)
Gauge 1219m
Park and Ride 4
Operating mode Automated, driver starts train (GoA2)
Depots 1

97
Figure 23 -Glasgow Subway route map Figure 24 - Current rolling stock

98
A1.6 Merseyrail
A1.6.1 Merseyrail differs from the other UK case studies as it is not a light rail network; however its future direction
and the similarities of the Merseyside and Tyne and Wear conurbations make it a useful comparator. The
network uses conventional heavy rail rolling stock and operating technology, with track infrastructure owned
and operated by Network Rail and trains leased by the train operating company Serco - Abellio.
A1.6.2 The Merseyrail franchise is awarded by the Merseyside Passenger Transport Executive rather than the DfT.
This situation exists because its tracks are self-contained and separates from the rest of the railway network.
As a result of this isolation, the franchise-holder has explored the potential for vertical integration - where
responsibility for maintenance of the track is transferred from Network Rail to Merseyrail, however for the
time being the Integrated Transport Authority has decided against changes to the established framework.
A1.6.3 The Merseyrail franchise covers a 25-year period from 2003. Because the franchise is locally specified and
managed, it has a different focus and delivery framework to that of larger rail franchises. The rolling stock
used on Merseyrail will need to be replaced shortly as it dates from the 1970s. New stock will have the
option of dual voltage capability so it can be used on both the existing 750V DC third rail and the national
standard 25kV AC overhead electrification system. The network is fairly unique in nature, which increases
the need for a bespoke fleet of trains. Potential tram train links to the existing network to allow for on-street
operation are also being examined.
A1.6.4 Supporters of longer franchise agreements cite developments such as M to Go, a combination of ticket
offices and retail stores at several locations across the Merseyrail network. The concession-style structure of
Merseyrail means that the franchisee does not take revenue risk, but receives an agreed management fee.
However, there are incentives to grow revenue, with profit-share between Merseytravel and Merseyrail
above an agreed threshold. So far Merseytravel has re-invested all such profits in the public transport
network, such as the refurbishment to Liverpool Central.
Figure 25 - Merseyrail network Figure 26 - Merseyrail Class 507 train
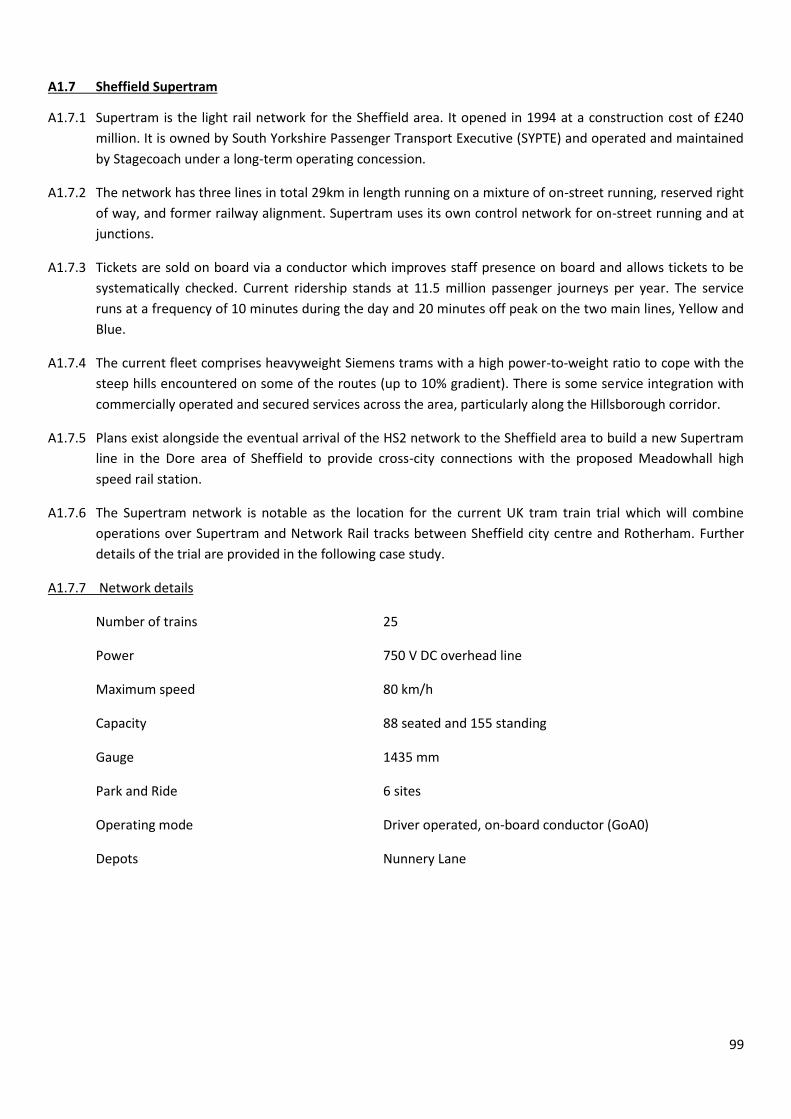
99
A1.7 Sheffield Supertram
A1.7.1 Supertram is the light rail network for the Sheffield area. It opened in 1994 at a construction cost of £240
million. It is owned by South Yorkshire Passenger Transport Executive (SYPTE) and operated and maintained
by Stagecoach under a long-term operating concession.
A1.7.2 The network has three lines in total 29km in length running on a mixture of on-street running, reserved right
of way, and former railway alignment. Supertram uses its own control network for on-street running and at
junctions.
A1.7.3 Tickets are sold on board via a conductor which improves staff presence on board and allows tickets to be
systematically checked. Current ridership stands at 11.5 million passenger journeys per year. The service
runs at a frequency of 10 minutes during the day and 20 minutes off peak on the two main lines, Yellow and
Blue.
A1.7.4 The current fleet comprises heavyweight Siemens trams with a high power-to-weight ratio to cope with the
steep hills encountered on some of the routes (up to 10% gradient). There is some service integration with
commercially operated and secured services across the area, particularly along the Hillsborough corridor.
A1.7.5 Plans exist alongside the eventual arrival of the HS2 network to the Sheffield area to build a new Supertram
line in the Dore area of Sheffield to provide cross-city connections with the proposed Meadowhall high
speed rail station.
A1.7.6 The Supertram network is notable as the location for the current UK tram train trial which will combine
operations over Supertram and Network Rail tracks between Sheffield city centre and Rotherham. Further
details of the trial are provided in the following case study.
A1.7.7 Network details
Number of trains 25
Power 750 V DC overhead line
Maximum speed 80 km/h
Capacity 88 seated and 155 standing
Gauge 1435 mm
Park and Ride 6 sites
Operating mode Driver operated, on-board conductor (GoA0)
Depots Nunnery Lane
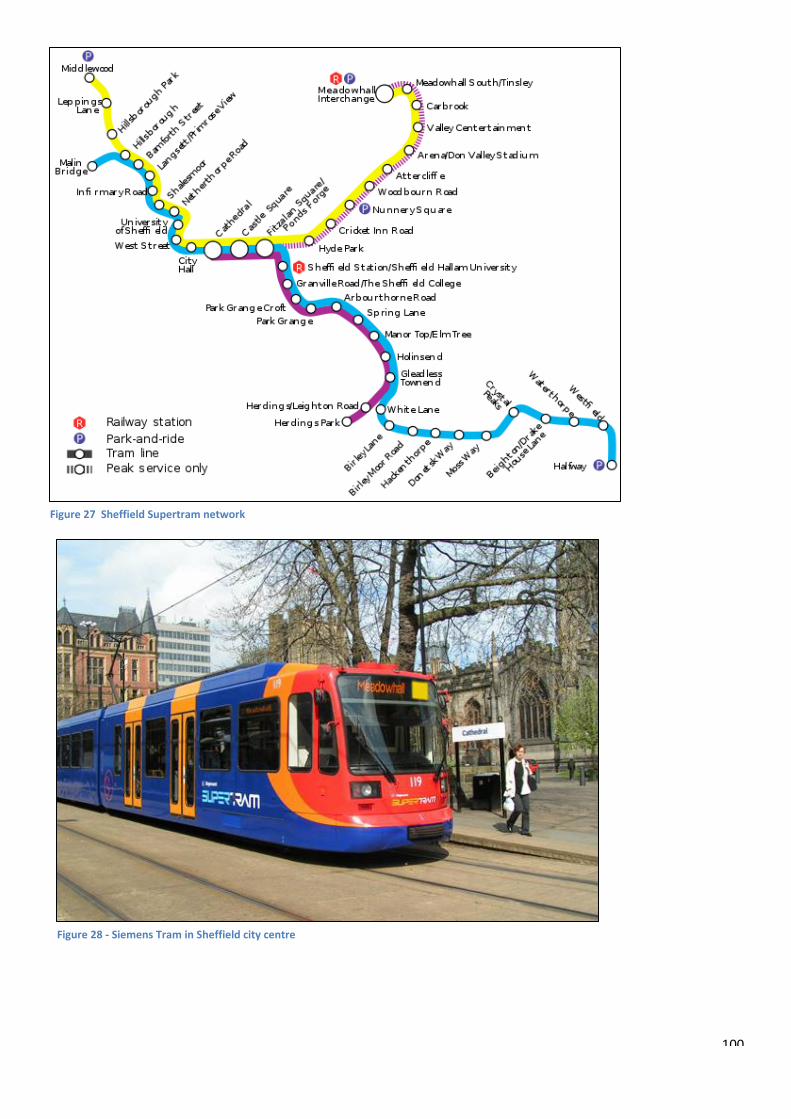
100
Figure 27 Sheffield Supertram network
Figure 28 - Siemens Tram in Sheffield city centre
101
A1.8 Sheffield Tram-Train Trial
A1.8.1 The tram train project is projected to cost £58m, funded around two thirds via DfT grant and one third
through Network Rail financing upgrades to its infrastructure. The strategic justification for tram train on this
corridor is mainly the potential for regeneration of the corridor. Seven new vehicles are being procured from
Vossloh: three for the existing Supertram operation, three for the tram train operation, and one spare;
nevertheless all of the new vehicles capable of tram-train operation. The pilot, the first of its kind in the UK,
will link the existing light rail Supertram network with the heavy national rail network between Rotherham
and Meadowhall shopping centre. The trial is expected to begin in 2018 at the earliest and is running
substantially behind its original schedule.
A1.8.2 A programme of infrastructure schemes and improvements will be delivered in preparation of the service
starting, including electrification of the rail line from Meadowhall South to Rotherham Parkgate as well as
new track and stations. New tram train vehicles are being manufactured by Vossloh in Spain.
A1.8.3 The proposed Tram Train service will be fully integrated with the existing Supertram service. The new
vehicles have been designed to run on both the Supertram network and the national rail network and are
therefore capable of negotiating the steep hills they will encounter on the Supertram network. Tickets will
also be fully integrated with Supertram.
A1.8.4 Not only will the new service provide better links to Rotherham and Rotherham Parkgate but it will enhance
capacity on the existing network by providing extra journeys between Sheffield City Centre and Meadowhall
South. It is claimed that the project will create up to 35 jobs as well as having wider economic benefits by
reinvigorating the local economy by making access easier to major local employment sites.
A1.8.5 The potential significance for Metro and local rail in the North East is that the trial if successful could pave
the way for the more widespread operational integration of light rail vehicles operations on the Network Rail
network, once the required technical and operational protocols have been worked through.
A1.8.5 Network details
Number of trains 7
Power 25kV overhead line
750 V DC overhead line
Maximum speed 100 km/h
Capacity 88 seated and 150 standing
Gauge 1435 mm
Operating mode Driver operated, on-board conductor (GoA0)
Depots Nunnery Lane

102
Figure 29 - Vossloh tram train vehicle
Figure 30 - Future Supertram network showing tram train extension to Rotherham

103
Appendix 2: POTENTIAL FUNDING SOURCES
A.2.1. EU Funding
A2.1.1 Funding streams such as the European Regional Development Fund (ERDF) and the European Social Fund
(ESF) are usually supplementary sources of funding are awarded on a competitive basis and not therefore
guaranteed. In addition, the size, scope and eligibility of ERDF programmes vary over time.
A2.1.2 ERDF is the main vehicle by which the EU delivers its regional policy aiming to address the level of regional
imbalances across the member states. As the EU has increased in size, so the focus of ERDF assistance has
moved towards poorer and more peripheral nations than the UK. Nonetheless, the fund is still responsible
for providing aid to regions to improve their level of economic competitiveness. The indicative allocations of
ERDF and ESF for the period 2014-2020 have been announced, with €6.2 billion allocated to England, of
which €539.6 million is allocated to the North Eastern LEP area. This is a significant sum however these funds
represent the primary source of European funding across the entire LEP area for innovation, business, skills
and employment so there will be competition for these resources.
A2.1.3 ERDF support would most likely comprise only a minor element of any total funding package and would be
dependent on the applicability of the programme and the availability of funding at a future point in time.
Greater Manchester PTE secured 7.5% of the cost of phases 1 and 2 of Metrolink during the 1990s, and
Nottingham Tram secured €4.2 million or 1.5% of the cost of the original network in 2004 from ERDF.
A.2.2 Central Government Funding
A2.2.1 Construction of the original Metro network during the 1970s was almost entirely funded by government
direct grant. Where fleet replacement and essential renewals are sought the government may expect to see
local contributions contributing towards the overall financing package. In terms of any network extensions
these will be considered on their own merits; and from the evidence of such proposals elsewhere are less
likely to receive majority government funding.
A2.2.2 However central government funding is likely to comprise the largest single element of financial support for
the next phase of Metro renewals and expansion. Where this support may differ from that offered in the
past is in the conditions attached to its use; for instance, a requirement to institute a defined operating
practices in return for guarantees of future funding.
A2.2.3 Metro’s dual role of fostering economic development and meeting social needs together with Tyne and
Wear’s relatively low density of population and level of GVA productivity combine to suggest that the
network will not meet its total fixed and operating costs through revenue over the medium term, although
long-term demand forecasts are more encouraging.41 In this environment, central government support will
still be vital. In order to establish a convincing business case to government to take forward for detailed
consideration and a favourable outcome it will be essential to demonstrate the following:
Sound value for money with a positive BCR.
Detailed analysis of operational models to ensure best practice.
Compliance with national economic, social and environmental policy goals.
Evidence of private sector and business sector engagement and support.
Optimal energy efficiency and CO2 emissions reductions
Alignment where appropriate with developments on the national rail network.
A track record of consistent success in major programme delivery.
41
Metro Demand Study MVA 2012.

104
A2.3 Regional Government Funding
A2.3.1 The emerging framework of regional governance offers great potential for the wider Metro network
extension proposals to be planned and funded at a level that will improve city region-scale transport
networks and meet the aspirations of adjacent areas of County Durham and Northumberland for improved
transport links to and from Tyne and Wear. However, unless higher funding levels accompany final
devolution arrangements, regional funding is unlikely to meet the bulk of the aspirations of this strategy.
A2.3.2 The Single Growth Fund is potentially a positive opportunity for local contributions towards Metro funding
however Metro would be in a competitive funding situation at a regional level. A clear vision of the benefits
of Metro will be needed to ensure that the network features highly in the frame of major infrastructure
investment decisions.
A2.4 Local Government Funding
A2.4.1 Local government is operating under constrained financial circumstances which are likely to continue over
the medium-term. Despite this there may be opportunities to benefit from wider government initiatives
targeted at economic regeneration in which Metro will be able to play an integral part. A present day
example is the Greater Manchester City Deal which commits to funding an extension of Metrolink to
Trafford Park as part of a programme of infrastructure investments that enhances city region-scale GVA, and
light rail and tram train enhancements also feature in the City Deal plans of Nottingham and Sheffield
respectively.
A2.5 Revenue Hypothecation of Local Taxes
A2.5.1 Nottingham Express Transit directly benefits from a regular income stream, reaped from the proceeds of the
city-wide Workplace Parking Levy (WPL). An estimated £322m over a 14-year period will be directly invested
in transport improvements, principally the Phase 2 extensions of the tram network towards Clifton and
Chilwell. This is set down as a requirement in the legal order accompanying the levy42.
A2.5.2 No other UK local authority has yet followed Nottingham’s lead with respect to workplace parking levies;
given that the population of Tyne and Wear is greater than that of the Greater Nottingham urban area there
could be potential for the introduction of such a measure in the long term; however in the meantime this
should not be relied upon as a means of financing the future of Metro and local rail in the region.
A2.5.3 Hypothecation of revenue from car travel towards other modes of transport, including public transport, has
been present in central London since the introduction of the Congestion Charge in 2003. Currently at £11.50
per day (£10.50 with Auto Pay) with several exemptions, the Charge produced net income of £172.5m in
2014/1543. Of this income a substantial proportion is spent on the maintenance and improvement of the
Tube. A2.6.5 As with a workplace parking levy, a congestion charge is unlikely to be introduced in the
NECA area for the foreseeable future and therefore should not be considered as a potential funding stream.
A2.6 Local Tax Increment Financing
A2.6.1 Tax Increment Financing (TIF) is a public financing method that is used to fund redevelopment,
infrastructure, and other community-improvement projects. The provisions for this are contained within the
Local Government Finance Act 2012.44 TIF works by allowing local authorities to borrow money for
42
The City of Nottingham Workplace Parking Levy Order 2008 43
TfL Annual Report and Statement of Accounts. TFL and Mayor of London 2015. 44
Tax Increment Financing. Commons Library Standard Note 2013
105
infrastructure projects against the anticipated increase in business rates income expected as a result of the
said infrastructure project. The UK TIF model is based on reinvesting a proportion of future business rates
from an area back into infrastructure and related development. It applies where the sources of funding
available for a scheme to deliver economic growth and renewal cannot cover the cost of infrastructure
required by the scheme. The upfront funding may be borrowed from public or private sources, or it may be
provided by the developer from capital available to it. Previously local councils had been unable to retain
business rates revenues, so had been unable to borrow against them.
A2.6.2 If successful, TIF can lead to increased regeneration and long-term benefits. However key to the success of
any TIF initiative is the ability to predict that a long-term increase in the income accruing from business rates
will result from the introduction of the infrastructure. To achieve this in the case of Metro it would be
necessary to demonstrate how network extensions will unlock development potential, increase economic
activity and enhance the benefits of agglomeration. Were councils to confirm through their Local
Development Frameworks that all future developments should be prioritised along Metro corridors, this
could help with the reliability of predictions for TIF.
A2.6.3 As legislation stands Nexus is not able to raise TIF funding itself; that power rests with rate-levying
authorities, so any allocation towards the Metro network would be by agreement with those areas which
would benefit from extensions.
A2.6.4 TIF and City Deals have similar structures. The ‘earn back’ arrangement that Manchester City Council secured
through its City Deal will allow the council to invest in transport infrastructure with the benefit of a long
term, ring-fenced income stream.
A2.7 Prudential Borrowing
A2.7.1 The Local Government Act 2003 allowed local authorities to borrow to invest in capital works and assets so
long as the cost of that borrowing was affordable and in line with principles set out in a professional
Prudential Code45. Most debt of this type is long term and 74% of this is secured from the Public Works Loan
Board46, a statutory body operating within the UK Debt Management Office, an Executive Agency of HM
Treasury. Fixed rate long-term loans are typically currently available at around 3% for a 20-year period
allowing long-term financial planning to take place on this basis subject to reasonable certainty of a future
income stream to allow repayment. About 66% of local authorities availed themselves of powers to finance
capital expenditure through self-financed borrowing in 2010-11.
Earn Back – the Greater Manchester model
A2.7.2 The Earn Back model applying in Manchester builds on the GM Transport Fund established in 2009 following
an unsuccessful referendum on an area-wide congestion charge that would have provided an income stream
for transport improvements. Investment is prioritised on the basis of net GVA impacts at the Greater
Manchester level; and most of the £1.2bn programme finance is being provided locally through Prudential
Borrowing against revenues and a levy on the local authorities, pro-rated to population.
A2.7.3 The Earn Back Model uses a formula, linked to changes in rateable values over time at the conurbation level,
to provide a revenue stream to Greater Manchester over 30 years if additional GVA is created relative to a
baseline. Earn Back provides an additional incentive for local authorities to prioritise local government
spending to maximise GVA growth. If successful in driving economic growth, under Earn Back Manchester
will receive a larger proportion of resultant tax take generated from this growth than would otherwise be
45
The Prudential Code for Capital Finance in Local Authorities (Summary) CIPFA 2011. 46
Local Government Financial Statistics England No.22 2012. DCLG/ONS.

106
the case under business rate retention. The ‘earned back’ resources are used for further investment,
similarly prioritised on net GVA impact at an area level, in theory creating a genuine ‘virtuous circle’ which
rewards local authorities for delivering growth.
A2.7.4 The Greater Manchester area benefits from this framework because it has the following attributes:
i. A large local investment fund – GM is pooling resources to generate a £1.2bn local investment fund,
which is big enough to drive above average growth.
ii. The right economic geography – Earn Back will operate across the functional economic area to
reduce displacement locally.
iii. Track record of GVA prioritisation – Greater Manchester has demonstrated the ability to prioritise
investment decisions based on impact on GVA through its Transport Fund.
iv. Strong governance across the economic area.
A2.7.5 Although economic conditions are less favourable in the NECA area, funding arrangements of this type could
be applicable for the funding of network extensions.
A2.8 Local Authority Bonds
A2.8.1 Due to increases in the repayment rates applied by the Public Works Loan Board in relation to gilts47 a
number of local authorities have acquired credit ratings to enable themselves to issue bonds on the capital
markets. Some authorities are considering pooling their resources in this initiative to achieve economies of
scale in expertise, procurement and legal matters, as well as critical mass. An advantage of this method is
that local authority bonds are not classed as public sector borrowing, so they can be used to match-fund
European grant programmes.
A2.8.2 The longer term success of the concept would depend upon the extent to which the proposal can continue
to undercut the level of interest rates offered by the Public Works Loan Board, and on the ability to raise
funds on capital markets. However as a type of loan they would merely defer the cost of extension
proposals.
A2.9 Community Infrastructure Levy
A2.9.1 Another potential source of funding for individual new Metro stations is the Community Infrastructure Levy
(CIL) which local authorities can levy based on the scale of individual development opportunities. The
purpose of CIL is to ensure that costs incurred in providing infrastructure to support the development of an
area can be funded (wholly or partly) by owners or developers of land48. Therefore if the provision of Metro
as a sustainable transport link is seen as key to the opening up of a defined geographical area, then CIL
contributions could be applicable in planning terms.
A2.9.2 The nature of the CIL framework is more suited to contributions towards individual stations than entire
route corridors. Recent experience with developers of current schemes suggests that transport is one of
many recipients of CIL funding, and that the amounts involved are likely to be insufficient to meet the full
cost of new stations
A2.10 Private Sector Funding
A2.10.1 Several capital investment schemes in UK light rail networks involve an element of loan finance provided
through the UK banking sector. There are two main routes to accessing this type of finance, either directly as
a PTE, or indirectly through concession holder(s).
47
A bond issued by the UK government 48
The Community Infrastructure Levy Regulations 2010. HMSO 2010.

107
A2.10.2 There are many sources of such funding which rely on a commercial rate of return to operate; the cost at
any given time dependent on levels of interest rates. A major source of such funding is the European
Investment Bank (EIB), a quasi-private sector institution run ‘for the public good’.
A2.10.3 The EIB is the EU’s non-profit long term lending institution which uses finance to fund ‘sound and
sustainable projects that contribute to EU policy objectives49’. Transport is one of the EIB’s funding priorities
and past schemes that have been brought to fruition with the help of EIB loan finance include £500 million of
loans over 30 years to the (then) Greater Manchester PTE to fund the third phase of construction of
Metrolink, financing new trains and additional infrastructure – some 30% of total project costs. The EIB cites
lower financing costs (due to the EIB’s strong institutional backing from EU member governments), fixed
interest rates and diversification of finance as amongst the benefits to TfGM.
A2.10.4 EIB funding appears to have potential to provide the level of funding that network extensions would
require. TfGM has made repayment assumptions based on future fares revenue that will accrue from new
patronage attracted from new and improved Metrolink provision.
A2.11 Farebox Income
A2.11.1 Transport for Greater Manchester’s funding package for Phase 3 of Metrolink includes a degree of Prudential
Borrowing against future fare-box revenues.50 This is potentially a high-risk strategy unless future revenues
can be plotted with some degree of certainty. Critically, TFGM and Metrolink have decided to increase fares
by 1% above inflation as part of a medium-term financial strategy. A ring-fenced element of fares, or possibly
a small additional ‘Network Extension Levy’ could be dedicated towards repayment of borrowings however
were these to be applied in a declining market they could result in a loss of patronage which would further
depress income.
49
www.eib.org 50
City Deal: Future Transport Prioritisation. Greater Manchester Combined Authority 29/07/12.

108
Appendix 3: NEW FLEET SPECIFICATION
A3.1 Below are a number of issues surrounding the specification of a new Metro train fleet.
Crashworthiness
A3.2 Currently the Network Rail standard for crash-worthiness includes a frontal impact force (‘buffer load’) of
2000kN, requiring a heavy vehicle structure to withstand. Most worldwide Metro vehicles on typical
segregated networks can typically only resist 400kN; however, Nexus Metro vehicles can resist 800kN, which
has been accepted by Network Rail on the Sunderland joint operation, due to both robust signalling and
control, and the overall relatively low speed on that line. The vehicles for the Sheffield tram-train trial also
have an 800kN frontal impact resistance; it is hoped that an outcome of the Sheffield project will be formal
acceptance by Network Rail of this standard for all future UK tram-train type joint operations on normal, i.e.
not high-speed rail lines. It is assumed that an 800kN impact resistance will be incorporated into any new
Metro vehicles, together with other associated features.
Closest comparator vehicles to Nexus
A3.3.1 A number of UK light rail vehicles are described in the case studies in Appendix 1. Manchester Metrolink
operates the only other high-floor light-rail vehicles in the UK. These are Bombardier ‘Flexity Swift’ vehicles
(designated M5000), whose dimensions and operating characteristics are similar to current Nexus Metro
vehicles, albeit substantially more up-to-date in terms of signalling, regenerative braking etc. M5000s also
operate on former standard-gauge railways as do Nexus, though they also have a wheel-rail profile enabling
them to operate on-street. As with Nexus Metro, M5000s normally operate in coupled 2-car sets. On the
other hand, the buffer load of the M5000 is only 400kN.
Figure 31 - Flexity Swift vehicle as used in Rotterdam
A3.3.2 A similar vehicle design from the same ‘Flexity Swift’ family has been operated on Rotterdam RET since the
late 2000s (pictured above). The main differences in this vehicle are that it has an extended 42m length in a
single passenger compartment, and has a top speed of 100 km/h. A vehicle of this length could potentially

109
use less traction energy than a two-car set of 55-60m (albeit its passenger capacity would obviously be less).
Other potential advantages of a single passenger compartment are:
Passengers’ improved perceptions of personal safety, due to being always in the same compartment
as the driver
Removal of couplings, leading to reduced maintenance costs and lower operational risks
Slightly faster driver transition from one cab to the other at the end of a journey
A3.3.3. Sheffield’s new Vossloh tram-train pilot vehicles also offer some similarities to Nexus Metro, in terms of
running on operational Network Rail tracks, as well as on-street. Their ‘buffer load’ figure also matches the
current Nexus Metro vehicles. However, the Sheffield tram-trains have low-floor external doors, and a single
passenger compartment of mixed high/low floor; they are capable of 110 km/h compared to Nexus Metro
vehicles’ 80 km/h.
A3.3.4 These and other factors will all be taken into account by Nexus when defining the proposed vehicle
specification
Seating density
A3.4 A table indicating the seating density of some comparator light rail vehicles is shown below, to support the
idea that there could potentially be a modest reduction of seating capacity in any future Metro vehicle as
referred to in Section 3:
Network
Seating density (seats/linear metre)
Sheffield Supertram (original) 2.5
Rotterdam RET Flexity Swift 2.5
Nexus Metro 2.3
Manchester Metrolink 2.1
Docklands Light Railway 2.0
Nottingham NET 1.9
Edinburgh Tram 1.8 (above-average luggage storage space has been provided on these vehicles due to Airport traffic)
Table 11 - Seating densities on European light rail stock