Embed Size (px)
Citation preview
Journal of Hydrology: Regional Studies 2 (2014) 1–19
Contents lists available at ScienceDirect
Journal of Hydrology: RegionalStudies
j ournal homepage: www.elsev ier .com/ locate /e j rh
Review
Status of wetlands in India: A review of extent,ecosystem benefits, threats and managementstrategies
Nitin Bassia,∗, M. Dinesh Kumarb, Anuradha Sharmac,P. Pardha-Saradhia
a Department of Environmental Studies, University of Delhi, Delhi 110007, Indiab Institute for Resource Analysis and Policy (IRAP), Hyderabad, Indiac Department of Botany, Hindu College, University of Delhi, Delhi, India
a r t i c l e i n f o
Article history:Received 29 April 2014Received in revised form 7 July 2014Accepted 12 July 2014Available online 13 August 2014
Keywords:IndiaWetlandsEcosystem benefitsAnthropogenic threatsInstitutional strategies
a b s t r a c t
Study region: India.
Study focus: India has a wealth of wetland ecosystems that support diverse and unique
habitats. These wetlands provide numerous ecological goods and services but are
under tremendous stress due to rapid urbanization, industrialization and agricultural
intensification, manifested by the shrinkage in their areal extent, and decline in the
hydrological, economic and ecological functions they perform. This paper reviews the
wetland wealth of India in terms of their geographic distribution and extent, ecosys-
tem benefits they provide, and the various stresses they are exposed to. The paper also
discusses the efforts at management of these fragile ecosystems, identifies the insti-
tutional vacuum and suggests priority area where immediate attention is required in
order to formulate better conservation strategies for these productive systems.
New hydrological insights for the region: It has been found that management of
wetlands has received inadequate attention in the national water sector agenda. As a
result, many of the wetlands are subject to anthropogenic pressures, including land
use changes in the catchment; pollution from industry and households; encroach-
ments; tourism; and over exploitation of their natural resources. Further, majority of
research on wetland management in India relates to the limnological aspects and eco-
logical/environmental economics of wetland management. But, the physical (such as
hydrological and land use changes in the catchment) and socio-economic processes
leading to limnological changes have not been explored substantially.© 2014 The Authors. Published by Elsevier B.V. This is an open access article under
the CC BY-NC-ND license (http://creativecommons.org/licenses/by-nc-nd/3.0/).
∗ Corresponding author. Tel.: +91 9999629934.E-mail addresses: [email protected], [email protected], bassi [email protected] (N. Bassi), [email protected]
(M.D. Kumar), [email protected] (A. Sharma), [email protected] (P. Pardha-Saradhi).
http://dx.doi.org/10.1016/j.ejrh.2014.07.0012214-5818/© 2014 The Authors. Published by Elsevier B.V. This is an open access article under the CC BY-NC-ND license(http://creativecommons.org/licenses/by-nc-nd/3.0/).
2 N. Bassi et al. / Journal of Hydrology: Regional Studies 2 (2014) 1–19
Contents
1. Introduction . . . . . . . . . . . . . . . . . . . . . . . . . . . . . . . . . . . . . . . . . . . . . . . . . . . . . . . . . . . . . . . . . . . . . . . . . . . . . . . . . . . . . . . . . . . . . . . . 22. Distribution and extent of wetlands in India . . . . . . . . . . . . . . . . . . . . . . . . . . . . . . . . . . . . . . . . . . . . . . . . . . . . . . . . . . . . . . 3
2.1. India’s wetland extent as per the latest wetland inventory . . . . . . . . . . . . . . . . . . . . . . . . . . . . . . . . . . . . . . . 42.2. Regional extent of wetlands in India as per the National Wetland Atlas 2011 . . . . . . . . . . . . . . . . . . . . 5
3. Importance of wetlands . . . . . . . . . . . . . . . . . . . . . . . . . . . . . . . . . . . . . . . . . . . . . . . . . . . . . . . . . . . . . . . . . . . . . . . . . . . . . . . . . . . . 73.1. Multiple-use water services . . . . . . . . . . . . . . . . . . . . . . . . . . . . . . . . . . . . . . . . . . . . . . . . . . . . . . . . . . . . . . . . . . . . . . . . 73.2. Carbon sequestration . . . . . . . . . . . . . . . . . . . . . . . . . . . . . . . . . . . . . . . . . . . . . . . . . . . . . . . . . . . . . . . . . . . . . . . . . . . . . . . 83.3. Pollution abatement . . . . . . . . . . . . . . . . . . . . . . . . . . . . . . . . . . . . . . . . . . . . . . . . . . . . . . . . . . . . . . . . . . . . . . . . . . . . . . . . 83.4. Flood control . . . . . . . . . . . . . . . . . . . . . . . . . . . . . . . . . . . . . . . . . . . . . . . . . . . . . . . . . . . . . . . . . . . . . . . . . . . . . . . . . . . . . . . . 93.5. Biodiversity hotspots . . . . . . . . . . . . . . . . . . . . . . . . . . . . . . . . . . . . . . . . . . . . . . . . . . . . . . . . . . . . . . . . . . . . . . . . . . . . . . 10
4. Growing threat to wetland ecosystem . . . . . . . . . . . . . . . . . . . . . . . . . . . . . . . . . . . . . . . . . . . . . . . . . . . . . . . . . . . . . . . . . . . 114.1. Urbanization and land use changes . . . . . . . . . . . . . . . . . . . . . . . . . . . . . . . . . . . . . . . . . . . . . . . . . . . . . . . . . . . . . . . 114.2. Agricultural, municipal and industrial pollution . . . . . . . . . . . . . . . . . . . . . . . . . . . . . . . . . . . . . . . . . . . . . . . . . 124.3. Other threats . . . . . . . . . . . . . . . . . . . . . . . . . . . . . . . . . . . . . . . . . . . . . . . . . . . . . . . . . . . . . . . . . . . . . . . . . . . . . . . . . . . . . . 13
5. Institutional strategies adopted for wetland management in India . . . . . . . . . . . . . . . . . . . . . . . . . . . . . . . . . . . . . 135.1. Legal framework . . . . . . . . . . . . . . . . . . . . . . . . . . . . . . . . . . . . . . . . . . . . . . . . . . . . . . . . . . . . . . . . . . . . . . . . . . . . . . . . . . 145.2. Policy support . . . . . . . . . . . . . . . . . . . . . . . . . . . . . . . . . . . . . . . . . . . . . . . . . . . . . . . . . . . . . . . . . . . . . . . . . . . . . . . . . . . . . 14
6. Conclusion . . . . . . . . . . . . . . . . . . . . . . . . . . . . . . . . . . . . . . . . . . . . . . . . . . . . . . . . . . . . . . . . . . . . . . . . . . . . . . . . . . . . . . . . . . . . . . . . 16Conflict of interest . . . . . . . . . . . . . . . . . . . . . . . . . . . . . . . . . . . . . . . . . . . . . . . . . . . . . . . . . . . . . . . . . . . . . . . . . . . . . . . . . . . . . . . . 16References . . . . . . . . . . . . . . . . . . . . . . . . . . . . . . . . . . . . . . . . . . . . . . . . . . . . . . . . . . . . . . . . . . . . . . . . . . . . . . . . . . . . . . . . . . . . . . . . 16
1. Introduction
Wetlands are amongst the most productive ecosystems on the Earth (Ghermandi et al., 2008),and provide many important services to human society (ten Brink et al., 2012). However, they arealso ecologically sensitive and adaptive systems (Turner et al., 2000). Wetlands exhibit enormousdiversity according to their genesis, geographical location, water regime and chemistry, dominantspecies, and soil and sediment characteristics (Space Applications Centre, 2011). Globally, the arealextent of wetland ecosystems ranges from 917 million hectares (m ha) (Lehner and Döll, 2004) to morethan 1275 m ha (Finlayson and Spiers, 1999) with an estimated economic value of about US$15 trilliona year (MEA, 2005).
One of the first widely used wetland classifications systems (devised by Cowardin et al., 1979)categorized wetlands into marine (coastal wetlands), estuarine (including deltas, tidal marshes, andmangrove swamps), lacustarine (lakes), riverine (along rivers and streams), and palustarine (‘marshy’– marshes, swamps and bogs) based on their hydrological, ecological and geological characteristics.However, Ramsar Convention on Wetlands, which is an international treaty signed in 1971 for nationalaction and international cooperation for the conservation and wise use of wetlands and their resources,defines wetlands (Article 1.1) as “areas of marsh, fen, peatland or water, whether natural or artificial,permanent or temporary, with water that is static or flowing, fresh, brackish or salt, including areas ofmarine water the depth of which at low tide does not exceed six metres”. Overall, 1052 sites in Europe;289 sites in Asia; 359 sites in Africa; 175 sites in South America; 211 sites in North America; and 79sites in Oceania region have been identified as Ramsar sites or wetlands of International importance(Ramsar Secretariat, 2013).
As per the Ramsar Convention definition most of the natural water bodies (such as rivers, lakes,coastal lagoons, mangroves, peat land, coral reefs) and man made wetlands (such as ponds, farmponds, irrigated fields, sacred groves, salt pans, reservoirs, gravel pits, sewage farms and canals) inIndia constitute the wetland ecosystem. Only 26 of these numerous wetlands have been designatedas Ramsar Sites (Ramsar, 2013). However, many other wetlands which perform potentially valuablefunctions are continued to be ignored in the policy process. As a result many freshwater wetlandsecosystems are threatened and many are already degraded and lost due to urbanization, populationgrowth, and increased economic activities (Central Pollution Control Board, 2008).
N. Bassi et al. / Journal of Hydrology: Regional Studies 2 (2014) 1–19 3
Table 1Number and size of wetlands as per the various wetland inventories of India.
Inventory Year Total number of wetlands Total area of wetlands (m ha)
Natural Man-made Natural Man-made
Directory of Asian Wetlandsand Directory of IndianWetlands (WWF and AWB)
1989 and 1993 Not specified 58.3
Directory of Indian Wetlands(MoEF, GoI)
1990 2167 65,253 1.45 2.59
Wetlands of India (SpaceApplications Centre)
1998 18,154 9249 5.31 2.27
Source: Adapted from Garg et al. (1998), Woistencroft et al. (1989) and WWF and AWB (1993).
The negative economic, social, and environmental consequences of declining water quality in wet-lands are also an issue of concern for India. The problem of deteriorating water quality is particularlymore alarming in the case of small water bodies such as lakes, tanks and ponds. In the past, thesewater sources performed several economic (fisheries, livestock and forestry), social (water supply),and ecological functions (groundwater recharge, nutrient recycling, and biodiversity maintenance).Despite all these benefits, many decision-makers and even many of the ‘primary stakeholders’ thinkof them as ‘wastelands’. Every one claims a stake in them, as they are in the open access regime, butrarely are willing to pay for this extractive use (Verma, 2001).
These freshwater bodies are often subject to changes in land use in their catchments leading toreduction in inflows and deteriorating quality of the “runoff” traversing through agricultural fieldsand urban areas. On the other hand, many of them act as the “sink” for untreated effluents from urbancentres and industries. Encroachment of reservoir area for urban development, excessive diversion ofwater for agriculture is yet another major problem (Verma, 2001). Lack of conformity among govern-ment policies in the areas of economics, environment, nature conservation, development planning isone reason for the deterioration of these water bodies (Turner et al., 2000). Lack of good governanceand management are also major reasons (Kumar et al., 2013a).
Given this background, the objective of this paper is to review the status of wetlands in India, interms of their geographic distribution and areal extent; the ecosystem goods and services they provide;various stresses they are being subject to; and the various legal and policy approaches adopted in Indiafor their conservation and management.
2. Distribution and extent of wetlands in India
India, with its varying topography and climatic regimes, supports diverse and unique wetlandhabitats (Prasad et al., 2002). The available estimates about the areal extent of wetlands in India varywidely from a lowest of 1% to a highest of 5% of geographical area, but do support nearly fifth ofthe known biodiversity (Space Applications Centre, 2011). These wetlands are distributed in differentgeographical regions ranging from Himalayas to Deccan plateau.
Initial attempts to prepare wetland inventory of India were made between 1980s and early 1990s(Table 1). As per the: Country report of Directory of Asian Wetlands (Woistencroft et al., 1989); and theDirectory of Indian Wetlands 1993 (WWF and AWB, 1993), the areal spread of wetlands in India wasaround 58.3 m ha. But, Paddy fields accounted for nearly 71% of this wetland area. However, as per theMinistry of Environment and Forests (1990) estimates, wetlands occupy an area of about 4.1 m ha, butit excludes mangroves. The first scientific mapping of wetlands of the country was carried out usingsatellite data of 1992–1993 by Space Applications Centre (SAC), Ahmedabad. The exercise classifiedwetlands based on the Ramsar Convention definition. This inventory estimated the areal extent ofwetlands to be about 7.6 m ha (Garg et al., 1998). The estimates did not include paddy fields, rivers,canals and irrigation channels. Thus, all these early assessments were marred by problem of inadequateunderstanding of the definition and characteristics of wetlands (Gopal and Sah, 1995).
4 N. Bassi et al. / Journal of Hydrology: Regional Studies 2 (2014) 1–19
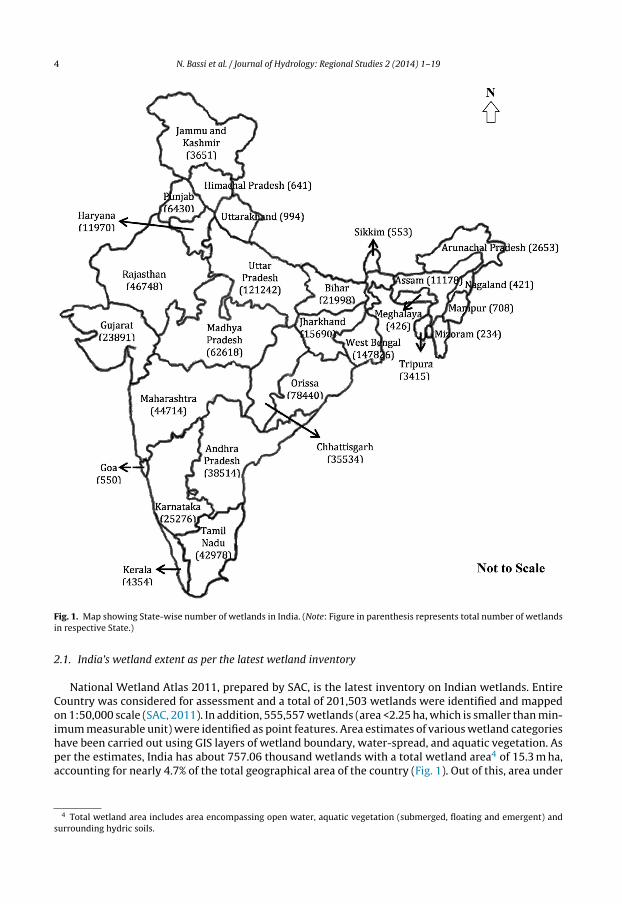
Fig. 1. Map showing State-wise number of wetlands in India. (Note: Figure in parenthesis represents total number of wetlandsin respective State.)
2.1. India’s wetland extent as per the latest wetland inventory
National Wetland Atlas 2011, prepared by SAC, is the latest inventory on Indian wetlands. EntireCountry was considered for assessment and a total of 201,503 wetlands were identified and mappedon 1:50,000 scale (SAC, 2011). In addition, 555,557 wetlands (area <2.25 ha, which is smaller than min-imum measurable unit) were identified as point features. Area estimates of various wetland categorieshave been carried out using GIS layers of wetland boundary, water-spread, and aquatic vegetation. Asper the estimates, India has about 757.06 thousand wetlands with a total wetland area4 of 15.3 m ha,accounting for nearly 4.7% of the total geographical area of the country (Fig. 1). Out of this, area under
4 Total wetland area includes area encompassing open water, aquatic vegetation (submerged, floating and emergent) andsurrounding hydric soils.
N. Bassi et al. / Journal of Hydrology: Regional Studies 2 (2014) 1–19 5
363.0
300
400et
land
Average Wetland Area (in hectares)
145.1 154.2
100
200
300
hect
res
per
we
27.61.0
0
Natural Man-made Natural Man-made
l d 0 C l 0 l d ( 2 2
Are
a in
h
Inland 0 Coastal 0 Wetlands (<2.25ha)
Wetland Category
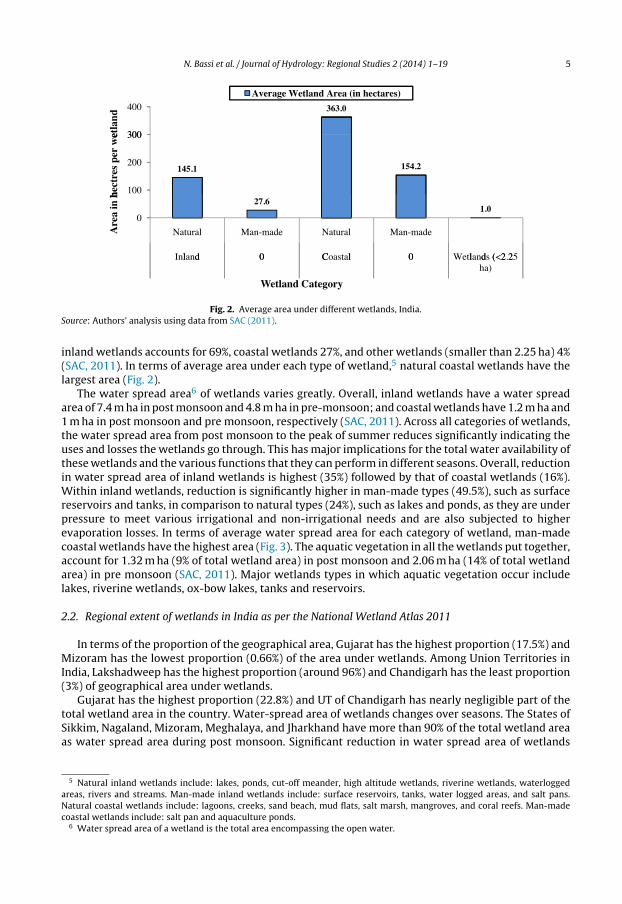
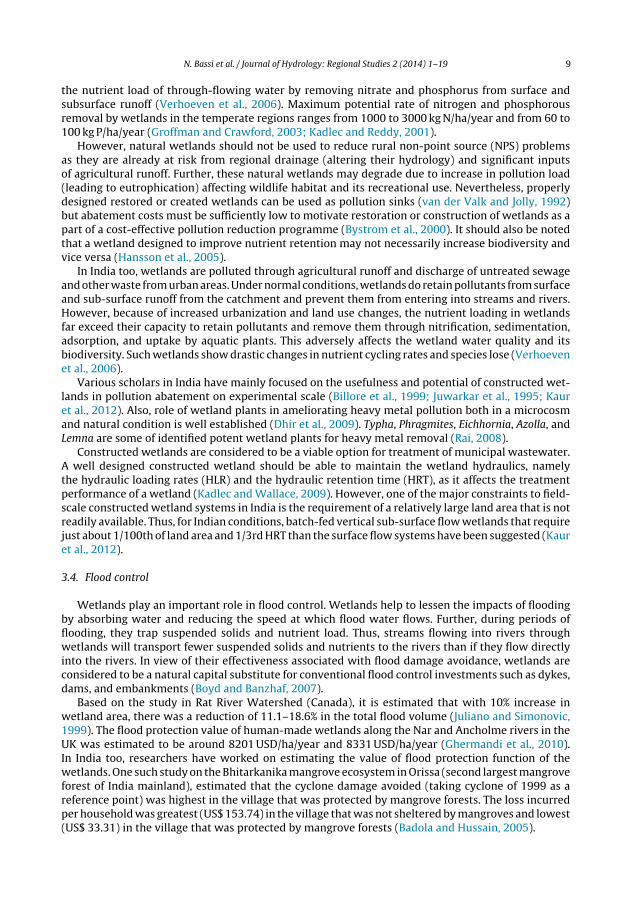
Fig. 2. Average area under different wetlands, India.Source: Authors’ analysis using data from SAC (2011).
inland wetlands accounts for 69%, coastal wetlands 27%, and other wetlands (smaller than 2.25 ha) 4%(SAC, 2011). In terms of average area under each type of wetland,5 natural coastal wetlands have thelargest area (Fig. 2).
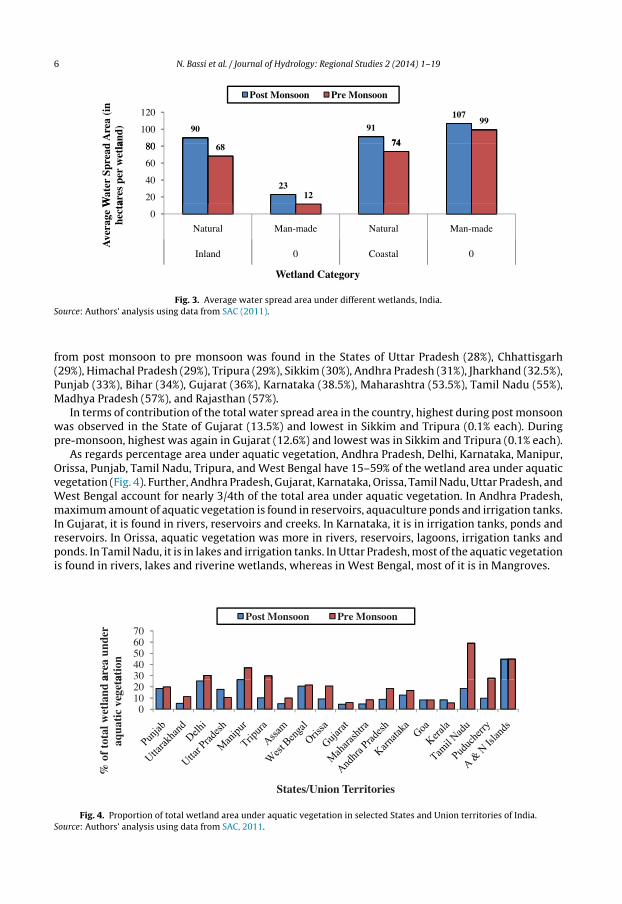
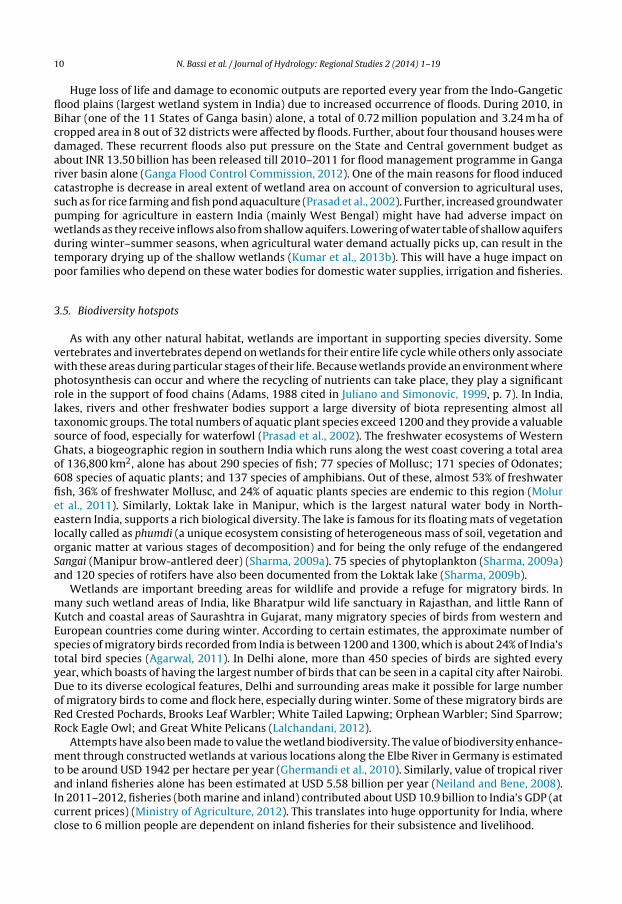
The water spread area6 of wetlands varies greatly. Overall, inland wetlands have a water spreadarea of 7.4 m ha in post monsoon and 4.8 m ha in pre-monsoon; and coastal wetlands have 1.2 m ha and1 m ha in post monsoon and pre monsoon, respectively (SAC, 2011). Across all categories of wetlands,the water spread area from post monsoon to the peak of summer reduces significantly indicating theuses and losses the wetlands go through. This has major implications for the total water availability ofthese wetlands and the various functions that they can perform in different seasons. Overall, reductionin water spread area of inland wetlands is highest (35%) followed by that of coastal wetlands (16%).Within inland wetlands, reduction is significantly higher in man-made types (49.5%), such as surfacereservoirs and tanks, in comparison to natural types (24%), such as lakes and ponds, as they are underpressure to meet various irrigational and non-irrigational needs and are also subjected to higherevaporation losses. In terms of average water spread area for each category of wetland, man-madecoastal wetlands have the highest area (Fig. 3). The aquatic vegetation in all the wetlands put together,account for 1.32 m ha (9% of total wetland area) in post monsoon and 2.06 m ha (14% of total wetlandarea) in pre monsoon (SAC, 2011). Major wetlands types in which aquatic vegetation occur includelakes, riverine wetlands, ox-bow lakes, tanks and reservoirs.
2.2. Regional extent of wetlands in India as per the National Wetland Atlas 2011
In terms of the proportion of the geographical area, Gujarat has the highest proportion (17.5%) andMizoram has the lowest proportion (0.66%) of the area under wetlands. Among Union Territories inIndia, Lakshadweep has the highest proportion (around 96%) and Chandigarh has the least proportion(3%) of geographical area under wetlands.
Gujarat has the highest proportion (22.8%) and UT of Chandigarh has nearly negligible part of thetotal wetland area in the country. Water-spread area of wetlands changes over seasons. The States ofSikkim, Nagaland, Mizoram, Meghalaya, and Jharkhand have more than 90% of the total wetland areaas water spread area during post monsoon. Significant reduction in water spread area of wetlands
5 Natural inland wetlands include: lakes, ponds, cut-off meander, high altitude wetlands, riverine wetlands, waterloggedareas, rivers and streams. Man-made inland wetlands include: surface reservoirs, tanks, water logged areas, and salt pans.Natural coastal wetlands include: lagoons, creeks, sand beach, mud flats, salt marsh, mangroves, and coral reefs. Man-madecoastal wetlands include: salt pan and aquaculture ponds.
6 Water spread area of a wetland is the total area encompassing the open water.
6 N. Bassi et al. / Journal of Hydrology: Regional Studies 2 (2014) 1–19
90 91
107
74
99
80
100
120 A
rea
(in
and)
Post Monsoon Pre Monsoon
23
68
12
74
20
40
60
80
Wat
er S
prea
dar
es p
er w
etla
0
Natural Man-made Natural Man-made
Inland 0 Coastal 0
Ave
rage
Whe
cta
Wetland Category
Fig. 3. Average water spread area under different wetlands, India.Source: Authors’ analysis using data from SAC (2011).
from post monsoon to pre monsoon was found in the States of Uttar Pradesh (28%), Chhattisgarh(29%), Himachal Pradesh (29%), Tripura (29%), Sikkim (30%), Andhra Pradesh (31%), Jharkhand (32.5%),Punjab (33%), Bihar (34%), Gujarat (36%), Karnataka (38.5%), Maharashtra (53.5%), Tamil Nadu (55%),Madhya Pradesh (57%), and Rajasthan (57%).
In terms of contribution of the total water spread area in the country, highest during post monsoonwas observed in the State of Gujarat (13.5%) and lowest in Sikkim and Tripura (0.1% each). Duringpre-monsoon, highest was again in Gujarat (12.6%) and lowest was in Sikkim and Tripura (0.1% each).
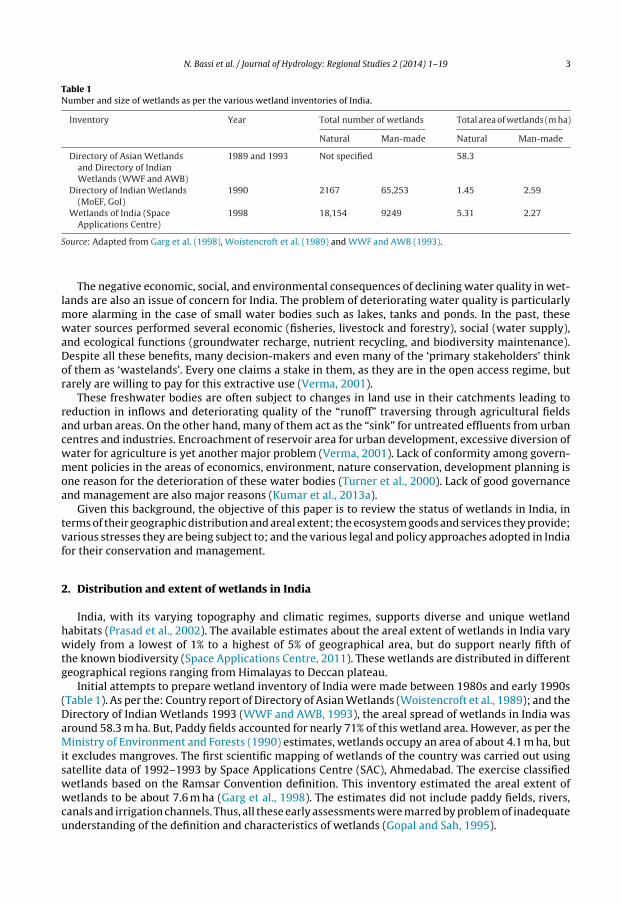
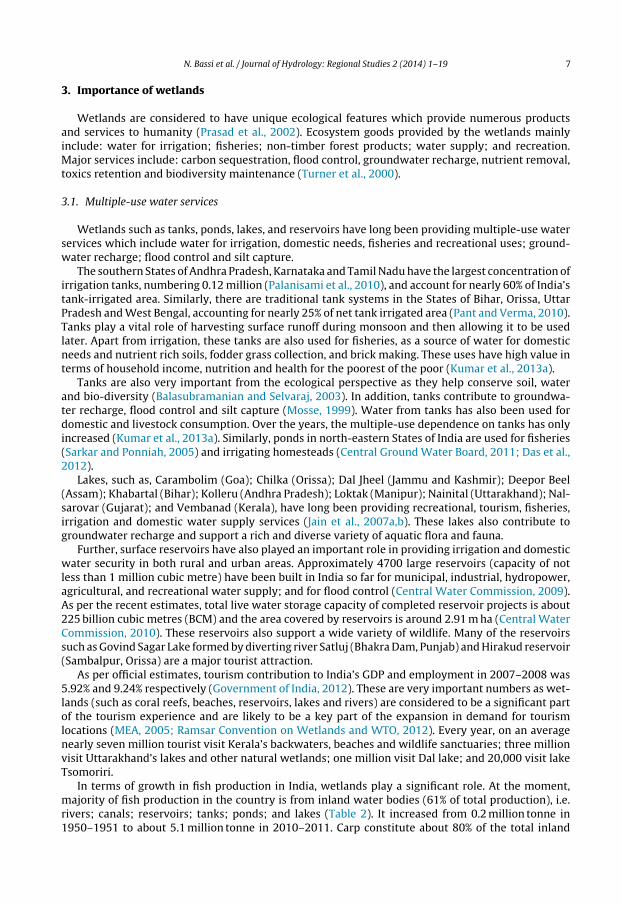
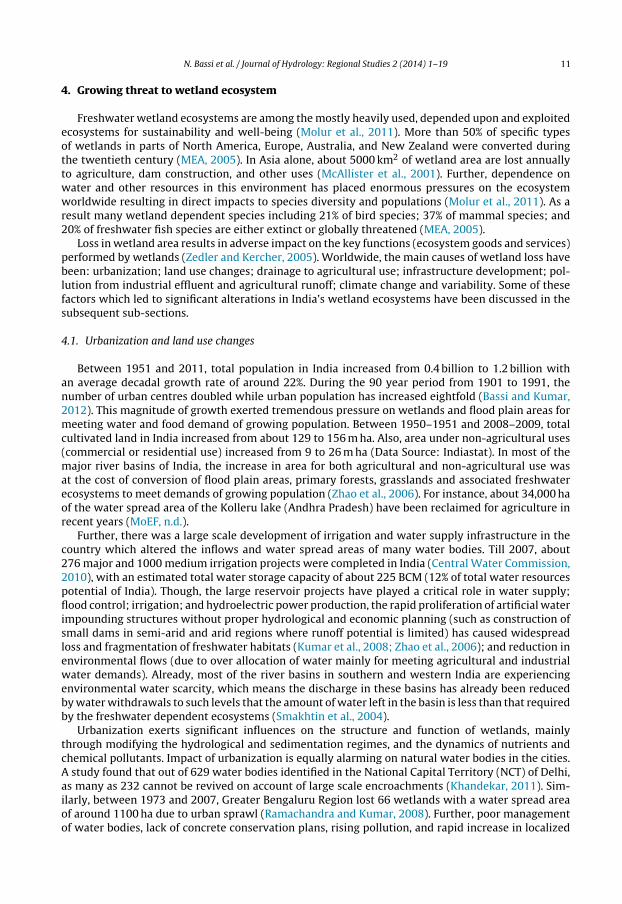
As regards percentage area under aquatic vegetation, Andhra Pradesh, Delhi, Karnataka, Manipur,Orissa, Punjab, Tamil Nadu, Tripura, and West Bengal have 15–59% of the wetland area under aquaticvegetation (Fig. 4). Further, Andhra Pradesh, Gujarat, Karnataka, Orissa, Tamil Nadu, Uttar Pradesh, andWest Bengal account for nearly 3/4th of the total area under aquatic vegetation. In Andhra Pradesh,maximum amount of aquatic vegetation is found in reservoirs, aquaculture ponds and irrigation tanks.In Gujarat, it is found in rivers, reservoirs and creeks. In Karnataka, it is in irrigation tanks, ponds andreservoirs. In Orissa, aquatic vegetation was more in rivers, reservoirs, lagoons, irrigation tanks andponds. In Tamil Nadu, it is in lakes and irrigation tanks. In Uttar Pradesh, most of the aquatic vegetationis found in rivers, lakes and riverine wetlands, whereas in West Bengal, most of it is in Mangroves.
3040506070
area
und
er
a tio
n
Post Monsoon Pre Monsoon
01020
% o
f to
tal w
etla
nd a
aqua
tic
vege
ta
States/Union Territories
Fig. 4. Proportion of total wetland area under aquatic vegetation in selected States and Union territories of India.Source: Authors’ analysis using data from SAC, 2011.
N. Bassi et al. / Journal of Hydrology: Regional Studies 2 (2014) 1–19 7
3. Importance of wetlands
Wetlands are considered to have unique ecological features which provide numerous productsand services to humanity (Prasad et al., 2002). Ecosystem goods provided by the wetlands mainlyinclude: water for irrigation; fisheries; non-timber forest products; water supply; and recreation.Major services include: carbon sequestration, flood control, groundwater recharge, nutrient removal,toxics retention and biodiversity maintenance (Turner et al., 2000).
3.1. Multiple-use water services
Wetlands such as tanks, ponds, lakes, and reservoirs have long been providing multiple-use waterservices which include water for irrigation, domestic needs, fisheries and recreational uses; ground-water recharge; flood control and silt capture.
The southern States of Andhra Pradesh, Karnataka and Tamil Nadu have the largest concentration ofirrigation tanks, numbering 0.12 million (Palanisami et al., 2010), and account for nearly 60% of India’stank-irrigated area. Similarly, there are traditional tank systems in the States of Bihar, Orissa, UttarPradesh and West Bengal, accounting for nearly 25% of net tank irrigated area (Pant and Verma, 2010).Tanks play a vital role of harvesting surface runoff during monsoon and then allowing it to be usedlater. Apart from irrigation, these tanks are also used for fisheries, as a source of water for domesticneeds and nutrient rich soils, fodder grass collection, and brick making. These uses have high value interms of household income, nutrition and health for the poorest of the poor (Kumar et al., 2013a).
Tanks are also very important from the ecological perspective as they help conserve soil, waterand bio-diversity (Balasubramanian and Selvaraj, 2003). In addition, tanks contribute to groundwa-ter recharge, flood control and silt capture (Mosse, 1999). Water from tanks has also been used fordomestic and livestock consumption. Over the years, the multiple-use dependence on tanks has onlyincreased (Kumar et al., 2013a). Similarly, ponds in north-eastern States of India are used for fisheries(Sarkar and Ponniah, 2005) and irrigating homesteads (Central Ground Water Board, 2011; Das et al.,2012).
Lakes, such as, Carambolim (Goa); Chilka (Orissa); Dal Jheel (Jammu and Kashmir); Deepor Beel(Assam); Khabartal (Bihar); Kolleru (Andhra Pradesh); Loktak (Manipur); Nainital (Uttarakhand); Nal-sarovar (Gujarat); and Vembanad (Kerala), have long been providing recreational, tourism, fisheries,irrigation and domestic water supply services (Jain et al., 2007a,b). These lakes also contribute togroundwater recharge and support a rich and diverse variety of aquatic flora and fauna.
Further, surface reservoirs have also played an important role in providing irrigation and domesticwater security in both rural and urban areas. Approximately 4700 large reservoirs (capacity of notless than 1 million cubic metre) have been built in India so far for municipal, industrial, hydropower,agricultural, and recreational water supply; and for flood control (Central Water Commission, 2009).As per the recent estimates, total live water storage capacity of completed reservoir projects is about225 billion cubic metres (BCM) and the area covered by reservoirs is around 2.91 m ha (Central WaterCommission, 2010). These reservoirs also support a wide variety of wildlife. Many of the reservoirssuch as Govind Sagar Lake formed by diverting river Satluj (Bhakra Dam, Punjab) and Hirakud reservoir(Sambalpur, Orissa) are a major tourist attraction.
As per official estimates, tourism contribution to India’s GDP and employment in 2007–2008 was5.92% and 9.24% respectively (Government of India, 2012). These are very important numbers as wet-lands (such as coral reefs, beaches, reservoirs, lakes and rivers) are considered to be a significant partof the tourism experience and are likely to be a key part of the expansion in demand for tourismlocations (MEA, 2005; Ramsar Convention on Wetlands and WTO, 2012). Every year, on an averagenearly seven million tourist visit Kerala’s backwaters, beaches and wildlife sanctuaries; three millionvisit Uttarakhand’s lakes and other natural wetlands; one million visit Dal lake; and 20,000 visit lakeTsomoriri.
In terms of growth in fish production in India, wetlands play a significant role. At the moment,majority of fish production in the country is from inland water bodies (61% of total production), i.e.rivers; canals; reservoirs; tanks; ponds; and lakes (Table 2). It increased from 0.2 million tonne in1950–1951 to about 5.1 million tonne in 2010–2011. Carp constitute about 80% of the total inland
8 N. Bassi et al. / Journal of Hydrology: Regional Studies 2 (2014) 1–19
Table 2Total fish production in India during the last decade.
Year Total (million tonne) Marine contribution (%) In-land contribution (%)
2001–2002 5.96 47.7 52.32002–2003 6.20 48.2 51.82003–2004 6.40 45.9 54.12004–2005 6.30 44.1 55.92005–2006 6.57 42.9 57.12006–2007 6.87 44.1 55.92007–2008 7.13 41.0 59.02008–2009 7.62 39.1 60.92009–2010 7.91 39.2 60.82010–2011 8.29 38.8 61.2
Source: Ministry of Agriculture (2012).
aquaculture production. Presently, the State of West Bengal occupies the topmost position (30% oftotal inland fish production) followed by Andhra Pradesh, Uttar Pradesh, Bihar and Orissa (Ministry ofAgriculture, 2012). Overall, fisheries accounts for 1.2% of India’s total Gross Domestic Product (GDP)and 5.4% of total agricultural GDP.
3.2. Carbon sequestration
Swamps, mangroves, peat lands, mires and marshes play an important role in carbon cycle. Whilewetland sediments are the long-term stores of carbon, short-term stores are in wetland existingbiomass (plants, animals, bacteria and fungi) and dissolved components in the surface and groundwa-ter (Wylynko, 1999). Though wetlands contribute about 40% of the global methane (CH4) emissions,they have the highest carbon (C) density among terrestrial ecosystems and relatively greater capacitiesto sequester additional carbon dioxide (CO2) (Pant et al., 2003).
Wetlands sequester C through high rates of organic matter inputs and reduced rates of decompo-sitions (Pant et al., 2003). Wetland soils may contain as much as 200 times more C than its vegetation.However, drainage of large areas of wetlands and their subsequent cultivation at many places hadmade them a net source of CO2. Restoration of wetlands can reverse them to a sink of atmosphericCO2 (Lal, 2008). As per the estimations, carbon sequestration potential of restored wetlands (over 50year period) comes out to be about 0.4 tonnes C/ha/year (IPCC, 2000).
In India, coastal wetlands are playing a major role in carbon sequestration. The total extent of coastalecosystems (including mangroves) in India is around 43,000 km2 (Kathiresan and Thakur, 2008). Ascarbon sink, mangrove wetlands in eastern India are more important than those on the west coast,as they are larger in size, higher in diversity and more complicated due to tidal creeks and canal net-work. Overall, mangroves are able to sequester about 1.5 metric tonne of carbon per hectare per year,and the upper layers of mangrove sediments have high carbon content, with conservative estimatesindicating the levels of 10% (Kathiresan and Thakur, 2008). However, mangroves were also found tobe emitting methane (CH4), one of the primary greenhouse gases, which was around 19% of their car-bon sequestration potential. Similarly, tropical coastal wetlands such as the Vembanad Lake, a lagoonalong the West Coast of India, were found to be releasing up to 193.2 mg/m2/h of CH4 (Verma et al.,2002). Wetlands function as net sequesters or producers of greenhouse gases depending on their bio-geo-chemical processes and hydrology. Thus more research is required to ascertain whether wetlandscan be managed as net carbon sinks over time and their potential role in climate change mitigationand international carbon trading system.
3.3. Pollution abatement
Wetlands act as a sink for contaminants in many agricultural and urban landscapes. From aneconomic perspective too, wetlands have been suggested as a low cost measure to reduce pointand non-point pollution (Bystrom et al., 2000). Natural wetlands, such as riparian wetlands, reduce
N. Bassi et al. / Journal of Hydrology: Regional Studies 2 (2014) 1–19 9
the nutrient load of through-flowing water by removing nitrate and phosphorus from surface andsubsurface runoff (Verhoeven et al., 2006). Maximum potential rate of nitrogen and phosphorousremoval by wetlands in the temperate regions ranges from 1000 to 3000 kg N/ha/year and from 60 to100 kg P/ha/year (Groffman and Crawford, 2003; Kadlec and Reddy, 2001).
However, natural wetlands should not be used to reduce rural non-point source (NPS) problemsas they are already at risk from regional drainage (altering their hydrology) and significant inputsof agricultural runoff. Further, these natural wetlands may degrade due to increase in pollution load(leading to eutrophication) affecting wildlife habitat and its recreational use. Nevertheless, properlydesigned restored or created wetlands can be used as pollution sinks (van der Valk and Jolly, 1992)but abatement costs must be sufficiently low to motivate restoration or construction of wetlands as apart of a cost-effective pollution reduction programme (Bystrom et al., 2000). It should also be notedthat a wetland designed to improve nutrient retention may not necessarily increase biodiversity andvice versa (Hansson et al., 2005).
In India too, wetlands are polluted through agricultural runoff and discharge of untreated sewageand other waste from urban areas. Under normal conditions, wetlands do retain pollutants from surfaceand sub-surface runoff from the catchment and prevent them from entering into streams and rivers.However, because of increased urbanization and land use changes, the nutrient loading in wetlandsfar exceed their capacity to retain pollutants and remove them through nitrification, sedimentation,adsorption, and uptake by aquatic plants. This adversely affects the wetland water quality and itsbiodiversity. Such wetlands show drastic changes in nutrient cycling rates and species lose (Verhoevenet al., 2006).
Various scholars in India have mainly focused on the usefulness and potential of constructed wet-lands in pollution abatement on experimental scale (Billore et al., 1999; Juwarkar et al., 1995; Kauret al., 2012). Also, role of wetland plants in ameliorating heavy metal pollution both in a microcosmand natural condition is well established (Dhir et al., 2009). Typha, Phragmites, Eichhornia, Azolla, andLemna are some of identified potent wetland plants for heavy metal removal (Rai, 2008).
Constructed wetlands are considered to be a viable option for treatment of municipal wastewater.A well designed constructed wetland should be able to maintain the wetland hydraulics, namelythe hydraulic loading rates (HLR) and the hydraulic retention time (HRT), as it affects the treatmentperformance of a wetland (Kadlec and Wallace, 2009). However, one of the major constraints to field-scale constructed wetland systems in India is the requirement of a relatively large land area that is notreadily available. Thus, for Indian conditions, batch-fed vertical sub-surface flow wetlands that requirejust about 1/100th of land area and 1/3rd HRT than the surface flow systems have been suggested (Kauret al., 2012).
3.4. Flood control
Wetlands play an important role in flood control. Wetlands help to lessen the impacts of floodingby absorbing water and reducing the speed at which flood water flows. Further, during periods offlooding, they trap suspended solids and nutrient load. Thus, streams flowing into rivers throughwetlands will transport fewer suspended solids and nutrients to the rivers than if they flow directlyinto the rivers. In view of their effectiveness associated with flood damage avoidance, wetlands areconsidered to be a natural capital substitute for conventional flood control investments such as dykes,dams, and embankments (Boyd and Banzhaf, 2007).
Based on the study in Rat River Watershed (Canada), it is estimated that with 10% increase inwetland area, there was a reduction of 11.1–18.6% in the total flood volume (Juliano and Simonovic,1999). The flood protection value of human-made wetlands along the Nar and Ancholme rivers in theUK was estimated to be around 8201 USD/ha/year and 8331 USD/ha/year (Ghermandi et al., 2010).In India too, researchers have worked on estimating the value of flood protection function of thewetlands. One such study on the Bhitarkanika mangrove ecosystem in Orissa (second largest mangroveforest of India mainland), estimated that the cyclone damage avoided (taking cyclone of 1999 as areference point) was highest in the village that was protected by mangrove forests. The loss incurredper household was greatest (US$ 153.74) in the village that was not sheltered by mangroves and lowest(US$ 33.31) in the village that was protected by mangrove forests (Badola and Hussain, 2005).
10 N. Bassi et al. / Journal of Hydrology: Regional Studies 2 (2014) 1–19
Huge loss of life and damage to economic outputs are reported every year from the Indo-Gangeticflood plains (largest wetland system in India) due to increased occurrence of floods. During 2010, inBihar (one of the 11 States of Ganga basin) alone, a total of 0.72 million population and 3.24 m ha ofcropped area in 8 out of 32 districts were affected by floods. Further, about four thousand houses weredamaged. These recurrent floods also put pressure on the State and Central government budget asabout INR 13.50 billion has been released till 2010–2011 for flood management programme in Gangariver basin alone (Ganga Flood Control Commission, 2012). One of the main reasons for flood inducedcatastrophe is decrease in areal extent of wetland area on account of conversion to agricultural uses,such as for rice farming and fish pond aquaculture (Prasad et al., 2002). Further, increased groundwaterpumping for agriculture in eastern India (mainly West Bengal) might have had adverse impact onwetlands as they receive inflows also from shallow aquifers. Lowering of water table of shallow aquifersduring winter–summer seasons, when agricultural water demand actually picks up, can result in thetemporary drying up of the shallow wetlands (Kumar et al., 2013b). This will have a huge impact onpoor families who depend on these water bodies for domestic water supplies, irrigation and fisheries.
3.5. Biodiversity hotspots
As with any other natural habitat, wetlands are important in supporting species diversity. Somevertebrates and invertebrates depend on wetlands for their entire life cycle while others only associatewith these areas during particular stages of their life. Because wetlands provide an environment wherephotosynthesis can occur and where the recycling of nutrients can take place, they play a significantrole in the support of food chains (Adams, 1988 cited in Juliano and Simonovic, 1999, p. 7). In India,lakes, rivers and other freshwater bodies support a large diversity of biota representing almost alltaxonomic groups. The total numbers of aquatic plant species exceed 1200 and they provide a valuablesource of food, especially for waterfowl (Prasad et al., 2002). The freshwater ecosystems of WesternGhats, a biogeographic region in southern India which runs along the west coast covering a total areaof 136,800 km2, alone has about 290 species of fish; 77 species of Mollusc; 171 species of Odonates;608 species of aquatic plants; and 137 species of amphibians. Out of these, almost 53% of freshwaterfish, 36% of freshwater Mollusc, and 24% of aquatic plants species are endemic to this region (Moluret al., 2011). Similarly, Loktak lake in Manipur, which is the largest natural water body in North-eastern India, supports a rich biological diversity. The lake is famous for its floating mats of vegetationlocally called as phumdi (a unique ecosystem consisting of heterogeneous mass of soil, vegetation andorganic matter at various stages of decomposition) and for being the only refuge of the endangeredSangai (Manipur brow-antlered deer) (Sharma, 2009a). 75 species of phytoplankton (Sharma, 2009a)and 120 species of rotifers have also been documented from the Loktak lake (Sharma, 2009b).
Wetlands are important breeding areas for wildlife and provide a refuge for migratory birds. Inmany such wetland areas of India, like Bharatpur wild life sanctuary in Rajasthan, and little Rann ofKutch and coastal areas of Saurashtra in Gujarat, many migratory species of birds from western andEuropean countries come during winter. According to certain estimates, the approximate number ofspecies of migratory birds recorded from India is between 1200 and 1300, which is about 24% of India’stotal bird species (Agarwal, 2011). In Delhi alone, more than 450 species of birds are sighted everyyear, which boasts of having the largest number of birds that can be seen in a capital city after Nairobi.Due to its diverse ecological features, Delhi and surrounding areas make it possible for large numberof migratory birds to come and flock here, especially during winter. Some of these migratory birds areRed Crested Pochards, Brooks Leaf Warbler; White Tailed Lapwing; Orphean Warbler; Sind Sparrow;Rock Eagle Owl; and Great White Pelicans (Lalchandani, 2012).
Attempts have also been made to value the wetland biodiversity. The value of biodiversity enhance-ment through constructed wetlands at various locations along the Elbe River in Germany is estimatedto be around USD 1942 per hectare per year (Ghermandi et al., 2010). Similarly, value of tropical riverand inland fisheries alone has been estimated at USD 5.58 billion per year (Neiland and Bene, 2008).In 2011–2012, fisheries (both marine and inland) contributed about USD 10.9 billion to India’s GDP (atcurrent prices) (Ministry of Agriculture, 2012). This translates into huge opportunity for India, whereclose to 6 million people are dependent on inland fisheries for their subsistence and livelihood.
N. Bassi et al. / Journal of Hydrology: Regional Studies 2 (2014) 1–19 11
4. Growing threat to wetland ecosystem
Freshwater wetland ecosystems are among the mostly heavily used, depended upon and exploitedecosystems for sustainability and well-being (Molur et al., 2011). More than 50% of specific typesof wetlands in parts of North America, Europe, Australia, and New Zealand were converted duringthe twentieth century (MEA, 2005). In Asia alone, about 5000 km2 of wetland area are lost annuallyto agriculture, dam construction, and other uses (McAllister et al., 2001). Further, dependence onwater and other resources in this environment has placed enormous pressures on the ecosystemworldwide resulting in direct impacts to species diversity and populations (Molur et al., 2011). As aresult many wetland dependent species including 21% of bird species; 37% of mammal species; and20% of freshwater fish species are either extinct or globally threatened (MEA, 2005).
Loss in wetland area results in adverse impact on the key functions (ecosystem goods and services)performed by wetlands (Zedler and Kercher, 2005). Worldwide, the main causes of wetland loss havebeen: urbanization; land use changes; drainage to agricultural use; infrastructure development; pol-lution from industrial effluent and agricultural runoff; climate change and variability. Some of thesefactors which led to significant alterations in India’s wetland ecosystems have been discussed in thesubsequent sub-sections.
4.1. Urbanization and land use changes
Between 1951 and 2011, total population in India increased from 0.4 billion to 1.2 billion withan average decadal growth rate of around 22%. During the 90 year period from 1901 to 1991, thenumber of urban centres doubled while urban population has increased eightfold (Bassi and Kumar,2012). This magnitude of growth exerted tremendous pressure on wetlands and flood plain areas formeeting water and food demand of growing population. Between 1950–1951 and 2008–2009, totalcultivated land in India increased from about 129 to 156 m ha. Also, area under non-agricultural uses(commercial or residential use) increased from 9 to 26 m ha (Data Source: Indiastat). In most of themajor river basins of India, the increase in area for both agricultural and non-agricultural use wasat the cost of conversion of flood plain areas, primary forests, grasslands and associated freshwaterecosystems to meet demands of growing population (Zhao et al., 2006). For instance, about 34,000 haof the water spread area of the Kolleru lake (Andhra Pradesh) have been reclaimed for agriculture inrecent years (MoEF, n.d.).
Further, there was a large scale development of irrigation and water supply infrastructure in thecountry which altered the inflows and water spread areas of many water bodies. Till 2007, about276 major and 1000 medium irrigation projects were completed in India (Central Water Commission,2010), with an estimated total water storage capacity of about 225 BCM (12% of total water resourcespotential of India). Though, the large reservoir projects have played a critical role in water supply;flood control; irrigation; and hydroelectric power production, the rapid proliferation of artificial waterimpounding structures without proper hydrological and economic planning (such as construction ofsmall dams in semi-arid and arid regions where runoff potential is limited) has caused widespreadloss and fragmentation of freshwater habitats (Kumar et al., 2008; Zhao et al., 2006); and reduction inenvironmental flows (due to over allocation of water mainly for meeting agricultural and industrialwater demands). Already, most of the river basins in southern and western India are experiencingenvironmental water scarcity, which means the discharge in these basins has already been reducedby water withdrawals to such levels that the amount of water left in the basin is less than that requiredby the freshwater dependent ecosystems (Smakhtin et al., 2004).
Urbanization exerts significant influences on the structure and function of wetlands, mainlythrough modifying the hydrological and sedimentation regimes, and the dynamics of nutrients andchemical pollutants. Impact of urbanization is equally alarming on natural water bodies in the cities.A study found that out of 629 water bodies identified in the National Capital Territory (NCT) of Delhi,as many as 232 cannot be revived on account of large scale encroachments (Khandekar, 2011). Sim-ilarly, between 1973 and 2007, Greater Bengaluru Region lost 66 wetlands with a water spread areaof around 1100 ha due to urban sprawl (Ramachandra and Kumar, 2008). Further, poor managementof water bodies, lack of concrete conservation plans, rising pollution, and rapid increase in localized
12 N. Bassi et al. / Journal of Hydrology: Regional Studies 2 (2014) 1–19
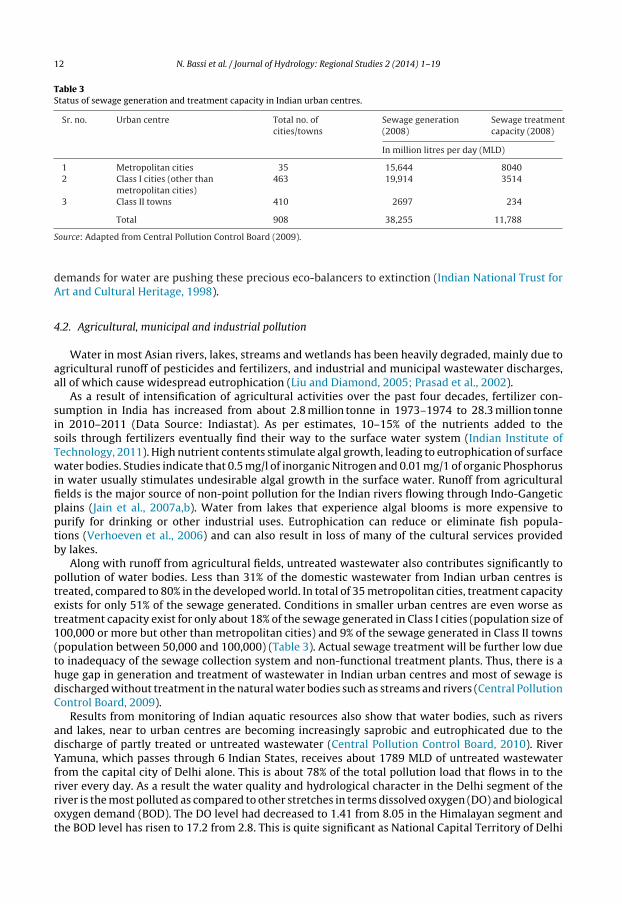
Table 3Status of sewage generation and treatment capacity in Indian urban centres.
Sr. no. Urban centre Total no. ofcities/towns
Sewage generation(2008)
Sewage treatmentcapacity (2008)
In million litres per day (MLD)
1 Metropolitan cities 35 15,644 80402 Class I cities (other than
metropolitan cities)463 19,914 3514
3 Class II towns 410 2697 234
Total 908 38,255 11,788
Source: Adapted from Central Pollution Control Board (2009).
demands for water are pushing these precious eco-balancers to extinction (Indian National Trust forArt and Cultural Heritage, 1998).
4.2. Agricultural, municipal and industrial pollution
Water in most Asian rivers, lakes, streams and wetlands has been heavily degraded, mainly due toagricultural runoff of pesticides and fertilizers, and industrial and municipal wastewater discharges,all of which cause widespread eutrophication (Liu and Diamond, 2005; Prasad et al., 2002).
As a result of intensification of agricultural activities over the past four decades, fertilizer con-sumption in India has increased from about 2.8 million tonne in 1973–1974 to 28.3 million tonnein 2010–2011 (Data Source: Indiastat). As per estimates, 10–15% of the nutrients added to thesoils through fertilizers eventually find their way to the surface water system (Indian Institute ofTechnology, 2011). High nutrient contents stimulate algal growth, leading to eutrophication of surfacewater bodies. Studies indicate that 0.5 mg/l of inorganic Nitrogen and 0.01 mg/1 of organic Phosphorusin water usually stimulates undesirable algal growth in the surface water. Runoff from agriculturalfields is the major source of non-point pollution for the Indian rivers flowing through Indo-Gangeticplains (Jain et al., 2007a,b). Water from lakes that experience algal blooms is more expensive topurify for drinking or other industrial uses. Eutrophication can reduce or eliminate fish popula-tions (Verhoeven et al., 2006) and can also result in loss of many of the cultural services providedby lakes.
Along with runoff from agricultural fields, untreated wastewater also contributes significantly topollution of water bodies. Less than 31% of the domestic wastewater from Indian urban centres istreated, compared to 80% in the developed world. In total of 35 metropolitan cities, treatment capacityexists for only 51% of the sewage generated. Conditions in smaller urban centres are even worse astreatment capacity exist for only about 18% of the sewage generated in Class I cities (population size of100,000 or more but other than metropolitan cities) and 9% of the sewage generated in Class II towns(population between 50,000 and 100,000) (Table 3). Actual sewage treatment will be further low dueto inadequacy of the sewage collection system and non-functional treatment plants. Thus, there is ahuge gap in generation and treatment of wastewater in Indian urban centres and most of sewage isdischarged without treatment in the natural water bodies such as streams and rivers (Central PollutionControl Board, 2009).
Results from monitoring of Indian aquatic resources also show that water bodies, such as riversand lakes, near to urban centres are becoming increasingly saprobic and eutrophicated due to thedischarge of partly treated or untreated wastewater (Central Pollution Control Board, 2010). RiverYamuna, which passes through 6 Indian States, receives about 1789 MLD of untreated wastewaterfrom the capital city of Delhi alone. This is about 78% of the total pollution load that flows in to theriver every day. As a result the water quality and hydrological character in the Delhi segment of theriver is the most polluted as compared to other stretches in terms dissolved oxygen (DO) and biologicaloxygen demand (BOD). The DO level had decreased to 1.41 from 8.05 in the Himalayan segment andthe BOD level has risen to 17.2 from 2.8. This is quite significant as National Capital Territory of Delhi
N. Bassi et al. / Journal of Hydrology: Regional Studies 2 (2014) 1–19 13
extract about 2500 million cubic metres of water per annum from river Yamuna for domestic, industrialand irrigation purposes (Study Group on Environment, n.d.).
4.3. Other threats
Global climate change is expected to become an important driver of loss and change in wet-land ecosystem (MEA, 2005; UNESCO, 2007). These findings are important for Indian subcontinentwhere the mean atmospheric temperature and frequency of occurrence of intense rainfall events hasincreased, while the number of rainy days and total annual amount of precipitation have decreaseddue to increase in the concentration of greenhouse gases such as CO2, CH4 and N2O in the atmosphere(Bates et al., 2008).
Limited analysis on the impact of climate change on wetlands in India suggests that high altitudewetlands and coastal wetlands (including mangroves and coral reefs) are some of the most sensitiveclasses that will be affected by climate change (Patel et al., 2009). For instance, climate change inducedrising level of glacial fed high altitude lakes, such as Tsomoriri in Ladakh, has submerged importantbreeding islands in the lake where endangered migratory birds like the Black-necked Crane and Bar-headed Goose would breed (Chandan et al., 2008). In case of the coastal wetlands such as Indian partof Sunderbans mangrove, rising sea surface temperature and sea level rise due to thermal expan-sion, could affect the fish distribution and lead to the destruction of significant portion of mangroveecosystem. Further destruction of the Sundarbans mangroves would diminish their critical role asnatural buffers against tropical cyclones resulting in loss of lives and livelihoods (Centre for Scienceand Environment, 2012; UNESCO, 2007).
The limited analysis also seems to suggest that the inland natural wetlands, especially those in aridand semi-arid regions, will be impacted through alteration in its hydrological regime due to changes inprecipitation, runoff, temperature and evapo-transpiration (Patel et al., 2009). Climate change inducedrising temperature and declining rainfall pattern presents a potential danger to the already disap-pearing lakes in the Gangetic plains (Sinha, 2011). Decreased precipitation will exacerbate problemsassociated with already growing demands for water and hence alter the freshwater inflows to wetlandecosystems (Bates et al., 2008; Erwin, 2009), whereas, rise in temperature can aggravate the problemof eutrophication, leading to algal blooms, fish kills, and dead zones in the surface water (Gopal et al.,2010). Also, seasonality of runoff in river basins (such as Ganges) will increase along with global warm-ing, that is, wet seasons will become wetter and dry seasons will become drier (World Bank, 2012).This would have severe adverse impact on affected populations, especially if the seasonality of runoffchange would be out of phase with that of demand.
As per estimates, India will lose about 84% of coastal wetlands and 13% of saline wetlands withclimate change induced sea water rise of 1 m (Blankespoor et al., 2012). As a result there will beadverse consequences on wetland species, especially those that cannot relocate to suitable habitats,as well as migratory species that rely on a variety of wetland types throughout their life cycle. However,it must be noted that projections about the extent of loss and degradation or decline of wetlands arenot yet well established as climate models used for such predictions are not robust. It is not clear howthe regions’ temporal and spatial variability in rainfall gets captured by these models. Further, there istendency to attribute hydrological regime changes in wetlands to climate change, rather than tryingto find the real physical and socio-economic processes responsible for such changes (Kumar, 2013).
5. Institutional strategies adopted for wetland management in India
In India, wetlands continue to be seen in isolation and hardly figure in water resources managementand development plans. The primary responsibility for the management of these ecologically sensitiveecosystems is in the hands of the Ministry of Environment and Forests (MoEF), Government of India.Though India is signatory to both Ramsar Convention on Wetlands and the Convention of BiologicalDiversity, there seem to be no clear cut regulatory framework for conservation of wetlands. In thesubsequent sub-sections wetland management strategies including the legal framework and policysupport for wetland conservation will be discussed.
14 N. Bassi et al. / Journal of Hydrology: Regional Studies 2 (2014) 1–19
5.1. Legal framework
Though there is no separate legal provision for wetland conservation in India, it is indirectly influ-enced by number of other legal instruments. These include: Indian Fisheries Act 1857, Indian ForestAct 1927, Wildlife (Protection) Act 1972, Water (Prevention and Control of Pollution) Act 1974, Ter-ritorial Water, Continental Shelf, Exclusive Economic Zone and other Marine Zones Act 1976, WaterCess Act 1977, Maritime Zone of India (Regulation and fishing by foreign vessels) Act 1980, Forest(Conservation) Act 1980, Environmental (Protection) Act 1986, Wildlife (Protection) Amendment Act1991, Biodiversity Act 2002, and Scheduled Tribes and Other Traditional Forest Dwellers (Recognitionof Forest Rights) Act 2006 (MoEF, 2007; Prasad et al., 2002).
Provisions under these acts range from protection of water quality and notification of ecologicallysensitive areas to contributing towards conserving, maintaining, and augmenting the floral, faunaland avifaunal biodiversity of the country’s aquatic bodies. However, the term wetland was not usedspecifically in any of these legal instruments.
5.2. Policy support
Until the early part of 2000, the policy support for wetland conservation in India was virtuallynon-existent. The action on wetland management was primarily influenced by the international com-mitments made under Ramsar Convention and indirectly through array of other policy measures,such as, National Conservation Strategy and Policy Statement on Environment and Development,1992; Coastal Zone Regulation Notification, 1991; National Policy and Macro level Action Strategy onBiodiversity, 1999; and National Water Policy, 2002 (MoEF, 2007; Prasad et al., 2002).
As a signatory to Ramsar Convention on Wetlands and recognizing the importance of protectingsuch water bodies, the Government of India identified two sites, i.e. Chilika lake (Orissa) and KeoladeoNational Park (Rajasthan), as Ramsar Wetlands of International Importance in 1981 (MoEF, 2012).Thereafter in 1985–1986, National Wetland Conservation Programme (NWCP) was launched in closecollaboration with concerned State Governments. Initially, only designated Ramsar Sites were iden-tified for conservation and management under the Programme (MoEF, 2007). Several measures weretaken to arrest further degradation and shrinkage of the identified water bodies due to encroachment,siltation, weed infestation, catchment erosion, agricultural run-off carrying pesticides and fertilizers,and wastewater discharge. Subsequently in 1993, National Lake Conservation Plan (NLCP) was carvedout of NWCP to focus on lakes particularly those located in urban and peri-urban areas which aresubjected to anthropogenic pressures. Initially, only 10 lakes were identified for conservation andmanagement under the plan (MoEF, 2007). There is also a National River Conservation Plan (NRCP),operational since 1995, with an objective to improve the water quality of the major Indian riversthrough the implementation of pollution abatement works, to the level of designated best use. The newdraft National Water Policy, 2012 which is cleared recently by the National Water Resources Councilalso recognizes the need for conservation of river corridors and water bodies (including wetlands) in ascientifically planned manner. Further, the policy emphasizes that the environmental needs of aquaticeco-system, wetlands and embanked flood plains should be recognized and taken into considerationwhile planning for water resources conservation (Ministry of Water Resources, 2012).
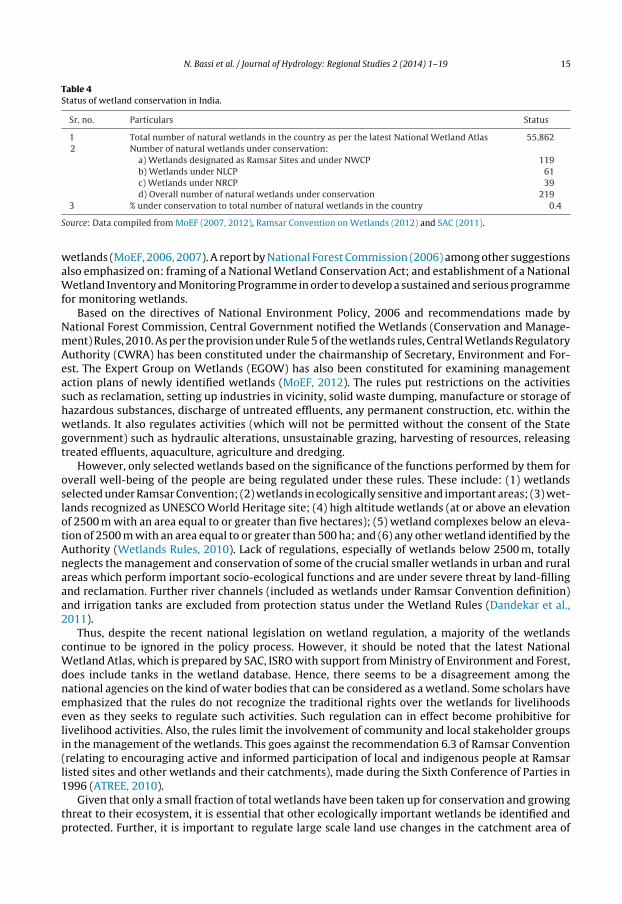
Over the years, number of designated Ramsar Sites has increased to 26 (Ramsar Convention onWetlands, 2012), number of rivers under NRCP has increased to 39 and number of wetlands covered bythe NWCP and NLCP has increased to 115 and 61 respectively (MoEF, 2012). However these initiativesproved to be too little considering the extent of ecologically sensitive wetland ecosystems in thecountry and the fact that only a selected few wetlands were taken up for conservation and managementpurpose (Dandekar et al., 2011) (Table 4).
Lately, the National Environmental Policy 2006 recognized the importance of wetlands in providingnumerous ecological services (MoEF, 2006). The policy, for the first time, accepted that there is noformal system of wetland regulation in the country outside the international commitments madein respect of Ramsar sites and thus there is a need of legally enforceable regulatory mechanism foridentified valuable wetlands, to prevent their degradation and enhance their conservation (Dandekaret al., 2011; MoEF, 2006). Further, the policy advocated, developing of National inventory of such
N. Bassi et al. / Journal of Hydrology: Regional Studies 2 (2014) 1–19 15
Table 4Status of wetland conservation in India.
Sr. no. Particulars Status
1 Total number of natural wetlands in the country as per the latest National Wetland Atlas 55,8622 Number of natural wetlands under conservation:
a) Wetlands designated as Ramsar Sites and under NWCP 119b) Wetlands under NLCP 61c) Wetlands under NRCP 39d) Overall number of natural wetlands under conservation 219
3 % under conservation to total number of natural wetlands in the country 0.4
Source: Data compiled from MoEF (2007, 2012), Ramsar Convention on Wetlands (2012) and SAC (2011).
wetlands (MoEF, 2006, 2007). A report by National Forest Commission (2006) among other suggestionsalso emphasized on: framing of a National Wetland Conservation Act; and establishment of a NationalWetland Inventory and Monitoring Programme in order to develop a sustained and serious programmefor monitoring wetlands.
Based on the directives of National Environment Policy, 2006 and recommendations made byNational Forest Commission, Central Government notified the Wetlands (Conservation and Manage-ment) Rules, 2010. As per the provision under Rule 5 of the wetlands rules, Central Wetlands RegulatoryAuthority (CWRA) has been constituted under the chairmanship of Secretary, Environment and For-est. The Expert Group on Wetlands (EGOW) has also been constituted for examining managementaction plans of newly identified wetlands (MoEF, 2012). The rules put restrictions on the activitiessuch as reclamation, setting up industries in vicinity, solid waste dumping, manufacture or storage ofhazardous substances, discharge of untreated effluents, any permanent construction, etc. within thewetlands. It also regulates activities (which will not be permitted without the consent of the Stategovernment) such as hydraulic alterations, unsustainable grazing, harvesting of resources, releasingtreated effluents, aquaculture, agriculture and dredging.
However, only selected wetlands based on the significance of the functions performed by them foroverall well-being of the people are being regulated under these rules. These include: (1) wetlandsselected under Ramsar Convention; (2) wetlands in ecologically sensitive and important areas; (3) wet-lands recognized as UNESCO World Heritage site; (4) high altitude wetlands (at or above an elevationof 2500 m with an area equal to or greater than five hectares); (5) wetland complexes below an eleva-tion of 2500 m with an area equal to or greater than 500 ha; and (6) any other wetland identified by theAuthority (Wetlands Rules, 2010). Lack of regulations, especially of wetlands below 2500 m, totallyneglects the management and conservation of some of the crucial smaller wetlands in urban and ruralareas which perform important socio-ecological functions and are under severe threat by land-fillingand reclamation. Further river channels (included as wetlands under Ramsar Convention definition)and irrigation tanks are excluded from protection status under the Wetland Rules (Dandekar et al.,2011).
Thus, despite the recent national legislation on wetland regulation, a majority of the wetlandscontinue to be ignored in the policy process. However, it should be noted that the latest NationalWetland Atlas, which is prepared by SAC, ISRO with support from Ministry of Environment and Forest,does include tanks in the wetland database. Hence, there seems to be a disagreement among thenational agencies on the kind of water bodies that can be considered as a wetland. Some scholars haveemphasized that the rules do not recognize the traditional rights over the wetlands for livelihoodseven as they seeks to regulate such activities. Such regulation can in effect become prohibitive forlivelihood activities. Also, the rules limit the involvement of community and local stakeholder groupsin the management of the wetlands. This goes against the recommendation 6.3 of Ramsar Convention(relating to encouraging active and informed participation of local and indigenous people at Ramsarlisted sites and other wetlands and their catchments), made during the Sixth Conference of Parties in1996 (ATREE, 2010).
Given that only a small fraction of total wetlands have been taken up for conservation and growingthreat to their ecosystem, it is essential that other ecologically important wetlands be identified andprotected. Further, it is important to regulate large scale land use changes in the catchment area of
16 N. Bassi et al. / Journal of Hydrology: Regional Studies 2 (2014) 1–19
wetlands and also prevent them from getting polluted in order to maintain their hydrological and eco-logical integrity. For achieving the second objective, an effective and proper water quality monitoringplan needs to be devised.
6. Conclusion
In India, wetland ecosystems support diverse and unique habitats and are distributed across var-ious topographic and climatic regimes. They are considered to be a vital part of hydrological cycleand are highly productive systems in their natural forms. Wetlands not only support large biologi-cal diversity but also provide a wide array of ecosystem goods and services (Wetlands Rules, 2010).In India, wetlands provide multiple services, including irrigation, domestic water supply, freshwa-ter fisheries and water for recreation. They are also playing important role in groundwater recharge,flood control, carbon sequestration and pollution abatement. However, management of wetlands hasreceived inadequate attention in the national water sector agenda. As a result, many of the wetlandsin urban and rural areas are subject to anthropogenic pressures, including land use changes in thecatchment; pollution from industry and households; encroachments; tourism; and over exploitationof their natural resources.
India is signatory to Ramsar Convention on Wetlands and has drafted Wetland (Conversation andManagement) Rules in 2010 but still no significant progress has been made on the conservation andwise use of wetlands. The main reason is that only selected number of wetlands has received significantattention (by way of financial and technical assistance from the central government) under the wetlandconservation programmes (like NWCP and NLCP) while the remaining ones continue to be in neglectedstate.
Majority of research work on wetland management in India relates to the limnological aspectsand ecological/environmental economics of wetland management. But, the physical (such as hydro-logical and land-use changes in the catchment) and socio-economic (such as population growth andchanges in economic activities) processes leading to limnological changes have not been explored sub-stantially. Further, the institutional aspects (policies, rules, regulation and organizations) of wetlandmanagement have received limited attention and attracted the imagination of research scholars onlyrecently. Thus more research emphasis on the physical, socio-economic and institutional factors influ-encing condition of wetlands and their use is required in order to arrive at better and comprehensivemanagement strategies for wetlands that are facing growing stress from a variety of anthropogenicand climatic factors.
Conflict of interest
We declare that there is no conflict of interest associated with this manuscript.
References
Agarwal, M., 2011. Migratory birds in India: migratory birds dwindling. Nature December.Ashoka Trust for Research in Ecology and the Environment (ATREE), 2010. Comments on Draft Wetlands (Conservation and
Management) Rules 2009. Ashoka Trust for Research in Ecology and the Environment, Bangalore.Badola, R., Hussain, S.A., 2005. Valuing ecosystem functions: an empirical study on the storm protection function of Bhitarkanika
mangrove ecosystem, India. Environ. Conserv. 32 (1), 85–92.Balasubramanian, R., Selvaraj, K.N., 2003. Poverty, Private Property and Common Pool Resource Management: The Case of
Irrigation Tanks in South India. [Working Paper No. 2]. South Asian Network for Development and Environmental Economics,Kathmandu, Nepal.
Bassi, N., Kumar, M.D., 2012. Addressing the civic challenges: perspective on institutional change for sustainable urban watermanagement in India. Environ. Urban. Asia 3 (1), 165–183.
Bates, B.C., Kundzewicz, Z.W., Wu, S., Palutikof, J.P. (Eds.), 2008. Climate Change and Water. [Technical Paper VI]. Intergovern-mental Panel on Climate Change, Geneva.
Billore, S.K., Singh, N., Sharma, J.K., Dass, P., Nelson, R.M., 1999. Horizontal subsurface flow gravel bed constructed wetland withPhragmites karka in Central India. Water Sci. Technol. 40 (3), 163–171.
Blankespoor, B., Dasgupta, S., Laplante, B., 2012. Sea-level Rise and Coastal Wetlands: Impacts and Costs. [Policy ResearchWorking Paper 6277]. The World Bank, Washington, DC.
Boyd, J., Banzhaf, S., 2007. What are ecosystem services? The need for standardized environmental accounting units. Ecol. Econ.63 (2–3), 616–626.
N. Bassi et al. / Journal of Hydrology: Regional Studies 2 (2014) 1–19 17
Bystrom, O., Andersson, H., Gren, I., 2000. Economic criteria for using wetlands as nitrogen sinks under uncertainty. Ecol. Econ.35 (1), 35–45.
Central Ground Water Board (CGWB), 2011. Select Case Studies: Rain Water Harvesting and Artificial Recharge. Central GroundWater Board, Ministry of Water Resources, New Delhi.
Central Pollution Control Board (CPCB), 2008. Status of Water Quality in India 2007. Central Pollution Control Board, Ministryof Environment and Forests, Government of India, New Delhi.
Central Pollution Control Board (CPCB), 2009. Status of Water Supply, Wastewater Generation and Treatment in Class-I Citiesand Class-II Towns of India. Central Pollution Control Board, Ministry of Environment and Forests, Government of India,New Delhi.
Central Pollution Control Board (CPCB), 2010. Status of Water Quality in India 2009. Central Pollution Control Board, Ministryof Environment and Forests, Government of India, New Delhi.
Central Water Commission (CWC), 2009. National Register of Large Dams 2009. Central Water Commission, New Delhi.Central Water Commission (CWC), 2010. Financial Aspects of Irrigation Projects in India. Central Water Commission, New Delhi.Centre for Science and Environment (CSE), 2012. Living With Changing Climate: Impact, Vulnerability and Adaptation Challenges
in Indian Sundarbans. Centre for Science and Environment, New Delhi.Chandan, P., Chatterjee, A., Gautam, P., 2008. Management planning of Himalayan high altitude wetlands: a case study of
Tsomoriri and Tsokar wetlands in Ladakh, India. In: Sengupta, M., Dalwani, R. (Eds.), Proceedings of Taal 2007: The 12thWorld Lake Conference. Jaipur, India, 28 October–2 November 2007. Ministry of Environment and Forest, Government ofIndia, New Delhi.
Cowardin, L.M., Carter, V., Golet, F.C., LaRoe, E.T., 1979. Classification of Wetlands and Deepwater Habitats of the United States.U.S. Department of the Interior, Fish and Wildlife Service, Washington, DC.
Dandekar, P., Bhattacharya, S., Thakkar, H., 2011, February. Wetland (Conservation and Management) Rules 2010, Welcome,But a Lost Opportunity: This Cannot Help Protect the Wetlands, Sir [Note]. South Asia Network on Dams, Rivers & People,New Delhi.
Das, A., GI, R., Choudhury, B.U., Munda, G.C., Patel, D.P., Ngachan, S.V., Ghosh, P.K., Tripathi, A.K., Das, S., Kumar, M., 2012. Naturalresource conservation through indigenous farming systems: wisdom alive in north-east India. Indian J. Tradit. Knowl. 11(3), 505–513.
Dhir, B., Sharmila, P., Saradhi, P.P., 2009. Potential of aquatic macrophytes for removing contaminants from the environment.Crit. Rev. Environ. Sci. Technol. 39 (9), 754–781.
Erwin, K.L., 2009. Wetlands and global climate change: the role of wetland restoration in a changing world. Wetl. Ecol. Manage.17 (1), 71–84.
Finlayson, C.M., Spiers, A.G. (Eds.), 1999. Global Review of Wetland Resources and Priorities for Wetland Inventory. SupervisingScientist, Canberra, Australia.
Ganga Flood Control Commission (GFCC), 2012. Annual Report 2010–2011. Ganga Flood Control Commission, Ministry of WaterResources, Government of India, Patna.
Garg, J.K., Singh, T.S., Murthy, T.V.R., 1998. Wetlands of India. SAC, Indian Space Research Organisation, Ahmedabad.Ghermandi, A., van den Bergh, J.C.J.M., Brander, L.M., de Groot, H.L.F., Nunes, P.A.L.D., 2010. Values of natural and human-made
wetlands: a meta-analysis. Water Resour. Res. 46 (12), 1–12.Ghermandi, A., van den Bergh, J.C.J.M., Brander, L.M., Nunes, P.A.L.D., 2008. The Economic Value of Wetland Conservation and
Creation: A Meta-Analysis. [Working Paper 79]. Fondazione Eni Enrico Mattei, Milan, Italy.Gopal, B., Sah, M., 1995. Inventory and classification of wetlands in India. Vegetatio 118 (1–2), 39–48.Gopal, B., Shilpakar, R., Sharma, E., 2010. Functions and Services of Wetlands in the Eastern Himalayas: Impacts of Climate
Change [Technical Report 3]. International Centre for Integrated Mountain Development, Kathmandu, Nepal.Government of India (GoI), 2012. Economic survey (2011–2012). Oxford University Press, New Delhi.Groffman, P.M., Crawford, M.K., 2003. Denitrification potential in urban riparian zones. J. Environ. Qual. 32 (3), 1144–1149.Hansson, L., Bronmark, C., Nilsson, P.A., Abjornsson, K., 2005. Conflicting demands on wetland ecosystem services: nutrient
retention, biodiversity or both? Freshw. Biol. 50 (4), 705–714.Indian Institute of Technology (IIT), 2011. Trends in Agriculture and Agricultural Practices in Ganga Basin: An Overview. Indian
Institute of Technology, Kanpur, India.Indian National Trust for Art and Cultural Heritage (INTACH), 1998. Delhi’s Dying Water Bodies. Indian National Trust for Art
and Cultural Heritage, New Delhi.Intergovernmental Panel on Climate Change (IPCC), 2000. Special Report on Land Use, Land-Use Change, and Forestry: Summary
for Policymakers. Intergovernmental Panel on Climate Change, Geneva, Switzerland.Jain, C.K., Singhal, D.C., Sharma, M.K., 2007a. Estimating nutrient loadings using chemical mass balance approach. Environ.
Monit. Assess. 134 (1–3), 385–396.Jain, S.K., Agarwal, P.K., Singh, V.P., 2007b. Hydrology and Water Resources of India. Springer, The Netherlands.Juliano, K., Simonovic, S.P., 1999. The Impact of Wetlands on Flood Control in the Red River Valley. Natural Resource Institute,
University of Manitoba, Manitoba, Canada.Juwarkar, A.S., Oke, B., Juwarkar, A., Patnaik, S.M., 1995. Domestic wastewater treatment through constructed wetland in India.
Water Sci. Technol. 32 (3), 291–294.Kadlec, R.H., Reddy, K.R., 2001. Temperature effects in treatment wetlands. Water Environ. Res. 73 (5), 543–557.Kadlec, R.H., Wallace, S.D., 2009. Treatment Wetlands, 2nd ed. CRC Press, USA.Kathiresan, K., Thakur, S., 2008. Mangroves for the Future: National Strategy and Action Plan, India. Ministry of Environment
and Forests, New Delhi [Revised Draft].Kaur, R., Dhir, G., Kumar, P., Laishram, G., Ningthoujam, D., Sachdeva, P., 2012. Constructed wetland technology for treating
municipal wastewaters. ICAR News 18 (1), 8–9.Khandekar, N., 2011. Delhi water bodies go under, almost. Hindustan Times February.Kumar, M.D., 2013. Climate in India: key features of the variables. In: Kumar, M.D. (Ed.), Water Insecurity and Climate Variability
in India: Theoretical Understanding and Practical Programming. Institute for Resource Analysis and Policy and South AsiaConsortium for Interdisciplinary Water Resources Studies, Hyderabad.
18 N. Bassi et al. / Journal of Hydrology: Regional Studies 2 (2014) 1–19
Kumar, M.D., Panda, R., Niranjan, V., Bassi, N., 2013a. Technology choices and institutions for improving economic and livelihoodbenefits from multiple uses tanks in western Orissa. In: Kumar, M.D., Sivamohan, M.V.K., Bassi, N. (Eds.), Water Management,Food Security and Sustainable Agriculture in Developing Economies. Routledge, Oxford, UK (Chapter 8).
Kumar, M.D., Bassi, N., Sivamohan, M.V.K., Venkatachalam, L., 2013b. Agriculture in West Bengal: can the new policies triggera second green revolution? Rev. Dev. Change 18 (1).
Kumar, M.D., Patel, A., Ravindranath, R., Singh, O.P., 2008. Chasing a mirage: water harvesting and artificial recharge in naturallywater-scarce regions. Econ. Polit. Wkly. 43 (35), 61–71.
Lal, R., 2008. Carbon sequestration. Philos. Trans. Roy. Soc. B 363 (1), 815–830.Lalchandani, N., 2012. Green zones packed as avian guests flocked. The Times of India December, 4.Lehner, B., Döll, P., 2004. Development and validation of a global database of lakes, reservoirs and wetlands. J. Hydrol. 296 (1–4),
1–22.Liu, J.G., Diamond, J., 2005. China’s environment in a globalizing world. Nature 435 (June), 1179–1186.McAllister, D.E., Craig, J.F., Davidson, N., Delany, S., Seddon, M., 2001. Biodiversity Impacts of Large Dams. International Union
for Conservation of Nature and United Nations Environmental Programme, Gland and Nairobi.Millennium Ecosystem Assessment (MEA), 2005. Ecosystems and Human Well-being: Wetlands and Water Synthesis. World
Resources Institute, Washington, DC.Ministry of Agriculture (MoA), 2012. Annual Report 2011–2012. Department of Animal Husbandry, Dairying & Fisheries, Ministry
of Agriculture, Government of India, New Delhi.Ministry of Environment and Forests (MoEF), 1990. Wetlands of India: A Directory. MoEF, Government of India, New Delhi.Ministry of Environment and Forests (MoEF), 2006. National Environmental Policy. MoEF, Government of India, New Delhi.Ministry of Environment and Forests (MoEF), 2007. Conservation of Wetlands in India: A Profile (Approach and Guidelines).
MoEF, Government of India, New Delhi.Ministry of Environment and Forests (MoEF), 2012. Annual Report 2011–2012. MoEF, Government of India, New Delhi.Ministry of Environment and Forests (MoEF), n.d. Wetlands of India: a directory. New Delhi: MoEF, Government of India.Ministry of Water Resources (MoWR), 2012. National Water Policy. Ministry of Water Resources, Government of India, New
Delhi.Molur, S., Smith, K.G., Daniel, B.A., Darwall, W.R.T., 2011. The Status and Distribution of Freshwater Biodiversity in the Western
Ghats, India. International Union for Conservation of Nature, Cambridge and Gland.Mosse, D., 1999. Colonial and contemporary ideologies of ‘community management’: the case of tank irrigation development
in south India. Mod. Asian Stud. 33 (2), 303–338.National Forest Commission, 2006. Report of the National Forest Commission. MoEF, Government of India, New Delhi.Neiland, A.E., Bene, C. (Eds.), 2008. Tropical River Fisheries Valuation: Background Papers to a Global Synthesis. [Studies and
Reviews 1836]. The WorldFish Center, Penang, Malaysia.Palanisami, K., Meinzen-Dick, R., Giordano, M., 2010. Climate change and water supplies: options for sustaining tank irrigation
potential in India. Econ. Polit. Wkly. 45 (26–27), 183–190.Pant, H.K., Rechcigl, J.E., Adjei, M.B., 2003. Carbon sequestration in wetlands: concept and estimation. Food Agric. Environ. 1 (2),
308–313.Pant, N., Verma, R.K., 2010. Tanks in Eastern India: A Study in Exploration. International Water Management Institute-TATA
Water Policy Research Program and Centre for Development Studies, Hyderabad and Lucknow, India.Patel, J.G., Murthy, T.V.R., Singh, T.S., Panigrahy, S., 2009. Analysis of the distribution pattern of wetlands in India in relation
to climate change. In: Panigrahy, S., Shankar Ray, S., Parihar, J.S. (Eds.), Proceedings of the Workshop on Impact of ClimateChange on Agriculture. Ahmedabad, India, 17–18 December. International Society for Photogrammetry and Remote Sensing,Ahmedabad.
Prasad, S.N., Ramachandra, T.V., Ahalya, N., Sengupta, T., Kumar, A., Tiwari, A.K., Vijayan, V.S., Vijayan, L., 2002. Conservation ofwetlands of India – a review. Trop. Ecol. 43 (1), 173–186.
Rai, P.K., 2008. Heavy metal pollution in aquatic ecosystems and its phytoremediation using wetland plants: an ecosustainableapproach. Int. J. Phytoremed. 10 (2), 133–160.
Ramachandra, T.V., Kumar, U., 2008. Wetlands of greater Bangalore, India: automatic delineation through pattern classifiers.Electr. Green J. 1 (26), 1–22.
Ramsar Convention on Wetlands and World Tourism Organization (WTO), 2012. Destination Wetlands: Supporting SustainableTourism. The Secretariat of the Convention on Wetlands and World Tourism Organization, Gland and Madrid.
Ramsar Convention on Wetlands, 2012, September. The Annotated Ramsar List: India. [Briefing Note]. The Secretariat of theConvention on Wetlands, Gland, Switzerland.
Ramsar Secretariat, 2013. The List of Wetlands of International Importance. The Secretariat of the Convention on Wetlands,Gland, Switzerland.
Sarkar, U.K., Ponniah, A.G. (Eds.), 2005. Evaluation of North-east Indian Fishes for Their Potential as Cultivable, Sport andOrnamental Fishes Along With Their Conservation and Endemic Status. National Bureau of Fish Genetic Resources, Lucknow,India.
Sharma, B.K., 2009a. Composition, abundance and ecology of phytoplankton communities of Loktak lake, Manipur, India. J.Threat. Taxa 1 (8), 401–410.
Sharma, B.K., 2009b. Diversity of rotifers (Rotifera, Eurotatoria) of Loktak lake, Manipur, North-eastern India. Trop. Ecol. 50 (2),277–285.
Sinha, C.P., 2011. Climate change and its impacts on the wetlands of North Bihar, India. Lakes Reserv.: Res. Manage. 16 (2),109–111.
Smakhtin, V., Revenga, C., Döll, P., 2004. A pilot global assessment of environmental water requirements and scarcity. WaterInt. 29 (3), 307–317.
Space Applications Centre (SAC), 2011. National Wetland Atlas. SAC, Indian Space Research Organisation, Ahmedabad.Study Group on Environment, n.d. Report of the study group on environment including tourism, heritage, pollution & disaster
management. New Delhi: National Capital Region Planning Board.
N. Bassi et al. / Journal of Hydrology: Regional Studies 2 (2014) 1–19 19
ten Brink, P., Badura, T., Farmer, A., Russi, D., 2012. The Economics of Ecosystem and Biodiversity for Water and Wetlands: ABriefing Note. Institute for European Environmental Policy, London.
Turner, R.K., van der Bergh, J.C.J.M., Soderqvist, T., Barendregt, A., van der Straaten, J., Maltby, E., van Ierland, E.C., 2000. Ecological-economic analysis of wetlands: scientific integration for management and policy. Ecol. Econ. 35 (1), 7–23.
United Nations Educational, Scientific and Cultural Organization (UNESCO), 2007. Case Studies on Climate Change and WorldHeritage. UNESCO World Heritage Centre, France.
van der Valk, A.G., Jolly, R.W., 1992. Recommendations for research to develop guidelines for the use of wetlands to controlrural nonpoint source pollution. Ecol. Eng. 1 (1–2), 115–134.
Verhoeven, J.T.A., Arheimer, B., Yin, C., Hefting, M.M., 2006. Regional and global concerns over wetlands and water quality.Trends Ecol. Evol. 21 (2), 96–103.
Verma, A., Subramanian, V., Ramesh, R., 2002. Methane emissions from a coastal lagoon: Vembanad Lake, west coast, India.Chemosphere 47 (1), 883–889.
Verma, M., 2001. Economic Valuation of Bhoj Wetlands for Sustainable Use. [EERC Working Paper Series: WB-9]. Indian Instituteof Forest Management, Bhopal.
2010. Wetlands (Conservation and Management) Rules. Ministry of Environment and Forests, Government of India, New Delhi.Woistencroft, J.A., Hussain, S.A., Varshney, C.K., 1989. India: introduction. In: Scott, D.A. (Ed.), A Directory of Asian Wetlands.
International Union for Conservation of Nature, Switzerland (Chapter 10).World Bank, 2012. Turn Down the Heat: Why a 4 ◦C Warmer World Must Be Avoided. The World Bank, Washington, DC.World Wide Fund for Nature (WWF) and Asian Wetland Bureau (AWB), 1993. Directory of Indian Wetlands. World Wide Fund
for Nature and Asian Wetland Bureau, New Delhi and Kuala Lumpur.Wylynko, D. (Ed.), 1999. Prairie Wetlands and Carbon Sequestration: Assessing Sinks Under the Kyoto Protocol. International
Institute for Sustainable Development, Manitoba, Canada.Zedler, J.B., Kercher, S., 2005. Wetland resources: status, trends, ecosystem services, and restorability. Annu. Rev. Environ.
Resour. 30 (1), 39–74.Zhao, S., Peng, C., Jiang, H., Tian, D., Lei, X., Zhou, X., 2006. Land use change in Asia and the ecological consequences. Ecol. Res.
21 (6), 890–896.