Embed Size (px)
Citation preview

CONTENTS HAPPINESS IN NATIONS
Foreword
Part I ASSESSING LIVABILITY OF NATIONS BY HAPPINESS chapter 1. Quest for The Good Society 1chapter 2. Criteria for the evaluation of human societies 4chapter 3. Indicators of livability of societies 8 chapter 4. Measures of happiness 16chapter 5. Validity of happiness as indicator of livability 26 chapter 6. Data about happiness in nations 46 chapter 7. Comparability of the data 51 chapter 8. Uses of this data-collection 66
Part II HAPPINESS IN REPRESENTATIVE NATION SAMPLES sectio 1. Overall happiness 1
sectio 2. Hedonic level of affect 88sectio 3. Contentment 102 sectio 4. Mixed indicators 105
Part III HAPPINESS IN SOCIAL CATEGORIES IN NATIONS 1
section A. Highschool pupils 2 section B. Young adults (age 18-24) 7section C. University Students 12 section D. Young and middle adults (age 15-40) 21
Part IV REVIEW OF DATA BY COUNTRY 1
World Database of Happiness
References
i
PART II HAPPINESS IN REPRESENTATIVE NATION SAMPLES
Section 1 OVERALL HAPPINESS 11.1 Single questions on happiness-in-life 1.2 Single questions on satisfaction-with-life 1.3 Single questions on Best-Worst possible life 1.4 Single quesions on Delighted-Terrible life 1.5 Further questions on appreciation of life
Section 2 HEDONIC LEVEL OF AFFECT 882.1 Single question on usual feeling 2.2 Multiple questions about specific affects
in the past few weeks 2.3 Ratings of cheerfull appearance
Section 3 CONTENTMENT 102 3 Single question on realisation of aspiration
Section 4 MIXED INDICATORS 1054 Single questions that tap both
overall happiness and hedonic level

Table 1.1.1.a 3 step happiness Single direct questions on happiness in general (type HAP 1.1) Typical item (H1): `IN GENERAL, HOW HAPPY WOULD YOU SAY YOU ARE?: O VERY HAPPY (3) O FAIRLY HAPPY (2) O NOT VERY HAPPY (1) __________________________________________________________________________________________________________________________ Country2 Year/ Question1 Proportions3 Mean5 N Source month ____________________ __________ 3 2 1 DK6 1-3 0-10 Survey name4 Published in NA ________________________________________________________________________________________________________________________ AFRICA South Sahara Africa2 1975 H8 18 50 31 1 1.87 6.26 914 Kettering Survey Gallup 1976:465 ANGLO-AMERICA2 1975 H8 40 51 8 1 2.32 7.44 2046 Kettering Survey Gallup 1976:Q9 Canada 1946/10 H2 32 55 13 * 2.19 7.11 Wessman 1956:166 1975 H8 36 59 4 1 2.32 7.46 1032 Kettering Survey Gallup 1976:Q9 U.S.A 1946/2 H2 46 45 8 1 2.38 7.58 2377 POS-417 Wessman 1956:170 1946/4 H2 39 50 9 2 2.31 7.36 3152 AIPO-369 Wessman 1956:170 1947/6 H3 38 57 4 1 2.34 7.35 3089 AIPO-399 Wessman 1956:170 1947/9-48/1 H1 43 47 10 * 2.33 7.42 1416 AIPO-410T Smith 1979:22 1948/5 H5 36 54 9 1 2.27 7.27 1627 AIPO-418 Wessman 1956:170 1948/9 H6 43 44 12 1 2.31 7.25 1596 AIPO-425K NIPO 1949/1 p.3-4 1952/11 H7 47 43 9 1 2.38 7.61 2862 AIPO-508 Wessman 1956:170
Happiness in Nations IITable 1.1.1. a
1 Representive Nation Samples
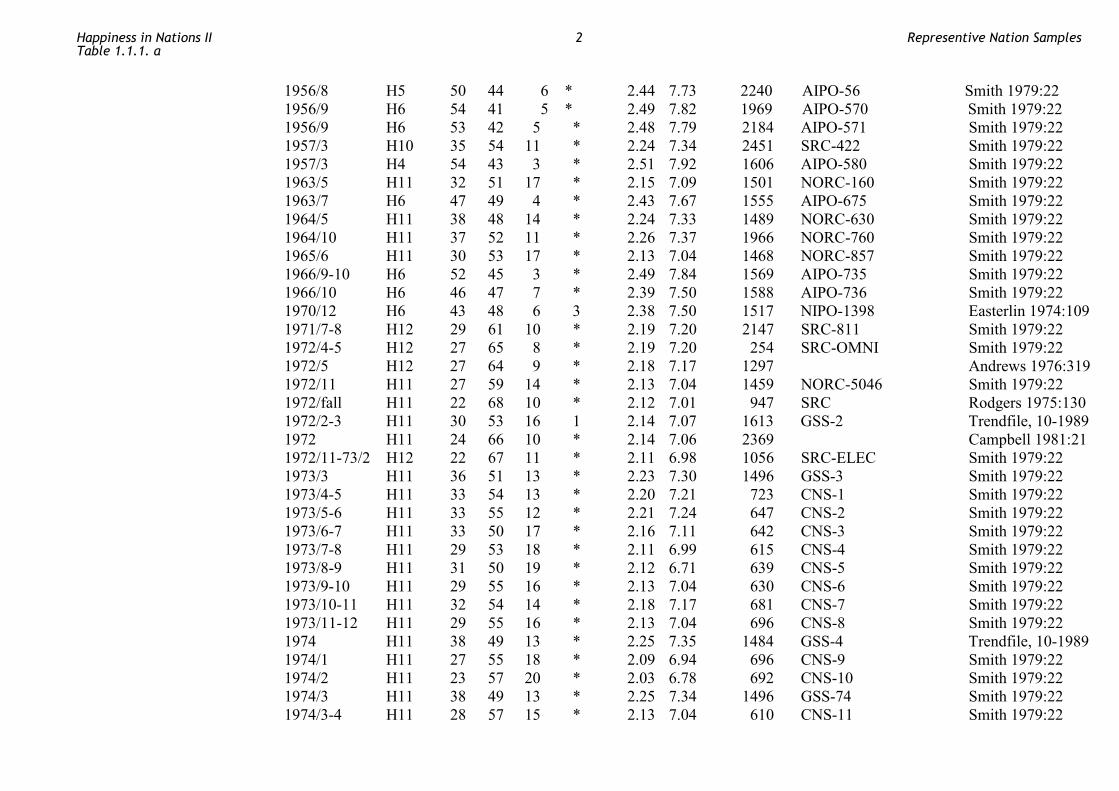
1956/8 H5 50 44 6 * 2.44 7.73 2240 AIPO-56 Smith 1979:22 1956/9 H6 54 41 5 * 2.49 7.82 1969 AIPO-570 Smith 1979:22
1956/9 H6 53 42 5 * 2.48 7.79 2184 AIPO-571 Smith 1979:22 1957/3 H10 35 54 11 * 2.24 7.34 2451 SRC-422 Smith 1979:22 1957/3 H4 54 43 3 * 2.51 7.92 1606 AIPO-580 Smith 1979:22 1963/5 H11 32 51 17 * 2.15 7.09 1501 NORC-160 Smith 1979:22 1963/7 H6 47 49 4 * 2.43 7.67 1555 AIPO-675 Smith 1979:22 1964/5 H11 38 48 14 * 2.24 7.33 1489 NORC-630 Smith 1979:22 1964/10 H11 37 52 11 * 2.26 7.37 1966 NORC-760 Smith 1979:22 1965/6 H11 30 53 17 * 2.13 7.04 1468 NORC-857 Smith 1979:22 1966/9-10 H6 52 45 3 * 2.49 7.84 1569 AIPO-735 Smith 1979:22 1966/10 H6 46 47 7 * 2.39 7.50 1588 AIPO-736 Smith 1979:22 1970/12 H6 43 48 6 3 2.38 7.50 1517 NIPO-1398 Easterlin 1974:109 1971/7-8 H12 29 61 10 * 2.19 7.20 2147 SRC-811 Smith 1979:22 1972/4-5 H12 27 65 8 * 2.19 7.20 254 SRC-OMNI Smith 1979:22 1972/5 H12 27 64 9 * 2.18 7.17 1297 Andrews 1976:319 1972/11 H11 27 59 14 * 2.13 7.04 1459 NORC-5046 Smith 1979:22 1972/fall H11 22 68 10 * 2.12 7.01 947 SRC Rodgers 1975:130 1972/2-3 H11 30 53 16 1 2.14 7.07 1613 GSS-2 Trendfile, 10-1989 1972 H11 24 66 10 * 2.14 7.06 2369 Campbell 1981:21 1972/11-73/2 H12 22 67 11 * 2.11 6.98 1056 SRC-ELEC Smith 1979:22 1973/3 H11 36 51 13 * 2.23 7.30 1496 GSS-3 Smith 1979:22 1973/4-5 H11 33 54 13 * 2.20 7.21 723 CNS-1 Smith 1979:22 1973/5-6 H11 33 55 12 * 2.21 7.24 647 CNS-2 Smith 1979:22 1973/6-7 H11 33 50 17 * 2.16 7.11 642 CNS-3 Smith 1979:22 1973/7-8 H11 29 53 18 * 2.11 6.99 615 CNS-4 Smith 1979:22 1973/8-9 H11 31 50 19 * 2.12 6.71 639 CNS-5 Smith 1979:22 1973/9-10 H11 29 55 16 * 2.13 7.04 630 CNS-6 Smith 1979:22 1973/10-11 H11 32 54 14 * 2.18 7.17 681 CNS-7 Smith 1979:22 1973/11-12 H11 29 55 16 * 2.13 7.04 696 CNS-8 Smith 1979:22 1974 H11 38 49 13 * 2.25 7.35 1484 GSS-4 Trendfile, 10-1989 1974/1 H11 27 55 18 * 2.09 6.94 696 CNS-9 Smith 1979:22 1974/2 H11 23 57 20 * 2.03 6.78 692 CNS-10 Smith 1979:22 1974/3 H11 38 49 13 * 2.25 7.34 1496 GSS-74 Smith 1979:22 1974/3-4 H11 28 57 15 * 2.13 7.04 610 CNS-11 Smith 1979:22
Happiness in Nations IITable 1.1.1. a
2 Representive Nation Samples
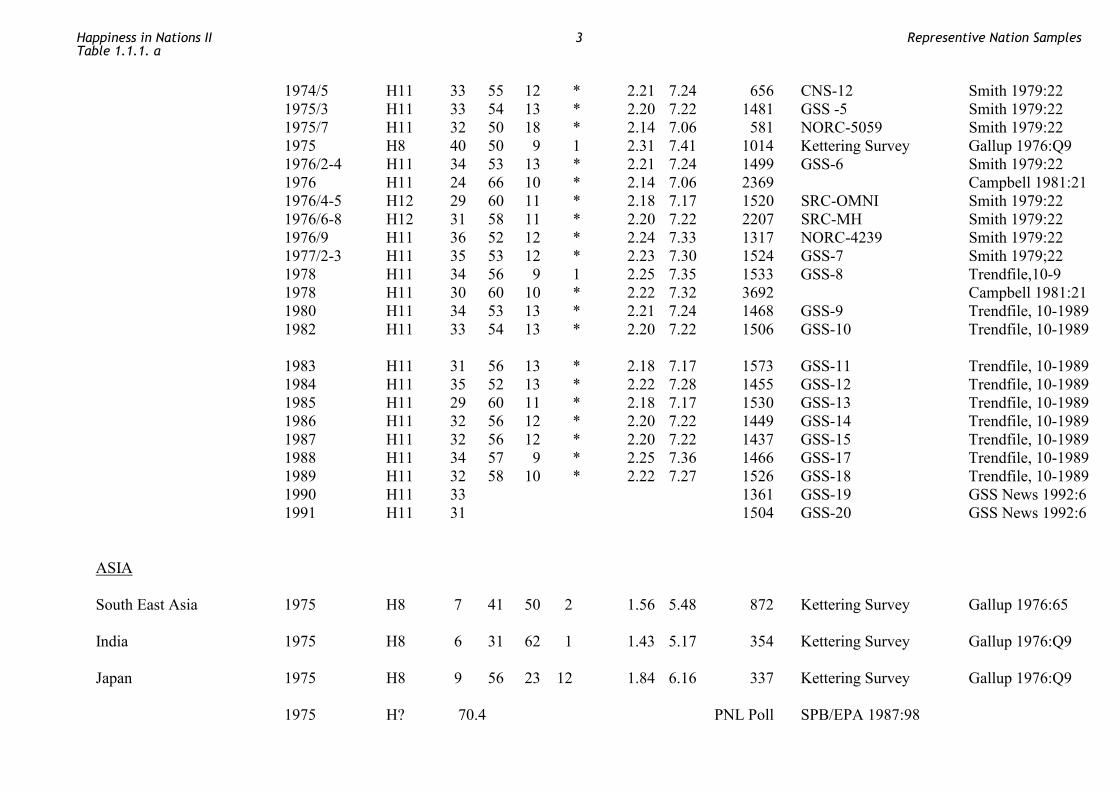
1974/5 H11 33 55 12 * 2.21 7.24 656 CNS-12 Smith 1979:22 1975/3 H11 33 54 13 * 2.20 7.22 1481 GSS -5 Smith 1979:22 1975/7 H11 32 50 18 * 2.14 7.06 581 NORC-5059 Smith 1979:22 1975 H8 40 50 9 1 2.31 7.41 1014 Kettering Survey Gallup 1976:Q9 1976/2-4 H11 34 53 13 * 2.21 7.24 1499 GSS-6 Smith 1979:22 1976 H11 24 66 10 * 2.14 7.06 2369 Campbell 1981:21 1976/4-5 H12 29 60 11 * 2.18 7.17 1520 SRC-OMNI Smith 1979:22 1976/6-8 H12 31 58 11 * 2.20 7.22 2207 SRC-MH Smith 1979:22 1976/9 H11 36 52 12 * 2.24 7.33 1317 NORC-4239 Smith 1979:22 1977/2-3 H11 35 53 12 * 2.23 7.30 1524 GSS-7 Smith 1979;22 1978 H11 34 56 9 1 2.25 7.35 1533 GSS-8 Trendfile,10-9 1978 H11 30 60 10 * 2.22 7.32 3692 Campbell 1981:21 1980 H11 34 53 13 * 2.21 7.24 1468 GSS-9 Trendfile, 10-1989 1982 H11 33 54 13 * 2.20 7.22 1506 GSS-10 Trendfile, 10-1989 1983 H11 31 56 13 * 2.18 7.17 1573 GSS-11 Trendfile, 10-1989 1984 H11 35 52 13 * 2.22 7.28 1455 GSS-12 Trendfile, 10-1989 1985 H11 29 60 11 * 2.18 7.17 1530 GSS-13 Trendfile, 10-1989 1986 H11 32 56 12 * 2.20 7.22 1449 GSS-14 Trendfile, 10-1989 1987 H11 32 56 12 * 2.20 7.22 1437 GSS-15 Trendfile, 10-1989 1988 H11 34 57 9 * 2.25 7.36 1466 GSS-17 Trendfile, 10-1989 1989 H11 32 58 10 * 2.22 7.27 1526 GSS-18 Trendfile, 10-1989 1990 H11 33 1361 GSS-19 GSS News 1992:6 1991 H11 31 1504 GSS-20 GSS News 1992:6 ASIA South East Asia 1975 H8 7 41 50 2 1.56 5.48 872 Kettering Survey Gallup 1976:65 India 1975 H8 6 31 62 1 1.43 5.17 354 Kettering Survey Gallup 1976:Q9 Japan 1975 H8 9 56 23 12 1.84 6.16 337 Kettering Survey Gallup 1976:Q9 1975 H? 70.4 PNL Poll SPB/EPA 1987:98
Happiness in Nations IITable 1.1.1. a
3 Representive Nation Samples
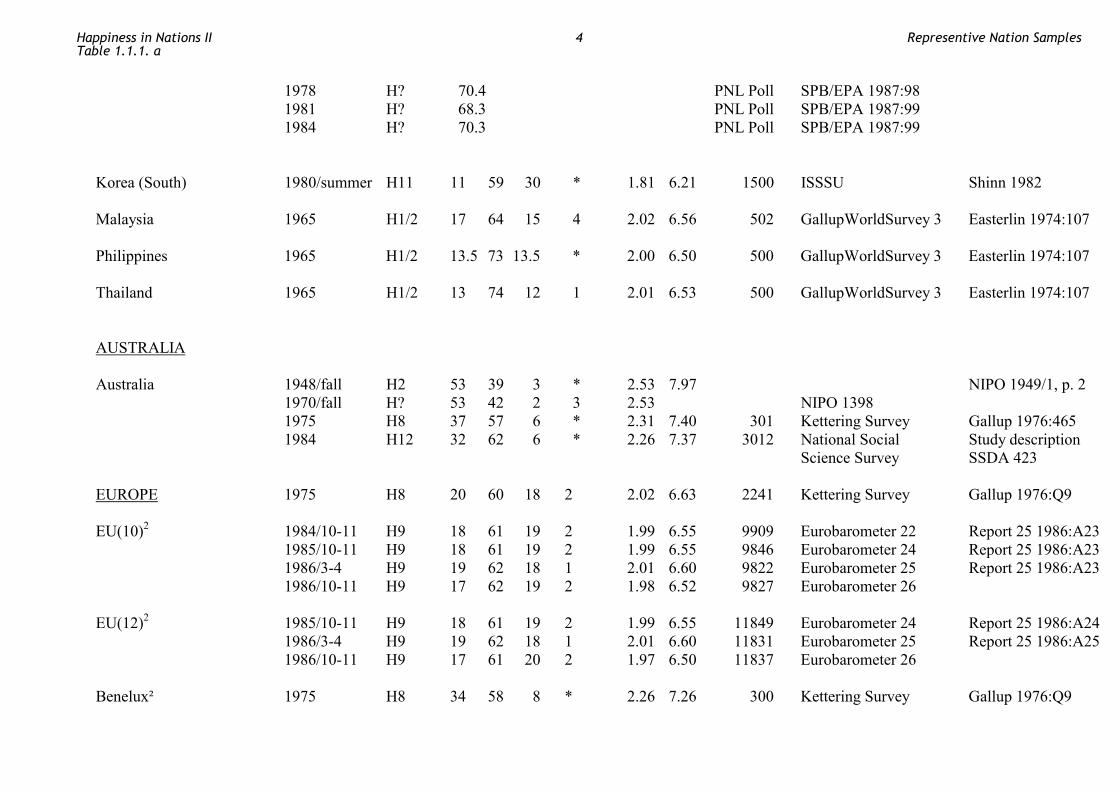
1978 H? 70.4 PNL Poll SPB/EPA 1987:98 1981 H? 68.3 PNL Poll SPB/EPA 1987:99 1984 H? 70.3 PNL Poll SPB/EPA 1987:99 Korea (South) 1980/summer H11 11 59 30 * 1.81 6.21 1500 ISSSU Shinn 1982 Malaysia 1965 H1/2 17 64 15 4 2.02 6.56 502 GallupWorldSurvey 3 Easterlin 1974:107 Philippines 1965 H1/2 13.5 73 13.5 * 2.00 6.50 500 GallupWorldSurvey 3 Easterlin 1974:107 Thailand 1965 H1/2 13 74 12 1 2.01 6.53 500 GallupWorldSurvey 3 Easterlin 1974:107 AUSTRALIA Australia 1948/fall H2 53 39 3 * 2.53 7.97 NIPO 1949/1, p. 2 1970/fall H? 53 42 2 3 2.53 NIPO 1398 1975 H8 37 57 6 * 2.31 7.40 301 Kettering Survey Gallup 1976:465 1984 H12 32 62 6 * 2.26 7.37 3012 National Social Study description Science Survey SSDA 423 EUROPE 1975 H8 20 60 18 2 2.02 6.63 2241 Kettering Survey Gallup 1976:Q9 EU(10)2 1984/10-11 H9 18 61 19 2 1.99 6.55 9909 Eurobarometer 22 Report 25 1986:A23 1985/10-11 H9 18 61 19 2 1.99 6.55 9846 Eurobarometer 24 Report 25 1986:A23 1986/3-4 H9 19 62 18 1 2.01 6.60 9822 Eurobarometer 25 Report 25 1986:A23 1986/10-11 H9 17 62 19 2 1.98 6.52 9827 Eurobarometer 26 EU(12)2 1985/10-11 H9 18 61 19 2 1.99 6.55 11849 Eurobarometer 24 Report 25 1986:A24 1986/3-4 H9 19 62 18 1 2.01 6.60 11831 Eurobarometer 25 Report 25 1986:A25 1986/10-11 H9 17 61 20 2 1.97 6.50 11837 Eurobarometer 26 Benelux² 1975 H8 34 58 8 * 2.26 7.26 300 Kettering Survey Gallup 1976:Q9
Happiness in Nations IITable 1.1.1. a
4 Representive Nation Samples
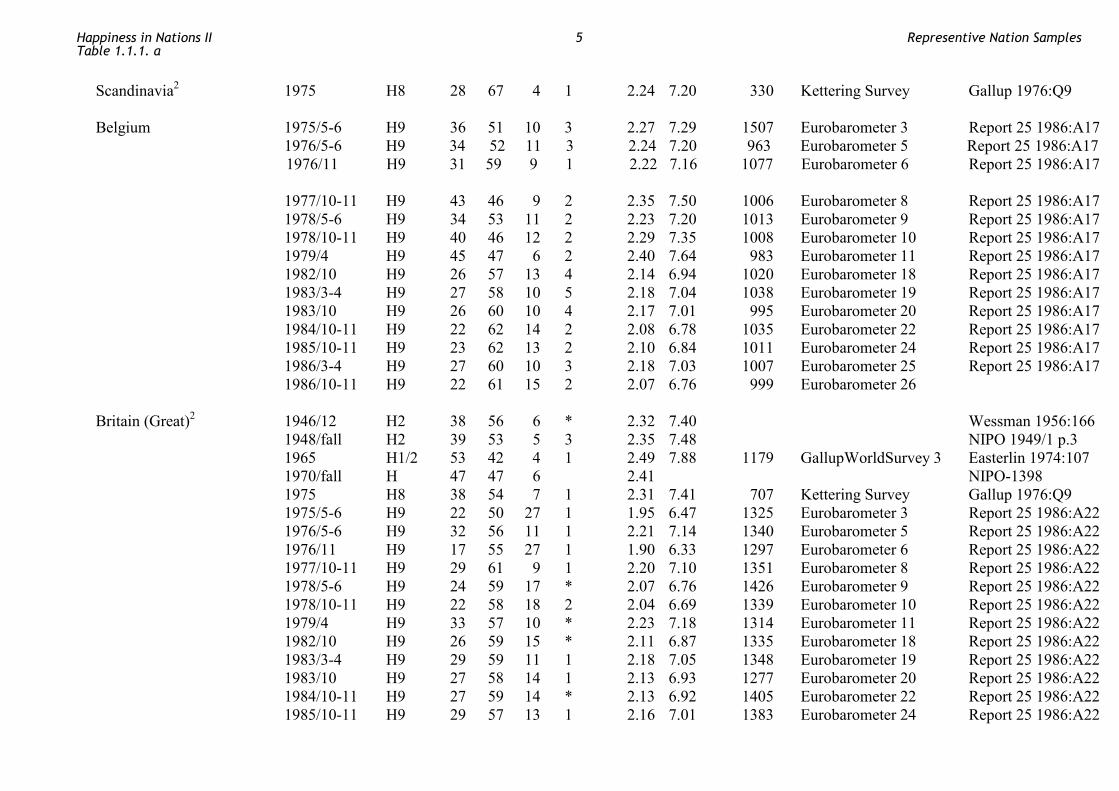
Scandinavia2 1975 H8 28 67 4 1 2.24 7.20 330 Kettering Survey Gallup 1976:Q9 Belgium 1975/5-6 H9 36 51 10 3 2.27 7.29 1507 Eurobarometer 3 Report 25 1986:A17 1976/5-6 H9 34 52 11 3 2.24 7.20 963 Eurobarometer 5 Report 25 1986:A17
1976/11 H9 31 59 9 1 2.22 7.16 1077 Eurobarometer 6 Report 25 1986:A17
1977/10-11 H9 43 46 9 2 2.35 7.50 1006 Eurobarometer 8 Report 25 1986:A17 1978/5-6 H9 34 53 11 2 2.23 7.20 1013 Eurobarometer 9 Report 25 1986:A17 1978/10-11 H9 40 46 12 2 2.29 7.35 1008 Eurobarometer 10 Report 25 1986:A17 1979/4 H9 45 47 6 2 2.40 7.64 983 Eurobarometer 11 Report 25 1986:A17 1982/10 H9 26 57 13 4 2.14 6.94 1020 Eurobarometer 18 Report 25 1986:A17 1983/3-4 H9 27 58 10 5 2.18 7.04 1038 Eurobarometer 19 Report 25 1986:A17 1983/10 H9 26 60 10 4 2.17 7.01 995 Eurobarometer 20 Report 25 1986:A17 1984/10-11 H9 22 62 14 2 2.08 6.78 1035 Eurobarometer 22 Report 25 1986:A17 1985/10-11 H9 23 62 13 2 2.10 6.84 1011 Eurobarometer 24 Report 25 1986:A17 1986/3-4 H9 27 60 10 3 2.18 7.03 1007 Eurobarometer 25 Report 25 1986:A17 1986/10-11 H9 22 61 15 2 2.07 6.76 999 Eurobarometer 26 Britain (Great)2 1946/12 H2 38 56 6 * 2.32 7.40 Wessman 1956:166 1948/fall H2 39 53 5 3 2.35 7.48 NIPO 1949/1 p.3 1965 H1/2 53 42 4 1 2.49 7.88 1179 GallupWorldSurvey 3 Easterlin 1974:107 1970/fall H 47 47 6 2.41 NIPO-1398 1975 H8 38 54 7 1 2.31 7.41 707 Kettering Survey Gallup 1976:Q9 1975/5-6 H9 22 50 27 1 1.95 6.47 1325 Eurobarometer 3 Report 25 1986:A22 1976/5-6 H9 32 56 11 1 2.21 7.14 1340 Eurobarometer 5 Report 25 1986:A22 1976/11 H9 17 55 27 1 1.90 6.33 1297 Eurobarometer 6 Report 25 1986:A22 1977/10-11 H9 29 61 9 1 2.20 7.10 1351 Eurobarometer 8 Report 25 1986:A22 1978/5-6 H9 24 59 17 * 2.07 6.76 1426 Eurobarometer 9 Report 25 1986:A22 1978/10-11 H9 22 58 18 2 2.04 6.69 1339 Eurobarometer 10 Report 25 1986:A22 1979/4 H9 33 57 10 * 2.23 7.18 1314 Eurobarometer 11 Report 25 1986:A22 1982/10 H9 26 59 15 * 2.11 6.87 1335 Eurobarometer 18 Report 25 1986:A22 1983/3-4 H9 29 59 11 1 2.18 7.05 1348 Eurobarometer 19 Report 25 1986:A22 1983/10 H9 27 58 14 1 2.13 6.93 1277 Eurobarometer 20 Report 25 1986:A22 1984/10-11 H9 27 59 14 * 2.13 6.92 1405 Eurobarometer 22 Report 25 1986:A22 1985/10-11 H9 29 57 13 1 2.16 7.01 1383 Eurobarometer 24 Report 25 1986:A22
Happiness in Nations IITable 1.1.1. a
5 Representive Nation Samples
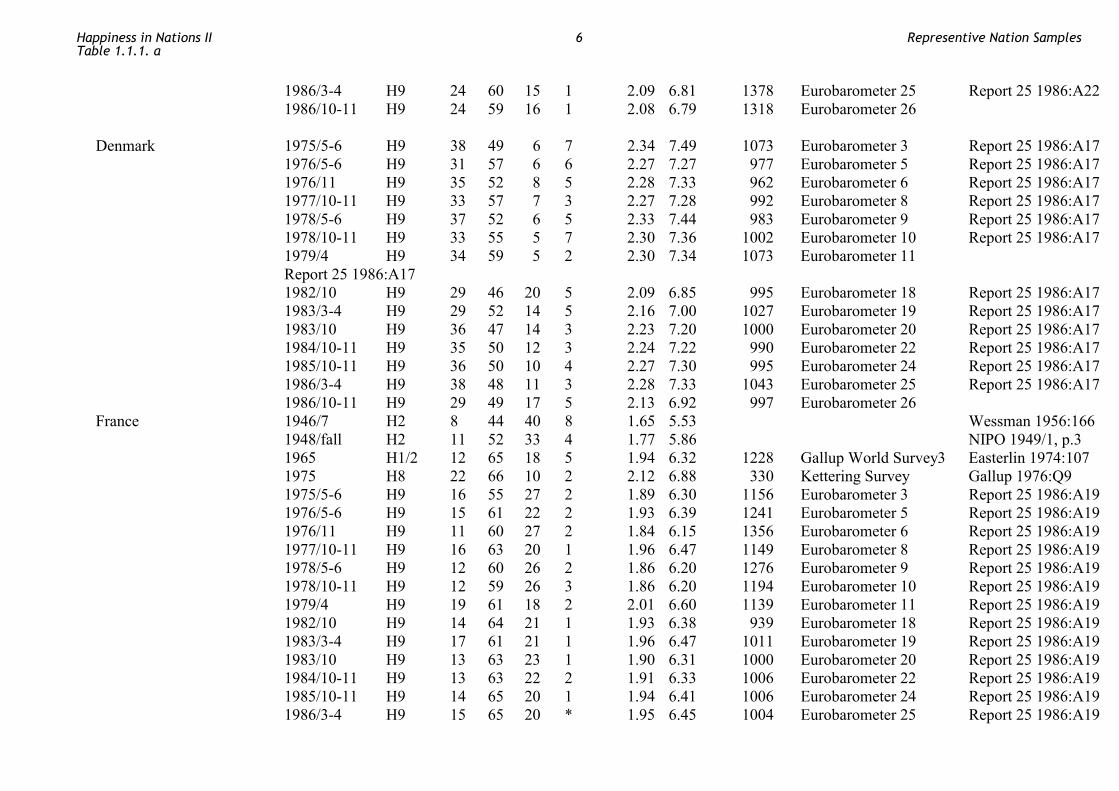
1986/3-4 H9 24 60 15 1 2.09 6.81 1378 Eurobarometer 25 Report 25 1986:A22 1986/10-11 H9 24 59 16 1 2.08 6.79 1318 Eurobarometer 26 Denmark 1975/5-6 H9 38 49 6 7 2.34 7.49 1073 Eurobarometer 3 Report 25 1986:A17 1976/5-6 H9 31 57 6 6 2.27 7.27 977 Eurobarometer 5 Report 25 1986:A17 1976/11 H9 35 52 8 5 2.28 7.33 962 Eurobarometer 6 Report 25 1986:A17 1977/10-11 H9 33 57 7 3 2.27 7.28 992 Eurobarometer 8 Report 25 1986:A17 1978/5-6 H9 37 52 6 5 2.33 7.44 983 Eurobarometer 9 Report 25 1986:A17 1978/10-11 H9 33 55 5 7 2.30 7.36 1002 Eurobarometer 10 Report 25 1986:A17 1979/4 H9 34 59 5 2 2.30 7.34 1073 Eurobarometer 11
Report 25 1986:A17 1982/10 H9 29 46 20 5 2.09 6.85 995 Eurobarometer 18 Report 25 1986:A17 1983/3-4 H9 29 52 14 5 2.16 7.00 1027 Eurobarometer 19 Report 25 1986:A17 1983/10 H9 36 47 14 3 2.23 7.20 1000 Eurobarometer 20 Report 25 1986:A17 1984/10-11 H9 35 50 12 3 2.24 7.22 990 Eurobarometer 22 Report 25 1986:A17 1985/10-11 H9 36 50 10 4 2.27 7.30 995 Eurobarometer 24 Report 25 1986:A17 1986/3-4 H9 38 48 11 3 2.28 7.33 1043 Eurobarometer 25 Report 25 1986:A17 1986/10-11 H9 29 49 17 5 2.13 6.92 997 Eurobarometer 26 France 1946/7 H2 8 44 40 8 1.65 5.53 Wessman 1956:166 1948/fall H2 11 52 33 4 1.77 5.86 NIPO 1949/1, p.3 1965 H1/2 12 65 18 5 1.94 6.32 1228 Gallup World Survey3 Easterlin 1974:107 1975 H8 22 66 10 2 2.12 6.88 330 Kettering Survey Gallup 1976:Q9 1975/5-6 H9 16 55 27 2 1.89 6.30 1156 Eurobarometer 3 Report 25 1986:A19 1976/5-6 H9 15 61 22 2 1.93 6.39 1241 Eurobarometer 5 Report 25 1986:A19 1976/11 H9 11 60 27 2 1.84 6.15 1356 Eurobarometer 6 Report 25 1986:A19 1977/10-11 H9 16 63 20 1 1.96 6.47 1149 Eurobarometer 8 Report 25 1986:A19 1978/5-6 H9 12 60 26 2 1.86 6.20 1276 Eurobarometer 9 Report 25 1986:A19 1978/10-11 H9 12 59 26 3 1.86 6.20 1194 Eurobarometer 10 Report 25 1986:A19 1979/4 H9 19 61 18 2 2.01 6.60 1139 Eurobarometer 11 Report 25 1986:A19 1982/10 H9 14 64 21 1 1.93 6.38 939 Eurobarometer 18 Report 25 1986:A19 1983/3-4 H9 17 61 21 1 1.96 6.47 1011 Eurobarometer 19 Report 25 1986:A19 1983/10 H9 13 63 23 1 1.90 6.31 1000 Eurobarometer 20 Report 25 1986:A19 1984/10-11 H9 13 63 22 2 1.91 6.33 1006 Eurobarometer 22 Report 25 1986:A19 1985/10-11 H9 14 65 20 1 1.94 6.41 1006 Eurobarometer 24 Report 25 1986:A19 1986/3-4 H9 15 65 20 * 1.95 6.45 1004 Eurobarometer 25 Report 25 1986:A19
Happiness in Nations IITable 1.1.1. a
6 Representive Nation Samples
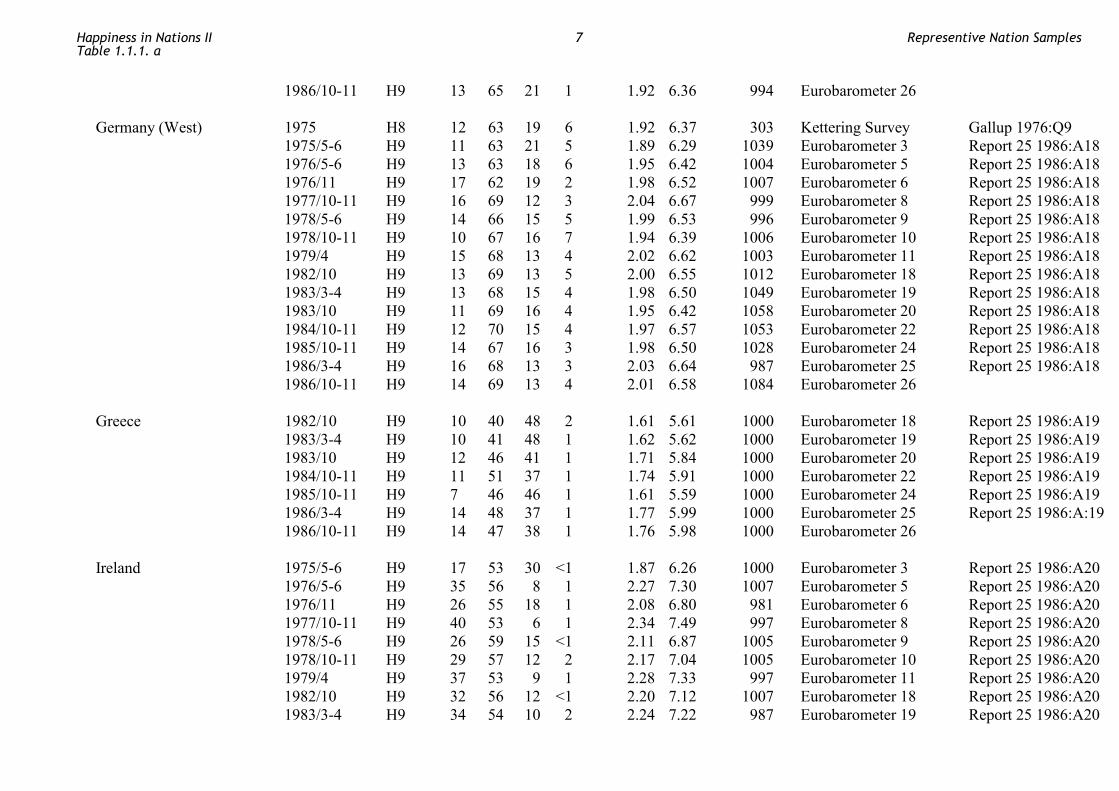
1986/10-11 H9 13 65 21 1 1.92 6.36 994 Eurobarometer 26 Germany (West) 1975 H8 12 63 19 6 1.92 6.37 303 Kettering Survey Gallup 1976:Q9 1975/5-6 H9 11 63 21 5 1.89 6.29 1039 Eurobarometer 3 Report 25 1986:A18 1976/5-6 H9 13 63 18 6 1.95 6.42 1004 Eurobarometer 5 Report 25 1986:A18 1976/11 H9 17 62 19 2 1.98 6.52 1007 Eurobarometer 6 Report 25 1986:A18 1977/10-11 H9 16 69 12 3 2.04 6.67 999 Eurobarometer 8 Report 25 1986:A18 1978/5-6 H9 14 66 15 5 1.99 6.53 996 Eurobarometer 9 Report 25 1986:A18 1978/10-11 H9 10 67 16 7 1.94 6.39 1006 Eurobarometer 10 Report 25 1986:A18 1979/4 H9 15 68 13 4 2.02 6.62 1003 Eurobarometer 11 Report 25 1986:A18 1982/10 H9 13 69 13 5 2.00 6.55 1012 Eurobarometer 18 Report 25 1986:A18 1983/3-4 H9 13 68 15 4 1.98 6.50 1049 Eurobarometer 19 Report 25 1986:A18 1983/10 H9 11 69 16 4 1.95 6.42 1058 Eurobarometer 20 Report 25 1986:A18 1984/10-11 H9 12 70 15 4 1.97 6.57 1053 Eurobarometer 22 Report 25 1986:A18 1985/10-11 H9 14 67 16 3 1.98 6.50 1028 Eurobarometer 24 Report 25 1986:A18 1986/3-4 H9 16 68 13 3 2.03 6.64 987 Eurobarometer 25 Report 25 1986:A18 1986/10-11 H9 14 69 13 4 2.01 6.58 1084 Eurobarometer 26 Greece 1982/10 H9 10 40 48 2 1.61 5.61 1000 Eurobarometer 18 Report 25 1986:A19 1983/3-4 H9 10 41 48 1 1.62 5.62 1000 Eurobarometer 19 Report 25 1986:A19 1983/10 H9 12 46 41 1 1.71 5.84 1000 Eurobarometer 20 Report 25 1986:A19 1984/10-11 H9 11 51 37 1 1.74 5.91 1000 Eurobarometer 22 Report 25 1986:A19 1985/10-11 H9 7 46 46 1 1.61 5.59 1000 Eurobarometer 24 Report 25 1986:A19 1986/3-4 H9 14 48 37 1 1.77 5.99 1000 Eurobarometer 25 Report 25 1986:A:19 1986/10-11 H9 14 47 38 1 1.76 5.98 1000 Eurobarometer 26 Ireland 1975/5-6 H9 17 53 30 <1 1.87 6.26 1000 Eurobarometer 3 Report 25 1986:A20 1976/5-6 H9 35 56 8 1 2.27 7.30 1007 Eurobarometer 5 Report 25 1986:A20 1976/11 H9 26 55 18 1 2.08 6.80 981 Eurobarometer 6 Report 25 1986:A20 1977/10-11 H9 40 53 6 1 2.34 7.49 997 Eurobarometer 8 Report 25 1986:A20 1978/5-6 H9 26 59 15 <1 2.11 6.87 1005 Eurobarometer 9 Report 25 1986:A20 1978/10-11 H9 29 57 12 2 2.17 7.04 1005 Eurobarometer 10 Report 25 1986:A20 1979/4 H9 37 53 9 1 2.28 7.33 997 Eurobarometer 11 Report 25 1986:A20 1982/10 H9 32 56 12 <1 2.20 7.12 1007 Eurobarometer 18 Report 25 1986:A20 1983/3-4 H9 34 54 10 2 2.24 7.22 987 Eurobarometer 19 Report 25 1986:A20
Happiness in Nations IITable 1.1.1. a
7 Representive Nation Samples
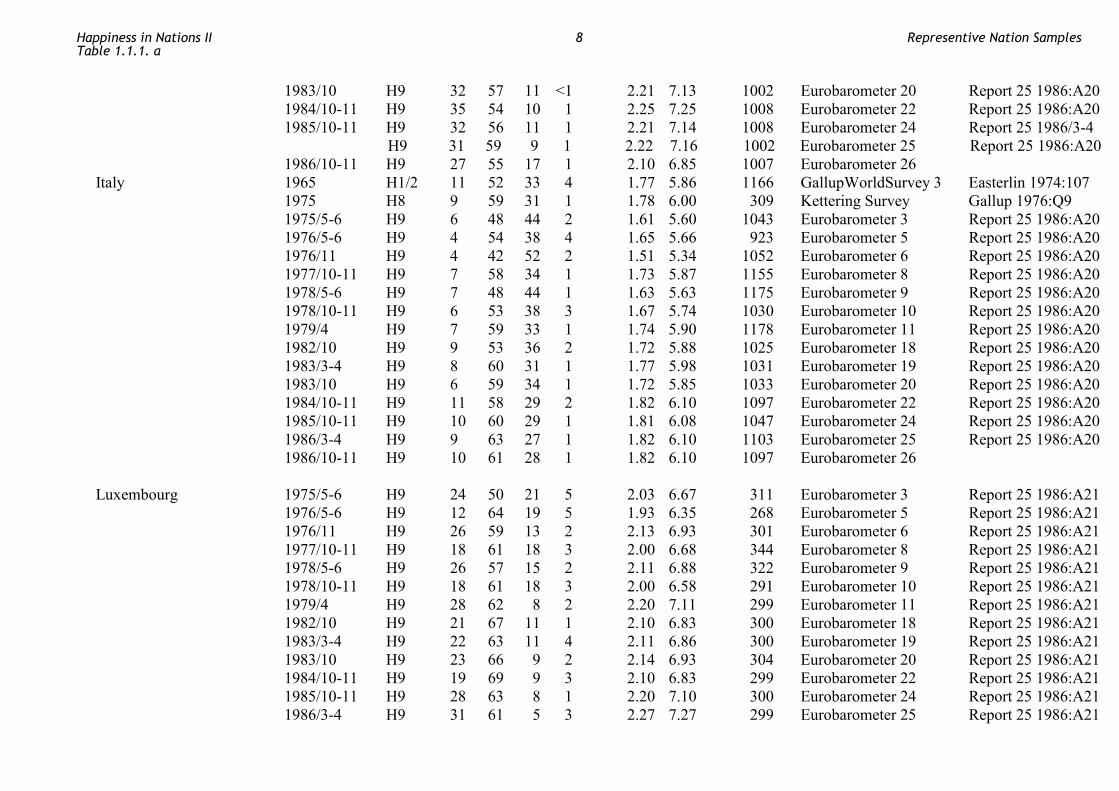
1983/10 H9 32 57 11 <1 2.21 7.13 1002 Eurobarometer 20 Report 25 1986:A20 1984/10-11 H9 35 54 10 1 2.25 7.25 1008 Eurobarometer 22 Report 25 1986:A20 1985/10-11 H9 32 56 11 1 2.21 7.14 1008 Eurobarometer 24 Report 25 1986/3-4
H9 31 59 9 1 2.22 7.16 1002 Eurobarometer 25 Report 25 1986:A20 1986/10-11 H9 27 55 17 1 2.10 6.85 1007 Eurobarometer 26 Italy 1965 H1/2 11 52 33 4 1.77 5.86 1166 GallupWorldSurvey 3 Easterlin 1974:107 1975 H8 9 59 31 1 1.78 6.00 309 Kettering Survey Gallup 1976:Q9 1975/5-6 H9 6 48 44 2 1.61 5.60 1043 Eurobarometer 3 Report 25 1986:A20 1976/5-6 H9 4 54 38 4 1.65 5.66 923 Eurobarometer 5 Report 25 1986:A20 1976/11 H9 4 42 52 2 1.51 5.34 1052 Eurobarometer 6 Report 25 1986:A20 1977/10-11 H9 7 58 34 1 1.73 5.87 1155 Eurobarometer 8 Report 25 1986:A20 1978/5-6 H9 7 48 44 1 1.63 5.63 1175 Eurobarometer 9 Report 25 1986:A20 1978/10-11 H9 6 53 38 3 1.67 5.74 1030 Eurobarometer 10 Report 25 1986:A20 1979/4 H9 7 59 33 1 1.74 5.90 1178 Eurobarometer 11 Report 25 1986:A20 1982/10 H9 9 53 36 2 1.72 5.88 1025 Eurobarometer 18 Report 25 1986:A20 1983/3-4 H9 8 60 31 1 1.77 5.98 1031 Eurobarometer 19 Report 25 1986:A20 1983/10 H9 6 59 34 1 1.72 5.85 1033 Eurobarometer 20 Report 25 1986:A20 1984/10-11 H9 11 58 29 2 1.82 6.10 1097 Eurobarometer 22 Report 25 1986:A20 1985/10-11 H9 10 60 29 1 1.81 6.08 1047 Eurobarometer 24 Report 25 1986:A20 1986/3-4 H9 9 63 27 1 1.82 6.10 1103 Eurobarometer 25 Report 25 1986:A20 1986/10-11 H9 10 61 28 1 1.82 6.10 1097 Eurobarometer 26 Luxembourg 1975/5-6 H9 24 50 21 5 2.03 6.67 311 Eurobarometer 3 Report 25 1986:A21 1976/5-6 H9 12 64 19 5 1.93 6.35 268 Eurobarometer 5 Report 25 1986:A21 1976/11 H9 26 59 13 2 2.13 6.93 301 Eurobarometer 6 Report 25 1986:A21 1977/10-11 H9 18 61 18 3 2.00 6.68 344 Eurobarometer 8 Report 25 1986:A21 1978/5-6 H9 26 57 15 2 2.11 6.88 322 Eurobarometer 9 Report 25 1986:A21 1978/10-11 H9 18 61 18 3 2.00 6.58 291 Eurobarometer 10 Report 25 1986:A21 1979/4 H9 28 62 8 2 2.20 7.11 299 Eurobarometer 11 Report 25 1986:A21 1982/10 H9 21 67 11 1 2.10 6.83 300 Eurobarometer 18 Report 25 1986:A21 1983/3-4 H9 22 63 11 4 2.11 6.86 300 Eurobarometer 19 Report 25 1986:A21 1983/10 H9 23 66 9 2 2.14 6.93 304 Eurobarometer 20 Report 25 1986:A21 1984/10-11 H9 19 69 9 3 2.10 6.83 299 Eurobarometer 22 Report 25 1986:A21 1985/10-11 H9 28 63 8 1 2.20 7.10 300 Eurobarometer 24 Report 25 1986:A21 1986/3-4 H9 31 61 5 3 2.27 7.27 299 Eurobarometer 25 Report 25 1986:A21
Happiness in Nations IITable 1.1.1. a
8 Representive Nation Samples
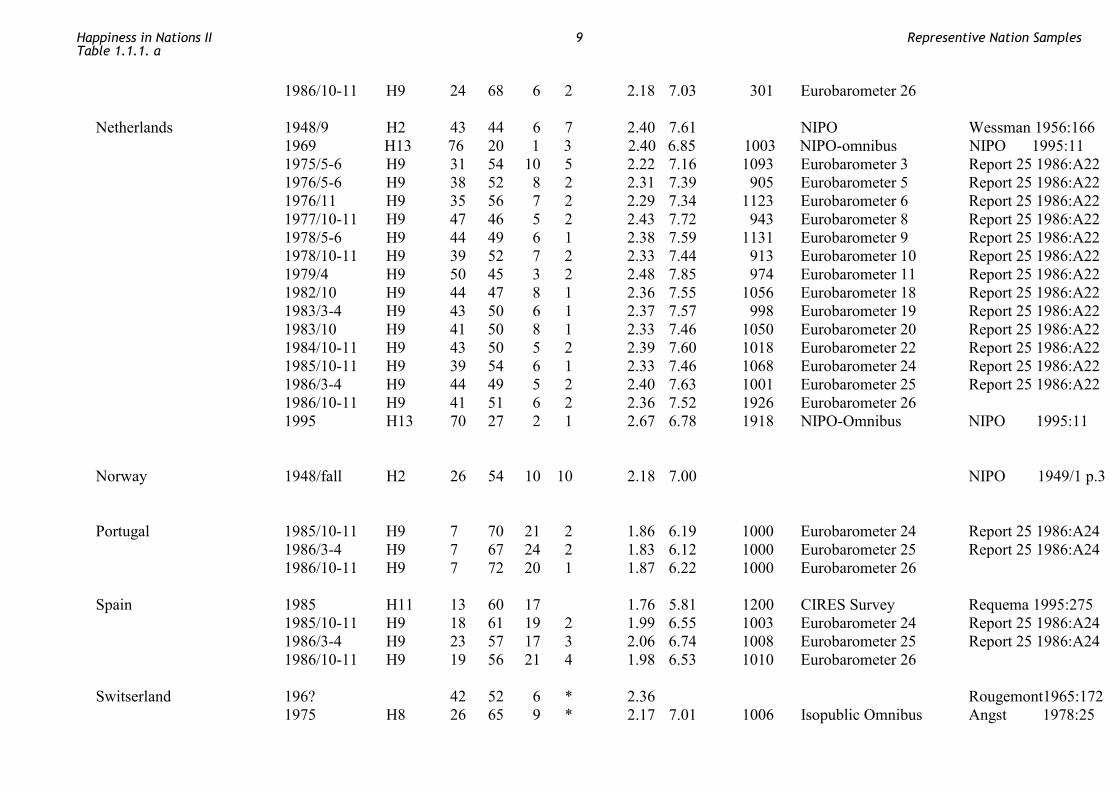
1986/10-11 H9 24 68 6 2 2.18 7.03 301 Eurobarometer 26 Netherlands 1948/9 H2 43 44 6 7 2.40 7.61 NIPO Wessman 1956:166
1969 H13 76 20 1 3 2.40 6.85 1003 NIPO-omnibus NIPO 1995:11 1975/5-6 H9 31 54 10 5 2.22 7.16 1093 Eurobarometer 3 Report 25 1986:A22 1976/5-6 H9 38 52 8 2 2.31 7.39 905 Eurobarometer 5 Report 25 1986:A22 1976/11 H9 35 56 7 2 2.29 7.34 1123 Eurobarometer 6 Report 25 1986:A22 1977/10-11 H9 47 46 5 2 2.43 7.72 943 Eurobarometer 8 Report 25 1986:A22 1978/5-6 H9 44 49 6 1 2.38 7.59 1131 Eurobarometer 9 Report 25 1986:A22 1978/10-11 H9 39 52 7 2 2.33 7.44 913 Eurobarometer 10 Report 25 1986:A22 1979/4 H9 50 45 3 2 2.48 7.85 974 Eurobarometer 11 Report 25 1986:A22 1982/10 H9 44 47 8 1 2.36 7.55 1056 Eurobarometer 18 Report 25 1986:A22 1983/3-4 H9 43 50 6 1 2.37 7.57 998 Eurobarometer 19 Report 25 1986:A22 1983/10 H9 41 50 8 1 2.33 7.46 1050 Eurobarometer 20 Report 25 1986:A22 1984/10-11 H9 43 50 5 2 2.39 7.60 1018 Eurobarometer 22 Report 25 1986:A22 1985/10-11 H9 39 54 6 1 2.33 7.46 1068 Eurobarometer 24 Report 25 1986:A22 1986/3-4 H9 44 49 5 2 2.40 7.63 1001 Eurobarometer 25 Report 25 1986:A22 1986/10-11 H9 41 51 6 2 2.36 7.52 1926 Eurobarometer 26 1995 H13 70 27 2 1 2.67 6.78 1918 NIPO-Omnibus NIPO 1995:11 Norway 1948/fall H2 26 54 10 10 2.18 7.00 NIPO 1949/1 p.3 Portugal 1985/10-11 H9 7 70 21 2 1.86 6.19 1000 Eurobarometer 24 Report 25 1986:A24 1986/3-4 H9 7 67 24 2 1.83 6.12 1000 Eurobarometer 25 Report 25 1986:A24 1986/10-11 H9 7 72 20 1 1.87 6.22 1000 Eurobarometer 26 Spain 1985 H11 13 60 17 1.76 5.81 1200 CIRES Survey Requema 1995:275 1985/10-11 H9 18 61 19 2 1.99 6.55 1003 Eurobarometer 24 Report 25 1986:A24 1986/3-4 H9 23 57 17 3 2.06 6.74 1008 Eurobarometer 25 Report 25 1986:A24 1986/10-11 H9 19 56 21 4 1.98 6.53 1010 Eurobarometer 26 Switserland 196? 42 52 6 * 2.36 Rougemont1965:172 1975 H8 26 65 9 * 2.17 7.01 1006 Isopublic Omnibus Angst 1978:25
Happiness in Nations IITable 1.1.1. a
9 Representive Nation Samples
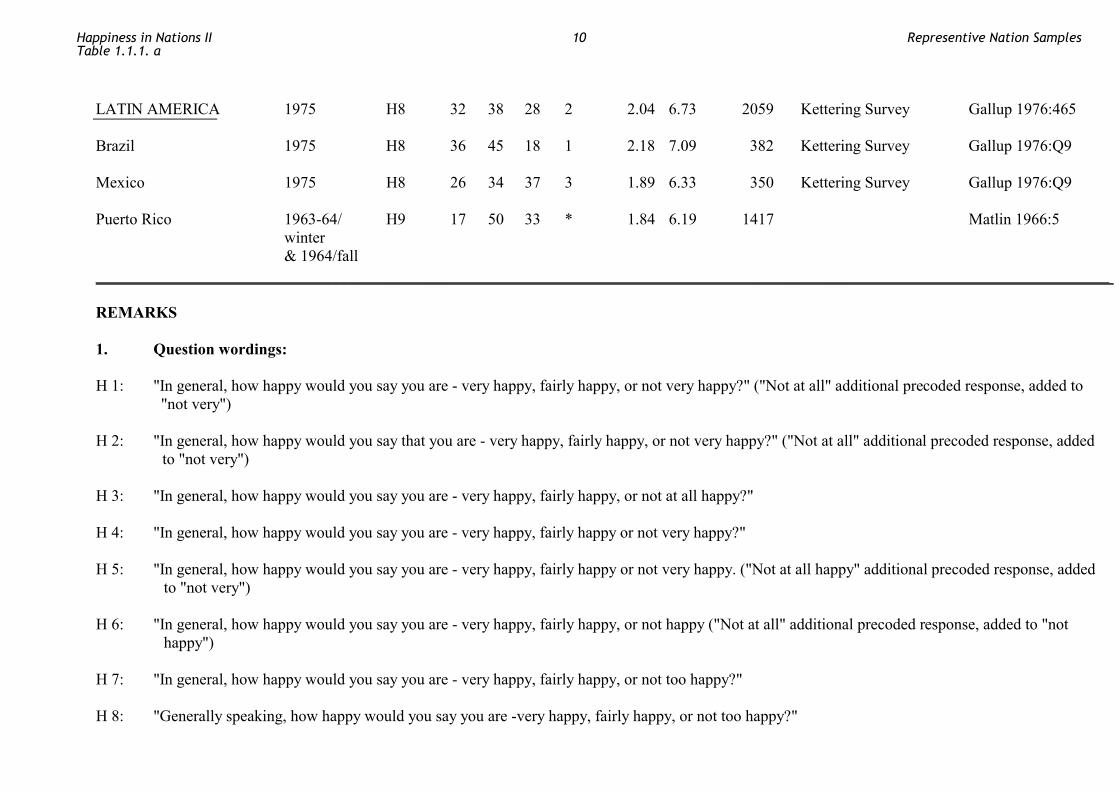
LATIN AMERICA 1975 H8 32 38 28 2 2.04 6.73 2059 Kettering Survey Gallup 1976:465 Brazil 1975 H8 36 45 18 1 2.18 7.09 382 Kettering Survey Gallup 1976:Q9 Mexico 1975 H8 26 34 37 3 1.89 6.33 350 Kettering Survey Gallup 1976:Q9 Puerto Rico 1963-64/ H9 17 50 33 * 1.84 6.19 1417 Matlin 1966:5 winter & 1964/fall _______________________________________________________________________________________________________________________________ REMARKS 1. Question wordings: H 1: "In general, how happy would you say you are - very happy, fairly happy, or not very happy?" ("Not at all" additional precoded response, added to
"not very") H 2: "In general, how happy would you say that you are - very happy, fairly happy, or not very happy?" ("Not at all" additional precoded response, added
to "not very") H 3: "In general, how happy would you say you are - very happy, fairly happy, or not at all happy?" H 4: "In general, how happy would you say you are - very happy, fairly happy or not very happy?" H 5: "In general, how happy would you say you are - very happy, fairly happy or not very happy. ("Not at all happy" additional precoded response, added
to "not very") H 6: "In general, how happy would you say you are - very happy, fairly happy, or not happy ("Not at all" additional precoded response, added to "not
happy") H 7: "In general, how happy would you say you are - very happy, fairly happy, or not too happy?" H 8: "Generally speaking, how happy would you say you are -very happy, fairly happy, or not too happy?"
Happiness in Nations IITable 1.1.1. a
10 Representive Nation Samples
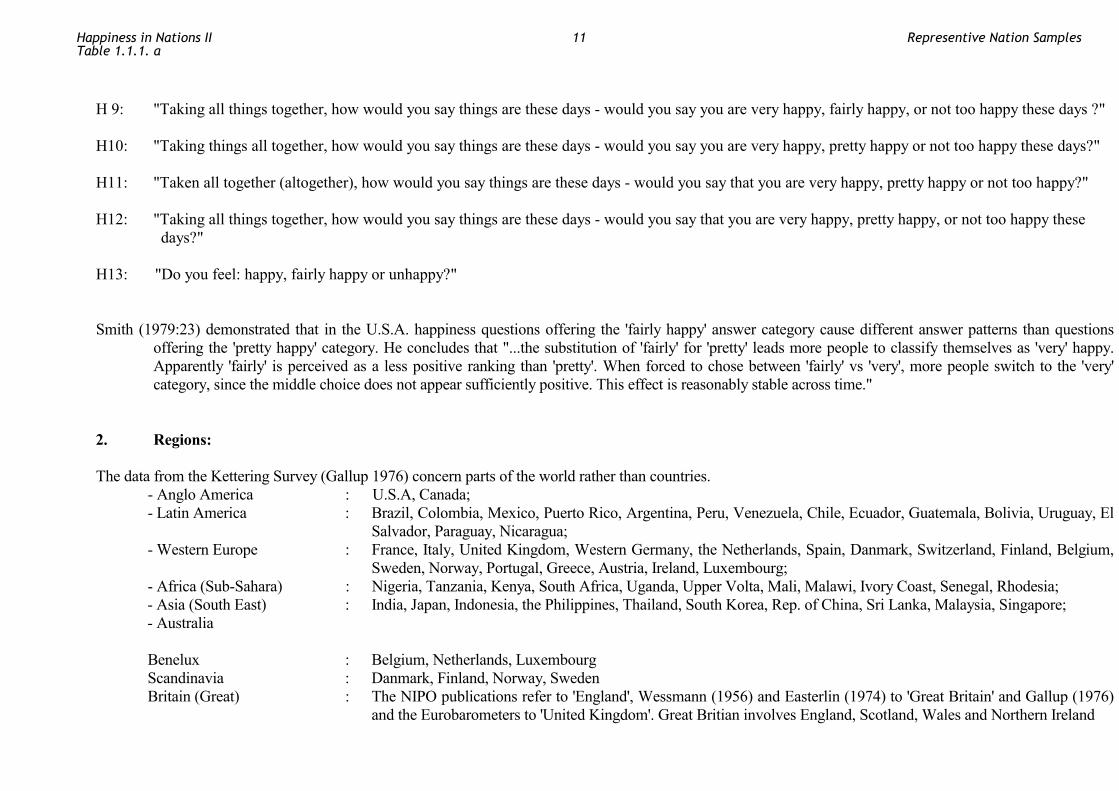
H 9: "Taking all things together, how would you say things are these days - would you say you are very happy, fairly happy, or not too happy these days ?" H10: "Taking things all together, how would you say things are these days - would you say you are very happy, pretty happy or not too happy these days?" H11: "Taken all together (altogether), how would you say things are these days - would you say that you are very happy, pretty happy or not too happy?" H12: "Taking all things together, how would you say things are these days - would you say that you are very happy, pretty happy, or not too happy these
days?" H13: "Do you feel: happy, fairly happy or unhappy?" Smith (1979:23) demonstrated that in the U.S.A. happiness questions offering the 'fairly happy' answer category cause different answer patterns than questions
offering the 'pretty happy' category. He concludes that "...the substitution of 'fairly' for 'pretty' leads more people to classify themselves as 'very' happy. Apparently 'fairly' is perceived as a less positive ranking than 'pretty'. When forced to chose between 'fairly' vs 'very', more people switch to the 'very' category, since the middle choice does not appear sufficiently positive. This effect is reasonably stable across time."
2. Regions: The data from the Kettering Survey (Gallup 1976) concern parts of the world rather than countries.
- Anglo America : U.S.A, Canada; - Latin America : Brazil, Colombia, Mexico, Puerto Rico, Argentina, Peru, Venezuela, Chile, Ecuador, Guatemala, Bolivia, Uruguay, El
Salvador, Paraguay, Nicaragua; - Western Europe : France, Italy, United Kingdom, Western Germany, the Netherlands, Spain, Danmark, Switzerland, Finland, Belgium,
Sweden, Norway, Portugal, Greece, Austria, Ireland, Luxembourg; - Africa (Sub-Sahara) : Nigeria, Tanzania, Kenya, South Africa, Uganda, Upper Volta, Mali, Malawi, Ivory Coast, Senegal, Rhodesia; - Asia (South East) : India, Japan, Indonesia, the Philippines, Thailand, South Korea, Rep. of China, Sri Lanka, Malaysia, Singapore; - Australia Benelux : Belgium, Netherlands, Luxembourg Scandinavia : Danmark, Finland, Norway, Sweden Britain (Great) : The NIPO publications refer to 'England', Wessmann (1956) and Easterlin (1974) to 'Great Britain' and Gallup (1976)
and the Eurobarometers to 'United Kingdom'. Great Britian involves England, Scotland, Wales and Northern Ireland
Happiness in Nations IITable 1.1.1. a
11 Representive Nation Samples
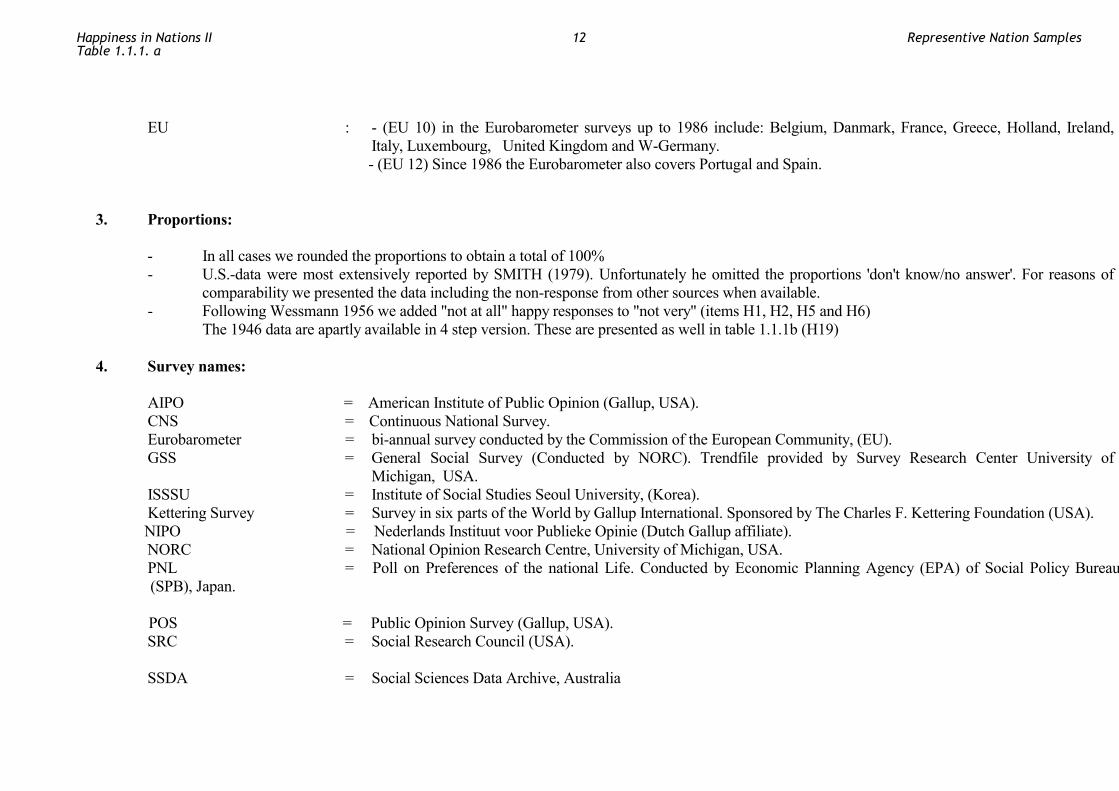
EU : - (EU 10) in the Eurobarometer surveys up to 1986 include: Belgium, Danmark, France, Greece, Holland, Ireland,
Italy, Luxembourg, United Kingdom and W-Germany. - (EU 12) Since 1986 the Eurobarometer also covers Portugal and Spain.
3. Proportions: - In all cases we rounded the proportions to obtain a total of 100% - U.S.-data were most extensively reported by SMITH (1979). Unfortunately he omitted the proportions 'don't know/no answer'. For reasons of
comparability we presented the data including the non-response from other sources when available. - Following Wessmann 1956 we added "not at all" happy responses to "not very" (items H1, H2, H5 and H6) The 1946 data are apartly available in 4 step version. These are presented as well in table 1.1.1b (H19) 4. Survey names: AIPO = American Institute of Public Opinion (Gallup, USA). CNS = Continuous National Survey. Eurobarometer = bi-annual survey conducted by the Commission of the European Community, (EU). GSS = General Social Survey (Conducted by NORC). Trendfile provided by Survey Research Center University of
Michigan, USA. ISSSU = Institute of Social Studies Seoul University, (Korea). Kettering Survey = Survey in six parts of the World by Gallup International. Sponsored by The Charles F. Kettering Foundation (USA).
NIPO = Nederlands Instituut voor Publieke Opinie (Dutch Gallup affiliate). NORC = National Opinion Research Centre, University of Michigan, USA. PNL = Poll on Preferences of the national Life. Conducted by Economic Planning Agency (EPA) of Social Policy Bureau
(SPB), Japan.
POS = Public Opinion Survey (Gallup, USA). SRC = Social Research Council (USA). SSDA = Social Sciences Data Archive, Australia
Happiness in Nations IITable 1.1.1. a
12 Representive Nation Samples
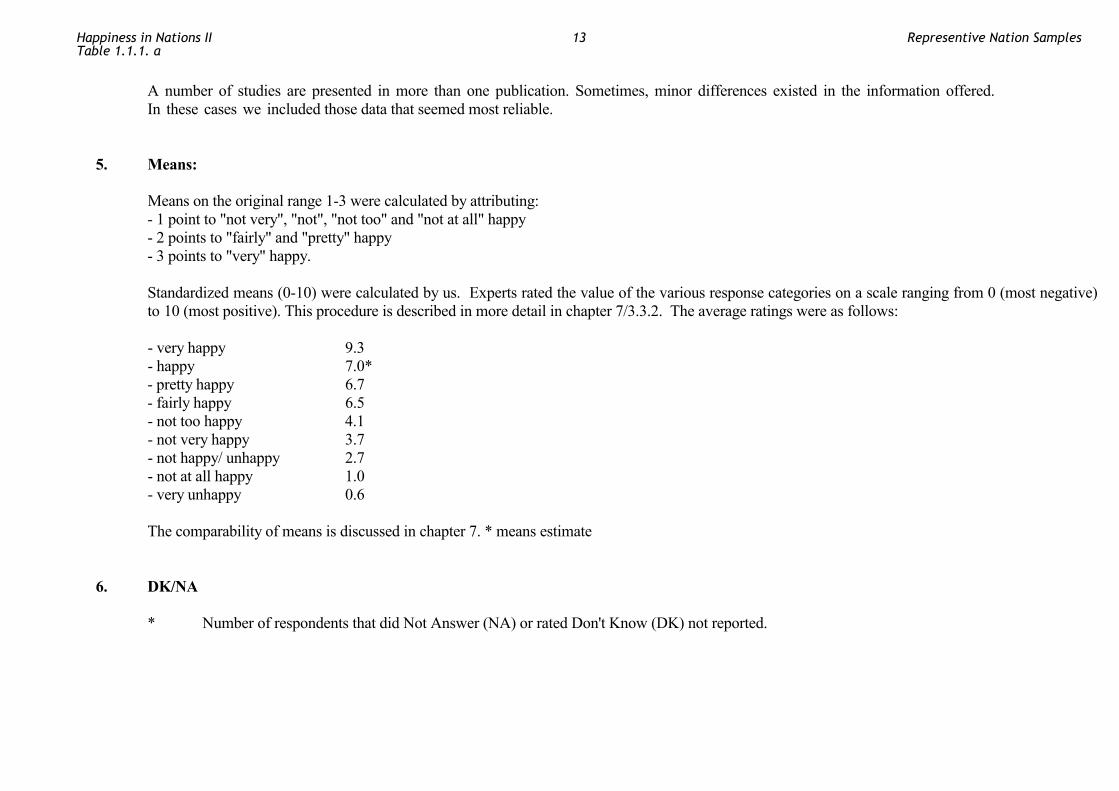
A number of studies are presented in more than one publication. Sometimes, minor differences existed in the information offered. In these cases we included those data that seemed most reliable.
5. Means: Means on the original range 1-3 were calculated by attributing: - 1 point to "not very", "not", "not too" and "not at all" happy - 2 points to "fairly" and "pretty" happy - 3 points to "very" happy. Standardized means (0-10) were calculated by us. Experts rated the value of the various response categories on a scale ranging from 0 (most negative)
to 10 (most positive). This procedure is described in more detail in chapter 7/3.3.2. The average ratings were as follows: - very happy 9.3 - happy 7.0* - pretty happy 6.7 - fairly happy 6.5 - not too happy 4.1 - not very happy 3.7 - not happy/ unhappy 2.7 - not at all happy 1.0 - very unhappy 0.6 The comparability of means is discussed in chapter 7. * means estimate 6. DK/NA * Number of respondents that did Not Answer (NA) or rated Don't Know (DK) not reported.
Happiness in Nations IITable 1.1.1. a
13 Representive Nation Samples
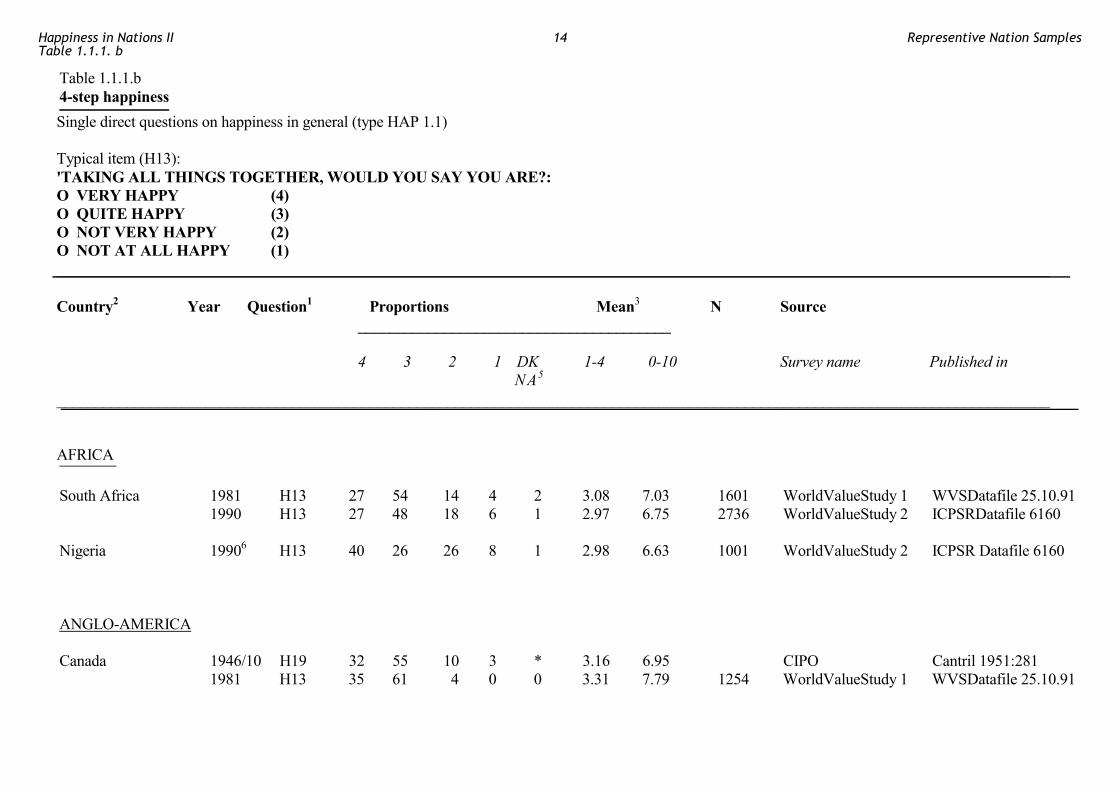
Table 1.1.1.b 4-step happiness Single direct questions on happiness in general (type HAP 1.1) Typical item (H13): 'TAKING ALL THINGS TOGETHER, WOULD YOU SAY YOU ARE?: O VERY HAPPY (4) O QUITE HAPPY (3) O NOT VERY HAPPY (2) O NOT AT ALL HAPPY (1) _______________________________________________________________________________________________________________________________ Country2 Year Question1 Proportions Mean3 N Source ________________________________________ 4 3 2 1 DK 1-4 0-10 Survey name Published in
NA5 _______________________________________________________________________________________________________________________________ AFRICA South Africa 1981 H13 27 54 14 4 2 3.08 7.03 1601 WorldValueStudy 1 WVSDatafile 25.10.91 1990 H13 27 48 18 6 1 2.97 6.75 2736 WorldValueStudy 2 ICPSRDatafile 6160 Nigeria 19906 H13 40 26 26 8 1 2.98 6.63 1001 WorldValueStudy 2 ICPSR Datafile 6160 ANGLO-AMERICA Canada 1946/10 H19 32 55 10 3 * 3.16 6.95 CIPO Cantril 1951:281 1981 H13 35 61 4 0 0 3.31 7.79 1254 WorldValueStudy 1 WVSDatafile 25.10.91
Happiness in Nations IITable 1.1.1. b
14 Representive Nation Samples
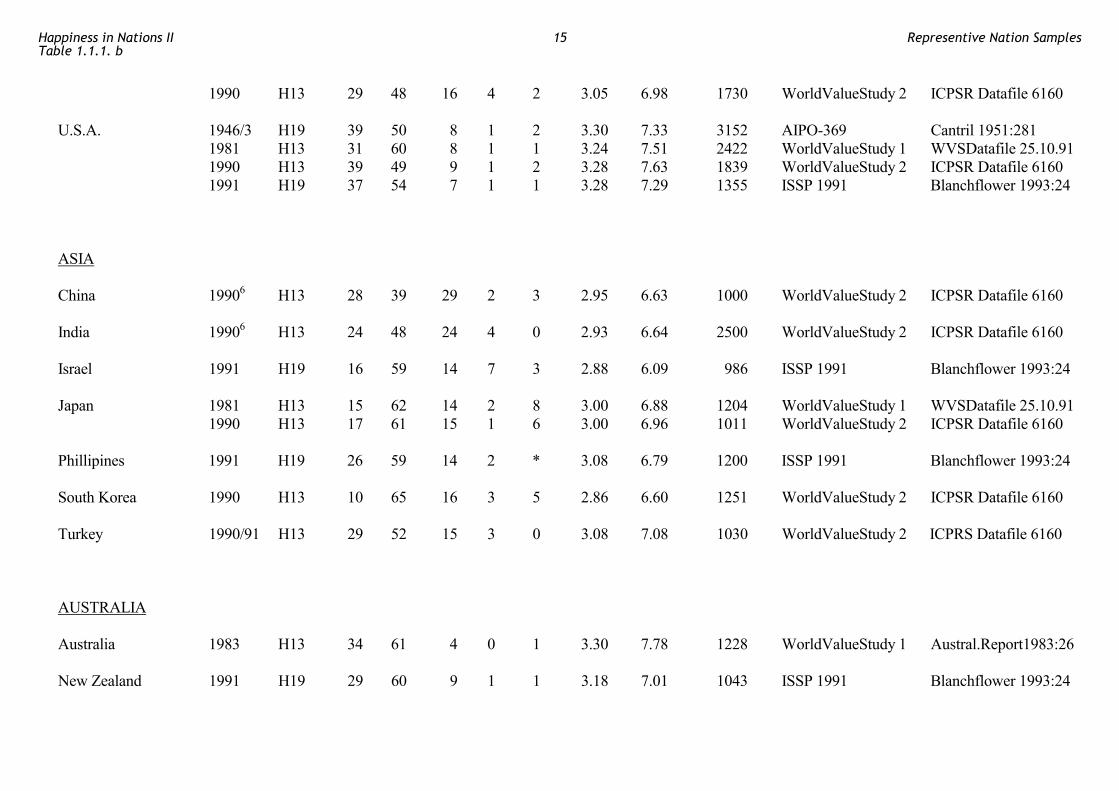
1990 H13 29 48 16 4 2 3.05 6.98 1730 WorldValueStudy 2 ICPSR Datafile 6160 U.S.A. 1946/3 H19 39 50 8 1 2 3.30 7.33 3152 AIPO-369 Cantril 1951:281 1981 H13 31 60 8 1 1 3.24 7.51 2422 WorldValueStudy 1 WVSDatafile 25.10.91 1990 H13 39 49 9 1 2 3.28 7.63 1839 WorldValueStudy 2 ICPSR Datafile 6160 1991 H19 37 54 7 1 1 3.28 7.29 1355 ISSP 1991 Blanchflower 1993:24 ASIA China 19906 H13 28 39 29 2 3 2.95 6.63 1000 WorldValueStudy 2 ICPSR Datafile 6160 India 19906 H13 24 48 24 4 0 2.93 6.64 2500 WorldValueStudy 2 ICPSR Datafile 6160 Israel 1991 H19 16 59 14 7 3 2.88 6.09 986 ISSP 1991 Blanchflower 1993:24 Japan 1981 H13 15 62 14 2 8 3.00 6.88 1204 WorldValueStudy 1 WVSDatafile 25.10.91 1990 H13 17 61 15 1 6 3.00 6.96 1011 WorldValueStudy 2 ICPSR Datafile 6160 Phillipines 1991 H19 26 59 14 2 * 3.08 6.79 1200 ISSP 1991 Blanchflower 1993:24 South Korea 1990 H13 10 65 16 3 5 2.86 6.60 1251 WorldValueStudy 2 ICPSR Datafile 6160 Turkey 1990/91 H13 29 52 15 3 0 3.08 7.08 1030 WorldValueStudy 2 ICPRS Datafile 6160 AUSTRALIA Australia 1983 H13 34 61 4 0 1 3.30 7.78 1228 WorldValueStudy 1 Austral.Report1983:26 New Zealand 1991 H19 29 60 9 1 1 3.18 7.01 1043 ISSP 1991 Blanchflower 1993:24
Happiness in Nations IITable 1.1.1. b
15 Representive Nation Samples
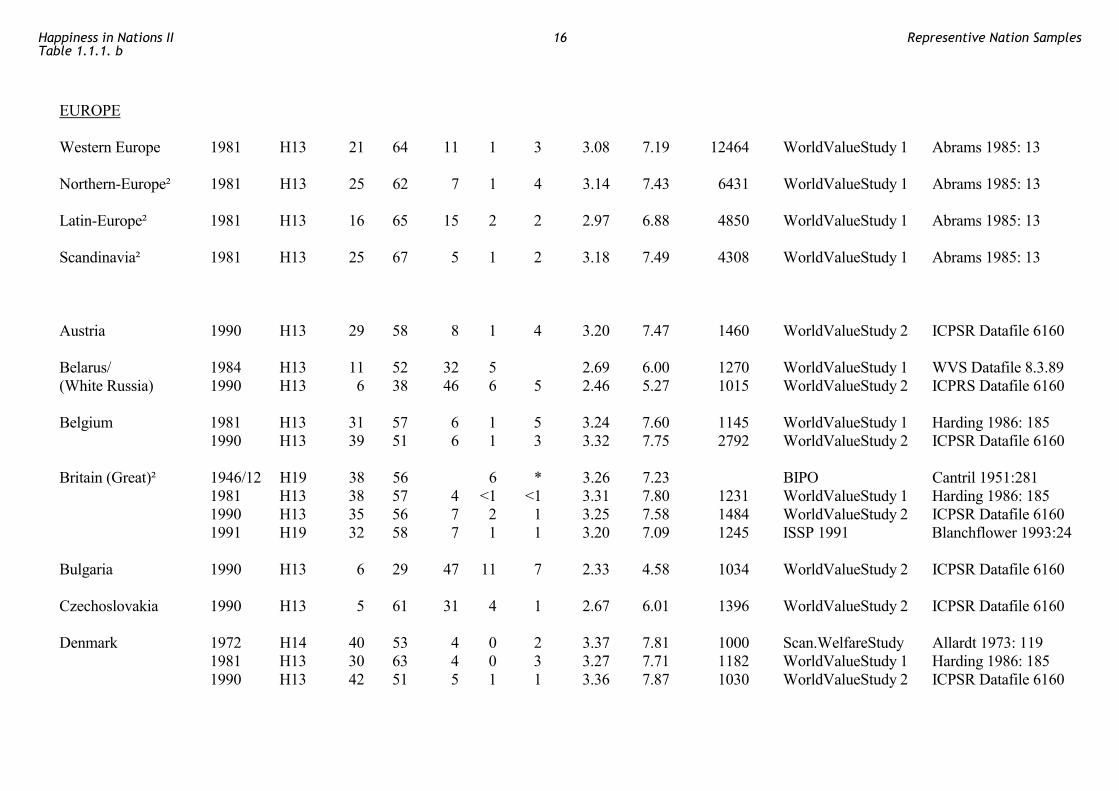
EUROPE Western Europe 1981 H13 21 64 11 1 3 3.08 7.19 12464 WorldValueStudy 1 Abrams 1985: 13 Northern-Europe² 1981 H13 25 62 7 1 4 3.14 7.43 6431 WorldValueStudy 1 Abrams 1985: 13 Latin-Europe² 1981 H13 16 65 15 2 2 2.97 6.88 4850 WorldValueStudy 1 Abrams 1985: 13 Scandinavia² 1981 H13 25 67 5 1 2 3.18 7.49 4308 WorldValueStudy 1 Abrams 1985: 13 Austria 1990 H13 29 58 8 1 4 3.20 7.47 1460 WorldValueStudy 2 ICPSR Datafile 6160 Belarus/ 1984 H13 11 52 32 5 2.69 6.00 1270 WorldValueStudy 1 WVS Datafile 8.3.89 (White Russia) 1990 H13 6 38 46 6 5 2.46 5.27 1015 WorldValueStudy 2 ICPRS Datafile 6160 Belgium 1981 H13 31 57 6 1 5 3.24 7.60 1145 WorldValueStudy 1 Harding 1986: 185 1990 H13 39 51 6 1 3 3.32 7.75 2792 WorldValueStudy 2 ICPSR Datafile 6160 Britain (Great)² 1946/12 H19 38 56 6 * 3.26 7.23 BIPO Cantril 1951:281 1981 H13 38 57 4 <1 <1 3.31 7.80 1231 WorldValueStudy 1 Harding 1986: 185 1990 H13 35 56 7 2 1 3.25 7.58 1484 WorldValueStudy 2 ICPSR Datafile 6160 1991 H19 32 58 7 1 1 3.20 7.09 1245 ISSP 1991 Blanchflower 1993:24 Bulgaria 1990 H13 6 29 47 11 7 2.33 4.58 1034 WorldValueStudy 2 ICPSR Datafile 6160 Czechoslovakia 1990 H13 5 61 31 4 1 2.67 6.01 1396 WorldValueStudy 2 ICPSR Datafile 6160 Denmark 1972 H14 40 53 4 0 2 3.37 7.81 1000 Scan.WelfareStudy Allardt 1973: 119 1981 H13 30 63 4 0 3 3.27 7.71 1182 WorldValueStudy 1 Harding 1986: 185 1990 H13 42 51 5 1 1 3.36 7.87 1030 WorldValueStudy 2 ICPSR Datafile 6160
Happiness in Nations IITable 1.1.1. b
16 Representive Nation Samples
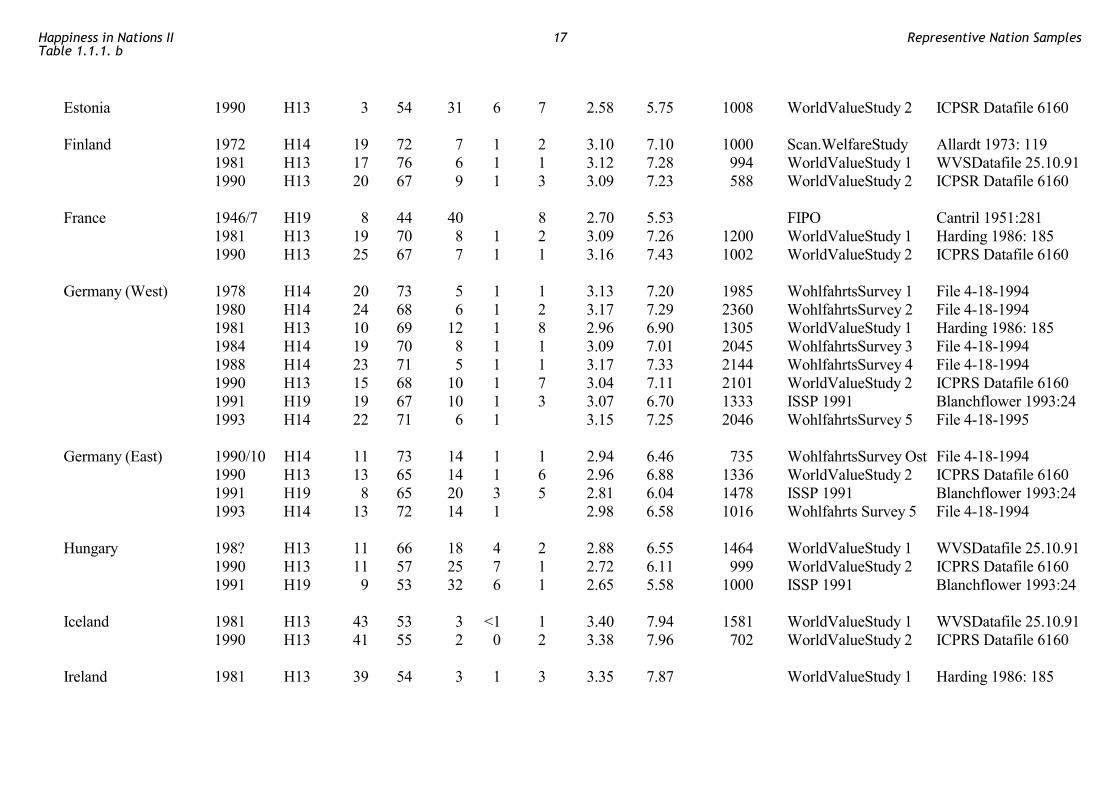
Estonia 1990 H13 3 54 31 6 7 2.58 5.75 1008 WorldValueStudy 2 ICPSR Datafile 6160 Finland 1972 H14 19 72 7 1 2 3.10 7.10 1000 Scan.WelfareStudy Allardt 1973: 119 1981 H13 17 76 6 1 1 3.12 7.28 994 WorldValueStudy 1 WVSDatafile 25.10.91 1990 H13 20 67 9 1 3 3.09 7.23 588 WorldValueStudy 2 ICPSR Datafile 6160 France 1946/7 H19 8 44 40 8 2.70 5.53 FIPO Cantril 1951:281 1981 H13 19 70 8 1 2 3.09 7.26 1200 WorldValueStudy 1 Harding 1986: 185 1990 H13 25 67 7 1 1 3.16 7.43 1002 WorldValueStudy 2 ICPRS Datafile 6160 Germany (West) 1978 H14 20 73 5 1 1 3.13 7.20 1985 WohlfahrtsSurvey 1 File 4-18-1994 1980 H14 24 68 6 1 2 3.17 7.29 2360 WohlfahrtsSurvey 2 File 4-18-1994 1981 H13 10 69 12 1 8 2.96 6.90 1305 WorldValueStudy 1 Harding 1986: 185 1984 H14 19 70 8 1 1 3.09 7.01 2045 WohlfahrtsSurvey 3 File 4-18-1994 1988 H14 23 71 5 1 1 3.17 7.33 2144 WohlfahrtsSurvey 4 File 4-18-1994 1990 H13 15 68 10 1 7 3.04 7.11 2101 WorldValueStudy 2 ICPRS Datafile 6160 1991 H19 19 67 10 1 3 3.07 6.70 1333 ISSP 1991 Blanchflower 1993:24 1993 H14 22 71 6 1 3.15 7.25 2046 WohlfahrtsSurvey 5 File 4-18-1995 Germany (East) 1990/10 H14 11 73 14 1 1 2.94 6.46 735 WohlfahrtsSurvey Ost File 4-18-1994 1990 H13 13 65 14 1 6 2.96 6.88 1336 WorldValueStudy 2 ICPRS Datafile 6160 1991 H19 8 65 20 3 5 2.81 6.04 1478 ISSP 1991 Blanchflower 1993:24 1993 H14 13 72 14 1 2.98 6.58 1016 Wohlfahrts Survey 5 File 4-18-1994 Hungary 198? H13 11 66 18 4 2 2.88 6.55 1464 WorldValueStudy 1 WVSDatafile 25.10.91 1990 H13 11 57 25 7 1 2.72 6.11 999 WorldValueStudy 2 ICPRS Datafile 6160 1991 H19 9 53 32 6 1 2.65 5.58 1000 ISSP 1991 Blanchflower 1993:24 Iceland 1981 H13 43 53 3 <1 1 3.40 7.94 1581 WorldValueStudy 1 WVSDatafile 25.10.91 1990 H13 41 55 2 0 2 3.38 7.96 702 WorldValueStudy 2 ICPRS Datafile 6160 Ireland 1981 H13 39 54 3 1 3 3.35 7.87 WorldValueStudy 1 Harding 1986: 185
Happiness in Nations IITable 1.1.1. b
17 Representive Nation Samples
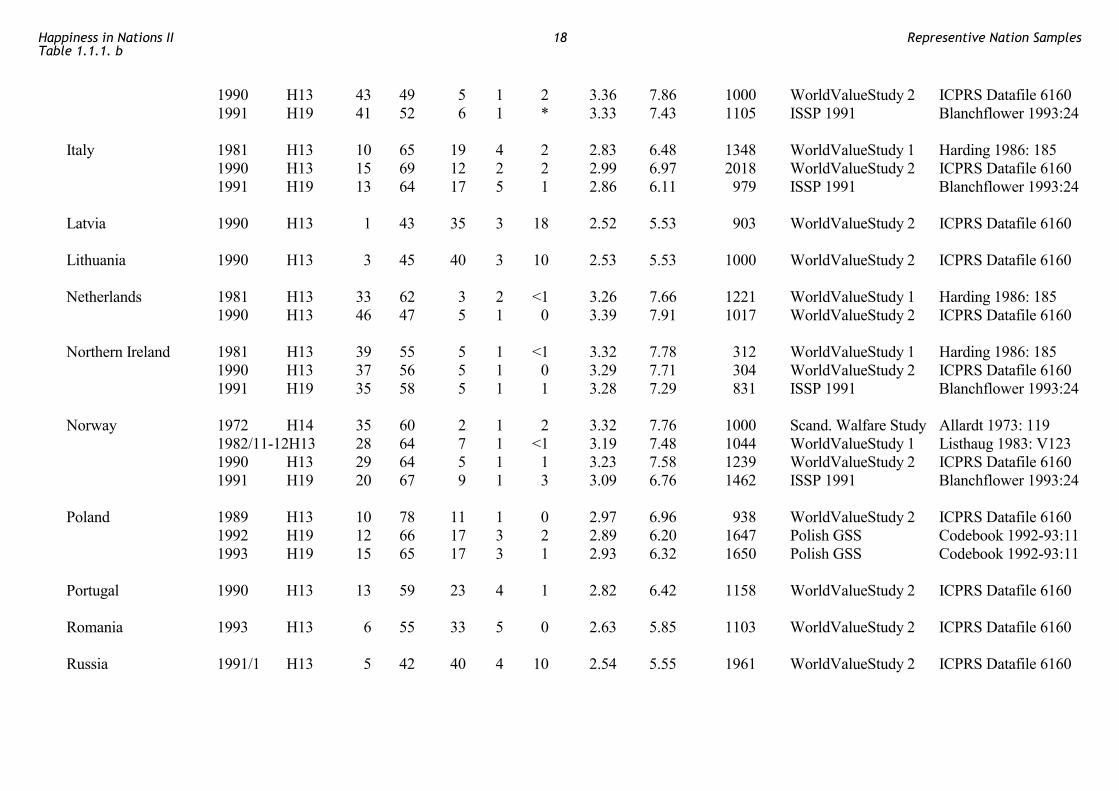
1990 H13 43 49 5 1 2 3.36 7.86 1000 WorldValueStudy 2 ICPRS Datafile 6160 1991 H19 41 52 6 1 * 3.33 7.43 1105 ISSP 1991 Blanchflower 1993:24 Italy 1981 H13 10 65 19 4 2 2.83 6.48 1348 WorldValueStudy 1 Harding 1986: 185 1990 H13 15 69 12 2 2 2.99 6.97 2018 WorldValueStudy 2 ICPRS Datafile 6160 1991 H19 13 64 17 5 1 2.86 6.11 979 ISSP 1991 Blanchflower 1993:24 Latvia 1990 H13 1 43 35 3 18 2.52 5.53 903 WorldValueStudy 2 ICPRS Datafile 6160 Lithuania 1990 H13 3 45 40 3 10 2.53 5.53 1000 WorldValueStudy 2 ICPRS Datafile 6160 Netherlands 1981 H13 33 62 3 2 <1 3.26 7.66 1221 WorldValueStudy 1 Harding 1986: 185 1990 H13 46 47 5 1 0 3.39 7.91 1017 WorldValueStudy 2 ICPRS Datafile 6160 Northern Ireland 1981 H13 39 55 5 1 <1 3.32 7.78 312 WorldValueStudy 1 Harding 1986: 185 1990 H13 37 56 5 1 0 3.29 7.71 304 WorldValueStudy 2 ICPRS Datafile 6160 1991 H19 35 58 5 1 1 3.28 7.29 831 ISSP 1991 Blanchflower 1993:24 Norway 1972 H14 35 60 2 1 2 3.32 7.76 1000 Scand. Walfare Study Allardt 1973: 119 1982/11-12H13 28 64 7 1 <1 3.19 7.48 1044 WorldValueStudy 1 Listhaug 1983: V123 1990 H13 29 64 5 1 1 3.23 7.58 1239 WorldValueStudy 2 ICPRS Datafile 6160 1991 H19 20 67 9 1 3 3.09 6.76 1462 ISSP 1991 Blanchflower 1993:24 Poland 1989 H13 10 78 11 1 0 2.97 6.96 938 WorldValueStudy 2 ICPRS Datafile 6160 1992 H19 12 66 17 3 2 2.89 6.20 1647 Polish GSS Codebook 1992-93:11 1993 H19 15 65 17 3 1 2.93 6.32 1650 Polish GSS Codebook 1992-93:11 Portugal 1990 H13 13 59 23 4 1 2.82 6.42 1158 WorldValueStudy 2 ICPRS Datafile 6160 Romania 1993 H13 6 55 33 5 0 2.63 5.85 1103 WorldValueStudy 2 ICPRS Datafile 6160 Russia 1991/1 H13 5 42 40 4 10 2.54 5.55 1961 WorldValueStudy 2 ICPRS Datafile 6160
Happiness in Nations IITable 1.1.1. b
18 Representive Nation Samples
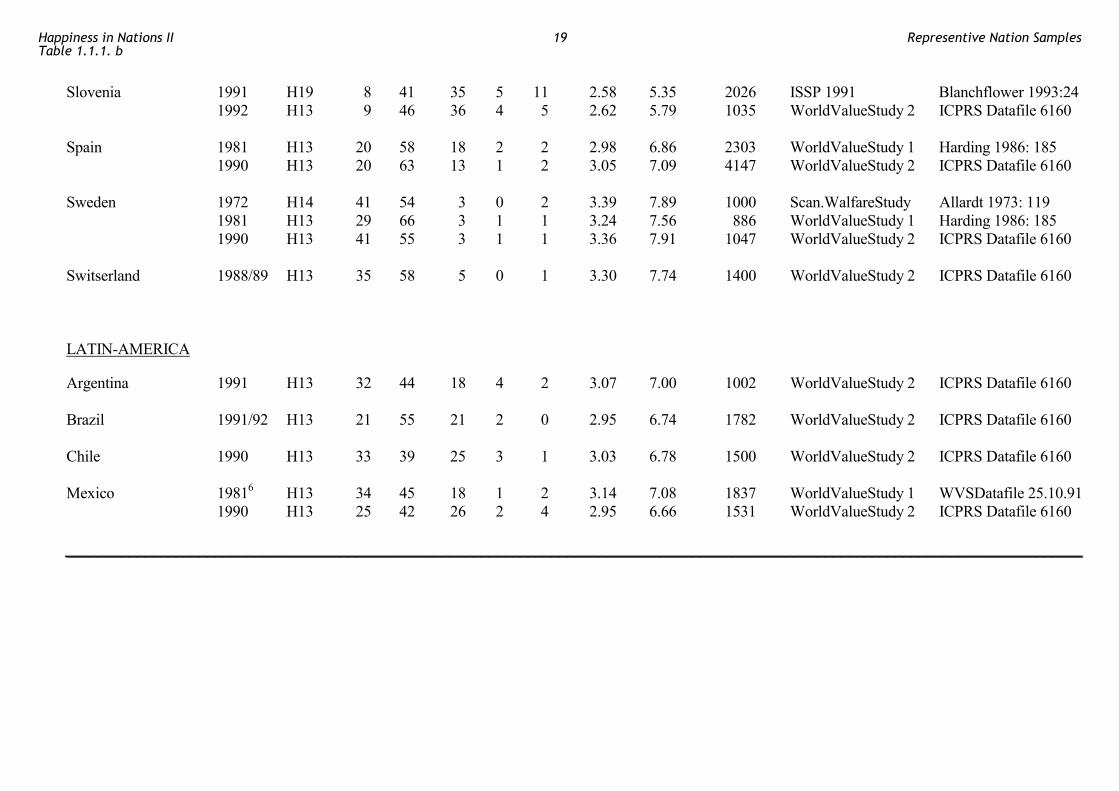
Slovenia 1991 H19 8 41 35 5 11 2.58 5.35 2026 ISSP 1991 Blanchflower 1993:24 1992 H13 9 46 36 4 5 2.62 5.79 1035 WorldValueStudy 2 ICPRS Datafile 6160 Spain 1981 H13 20 58 18 2 2 2.98 6.86 2303 WorldValueStudy 1 Harding 1986: 185 1990 H13 20 63 13 1 2 3.05 7.09 4147 WorldValueStudy 2 ICPRS Datafile 6160 Sweden 1972 H14 41 54 3 0 2 3.39 7.89 1000 Scan.WalfareStudy Allardt 1973: 119 1981 H13 29 66 3 1 1 3.24 7.56 886 WorldValueStudy 1 Harding 1986: 185 1990 H13 41 55 3 1 1 3.36 7.91 1047 WorldValueStudy 2 ICPRS Datafile 6160 Switserland 1988/89 H13 35 58 5 0 1 3.30 7.74 1400 WorldValueStudy 2 ICPRS Datafile 6160 LATIN-AMERICA Argentina 1991 H13 32 44 18 4 2 3.07 7.00 1002 WorldValueStudy 2 ICPRS Datafile 6160 Brazil 1991/92 H13 21 55 21 2 0 2.95 6.74 1782 WorldValueStudy 2 ICPRS Datafile 6160 Chile 1990 H13 33 39 25 3 1 3.03 6.78 1500 WorldValueStudy 2 ICPRS Datafile 6160 Mexico 19816 H13 34 45 18 1 2 3.14 7.08 1837 WorldValueStudy 1 WVSDatafile 25.10.91 1990 H13 25 42 26 2 4 2.95 6.66 1531 WorldValueStudy 2 ICPRS Datafile 6160 __________________________________________________________________________________________________________________________________
Happiness in Nations IITable 1.1.1. b
19 Representive Nation Samples
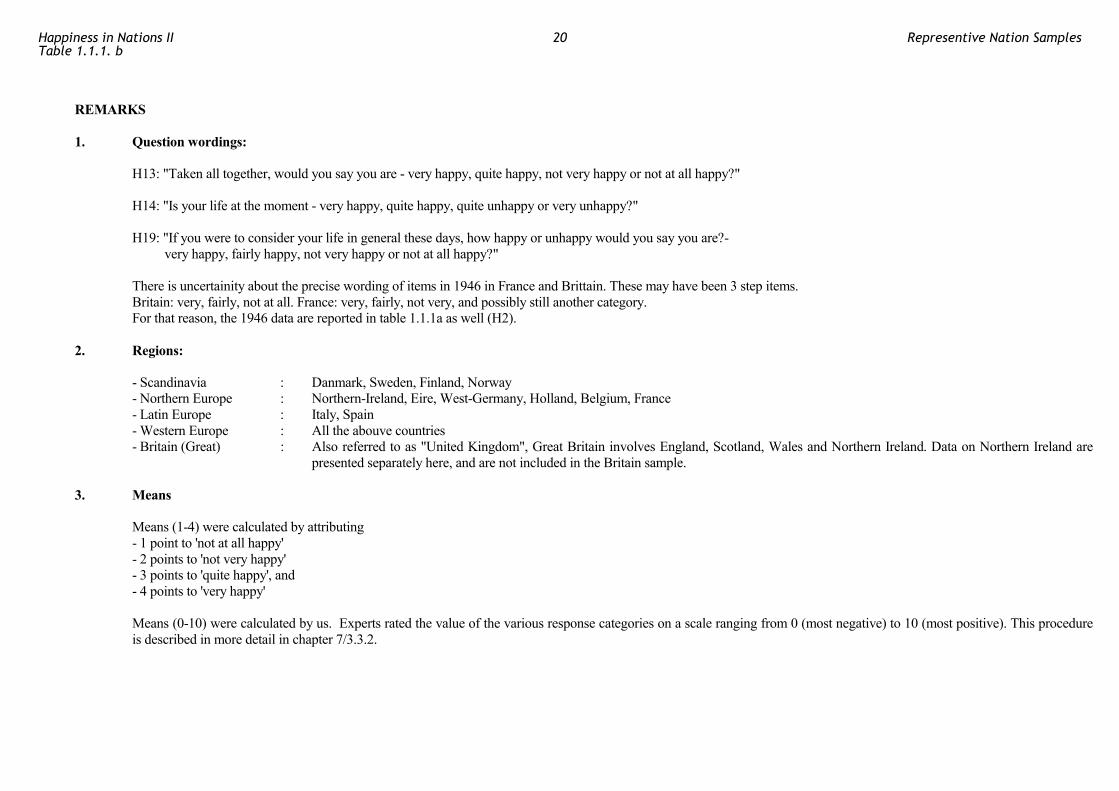
REMARKS 1. Question wordings: H13: "Taken all together, would you say you are - very happy, quite happy, not very happy or not at all happy?" H14: "Is your life at the moment - very happy, quite happy, quite unhappy or very unhappy?" H19: "If you were to consider your life in general these days, how happy or unhappy would you say you are?- very happy, fairly happy, not very happy or not at all happy?" There is uncertainity about the precise wording of items in 1946 in France and Brittain. These may have been 3 step items. Britain: very, fairly, not at all. France: very, fairly, not very, and possibly still another category. For that reason, the 1946 data are reported in table 1.1.1a as well (H2). 2. Regions: - Scandinavia : Danmark, Sweden, Finland, Norway - Northern Europe : Northern-Ireland, Eire, West-Germany, Holland, Belgium, France - Latin Europe : Italy, Spain - Western Europe : All the abouve countries - Britain (Great) : Also referred to as "United Kingdom", Great Britain involves England, Scotland, Wales and Northern Ireland. Data on Northern Ireland are
presented separately here, and are not included in the Britain sample. 3. Means Means (1-4) were calculated by attributing - 1 point to 'not at all happy' - 2 points to 'not very happy' - 3 points to 'quite happy', and - 4 points to 'very happy' Means (0-10) were calculated by us. Experts rated the value of the various response categories on a scale ranging from 0 (most negative) to 10 (most positive). This procedure
is described in more detail in chapter 7/3.3.2.
Happiness in Nations IITable 1.1.1. b
20 Representive Nation Samples
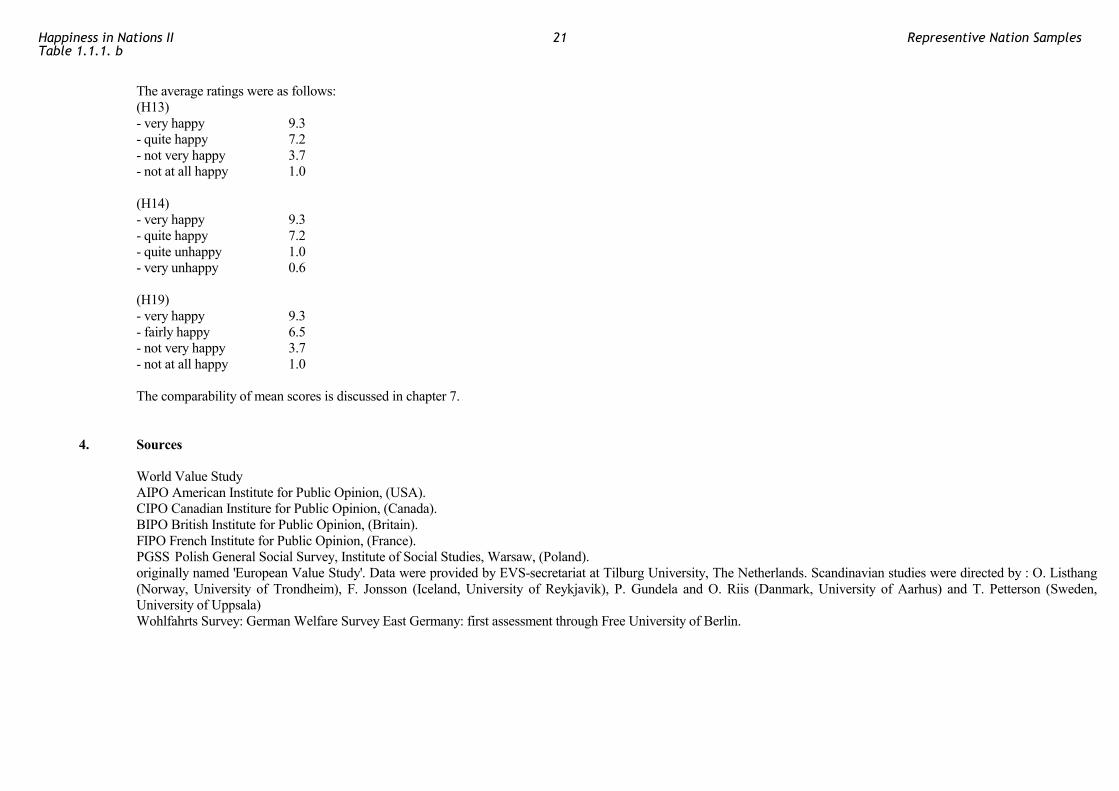
The average ratings were as follows: (H13) - very happy 9.3 - quite happy 7.2 - not very happy 3.7 - not at all happy 1.0 (H14) - very happy 9.3 - quite happy 7.2 - quite unhappy 1.0 - very unhappy 0.6 (H19) - very happy 9.3 - fairly happy 6.5 - not very happy 3.7 - not at all happy 1.0 The comparability of mean scores is discussed in chapter 7. 4. Sources World Value Study AIPO American Institute for Public Opinion, (USA). CIPO Canadian Institure for Public Opinion, (Canada). BIPO British Institute for Public Opinion, (Britain). FIPO French Institute for Public Opinion, (France). PGSS Polish General Social Survey, Institute of Social Studies, Warsaw, (Poland). originally named 'European Value Study'. Data were provided by EVS-secretariat at Tilburg University, The Netherlands. Scandinavian studies were directed by : O. Listhang (Norway, University of Trondheim), F. Jonsson (Iceland, University of Reykjavik), P. Gundela and O. Riis (Danmark, University of Aarhus) and T. Petterson (Sweden, University of Uppsala) Wohlfahrts Survey: German Welfare Survey East Germany: first assessment through Free University of Berlin.
Happiness in Nations IITable 1.1.1. b
21 Representive Nation Samples
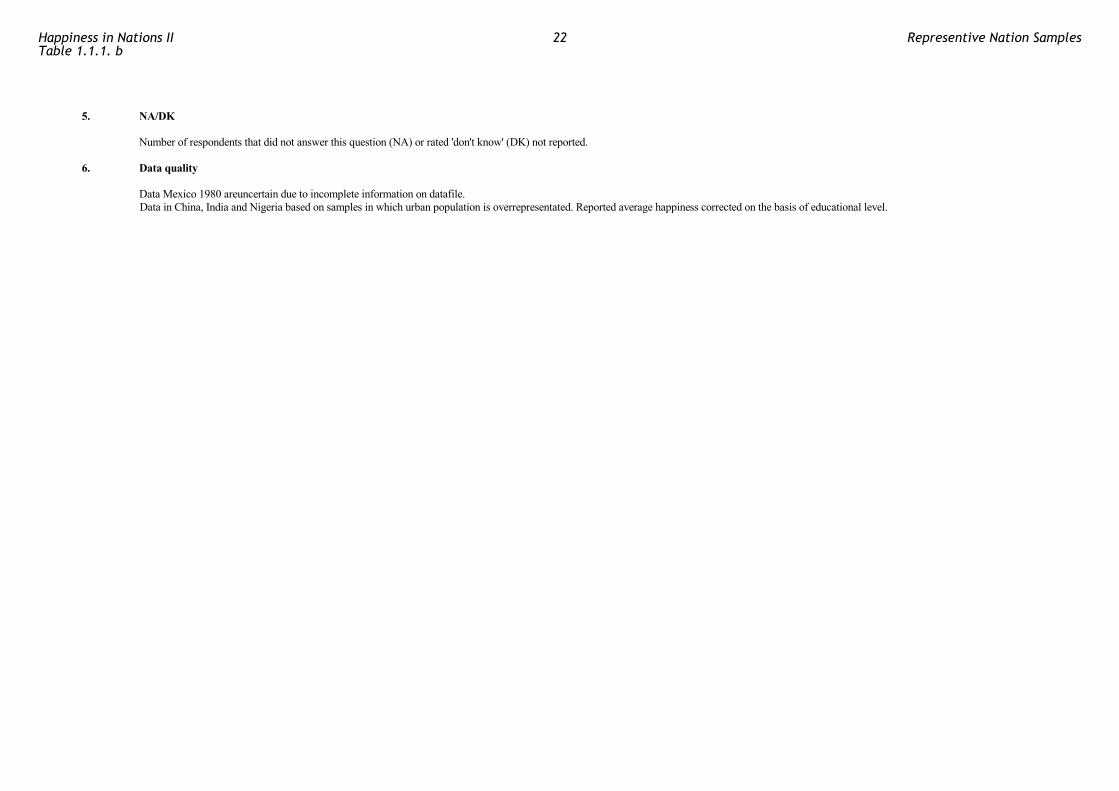
5. NA/DK Number of respondents that did not answer this question (NA) or rated 'don't know' (DK) not reported. 6. Data quality Data Mexico 1980 areuncertain due to incomplete information on datafile. Data in China, India and Nigeria based on samples in which urban population is overrepresentated. Reported average happiness corrected on the basis of educational level.
Happiness in Nations IITable 1.1.1. b
22 Representive Nation Samples
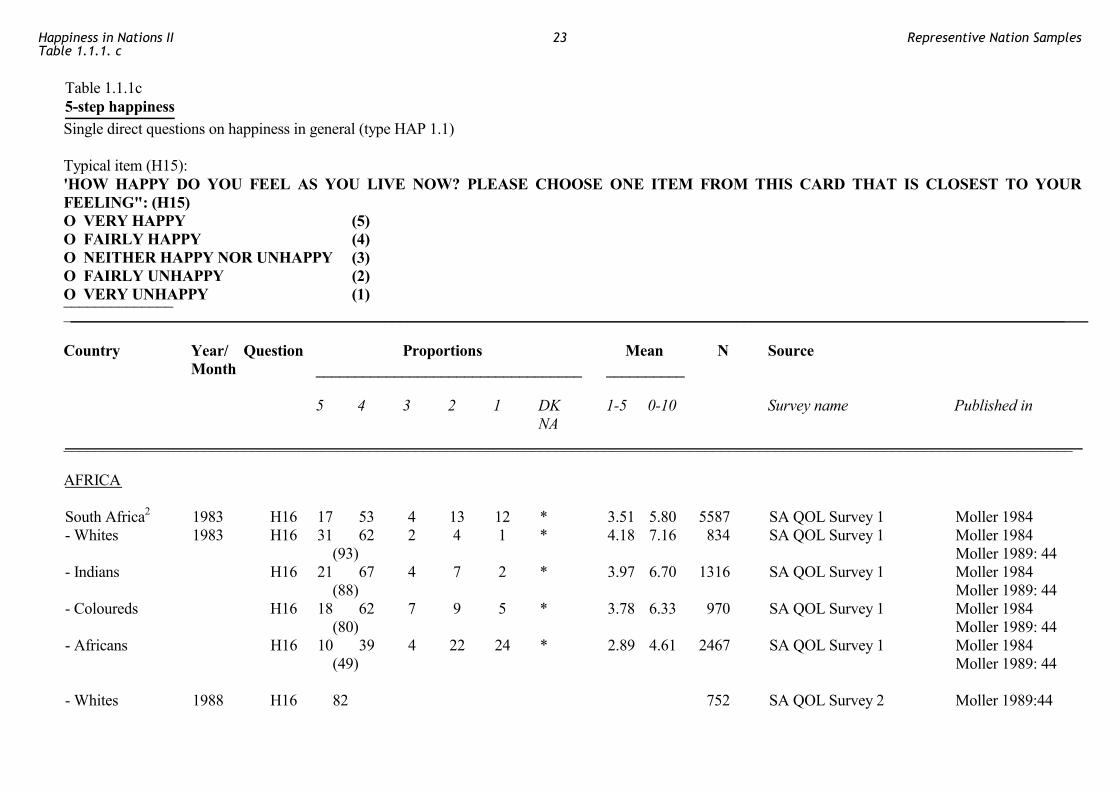
Table 1.1.1c 5-step happiness Single direct questions on happiness in general (type HAP 1.1) Typical item (H15): 'HOW HAPPY DO YOU FEEL AS YOU LIVE NOW? PLEASE CHOOSE ONE ITEM FROM THIS CARD THAT IS CLOSEST TO YOUR FEELING": (H15) O VERY HAPPY (5) O FAIRLY HAPPY (4) O NEITHER HAPPY NOR UNHAPPY (3) O FAIRLY UNHAPPY (2) O VERY UNHAPPY (1) ______________ ________________________________________________________________________________________________________________________________ Country Year/ Question Proportions Mean N Source Month __________________________________ __________ 5 4 3 2 1 DK 1-5 0-10 Survey name Published in NA _________________________________________________________________________________________________________________________________ AFRICA South Africa2 1983 H16 17 53 4 13 12 * 3.51 5.80 5587 SA QOL Survey 1 Moller 1984 - Whites 1983 H16 31 62 2 4 1 * 4.18 7.16 834 SA QOL Survey 1 Moller 1984 (93) Moller 1989: 44 - Indians H16 21 67 4 7 2 * 3.97 6.70 1316 SA QOL Survey 1 Moller 1984 (88) Moller 1989: 44 - Coloureds H16 18 62 7 9 5 * 3.78 6.33 970 SA QOL Survey 1 Moller 1984 (80) Moller 1989: 44 - Africans H16 10 39 4 22 24 * 2.89 4.61 2467 SA QOL Survey 1 Moller 1984 (49) Moller 1989: 44 - Whites 1988 H16 82 752 SA QOL Survey 2 Moller 1989:44
Happiness in Nations IITable 1.1.1. c
23 Representive Nation Samples
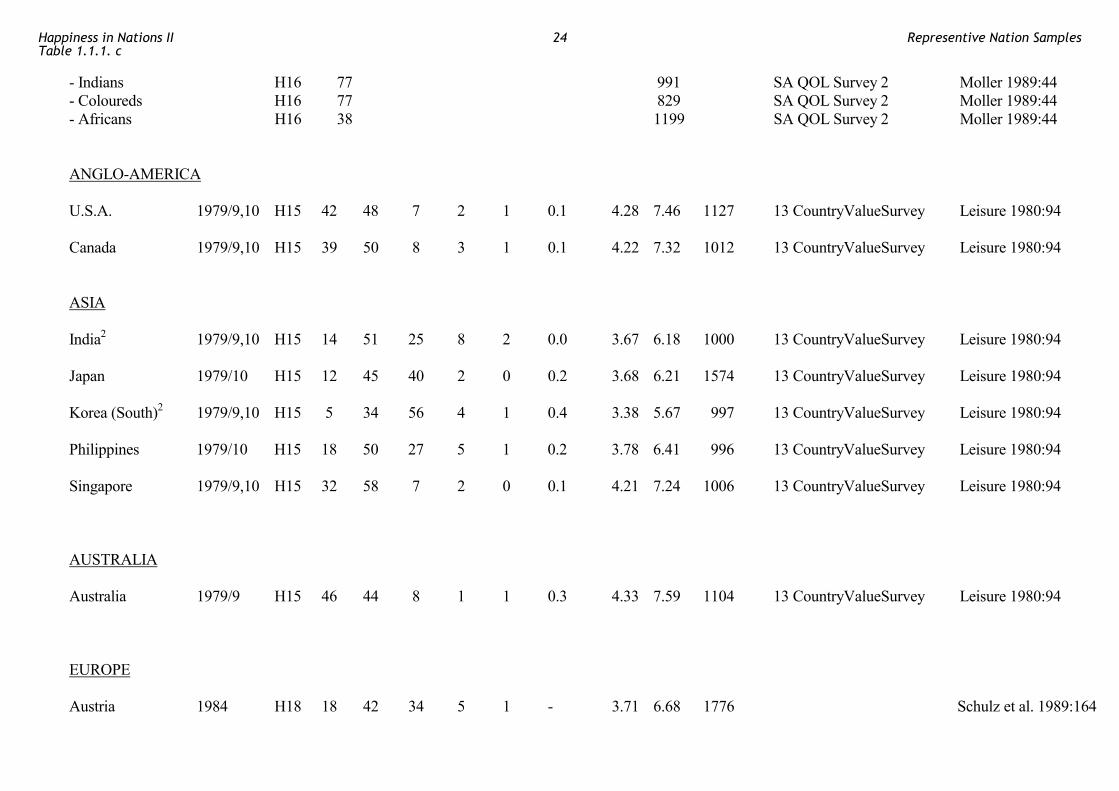
- Indians H16 77 991 SA QOL Survey 2 Moller 1989:44 - Coloureds H16 77 829 SA QOL Survey 2 Moller 1989:44 - Africans H16 38 1199 SA QOL Survey 2 Moller 1989:44 ANGLO-AMERICA U.S.A. 1979/9,10 H15 42 48 7 2 1 0.1 4.28 7.46 1127 13 CountryValueSurvey Leisure 1980:94 Canada 1979/9,10 H15 39 50 8 3 1 0.1 4.22 7.32 1012 13 CountryValueSurvey Leisure 1980:94 ASIA India2 1979/9,10 H15 14 51 25 8 2 0.0 3.67 6.18 1000 13 CountryValueSurvey Leisure 1980:94 Japan 1979/10 H15 12 45 40 2 0 0.2 3.68 6.21 1574 13 CountryValueSurvey Leisure 1980:94 Korea (South)2 1979/9,10 H15 5 34 56 4 1 0.4 3.38 5.67 997 13 CountryValueSurvey Leisure 1980:94 Philippines 1979/10 H15 18 50 27 5 1 0.2 3.78 6.41 996 13 CountryValueSurvey Leisure 1980:94 Singapore 1979/9,10 H15 32 58 7 2 0 0.1 4.21 7.24 1006 13 CountryValueSurvey Leisure 1980:94 AUSTRALIA Australia 1979/9 H15 46 44 8 1 1 0.3 4.33 7.59 1104 13 CountryValueSurvey Leisure 1980:94 EUROPE Austria 1984 H18 18 42 34 5 1 - 3.71 6.68 1776 Schulz et al. 1989:164
Happiness in Nations IITable 1.1.1. c
24 Representive Nation Samples

Britain (Great) 1979/9,10 H15 47 44 6 2 1 0.1 4.34 7.61 987 13 CountryValueSurvey Leisure 1980:94 France 1979/9 H15 16 51 31 2 1 0.1 3.78 6.39 993 13 CountryValueSurvey Leisure 1980:94 Germany (West) 1979/10 H15 12 49 36 2 0 2.0 3.72 6.27 1020 13 CountryValueSurvey Leisure 1980:94 Italy 1979/10 H15 10 52 31 5 1 1.0 3.66 6.13 1042 13 CountryValueSurvey Leisure 1980:94 Netherlands 1977 H17 22 62 14 2 0 0 4.04 7.18 4159 LifeSituationSurvey Jol 1981:22 1980 H17 24 61 11 2 1 1 4.06 7.24 2865 LifeSituationSurvey CBS datafile 2.4.91 1983 H17 20 64 12 3 0 0.3 4.02 7.15 3996 LifeSituationSurvey CBS datafile 2.4.91 1986 H17 21 64 12 2 0 0.2 4.05 7.20 4040 LifeSituationSurvey CBS datafile 2.4.91 1989 H17 26 62 9 3 1 0.0 4.08 7.29 2967 LifeSituationSurvey CBS datafile 2.4.91 1991 H17 (88) 5790 LifeSituationSurvey CBS 1992:58 LATIN-AMERICA Brazil2 1979/10 H15 40 36 21 1 1 1.3 4.14 7.27 1000 13 CountryValueSurvey Leisure 1980:94 _________________________________________________________________________________________________________________________________ REMARKS 1. Question wordings H15 How do you feel as you live now? Please choose one item from this card that is closes to your feeling: ! very happy ! fairly happy ! neither happy nor unhappy ! fairly unhappy ! very unhappy H16 Taking all things together in your life, how would you say things are these days.
Happiness in Nations IITable 1.1.1. c
25 Representive Nation Samples
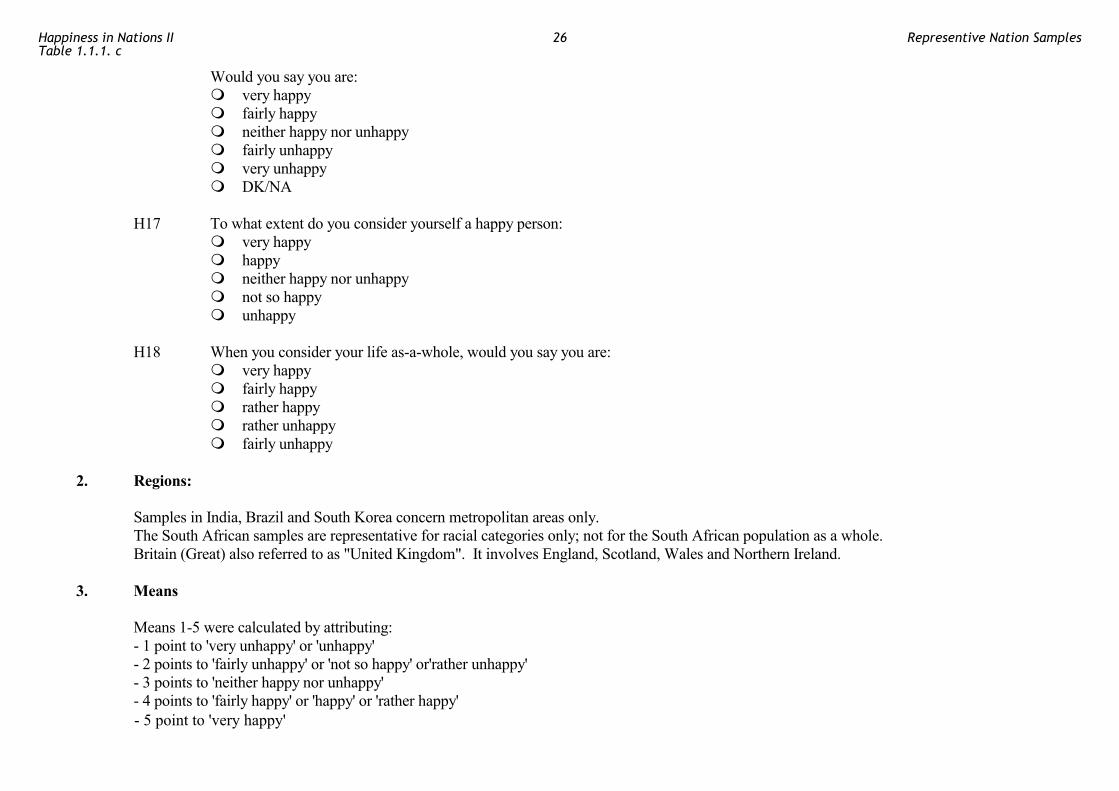
Would you say you are: ! very happy ! fairly happy ! neither happy nor unhappy ! fairly unhappy ! very unhappy ! DK/NA H17 To what extent do you consider yourself a happy person: ! very happy ! happy ! neither happy nor unhappy ! not so happy ! unhappy H18 When you consider your life as-a-whole, would you say you are: ! very happy ! fairly happy ! rather happy ! rather unhappy ! fairly unhappy 2. Regions: Samples in India, Brazil and South Korea concern metropolitan areas only. The South African samples are representative for racial categories only; not for the South African population as a whole. Britain (Great) also referred to as "United Kingdom". It involves England, Scotland, Wales and Northern Ireland. 3. Means Means 1-5 were calculated by attributing: - 1 point to 'very unhappy' or 'unhappy' - 2 points to 'fairly unhappy' or 'not so happy' or'rather unhappy' - 3 points to 'neither happy nor unhappy' - 4 points to 'fairly happy' or 'happy' or 'rather happy'
- 5 point to 'very happy'
Happiness in Nations IITable 1.1.1. c
26 Representive Nation Samples
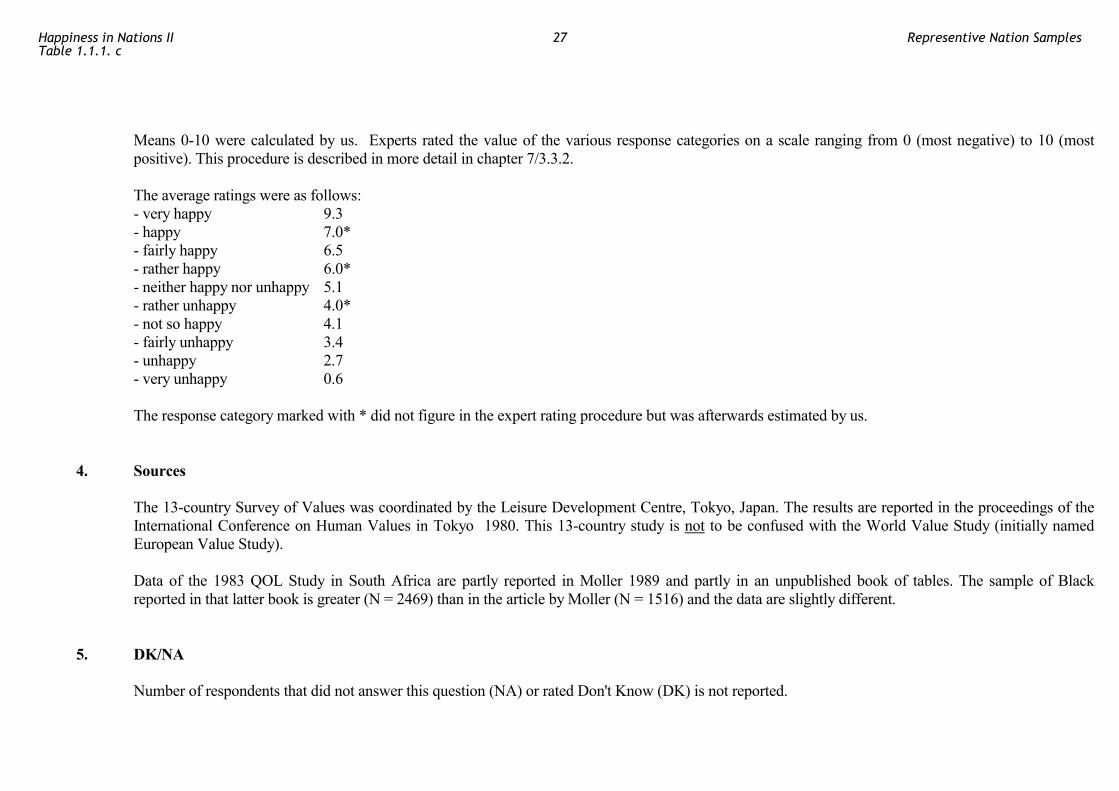
Means 0-10 were calculated by us. Experts rated the value of the various response categories on a scale ranging from 0 (most negative) to 10 (most
positive). This procedure is described in more detail in chapter 7/3.3.2. The average ratings were as follows: - very happy 9.3 - happy 7.0* - fairly happy 6.5 - rather happy 6.0* - neither happy nor unhappy 5.1 - rather unhappy 4.0* - not so happy 4.1 - fairly unhappy 3.4 - unhappy 2.7 - very unhappy 0.6 The response category marked with * did not figure in the expert rating procedure but was afterwards estimated by us. 4. Sources The 13-country Survey of Values was coordinated by the Leisure Development Centre, Tokyo, Japan. The results are reported in the proceedings of the
International Conference on Human Values in Tokyo 1980. This 13-country study is not to be confused with the World Value Study (initially named European Value Study).
Data of the 1983 QOL Study in South Africa are partly reported in Moller 1989 and partly in an unpublished book of tables. The sample of Black
reported in that latter book is greater (N = 2469) than in the article by Moller (N = 1516) and the data are slightly different. 5. DK/NA Number of respondents that did not answer this question (NA) or rated Don't Know (DK) is not reported.
Happiness in Nations IITable 1.1.1. c
27 Representive Nation Samples
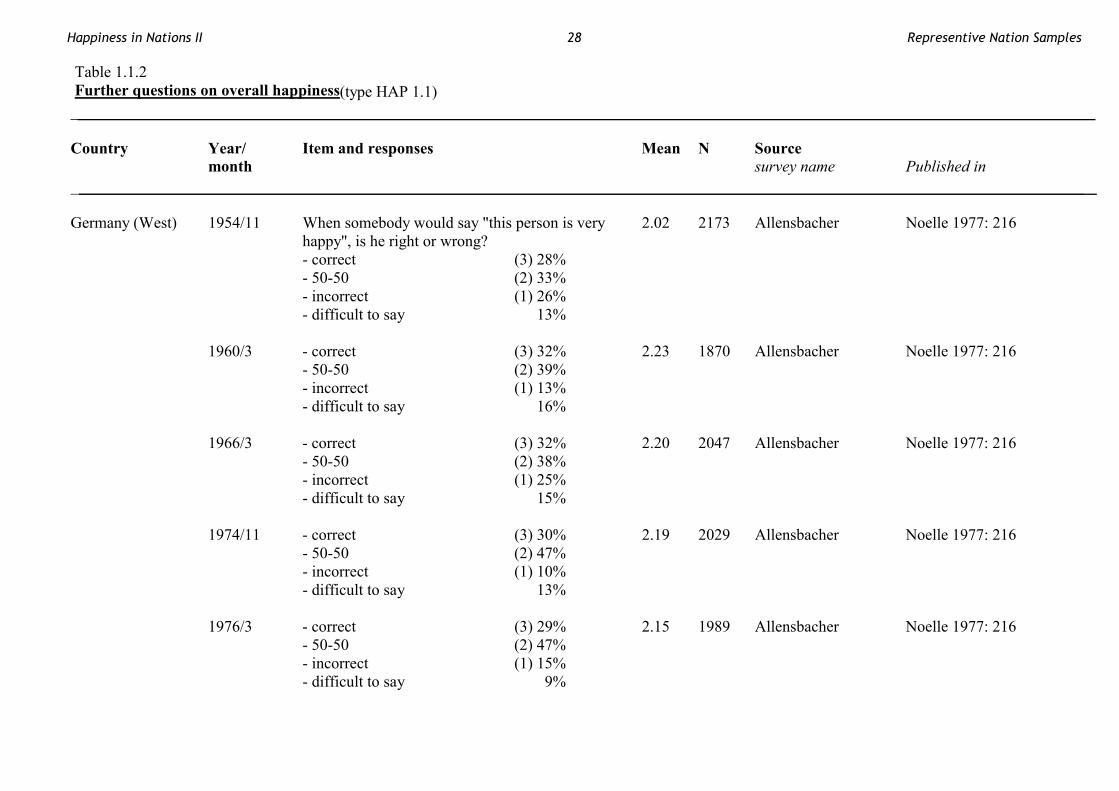
Table 1.1.2 Further questions on overall happiness (type HAP 1.1)
_______________________________________________________________________________________________________________________________ Country Year/ Item and responses Mean N Source month survey name Published in _______________________________________________________________________________________________________________________________ Germany (West) 1954/11 When somebody would say "this person is very 2.02 2173 Allensbacher Noelle 1977: 216 happy", is he right or wrong? - correct (3) 28% - 50-50 (2) 33% - incorrect (1) 26% - difficult to say 13% 1960/3 - correct (3) 32% 2.23 1870 Allensbacher Noelle 1977: 216 - 50-50 (2) 39% - incorrect (1) 13% - difficult to say 16% 1966/3 - correct (3) 32% 2.20 2047 Allensbacher Noelle 1977: 216 - 50-50 (2) 38% - incorrect (1) 25% - difficult to say 15% 1974/11 - correct (3) 30% 2.19 2029 Allensbacher Noelle 1977: 216 - 50-50 (2) 47% - incorrect (1) 10% - difficult to say 13% 1976/3 - correct (3) 29% 2.15 1989 Allensbacher Noelle 1977: 216 - 50-50 (2) 47% - incorrect (1) 15% - difficult to say 9%
Happiness in Nations II 28 Representive Nation Samples
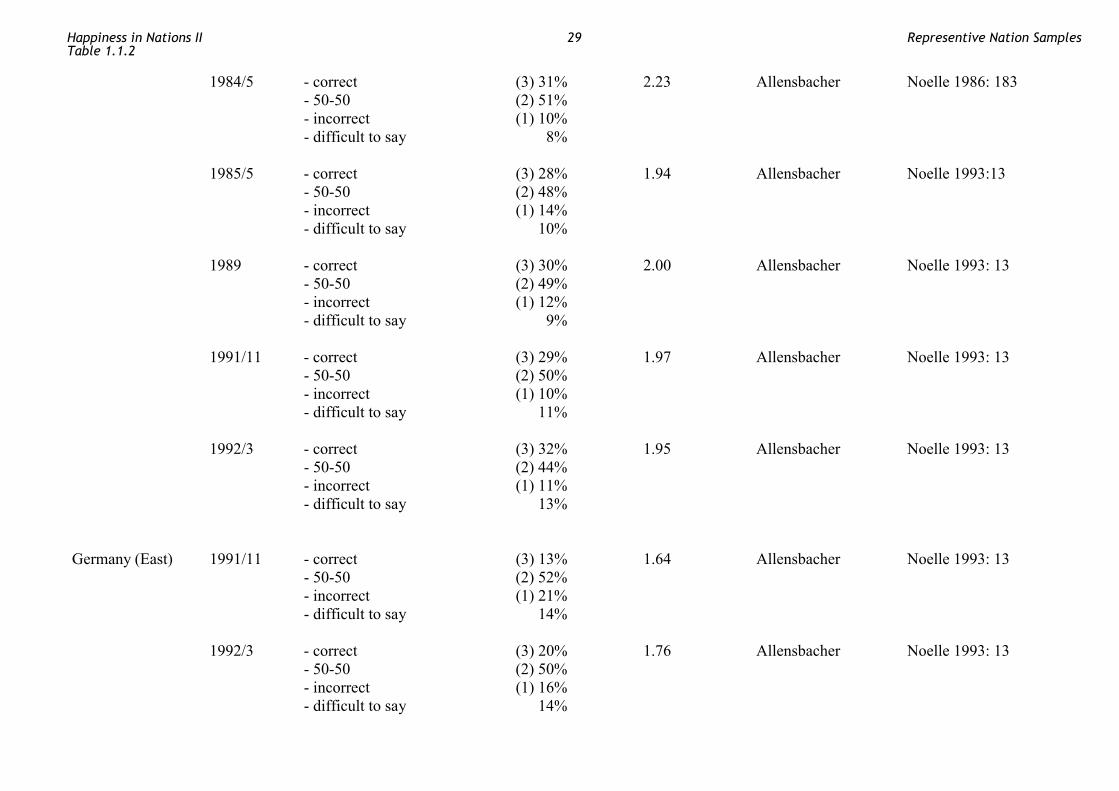
1984/5 - correct (3) 31% 2.23 Allensbacher Noelle 1986: 183 - 50-50 (2) 51% - incorrect (1) 10% - difficult to say 8% 1985/5 - correct (3) 28% 1.94 Allensbacher Noelle 1993:13 - 50-50 (2) 48% - incorrect (1) 14% - difficult to say 10% 1989 - correct (3) 30% 2.00 Allensbacher Noelle 1993: 13 - 50-50 (2) 49% - incorrect (1) 12% - difficult to say 9% 1991/11 - correct (3) 29% 1.97 Allensbacher Noelle 1993: 13 - 50-50 (2) 50% - incorrect (1) 10% - difficult to say 11% 1992/3 - correct (3) 32% 1.95 Allensbacher Noelle 1993: 13 - 50-50 (2) 44% - incorrect (1) 11% - difficult to say 13% Germany (East) 1991/11 - correct (3) 13% 1.64 Allensbacher Noelle 1993: 13 - 50-50 (2) 52% - incorrect (1) 21% - difficult to say 14% 1992/3 - correct (3) 20% 1.76 Allensbacher Noelle 1993: 13 - 50-50 (2) 50% - incorrect (1) 16% - difficult to say 14%
Happiness in Nations IITable 1.1.2
29 Representive Nation Samples
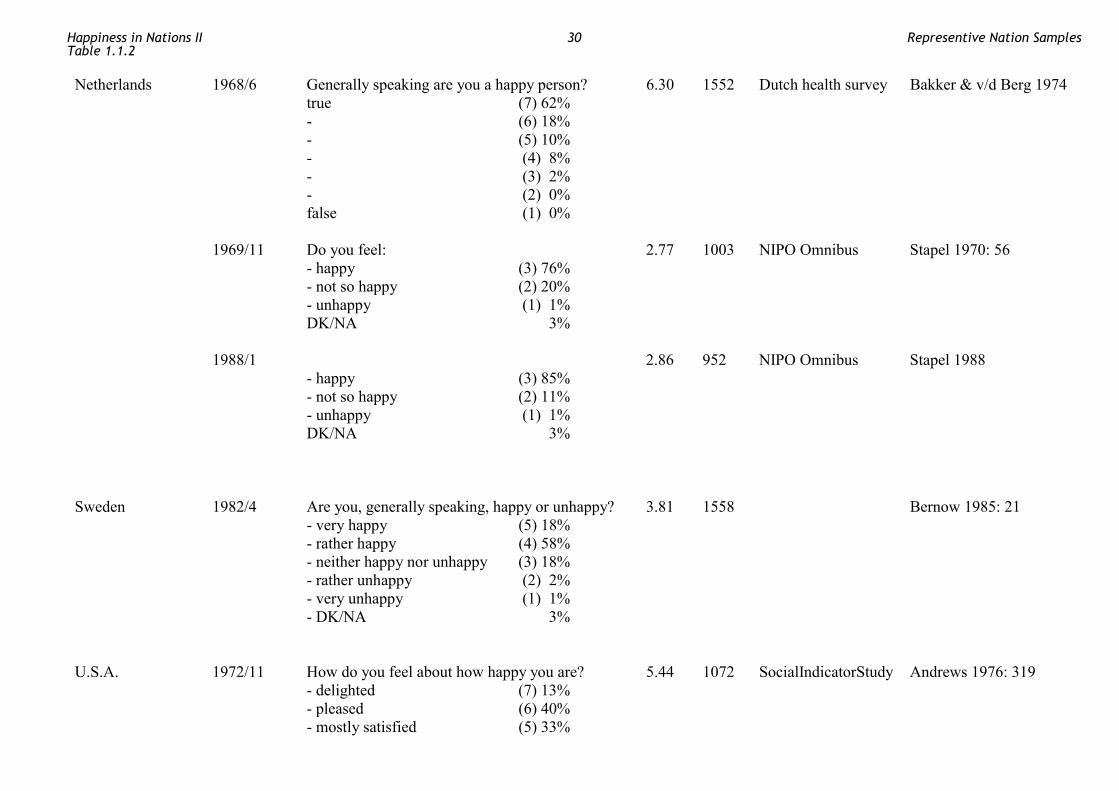
Netherlands 1968/6 Generally speaking are you a happy person? 6.30 1552 Dutch health survey Bakker & v/d Berg 1974 true (7) 62% - (6) 18% - (5) 10% - (4) 8% - (3) 2% - (2) 0% false (1) 0% 1969/11 Do you feel: 2.77 1003 NIPO Omnibus Stapel 1970: 56 - happy (3) 76% - not so happy (2) 20% - unhappy (1) 1% DK/NA 3% 1988/1 2.86 952 NIPO Omnibus Stapel 1988 - happy (3) 85% - not so happy (2) 11% - unhappy (1) 1% DK/NA 3% Sweden 1982/4 Are you, generally speaking, happy or unhappy? 3.81 1558 Bernow 1985: 21 - very happy (5) 18% - rather happy (4) 58% - neither happy nor unhappy (3) 18% - rather unhappy (2) 2% - very unhappy (1) 1% - DK/NA 3% U.S.A. 1972/11 How do you feel about how happy you are? 5.44 1072 SocialIndicatorStudy Andrews 1976: 319 - delighted (7) 13% - pleased (6) 40% - mostly satisfied (5) 33%
Happiness in Nations IITable 1.1.2
30 Representive Nation Samples
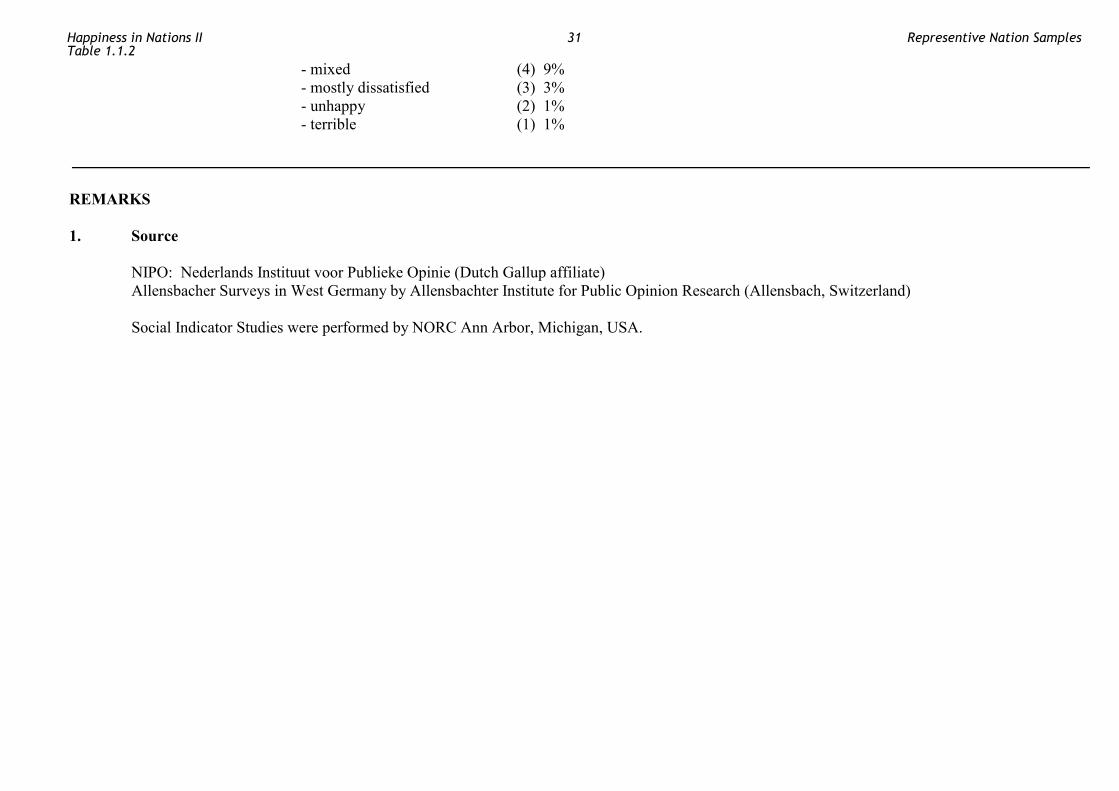
- mixed (4) 9% - mostly dissatisfied (3) 3% - unhappy (2) 1% - terrible (1) 1%
REMARKS 1. Source NIPO: Nederlands Instituut voor Publieke Opinie (Dutch Gallup affiliate) Allensbacher Surveys in West Germany by Allensbachter Institute for Public Opinion Research (Allensbach, Switzerland) Social Indicator Studies were performed by NORC Ann Arbor, Michigan, USA.
Happiness in Nations IITable 1.1.2
31 Representive Nation Samples
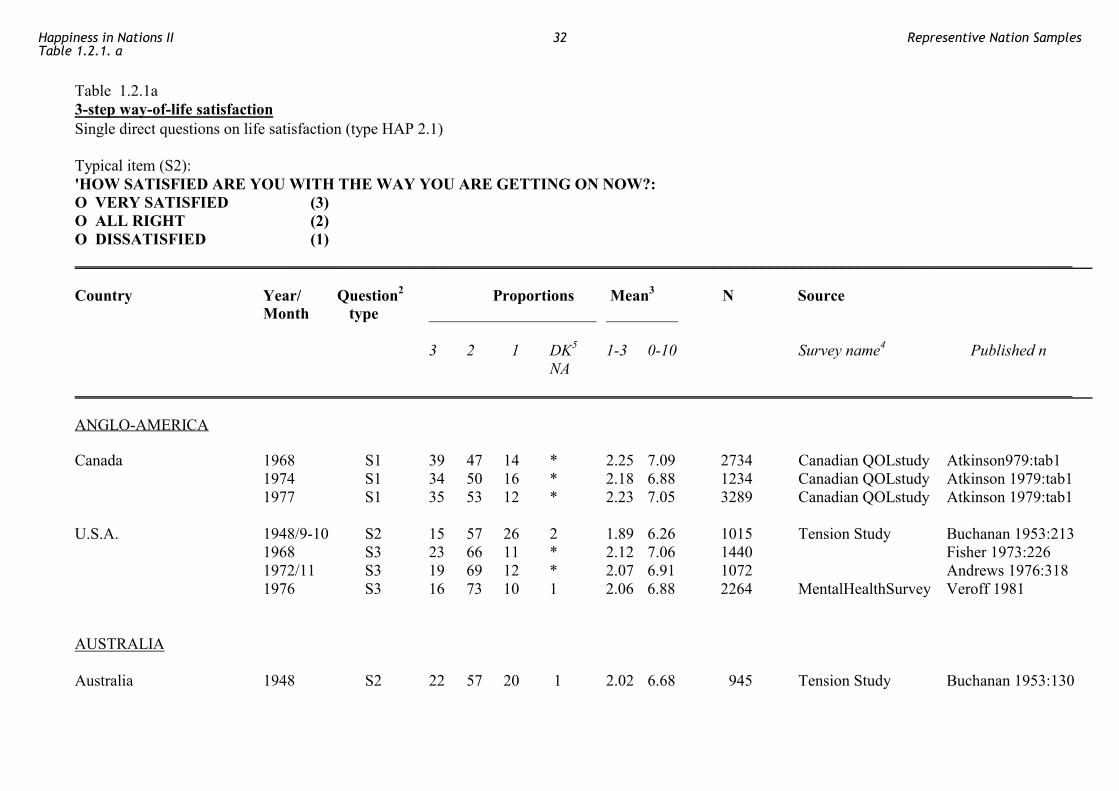
Table 1.2.1a 3-step way-of-life satisfaction Single direct questions on life satisfaction (type HAP 2.1) Typical item (S2): 'HOW SATISFIED ARE YOU WITH THE WAY YOU ARE GETTING ON NOW?: O VERY SATISFIED (3) O ALL RIGHT (2) O DISSATISFIED (1) _____________________________________________________________________________________________________________________________ Country Year/ Question2 Proportions Mean3 N Source Month type _____________________ _________ 3 2 1 DK5 1-3 0-10 Survey name4 Published n NA _____________________________________________________________________________________________________________________________ ANGLO-AMERICA Canada 1968 S1 39 47 14 * 2.25 7.09 2734 Canadian QOLstudy Atkinson979:tab1 1974 S1 34 50 16 * 2.18 6.88 1234 Canadian QOLstudy Atkinson 1979:tab1 1977 S1 35 53 12 * 2.23 7.05 3289 Canadian QOLstudy Atkinson 1979:tab1 U.S.A. 1948/9-10 S2 15 57 26 2 1.89 6.26 1015 Tension Study Buchanan 1953:213 1968 S3 23 66 11 * 2.12 7.06 1440 Fisher 1973:226 1972/11 S3 19 69 12 * 2.07 6.91 1072 Andrews 1976:318 1976 S3 16 73 10 1 2.06 6.88 2264 MentalHealthSurvey Veroff 1981 AUSTRALIA Australia 1948 S2 22 57 20 1 2.02 6.68 945 Tension Study Buchanan 1953:130
Happiness in Nations IITable 1.2.1. a
32 Representive Nation Samples
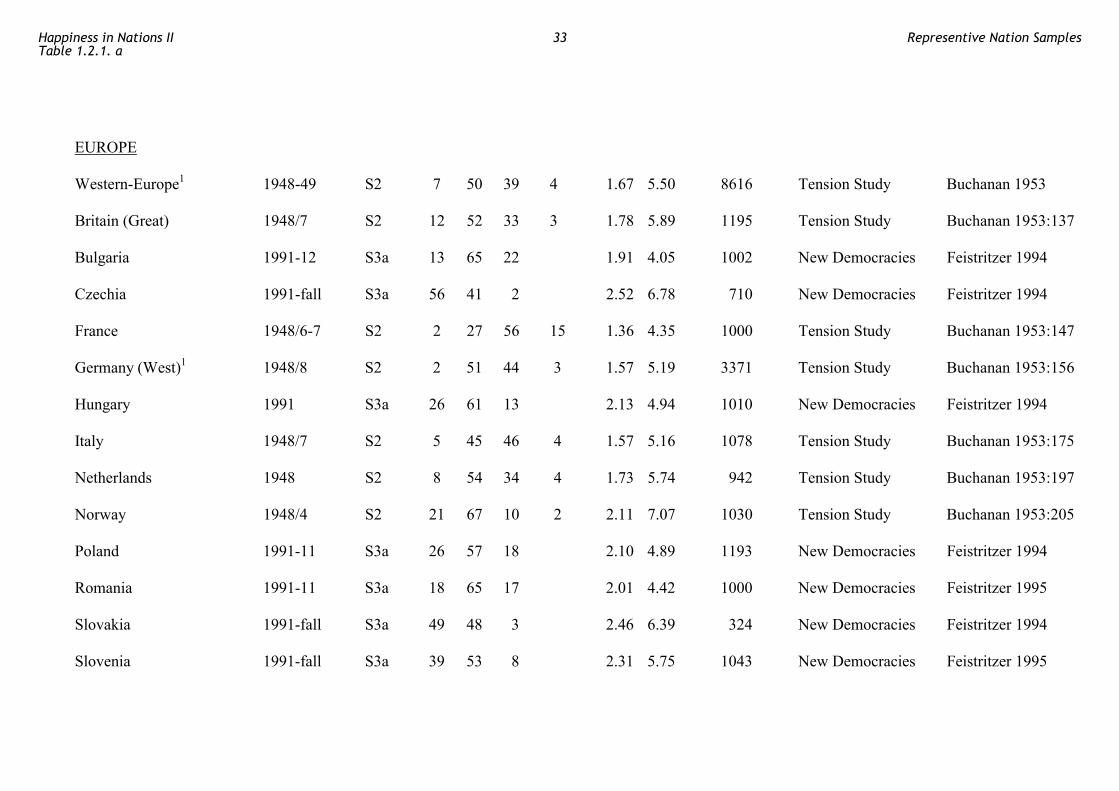
EUROPE Western-Europe1 1948-49 S2 7 50 39 4 1.67 5.50 8616 Tension Study Buchanan 1953 Britain (Great) 1948/7 S2 12 52 33 3 1.78 5.89 1195 Tension Study Buchanan 1953:137 Bulgaria 1991-12 S3a 13 65 22 1.91 4.05 1002 New Democracies Feistritzer 1994 Czechia 1991-fall S3a 56 41 2 2.52 6.78 710 New Democracies Feistritzer 1994 France 1948/6-7 S2 2 27 56 15 1.36 4.35 1000 Tension Study Buchanan 1953:147 Germany (West)1 1948/8 S2 2 51 44 3 1.57 5.19 3371 Tension Study Buchanan 1953:156 Hungary 1991 S3a 26 61 13 2.13 4.94 1010 New Democracies Feistritzer 1994 Italy 1948/7 S2 5 45 46 4 1.57 5.16 1078 Tension Study Buchanan 1953:175 Netherlands 1948 S2 8 54 34 4 1.73 5.74 942 Tension Study Buchanan 1953:197 Norway 1948/4 S2 21 67 10 2 2.11 7.07 1030 Tension Study Buchanan 1953:205 Poland 1991-11 S3a 26 57 18 2.10 4.89 1193 New Democracies Feistritzer 1994 Romania 1991-11 S3a 18 65 17 2.01 4.42 1000 New Democracies Feistritzer 1995 Slovakia 1991-fall S3a 49 48 3 2.46 6.39 324 New Democracies Feistritzer 1994 Slovenia 1991-fall S3a 39 53 8 2.31 5.75 1043 New Democracies Feistritzer 1995
Happiness in Nations IITable 1.2.1. a
33 Representive Nation Samples
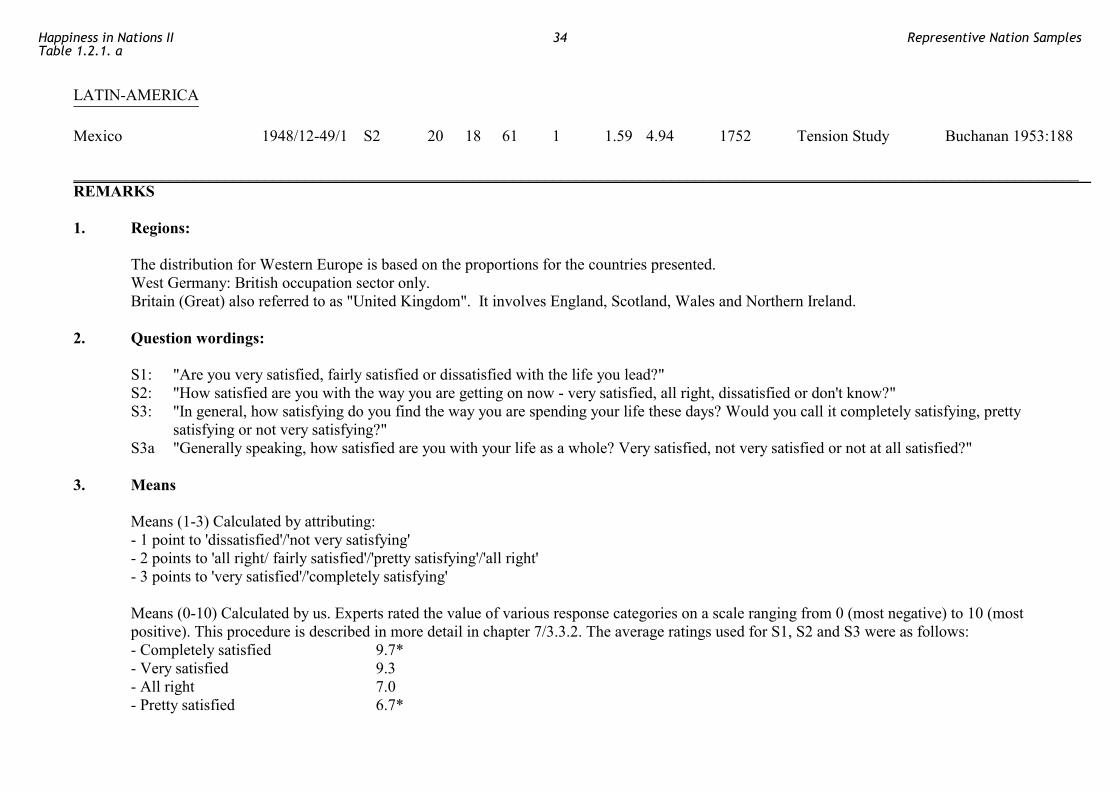
LATIN-AMERICA Mexico 1948/12-49/1 S2 20 18 61 1 1.59 4.94 1752 Tension Study Buchanan 1953:188 ______________________________________________________________________________________________________________________________ REMARKS 1. Regions: The distribution for Western Europe is based on the proportions for the countries presented. West Germany: British occupation sector only. Britain (Great) also referred to as "United Kingdom". It involves England, Scotland, Wales and Northern Ireland. 2. Question wordings: S1: "Are you very satisfied, fairly satisfied or dissatisfied with the life you lead?" S2: "How satisfied are you with the way you are getting on now - very satisfied, all right, dissatisfied or don't know?" S3: "In general, how satisfying do you find the way you are spending your life these days? Would you call it completely satisfying, pretty
satisfying or not very satisfying?" S3a "Generally speaking, how satisfied are you with your life as a whole? Very satisfied, not very satisfied or not at all satisfied?" 3. Means Means (1-3) Calculated by attributing: - 1 point to 'dissatisfied'/'not very satisfying' - 2 points to 'all right/ fairly satisfied'/'pretty satisfying'/'all right' - 3 points to 'very satisfied'/'completely satisfying' Means (0-10) Calculated by us. Experts rated the value of various response categories on a scale ranging from 0 (most negative) to 10 (most
positive). This procedure is described in more detail in chapter 7/3.3.2. The average ratings used for S1, S2 and S3 were as follows: - Completely satisfied 9.7* - Very satisfied 9.3 - All right 7.0 - Pretty satisfied 6.7*
Happiness in Nations IITable 1.2.1. a
34 Representive Nation Samples
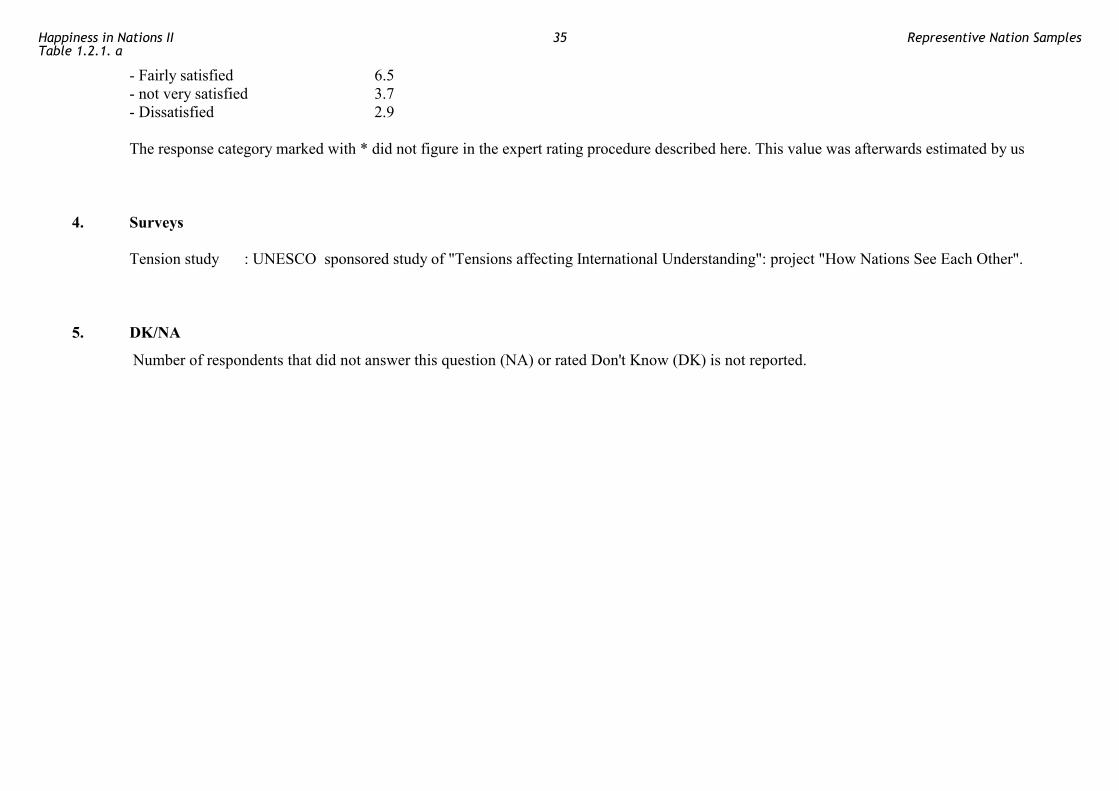
- Fairly satisfied 6.5 - not very satisfied 3.7 - Dissatisfied 2.9 The response category marked with * did not figure in the expert rating procedure described here. This value was afterwards estimated by us 4. Surveys Tension study : UNESCO sponsored study of "Tensions affecting International Understanding": project "How Nations See Each Other". 5. DK/NA Number of respondents that did not answer this question (NA) or rated Don't Know (DK) is not reported.
Happiness in Nations IITable 1.2.1. a
35 Representive Nation Samples
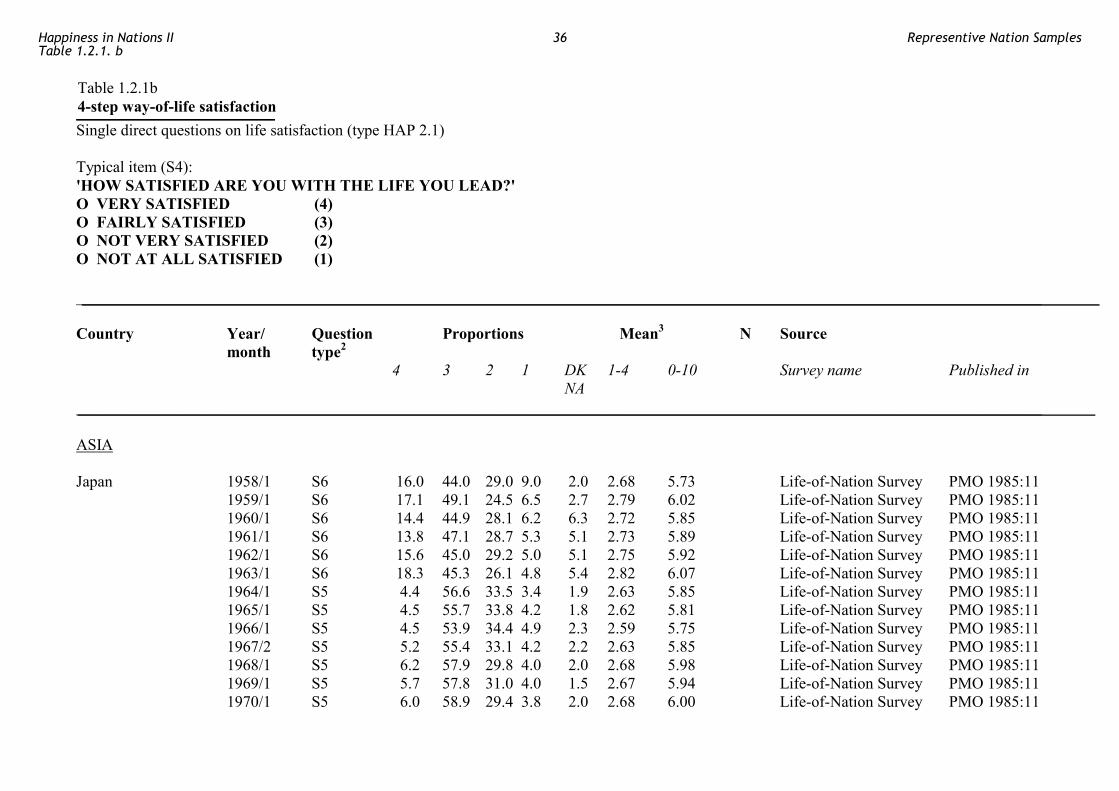
Table 1.2.1b 4-step way-of-life satisfaction Single direct questions on life satisfaction (type HAP 2.1) Typical item (S4): 'HOW SATISFIED ARE YOU WITH THE LIFE YOU LEAD?' O VERY SATISFIED (4) O FAIRLY SATISFIED (3) O NOT VERY SATISFIED (2) O NOT AT ALL SATISFIED (1) _________________________________________________________________________________________________________________________ Country Year/ Question Proportions Mean3 N Source month type2 4 3 2 1 DK 1-4 0-10 Survey name Published in NA _________________________________________________________________________________________________________________________ ASIA Japan 1958/1 S6 16.0 44.0 29.0 9.0 2.0 2.68 5.73 Life-of-Nation Survey PMO 1985:11 1959/1 S6 17.1 49.1 24.5 6.5 2.7 2.79 6.02 Life-of-Nation Survey PMO 1985:11 1960/1 S6 14.4 44.9 28.1 6.2 6.3 2.72 5.85 Life-of-Nation Survey PMO 1985:11 1961/1 S6 13.8 47.1 28.7 5.3 5.1 2.73 5.89 Life-of-Nation Survey PMO 1985:11 1962/1 S6 15.6 45.0 29.2 5.0 5.1 2.75 5.92 Life-of-Nation Survey PMO 1985:11 1963/1 S6 18.3 45.3 26.1 4.8 5.4 2.82 6.07 Life-of-Nation Survey PMO 1985:11 1964/1 S5 4.4 56.6 33.5 3.4 1.9 2.63 5.85 Life-of-Nation Survey PMO 1985:11 1965/1 S5 4.5 55.7 33.8 4.2 1.8 2.62 5.81 Life-of-Nation Survey PMO 1985:11 1966/1 S5 4.5 53.9 34.4 4.9 2.3 2.59 5.75 Life-of-Nation Survey PMO 1985:11 1967/2 S5 5.2 55.4 33.1 4.2 2.2 2.63 5.85 Life-of-Nation Survey PMO 1985:11 1968/1 S5 6.2 57.9 29.8 4.0 2.0 2.68 5.98 Life-of-Nation Survey PMO 1985:11 1969/1 S5 5.7 57.8 31.0 4.0 1.5 2.67 5.94 Life-of-Nation Survey PMO 1985:11 1970/1 S5 6.0 58.9 29.4 3.8 2.0 2.68 6.00 Life-of-Nation Survey PMO 1985:11
Happiness in Nations IITable 1.2.1. b
36 Representive Nation Samples
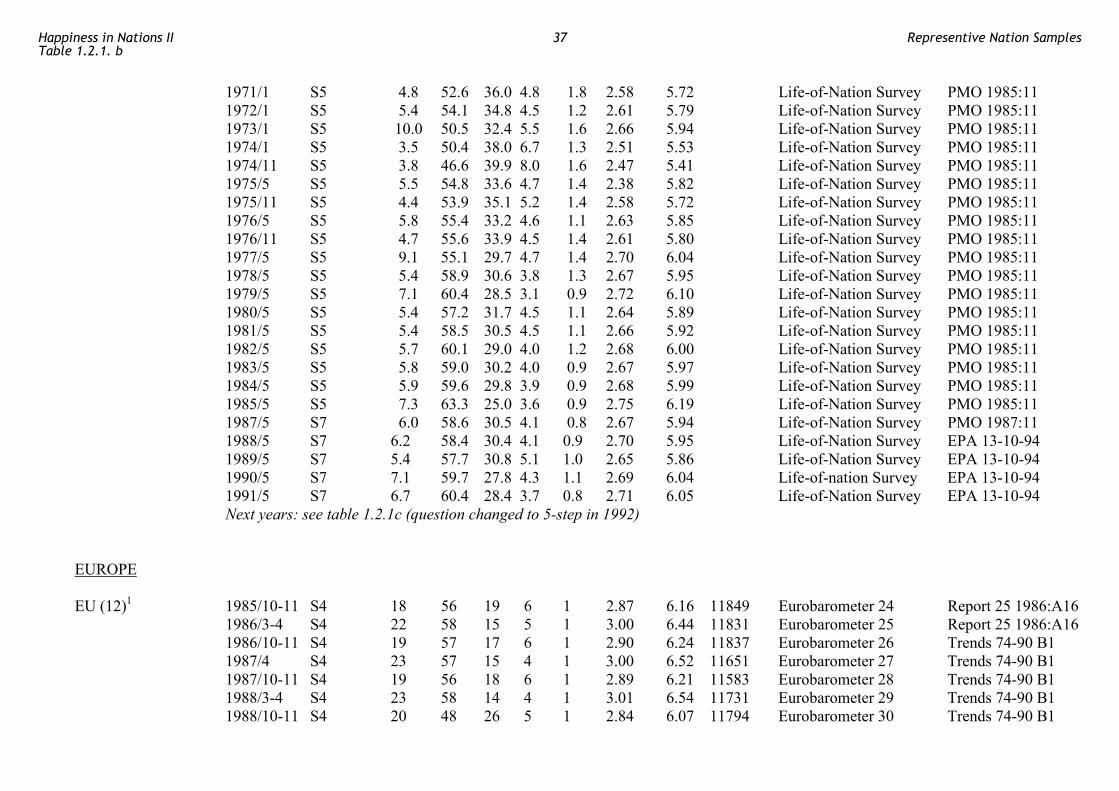
1971/1 S5 4.8 52.6 36.0 4.8 1.8 2.58 5.72 Life-of-Nation Survey PMO 1985:11 1972/1 S5 5.4 54.1 34.8 4.5 1.2 2.61 5.79 Life-of-Nation Survey PMO 1985:11 1973/1 S5 10.0 50.5 32.4 5.5 1.6 2.66 5.94 Life-of-Nation Survey PMO 1985:11 1974/1 S5 3.5 50.4 38.0 6.7 1.3 2.51 5.53 Life-of-Nation Survey PMO 1985:11 1974/11 S5 3.8 46.6 39.9 8.0 1.6 2.47 5.41 Life-of-Nation Survey PMO 1985:11 1975/5 S5 5.5 54.8 33.6 4.7 1.4 2.38 5.82 Life-of-Nation Survey PMO 1985:11 1975/11 S5 4.4 53.9 35.1 5.2 1.4 2.58 5.72 Life-of-Nation Survey PMO 1985:11 1976/5 S5 5.8 55.4 33.2 4.6 1.1 2.63 5.85 Life-of-Nation Survey PMO 1985:11 1976/11 S5 4.7 55.6 33.9 4.5 1.4 2.61 5.80 Life-of-Nation Survey PMO 1985:11 1977/5 S5 9.1 55.1 29.7 4.7 1.4 2.70 6.04 Life-of-Nation Survey PMO 1985:11 1978/5 S5 5.4 58.9 30.6 3.8 1.3 2.67 5.95 Life-of-Nation Survey PMO 1985:11 1979/5 S5 7.1 60.4 28.5 3.1 0.9 2.72 6.10 Life-of-Nation Survey PMO 1985:11 1980/5 S5 5.4 57.2 31.7 4.5 1.1 2.64 5.89 Life-of-Nation Survey PMO 1985:11 1981/5 S5 5.4 58.5 30.5 4.5 1.1 2.66 5.92 Life-of-Nation Survey PMO 1985:11 1982/5 S5 5.7 60.1 29.0 4.0 1.2 2.68 6.00 Life-of-Nation Survey PMO 1985:11 1983/5 S5 5.8 59.0 30.2 4.0 0.9 2.67 5.97 Life-of-Nation Survey PMO 1985:11 1984/5 S5 5.9 59.6 29.8 3.9 0.9 2.68 5.99 Life-of-Nation Survey PMO 1985:11 1985/5 S5 7.3 63.3 25.0 3.6 0.9 2.75 6.19 Life-of-Nation Survey PMO 1985:11 1987/5 S7 6.0 58.6 30.5 4.1 0.8 2.67 5.94 Life-of-Nation Survey PMO 1987:11 1988/5 S7 6.2 58.4 30.4 4.1 0.9 2.70 5.95 Life-of-Nation Survey EPA 13-10-94 1989/5 S7 5.4 57.7 30.8 5.1 1.0 2.65 5.86 Life-of-Nation Survey EPA 13-10-94 1990/5 S7 7.1 59.7 27.8 4.3 1.1 2.69 6.04 Life-of-nation Survey EPA 13-10-94 1991/5 S7 6.7 60.4 28.4 3.7 0.8 2.71 6.05 Life-of-Nation Survey EPA 13-10-94 Next years: see table 1.2.1c (question changed to 5-step in 1992) EUROPE EU (12)1 1985/10-11 S4 18 56 19 6 1 2.87 6.16 11849 Eurobarometer 24 Report 25 1986:A16 1986/3-4 S4 22 58 15 5 1 3.00 6.44 11831 Eurobarometer 25 Report 25 1986:A16 1986/10-11 S4 19 57 17 6 1 2.90 6.24 11837 Eurobarometer 26 Trends 74-90 B1 1987/4 S4 23 57 15 4 1 3.00 6.52 11651 Eurobarometer 27 Trends 74-90 B1 1987/10-11 S4 19 56 18 6 1 2.89 6.21 11583 Eurobarometer 28 Trends 74-90 B1 1988/3-4 S4 23 58 14 4 1 3.01 6.54 11731 Eurobarometer 29 Trends 74-90 B1 1988/10-11 S4 20 48 26 5 1 2.84 6.07 11794 Eurobarometer 30 Trends 74-90 B1
Happiness in Nations IITable 1.2.1. b
37 Representive Nation Samples
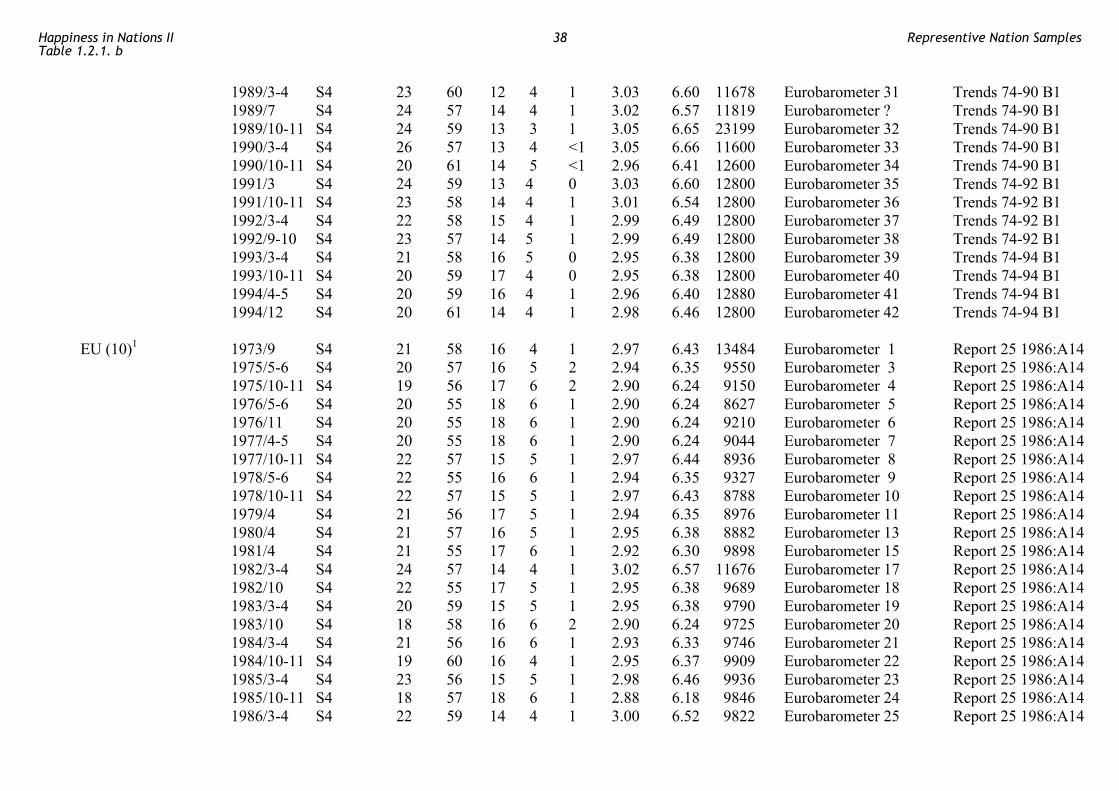
1989/3-4 S4 23 60 12 4 1 3.03 6.60 11678 Eurobarometer 31 Trends 74-90 B1 1989/7 S4 24 57 14 4 1 3.02 6.57 11819 Eurobarometer ? Trends 74-90 B1 1989/10-11 S4 24 59 13 3 1 3.05 6.65 23199 Eurobarometer 32 Trends 74-90 B1 1990/3-4 S4 26 57 13 4 <1 3.05 6.66 11600 Eurobarometer 33 Trends 74-90 B1 1990/10-11 S4 20 61 14 5 <1 2.96 6.41 12600 Eurobarometer 34 Trends 74-90 B1 1991/3 S4 24 59 13 4 0 3.03 6.60 12800 Eurobarometer 35 Trends 74-92 B1 1991/10-11 S4 23 58 14 4 1 3.01 6.54 12800 Eurobarometer 36 Trends 74-92 B1 1992/3-4 S4 22 58 15 4 1 2.99 6.49 12800 Eurobarometer 37 Trends 74-92 B1 1992/9-10 S4 23 57 14 5 1 2.99 6.49 12800 Eurobarometer 38 Trends 74-92 B1 1993/3-4 S4 21 58 16 5 0 2.95 6.38 12800 Eurobarometer 39 Trends 74-94 B1 1993/10-11 S4 20 59 17 4 0 2.95 6.38 12800 Eurobarometer 40 Trends 74-94 B1 1994/4-5 S4 20 59 16 4 1 2.96 6.40 12880 Eurobarometer 41 Trends 74-94 B1 1994/12 S4 20 61 14 4 1 2.98 6.46 12800 Eurobarometer 42 Trends 74-94 B1 EU (10)1 1973/9 S4 21 58 16 4 1 2.97 6.43 13484 Eurobarometer 1 Report 25 1986:A14 1975/5-6 S4 20 57 16 5 2 2.94 6.35 9550 Eurobarometer 3 Report 25 1986:A14 1975/10-11 S4 19 56 17 6 2 2.90 6.24 9150 Eurobarometer 4 Report 25 1986:A14 1976/5-6 S4 20 55 18 6 1 2.90 6.24 8627 Eurobarometer 5 Report 25 1986:A14 1976/11 S4 20 55 18 6 1 2.90 6.24 9210 Eurobarometer 6 Report 25 1986:A14 1977/4-5 S4 20 55 18 6 1 2.90 6.24 9044 Eurobarometer 7 Report 25 1986:A14 1977/10-11 S4 22 57 15 5 1 2.97 6.44 8936 Eurobarometer 8 Report 25 1986:A14 1978/5-6 S4 22 55 16 6 1 2.94 6.35 9327 Eurobarometer 9 Report 25 1986:A14 1978/10-11 S4 22 57 15 5 1 2.97 6.43 8788 Eurobarometer 10 Report 25 1986:A14 1979/4 S4 21 56 17 5 1 2.94 6.35 8976 Eurobarometer 11 Report 25 1986:A14 1980/4 S4 21 57 16 5 1 2.95 6.38 8882 Eurobarometer 13 Report 25 1986:A14 1981/4 S4 21 55 17 6 1 2.92 6.30 9898 Eurobarometer 15 Report 25 1986:A14 1982/3-4 S4 24 57 14 4 1 3.02 6.57 11676 Eurobarometer 17 Report 25 1986:A14 1982/10 S4 22 55 17 5 1 2.95 6.38 9689 Eurobarometer 18 Report 25 1986:A14 1983/3-4 S4 20 59 15 5 1 2.95 6.38 9790 Eurobarometer 19 Report 25 1986:A14 1983/10 S4 18 58 16 6 2 2.90 6.24 9725 Eurobarometer 20 Report 25 1986:A14 1984/3-4 S4 21 56 16 6 1 2.93 6.33 9746 Eurobarometer 21 Report 25 1986:A14 1984/10-11 S4 19 60 16 4 1 2.95 6.37 9909 Eurobarometer 22 Report 25 1986:A14 1985/3-4 S4 23 56 15 5 1 2.98 6.46 9936 Eurobarometer 23 Report 25 1986:A14 1985/10-11 S4 18 57 18 6 1 2.88 6.18 9846 Eurobarometer 24 Report 25 1986:A14 1986/3-4 S4 22 59 14 4 1 3.00 6.52 9822 Eurobarometer 25 Report 25 1986:A14
Happiness in Nations IITable 1.2.1. b
38 Representive Nation Samples
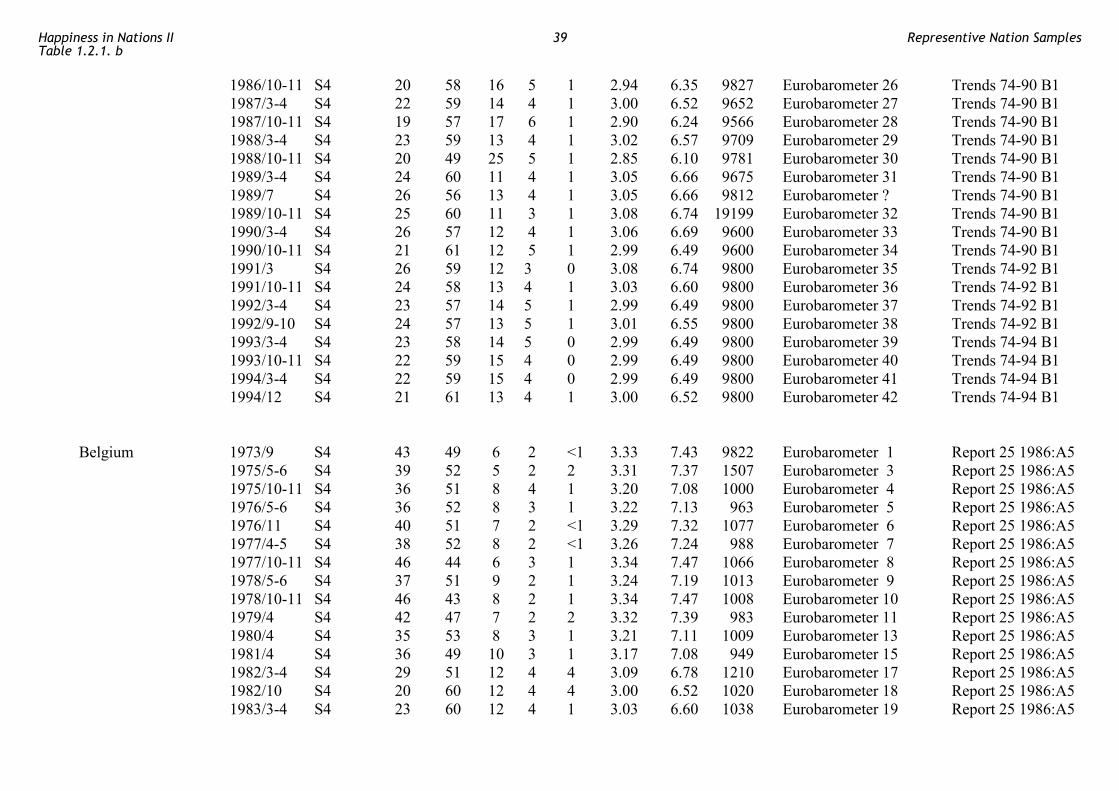
1986/10-11 S4 20 58 16 5 1 2.94 6.35 9827 Eurobarometer 26 Trends 74-90 B1 1987/3-4 S4 22 59 14 4 1 3.00 6.52 9652 Eurobarometer 27 Trends 74-90 B1 1987/10-11 S4 19 57 17 6 1 2.90 6.24 9566 Eurobarometer 28 Trends 74-90 B1 1988/3-4 S4 23 59 13 4 1 3.02 6.57 9709 Eurobarometer 29 Trends 74-90 B1 1988/10-11 S4 20 49 25 5 1 2.85 6.10 9781 Eurobarometer 30 Trends 74-90 B1 1989/3-4 S4 24 60 11 4 1 3.05 6.66 9675 Eurobarometer 31 Trends 74-90 B1 1989/7 S4 26 56 13 4 1 3.05 6.66 9812 Eurobarometer ? Trends 74-90 B1 1989/10-11 S4 25 60 11 3 1 3.08 6.74 19199 Eurobarometer 32 Trends 74-90 B1 1990/3-4 S4 26 57 12 4 1 3.06 6.69 9600 Eurobarometer 33 Trends 74-90 B1 1990/10-11 S4 21 61 12 5 1 2.99 6.49 9600 Eurobarometer 34 Trends 74-90 B1 1991/3 S4 26 59 12 3 0 3.08 6.74 9800 Eurobarometer 35 Trends 74-92 B1 1991/10-11 S4 24 58 13 4 1 3.03 6.60 9800 Eurobarometer 36 Trends 74-92 B1 1992/3-4 S4 23 57 14 5 1 2.99 6.49 9800 Eurobarometer 37 Trends 74-92 B1 1992/9-10 S4 24 57 13 5 1 3.01 6.55 9800 Eurobarometer 38 Trends 74-92 B1 1993/3-4 S4 23 58 14 5 0 2.99 6.49 9800 Eurobarometer 39 Trends 74-94 B1 1993/10-11 S4 22 59 15 4 0 2.99 6.49 9800 Eurobarometer 40 Trends 74-94 B1 1994/3-4 S4 22 59 15 4 0 2.99 6.49 9800 Eurobarometer 41 Trends 74-94 B1 1994/12 S4 21 61 13 4 1 3.00 6.52 9800 Eurobarometer 42 Trends 74-94 B1 Belgium 1973/9 S4 43 49 6 2 <1 3.33 7.43 9822 Eurobarometer 1 Report 25 1986:A5 1975/5-6 S4 39 52 5 2 2 3.31 7.37 1507 Eurobarometer 3 Report 25 1986:A5 1975/10-11 S4 36 51 8 4 1 3.20 7.08 1000 Eurobarometer 4 Report 25 1986:A5 1976/5-6 S4 36 52 8 3 1 3.22 7.13 963 Eurobarometer 5 Report 25 1986:A5 1976/11 S4 40 51 7 2 <1 3.29 7.32 1077 Eurobarometer 6 Report 25 1986:A5 1977/4-5 S4 38 52 8 2 <1 3.26 7.24 988 Eurobarometer 7 Report 25 1986:A5 1977/10-11 S4 46 44 6 3 1 3.34 7.47 1066 Eurobarometer 8 Report 25 1986:A5 1978/5-6 S4 37 51 9 2 1 3.24 7.19 1013 Eurobarometer 9 Report 25 1986:A5 1978/10-11 S4 46 43 8 2 1 3.34 7.47 1008 Eurobarometer 10 Report 25 1986:A5 1979/4 S4 42 47 7 2 2 3.32 7.39 983 Eurobarometer 11 Report 25 1986:A5 1980/4 S4 35 53 8 3 1 3.21 7.11 1009 Eurobarometer 13 Report 25 1986:A5 1981/4 S4 36 49 10 3 1 3.17 7.08 949 Eurobarometer 15 Report 25 1986:A5 1982/3-4 S4 29 51 12 4 4 3.09 6.78 1210 Eurobarometer 17 Report 25 1986:A5 1982/10 S4 20 60 12 4 4 3.00 6.52 1020 Eurobarometer 18 Report 25 1986:A5 1983/3-4 S4 23 60 12 4 1 3.03 6.60 1038 Eurobarometer 19 Report 25 1986:A5
Happiness in Nations IITable 1.2.1. b
39 Representive Nation Samples

5
1983/10 S4 18 60 15 4 3 2.95 6.37 995 Eurobarometer 20 Report 25 1986:A5 1984/3-4 S4 30 46 15 8 1 2.99 6.50 1018 Eurobarometer 21 Report 25 1986:A5 1984/10-11 S4 16 63 15 5 1 2.91 6.27 1035 Eurobarometer 22 Report 25 1986:A5 1985/3-4 S4 26 58 13 2 1 3.09 6.76 1016 Eurobarometer 23 Report 25 1986:A5 1985/10-11 S4 18 62 15 4 1 2.95 6.37 1011 Eurobarometer 24 Report 25 1986:A5 1986/3-4 S4 22 57 15 5 1 2.97 6.44 1007 Eurobarometer 25 Report 25 1986:A5 1986/10-11 S4 13 61 19 5 2 2.84 6.06 999 Eurobarometer 26 Trends 74-90 B1 1987/3-4 S4 30 54 10 4 2 3.12 6.86 1018 Eurobarometer 27 Trends 74-90 B1 1987/10-11 S4 23 56 16 4 1 2.99 6.49 1005 Eurobarometer 28 Trends 74-90 B1 1988/3-4 S4 29 55 11 4 1 3.10 6.80 1022 Eurobarometer 29 Trends 74-90 B1 1988/10-11 S4 16 57 23 3 1 2.87 6.14 1024 Eurobarometer 30 Trends 74-90 B1 1989/3-4 S4 30 55 9 4 2 3.13 6.89 1002 Eurobarometer 31 Trends 74-90 B1 1989/7 S4 26 55 12 4 3 3.06 6.69 1028 Eurobarometer ? Trends 74-90 B1 1989/10-11 S4 28 61 9 2 <1 3.15 6.93 2000 Eurobarometer 32 Trends 74-90 B1 1990/3-4 S4 35 55 7 3 <1 3.22 7.13 1000 Eurobarometer 33 Trends 74-90 B1 1990/10-11 S4 23 63 11 3 <1 3.06 6.68 1000 Eurobarometer 34 Trends 74-90 B1 1991/3 S4 39 52 7 2 0 3.28 7.29 1000 Eurobarometer 35 Trends 74-92 B1 1991/10-11 S4 32 56 10 2 0 3.18 7.01 1000 Eurobarometer 36 Trends 74-92 B1 1992/3-4 S4 29 60 8 2 1 3.17 6.99 1000 Eurobarometer 37 Trends 74-92 B1 1992/9-10 S4 30 59 7 3 1 3.17 6.99 1000 Eurobarometer 38 Trends 74-92 B1 1993/3-4 S4 26 63 8 3 0 3.12 6.85 1000 Eurobarometer 39 Trends 74-94 B1 1993/10-11 S4 26 58 11 4 1 3.07 6.71 1000 Eurobarometer 40 Trends 74-94 B1 1994/3-4 S4 33 55 8 3 1 3.19 7.05 1000 Eurobarometer 41 Trends 74-94 B1 1994/12 S4 21 63 11 3 2 3.04 6.63 1000 Eurobarometer 42 Trends 74-94 B1 Britain (Great) 1973/9 S4 33 52 11 3 1 3.16 6.96 1933 Eurobarometer 1 Report 25 1986:A1 1975/5-6 S4 33 53 9 3 2 3.18 7.03 1328 Eurobarometer 3 Report 25 1986:A13 1975/10-11 S4 29 53 12 5 1 3.07 6.72 1438 Eurobarometer 4 Report 25 1986:A13 1976/5-6 S4 28 54 12 5 1 3.06 6.69 1340 Eurobarometer 5 Report 25 1986:A13 1976/11 S4 28 56 12 4 <1 3.08 6.74 1351 Eurobarometer 6 Report 25 1986:A13 1977/4-5 S4 29 53 12 5 1 3.07 6.72 1414 Eurobarometer 7 Report 25 1986:A13 1977/10-11 S4 30 57 10 3 <1 3.14 6.90 1351 Eurobarometer 8 Report 25 1986:A13 1978/4-5 S4 34 52 11 3 <1 3.17 6.99 1426 Eurobarometer 9 Report 25 1986:A13 1978/10-11 S4 32 55 8 4 1 3.16 6.97 1339 Eurobarometer 10 Report 25 1986:A13
Happiness in Nations IITable 1.2.1. b
40 Representive Nation Samples
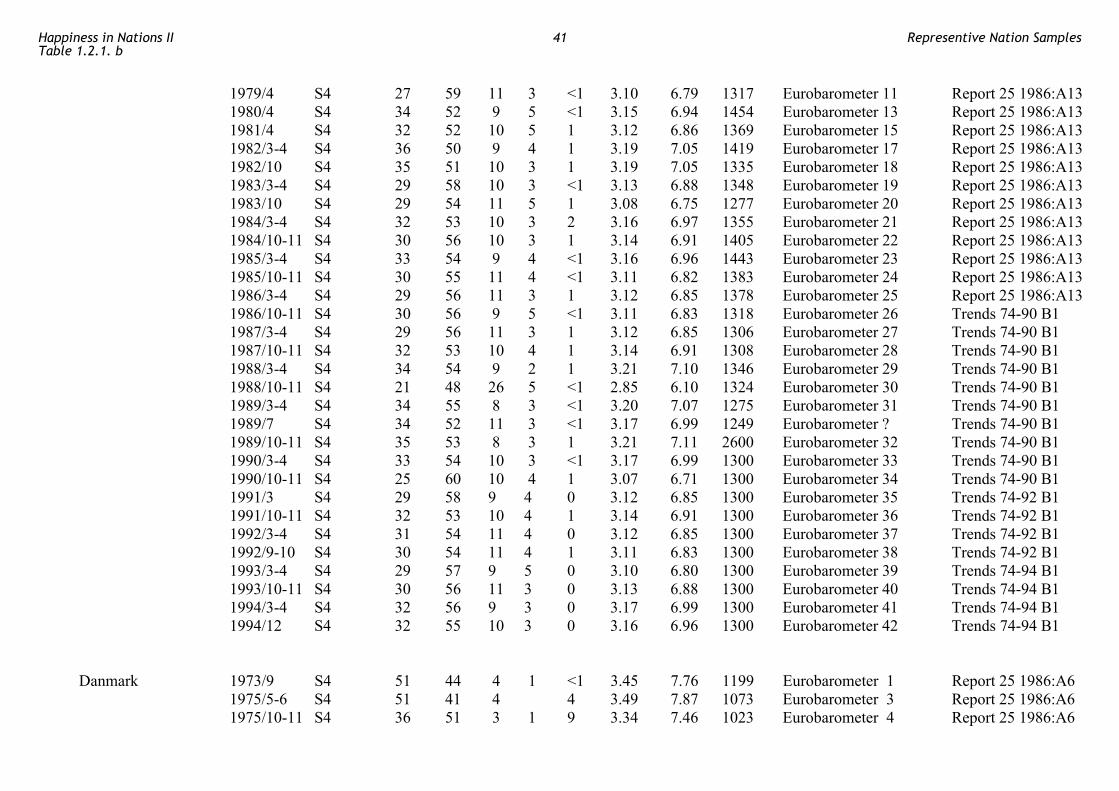
1979/4 S4 27 59 11 3 <1 3.10 6.79 1317 Eurobarometer 11 Report 25 1986:A13 1980/4 S4 34 52 9 5 <1 3.15 6.94 1454 Eurobarometer 13 Report 25 1986:A13 1981/4 S4 32 52 10 5 1 3.12 6.86 1369 Eurobarometer 15 Report 25 1986:A13 1982/3-4 S4 36 50 9 4 1 3.19 7.05 1419 Eurobarometer 17 Report 25 1986:A13 1982/10 S4 35 51 10 3 1 3.19 7.05 1335 Eurobarometer 18 Report 25 1986:A13 1983/3-4 S4 29 58 10 3 <1 3.13 6.88 1348 Eurobarometer 19 Report 25 1986:A13 1983/10 S4 29 54 11 5 1 3.08 6.75 1277 Eurobarometer 20 Report 25 1986:A13 1984/3-4 S4 32 53 10 3 2 3.16 6.97 1355 Eurobarometer 21 Report 25 1986:A13 1984/10-11 S4 30 56 10 3 1 3.14 6.91 1405 Eurobarometer 22 Report 25 1986:A13 1985/3-4 S4 33 54 9 4 <1 3.16 6.96 1443 Eurobarometer 23 Report 25 1986:A13 1985/10-11 S4 30 55 11 4 <1 3.11 6.82 1383 Eurobarometer 24 Report 25 1986:A13 1986/3-4 S4 29 56 11 3 1 3.12 6.85 1378 Eurobarometer 25 Report 25 1986:A13 1986/10-11 S4 30 56 9 5 <1 3.11 6.83 1318 Eurobarometer 26 Trends 74-90 B1 1987/3-4 S4 29 56 11 3 1 3.12 6.85 1306 Eurobarometer 27 Trends 74-90 B1 1987/10-11 S4 32 53 10 4 1 3.14 6.91 1308 Eurobarometer 28 Trends 74-90 B1 1988/3-4 S4 34 54 9 2 1 3.21 7.10 1346 Eurobarometer 29 Trends 74-90 B1 1988/10-11 S4 21 48 26 5 <1 2.85 6.10 1324 Eurobarometer 30 Trends 74-90 B1 1989/3-4 S4 34 55 8 3 <1 3.20 7.07 1275 Eurobarometer 31 Trends 74-90 B1 1989/7 S4 34 52 11 3 <1 3.17 6.99 1249 Eurobarometer ? Trends 74-90 B1 1989/10-11 S4 35 53 8 3 1 3.21 7.11 2600 Eurobarometer 32 Trends 74-90 B1 1990/3-4 S4 33 54 10 3 <1 3.17 6.99 1300 Eurobarometer 33 Trends 74-90 B1 1990/10-11 S4 25 60 10 4 1 3.07 6.71 1300 Eurobarometer 34 Trends 74-90 B1 1991/3 S4 29 58 9 4 0 3.12 6.85 1300 Eurobarometer 35 Trends 74-92 B1 1991/10-11 S4 32 53 10 4 1 3.14 6.91 1300 Eurobarometer 36 Trends 74-92 B1 1992/3-4 S4 31 54 11 4 0 3.12 6.85 1300 Eurobarometer 37 Trends 74-92 B1 1992/9-10 S4 30 54 11 4 1 3.11 6.83 1300 Eurobarometer 38 Trends 74-92 B1 1993/3-4 S4 29 57 9 5 0 3.10 6.80 1300 Eurobarometer 39 Trends 74-94 B1 1993/10-11 S4 30 56 11 3 0 3.13 6.88 1300 Eurobarometer 40 Trends 74-94 B1 1994/3-4 S4 32 56 9 3 0 3.17 6.99 1300 Eurobarometer 41 Trends 74-94 B1 1994/12 S4 32 55 10 3 0 3.16 6.96 1300 Eurobarometer 42 Trends 74-94 B1 Danmark 1973/9 S4 51 44 4 1 <1 3.45 7.76 1199 Eurobarometer 1 Report 25 1986:A6 1975/5-6 S4 51 41 4 4 3.49 7.87 1073 Eurobarometer 3 Report 25 1986:A6 1975/10-11 S4 36 51 3 1 9 3.34 7.46 1023 Eurobarometer 4 Report 25 1986:A6
Happiness in Nations IITable 1.2.1. b
41 Representive Nation Samples
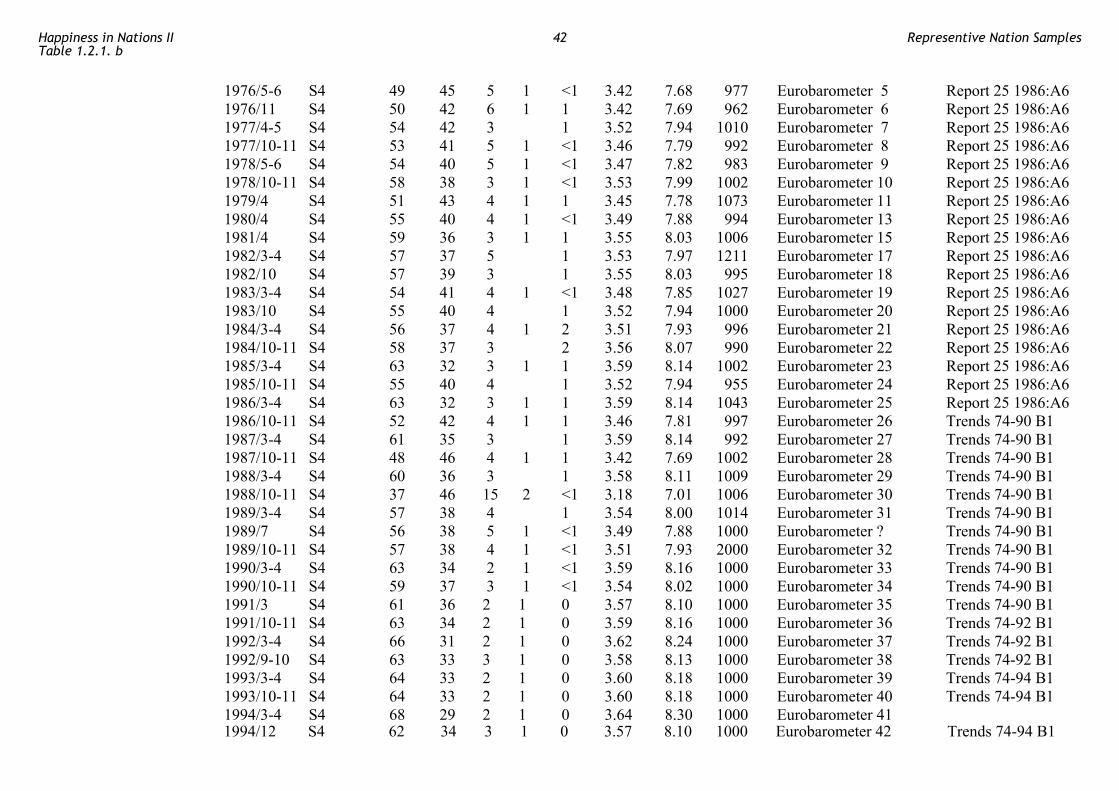
1976/5-6 S4 49 45 5 1 <1 3.42 7.68 977 Eurobarometer 5 Report 25 1986:A6 1976/11 S4 50 42 6 1 1 3.42 7.69 962 Eurobarometer 6 Report 25 1986:A6 1977/4-5 S4 54 42 3 1 3.52 7.94 1010 Eurobarometer 7 Report 25 1986:A6 1977/10-11 S4 53 41 5 1 <1 3.46 7.79 992 Eurobarometer 8 Report 25 1986:A6 1978/5-6 S4 54 40 5 1 <1 3.47 7.82 983 Eurobarometer 9 Report 25 1986:A6 1978/10-11 S4 58 38 3 1 <1 3.53 7.99 1002 Eurobarometer 10 Report 25 1986:A6 1979/4 S4 51 43 4 1 1 3.45 7.78 1073 Eurobarometer 11 Report 25 1986:A6 1980/4 S4 55 40 4 1 <1 3.49 7.88 994 Eurobarometer 13 Report 25 1986:A6 1981/4 S4 59 36 3 1 1 3.55 8.03 1006 Eurobarometer 15 Report 25 1986:A6 1982/3-4 S4 57 37 5 1 3.53 7.97 1211 Eurobarometer 17 Report 25 1986:A6 1982/10 S4 57 39 3 1 3.55 8.03 995 Eurobarometer 18 Report 25 1986:A6 1983/3-4 S4 54 41 4 1 <1 3.48 7.85 1027 Eurobarometer 19 Report 25 1986:A6 1983/10 S4 55 40 4 1 3.52 7.94 1000 Eurobarometer 20 Report 25 1986:A6 1984/3-4 S4 56 37 4 1 2 3.51 7.93 996 Eurobarometer 21 Report 25 1986:A6 1984/10-11 S4 58 37 3 2 3.56 8.07 990 Eurobarometer 22 Report 25 1986:A6 1985/3-4 S4 63 32 3 1 1 3.59 8.14 1002 Eurobarometer 23 Report 25 1986:A6 1985/10-11 S4 55 40 4 1 3.52 7.94 955 Eurobarometer 24 Report 25 1986:A6 1986/3-4 S4 63 32 3 1 1 3.59 8.14 1043 Eurobarometer 25 Report 25 1986:A6 1986/10-11 S4 52 42 4 1 1 3.46 7.81 997 Eurobarometer 26 Trends 74-90 B1 1987/3-4 S4 61 35 3 1 3.59 8.14 992 Eurobarometer 27 Trends 74-90 B1 1987/10-11 S4 48 46 4 1 1 3.42 7.69 1002 Eurobarometer 28 Trends 74-90 B1 1988/3-4 S4 60 36 3 1 3.58 8.11 1009 Eurobarometer 29 Trends 74-90 B1 1988/10-11 S4 37 46 15 2 <1 3.18 7.01 1006 Eurobarometer 30 Trends 74-90 B1 1989/3-4 S4 57 38 4 1 3.54 8.00 1014 Eurobarometer 31 Trends 74-90 B1 1989/7 S4 56 38 5 1 <1 3.49 7.88 1000 Eurobarometer ? Trends 74-90 B1 1989/10-11 S4 57 38 4 1 <1 3.51 7.93 2000 Eurobarometer 32 Trends 74-90 B1 1990/3-4 S4 63 34 2 1 <1 3.59 8.16 1000 Eurobarometer 33 Trends 74-90 B1 1990/10-11 S4 59 37 3 1 <1 3.54 8.02 1000 Eurobarometer 34 Trends 74-90 B1 1991/3 S4 61 36 2 1 0 3.57 8.10 1000 Eurobarometer 35 Trends 74-90 B1 1991/10-11 S4 63 34 2 1 0 3.59 8.16 1000 Eurobarometer 36 Trends 74-92 B1 1992/3-4 S4 66 31 2 1 0 3.62 8.24 1000 Eurobarometer 37 Trends 74-92 B1 1992/9-10 S4 63 33 3 1 0 3.58 8.13 1000 Eurobarometer 38 Trends 74-92 B1 1993/3-4 S4 64 33 2 1 0 3.60 8.18 1000 Eurobarometer 39 Trends 74-94 B1 1993/10-11 S4 64 33 2 1 0 3.60 8.18 1000 Eurobarometer 40 Trends 74-94 B1 1994/3-4 S4 68 29 2 1 0 3.64 8.30 1000 Eurobarometer 41
1994/12 S4 62 34 3 1 0 3.57 8.10 1000 Eurobarometer 42 Trends 74-94 B1
Happiness in Nations IITable 1.2.1. b
42 Representive Nation Samples
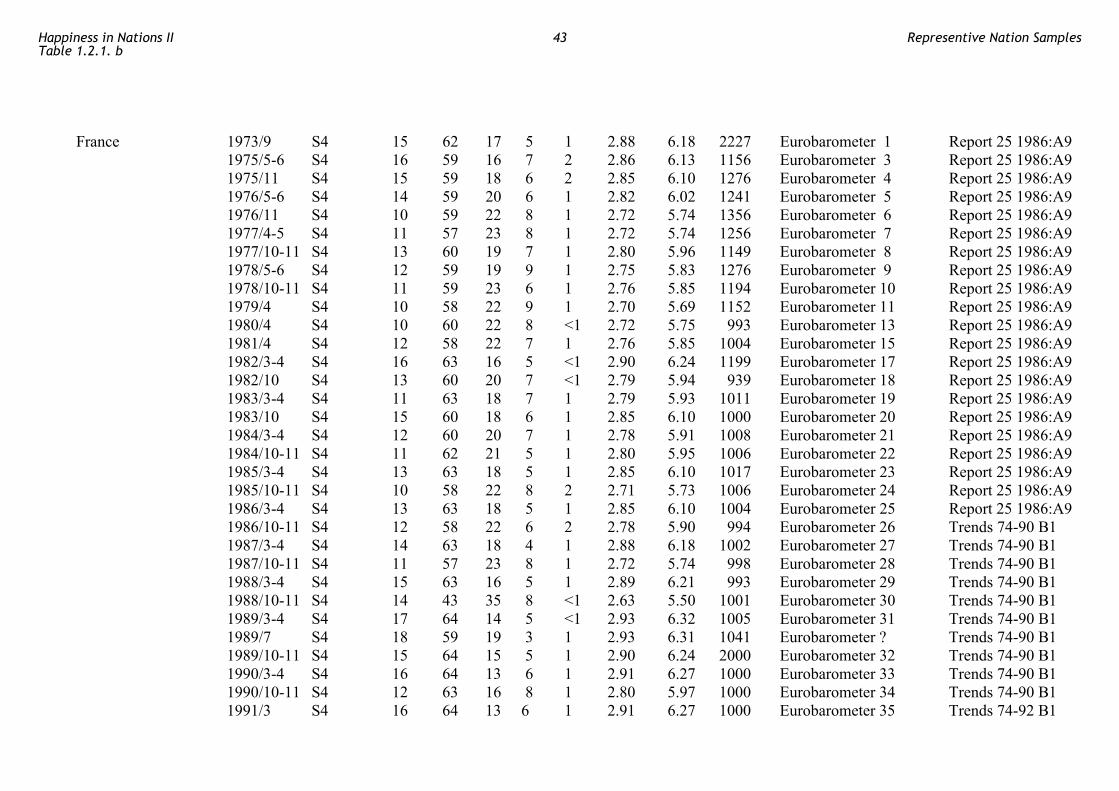
France 1973/9 S4 15 62 17 5 1 2.88 6.18 2227 Eurobarometer 1 Report 25 1986:A9 1975/5-6 S4 16 59 16 7 2 2.86 6.13 1156 Eurobarometer 3 Report 25 1986:A9 1975/11 S4 15 59 18 6 2 2.85 6.10 1276 Eurobarometer 4 Report 25 1986:A9 1976/5-6 S4 14 59 20 6 1 2.82 6.02 1241 Eurobarometer 5 Report 25 1986:A9 1976/11 S4 10 59 22 8 1 2.72 5.74 1356 Eurobarometer 6 Report 25 1986:A9 1977/4-5 S4 11 57 23 8 1 2.72 5.74 1256 Eurobarometer 7 Report 25 1986:A9 1977/10-11 S4 13 60 19 7 1 2.80 5.96 1149 Eurobarometer 8 Report 25 1986:A9 1978/5-6 S4 12 59 19 9 1 2.75 5.83 1276 Eurobarometer 9 Report 25 1986:A9 1978/10-11 S4 11 59 23 6 1 2.76 5.85 1194 Eurobarometer 10 Report 25 1986:A9 1979/4 S4 10 58 22 9 1 2.70 5.69 1152 Eurobarometer 11 Report 25 1986:A9 1980/4 S4 10 60 22 8 <1 2.72 5.75 993 Eurobarometer 13 Report 25 1986:A9 1981/4 S4 12 58 22 7 1 2.76 5.85 1004 Eurobarometer 15 Report 25 1986:A9 1982/3-4 S4 16 63 16 5 <1 2.90 6.24 1199 Eurobarometer 17 Report 25 1986:A9 1982/10 S4 13 60 20 7 <1 2.79 5.94 939 Eurobarometer 18 Report 25 1986:A9 1983/3-4 S4 11 63 18 7 1 2.79 5.93 1011 Eurobarometer 19 Report 25 1986:A9 1983/10 S4 15 60 18 6 1 2.85 6.10 1000 Eurobarometer 20 Report 25 1986:A9 1984/3-4 S4 12 60 20 7 1 2.78 5.91 1008 Eurobarometer 21 Report 25 1986:A9 1984/10-11 S4 11 62 21 5 1 2.80 5.95 1006 Eurobarometer 22 Report 25 1986:A9 1985/3-4 S4 13 63 18 5 1 2.85 6.10 1017 Eurobarometer 23 Report 25 1986:A9 1985/10-11 S4 10 58 22 8 2 2.71 5.73 1006 Eurobarometer 24 Report 25 1986:A9 1986/3-4 S4 13 63 18 5 1 2.85 6.10 1004 Eurobarometer 25 Report 25 1986:A9 1986/10-11 S4 12 58 22 6 2 2.78 5.90 994 Eurobarometer 26 Trends 74-90 B1 1987/3-4 S4 14 63 18 4 1 2.88 6.18 1002 Eurobarometer 27 Trends 74-90 B1 1987/10-11 S4 11 57 23 8 1 2.72 5.74 998 Eurobarometer 28 Trends 74-90 B1 1988/3-4 S4 15 63 16 5 1 2.89 6.21 993 Eurobarometer 29 Trends 74-90 B1 1988/10-11 S4 14 43 35 8 <1 2.63 5.50 1001 Eurobarometer 30 Trends 74-90 B1 1989/3-4 S4 17 64 14 5 <1 2.93 6.32 1005 Eurobarometer 31 Trends 74-90 B1 1989/7 S4 18 59 19 3 1 2.93 6.31 1041 Eurobarometer ? Trends 74-90 B1 1989/10-11 S4 15 64 15 5 1 2.90 6.24 2000 Eurobarometer 32 Trends 74-90 B1 1990/3-4 S4 16 64 13 6 1 2.91 6.27 1000 Eurobarometer 33 Trends 74-90 B1 1990/10-11 S4 12 63 16 8 1 2.80 5.97 1000 Eurobarometer 34 Trends 74-90 B1 1991/3 S4 16 64 13 6 1 2.91 6.27 1000 Eurobarometer 35 Trends 74-92 B1
Happiness in Nations IITable 1.2.1. b
43 Representive Nation Samples
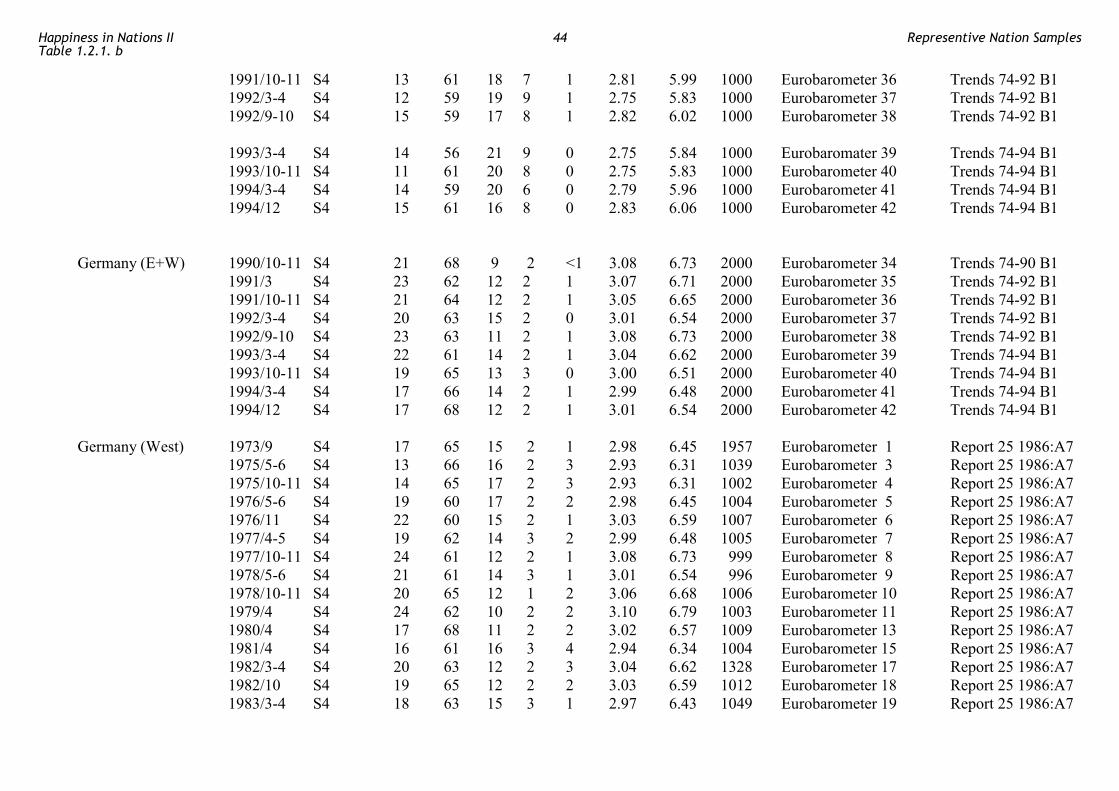
1991/10-11 S4 13 61 18 7 1 2.81 5.99 1000 Eurobarometer 36 Trends 74-92 B1 1992/3-4 S4 12 59 19 9 1 2.75 5.83 1000 Eurobarometer 37 Trends 74-92 B1 1992/9-10 S4 15 59 17 8 1 2.82 6.02 1000 Eurobarometer 38 Trends 74-92 B1 1993/3-4 S4 14 56 21 9 0 2.75 5.84 1000 Eurobaromater 39 Trends 74-94 B1 1993/10-11 S4 11 61 20 8 0 2.75 5.83 1000 Eurobarometer 40 Trends 74-94 B1 1994/3-4 S4 14 59 20 6 0 2.79 5.96 1000 Eurobarometer 41 Trends 74-94 B1 1994/12 S4 15 61 16 8 0 2.83 6.06 1000 Eurobarometer 42 Trends 74-94 B1 Germany (E+W) 1990/10-11 S4 21 68 9 2 <1 3.08 6.73 2000 Eurobarometer 34 Trends 74-90 B1 1991/3 S4 23 62 12 2 1 3.07 6.71 2000 Eurobarometer 35 Trends 74-92 B1 1991/10-11 S4 21 64 12 2 1 3.05 6.65 2000 Eurobarometer 36 Trends 74-92 B1 1992/3-4 S4 20 63 15 2 0 3.01 6.54 2000 Eurobarometer 37 Trends 74-92 B1 1992/9-10 S4 23 63 11 2 1 3.08 6.73 2000 Eurobarometer 38 Trends 74-92 B1 1993/3-4 S4 22 61 14 2 1 3.04 6.62 2000 Eurobarometer 39 Trends 74-94 B1 1993/10-11 S4 19 65 13 3 0 3.00 6.51 2000 Eurobarometer 40 Trends 74-94 B1 1994/3-4 S4 17 66 14 2 1 2.99 6.48 2000 Eurobarometer 41 Trends 74-94 B1 1994/12 S4 17 68 12 2 1 3.01 6.54 2000 Eurobarometer 42 Trends 74-94 B1 Germany (West) 1973/9 S4 17 65 15 2 1 2.98 6.45 1957 Eurobarometer 1 Report 25 1986:A7 1975/5-6 S4 13 66 16 2 3 2.93 6.31 1039 Eurobarometer 3 Report 25 1986:A7 1975/10-11 S4 14 65 17 2 3 2.93 6.31 1002 Eurobarometer 4 Report 25 1986:A7 1976/5-6 S4 19 60 17 2 2 2.98 6.45 1004 Eurobarometer 5 Report 25 1986:A7 1976/11 S4 22 60 15 2 1 3.03 6.59 1007 Eurobarometer 6 Report 25 1986:A7 1977/4-5 S4 19 62 14 3 2 2.99 6.48 1005 Eurobarometer 7 Report 25 1986:A7 1977/10-11 S4 24 61 12 2 1 3.08 6.73 999 Eurobarometer 8 Report 25 1986:A7 1978/5-6 S4 21 61 14 3 1 3.01 6.54 996 Eurobarometer 9 Report 25 1986:A7 1978/10-11 S4 20 65 12 1 2 3.06 6.68 1006 Eurobarometer 10 Report 25 1986:A7 1979/4 S4 24 62 10 2 2 3.10 6.79 1003 Eurobarometer 11 Report 25 1986:A7 1980/4 S4 17 68 11 2 2 3.02 6.57 1009 Eurobarometer 13 Report 25 1986:A7 1981/4 S4 16 61 16 3 4 2.94 6.34 1004 Eurobarometer 15 Report 25 1986:A7 1982/3-4 S4 20 63 12 2 3 3.04 6.62 1328 Eurobarometer 17 Report 25 1986:A7 1982/10 S4 19 65 12 2 2 3.03 6.59 1012 Eurobarometer 18 Report 25 1986:A7 1983/3-4 S4 18 63 15 3 1 2.97 6.43 1049 Eurobarometer 19 Report 25 1986:A7
Happiness in Nations IITable 1.2.1. b
44 Representive Nation Samples

1983/10 S4 12 66 15 2 5 2.93 6.30 1058 Eurobarometer 20 Report 25 1986:A7 1984/3-4 S4 20 63 12 2 3 3.04 6.62 992 Eurobarometer 21 Report 25 1986:A7 1984/10-11 S4 13 71 13 2 1 2.96 6.39 1053 Eurobarometer 22 Report 25 1986:A7 1985/3-4 S4 24 60 14 2 <1 3.06 6.68 1007 Eurobarometer 23 Report 25 1986:A7 1985/10-11 S4 14 64 17 3 2 2.91 6.26 1028 Eurobarometer 24 Report 25 1986:A7 1986/3-4 S4 25 63 10 2 <1 3.11 6.82 987 Eurobarometer 25 Report 25 1986:A7 1986/10-11 S4 18 65 14 2 1 3.00 6.51 1084 Eurobarometer 26 Trends 74-90 B1 1987/3-4 S4 21 65 11 2 1 3.06 6.68 994 Eurobarometer 27 Trends 74-90 B1 1987/10-11 S4 15 68 14 2 1 2.97 6.42 957 Eurobarometer 28 Trends 74-90 B1 1988/3-4 S4 23 64 11 2 <1 3.08 6.73 1008 Eurobarometer 29 Trends 74-90 B1 1988/10-11 S4 25 56 17 1 1 3.06 6.67 1051 Eurobarometer 30 Trends 74-90 B1 1989/3-4 S4 20 70 8 1 1 3.10 6.79 1024 Eurobarometer 31 Trends 74-90 B1 1989/7 S4 27 61 8 2 2 3.15 6.94 1202 Eurobarometer ? Trends 74-90 B1 1989/10-11 S4 27 63 8 1 1 3.17 6.98 2000 Eurobarometer 32 Trends 74-90 B1 1990/3-4 S4 29 59 9 3 <1 3.14 6.90 1000 Eurobarometer 33 Trends 74-90 B1 1990/10-11 S4 24 68 7 1 <1 3.15 6.92 1000 Eurobarometer 34 Trends 74-90 B1 1991/3 S4 28 63 8 1 0 3.18 7.01 1000 Eurobarometer 35 Trends 74-92 B1 199110-11 S4 24 63 10 2 1 3.10 6.79 1000 Eurobarometer 36 Trends 74-92 B1 1992/3-4 S4 23 64 12 1 0 3.09 6.76 1000 Eurobarometer 37 Trends 74-92 B1 1992/9-10 S4 27 62 9 1 1 3.16 6.96 1000 Eurobarometer 38 Trends 74-92 B1 1993/3-4 S4 26 62 11 1 0 3.13 6.87 1000 Eurobarometer 39 Trends 74-94 B1 1993/10-11 S4 22 65 11 2 0 3.07 6.70 1000 Eurobarometer 40 Trends 74-94 B1 1994/3-4 S4 20 66 12 1 1 3.06 6.67 1000 Eurobarometer 41 Trends 74-94 B1 1994/12 S4 19 68 11 1 1 3.06 6.67 1000 Eurobarometer 42 Trends 74-94 B1 Germany (East) 1990/10-11 S4 10 68 19 3 <1 2.85 6.09 2000 Eurobarometer 34 Trends 74-90 B1 1991/3 S4 6 57 30 6 1 2.64 5.51 1000 Eurobarometer 35 Trends 74-92 B1 1991/10-11 S4 9 66 20 5 0 2.79 5.93 1000 Eurobarometer 36 Trends 74-92 B1 1992/3-4 S4 10 63 23 4 0 2.79 5.93 1000 Eurobarometer 37 Trends 74-92 B1 1992/9-10 S4 7 68 21 4 0 2.78 5.90 1000 Eurobarometer 38 Trends 74-92 B1 1993/3-4 S4 9 60 25 5 1 2.74 5.90 1000 Eurobarometer 39 Trends 74-94 B1 1993/10-11 S4 10 65 22 3 0 2.82 6.01 1000 Eurobarometer 40 Trends 74-94 B1 1994/3-4 S4 8 65 21 6 0 2.75 5.88 1000 Eurobarometer 41 Trends 74-94 B1 1994/12 S4 11 65 20 3 1 2.85 6.09 1000 Eurobarometer 42 Trends 74-94 B1
Happiness in Nations IITable 1.2.1. b
45 Representive Nation Samples
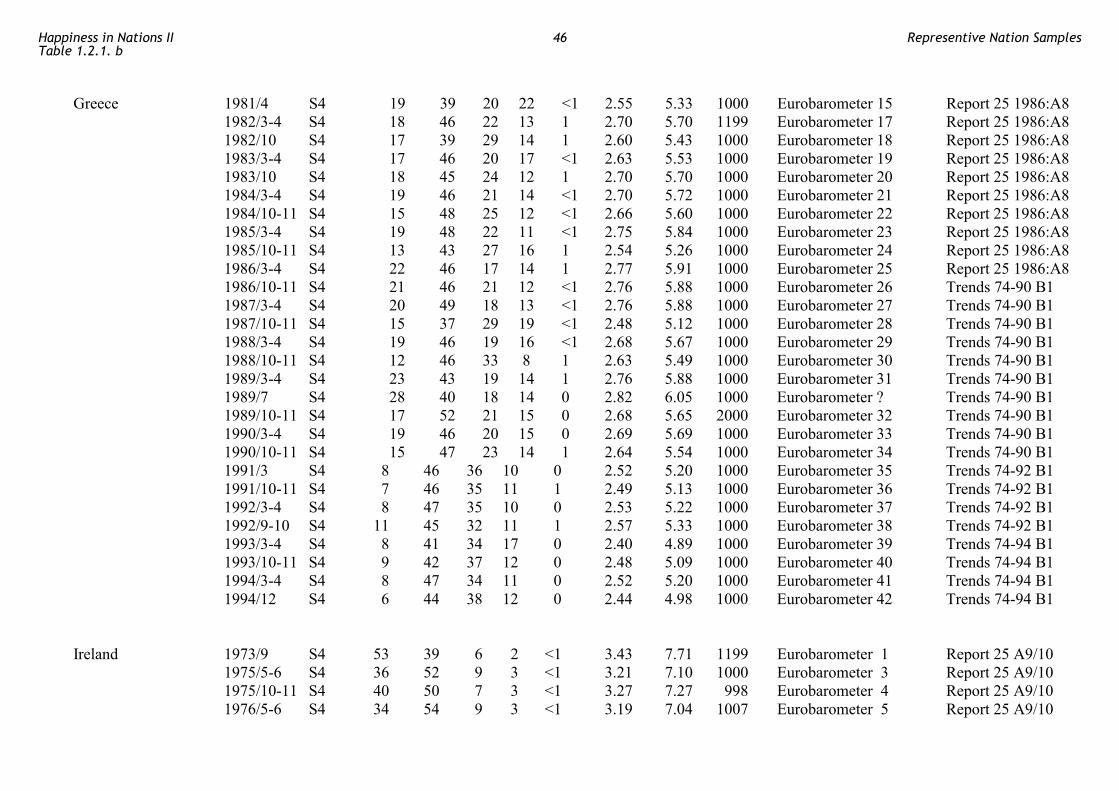
Greece 1981/4 S4 19 39 20 22 <1 2.55 5.33 1000 Eurobarometer 15 Report 25 1986:A8 1982/3-4 S4 18 46 22 13 1 2.70 5.70 1199 Eurobarometer 17 Report 25 1986:A8 1982/10 S4 17 39 29 14 1 2.60 5.43 1000 Eurobarometer 18 Report 25 1986:A8 1983/3-4 S4 17 46 20 17 <1 2.63 5.53 1000 Eurobarometer 19 Report 25 1986:A8 1983/10 S4 18 45 24 12 1 2.70 5.70 1000 Eurobarometer 20 Report 25 1986:A8 1984/3-4 S4 19 46 21 14 <1 2.70 5.72 1000 Eurobarometer 21 Report 25 1986:A8 1984/10-11 S4 15 48 25 12 <1 2.66 5.60 1000 Eurobarometer 22 Report 25 1986:A8 1985/3-4 S4 19 48 22 11 <1 2.75 5.84 1000 Eurobarometer 23 Report 25 1986:A8 1985/10-11 S4 13 43 27 16 1 2.54 5.26 1000 Eurobarometer 24 Report 25 1986:A8 1986/3-4 S4 22 46 17 14 1 2.77 5.91 1000 Eurobarometer 25 Report 25 1986:A8 1986/10-11 S4 21 46 21 12 <1 2.76 5.88 1000 Eurobarometer 26 Trends 74-90 B1 1987/3-4 S4 20 49 18 13 <1 2.76 5.88 1000 Eurobarometer 27 Trends 74-90 B1 1987/10-11 S4 15 37 29 19 <1 2.48 5.12 1000 Eurobarometer 28 Trends 74-90 B1 1988/3-4 S4 19 46 19 16 <1 2.68 5.67 1000 Eurobarometer 29 Trends 74-90 B1 1988/10-11 S4 12 46 33 8 1 2.63 5.49 1000 Eurobarometer 30 Trends 74-90 B1 1989/3-4 S4 23 43 19 14 1 2.76 5.88 1000 Eurobarometer 31 Trends 74-90 B1 1989/7 S4 28 40 18 14 0 2.82 6.05 1000 Eurobarometer ? Trends 74-90 B1 1989/10-11 S4 17 52 21 15 0 2.68 5.65 2000 Eurobarometer 32 Trends 74-90 B1 1990/3-4 S4 19 46 20 15 0 2.69 5.69 1000 Eurobarometer 33 Trends 74-90 B1 1990/10-11 S4 15 47 23 14 1 2.64 5.54 1000 Eurobarometer 34 Trends 74-90 B1 1991/3 S4 8 46 36 10 0 2.52 5.20 1000 Eurobarometer 35 Trends 74-92 B1 1991/10-11 S4 7 46 35 11 1 2.49 5.13 1000 Eurobarometer 36 Trends 74-92 B1 1992/3-4 S4 8 47 35 10 0 2.53 5.22 1000 Eurobarometer 37 Trends 74-92 B1 1992/9-10 S4 11 45 32 11 1 2.57 5.33 1000 Eurobarometer 38 Trends 74-92 B1 1993/3-4 S4 8 41 34 17 0 2.40 4.89 1000 Eurobarometer 39 Trends 74-94 B1 1993/10-11 S4 9 42 37 12 0 2.48 5.09 1000 Eurobarometer 40 Trends 74-94 B1 1994/3-4 S4 8 47 34 11 0 2.52 5.20 1000 Eurobarometer 41 Trends 74-94 B1 1994/12 S4 6 44 38 12 0 2.44 4.98 1000 Eurobarometer 42 Trends 74-94 B1 Ireland 1973/9 S4 53 39 6 2 <1 3.43 7.71 1199 Eurobarometer 1 Report 25 A9/10 1975/5-6 S4 36 52 9 3 <1 3.21 7.10 1000 Eurobarometer 3 Report 25 A9/10 1975/10-11 S4 40 50 7 3 <1 3.27 7.27 998 Eurobarometer 4 Report 25 A9/10 1976/5-6 S4 34 54 9 3 <1 3.19 7.04 1007 Eurobarometer 5 Report 25 A9/10
Happiness in Nations IITable 1.2.1. b
46 Representive Nation Samples
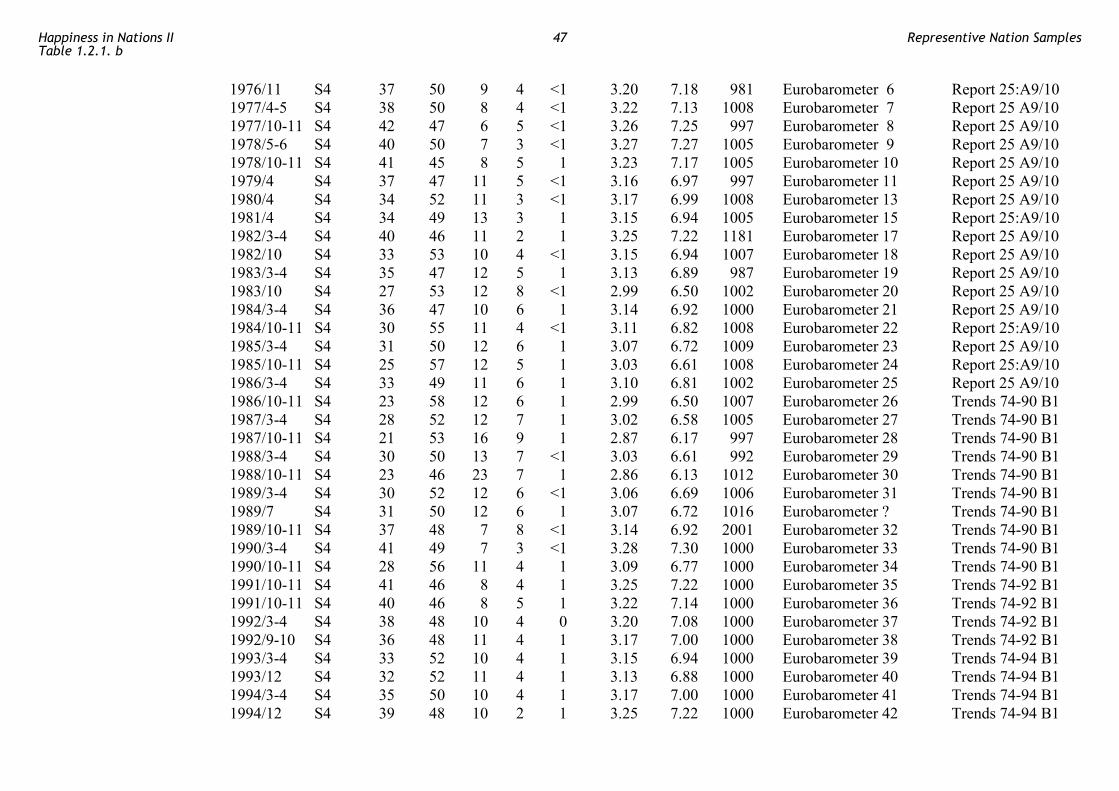
1976/11 S4 37 50 9 4 <1 3.20 7.18 981 Eurobarometer 6 Report 25:A9/10 1977/4-5 S4 38 50 8 4 <1 3.22 7.13 1008 Eurobarometer 7 Report 25 A9/10 1977/10-11 S4 42 47 6 5 <1 3.26 7.25 997 Eurobarometer 8 Report 25 A9/10 1978/5-6 S4 40 50 7 3 <1 3.27 7.27 1005 Eurobarometer 9 Report 25 A9/10 1978/10-11 S4 41 45 8 5 1 3.23 7.17 1005 Eurobarometer 10 Report 25 A9/10 1979/4 S4 37 47 11 5 <1 3.16 6.97 997 Eurobarometer 11 Report 25 A9/10 1980/4 S4 34 52 11 3 <1 3.17 6.99 1008 Eurobarometer 13 Report 25 A9/10 1981/4 S4 34 49 13 3 1 3.15 6.94 1005 Eurobarometer 15 Report 25:A9/10 1982/3-4 S4 40 46 11 2 1 3.25 7.22 1181 Eurobarometer 17 Report 25 A9/10 1982/10 S4 33 53 10 4 <1 3.15 6.94 1007 Eurobarometer 18 Report 25 A9/10 1983/3-4 S4 35 47 12 5 1 3.13 6.89 987 Eurobarometer 19 Report 25 A9/10 1983/10 S4 27 53 12 8 <1 2.99 6.50 1002 Eurobarometer 20 Report 25 A9/10 1984/3-4 S4 36 47 10 6 1 3.14 6.92 1000 Eurobarometer 21 Report 25 A9/10 1984/10-11 S4 30 55 11 4 <1 3.11 6.82 1008 Eurobarometer 22 Report 25:A9/10 1985/3-4 S4 31 50 12 6 1 3.07 6.72 1009 Eurobarometer 23 Report 25 A9/10 1985/10-11 S4 25 57 12 5 1 3.03 6.61 1008 Eurobarometer 24 Report 25:A9/10 1986/3-4 S4 33 49 11 6 1 3.10 6.81 1002 Eurobarometer 25 Report 25 A9/10 1986/10-11 S4 23 58 12 6 1 2.99 6.50 1007 Eurobarometer 26 Trends 74-90 B1 1987/3-4 S4 28 52 12 7 1 3.02 6.58 1005 Eurobarometer 27 Trends 74-90 B1 1987/10-11 S4 21 53 16 9 1 2.87 6.17 997 Eurobarometer 28 Trends 74-90 B1 1988/3-4 S4 30 50 13 7 <1 3.03 6.61 992 Eurobarometer 29 Trends 74-90 B1 1988/10-11 S4 23 46 23 7 1 2.86 6.13 1012 Eurobarometer 30 Trends 74-90 B1 1989/3-4 S4 30 52 12 6 <1 3.06 6.69 1006 Eurobarometer 31 Trends 74-90 B1 1989/7 S4 31 50 12 6 1 3.07 6.72 1016 Eurobarometer ? Trends 74-90 B1 1989/10-11 S4 37 48 7 8 <1 3.14 6.92 2001 Eurobarometer 32 Trends 74-90 B1 1990/3-4 S4 41 49 7 3 <1 3.28 7.30 1000 Eurobarometer 33 Trends 74-90 B1 1990/10-11 S4 28 56 11 4 1 3.09 6.77 1000 Eurobarometer 34 Trends 74-90 B1 1991/10-11 S4 41 46 8 4 1 3.25 7.22 1000 Eurobarometer 35 Trends 74-92 B1 1991/10-11 S4 40 46 8 5 1 3.22 7.14 1000 Eurobarometer 36 Trends 74-92 B1 1992/3-4 S4 38 48 10 4 0 3.20 7.08 1000 Eurobarometer 37 Trends 74-92 B1 1992/9-10 S4 36 48 11 4 1 3.17 7.00 1000 Eurobarometer 38 Trends 74-92 B1 1993/3-4 S4 33 52 10 4 1 3.15 6.94 1000 Eurobarometer 39 Trends 74-94 B1 1993/12 S4 32 52 11 4 1 3.13 6.88 1000 Eurobarometer 40 Trends 74-94 B1 1994/3-4 S4 35 50 10 4 1 3.17 7.00 1000 Eurobarometer 41 Trends 74-94 B1 1994/12 S4 39 48 10 2 1 3.25 7.22 1000 Eurobarometer 42 Trends 74-94 B1
Happiness in Nations IITable 1.2.1. b
47 Representive Nation Samples
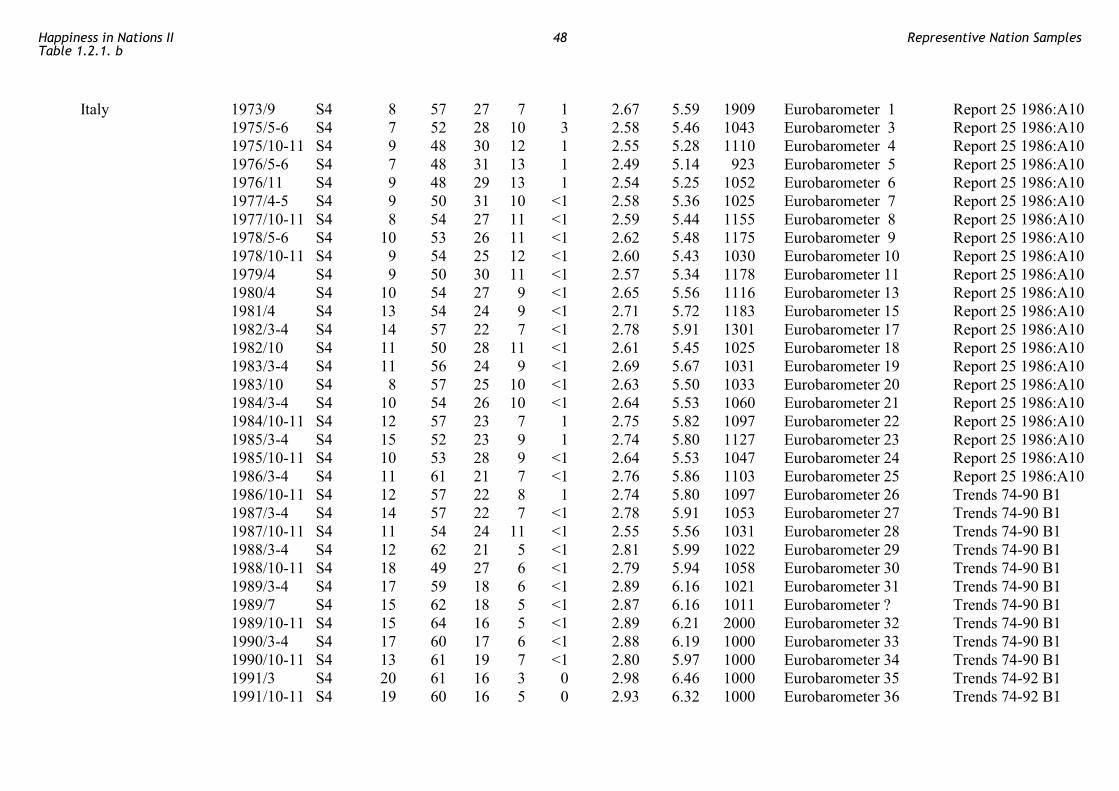
Italy 1973/9 S4 8 57 27 7 1 2.67 5.59 1909 Eurobarometer 1 Report 25 1986:A10 1975/5-6 S4 7 52 28 10 3 2.58 5.46 1043 Eurobarometer 3 Report 25 1986:A10 1975/10-11 S4 9 48 30 12 1 2.55 5.28 1110 Eurobarometer 4 Report 25 1986:A10 1976/5-6 S4 7 48 31 13 1 2.49 5.14 923 Eurobarometer 5 Report 25 1986:A10 1976/11 S4 9 48 29 13 1 2.54 5.25 1052 Eurobarometer 6 Report 25 1986:A10 1977/4-5 S4 9 50 31 10 <1 2.58 5.36 1025 Eurobarometer 7 Report 25 1986:A10 1977/10-11 S4 8 54 27 11 <1 2.59 5.44 1155 Eurobarometer 8 Report 25 1986:A10 1978/5-6 S4 10 53 26 11 <1 2.62 5.48 1175 Eurobarometer 9 Report 25 1986:A10 1978/10-11 S4 9 54 25 12 <1 2.60 5.43 1030 Eurobarometer 10 Report 25 1986:A10 1979/4 S4 9 50 30 11 <1 2.57 5.34 1178 Eurobarometer 11 Report 25 1986:A10 1980/4 S4 10 54 27 9 <1 2.65 5.56 1116 Eurobarometer 13 Report 25 1986:A10 1981/4 S4 13 54 24 9 <1 2.71 5.72 1183 Eurobarometer 15 Report 25 1986:A10 1982/3-4 S4 14 57 22 7 <1 2.78 5.91 1301 Eurobarometer 17 Report 25 1986:A10 1982/10 S4 11 50 28 11 <1 2.61 5.45 1025 Eurobarometer 18 Report 25 1986:A10 1983/3-4 S4 11 56 24 9 <1 2.69 5.67 1031 Eurobarometer 19 Report 25 1986:A10 1983/10 S4 8 57 25 10 <1 2.63 5.50 1033 Eurobarometer 20 Report 25 1986:A10 1984/3-4 S4 10 54 26 10 <1 2.64 5.53 1060 Eurobarometer 21 Report 25 1986:A10 1984/10-11 S4 12 57 23 7 1 2.75 5.82 1097 Eurobarometer 22 Report 25 1986:A10 1985/3-4 S4 15 52 23 9 1 2.74 5.80 1127 Eurobarometer 23 Report 25 1986:A10 1985/10-11 S4 10 53 28 9 <1 2.64 5.53 1047 Eurobarometer 24 Report 25 1986:A10 1986/3-4 S4 11 61 21 7 <1 2.76 5.86 1103 Eurobarometer 25 Report 25 1986:A10 1986/10-11 S4 12 57 22 8 1 2.74 5.80 1097 Eurobarometer 26 Trends 74-90 B1 1987/3-4 S4 14 57 22 7 <1 2.78 5.91 1053 Eurobarometer 27 Trends 74-90 B1 1987/10-11 S4 11 54 24 11 <1 2.55 5.56 1031 Eurobarometer 28 Trends 74-90 B1 1988/3-4 S4 12 62 21 5 <1 2.81 5.99 1022 Eurobarometer 29 Trends 74-90 B1 1988/10-11 S4 18 49 27 6 <1 2.79 5.94 1058 Eurobarometer 30 Trends 74-90 B1 1989/3-4 S4 17 59 18 6 <1 2.89 6.16 1021 Eurobarometer 31 Trends 74-90 B1 1989/7 S4 15 62 18 5 <1 2.87 6.16 1011 Eurobarometer ? Trends 74-90 B1 1989/10-11 S4 15 64 16 5 <1 2.89 6.21 2000 Eurobarometer 32 Trends 74-90 B1 1990/3-4 S4 17 60 17 6 <1 2.88 6.19 1000 Eurobarometer 33 Trends 74-90 B1 1990/10-11 S4 13 61 19 7 <1 2.80 5.97 1000 Eurobarometer 34 Trends 74-90 B1 1991/3 S4 20 61 16 3 0 2.98 6.46 1000 Eurobarometer 35 Trends 74-92 B1 1991/10-11 S4 19 60 16 5 0 2.93 6.32 1000 Eurobarometer 36 Trends 74-92 B1
Happiness in Nations IITable 1.2.1. b
48 Representive Nation Samples
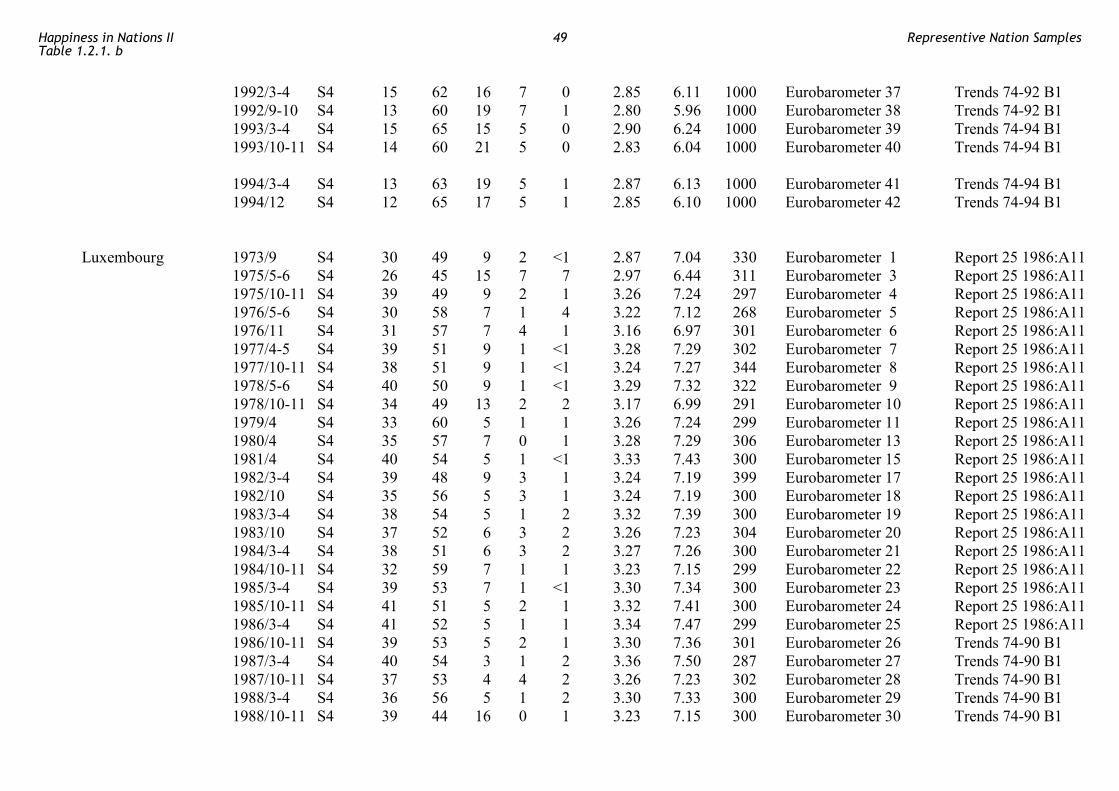
1992/3-4 S4 15 62 16 7 0 2.85 6.11 1000 Eurobarometer 37 Trends 74-92 B1 1992/9-10 S4 13 60 19 7 1 2.80 5.96 1000 Eurobarometer 38 Trends 74-92 B1 1993/3-4 S4 15 65 15 5 0 2.90 6.24 1000 Eurobarometer 39 Trends 74-94 B1 1993/10-11 S4 14 60 21 5 0 2.83 6.04 1000 Eurobarometer 40 Trends 74-94 B1 1994/3-4 S4 13 63 19 5 1 2.87 6.13 1000 Eurobarometer 41 Trends 74-94 B1 1994/12 S4 12 65 17 5 1 2.85 6.10 1000 Eurobarometer 42 Trends 74-94 B1 Luxembourg 1973/9 S4 30 49 9 2 <1 2.87 7.04 330 Eurobarometer 1 Report 25 1986:A11 1975/5-6 S4 26 45 15 7 7 2.97 6.44 311 Eurobarometer 3 Report 25 1986:A11 1975/10-11 S4 39 49 9 2 1 3.26 7.24 297 Eurobarometer 4 Report 25 1986:A11 1976/5-6 S4 30 58 7 1 4 3.22 7.12 268 Eurobarometer 5 Report 25 1986:A11 1976/11 S4 31 57 7 4 1 3.16 6.97 301 Eurobarometer 6 Report 25 1986:A11 1977/4-5 S4 39 51 9 1 <1 3.28 7.29 302 Eurobarometer 7 Report 25 1986:A11 1977/10-11 S4 38 51 9 1 <1 3.24 7.27 344 Eurobarometer 8 Report 25 1986:A11 1978/5-6 S4 40 50 9 1 <1 3.29 7.32 322 Eurobarometer 9 Report 25 1986:A11 1978/10-11 S4 34 49 13 2 2 3.17 6.99 291 Eurobarometer 10 Report 25 1986:A11 1979/4 S4 33 60 5 1 1 3.26 7.24 299 Eurobarometer 11 Report 25 1986:A11 1980/4 S4 35 57 7 0 1 3.28 7.29 306 Eurobarometer 13 Report 25 1986:A11 1981/4 S4 40 54 5 1 <1 3.33 7.43 300 Eurobarometer 15 Report 25 1986:A11 1982/3-4 S4 39 48 9 3 1 3.24 7.19 399 Eurobarometer 17 Report 25 1986:A11 1982/10 S4 35 56 5 3 1 3.24 7.19 300 Eurobarometer 18 Report 25 1986:A11 1983/3-4 S4 38 54 5 1 2 3.32 7.39 300 Eurobarometer 19 Report 25 1986:A11 1983/10 S4 37 52 6 3 2 3.26 7.23 304 Eurobarometer 20 Report 25 1986:A11 1984/3-4 S4 38 51 6 3 2 3.27 7.26 300 Eurobarometer 21 Report 25 1986:A11 1984/10-11 S4 32 59 7 1 1 3.23 7.15 299 Eurobarometer 22 Report 25 1986:A11 1985/3-4 S4 39 53 7 1 <1 3.30 7.34 300 Eurobarometer 23 Report 25 1986:A11 1985/10-11 S4 41 51 5 2 1 3.32 7.41 300 Eurobarometer 24 Report 25 1986:A11 1986/3-4 S4 41 52 5 1 1 3.34 7.47 299 Eurobarometer 25 Report 25 1986:A11 1986/10-11 S4 39 53 5 2 1 3.30 7.36 301 Eurobarometer 26 Trends 74-90 B1 1987/3-4 S4 40 54 3 1 2 3.36 7.50 287 Eurobarometer 27 Trends 74-90 B1 1987/10-11 S4 37 53 4 4 2 3.26 7.23 302 Eurobarometer 28 Trends 74-90 B1 1988/3-4 S4 36 56 5 1 2 3.30 7.33 300 Eurobarometer 29 Trends 74-90 B1 1988/10-11 S4 39 44 16 0 1 3.23 7.15 300 Eurobarometer 30 Trends 74-90 B1
Happiness in Nations IITable 1.2.1. b
49 Representive Nation Samples
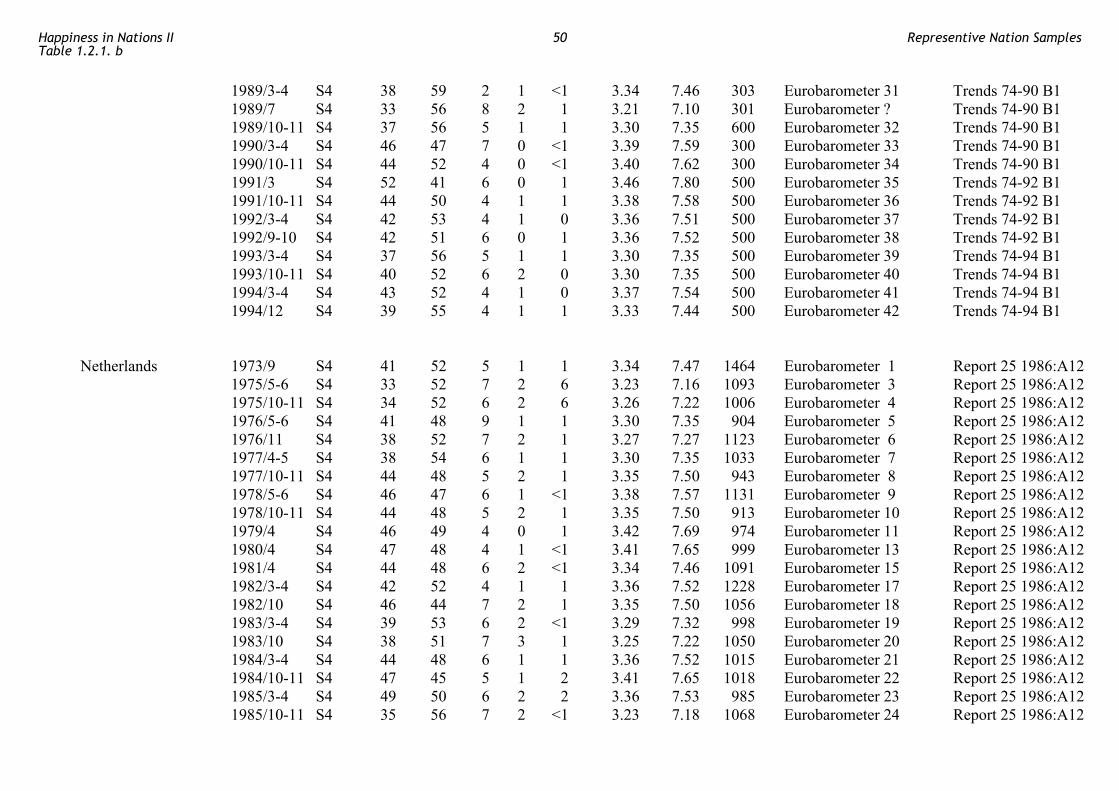
1989/3-4 S4 38 59 2 1 <1 3.34 7.46 303 Eurobarometer 31 Trends 74-90 B1 1989/7 S4 33 56 8 2 1 3.21 7.10 301 Eurobarometer ? Trends 74-90 B1 1989/10-11 S4 37 56 5 1 1 3.30 7.35 600 Eurobarometer 32 Trends 74-90 B1 1990/3-4 S4 46 47 7 0 <1 3.39 7.59 300 Eurobarometer 33 Trends 74-90 B1 1990/10-11 S4 44 52 4 0 <1 3.40 7.62 300 Eurobarometer 34 Trends 74-90 B1 1991/3 S4 52 41 6 0 1 3.46 7.80 500 Eurobarometer 35 Trends 74-92 B1 1991/10-11 S4 44 50 4 1 1 3.38 7.58 500 Eurobarometer 36 Trends 74-92 B1 1992/3-4 S4 42 53 4 1 0 3.36 7.51 500 Eurobarometer 37 Trends 74-92 B1 1992/9-10 S4 42 51 6 0 1 3.36 7.52 500 Eurobarometer 38 Trends 74-92 B1 1993/3-4 S4 37 56 5 1 1 3.30 7.35 500 Eurobarometer 39 Trends 74-94 B1 1993/10-11 S4 40 52 6 2 0 3.30 7.35 500 Eurobarometer 40 Trends 74-94 B1 1994/3-4 S4 43 52 4 1 0 3.37 7.54 500 Eurobarometer 41 Trends 74-94 B1 1994/12 S4 39 55 4 1 1 3.33 7.44 500 Eurobarometer 42 Trends 74-94 B1 Netherlands 1973/9 S4 41 52 5 1 1 3.34 7.47 1464 Eurobarometer 1 Report 25 1986:A12 1975/5-6 S4 33 52 7 2 6 3.23 7.16 1093 Eurobarometer 3 Report 25 1986:A12 1975/10-11 S4 34 52 6 2 6 3.26 7.22 1006 Eurobarometer 4 Report 25 1986:A12 1976/5-6 S4 41 48 9 1 1 3.30 7.35 904 Eurobarometer 5 Report 25 1986:A12 1976/11 S4 38 52 7 2 1 3.27 7.27 1123 Eurobarometer 6 Report 25 1986:A12 1977/4-5 S4 38 54 6 1 1 3.30 7.35 1033 Eurobarometer 7 Report 25 1986:A12 1977/10-11 S4 44 48 5 2 1 3.35 7.50 943 Eurobarometer 8 Report 25 1986:A12 1978/5-6 S4 46 47 6 1 <1 3.38 7.57 1131 Eurobarometer 9 Report 25 1986:A12 1978/10-11 S4 44 48 5 2 1 3.35 7.50 913 Eurobarometer 10 Report 25 1986:A12 1979/4 S4 46 49 4 0 1 3.42 7.69 974 Eurobarometer 11 Report 25 1986:A12 1980/4 S4 47 48 4 1 <1 3.41 7.65 999 Eurobarometer 13 Report 25 1986:A12 1981/4 S4 44 48 6 2 <1 3.34 7.46 1091 Eurobarometer 15 Report 25 1986:A12 1982/3-4 S4 42 52 4 1 1 3.36 7.52 1228 Eurobarometer 17 Report 25 1986:A12 1982/10 S4 46 44 7 2 1 3.35 7.50 1056 Eurobarometer 18 Report 25 1986:A12 1983/3-4 S4 39 53 6 2 <1 3.29 7.32 998 Eurobarometer 19 Report 25 1986:A12 1983/10 S4 38 51 7 3 1 3.25 7.22 1050 Eurobarometer 20 Report 25 1986:A12 1984/3-4 S4 44 48 6 1 1 3.36 7.52 1015 Eurobarometer 21 Report 25 1986:A12 1984/10-11 S4 47 45 5 1 2 3.41 7.65 1018 Eurobarometer 22 Report 25 1986:A12 1985/3-4 S4 49 50 6 2 2 3.36 7.53 985 Eurobarometer 23 Report 25 1986:A12 1985/10-11 S4 35 56 7 2 <1 3.23 7.18 1068 Eurobarometer 24 Report 25 1986:A12
Happiness in Nations IITable 1.2.1. b
50 Representive Nation Samples

16
1986/3-4 S4 41 53 4 1 1 3.35 7.49 1001 Eurobarometer 25 Report 25 1986:A12 1986/10-11 S4 35 55 8 1 1 3.25 7.21 1026 Eurobarometer 26 Trends 74-90 B1 1987/3-4 S4 41 51 6 1 1 3.33 7.44 1004 Eurobarometer 27 Trends 74-90 B1 1987/10-11 S4 35 56 6 2 1 3.25 7.22 965 Eurobarometer 28 Trends 74-90 B1 1988/3-4 S4 45 48 5 1 1 3.38 7.58 1023 Eurobarometer 29 Trends 74-90 B1 1988/10-11 S4 31 58 9 1 1 3.20 7.07 1006 Eurobarometer 30 Trends 74-90 B1 1989/3-4 S4 49 46 4 1 <1 3.43 7.71 1025 Eurobarometer 31 Trends 74-90 B1 1989/7 S4 49 45 5 1 <1 3.42 7.68 970 Eurobarometer ? Trends 74-90 B1 1989/10-11 S4 42 51 4 1 2 3.37 7.53 1999 Eurobarometer 32 Trends 74-90 B1 1990/3-4 S4 48 45 6 1 3.42 7.69 1000 Eurobarometer 33 Trends 74-90 B1 1990/10-11 S4 40 52 5 1 2 3.34 7.45 1000 Eurobarometer 34 Trends 74-90 B1 1991/3 S4 50 44 4 1 1 3.44 7.75 1000 Eurobarometer 35 Trends 74-92 B1 1991/10-11 S4 47 46 5 1 1 3.40 7.64 1000 Eurobarometer 36 Trends 74-92 B1 1992/3-4 S4 49 43 7 0 1 3.42 7.69 1000 Eurobarometer 37 Trends 74-92 B1 1992/9-10 S4 50 44 5 1 0 3.43 7.71 1000 Eurobarometer 38 Trends 74-92 B1 1993/3-4 S4 47 47 5 1 0 3.40 7.62 1000 Eurobarometer 39 Trends 74-94 B1 1993/10-11 S4 45 49 5 1 0 3.38 7.57 1000 Eurobarometer 40 Trends 74-94 B1 1994/3-4 S4 47 47 5 2 0 3.41 7.64 1000 Eurobarometer 41 Trends 74-94 B1 1994/12 S4 39 53 7 1 0 3.30 7.34 1000 Eurobarometer 42 Trends 74-94 B1 Portugal 1985/10-11 S4 3 53 28 15 1 2.44 5.01 1000 Eurobarometer 24 Report 25 1986:A15 1986/3-4 S4 5 57 25 12 1 2.56 5.30 1000 Eurobarometer 25 Report 25 1986:A15 1986/10-11 S4 5 63 24 7 1 2.67 5.59 1000 Eurobarometer 26 Trends 74-90 B1 1987/3-4 S4 4 62 25 8 1 2.63 5.49 1000 Eurobarometer 27 Trends 74-90 B1 1987/10-11 S4 8 67 19 5 1 2.79 5.93 1000 Eurobarometer 28 Trends 74-90 B1 1988/3-4 S4 6 62 21 10 1 2.65 5.55 1000 Eurobarometer 29 Trends 74-90 B1 1988/10-11 S4 13 40 39 8 <1 2.58 5.36 1000 Eurobarometer 30 Trends 74-90 B1 1989/3-4 S4 4 67 23 6 <1 2.69 5.66 1000 Eurobarometer 31 Trends 74-90 B1 1989/7 S4 5 61 24 9 1 2.63 5.49 1000 Eurobarometer ? Trends 74-90 B1 1989/10-11 S4 6 66 21 6 1 2.73 5.76 2000 Eurobarometer 32 Trends 74-90 B1 1990/3-4 S4 8 65 18 9 <1 2.72 5.75 1000 Eurobarometer 33 Trends 74-90 B1 1990/10-11 S4 5 66 20 7 2 2.70 5.70 1000 Eurobarometer 34 Trends 74-90 B1 1991/3 S4 7 65 21 7 0 2.72 5.74 1000 Eurobarometer 35 Trends 74-92 B1 1991/10-11 S4 6 67 21 5 1 2.75 5.81 1000 Eurobarometer 36 Trends 74-92 B1
Happiness in Nations IITable 1.2.1. b
51 Representive Nation Samples
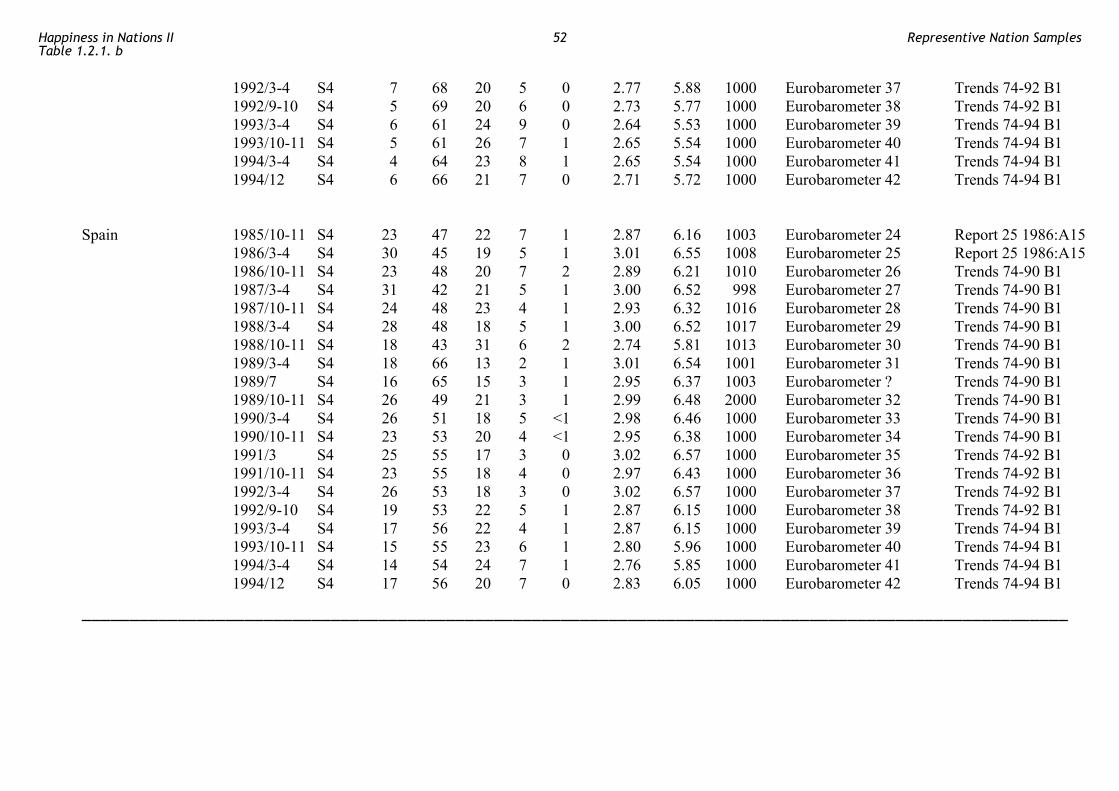
17
1992/3-4 S4 7 68 20 5 0 2.77 5.88 1000 Eurobarometer 37 Trends 74-92 B1 1992/9-10 S4 5 69 20 6 0 2.73 5.77 1000 Eurobarometer 38 Trends 74-92 B1 1993/3-4 S4 6 61 24 9 0 2.64 5.53 1000 Eurobarometer 39 Trends 74-94 B1 1993/10-11 S4 5 61 26 7 1 2.65 5.54 1000 Eurobarometer 40 Trends 74-94 B1 1994/3-4 S4 4 64 23 8 1 2.65 5.54 1000 Eurobarometer 41 Trends 74-94 B1 1994/12 S4 6 66 21 7 0 2.71 5.72 1000 Eurobarometer 42 Trends 74-94 B1 Spain 1985/10-11 S4 23 47 22 7 1 2.87 6.16 1003 Eurobarometer 24 Report 25 1986:A15 1986/3-4 S4 30 45 19 5 1 3.01 6.55 1008 Eurobarometer 25 Report 25 1986:A15 1986/10-11 S4 23 48 20 7 2 2.89 6.21 1010 Eurobarometer 26 Trends 74-90 B1 1987/3-4 S4 31 42 21 5 1 3.00 6.52 998 Eurobarometer 27 Trends 74-90 B1 1987/10-11 S4 24 48 23 4 1 2.93 6.32 1016 Eurobarometer 28 Trends 74-90 B1 1988/3-4 S4 28 48 18 5 1 3.00 6.52 1017 Eurobarometer 29 Trends 74-90 B1 1988/10-11 S4 18 43 31 6 2 2.74 5.81 1013 Eurobarometer 30 Trends 74-90 B1 1989/3-4 S4 18 66 13 2 1 3.01 6.54 1001 Eurobarometer 31 Trends 74-90 B1 1989/7 S4 16 65 15 3 1 2.95 6.37 1003 Eurobarometer ? Trends 74-90 B1 1989/10-11 S4 26 49 21 3 1 2.99 6.48 2000 Eurobarometer 32 Trends 74-90 B1 1990/3-4 S4 26 51 18 5 <1 2.98 6.46 1000 Eurobarometer 33 Trends 74-90 B1 1990/10-11 S4 23 53 20 4 <1 2.95 6.38 1000 Eurobarometer 34 Trends 74-90 B1 1991/3 S4 25 55 17 3 0 3.02 6.57 1000 Eurobarometer 35 Trends 74-92 B1 1991/10-11 S4 23 55 18 4 0 2.97 6.43 1000 Eurobarometer 36 Trends 74-92 B1 1992/3-4 S4 26 53 18 3 0 3.02 6.57 1000 Eurobarometer 37 Trends 74-92 B1 1992/9-10 S4 19 53 22 5 1 2.87 6.15 1000 Eurobarometer 38 Trends 74-92 B1 1993/3-4 S4 17 56 22 4 1 2.87 6.15 1000 Eurobarometer 39 Trends 74-94 B1 1993/10-11 S4 15 55 23 6 1 2.80 5.96 1000 Eurobarometer 40 Trends 74-94 B1 1994/3-4 S4 14 54 24 7 1 2.76 5.85 1000 Eurobarometer 41 Trends 74-94 B1 1994/12 S4 17 56 20 7 0 2.83 6.05 1000 Eurobarometer 42 Trends 74-94 B1 ───────────────────────────────────────────────────────────────────────────────────────────────────────
Happiness in Nations IITable 1.2.1. b
52 Representive Nation Samples
REMARKS 1. Regions: (EU 10) stands for Belgium, Danmark, France, Greece, Holland, Ireland, Italy, Luxembourg, United Kingdom and W-Germany. (EU 12) stands for EU 10 plus Portugal and Spain. Britain (Great) also referred to as "United Kingdom". It involves England, Scotland, Wales and Northern Ireland. 2. Question wordings: S4: "On the whole, are you very satisfied, fairly satisfied, not very satisfied, or not at all satisfied with the life you lead?" (Data from the publication of the Commission of the European Communities, Eurobarometer survey) S5: "On the whole, are you fully satisfied, not fully but to an extent satisfied, as yet unsatisfied or very unsatisfied with the life you lead?" (Data from the Prime Ministers Office, Japan) S6: "On the whole, are you satisfied, rather satisfied, as yet unsatisfied or unbearably dissatisfied with the life you lead?" (Data from the Prime Ministers Office, Japan) S7: "On the whole, are you fully satisfied, not fully but generally, still dissatisfied or extremely dissatisfied?" (Data from the Prime Ministers Office, Japan)
Happiness in Nations IITable 1.2.1. b
53 Representive Nation Samples

3. Means (1-4) Calculated by attributing - 1 point to 'not at all satisfied'/'very unsatisfied'/'unbearably dissatisfied'/'extremely dissatisfied' - 2 points to 'not very satisfied'/'as yet unsatisfied'/'still dissatisfied' - 3 points to 'fairly satisfied'/'not fully but to an extent satisfied'/'rather satisfied'/'not fully but generally satisfied'/'rather yes' - 4 points to 'very satisfied'/'fully satisfied'/'satisfied'/'yes' 4. Means (0-10) Calculated by us (for S4, S5 and S6). Experts rated the value of the various response categories on a scale ranging from 0 (most negative) to 10
(most positive). This procedure is described in more detail in chapter 7/3.3.2. Items marked * did not figure in the original weighting procedure, but were estimated later off hand.
The average ratings used were as follows: - fully satisfied 9.7 - very satisfied 9.3 - satisfied 8.5 - not fully but to an extent satisfied 6.9 - rather satisfied 6.8 - fairly satisfied 6.5 - as yet unsatisfied 4.0 - still dissatisfied* 4.0 - not very satisfied 3.7 - very unsatisfied 1.7 - not at all satisfied 1.3 - extremely dissatisfied* 1.2 - unbearably dissatisfied 1.2 5. Sources PMO: Prime Ministers Office (Japan)
EPA: Economic Planning Agency (Japan). Data provided on request 13-10-1994.
Happiness in Nations IITable 1.2.1. b
54 Representive Nation Samples
Table 1.2.1c 5-step life satisfaction Single direct questions on happiness in general (type HAP 1.1) Typical item (S8): 'OVERALL, HOW SATISFIED ARE YOU WITH YOUR PRESENT LIFE?' O VERY SATISFIED (5) O FAIRLY SATISFIED (4) O NEITHER SATISFIED NOR DISSATISFIED (3) O FAIRLY DISSATISFIED (2) O VERY DISSATISFIED (1) Country Year/ Question Proportions Mean N Source4 Month type 5 4 3 2 1 DK 1-52 0-103 Survey name Published in NA AFRICA South Africa 1983 S9 17 51 4 18 10 * 3.47 6.80 5587 SA QOL Study 1 Moller 1984 - Whites 1983 S9 30 59 3 5 2 1 4.11 8.22 834 SA QOL Study 1 Moller 1987: 22 (89) (7) SA QOL Study 1 Moller 1989: 44 - Indians 1983 S9 20 68 3 7 1 0 4.00 8.09 1316 SA QOL Study 1 Moller 1987: 22 (88) (8) SA QOL Study 1 Moller 1989: 44 - Coloureds 1983 S9 19 62 4 13 2 1 3.83 7.65 970 SA QOL Study 1 Moller 1987: 22 (81) (15) SA QOL Study 1 Moller 1989: 44 - Africans 1983 S9 9 35 3 30 22 1 2.79 5.26 2467 SA QOL Study 1 Moller 1987: 22 (44) (52) - Whites 1988 S9 82 752 SA QOL Study 2 Moller 1989: 44 - Indians 1988 S9 77 991 SA QOL Study 2 Moller 1989: 44 - Coloureds 1988 S9 77 829 SA QOL Study 2 Moller 1989: 44 - Africans 1988 S9 32 1199 SA QOL Study 2 Moller 1989: 44
Happiness in Nations IITable 1.2.1. c
55 Representive Nation Samples
ANGLO-AMERICA U.S.A. 1979/9 S8 37 51 6 4 1 0.2 4.20 7.29 1127 13CountryValueSurvey Leisure 1980:96 Canada 1979/9 S8 34 55 7 3 1 0.2 4.18 7.21 1012 13CountryValueSurvey Leisure 1980:96 ASIA India1 1979/9 S8 12 56 22 9 1 0.1 3.69 6.20 1000 13CountryValueSurvey Leisure 1980:96 Japan 1979/10 S8 5 45 42 8 1 0.3 3.45 5.76 1574 13CountryValueSurvey Leisure 1980:96 continued from table 1.2.1b (question changed from 4-step to 5 step in 1992) 1992/5 S11a 9.3 59.9 2.9 21.0 6.3 0.5 3.45 6.13 Life-in-Nation Survey EPA 13-10-1994 1993/5 S11a 10.3 59.5 2.6 20.9 6.4 0.4 3.47 6.18 Life-in-Nation Survey EPA 13-10-1995 1994/5 S11a 8.3 59.0 3.3 23.3 7.7 0.4 3.35 5.96 Life-of-Nation Survey EPA 13-10-1995 Korea1 (South) 1979/9 S8 2 37 50 10 2 0.5 3.27 5.46 997 13CountryValueSurvey Leisure 1980:96 Philippines 1979/10 S8 18 59 19 3 1 0.1 3.90 6.60 996 13CountryValueSurvey Leisure 1980:96 Singapore 1979/9 S8 28 63 7 2 0.2 4.17 7.12 1006 13CountryValueSurvey Leisure 1980:96 AUSTRALIA Australia 1979/9 S8 35 54 7 3 1 0.2 4.19 7.24 1104 13CountryValueSurvey Leisure 1980:96
Happiness in Nations IITable 1.2.1. c
56 Representive Nation Samples
EUROPE Austria 1984 S11 23 44 28 4 1 - 3.84 6.87 1776 Schulz 1985:164 1989 S11 22 48 26 4 1 - 3.85 6.85 2000 Grundlagen Kultur Ifes Data archive 1989 S11 27 49 21 3 1 - 3.97 7.04 2000 WohnenInOesterreich Ifes Data archive Belgium 1991 S9a ?? ?? ?? ?? ?? ?? ?? ?? 1439 IMRC Saris 1996 ?? Britain (Great)2 1979/9 S8 42 50 5 3 1 0.4 4.28 7.46 987 13CountryValueSurvey Leisure 1980:96 France 1979/9 S8 14 54 29 3 1 0.5 3.76 6.35 993 13CountryValueSurvey Leisure 1980:96 Germany (West) 1979/10 S8 17 59 19 3 1 2.1 3.89 6.57 1020 13CountryValueSurvey Leisure 1980:96 Italy 1979/10 S8 8 25 8 2 1 3.84 6.50 1042 13CountryValueSurvey Leisure 1980:96 1991 IRMCS Netherlands 1974 S10 8 29 43 13 6 1 3.20 8.26 4648 LifeSituationSurvey Jol 1981:72 1977 S10 9 26 45 13 7 1 3.17 8.20 3983 LifeSituationSurvey Jol 1981:72 1980 S10 11 30 41 11 6 1.0 3.29 8.34 2865 LifeSituationSurvey Jol 1981:72 1983 S10 7 27 47 14 5 0.2 3.17 8.27 3998 LifeSituationSurvey CBSdatafile2.4.92 1986 S10 9 30 44 12 5 0.2 3.26 8.35 4040 LifeSituationSurvey CBSdatafile2.4.92 1989 S10 17 36 33 10 5 0.1 3.50 8.52 2967 LifeSituationSurvey CBSdatafile2.4.92 1990 S10 8 33 45 11 3 - 3.32 8.50 1612 LifeSituationSurvey Saris 1996 ?? 1991 S9a 15 74 10 1 0 * 4.03 8.22 1599 IRMCS Scherpenz. 1992:4 Norway 1991 S9a 48 44 6 2 4.38 8.78 955 IRMCS Saris 1996 ?? Russia 1991/5+6 S9a 5 39 43 11 2 3.34 6.37 10. 962 IRMCS Saris 1996 ?? Slovenia/1 1991 S9a ?? ?? ?? ?? ?? ?? ?? 2050 IRMCS
Happiness in Nations IITable 1.2.1. c
57 Representive Nation Samples
LATIN-AMERICA Brazil1 1979/10 S8 36 38 18 5 2 2.4 4.02 7.01 1000 13CountryValueSurvey Leisure 1980:96 REMARKS 1. Question wordings S8 Overall, how satisfied are youwith your present life? ! very satisfied ! fairly satisfied ! neither satisfied nor dissatisfied ! fairly dissatisfied ! very dissatisfied ! DK/NA S9 Taking all things together, how satisfied are you with your life as a whole these days? On the whole would you say you are: ! very satisfied ! satisfied ! neither satisfied nor dissatisfied ! dissatisfied ! very dissatisfied ! DK/NK
Happiness in Nations IITable 1.2.1. c
58 Representive Nation Samples
S9a satisfied and not satisfied S10 How satisfied are you with the life you currently lead: ! extraordinary satisfied ! very satisfied ! satisfied ! fairly satisfied ! not so satisfied S11 When you consider your present life all lin all, are you: ! very satisfied ! fairly satisfied ! more or less satisfied ! more or less dissatisfied ! fairly dissatisfied S11a On the whole, are you: o fully satisfied o not fully satisfied but generally o neither satisfied nor dissatisfied o still dissatisfied o extremely dissatisfied? 2. Regions: Samples in India, Brazil and South Korea concern metropolitan areas only. Britain (Great) also referred to as "United Kingdom". It involves England, Scotland, Wales and Northern Ireland. 3. Means Means 1-5 were calculated by attributing: - 1 point to 'very dissatisfied' - 2 points to 'fairly dissatisfied' - 3 points to 'neither satisfied nor dissatisfied' - 4 points to 'fairly satisfied'
Happiness in Nations IITable 1.2.1. c
59 Representive Nation Samples
- 5 points to 'very satisfied' Means (0-10) were calculated by us. Experts rated the value of the various response categories on a scale ranging from 0 (most negative) to 10 (most
positive). This procedure is described in more detail in chapter 7/3.3.2. The average ratings were as follows: - extraordinary satisfied 9.5* - very satisfied 9.3 - satisfied 8.5 - fairly satisfied 6.5 - more or less satisfied 6.0* - neither satisfied nor dissatisfied, satisfied and dissatisfied 5.1* - more or less dissatisfied 4.0* - not very satisfied 3.7 - not so satisfied 3.7* - fairly dissatisfied 3.4 - dissatisfied, not satisfied 2.9 - very dissatisfied 1.7 The response categories marked with * did not figure in the expert-rating procedure described here. These values were estimated afterwards by us. 4. Sources The 13-country Survey of Values was coordinated by the Leisure Development Centre, Tokyo, Japan. The results are reported in the proceedings of
the International Conference on Human Values in Tokyo 1980. This 13-country study is not to be confused with the World Value Study (initially named European Value Study).
Ifes: Institut für Empirische sozialforschung, Vienna, Austria IRMCS: International Researchgroup on Methodology and Comparative Research (University of Amsterdam, Netherlands)
EPA: Economic Planning Agency (Japan). Data provided on request 13-10-1994.
Happiness in Nations IITable 1.2.1. c
60 Representive Nation Samples
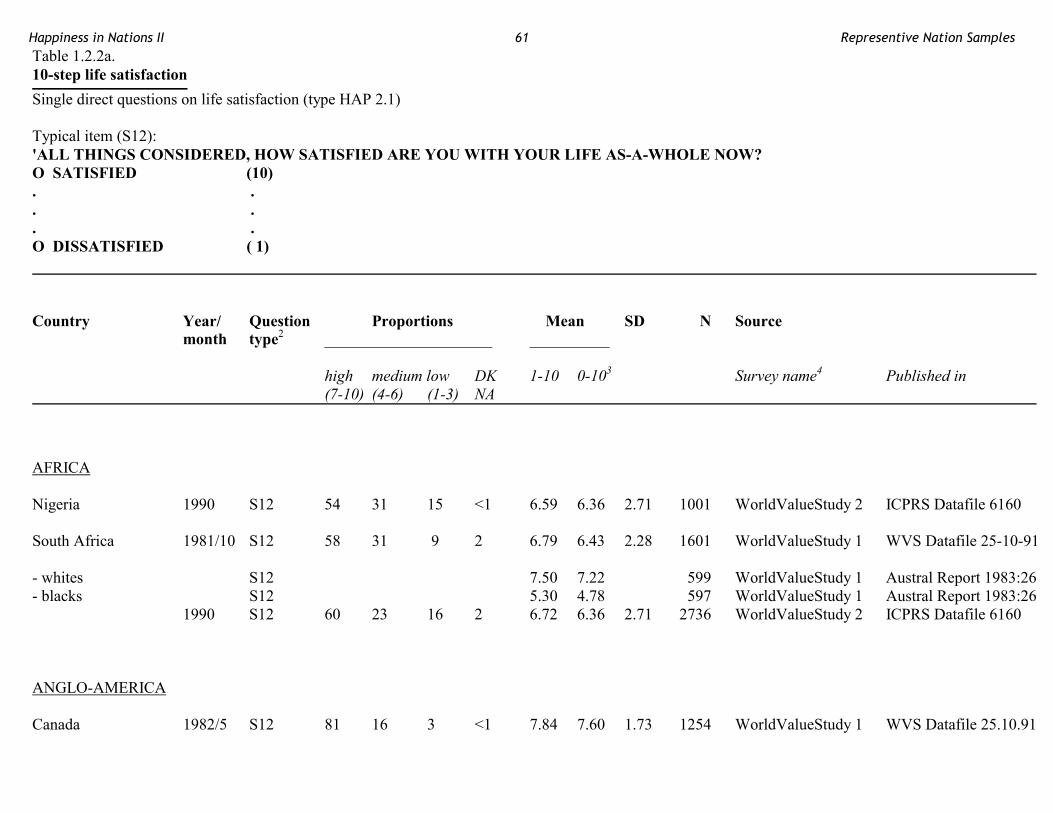
Table 1.2.2a. 10-step life satisfaction Single direct questions on life satisfaction (type HAP 2.1) Typical item (S12): 'ALL THINGS CONSIDERED, HOW SATISFIED ARE YOU WITH YOUR LIFE AS-A-WHOLE NOW? O SATISFIED (10) . . . . . . O DISSATISFIED ( 1) Country Year/ Question Proportions Mean SD N Source month type2 _____________________ __________ high medium low DK 1-10 0-103 Survey name4 Published in (7-10) (4-6) (1-3) NA AFRICA Nigeria 1990 S12 54 31 15 <1 6.59 6.36 2.71 1001 WorldValueStudy 2 ICPRS Datafile 6160 South Africa 1981/10 S12 58 31 9 2 6.79 6.43 2.28 1601 WorldValueStudy 1 WVS Datafile 25-10-91 - whites S12 7.50 7.22 599 WorldValueStudy 1 Austral Report 1983:26- blacks S12 5.30 4.78 597 WorldValueStudy 1 Austral Report 1983:26 1990 S12 60 23 16 2 6.72 6.36 2.71 2736 WorldValueStudy 2 ICPRS Datafile 6160 ANGLO-AMERICA Canada 1982/5 S12 81 16 3 <1 7.84 7.60 1.73 1254 WorldValueStudy 1 WVS Datafile 25.10.91
Happiness in Nations II 61 Representive Nation Samples
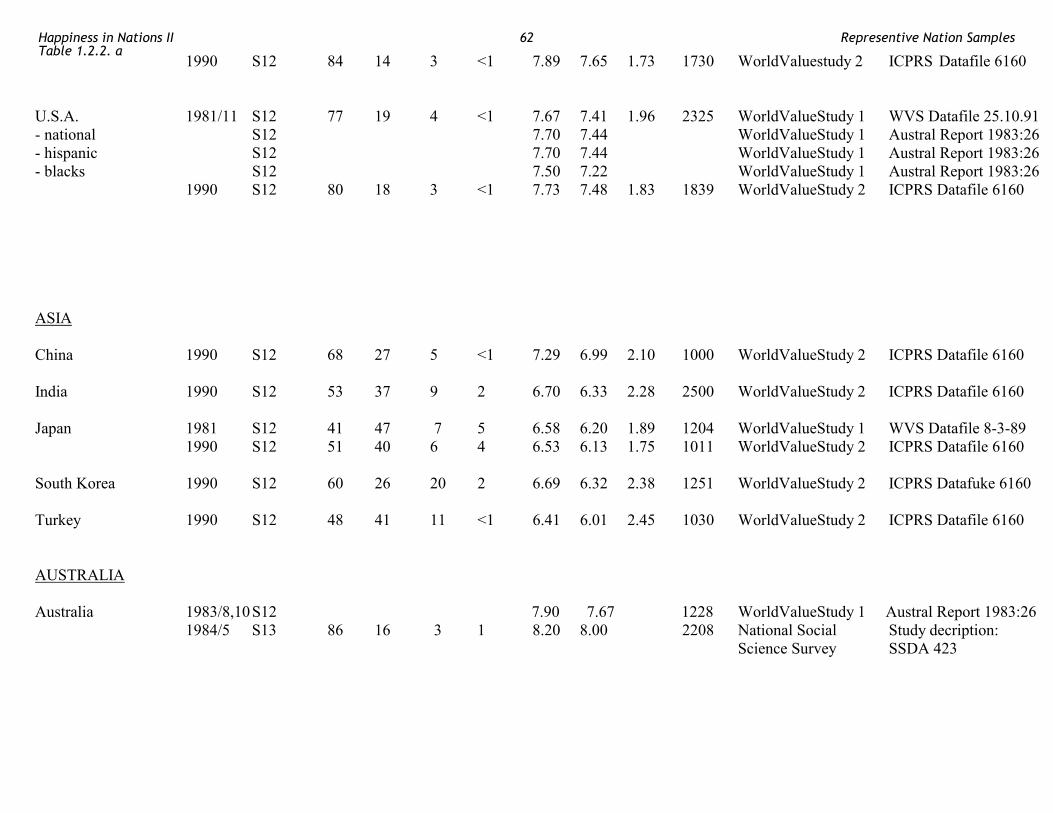
1990 S12 84 14 3 <1 7.89 7.65 1.73 1730 WorldValuestudy 2 ICPRS Datafile 6160
U.S.A. 1981/11 S12 77 19 4 <1 7.67 7.41 1.96 2325 WorldValueStudy 1 WVS Datafile 25.10.91- national S12 7.70 7.44 WorldValueStudy 1 Austral Report 1983:26- hispanic S12 7.70 7.44 WorldValueStudy 1 Austral Report 1983:26- blacks S12 7.50 7.22 WorldValueStudy 1 Austral Report 1983:26 1990 S12 80 18 3 <1 7.73 7.48 1.83 1839 WorldValueStudy 2 ICPRS Datafile 6160 ASIA China 1990 S12 68 27 5 <1 7.29 6.99 2.10 1000 WorldValueStudy 2 ICPRS Datafile 6160 India 1990 S12 53 37 9 2 6.70 6.33 2.28 2500 WorldValueStudy 2 ICPRS Datafile 6160 Japan 1981 S12 41 47 7 5 6.58 6.20 1.89 1204 WorldValueStudy 1 WVS Datafile 8-3-89 1990 S12 51 40 6 4 6.53 6.13 1.75 1011 WorldValueStudy 2 ICPRS Datafile 6160 South Korea 1990 S12 60 26 20 2 6.69 6.32 2.38 1251 WorldValueStudy 2 ICPRS Datafuke 6160 Turkey 1990 S12 48 41 11 <1 6.41 6.01 2.45 1030 WorldValueStudy 2 ICPRS Datafile 6160 AUSTRALIA Australia 1983/8,10 S12 7.90 7.67 1228 WorldValueStudy 1 Austral Report 1983:26 1984/5 S13 86 16 3 1 8.20 8.00 2208 National Social Study decription: Science Survey SSDA 423
Happiness in Nations IITable 1.2.2. a
62 Representive Nation Samples
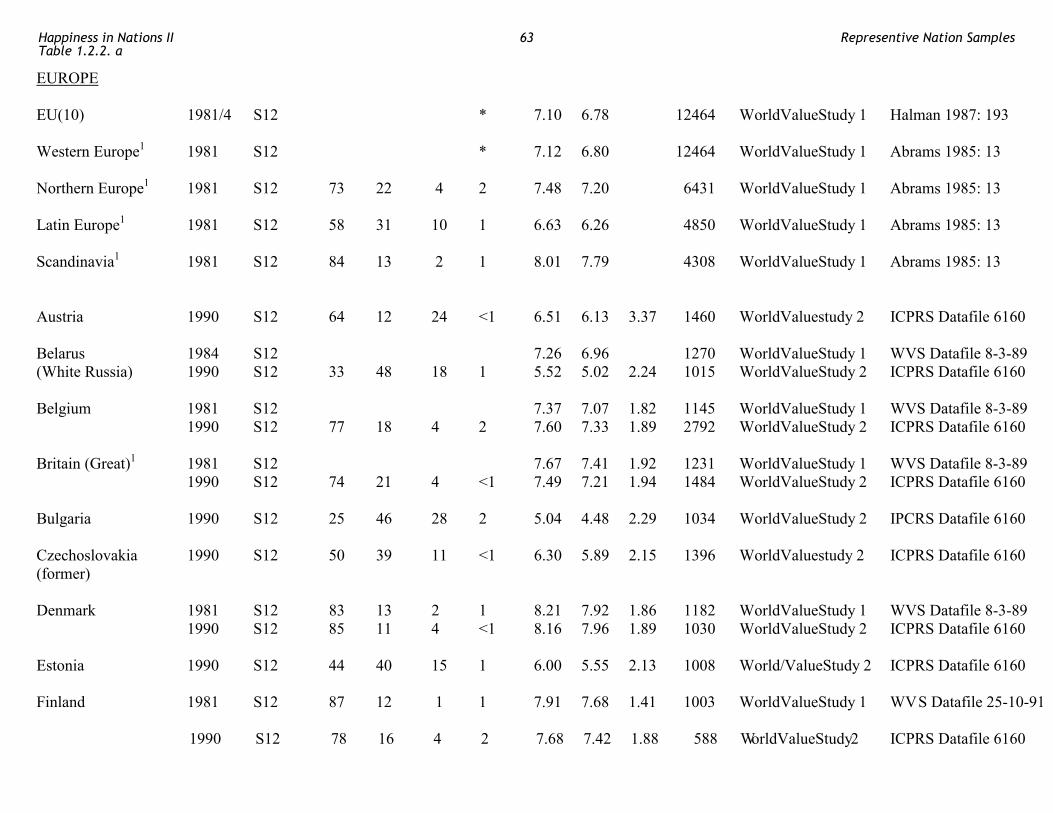
EUROPE EU(10) 1981/4 S12 * 7.10 6.78 12464 WorldValueStudy 1 Halman 1987: 193 Western Europe1 1981 S12 * 7.12 6.80 12464 WorldValueStudy 1 Abrams 1985: 13 Northern Europe1 1981 S12 73 22 4 2 7.48 7.20 6431 WorldValueStudy 1 Abrams 1985: 13 Latin Europe1 1981 S12 58 31 10 1 6.63 6.26 4850 WorldValueStudy 1 Abrams 1985: 13 Scandinavia1 1981 S12 84 13 2 1 8.01 7.79 4308 WorldValueStudy 1 Abrams 1985: 13 Austria 1990 S12 64 12 24 <1 6.51 6.13 3.37 1460 WorldValuestudy 2 ICPRS Datafile 6160 Belarus 1984 S12 7.26 6.96 1270 WorldValueStudy 1 WVS Datafile 8-3-89 (White Russia) 1990 S12 33 48 18 1 5.52 5.02 2.24 1015 WorldValueStudy 2 ICPRS Datafile 6160 Belgium 1981 S12 7.37 7.07 1.82 1145 WorldValueStudy 1 WVS Datafile 8-3-89 1990 S12 77 18 4 2 7.60 7.33 1.89 2792 WorldValueStudy 2 ICPRS Datafile 6160 Britain (Great)1 1981 S12 7.67 7.41 1.92 1231 WorldValueStudy 1 WVS Datafile 8-3-89 1990 S12 74 21 4 <1 7.49 7.21 1.94 1484 WorldValueStudy 2 ICPRS Datafile 6160 Bulgaria 1990 S12 25 46 28 2 5.04 4.48 2.29 1034 WorldValueStudy 2 IPCRS Datafile 6160 Czechoslovakia 1990 S12 50 39 11 <1 6.30 5.89 2.15 1396 WorldValuestudy 2 ICPRS Datafile 6160 (former) Denmark 1981 S12 83 13 2 1 8.21 7.92 1.86 1182 WorldValueStudy 1 WVS Datafile 8-3-89 1990 S12 85 11 4 <1 8.16 7.96 1.89 1030 WorldValueStudy 2 ICPRS Datafile 6160 Estonia 1990 S12 44 40 15 1 6.00 5.55 2.13 1008 World/ValueStudy 2 ICPRS Datafile 6160 Finland 1981 S12 87 12 1 1 7.91 7.68 1.41 1003 WorldValueStudy 1 WVS Datafile 25-10-91
1990 S12 78 16 4 2 7.68 7.42 1.88 588 WorldValueStudy 2 ICPRS Datafile 6160
Happiness in Nations IITable 1.2.2. a
63 Representive Nation Samples
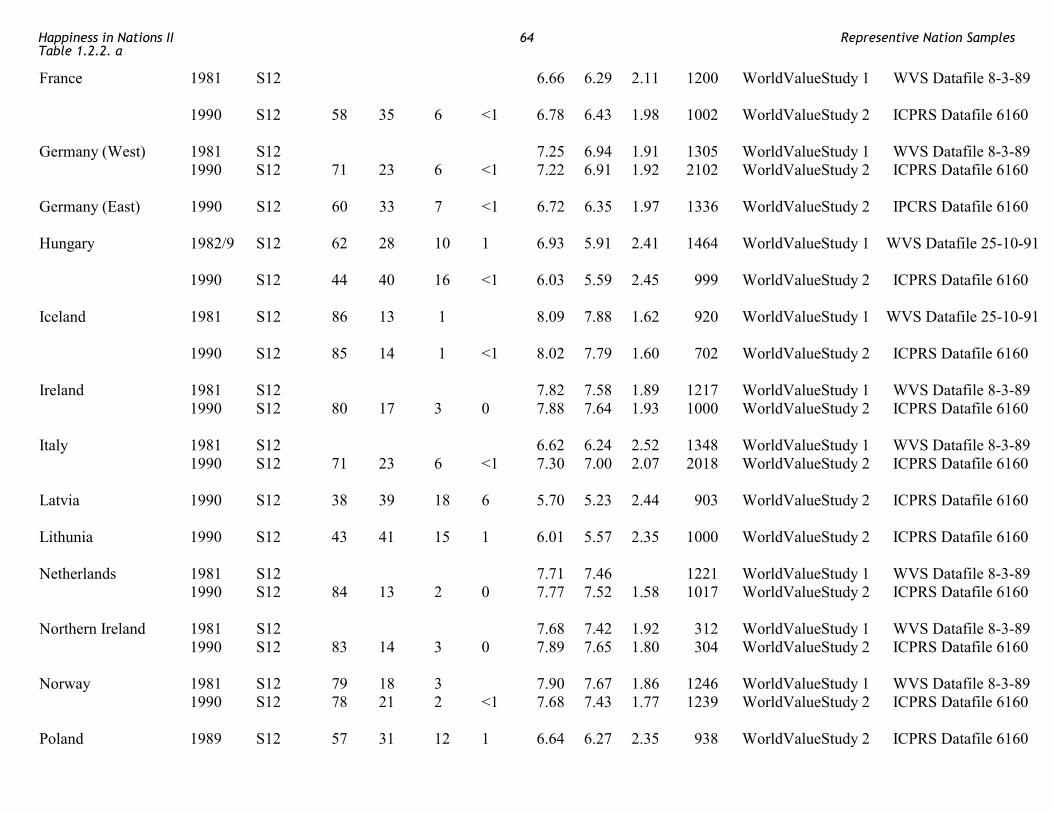
France 1981 S12 6.66 6.29 2.11 1200 WorldValueStudy 1 WVS Datafile 8-3-89 1990 S12 58 35 6 <1 6.78 6.43 1.98 1002 WorldValueStudy 2 ICPRS Datafile 6160 Germany (West) 1981 S12 7.25 6.94 1.91 1305 WorldValueStudy 1 WVS Datafile 8-3-89 1990 S12 71 23 6 <1 7.22 6.91 1.92 2102 WorldValueStudy 2 ICPRS Datafile 6160 Germany (East) 1990 S12 60 33 7 <1 6.72 6.35 1.97 1336 WorldValueStudy 2 IPCRS Datafile 6160 Hungary 1982/9 S12 62 28 10 1 6.93 5.91 2.41 1464 WorldValueStudy 1 WVS Datafile 25-10-91
1990 S12 44 40 16 <1 6.03 5.59 2.45 999 WorldValueStudy 2 ICPRS Datafile 6160 Iceland 1981 S12 86 13 1 8.09 7.88 1.62 920 WorldValueStudy 1 WVS Datafile 25-10-91 1990 S12 85 14 1 <1 8.02 7.79 1.60 702 WorldValueStudy 2 ICPRS Datafile 6160 Ireland 1981 S12 7.82 7.58 1.89 1217 WorldValueStudy 1 WVS Datafile 8-3-89 1990 S12 80 17 3 0 7.88 7.64 1.93 1000 WorldValueStudy 2 ICPRS Datafile 6160 Italy 1981 S12 6.62 6.24 2.52 1348 WorldValueStudy 1 WVS Datafile 8-3-89 1990 S12 71 23 6 <1 7.30 7.00 2.07 2018 WorldValueStudy 2 ICPRS Datafile 6160 Latvia 1990 S12 38 39 18 6 5.70 5.23 2.44 903 WorldValueStudy 2 ICPRS Datafile 6160 Lithunia 1990 S12 43 41 15 1 6.01 5.57 2.35 1000 WorldValueStudy 2 ICPRS Datafile 6160 Netherlands 1981 S12 7.71 7.46 1221 WorldValueStudy 1 WVS Datafile 8-3-89 1990 S12 84 13 2 0 7.77 7.52 1.58 1017 WorldValueStudy 2 ICPRS Datafile 6160 Northern Ireland 1981 S12 7.68 7.42 1.92 312 WorldValueStudy 1 WVS Datafile 8-3-89 1990 S12 83 14 3 0 7.89 7.65 1.80 304 WorldValueStudy 2 ICPRS Datafile 6160 Norway 1981 S12 79 18 3 7.90 7.67 1.86 1246 WorldValueStudy 1 WVS Datafile 8-3-89 1990 S12 78 21 2 <1 7.68 7.43 1.77 1239 WorldValueStudy 2 ICPRS Datafile 6160 Poland 1989 S12 57 31 12 1 6.64 6.27 2.35 938 WorldValueStudy 2 ICPRS Datafile 6160
Happiness in Nations IITable 1.2.2. a
64 Representive Nation Samples
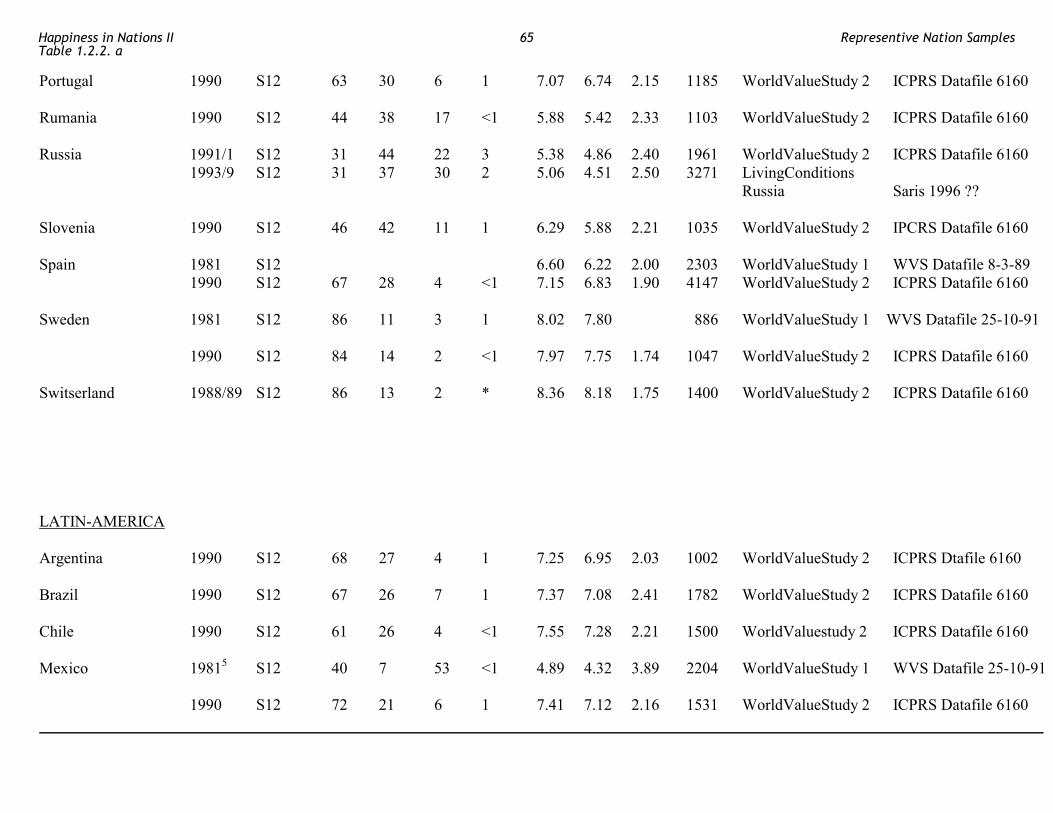
Portugal 1990 S12 63 30 6 1 7.07 6.74 2.15 1185 WorldValueStudy 2 ICPRS Datafile 6160 Rumania 1990 S12 44 38 17 <1 5.88 5.42 2.33 1103 WorldValueStudy 2 ICPRS Datafile 6160 Russia 1991/1 S12 31 44 22 3 5.38 4.86 2.40 1961 WorldValueStudy 2 ICPRS Datafile 6160 1993/9 S12 31 37 30 2 5.06 4.51 2.50 3271 LivingConditions Russia Saris 1996 ?? Slovenia 1990 S12 46 42 11 1 6.29 5.88 2.21 1035 WorldValueStudy 2 IPCRS Datafile 6160 Spain 1981 S12 6.60 6.22 2.00 2303 WorldValueStudy 1 WVS Datafile 8-3-89 1990 S12 67 28 4 <1 7.15 6.83 1.90 4147 WorldValueStudy 2 ICPRS Datafile 6160 Sweden 1981 S12 86 11 3 1 8.02 7.80 886 WorldValueStudy 1 WVS Datafile 25-10-91
1990 S12 84 14 2 <1 7.97 7.75 1.74 1047 WorldValueStudy 2 ICPRS Datafile 6160 Switserland 1988/89 S12 86 13 2 * 8.36 8.18 1.75 1400 WorldValueStudy 2 ICPRS Datafile 6160 LATIN-AMERICA Argentina 1990 S12 68 27 4 1 7.25 6.95 2.03 1002 WorldValueStudy 2 ICPRS Dtafile 6160 Brazil 1990 S12 67 26 7 1 7.37 7.08 2.41 1782 WorldValueStudy 2 ICPRS Datafile 6160 Chile 1990 S12 61 26 4 <1 7.55 7.28 2.21 1500 WorldValuestudy 2 ICPRS Datafile 6160 Mexico 19815 S12 40 7 53 <1 4.89 4.32 3.89 2204 WorldValueStudy 1 WVS Datafile 25-10-91 1990 S12 72 21 6 1 7.41 7.12 2.16 1531 WorldValueStudy 2 ICPRS Datafile 6160
Happiness in Nations IITable 1.2.2. a
65 Representive Nation Samples
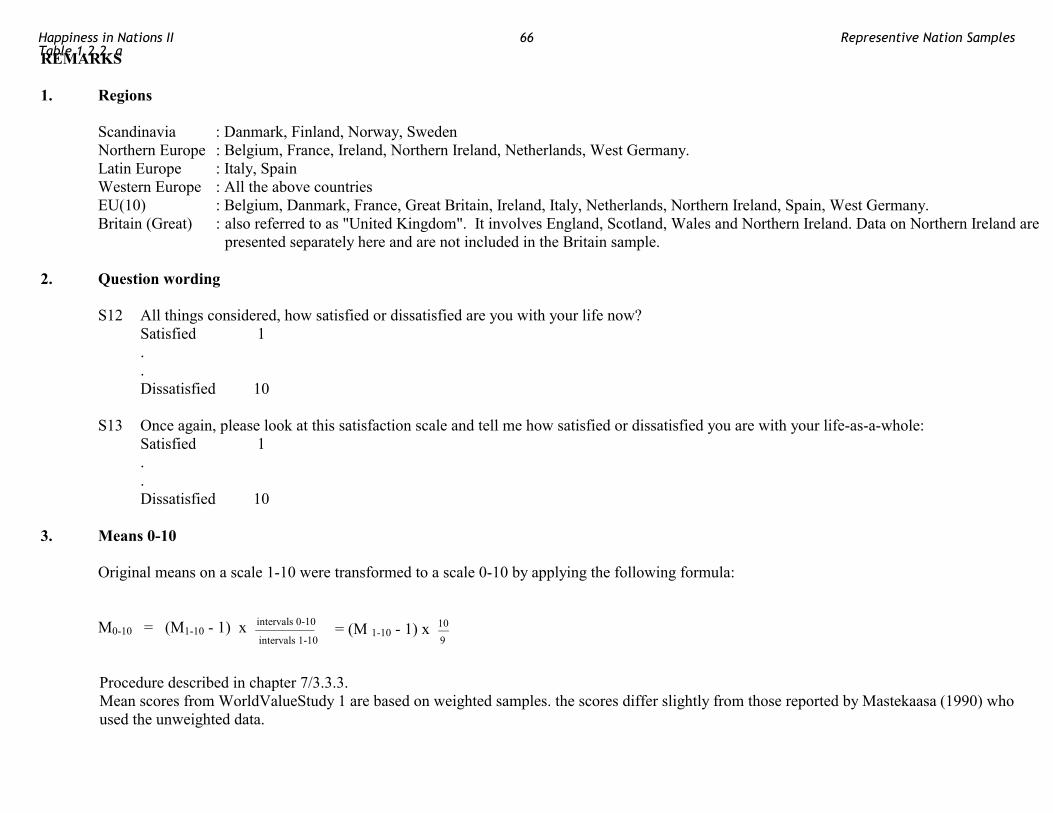
REMARKS 1. Regions Scandinavia : Danmark, Finland, Norway, Sweden Northern Europe : Belgium, France, Ireland, Northern Ireland, Netherlands, West Germany. Latin Europe : Italy, Spain Western Europe : All the above countries EU(10) : Belgium, Danmark, France, Great Britain, Ireland, Italy, Netherlands, Northern Ireland, Spain, West Germany. Britain (Great) : also referred to as "United Kingdom". It involves England, Scotland, Wales and Northern Ireland. Data on Northern Ireland are
presented separately here and are not included in the Britain sample. 2. Question wording S12 All things considered, how satisfied or dissatisfied are you with your life now? Satisfied 1 . . Dissatisfied 10 S13 Once again, please look at this satisfaction scale and tell me how satisfied or dissatisfied you are with your life-as-a-whole: Satisfied 1 . . Dissatisfied 10 3. Means 0-10 Original means on a scale 1-10 were transformed to a scale 0-10 by applying the following formula: M0-10 = (M1-10 - 1) x intervals 0-10 = (M 1-10 - 1) x 10 intervals 1-10 9 Procedure described in chapter 7/3.3.3. Mean scores from WorldValueStudy 1 are based on weighted samples. the scores differ slightly from those reported by Mastekaasa (1990) who
used the unweighted data.
Happiness in Nations IITable 1.2.2. a
66 Representive Nation Samples
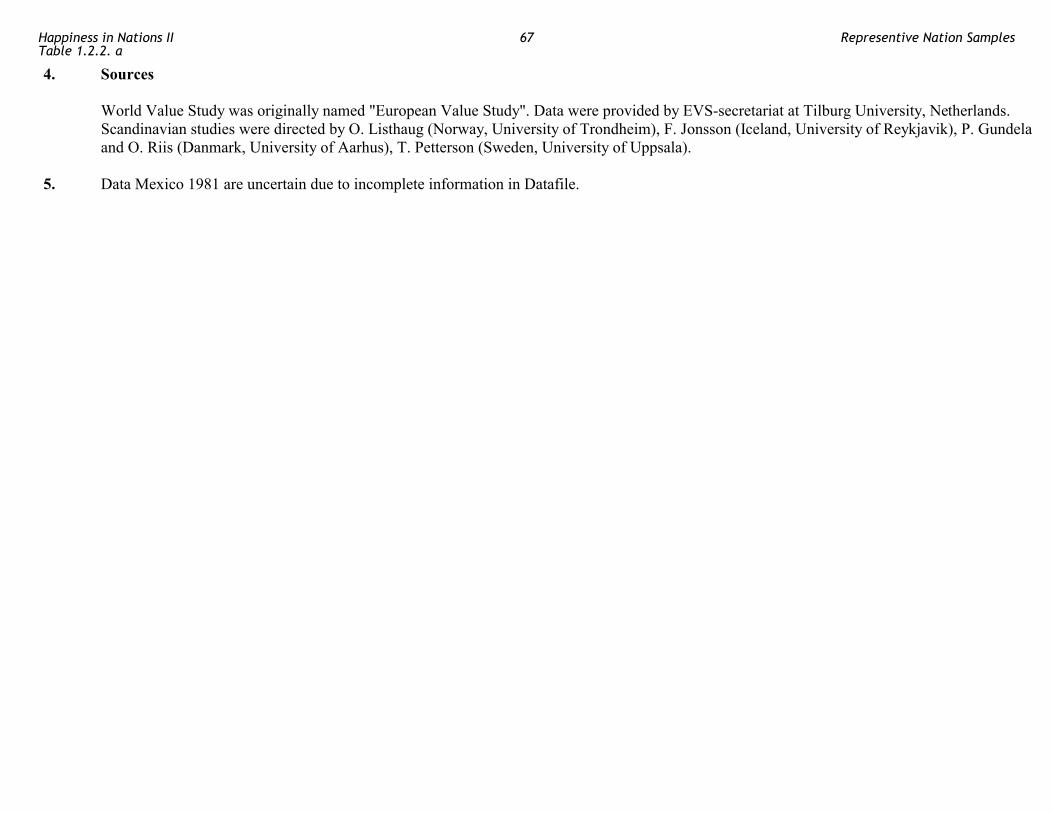
4. Sources World Value Study was originally named "European Value Study". Data were provided by EVS-secretariat at Tilburg University, Netherlands.
Scandinavian studies were directed by O. Listhaug (Norway, University of Trondheim), F. Jonsson (Iceland, University of Reykjavik), P. Gundela and O. Riis (Danmark, University of Aarhus), T. Petterson (Sweden, University of Uppsala).
5. Data Mexico 1981 are uncertain due to incomplete information in Datafile.
Happiness in Nations IITable 1.2.2. a
67 Representive Nation Samples
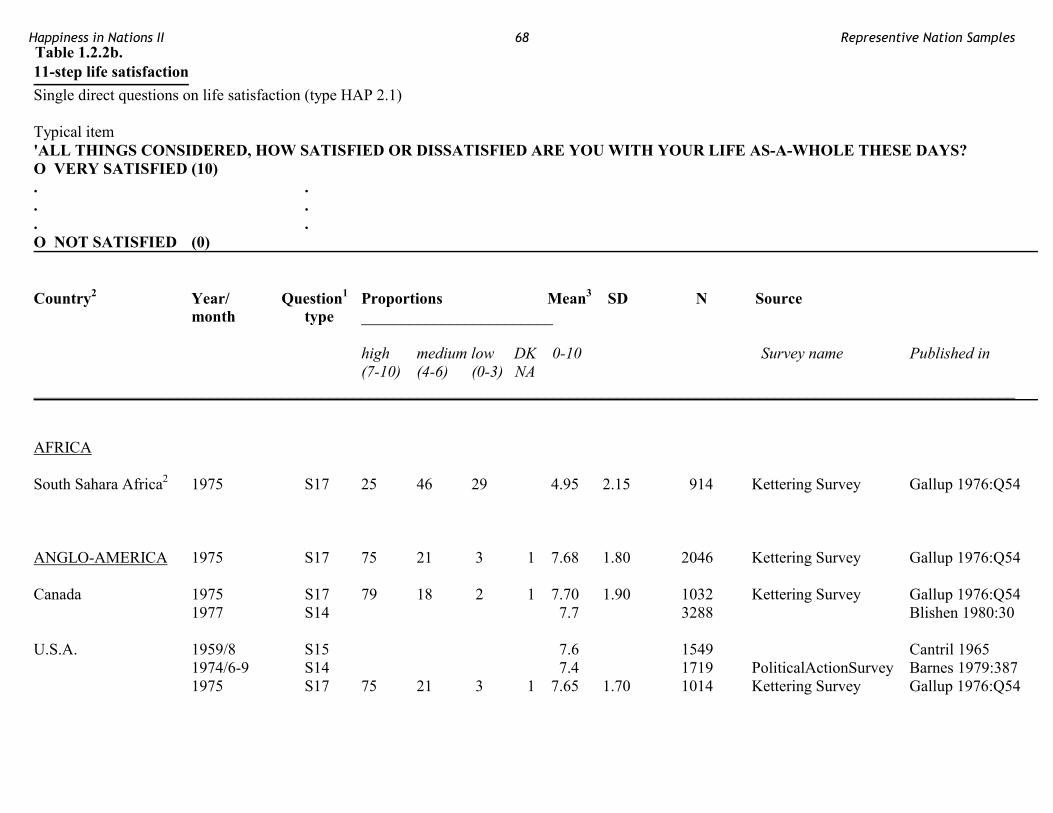
11-step life satisfaction Single direct questions on life satisfaction (type HAP 2.1) Typical item 'ALL THINGS CONSIDERED, HOW SATISFIED OR DISSATISFIED ARE YOU WITH YOUR LIFE AS-A-WHOLE THESE DAYS? O VERY SATISFIED (10) . . . . . . O NOT SATISFIED (0)
Country2 Year/ Question1 Proportions Mean3 SD N Source month type ________________________ high medium low DK 0-10 Survey name Published in (7-10) (4-6) (0-3) NA ___________________________________________________________________________________________________________________________ AFRICA South Sahara Africa2 1975 S17 25 46 29 4.95 2.15 914 Kettering Survey Gallup 1976:Q54 ANGLO-AMERICA 1975 S17 75 21 3 1 7.68 1.80 2046 Kettering Survey Gallup 1976:Q54 Canada 1975 S17 79 18 2 1 7.70 1.90 1032 Kettering Survey Gallup 1976:Q54 1977 S14 7.7 3288 Blishen 1980:30 U.S.A. 1959/8 S15 7.6 1549 Cantril 1965 1974/6-9 S14 7.4 1719 PoliticalActionSurvey Barnes 1979:387 1975 S17 75 21 3 1 7.65 1.70 1014 Kettering Survey Gallup 1976:Q54
Table 1.2.2b. Happiness in Nations II 68 Representive Nation Samples
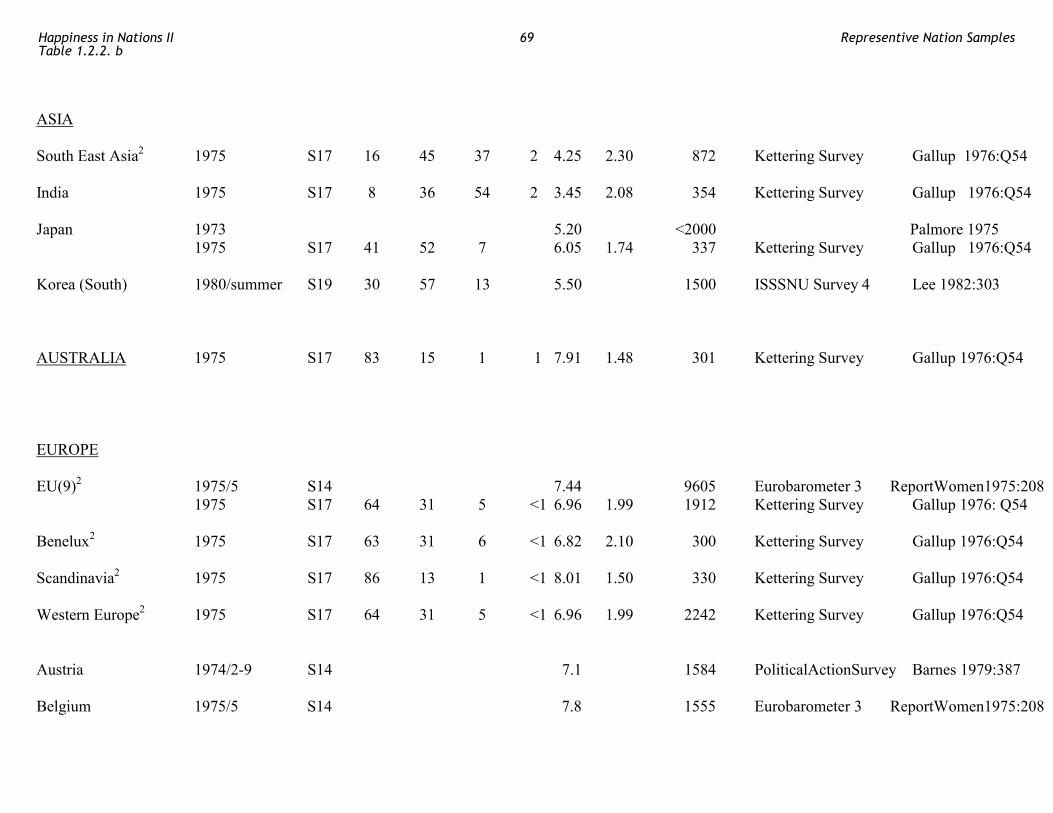
ASIA South East Asia2 1975 S17 16 45 37 2 4.25 2.30 872 Kettering Survey Gallup 1976:Q54 India 1975 S17 8 36 54 2 3.45 2.08 354 Kettering Survey Gallup 1976:Q54 Japan 1973 5.20 <2000 Palmore 1975 1975 S17 41 52 7 6.05 1.74 337 Kettering Survey Gallup 1976:Q54 Korea (South) 1980/summer S19 30 57 13 5.50 1500 ISSSNU Survey 4 Lee 1982:303 AUSTRALIA 1975 S17 83 15 1 1 7.91 1.48 301 Kettering Survey Gallup 1976:Q54 EUROPE EU(9)2 1975/5 S14 7.44 9605 Eurobarometer 3 ReportWomen1975:208 1975 S17 64 31 5 <1 6.96 1.99 1912 Kettering Survey Gallup 1976: Q54 Benelux2 1975 S17 63 31 6 <1 6.82 2.10 300 Kettering Survey Gallup 1976:Q54 Scandinavia2 1975 S17 86 13 1 <1 8.01 1.50 330 Kettering Survey Gallup 1976:Q54 Western Europe2 1975 S17 64 31 5 <1 6.96 1.99 2242 Kettering Survey Gallup 1976:Q54 Austria 1974/2-9 S14 7.1 1584 PoliticalActionSurvey Barnes 1979:387 Belgium 1975/5 S14 7.8 1555 Eurobarometer 3 ReportWomen1975:208
Happiness in Nations IITable 1.2.2. b
69 Representive Nation Samples

1989/fall S20 82 12 2 8.01 1439 IRMCS Saris?? Britain (Great)2 1971/3 S14 24 27 29 20 5.5 213 Abrams 1973:3 1974 S15 7.3 PoliticalAction Inglehart 1985:12 1975 S15 58 29 13 0 7.53 1.62 307 Kettering Survey Gallup 1976:Q54 1975/5 S14 74 26 7.5 1317 Eurobarometer 3 ReportWomen1975:208 1983 S14 7.6 1348 Eurobarometer 19 Inglehart 1985:12 Denmark 1975/5 S14 8.3 1039 Eurobarometer 3 ReportWomen1975:208 1983 S14 7.8 1027 Eurobarometer 19 Inglehart 1985:12 Finland 1976 S14 7.6 PoliticalAction Inglehart 1985:12 France 1975 S17 57 37 5 1 6.61 1.87 330 Kettering Survey Gallup 1976:Q54 1975/5 S14 6.7 1196 Eurobarometer 3 ReportWomen1975:208 1983 S14 6.6 1011 Eurobarometer 19 Inglehart 1985:12 Germany (West) 1974/2-5 S14 7.15 2307 PoliticalAction Barnes 1979:387 1975 S15 71 27 2 7.36 1.69 303 Kettering Survey Gallup 1976:Q54 1975/5 S14 7.0 1039 Eurobarometer 3 ReportWomen1975:208 1978 S18 78 18 3 1 7.73 1.88 2012 WohlfahrtsSurvey 1 File 4-18-1994 1980 S18 77 20 3 7.62 1.87 2417 WohlfahrtsSurvey 2 File 4-18-1994 1983 S14 7.5 1049 Eurobarometer 19 Inglehart 1985:12 1984 S18 80 15 4 1.2 7.73 1.93 2067 WohlfahrtsSurvey 3 File 4-18-1994 1988 S18 83 14 3 0.4 7.85 1.74 2144 WohlfahrtsSurvey 4 File 4-18-1994 1993 S18 84 14 2 0.1 7.85 1.60 2046 WohlfahrtsSurvey 5 File 4-18-1994 1984 S18 72 22 5 <1 7.4 12245 SOcioEconomicPanel SOEPDatafile26.11.92 1985 S18 70 24 5 <1 7.2 11090 SOcioEconomicPanel SOEPDatafile26.11.92 1986 S18 72 23 4 <1 7.3 10646 SOcioEconomicPanel SOEPDatafile26.11.92 OEP 1987 S18 69 25 5 <1 7.1 10516 SOcioEconomicPanel SOEPDatafile26.11.92
1983 S14 7.3 1038 Eurobarometer 19 Inglehart 1985:12
Happiness in Nations IITable 1.2.2. b
70 Representive Nation Samples
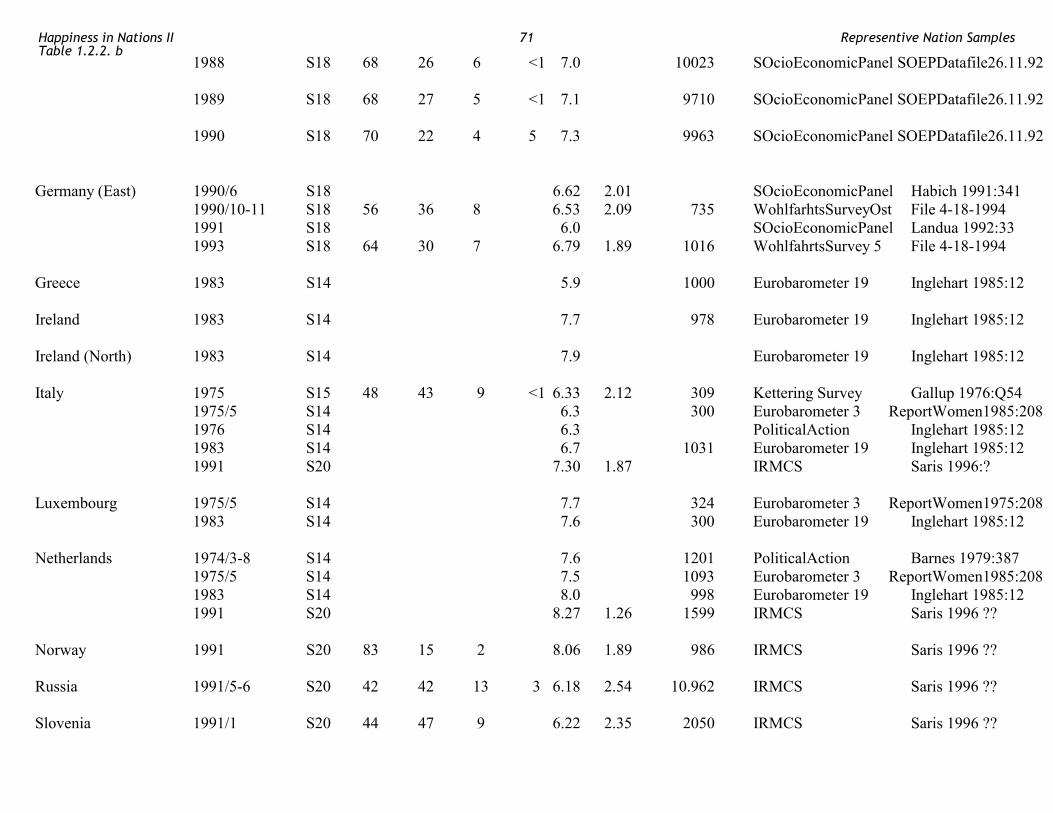
1988 S18 68 26 6 <1 7.0 10023 SOcioEconomicPanel SOEPDatafile26.11.92 1989 S18 68 27 5 <1 7.1 9710 SOcioEconomicPanel SOEPDatafile26.11.92
1990 S18 70 22 4 5 7.3 9963 SOcioEconomicPanel SOEPDatafile26.11.92 Germany (East) 1990/6 S18 6.62 2.01 SOcioEconomicPanel Habich 1991:341 1990/10-11 S18 56 36 8 6.53 2.09 735 WohlfarhtsSurveyOst File 4-18-1994 1991 S18 6.0 SOcioEconomicPanel Landua 1992:33 1993 S18 64 30 7 6.79 1.89 1016 WohlfahrtsSurvey 5 File 4-18-1994 Greece 1983 S14 5.9 1000 Eurobarometer 19 Inglehart 1985:12 Ireland 1983 S14 7.7 978 Eurobarometer 19 Inglehart 1985:12 Ireland (North) 1983 S14 7.9 Eurobarometer 19 Inglehart 1985:12 Italy 1975 S15 48 43 9 <1 6.33 2.12 309 Kettering Survey Gallup 1976:Q54 1975/5 S14 6.3 300 Eurobarometer 3 ReportWomen1985:208 1976 S14 6.3 PoliticalAction Inglehart 1985:12 1983 S14 6.7 1031 Eurobarometer 19 Inglehart 1985:12 1991 S20 7.30 1.87 IRMCS Saris 1996:? Luxembourg 1975/5 S14 7.7 324 Eurobarometer 3 ReportWomen1975:208 1983 S14 7.6 300 Eurobarometer 19 Inglehart 1985:12 Netherlands 1974/3-8 S14 7.6 1201 PoliticalAction Barnes 1979:387 1975/5 S14 7.5 1093 Eurobarometer 3 ReportWomen1985:208 1983 S14 8.0 998 Eurobarometer 19 Inglehart 1985:12 1991 S20 8.27 1.26 1599 IRMCS Saris 1996 ?? Norway 1991 S20 83 15 2 8.06 1.89 986 IRMCS Saris 1996 ?? Russia 1991/5-6 S20 42 42 13 3 6.18 2.54 10.962 IRMCS Saris 1996 ?? Slovenia 1991/1 S20 44 47 9 6.22 2.35 2050 IRMCS Saris 1996 ??
Happiness in Nations IITable 1.2.2. b
71 Representive Nation Samples
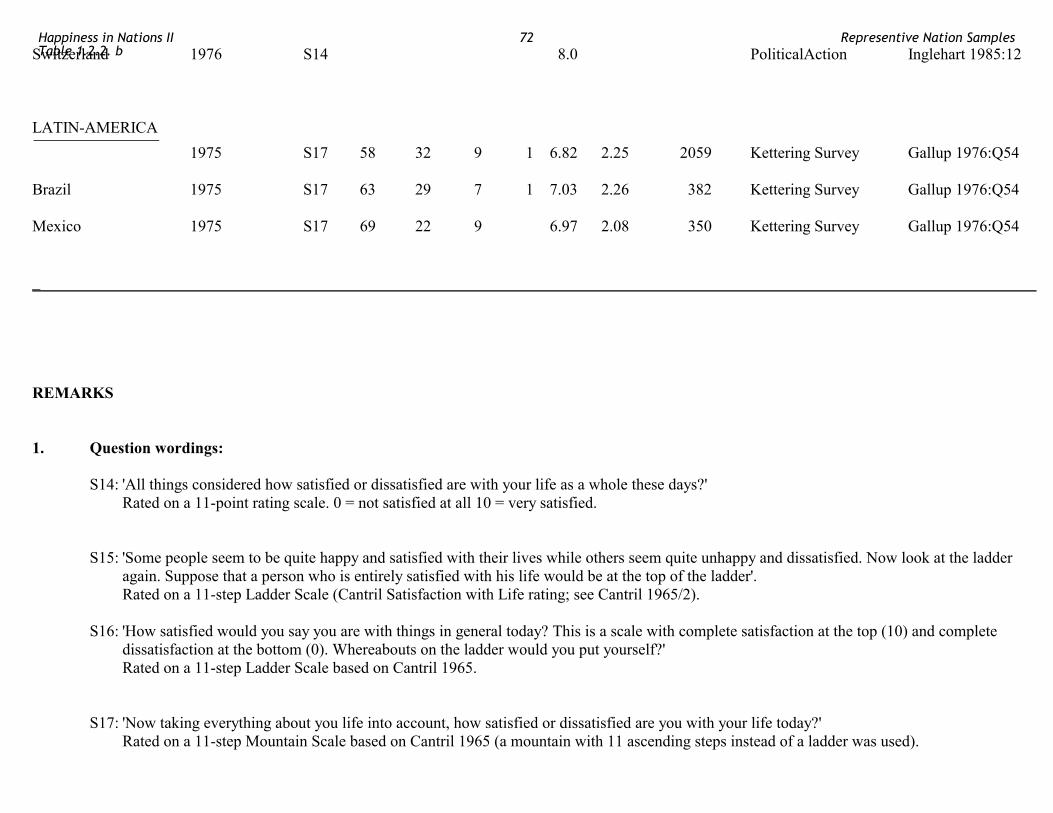
Switzerland 1976 S14 8.0 PoliticalAction Inglehart 1985:12 LATIN-AMERICA
1975 S17 58 32 9 1 6.82 2.25 2059 Kettering Survey Gallup 1976:Q54 Brazil 1975 S17 63 29 7 1 7.03 2.26 382 Kettering Survey Gallup 1976:Q54 Mexico 1975 S17 69 22 9 6.97 2.08 350 Kettering Survey Gallup 1976:Q54
_ REMARKS 1. Question wordings: S14: 'All things considered how satisfied or dissatisfied are with your life as a whole these days?' Rated on a 11-point rating scale. 0 = not satisfied at all 10 = very satisfied. S15: 'Some people seem to be quite happy and satisfied with their lives while others seem quite unhappy and dissatisfied. Now look at the ladder
again. Suppose that a person who is entirely satisfied with his life would be at the top of the ladder'. Rated on a 11-step Ladder Scale (Cantril Satisfaction with Life rating; see Cantril 1965/2). S16: 'How satisfied would you say you are with things in general today? This is a scale with complete satisfaction at the top (10) and complete
dissatisfaction at the bottom (0). Whereabouts on the ladder would you put yourself?' Rated on a 11-step Ladder Scale based on Cantril 1965. S17: 'Now taking everything about you life into account, how satisfied or dissatisfied are you with your life today?' Rated on a 11-step Mountain Scale based on Cantril 1965 (a mountain with 11 ascending steps instead of a ladder was used).
Happiness in Nations IITable 1.2.2. b
72 Representive Nation Samples

S18: 'Was meinen Sie, wie zufrieden sind Sie gegenwärtig -alles im allem- mit Ihren Leben? Bitte sagen Sie es anhand dieser Skalen. Wenn sie
zum Beispiel mit Ihrem Leben ganz und gar zufrieden sind, geben Sie bitte die "10" an. Wenn Sie mit Ihrem Leben ganz und gar unzufrieden sind, geben Sie die "0" an. Die Werten dazwischen verwenden Sie bitte, wenn Sie weder ganz und gar zufrieden noch ganz und gar unzufrieden sind.
S19: 'All in all, how satisfied would you say you are presently with your life? Rated on an 11-point scale ranging from 0 (very dissatisfied) to 10 (very satisfied). S20:'Altogether and considering all things in life which are important to you, and using a scale from 0 to 10, where 0 means that your life is going
very badly and 10 that your life is going very well, how would you say things are going currently?' Rated on an 11-point scale ranging from 0 (completely dissatisfied) to 10 (completely satisfied). 2. Regions: The data from the Kettering Survey (Gallup 1976: Q54) concern parts of the world rather than countries. - Anglo America : U.S.A, Canada; - Latin America : Brazil, Colombia, Mexico, Puerto Rico, Argentina, Peru, Venezuela, Chile, Ecuador, Guatemala, Bolivia, Uruguay, El
Salvador, Paraguay, Nicaragua; - Western Europe : France, Italy, United Kingdom, Western Germany, the Netherlands, Spain, Danmark, Switzerland, Finland, Belgium,
Sweden, Norway, Portugal, Greece, Austria, Ireland, Luxembourg; - Africa (Sub Sahara) : Nigeria, Tanzania, Kenya, South Africa, Uganda, Upper Volta, Mali, Malawi, Ivory Coast, Senegal, Rhodesia; - Asia : India, Japan, Indonesia, the Philippines, Thailand, South Korea, Rep. of China, Sri Lanka, Malaysia, Singapore; - Australia - Benelux : Belgium, Netherlands, Luxembourg - Scandinavia : Danmark, Finland, Norway, Sweden - Great Britain : the NIPO publications refer to 'England', Wessmann (1956) and Easterlin (1974) to 'Great Britain' and Gallup (1976)
and the Eurobarometers to 'United Kingdom'. Unless specified, Northern Ireland is included in the UK. Great Britain involved England, Scotland, Wales and Northern Ireland. The Eurobarometer study presents data on Northern Ireland separately.
EU : - EU (9) involves: Belgium, Danmark, France, Ireland, Italy, Luxembourg, the Netherlands, UK, West Germany.
Happiness in Nations IITable 1.2.2. b
73 Representive Nation Samples
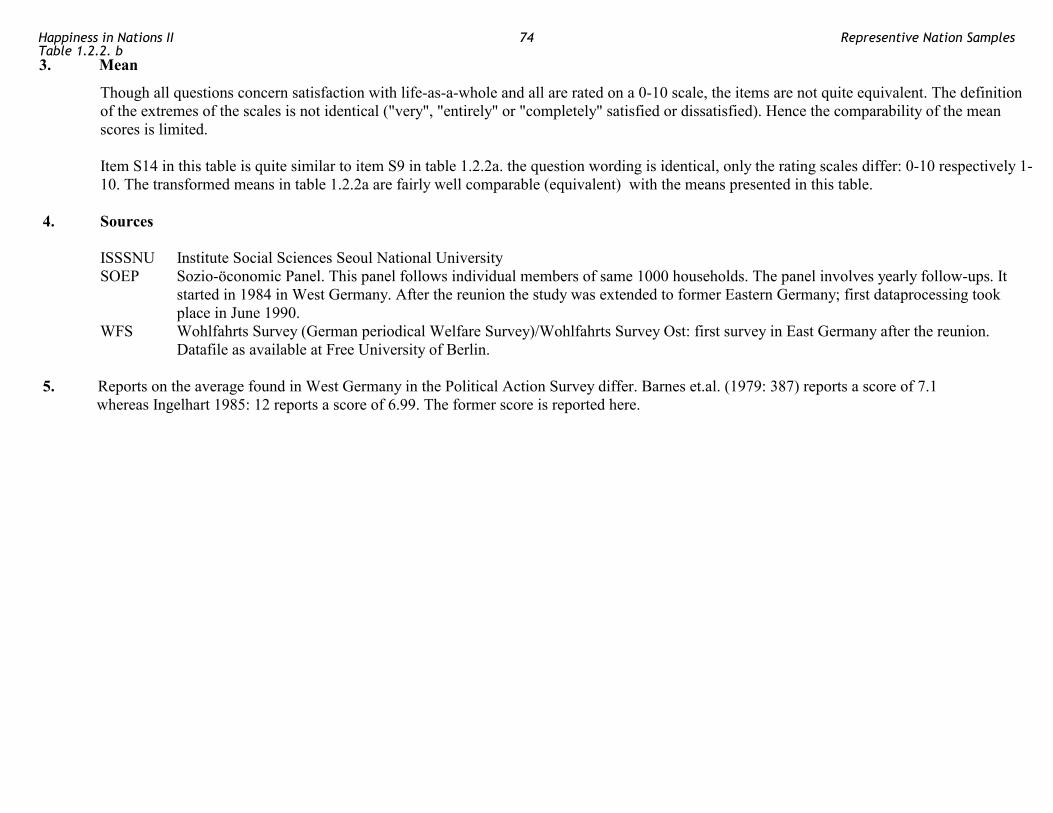
Though all questions concern satisfaction with life-as-a-whole and all are rated on a 0-10 scale, the items are not quite equivalent. The definition
of the extremes of the scales is not identical ("very", "entirely" or "completely" satisfied or dissatisfied). Hence the comparability of the mean scores is limited.
Item S14 in this table is quite similar to item S9 in table 1.2.2a. the question wording is identical, only the rating scales differ: 0-10 respectively 1-
10. The transformed means in table 1.2.2a are fairly well comparable (equivalent) with the means presented in this table. 4. Sources ISSSNU Institute Social Sciences Seoul National University SOEP Sozio-öconomic Panel. This panel follows individual members of same 1000 households. The panel involves yearly follow-ups. It
started in 1984 in West Germany. After the reunion the study was extended to former Eastern Germany; first dataprocessing took place in June 1990.
WFS Wohlfahrts Survey (German periodical Welfare Survey)/Wohlfahrts Survey Ost: first survey in East Germany after the reunion. Datafile as available at Free University of Berlin.
5. Reports on the average found in West Germany in the Political Action Survey differ. Barnes et.al. (1979: 387) reports a score of 7.1
whereas Ingelhart 1985: 12 reports a score of 6.99. The former score is reported here.
3. Mean
Happiness in Nations IITable 1.2.2. b
74 Representive Nation Samples

Table 1.2.3 Various life-satisfaction items (indicator type HAP 2) Single questions (HAP 2.1) and double questions (HAP 2.2)
Country Year/ Question Item and responses Mean N Source month type
Austria 1988 Taking all together, how satisfied 4.16 20.000 Lebensqualität Umfrage are you with your life-as-a-whole? Ifes Data Archives - very satisfied (5) 38.0% - (4) 45.0% - (3) 12.0% - (2) 2.0% - not satisfied at all (1) 1.0% Britain (Great) 1971/3 HAP 2.1 How dissatisfied would you say you are 5.54 213 Abram 1972:3 with things in general today? - high (8-10) 24% - medium (4-7) 56% - low (0-3) 20% Finland 1966/6 HAP 2.1 Satisfaction with overall life 3.16 948 Haavio 1971: 587 - very satisfying (4) 22% - fairly satisfying (3) 72% - not satisfying (2) 6% - very unsatisfying (1) 0% Netherlands 1991 Line life satisfaction Scherpenzeel??
Happiness in Nations II 75 Representive Nation Samples
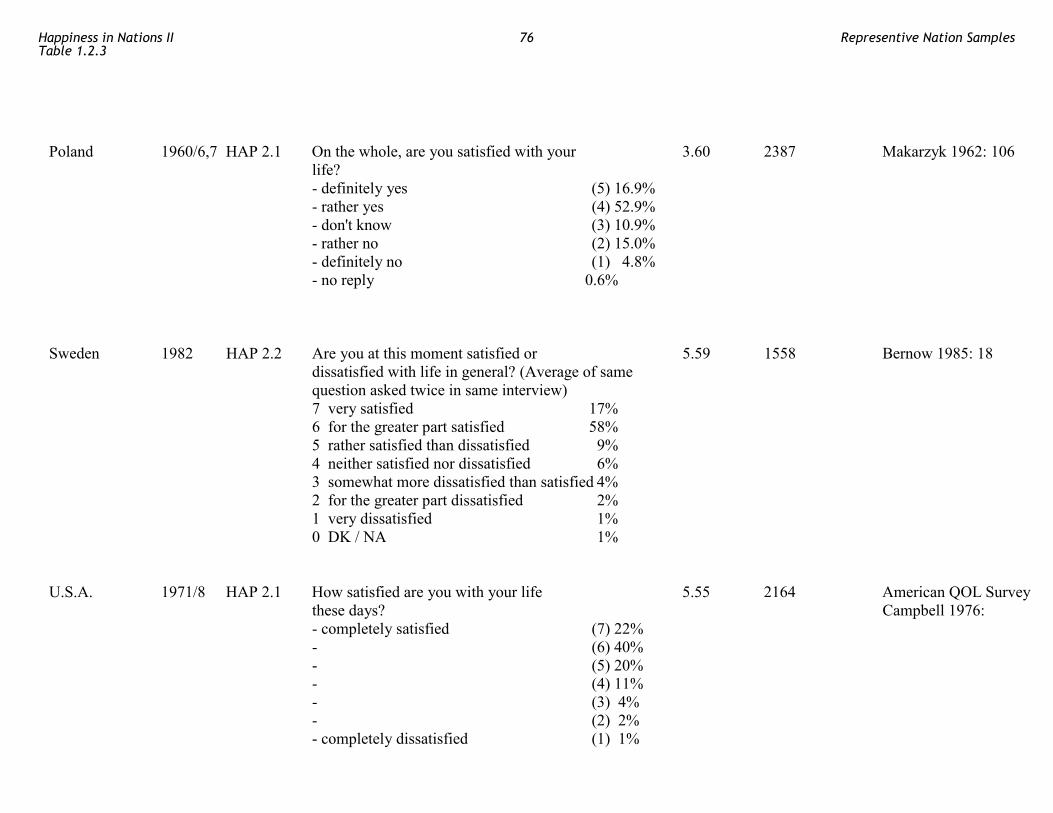
Poland 1960/6,7 HAP 2.1 On the whole, are you satisfied with your 3.60 2387 Makarzyk 1962: 106 life? - definitely yes (5) 16.9% - rather yes (4) 52.9% - don't know (3) 10.9% - rather no (2) 15.0% - definitely no (1) 4.8% - no reply 0.6% Sweden 1982 HAP 2.2 Are you at this moment satisfied or 5.59 1558 Bernow 1985: 18 dissatisfied with life in general? (Average of same question asked twice in same interview) 7 very satisfied 17% 6 for the greater part satisfied 58% 5 rather satisfied than dissatisfied 9% 4 neither satisfied nor dissatisfied 6% 3 somewhat more dissatisfied than satisfied 4% 2 for the greater part dissatisfied 2% 1 very dissatisfied 1% 0 DK / NA 1% U.S.A. 1971/8 HAP 2.1 How satisfied are you with your life 5.55 2164 American QOL Survey these days? Campbell 1976: - completely satisfied (7) 22% - (6) 40% - (5) 20% - (4) 11% - (3) 4% - (2) 2% - completely dissatisfied (1) 1%
Happiness in Nations IITable 1.2.3
76 Representive Nation Samples
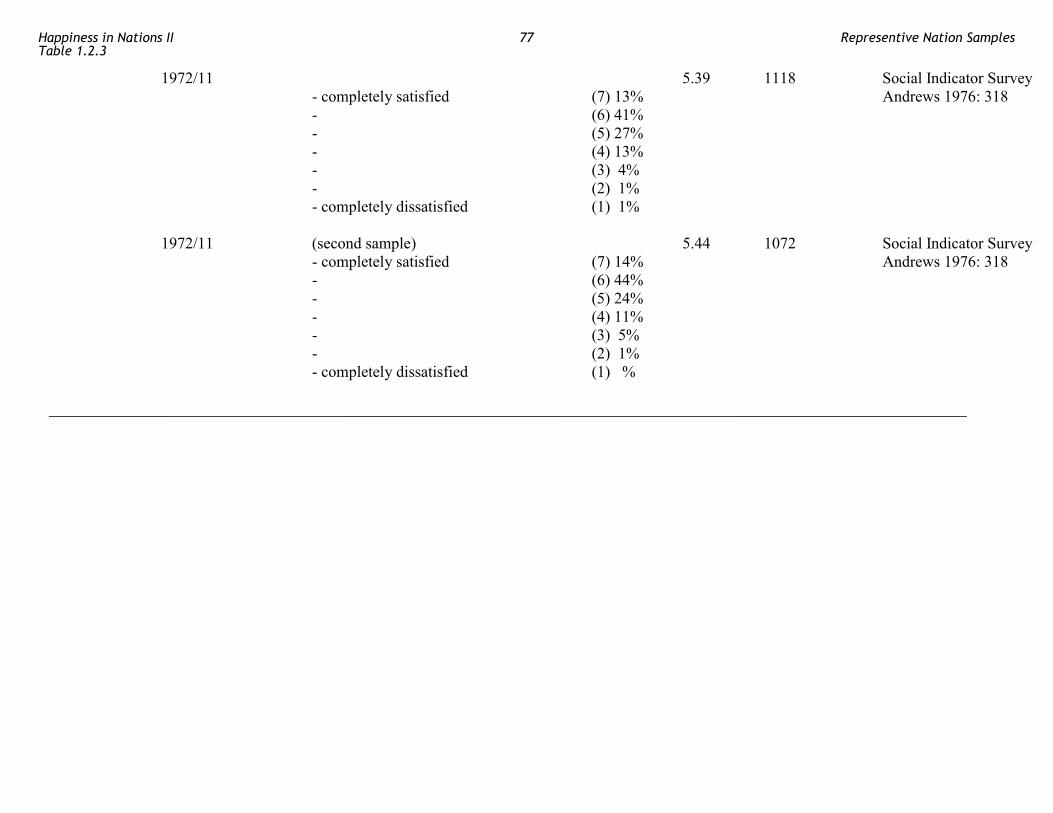
1972/11 5.39 1118 Social Indicator Survey - completely satisfied (7) 13% Andrews 1976: 318 - (6) 41% - (5) 27% - (4) 13% - (3) 4% - (2) 1% - completely dissatisfied (1) 1% 1972/11 (second sample) 5.44 1072 Social Indicator Survey - completely satisfied (7) 14% Andrews 1976: 318 - (6) 44% - (5) 24% - (4) 11% - (3) 5% - (2) 1% - completely dissatisfied (1) % ___________________________________________________________________________________________________________________
Happiness in Nations IITable 1.2.3
77 Representive Nation Samples
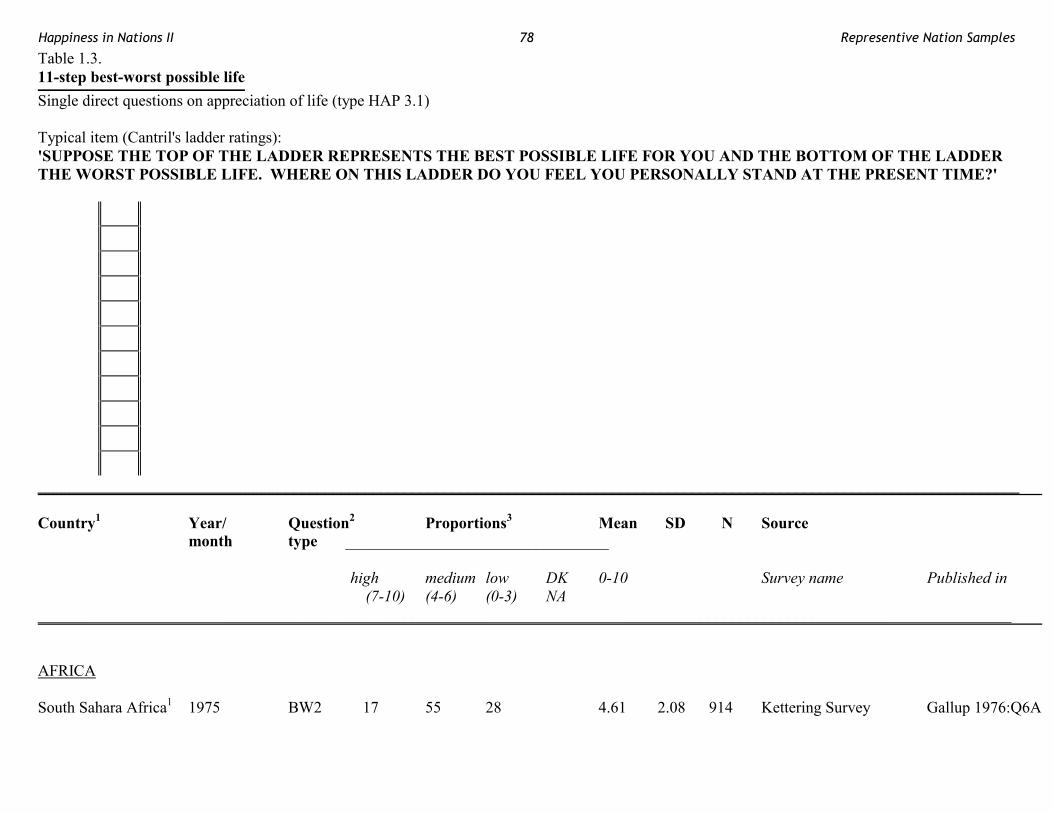
Table 1.3. 11-step best-worst possible life Single direct questions on appreciation of life (type HAP 3.1) Typical item (Cantril's ladder ratings): 'SUPPOSE THE TOP OF THE LADDER REPRESENTS THE BEST POSSIBLE LIFE FOR YOU AND THE BOTTOM OF THE LADDER THE WORST POSSIBLE LIFE. WHERE ON THIS LADDER DO YOU FEEL YOU PERSONALLY STAND AT THE PRESENT TIME?'
___________________________________________________________________________________________________________________________ Country1 Year/ Question2 Proportions3 Mean SD N Source month type _________________________________ high medium low DK 0-10 Survey name Published in (7-10) (4-6) (0-3) NA __________________________________________________________________________________________________________________________ AFRICA South Sahara Africa1 1975 BW2 17 55 28 4.61 2.08 914 Kettering Survey Gallup 1976:Q6A
Happiness in Nations II 78 Representive Nation Samples

Egypt 1960/fall BW1 30 51 17 2 5.5 499 Cantril 1965:258 Nigeria 1962/9- BW1 21 46 28 5 4.8 1200 Cantril 1965:258 1963/spring ANGLO-AMERICA 1975 BW2 56 37 6 1 6.5 1.95 2045 Kettering Survey Gallup 1976:Q6A
Canada 1975 BW2 63 34 3 7.00 1.76 1932 Kettering Survey Gallup 1976:Q6A
U.S.A. 1959/8 BW1 51 41 7 1 6.6 1549 Cantril 1965:258
1964 BW1 6.9 Cantril 1971:66 1971 BW1 6.6 1588 Cantril 1971:66 1972 BW1 6.4 Watts 1978:4 1974 BW1 6.4 Watts 1978:4 1974 BW1 6.1 Caplow1993:550
1975 BW2 56 37 6 1 6.71 2.13 1014 Kettering Survey Gallup 1976:Q6A
1975 BW1 6.3 Caplow1993:550
1976 BW1 6.7 Watts 1978: 4 1976 BW1 6.4 Caplow1993:550
1977 BW1 6.1 Caplow1993:550
1978 BW1 6.2 Caplow1993:550
1979 BW1 6.4 Caplow1993:550
1980 BW1 6.6 Caplow1993:550
Happiness in Nations IITable 1.3
79 Representive Nation Samples
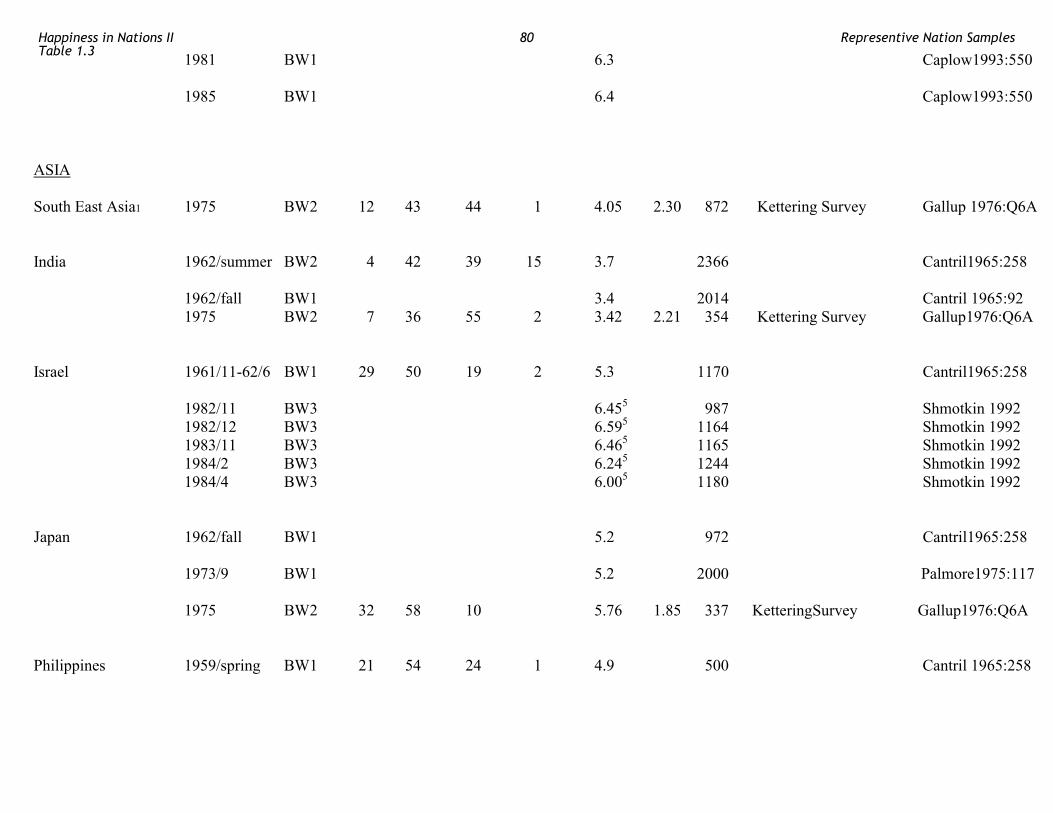
1981 BW1 6.3 Caplow1993:550
1985 BW1 6.4 Caplow1993:550
ASIA South East Asia1 1975 BW2 12 43 44 1 4.05 2.30 872 Kettering Survey Gallup 1976:Q6A
India 1962/summer BW2 4 42 39 15 3.7 2366 Cantril1965:258
1962/fall BW1 3.4 2014 Cantril 1965:92 1975 BW2 7 36 55 2 3.42 2.21 354 Kettering Survey Gallup1976:Q6A
Israel 1961/11-62/6 BW1 29 50 19 2 5.3 1170 Cantril1965:258
1982/11 BW3 6.455 987 Shmotkin 1992 1982/12 BW3 6.595 1164 Shmotkin 1992
1983/11 BW3 6.465 1165 Shmotkin 1992 1984/2 BW3 6.245 1244 Shmotkin 1992 1984/4 BW3 6.005 1180 Shmotkin 1992 Japan 1962/fall BW1 5.2 972 Cantril1965:258
1973/9 BW1 5.2 2000 Palmore1975:117
1975 BW2 32 58 10 5.76 1.85 337 KetteringSurvey Gallup1976:Q6A
Philippines 1959/spring BW1 21 54 24 1 4.9 500 Cantril 1965:258
Happiness in Nations IITable 1.3
80 Representive Nation Samples
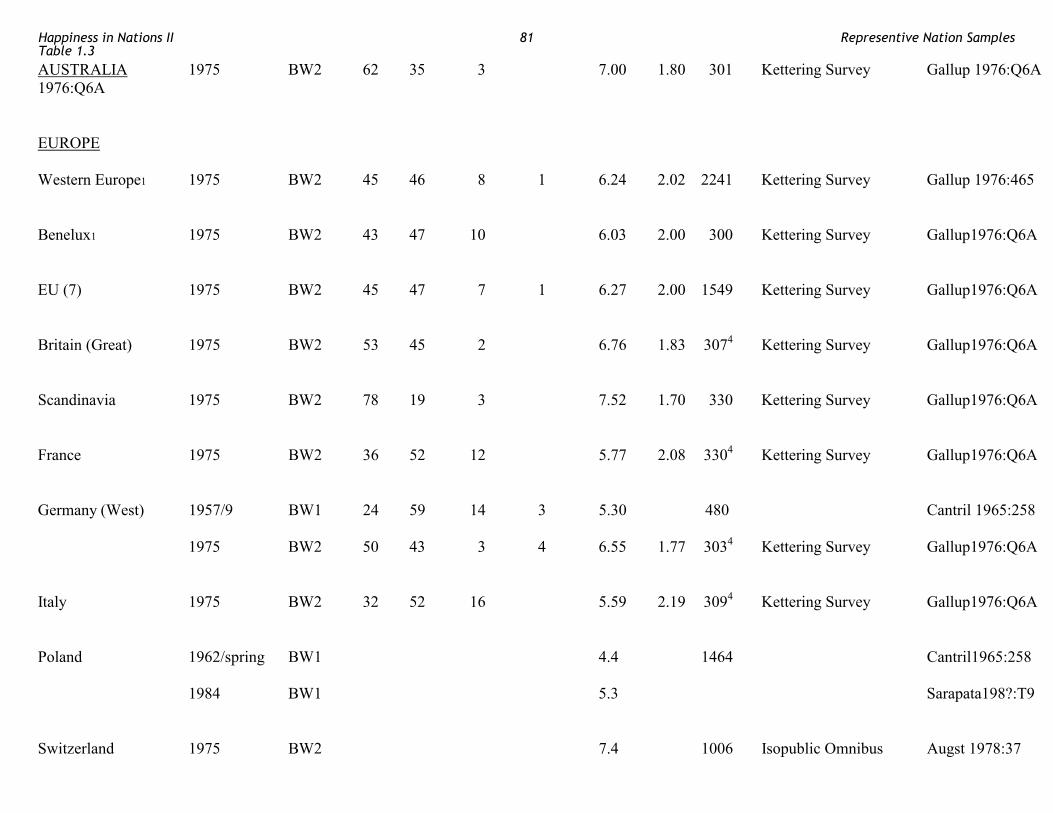
AUSTRALIA 1975 BW2 62 35 3 7.00 1.80 301 Kettering Survey Gallup 1976:Q6A 1976:Q6A EUROPE Western Europe1 1975 BW2 45 46 8 1 6.24 2.02 2241 Kettering Survey Gallup 1976:465
Benelux1 1975 BW2 43 47 10 6.03 2.00 300 Kettering Survey Gallup1976:Q6A EU (7) 1975 BW2 45 47 7 1 6.27 2.00 1549 Kettering Survey Gallup1976:Q6A Britain (Great) 1975 BW2 53 45 2 6.76 1.83 3074 Kettering Survey Gallup1976:Q6A Scandinavia 1975 BW2 78 19 3 7.52 1.70 330 Kettering Survey Gallup1976:Q6A France 1975 BW2 36 52 12 5.77 2.08 3304 Kettering Survey Gallup1976:Q6A
Germany (West) 1957/9 BW1 24 59 14 3 5.30 480 Cantril 1965:258 1975 BW2 50 43 3 4 6.55 1.77 3034 Kettering Survey Gallup1976:Q6A
Italy 1975 BW2 32 52 16 5.59 2.19 3094 Kettering Survey Gallup1976:Q6A
Poland 1962/spring BW1 4.4 1464 Cantril1965:258
1984 BW1 5.3 Sarapata198?:T9
Switzerland 1975 BW2 7.4 1006 Isopublic Omnibus Augst 1978:37
Happiness in Nations IITable 1.3
81 Representive Nation Samples
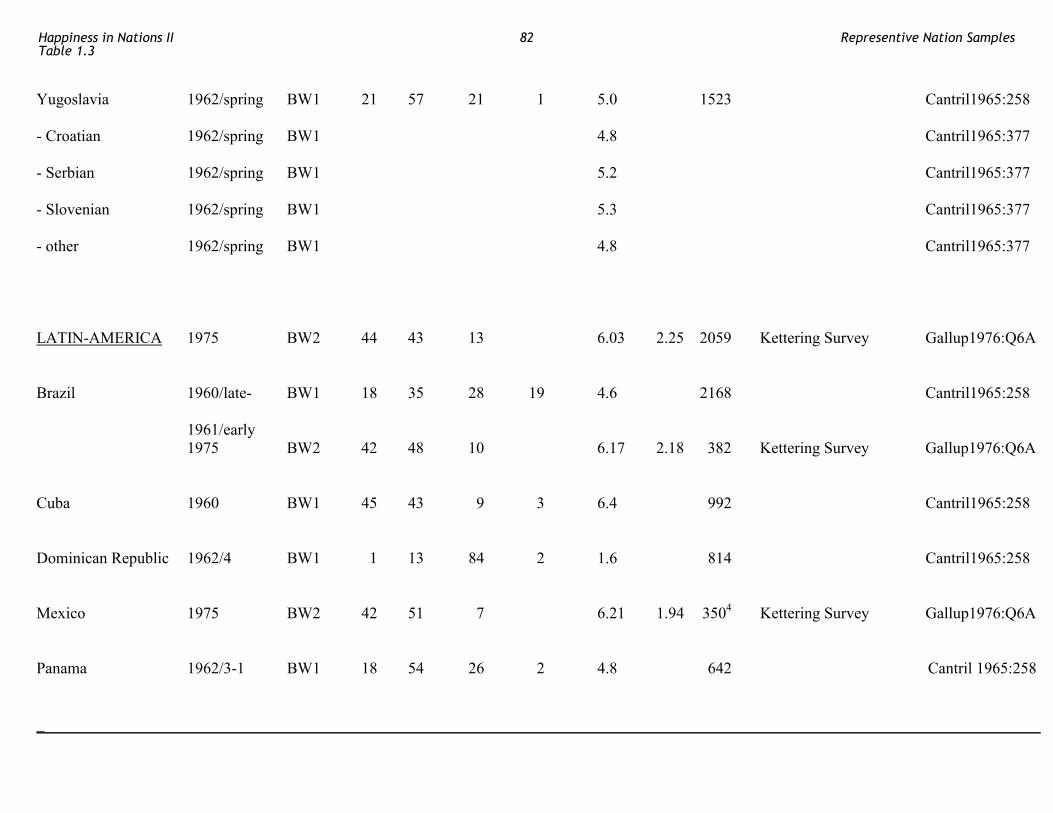
Yugoslavia 1962/spring BW1 21 57 21 1 5.0 1523 Cantril1965:258 - Croatian 1962/spring BW1 4.8 Cantril1965:377
- Serbian 1962/spring BW1 5.2 Cantril1965:377
- Slovenian 1962/spring BW1 5.3 Cantril1965:377
- other 1962/spring BW1 4.8 Cantril1965:377
LATIN-AMERICA 1975 BW2 44 43 13 6.03 2.25 2059 Kettering Survey Gallup1976:Q6A
Brazil 1960/late- BW1 18 35 28 19 4.6 2168 Cantril1965:258
1961/early 1975 BW2 42 48 10 6.17 2.18 382 Kettering Survey Gallup1976:Q6A
Cuba 1960 BW1 45 43 9 3 6.4 992 Cantril1965:258
Dominican Republic 1962/4 BW1 1 13 84 2 1.6 814 Cantril1965:258 Mexico 1975 BW2 42 51 7 6.21 1.94 3504 Kettering Survey Gallup1976:Q6A
Panama 1962/3-1 BW1 18 54 26 2 4.8 642 Cantril 1965:258
_
Happiness in Nations IITable 1.3
82 Representive Nation Samples
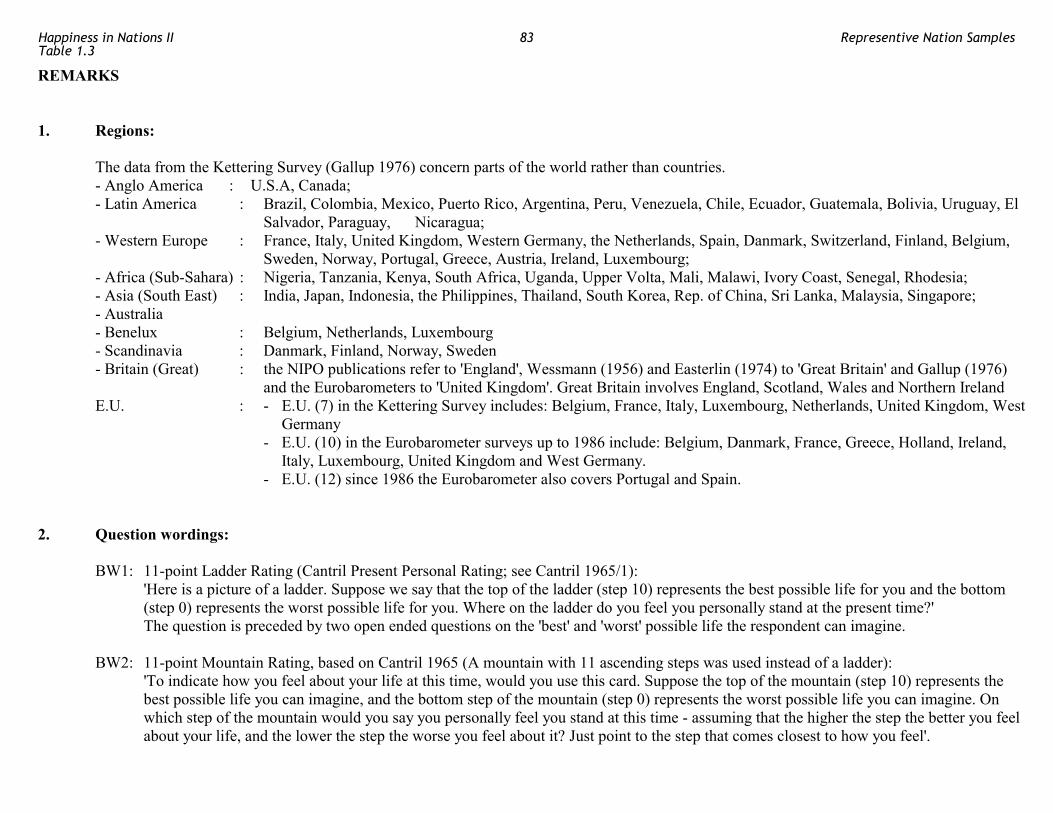
REMARKS 1. Regions: The data from the Kettering Survey (Gallup 1976) concern parts of the world rather than countries. - Anglo America : U.S.A, Canada; - Latin America : Brazil, Colombia, Mexico, Puerto Rico, Argentina, Peru, Venezuela, Chile, Ecuador, Guatemala, Bolivia, Uruguay, El
Salvador, Paraguay, Nicaragua; - Western Europe : France, Italy, United Kingdom, Western Germany, the Netherlands, Spain, Danmark, Switzerland, Finland, Belgium,
Sweden, Norway, Portugal, Greece, Austria, Ireland, Luxembourg; - Africa (Sub-Sahara) : Nigeria, Tanzania, Kenya, South Africa, Uganda, Upper Volta, Mali, Malawi, Ivory Coast, Senegal, Rhodesia; - Asia (South East) : India, Japan, Indonesia, the Philippines, Thailand, South Korea, Rep. of China, Sri Lanka, Malaysia, Singapore; - Australia - Benelux : Belgium, Netherlands, Luxembourg - Scandinavia : Danmark, Finland, Norway, Sweden - Britain (Great) : the NIPO publications refer to 'England', Wessmann (1956) and Easterlin (1974) to 'Great Britain' and Gallup (1976)
and the Eurobarometers to 'United Kingdom'. Great Britain involves England, Scotland, Wales and Northern Ireland E.U. : - E.U. (7) in the Kettering Survey includes: Belgium, France, Italy, Luxembourg, Netherlands, United Kingdom, West
Germany - E.U. (10) in the Eurobarometer surveys up to 1986 include: Belgium, Danmark, France, Greece, Holland, Ireland,
Italy, Luxembourg, United Kingdom and West Germany. - E.U. (12) since 1986 the Eurobarometer also covers Portugal and Spain. 2. Question wordings: BW1: 11-point Ladder Rating (Cantril Present Personal Rating; see Cantril 1965/1): 'Here is a picture of a ladder. Suppose we say that the top of the ladder (step 10) represents the best possible life for you and the bottom
(step 0) represents the worst possible life for you. Where on the ladder do you feel you personally stand at the present time?' The question is preceded by two open ended questions on the 'best' and 'worst' possible life the respondent can imagine. BW2: 11-point Mountain Rating, based on Cantril 1965 (A mountain with 11 ascending steps was used instead of a ladder): 'To indicate how you feel about your life at this time, would you use this card. Suppose the top of the mountain (step 10) represents the
best possible life you can imagine, and the bottom step of the mountain (step 0) represents the worst possible life you can imagine. On which step of the mountain would you say you personally feel you stand at this time - assuming that the higher the step the better you feel about your life, and the lower the step the worse you feel about it? Just point to the step that comes closest to how you feel'.
Happiness in Nations IITable 1.3
83 Representive Nation Samples
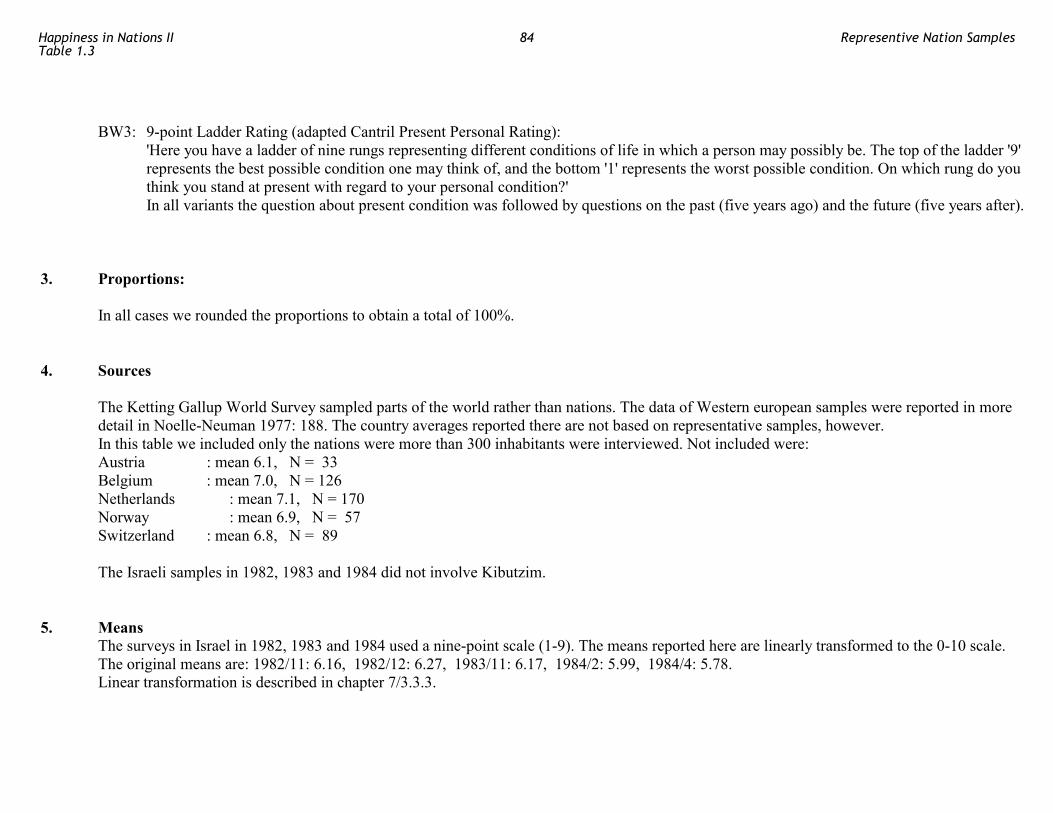
BW3: 9-point Ladder Rating (adapted Cantril Present Personal Rating): 'Here you have a ladder of nine rungs representing different conditions of life in which a person may possibly be. The top of the ladder '9'
represents the best possible condition one may think of, and the bottom '1' represents the worst possible condition. On which rung do you think you stand at present with regard to your personal condition?'
In all variants the question about present condition was followed by questions on the past (five years ago) and the future (five years after). 3. Proportions: In all cases we rounded the proportions to obtain a total of 100%. 4. Sources The Ketting Gallup World Survey sampled parts of the world rather than nations. The data of Western european samples were reported in more
detail in Noelle-Neuman 1977: 188. The country averages reported there are not based on representative samples, however. In this table we included only the nations were more than 300 inhabitants were interviewed. Not included were: Austria : mean 6.1, N = 33 Belgium : mean 7.0, N = 126 Netherlands : mean 7.1, N = 170 Norway : mean 6.9, N = 57 Switzerland : mean 6.8, N = 89 The Israeli samples in 1982, 1983 and 1984 did not involve Kibutzim. 5. Means The surveys in Israel in 1982, 1983 and 1984 used a nine-point scale (1-9). The means reported here are linearly transformed to the 0-10 scale.
The original means are: 1982/11: 6.16, 1982/12: 6.27, 1983/11: 6.17, 1984/2: 5.99, 1984/4: 5.78. Linear transformation is described in chapter 7/3.3.3.
Happiness in Nations IITable 1.3
84 Representive Nation Samples
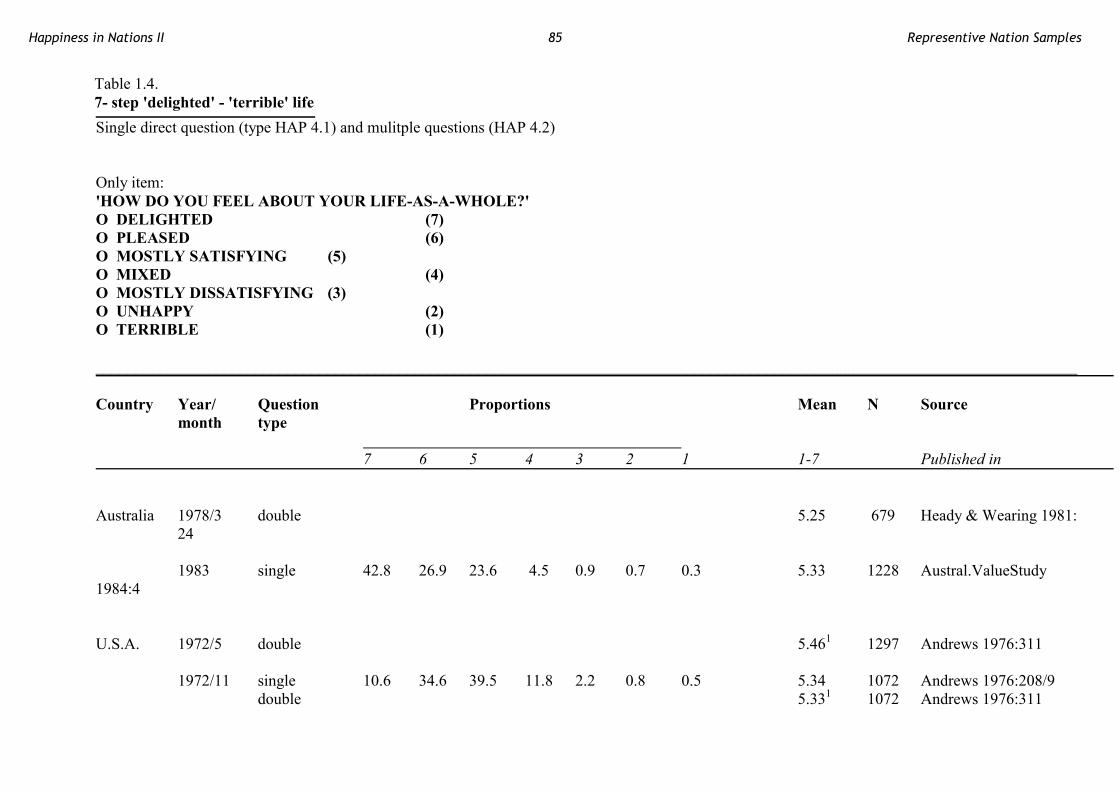
Table 1.4. 7- step 'delighted' - 'terrible' life Single direct question (type HAP 4.1) and mulitple questions (HAP 4.2) Only item: 'HOW DO YOU FEEL ABOUT YOUR LIFE-AS-A-WHOLE?' O DELIGHTED (7) O PLEASED (6) O MOSTLY SATISFYING (5) O MIXED (4) O MOSTLY DISSATISFYING (3) O UNHAPPY (2) O TERRIBLE (1) ___________________________________________________________________________________________________________________________ Country Year/ Question Proportions Mean N Source month type 7 6 5 4 3 2 1 1-7 Published in
Australia 1978/3 double 5.25 679 Heady & Wearing 1981:
24 1983 single 42.8 26.9 23.6 4.5 0.9 0.7 0.3 5.33 1228 Austral.ValueStudy 1984:4 U.S.A. 1972/5 double 5.461 1297 Andrews 1976:311 1972/11 single 10.6 34.6 39.5 11.8 2.2 0.8 0.5 5.34 1072 Andrews 1976:208/9 double 5.331 1072 Andrews 1976:311
Happiness in Nations II 85 Representive Nation Samples
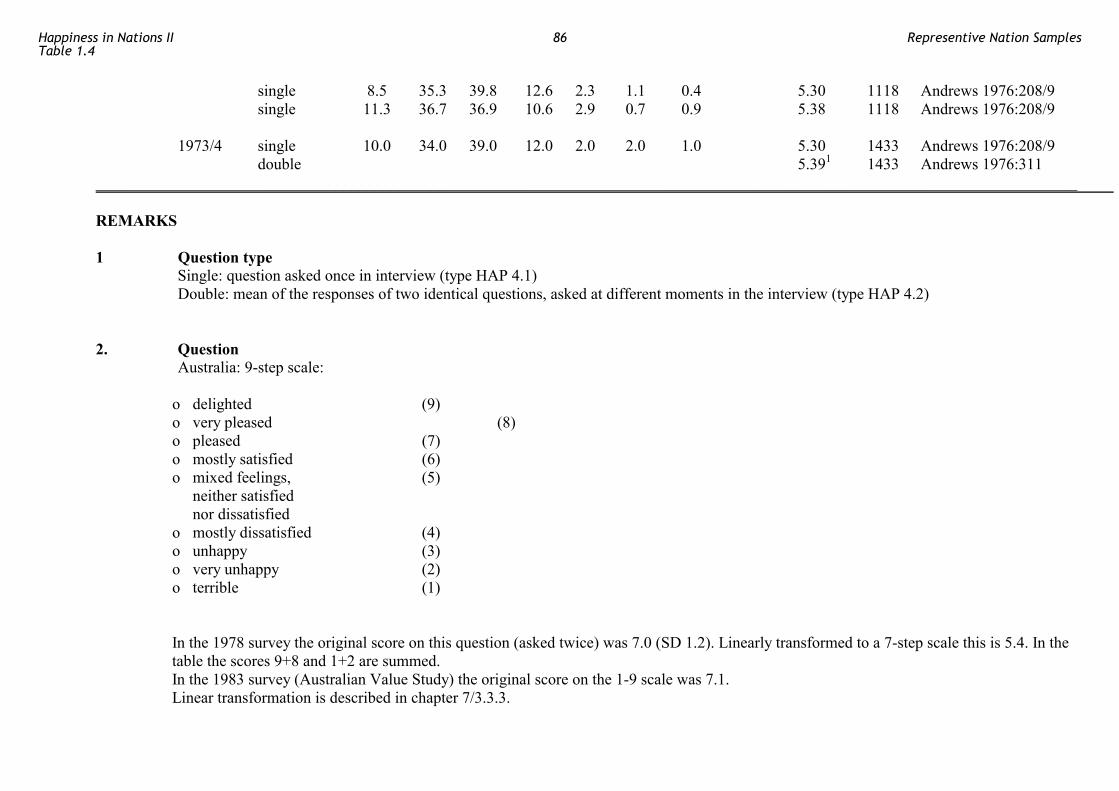
single 8.5 35.3 39.8 12.6 2.3 1.1 0.4 5.30 1118 Andrews 1976:208/9 single 11.3 36.7 36.9 10.6 2.9 0.7 0.9 5.38 1118 Andrews 1976:208/9 1973/4 single 10.0 34.0 39.0 12.0 2.0 2.0 1.0 5.30 1433 Andrews 1976:208/9 double 5.391 1433 Andrews 1976:311 ___________________________________________________________________________________________________________________________ REMARKS 1 Question type Single: question asked once in interview (type HAP 4.1) Double: mean of the responses of two identical questions, asked at different moments in the interview (type HAP 4.2) 2. Question Australia: 9-step scale: o delighted (9) o very pleased (8) o pleased (7) o mostly satisfied (6) o mixed feelings, (5) neither satisfied nor dissatisfied o mostly dissatisfied (4) o unhappy (3) o very unhappy (2) o terrible (1) In the 1978 survey the original score on this question (asked twice) was 7.0 (SD 1.2). Linearly transformed to a 7-step scale this is 5.4. In the
table the scores 9+8 and 1+2 are summed. In the 1983 survey (Australian Value Study) the original score on the 1-9 scale was 7.1. Linear transformation is described in chapter 7/3.3.3.
Happiness in Nations IITable 1.4
86 Representive Nation Samples
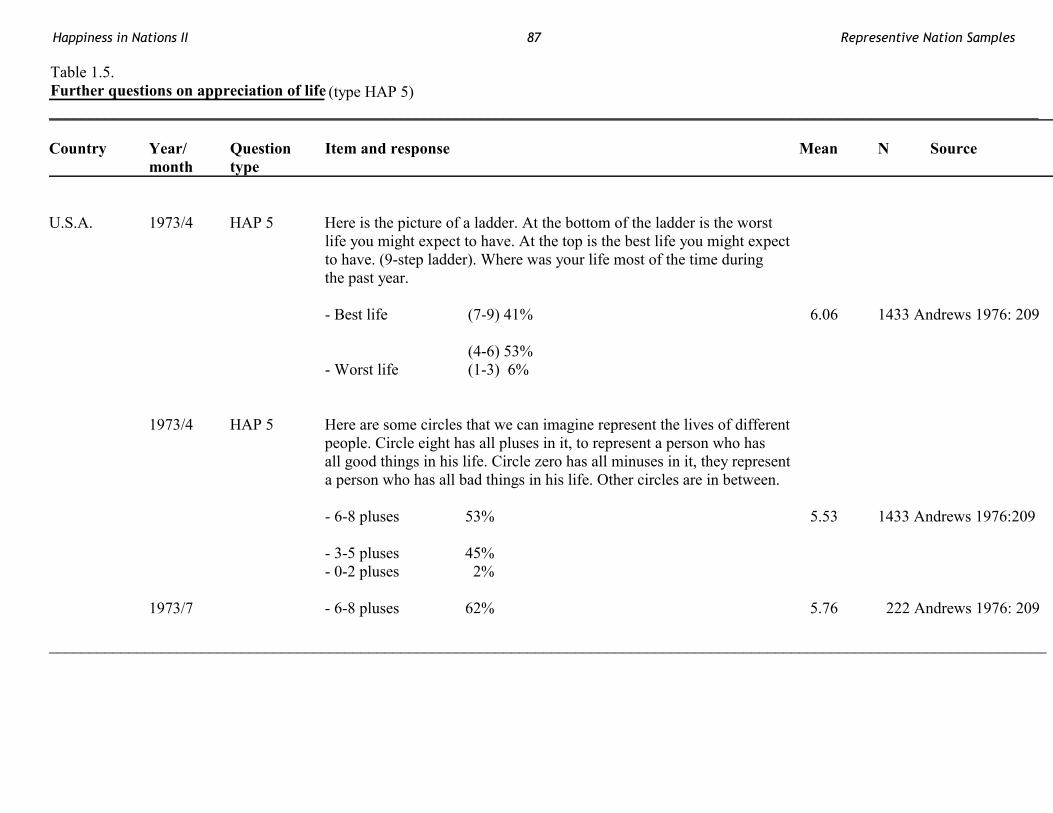
Table 1.5. Further questions on appreciation of life (type HAP 5) ____________________________________________________________________________________________________________________________ Country Year/ Question Item and response Mean N Source month type
U.S.A. 1973/4 HAP 5 Here is the picture of a ladder. At the bottom of the ladder is the worst life you might expect to have. At the top is the best life you might expect to have. (9-step ladder). Where was your life most of the time during the past year. - Best life (7-9) 41% 6.06 1433 Andrews 1976: 209
(4-6) 53% - Worst life (1-3) 6% 1973/4 HAP 5 Here are some circles that we can imagine represent the lives of different people. Circle eight has all pluses in it, to represent a person who has all good things in his life. Circle zero has all minuses in it, they represent a person who has all bad things in his life. Other circles are in between. - 6-8 pluses 53% 5.53 1433 Andrews 1976:209
- 3-5 pluses 45% - 0-2 pluses 2% 1973/7 - 6-8 pluses 62% 5.76 222 Andrews 1976: 209 _____________________________________________________________________________________________________________________________
Happiness in Nations II 87 Representive Nation Samples
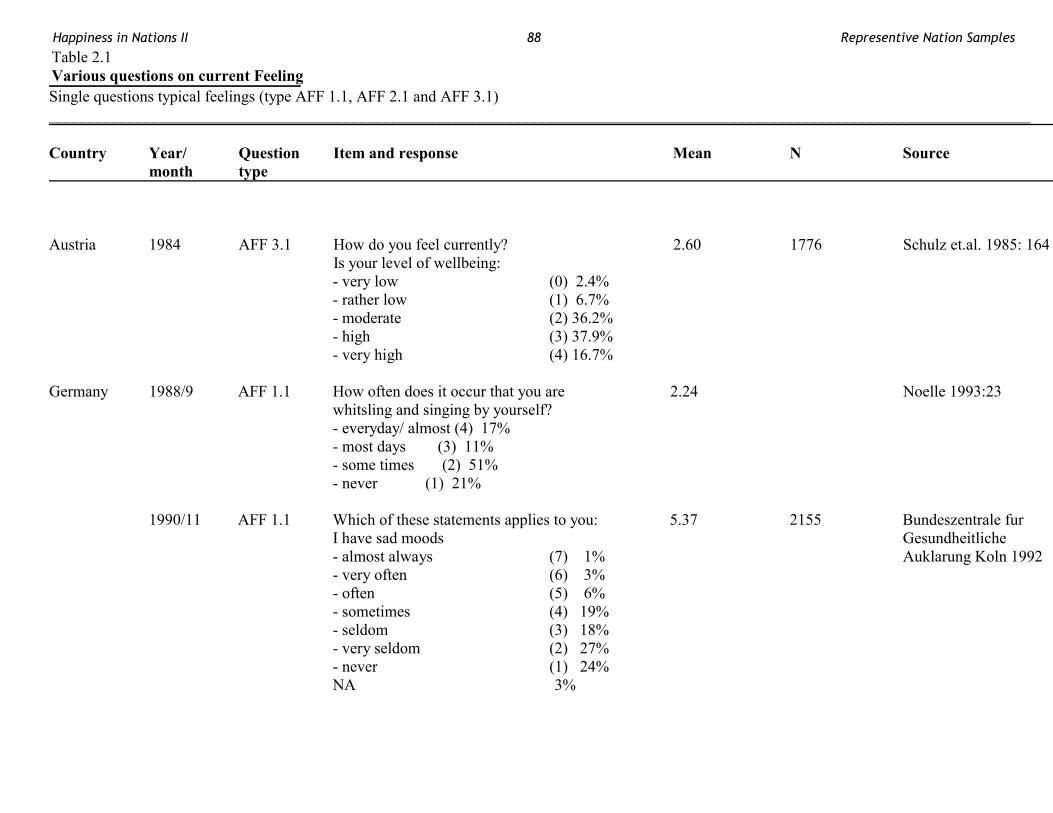
Table 2.1 Various questions on current Feeling Single questions typical feelings (type AFF 1.1, AFF 2.1 and AFF 3.1) ___________________________________________________________________________________________________________________________ Country Year/ Question Item and response Mean N Source month type
Austria 1984 AFF 3.1 How do you feel currently? 2.60 1776 Schulz et.al. 1985: 164 Is your level of wellbeing: - very low (0) 2.4% - rather low (1) 6.7% - moderate (2) 36.2% - high (3) 37.9% - very high (4) 16.7% Germany 1988/9 AFF 1.1 How often does it occur that you are 2.24 Noelle 1993:23 whitsling and singing by yourself? - everyday/ almost (4) 17% - most days (3) 11% - some times (2) 51% - never (1) 21% 1990/11 AFF 1.1 Which of these statements applies to you: 5.37 2155 Bundeszentrale fur I have sad moods Gesundheitliche - almost always (7) 1% Auklarung Koln 1992 - very often (6) 3% - often (5) 6% - sometimes (4) 19% - seldom (3) 18% - very seldom (2) 27% - never (1) 24% NA 3%
Happiness in Nations II 88 Representive Nation Samples
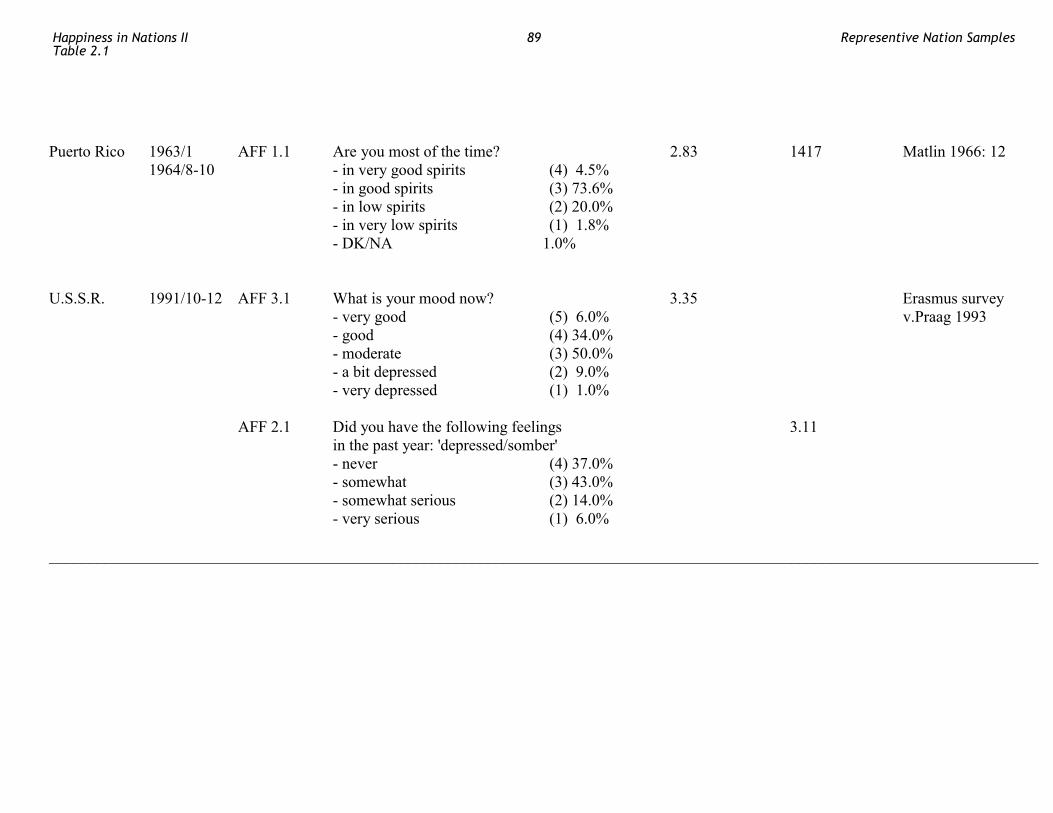
Puerto Rico 1963/1 AFF 1.1 Are you most of the time? 2.83 1417 Matlin 1966: 12 1964/8-10 - in very good spirits (4) 4.5% - in good spirits (3) 73.6% - in low spirits (2) 20.0% - in very low spirits (1) 1.8% - DK/NA 1.0% U.S.S.R. 1991/10-12 AFF 3.1 What is your mood now? 3.35 Erasmus survey - very good (5) 6.0% v.Praag 1993 - good (4) 34.0% - moderate (3) 50.0% - a bit depressed (2) 9.0% - very depressed (1) 1.0% AFF 2.1 Did you have the following feelings 3.11 in the past year: 'depressed/somber' - never (4) 37.0% - somewhat (3) 43.0% - somewhat serious (2) 14.0% - very serious (1) 6.0% ____________________________________________________________________________________________________________________________
Happiness in Nations IITable 2.1
89 Representive Nation Samples

Table 2.2 Affect balance Multiple questions on specific affects in the recent past (type AFF 2.3) Bradburns' (19690 Affect Balance Scale 'DURING THE PAST FEW WEEKS DID YOU EVER FEEL - PARTICULARLY EXCITED OR INTERESTED IN SOMETHING? YES/NO - SO RESTLESS THAT YOU COULDN'T SIT LONG IN A CHAIR? YES/NO - PROUD BECAUSE SOMEONE COMPLIMENTED YOU ON SOMETHING YOU HAD DONE? YES/NO - VERY LONELY OR REMOTE FROM OTHER PEOPLE? YES/NO - PLEASED ABOUT HAVING ACCOMPLISHED SOMETHING? YES/NO - BORED? YES/NO - ON TOP OF THE WORLD? YES/NO - DEPRESSED? YES/NO - THAT THINGS WERE GOING YOUR WAY? YES/NO - UPSET BECAUSE SOMEONE CRITICIZED YOU? YES/NO Positive affects: items 1,3,5,7,9/ Negative affects 2,4,6,8,10/ Scoring Positive Affect: yes = +1, no = 0. Negative Affect: yes = -1, no = 0. Computation of Affect Balance Score (ABS): Positive Affect Score, minus Negative Affect score (range -5 to +5). Transformation to range 0 - 10: original mean + 5
Happiness in Nations II 90 Representive Nation Samples
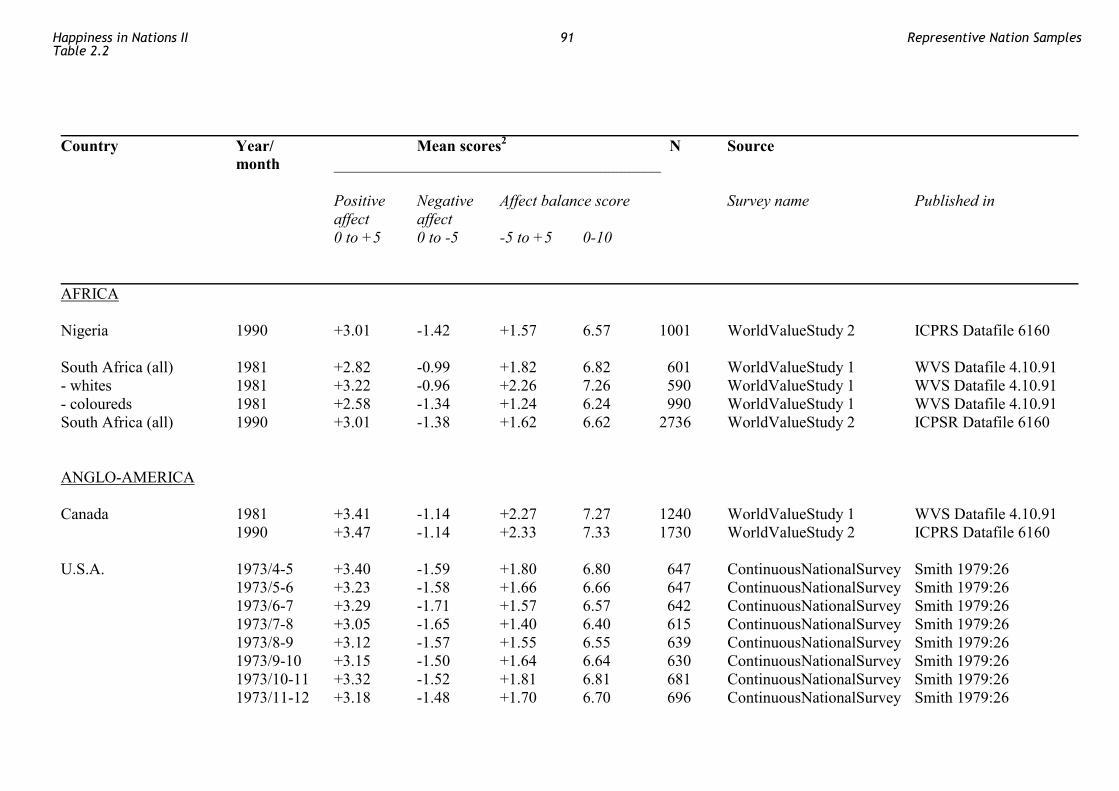
Country Year/ Mean scores2 N Source month _________________________________________ Positive Negative Affect balance score Survey name Published in affect affect 0 to +5 0 to -5 -5 to +5 0-10
AFRICA Nigeria 1990 +3.01 -1.42 +1.57 6.57 1001 WorldValueStudy 2 ICPRS Datafile 6160 South Africa (all) 1981 +2.82 -0.99 +1.82 6.82 601 WorldValueStudy 1 WVS Datafile 4.10.91 - whites 1981 +3.22 -0.96 +2.26 7.26 590 WorldValueStudy 1 WVS Datafile 4.10.91 - coloureds 1981 +2.58 -1.34 +1.24 6.24 990 WorldValueStudy 1 WVS Datafile 4.10.91 South Africa (all) 1990 +3.01 -1.38 +1.62 6.62 2736 WorldValueStudy 2 ICPSR Datafile 6160 ANGLO-AMERICA Canada 1981 +3.41 -1.14 +2.27 7.27 1240 WorldValueStudy 1 WVS Datafile 4.10.91 1990 +3.47 -1.14 +2.33 7.33 1730 WorldValueStudy 2 ICPRS Datafile 6160 U.S.A. 1973/4-5 +3.40 -1.59 +1.80 6.80 647 ContinuousNationalSurvey Smith 1979:26 1973/5-6 +3.23 -1.58 +1.66 6.66 647 ContinuousNationalSurvey Smith 1979:26 1973/6-7 +3.29 -1.71 +1.57 6.57 642 ContinuousNationalSurvey Smith 1979:26 1973/7-8 +3.05 -1.65 +1.40 6.40 615 ContinuousNationalSurvey Smith 1979:26 1973/8-9 +3.12 -1.57 +1.55 6.55 639 ContinuousNationalSurvey Smith 1979:26 1973/9-10 +3.15 -1.50 +1.64 6.64 630 ContinuousNationalSurvey Smith 1979:26 1973/10-11 +3.32 -1.52 +1.81 6.81 681 ContinuousNationalSurvey Smith 1979:26 1973/11-12 +3.18 -1.48 +1.70 6.70 696 ContinuousNationalSurvey Smith 1979:26
Happiness in Nations IITable 2.2
91 Representive Nation Samples
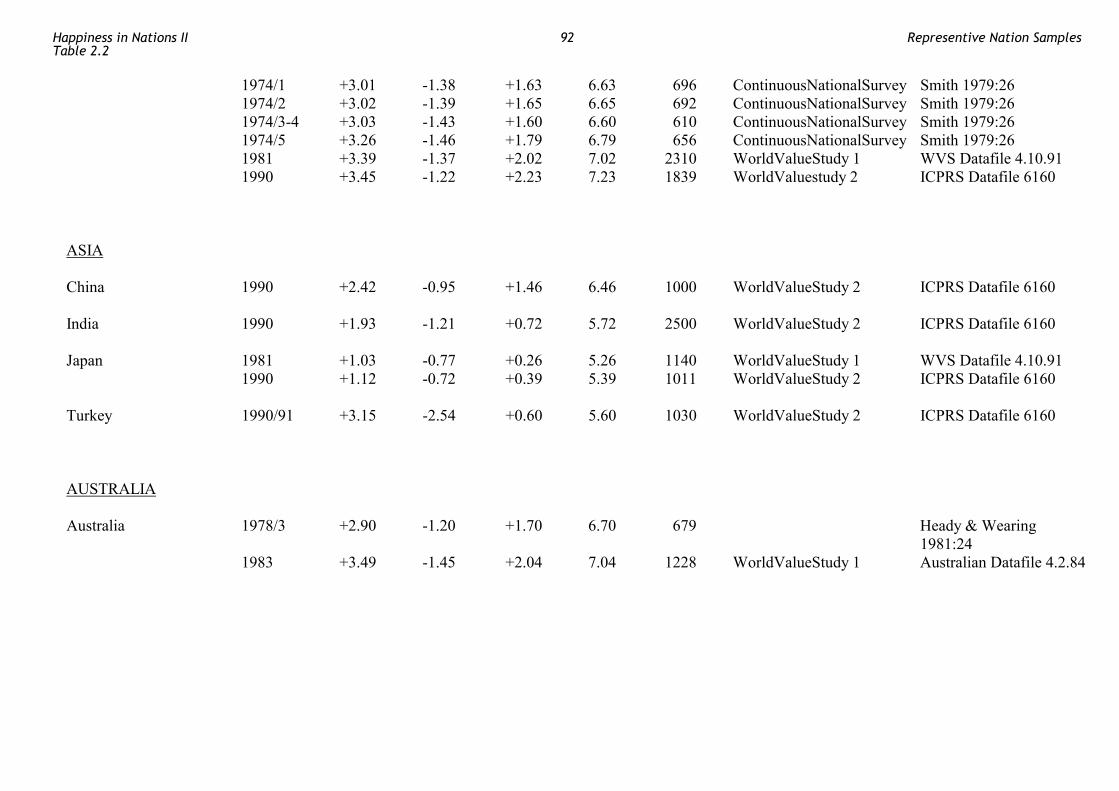
1974/1 +3.01 -1.38 +1.63 6.63 696 ContinuousNationalSurvey Smith 1979:26 1974/2 +3.02 -1.39 +1.65 6.65 692 ContinuousNationalSurvey Smith 1979:26 1974/3-4 +3.03 -1.43 +1.60 6.60 610 ContinuousNationalSurvey Smith 1979:26 1974/5 +3.26 -1.46 +1.79 6.79 656 ContinuousNationalSurvey Smith 1979:26 1981 +3.39 -1.37 +2.02 7.02 2310 WorldValueStudy 1 WVS Datafile 4.10.91 1990 +3.45 -1.22 +2.23 7.23 1839 WorldValuestudy 2 ICPRS Datafile 6160 ASIA China 1990 +2.42 -0.95 +1.46 6.46 1000 WorldValueStudy 2 ICPRS Datafile 6160 India 1990 +1.93 -1.21 +0.72 5.72 2500 WorldValueStudy 2 ICPRS Datafile 6160 Japan 1981 +1.03 -0.77 +0.26 5.26 1140 WorldValueStudy 1 WVS Datafile 4.10.91 1990 +1.12 -0.72 +0.39 5.39 1011 WorldValueStudy 2 ICPRS Datafile 6160 Turkey 1990/91 +3.15 -2.54 +0.60 5.60 1030 WorldValueStudy 2 ICPRS Datafile 6160 AUSTRALIA Australia 1978/3 +2.90 -1.20 +1.70 6.70 679 Heady & Wearing 1981:24 1983 +3.49 -1.45 +2.04 7.04 1228 WorldValueStudy 1 Australian Datafile 4.2.84
Happiness in Nations IITable 2.2
92 Representive Nation Samples
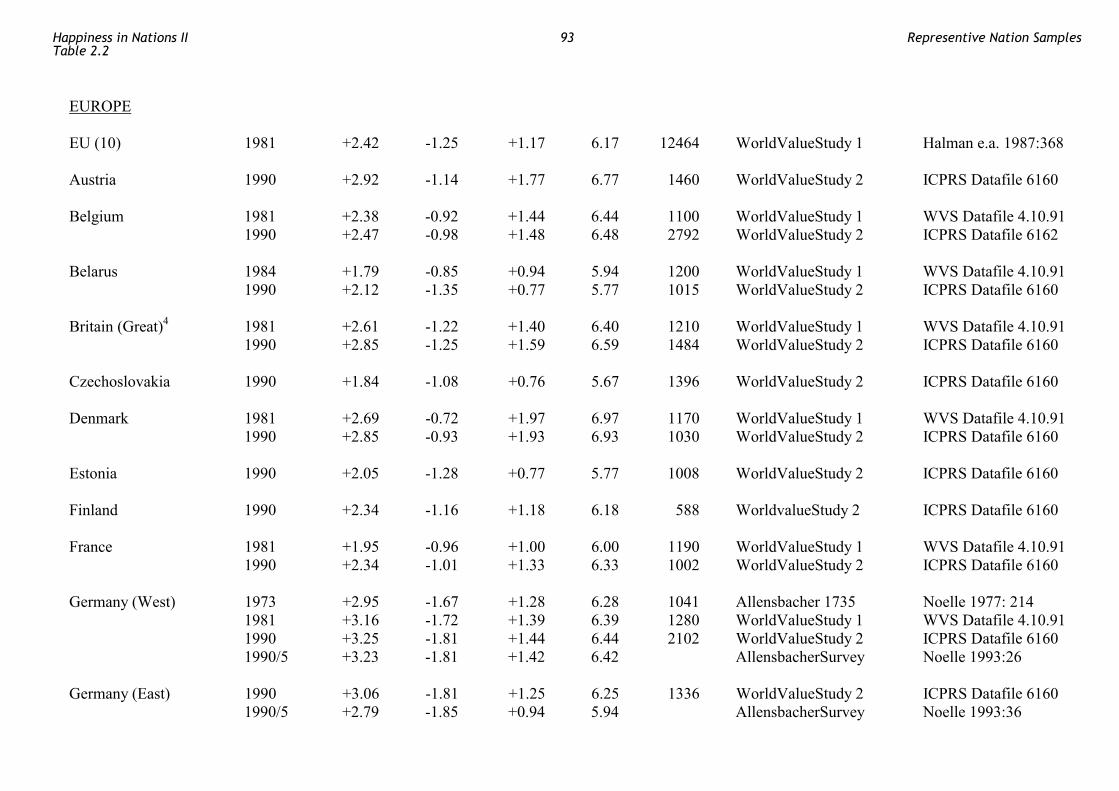
4
EUROPE EU (10) 1981 +2.42 -1.25 +1.17 6.17 12464 WorldValueStudy 1 Halman e.a. 1987:368 Austria 1990 +2.92 -1.14 +1.77 6.77 1460 WorldValueStudy 2 ICPRS Datafile 6160 Belgium 1981 +2.38 -0.92 +1.44 6.44 1100 WorldValueStudy 1 WVS Datafile 4.10.91 1990 +2.47 -0.98 +1.48 6.48 2792 WorldValueStudy 2 ICPRS Datafile 6162 Belarus 1984 +1.79 -0.85 +0.94 5.94 1200 WorldValueStudy 1 WVS Datafile 4.10.91 1990 +2.12 -1.35 +0.77 5.77 1015 WorldValueStudy 2 ICPRS Datafile 6160 Britain (Great)4 1981 +2.61 -1.22 +1.40 6.40 1210 WorldValueStudy 1 WVS Datafile 4.10.91 1990 +2.85 -1.25 +1.59 6.59 1484 WorldValueStudy 2 ICPRS Datafile 6160 Czechoslovakia 1990 +1.84 -1.08 +0.76 5.67 1396 WorldValueStudy 2 ICPRS Datafile 6160 Denmark 1981 +2.69 -0.72 +1.97 6.97 1170 WorldValueStudy 1 WVS Datafile 4.10.91 1990 +2.85 -0.93 +1.93 6.93 1030 WorldValueStudy 2 ICPRS Datafile 6160 Estonia 1990 +2.05 -1.28 +0.77 5.77 1008 WorldValueStudy 2 ICPRS Datafile 6160 Finland 1990 +2.34 -1.16 +1.18 6.18 588 WorldvalueStudy 2 ICPRS Datafile 6160 France 1981 +1.95 -0.96 +1.00 6.00 1190 WorldValueStudy 1 WVS Datafile 4.10.91 1990 +2.34 -1.01 +1.33 6.33 1002 WorldValueStudy 2 ICPRS Datafile 6160 Germany (West) 1973 +2.95 -1.67 +1.28 6.28 1041 Allensbacher 1735 Noelle 1977: 214 1981 +3.16 -1.72 +1.39 6.39 1280 WorldValueStudy 1 WVS Datafile 4.10.91 1990 +3.25 -1.81 +1.44 6.44 2102 WorldValueStudy 2 ICPRS Datafile 6160 1990/5 +3.23 -1.81 +1.42 6.42 AllensbacherSurvey Noelle 1993:26 Germany (East) 1990 +3.06 -1.81 +1.25 6.25 1336 WorldValueStudy 2 ICPRS Datafile 6160 1990/5 +2.79 -1.85 +0.94 5.94 AllensbacherSurvey Noelle 1993:36
Happiness in Nations IITable 2.2
93 Representive Nation Samples

Hungary 1981 +2.51 -1.37 +1.14 6.14 1440 WorldValueStudy 1 WVS Datafile 4.10.91 1990 +1.98 -1.12 +0.86 5.86 999 WorldValueStudy 2 ICPRS Datafile 6160 Iceland 1981 +3.09 -0.61 +2.48 7.48 920 WorldValueStudy 1 WVS Datafile 4.10.91 1990 +3.31 -0.79 +2.53 7.53 702 WorldValueStudy 2 ICPRS Datafile 6160 Ireland 1981 +2.61 -0.97 +1.63 6.63 1200 WorldValueStudy 1 WVS Datafile 4.10.91 1990 +2.89 -0.90 +2.00 7.00 1000 WorldValueStudy 2 ICPRS Datafile 6160 Italy 1981 +2.18 -1.31 +0.87 5.87 1330 WorldValueStudy 1 WVS Datafile 4.10.91 1990 +2.11 -0.86 +1.25 6.25 2018 WorldValueStudy 2 ICPRS Datafile 6160 Latvia 1990 +2.00 -1.08 +0.92 5.92 903 WorldValueStudy 2 ICPRS Datafile 6160 Lithuania 1990 +1.86 -.126 +0.60 5.60 1000 WorldValueStudy 2 ICPRS Datafile 6160 Netherlands 1980 +1.95 6.95 2000 LifeSituationSurvey CBS 1984B: 127 1981 +2.43 -0.93 +1.51 6.51 1221 WorldValueStudy 1 WVS Datafile 4.10.91 1983 +1.90 6.90 2000 LifeSituationSurvey CBS 1984A: 82 1986 +2.00 7.00 2000 LifeSituationSurvey CBS 1987: 49 1990 +2.83 -1.13 +1.70 6.70 1017 WorldValueStudy 2 ICPRS Datafile 6160 Northern Ireland 1981 +2.85 -1.00 +1.86 6.86 312 WorldValueStudy 1 Halman e.a. 1987:368 1990 +2.72 -1.03 +1.69 6.69 304 WorldValueStudy 2 ICPRS Datafile 6160 Norway 1981 +3.13 -0.86 +2.27 7.27 1240 WorldValueStudy 1 WVS Datafile 4.10.91 1990 +3.27 -0.95 +2.31 7.31 1227 WorldValueStudy 2 WVS Datafile 9.11.92 Poland 1989 +2.75 -1.26 +1.46 6.46 938 WorldValueStudy 2 ICPRS Datafile 6160 Portugal 1990 +2.27 -0.94 +1.32 6.32 1185 WorldValueStudy 2 ICPRS Datafile 6160 Romania 1993 +2.34 -1.63 +1.71 5.71 1103 WorldValueStudy 2 ICPRS Datafile 6160
Happiness in Nations IITable 2.2
94 Representive Nation Samples
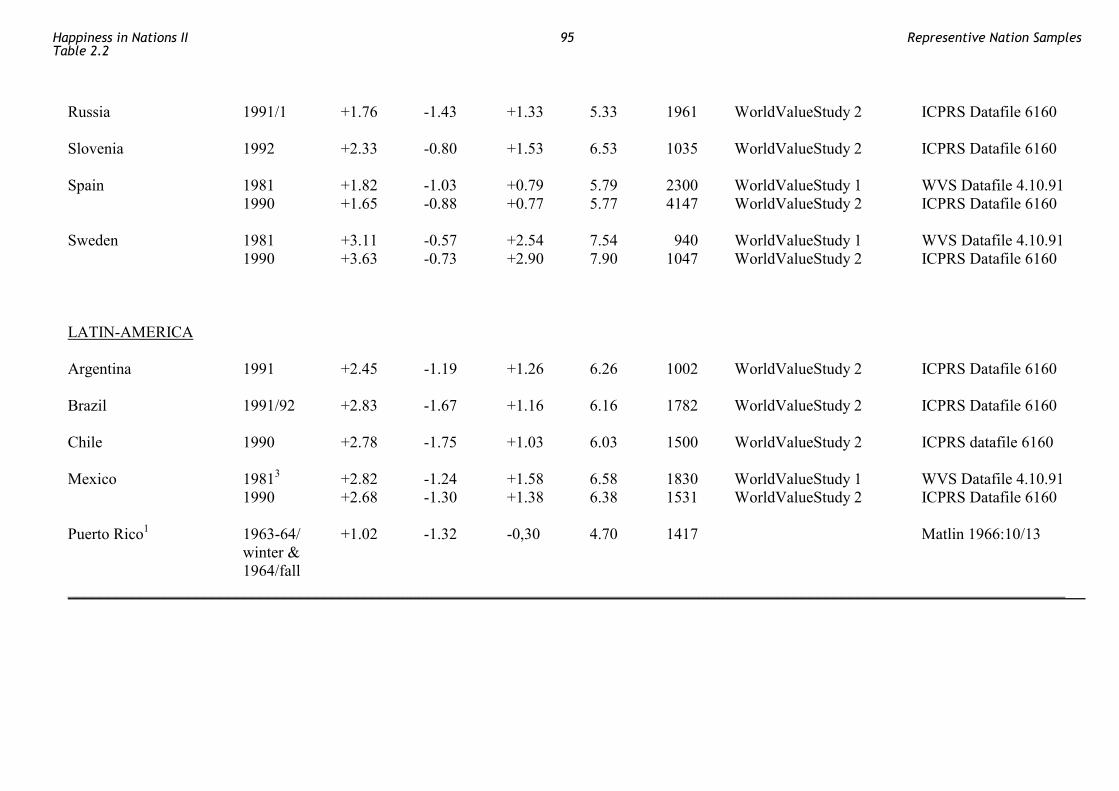
Russia 1991/1 +1.76 -1.43 +1.33 5.33 1961 WorldValueStudy 2 ICPRS Datafile 6160 Slovenia 1992 +2.33 -0.80 +1.53 6.53 1035 WorldValueStudy 2 ICPRS Datafile 6160 Spain 1981 +1.82 -1.03 +0.79 5.79 2300 WorldValueStudy 1 WVS Datafile 4.10.91 1990 +1.65 -0.88 +0.77 5.77 4147 WorldValueStudy 2 ICPRS Datafile 6160 Sweden 1981 +3.11 -0.57 +2.54 7.54 940 WorldValueStudy 1 WVS Datafile 4.10.91 1990 +3.63 -0.73 +2.90 7.90 1047 WorldValueStudy 2 ICPRS Datafile 6160 LATIN-AMERICA Argentina 1991 +2.45 -1.19 +1.26 6.26 1002 WorldValueStudy 2 ICPRS Datafile 6160 Brazil 1991/92 +2.83 -1.67 +1.16 6.16 1782 WorldValueStudy 2 ICPRS Datafile 6160 Chile 1990 +2.78 -1.75 +1.03 6.03 1500 WorldValueStudy 2 ICPRS datafile 6160 Mexico 19813 +2.82 -1.24 +1.58 6.58 1830 WorldValueStudy 1 WVS Datafile 4.10.91 1990 +2.68 -1.30 +1.38 6.38 1531 WorldValueStudy 2 ICPRS Datafile 6160 Puerto Rico1 1963-64/ +1.02 -1.32 -0,30 4.70 1417 Matlin 1966:10/13 winter & 1964/fall _____________________________________________________________________________________________________________________________
Happiness in Nations IITable 2.2
95 Representive Nation Samples

REMARKS 1. Items: Puerto Rico-data : adapted Bradburn Affect Balance Score: 'During the past week, did you ever feel...' yes/no 1. on top of the world? 2. pleased about having accomplished something? 3. proud because someone complimented you on something you had done? 4. very lonely or remote from other people? 5. depressed or very unhappy? 6. bored? 7. so restless you couldn't sit long in a chair? 8. vaguely uneasy about something without knowing why? 9. that you could not do anything simply because you could not start it? Positive affects: items 1,2,3/ Negative affects: items 4,5,6,7,8,9/ Affect Balance M: Positive affect score minus Negative affect score; Means (0-10)
= (M+6)/0.9. 2. Mean scores: The Puerto Rico data are not comparable with the other data. Normally, 5 positive and 5 negative affect items were used, leading to a possible range
from 0 to 5 for Positive and for Negative affect and from -5 to +5 for Affect Balance. In Puerto Rico 3 positive and 6 negative items were used, leading to a possible range from 0 to 3 for Positive affect, from 0 to 6 for Negative affect, and from -6 to 3 for Affect Balance.
US data reported by Smith were presented differently in original. Smith computes ABS by PA - NA + 6. The Affect Balance Scores presented here
are computed by means of the formula PA - NA + 5. Mean scores from WorldValueStudy 1 as reported here are based on weighted samples. The scores differ slightly from those reported by Mastekaasa
(1990: 17) who used unweighted samples.
Happiness in Nations IITable 2.2
96 Representive Nation Samples
3. Sources Allenbacher: surveys by Allensbacher Institute of Public Opinion Research, Allensbach, Switzerland World Value Study was originally named 'European Value Study'. Data were provided by the EVT sekretariat at Tilburg university, the Netherlands
(Louk Halman). Scandinavian Studies were directed by: O. Listhaug (Norway, University of Trondheim), F. Jonsson (Iceland, University of Reykjavik), P. Gundela
and O. Riss (Danmark, University of Aarhus), T. Petterson (Sweden, Univerity of Uppsala). Data on Mexico are uncertain due to incomplete information on the datafile. 4. Regions Britain (Great) is also referred to as "United Kingdom". It involves England, Scotland, Wales and Northern Ireland. Data about Northern Ireland are
presented separately here and are not included in the British score.
Happiness in Nations IITable 2.2
97 Representive Nation Samples

Table 2.3a. Cheerful appearance: 8-aspect rating Interviewer rating of cheefulness in non-verbal behaviour (Allenbacher Ausdrucks-Test: type AFF 5) Rating instructions for the interviewer: RATE THE RESPONDENTS APPEARANCE ON THE FOLLOWING ASPECTS: - Looks ! open (+1) ! evasive (-1) ! hard to say ( 0) - Mouth ! corners upward (+1) ! corners downward (-1) ! hard to say ( 0) - Posture ! easy, jaunty (+1) ! stiff (-1) ! hard to say ( 0) - Movements ! easy, jaunty (+1) ! limited, restrained (-1) ! hard to say ( 0) - Eyes ! large, open (+1) ! small, narrowed (-1) ! hard to say ( 0) - Elbows ! not close to the body (+1) ! close to the body (-1) ! hard to say ( 0) - Lips ! broad, full (+1) ! thin, compressed (-1) ! hard to say ( 0) - Overall ! looks quite cheerful (+1) ! looks not cheerful (-1) ! hard to say ( 0) Total score is simple sum of scores. Possible range -8 to +8.
Happiness in Nations II 98 Representive Nation Samples
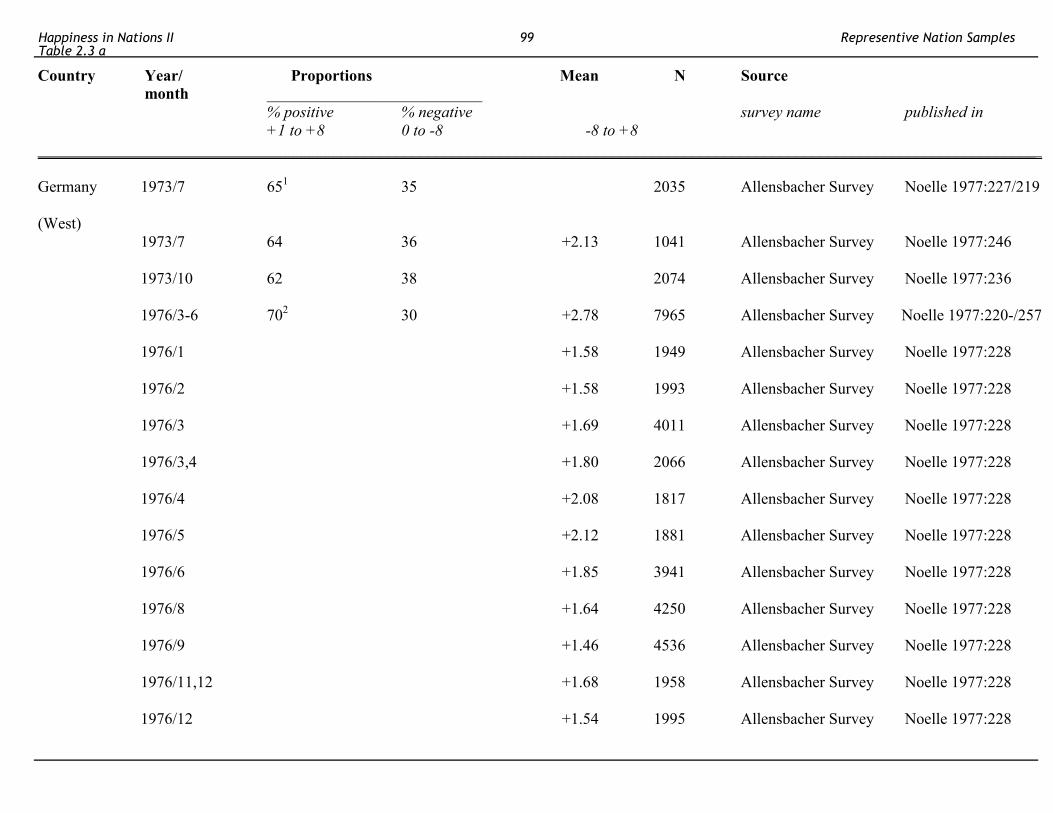
Country Year/ Proportions Mean N Source month ___________________________ % positive % negative survey name published in +1 to +8 0 to -8 -8 to +8 ______________________________________________________________________________________________________________________________ Germany 1973/7 651 35 2035 Allensbacher Survey Noelle 1977:227/219
(West) 1973/7 64 36 +2.13 1041 Allensbacher Survey Noelle 1977:246 1973/10 62 38 2074 Allensbacher Survey Noelle 1977:236 1976/3-6 702 30 +2.78 7965 Allensbacher Survey Noelle 1977:220-/257 1976/1 +1.58 1949 Allensbacher Survey Noelle 1977:228 1976/2 +1.58 1993 Allensbacher Survey Noelle 1977:228 1976/3 +1.69 4011 Allensbacher Survey Noelle 1977:228 1976/3,4 +1.80 2066 Allensbacher Survey Noelle 1977:228 1976/4 +2.08 1817 Allensbacher Survey Noelle 1977:228 1976/5 +2.12 1881 Allensbacher Survey Noelle 1977:228 1976/6 +1.85 3941 Allensbacher Survey Noelle 1977:228 1976/8 +1.64 4250 Allensbacher Survey Noelle 1977:228 1976/9 +1.46 4536 Allensbacher Survey Noelle 1977:228 1976/11,12 +1.68 1958 Allensbacher Survey Noelle 1977:228 1976/12 +1.54 1995 Allensbacher Survey Noelle 1977:228
Happiness in Nations IITable 2.3 a
99 Representive Nation Samples
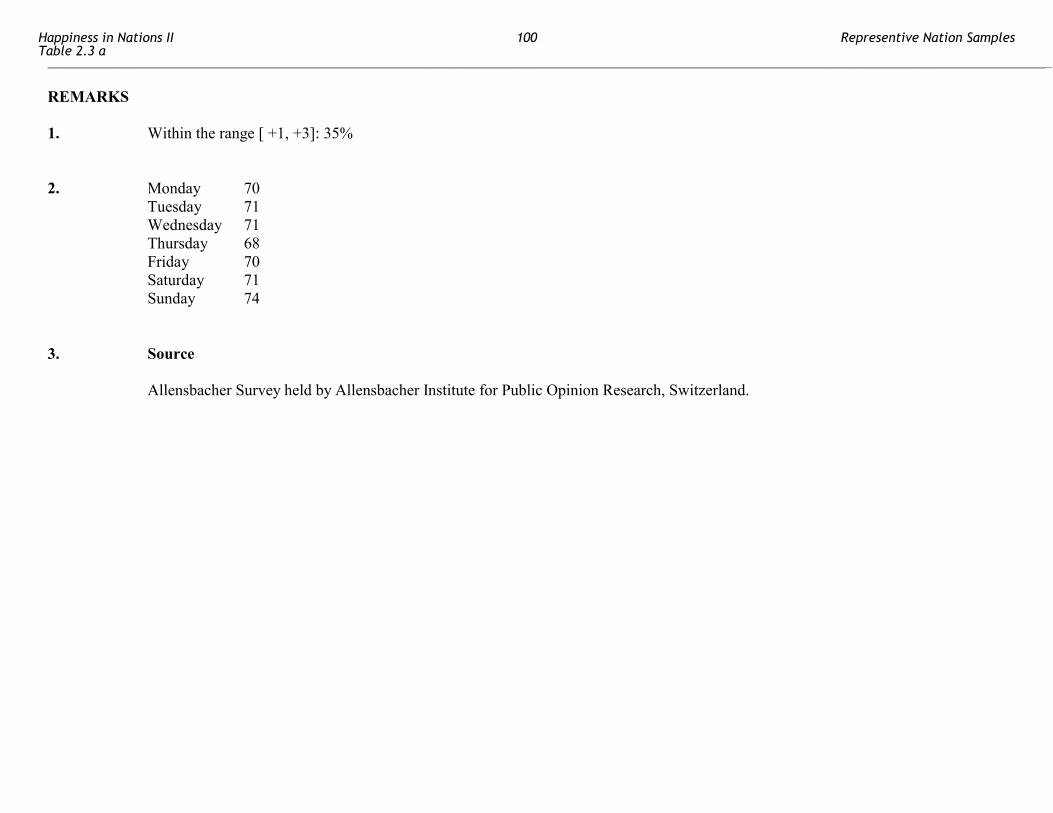
______________________________________________________________________________________________________________________________ REMARKS 1. Within the range [ +1, +3]: 35% 2. Monday 70 Tuesday 71 Wednesday 71 Thursday 68 Friday 70 Saturday 71 Sunday 74 3. Source Allensbacher Survey held by Allensbacher Institute for Public Opinion Research, Switzerland.
Happiness in Nations IITable 2.3 a
100 Representive Nation Samples
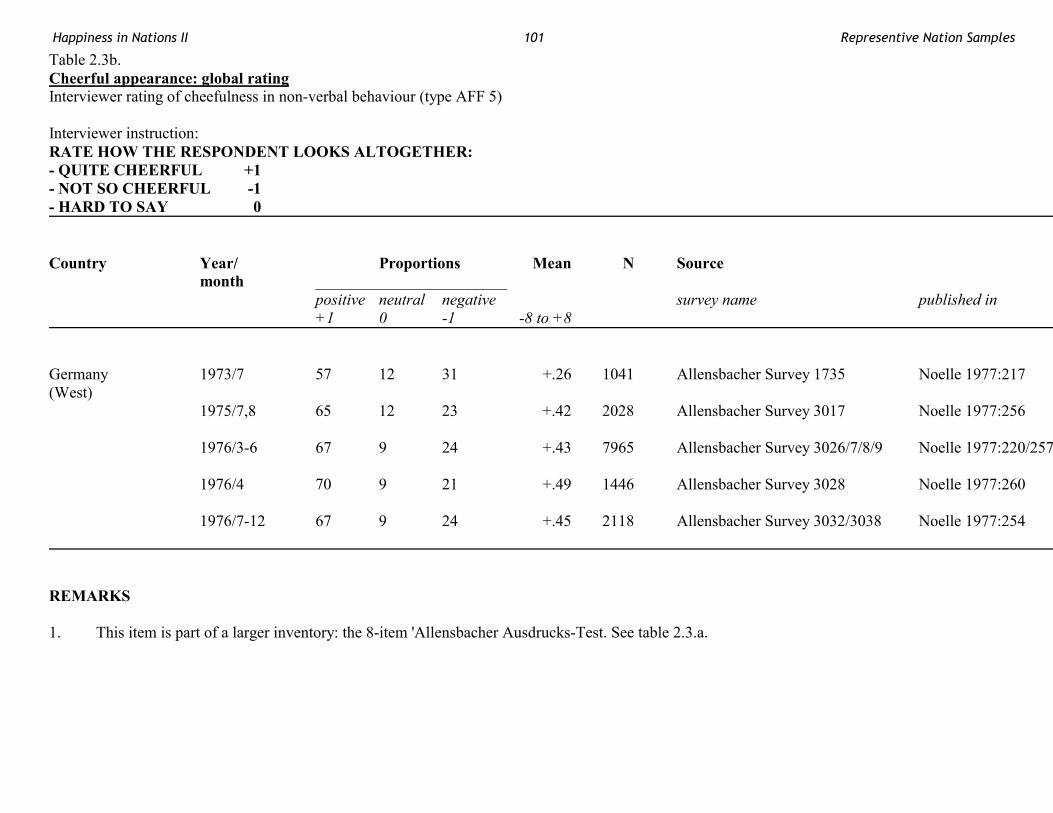
Table 2.3b. Cheerful appearance: global rating Interviewer rating of cheefulness in non-verbal behaviour (type AFF 5) Interviewer instruction: RATE HOW THE RESPONDENT LOOKS ALTOGETHER: - QUITE CHEERFUL +1 - NOT SO CHEERFUL -1 - HARD TO SAY 0
Country Year/ Proportions Mean N Source month ________________________ positive neutral negative survey name published in +1 0 -1 -8 to +8
Germany 1973/7 57 12 31 +.26 1041 Allensbacher Survey 1735 Noelle 1977:217 (West) 1975/7,8 65 12 23 +.42 2028 Allensbacher Survey 3017 Noelle 1977:256 1976/3-6 67 9 24 +.43 7965 Allensbacher Survey 3026/7/8/9 Noelle 1977:220/257 1976/4 70 9 21 +.49 1446 Allensbacher Survey 3028 Noelle 1977:260 1976/7-12 67 9 24 +.45 2118 Allensbacher Survey 3032/3038 Noelle 1977:254
REMARKS 1. This item is part of a larger inventory: the 8-item 'Allensbacher Ausdrucks-Test. See table 2.3.a.
Happiness in Nations II 101 Representive Nation Samples
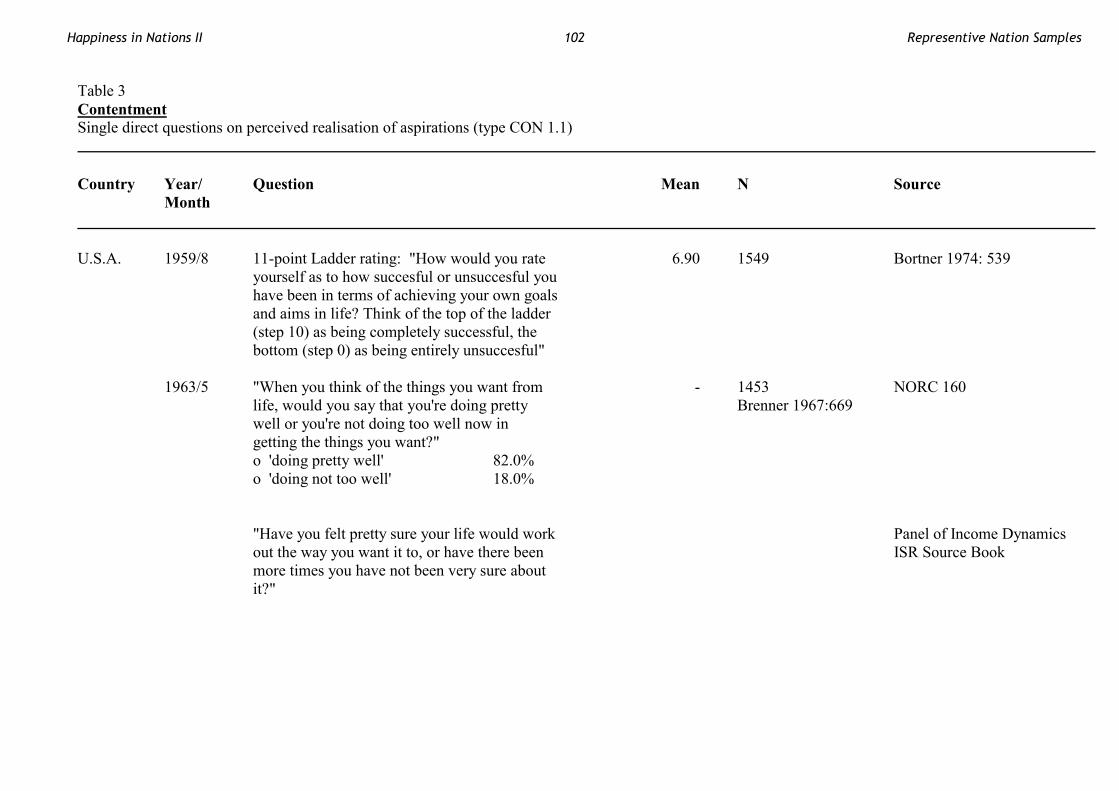
Table 3 Contentment Single direct questions on perceived realisation of aspirations (type CON 1.1)
Country Year/ Question Mean N Source Month ___________________________________________________________________________________________________________________________ U.S.A. 1959/8 11-point Ladder rating: "How would you rate 6.90 1549 Bortner 1974: 539 yourself as to how succesful or unsuccesful you have been in terms of achieving your own goals and aims in life? Think of the top of the ladder (step 10) as being completely successful, the bottom (step 0) as being entirely unsuccesful" 1963/5 "When you think of the things you want from - 1453 NORC 160 life, would you say that you're doing pretty Brenner 1967:669 well or you're not doing too well now in getting the things you want?" o 'doing pretty well' 82.0% o 'doing not too well' 18.0% "Have you felt pretty sure your life would work Panel of Income Dynamics out the way you want it to, or have there been ISR Source Book more times you have not been very sure about it?"
Happiness in Nations II 102 Representive Nation Samples
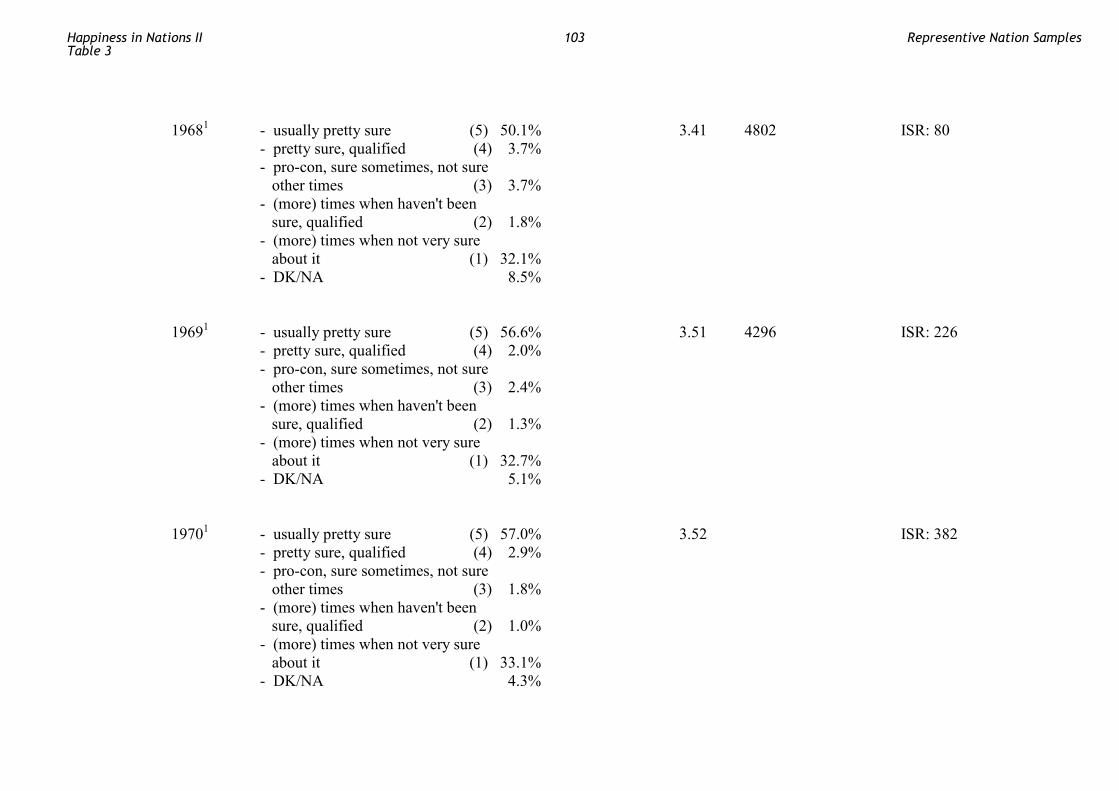
19681 - usually pretty sure (5) 50.1% 3.41 4802 ISR: 80 - pretty sure, qualified (4) 3.7% - pro-con, sure sometimes, not sure other times (3) 3.7% - (more) times when haven't been sure, qualified (2) 1.8% - (more) times when not very sure about it (1) 32.1% - DK/NA 8.5% 19691 - usually pretty sure (5) 56.6% 3.51 4296 ISR: 226 - pretty sure, qualified (4) 2.0% - pro-con, sure sometimes, not sure other times (3) 2.4% - (more) times when haven't been sure, qualified (2) 1.3% - (more) times when not very sure about it (1) 32.7% - DK/NA 5.1% 19701 - usually pretty sure (5) 57.0% 3.52 ISR: 382 - pretty sure, qualified (4) 2.9% - pro-con, sure sometimes, not sure other times (3) 1.8% - (more) times when haven't been sure, qualified (2) 1.0% - (more) times when not very sure about it (1) 33.1% - DK/NA 4.3%
Happiness in Nations IITable 3
103 Representive Nation Samples
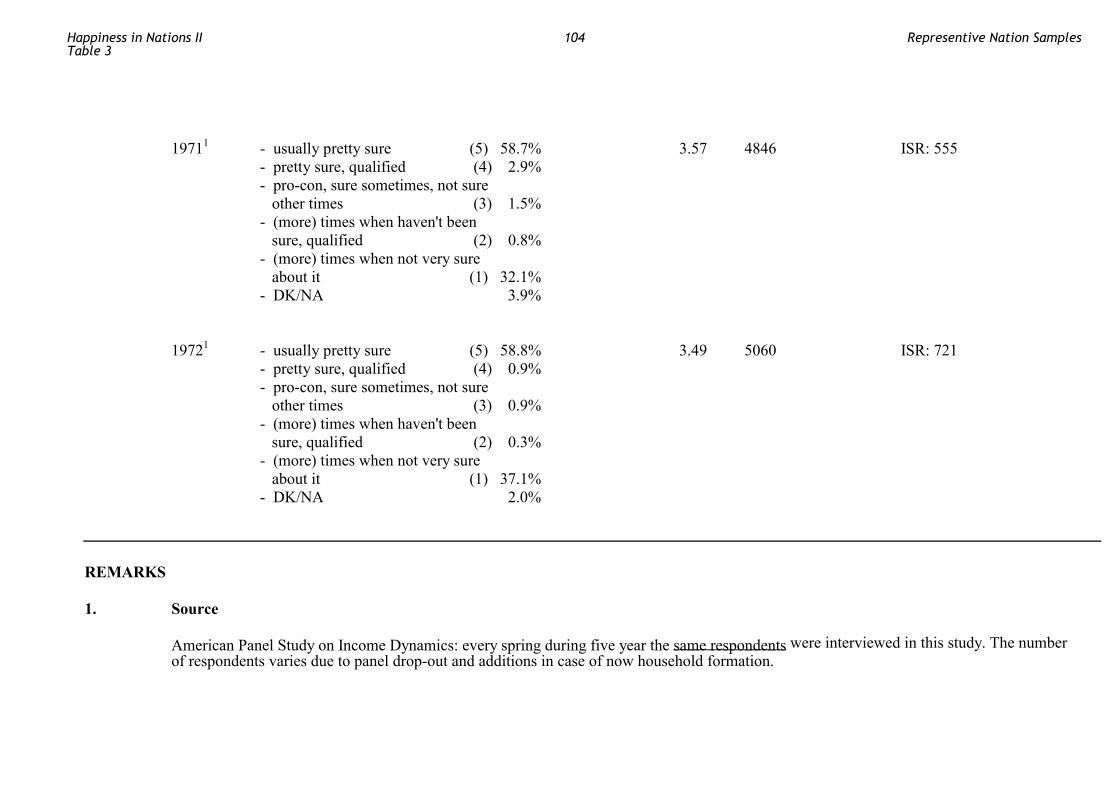
19711 - usually pretty sure (5) 58.7% 3.57 4846 ISR: 555 - pretty sure, qualified (4) 2.9% - pro-con, sure sometimes, not sure other times (3) 1.5% - (more) times when haven't been sure, qualified (2) 0.8% - (more) times when not very sure about it (1) 32.1% - DK/NA 3.9% 19721 - usually pretty sure (5) 58.8% 3.49 5060 ISR: 721 - pretty sure, qualified (4) 0.9% - pro-con, sure sometimes, not sure other times (3) 0.9% - (more) times when haven't been sure, qualified (2) 0.3% - (more) times when not very sure about it (1) 37.1% - DK/NA 2.0%
REMARKS 1. Source American Panel Study on Income Dynamics: every spring during five year the same respondents were interviewed in this study. The number
of respondents varies due to panel drop-out and additions in case of now household formation.
Happiness in Nations IITable 3
104 Representive Nation Samples
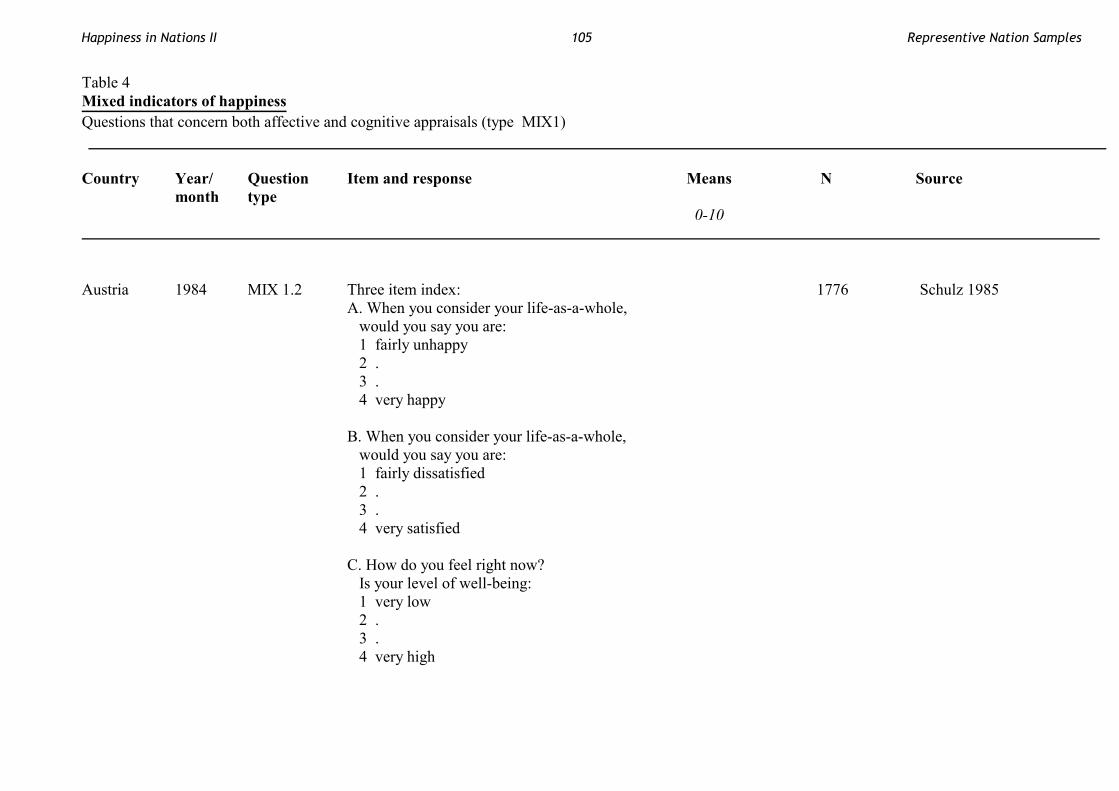
Table 4 Mixed indicators of happiness Questions that concern both affective and cognitive appraisals (type MIX1)
Country Year/ Question Item and response Means N Source month type 0-10 Austria 1984 MIX 1.2 Three item index: 1776 Schulz 1985 A. When you consider your life-as-a-whole, would you say you are: 1 fairly unhappy 2 . 3 . 4 very happy B. When you consider your life-as-a-whole, would you say you are: 1 fairly dissatisfied 2 . 3 . 4 very satisfied C. How do you feel right now? Is your level of well-being: 1 very low 2 . 3 . 4 very high
Happiness in Nations II 105 Representive Nation Samples
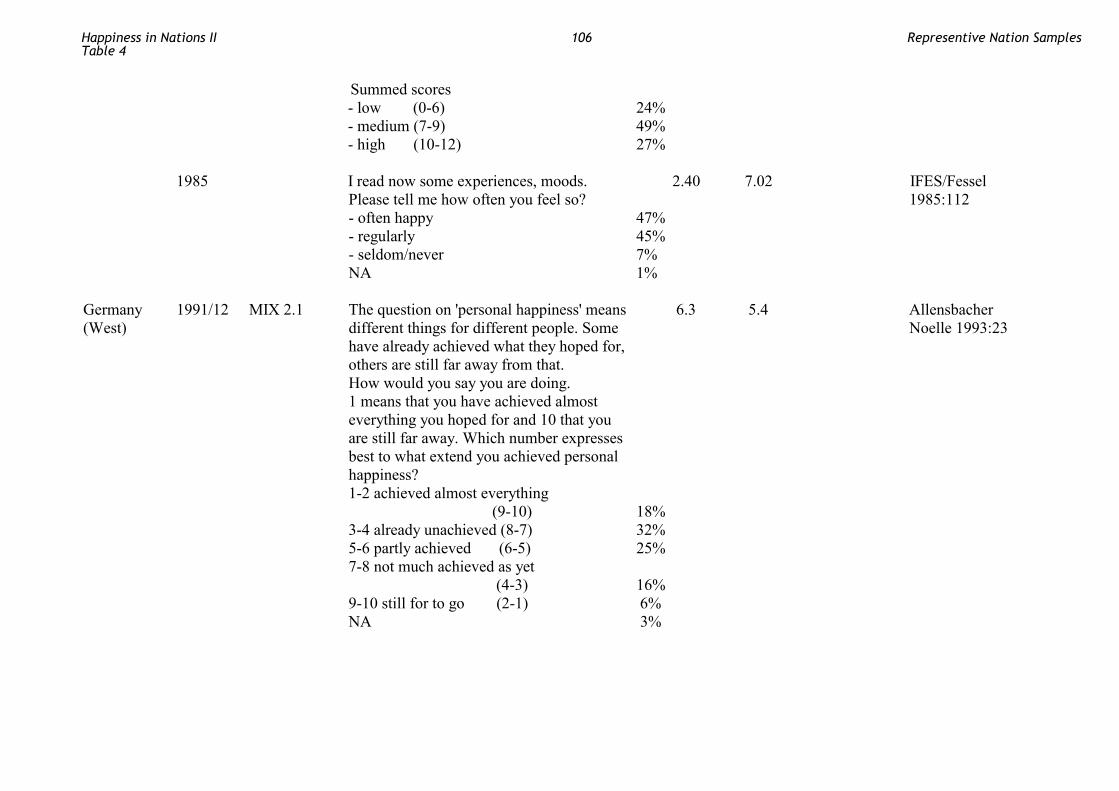
Summed scores - low (0-6) 24% - medium (7-9) 49% - high (10-12) 27% 1985 I read now some experiences, moods. 2.40 7.02 IFES/Fessel Please tell me how often you feel so? 1985:112 - often happy 47% - regularly 45% - seldom/never 7% NA 1% Germany 1991/12 MIX 2.1 The question on 'personal happiness' means 6.3 5.4 Allensbacher (West) different things for different people. Some Noelle 1993:23 have already achieved what they hoped for, others are still far away from that. How would you say you are doing. 1 means that you have achieved almost everything you hoped for and 10 that you are still far away. Which number expresses best to what extend you achieved personal happiness? 1-2 achieved almost everything (9-10) 18% 3-4 already unachieved (8-7) 32% 5-6 partly achieved (6-5) 25% 7-8 not much achieved as yet (4-3) 16% 9-10 still for to go (2-1) 6% NA 3%
Happiness in Nations IITable 4
106 Representive Nation Samples
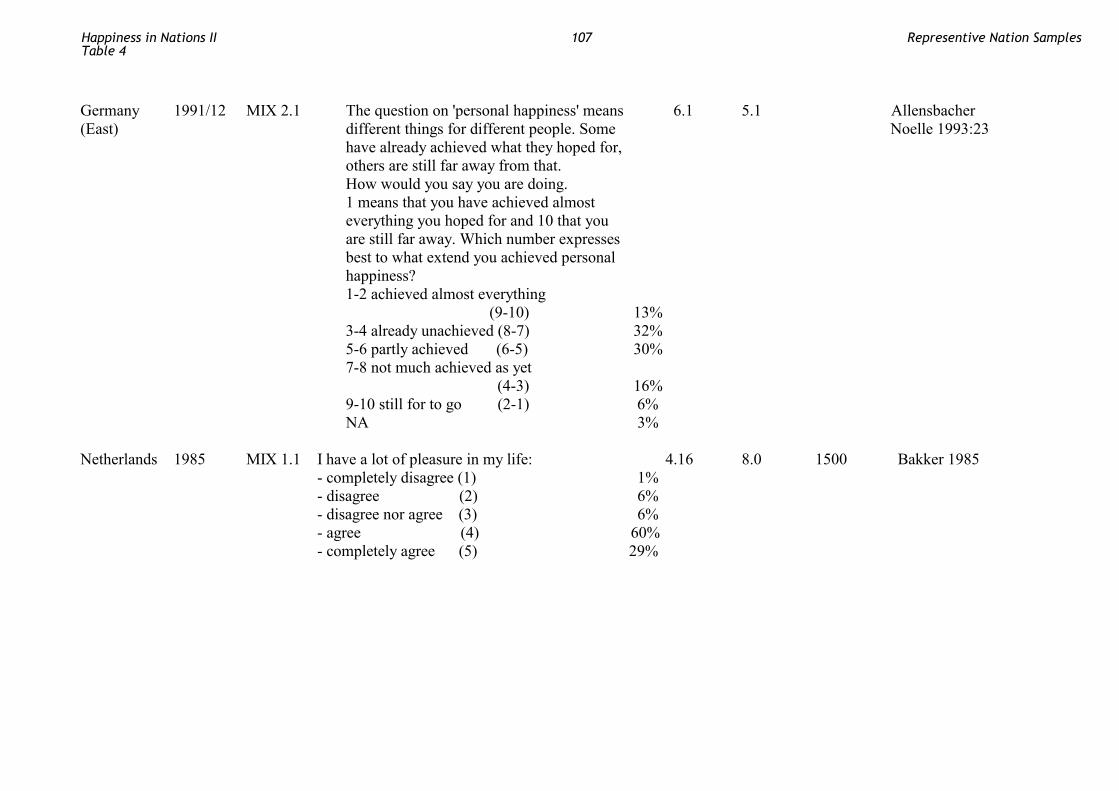
Germany 1991/12 MIX 2.1 The question on 'personal happiness' means 6.1 5.1 Allensbacher (East) different things for different people. Some Noelle 1993:23 have already achieved what they hoped for, others are still far away from that. How would you say you are doing. 1 means that you have achieved almost everything you hoped for and 10 that you are still far away. Which number expresses best to what extend you achieved personal happiness? 1-2 achieved almost everything (9-10) 13% 3-4 already unachieved (8-7) 32% 5-6 partly achieved (6-5) 30% 7-8 not much achieved as yet (4-3) 16% 9-10 still for to go (2-1) 6% NA 3% Netherlands 1985 MIX 1.1 I have a lot of pleasure in my life: 4.16 8.0 1500 Bakker 1985 - completely disagree (1) 1% - disagree (2) 6% - disagree nor agree (3) 6% - agree (4) 60% - completely agree (5) 29%
Happiness in Nations IITable 4
107 Representive Nation Samples
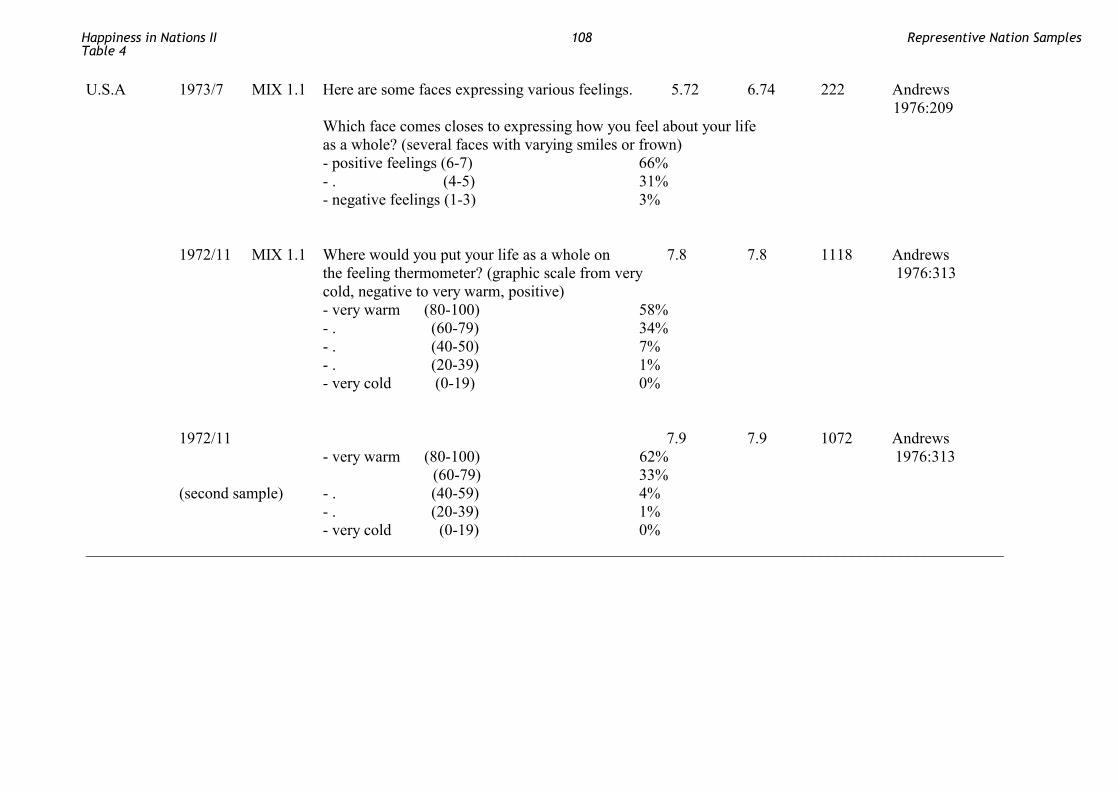
U.S.A 1973/7 MIX 1.1 Here are some faces expressing various feelings. 5.72 6.74 222 Andrews
1976:209 Which face comes closes to expressing how you feel about your life as a whole? (several faces with varying smiles or frown) - positive feelings (6-7) 66% - . (4-5) 31% - negative feelings (1-3) 3% 1972/11 MIX 1.1 Where would you put your life as a whole on 7.8 7.8 1118 Andrews the feeling thermometer? (graphic scale from very 1976:313 cold, negative to very warm, positive) - very warm (80-100) 58% - . (60-79) 34% - . (40-50) 7% - . (20-39) 1% - very cold (0-19) 0% 1972/11 7.9 7.9 1072 Andrews - very warm (80-100) 62% 1976:313 (60-79) 33% (second sample) - . (40-59) 4% - . (20-39) 1% - very cold (0-19) 0% ___________________________________________________________________________________________________________________
Happiness in Nations IITable 4
108 Representive Nation Samples