Embed Size (px)
Citation preview

Flash to read and share!
Consult this publication on line at http://dx.doi.org/10.1787/sti_scoreboard-2013-en.
This work is published on the OECD iLibrary, which gathers all OECD books, periodicals and statistical databases.Visit www.oecd-ilibrary.org for more information.
OECD Science, Technology and Industry Scoreboard 2013INNOVATION FOR GROWTH
Science, technology, innovation and entrepreneurship – which foster competitiveness, productivity, and job creation – are important mechanisms for encouraging sustainable growth. Over 250 indicators in the OECD Science, Technology and Industry (STI) Scoreboard show how OECD and major non-OECD economies are performing in a wide range of areas to help governments design more effective and effi cient policies and monitor progress towards their desired goals.
The charts and underlying data in the STI Scoreboard 2013 are available for download and for the fi rst time, selected indicators contain additional data expanding the time and country coverage of the print edition.
Contents
• Knowledge economies: Trends and features
• Building knowledge
• Connecting to knowledge
• Targeting new growth areas
• Unleashing innovation in fi rms
• Competing in the knowledge economy
• Participating in the global economy
For more information about the OECD STI Scoreboard, see www.oecd.org/sti/scoreboard.htm
OE
CD
Science, Tech
nolo
gy an
d In
du
stry Sco
rebo
ard 2013 IN
NO
VA
TIO
N FO
R G
RO
WT
H
OECD Science, Technology and Industry Scoreboard 2013INNOVATION FOR GROWTH
ISBN 978-92-64-20073-992 2013 05 1 P 9HSTCQE*caahdj+

OECD Science,Technology and Industry
Scoreboard 2013
This work is published on the responsibility of the Secretary-General of the OECD. The
opinions expressed and arguments employed herein do not necessarily reflect the official
views of the Organisation or of the governments of its member countries.
This document and any map included herein are without prejudice to the status of or
sovereignty over any territory, to the delimitation of international frontiers and boundaries
and to the name of any territory, city or area.
ISBN 978-92-64-20073-9 (print)ISBN 978-92-64-20500-0 (PDF)ISBN 978-92-64-203181 (HTML)
Biennial:ISSN 1562-983X (print)ISSN 2072-5345 (online)
1. Note by Turkey:
The information in this document with reference to “Cyprus” relates to the southern part of the Island. There is nosingle authority representing both Turkish and Greek Cypriot people on the Island. Turkey recognises the TurkishRepublic of Northern Cyprus (TRNC). Until a lasting and equitable solution is found within the context of the UnitedNations, Turkey shall preserve its position concerning the “Cyprus issue”.
2. Note by all the European Union Member States of the OECD and the European Union:
The Republic of Cyprus is recognised by all members of the United Nations with the exception of Turkey. Theinformation in this document relates to the area under the effective control of the Government of the Republic ofCyprus.
The statistical data for Israel are supplied by and under the responsibility of the relevant Israeli authorities or thirdparty. The use of such data by the OECD is without prejudice to the status of the Golan Heights, East Jerusalem andIsraeli settlements in the West Bank under the terms of international law.
Photo credits: Cover © Sergey Nivens/Shutterstock.com; © Redshinestudio/Shutterstock.com.
Corrigenda to OECD publications may be found on line at: www.oecd.org/publishing/corrigenda.
© OECD 2013
You can copy, download or print OECD content for your own use, and you can include excerpts from OECD publications, databases and
multimedia products in your own documents, presentations, blogs, websites and teaching materials, provided that suitable
acknowledgment of the source and copyright owner is given. All requests for public or commercial use and translation rights should be
submitted to [email protected]. Requests for permission to photocopy portions of this material for public or commercial use shall be
addressed directly to the Copyright Clearance Center (CCC) at [email protected] or the Centre français d'exploitation du droit de copie
(CFC) at [email protected].
Please cite this publication as:OECD (2013), OECD Science, Technology and Industry Scoreboard 2013, OECD Publishing.http://dx.doi.org/10.1787/sti_scoreboard-2013-en

FOREWORD
Foreword
The OECD Science, Technology and Industry Scoreboard 2013 draws on the latest
internationally comparable data to uncover the strengths of OECD and other leading economies and
explore the continuing challenges to overcome the effects of the recent financial and economic crises.
It features indicators traditionally used to monitor developments in science, technology, innovation
and industry, and complements them with new and experimental indicators that provide new
insights into areas of policy interest.
The STI Scoreboard is not about “ranking” countries or developing composite indicators. It is
about giving policy makers and analysts the means of comparing economies with others of a similar
size or with a similar structure and monitor progress towards desired national or supranational
policy goals. It draws on the OECD’s efforts to build the data infrastructure needed to link actors,
outcomes and impacts; it highlights the potential and the limits of certain metrics and points to
directions for further work.
Indicators are pointers. They do not address causal relations. Moreover, the validity of a set of
indicators depends on its use. The selected indicators have been developed with the following criteria
in mind:
● Indicators should be based on high-quality statistics and robust analytical principles and be
measurable internationally, over time and with prospects of improvement.
● Indicators should be relevant, particularly for decision makers.
● Experimental indicators that complement more established ones bring new perspectives and
advance the measurement agenda. They help to stimulate continuing and new policy debates and
uncover new dynamics.
The first chapter, Knowledge economies: trends and features, provides a broad perspective.
It looks at innovation, firm dynamics, productivity and jobs against the backdrop of the economic
crisis. It explores the new geography of growth through the lenses of global value chains, the
changing landscape of innovation, the features of science today and the characteristics of innovation
beyond formal research and development.
Six thematic chapters focus on areas of key policy interest:
● Building knowledge looks at the knowledge assets that many firms and governments view as
their current and future sources of long-term sustainable growth. It focuses on indicators of
knowledge-based capital and on the jobs and employment related to it, scientific skills and
education, and investment in research. It also presents experimental indicators of public funding
and new estimates of R&D tax incentives.
● Connecting to knowledge helps inform the policy debate with a set of metrics on the variety
and nature of mechanisms for knowledge exchange. Among the indicators presented are the
impact of scientific collaboration (based on patent citations) and science-industry linkages (based
on citations of non-patent literature in patent documents). Also included are new indicators on
OECD SCIENCE, TECHNOLOGY AND INDUSTRY SCOREBOARD 2013 © OECD 2013 3
FOREWORD
researcher mobility that track the careers of scientists who publish in scholarly journals and on the
extent of firms’ collaboration in innovation processes.
● Targeting new growth areas examines the direction of countries’ scientific efforts and the
technologies on which they build their comparative advantage. It presents R&D and innovation
indicators in biotechnology and nanotechnology and in health, environmental and information and
communication technologies, and looks at developments in smart ICT infrastructure. It also
reveals how the development of technologies accelerates over time and how innovations emerge
from the combination of different technologies.
● Unleashing innovation in firms is concerned with the dynamism of the business sector and
shows the strong contribution of young firms to job creation using new microdata-based
indicators. It looks at the main ways in which firms innovate and proposes a novel indicator on the
intellectual property bundle to point to firms’ joint use of patents, trademarks and industrial
designs to protect their innovations. New data on registered designs provide information on how
countries protect creativity. Other indicators address the extent to which governments create the
conditions for young innovative firms to grow and the broader policy environment for innovation.
● Competing in the knowledge economy looks at how countries seek to build their competitive
strengths and uses a wide range of more sophisticated indicators than those that are generally
available. It considers industrial specialisation and diversification, R&D and trade specialisation,
technological advantages and relative strengths, as well as the characteristics of innovative firms
and their use of new technologies in business processes.
● Participating in the global economy draws out the implications of structural characteristics
for economies’ participation in global value chains. Indicators related to firms’ size, survival and
growth and to foreign affiliates accompany employment patterns in key industries and linkages
between manufacturing and services. Novel indicators building on the OECD-WTO Trade in Value
Added Database shed new light on economies’ participation in global trade and value chains and
the implications of this participation for jobs.
The main audience of the STI Scoreboard is policy analysts with a good understanding of the use
of indicators and all those engaged in producing indicators for analytical or policy-making purposes.
A few paragraphs introduce each indicator and offer some interpretation. They are accompanied by
a box called “Definitions” for those less familiar with the methods used. A box titled “Measurability”
summarises measurement challenges, gaps and recent initiatives.
All charts and underlying data can be downloaded via the Statlinks (hyperlink to a webpage).
For the first time, additional data that expand the coverage of countries and time periods are
available in the Statlinks. New tools to visualise indicators and help users develop thematic and
country profiles based on their own interests will be available on the STI Scoreboard website.
OECD SCIENCE, TECHNOLOGY AND INDUSTRY SCOREBOARD 2013 © OECD 20134

ACKNOWLEDGMENTS
Acknowledgments
This volume is the result of a collective effort by the Economic Analysis and Statistics
Division (EAS) of the OECD Directorate for Science, Technology and Industry (DSTI), under
the guidance of Alessandra Colecchia. Lead authors were Alessandra Colecchia, Andrea de
Panizza, Fernando Galindo-Rueda, Vladimir Lopez-Bassols, Mariagrazia Squicciarini and
Colin Webb with contributions from Silvia Appelt, Laudeline Auriol, Brigitte van Beuzekom,
Catherine Bignon, Brunella Boselli, Agnès Cimper, Hélène Dernis, Chrystyna Harpluk,
Pedro Herrera-Gimenez, Elif Köksal-Oudot, Guillaume Kpodar, Marie Le Mouel, Valentine
Millot, Pierre Montagnier, Asako Okamura, Fabien Verger, Bo Werth and Norihiko Yamano.
The contributions of Mari Jibu (Japan Science and Technology Agency) and Roberto de
Pinho (Ministry of Science, Technology and Innovation, Brazil) as visiting experts at EAS, on
the analysis of scientist mobility and science-technology links, respectively, are greatly
appreciated. The analysis of science and technology links relies on an algorithm developed
by Thomson Reuters and Japan’s Science and Technology Agency matching patent and
scientific publication databases.
Brigitte van Beuzekom and Elif Köksal-Oudot coordinated the production process of
this publication. Andrew Wyckoff and Dirk Pilat provided overall guidance and comments.
Others in DSTI and elsewhere in the OECD made available their respective areas of
expertise: Nadim Ahmad, Frédéric Bourassa, Chiara Criscuolo, Koen de Backer, Rudolf Van
Der Berg, Isabelle Desnoyers-James, Agustín Díaz-Pinés, Peter Gal, Corinne Heckmann,
Joseph Loux, Mariarosa Lunati, Carlo Menon, Laurent Moussiegt, Filipe Silva and Karen
Wilson.
The SCImago Research Group (CSIC, Spain), www.scimago.es, led by Félix de Moya-
Anegón with contributions from Carmen López-Illescas, Zaida Chinchilla-Rodríguez and
Elena Corera-Álvarez, collaborated with the OECD in designing and preparing new
indicators of scientific production, collaboration and impact using Elsevier’s Scopus data.
EAS matched 16.2 million patents in the EPO’s Worldwide Patent Statistical Database
(PATSTAT) and 2.2 million OHIM and USPTO trademarks against 1.2 million companies in
Bureau van Dijk’s ORBIS© database thanks to the efficient matching software developed for
the OECD by IDENER, Seville, www.idener.es/nosotros_en.html).
Several indicators are based on special data requests to national statistical offices or
ministries. The time and help granted by the OECD National Experts for Science and
Technology Indicators (NESTI), their colleagues and organisations have been instrumental
to this publication.
Preliminary results from the DYNEMP project on firm-level dynamics, under the aegis
of the OECD Working Party on Industry Analysis (WPIA), have kindly been made available
by teams in 15 countries: Werner Hölzl (Austria – WIFO); Hilde Spinnewyn, Chantal Kegels,
Michel Dumont (Belgium – Federal Planning Bureau); Gabriel Lopes de Ulyssea, Carlos
OECD SCIENCE, TECHNOLOGY AND INDUSTRY SCOREBOARD 2013 © OECD 2013 5

ACKNOWLEDGMENTS
Henrique Leite Corseuil, Fernanda de Negri (Brazil – IPEA); Mika Maliranta (Finland – ETLA
and Statistics Finland); Lionel Nesta, Flora Bellone (France – GREDEG, CNSR and OFCE,
Sciences Po); Adrienn Szep Szollosine, Erzsebet Eperjesi Lindnerne, Gabor Katay, Peter
Harasztosi (Hungary – Central Bank of Hungary and Central Statistical Office of Hungary);
Stefano Costa (Italy – ISTAT); Kyoji Fukao, Kenta Ikeuchi (Japan – Hitotsubashi University
and National Institute of Science and Technology Policy); Leila Ben-Aoun, Anne Dubrocard,
Michel Prombo (Luxembourg – STATEC); Michael Polder (Netherlands – CBS); Lynda
Sanderson, Richard Fabling, Gerald Minnee, Hamish Hill (New Zealand – New Zealand
Treasury, Statistics New Zealand, Motu Economic and Public Policy Research); Arvid
Raknerud (Norway – Statistics Norway); Valentin Llorente Garcia, Luis Esteban Barbado
Miguel, Jose Manuel Almendros Ulibarri, Javier Agustin Munoz Carabias (Spain – Ministry of
Industry, Energy and Tourism and Spanish Statistical Office); Eva Hagsten, Jan Selen,
Monica Nelsonedberg (Sweden – Statistics Sweden); Javier Miranda (Census Bureau of the
United States).
OECD SCIENCE, TECHNOLOGY AND INDUSTRY SCOREBOARD 2013 © OECD 20136

TABLE OF CONTENTS
Table of contents
Acknowledgments . . . . . . . . . . . . . . . . . . . . . . . . . . . . . . . . . . . . . . . . . . . . . . . . . . . . . . . . . . 5
Reader’s Guide . . . . . . . . . . . . . . . . . . . . . . . . . . . . . . . . . . . . . . . . . . . . . . . . . . . . . . . . . . . . . 10
Executive summary . . . . . . . . . . . . . . . . . . . . . . . . . . . . . . . . . . . . . . . . . . . . . . . . . . . . . . . . . 13
1. Knowledge economies: Trends and features . . . . . . . . . . . . . . . . . . . . . . . . . . . . . . . . . 17
Sources of growth and the crisis . . . . . . . . . . . . . . . . . . . . . . . . . . . . . . . . . . . . . . . . . . 18
The new geography of growth . . . . . . . . . . . . . . . . . . . . . . . . . . . . . . . . . . . . . . . . . . . . 40
The changing landscape of innovation . . . . . . . . . . . . . . . . . . . . . . . . . . . . . . . . . . . . . 50
Science and innovation today. . . . . . . . . . . . . . . . . . . . . . . . . . . . . . . . . . . . . . . . . . . . . 57
Notes. . . . . . . . . . . . . . . . . . . . . . . . . . . . . . . . . . . . . . . . . . . . . . . . . . . . . . . . . . . . . . . . . . 70
References . . . . . . . . . . . . . . . . . . . . . . . . . . . . . . . . . . . . . . . . . . . . . . . . . . . . . . . . . . . . . 81
2. Building knowledge . . . . . . . . . . . . . . . . . . . . . . . . . . . . . . . . . . . . . . . . . . . . . . . . . . . . . . 85
1. Investment in knowledge . . . . . . . . . . . . . . . . . . . . . . . . . . . . . . . . . . . . . . . . . . . . . 86
2. Human resources and knowledge-based capital . . . . . . . . . . . . . . . . . . . . . . . . . 88
3. Learning for innovation . . . . . . . . . . . . . . . . . . . . . . . . . . . . . . . . . . . . . . . . . . . . . . 90
4. Skills for innovation. . . . . . . . . . . . . . . . . . . . . . . . . . . . . . . . . . . . . . . . . . . . . . . . . . 92
5. New doctorates . . . . . . . . . . . . . . . . . . . . . . . . . . . . . . . . . . . . . . . . . . . . . . . . . . . . . 94
6. Doctorate holders. . . . . . . . . . . . . . . . . . . . . . . . . . . . . . . . . . . . . . . . . . . . . . . . . . . . 96
7. Researchers . . . . . . . . . . . . . . . . . . . . . . . . . . . . . . . . . . . . . . . . . . . . . . . . . . . . . . . . . 98
8. R&D . . . . . . . . . . . . . . . . . . . . . . . . . . . . . . . . . . . . . . . . . . . . . . . . . . . . . . . . . . . . . . . 100
9. Higher education and basic research . . . . . . . . . . . . . . . . . . . . . . . . . . . . . . . . . . . 102
10. Business R&D . . . . . . . . . . . . . . . . . . . . . . . . . . . . . . . . . . . . . . . . . . . . . . . . . . . . . . . 104
11. R&D tax incentives. . . . . . . . . . . . . . . . . . . . . . . . . . . . . . . . . . . . . . . . . . . . . . . . . . . 106
12. International funding of R&D . . . . . . . . . . . . . . . . . . . . . . . . . . . . . . . . . . . . . . . . . 108
Notes. . . . . . . . . . . . . . . . . . . . . . . . . . . . . . . . . . . . . . . . . . . . . . . . . . . . . . . . . . . . . . . . . . 110
References . . . . . . . . . . . . . . . . . . . . . . . . . . . . . . . . . . . . . . . . . . . . . . . . . . . . . . . . . . . . . 118
3. Connecting to knowledge . . . . . . . . . . . . . . . . . . . . . . . . . . . . . . . . . . . . . . . . . . . . . . . . . 121
1. R&D and knowledge flows . . . . . . . . . . . . . . . . . . . . . . . . . . . . . . . . . . . . . . . . . . . . 122
2. Open innovation. . . . . . . . . . . . . . . . . . . . . . . . . . . . . . . . . . . . . . . . . . . . . . . . . . . . . 124
3. Collaboration on innovation. . . . . . . . . . . . . . . . . . . . . . . . . . . . . . . . . . . . . . . . . . . 126
4. International collaboration . . . . . . . . . . . . . . . . . . . . . . . . . . . . . . . . . . . . . . . . . . . 128
5. Skills mobility . . . . . . . . . . . . . . . . . . . . . . . . . . . . . . . . . . . . . . . . . . . . . . . . . . . . . . 130
6. Researchers on the move . . . . . . . . . . . . . . . . . . . . . . . . . . . . . . . . . . . . . . . . . . . . . 132
7. Research excellence . . . . . . . . . . . . . . . . . . . . . . . . . . . . . . . . . . . . . . . . . . . . . . . . . 134
8. Science for innovation. . . . . . . . . . . . . . . . . . . . . . . . . . . . . . . . . . . . . . . . . . . . . . . . 136
9. From knowledge to inventions. . . . . . . . . . . . . . . . . . . . . . . . . . . . . . . . . . . . . . . . . 138
OECD SCIENCE, TECHNOLOGY AND INDUSTRY SCOREBOARD 2013 © OECD 2013 7

TABLE OF CONTENTS
10. Inventions across borders . . . . . . . . . . . . . . . . . . . . . . . . . . . . . . . . . . . . . . . . . . . . 140
11. Technology flows and markets . . . . . . . . . . . . . . . . . . . . . . . . . . . . . . . . . . . . . . . . 142
Notes. . . . . . . . . . . . . . . . . . . . . . . . . . . . . . . . . . . . . . . . . . . . . . . . . . . . . . . . . . . . . . . . . . 144
References . . . . . . . . . . . . . . . . . . . . . . . . . . . . . . . . . . . . . . . . . . . . . . . . . . . . . . . . . . . . . 149
4. Targeting new growth areas . . . . . . . . . . . . . . . . . . . . . . . . . . . . . . . . . . . . . . . . . . . . . . . 151
1. R&D funding and specialisation . . . . . . . . . . . . . . . . . . . . . . . . . . . . . . . . . . . . . . . 152
2. Green innovation . . . . . . . . . . . . . . . . . . . . . . . . . . . . . . . . . . . . . . . . . . . . . . . . . . . . 154
3. Health innovation . . . . . . . . . . . . . . . . . . . . . . . . . . . . . . . . . . . . . . . . . . . . . . . . . . . 156
4. Biotechnology R&D . . . . . . . . . . . . . . . . . . . . . . . . . . . . . . . . . . . . . . . . . . . . . . . . . . 158
5. Nanotechnology R&D . . . . . . . . . . . . . . . . . . . . . . . . . . . . . . . . . . . . . . . . . . . . . . . . 160
6. ICT innovation . . . . . . . . . . . . . . . . . . . . . . . . . . . . . . . . . . . . . . . . . . . . . . . . . . . . . . 162
7. Broadband price and quality . . . . . . . . . . . . . . . . . . . . . . . . . . . . . . . . . . . . . . . . . . 164
8. Fixed and wireless broadband . . . . . . . . . . . . . . . . . . . . . . . . . . . . . . . . . . . . . . . . . 166
9. Internet users . . . . . . . . . . . . . . . . . . . . . . . . . . . . . . . . . . . . . . . . . . . . . . . . . . . . . . . 168
10. Emerging technologies . . . . . . . . . . . . . . . . . . . . . . . . . . . . . . . . . . . . . . . . . . . . . . . 170
Notes. . . . . . . . . . . . . . . . . . . . . . . . . . . . . . . . . . . . . . . . . . . . . . . . . . . . . . . . . . . . . . . . . . 172
References . . . . . . . . . . . . . . . . . . . . . . . . . . . . . . . . . . . . . . . . . . . . . . . . . . . . . . . . . . . . . 177
5. Unleashing innovation in firms . . . . . . . . . . . . . . . . . . . . . . . . . . . . . . . . . . . . . . . . . . . . 179
1. Mixed modes of innovation . . . . . . . . . . . . . . . . . . . . . . . . . . . . . . . . . . . . . . . . . . . 180
2. Broader innovation . . . . . . . . . . . . . . . . . . . . . . . . . . . . . . . . . . . . . . . . . . . . . . . . . . 182
3. Public support to innovation . . . . . . . . . . . . . . . . . . . . . . . . . . . . . . . . . . . . . . . . . . 184
4. The IP “bundle”. . . . . . . . . . . . . . . . . . . . . . . . . . . . . . . . . . . . . . . . . . . . . . . . . . . . . . 186
5. Trademarks . . . . . . . . . . . . . . . . . . . . . . . . . . . . . . . . . . . . . . . . . . . . . . . . . . . . . . . . . 188
6. Knowledge-asset-related trademarks. . . . . . . . . . . . . . . . . . . . . . . . . . . . . . . . . . . 190
7. Registered designs . . . . . . . . . . . . . . . . . . . . . . . . . . . . . . . . . . . . . . . . . . . . . . . . . . 192
8. Trademarks and patents . . . . . . . . . . . . . . . . . . . . . . . . . . . . . . . . . . . . . . . . . . . . . 194
9. Entry, exit and survival . . . . . . . . . . . . . . . . . . . . . . . . . . . . . . . . . . . . . . . . . . . . . . . 196
10. Firm employment dynamics . . . . . . . . . . . . . . . . . . . . . . . . . . . . . . . . . . . . . . . . . . 198
11. Access to capital. . . . . . . . . . . . . . . . . . . . . . . . . . . . . . . . . . . . . . . . . . . . . . . . . . . . . 200
12. Policy environment . . . . . . . . . . . . . . . . . . . . . . . . . . . . . . . . . . . . . . . . . . . . . . . . . . 202
Notes. . . . . . . . . . . . . . . . . . . . . . . . . . . . . . . . . . . . . . . . . . . . . . . . . . . . . . . . . . . . . . . . . . 204
References . . . . . . . . . . . . . . . . . . . . . . . . . . . . . . . . . . . . . . . . . . . . . . . . . . . . . . . . . . . . . 211
6. Competing in the knowledge economy. . . . . . . . . . . . . . . . . . . . . . . . . . . . . . . . . . . . . . 213
1. Industry specialisation . . . . . . . . . . . . . . . . . . . . . . . . . . . . . . . . . . . . . . . . . . . . . . . 214
2. ICT industry specialisation. . . . . . . . . . . . . . . . . . . . . . . . . . . . . . . . . . . . . . . . . . . . 216
3. Export structures . . . . . . . . . . . . . . . . . . . . . . . . . . . . . . . . . . . . . . . . . . . . . . . . . . . . 218
4. R&D specialisation. . . . . . . . . . . . . . . . . . . . . . . . . . . . . . . . . . . . . . . . . . . . . . . . . . . 220
5. Technological advantage . . . . . . . . . . . . . . . . . . . . . . . . . . . . . . . . . . . . . . . . . . . . . 222
6. Trade competitiveness . . . . . . . . . . . . . . . . . . . . . . . . . . . . . . . . . . . . . . . . . . . . . . . 224
7. E-business uptake . . . . . . . . . . . . . . . . . . . . . . . . . . . . . . . . . . . . . . . . . . . . . . . . . . . 226
8. Young innovative firms . . . . . . . . . . . . . . . . . . . . . . . . . . . . . . . . . . . . . . . . . . . . . . . 228
9. Technological strengths . . . . . . . . . . . . . . . . . . . . . . . . . . . . . . . . . . . . . . . . . . . . . . 230
Notes. . . . . . . . . . . . . . . . . . . . . . . . . . . . . . . . . . . . . . . . . . . . . . . . . . . . . . . . . . . . . . . . . . 232
References . . . . . . . . . . . . . . . . . . . . . . . . . . . . . . . . . . . . . . . . . . . . . . . . . . . . . . . . . . . . . 237
OECD SCIENCE, TECHNOLOGY AND INDUSTRY SCOREBOARD 2013 © OECD 20138
TABLE OF CONTENTS
7. Participating in the global economy . . . . . . . . . . . . . . . . . . . . . . . . . . . . . . . . . . . . . . . . 239
1. Employment . . . . . . . . . . . . . . . . . . . . . . . . . . . . . . . . . . . . . . . . . . . . . . . . . . . . . . . . . 240
2. Services-manufacturing linkages . . . . . . . . . . . . . . . . . . . . . . . . . . . . . . . . . . . . . . . 242
3. Firm size . . . . . . . . . . . . . . . . . . . . . . . . . . . . . . . . . . . . . . . . . . . . . . . . . . . . . . . . . . . . 244
4. Firm dynamics . . . . . . . . . . . . . . . . . . . . . . . . . . . . . . . . . . . . . . . . . . . . . . . . . . . . . . . 246
5. Foreign affiliates . . . . . . . . . . . . . . . . . . . . . . . . . . . . . . . . . . . . . . . . . . . . . . . . . . . . . . 248
6. Trade and global value chains . . . . . . . . . . . . . . . . . . . . . . . . . . . . . . . . . . . . . . . . . . 250
7. Global demand . . . . . . . . . . . . . . . . . . . . . . . . . . . . . . . . . . . . . . . . . . . . . . . . . . . . . . . 252
8. Trade and jobs. . . . . . . . . . . . . . . . . . . . . . . . . . . . . . . . . . . . . . . . . . . . . . . . . . . . . . . . 254
9. Trade and household consumption . . . . . . . . . . . . . . . . . . . . . . . . . . . . . . . . . . . . . . 256
Notes. . . . . . . . . . . . . . . . . . . . . . . . . . . . . . . . . . . . . . . . . . . . . . . . . . . . . . . . . . . . . . . . . . 258
References . . . . . . . . . . . . . . . . . . . . . . . . . . . . . . . . . . . . . . . . . . . . . . . . . . . . . . . . . . . . . 261
Data sources . . . . . . . . . . . . . . . . . . . . . . . . . . . . . . . . . . . . . . . . . . . . . . . . . . . . . . . . . . . . . . . 263
List of figures . . . . . . . . . . . . . . . . . . . . . . . . . . . . . . . . . . . . . . . . . . . . . . . . . . . . . . . . . . . . . . 267
Look for the StatLinks2at the bottom of the tables or graphs in this book.
To download the matching Excel® spreadsheet, just type the link into your
Internet browser, starting with the http://dx.doi.org prefix, or click on the link from
the e-book edition.
Follow OECD Publications on:
This book has... StatLinks2A service that delivers Excel files from the printed page! ®
http://twitter.com/OECD_Pubs
http://www.facebook.com/OECDPublications
http://www.linkedin.com/groups/OECD-Publications-4645871
http://www.youtube.com/oecdilibrary
http://www.oecd.org/oecddirect/ OECD
Alerts
OECD SCIENCE, TECHNOLOGY AND INDUSTRY SCOREBOARD 2013 © OECD 2013 9

READER’S GUIDE
Reader’s Guide
Acronyms
BERD Business enterprise expenditure on research and development
CIS Community Innovation Survey
CTM Community trademark
DSL Digital subscriber line
EPO European Patent Office
EU European Union
FDI Foreign direct investment
FTE Full-time equivalent
GBAORD Government budget appropriations or outlays for R&D
GDP Gross domestic product
GERD Gross domestic expenditure on R&D
HERD Higher education expenditure on R&D
HRST Human resources in science and technology
ICT Information and communication technology
IMF International Monetary Fund
I-O Input-output
IP Intellectual property
IPC International Patent Classification
IPv4 Internet Protocol version 4
IPv6 Internet Protocol version 6
ISCED International Standard Classification of Education
ISCO International Standard Classification of Occupations
ISIC International Standard Industrial Classification
JPO Japan Patent Office
KBC Knowledge-Based Capital
KLEMS Capital, labour, energy, material and service inputs
LFS Labour Force Survey
MFP Multi-factor productivity
NACE Statistical classification of economic activities in the European Community
(Nomenclature statistique des activités économiques dans la Communauté
européenne)
NPL Non-patent literature
OHIM Office for Harmonization in the Internal Market
PCT Patent Cooperation Treaty
PPP Purchasing power parity
PRO Public research organisation
R&D Research and development
OECD SCIENCE, TECHNOLOGY AND INDUSTRY SCOREBOARD 2013 © OECD 201310
READER’S GUIDE
RCD Registered Community Design
RD&D Research, development and demonstration
S&E Science and engineering
S&T Science and technology
SME Small and medium-sized enterprise
SNA System of National Accounts
TM Trademark
USD United States dollar
USPTO United States Patent and Trademark Office
Wi-Fi Wireless fidelity
WIPO World Intellectual Property Organization
AbbreviationsFor most of the charts, this publication uses ISO codes for countries or economies.
ARG Argentina
AUS Australia
AUT Austria
BEL Belgium
BGR Bulgaria
BRA Brazil
BRB Barbados
CAN Canada
CHE Switzerland
CHL Chile
CHN People’s Republic of China
CYM Cayman Islands
CYP Cyprus
CZE Czech Republic
DEU Germany
DNK Denmark
EGY Egypt
ESP Spain
EST Estonia
FIN Finland
FRA France
GBR United Kingdom
GRC Greece
HKG Hong Kong, China
HRV Croatia
HUN Hungary
IDN Indonesia
IND India
IRL Ireland
IRN Iran
ISL Iceland
ISR Israel
ITA Italy
OECD SCIENCE, TECHNOLOGY AND INDUSTRY SCOREBOARD 2013 © OECD 2013 11

READER’S GUIDE
JPN Japan
KOR Korea
LTU Lithuania
LUX Luxembourg
LVA Latvia
MEX Mexico
MLT Malta
MYS Malaysia
NLD Netherlands
NOR Norway
NZL New Zealand
PAK Pakistan
PHL Philippines
POL Poland
PRT Portugal
ROU Romania
RUS Russian Federation
SAU Saudi Arabia
SGP Singapore
SVK Slovak Republic
SVN Slovenia
SWE Sweden
THA Thailand
TUR Turkey
TWN Chinese Taipei
UKR Ukraine
USA United States
VGB Virgin Islands (British)
ZAF South Africa
Country groupings
ASEAN Brunei Darussalam, Cambodia, Indonesia, Laos, Malaysia, Myanmar,
the Philippines, Singapore, Thailand and Viet Nam.
BRIICS Brazil, the Russian Federation, India, Indonesia, China and South Africa.
Euro area Austria, Belgium, Cyprus, Estonia, Finland, France, Germany, Greece, Ireland,
Italy, Luxembourg, Malta, the Netherlands, Portugal, the Slovak Republic,
Slovenia and Spain.
EU28 European Union
G7 Canada, France, Germany, Italy, Japan, the United Kingdom and the United States.
NAFTA Canada, Mexico and the United States.
OECD Total OECD
ROW Rest of the world
WLD World
OECD SCIENCE, TECHNOLOGY AND INDUSTRY SCOREBOARD 2013 © OECD 201312

OECD Science, Technology and Industry Scoreboard 2013
© OECD 2013
Executive summary
With lacklustre growth across much of the globe, promoting new sources of growth has
become a global policy priority. Science, technology, innovation and entrepreneurship –
which foster competitiveness, productivity, and job creation – are important mechanisms
for encouraging sustainable growth.
The 260 science, technology, innovation and industrial performance indicators in this
Scoreboard show how OECD and major non-OECD economies are performing in a wide range of
areas. The STI Scoreboard helps governments design more effective and efficient policies and
monitor progress towards their desired goals.The following are some of the key findings of the
2013 Scoreboard.
Investment in innovation remains a priority, largely through R&D supportmeasures
In 2012, OECD governments on average invested the equivalent of 0.8% of GDP in direct
funding of R&D at home or abroad; Korea and Finland invested over 1%. In addition, 27 of
the 34 OECD countries and a number of non-OECD economies now indirectly support
business R&D via tax incentives. In 2011, the Russian Federation, Korea, France and
Slovenia provided the most combined support for business R&D as a percentage of GDP. In
Canada and Australia indirect funding of business R&D exceeded direct funding by a factor
of five. R&D tax credits were worth USD 8.3 billion in the United States, followed by France
and China. New estimates show that the cost to a firm of investing in R&D depends on its
size, location and balance sheet. In 2013, Australia, Canada, France, Korea, the Netherlands
and Portugal give more generous treatment to SMEs.
Young, dynamic firms contribute more to job creation than previouslyrecognised
Between 2008 and 2011, net employment in the OECD area fell by 2%, or 9 million people,
two-thirds of them in the United States. The manufacturing and construction sectors were
the hardest hit (an average loss of 32% and 25%, respectively), but information industries –
ICT manufacturing, publishing or telecommunication services – suffered too. For many
OECD countries, significant losses in employment continued well into 2012 with higher
skilled managers affected just as much as the lower-skilled. During the crisis, most jobs
destroyed in most countries reflected the downsizing of mature businesses; net job growth
in young firms (five years old or less) remained positive. Young firms with fewer than 50
employees represent only around 11% of employment, but they generally account for more
13

EXECUTIVE SUMMARY
than 33% of total job creation in the business sector; their share of job destruction is
around 17%.
Trade in value added provides a new perspective on trading relationships
The OECD-WTO Trade in Value Added (TiVA) indicators reveal that countries have become
more dependent on imports from a greater number of economies in order to maintain or
improve their export performance. For example, in China, over 1999-2009, gross exports
increased about 12-fold at current prices to almost USD 1 300 billion, and the foreign value-
added content of exports almost tripled to more than 30%; 20% of the value added of
exports originated from OECD countries, half of it from Japan and Korea.
Foreign consumers sustain jobs
As the interdependency of countries grows, consumers in one country sustain jobs in
countries further up the value chain. In 2008, 20% to 45% of business sector jobs in most
European economies and 20% of jobs in China were sustained by foreign demand. Shares
are smaller in Japan and the United States owing to their relatively large size and lower
dependency on exports and imports. Nonetheless, initial estimates suggest that in 2008,
over 10 million US business sector jobs were sustained by foreign consumers, with East and
Southeast Asian consumers sustaining 2 million.
Emerging economies increasingly play a role in science and innovation
In the global landscape of scientific research, the emergence of new players has changed
the structure of global collaboration networks. In 2011 China was the second-largest R&D
performer after the United States, ahead of Japan, Germany and Korea. It was also the
second largest producer of scientific publications, yet in terms of quality-adjusted research
output (top cited papers) it lags most OECD countries. China accounted for more than
74 000 scientific collaborations in 2011 up from only 9 000 in 1998. Over the period, the
number of Chinese publications co-authored with US-based institutions increased from
nearly 2 000 to more than 22 000. The United States continues to be the centre of the
international research network, accounting in 2011 for nearly 15% of all scientific
collaborations documented in peer-reviewed scientific publications.
University hotspots are still concentrated in a few locations
Worldwide, the top 50 universities with the highest relative impact over 2007-11 are highly
concentrated geographically but less so than over 2003-09. Overall, 34 of the top 50 are
located in the United States. The rest are in Europe, and, for the first time, two are outside
the OECD area, in Chinese Taipei. The United Kingdom is second, with specific strengths in
the medical and social sciences. There are notable differences by subject, with US-based
universities most likely to excel in biochemistry, computer science, neuroscience and
psychology. Universities in non-OECD economies, especially in Asia, play a relatively
prominent role in chemical engineering, energy and veterinary research.
Researchers are increasingly mobile
Researcher mobility and collaboration among institutions are increasing. A new indicator
tracks changes in the affiliation of scientists who publish in scholarly journals. The top
nine international bilateral flows of researchers coming into and leaving a country involve
exchanges with the United States. While total US inflows exceed the outflows, more
OECD SCIENCE, TECHNOLOGY AND INDUSTRY SCOREBOARD 2013 © OECD 201314

EXECUTIVE SUMMARY
scientists who start by publishing in the United States move to affiliations in China and
Korea than vice versa. The United Kingdom is the second most-connected economy. On
average, the research impact of scientists who move affiliations across national boundaries
is nearly 20% higher than that of those who never move abroad. For many economies,
raising the performance of these “stayers” to the level of their internationally mobile
researchers (those who leave and those who return) would allow them to catch up with
leading research nations.
OECD SCIENCE, TECHNOLOGY AND INDUSTRY SCOREBOARD 2013 © OECD 2013 15

OECD SCIENCE, TECHNOLOGY AND INDU
1. KNOWLEDGE ECONOMIES:TRENDS AND FEATURES
Sources of growth and the crisis
The new geography of growth
The changing landscape of innovation
Science and innovation today
Notes and References
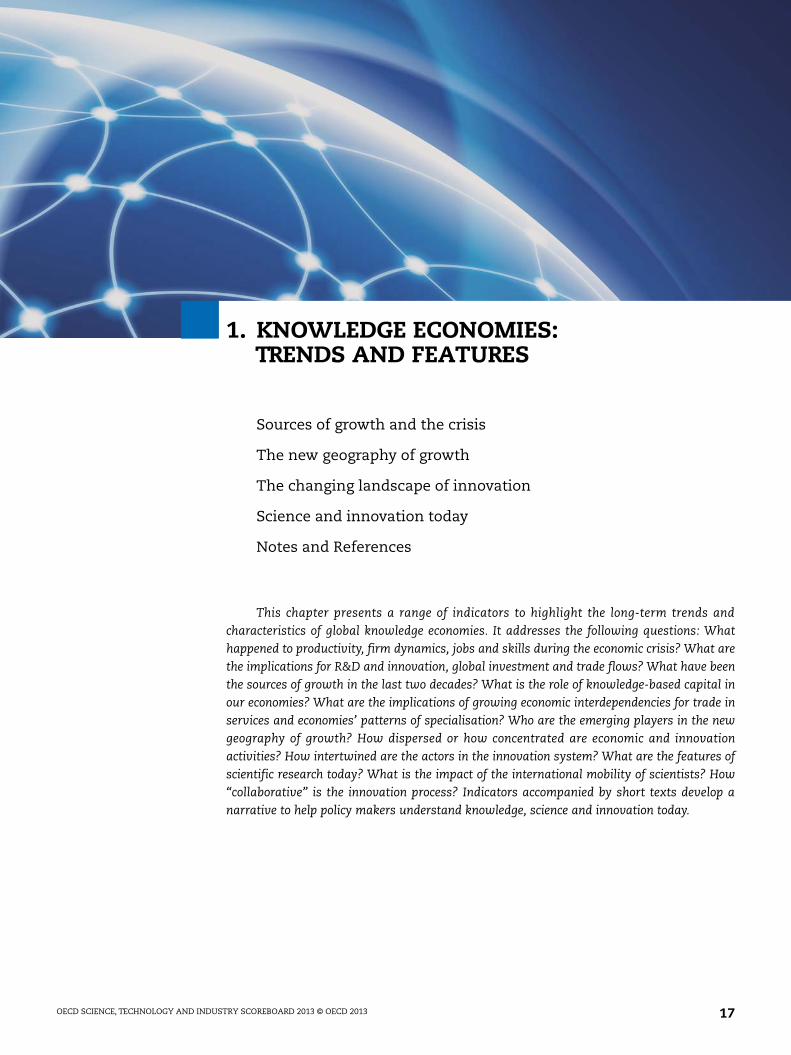
This chapter presents a range of indicators to highlight the long-term trends andcharacteristics of global knowledge economies. It addresses the following questions: Whathappened to productivity, firm dynamics, jobs and skills during the economic crisis? What arethe implications for R&D and innovation, global investment and trade flows? What have beenthe sources of growth in the last two decades? What is the role of knowledge-based capital inour economies? What are the implications of growing economic interdependencies for trade inservices and economies’ patterns of specialisation? Who are the emerging players in the newgeography of growth? How dispersed or how concentrated are economic and innovationactivities? How intertwined are the actors in the innovation system? What are the features ofscientific research today? What is the impact of the international mobility of scientists? How“collaborative” is the innovation process? Indicators accompanied by short texts develop anarrative to help policy makers understand knowledge, science and innovation today.
STRY SCOREBOARD 2013 © OECD 2013 17
1. KNOWLEDGE ECONOMIES: TRENDS AND FEATURES
Sources of growth and the crisis
Productivity and the crisis
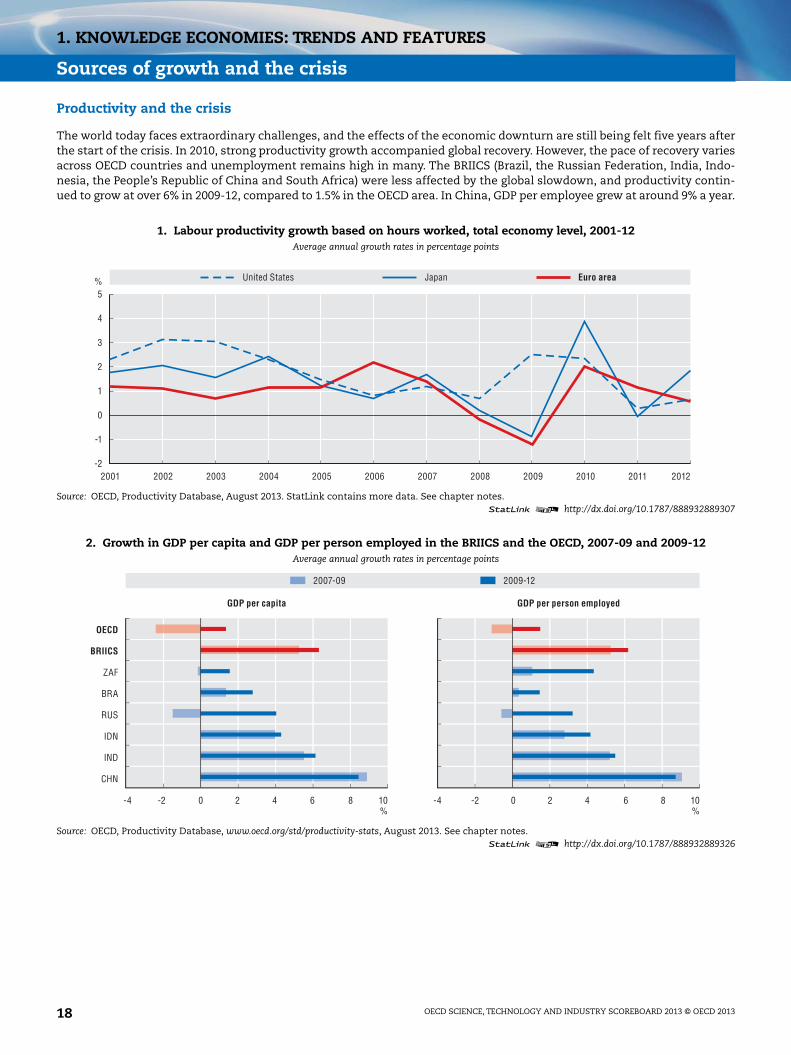
The world today faces extraordinary challenges, and the effects of the economic downturn are still being felt five years afterthe start of the crisis. In 2010, strong productivity growth accompanied global recovery. However, the pace of recovery variesacross OECD countries and unemployment remains high in many. The BRIICS (Brazil, the Russian Federation, India, Indo-nesia, the People’s Republic of China and South Africa) were less affected by the global slowdown, and productivity contin-ued to grow at over 6% in 2009-12, compared to 1.5% in the OECD area. In China, GDP per employee grew at around 9% a year.
1. Labour productivity growth based on hours worked, total economy level, 2001-12Average annual growth rates in percentage points
Source: OECD, Productivity Database, August 2013. StatLink contains more data. See chapter notes.1 2 http://dx.doi.org/10.1787/888932889307
2. Growth in GDP per capita and GDP per person employed in the BRIICS and the OECD, 2007-09 and 2009-12Average annual growth rates in percentage points
Source: OECD, Productivity Database, www.oecd.org/std/productivity-stats, August 2013. See chapter notes.1 2 http://dx.doi.org/10.1787/888932889326
5
4
3
2
1
0
-1
-2
%
2001 2002 2003 2004 2005 2006 2007 2008 2009 201220112010
Euro areaUnited States Japan
OECD
BRIICS
ZAF
BRA
RUS
IND
IDN
CHN
-4 -2 0 2 4 6 8 10%
-4 -2 0 2 4 6 8 10%
2007-09 2009-12
GDP per capita GDP per person employed
OECD SCIENCE, TECHNOLOGY AND INDUSTRY SCOREBOARD 2013 © OECD 201318
1. KNOWLEDGE ECONOMIES: TRENDS AND FEATURES
Sources of growth and the crisis
Jobs: The most pressing challenge
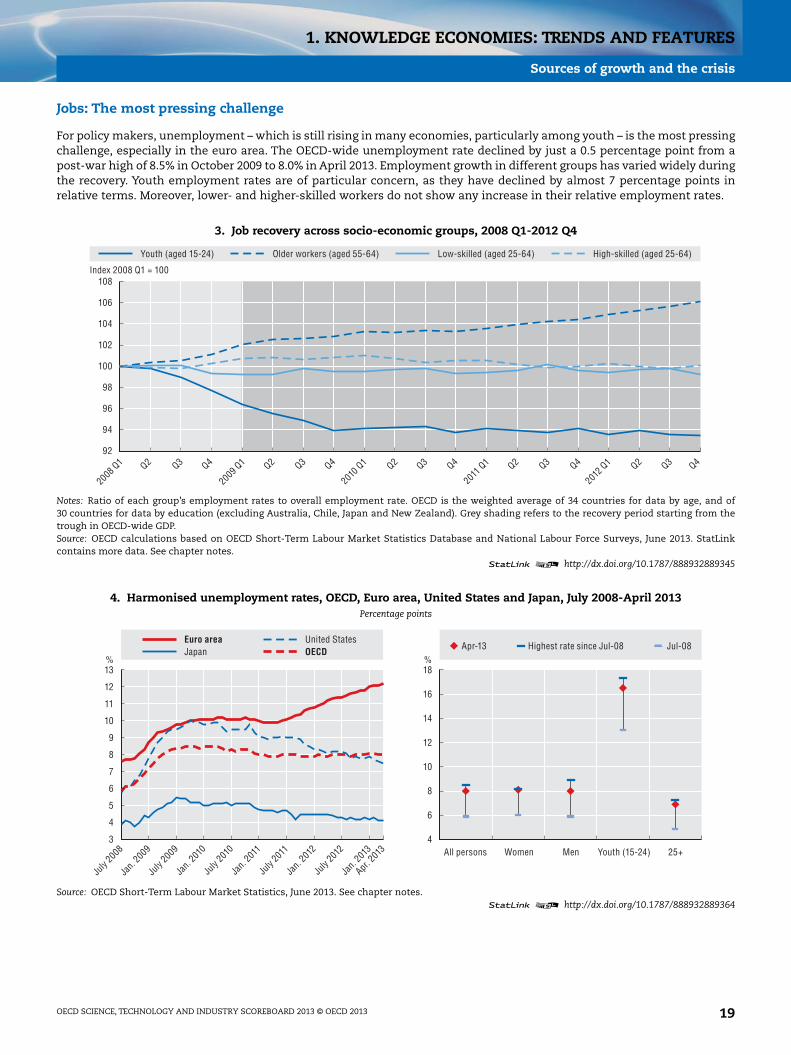
For policy makers, unemployment – which is still rising in many economies, particularly among youth – is the most pressingchallenge, especially in the euro area. The OECD-wide unemployment rate declined by just a 0.5 percentage point from apost-war high of 8.5% in October 2009 to 8.0% in April 2013. Employment growth in different groups has varied widely duringthe recovery. Youth employment rates are of particular concern, as they have declined by almost 7 percentage points inrelative terms. Moreover, lower- and higher-skilled workers do not show any increase in their relative employment rates.
3. Job recovery across socio-economic groups, 2008 Q1-2012 Q4
Notes: Ratio of each group’s employment rates to overall employment rate. OECD is the weighted average of 34 countries for data by age, and of30 countries for data by education (excluding Australia, Chile, Japan and New Zealand). Grey shading refers to the recovery period starting from thetrough in OECD-wide GDP.Source: OECD calculations based on OECD Short-Term Labour Market Statistics Database and National Labour Force Surveys, June 2013. StatLinkcontains more data. See chapter notes.
1 2 http://dx.doi.org/10.1787/888932889345
4. Harmonised unemployment rates, OECD, Euro area, United States and Japan, July 2008-April 2013Percentage points
Source: OECD Short-Term Labour Market Statistics, June 2013. See chapter notes.1 2 http://dx.doi.org/10.1787/888932889364
108
106
104
102
100
98
96
92
94
Older workers (aged 55-64)Youth (aged 15-24) High-skilled (aged 25-64)Low-skilled (aged 25-64)
Index 2008 Q1 = 100
2008 Q
1
2009 Q
1Q2 Q3 Q4 Q2 Q3 Q4
2010
Q1 Q2 Q3 Q4
2011
Q1 Q2 Q3 Q4
2012
Q1 Q2 Q3 Q4
13% %
12
11
10
9
8
7
6
5
4
3
18
16
14
12
10
8
6
4All persons Women Men Youth (15-24) 25+
Euro area United StatesJapan OECD Highest rate since Jul-08 Jul-08Apr-13
July
2008
Jan.
2009
July
2009
Jan.
2010
July
2010
Jan.
2011
July
2011
Jan.
2012
July
2012
Apr. 20
13
Jan.
2013
OECD SCIENCE, TECHNOLOGY AND INDUSTRY SCOREBOARD 2013 © OECD 2013 19
1. KNOWLEDGE ECONOMIES: TRENDS AND FEATURES
Sources of growth and the crisis
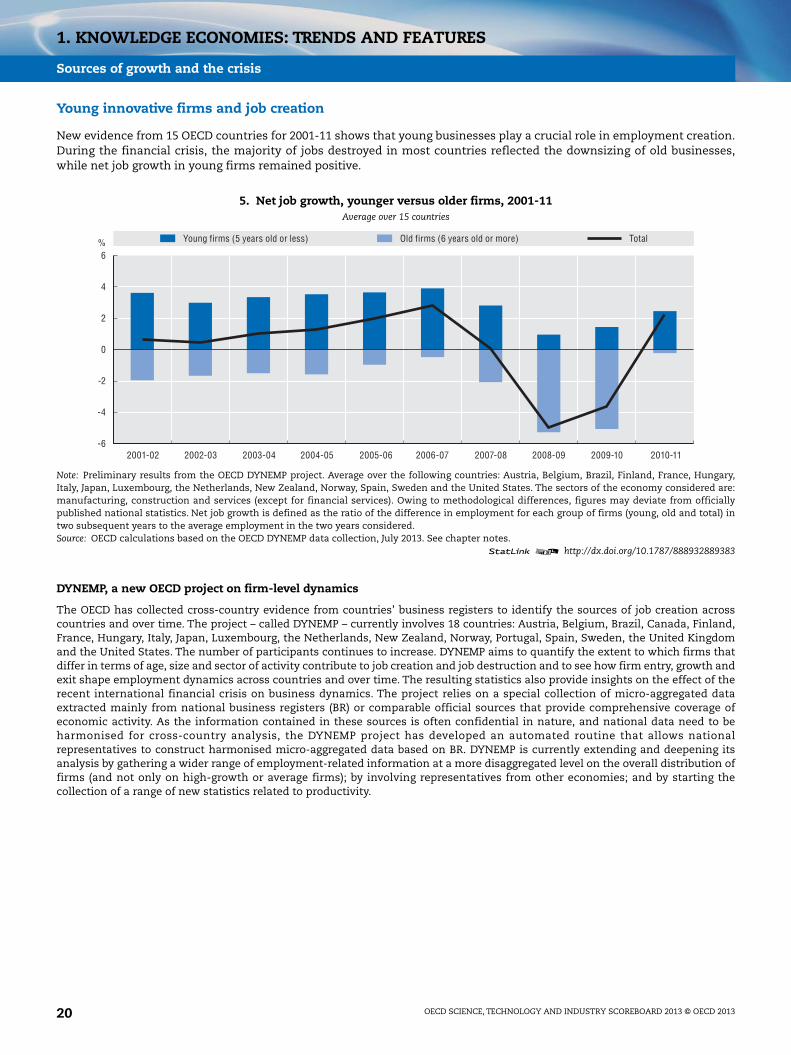
Young innovative firms and job creation
New evidence from 15 OECD countries for 2001-11 shows that young businesses play a crucial role in employment creation.During the financial crisis, the majority of jobs destroyed in most countries reflected the downsizing of old businesses,while net job growth in young firms remained positive.
DYNEMP, a new OECD project on firm-level dynamics
The OECD has collected cross-country evidence from countries’ business registers to identify the sources of job creation acrosscountries and over time. The project – called DYNEMP – currently involves 18 countries: Austria, Belgium, Brazil, Canada, Finland,France, Hungary, Italy, Japan, Luxembourg, the Netherlands, New Zealand, Norway, Portugal, Spain, Sweden, the United Kingdomand the United States. The number of participants continues to increase. DYNEMP aims to quantify the extent to which firms thatdiffer in terms of age, size and sector of activity contribute to job creation and job destruction and to see how firm entry, growth andexit shape employment dynamics across countries and over time. The resulting statistics also provide insights on the effect of therecent international financial crisis on business dynamics. The project relies on a special collection of micro-aggregated dataextracted mainly from national business registers (BR) or comparable official sources that provide comprehensive coverage ofeconomic activity. As the information contained in these sources is often confidential in nature, and national data need to beharmonised for cross-country analysis, the DYNEMP project has developed an automated routine that allows nationalrepresentatives to construct harmonised micro-aggregated data based on BR. DYNEMP is currently extending and deepening itsanalysis by gathering a wider range of employment-related information at a more disaggregated level on the overall distribution offirms (and not only on high-growth or average firms); by involving representatives from other economies; and by starting thecollection of a range of new statistics related to productivity.
5. Net job growth, younger versus older firms, 2001-11Average over 15 countries
Note: Preliminary results from the OECD DYNEMP project. Average over the following countries: Austria, Belgium, Brazil, Finland, France, Hungary,Italy, Japan, Luxembourg, the Netherlands, New Zealand, Norway, Spain, Sweden and the United States. The sectors of the economy considered are:manufacturing, construction and services (except for financial services). Owing to methodological differences, figures may deviate from officiallypublished national statistics. Net job growth is defined as the ratio of the difference in employment for each group of firms (young, old and total) intwo subsequent years to the average employment in the two years considered.Source: OECD calculations based on the OECD DYNEMP data collection, July 2013. See chapter notes.
1 2 http://dx.doi.org/10.1787/888932889383
6
4
2
0
-2
-6
-4
%
2001-02 2002-03 2003-04 2004-05 2005-06 2006-07 2007-08 2008-09 2009-10 2010-11
Young firms (5 years old or less) Old firms (6 years old or more) Total
OECD SCIENCE, TECHNOLOGY AND INDUSTRY SCOREBOARD 2013 © OECD 201320

1. KNOWLEDGE ECONOMIES: TRENDS AND FEATURES
Sources of growth and the crisis
Young, innovative firms and job creation
Firm-level data also show that, across all countries in the sample, young firms are more dynamic than older firms. Youngfirms systematically create more jobs than they destroy. In particular, young firms with fewer than 50 employees representonly around 11% of employment, they generally account for more than 33% of total job creation in the business sector, whiletheir share in job destruction is around 17%.
6. Employment, job creation and job destruction, by firm age and size, 2001-11Non-financial business sector, average over 15 countries
Source: OECD calculations based on the OECD DYNEMP data collection, July 2013. See chapter notes.1 2 http://dx.doi.org/10.1787/888932889402
7. Employment, job creation and job destruction, manufacturing and services 2001-11By firm age and size, average over 15 countries
Source: OECD calculations based on the OECD DYNEMP data collection, July 2013. See chapter notes.1 2 http://dx.doi.org/10.1787/888932889421
45
40
35
30
25
15
10
20
0
5
% Employment Job destruction Job creation
Small young Small old Medium young Medium old Large young Large old
45
40
35
30
25
15
10
20
0
5
% Employment Job destruction Job creation
Smallyoung
Manufacturing Services
Smallold
Mediumyoung
Mediumold
Largeyoung
Large old
Smallyoung
Smallold
Mediumyoung
Mediumold
Largeyoung
Large old
OECD SCIENCE, TECHNOLOGY AND INDUSTRY SCOREBOARD 2013 © OECD 2013 21

1. KNOWLEDGE ECONOMIES: TRENDS AND FEATURES
Sources of growth and the crisis
Jobs in the crisis
Between 2008 and 2011, the OECD area as a whole suffered a net loss of about 9 million jobs. Although this represents anoverall drop of less than 2%, Estonia, Greece, Ireland and Spain suffered losses of over 8%. The United States alone shedabout 6 million jobs over the period, a fall of about 4%. The construction and manufacturing sectors were the hardest hit,with significant declines in most OECD countries. Wholesale, retail, hotels, food services and transport sectors also strug-gled. In many countries, the losses were partly offset by gains in “Public administration, education, health and other ser-vices”. Along with business services, this sector ensured that Australia, Germany, Israel, Korea and Switzerland saw jobsincrease during this period.
8. Where people lost their jobs, 2008-11Relative contribution to change in total employment by major sectors of economic activity
Note: For Israel and Japan certain industry breakdowns are not available. See chapter notes.Source: OECD, Structural Analysis (STAN) Database, May 2013; OECD National Accounts (SNA) Database and national statistical institutes, June 2013.See chapter notes.
1 2 http://dx.doi.org/10.1787/888932889440
100
75
50
25
0
-25
-50
-75
-100
%
GRCPRT
ESP
SVNIRL
DNKUSA ITA SVK
HUNISL FINCZEES
TNZLJP
N
100
75
50
25
0
-25
-50
-75
-100
%
FRA
NLDGBRAUT
MEXBELNOR
KOR ISRAUS
DEU LUX
POLSWE
CHECAN
-13 805
4 679
-419 -2 204 -292 -307 -6 453 -59 -162 -167 -1 707 -627 -69 -15 -85 -70 -73 -82
0 81 12 21 558 5 16 20 295 110 14 3 27 31 34 41
-13 805
4 679
-384 -766 -960 -215 -45 -73 -366 -63 -153 -305 -29 -209 -60 -8 -8 -1
212 491 636 180 56 109 661 146 448 971 102 1 025 577 174 231 21
Finance, insurance, real estate and business servicesWholesale, retail, hotels, transport and communicationsMining, manufacturing and utilities
Public administration, education, health and other services
Agriculture, forestry and fishingConstruction
Professional, scientific, technical and other business servicesInformation and communication
Gains, thousands
Losses, thousands
OECD
Gains, thousands
Losses, thousands
OECD
OECD SCIENCE, TECHNOLOGY AND INDUSTRY SCOREBOARD 2013 © OECD 201322
1. KNOWLEDGE ECONOMIES: TRENDS AND FEATURES
Sources of growth and the crisis
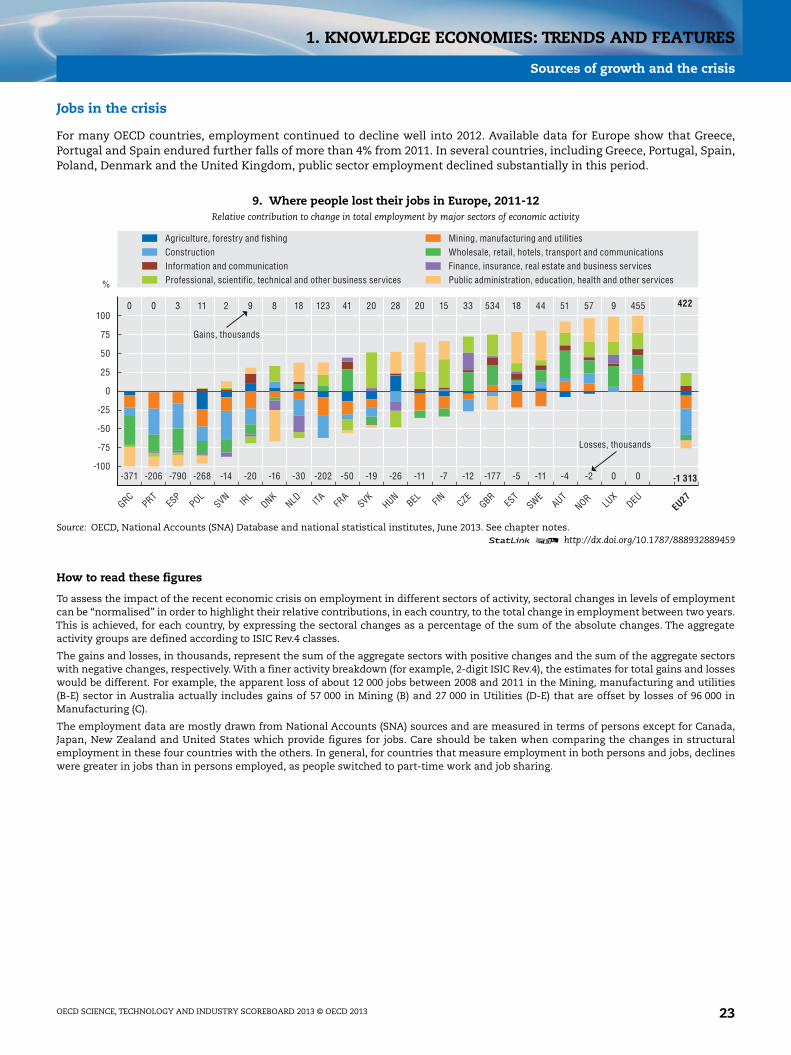
Jobs in the crisis
For many OECD countries, employment continued to decline well into 2012. Available data for Europe show that Greece,Portugal and Spain endured further falls of more than 4% from 2011. In several countries, including Greece, Portugal, Spain,Poland, Denmark and the United Kingdom, public sector employment declined substantially in this period.
How to read these figures
To assess the impact of the recent economic crisis on employment in different sectors of activity, sectoral changes in levels of employmentcan be “normalised” in order to highlight their relative contributions, in each country, to the total change in employment between two years.This is achieved, for each country, by expressing the sectoral changes as a percentage of the sum of the absolute changes. The aggregateactivity groups are defined according to ISIC Rev.4 classes.
The gains and losses, in thousands, represent the sum of the aggregate sectors with positive changes and the sum of the aggregate sectorswith negative changes, respectively. With a finer activity breakdown (for example, 2-digit ISIC Rev.4), the estimates for total gains and losseswould be different. For example, the apparent loss of about 12 000 jobs between 2008 and 2011 in the Mining, manufacturing and utilities(B-E) sector in Australia actually includes gains of 57 000 in Mining (B) and 27 000 in Utilities (D-E) that are offset by losses of 96 000 inManufacturing (C).
The employment data are mostly drawn from National Accounts (SNA) sources and are measured in terms of persons except for Canada,Japan, New Zealand and United States which provide figures for jobs. Care should be taken when comparing the changes in structuralemployment in these four countries with the others. In general, for countries that measure employment in both persons and jobs, declineswere greater in jobs than in persons employed, as people switched to part-time work and job sharing.
9. Where people lost their jobs in Europe, 2011-12Relative contribution to change in total employment by major sectors of economic activity
Source: OECD, National Accounts (SNA) Database and national statistical institutes, June 2013. See chapter notes.1 2 http://dx.doi.org/10.1787/888932889459
100
75
50
25
0
-25
-50
-75
-100
%
GRCPRT
ESP
POLSVN IR
LDNK
NLD ITA FRA
SVKHUN
BEL FIN CZEGBR
EST
SWEAUT
NOR LU
XDEU
-371 -206 -790 -268 -14 -20 -16 -30 -202 -50 -19 -26 -11 -7 -12 -177 -5 -11 -4 -2 0 0
0 0 3 11 2 9 8 18 123 41 20 28 20 15 33 534 18 44 51 57 9 455
-1 313
422
Finance, insurance, real estate and business servicesWholesale, retail, hotels, transport and communicationsMining, manufacturing and utilities
Public administration, education, health and other services
Agriculture, forestry and fishingConstruction
Professional, scientific, technical and other business servicesInformation and communication
Gains, thousands
Losses, thousands
EU27
OECD SCIENCE, TECHNOLOGY AND INDUSTRY SCOREBOARD 2013 © OECD 2013 23
1. KNOWLEDGE ECONOMIES: TRENDS AND FEATURES
Sources of growth and the crisis
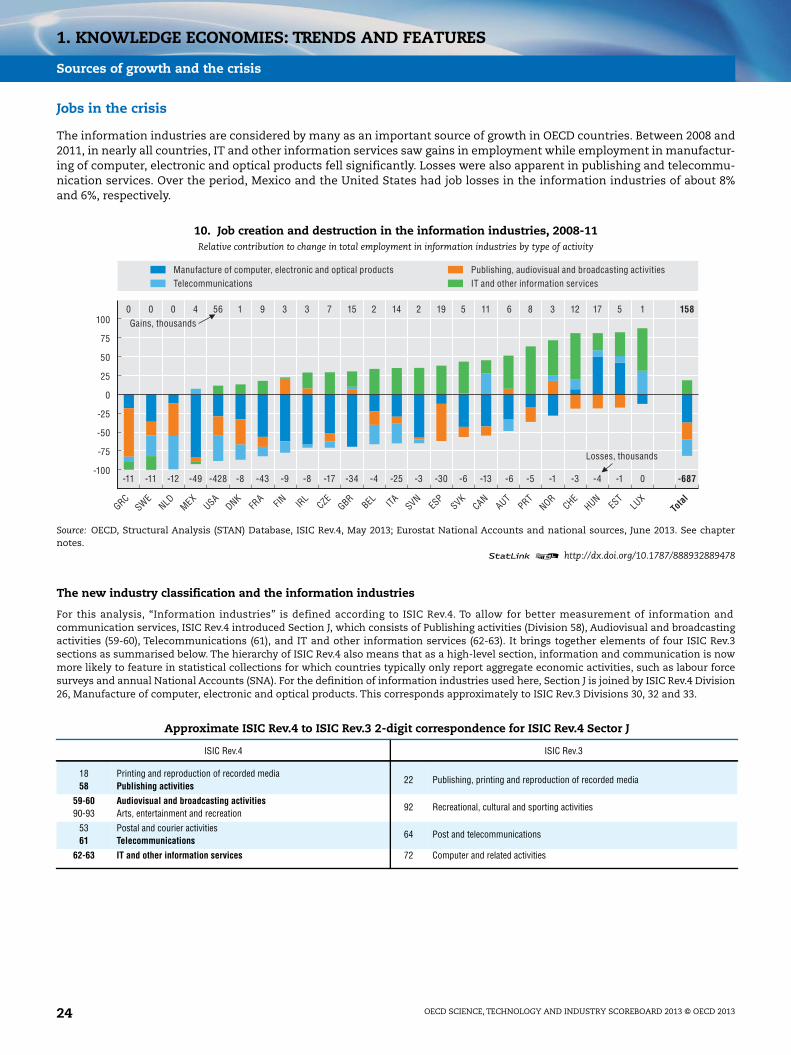
Jobs in the crisis
The information industries are considered by many as an important source of growth in OECD countries. Between 2008 and2011, in nearly all countries, IT and other information services saw gains in employment while employment in manufactur-ing of computer, electronic and optical products fell significantly. Losses were also apparent in publishing and telecommu-nication services. Over the period, Mexico and the United States had job losses in the information industries of about 8%and 6%, respectively.
The new industry classification and the information industries
For this analysis, “Information industries” is defined according to ISIC Rev.4. To allow for better measurement of information andcommunication services, ISIC Rev.4 introduced Section J, which consists of Publishing activities (Division 58), Audiovisual and broadcastingactivities (59-60), Telecommunications (61), and IT and other information services (62-63). It brings together elements of four ISIC Rev.3sections as summarised below. The hierarchy of ISIC Rev.4 also means that as a high-level section, information and communication is nowmore likely to feature in statistical collections for which countries typically only report aggregate economic activities, such as labour forcesurveys and annual National Accounts (SNA). For the definition of information industries used here, Section J is joined by ISIC Rev.4 Division26, Manufacture of computer, electronic and optical products. This corresponds approximately to ISIC Rev.3 Divisions 30, 32 and 33.
10. Job creation and destruction in the information industries, 2008-11Relative contribution to change in total employment in information industries by type of activity
Source: OECD, Structural Analysis (STAN) Database, ISIC Rev.4, May 2013; Eurostat National Accounts and national sources, June 2013. See chapternotes.
1 2 http://dx.doi.org/10.1787/888932889478
Approximate ISIC Rev.4 to ISIC Rev.3 2-digit correspondence for ISIC Rev.4 Sector J
ISIC Rev.4 ISIC Rev.3
1858
Printing and reproduction of recorded mediaPublishing activities
22 Publishing, printing and reproduction of recorded media
59-6090-93
Audiovisual and broadcasting activitiesArts, entertainment and recreation
92 Recreational, cultural and sporting activities
5361
Postal and courier activitiesTelecommunications
64 Post and telecommunications
62-63 IT and other information services 72 Computer and related activities
GRC
SWE
NLD
MEX
USA
DNK
FRA
FIN
IRL
CZE
GBR
BEL IT
A S
VN E
SP S
VK C
AN A
UT P
RT N
OR C
HE H
UN E
ST L
UXTo
tal
-100
-75
-50
-25
25
0
50
75
100
-11 -11 -12 -49 -428 -8 -43 -9 -8 -17 -34 -4 -25 -3 -30 -6 -13 -6 -5 -1 -3 -4 -1 0 -687
0 0 0 4 56 1 9 3 3 7 15 2 14 2 19 5 11 6 8 3 12 17 5 1 158
Telecommunications IT and other information servicesManufacture of computer, electronic and optical products Publishing, audiovisual and broadcasting activities
Gains, thousands
Losses, thousands
OECD SCIENCE, TECHNOLOGY AND INDUSTRY SCOREBOARD 2013 © OECD 201324

1. KNOWLEDGE ECONOMIES: TRENDS AND FEATURES
Sources of growth and the crisis
The skills challenge
Occupations provide another way of looking at changes in employment. Analysis of European labour force statisticssuggests that during 2011-12, while there were some hints of recovery in employment, opportunities for managers declined.There was also a drop in lower-skilled jobs in both business services and manufacturing. However, employment rose forProfessionals and for Technicians and associate professionals, i.e. higher-skilled “non-managerial” occupations.
How to read this figure
To see the occupations most affected by rises and falls in employment between 2011 and 2012, changes in the levels of employment inoccupation groups were “normalised” to show their relative contributions to the total change in each country. This is achieved, for eachcountry, by expressing changes in the level of occupation groups as a percentage of the sum of absolute change.
Occupations are defined according to the International Standard Classification of Occupations 2008 (ISCO-08). Gains and losses, inthousands, represent the sum of the occupations with positive changes and the sum of the occupations with negative changes, respectively.With a finer activity breakdown (for example, 3-digit ISCO-08), estimates of total gains and losses would differ, although the balance wouldremain the same.
11. Change in the skill mix in Europe, services and manufacturing, 2011-12Relative contribution to changes in total employment by major occupation groups
Source: OECD, based on Eurostat,8 European Labour Force Surveys, June 2013. See chapter notes.1 2 http://dx.doi.org/10.1787/888932889497
100
75
50
25
0
-25
-50
-75
-100
%
GRCPRT
ESP
AUTPOL
SVKISLSVN
FRAFINITA LU
XCZE
DNKDEU ES
TSWE
CHEBELHUN
GBRNORIR
L
100
75
50
25
0
-25
-50
-75
-100
%
GRCPRT
ESP
AUTPOL
SVKISLSVN
FRAFINITA LU
XCZE
DNKDEU ES
TSWE
CHEBELHUN
GBRNORIR
L
-304
5624 34 12 56 3 19 23 18 18 9 45 251 39 479 87 11 26 13 49 97 39 46 300
-4-129 -304 -72 -216 -5 -34 -41 -33 -27 -10 -36 -178 -26 -280 -47 -5 -12 -5 -17 -31 -8 -9
-753
2646 16 3 5 1 11 26 23 6 3 20 53 19 398 25 1 6 2 9 5 5 0 84
-33-61 -145 -46 -125 -2 -20 -21 -22 -10 -130 -13 -156 -21 -349 -112 -1 -26 -5 -14 -51 -5 -31
Managers
Craft and related trades workersTechnicians and associate professionals Clerical support workers
Professionals
Elementary occupationsPlant and machine operators, and assemblersService and sales workers
Gains, thousands
Business sector services
Losses, thousands
EU
Gains, thousands
Manufacturing
Losses, thousands
EU
OECD SCIENCE, TECHNOLOGY AND INDUSTRY SCOREBOARD 2013 © OECD 2013 25

1. KNOWLEDGE ECONOMIES: TRENDS AND FEATURES
Sources of growth and the crisis
R&D and innovation: emerging from the crisis?
Like other types of investment activity, expenditures on R&D and innovation are pro-cyclical. As data from 1982 to 2012demonstrate, they mirror and amplify the economic performance of the OECD area. R&D financed by the business sector isparticularly affected by the business cycle and reflects changes in financing constraints and aggregate demand. The unpre-cedented drop in GDP and business R&D in 2008-09 was partly balanced by a boost in government-funded R&D. From 2010,business-funded R&D appears to have recovered somewhat, counterbalancing to some extent what appears to be a signifi-cant reduction in government funding of R&D. Recent data also show that trademark activity in goods and services wasstrongly affected by the economic crisis, with drops that slightly preceded the inflection of GDP in the cycle. Several trade-mark categories that account for a large share of US trademarks (ICT and audiovisual, advertising and business services)have been on a downward trend since the beginning of 2012.
12. R&D growth over the business cycle by source of financing, OECD area, 1982-2012Average annual real growth rate, percentage
Source: OECD, Main Science and Technology Indicators Database, www.oecd.org/sti/msti.htm, June 2013. See chapter notes.1 2 http://dx.doi.org/10.1787/888932889516
13. US GDP and trademark applications at the US Patent and Trademark Office, 2003-13Comparing cycles, by type of trademarks, percentage deviation from the long-term trend
Source: OECD, based on US Patent and Trademark Office, Trademark Electronic Search System (TESS), June 2013; and OECD, Quarterly NationalAccounts Database, June 2013. See chapter notes.
1 2 http://dx.doi.org/10.1787/888932889535
12
9
6
3
0
-3
-6
%
1982
1983
1984
1985
1986
1987
1988
1989
1990
1991
1992
1993
1994
1995
1996
1997
1998
1999
2000
2001
2002
2003
2004
2005
2006
2007
2008
2009
2010
2011
2012
Government R&D budgets (subset of OECD countries)Business-financed R&D expenditures Government-financed R&D expenditures
GDP
20
15
10
5
-5
0
-10
-15
-20
%4
3
2
1
0
-2
-1
-3
-4
%United States GDP (right-hand scale)
Health, pharma and cosmetics
ICT and audiovisual
Leisure and education Advertising and business services
Jan.
2003
July
2003
Jan.
2004
July
2004
Jan.
2005
July
2005
Jan.
2006
July
2006
Jan.
2007
July
2007
Jan.
2008
July
2008
Jan.
2009
July
2009
Jan.
2010
July
2010
Jan.
2011
July
2011
Jan.
2012
Jan.
2013
July
2012
OECD SCIENCE, TECHNOLOGY AND INDUSTRY SCOREBOARD 2013 © OECD 201326

1. KNOWLEDGE ECONOMIES: TRENDS AND FEATURES
Sources of growth and the crisis
R&D through the recession
The performance of R&D from 2007 to 2011 has differed significantly across economies and sectors. In Europe, total GERD –measured in constant USD PPP – grew about 10 percentage points , while in Japan, it has still to recover its 2007 level, largelyowing to the poor performance of the business sector. In the United States, GERD has been on a downward trend since 2008,due to the fall in business R&D, partly offset by increasing R&D in the higher education and government sectors. The EU28performance has been more robust, mainly owing to the recovery of business R&D from a trough in 2009. This is principallydue to growth in Germany’s business R&D, which has more than offset reductions in other countries. In China, R&D expen-diture has nearly doubled in real terms in the space of five years, principally boosted by the business sector. From 2009, R&Dgrowth in the government and higher education sectors began to slow down but R&D levels continued to increase at a timewhen other countries were beginning to implement R&D budget cuts.
14. Recent R&D trends by sector of performance, 2007-11Constant USD PPPs, index 2007 = 100
Source: OECD, Main Science and Technology Indicators Database, www.oecd.org/sti/msti.htm, June 2013.1 2 http://dx.doi.org/10.1787/888932889554
120
110
100
90
802007 2008 2009 2010 2011
120
110
100
90
802007 2008 2009 2010 2011
120
110
100
90
802007 2008 2009 2010 2011
200
180
160
140
100
120
2007 2008 2009 2010 2011
United States EU28
Japan China
Business enterprisesTotal R&D (GERD) Higher educationGovernment
Different scale for China
OECD SCIENCE, TECHNOLOGY AND INDUSTRY SCOREBOARD 2013 © OECD 2013 27

1. KNOWLEDGE ECONOMIES: TRENDS AND FEATURES
Sources of growth and the crisis
Creative destruction in the crisis
“Creative destruction” – the process whereby economic growth and structural change force less productive firms to exit andallow more innovative firms to enter – can help improve overall economic performance. The process of creative destructionslowed with the onset of the global financial crisis. Business register data show a decline in the rate of enterprise creation as earlyas 2007 for some of the largest economies. In 2009, the downward trend became more pronounced in several European countries.After six years only a few countries have returned to pre-crisis levels of enterprise creation. Trends in bankruptcies are broadlyindicative of the cash flow situation of enterprises. However, as the length of countries’ bankruptcy procedures varies, insolvententerprises are not declared bankrupt at the same pace and this may affect the statistics shown. In several countries, bank-ruptcies continued to rise until 2011 and in nearly all of them remained much higher than in 2007.
15. New enterprise creations, selected OECD countries, 2007-13Trend cycle average
Notes: For France, there is a break in series in Q1-2009 when new legislation supporting auto-entrepreneurs led to a substantial increase in individual start-ups.Source: OECD (2013), Entrepreneurship at a Glance 2013, OECD Publishing. StatLink contains more data. See chapter notes.
1 2 http://dx.doi.org/10.1787/888932889573
16. Trends in bankruptcies, 2007-11
Note: Differences in national sources may affect international comparability.Source: OECD (2013), Financing SMEs and Entrepreneurs 2013: An OECD Scoreboard, OECD Publishing and OECD (2013), Entrepreneurship at a Glance 2013,OECD Publishing. See chapter notes.
1 2 http://dx.doi.org/10.1787/888932889592
175
125
100
75
50
150
125
100
75
50
Norway
Netherlands
Sweden
Finland
Belgium Denmark
United States
ItalySpain United KingdomGermanyAustralia France
Index 2007 = 100 Index 2007 = 100
Q1 2007
Q3 2007
Q1 2008
Q3 2008
Q1 2009
Q3 2009
Q1 201
0
Q3 201
0
Q1 201
1
Q3 201
1
Q1 201
2
Q3 201
2
Q1 201
3
Q1 2007
Q3 2007
Q1 2008
Q3 2008
Q1 2009
Q3 2009
Q1 201
0
Q3 201
0
Q1 201
1
Q3 201
1
Q1 201
2
Q3 201
2
Q1 201
3
540480420360300
6080
100120140160180200220240
KORCAN
JPN
NZLCHLFR
A FIN AUSSWE
TURGBR
NLDCHEUSA
NOR
PRTHUN
ITA
IRL
DNK
ISL
SVK
ESP
2008 2009 2010 2011
Index 2007 = 100
OECD SCIENCE, TECHNOLOGY AND INDUSTRY SCOREBOARD 2013 © OECD 201328

1. KNOWLEDGE ECONOMIES: TRENDS AND FEATURES
Sources of growth and the crisis
Financing of young innovative firms
Access to finance for new and innovative small firms involves both debt and equity finance. Venture capital (VC) is animportant source of funding, especially for young technology-based firms. Even before the recent financial crisis, bankswere reluctant to lend to small, innovative firms owing to their perceived riskiness and lack of collateral. The financial crisiswidened the existing gap at the seed and early stage, as bank lending to start-ups fell and VC firms turned to later invest-ment stages where risks are lower. In Europe venture capital markets appear less developed than in the United States, interms both of the amounts invested and the amount per deal. Exits from VC and other private equity investments, throughtrade sales (mergers and acquisitions) or initial public offerings (IPOs) on stock markets, provide an opportunity for investorsto realise returns from their investment and potentially free up funding for further investment in innovative young firms.As a consequence of the financial crisis, both trade sales and IPOs have declined significantly. Exit markets have not yetrecovered (especially in Europe) and further improvement in these markets remains a challenge.
17. Venture capital investment in the United States, 1995-2012 and in Europe, 1995-2010
Source: OECD calculations based on PwCMoneyTree, EVCA/Thomson Reuters/PwC and EVCA/PEREP_Analytics, June 2013. See chapter notes.1 2 http://dx.doi.org/10.1787/888932889611
18. Venture capital exits in the United States and Europe, 2007-12Trade sales and initial public offerings
Source: OECD calculations based on EVCA/PEREP_Analytics and Thomson Reuters/National Venture Capital Association, June 2013. See chapter notes.1 2 http://dx.doi.org/10.1787/888932889630
120
80
100
60
40
20
0
12 600
10 500
8 400
6 300
4 200
2 100
0200019991998199719961995 2001 2002 2003 2004 2005 2006 2007 2008 2009 2010 2011 2012
USD billions at current exchange rates Number of deals
VC investment in the United States (left-hand scale) VC investment in Europe (left-hand scale)Number of deals in the United States (right-hand scale) Number of deals in Europe (right-hand scale)
2007 2008 2009 2010 2011 2012 2007 2008 2009 2010 2011 2012
120
100
80
60
40
20
0
120
100
80
60
40
20
0
United States EuropeIndex 2007 = 100Index 2007 = 100
Trade sales Initial public offerings
OECD SCIENCE, TECHNOLOGY AND INDUSTRY SCOREBOARD 2013 © OECD 2013 29

1. KNOWLEDGE ECONOMIES: TRENDS AND FEATURES
Sources of growth and the crisis
Technology development
Data on patent applications can be used to investigate the extent to which inventions occur in different technology areas,and the pace at which these fields develop and mature. Patents in ICT, health and biotechnologies account for the majorityof patent applications worldwide, although their relative importance has decreased from almost 72% in 2000 to 54% in 2011.This decline has been mainly driven by a gradual reduction in the number of patent applications in health- and biotechnology-related technologies. Patents in nanotechnologies and the environment, instead, which in 2000 accounted for about 6% ofall patents, saw their relative share increase to almost 10% in 2010.
Classifying patents into technology areas
Information contained in patent documents – the invention’s International Patent Classification (IPC) and national patent classificationfields, its title, the abstract describing it, and its list of claims – can be used to classify a patent in the relevant technology. In the case of IPCclasses, one or several codes may be attributed during the patent examination process. However, for emerging and rapidly evolvingtechnologies, specific categories or classes may not be available when needed. This can make it difficult to identify patents relating to suchtechnologies at a later date. A careful examination of the IPC classes and subclasses, combined with searches for appropriate keywords inthe text fields of the patent document, makes it possible to define the boundaries of a given technology domain. A comprehensive allocationof patented inventions based on 4-digit IPC codes was developed by Schmoch (WIPO, 2008, revised in 2013), who subdivided patents into 35technology classes. Additionally, groups of experts have identified key domains on the basis of IPC classes and the ad hoc tagging system ofthe European Classification System (ECLA) to highlight the areas of application of patented inventions.
19. Patents by technology fields, 1999-2011As a percentage of total patent applications
Source: OECD, Patent Database, June 2013. See chapter notes.1 2 http://dx.doi.org/10.1787/888932889649
40
30
20
10
-10
0
%
1999 2000 2001 2002 2003 2004 2005 2006 2007 2008 2009 2010 2011
ICT Health Biotechnologies Environment NanotechnologiesAnnual growth rate (all patents) Annual growth rate (ICT-related patents)
OECD SCIENCE, TECHNOLOGY AND INDUSTRY SCOREBOARD 2013 © OECD 201330

1. KNOWLEDGE ECONOMIES: TRENDS AND FEATURES
Sources of growth and the crisis
Trade in the crisis
Growth of international trade has greatly outpaced growth of GDP over the past decade. Between 2000 and 2008, and beforethe financial crisis triggered a worldwide slump in 2009, there was a nearly threefold increase in reported global exports ofgoods and services. Movements of intermediate goods were the hardest hit but were also the first to recover. Between 2000and 2011 growth of exports from emerging economies outpaced exports of OECD countries. By 2011, the OECD’s share ofgoods exports had fallen by about 12 percentage points from 2000 and its share of exports of services had fallen by 10 percentagepoints. In general, services were less affected by the collapse. By 2011, in both OECD and non-OECD economies, global tradein goods and services had recovered, supported by increases in commodity prices. The amplitude of the crisis underscoredthe depth and breadth of global interdependencies and prompted calls for better tools to link trade, demand and outputflows across countries, sectors and commodities. The recent development of the OECD-WTO Trade in Value Added (TiVA)Database has made it possible to analyse trade dynamics and relations from a new perspective.
20. The dynamics of merchandise exports in OECD and non-OECD economies, 2000-11
Source: OECD, STAN Bilateral Trade Database by Industry and End-use (BTDIxE), www.oecd.org/sti/btd, May 2013. StatLink contains more data. Seechapter notes.
1 2 http://dx.doi.org/10.1787/888932889668
21. The dynamics of trade in services in OECD and non-OECD economies, 2000-12
Source: UNCTAD, UNCTADstat, June 2013.1 2 http://dx.doi.org/10.1787/888932889687
450
350
400
300
250
200
150
100
50
74
70
66
62
582000 2001 2002 2003 2004 2005 2006 2007 2008 2009 2010 2011
OECD intermediates
Final OECD Final non-OECD Non-OECD intermediates
Index 2000 = 100
43.1%
56.9%
34.1%
65.9%Shares of intermediate and final goods in total exports
Percentage shares of world exports
OECD shares in world’s exports (right-hand scale)
450
350
400
300
250
200
150
100
50
80
76
72
68
642000 2001 2002 2003 2004 2005 2006 2007 2008 2009 2010 20122011
OECD Non-OECD
Index 2000 = 100 Percentage shares of world exports
OECD shares in world’s exports (right-hand scale)
OECD SCIENCE, TECHNOLOGY AND INDUSTRY SCOREBOARD 2013 © OECD 2013 31
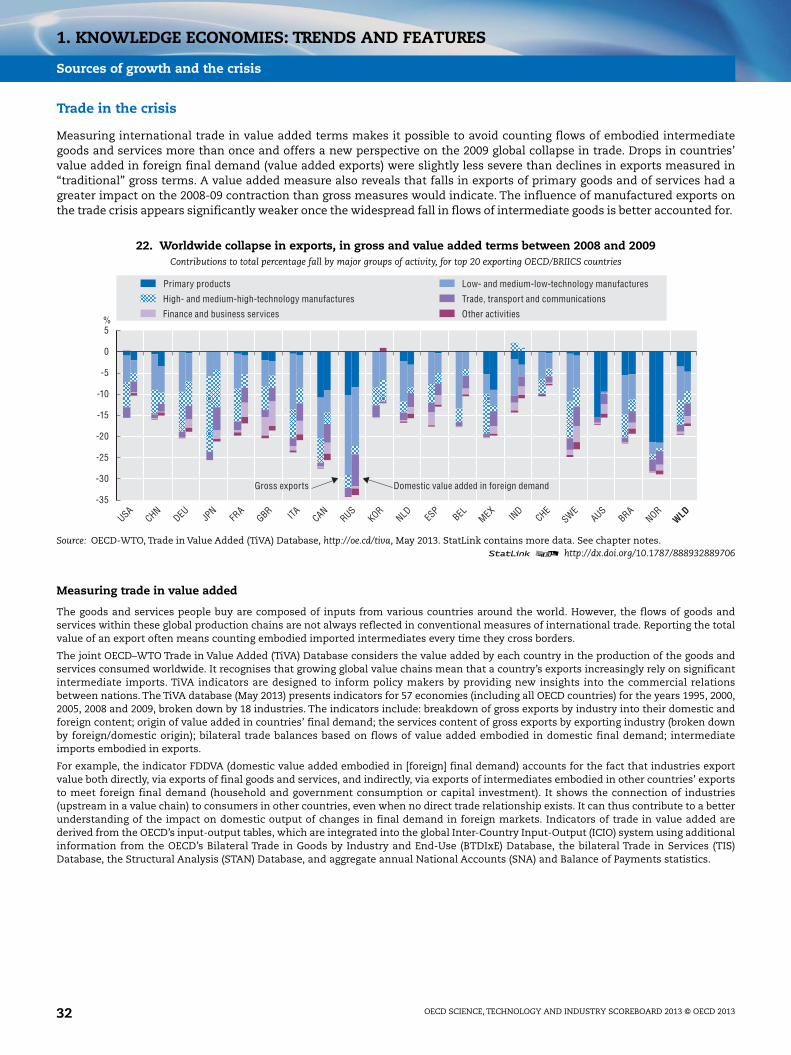
1. KNOWLEDGE ECONOMIES: TRENDS AND FEATURES
Sources of growth and the crisis
Trade in the crisis
Measuring international trade in value added terms makes it possible to avoid counting flows of embodied intermediategoods and services more than once and offers a new perspective on the 2009 global collapse in trade. Drops in countries’value added in foreign final demand (value added exports) were slightly less severe than declines in exports measured in“traditional” gross terms. A value added measure also reveals that falls in exports of primary goods and of services had agreater impact on the 2008-09 contraction than gross measures would indicate. The influence of manufactured exports onthe trade crisis appears significantly weaker once the widespread fall in flows of intermediate goods is better accounted for.
Measuring trade in value added
The goods and services people buy are composed of inputs from various countries around the world. However, the flows of goods andservices within these global production chains are not always reflected in conventional measures of international trade. Reporting the totalvalue of an export often means counting embodied imported intermediates every time they cross borders.
The joint OECD–WTO Trade in Value Added (TiVA) Database considers the value added by each country in the production of the goods andservices consumed worldwide. It recognises that growing global value chains mean that a country’s exports increasingly rely on significantintermediate imports. TiVA indicators are designed to inform policy makers by providing new insights into the commercial relationsbetween nations. The TiVA database (May 2013) presents indicators for 57 economies (including all OECD countries) for the years 1995, 2000,2005, 2008 and 2009, broken down by 18 industries. The indicators include: breakdown of gross exports by industry into their domestic andforeign content; origin of value added in countries’ final demand; the services content of gross exports by exporting industry (broken downby foreign/domestic origin); bilateral trade balances based on flows of value added embodied in domestic final demand; intermediateimports embodied in exports.
For example, the indicator FDDVA (domestic value added embodied in [foreign] final demand) accounts for the fact that industries exportvalue both directly, via exports of final goods and services, and indirectly, via exports of intermediates embodied in other countries’ exportsto meet foreign final demand (household and government consumption or capital investment). It shows the connection of industries(upstream in a value chain) to consumers in other countries, even when no direct trade relationship exists. It can thus contribute to a betterunderstanding of the impact on domestic output of changes in final demand in foreign markets. Indicators of trade in value added arederived from the OECD’s input-output tables, which are integrated into the global Inter-Country Input-Output (ICIO) system using additionalinformation from the OECD’s Bilateral Trade in Goods by Industry and End-Use (BTDIxE) Database, the bilateral Trade in Services (TIS)Database, the Structural Analysis (STAN) Database, and aggregate annual National Accounts (SNA) and Balance of Payments statistics.
22. Worldwide collapse in exports, in gross and value added terms between 2008 and 2009Contributions to total percentage fall by major groups of activity, for top 20 exporting OECD/BRIICS countries
Source: OECD-WTO, Trade in Value Added (TiVA) Database, http://oe.cd/tiva, May 2013. StatLink contains more data. See chapter notes.1 2 http://dx.doi.org/10.1787/888932889706
5%
-5
0
-10
-15
-30
-25
-20
-35
USACHN
DEU JPN
FRA
GBR ITA CANRUS
KORNLD ES
PBEL
MEXIN
DCHE
SWEAUS
BRANOR
WLD
Primary products
High- and medium-high-technology manufactures Trade, transport and communications
Finance and business services Other activities
Low- and medium-low-technology manufactures
Gross exports Domestic value added in foreign demand
OECD SCIENCE, TECHNOLOGY AND INDUSTRY SCOREBOARD 2013 © OECD 201332

1. KNOWLEDGE ECONOMIES: TRENDS AND FEATURES
Sources of growth and the crisis
Investment in the crisis
Since the mid-1990s, foreign direct investment (FDI) has grown at a faster pace than international trade in goods andservices. Although most flows still take place within the OECD, the landscape has changed dramatically in the past decade.Until 2003, around 95% of FDI outflows originated from OECD countries, but in the following years their share fell below 80%owing to the spectacular rise in overseas investment by emerging economies. The impact of the 2008 crisis on FDI flowsvaried across countries. Non-OECD economies overall experienced a severe slump (about 20%) in 2009 followed by an immediaterecovery. In the OECD area as a whole, both inward and outward flows were already falling in 2008 and by 2011 had still notreached their pre-crisis levels.
23. Trends in world foreign direct investment flows 1995-2011
Source: IMF, Balance of Payments Database, June 2013. See chapter notes.1 2 http://dx.doi.org/10.1787/888932889725
100
300
500
700
900
1 100
1 300
1 500
1 700
1 900
2 100
50
55
60
65
70
75
80
85
90
95
100
1995 1996 1997 1998 1999 2000 2001 2002 2003 2004 2005 2006 2007 2008 2009 2010 2011
OECD % share of outward FDI (right-hand scale)
Non-OECD outward FDI index
OECD outward FDI index
Share of total world FDIIndex 1995 = 100
Non-OECD inward FDI index
OECD % share of inward FDI (right-hand scale)
OECD inward FDI index
OECD SCIENCE, TECHNOLOGY AND INDUSTRY SCOREBOARD 2013 © OECD 2013 33

1. KNOWLEDGE ECONOMIES: TRENDS AND FEATURES
Sources of growth and the crisis
GDP per capita
GDP per capita is a measure traditionally used to gauge a nation’s welfare. Changes in this measure can result from changesin labour productivity (GDP per hours worked) and labour utilisation (hours worked per employee and employment per capita).Differences in GDP per capita growth in OECD countries can be mainly attributed to differences in labour productivitygrowth, as labour utilisation has generally increased only marginally over the past 15 years. The picture has been slightlydifferent since the onset of the financial crisis. In most countries, the decline in GDP per capita was primarily due to sub-stantial declines in labour utilisation, only partly offset by increases in productivity. These were due to falls both in employ-ment and hours worked per person, while labour force participation remained broadly unchanged. In 2010 widespreadgrowth signalled the start of a global recovery. However, the pace of recovery varies in OECD countries and obliges them tofind new and sustainable sources of growth.
24. Decomposition of growth in GDP per capita, 2007-09 and 2009-12Total economy, annual percentage change
Source: OECD, Productivity Database, www.oecd.org/std/productivity-stats, August 2013. StatLink contains more data. See chapter notes.1 2 http://dx.doi.org/10.1787/888932889744
-10 -5 0 5 10%
-10 -5 0 5 10%
-10 -5 0 5 10%
2007-09 2009-12
GRCPRTESPLUXITA
SVNISL
NLDIRL
GBRNORDNKBELNZLEURHUNFRACZEFIN
USAAUSCANCHEAUT
JPNISR
DEUSWEPOLSVKKORMEXRUSCHLESTTUR
Growth in GDP per capita = Growth in GDP per hour worked + Growth in labour utilisation
OECD
OECD SCIENCE, TECHNOLOGY AND INDUSTRY SCOREBOARD 2013 © OECD 201334

1. KNOWLEDGE ECONOMIES: TRENDS AND FEATURES
Sources of growth and the crisis
GDP per capita
What stands out from the breakdown of GDP per capita is the importance of labour productivity in explaining the cross-country dispersion in income per capita. Despite rapid convergence in some of the BRIICS, all still have income gaps ofbetween 65% and 92%, mainly due to large labour productivity shortfalls compared to the United States. Among the BRIICS,China’s GDP per capita soared during the years of the crisis, narrowing the gap by over 6 percentage points; its labour forceparticipation rates remained above the OECD average and the difference in income per capita is essentially due to lowercapital per worker and lower multifactor productivity. In Brazil the GDP per capita gap is slowly diminishing, but it remainslarge and is mainly due to comparatively weak labour productivity performance.
25. Gap in GDP per capita and GDP per person employed in the BRIICS, with respect to the United States, 1997-2012In percentage points
Source: OECD, Productivity Database, www.oecd.org/std/productivity-stats, August 2013. See chapter notes.1 2 http://dx.doi.org/10.1787/888932889763
-55
-60
-80
-65
-75
-85
-95
-70
-90
-100
-55
-60
-80
-65
-75
-85
-95
-70
-90
-100
1997
1998
1999
2007
2006
2005
2004
2003
2002
2001
2000
2008
2009
2010
2012
2011
1997
1998
1999
2007
2006
2005
2004
2003
2002
2001
2000
2008
2009
2010
2012
2011
% %Gap in GDP per capita Gap in GDP per person employed
ChinaBrazil Indonesia Russian Federation South AfricaIndia
OECD SCIENCE, TECHNOLOGY AND INDUSTRY SCOREBOARD 2013 © OECD 2013 35

1. KNOWLEDGE ECONOMIES: TRENDS AND FEATURES
Sources of growth and the crisis
Labour productivity
Understanding the drivers of productivity growth at the total economy level requires an understanding of the contributionof each industry. An individual sector’s contribution depends not only on its productivity growth but also on its share ofvalue added and employment. In the years up to the economic crisis, productivity growth was almost entirely driven bymanufacturing and business-sector services. The contribution of manufacturing was generally due to increasing productiv-ity and not to the growth of the sector. The strong contribution of business-sector services reflected their increasing share inoverall activity; excluding real estate, business-sector services accounted for 35% to 50% of value added across OECD coun-tries.
How to read this figure
Labour productivity growth is defined as the rate of growth in real value added per hour worked. Differences in labour productivity growthacross sectors may relate, for instance, to the intensity with which sectors use capital and skilled labour in their production, the scope forproduct and process innovation, the absorption of external knowledge, the degree of product standardisation, the scope for economies ofscale, and involvement in international competition.
Productivity growth rates differ widely across industries. High growth rates are found particularly in the manufacturing sector but also insome business-sector services. The differences in sectors’ productivity performances do not appear to explain all of the differences inproductivity growth across countries. For instance, in manufacturing, productivity growth rates ranged from less than 1% in Italy to 8% inthe Czech Republic between 1995 and 2011. For most OECD countries for which data are available, labour productivity growth has declinedsince the onset of the financial crisis, and the decline is broadly spread across sectors. Spain is a notable exception, but its labourproductivity growth was due to significantly larger falls in employment than in output.
26. Labour productivity growth in non-agricultural business sector before the crisis, 2001-07Contribution to average annual percentage change by industry
Source: OECD, National Accounts (SNA) Database and Structural Analysis (STAN) Database, ISIC Rev.4, May 2013. See chapter notes.1 2 http://dx.doi.org/10.1787/888932889782
5
4
3
2
1
0
-1
%
PRTES
PSVN
KORDNK
SWE ITASVKAUS
HUNCHE
NLD DEUFIN NORCZE
EST
FRA
LUX
GRCPOL
BELAUT
Finance and insurance
ConstructionWholesale, retail, hotels, food services and transportMining, manufacturing and utilities
Professional, scientific, technical and other business servicesInformation and communication
OECD SCIENCE, TECHNOLOGY AND INDUSTRY SCOREBOARD 2013 © OECD 201336

1. KNOWLEDGE ECONOMIES: TRENDS AND FEATURES
Sources of growth and the crisis
Labour productivity
Since the crisis, productivity growth has been sluggish in many OECD countries; positive growth, however small, hastypically occurred in manufacturing, information and communication, and, to a lesser extent, finance and insurance.However, many recent gains, especially in manufacturing, stem from aggregate efficiency increases following heavy joblosses in the sector.
Measuring labour productivity by sector
The comparability of productivity growth across industries and countries may be affected by problems in measuring real value added. Thisis particularly relevant for services, as it is difficult to isolate price effects due to changes in the quality or the mix of services from pure pricechanges. In spite of the substantial progress made in the past ten years in compiling service producer price indices (SPPIs), the methods usedto compute real value added still vary across OECD countries. In many of them, estimates of real value added in some industries are basedon a sum-of-costs approach, which deflates compensation of employees using assumptions about labour productivity growth. For example,most countries assume no change in labour productivity for public administration activities, which is why this sector is not included here.Also excluded are real estate services, as the output of this sector mainly reflects the imputation made for the dwelling services providedand consumed by homeowners. In addition, sectors such as construction and several services are characterised by a high degree of part-timework and self-employment, which can affect the quality of estimates of actual hours worked. See OECD (2012) Compendium of ProductivityIndicators 2012, OECD Publishing.
27. Labour productivity growth in non-agricultural business sector after the crisis, 2007-11Contribution to average annual percentage change by industry
Source: OECD, National Accounts (SNA) Database and Structural Analysis (STAN) Database, ISIC Rev.4, May 2013. See chapter notes.1 2 http://dx.doi.org/10.1787/888932889801
5
4
3
2
1
0
-3
-1
-2
%
PRTES
PSVN
KORDNK
SWE ITASVKAUS
HUNCHE
NLD DEUFIN NORCZE
EST
FRA
LUX
GRCPOL
BELAUT
Finance and insurance
ConstructionWholesale, retail, hotels, food services and transportMining, manufacturing and utilities
Professional, scientific, technical and other business servicesInformation and communication
OECD SCIENCE, TECHNOLOGY AND INDUSTRY SCOREBOARD 2013 © OECD 2013 37

1. KNOWLEDGE ECONOMIES: TRENDS AND FEATURES
Sources of growth and the crisis
Knowledge-based capital
Innovation stems from more than investment in R&D. It requires complementary assets such as software, design, humancapital and appropriate organisational structures. Investment in such knowledge-based capital (KBC) has been rising inmany OECD economies, often at a faster pace than investment in traditional physical capital. In the United States, the coun-try with the longest time series, investment in KBC has been rising almost continuously for more than 40 years to reachsome 15% of GDP by 2010. In Denmark, Finland, France, the Netherlands, the United Kingdom and the United States, theseinvestments exceeded investment in machinery and equipment in 2010. R&D and other innovative property assets onlyrepresent between 26% and 55% of total KBC investments.
What do we mean by “knowledge-based capital”?
Sometimes referred to as “intangible assets” or “intellectual capital”, knowledge-based capital has been defined as “claims on future benefitsthat do not have a physical or financial embodiment” (Lev, 2001). Much of the focus has been on R&D, key personnel and software, but therange of assets in the bundle of KBC is considerably broader. One classification, offered by Corrado et al. (2009), groups intangibleinvestments into three main types: computerised information (such as software and databases); innovative property (such as scientific andnon-scientific R&D, copyrights, designs, trademarks); and economic competencies (including brand equity, aspects of advertising andmarketing, firm-specific human capital, and the organisational know-how that increases enterprise efficiency). On the basis of that study,researchers in several countries have computed aggregates for KBC investment. Some intangibles – software and, more recently, R&D – arenow recognised by the international statistical community as capital assets and will be accounted for in the System of National Accounts(see the 2010 OECD Handbook on Deriving Capital Measures of Intellectual Property Products, OECD Publishing). More work is needed to harmonisethe definition of KBC and collect data on an internationally comparable basis for better identification and measurement of new sources ofgrowth.
28. Investment in physical and knowledge-based capital, 2010As a percentage of value added of the business sector
Source: Statistics on knowledge-based investment based on INTAN-Invest Database, www.intan-invest.net, and national estimates by researchers.Estimates of physical investment are based on OECD Annual National Accounts (SNA) and INTAN-Invest Database, May 2013. See chapter notes.
1 2 http://dx.doi.org/10.1787/888932889820
35
30
15
25
10
20
5
0
%
LUX
USAFR
ABEL GBR
PRTDNK
NLDSWE ITAAUSJP
NDEU ES
PAUT
IRL
CAN FINSVNKOR
CZE
Non-residential physical assets Software and databasesR&D and other intellectual property products Brand equity, firm-specific human capital, organisational capital
OECD SCIENCE, TECHNOLOGY AND INDUSTRY SCOREBOARD 2013 © OECD 201338

1. KNOWLEDGE ECONOMIES: TRENDS AND FEATURES
Sources of growth and the crisis
Dynamics of knowledge-based assets
Evidence suggests that business investment in KBC relates to growth and productivity. KBC can be the source of increasingreturns to scale in production by allowing firms to make use of existing knowledge without re-incurring the costs ofdeveloping it. In addition, some of the knowledge created by assets such as R&D, design and new business processes canspill over into other parts of the economy, spurring growth. Growth accounting studies for the European Union and theUnited States show that business investment in KBC is the source of 20% to 27% of average labour productivity growth.Recently gathered data suggest that, at least in the early phase of the global economic crisis, business investment in KBCeither grew faster than, or did not decline to the same extent as, investment in physical capital. This characteristic ofaggregate investment in KBC may depend in part on the nature of the expenditures measured, primarily wages, which tendto be stickier than other forms of business expenditures.
How to read this figure
Since the start of the global economic crisis, business investment has suffered, although not equally across different types of assets. Thisfigure shows the change in investment in KBC and in physical assets between 2008 and 2010. For example, in the United States, investmentin physical assets fell from 9.7% to 7.6% of business-sector value added, a drop of 2.1 percentage points. Investment in innovative propertyfell by 0.67 percentage points, while investment in economic competencies increased by 0.16 percentage points.
29. Change in business investment intensity between 2008 and 2010
Source: Statistics on knowledge-based investment are based on INTAN-Invest Database, www.intan-invest.net, and national estimates by researchers.Estimates of physical investment are based on OECD Annual National Accounts (SNA) and the INTAN-Invest Database, May 2013. See chapter notes.
1 2 http://dx.doi.org/10.1787/888932889839
2
1
-5
0
-6
-4
-3
-2
-1
-7
-8
ESP
FRA
CZESWE
NLDITA USAFIN PRTDEU IR
LSVN
LUX
AUTGBR
DNK A
USBEL
Percentage points
Non-residential physical assets Software and databasesR&D and other intellectual property products Brand equity, firm-specific human capital, organisational capital
OECD SCIENCE, TECHNOLOGY AND INDUSTRY SCOREBOARD 2013 © OECD 2013 39

1. KNOWLEDGE ECONOMIES: TRENDS AND FEATURES
The new geography of growth
Evolving global value chains
The international fragmentation of production has expanded rapidly in the last two decades and production processes inmany economies have specialised in specific tasks and activities. To understand this development it is not enough to com-pare direct imports to measures of domestic production. A producer that imports components may also purchase compo-nents from domestic providers that, in turn, use intermediate imports in their production processes. Moreover, imports maycontain elements produced in the domestic economy. Developed in response to demand from policy makers, the OECD-WTO Trade in Value Added (TiVA) Database offers new insights on international trade patterns and dynamics. For example,indicators of the foreign value added content of exports reveal the extent to which countries have become more dependenton imports from a greater number of countries in order to maintain or improve their export performance.
How to read these figures
The size of the bubble represents the total amount of foreign value added embodied in an economy’s or a region’s total exports of goods andservices for final demand (e.g. household and capital consumption). This is broken down to reveal the origin of the imported (intermediate)content (arrows). As the following figure for 2009 shows, the size of the bubbles and the thickness of the arrows increase considerablybetween 1995 and 2009, the latest available year in the TiVA Database, and demonstrate countries’ increased dependency on imports.
30. Foreign value added content of exports, 1995Selected flows, by source country/region, USD millions, at current prices
Source: OECD-WTO, Trade in Value Added (TiVA) Database, http://oe.cd/tiva, May 2013; map source: ARTICQUE© – all rights reserved. StatLink containsmore data. See chapter notes.
1 2 http://dx.doi.org/10.1787/888932889858
CAN
USA
MEX
EU15
RUS
KOR
JPNCHN
AUS
50 000
1 000 000
Flow in USD millions
Area sizein USD millions ASEAN
Other Europe
Rest of the world
OECD SCIENCE, TECHNOLOGY AND INDUSTRY SCOREBOARD 2013 © OECD 201340

1. KNOWLEDGE ECONOMIES: TRENDS AND FEATURES
The new geography of growth
Evolving global value chains
In most economies, the share of foreign value added in exports has increased in the last decade, a clear sign of the growingand evolving reliance on foreign intermediates in production. Among other factors, geography (proximity to markets), sizeof the economy (ability to source intermediates from domestic suppliers), and natural endowments of mineral resources allplay a role. For example, in recent years China has increasingly relied on imports, notably from Europe, Japan and otherOECD economies, to produce final goods for export. The foreign value added content of Chinese exports rose from 12% to33% between 1995 and 2009.
31. Foreign value added content of exports, 2009Selected flows, by source country/region, USD millions, at current prices
Source: OECD-WTO, Trade in Value Added (TiVA) Database, http://oe.cd/tiva, May 2013; map source: ARTICQUE© – all rights reserved. StatLink containsmore data. See chapter notes.
1 2 http://dx.doi.org/10.1787/888932889877
150 000
CAN
USA
MEXEU15
RUS
KOR
JPNCHN
AUS1 000 000
Rest of the world
Flow in USD millions
Area size in USD millions
Other Europe
ASEAN
OECD SCIENCE, TECHNOLOGY AND INDUSTRY SCOREBOARD 2013 © OECD 2013 41

1. KNOWLEDGE ECONOMIES: TRENDS AND FEATURES
The new geography of growth
Evolving global value chains
The exports of countries with relatively open and liberal trade regimes and high shares of foreign direct investment arelikely to have higher foreign value added content. The exports of larger economies that have significant mineral resourcesor are relatively far from foreign markets and suppliers tend to have relatively higher domestic (and lower foreign) valueadded content than those of smaller economies. Similarly, the exports of countries that specialise in activities upstream inthe value chain, such as mining and agriculture, and those that specialise in services typically have higher domestic valueadded content. For the OECD area, foreign value added represented 24% of the value of gross exports in 2009, up from 19%in 1995. For the largest non-OECD exporters, it ranged from less than 10% in the Russian Federation and Brazil, where theweight of natural resources in exports is high, up to 50% in Singapore. In China, where gross exports increased about 12-foldat current prices to almost USD 1 300 billion, this measure of interdependence almost tripled to more than 30%, with 60% ofthe foreign value added of exports originating from OECD countries, half of which from Japan and Korea.
How to read this figure
The height of the stacked bars represents the percentage of foreign value added included in gross exports in 2009. Economies are orderedaccording to the share of foreign value added originating from the OECD area. The right-hand scale indicates the value of gross exports inUSD billions in 2009.
32. Foreign value added content of exports, non-OECD economies, 2009As a percentage of total gross exports
Source: OECD-WTO, Trade in Value Added (TiVA) Database, http://oe.cd/tiva, May 2013. StatLink contains more data. See chapter notes.1 2 http://dx.doi.org/10.1787/888932889896
60
50
40
30
20
10
0
1 250
1 500
1 000
750
500
250
0
% USD billions
58.2 60.6 49.5 52.3 59.1 49.6 52.5 50.0 53.0 48.1 58.0 68.9 69.5
SGP MYS TWN PHL CHN THA HKG IND ZAF IDN BRA RUS
Share of OECD in foreign value added
OECD
OECD Non-OECD Gross exports USD billions (right-hand scale)Foreign value added shares in 1995
OECD SCIENCE, TECHNOLOGY AND INDUSTRY SCOREBOARD 2013 © OECD 201342

1. KNOWLEDGE ECONOMIES: TRENDS AND FEATURES
The new geography of growth
A new look at service trade
Services represent more than 70% of GDP in most OECD countries, while reported trade in services accounts for just overone-quarter of total international trade in goods and services. However, accounting for the value added by services in theproduction of goods reveals that the services sector plays a much more significant role in international trade, surpassing50% of total exports in the United States, the United Kingdom, France, Germany and Italy. The OECD-WTO Trade in ValueAdded (TiVA) Database can provide insights into the role of services in global value chains by revealing, for example, theextent to which exports of manufactured goods depend on the inputs from various service activities that are required toproduce them. In 2009, about a third of the value of OECD exports of manufactured goods could be attributed to services, asignificant rise since 1995. Services content varies across industries and countries; electrical and transport equipment(high- and medium-high technology) manufactures have large shares of services content in many countries, often owing tobusiness services such as IT services. Service content can be further split into domestic and foreign origin. Foreign servicescontent in high- and medium-high-technology manufactures can represent between 40% and 50% of total services valueadded content.
How to read this figure
The indicator of services value added in manufacturing exports reflects the share of services value added in manufacturing production. Thedistance between 1995 and 2009 average values shows that the average content of services rose about 5 percentage points during the periodto a value ranging from 30% to 35% across all industries. Half of the OECD economies (between the 25th and 75th percentiles) differ by only 5to 10 percentage points. Lowest and highest country values in each industry are much more diversified, and their interpretation depends onthe industry and the economy under consideration. Differences among countries are very small for machinery manufacturing but very widefor electrical equipment. For the latter, the share of services in the Netherlands’ manufacturing exports largely concerns R&D and marketingservices while Chile has very little manufacturing in this industry.
33. Services value added in manufacturing exports by industry, 1995 and 2009Range of values as a percentage of gross exports
Source: OECD-WTO, Trade in Value Added (TiVA) Database, http://oe.cd/tiva, May 2013.StatLink contains more data. See chapter notes.1 2 http://dx.doi.org/10.1787/888932889915
60
50
40
30
20
0
10
%
Machinery
DEU ITA
IRL
DEUFRA
ISR
NLDIRL
ITA
ISR USAKOR
KOR CHLUSA
CHLKOR
CHL
OECD average 1995 OECD average 2009 OECD 25th and 75th percentiles 2009
Highest value
Lowest value
Foodproducts
Textiles andapparel
Wood andpaper
Chemicalsand minerals
Basicmetals
Electricalequipment
Transportequipment
Othermanufactures
OECD SCIENCE, TECHNOLOGY AND INDUSTRY SCOREBOARD 2013 © OECD 2013 43

1. KNOWLEDGE ECONOMIES: TRENDS AND FEATURES
The new geography of growth
FDI shifting east
Foreign direct investment may provide recipient countries with access to new technologies and generate knowledge spill-overs for domestic firms and additional investment in R&D. In the last 15 years FDI flows have tripled. FDI inflows to Europestill exceed those to the rest of the world, but FDI flows to China and the rest of Southeast Asia have leapt from an averageof about USD 81 billion a year in 1995-2000 to about USD 353 billion a year in 2007-11. According to preliminary OECD 2012estimates, 44% of global FDI inflows were hosted by just five countries. China, with a five-fold increase in average annualinflows over 2008-11 became the largest FDI recipient in 2012, followed by the United States, Brazil, the United Kingdom andFrance. Rising global FDI outflows are driven by OECD countries and more than doubled between the early and late 2000s.At the same time, FDI by the BRIICS increased substantially as these economies became more integrated in the globaleconomy.
34. Foreign direct investment inflows, 1995-2000, 2001-06 and 2007-11Yearly averages
Source: IMF, Balance of Payments Database, June 2013. See chapter notes.1 2 http://dx.doi.org/10.1787/888932889934
35. Outward foreign direct investment flows from BRIICS, 2001-04, 2005-07 and 2008-11Billions of USD, current exchange rates, yearly averages
Source: IMF, Balance of Payments Database, June 2013. See chapter notes.1 2 http://dx.doi.org/10.1787/888932889953
2 000
1 800
1 600
1995-2000
2001-06
2007-11
1 400
1 200
1 000
800
600
400
200
0
USACHN
JPN
USACHN
JPN
USACHN
JPN
All countries
USD billions at current exchange rates
EU28
Other O
ECD
Rest o
f the w
orld
Other B
RIICS
Southe
ast A
siaEU28
Other O
ECD
Rest o
f the w
orld
Other B
RIICS
Southe
ast A
siaEU28
Other O
ECD
Rest o
f the w
orld
Other B
RIICS
Southe
ast A
sia
1 800
1 400
90
40
50
60
70
80
30
20
10
0
-10RUSCHN IND BRA IDN ZAF
711
Average 2008-11 Average 2005-07 Average 2001-04
USD billions at current exchange rates
OECD
OECD SCIENCE, TECHNOLOGY AND INDUSTRY SCOREBOARD 2013 © OECD 201344

1. KNOWLEDGE ECONOMIES: TRENDS AND FEATURES
The new geography of growth
FDI shifting east
Average outward foreign direct investment (OFDI) from India increased more than nine-fold between the early and late2000s while that of China increased 30-fold. Asia, and particularly Hong Kong, China, remains the largest recipient ofChinese investment, but the Caribbean countries also receive large amounts of Chinese OFDI. The routing via Hong Kong,China, and the Caribbean makes it difficult to build a reliable picture of the geographical distribution of China’s OFDI. Interms of the stocks of inward and outward FDI, the United States remains the top investor and largest destination for FDI,with an inward stock of about USD 4 trillion, or about 20% of US GDP. Japan and Germany have the largest net activeposition, and Brazil is the largest net receiver. Besides Hong Kong, China, the top 20 economies measured by the sum ofinward and outward positions include some very small economies such as Ireland, Singapore and the British Virgin Islands.Larger economies such as Italy and Japan attract little foreign investment, which contributes to their positive net FDI stockbalance.
36. Outward foreign direct investment flows from China, yearly average 2007-11USD billions at current exchange rates
Source: OECD calculations based on Chinese Ministry of Commerce, Statistical Bulletin of China’s Outward Foreign Direct Investment 2011. Map source:ARTICQUE© – all rights reserved. See chapter notes.
1 2 http://dx.doi.org/10.1787/888932889972
37. Top 20 countries, total stock of foreign direct investment, 2012Inward and outward positions, USD billions at current exchange rates
Source: UNCTAD, FDI/TNC Database, www.unctad.org/fdistatistics, July 2013. See chapter notes.1 2 http://dx.doi.org/10.1787/888932889991
30 10 2
Outward FDI flows(USD billions)
Offshore financialcenters: 12.7%
United Statesand Canada: 2.8% EU28: 6.4%
OtherSoutheastAsia: 6.4%
Australia: 3.4%
Japan: 0.2%
Hong Kong, China: 57.4%
Africa: 4.9%
5 000
4 000
3 000
2 000
1 750
1 500
1 250
1 000
750
500
250
0
USA H
KGGBR
FRA
BEL
CHN
DEU
BRA
SNG
CHE
CAN
ESP
AUS
RUS
SWE
VGB
ITA
IRL
JPN
NLD
Inward Outward
USD billions
OECD SCIENCE, TECHNOLOGY AND INDUSTRY SCOREBOARD 2013 © OECD 2013 45

1. KNOWLEDGE ECONOMIES: TRENDS AND FEATURES
The new geography of growth
The structure of economies
As manufacturing production declines in OECD countries, the contribution of services to GDP rises: they now representmore than 70% of OECD value added and surpass 75% in eight OECD countries, including France and the United States. Evenas manufacturing has expanded in the BRIICS in the last 20 years, natural resources continue to play a significant role intheir economies, especially in the Russian Federation. Among OECD countries, Australia, Chile, Norway and Mexico relyheavily on natural resources.
38. Composition of GDP in OECD and BRIICS countries, 2011Value added of major activity groups as a percentage of total industry value added
Source: OECD National Accounts (SNA) Database and Structural Analysis (STAN) Database, ISIC Rev.4; and national statistical institutes, June 2013. Seechapter notes.
1 2 http://dx.doi.org/10.1787/888932890010
39. Top 20 OECD and BRIICS countries reliant on natural resources, 2011Natural resource rents as a percentage of GDP
Source: World Bank, World Development Indicators Database, June 2013. See chapter notes.1 2 http://dx.doi.org/10.1787/888932890029
100
80
60
40
20
0
%
LUX
GRCFR
AUSA
ISRDNK
BEL GBRPRT
NLD ITA CHEJP
N IRL
SWECAN
ESP
AUS FIN NZL AUTZAF
DEU BRASVN
EST ISL
HUNTUR
POLMEX
SVKCZE
RUSKOR
CHLNOR
IND
CHNID
N
“Market” services “Non-market” services Construction Industry Agriculture
25
20
15
10
5
0
%33.3
RUSCHL
NORAUS
ZAFID
NCHN
MEXIN
DBRA
CANES
TNZL POL
DNKUSA
GBRSWE
NLD CZE
4
3
2
1
0
EST
NZLPOL
DNKUSA
GBRSWE
NLD CZE
Magnified
Oil Natural gas Coal Minerals Forest Total rents in 2001
OECD SCIENCE, TECHNOLOGY AND INDUSTRY SCOREBOARD 2013 © OECD 201346
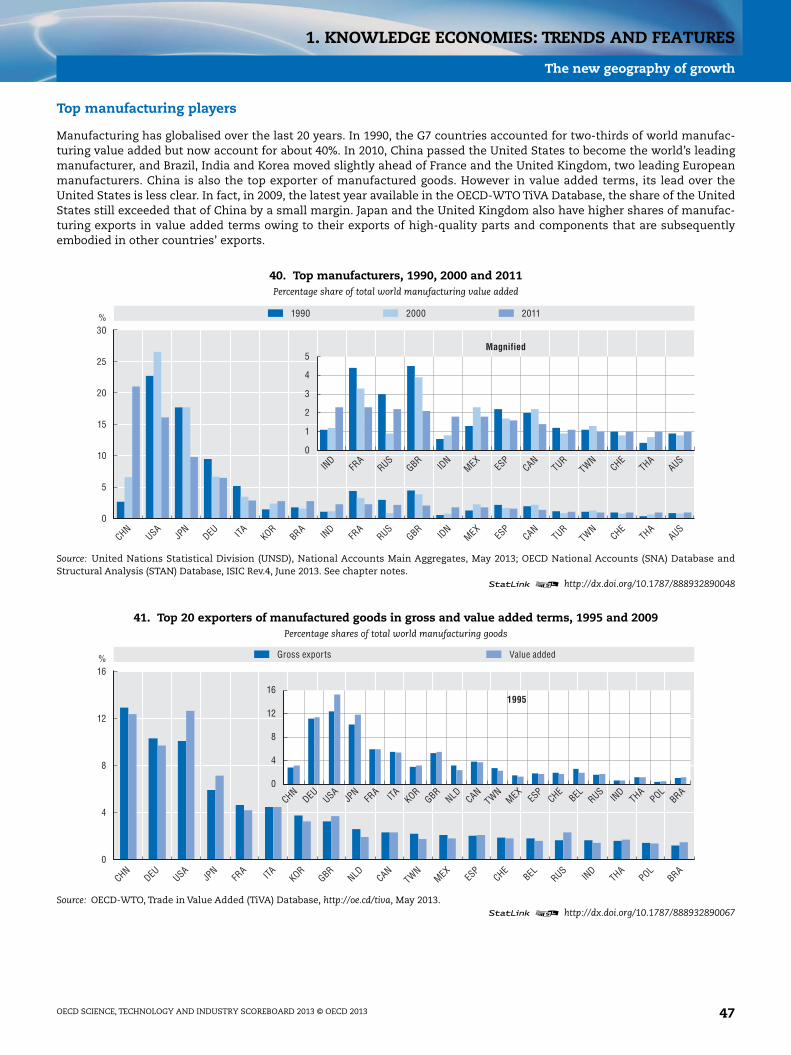
1. KNOWLEDGE ECONOMIES: TRENDS AND FEATURES
The new geography of growth
Top manufacturing players
Manufacturing has globalised over the last 20 years. In 1990, the G7 countries accounted for two-thirds of world manufac-turing value added but now account for about 40%. In 2010, China passed the United States to become the world’s leadingmanufacturer, and Brazil, India and Korea moved slightly ahead of France and the United Kingdom, two leading Europeanmanufacturers. China is also the top exporter of manufactured goods. However in value added terms, its lead over theUnited States is less clear. In fact, in 2009, the latest year available in the OECD-WTO TiVA Database, the share of the UnitedStates still exceeded that of China by a small margin. Japan and the United Kingdom also have higher shares of manufac-turing exports in value added terms owing to their exports of high-quality parts and components that are subsequentlyembodied in other countries’ exports.
40. Top manufacturers, 1990, 2000 and 2011Percentage share of total world manufacturing value added
Source: United Nations Statistical Division (UNSD), National Accounts Main Aggregates, May 2013; OECD National Accounts (SNA) Database andStructural Analysis (STAN) Database, ISIC Rev.4, June 2013. See chapter notes.
1 2 http://dx.doi.org/10.1787/888932890048
41. Top 20 exporters of manufactured goods in gross and value added terms, 1995 and 2009Percentage shares of total world manufacturing goods
Source: OECD-WTO, Trade in Value Added (TiVA) Database, http://oe.cd/tiva, May 2013.1 2 http://dx.doi.org/10.1787/888932890067
30
25
20
15
10
5
0
%
CHNUSA
JPN
DEU ITA KORBRA
IND
FRA
RUSGBR
IDN
MEXES
PCAN
TURTWN
CHETHA
AUS
1990 2000 2011
5
4
3
2
1
0
IND
FRA
RUSGBR
IDN
MEXES
PCAN
TURTWN
CHETHA
AUS
Magnified
16
12
8
4
0
%
CHNDEU USA
JPN
FRA ITA KOR
GBRNLD CAN
TWNMEX
ESP
CHEBEL RUS
IND
THAPOL
BRA
16
12
8
4
0
1995
CHNDEU USA
JPN
FRA ITA KOR
GBRNLD CAN
TWNMEX
ESP
CHEBEL RUS
IND
THAPOL
BRA
Gross exports Value added
OECD SCIENCE, TECHNOLOGY AND INDUSTRY SCOREBOARD 2013 © OECD 2013 47

1. KNOWLEDGE ECONOMIES: TRENDS AND FEATURES
The new geography of growth
Relying on energy
Energy-intensive products make up over a quarter of total OECD exports of manufactures. For most OECD countries theshare has increased since 2000, partly because of price increases in commodities. Energy-intensive does not necessarilymean carbon-intensive, but for many countries, industrial production is an area in which efforts to reduce the carboncontent of output can still be made.
42. Exports from energy-intensive manufacturing industries, 2011As a percentage of total manufacturing exports
Source: OECD, STAN Bilateral Trade Database by Industry and End-use (BTDIxE), May 2013. See chapter notes.1 2 http://dx.doi.org/10.1787/888932890086
90
80
60
70
40
50
0
20
10
30
RUSCHL
ZAFGRC
NOR FIN AUS ISLLU
XBEL CAN
NLD IND IR
LSWE
IDN
BRAES
PKOR
EST
USAPRT
GBRTUR
FRA
SVN ITA AUTPOL
JPN
SVKISR
DEU CHEDNK
MEXCZE
NZL CHNHUN
%
Paper and paper products Coke and refined petroleum products Chemicals and chemical productsOther non-metallic mineral products Basic metals Total 2000
OECD
BRIICS
OECD SCIENCE, TECHNOLOGY AND INDUSTRY SCOREBOARD 2013 © OECD 201348

1. KNOWLEDGE ECONOMIES: TRENDS AND FEATURES
The new geography of growth
Growth and carbon emissions
The gains from growth, while distributed unevenly around the world, have been dramatic. Over the past 150 years lifeexpectancy increased by around 30 years in most regions, including some of the world’s least developed. The growthdynamic that has yielded these improvements in living standards has imposed substantial costs on the physical environ-ment on which human well-being ultimately depends. It is increasingly apparent that the current use of natural resourcescould put higher living standards and even conventionally measured growth at risk. Without decisive action, energy-relatedemissions of CO2 will double by 2050. Efforts to mitigate greenhouse gas (GHG) emissions, such as the Kyoto Protocol, willbe less effective in reducing global emissions of GHG if countries with emission commitments source their carbon-intensiveproduction activities from economies without such commitments, particularly if production in the latter countries is GHG-intensive.
How to estimate imports and exports of CO2
The OECD’s input-output tables, bilateral trade in goods and services statistics, and energy statistics (e.g. fuel-combustion-based CO2 andinternational electricity transfer), together with other industry statistics, can be used to estimate the effects of international transfers of CO2emissions. The results highlight differences among countries in production-based and consumption-based emissions. Consumption-basedCO2 emissions of OECD countries were, on average, about 15% higher in 2009 than conventional measures of production-based emissionswould suggest. The divergence exceeds 25% in France, Italy and the United Kingdom. The magnitude of the difference increased in the late1990s as trade in goods and services increased, except in Japan and Germany where both the production and the consumption of CO2emissions decreased between 1995 and 2009. The emissions structure of countries varies owing to differences in consumption activities,sources of electricity generation and the carbon intensity of imported goods. Electricity-sourced emissions are relatively high in emergingeconomies (e.g. China and India), whereas emissions due to transport activity and consumption of imported goods are relatively high indeveloped OECD economies (e.g. Japan and Germany).
43. Biggest net CO2 importers and net CO2 exporters, 2009Estimates of production-based CO2 emissions and consumption-based CO2 emissions, selected countries, million tonnes
Source: OECD, Inter-Country Input-Output Database, May 2013. International Energy Agency (2013), CO2 emissions from fuel combustion. See chapternotes.
1 2 http://dx.doi.org/10.1787/888932890105
7 0006 000
2 0003 0004 0005 000
1 500
1 000
500
0USA JPN DEU GBR CAN ITA FRA MEX AUS BRA ESP TUR POL ZAF IDN SAU KOR RUS IND CHN
Consumption-based CO2 emissions, 2009Production-based CO2 emissions, 2009 1995 2008
Million tonnes
OECD SCIENCE, TECHNOLOGY AND INDUSTRY SCOREBOARD 2013 © OECD 2013 49

1. KNOWLEDGE ECONOMIES: TRENDS AND FEATURES
The changing landscape of innovation
R&D in the global landscape
The United States is the world’s largest R&D performer, with nearly USD 415 billion of domestic R&D expenditures in 2011.This is about twice the amount of R&D performed in China, which is now the second largest performer, ahead of Japan,Germany and Korea. Korea has the highest ratio of R&D expenditures to GDP owing to rapid increases in recent years. Non-OECD economies account for a growing share of the world’s R&D, measured in terms of total researchers and R&D expendi-tures. Personnel costs account in most economies for the bulk of R&D expenditures. This explains the close relationshipbetween R&D as a percentage of GDP and the number of researchers as a percentage of total employment. Variations can berelated to differences in the price of R&D inputs, such as researcher costs, the pattern of R&D specialisation and R&D capitalexpenditures, as some countries may be developing their research infrastructure for future use.
44. R&D in OECD and key partner countries, 2011
Note: Owing to methodological differences, data for some non-OECD economies may not be fully comparable with figures for other countries.Source: OECD, Main Science and Technology Indicators Database, www.oecd.org/sti/msti.htm, Brazil’s Ministry of Science, Technology and Innovationand UNESCO Institute for Statistics, June 2013. See chapter notes.
1 2 http://dx.doi.org/10.1787/888932890124
0 0.5 1.0 1.5 2.0 2.5 3.0 3.5 4.54.0
16
14
12
10
8
6
4
2
0
USA
CHN
JPN
DEU
KOR
FRA
GBR
RUS
IND
BRA
CAN
ITA
AUS
ESP
SWE
NLD
CHE
TUR
AUTBEL
FIN
MEX
DNK
POL
CZE
NOR
ZAF
PRT
IRL
HUNGRC
NZL
SVN
CHL
SVK
IDN
ESTLUX
ISL
Researchers, per thousand employment
Gross domestic expenditures on R&D as a percentage of GDP
R&D volumes in 2005 USD – constant prices and PPP
USD 100 billion
USD 10 billion
USD 1 billionNorth America
EU
BRIICS
Other OECD members
OECD SCIENCE, TECHNOLOGY AND INDUSTRY SCOREBOARD 2013 © OECD 201350

1. KNOWLEDGE ECONOMIES: TRENDS AND FEATURES
The changing landscape of innovation
The policy mix for R&D
Governments can choose among various instruments to promote business R&D. In addition to giving grants or loans andprocuring R&D, many also provide fiscal incentives. Today, 27 of the 34 OECD countries and a number of non-OECD economiesgive preferential tax treatment to R&D expenditures. New estimates of the cost of these incentives have been combinedwith data on direct R&D funding (R&D grants and purchases), as reported by firms, to provide a more complete picture ofgovernment efforts to promote business R&D. Across countries, R&D intensity in the business sector is significantly correlatedwith total government support for business R&D. This does not imply a causal relationship and there are notable exceptions.Germany and Korea have relatively high business R&D intensity compared to their degree of government support, whileCanada, the Russian Federation and Turkey have high rates of support relative to countries with similar business R&D-to-GDPratios. In 2011, Finland, Germany, Sweden and Switzerland did not offer tax incentives but had very R&D-intensive businesssectors. In 2013, Finland introduced a new R&D tax allowance.
How to read this figure
Bubble sizes represent the total amount of tax incentive support for R&D expenditures in USD PPP. For example, in the Netherlands, taxsupport for R&D is just above USD 1 billion. Total government support for business R&D is just above 0.2% of GDP and business R&D is closeto 1% of GDP. Across countries, the correlation between the two variables is 29%.
How to measure the cost of tax incentives
The OECD data collection on R&D tax incentives, now in its fourth edition, attempts to identify and address subtle differences in the taxtreatment of R&D, the relevant tax benchmark and measurement approaches. National experts on science and technology indicators havecollaborated with public finance and tax authorities to provide the most up-to-date and internationally comparable figures possible. Theestimated cost of provisions for the treatment of R&D expenditures by firms is presented relative to a common benchmark wheneverpossible. Estimates reflect the sum of foregone tax revenues – on an accrual basis – and refunds where applicable. However, many authoritiescan only report the cost of government tax liabilities realised in a given period (cash basis).
45. Business R&D intensity and government support to business R&D, 2011As a percentage of GDP
Note: This is an experimental indicator. International comparability may be limited. For more information, see www.oecd.org/sti/rd-tax-stats.htm.Source: OECD, based on OECD R&D tax incentives questionnaire, publicly available sources and OECD, Main Science and Technology IndicatorsDatabase, www.oecd.org/sti/msti.htm, June 2013. See chapter notes.
1 2 http://dx.doi.org/10.1787/888932890143
3.5
0
0.5
1.0
1.5
2.0
2.5
3.0
0 0.05 0.10 0.15 0.20 0.25 0.30 0.35 0.40 0.45
AUS
SVN
ISR
USA
FRA
CHN
JPN
KOR
CANGBR NLD
BRA
BEL
RUS
TUR
ESP
AUT
IRL
PRTHUN
NOR CZE
ZAF
DNK
ITA
CHLPOL
SVK
EST
FIN
DEU
LUX
MEX
NZL
SWECHE
SVN
Volume of tax support to business R&D, 2011 (million USD PPP) No data availableNo incentive USD 250 million USD 2 500 million USD 75 million
BERD, as % of GDP
Total government support (direct and tax) to business R&D, as % of GDP
OECD SCIENCE, TECHNOLOGY AND INDUSTRY SCOREBOARD 2013 © OECD 2013 51
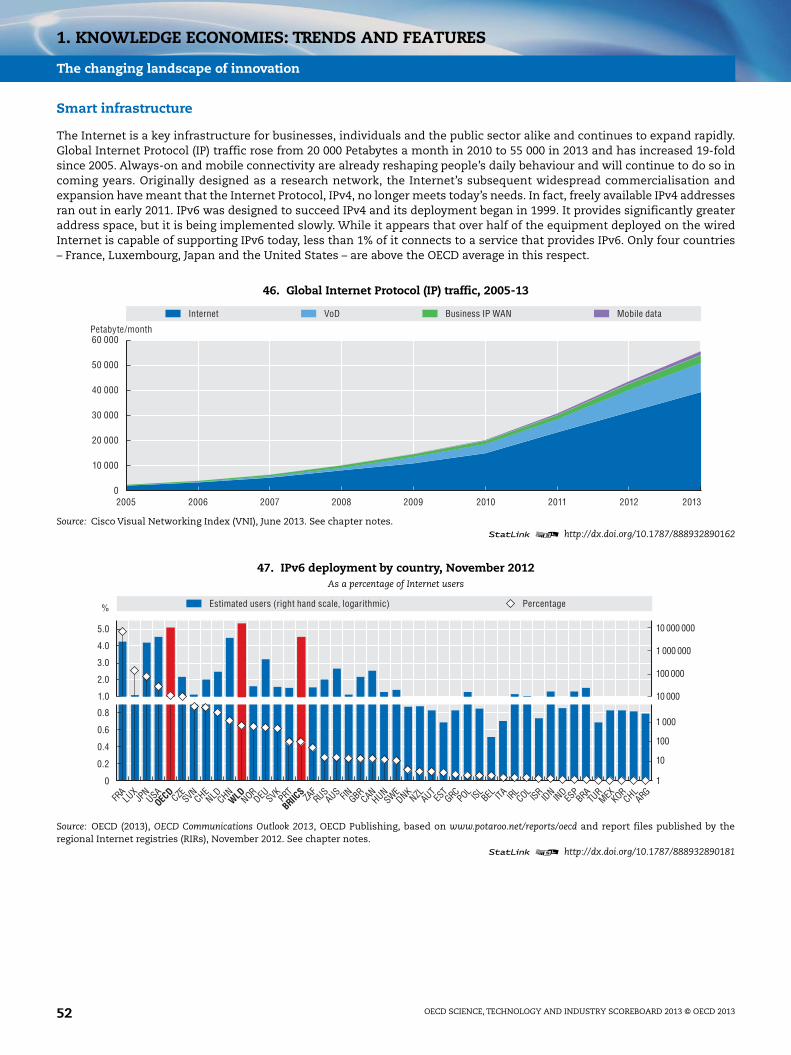
1. KNOWLEDGE ECONOMIES: TRENDS AND FEATURES
The changing landscape of innovation
Smart infrastructure
The Internet is a key infrastructure for businesses, individuals and the public sector alike and continues to expand rapidly.Global Internet Protocol (IP) traffic rose from 20 000 Petabytes a month in 2010 to 55 000 in 2013 and has increased 19-foldsince 2005. Always-on and mobile connectivity are already reshaping people’s daily behaviour and will continue to do so incoming years. Originally designed as a research network, the Internet’s subsequent widespread commercialisation andexpansion have meant that the Internet Protocol, IPv4, no longer meets today’s needs. In fact, freely available IPv4 addressesran out in early 2011. IPv6 was designed to succeed IPv4 and its deployment began in 1999. It provides significantly greateraddress space, but it is being implemented slowly. While it appears that over half of the equipment deployed on the wiredInternet is capable of supporting IPv6 today, less than 1% of it connects to a service that provides IPv6. Only four countries– France, Luxembourg, Japan and the United States – are above the OECD average in this respect.
46. Global Internet Protocol (IP) traffic, 2005-13
Source: Cisco Visual Networking Index (VNI), June 2013. See chapter notes.1 2 http://dx.doi.org/10.1787/888932890162
47. IPv6 deployment by country, November 2012As a percentage of Internet users
Source: OECD (2013), OECD Communications Outlook 2013, OECD Publishing, based on www.potaroo.net/reports/oecd and report files published by theregional Internet registries (RIRs), November 2012. See chapter notes.
1 2 http://dx.doi.org/10.1787/888932890181
60 000
40 000
50 000
30 000
20 000
10 000
02005 2007 2009 2011 20122006 2008 2010 2013
Internet VoD Business IP WAN Mobile data
Petabyte/month
5.0 10 000 000
1 000 000
100 000
10 000
1 000
100
10
1
%
2.0
1.0
3.0
4.0
0.8
0.6
0.4
0.2
0
FRALU
XJP
NUSA
CZESVNCHE
NLDCHNNOR
DEUSVKPRT
ZAFRUS
AUS FINGBRCAN
HUNSWE
DNKNZLAUT
ESTGRC
POL ISLBEL ITA IRL
COLISR
IDN
IND
ESPBRA
TURMEXKOR
CHLARG
Estimated users (right hand scale, logarithmic) Percentage
OECD
WLDBRIIC
S
OECD SCIENCE, TECHNOLOGY AND INDUSTRY SCOREBOARD 2013 © OECD 201352
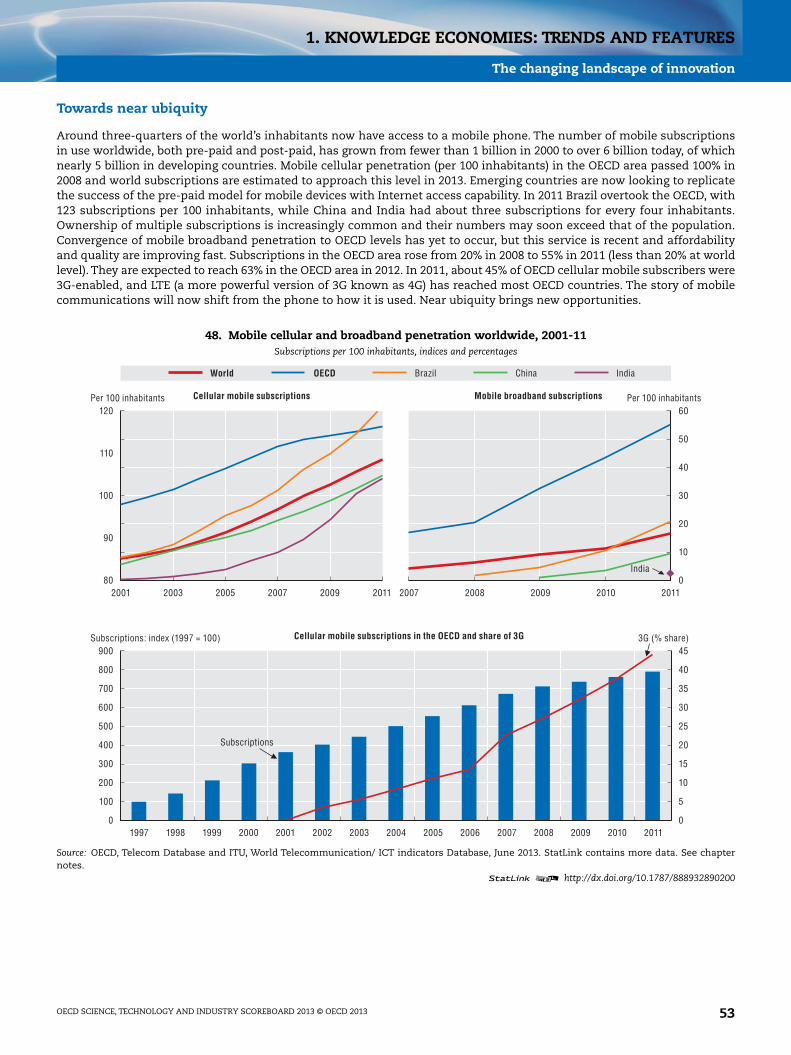
1. KNOWLEDGE ECONOMIES: TRENDS AND FEATURES
The changing landscape of innovation
Towards near ubiquity
Around three-quarters of the world’s inhabitants now have access to a mobile phone. The number of mobile subscriptionsin use worldwide, both pre-paid and post-paid, has grown from fewer than 1 billion in 2000 to over 6 billion today, of whichnearly 5 billion in developing countries. Mobile cellular penetration (per 100 inhabitants) in the OECD area passed 100% in2008 and world subscriptions are estimated to approach this level in 2013. Emerging countries are now looking to replicatethe success of the pre-paid model for mobile devices with Internet access capability. In 2011 Brazil overtook the OECD, with123 subscriptions per 100 inhabitants, while China and India had about three subscriptions for every four inhabitants.Ownership of multiple subscriptions is increasingly common and their numbers may soon exceed that of the population.Convergence of mobile broadband penetration to OECD levels has yet to occur, but this service is recent and affordabilityand quality are improving fast. Subscriptions in the OECD area rose from 20% in 2008 to 55% in 2011 (less than 20% at worldlevel). They are expected to reach 63% in the OECD area in 2012. In 2011, about 45% of OECD cellular mobile subscribers were3G-enabled, and LTE (a more powerful version of 3G known as 4G) has reached most OECD countries. The story of mobilecommunications will now shift from the phone to how it is used. Near ubiquity brings new opportunities.
48. Mobile cellular and broadband penetration worldwide, 2001-11Subscriptions per 100 inhabitants, indices and percentages
Source: OECD, Telecom Database and ITU, World Telecommunication/ ICT indicators Database, June 2013. StatLink contains more data. See chapternotes.
1 2 http://dx.doi.org/10.1787/888932890200
120
110
100
90
802001 2003 2005 2007 2009 2011 2007 2008 2009 2010 2011
1997 1998 1999 2000 2001 2002 2003 2004 2005 2006 2007 2008 2009 2010 2011
60
50
40
30
20
10
0
900
300
400
500
600
700
800
200
100
0
45
40
35
30
25
20
15
10
5
0
Cellular mobile subscriptions Mobile broadband subscriptions
Cellular mobile subscriptions in the OECD and share of 3G
OECDWorld China IndiaBrazil
Subscriptions: index (1997 = 100)
Subscriptions
3G (% share)
Per 100 inhabitants Per 100 inhabitants
India
OECD SCIENCE, TECHNOLOGY AND INDUSTRY SCOREBOARD 2013 © OECD 2013 53

1. KNOWLEDGE ECONOMIES: TRENDS AND FEATURES
The changing landscape of innovation
University hotspots
Worldwide, the top 50 universities with the highest relative impact in 2007-11 – in terms of normalised citations to academicpublications across disciplines – are highly concentrated geographically but less so than in 2003-09. Overall, 34 of the top 50are located in the United States. The rest are in Europe, and, for the first time, two are outside the OECD area, in ChineseTaipei. The United Kingdom is the second-ranked economy, with specific strengths in the medical and social sciences.There are interesting differences by subject, with US-based universities most likely to excel in biochemistry, computerscience, neuroscience and psychology. Universities in non-OECD economies, especially in Asia, play a relatively prominentrole in chemical engineering, energy and veterinary research. These results refer to measures of output quality per unit ofproduction, not absolute values of high-quality publications. Economies also differ in the share of scientific outputproduced outside the higher education sector, for example in government research institutes.
How to read this figure
The X axis shows the geographic distribution of the top 50 universities in the main subject areas (Y axis) according to their normalisedimpact. The publication threshold set for the institutions was at least 100 documents in 2011, except for some disciplines for which thethreshold was set at 50 documents. The normalised impact is the ratio between the average number of citations received by a specific unitand the world average of citations in the same time period, document type and subject area, i.e. the normalisation is done at the level of theindividual article. If an article belongs to several subject areas a mean value of the areas is calculated. The normalised impact of theseinstitutions is calculated for 2007-11 and only for the production in which the country is the main contributor (production in which thecorresponding author belongs to the institution).
49. University hotspots, geographical distribution of highest impact institutions, 2007-11Location of top 50 universities by main subject areas
Source: OECD and SCImago Research Group (CSIC), Compendium of Bibliometric Science Indicators 2014, based on Scopus Custom Data, Elsevier, May 2013.StatLink contains more data. See chapter notes.
1 2 http://dx.doi.org/10.1787/888932890219
0 10 20 30 40 50
USA GBR
Universities
Other EU Other OECD Non-OECD
VeterinarySocial sciences
PsychologyPhysics and astronomy
Pharmacology, toxicology and pharmaceuticsNeuroscience
MedicineMathematics
Material scienceImmunology and microbiology
Environmental sciencesEngineering
EnergyEconomics, econometrics and finance
Earth and planetary sciencesComputer science
ChemistryChemical engineering
Business, management and accountingBiochemistry, genetics and molecular biology
Arts & humanitiesAgricultural and biological sciences
All areas
OECD SCIENCE, TECHNOLOGY AND INDUSTRY SCOREBOARD 2013 © OECD 201354
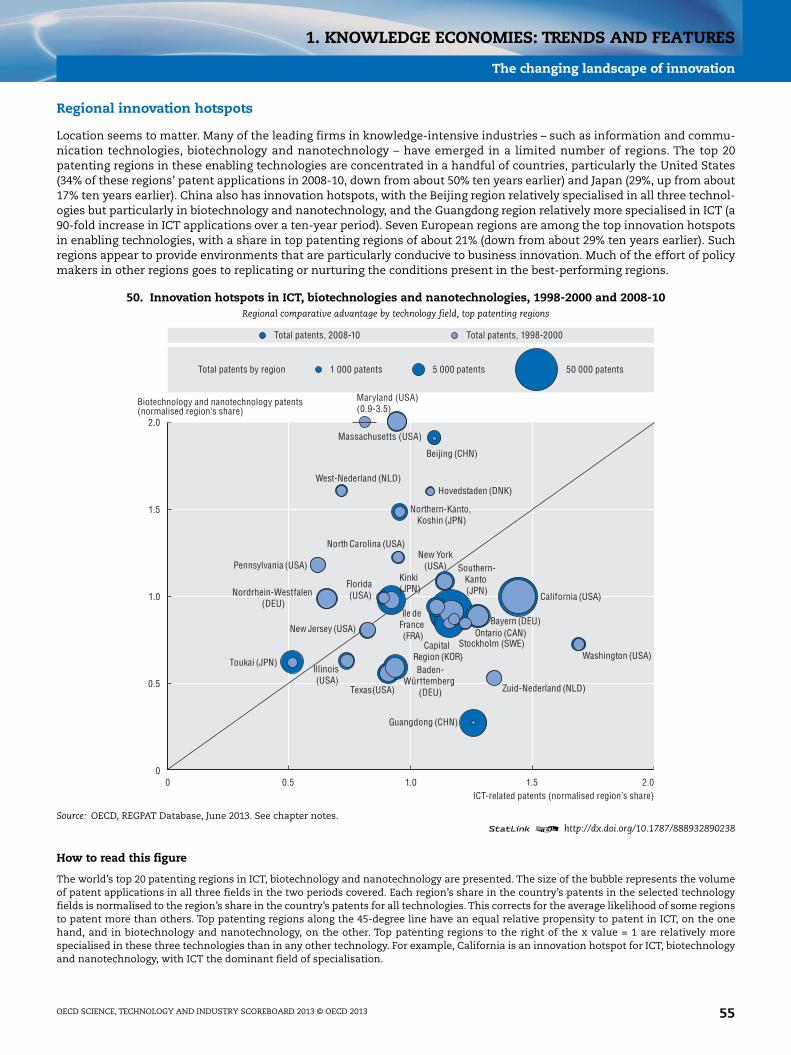
1. KNOWLEDGE ECONOMIES: TRENDS AND FEATURES
The changing landscape of innovation
Regional innovation hotspots
Location seems to matter. Many of the leading firms in knowledge-intensive industries – such as information and commu-nication technologies, biotechnology and nanotechnology – have emerged in a limited number of regions. The top 20patenting regions in these enabling technologies are concentrated in a handful of countries, particularly the United States(34% of these regions’ patent applications in 2008-10, down from about 50% ten years earlier) and Japan (29%, up from about17% ten years earlier). China also has innovation hotspots, with the Beijing region relatively specialised in all three technol-ogies but particularly in biotechnology and nanotechnology, and the Guangdong region relatively more specialised in ICT (a90-fold increase in ICT applications over a ten-year period). Seven European regions are among the top innovation hotspotsin enabling technologies, with a share in top patenting regions of about 21% (down from about 29% ten years earlier). Suchregions appear to provide environments that are particularly conducive to business innovation. Much of the effort of policymakers in other regions goes to replicating or nurturing the conditions present in the best-performing regions.
How to read this figure
The world’s top 20 patenting regions in ICT, biotechnology and nanotechnology are presented. The size of the bubble represents the volumeof patent applications in all three fields in the two periods covered. Each region’s share in the country’s patents in the selected technologyfields is normalised to the region’s share in the country’s patents for all technologies. This corrects for the average likelihood of some regionsto patent more than others. Top patenting regions along the 45-degree line have an equal relative propensity to patent in ICT, on the onehand, and in biotechnology and nanotechnology, on the other. Top patenting regions to the right of the x value = 1 are relatively morespecialised in these three technologies than in any other technology. For example, California is an innovation hotspot for ICT, biotechnologyand nanotechnology, with ICT the dominant field of specialisation.
50. Innovation hotspots in ICT, biotechnologies and nanotechnologies, 1998-2000 and 2008-10Regional comparative advantage by technology field, top patenting regions
Source: OECD, REGPAT Database, June 2013. See chapter notes.1 2 http://dx.doi.org/10.1787/888932890238
0 1.0 1.50.5 2.0
2.0
1.0
1.5
0.5
0
Biotechnology and nanotechnology patents (normalised region’s share)
ICT-related patents (normalised region’s share)
Total patents by region 1 000 patents
Total patents, 2008-10 Total patents, 1998-2000
5 000 patents 50 000 patents
California (USA)
Guangdong (CHN)
Bayern (DEU)
Washington (USA)Toukai (JPN)
Beijing (CHN)
Ontario (CAN)New Jersey (USA)
Stockholm (SWE)
Pennsylvania (USA)
North Carolina (USA)
Hovedstaden (DNK)
Massachusetts (USA)
Southern-Kanto (JPN)
Zuid-Nederland (NLD)
Baden-Württemberg
(DEU)
île de France (FRA)
Texas(USA)
Illinois (USA)
Nordrhein-Westfalen (DEU)
Florida (USA)
Kinki (JPN)
New York(USA)
Northern-Kanto, Koshin (JPN)
West-Nederland (NLD)
Capital Region (KOR)
Maryland (USA) (0.9-3.5)
OECD SCIENCE, TECHNOLOGY AND INDUSTRY SCOREBOARD 2013 © OECD 2013 55

1. KNOWLEDGE ECONOMIES: TRENDS AND FEATURES
The changing landscape of innovation
Innovation for new markets
Because trademark registrations often accompany the launch of new products and services, trademark-based indicatorscan point to the presence of incremental and marketing innovations. While trademark applications have increased overtime, the share of trademark applications related to service classes has remained stable or declined slightly over the lastdecade in most OECD economies. In contrast, the share of service-related trademarks protected on both the European andUS markets by the BRIICS economies has increased since 2000-02. Trademarks in knowledge-intensive business servicesaccount for the majority of service trademarks registered by all the economies considered, and especially in Brazil and theUnited States. A breakdown of trademarks in knowledge-intensive services (KIS) helps reveal firms’ strategies in differentmarkets. R&D-related trademarks applied for by the G7 and the BRIICS economies appear relatively more likely to beprotected in the United States than in Europe, while the BRIICS have a relatively larger share of registrations of business-services-related trademarks on the European market.
51. Service-related trademark applications at USPTO and OHIM, selected OECD and non-OECD economies,2000-02 and 2010-12
As a percentage of total trademark applications
Source: US Patent and Trademark Office Bulk Downloads: Trademark Application Text hosted by Google, May 2013; OHIM Community TrademarkDatabase CTM Download, May 2013. StatLink contains more data. See chapter notes.
1 2 http://dx.doi.org/10.1787/888932890257
52. Trademarks in knowledge-intensive services, selected OECD and non-OECD economies, 2010-12As a percentage of total service-related trademark applications
Source: US Patent and Trademark Office Bulk Downloads: Trademark Application Text hosted by Google, May 2013; OHIM Community TrademarkDatabase CTM Download, May 2013. StatLink contains more data. See chapter notes.
1 2 http://dx.doi.org/10.1787/888932890276
50
30
40
20
10
0
20.4
12.1
38.8
12.8 2.2
19.2
14.0 8.2
16.5 6.2
2.5 8.1 3.3
9.3
1.3
4.4
0.5
1.3
0.2
1.0
0.6
1.3
25.8
757.1
GBR DEU CAN FRA ITA CHN JPN KOR IND RUS BRA USA
Trademarks in KIS (2010-12) Trademarks in other services (2010-12)% Service-related trademarks 2000-02
Total number of applications, thousands
OH
IM
USP
TO
OH
IM
USP
TO
OH
IM
USP
TO
OH
IM
USP
TO
OH
IM
USP
TO
OH
IM
USP
TO
OH
IM
USP
TO
OH
IM
USP
TO
OH
IM
USP
TO
OH
IM
USP
TO
OH
IM
USP
TO
OH
IM
USP
TO
100
60
80
40
20
0
GBRDEU CANFRA ITACHN JPNKORIND RUSBRA USA
0.3
0.9
0.1
0.4
0.2
0.5
7.4
331
0.2
0.8 13 2.8
4.6
2.0
0.8
6.5
7.4
3.8
0.0
0.3
4.1
0.9
0.4
1.3
Business services Finance and insurance Telecommunications R&D%
Total number of service related trademark applications, thousands
OH
IM
USP
TO
OH
IM
USP
TO
OH
IM
USP
TO
OH
IM
USP
TO
OH
IM
USP
TO
OH
IM
USP
TO
OH
IM
USP
TO
OH
IM
USP
TO
OH
IM
USP
TO
OH
IM
USP
TO
OH
IM
USP
TO
OH
IM
USP
TO
OECD SCIENCE, TECHNOLOGY AND INDUSTRY SCOREBOARD 2013 © OECD 201356

1. KNOWLEDGE ECONOMIES: TRENDS AND FEATURES
Science and innovation today
Innovation everywhere
Indicators of triadic patents and of trademarks abroad suggest the worldwide spread of innovative activities, in terms ofboth technological and non-R&D-based innovation. Economies featuring relatively large manufacturing sectors or speciali-sations in information and communication technologies have a greater propensity to patent than to “trademark”. Econo-mies with relatively larger services sectors tend instead to engage relatively more in trademark protection. Emergingeconomies, although they are generally less likely to seek protection for their innovations via patents or trademarks thanOECD countries, increasingly rely on intellectual property protection to appropriate the results of their innovative activities.
What is a triadic patent?
Triadic patent families are defined as patents applied for at the European Patent Office (EPO), the Japan Patent Office (JPO) and the UnitedStates Patent and Trademark Office (USPTO) to protect a same invention. Triadic patents are typically of higher value and eliminate biasesfrom home advantage and the influence of geographical location.
What is a trademark “abroad”?
Trademark counts are subject to home bias, as firms tend to file trademarks in their home country first. Trademarks abroad correspond tothe number of applications filed at the USPTO, the Office for Harmonisation in the Internal Market (OHIM) and the JPO, by application dateand country of residence of the applicant. For the United States, EU members and Japan, counts exclude applications in their domesticmarket (USPTO, OHIM and JPO respectively). Counts are rescaled, taking into account the relative average propensity of other countries tofile in those three offices.
Why use trademarks as indicators of innovation?
A trademark is a sign used to distinguish the goods and services of one undertaking from those of other undertakings. Firms use trademarksto signal novelty and to appropriate the benefits of their innovations when they launch new products on the market. The number oftrademark applications is highly correlated with other innovation indicators. With their very broad perimeter of applications, they conveyinformation on product innovations but also on marketing and services innovations. Because the data relating to trademark applications arepublicly available immediately after filing, trademark-based indicators can provide very timely information on the level of certain types ofinnovative activities.
53. Patents and trademarks per capita, 2000-02 and 2009-11Average number per million population, OECD and G20 countries
Source: OECD, Patent Database, June 2013; US Patent and Trademark Office Bulk Downloads: Trademark Application Text hosted by Google, May 2013;OHIM Community Trademark Database CTM Download, May 2013; JPO, Annual Reports 2001-12, June 2013. See chapter notes.
1 2 http://dx.doi.org/10.1787/888932890295
0 1 10 100 500
500
100
10
1
0
2009-11
2000-02
0
1
10
0 1 10
ARG
AUSAUT
BEL
BRA
CAN
CHE
CHL
CHN
CZE
DEU
DNK
ESPEST
FIN
FRAGBR
GRC HUN
IND
IRL
ISL ISR
ITA JPNKOR
LUX
NLD
NOR
NZL
POL
PRT
RUS
SAUSVK
SVN
SWE
TUR
USA
ZAF
IDN
MEX
ARGBRA
CHL
CZE
ESPEST
GRC HUN
MEX
POL
PRT
RUS
SAU SVK
SVN
TUR
ZAF
CHN
Trademarks abroad per capita
Triadic patent families per capitaAxes in logarithmic scale
BRIICSBRIICS
EU28
OECD
OECD SCIENCE, TECHNOLOGY AND INDUSTRY SCOREBOARD 2013 © OECD 2013 57

1. KNOWLEDGE ECONOMIES: TRENDS AND FEATURES
Science and innovation today
Collaboration in scientific research
In the global landscape of scientific research, scientific output has grown rapidly and collaboration between institutions indifferent countries has intensified. The emergence of new players has changed the structure of global collaboration net-works.
How to read these figures
The position of selected economies (nodes) exceeding a minimum collaboration threshold of 10 000 documents is determined by the numberof co-authored scientific documents published in 2011. A visualisation algorithm has been applied to the full international collaborationnetwork to represent the linkages in a two-dimensional chart on which distances approximate the combined strength of collaborationforces. Bubble sizes are proportional to the number of scientific collaborations in a given year. The thickness of the lines (edges) betweencountries represents the intensity of collaboration (number of co-authored documents between each pair).
The positions derived for 2011 collaboration data have been applied to 1998 values. New nodes and edges appear in 2011 as they exceed theminimum thresholds.
54a. International collaboration networks in science, 1998Whole counts of internationally co-authored documents
Source: OECD calculations based on Scopus Custom Data, Elsevier, version 5.2012, June 2013. See chapter notes.
Australia
Canada
France
Germany
Italy
Japan
Netherlands
Russian Federation
SpainSweden
Switzerland
United Kingdom
United States
OECD SCIENCE, TECHNOLOGY AND INDUSTRY SCOREBOARD 2013 © OECD 201358
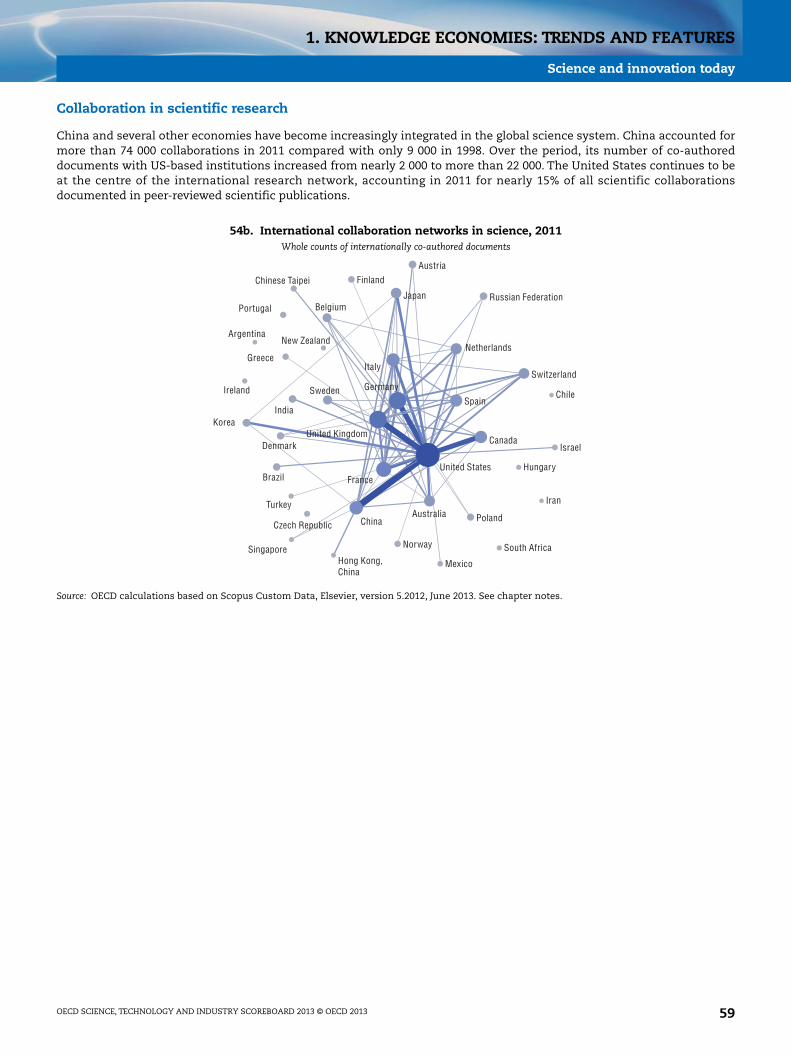
1. KNOWLEDGE ECONOMIES: TRENDS AND FEATURES
Science and innovation today
Collaboration in scientific research
China and several other economies have become increasingly integrated in the global science system. China accounted formore than 74 000 collaborations in 2011 compared with only 9 000 in 1998. Over the period, its number of co-authoreddocuments with US-based institutions increased from nearly 2 000 to more than 22 000. The United States continues to beat the centre of the international research network, accounting in 2011 for nearly 15% of all scientific collaborationsdocumented in peer-reviewed scientific publications.
54b. International collaboration networks in science, 2011Whole counts of internationally co-authored documents
Source: OECD calculations based on Scopus Custom Data, Elsevier, version 5.2012, June 2013. See chapter notes.
Argentina
Australia
Austria
Belgium
Brazil
Canada
Chile
ChinaCzech Republic
Denmark
Finland
France
Germany
Greece
Hong Kong, China
Hungary
India
Iran
Ireland
Israel
Italy
Japan
Mexico
NetherlandsNew Zealand
Norway
Poland
PortugalRussian Federation
Singapore South Africa
Korea
SpainSweden
Switzerland
Chinese Taipei
Turkey
United Kingdom
United States
OECD SCIENCE, TECHNOLOGY AND INDUSTRY SCOREBOARD 2013 © OECD 2013 59

1. KNOWLEDGE ECONOMIES: TRENDS AND FEATURES
Science and innovation today
The impact of scientific collaboration
The production of scientific research is progressively shifting from individuals to groups, from single to multiple institutions, andfrom national to international. Because they draw on larger pools of expertise, international research collaborations are morelikely to have a bigger impact in terms of citations in subsequent scientific publications. Differences across countries suggest apositive relationship between measures of scientific research collaboration and impact, the latter proxied in this case by the aver-age normalised citation index.The relationship appears to be stronger in economies with lower scientific production, suggestingthe importance of scale, which smaller economies can overcome by participating in global networks.
How to measure the impact of scientific collaboration
To measure the impact of scientific publications it is possible to either use the citations received by an article or to assess its quality on thebasis of the level of citations relative to the record of the journal in which the article is published. Here, the focus is on publications andcitations received during 2003-11. The normalised impact is the ratio between the average number of citations received by the documentspublished by a specific unit (country, institution and author) and the world average of citations of the same time period, document type andsubject area. The normalisation of citation values is item-oriented, i.e. carried out at the level of the individual article. If an article belongsto several subject areas, a mean value of the areas is calculated. The values show the relationship of the unit’s average impact to the worldaverage, which is 1, i.e. a score of 0.8 means the unit is cited 20% below average and 1.3 means the unit is cited 30% above average. Althougharticle citation has the advantage of focusing directly on the impact of the articles examined, citing takes time, particularly in somedisciplines. A trade-off exists between the length of time over which citations are accounted for and the timeliness of the indicator: the moretime allowed to measure the impact, the less timely the indicator becomes.
How to read this figure
Bubbles plot a country’s share of documents resulting from international collaboration – as implied by the share of domestic articles co-authored with individuals affiliated with foreign institutions – against the normalised impact of its publications. The size of the bubblesrepresents the volume of scientific production, with the United States and China the largest producers of scientific output. Switzerland hasboth a high share of international scientific collaboration and average impact, although its total output volume is smaller than that ofcountries such as France or the United Kingdom.
55. The impact of scientific production and the extent of international scientific collaboration, 2003-11Whole counts of internationally co-authored documents
Source: OECD and SCImago Research Group (CSIC), Compendium of Bibliometric Science Indicators 2014, based on Scopus Custom Data, Elsevier, May 2013.See chapter notes. 1 2 http://dx.doi.org/10.1787/888932890314
0 10 20 30 40 50 60 70 80
2.0
1.8
1.6
1.4
1.2
1.0
0.8
0.6
0.4
USA
CHN
GBR
DEU
JPN
FRA
CAN
ITAESP
IND
AUS
KOR
NLD
BRA
RUS
CHE
POL
SWE
TUR
BEL
ISRAUT
DNK
GRC
FIN
MEX
CZE
NOR
PRT
NZL
ZAF
IRL
HUNCHL
SVK
SVNIDN
EST
ISL
LUX
Normalised impact
International collaboration among institutions (%)
Number of articles
100 000 articles
50 000 articles500 000 articles North America
BRIICS EU
Other OECD members
World
OECD SCIENCE, TECHNOLOGY AND INDUSTRY SCOREBOARD 2013 © OECD 201360

1. KNOWLEDGE ECONOMIES: TRENDS AND FEATURES
Science and innovation today
Researchers on the move and their impact
Scientists are known to be highly mobile and internationally mobile scientists tend to publish in higher-quality journalsthan their counterparts who stay in the same country throughout their research careers. New analysis of bibliometric dataunveils the mobility patterns of scientific authors. For a majority of economies, the median impact of scientists whose affil-iation shifts abroad tends to be higher than for new arrivals. The performance gap between inflows and outflows is largestfor countries with relatively low average research performance. Causality could go both ways: high performers may be moreenticed than others by better prospects elsewhere, while mobility can also enhance their performance, especially whenmoving to work in organisations with better resources and with leading experts.
How to read this figure
The scientific impact of researchers moving across countries is proxied by a measure of the quality of the journals they publish in. SNIP(source-normalised impact per paper) is the ratio of a journal’s average citation count per paper and the citation potential of its subject field.The citation potential represents the likelihood of being cited for documents in a particular field. Impact is estimated by calculating, for eachauthor and mobility profile, the median across the relevant journals’ SNIP, over the entire period. An impact value higher than one meansthat the median-attributed SNIP for authors of that country/category is above average.
Switzerland has the highest impact factor of incoming (inflows) and outgoing (outflows) authors and these are nearly identical. In Korea,both types have higher impacts than the world average, but outflows have a higher citation impact than inflows (distant from the 45-degreeline). For India, the impact of outgoing researchers is above average whereas it is below average for incoming ones. The size of bubbles isproportional to the degree of mobility among scientific authors in an economy, as reflected in the average of inflows and outflows over1996-2011.
56. The impact of internationally mobile scientists, inflows versus outflows, 1996-2011Based on citation impact and changes in the affiliation of scientific authors
Source: OECD calculations based on Scopus Custom Data, Elsevier, version 5.2012, and SNIP2 Database, www.journalmetrics.com, Elsevier, Scimago andUniversity of Leiden. May 2013. StatLink contains more data. See chapter notes.
1 2 http://dx.doi.org/10.1787/888932890333
0.9 1.1 1.21.0 1.3
1.3
1.2
1.1
1.0
ARG
AUS
AUT
BEL
BRA
CAN
CHE
CHLCHN
CZE
DEU
DNK
ESP
FIN
FRAGBRGRC
HKG
IND
ITA
JPN
KOR
MEX
NLD
NOR
NZL
POL
PRT
SGP
SWE
TUR
TWN
USA
ZAF
Median impact of outflows
Median impact of inflows
Average flows, inflows plus outflows, of scientific authors
1 000 10 000 70 000
RUS: Inflows impact= 0.71
OECD SCIENCE, TECHNOLOGY AND INDUSTRY SCOREBOARD 2013 © OECD 2013 61

1. KNOWLEDGE ECONOMIES: TRENDS AND FEATURES
Science and innovation today
Knowledge networks
The mobility of researchers contributes to the diffusion of scientific and technological knowledge across institutions, at anational and international level. The trail of affiliation changes left by scientific authors in their scholarly publicationrecords provides a partial means of identifying the international network of researcher flows. As expected, leading researchcountries tend to attract more scientific authors from abroad than they have authors who leave. Flows within each pair ofcountries tend to be of a similar order of magnitude in both directions, suggesting the existence of complex patterns ofknowledge circulation representing the mobility of individuals at different stages of their careers, from students to estab-lished professors. The international mobility network also displays a number of interesting patterns that reveal affinitiesbetween different economies based on linguistic, historical as well as political and cultural linkages, such as the linkbetween Spain and Latin America countries.
How to read this figure
The position of selected economies (nodes) is determined by the number of bilateral flows of publishing scientific authors from 1996 to 2011.A visualisation algorithm has been applied to the international mobility network to represent the linkages in a two-dimensional layoutwhere distances reflect the combined strength of mobility forces between economies. Bubble sizes are proportional to the number ofscientific authors who stay in the economy. The thickness of the arrows joining the nodes represents the number of moves between eachpair. A difference in the size of the arrow tip within each pair denotes a marked difference in the volume of flows in each direction.
57. International mobility network, 1996-2011Counts of bilateral flows, by first and last affiliation
Source: OECD calculations based on Scopus Custom Data, Elsevier, version 5.2012, June 2013.
CHE
CHN
DNK
EGY
FIN
GRC
IRL
ISR
KOR
MEX
MYSNLD
NOR
NZL
PAK
RUS
SWE
THA
ZAF
BRA
TUR
ITA
USA
DEU
IND
JPN
POL
UKR
HUN
IRN
ESPPRT HKG
SGP
CZE
CHL
ARG
TWN
FRA
BEL
AUS
CANGBR
AUT
OECD SCIENCE, TECHNOLOGY AND INDUSTRY SCOREBOARD 2013 © OECD 201362

1. KNOWLEDGE ECONOMIES: TRENDS AND FEATURES
Science and innovation today
Innovation on the shoulders of science
Much can be learned from citations to scientific publications by patents in different technology areas. This new indicatorshows that patented inventions in biotechnology, pharmaceuticals, organic chemistry and analysis of biological materialsaccount for the majority of citations to scientific literature in patent documents. The life sciences – biology and biochemistry,immunology, microbiology, molecular biology and genetics – and the medical sciences are the most frequently citedscientific fields. Micro-structural technology and nanotechnology rely particularly on chemistry, materials science,engineering and physics. Publications in the social sciences appear relevant to patents on IT methods for management,alongside computer science, engineering, life and medical sciences. The diversity of scientific sources shows the impossi-bility of identifying a single major scientific field for an invention in any area. It also reveals the fundamental interdiscipli-narity and reliance on basic science for important advances in innovation.
What is a patent-science link?
The link between patents and scientific literature is based on the non-patent literature (NPL) listed as relevant references in patentdocuments in the Thomson Reuters Derwent World Patents Index and Derwent Patents Citation Index databases. It is applied to patents inselected technology areas, based on the International Patent Classification (IPC) codes in the patent document, which define technologyareas according to the classification presented in Schmoch (WIPO, 2008 revised in 2013). To identify whether NPL corresponds to a scientificdocument, NPL references were matched to Thomson Reuters Web of Science Database, an index of scientific literature. For successfullymatched references, it is possible to extract bibliographical information, including on the field(s) of science.
How to read this figure
36% of citations to scientific literature in telecommunication patents are to articles in computer science and mathematics, 34% toengineering science articles and 22% to physics-related articles.
58. The innovation-science link by technology area, 2001-11Share of scientific fields in non-patent literature cited in patents
Source: OECD and Japan Science and Technology Agency (JST), based on Thomson Reuters Web of Science, Derwent World Patents Index and DerwentPatents Citation Index data, June 2013. See chapter notes.
1 2 http://dx.doi.org/10.1787/888932890352
100
80
60
40
20
0
350 000
300 000
250 000
200 000
150 000
100 000
50 000
0
%
Agriculture/plant and animal science Chemistry Computer science/mathematics
Earth science Engineering Life sciences
Materials science Medical science Multidisciplinary
Physics/space science Social science/humanities Total number of citations (right-hand scale)
Biotec
hnolo
gy
Pharm
aceu
ticals
Organ
ic fin
e che
mistry
Analys
is of
biolog
ical m
ateria
ls
Measu
remen
t
Medica
l tech
nolog
y
Basic
materia
ls ch
emist
ry
Compu
ter te
chno
logy
Semico
nduc
tors
Chemica
l eng
ineeri
ng
Electr
ical m
achin
ery, a
ppara
tus, e
nerg
y
Surfac
e tec
hnolo
gy, co
ating
Other s
pecia
l mac
hinesOpti
cs
Food
chem
istry
Macrom
olecu
lar ch
emist
ry, po
lymers
Materia
ls, m
etallu
rgy
Telec
ommun
icatio
ns
Digital
commun
icatio
n
Basic
commun
icatio
n pro
cess
es
Envir
onmen
tal te
chno
logy
Texti
le an
d pap
er mac
hines
Contro
l
Engin
es, p
umps
, turb
ines
Machin
e too
ls
IT meth
ods f
or man
agem
ent
Handli
ng
Other c
onsu
mer go
ods
Civil e
ngine
ering
Mecha
nical
elemen
ts
Trans
port
Therm
al pro
cess
es an
d app
aratus
Furn
iture,
games
Micro-st
ructu
ral an
d nan
o-tech
nolog
y
Audio-vi
sual
techn
ology
Total citations
OECD SCIENCE, TECHNOLOGY AND INDUSTRY SCOREBOARD 2013 © OECD 2013 63

1. KNOWLEDGE ECONOMIES: TRENDS AND FEATURES
Science and innovation today
Openness in science and innovation
Collaboration among institutions is a pervasive feature of research in, and increasingly between, countries. This isconfirmed by an analysis of the affiliations and geographic locations of co-authors and co-inventors in scientific publica-tions and patent documents. International co-authorship appears more widespread for scientific publications than forpatented inventions, except in India and Poland. The positive correlation between international scientific collaboration andcross-border patent applications may signal the existence of common underlying factors. Smaller countries tend to havehigher rates of international collaboration. This may be partly due to the need to overcome limited domestic opportunitiesfor collaboration and, in some cases, to the possible proximity (not only geographical) to centres of knowledge locatedabroad.
How to read this figure
International co-authorship of scientific publications is based on the share of articles featuring authors affiliated with foreign institutionsin total articles produced by domestic institutions. Co-inventions are measured as the share of patent applications with at least oneco-inventor located abroad in total patents invented domestically. For Switzerland, 60% of publications featuring Swiss institutions involveco-authorship with institutions based abroad. For Japan, scientific co-authorship just exceeds 20% but this is still more than its level ofinternational patent co-invention, which stands at less than 5%. Most countries fall below the 45-degree line; this indicates that they havemore international scientific co-authorships than patent co-inventions.
59. International collaboration in science and innovation, 2007-11Co-authorship and co-invention as a percentage of scientific publications and PCT patent applications
Source: OECD, Patent Database, June 2013; OECD and SCImago Research Group (CSIC), Compendium of Bibliometric Science Indicators 2014, based on ScopusCustom Data, Elsevier, May 2013. See chapter notes.
1 2 http://dx.doi.org/10.1787/888932890371
0 20 40 60 80
80
60
40
20
0
AUS
AUT
BEL
BRA
CAN
CHE
CHL
CHN
CZE
DEUDNK
ESP
EST
FIN
FRAGBR
GRC HUN
IDN
IND
IRL ISL
ISRITA
JPN KOR
LUX
MEX
NLDNOR
NZL
POL
PRT
RUS
SVK
SVN
SWE
TURUSA ZAF
International co-inventions (%)
International co-authorship (%)
OECD SCIENCE, TECHNOLOGY AND INDUSTRY SCOREBOARD 2013 © OECD 201364

1. KNOWLEDGE ECONOMIES: TRENDS AND FEATURES
Science and innovation today
Domestic and foreign ownership of inventions
Companies worldwide look at home and abroad for the knowledge and innovative capacity they need to become and remaincompetitive. As a result, knowledge is increasingly owned and used in a different country from the one in which it wasdeveloped. To use the knowledge and inventions of others, companies acquire the legal rights associated with intellectualproperty (IP) rights, including patents. Differences in the owner’s and the inventor’s country of residence are often due tothe activities of multinationals: the owner is an international conglomerate and the invention is that of a foreign subsidiary.The propensity to create knowledge and appropriate the returns to knowledge through IP varies across economies. Italy andSweden applied for a similar number of patents over 2009-11 and have a similar share of patents controlled by foreign firms(about 21%), but they exhibit very different shares of inventions generated abroad, around 31% in Sweden and 8% in Italy. Ingeneral, small open economies with a strong presence of multinationals are more likely to appropriate returns from knowledgecreated elsewhere. Companies resident in Luxembourg, Switzerland and Ireland own a substantial proportion of inventionsgenerated abroad, but only up to a third of their patented inventions are owned by foreign firms. The reverse is true inPoland, Hungary and India.
How to read this figure
Foreign ownership of domestic inventions is measured as the share of patents invented in one country that is owned by residents in anothercountry in total patents invented domestically. Domestic ownership of inventions from abroad is measured as the share of patents ownedby country residents with at least one foreign inventor in total patents owned by country residents. In Belgium the two measures are almostidentical. Some 38% of Belgian patents filed over 2009-11 are owned by foreign companies or individuals and about 38% of the patents in thehands of Belgian residents were invented or co-invented by foreigners.
60. Cross-border ownership of patents, 2009-11As a percentage of total patents by countries
Source: OECD, Patent Database, June 2013. StatLink contains more data. See chapter notes.1 2 http://dx.doi.org/10.1787/888932890390
10 20 30 40 50
90
10
20
30
40
50
60
70
80
00
AUS
AUT
BEL
BRA
CAN
CHN
CZE
DNK
FIN
FRADEU
GRCHUN
IND
IRL
ISR
ITA
JPN
KOR
LUX
MEX
NLD
NZL
NOR
POL
PRT
RUS
SVK
SVN
ZAFESP
SWE
CHE
TUR
GBRUSA
Domestic ownership of inventions from abroad (%)
Foreign ownership of domestic inventions (%)
Total patents invented locally 10 000 patents 50 000 patents1 000 patents
OECD SCIENCE, TECHNOLOGY AND INDUSTRY SCOREBOARD 2013 © OECD 2013 65
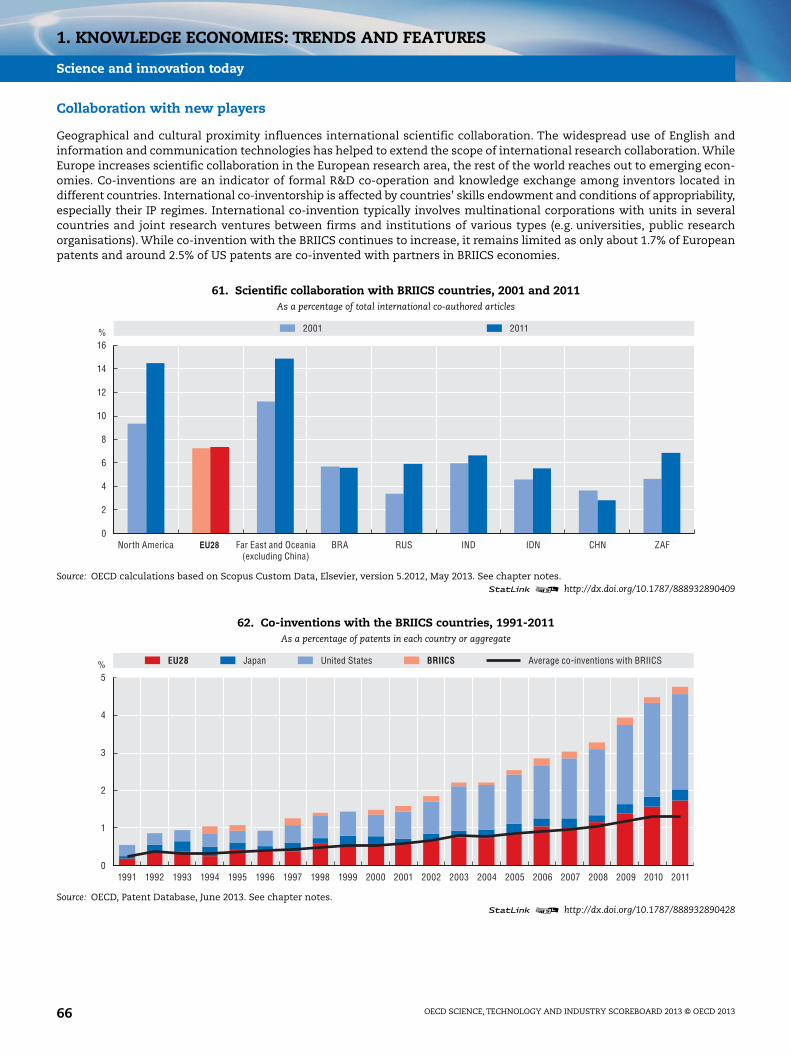
1. KNOWLEDGE ECONOMIES: TRENDS AND FEATURES
Science and innovation today
Collaboration with new players
Geographical and cultural proximity influences international scientific collaboration. The widespread use of English andinformation and communication technologies has helped to extend the scope of international research collaboration. WhileEurope increases scientific collaboration in the European research area, the rest of the world reaches out to emerging econ-omies. Co-inventions are an indicator of formal R&D co-operation and knowledge exchange among inventors located indifferent countries. International co-inventorship is affected by countries’ skills endowment and conditions of appropriability,especially their IP regimes. International co-invention typically involves multinational corporations with units in severalcountries and joint research ventures between firms and institutions of various types (e.g. universities, public researchorganisations). While co-invention with the BRIICS continues to increase, it remains limited as only about 1.7% of Europeanpatents and around 2.5% of US patents are co-invented with partners in BRIICS economies.
61. Scientific collaboration with BRIICS countries, 2001 and 2011As a percentage of total international co-authored articles
Source: OECD calculations based on Scopus Custom Data, Elsevier, version 5.2012, May 2013. See chapter notes.1 2 http://dx.doi.org/10.1787/888932890409
62. Co-inventions with the BRIICS countries, 1991-2011As a percentage of patents in each country or aggregate
Source: OECD, Patent Database, June 2013. See chapter notes.1 2 http://dx.doi.org/10.1787/888932890428
16
14
12
10
8
6
4
2
0
%
BRA RUS IND IDN CHN ZAF
2001 2011
North America Far East and Oceania(excluding China)
EU28
5
4
3
2
1
0
%
1991 1992 1993 1994 1995 1996 1997 1998 1999 2000 2001 2002 2003 2004 2005 2006 2007 2008 20102009 2011
EU28 Japan United States BRIICS Average co-inventions with BRIICS
OECD SCIENCE, TECHNOLOGY AND INDUSTRY SCOREBOARD 2013 © OECD 201366

1. KNOWLEDGE ECONOMIES: TRENDS AND FEATURES
Science and innovation today
Technology flows
The ownership of “higher-value” patents, i.e. triadic patent families, in non-OECD economies is increasing as competitionbecomes global and the capacity of non-OECD countries to generate innovations and penetrate key OECD marketsincreases. As they have developed, emerging economies have benefited to varying degrees from technologies and inno-vations generated elsewhere. Patented technologies that were invented in Europe, Japan, Korea and the United States andthat are filed at patent offices of BRIICS economies bear witness to this. On average 40% of world inventions and over 45%of Japanese inventions are protected in China; the technology flows are predominantly in the field of electrical and mechanicalengineering. The strategic behaviour of firms, the location of both subsidiaries and competitors, and the attractiveness ofemerging markets may help to explain the patterns observed.
63. Triadic patent families by blocs, 2001 and 2011Share in total triadic patent families
Source: OECD, Patent Database, June 2013. StatLink contains more data. See chapter notes.1 2 http://dx.doi.org/10.1787/888932890447
64. Technology transfers to selected BRIICS, 2005-09Share of patent families by origin of inventor and patent office of destination in total patent families
Source: OECD calculations based on the Worldwide Patent Statistical Database, EPO, April 2013. StatLink contains more data. See chapter notes.1 2 http://dx.doi.org/10.1787/888932890466
2001 2011
40
30
20
10
0
% EU28 Japan United States BRIICS Rest of the world
50
40
30
20
10
0
%
JPN
KORUSA
JPN
KORUSA
JPN
KORUSA
JPN
KORUSA
JPN
KORUSA
JPN
KORUSA
JPN
KORUSA
8
6
4
2
0
Magnified
Chemistry Electrical engineering Instruments
China(SIPO)
Brazil(INPI)
Russian Federation(ROSPATENT)
South Africa(CIPC)
Mechanical engineering Other field
EU28OEC
DWLD
EU28OEC
DWLD
EU28OEC
DWLD
EU28OEC
DWLD
EU28OEC
DWLD
EU28OEC
DWLD
EU28OEC
DWLD
OECD SCIENCE, TECHNOLOGY AND INDUSTRY SCOREBOARD 2013 © OECD 2013 67

1. KNOWLEDGE ECONOMIES: TRENDS AND FEATURES
Science and innovation today
Internet and society
One of the primary uses of the Internet in everyday life is to find information. The search for health-related informationranks among the top activities, with over 50% of users doing so. While cross-country differences are important, the datasuggest that in all countries and across all age cohorts women search more actively for such information, with a gender gapof about 15 percentage points. The Internet is also increasingly used to search for employment: on average, almost one-quarter of working-age Internet users seek job-related information on the Internet, with cross-country differences likely toreflect labour market conditions and the opportunities offered by this channel. The diffusion of this activity is higher amongyounger users, especially in the Nordic countries.
65. Gender differences in seeking health-related information on the Internet, 2011Percentages of 16-74 year-old Internet users and of users by age group
Source: OECD, ICT Database, June 2013; Eurostat; and national sources, May 2013. See chapter notes.1 2 http://dx.doi.org/10.1787/888932890485
66. Age differences in seeking employment-related information on the Internet, 2011Percentage of Internet users in working age population, by age group
Source: OECD, ICT Database, June 2013; Eurostat; and national sources, May 2013. See chapter notes.1 2 http://dx.doi.org/10.1787/888932890504
80
70
90
60
50
40
30
20
10
0
%
HUNUSA
SVNAUT
DEU PRT FIN ISLDNK
GRCLU
XNLD ES
PNOR
TUR IRL
CHENZL SVK
SWE ITA RUSFR
ACZE ES
TBEL GBR
POLKOR
16-24
55-74
25-5
4
All individuals Women Men All individuals, average Women, average Men, average
70
60
50
40
30
20
10
0
%
CANCHL
EST
NORGBR
DNK FIN HUNSWE ISL
AUTIR
LES
PGRC
SVKDEU ITA NLD SVN
PRTFR
APOL
BEL LUX
RUSKOR
CZEJP
NTUR
USA
Methodology differs
16-24 year-olds 55-64 year-olds16-64 year-olds
OECD SCIENCE, TECHNOLOGY AND INDUSTRY SCOREBOARD 2013 © OECD 201368

1. KNOWLEDGE ECONOMIES: TRENDS AND FEATURES
Science and innovation today
Science and technology and society
Developments in science and technology have visible impacts on people’s lives. Surveys carried out across a large numberof countries indicate that the public has a mainly positive view of the impact of science and technology on their personalwell-being. However, the surveys do find that a significant fraction of the population has mixed or critical opinions asregards the balance of the beneficial and harmful effects of scientific research. They also suggest that non-European countriestend to have more positive views of science and technology.
Measuring public perceptions and engagement in science and technology
Surveys on the public perception and awareness of, and engagement in science and technology have been carried out in several countries.A new OECD project is reviewing the methodological challenges faced by such surveys and their international comparability. Given themethodological differences and potential biases that affect responses, results should be interpreted with caution.
67. Public perception of the impact of science and technology on personal well-being, 2010“Science and technology are making our lives healthier, easier and more comfortable”
Source: OECD, based on European Commission, US National Science Foundation and other national data sources. June 2013. See chapter note.1 2 http://dx.doi.org/10.1787/888932890523
68. Public perception of scientific research benefits, 2010“Have the benefits of scientific research outweighed the harmful results?”
Source: OECD, based on European Commission, US National Science Foundation and other national data sources, June 2013. See chapter notes.1 2 http://dx.doi.org/10.1787/888932890542
100
80
60
40
0
20
USACHN
KORJP
N ISLIN
DGBR
NORLU
XRUS
ESP
EST
TUR IRL
CHEDNK
SWEHUN
POL FIN BELEU27
FRA
NLD AUTGRC
CZESVN
PRT ITA SVKDEU
Strongly agree Agree Neither agree nor disagree Disagree Strongly disagree Don’t know
As a percentage of respondents
100
80
60
40
0
20
BRACHN
KORUSA
RUSNOR
ESP
TURHUN
JPN
SVKES
TPOL ITA GRC
EU27CZE
IRL
AUTDNK
PRTFR
ADEU BEL FIN GBR
SVNCHE
SWE ISLLU
XNLD
Benefit much outweighs harm Benefit slightly outweighs harm Benefit = Harm
Harm slightly outweighs benefit Harm strongly outweighs benefit Don’t know
As a percentage of respondents
OECD SCIENCE, TECHNOLOGY AND INDUSTRY SCOREBOARD 2013 © OECD 2013 69

1. KNOWLEDGE ECONOMIES: TRENDS AND FEATURES
Notes and References
1. Labour productivity growth based on hours worked, total economy level, 2001-12
Euro area here excludes Cyprus and Malta.
2. Growth in GDP per capita and GDP per person employed in the BRIICS and the OECD, 2007-09 and2009-12
Calculations are based on GDP at constant prices, converted to USD using 2005 purchasing power parities. GDP for Brazil,Indonesia and South Africa are from OECD, Quarterly National Accounts, April 2013. GDP for India is from OECD, AnnualNational Accounts, April 2013; the series was extended after 2009 using OECD, Quarterly National Accounts, April 2013.
Employment estimates for Brazil, China, India and Indonesia are based on GGDC, Total Economy Database, January 2013.
Employment data for South Africa are from OECD, Annual National Accounts, April 2013; the series was extended after 2010using GGDC, Total Economy Database, January 2013.
3. Job recovery across socio-economic groups, 2008 Q1-2012 Q4
The skill dimension is based on ISCED97 as follows: low-skilled (ISCED97 0/1/2), less than upper secondary education;medium-skilled (IECD97 3/4), upper secondary education; high-skilled (ISCED97 5/6); tertiary education.
4. Harmonised unemployment rates, OECD, Euro area, United States and Japan, July 2008-April 2013
The OECD harmonised unemployment rates, compiled for all 34 OECD member countries, are based on the InternationalLabour Office (ILO) guidelines. The unemployed are persons of working age who, in the reference period: are without work;are available for work; and have taken specific steps to find work.
Rates are seasonally adjusted.
Euro area here excludes Cyprus and Malta.
5. Net job growth, younger versus older firms, 2001-11
Establishments and firms that appear only for one year are excluded.
Mergers and acquisitions are not taken into account in determining firm age and firm exit.
Cyprus
The following note is included at the request of Turkey:
“The information in this document with reference to ‘Cyprus’ relates to the southern part of the Island. There is nosingle authority representing both Turkish and Greek Cypriot people on the Island. Turkey recognizes the TurkishRepublic of Northern Cyprus (TRNC). Until a lasting and equitable solution is found within the context of the UnitedNations, Turkey shall preserve its position concerning the ‘Cyprus issue’.”
The following note is included at the request of all the European Union Member States of the OECD and the EuropeanUnion:
“The Republic of Cyprus is recognised by all members of the United Nations with the exception of Turkey. The infor-mation in this document relates to the area under the effective control of the Government of the Republic of Cyprus.”
Israel
“The statistical data for Israel are supplied by and under the responsibility of the relevant Israeli authorities or thirdparty. The use of such data by the OECD is without prejudice to the status of the Golan Heights, East Jerusalem andIsraeli settlements in the West Bank under the terms of international law.
“It should be noted that statistical data on Israeli patents and trademarks are supplied by the patent and trademarkoffices of the relevant countries.”
OECD SCIENCE, TECHNOLOGY AND INDUSTRY SCOREBOARD 2013 © OECD 201370

1. KNOWLEDGE ECONOMIES: TRENDS AND FEATURES
Notes and References
The shares are calculated as shares of total employment, job destruction and job creation.
Small firms have between 1 and 49 employees, medium firms have between 50 and 249 employees, and large firms havemore than 250 employees.
For Austria, data are at the establishment level.
For Japan, data are at the establishment level and refer to the manufacturing sector only.
For Austria, Italy, Luxembourg and Sweden, data refer to 2001-10.
For Brazil, data refer to 2002-10.
For France, data refer to 2002-07.
For Japan and New Zealand, data refer to 2001-09.
For Spain, data refer to 2003-09.
6. Employment, job creation and job destruction, by firm age and size, 2001-11
See notes under 5.
7. Employment, job creation and job destruction, manufacturing and services 2001-11
See notes under 5.
8. Where people lost their jobs, 2008-11
General note:
The aggregate activity groups are defined according to ISIC Rev.4 Divisions 01-03 (Section A), 05-39 (B-E), 41-43 (F), 45-56 G-I),58-63 (J), 64-68 (K-L), 69-82 (M-N) and 84-99 (O-U).
Additional notes:
For Australia, calendar year averages from the Quarterly Labour Force Survey (QLFS), June 2013. Finance, insurance and realestate activities includes renting and hiring of machinery and equipment (77).
For Iceland, Annual Labour Force Survey (LFS) data by industry are used in the absence of employment by activity statisticspublished in an SNA context.
For Israel, estimates based on SNA employment data provided to OECD according to ISIC Rev.3. Professional, scientific,technical and other business services (69-82) includes Information and communication (58-63) and Finance, insurance andreal estate activities (64-68).
For Japan, public administration, education, health and other services (84-99) includes Professional, scientific, technical andother business services (69-82).
For New Zealand, data are based on employment estimates for fiscal years 2008/09 and 2011/12. Agriculture, forestry andfishing (01-03) includes Mining and quarrying (05-09).
The OECD aggregate does not include Chile and Turkey.
9. Where people lost their jobs in Europe, 2011-12
See general note under 8.
10. Job creation and destruction in the information industries, 2008-11
To assess the effects of the economic crisis on employment across information industries, sectoral changes in levels ofemployment can be “normalised” in order to highlight their relative contributions, within each country, to the total changein information industry employment between 2008 and 2011. This is achieved, for each country, by expressing the sectoralchanges as a percentage of the sum of the absolute changes.
The four activity groups comprising “information industries” are defined according to ISIC Rev.4 Divisions 26 (CI), 58-60 (JA),61 (JB) and 62-63 (JC) respectively.
OECD SCIENCE, TECHNOLOGY AND INDUSTRY SCOREBOARD 2013 © OECD 2013 71

1. KNOWLEDGE ECONOMIES: TRENDS AND FEATURES
Notes and References
The gains and losses, in thousands, represent the sum of the aggregate sectors with positive changes and the sum of theaggregate sectors with negative changes, respectively. With a finer activity breakdown (such as 3-digit ISIC Rev.4), the esti-mates for total gains and losses could differ. For example, within the losses noted for Manufacture of computer, electronicand optical products (26), certain (3- or 4-digit) activities may have experienced gains in employment.
The employment data are measured in terms of persons except for Canada and the United States where number of jobs isthe unit of measurement.
For Spain, IT and other information services (JC) includes Telecommunications (JB).
11. Change in the skill mix in Europe, services and manufacturing, 2011-12
Occupations are defined according to International Standard Classification of Occupations 2008 (ISCO-08). The followingmajor groups are used 1) Managers, 2) Professionals, 3) Technicians and associate professionals, 4) Clerical support workers,5) Service and sales workers, 7) Craft and related trades workers, 8) Plant and machine operators and assemblers, and9) Elementary occupations.
Craft and related trades workers includes ISCO-08 major group 6, Skilled agricultural, forestry and fishery workers, whichare reported by a few countries under manufacturing and business-sector services.
Manufacturing corresponds to ISIC Rev.4 (NACE Rev.2) Divisions 10-33 (Section C) while business-sector services coverDivisions 45-82 (G-N).
12. R&D growth over the business cycle by source of financing, OECD area, 1982-2012
Business and government-financed R&D expenditures are subcomponents of gross domestic expenditure on R&D (GERD),i.e. intramural R&D expenditures on R&D performed in the national territory. Funding sources are typically identified by theR&D-performing units.
Estimates for government R&D budgets are based on GBAORD (government budget appropriations or outlays for R&D) datafor OECD countries with information available for 2012 (Denmark, Estonia, Finland, Germany, Greece, Hungary, Iceland, Ire-land, Italy, Japan, Luxembourg, the Netherlands, New Zealand, Norway, Portugal, the Slovak Republic, Slovenia and theUnited States). Rates of growth for this series only from 2008. Government budget data tend to be more timely but may notcoincide with R&D performer-reported funding by government, owing to factors such as differences between budgetaryplans and actual disbursements.
13. US GDP and trademark applications at the US Patent and Trademark Office, 2003-13
US GDP is based on the series of seasonally adjusted GDP, expenditure approach, in volume (chained volume estimates)contained in the OECD Quarterly National Accounts Database, June 2013.
The following aggregated fields based on the Nice Classification are used: Health, pharma and cosmetics: classes 3, 5, 10 and44; Leisure and education: classes 13, 15, 16, 28 and 41; Advertising and business services: classes 35, 36 and 45; ICT andaudiovisual: classes 9 and 38.
Raw GDP and trademark applications series were treated using the OECD’s Composite Leading Indicators methodology.Monthly data were used for trademark applications and quarterly data for GDP, converted to a monthly frequency via linearinterpolation and aligned with the mid-quarter month. This treatment removes seasonal patterns and trends (using theHodrick-Prescott filter) in order to extract the cyclical pattern. The cyclical pattern presented on the graph is expressed as apercentage deviation from the long-term trend. Considering the filters applied, the remaining cycles are those with a periodof between 18 months and 10 years. The analysis was performed on series from January 1990 to February 2013 for trademarkapplications and to March 2013 for GDP. For more information on the methodology, see OECD (2012), “OECD System ofComposite Leading Indicators”, www.oecd.org/std/leading-indicators/41629509.pdf.
The figure shows a peak around 2004 for the trademark series that does not correspond to economic activity. It correspondsto the accession of the United States to the Madrid Agreement in November 2003, which facilitated the filing procedure forforeign applications.
OECD SCIENCE, TECHNOLOGY AND INDUSTRY SCOREBOARD 2013 © OECD 201372
1. KNOWLEDGE ECONOMIES: TRENDS AND FEATURES
Notes and References
15. New enterprise creations, selected OECD countries, 2007-13
The trend cycle reflects the combined long-term (trend) and medium-to-long-term (cycle) movements in the original series.
For Australia, data exclude non-incorporated companies.
For Spain, data exclude natural persons and sole proprietors.
For the United States, data only refer to establishments with employees.
16. Trends in bankruptcies, 2007-11
For France, Norway and Spain, data refers to SMEs only.
17. Venture capital investment in the United States, 1995-2012 and in Europe, 1995-2010
Data for the United States refer to market statistics, data for Europe refer to industry statistics.
Europe includes Austria, Belgium, Bosnia-Herzegovina, Bulgaria, Croatia, the Czech Republic, Denmark, Estonia, Finland,France, Germany, Greece, Hungary, Ireland, Italy, Latvia, Lithuania, Luxembourg, the Former Yugoslav Republic of Macedonia,Montenegro, the Netherlands, Norway, Poland, Portugal, Romania, Serbia, the Slovak Republic, Slovenia, Spain, Sweden,Switzerland, Ukraine and the United Kingdom.
18. Venture capital exits in the United States and Europe, 2007-12
Trade sale refers to the sale of company shares to industrial investors.
Initial public offering refers to the sale or distribution of a company’s shares to the public for the first time.
Europe includes Austria, Belgium, Bosnia-Herzegovina, Bulgaria, Croatia, Czech Republic, Denmark, Estonia, Finland,France, Germany, Greece, Hungary, Ireland, Italy, Latvia, Lithuania, Luxembourg, Former Yugoslav Republic of Macedonia,Montenegro, Netherlands, Norway, Poland, Portugal, Romania, Serbia, Slovak Republic, Slovenia, Spain, Sweden, Switzerland,Ukraine and United Kingdom.
19. Patents by technology fields, 1999-2011
The data refer to counts of patent applications filed under the Patent Cooperation Treaty (PCT), at international phase, bypriority date. Data for 2011 are estimates.
Patents in biotechnologies, nanotechnologies health- and ICT-related technologies are based on a selection of InternationalPatent Classification (IPC) classes.
Patents in environment-related technologies are defined using combinations of IPC classes and codes Y02 of the EuropeanClassification (ECLA).
20. The dynamics of merchandise exports in OECD and non-OECD economies, 2000-11
Underlying values are in current USD. Data refer to manufactured goods and goods stemming from primary activities (i.e.agriculture, fishing, forestry, mining and quarrying); a few utilities, such as electricity and some community services, arealso covered.
22. Worldwide collapse in exports, in gross value added terms between 2008 and 2009
Gross exports of goods and services are estimated from the underlying inter-country input-output (ICIO) system used toproduce the OECD-WTO Trade in Value Added (TiVA) indicators. Of necessity, the system requires consistent bilateral tradematrices in which exports of products X from country A to B are equal to imports of products X by B from A. Efforts are madeto ensure consistency with aggregate exports and imports as reported in countries' National Accounts or Balance ofPayments statistics. However, because of the required balancing of global bilateral trade matrices, certain results may notmatch countries’ perceptions of their trading patterns.
OECD SCIENCE, TECHNOLOGY AND INDUSTRY SCOREBOARD 2013 © OECD 2013 73

1. KNOWLEDGE ECONOMIES: TRENDS AND FEATURES
Notes and References
23. Trends in world foreign direct investment flows, 1995-2011
From 2005, data refer to the definition of FDI of the 6th revision of the Balance of Payments Manual.
The OECD share in world total is based on the average of inward and outward FDI flows.
24. Decomposition of growth in GDP per capita, 2007-09 and 2009-12
Calculations are based on GDP at constant prices, converted to USD using 2005 purchasing power parities.
For Australia, estimates refer to fiscal years beginning 1st July.
For New Zealand, underlying GDP series refer to fiscal years beginning 1st April.
25. Gap in GDP per capita and GDP per person employed in the BRIICS, with respect to the UnitedStates, 1997-2012
Calculations are based on GDP at constant prices, converted to USD using 2005 purchasing power parities.
26. Labour productivity growth in non-agricultural business sector before the crisis, 2001-07
General notes:
The contribution of each sector to aggregate labour productivity growth is computed as the difference between the growthrate of real value added and that of hours worked, weighted by the sector’s share in total nominal value added and totalhours worked, respectively.
The aggregate activity groups are defined according to ISIC Rev.4 Divisions 05-39 (Sections B-E), 41-43 (F), 45-56 (G-I), 58-63 (J),64-66 (K) and 69-82 (M-N) respectively. Total non-agriculture business sector thus includes all activities except ISIC Rev.4Sections A: Agriculture, forestry and fishing (Divisions 01-03), L: Real estate (68), and O-U: Public administration, education,health and other services (84-99).
Additional note:
Korean hours worked for 2001 are a Secretariat estimate which applies the 2004 industry distribution of hours worked to a2001 total economy figure.
27. Labour productivity growth in non-agricultural business sector after the crisis, 2007-11
See general notes under 26.
28. Investment in fixed and knowledge-based capital, 2010
For Canada, Japan and Korea estimates refer to 2008.
Estimates refer to the business sector for all countries except Korea, for which estimates refer to the total economy. Valueadded in the business sector is adjusted to include knowledge-based investments.
Data on knowledge-based capital (KBC) for Australia provided by L. Talbott; all data for Canada provided by J. Baldwin, W. Guand R. Macdonald; data on KBC and physical assets for members of the European Union, Norway and the United Statesprovided by the INTAN-Invest consortium led by C. Corrado, J. Haskel, C. Jona-Lasinio and M. Iommi; all data for Japanprovided by K. Fukao and T. Miyagawa; data on KBC for Korea provided by H. Chun. Data on tangible investment for Australia,Austria, Denmark, Finland, France, Ireland, Italy, Korea, Luxembourg, the Netherlands, Spain and Sweden and data onadjusted value added for Australia, Korea, Luxembourg and Portugal are OECD calculations based on OECD and AnnualNational Accounts Databases, May 2013.
OECD SCIENCE, TECHNOLOGY AND INDUSTRY SCOREBOARD 2013 © OECD 201374

1. KNOWLEDGE ECONOMIES: TRENDS AND FEATURES
Notes and References
29. Change in business investment intensity between 2008 and 2010
Estimates refer to the business sector for all countries.
Data on knowledge-based capital (KBC) for Australia provided by L. Talbott; data on KBC and physical assets for members ofthe European Union, Norway and the United States provided by the INTAN-Invest consortium led by C. Corrado, J. Haskel,C. Jona-Lasinio and M. Iommi. Data on tangible investment for Australia, Austria, Denmark, Finland, France, Ireland, Italy,Luxembourg, Netherlands, Spain and Sweden and data on adjusted value added for Australia, Luxembourg and Portugal areOECD calculations based on OECD and Annual National Accounts Databases, May 2013.
30. Foreign value added content of exports, 1995
Regional aggregations are as follows:
ASEAN: Brunei Darussalam, Cambodia, Indonesia, Malaysia, the Philippines, Singapore, Thailand and Viet Nam. The aggregatedoes not include Laos and Myanmar.
EU15: Austria, Belgium, Denmark, Finland, France, Germany, Greece, Ireland, Italy, Luxembourg, the Netherlands, Portugal,Spain, Sweden and the United Kingdom.
Other EU: Bulgaria, Cyprus, the Czech Republic, Estonia, Hungary, Iceland, Latvia, Lithuania, Malta, Norway, Poland, Romania, theSlovak Republic, Slovenia and Switzerland.
Rest of the world (world excluding TiVA countries, see www.oecd.org/sti/ind/TiVA_Guide_to_Country_Notes.pdf).
For the regions ASEAN, EU15 and Other Europe, intra-regional trade is included. For example, the arrow from USA to EU15includes USA value added embodied in EU15 countries’ exports to other EU15 countries.
This document and any map included herein are without prejudice to the status of or sovereignty over any territory, to thedelimitation of international frontiers and boundaries and to the name of any territory, city or area.
31. Foreign value added content of exports, 2009
See notes under 30.
32. Foreign value added content of exports, non-OECD economies, 2009
OECD calculated as a weighted average of OECD countries.
33 Service value added in manufacturing exports by industry, 1995 and 2009
The manufacturing activities covered are based on the following ISIC Rev.3 industries: 15-16 (Food products, beverages andtobacco); 17-19 (Textiles, wearing apparel, leather and related products); 20-22 (Wood, paper products, printing and publish-ing); 23-26 (Chemicals, pharmaceuticals, plastics and other non-metallic mineral products); 27-28 (Basic metals and fabri-cated metal products); 29 (Machinery and equipment); 30-33 (Electrical and optical equipment); 34-35 (Transportequipment); 36-37 (Other manufacturing and recycling).
Outliers were excluded from the computation of indices.
34. Foreign direct investment inflows, 1995-2000, 2001-06 and 2007-11
Data from 2005 to 2011 refer to the IMF (2009), Balance of Payments and International Investment Position Manual, 6th edition,definition of FDI. Data prior to 2005 refer to the IMF (1993), Balance of Payments and International Investment Position Man-ual, 5th edition definition of FDI.
Other OECD includes: Australia, Canada, Chile, Iceland, Israel, Korea, Mexico, New Zealand, Norway, Switzerland andTurkey.
Other BRIICS includes: Brazil, India, Indonesia, Russian Federation and South Africa.
Southeast Asia includes: Cambodia, Chinese Taipei, Hong Kong (China), Laos, Malaysia, Myanmar, the Philippines,Singapore, Thailand and Viet Nam.
OECD SCIENCE, TECHNOLOGY AND INDUSTRY SCOREBOARD 2013 © OECD 2013 75

1. KNOWLEDGE ECONOMIES: TRENDS AND FEATURES
Notes and References
35. Outward foreign direct investment flows from BRIICS, 2001-04, 2005-07 and 2008-11
For Indonesia, the 2001-04 average is not available.
The IMF (2009), Balance of Payments and International Investment Position Manual, 6th edition definition of FDI is used for2005-07 and 2008-11, IMF (1993), Balance of Payments and International Investment Position Manual, 5th edition definitionfor 2001-04.
36. Outward foreign direct investment flows from China, yearly average 2007-11
Offshore financial centres include Antigua & Barbuda, the Bahamas, the British Virgin Islands, the Cayman Islands, St Vincent &the Grenadines, and Bermuda.
Southeast Asia includes Brunei Darussalam, Cambodia, Chinese Taipei, Indonesia, Laos, Macau, Malaysia, Myanmar, thePhilippines, Singapore, Thailand and Viet Nam.
37. Top 20 countries, total stock of foreign direct investment, 2012
Top 20 countries by the sum of inward and outward positions.
Countries are ranked by their inward position.
38. Composition of GDP in OECD and BRIICS economies, 2011
The major activity groups defined according to ISIC Rev.4 are: Market services: ISIC Divisions 45-82 (G-N); Non-marketservices: 84-99 (O-U); Industry: 05-39 (B-E), i.e. Mining (05-09), Manufacturing (10-33) and Utilities (35-39); Construction:41-43 (F); and Agriculture: 01-03 (A).
Value added is measured in basic prices except for Indonesia and Japan (market prices) and India and the United States(factor costs).
For Australia data refer to the fiscal year ending June 2012.
For Brazil and Canada data refer to 2009.
For India data refer to the fiscal year ending March 2012.
For New Zealand data refer to the fiscal year ending March 2010.
39. Top 20 OECD and BRIICS economies reliant on natural resources, 2011
For Estonia, previous year data refer to 1995.
Total natural resources rents are the sum of oil rents, natural gas rents, coal rents (hard and soft), mineral rents, and forestrents. Rents are estimated as the difference between the value of production at world prices and total costs of production,including depreciation of fixed capital and return on capital.
40. Top manufacturers, 1990, 2000 and 2011
For Canada the 2011 share is based on a Secretariat extrapolation from official current price value added statistics availableup to 2009.
For China the 2011 share is based on an estimate calculated by the United Nations Statistics Division and derived by apply-ing the average 2008-10 share of manufacturing value added to total industry value added published for 2011.
42. Exports from energy-intensive manufacturing industries, 2011
The five industries considered are those included in ISIC Rev.4 Divisions 17, 19, 20, 23 and 24.
OECD SCIENCE, TECHNOLOGY AND INDUSTRY SCOREBOARD 2013 © OECD 201376

1. KNOWLEDGE ECONOMIES: TRENDS AND FEATURES
Notes and References
43. Biggest net CO2 importers and net CO2 exporters, 2009
Countries are listed by production-based CO2 emissions, in descending order on the left-hand side, in ascending order onthe right-hand side.
44. R&D in OECD and key partner countries, 2011
Figures for researchers are in full-time equivalent units.
For Brazil, Chile and the Netherlands, data refer to 2010.
For Iceland, Indonesia and South Africa data refer to 2009.
For Switzerland, data refer to 2008.
For Greece, data refer to 2007.
For Australia, data refer to 2010 for R&D expenditures and 2008 for researchers.
For India, data refer to 2007 for R&D expenditures and 2005 for researchers.
For Canada, France and Germany, data for researchers refer to 2010.
For United States, data for researchers refer to 2007.
Data for Brazil are provided by Brazil’s Ministry of Science, Technology and Innovation. Data for India and Indonesia fromthe Science & Technology Statistics collected and published by the UNESCO Institute for Statistics. Owing to methodologicaldifferences, data for these countries may not be fully comparable with those for other countries.
45. Business R&D intensity and government support to business R&D, 2011
This is an experimental indicator. International comparability may be limited. For more information, see www.oecd.org/sti/rd-tax-stats.htm.
For Australia, Belgium, Brazil, Chile, Ireland, Israel and Spain, figures refer to 2010. For China, Luxembourg and South Africa,figures refer to 2009 and for Switzerland to 2008.
Estimates of direct funding for Belgium, France, Italy and Portugal are based on imputing the share of direct government-funded BERD in the previous year to the current ratio of BERD to GDP. For Austria, the 2009 share is used for 2011. For Brazil,the 2008 share, based on national sources, is used for 2010.
In Austria, Poland and South Africa, R&D tax incentive support is included in official estimates of direct government fund-ing of business R&D. It is removed from direct funding estimates to avoid double-counting.
Estonia, Finland, Germany, Luxembourg, Mexico, New Zealand, Sweden and Switzerland did not provide information onexpenditure-based R&D tax incentives for 2011. For Israel the R&D component of incentives cannot be separately identifiedat present.
Estimates do not cover sub-national and income-based R&D tax incentives and are limited to the business sector (excludingtax incentive support to individuals). Data refer to estimated initial revenue loss (foregone revenues) unless otherwisespecified.
Estimates refer to costs of incentives for business expenditures on R&D, both intramural and extramural unless otherwisespecified. Direct support figures refer only to intramural R&D expenditures, except for Brazil.
Country specific notes are available at www.oecd.org/sti/rd-tax-stats.htm.
46. Global Internet Protocol (IP) traffic, 2005-13
VoD: video on demand. WAN: wide area network.
2013: estimates.
OECD SCIENCE, TECHNOLOGY AND INDUSTRY SCOREBOARD 2013 © OECD 2013 77

1. KNOWLEDGE ECONOMIES: TRENDS AND FEATURES
Notes and References
47. IPv6 deployment by country, November 2012
Data collected on 19 November 2012.
48. Mobile cellular and broadband penetration worldwide, 2001-11
OECD series are computed with OECD data.
For Brazil, China, India and World, data are from ITU for mobile subscriptions and from the United Nations for population.
49. University hotspots, geographical distribution of highest impact institutions, 2007-11
Other OECD includes Australia, Canada, Israel, Japan, Korea, Mexico, New Zealand, Norway and Switzerland.
Other EU (and OECD) includes Austria, Belgium, the Czech Republic, Denmark, Finland, France, Germany, Greece, Ireland,Italy, the Netherlands, Poland, Portugal, Spain and Sweden.
Non-OECD includes Brazil, China, Chinese Taipei, Hong Kong (China), India, Iran, Lithuania, Malaysia, Singapore, SouthAfrica and Thailand.
50. Innovation hotspots in ICT, biotechnology and nanotechnology, 1998-2000 and 2008-10
Data relate to patent applications filed under the Patent Cooperation Treaty (PCT) in ICT, biotechnology and nanotechnology.Patent counts are based on the priority date, the inventor’s region of residence and fractional counts. The regional break-down used is the OECD’s Territorial Level 2.
51. Service-related trademark applications at USPTO and OHIM, selected OECD and non-OECDeconomies, 2000-02 and 2010-12
Shares of service trademarks are calculated using fractional counts of the classes designated in the trademark application.Classes 1 to 34 relate to goods; classes 35 to 45 relate to services.
Trademarks in knowledge-intensive services refer to applications in classes 35, 36, 38 and 42 of the Nice Classification.Trademarks in other services refer to applications in classes 37, 39, 40, 41, 43, 44 and 45 of the Nice Classification.
52. Trademarks in knowledge-intensive services, selected OECD and non-OECD economies, 2010-12
Shares of knowledge-intensive service trademarks are calculated using fractional counts of the classes designated in thetrademark application. The following classes of the 10th edition of the Nice Classification are covered: class 35, businessservices; class 36, finance and insurance; class 38, telecommunications; and class 42, R&D.
53. Patents and trademarks per capita, 2000-02 and 2009-11
Patent families are counted using fractional counts and according to the earliest priority date (first patent applicationworldwide) and the inventor’s country of residence.
Trademarks abroad are counted according to the application date and the address of the applicant.
55. The impact of scientific production and the extent of international scientific collaboration, 2003-11
The international institutional collaboration indicator is based on the proportion of documents involving institutionalaffiliations with other countries or economies, as a proportion of documents attributed to authors with an affiliation in thereference economy. Single-authored documents with multiple affiliations across boundaries can therefore count as institu-tional international collaboration.
OECD SCIENCE, TECHNOLOGY AND INDUSTRY SCOREBOARD 2013 © OECD 201378
1. KNOWLEDGE ECONOMIES: TRENDS AND FEATURES
Notes and References
56. The impact of internationally mobile scientists, inflows versus outflows, 1996-2011
International mobility of scientific researchers is inferred from authors listed in the Scopus Custom database of peer-reviewed scientific publications with at least two documents during the reference period, based on changes in the locationof their institutional affiliation. Outflows are defined on the basis of their first affiliation. Inflows are defined on the basisof the final affiliation and exclude individual authors who “return” to their original country of affiliation.
A proxy measure of scientific impact for researchers with different mobility patterns is estimated by calculating, for eachauthor and mobility profile, the median across the relevant journals’ Source-Normalized Impact per Paper (SNIP) over theentire period. A SNIP impact value that is higher than one means that the median-attributed SNIP for authors of that coun-try/category is above average.
58. The innovation-science link by technology area, 2001-11
To identify whether NPL corresponds to a scientific document, NPL references were matched to Thomson Reuters Web ofScience database, an index of scientific literature. For matched references, scientific domains correspond to ThomsonReuters Essential Science Indicators 22-field classification (http://archive.sciencewatch.com/about/met/fielddef/). For presenta-tional purposes, the fields are combined into a reduced set of 11 categories. Medical sciences encompasses clinical medi-cine, neuroscience, psychiatry and psychology. Life sciences covers biology and biochemistry, immunology, microbiology,molecular biology and genetics. Earth science includes geosciences and environment/ecology. Economics is included insocial sciences. Other items are as indicated.
59. International collaboration in science and innovation, 2007-11
International co-authorship of scientific publications is defined at institutional level. A scientific document is deemed toinvolve an international collaboration if there are institutions from different countries or economies in the list of affiliationsreported by single or multiple authors. Estimates are based on whole counts from information contained in the Scopus®database (Elsevier B.V.).
International co-inventions are measured as the share of patent applications filed under the Patent Cooperation Treaty(PCT) with at least one co-inventor located in a different country in total patents invented domestically. Patent counts arebased on the priority date, the inventor’s country of residence and whole counts.
60. Cross-border ownership of patents, 2009-11
The data refer to counts of patent applications filed under the Patent Cooperation Treaty (PCT), at international phase, bypriority date, country and fractional counts.
61. Scientific collaboration with the BRIICS countries, 2001 and 2011
Numbers are based on whole counts.
North America includes the United States, Canada and Mexico.
Far East and Oceania includes Australia, Japan, Korea, Malaysia, New Zealand, Singapore and Thailand.
62. Co-inventions with the BRIICS countries, 1991-2011
Co-inventions are measured as the share of patent applications with at least one co-inventor located in a BRIICS country intotal patents invented domestically.
Data refer to counts of patent applications filed under the Patent Cooperation Treaty (PCT), at international phase, by prior-ity date, inventor’s country of residence and whole counts.
63. Triadic patent families by blocs, 2001 and 2011
“Triadic” patent families refer to patents filed at the European Patent Office (EPO), the Japan Patent Office (JPO) and theUnited States Patent and Trademark Office (USPTO) that protect the same invention. Patent counts are based on the prioritydate, the inventor’s country of residence and fractional counts.
Data for 2011 are estimates.
OECD SCIENCE, TECHNOLOGY AND INDUSTRY SCOREBOARD 2013 © OECD 2013 79

1. KNOWLEDGE ECONOMIES: TRENDS AND FEATURES
Notes and References
64. Technology transfers to selected BRIICS, 2005-09
Data refer to patent families, i.e. patents applied for at more than one patent office, one of which is among the following:Canadian Intellectual Property Office (CIPO, Canada); Companies and Intellectual Property Commission (CIPC, South Africa);Deutsches Patent- und Markenamt (DPMA, Germany); European Patent Office (EPO); Federal Service for Intellectual Property(ROSPATENT, Russian Federation); Institut National de la Propriété Industrielle (INPI, France); Instituto Nacional de PropriedadeIndustrial (INPI, Brazil); Japan Patent Office (JPO, Japan); Korean Intellectual Property Office (KIPO, Korea); State IntellectualProperty Office of the People’s Republic of China (SIPO, China); UK Intellectual Patent Office (UKIPO, United Kingdom); andthe United States Patent and Trademark Office (USPTO, United States).
Patents are allocated to technology fields using the International Patent Classification (IPC) codes and the classification pre-sented in Schmoch (2008, revised in 2013). Patent counts are based on the earliest priority date, the inventor’s country ofresidence and fractional counts.
65. Gender differences in seeking health-related information on the Internet, 2011
Except where otherwise stated, the recall period is three months.
Averages are calculated using data from available OECD countries for which data are strictly comparable.
The national source for the Russian Federation is the Institute for Statistical Studies and Economics of Knowledge, HigherSchool of Economics (HSE) of the National Research University, May 2013.
For Canada, individuals aged 16 and over. Internet users are defined for a recall period of 12 months.
For Korea and New Zealand, data refer to 2012. Internet users are defined for a recall period of 12 months.
For Switzerland, data refer to 2010. Internet users are defined for a recall period of 6 months.
For the United States, data refer to May 2011 and are from the Pew Research Center. Percentages refer to adult Internet users(aged 18 or more) who have ever looked on line for health or medical information. There is no recall period.
66. Age differences in seeking employment-related information on the Internet, 2011
The recall period is three months, except for Canada, Chile, Japan and Korea (12 months), and the United States, which hasno recall period (see note below).
The national source for the Russian Federation is the Institute for Statistical Studies and Economics of Knowledge, HigherSchool of Economics (HSE) of the National Research University, May 2013.
For Canada, data refer to 2010 and to search for employment only. The recall period is 12 months.
For Chile, data refer to 2012. Calculations for 16-64 year-olds are based on population figures for the group of individuals15-64 years old.
For Japan, data refer to 2012 with different age groups: 15-59 year-olds, 15-19 year-olds and 50-59 year-olds.
For Korea data refer to 2012.
For the United States, data refer to May 2011 and are from the Pew Research Center. Percentages refer to adult Internet users(aged 18 or more) who have ever looked on line for information about a job. Internet users aged 18 or more instead of 16-64,18-29 instead of 16-24 and 50-64 instead of 55-64.
67. Public perception of the impact of science and technology on personal well-being, 2010
For Japan and the Russian Federation, data refer to 2011.
For Korea, data refer to 2012.
For the United States, data refer to 2004.
For India, data refer to 2004.
Based on surveys conducted by means of face-to-face interviews. Results for Japan are based on web-based questionnaire.
Respondents in Japan, the Russian Federation and the United States were offered the following options (Strongly agree,Agree, Disagree, Strongly disagree, Don’t know). Respondents in India were presented with three options (Agree, Disagree,Don’t know). For Korea, only results for Strongly agree and Agree to some extent are available.
OECD SCIENCE, TECHNOLOGY AND INDUSTRY SCOREBOARD 2013 © OECD 201380
1. KNOWLEDGE ECONOMIES: TRENDS AND FEATURES
Notes and References
National sources within the following publications:
China: Ministry of Science and Technology of the People’s Republic of China (2010). EU countries: European Commission(2010). Japan: National Institute of Science and Technology Policy (2011). Korea: Korea Foundation for the Advancement ofScience and Creativity (2012). Russian Federation: National Research University – Higher School of Economics (2012). UnitedStates: National Science Board (2012). India: National Science Board (2012).
68. Public perception of scientific research benefits, 2010
For Japan and the Russian Federation, data refer to 2011.
For Korea, data refer to 2006.
Based on surveys conducted by means of face-to-face interviews.
For Japan, Korea, the Russian Federation and the United States, respondents were invited to choose among the followingoptions: Benefits are much greater than harm, Benefits are slightly greater than harm, Benefits and harm are about equal,Harm is slightly greater than benefits, Harm is much greater than benefits, and Don’t know.
For Brazil, respondents are asked to choose among the following options: Only benefits, More benefits than harm, Bothbenefit and harm, More harm than benefits, Only harm, and Don’t know.
For EU countries and China, the question invited respondents to express their (dis)agreement with the statement, “Thebenefits of science are greater than any harmful effects it may have”, by choosing among the following: Totally agree, Tendto agree, Neither agree nor disagree, Tend to disagree, Totally disagree, Don’t know.
National sources within the following publications:
Brazil: Ministry of Science and Technology of Brazil (2010). China: Ministry of Science and Technology of the People’s Republic ofChina (2010). EU countries: European Commission (2010). Japan: National Institute of Science and Technology Policy (2011).Korea: National Science Board (2012). The Russian Federation: National Research University – Higher School of Economics(2012). United States: National Science Board (2012).
Notes andReferences
Baldwin, J., W. Gu and R. Macdonald (2012), “Intangible capital and productivity growth in Canada”, in The Canadian ProductivityReview Research Papers, Statistics Canada, Ottawa, www.statcan.gc.ca/pub/15-206-x/15-206-x2012029-eng.htm.
Bravo-Biosca, A., C. Criscuolo and C. Menon (2013), “What Drives the Dynamics of Business Growth?”, OECD Science, Technology andIndustry Policy Papers, No. 1, OECD Publishing. Doi: http://dx.doi.org/10.1787/5k486qtttq46-en.
Chun, H., K. Fukao, S. Hisa and T. Miyagawa (2012), “Measurement of Intangible Investments by Industry and Its Role in ProductivityImprovement Utilizing Comparative Studies between Japan and Korea”, RIETI Discussion Paper Series, 12-E-037.
Corrado, C., C. Hulten, and D. Sichel (2009), “Intangible Capital and US Economic Growth”, Review of Income and Wealth, Vol. 55, No. 3,pp. 661–685.
Corrado, C., J. Haskel, C. Jona-Lasinio and M. Iommi (2012), “Intangible Capital and Growth in Advanced Economies: MeasurementMethods and Comparative Results”, Working Paper, June, www.intan-invest.net.
Department of Industry, Innovation, Science, Research and Tertiary Education, Commonwealth of Australia (2012), Australian InnovationSystem Report – 2012, www.innovation.gov.au/innovation/policy/AustralianInnovationSystemReport/AISR2012/index.html.
European Commission (2010), Special EUROBAROMETER ’Science and Technology Report’, European Commission Directorate-General forResearch, Brussels, http://ec.europa.eu/public_opinion/archives/ebs/ebs_340_en.pdf, accessed 10 June 2013.
Eurostat, “'High-technology' and 'knowledge based services' aggregations based on NACE Rev.2” (Eurostat online document),http://epp.eurostat.ec.europa.eu/cache/ITY_SDDS/Annexes/htec_esms_an3.pdf.
Graham, S., G. Hancock, A. Marco and A. Myers (2013), “The USPTO Trademark Case Files Dataset: Descriptions, Lessons, andInsights”, SSRN Working Paper, http://papers.ssrn.com/sol3/papers.cfm?abstract_id=2188621.
International Energy Agency (2013), CO2 Emissions from Fuel Combustion, 2012 edition, www.iea.org/co2highlights/co2highlights.pdf.
JPO (2001-12), Annual Reports, Japan Patent Office (JPO),Tokyo, www.jpo.go.jp.
OECD SCIENCE, TECHNOLOGY AND INDUSTRY SCOREBOARD 2013 © OECD 2013 81

1. KNOWLEDGE ECONOMIES: TRENDS AND FEATURES
Notes and References
Korea Foundation for the Advancement of Science and Creativity (KOFAC) (2012), Survey of Public Attitudes toward and Understandingof Science and Technology, KOFAC, Seoul.
Lev, B. (2001), Intangibles: Management, Measurement and Reporting, Bookings Institution Press, Washington, DC.
Ministry of Science and Technology of Brazil (2010), Public Perception of Science and Technology in Brazil: 2010 Poll results, Ministry ofScience and Technology, www.mct.gov.br/upd_blob/0214/214770.pdf, accessed 10 June 2013.
Ministry of Science and Technology of the People's Republic of China (2010), China Science and Technology Indicators 2010, Scientificand Technical Documentation Press, Beijing.
Miroudot, S., R. Lanz and A. Ragoussis (2009), “Trade in Intermediate Goods and Services”, OECD Trade Policy Working Papers, No. 93,OECD, Paris. Doi: http://dx.doi.org/10.1787/5kmlcxtdlk8r-en.
Nakano, S., A. Okamura, N. Sakurai, M. Suzuki, Y. Tojo and N. Yamano (2009), “The Measurement of CO2 Embodiments inInternational Trade: Evidence from the Harmonised Input-Output and Bilateral Trade Database”, OECD Science, Technology andIndustry Working Papers, 2009/03, OECD Publishing. Doi: http://dx.doi.org/10.1787/227026518048.
National Institute of Science and Technology Policy (NISTEP), Ministry of Education, Culture, Sports, Science and Technology (MEXT)(2011), The Change of the Public Attitudes to Science and Technology The Findings from Face-to-Face Interviews and from a Monthly InternetSurvey, NISTEP, Tokyo, http://hdl.handle.net/11035/1156, accessed 10 June 2013.
National Research University – Higher School of Economics (2012), Science and Technology Indicators in the Russian Federation: Data book,Moscow, www.hse.ru/en/primarydata/st2012.
National Science Board (2012), Science and Engineering Indicators 2012, National Science Foundation, Arlington, VA, www.nsf.gov/statistics/seind12, accessed 10 June 2013.
OECD, “ISIC Rev.3 Technology Intensity Definition”, (OECD, online document), www.oecd.org/dataoecd/43/41/48350231.pdf.
OECD, “Carbon Dioxide Emissions Embodied in International Trade”, (OECD, online document), www.oecd.org/document/22/0,3746,en_2649_34445_46878038_1_1_1_1,00.html.
OECD (2001), “Measuring Productivity – OECD Manual: Measurement of Aggregate and Industry-Level Productivity Growth, OECDPublishing”. Doi: http://dx.doi.org/10.1787/9789264194519-en.
OECD (2002), Frascati Manual 2002. The Measurement of Scientific and Technological Activities. Proposed Standard Practice for Surveys onResearch and Experimental Development, 6th edition, OECD Publishing, www.oecd.org/sti/frascatimanual. Doi: http://dx.doi.org/10.1787/9789264199040-en.
OECD (2005), A Framework for Biotechnology Statistics, OECD, Paris, www.oecd.org/dataoecd/5/48/34935605.pdf.
OECD/Eurostat (2005), Oslo Manual: Guidelines for Collecting and Interpreting Innovation Data, The Measurement of Scientific andTechnological Activities, 3rd edition, OECD Publishing. Doi: http://dx.doi.org/10.1787/9789264013100-en.
OECD (2009), OECD Biotechnology Statistics 2009, OECD, Paris, www.oecd.org/dataoecd/4/23/42833898.pdf.
OECD (2009), OECD Patent Statistics Manual, OECD Publishing. Doi: http://dx.doi.org/10.1787/9789264056442-en.
OECD (2010), Measuring Innovation: A New Perspective, OECD Publishing. Doi: http://dx.doi.org/10.1787/9789264059474-en.
OECD (2010), OECD Handbook on Deriving Capital Measures of Intellectual Property Products, OECD Publishing.Doi: http://dx.doi.org/10.1787/9789264079205-6-en.
OECD (2011), OECD Guide to Measuring the Information Society 2011, OECD Publishing. Doi: http://dx.doi.org/10.1787/9789264113541-en.
OECD (2011), Science, Technology and Industry Scoreboard 2011, OECD Publishing. Doi: http://dx.doi.org/10.1787/sti_scoreboard-2011-en.
OECD (2012), OECD Compendium of Productivity Indicators 2012, OECD Publishing. Doi: http://dx.doi.org//10.1787/9789264188846-en.
OECD (2012), OECD Science, Technology and Industry Outlook 2012, OECD Publishing. Doi: http://dx.doi.org/10.1787/sti_outlook-2012-en.
OECD (2012), “OECD System of Composite Leading Indicators”, (OECD, online document), www.oecd.org/std/leading-indicators/41629509.pdf.
OECD (2013), OECD Economic Outlook 2013, Issue 1, OECD Publishing. Doi: http://dx.doi.org/10.1787/eco_outlook-v2013-1-en.
OECD (2013), OECD Employment Outlook 2013, OECD Publishing. Doi: http://dx.doi.org/10.1787/empl_outlook-2013-en.
OECD (2013), Economic Policy Reforms 2013: Going for Growth, OECD Publishing. Doi: http://dx.doi.org/10.1787/growth-2013-en.
OECD (2013), Education at a Glance 2013: OECD Indicators, OECD Publishing. Doi: http://dx.doi.org/10.1787/eag-2013-en.
OECD (2013), Entrepreneurship at a Glance 2013, OECD Publishing. Doi: http://dx.doi.org/10.1787/entrepreneur_aag-2013-en.
OECD (2013), “FDI in Figures”, April 2013, www.oecd.org/daf/inv/FDI%20in%20figures.pdf.
OECD (2013), Financing SMEs and Entrepreneurs 2013: An OECD Scoreboard, OECD Publishing. Doi: http://dx.doi.org/10.1787/9789264166769-en.
OECD (2013), Interconnected Economies: Benefiting from Global Value Chains, OECD Publishing. Doi: http://dx.doi.org/10.1787/9789264189560-en.
OECD (2013), OECD Communications Outlook 2013, OECD Publishing. Doi: http://dx.doi.org/10.1787/comms_outlook-2013-en.
OECD SCIENCE, TECHNOLOGY AND INDUSTRY SCOREBOARD 2013 © OECD 201382
1. KNOWLEDGE ECONOMIES: TRENDS AND FEATURES
Notes and References
OECD and SCImago Research Group-CSIC (forthcoming), Compendium of Bibliometric Science Indicators 2014.
Schmoch, U. (2008), “Concept of a Technology Classification for Country Comparisons, Final Report to the World Intellectual PropertyOrganisation (WIPO)”, revised in January 2013, www.wipo.int/export/sites/www/ipstats/en/statistics/patents/pdf/wipo_ipc_technology.pdf.
UNCTAD (2012), World Investment Report 2012, www.unctad-docs.org/files/UNCTAD-WIR2012-Overview-en.pdf.
World Bank (2012), Information and Communications for Development 2012: Maximizing Mobile, The World Bank, Washington, DC. Doi:http://dx.doi.org/10.1596/978-0-8213-8991-1. Licence: Creative Commons Attribution CC BY 3.0.
WTO and Institute of Developing Economies – Japan External Trade Organization (IDE-JETRO) (2011), Trade Patterns and Global Value ChainsIn East Asia: From Trade in Goods to Trade in Tasks, Geneva, www.wto.org/english/res_e/booksp_e/stat_tradepat_globvalchains_e.pdf.
OECD SCIENCE, TECHNOLOGY AND INDUSTRY SCOREBOARD 2013 © OECD 2013 83


OECD SCIENCE, TECHNOLOGY AND INDU
2. BUILDING KNOWLEDGE
1. Investment in knowledge2. Human resources and knowledge-based capital3. Learning for innovation4. Skills for innovation5. New doctorates6. Doctorate holders7. Researchers8. R&D9. Higher education and basic research10. Business R&D11. R&D tax incentives12. International funding of R&DNotes and References
Investment in education, research and innovation generates the knowledge-based capitalthat makes a key contribution to the productivity and competitiveness of nations. A newexperimental indicator identifies the occupations and employment of workers who add toknowledge-based capital. A second set of indicators focuses on the role of education systemsin building competencies for innovation and positions countries with respect to theperformance of students from a young age and throughout the educational system. There is aspecial focus on scientific skills, science and engineering degrees and doctorate holders, whoare specifically trained for research. Other indicators look beyond the educational system tolabour market outcomes, in particular for human resources in science and technology andresearchers. Still another set of indicators looks at investment in R&D performed by thebusiness sector, government and higher education. Experimental indicators of public funding“modes” (e.g. institutional versus project funding) are also included. Finally, new estimates ofR&D tax incentives are combined with direct funding of R&D to provide a more completepicture of the efforts made by governments to promote business R&D.
STRY SCOREBOARD 2013 © OECD 2013 85
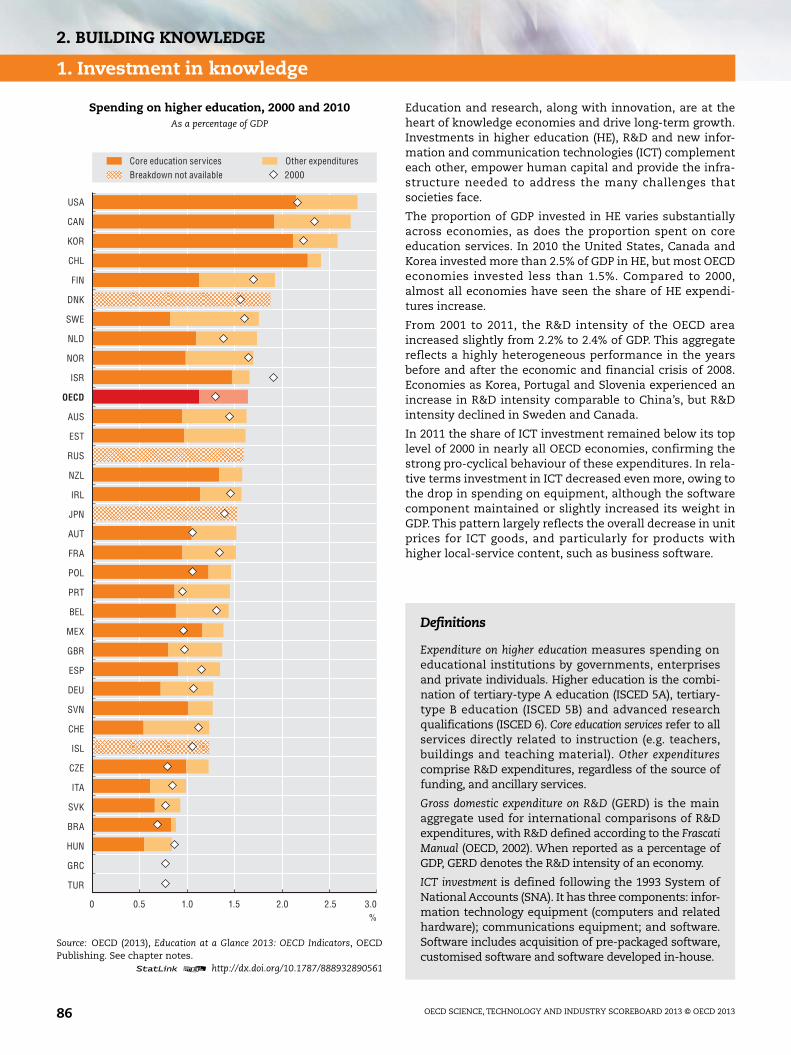
2. BUILDING KNOWLEDGE
1. Investment in knowledge
Education and research, along with innovation, are at theheart of knowledge economies and drive long-term growth.Investments in higher education (HE), R&D and new infor-mation and communication technologies (ICT) complementeach other, empower human capital and provide the infra-structure needed to address the many challenges thatsocieties face.
The proportion of GDP invested in HE varies substantiallyacross economies, as does the proportion spent on coreeducation services. In 2010 the United States, Canada andKorea invested more than 2.5% of GDP in HE, but most OECDeconomies invested less than 1.5%. Compared to 2000,almost all economies have seen the share of HE expendi-tures increase.
From 2001 to 2011, the R&D intensity of the OECD areaincreased slightly from 2.2% to 2.4% of GDP. This aggregatereflects a highly heterogeneous performance in the yearsbefore and after the economic and financial crisis of 2008.Economies as Korea, Portugal and Slovenia experienced anincrease in R&D intensity comparable to China’s, but R&Dintensity declined in Sweden and Canada.
In 2011 the share of ICT investment remained below its toplevel of 2000 in nearly all OECD economies, confirming thestrong pro-cyclical behaviour of these expenditures. In rela-tive terms investment in ICT decreased even more, owing tothe drop in spending on equipment, although the softwarecomponent maintained or slightly increased its weight inGDP. This pattern largely reflects the overall decrease in unitprices for ICT goods, and particularly for products withhigher local-service content, such as business software.
Spending on higher education, 2000 and 2010As a percentage of GDP
Source: OECD (2013), Education at a Glance 2013: OECD Indicators, OECDPublishing. See chapter notes.
1 2 http://dx.doi.org/10.1787/888932890561
0 1.00.5 1.5 2.0 2.5 3.0%
USA
CAN
KOR
CHL
FIN
DNK
SWE
NLD
NOR
ISR
AUS
EST
RUS
NZL
IRL
JPN
AUT
FRA
POL
PRT
BEL
MEX
GBR
ESP
DEU
SVN
CHE
ISL
CZE
ITA
SVK
BRA
HUN
GRC
TUR
Core education servicesBreakdown not available 2000
Other expenditures
OECD
Definitions
Expenditure on higher education measures spending oneducational institutions by governments, enterprisesand private individuals. Higher education is the combi-nation of tertiary-type A education (ISCED 5A), tertiary-type B education (ISCED 5B) and advanced researchqualifications (ISCED 6). Core education services refer to allservices directly related to instruction (e.g. teachers,buildings and teaching material). Other expenditurescomprise R&D expenditures, regardless of the source offunding, and ancillary services.
Gross domestic expenditure on R&D (GERD) is the mainaggregate used for international comparisons of R&Dexpenditures, with R&D defined according to the FrascatiManual (OECD, 2002). When reported as a percentage ofGDP, GERD denotes the R&D intensity of an economy.
ICT investment is defined following the 1993 System ofNational Accounts (SNA). It has three components: infor-mation technology equipment (computers and relatedhardware); communications equipment; and software.Software includes acquisition of pre-packaged software,customised software and software developed in-house.
OECD SCIENCE, TECHNOLOGY AND INDUSTRY SCOREBOARD 2013 © OECD 201386
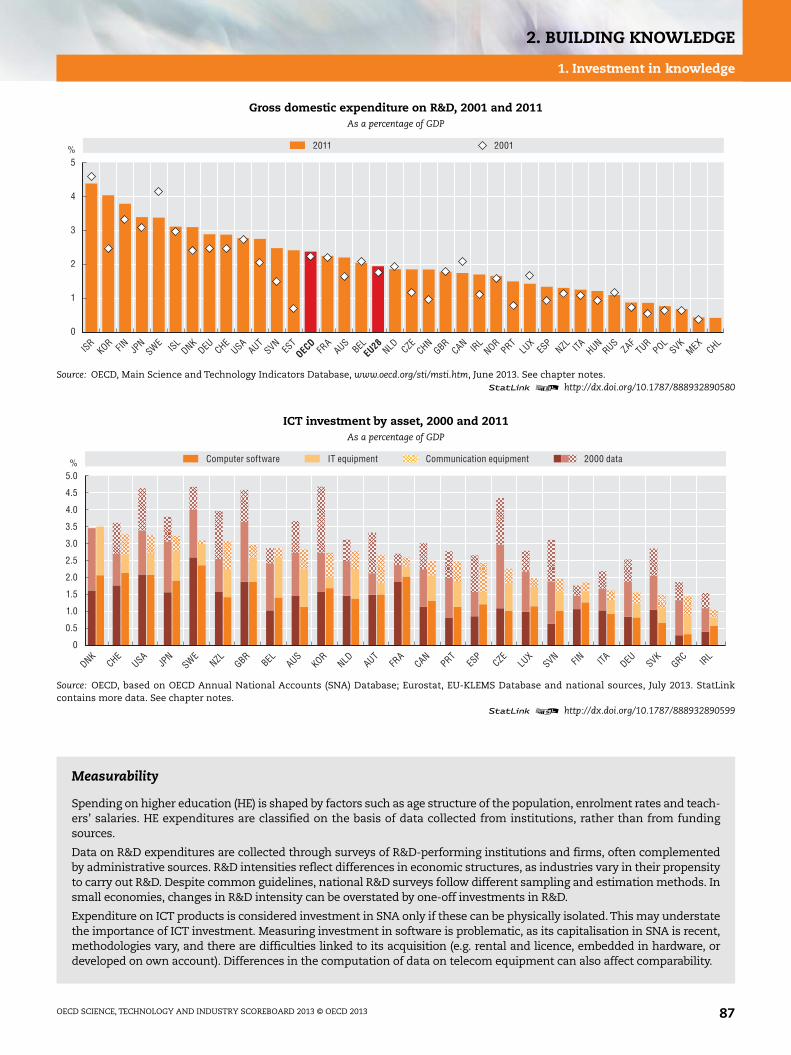
2. BUILDING KNOWLEDGE
1. Investment in knowledge
Gross domestic expenditure on R&D, 2001 and 2011As a percentage of GDP
Source: OECD, Main Science and Technology Indicators Database, www.oecd.org/sti/msti.htm, June 2013. See chapter notes.1 2 http://dx.doi.org/10.1787/888932890580
ICT investment by asset, 2000 and 2011As a percentage of GDP
Source: OECD, based on OECD Annual National Accounts (SNA) Database; Eurostat, EU-KLEMS Database and national sources, July 2013. StatLinkcontains more data. See chapter notes.
1 2 http://dx.doi.org/10.1787/888932890599
Measurability
Spending on higher education (HE) is shaped by factors such as age structure of the population, enrolment rates and teach-ers’ salaries. HE expenditures are classified on the basis of data collected from institutions, rather than from fundingsources.
Data on R&D expenditures are collected through surveys of R&D-performing institutions and firms, often complementedby administrative sources. R&D intensities reflect differences in economic structures, as industries vary in their propensityto carry out R&D. Despite common guidelines, national R&D surveys follow different sampling and estimation methods. Insmall economies, changes in R&D intensity can be overstated by one-off investments in R&D.
Expenditure on ICT products is considered investment in SNA only if these can be physically isolated. This may understatethe importance of ICT investment. Measuring investment in software is problematic, as its capitalisation in SNA is recent,methodologies vary, and there are difficulties linked to its acquisition (e.g. rental and licence, embedded in hardware, ordeveloped on own account). Differences in the computation of data on telecom equipment can also affect comparability.
%5
4
3
2
1
0
CHLFR
ACHN
CAN IRL
CZEES
TISR
SVNNZL
SWEBEL ITAGBR
AUTCHE
DNKES
PAUSFIN JP
NDEU SVK
EU28OEC
DNOR
USAISLNLDKOR
POLLU
XHUN
RUSZAF
TURPRT
MEX
2011 2001
%5.0
4.5
4.0
3.0
3.5
2.0
2.5
1.0
1.5
0.5
0
DNKCHE
USAJP
NSWE
NZL GBRBEL AUS
KORNLD AUT
FRA
CANPRT
ESP
CZELU
XSVN FIN ITA DEU SVK
GRC IRL
Computer software IT equipment Communication equipment 2000 data
OECD SCIENCE, TECHNOLOGY AND INDUSTRY SCOREBOARD 2013 © OECD 2013 87

2. BUILDING KNOWLEDGE
2. Human resources and knowledge-based capital
Knowledge-based capital related workers, 2012As a percentage of total employed persons
Note: Workers contributing to R&D, design, software and databaseactivities and to firms’ organisational knowhow account for between 13%and 28% of total employment in many OECD economies (total length of thebar). Of these workers, between 30% and 54% contribute to more than onetype of KBC asset (bar “overlapping assets”).Source: OECD, based on United States Occupational Information NetworkDatabase, US Current Population Survey and European Union Labour ForceSurvey, June 2013. See chapter notes.
1 2 http://dx.doi.org/10.1787/888932890618
Knowledge-based capital (KBC) is considered extremelyimportant for firms and countries as it relates positively tovalue added, productivity and competitiveness. It consistsof assets lacking physical substance the value of whichstems from their knowledge content and lasting nature.Because people are the main source and means to embodysuch knowledge, human capital plays a key role in generat-ing and accumulating KBC.
The OECD has developed an experimental methodology toidentify occupations that contribute to the formation ofKBC, in particular organisational capital (OC), computerisedinformation (CI), design, and research and development(R&D). The occupations are selected on the basis of thetasks workers perform on the job, the skills they apply, andthe level of knowledge of the subject area they rely on.Several categories of workers are involved in more than onetype of KBC; this shows the need to look at KBC in itsentirety and to address the relationships (e.g. complemen-tarities) among the different KBC assets.
KBC-related workers account for between 13% and 28% oftotal employment in many OECD economies. Of theseworkers, between 30% and 54% contribute to more thanone type of KBC asset, and, of these, between 30% to 50%are involved in tasks related to the combination of R&D andCI. In particular, workers involved in CI, i.e. those dealingwith software and databases, are to various extentsinvolved in tasks related to all other KBC types considered.OC-related occupations that do not overlap with otherassets conversely account for the single largest group ofemployed persons (6% to 14% of total employment).
The proportion of KBC-related employment varies morewidely in manufacturing (between 12% and 37%) than inservices industries (21%-34%). The United States has themost KBC-intensive manufacturing and the Nordic econo-mies have among the most KBC-intensive services. Thereare differences of up to 11 percentage points between thetwo industry aggregates. Composition effects, technologyintensity, industrial specialisation and differences in thecontent of occupations may explain these patterns.
0 105 15 20 25 30%
TUR
SVK
ITA
PRT
HUN
ESP
GRC
DNK
POL
CZE
LUX
AUT
IRL
FIN
SVN
EST
BEL
NLD
SWE
DEU
FRA
NOR
USA
GBR
ISL
Organisational capital
Design
Computerised information
Research and development
Overlapping assets
Definitions
Four of the 12 assets identified in Corrado et al. (2009)are considered here: CI, R&D, design and OC. Overlap-ping assets refers to occupations contributing to morethan one KBC type. Occupations related to KBC aredefined on the basis of tasks performed, skills andknowledge areas, using the United States OccupationalInformation Network (O*NET) Database. Occupationsare defined according to the Standard OccupationalClassification (SOC, 2010) for the United States and tothe latest International Standard Classification ofOccupations (ISCO, 2008) for Europe. Figures foremployed persons refer to employees and self-employedworkers for the total economy in 2012.
OECD SCIENCE, TECHNOLOGY AND INDUSTRY SCOREBOARD 2013 © OECD 201388

2. BUILDING KNOWLEDGE
2. Human resources and knowledge-based capital
Workers contributing to more than one activity related to knowledge-based capital, 2012As a percentage of employed persons related to more than one asset type
Source: OECD, based on United States Occupational Information Network Database, US Current Population Survey and European Union Labour ForceSurvey, June 2013. See chapter notes.
1 2 http://dx.doi.org/10.1787/888932890637
Employment contributing to knowledge-based capital by industry, 2012As a percentage of all employed persons in the industry
Source: OECD, based on United States Occupational Information Network Database, US Current Population Survey and European Union Labour ForceSurvey, June 2013. See chapter notes.
1 2 http://dx.doi.org/10.1787/888932890656
Measurability
KBC-related occupations are identified via cluster analysis and a distribution-based approach (Squicciarini and Le Mouel,2012) using pooled O*NET data on the importance and level of tasks, skills and knowledge areas of workers. The cross-sectional nature of O*NET does not allow for addressing changes in occupational profiles. The absence of O*NET-type sur-veys for other countries hinders analysis of country-specific data. Here it is assumed that employees with correspondingoccupational titles perform identical tasks in the EU and the United States. The OECD is trying to develop country-specificanalysis by using data from the Programme for the International Assessment of Adult Competencies (PIAAC). SOC (2010)occupations are translated into ISCO (2008) 4-digit classes to identify KBC-related occupations for the EU. Small differencesin the selection of KBC-related occupations are due to differences in the two classifications. Employment figures for theUnited States are calculated on Current Population Survey (CPS) data. Employment figures for the EU are based on 3-digitLabour Force Survey (LFS) data and rely on proportions drawn from CPS data.
%
FRA IR
LCZE
EST
SVNSWE
BELITA GBRAUT
GRCDNK
ESPFINSVK
DEU NORUSA ISL
NLDPOLLU
XHUN
TURPRT
0102030405060708090
100
9 9 9 8 6 11 10 7 11 11 7 6 10 9 8 6 8 7 7 9 4 11 10 9 8
2 assets: Computerised Information, Design2 assets: Organisational Capital, R&D2 assets: Organisational Capital, Computerised Information2 assets: Computerised Information, R&D
4 Assets3 assets: Computerised Information, R&D, Design3 assets: Organisational Capital, Computerised Information, R&D
Share of overlapping KBC-related employed persons in total employment
%40
30
35
20
25
10
15
5
0
FRA IR
LCZE
EST
SVNSWE
BEL ITA GRCGBR
AUTDNK
ESPFINDEU SVK
NORUSA ISL
NLD POLLU
XHUN
TURPRT
Manufacturing Services
OECD SCIENCE, TECHNOLOGY AND INDUSTRY SCOREBOARD 2013 © OECD 2013 89
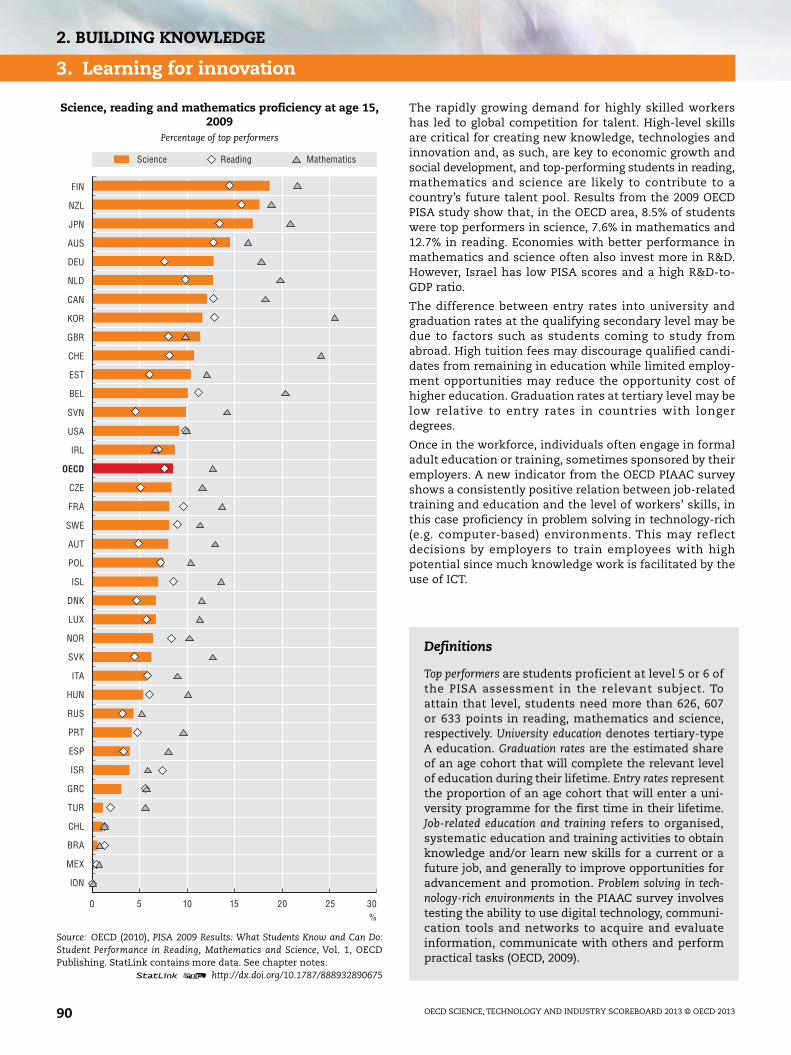
2. BUILDING KNOWLEDGE
3. Learning for innovation
Science, reading and mathematics proficiency at age 15,2009
Percentage of top performers
Source: OECD (2010), PISA 2009 Results: What Students Know and Can Do:Student Performance in Reading, Mathematics and Science, Vol. 1, OECDPublishing. StatLink contains more data. See chapter notes.
1 2 http://dx.doi.org/10.1787/888932890675
The rapidly growing demand for highly skilled workershas led to global competition for talent. High-level skillsare critical for creating new knowledge, technologies andinnovation and, as such, are key to economic growth andsocial development, and top-performing students in reading,mathematics and science are likely to contribute to acountry’s future talent pool. Results from the 2009 OECDPISA study show that, in the OECD area, 8.5% of studentswere top performers in science, 7.6% in mathematics and12.7% in reading. Economies with better performance inmathematics and science often also invest more in R&D.However, Israel has low PISA scores and a high R&D-to-GDP ratio.
The difference between entry rates into university andgraduation rates at the qualifying secondary level may bedue to factors such as students coming to study fromabroad. High tuition fees may discourage qualified candi-dates from remaining in education while limited employ-ment opportunities may reduce the opportunity cost ofhigher education. Graduation rates at tertiary level may below relative to entry rates in countries with longerdegrees.
Once in the workforce, individuals often engage in formaladult education or training, sometimes sponsored by theiremployers. A new indicator from the OECD PIAAC surveyshows a consistently positive relation between job-relatedtraining and education and the level of workers’ skills, inthis case proficiency in problem solving in technology-rich(e.g. computer-based) environments. This may reflectdecisions by employers to train employees with highpotential since much knowledge work is facilitated by theuse of ICT.
0 105 15 20 25 30%
FIN
NZL
JPN
AUS
DEU
NLD
CAN
KOR
GBR
CHE
EST
BEL
SVN
USA
IRL
CZE
FRA
SWE
AUT
POL
ISL
DNK
LUX
NOR
SVK
ITA
HUN
RUS
PRT
ESP
ISR
GRC
TUR
CHL
BRA
MEX
IDN
Science Reading Mathematics
OECD
Definitions
Top performers are students proficient at level 5 or 6 ofthe PISA assessment in the relevant subject. Toattain that level, students need more than 626, 607or 633 points in reading, mathematics and science,respectively. University education denotes tertiary-typeA education. Graduation rates are the estimated shareof an age cohort that will complete the relevant levelof education during their lifetime. Entry rates representthe proportion of an age cohort that will enter a uni-versity programme for the first time in their lifetime.Job-related education and training refers to organised,systematic education and training activities to obtainknowledge and/or learn new skills for a current or afuture job, and generally to improve opportunities foradvancement and promotion. Problem solving in tech-nology-rich environments in the PIAAC survey involvestesting the ability to use digital technology, communi-cation tools and networks to acquire and evaluateinformation, communicate with others and performpractical tasks (OECD, 2009).
OECD SCIENCE, TECHNOLOGY AND INDUSTRY SCOREBOARD 2013 © OECD 201390

2. BUILDING KNOWLEDGE
3. Learning for innovation
Transition from upper secondary to graduation at university level, 2011Graduation and entry rates
Source: OECD (2013), Education at a Glance 2013: OECD Indicators, OECD Publishing. See chapter notes.1 2 http://dx.doi.org/10.1787/888932890694
Participation in job-related education and training by level of problem solving in technology-rich environments, 2012As a percentage of the adult population at the relevant proficiency level
Source: OECD, Survey of Adult Skills Database, Programme for the International Assessment of Adult Competencies (PIAAC), April 2013. See chapter notes.1 2 http://dx.doi.org/10.1787/888932890713
Measurability
The OECD Programme for International Student Assessment (PISA) assesses the extent to which students near the end ofcompulsory education have acquired key knowledge and skills, with a focus on reading, mathematics and science. The2009 survey was conducted in 34 OECD and 31 partner economies; 470 000 students aged 15 to 16 participated (OECD, 2010).
The calculation of graduation and entry rates on a net basis requires information that is not always available. In thiscase, gross rates, which divide the total number of entrants or graduates by the population at the typical entry orgraduation age, are used. In Europe, the Bologna process for harmonising higher education systems may result inlimited comparability of education statistics during the transition.
Education and training participation rates are calculated on an adjusted adult population that excludes students whohave not completed their first formal cycle of education. Individuals aged 16 to 19 who recently completed or areengaged in short-duration education or training at level ISCED 3C or below, as well as those aged 20 to 24 forISCED 3A,B,C, are included.
%100
40
80
20
60
0
PRTAUS ISL
POLNZL NOR
SVNUSA
SWERUS
DNKKOR FIN NLD GBR
SVKCZE
ISRES
PAUT
HUNJP
N IRL ITA DEU CHL
CHEES
TGRC
FRA
TURMEX
BEL IDN
CHNBRA
CANLU
X
Entry rate into tertiary education (ISCED 5A)
Graduation rate from upper secondary programmes designed to prepare students for tertiary education (ISCED 3A)
Graduation rate at the tertiary level (ISCED 5A)
OECD
%90
60
70
80
0
20
30
10
40
50
AUSNLD SWE
DEUNORES
TFINUSA IRL
DNKSVK
AUTCAN
POLJP
NCZE
KOR
Most proficient (Level 3) No ICT experience/Failed core ICT testLeast proficient (Below Level 1)
OECD SCIENCE, TECHNOLOGY AND INDUSTRY SCOREBOARD 2013 © OECD 2013 91

2. BUILDING KNOWLEDGE
4. Skills for innovation
Human resources in science and technology (HRST) playa key role in innovation. In most OECD countries, profes-sionals, associates and technicians – an occupation-basedproxy for HRST – represented more than a quarter of totalemployment in 2010, with an EU average above 30%. InLuxembourg, Denmark, Sweden and Switzerland, over 40%of all employed individuals are in these occupations. Thesplit between professionals and technicians differs acrosscountries.
The industry structure of employment shows that HRSTare, in general, a little more prevalent in business sectorservices than in manufacturing - with differences of about4 and 7 percentage points in the EU and the United Statesrespectively. In France and Germany, however, shares ofthese HRST workers are higher in manufacturing than inbusiness sector services while for a few other EU countries,HRST shares in manufacturing are only slightly lower. Thispartly reflects the skill intensity of manufacturing in thesecountries, as well as in business sector services which arehighly diverse in terms of skills use.
Innovation requires a broad range of capabilities thatinclude but go beyond science and technology. Businesssurveys can help to identify skills and competencies usedby firms and their relation to innovation. New innovationsurvey data show significant differences in the use of inter-nal or external skills between innovative and non-innovativefirms. Innovative firms are more likely to draw not only onskills in engineering and applied science, but also on skillsin product design, graphics, advertising, market research,software development and data management.
Professionals and technicians, 2012HRST as a percentage of total employment
Note: HRST refers to human resources in science and technology.Source: OECD, based on European Labour Force Surveys, Eurostat,July 2013; ILO Laborsta Database, July 2013; and national sources. Seechapter notes.
1 2 http://dx.doi.org/10.1787/888932890732
0 60%
20 40
IND
IDN
CHN
BRA
CHL
AUS
RUS
ISR
CAN
MEX
TUR
ZAF
PRT
GRC
ESP
SVK
POL
HUN
ITA
CZE
EST
IRL
SVN
AUT
BEL
GBR
FRA
ISL
DEU
NLD
FIN
NOR
USA
CHE
SWE
DNK
LUX
27
48
50
52
46
54
64
52
56
45
37
52
52
50
49
57
58
58
46
49
64
53
57
50
47
50
49
48
58
49
48
52
48
52
46
52
52
46
Professionals (ISCO 2)
Technicians and associate professionals (ISCO 3)
Breakdown not available
ISCO-08 classification
ISCO-88 classification
Share of women in HRST work force
EU28
Definitions
Human resources in science and technology (HRST) aredefined in the Canberra Manual (OECD and Eurostat,1995) as persons graduated at the tertiary level of edu-cation or employed in a science and technology occu-pation for which a high qualification is normallyrequired and innovation potential is high. In terms ofoccupational data, HRST comprises Professionals (ISCOGroup 2) and Technicians and associate professionals(ISCO Group 3) in physical and engineering science;life sciences and health; teaching; and other areas.
In line with the Oslo Manual definition of innovation(OECD and Eurostat, 2005), innovative enterprises engagedduring 2008-10 in activities related to the introductionof new products, processes, organisational or market-ing methods. Enterprises with ongoing and aban-doned activities for product and process innovationare included. Companies using innovation-relevant skillsare defined as having employed individuals with skillsin areas such as product design, software develop-ment, database management, or having secured suchskills from external sources, such as consultants.
OECD SCIENCE, TECHNOLOGY AND INDUSTRY SCOREBOARD 2013 © OECD 201392

2. BUILDING KNOWLEDGE
4. Skills for innovation
Professionals and technicians in business sector services and manufacturing, 2012As a percentage of total employment in each industry group
Source: OECD, based on European Labour Force Surveys, Eurostat, June 2013; and US Current Population Survey, March 2012. See chapter notes.1 2 http://dx.doi.org/10.1787/888932890751
Firms using innovation-relevant skills, 2008-10As a proportion of innovative and non-innovative firms
Source: Eurostat, Community Innovation Survey Database, July 2013. See chapter notes.1 2 http://dx.doi.org/10.1787/888932890770
Measurability
ISCO-08 (International Standard Classification of Occupations 2008) is an international classification designed to producecomparative official statistics. Adopted late in 2007, it replaced ISCO-88 (www.ilo.org/public/english/bureau/stat/isco/index.htm). Many countries maintain national classifications that are more detailed and may have different criteria fordefining occupations. Converting national classifications to ISCO for comparative purposes may lead to a loss or distortionof information. As the process of adopting the new classification and developing appropriate conversion tables is stillunder way, the scope for cross-country and longitudinal comparisons is currently reduced.
The primary focus of business innovation surveys is to identify the innovation outcomes and activities of firms, butthere is increasing interest in questions concerning firms’ innovation capabilities, and innovation-related skills inparticular. A voluntary module was introduced in the EU Community Innovation Survey 2010 on firms’ internal andexternal skills and methods used to stimulate new ideas and creativity.
%60
30
50
20
10
40
0
LUX
SWEDNK
CHENOR ISL FIN USA
FRA
SVNCZE
GBRNLD ITA IR
LES
TEU28
AUTPOL
DEU BEL HUNSVK
PRTGRC
ESP
TUR
Business sector services Manufacturing
%80
60
40
20
40
0
20
60
EST
TURSVN
NORHUN
BEL AUTSVK
CZEPOL
IRL
SWEFR
APRT ITA
Percentage of innovative firms
Percentage of non-innovative firms
Engineering/applied sciences Mathematics/statistics/database management Software development
Design of objects or services Market researchGraphic arts/layout/advertising
OECD SCIENCE, TECHNOLOGY AND INDUSTRY SCOREBOARD 2013 © OECD 2013 93

2. BUILDING KNOWLEDGE
5. New doctorates
Doctoral graduates are key players in research and innova-tion. They are specifically trained to conduct research andare considered best qualified to create and diffuse scientificknowledge.
While only a small proportion of students obtainedadvanced research degrees in 2011, doctoral graduationrates increased over the last decade in all countries exceptPoland. In Switzerland, Sweden, Germany and Finland,they were at least 2.5% of all population in the relevant agecohorts. The increase was proportionally largest in theSlovak Republic and New Zealand.
The growing presence of women in doctoral programmespartly explains the overall increase in doctorates over thepast decade. In 2011, women received 47% of the OECDaverage of doctoral degrees, up from 43% in 2006.
The largest share of new doctorates is in science (25%),followed by health and welfare (20%). Science and engi-neering degrees combined account for 40% of new doctor-ates and social sciences and humanities for 36%. There aresignificant variations among countries in the share of newscience and engineering degrees. Science accounts formore than 40% of new doctoral degrees in Iceland, Chileand France. Engineering represents up to one-quarter ofnew doctoral degrees in Korea and Denmark. Women areunder-represented among new science and engineeringdoctorates but outnumber men in health degrees.
On average over 2007-11, in the United States, China andGermany, some 67 000, 48 000 and 26 000 individuals,respectively, received doctoral degrees. Science andengineering degrees represent more than 50% of the totalflow of new doctorates in Chile, France, China, Canada,Ireland, Estonia and Israel.
Graduation rates at doctoral level, 2000 and 2011As a percentage of population in the reference age cohort
Source: OECD, based on OECD (2013), Education at a Glance 2013: OECDIndicators, and OECD Education Database, July 2013. See chapter notes.
1 2 http://dx.doi.org/10.1787/888932890789
0 1 2 3 4%
CHE
SWE
DEU
FIN
GBR
CHN
DNK
AUT
NZL
NOR
IRL
AUS
SVK
NLD
USA
SVN
FRA
BEL
CZE
KOR
ISR
PRT
ITA
EST
CAN
ESP
JPN
GRC
ISL
HUN
POL
BRA
RUS
TUR
MEX
CHL
ZAF
IDN
Percentage of doctoratedegrees awarded to women
43
47
45
51
45
46
45
42
50
46
49
49
51
44
53
46
47
43
43
43
32
51
57
53
52
44
47
30
38
44
47
52
51
47
45
46
42
42
40
2011 2000
OECD
Definitions
Doctoral graduates have attained the second stage ofuniversity education and obtained a degree at ISCED-97Level 6. They have successfully completed anadvanced research programme and gained anadvanced research qualification, e.g. a Ph.D. or equiva-lent. The fields of education correspond to thosedefined in the ISCED-97 classification.
Graduation rates represent the estimated percentage ofan age cohort that will complete a given level of edu-cation during their lifetime. These are calculated asnet graduation rates (i.e. as the sum of age-specificgraduation rates). Gross graduation rates are used forcountries that are unable to provide more detaileddata. The number of graduates, regardless of their age,is divided by the population at the typical age ofgraduation.
OECD SCIENCE, TECHNOLOGY AND INDUSTRY SCOREBOARD 2013 © OECD 201394
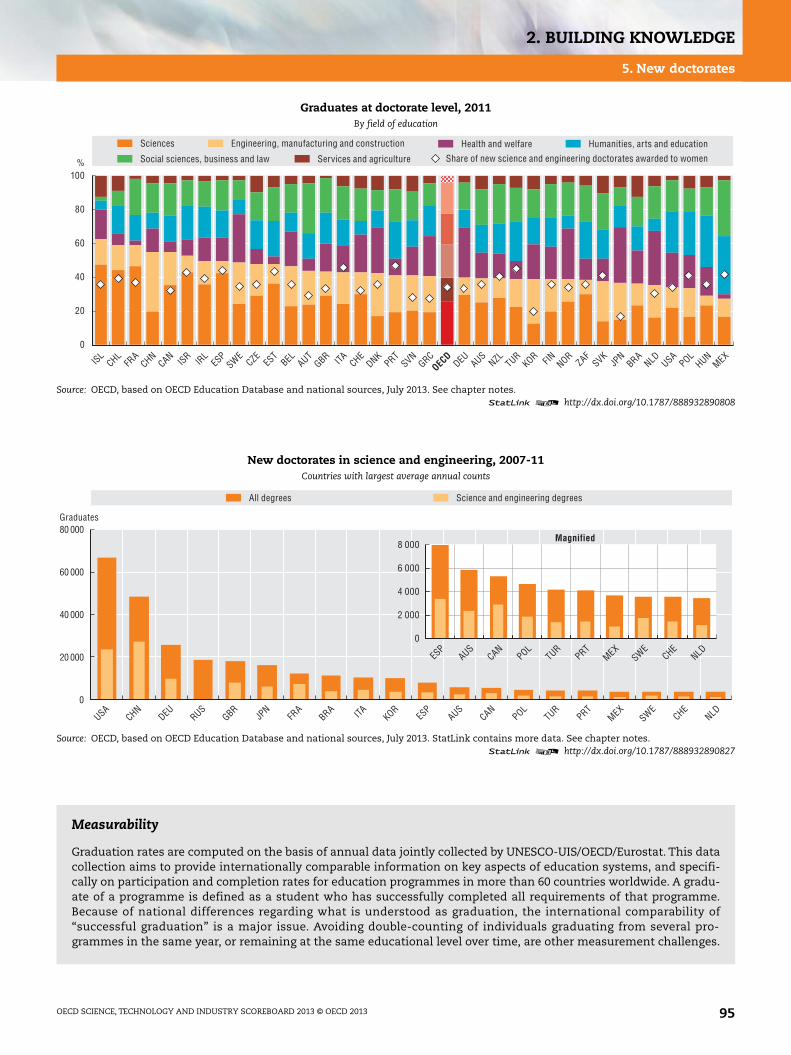
2. BUILDING KNOWLEDGE
5. New doctorates
Graduates at doctorate level, 2011By field of education
Source: OECD, based on OECD Education Database and national sources, July 2013. See chapter notes.1 2 http://dx.doi.org/10.1787/888932890808
New doctorates in science and engineering, 2007-11Countries with largest average annual counts
Source: OECD, based on OECD Education Database and national sources, July 2013. StatLink contains more data. See chapter notes.1 2 http://dx.doi.org/10.1787/888932890827
Measurability
Graduation rates are computed on the basis of annual data jointly collected by UNESCO-UIS/OECD/Eurostat. This datacollection aims to provide internationally comparable information on key aspects of education systems, and specifi-cally on participation and completion rates for education programmes in more than 60 countries worldwide. A gradu-ate of a programme is defined as a student who has successfully completed all requirements of that programme.Because of national differences regarding what is understood as graduation, the international comparability of“successful graduation” is a major issue. Avoiding double-counting of individuals graduating from several pro-grammes in the same year, or remaining at the same educational level over time, are other measurement challenges.
%100
80
60
20
40
0
ISLCHL
FRA
CHNCAN ISR IR
LES
PSWE
CZEES
TBEL AUT
GBR ITA CHEDNK
PRTSVN
GRCDEU AUS
NZL TURKOR FIN NOR
ZAFSVK
JPN
BRANLD USA
POLHUN
MEXOEC
D
Services and agricultureSocial sciences, business and law
Humanities, arts and educationHealth and welfareSciences Engineering, manufacturing and construction
Share of new science and engineering doctorates awarded to women
80 000
40 000
60 000
20 000
0
USACHN
DEU RUSGBR
JPN
FRA
BRA ITA KORES
PAUS
CANPOL
TURPRT
MEXSWE
CHENLD
8 000
2 000
4 000
6 000
0
ESP
AUSCAN
POLTUR
PRTMEX
SWECHE
NLD
All degrees Science and engineering degrees
Graduates
Magnified
OECD SCIENCE, TECHNOLOGY AND INDUSTRY SCOREBOARD 2013 © OECD 2013 95

2. BUILDING KNOWLEDGE
6. Doctorate holders
An economy’s ability to encourage research affects itscapacity to create new knowledge and stimulate innova-tion. Increasing specialisation and rapid growth in scien-tific production have made research professionals withadvanced research degrees a cornerstone of modernscience and innovation systems worldwide. There aremarked differences among countries in the share of indi-viduals with doctorates. Luxembourg and Switzerland havethe largest shares in the working age population, partlyowing to a relatively large share of foreign doctoral gradu-ates. Germany, the United States and the United Kingdomalso have high shares of doctoral graduates. The quality ofdoctoral training and the possibility of rewarding researchcareers are key factors in explaining these differences. Inmost countries, women account for less than 40% of thedoctoral population, but there are significant differences byfield of science.
A majority of doctorate holders follow academic careers inhigher education. In countries for which data are available,at least 50% work as researchers. While higher education isthe main institutional sector of employment for individu-als with a doctorate, they are becoming more prevalent inother sectors, particularly in countries with high R&Dintensity. Higher education accounts for a variable share ofdoctorates, from around one-third in the Netherlands,Denmark and Belgium, to nearly four-fifths in Poland andPortugal. The government and business sectors alternateas the second most important share. In Belgium, Denmarkand the United States, more than one out of threeemployed doctorate holders works in the business sector.
Doctorate holders in the working age population, 2009Per thousand population aged 25-64
Source: OECD, based on OECD/UNESCO Institute for Statistics/Eurostatdata collection on Careers of Doctorate Holders 2010; OECD MainScience and Technology Indicators and OECD Education AttainmentDatabase, June 2013. See chapter notes.
1 2 http://dx.doi.org/10.1787/888932890846
0 105 15 20 25 30‰
TUR
LVA
HRV
PRT
BLG
GRC
TWN
HUN
LTU
DNK
SVN
IRL
BEL
ESP
KOR
NOR
AUS
NLD
FRA
FIN
ISL
CAN
ISR
GBR
USA
DEU
CHE
LUX
Women Men
All doctorate holders(no breakdown between men andwomen)
Definitions
Doctorate holders are all residents of a country whohave completed the second stage of tertiary education(ISCED-97 level 6) leading to an advanced researchqualification. Researchers are defined as in the OECDFrascati Manual (OECD, 2002) as professionals engagedin the conception and creation of new knowledge,products, processes, methods and systems anddirectly involved in the management of the projectsconcerned. Employed doctorate holders are allocatedto the institutional sectors defined in the FrascatiManual. The higher education sector may include privateand public corporations, as well as private not-for-profitorganisations. Similarly, the business enterprise sectorincludes both public and private corporations. In somecountries, a considerable fraction of staff in hospitalsis included in the government sector.
OECD SCIENCE, TECHNOLOGY AND INDUSTRY SCOREBOARD 2013 © OECD 201396

2. BUILDING KNOWLEDGE
6. Doctorate holders
Doctorate holders working as researchers, 2009As a percentage of employed doctorate holders
Source: OECD, based on OECD/UNESCO Institute for Statistics/Eurostat data collection on careers of doctorate holders 2010, www.oecd.org/sti/cdh, June2013. See chapter notes.
1 2 http://dx.doi.org/10.1787/888932890865
Doctorate holders by sector of employment, 2009As a percentage of employed doctorate holders
Source: OECD, based on OECD/UNESCO Institute for Statistics/Eurostat data collection on careers of doctorate holders 2010, www.oecd.org/sti/cdh, June2013. See chapter notes.
1 2 http://dx.doi.org/10.1787/888932890884
Measurability
The Careers of Doctorate Holders (CDH) project is a joint initiative of the OECD, UNESCO Institute for Statistics and Eurostatto provide empirical evidence on the career path and performance of a population that plays a key role in generating anddiffusing new knowledge. The project has developed, with the help of an international expert group, a set of methodologi-cal guidelines, a model survey questionnaire and templates for output tables. Owing to the need for comprehensivenational registers of doctorate holders, some countries use alternative data sources such as censuses, registers or labourforce surveys as the main source. The use of different methodologies may affect the coverage of the target population, theavailability of certain variables or the international comparability of the data. For example, data for France, Japan and theUnited Kingdom are shown for recent doctoral graduates only. The project has used published tables and micro-data toaddress some of these challenges and to investigate structural issues concerning the careers, mobility, competencies andlabour market performance of doctorate holders. For more information see www.oecd.org/sti/cdh.
%100
60
80
40
POLNOR
ROUTUR
BELBGRHUN
SVNLT
UES
PHRV
LVA
GBRISRPRT
USANLDMLT JP
NFR
A
Researchers Unspecified Shares among women
Only recent doctorate graduates (three previous years)
%100
60
80
0
20
40
TURES
PNLDBELLV
ALT
UMLT HRV
HUNDNK
RUSROU
FRA
SVNTWN
PRTPOL
USAISLBGR
JPN
GBR
Higher education Government Business enterprise Other/Unknown Only recent doctorate graduates(three previous years)
OECD SCIENCE, TECHNOLOGY AND INDUSTRY SCOREBOARD 2013 © OECD 2013 97

2. BUILDING KNOWLEDGE
7. Researchers
R&D efforts in OECD and key partner economies rely onpersonnel engaged in R&D activities. The share of R&Dpersonnel in total employment, measured on a full-timeequivalent (FTE) basis, exceeds 2% in Iceland, Finland andDenmark, about twice the EU average of 1.1%. Employmentof R&D personnel has risen over the last decade, mainlyowing to an increase in the number of researchers relativeto technicians and other R&D personnel. The share ofresearchers in total R&D personnel varies widely, from 90%in Portugal to 40% in Switzerland.
The business enterprise and the higher education sectorsare the main employers of researchers. The former leadsthe latter in more than half of countries reporting esti-mates, and its share is above 60% in Korea, Japan, Austria,China, Denmark and Sweden. The sectoral distribution ofresearchers and R&D expenditures reveals that higher edu-cation is more researcher-intensive, owing to sectoral dif-ferences in the relative importance of non-labour costssuch as investment in R&D equipment. Higher educationinstitutions account for more than a third of researchers ina majority of countries.
Among countries for which data are available, the share ofwomen in the researcher population ranges from nearly45% in Portugal, the Slovak Republic and Estonia to lessthan 20% in Luxembourg and Germany. Higher education isthe main employer of female researchers, except inDenmark and Sweden, where a majority work in the busi-ness sector.
R&D personnel, 2001 and 2011Per thousand employment
Source: OECD, Main Science and Technology Indicators Database,www.oecd.org/sti/msti.htm, June 2013. See chapter notes.
1 2 http://dx.doi.org/10.1787/888932890903
0 84 12 16 20 24‰
ISL
FIN
DNK
SWE
SVN
KOR
FRA
AUT
NOR
CHE
JPN
DEU
LUX
BEL
CAN
AUS
IRL
RUS
NLD
ESP
GBR
PRT
CZE
NZL
EST
ITA
HUN
SVK
POL
TUR
CHN
ZAF
CHL
Researchers, 2011Total R&D personnel, 2001
Other R&D personnel, 2011
EU28
Definitions
Research and development personnel includes all personsemployed directly in R&D activities and thereforecovers technicians and support staff as well asresearchers. Researchers are defined as professionalsengaged in the conception and creation of new knowl-edge, products, processes, methods and systems andare directly involved in the management of projects.R&D personnel and researchers are represented infull-time equivalent units. A person working half-timeon R&D during the course of a given year is counted as0.5 person year in FTE. FTE data are a more accuratemeasure of the volume of human resources devoted toresearch in a country than headcounts or jobs. Forinternational comparison purposes, R&D personnelfigures are normalised by total employment asreported in the OECD National Accounts.
OECD SCIENCE, TECHNOLOGY AND INDUSTRY SCOREBOARD 2013 © OECD 201398

2. BUILDING KNOWLEDGE
7. Researchers
Researchers by sector of employment, 2011As a percentage of total researchers, full-time equivalent
Source: OECD, Research and Development Statistics Database, www.oecd.org/sti/rds, June 2013. See chapter notes.1 2 http://dx.doi.org/10.1787/888932890922
Female researchers by sector of employment, 2011As a percentage of female researchers, full-time equivalent
Source: OECD, Research and Development Statistics Database, www.oecd.org/sti/rds, June 2013. See chapter notes.1 2 http://dx.doi.org/10.1787/888932890941
Measurability
Production of internationally comparable estimates of R&D personnel is fraught with difficulties. These are a focus ofattention for the current revision of the Frascati Manual (OECD, 2002). For example, methods used to calculate FTE unitsmay vary not only from country to country but also across sectors within countries, owing to differences in the datasources used to estimate R&D in each sector. Estimating FTEs is particularly challenging in the higher education sec-tor, as many researchers typically engage in other activities, such as teaching or administrative tasks, some of whichare at the boundary of R&D. In the business sector, staff providing information on financial resources have difficultyanswering questions on R&D personnel, so that questionnaires need to be shared with human resource departmentswith limited information on the nature of R&D projects. At present, no reliable up-to-date estimates on R&D personneland its components are available for a number of OECD countries.
%100
60
80
0
40
20
JPN
NLD NORHUN
DEUSWEAUT
CANFR
ARUS
DNKCHN
SVKFINKORSVN
LUXIR
LNZL CHL
ZAFITATUR
CHE ISLAUS
CZEBEL ES
PGBR
EST
MEXPRT
POL
Higher education Private non-profitBusiness enterprise Government
Share of business enterprise in total R&D expenditures
%100
60
80
0
20
40
TURES
PDNK
BEL IRL
EST
ZAFITA HUN
SWELU
XSVN
SVKPRT
POLCZEISL
CHLAUT
DEU
Higher educationGovernmentBusiness enterprise Private non-profit Share of female researchers
OECD SCIENCE, TECHNOLOGY AND INDUSTRY SCOREBOARD 2013 © OECD 2013 99
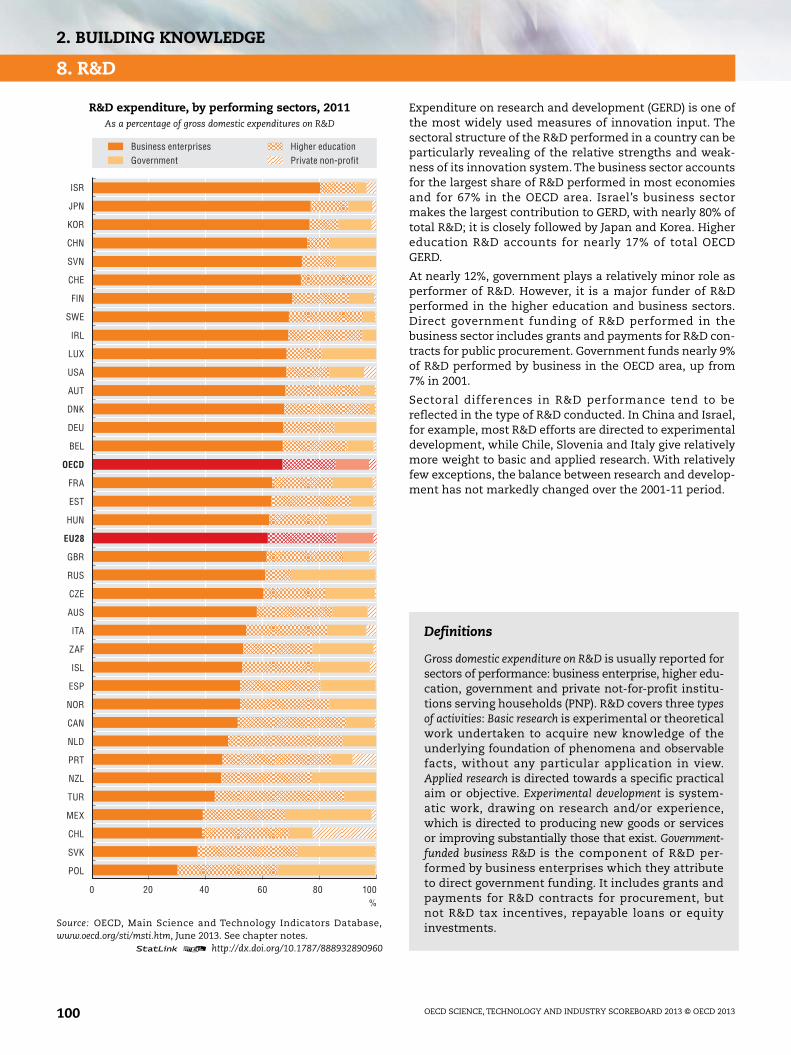
2. BUILDING KNOWLEDGE
8. R&D
Expenditure on research and development (GERD) is one ofthe most widely used measures of innovation input. Thesectoral structure of the R&D performed in a country can beparticularly revealing of the relative strengths and weak-ness of its innovation system. The business sector accountsfor the largest share of R&D performed in most economiesand for 67% in the OECD area. Israel’s business sectormakes the largest contribution to GERD, with nearly 80% oftotal R&D; it is closely followed by Japan and Korea. Highereducation R&D accounts for nearly 17% of total OECDGERD.
At nearly 12%, government plays a relatively minor role asperformer of R&D. However, it is a major funder of R&Dperformed in the higher education and business sectors.Direct government funding of R&D performed in thebusiness sector includes grants and payments for R&D con-tracts for public procurement. Government funds nearly 9%of R&D performed by business in the OECD area, up from7% in 2001.
Sectoral differences in R&D performance tend to bereflected in the type of R&D conducted. In China and Israel,for example, most R&D efforts are directed to experimentaldevelopment, while Chile, Slovenia and Italy give relativelymore weight to basic and applied research. With relativelyfew exceptions, the balance between research and develop-ment has not markedly changed over the 2001-11 period.
R&D expenditure, by performing sectors, 2011As a percentage of gross domestic expenditures on R&D
Source: OECD, Main Science and Technology Indicators Database,www.oecd.org/sti/msti.htm, June 2013. See chapter notes.
1 2 http://dx.doi.org/10.1787/888932890960
0 20 40 60 80 100%
POL
SVK
CHL
MEX
TUR
NZL
PRT
NLD
CAN
NOR
ESP
ISL
ZAF
ITA
AUS
CZE
RUS
GBR
HUN
EST
FRA
BEL
DEU
DNK
AUT
USA
LUX
IRL
SWE
FIN
CHE
SVN
CHN
KOR
JPN
ISR
Business enterprises Higher educationGovernment Private non-profit
OECD
EU28
Definitions
Gross domestic expenditure on R&D is usually reported forsectors of performance: business enterprise, higher edu-cation, government and private not-for-profit institu-tions serving households (PNP). R&D covers three typesof activities: Basic research is experimental or theoreticalwork undertaken to acquire new knowledge of theunderlying foundation of phenomena and observablefacts, without any particular application in view.Applied research is directed towards a specific practicalaim or objective. Experimental development is system-atic work, drawing on research and/or experience,which is directed to producing new goods or servicesor improving substantially those that exist. Government-funded business R&D is the component of R&D per-formed by business enterprises which they attributeto direct government funding. It includes grants andpayments for R&D contracts for procurement, butnot R&D tax incentives, repayable loans or equityinvestments.
OECD SCIENCE, TECHNOLOGY AND INDUSTRY SCOREBOARD 2013 © OECD 2013100
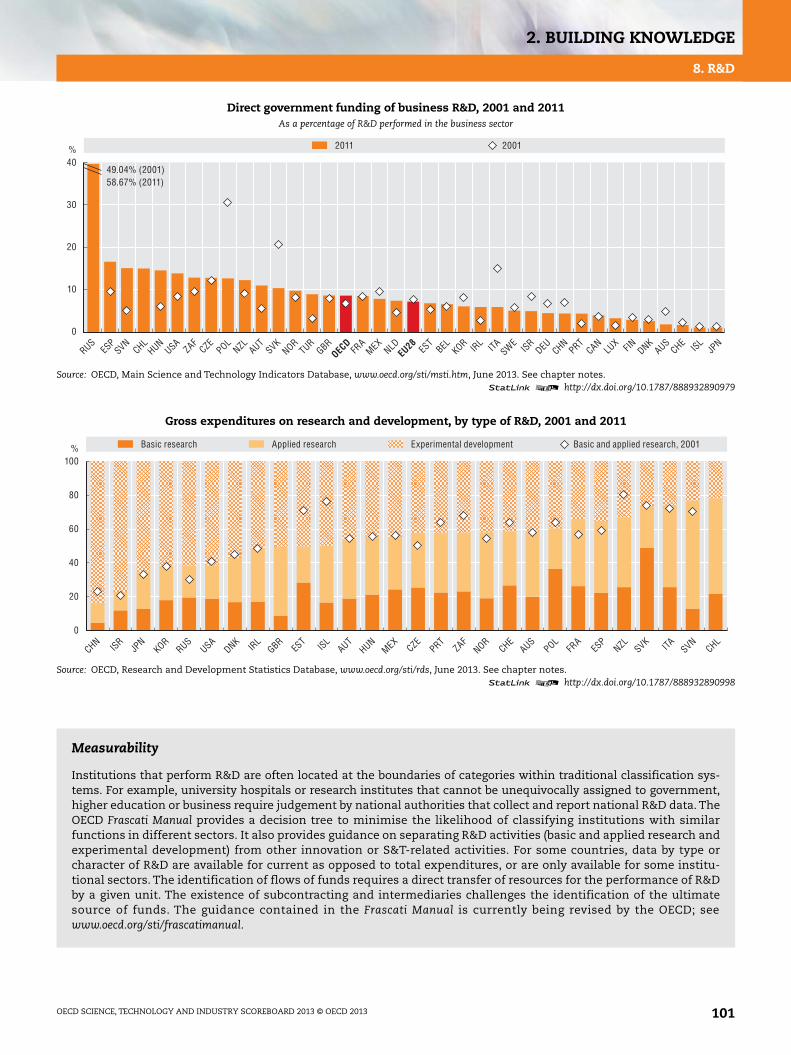
2. BUILDING KNOWLEDGE
8. R&D
Direct government funding of business R&D, 2001 and 2011As a percentage of R&D performed in the business sector
Source: OECD, Main Science and Technology Indicators Database, www.oecd.org/sti/msti.htm, June 2013. See chapter notes.1 2 http://dx.doi.org/10.1787/888932890979
Gross expenditures on research and development, by type of R&D, 2001 and 2011
Source: OECD, Research and Development Statistics Database, www.oecd.org/sti/rds, June 2013. See chapter notes.1 2 http://dx.doi.org/10.1787/888932890998
Measurability
Institutions that perform R&D are often located at the boundaries of categories within traditional classification sys-tems. For example, university hospitals or research institutes that cannot be unequivocally assigned to government,higher education or business require judgement by national authorities that collect and report national R&D data. TheOECD Frascati Manual provides a decision tree to minimise the likelihood of classifying institutions with similarfunctions in different sectors. It also provides guidance on separating R&D activities (basic and applied research andexperimental development) from other innovation or S&T-related activities. For some countries, data by type orcharacter of R&D are available for current as opposed to total expenditures, or are only available for some institu-tional sectors. The identification of flows of funds requires a direct transfer of resources for the performance of R&Dby a given unit. The existence of subcontracting and intermediaries challenges the identification of the ultimatesource of funds. The guidance contained in the Frascati Manual is currently being revised by the OECD; seewww.oecd.org/sti/frascatimanual.
%40
49.04% (2001)58.67% (2011)
10
20
30
0
ESP
TURFR
AGBR
NZLUSASVN
ZAFPOL
HUNCHL
MEXNLDAUT
RUSNOR
SVKCZE
JPN
EST
BEL KOR IRL ITA SWE
ISRDEU CHN
PRTCAN
LUX FIN DNK
AUSCHE ISL
2011 2001
OECD
EU28
%100
60
80
0
20
40
EST
RUSPRTISL
HUNJP
NKOR
GBRMEX
CZECHE
IRL
ISRCHN
USAZAF
DNKAUT
NORAUS
POLFR
AES
PNZL SVK ITA SVN
CHL
Basic research Applied research Experimental development Basic and applied research, 2001
OECD SCIENCE, TECHNOLOGY AND INDUSTRY SCOREBOARD 2013 © OECD 2013 101
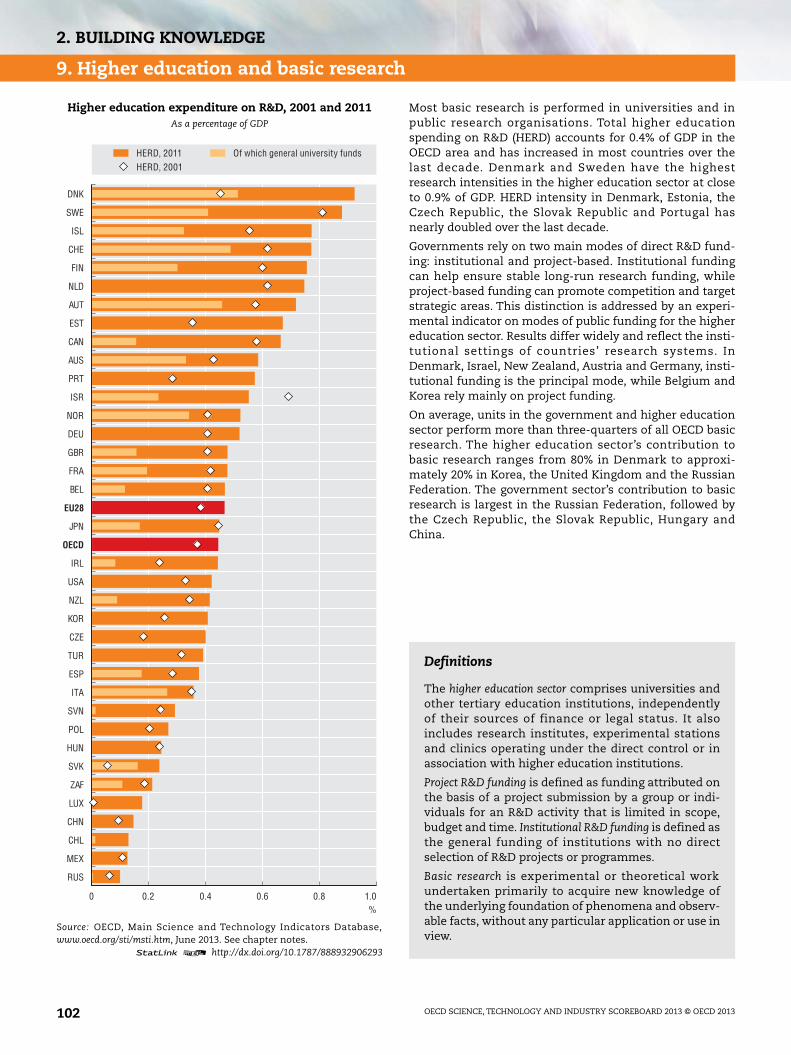
2. BUILDING KNOWLEDGE
9. Higher education and basic research
Most basic research is performed in universities and inpublic research organisations. Total higher educationspending on R&D (HERD) accounts for 0.4% of GDP in theOECD area and has increased in most countries over thelast decade. Denmark and Sweden have the highestresearch intensities in the higher education sector at closeto 0.9% of GDP. HERD intensity in Denmark, Estonia, theCzech Republic, the Slovak Republic and Portugal hasnearly doubled over the last decade.
Governments rely on two main modes of direct R&D fund-ing: institutional and project-based. Institutional fundingcan help ensure stable long-run research funding, whileproject-based funding can promote competition and targetstrategic areas. This distinction is addressed by an experi-mental indicator on modes of public funding for the highereducation sector. Results differ widely and reflect the insti-tutional settings of countries’ research systems. InDenmark, Israel, New Zealand, Austria and Germany, insti-tutional funding is the principal mode, while Belgium andKorea rely mainly on project funding.
On average, units in the government and higher educationsector perform more than three-quarters of all OECD basicresearch. The higher education sector’s contribution tobasic research ranges from 80% in Denmark to approxi-mately 20% in Korea, the United Kingdom and the RussianFederation. The government sector’s contribution to basicresearch is largest in the Russian Federation, followed bythe Czech Republic, the Slovak Republic, Hungary andChina.
Higher education expenditure on R&D, 2001 and 2011As a percentage of GDP
Source: OECD, Main Science and Technology Indicators Database,www.oecd.org/sti/msti.htm, June 2013. See chapter notes.
1 2 http://dx.doi.org/10.1787/888932906293
0 0.40.2 0.6 0.8 1.0%
DNK
SWE
ISL
CHE
FIN
NLD
AUT
EST
CAN
AUS
PRT
ISR
NOR
DEU
GBR
FRA
BEL
JPN
IRL
USA
NZL
KOR
CZE
TUR
ESP
ITA
SVN
POL
HUN
SVK
ZAF
LUX
CHN
CHL
MEX
RUS
HERD, 2011HERD, 2001
Of which general university funds
EU28
OECD
Definitions
The higher education sector comprises universities andother tertiary education institutions, independentlyof their sources of finance or legal status. It alsoincludes research institutes, experimental stationsand clinics operating under the direct control or inassociation with higher education institutions.
Project R&D funding is defined as funding attributed onthe basis of a project submission by a group or indi-viduals for an R&D activity that is limited in scope,budget and time. Institutional R&D funding is defined asthe general funding of institutions with no directselection of R&D projects or programmes.
Basic research is experimental or theoretical workundertaken primarily to acquire new knowledge ofthe underlying foundation of phenomena and observ-able facts, without any particular application or use inview.
OECD SCIENCE, TECHNOLOGY AND INDUSTRY SCOREBOARD 2013 © OECD 2013102

2. BUILDING KNOWLEDGE
9. Higher education and basic research
Government funding of R&D in higher education, by type of funding, 2010As a percentage of national funding of domestic R&D
Note: This is an experimental indicator. International comparability is currently limited.Source: OECD, based on data collected from national authorities in 2010 and 2013. See chapter notes.
1 2 http://dx.doi.org/10.1787/888932891017
Basic research performed in the higher education and government sectors, 2011As a percentage of domestic expenditures on basic research
Source: OECD, Research and Development Statistics Database, www.oecd.org/sti/rds, June 2013. See chapter notes.1 2 http://dx.doi.org/10.1787/888932891036
Measurability
The higher education sector is not a formal sector in the System of National Accounts (SNA). It is separately identified bythe OECD and other organisations because of the important and specific role played by universities and related insti-tutions in the performance of R&D and the training of researchers (doctorates and other research degrees). Measurementof higher education R&D (HERD) relies on dedicated institutional surveys in most OECD countries, and it is particularlysensitive to institutional differences that influence the data that universities and departments are able to provide.
Project-based funding to higher education includes national R&D contracts, while institutional funding to higher educa-tion includes general university funds (GUF) and other institutional funds. The OECD project on modes of public fund-ing of R&D has been developing new indicators by exploiting existing budget data. As part of the ongoing revision ofthe Frascati Manual, a number of options for updating recommendations are being considered in order to improve themeasurement of higher education R&D and government funding of R&D across the whole economy.
%100
60
80
0
40
20
CZEAUS
CANDEUDNK
ISRAUT
POLKOR
NLD NORCHE
NZL IRL
BEL
Government funded, institution-based Government funded, project-based
%100
60
80
0
20
40
CHLISR
CHNPRT
ESP
NORES
TFR
ANZL AUT
USACHE
IRL
DNK ISLSVK
AUT ITA POLZAF
JPN
MEXHUN
CZEGBR
SVNKOR
RUS
Higher education Government
OECD SCIENCE, TECHNOLOGY AND INDUSTRY SCOREBOARD 2013 © OECD 2013 103
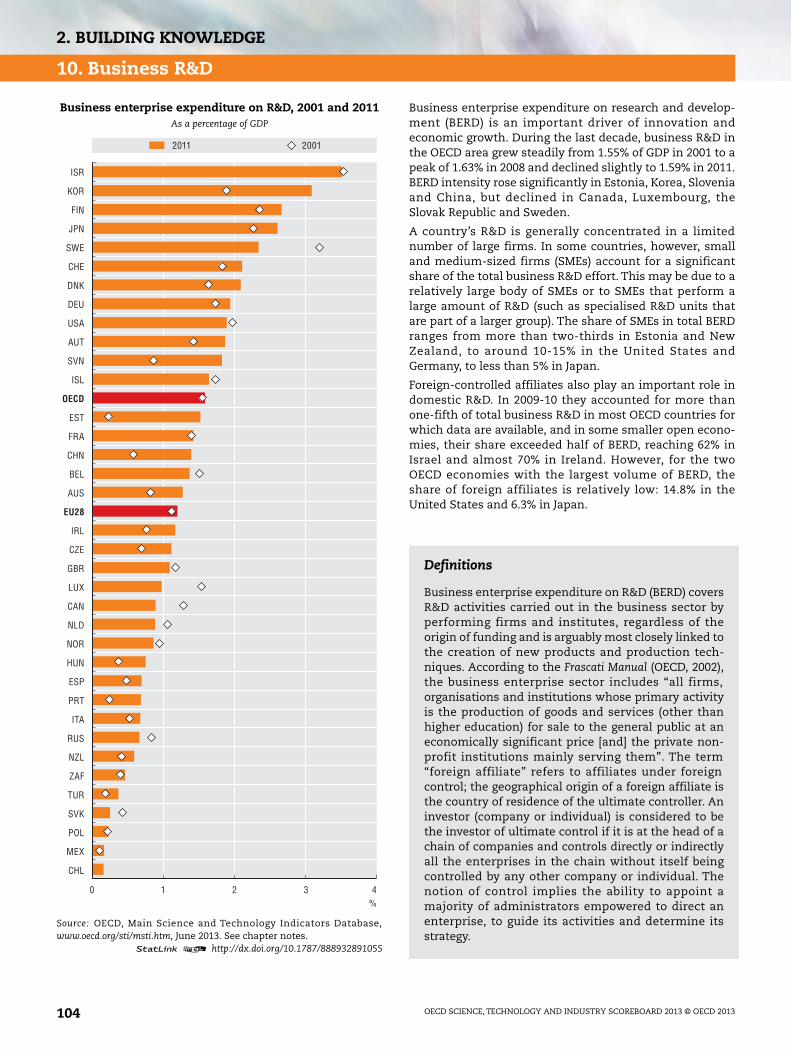
2. BUILDING KNOWLEDGE
10. Business R&D
Business enterprise expenditure on research and develop-ment (BERD) is an important driver of innovation andeconomic growth. During the last decade, business R&D inthe OECD area grew steadily from 1.55% of GDP in 2001 to apeak of 1.63% in 2008 and declined slightly to 1.59% in 2011.BERD intensity rose significantly in Estonia, Korea, Sloveniaand China, but declined in Canada, Luxembourg, theSlovak Republic and Sweden.
A country’s R&D is generally concentrated in a limitednumber of large firms. In some countries, however, smalland medium-sized firms (SMEs) account for a significantshare of the total business R&D effort. This may be due to arelatively large body of SMEs or to SMEs that perform alarge amount of R&D (such as specialised R&D units thatare part of a larger group). The share of SMEs in total BERDranges from more than two-thirds in Estonia and NewZealand, to around 10-15% in the United States andGermany, to less than 5% in Japan.
Foreign-controlled affiliates also play an important role indomestic R&D. In 2009-10 they accounted for more thanone-fifth of total business R&D in most OECD countries forwhich data are available, and in some smaller open econo-mies, their share exceeded half of BERD, reaching 62% inIsrael and almost 70% in Ireland. However, for the twoOECD economies with the largest volume of BERD, theshare of foreign affiliates is relatively low: 14.8% in theUnited States and 6.3% in Japan.
Business enterprise expenditure on R&D, 2001 and 2011As a percentage of GDP
Source: OECD, Main Science and Technology Indicators Database,www.oecd.org/sti/msti.htm, June 2013. See chapter notes.
1 2 http://dx.doi.org/10.1787/888932891055
0 21 3 4%
ISR
KOR
FIN
JPN
SWE
CHE
DNK
DEU
USA
AUT
SVN
ISL
EST
FRA
CHN
BEL
AUS
IRL
CZE
GBR
LUX
CAN
NLD
NOR
HUN
ESP
PRT
ITA
RUS
NZL
ZAF
TUR
SVK
POL
MEX
CHL
2011 2001
OECD
EU28
Definitions
Business enterprise expenditure on R&D (BERD) coversR&D activities carried out in the business sector byperforming firms and institutes, regardless of theorigin of funding and is arguably most closely linked tothe creation of new products and production tech-niques. According to the Frascati Manual (OECD, 2002),the business enterprise sector includes “all firms,organisations and institutions whose primary activityis the production of goods and services (other thanhigher education) for sale to the general public at aneconomically significant price [and] the private non-profit institutions mainly serving them”. The term“foreign affiliate” refers to affiliates under foreigncontrol; the geographical origin of a foreign affiliate isthe country of residence of the ultimate controller. Aninvestor (company or individual) is considered to bethe investor of ultimate control if it is at the head of achain of companies and controls directly or indirectlyall the enterprises in the chain without itself beingcontrolled by any other company or individual. Thenotion of control implies the ability to appoint amajority of administrators empowered to direct anenterprise, to guide its activities and determine itsstrategy.
OECD SCIENCE, TECHNOLOGY AND INDUSTRY SCOREBOARD 2013 © OECD 2013104
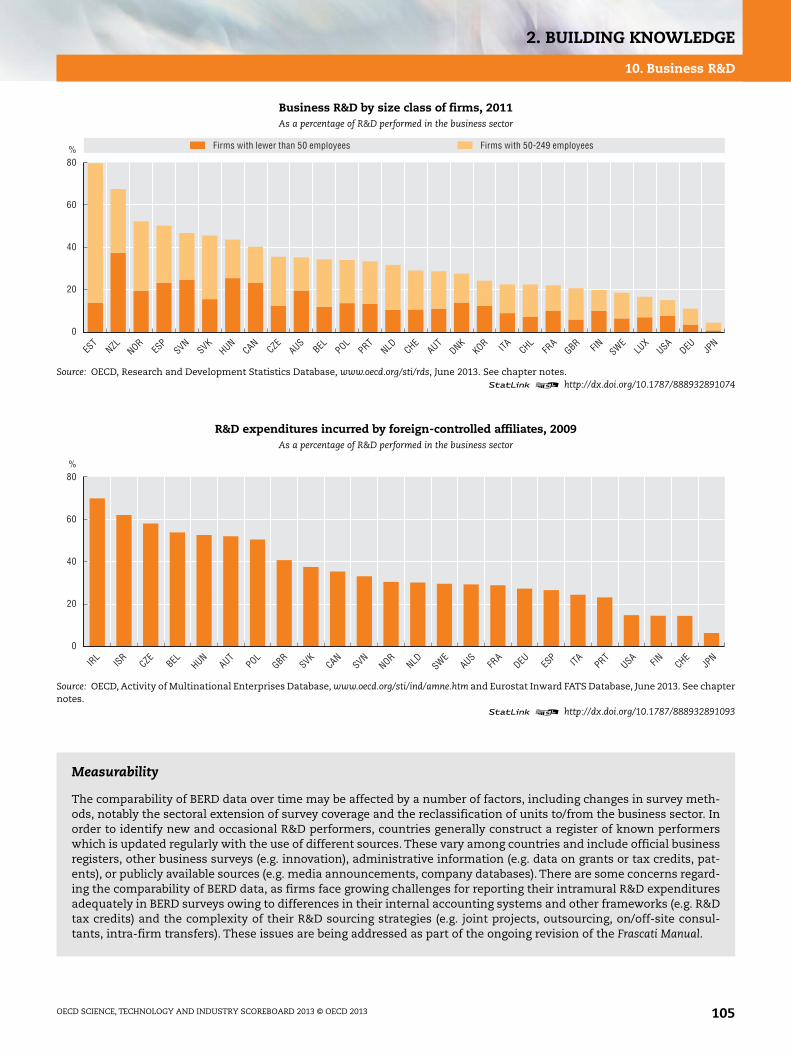
2. BUILDING KNOWLEDGE
10. Business R&D
Business R&D by size class of firms, 2011As a percentage of R&D performed in the business sector
Source: OECD, Research and Development Statistics Database, www.oecd.org/sti/rds, June 2013. See chapter notes.1 2 http://dx.doi.org/10.1787/888932891074
R&D expenditures incurred by foreign-controlled affiliates, 2009As a percentage of R&D performed in the business sector
Source: OECD, Activity of Multinational Enterprises Database, www.oecd.org/sti/ind/amne.htm and Eurostat Inward FATS Database, June 2013. See chapternotes.
1 2 http://dx.doi.org/10.1787/888932891093
Measurability
The comparability of BERD data over time may be affected by a number of factors, including changes in survey meth-ods, notably the sectoral extension of survey coverage and the reclassification of units to/from the business sector. Inorder to identify new and occasional R&D performers, countries generally construct a register of known performerswhich is updated regularly with the use of different sources. These vary among countries and include official businessregisters, other business surveys (e.g. innovation), administrative information (e.g. data on grants or tax credits, pat-ents), or publicly available sources (e.g. media announcements, company databases). There are some concerns regard-ing the comparability of BERD data, as firms face growing challenges for reporting their intramural R&D expendituresadequately in BERD surveys owing to differences in their internal accounting systems and other frameworks (e.g. R&Dtax credits) and the complexity of their R&D sourcing strategies (e.g. joint projects, outsourcing, on/off-site consul-tants, intra-firm transfers). These issues are being addressed as part of the ongoing revision of the Frascati Manual.
%80
60
20
40
0
JPN
DEUUSALU
XSWEFINGBR
FRA
CHLITAKORDNK
AUTNLDPRT
POLBELAUS
CZECAN
HUNSVK
SVNES
PNZL NOR
EST
CHE
Firms with lewer than 50 employees Firms with 50-249 employees
%80
60
20
40
0
IRL
ISRCZE
BEL HUNAUT
POLGBR
SVKCAN
SVNNOR
NLD SWEAUS
FRA
DEU ESP ITA PRT
USA FIN CHEJP
N
OECD SCIENCE, TECHNOLOGY AND INDUSTRY SCOREBOARD 2013 © OECD 2013 105

2. BUILDING KNOWLEDGE
11. R&D tax incentives
In addition to providing grants, contracts and loans, manygovernments contribute to business R&D through taxincentives. In 2013, 27 OECD countries gave preferential taxtreatment to business R&D expenditures. In 2011, theRussian Federation, Korea, France and Slovenia providedthe most combined support for business R&D as a percent-age of GDP. R&D tax credits were worth USD 8.3 billion inthe United States, followed by France and China.
Over 2006-11, the importance of tax incentives vis-à-visdirect support increased in 11 out of 23 countries for whichcomplete data are available. Their share of support fell inmany countries owing to the crisis-driven decline in busi-ness R&D. Mexico and New Zealand abolished their taxincentives but Finland introduced them in 2013. Fallingprofits at the outset of the economic crisis also reducedfirms’ ability to claim incentives.
National differences in the cost of R&D tax incentivesreflect eligibility rules and their use by firms, whichdepends not only on R&D spending but also on profitability.Effective tax subsidy rates are influenced by business char-acteristics. Australia, Canada, France, Japan, Korea, theNetherlands, Norway and Portugal give more generoustreatment to SMEs relative to large firms. Some countriesallow firms to benefit from tax incentives when they arenot profitable enough to use them in the current period,but few do so to a significant extent. In Austria and Norway,refunds by authorities effectively allow such firms to bene-fit from incentives as if they were profitable. Refunds andcarry-forward provisions are sometimes used to promoteR&D in firms that could not otherwise use their credits orallowances. Such provisions tend to be more generous forSMEs and younger firms, as in Australia, France and theUnited Kingdom.
Direct government funding of business R&D and taxincentives for R&D, 2011
As a percentage of GDP
Note: This is an experimental indicator. International comparability maybe limited. For more information, see www.oecd.org/sti/rd-tax-stats.htm.Source: OECD, based on OECD R&D tax incentives questionnaire, publiclyavailable sources, and OECD, Main Science and Technology IndicatorsDatabase, www.oecd.org/sti/msti.htm, June 2013. See chapter notes.
1 2 http://dx.doi.org/10.1787/888932891112
0 0.20.1 0.3 0.4 0.5%
MEX
CHL
AUS
POL
CHE
SVK
TUR
JPN
PRT
LUX
ITA
ZAF
NLD
CAN
CHN
DNK
IRL
NZL
FIN
NOR
DEU
GBR
BEL
EST
BRA
AUT
HUN
SWE
ESP
FRA
CZE
ISR
KOR
USA
SVN
RUS
Indirect government support through R&D tax incentivesData on tax incentive support not available
Direct government funding of BERD
Definitions
Tax incentives for business R&D expenditures includeallowances and credits, as well as other forms ofadvantageous tax treatment such as allowing for theaccelerated depreciation of R&D capital expenditures.Estimates here exclude income-based incentives –preferential treatment of incomes from licensing orasset disposal attributable to R&D or patents – andincentives to taxpayers other than companies. Figuresrefer to incentives applied at a national level throughcorporate income taxes, employer social security con-tributions and withholding taxes for R&D personnel.Personal and consumption tax incentives are notincluded. While typically non-discretionary, somecountries require pre-approval of R&D projects oraccreditation by government agencies or third parties.
The tax subsidy rate is 1 minus the B index, a measureof the before-tax income needed to break even onUSD 1 of R&D outlays (Warda, 2001).
OECD SCIENCE, TECHNOLOGY AND INDUSTRY SCOREBOARD 2013 © OECD 2013106

2. BUILDING KNOWLEDGE
11. R&D tax incentives
Change in government support for business R&D through direct funding and tax incentives, 2006-11As a percentage of total support, and annualised growth rates in constant PPPs
Note: This is an experimental indicator. International comparability may be limited. For more information, see www.oecd.org/sti/rd-tax-stats.htm.Source: OECD, based on OECD R&D tax incentives questionnaires, January 2010, June 2011 and June 2013, publicly available sources, and OECD, MainScience and Technology Indicators Database, www.oecd.org/sti/msti.htm, June 2013. See chapter notes.
1 2 http://dx.doi.org/10.1787/888932891131
Tax subsidy rates on R&D expenditures, 20131-B index, by firm size and profit scenario
Note: This is an experimental indicator. International comparability may be limited. For more information, see www.oecd.org/sti/rd-tax-stats.htm.Source: OECD, based on OECD R&D tax incentives questionnaire and publicly available sources, June 2013. See chapter notes.
1 2 http://dx.doi.org/10.1787/888932891150
Measurability
There are several ways to measure the value of R&D tax provisions. Tax expenditures are deviations from a benchmark taxsystem (OECD, 2010) and countries use different national benchmarks. The 2013 OECD questionnaire adopted a commonreference framework based on full deductibility of current R&D expenditures and a country’s baseline treatment of capitalinvestments. Available estimates are typically in terms of initial revenue loss, with no or minimal adjustments for behav-iour effects. Some only report claims realised in a given year, while others report losses to government on an accrual basis,excluding claims referring to earlier periods and including claims for current R&D to be used in the future.
The B-index traditionally assumes that the “representative firm” is taxable and enjoys the incentive’s full benefit. Anadjusted B-index is reported for a firm unable to claim tax benefits in the reporting period. When credits or allowancesare fully refundable, the B-index of a company in such position is identical to the profit scenario. Carry-forwards aremodelled as discounted options to claim the incentive in the future, assuming a constant annual probability of returningto profit of 50% and a nominal discount rate of 10%.
% %100
90
70
20
80
60
50
40
30
10
0
100
60
0
20
-40
80
40
-20
-80
-60
-100
CANAUS
NLD PRTIR
LJP
NFR
ABEL TUR
KORAUT
DNKGBR
HUNZAF
NORCZE
ESP
USASVN ITA MEX
NZL
Tax incentive share of government funds for R&D, 2006
Direct funding, annual growth rate, 2006-11 (right-hand scale)
Tax incentive share of government funds for R&D, 2011
Tax incentive support, annual growth rate, 2006-11 (right-hand scale)
R&D tax incentives abolished
0.7
0.6
0.1
0.5
0.4
0.3
0.2
0
-0.1
PRTFR
AES
PCHL
NLD CANHUN IR
L FIN GBRBRA
KORNOR
ZAFCZE
AUSSVN
BEL JPN
CHNAUT
USAPOL
DNKLU
XMEX
SVKSWE
CHEDEU NZL
SME, profitable firmLarge, profitable firm Large, loss-making firm SME, loss-making firm
1-B index
OECD SCIENCE, TECHNOLOGY AND INDUSTRY SCOREBOARD 2013 © OECD 2013 107
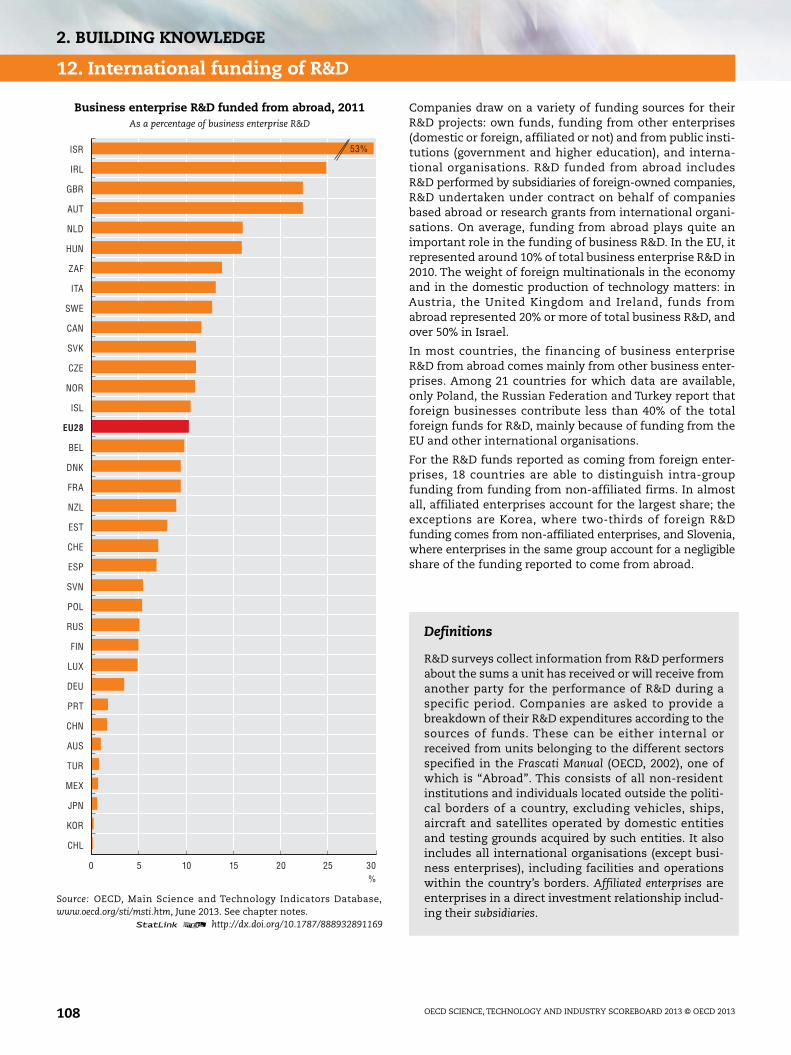
2. BUILDING KNOWLEDGE
12. International funding of R&D
Companies draw on a variety of funding sources for theirR&D projects: own funds, funding from other enterprises(domestic or foreign, affiliated or not) and from public insti-tutions (government and higher education), and interna-tional organisations. R&D funded from abroad includesR&D performed by subsidiaries of foreign-owned companies,R&D undertaken under contract on behalf of companiesbased abroad or research grants from international organi-sations. On average, funding from abroad plays quite animportant role in the funding of business R&D. In the EU, itrepresented around 10% of total business enterprise R&D in2010. The weight of foreign multinationals in the economyand in the domestic production of technology matters: inAustria, the United Kingdom and Ireland, funds fromabroad represented 20% or more of total business R&D, andover 50% in Israel.
In most countries, the financing of business enterpriseR&D from abroad comes mainly from other business enter-prises. Among 21 countries for which data are available,only Poland, the Russian Federation and Turkey report thatforeign businesses contribute less than 40% of the totalforeign funds for R&D, mainly because of funding from theEU and other international organisations.
For the R&D funds reported as coming from foreign enter-prises, 18 countries are able to distinguish intra-groupfunding from funding from non-affiliated firms. In almostall, affiliated enterprises account for the largest share; theexceptions are Korea, where two-thirds of foreign R&Dfunding comes from non-affiliated enterprises, and Slovenia,where enterprises in the same group account for a negligibleshare of the funding reported to come from abroad.
Business enterprise R&D funded from abroad, 2011As a percentage of business enterprise R&D
Source: OECD, Main Science and Technology Indicators Database,www.oecd.org/sti/msti.htm, June 2013. See chapter notes.
1 2 http://dx.doi.org/10.1787/888932891169
0 10 15 205 25 30%
CHL
KOR
JPN
MEX
TUR
AUS
CHN
PRT
DEU
LUX
FIN
RUS
POL
SVN
ESP
CHE
EST
NZL
FRA
DNK
BEL
ISL
NOR
CZE
SVK
CAN
SWE
ITA
ZAF
HUN
NLD
AUT
GBR
IRL
ISR 53%
EU28
Definitions
R&D surveys collect information from R&D performersabout the sums a unit has received or will receive fromanother party for the performance of R&D during aspecific period. Companies are asked to provide abreakdown of their R&D expenditures according to thesources of funds. These can be either internal orreceived from units belonging to the different sectorsspecified in the Frascati Manual (OECD, 2002), one ofwhich is “Abroad”. This consists of all non-residentinstitutions and individuals located outside the politi-cal borders of a country, excluding vehicles, ships,aircraft and satellites operated by domestic entitiesand testing grounds acquired by such entities. It alsoincludes all international organisations (except busi-ness enterprises), including facilities and operationswithin the country’s borders. Affiliated enterprises areenterprises in a direct investment relationship includ-ing their subsidiaries.
OECD SCIENCE, TECHNOLOGY AND INDUSTRY SCOREBOARD 2013 © OECD 2013108
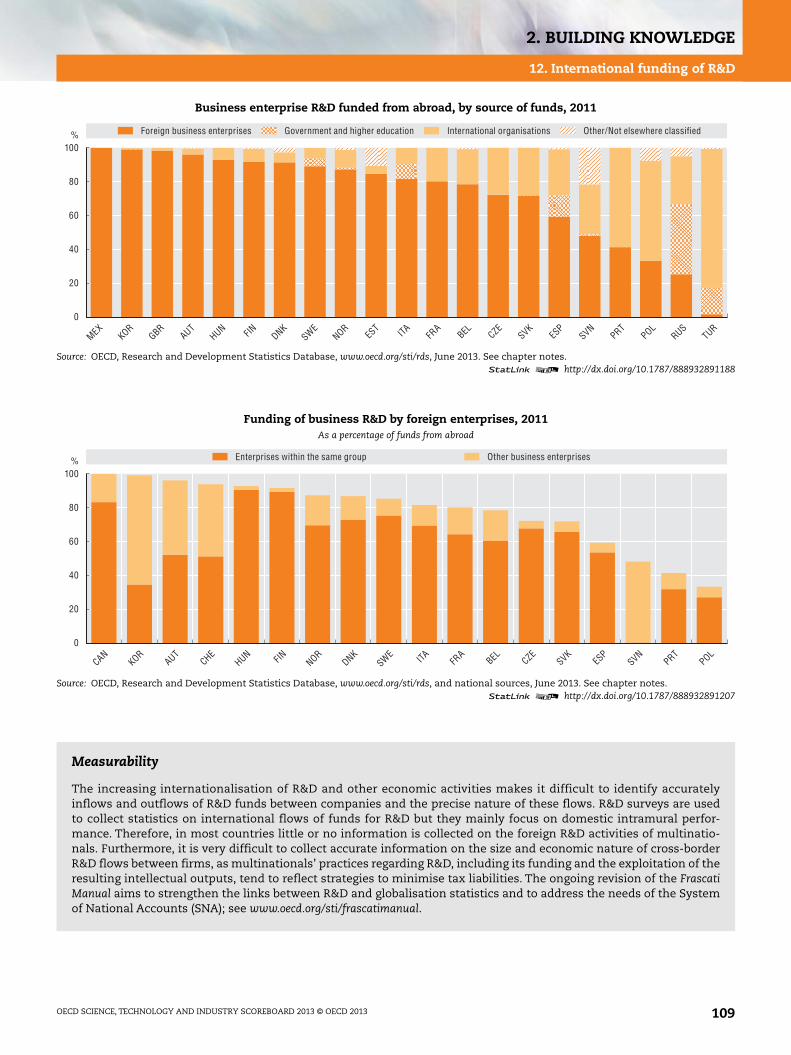
2. BUILDING KNOWLEDGE
12. International funding of R&D
Business enterprise R&D funded from abroad, by source of funds, 2011
Source: OECD, Research and Development Statistics Database, www.oecd.org/sti/rds, June 2013. See chapter notes.1 2 http://dx.doi.org/10.1787/888932891188
Funding of business R&D by foreign enterprises, 2011As a percentage of funds from abroad
Source: OECD, Research and Development Statistics Database, www.oecd.org/sti/rds, and national sources, June 2013. See chapter notes.1 2 http://dx.doi.org/10.1787/888932891207
Measurability
The increasing internationalisation of R&D and other economic activities makes it difficult to identify accuratelyinflows and outflows of R&D funds between companies and the precise nature of these flows. R&D surveys are usedto collect statistics on international flows of funds for R&D but they mainly focus on domestic intramural perfor-mance. Therefore, in most countries little or no information is collected on the foreign R&D activities of multinatio-nals. Furthermore, it is very difficult to collect accurate information on the size and economic nature of cross-borderR&D flows between firms, as multinationals’ practices regarding R&D, including its funding and the exploitation of theresulting intellectual outputs, tend to reflect strategies to minimise tax liabilities. The ongoing revision of the FrascatiManual aims to strengthen the links between R&D and globalisation statistics and to address the needs of the Systemof National Accounts (SNA); see www.oecd.org/sti/frascatimanual.
%100
60
80
0
20
40
MEXKOR
GBRAUT
HUN FIN DNKSWE
NORES
T ITA FRA
BEL CZESVK
ESP
SVNPOL
RUSTUR
PRT
Foreign business enterprises Government and higher education International organisations Other/Not elsewhere classified
%100
60
80
0
20
40
CANKOR
AUTCHE
HUN FIN NORDNK
SWE ITA FRA
BEL CZESVK
ESP
SVNPRT
POL
Enterprises within the same group Other business enterprises
OECD SCIENCE, TECHNOLOGY AND INDUSTRY SCOREBOARD 2013 © OECD 2013 109

2. BUILDING KNOWLEDGE
Notes and References
2.1. Investment in knowledge
Spending on higher education, 2000 and 2010
Estimates for Canada refer to 2009. Estimates for Chile refer to 2011.
Estimates for Brazil, Canada, Hungary, Ireland, Italy, Poland, Portugal and Switzerland refer to public institutions only.
Core educational services include all expenditures directly related to instruction: all expenditures on teachers, school build-ings, teaching materials, books, and administration of schools. Other expenditures include ancillary education expendi-tures, such as housing, meals and transport provided by institutions, and R&D expenditures at higher educationinstitutions. The breakdown of total expenditures is not available for Argentina, Denmark, Iceland, Japan and the RussianFederation.
Gross domestic expenditure on R&D, 2001 and 2011
For Australia, data refer to 2002 and 2010 instead of 2001 and 2011.
For Chile and the Netherlands, data refer to 2010 instead of 2011.
For Iceland and South Africa, data refer to 2009 instead of 2011.
For Luxembourg, data refer to 2000 instead of 2001.
For Switzerland, data refer to 2000 and 2008 instead of 2001 and 2011.
ICT Investment by asset, 2000 and 2011
For Australia, data refer to 2008.
For Denmark and the United Kingdom, data refer to 2009.
For Ireland, Japan, New Zealand, Portugal and Switzerland data refer to 2010.
For the Slovak Republic, data refer to 2004 instead of 2000.
For Denmark, communication equipment is included under IT equipment.
National sources (used only for investment data) include the National Statistical Institutes of Canada, Denmark, Germany,Japan, the Netherlands, New Zealand, Switzerland, the Central Bank of Korea, the United States Bureau of EconomicAnalysis (BEA).
Cyprus
The following note is included at the request of Turkey:
“The information in this document with reference to ‘Cyprus’ relates to the southern part of the Island. There is nosingle authority representing both Turkish and Greek Cypriot people on the Island. Turkey recognizes the TurkishRepublic of Northern Cyprus (TRNC). Until a lasting and equitable solution is found within the context of the UnitedNations, Turkey shall preserve its position concerning the ‘Cyprus issue’.”
The following note is included at the request of all of the European Union Member States of the OECD and the EuropeanUnion:
“The Republic of Cyprus is recognised by all members of the United Nations with the exception of Turkey. The infor-mation in this document relates to the area under the effective control of the Government of the Republic of Cyprus.”
Israel
“The statistical data for Israel are supplied by and under the responsibility of the relevant Israeli authorities or thirdparty. The use of such data by the OECD is without prejudice to the status of the Golan Heights, East Jerusalem andIsraeli settlements in the West Bank under the terms of international law.
“It should be noted that statistical data on Israeli patents and trademarks are supplied by the patent and trademarkoffices of the relevant countries.”
OECD SCIENCE, TECHNOLOGY AND INDUSTRY SCOREBOARD 2013 © OECD 2013110

2. BUILDING KNOWLEDGE
Notes and References
2.2. Human resources and knowledge-based capital
General notes for all figures:
Identification of occupations that relate to knowledge-based capital (KBC) is based on survey results from the OccupationalInformation Network Database of the United States Bureau of Labor Statistics. Results for the United States are based on theStandard Occupational Classification system (SOC, 2010) and those for the other countries are based on the InternationalStandard Classification of Occupations (ISCO, 2008). Therefore, the selection of KBC-related occupations slightly differsbetween the United States and the other countries.
Additional notes:
Knowledge-based capital related workers, 2012 and;
Workers contributing to more than one activity related to knowledge-based capital, 2012
The category “Overlapping assets” refers to all employed persons who are related to more than one knowledge-based asset.
2.3. Learning for innovation
Transition from upper secondary education to graduation at the university level, 2011
Upper secondary graduation rates include students who graduated at the ISCED 3A, 3B and 3C levels for Portugal, the UnitedKingdom and the United States and from ISCED 4A programmes “Berufsbildende höhere Schulen” for Austria.
Gross upper secondary graduation rates for China, Germany, Japan, Korea, the Russian Federation, Spain, Switzerland andthe United Kingdom.
Gross entry rates into tertiary education for China.
Gross graduation rates at the tertiary level for Japan, Turkey and the United States.
Participation in job-related education and training by level of problem solving in technology-rich environments, 2012
Participation in adult education and training is calculated by excluding students who are considered to be still in their firstformal cycle of studies. However, those aged 16 to 19, who recently completed or are still in a programme of short durationat ISCED 3C or below, are considered adult learners. Similarly, those aged 20 to 24 who recently completed or are still atISCED 3A,B,C or below are considered adult learners.
On the basis of their test results, respondents are assigned a proficiency level. “Below Level 1” is the lowest level and corre-sponds to a score of less than 241 points out of 500 (12.3% of respondents). “Level-3” is the highest level and corresponds toa score of more than 340 points out of 500 (5.8% of respondents). “No ICT experience/ Failed core ICT test” corresponds torespondents whose ICT skills were insufficiently developed to take the computer-based test and whose problem-solvingskills were not evaluated (22.8% of respondents).
2.4. Skills for innovation
Professionals and technicians, 2012
“Professionals” and “Technicians and associate professionals” are defined according to the International Standard Classifi-cation of Occupations 2008 (ISCO-08) major groups 2 and 3 respectively, except for Australia, Brazil, Canada, Chile, China,India, Indonesia, Israel and the Russian Federation, for which the corresponding ISCO-88 groups are reported.
For Australia, Brazil, Canada, Chile, India, Indonesia, Israel, Mexico, the Russian Federation and South Africa, data are drawnfrom the Laborsta Database maintained by the International Labour Organization (ILO).
For China, data are drawn from China’s Labour Statistical Yearbook 2012.
For India, data refer to the period July 2011-June 2012 covered by the Indian National Sample Survey, Ministry of Statisticsand Program Implementation, June 2013.
For the United States, data refer to March 2012, based on the Current Population Survey (CPS). CPS data were converted fromUS 2010 census codes to 1-digit ISCO-08 major groups via published correspondences with US 2010 Standard OccupationalClassification (SOC) codes.
For Brazil, data refer to 2009.
OECD SCIENCE, TECHNOLOGY AND INDUSTRY SCOREBOARD 2013 © OECD 2013 111
2. BUILDING KNOWLEDGE
Notes and References
For Canada, Chile, Indonesia, Israel, Mexico and the Russian Federation, data refer to 2010.
For China, data refer to 2011.
Professionals and technicians in business sector services and manufacturing, 2012
The occupations considered here correspond to major groups 2, “Professionals”, and 3, “Technicians and associate profes-sionals” of the International Standard Classification of Occupations 2008 (ISCO-08).
Manufacturing refers to the ISIC Rev.4 (NACE Rev.2) Divisions 10-33 (Section C) while Business sector services cover Divi-sions 45-82 (G-N).
Data refer to total employment (including self-employed).
For the Netherlands data refer to 2011.
For the United States, data refer to March 2012, based on the Current Population Survey (CPS). CPS data were converted fromUS 2010 census codes to 1-digit ISCO-08 major groups via published correspondences with US 2010 Standard OccupationalClassification (SOC) codes.
Firms using innovation-relevant skills, 2008-10
Estimates are based on the voluntary, ad-hoc module in the EU Community Innovation Survey 2010 on the skills availablein enterprises and on methods to stimulate new ideas and creativity. The indicator corresponds to the percentage of firmsin the relevant innovation category responding affirmatively to the question: “During the three years 2008 to 2010, did yourenterprise employ individuals in-house with the following skills, or obtain these skills from external sources?”
Innovative enterprises had innovation activities during 2008-10, relating to the introduction of new products, processes,organisational or marketing methods. This includes enterprises with ongoing and abandoned activities for product and pro-cess innovation. The question on innovation-relevant skills also applies to non-innovative enterprises.
Estimates are based on firms with in “core” NACE Rev.2 economic activities (B, C, D, E, G46, H, J58, J61, J62, J63, K and M71).
2.5. New doctorates
Graduation rates at doctorate level, 2000 and 2011
For Australia, Canada, France, Iceland and Indonesia data refer to 2010.
Because of the increasing harmonisation of programme durations among European countries within the Bologna Process,some countries have seen rapid changes in their graduation rates.
General notes:
Graduates at doctorate level, 2011 and;
New doctorates in science and engineering, 2007-11
For Brazil, China, Norway and South Africa, data are based on national sources: for Brazil, Capes Database, Ministry ofEducation of Brazil, July 2013; for China, Ministry of Education of the Peoples’ Republic of China, Educational Statisticswebsite, July 2013; for Norway, the Nordic Institute for Studies in Innovation, Research and Education (NIFU), June 2013; andfor South Africa, Higher Education Management and Information System (HEMIS), South African Department of HigherEducation and Training, July 2013.
For Brazil, China and South Africa, an approximate conversion of nationally available information was carried out to mapto the ISCED-1997 classification of fields of study.
For Norway, data are based on NIFU’s Doctoral Degree Register, which also includes “Licentiate” degrees (equivalent to adoctorate degree).
Additional notes:
Graduates at doctorate level, 2011
For Australia, Canada, France and Iceland, data refer to 2010.
OECD SCIENCE, TECHNOLOGY AND INDUSTRY SCOREBOARD 2013 © OECD 2013112
2. BUILDING KNOWLEDGE
Notes and References
New doctorates in science and engineering, 2007-11
Owing to data availability by field of education, data refer to the 2007-10 average for Australia, Canada and France; 2009-11average for China; and the average of the years 2005, 2006 and 2011 for Italy.
2.6. Doctorate holders
Doctorate holders in the working age population, 2009
For Chinese Taipei, data only include PhDs in the National Profiles of Human Resources in Science and Technology(NPHRST) compiled by STPI, NARL, http://hrst.stpi.narl.org.tw/index.htm#noticeChinese.
For Australia and Canada, data refer to 2006; for Finland, data refer to 2008.
For Korea, OECD estimates based on national sources. Data refer to 2010.
General notes:
Doctorate holders working as researchers, 2009 and;
Doctorate holders by sector of employment, 2009
For Belgium, the Netherlands and Spain, data refer to graduation years 1990 onwards.
For Spain, there is limited coverage of graduates who received their doctorate between 2007 and 2009.
For the United States, data exclude those with a doctorate in the humanities.
Recent doctorates (right-hand side bars) are defined as follows: France, 2006/07 graduates between March and July 2010;Japan, 2002-06 graduates in April 2008; United Kingdom, 2006/07 graduates in November 2010.
Additional notes:
Doctorate holders working as researchers, 2009
For Norway, the figure is a lower bound estimate.
For Japan, Norway, Poland, Romania and the United States, data refer to 2008; for France and the United Kingdom, data referto 2010.
Doctorate holders by sector of employment, 2009
For Chinese Taipei, data only include PhDs in the National Profiles of Human Resources in Science and Technology(NPHRST) compiled by STPI, NARL, http://hrst.stpi.narl.org.tw/index.htm#noticeChinese. Doctorate holders working in the busi-ness sector are under-represented.
For the Russian Federation, data relate only to doctoral graduates employed as researchers and teachers.
For Denmark, Japan, Poland and the United States, data refer to 2008; for France and the United Kingdom, data refer to 2010.
2.7. Researchers
R&D personnel, 2001 and 2011
For Australia, 2002 and 2008 instead of 2001 and 2011.
For Austria, 2002 instead of 2001.
For Canada, Chile, EU28, France, Germany and the Netherlands, 2010 instead of 2011.
For Iceland and South Africa, 2009 instead of 2011.
For Luxembourg, 2000 instead of 2001.
For Switzerland, 2000 and 2008 instead of 2001 and 2011.
Researchers by sector of employment, 2011
For Australia and Switzerland, data refer to 2008.
For Austria, Belgium, Germany, Iceland, Luxembourg and South Africa, data refer to 2009.
For Canada, Chile, France, Hungary and the Netherlands, data refer to 2010.
OECD SCIENCE, TECHNOLOGY AND INDUSTRY SCOREBOARD 2013 © OECD 2013 113

2. BUILDING KNOWLEDGE
Notes and References
Female researchers by sector of employment, 2011
For Austria, Belgium, Denmark, Germany, Iceland, Luxembourg, South Africa and Sweden, data refer to 2009.
For Chile, Italy, France, Hungary, Portugal and Spain, data refer to 2010.
2.8. R&D
R&D expenditure by performing sectors, 2011
For Australia, Chile and the Netherlands, data refer to 2010.
For Iceland and South Africa, data refer to 2009.
For Switzerland, data refer to 2008.
For Israel, defence R&D is partly excluded from available estimates.
For Hungary, total GERD combines survey data and data from the central budget on R&D support. It includes R&D expendi-tures that cannot be attributed to a specific sector on a performance basis.
For the Netherlands, expenditures in the private non profit (PNP) sector are included in the government sector.
For the Slovak Republic, defence is excluded from the government sector.
For the United States, capital expenditures are excluded from R&D performed in the business, higher education and PNPsector. Government is federal or central government only.
Direct government funding of business R&D, 2001 and 2011
For Australia, Chile, EU28, France, Israel, Italy, the Netherlands, Portugal and Spain, data refer to 2010 instead of 2011.
For Austria, data refer to 2002 and 2009 instead of 2001 and 2011.
For Belgium, Iceland and South Africa, data refer to 2009 instead of 2011.
For China, data refer to 2000 instead of 2001.
For Luxembourg, data refer to 2000 and 2009 instead of 2001 and 2011.
For Switzerland, data refer to 2000 and 2008 instead of 2001 and 2011.
In Austria, “research premium” funding is part of direct government funding since 2006. In previous R&D surveys (referenceyears 2002 and 2004) it was not listed as a separate source of funds.
For Israel a substantial part of defence R&D funding is not reported.
Gross expenditures on research and development, by type of R&D, 2001 and 2011
Shares by type of R&D are based on total GERD, except for Chile, Estonia, Norway, Poland, the Russian Federation, Spain andthe United States. For these countries, estimates are based on current R&D estimates as complete records with capital costsare not available.
Data refer to 2001 and 2011 except for Australia (2002, 2008), Austria (2002, 2009), Chile (2010), Denmark (2003, 2010), France(2001, 2010), Iceland (2001, 2009), Ireland (2002, 2011), Israel (2001, 2010), Italy (2005, 2010), Mexico (2003, 2009), Portugal(2001, 2010), the Russian Federation (2001, 2010), South Africa (2001, 2009), Spain (2001, 2010), Switzerland (2000, 2008), theUnited Kingdom (2010) and the United States (2001, 2010).
Estimates for Austria, France, Hungary and Japan are based on R&D expenditures for which a breakdown by type of R&D isavailable: non-classified R&D accounts for 2.0%, 3.8%, 1.6% and 4.6% of the total, respectively. For Austria, R&D expenditureof provincial hospitals is estimated and no breakdown is available by type of R&D. For France, data by type of R&D fordefence are not available. For Hungary, total GERD combines survey data and data from the central budget on R&D support,including R&D expenditure that cannot be allocated by type of R&D. For Japan, classification by type of R&D for naturalsciences and engineering is limited to physical sciences, engineering, agriculture and health expenditures.
2.9. Higher education and basic research
Higher education expenditure on R&D, 2001 and 2011
General university funds (GUF) estimates identify the component of general grants received by the higher education sectorthat are ultimately used for R&D. Estonia, Poland and the United States report no relevant grants fitting the GUF description.No estimates are available for China, the Czech Republic, Germany, Hungary, Korea, Luxembourg, Mexico, the Netherlands,
OECD SCIENCE, TECHNOLOGY AND INDUSTRY SCOREBOARD 2013 © OECD 2013114
2. BUILDING KNOWLEDGE
Notes and References
Portugal and Turkey. The GUF figures correspond to the same reference year as HERD, or, in their absence, are based onshares for the most recent available year: Canada, France, Spain (2010), Belgium and Israel (2009).
For Australia, data refer to 2002 and 2010 instead of 2001 and 2011.
For Austria, data refer to 2002 instead of 2001.
For Chile and the Netherlands, data refer to 2010 instead of 2011.
For Iceland and South Africa, data refer to 2009 instead of 2011.
For Switzerland, data refer to 2002 and 2010 instead of 2001 and 2011.
R&D in the social sciences and humanities are not included in estimates for Israel (2001 and 2011) and Korea (2001).
Government funding of R&D in higher education, by type of funding, 2010
For Canada, Denmark, Israel, the Netherlands, New Zealand and Poland, data refer to 2008.
Basic research performed in the higher education and government sectors, 2011
Data refer to the sum of current and capital expenditures, except for Chile, Estonia, Norway, Poland, the Russian Federation,Spain and the United States, for which only current costs are included in estimates reported to the OECD.
For Australia and Switzerland, data refer to 2008.
For Austria, Iceland, Mexico and South Africa, data refer to 2009.
For Chile, Denmark, France, Israel, Italy, Portugal, the Russian Federation, Spain, the United Kingdom and the United Statesdata refer to 2010.
For Israel and Switzerland, most expenditures on defence R&D are not reported or are excluded from the government sector.
For Switzerland and the United States, the government sector refers to the federal or central government only.
For Israel higher education excludes R&D in the social sciences and humanities.
2.10. Business R&D
Business enterprise expenditure on R&D, 2001 and 2011
For Australia, Chile and the Netherlands, data refer to 2010 instead of 2011.
For Austria, data refer to 2002 instead of 2001.
For Iceland and South Africa, data refer to 2009 instead of 2011.
For Luxembourg, data refer to 2000 instead of 2001.
For Switzerland, data refer to 2000 and 2008 instead of 2001 and 2011.
Business R&D by size class of firms, 2011
National statistical agencies use different minimum thresholds for inclusion in R&D surveys and estimates. There are vari-ations in the definition of small and medium-sized firms. Small firms (fewer than 50 employees): for Belgium, 1-49 employ-ees; for the United States, 5-49 employees; for Luxembourg, the Netherlands and Sweden, 10-49 employees. For Japan, thesurvey excludes firms with capital of less than JPY 10 million.
For Australia, Canada, Chile, France, Germany, Italy, the Netherlands, Portugal, Spain, the United Kingdom and the UnitedStates, data refer to 2010.
For Austria, Belgium, Denmark, Luxembourg and Sweden, data refer to 2009.
For Switzerland, data refer to 2008.
R&D expenditures incurred by foreign-controlled affiliates, 2009
Financial intermediation excluded for the Czech Republic, Israel, Japan and Poland.
Community, social and personal services excluded for the Czech Republic and Poland.
For Finland, Hungary, the Netherlands, Slovenia and Spain, only sections B to F of ISIC Rev.4 are covered.
For Japan, data refer to majority and minority foreign-controlled affiliates.
For Australia, Canada, France, Italy, the United Kingdom and the United States, data refer to 2010.
OECD SCIENCE, TECHNOLOGY AND INDUSTRY SCOREBOARD 2013 © OECD 2013 115

2. BUILDING KNOWLEDGE
Notes and References
For Switzerland, data refer to 2008.
For Norway, Portugal and the Slovak Republic, data refer to 2007.
2.11. R&D Tax incentives
Direct government funding of business R&D and tax incentives for R&D, 2011
For Australia, Belgium, Brazil, Chile, Ireland, Israel and Spain, data refer to 2010. For China, Luxembourg and South Africa,data refer to 2009 and for Switzerland to 2008.
Estimates of direct funding for Belgium, France, Italy and Portugal are based on imputing the share of direct government-funded BERD in the previous year to the current ratio of BERD to GDP. For Austria, the 2009 share is used for 2011. For Brazil,the 2008 share, based on national sources, is used for 2010.
In Austria, Poland and South Africa, R&D tax incentive support is included in official estimates of direct government fund-ing of business R&D. It is removed from direct funding estimates to avoid double-counting.
Estonia, Finland, Germany, Luxembourg, Mexico, New Zealand, Sweden and Switzerland did not provide information onexpenditure-based R&D tax incentives for 2011. For Israel the R&D component of incentives cannot be separately identifiedat present.
Estimates do not cover sub-national and income-based R&D tax incentives and are limited to the business sector (excludingtax incentive support to individuals). Data refer to estimated initial revenue loss (foregone revenues) unless otherwisespecified.
Estimates refer to costs of incentives for business expenditures on R&D, both intramural and extramural unless otherwisespecified. Direct support figures refer only to intramural R&D expenditures, except for Brazil.
Country specific notes available at www.oecd.org/sti/rd-tax-stats.htm.
Change in government support for business R&D through direct funding and tax incentives, 2006-11
Results restricted to countries providing information on expenditure-based R&D tax incentives for four or more yearsbetween 2006 and 2011. A minimum 2% threshold for the tax incentive share of government support for R&D (2011 or latestyear) is applied to ensure reliable estimates of growth rates.
For Australia, Belgium, Ireland and Spain data refer to 2010 instead of 2011. For South Africa data refer to 2009 instead of2011.
For Belgium, Denmark, Korea, Mexico and Slovenia data refer to 2007 instead of 2006. For Turkey data refer to 2008 insteadof 2006. For New Zealand figures for tax incentives refer to 2008 instead of 2006, and for direct government support for BERD,figures are an average of 2007 and 2009 values.
Mexico and New Zealand repealed tax incentive schemes in 2009. In 2008, the cost of R&D tax support amounted toMXN 4 500 million in Mexico and to NZD 103 million in New Zealand.
Estimates of direct funding for Belgium, France, Italy and Portugal in 2011 are based on imputing the share of direct govern-ment-funded BERD in the previous year to the current ratio of BERD to GDP. The same applies to the Netherlands for 2006.For Austria, the 2009 share is used for 2011.
In Austria, Poland and South Africa, R&D tax incentive support is included in official estimates of direct government fund-ing of business R&D. It is removed from direct funding estimates to avoid double-counting.
Estonia, Finland, Germany, Luxembourg, Mexico, New Zealand, Sweden and Switzerland did not provide expenditure-basedR&D tax incentives for 2011. For Israel the R&D component of incentives cannot be separately identified at present.
Estimates do not cover sub-national and income-based R&D tax incentives and are limited to the business sector (excludingtax incentive support to individuals). Data refer to estimated initial revenue loss (foregone revenues) unless otherwise specified.
Estimates refer to the costs of incentives for business R&D expenditures, both intramural and extramural unless otherwisespecified. Direct support figures refer only to intramural R&D expenditures, except for Brazil.
Country specific notes available at www.oecd.org/sti/rd-tax-stats.htm.
OECD SCIENCE, TECHNOLOGY AND INDUSTRY SCOREBOARD 2013 © OECD 2013116

2. BUILDING KNOWLEDGE
Notes and References
Tax subsidy rates on R&D expenditures, 2013
The tax subsidy rate is calculated as 1 minus the B-index, a measure of the before-tax income needed to break even onUSD 1 of R&D outlays (Warda, 2001). It is based on responses from national finance/tax/innovation authorities and R&D statisti-cal agencies to the OECD questionnaire on R&D tax incentives and also draws on other publicly available information.
Benchmark tax data information, including statutory corporate income tax rates, is obtained from the OECD Tax Database, basic(non-targeted) corporate income tax rates, May 2013.
Estimates allow for differences in the treatment of the various components of R&D expenditures: current (labour, othercurrent) and capital (machinery and equipment, facilities/buildings) expenditures. A common 60:30:5:5 percentage distributionof labour, other current, machinery and equipment, and building expenditures is applied based on average estimates forOECD countries (www.oecd.org/sti/rds).
Expenditures on capital assets used for R&D are depreciated over their useful life, using a straight-line or declining balancedepreciation method, as applicable. Estimates of the net present value of provisions relating to R&D capital expendituresare based on multiple sources of information about the benchmark tax treatment of capital expenditures. Estimates of taxsubsidy rates are fairly robust to different choices of sources and methodologies because of the small weight of this compo-nent in eligible R&D expenditures.
R&D tax allowances are deducted from taxable income while R&D tax credits are applied against corporate income tax pay-able (as also for payroll withholding tax incentives and wage taxes). Tax benefits are treated as taxable when appropriate(e.g. Canada).
The model excludes incentives related to personal income, value added, property taxes as well as taxes on wealth andcapital and other forms of direct government support (grants and subsidies).
Unless otherwise specified, figures refer to “representative” firms in their class for which caps or ceilings that limit theamount of eligible expenditures or tax support are not applicable.
The B-index for the profit scenario assumes that the “representative firm” generates a sufficiently large profit to achieve theincentive’s full potential benefit. An adjusted B-index is reported for a loss-making firm that is unable to claim tax benefitsin the reporting period, using an adjusted effective tax rate that takes into account refundability and carry-forwardprovisions.
Refunds are generally modelled as immediate and full payment of tax incentive claims unless excess claims are payableover time and require discounting.
Carry-forwards are modelled as discounted options to claim the incentive in the future, assuming a constant annualprobability of returning to profit of 50% and a nominal discount rate of 10%.
For simplicity, loss-making firms are assumed to enjoy an infinite carry-forward of standard deductions of current R&Dexpenditures and depreciation expenses arising from the use of machinery, equipment and buildings in R&D, unless expen-ditures are refundable.
The definitions of SMEs and large firms vary across countries and may also vary over time.
Estimates are not included for some countries that provide expenditure-based R&D tax incentives as these lack sufficientdetail to carry out calculations for representative firms in the relevant categories.
Figures for Germany, Israel, Luxembourg, Mexico, New Zealand, Sweden and Switzerland, which apply no special treatmentto R&D, reflect the value (or lack thereof) of available allowances for current and capital expenditures.
Country specific notes available at www.oecd.org/sti/rd-tax-stats.htm.
2.12. International funding of R&D
Business enterprise R&D funded from abroad, 2011
For Australia, Chile, the EU28, France, Israel, Italy, Portugal and Spain, data refer to 2010.
For Austria, Belgium, Iceland, Luxembourg, the Netherlands and South Africa, data refer to 2009.
For Switzerland, data refer to 2008.
OECD SCIENCE, TECHNOLOGY AND INDUSTRY SCOREBOARD 2013 © OECD 2013 117
2. BUILDING KNOWLEDGE
Notes and References
Business enterprise R&D funded from abroad, by source of funds, 2011
“Other/Not elsewhere classified” also includes the private non profit (PNP) sector which accounts at most for 1.4% of allBERD funded from abroad.
For Denmark, France, Italy, Portugal, the Russian Federation, Spain and the United Kingdom, data refer to 2010.
For Austria, Belgium and Sweden, data refer to 2009.
Funding of business R&D by foreign enterprises, 2011
For Canada, France, Italy, Portugal and Spain, data refer to 2010.
For Austria, Belgium and Sweden, data refer to 2009.
For Denmark and Switzerland, data refer to 2008.
Data for Canada and Switzerland are from national sources and separately reported to the OECD.
Notes andReferences
Auriol, L., M. Misu and R. Freeman (2013), “Careers of Doctorate Holders: Analysis of Labour Market and Mobility Indicators”, OECDScience, Technology and Industry Indicators Working Papers, No. 2013/04, OECD Publishing.Doi: http://dx.doi.org/10.1787/5k43nxgs289w-en.
Auriol, L., M. Schaaper and B. Felix (2012), “Mapping Careers and Mobility of Doctorate Holders. Draft Guidelines, ModelQuestionnaire and Indicators – Third Edition”, OECD Science, Technology and Industry Working Papers, No. 7, OECD Publishing.Doi: http://dx.doi.org/10.1787/5k4dnq2h4n5c-en.
Corrado, C., C. Hulten and D. Sichel, (2009), “Intangible Capital and US Economic Growth”, Review of Income and Wealth, Vol. 55, No. 3,pp. 661-685.
OECD and Eurostat (1995), The Measurement of Scientific and Technological Activities: Manual on the Measurement of Human ResourcesDevoted to S&T – Canberra Manual, OECD Publishing and ECSC-EC-EAEC, Brussels and Luxembourg.Doi: http://dx.doi.org/10.1787/9789264065581-en.
OECD and Eurostat (2005), Oslo Manual: Guidelines for Collecting and Interpreting Innovation Data, 3rd edition, OECD Publishing andStatistical Office of the European Communities, Luxembourg, www.oecd.org/sti/oslomanual.Doi: http://dx.doi.org/10.1787/9789264013100-en.
OECD (2002), Frascati Manual 2002: The Measurement of Scientific and Technological Activities. Proposed Standard Practice for Surveys onResearch and Experimental Development, 6th edition, OECD Publishing, www.oecd.org/sti/frascatimanual.Doi: http://dx.doi.org/10.1787/9789264199040-en.
OECD (2004), OECD Handbook for Internationally Comparative Education Statistics: Concepts, Standards, Definitions and Classifications, OECDPublishing. Doi: http://dx.doi.org/10.1787/9789264104112-en.
OECD (2010), OECD Handbook on Deriving Capital Measures of Intellectual Property Products, OECD Publishing.Doi: http://dx.doi.org/10.1787/9789264079205-en.
OECD (2010), PISA 2009 Results: What Students Know and Can Do: Student Performance in Reading, Mathematics and Science, Vol. 1, OECDPublishing. Doi: http://dx.doi.org/10.1787/9789264091450-en.
OECD (2010), Tax expenditures in OECD countries, OECD Publishing. Doi: http://dx.doi.org/10.1787/9789264076907-en.
OECD (2011), Science, Technology and Industry Scoreboard 2011, OECD Publishing. Doi: http://dx.doi.org/10.1787/sti_scoreboard-2011-en.
OECD (2013), Education at a Glance 2013: OECD Indicators, OECD Publishing. Doi: http://dx.doi.org/10.1787/eag-2013-en.
OECD (2013), Supporting Investment in Knowledge Capital, Growth and Innovation, OECD Publishing.Doi: http://dx.doi.org/10.1787/9789264193307-en.
PIAAC Expert Group in Problem Solving in Technology-Rich Environments (2009), “PIAAC Problem Solving in Technology-RichEnvironments: A Conceptual Framework”, OECD Education Working Papers, No. 36, OECD Publishing.Doi: http://dx.doi.org/10.1787/220262483674.
OECD SCIENCE, TECHNOLOGY AND INDUSTRY SCOREBOARD 2013 © OECD 2013118

2. BUILDING KNOWLEDGE
Notes and References
Squicciarini, M. and M. Le Mouel (2012), “Defining and Measuring Investment in Organisational Capital: Using US Microdata toDevelop a Task-based Approach”, OECD Science, Technology and Industry Working Papers, No. 2012/05, OECD Publishing.Doi: http://dx.doi.org/10.1787/5k92n2t3045b-en.
Van Steen, J. (2012), “Modes of Public Funding of Research and Development: Towards Internationally Comparable Indicators”, OECDScience, Technology and Industry Working Papers, No. 2012/04, OECD Publishing. Doi: http://dx.doi.org/10.1787/5k98ssns1gzs-en.
Warda, J. (2001), “Measuring the Value of R&D Tax Treatment in OECD Countries”, STI Review No. 27: Special Issue on New Science andTechnology Indicators, OECD Publishing, www.oecd.org/sti/37124998.pdf.
OECD SCIENCE, TECHNOLOGY AND INDUSTRY SCOREBOARD 2013 © OECD 2013 119


OECD SCIENCE, TECHNOLOGY AND INDU
3. CONNECTING TO KNOWLEDGE
1. R&D and knowledge flows2. Open innovation3. Collaboration on innovation4. International collaboration5. Skills mobility6. Researchers on the move7. Research excellence8. Science for innovation9. From knowledge to inventions10. Inventions across borders11. Technology flows and marketsNotes and References
Improving the efficiency and effectiveness of the innovation effort requires strongknowledge transmission channels. New metrics help inform the policy debate bydemonstrating the variety and nature of available mechanisms for exchanging knowledge. Anexperimental indicator reveals that business sourcing of R&D from other businesses is stilllimited, but open innovation goes beyond R&D interactions, as shown by the importance ofinstitutional and market-based collaboration when introducing new innovations. Combininginnovation survey and patent data points to the role of international collaboration. Theinternational mobility of the highly skilled, from students to scientists, is hard to track. Anexperimental indicator follows the careers of scientists who publish in scholarly journals; themobility patterns and quality of scientific output of those who stay, move or return to theirhome country differ sharply. New citation-based indicators show that collaboration byinstitutions is an increasingly pervasive feature of top-quality research. Linking patents andscientific publications reveals the importance of research crossing several disciplines in newtechnology development. Data on foreign ownership of inventions indicate which countries own therights to patents invented elsewhere. Data on licensing revenues provide evidence on knowledgemarkets, and the role of intermediaries, although these metrics are still in their infancy.
STRY SCOREBOARD 2013 © OECD 2013 121
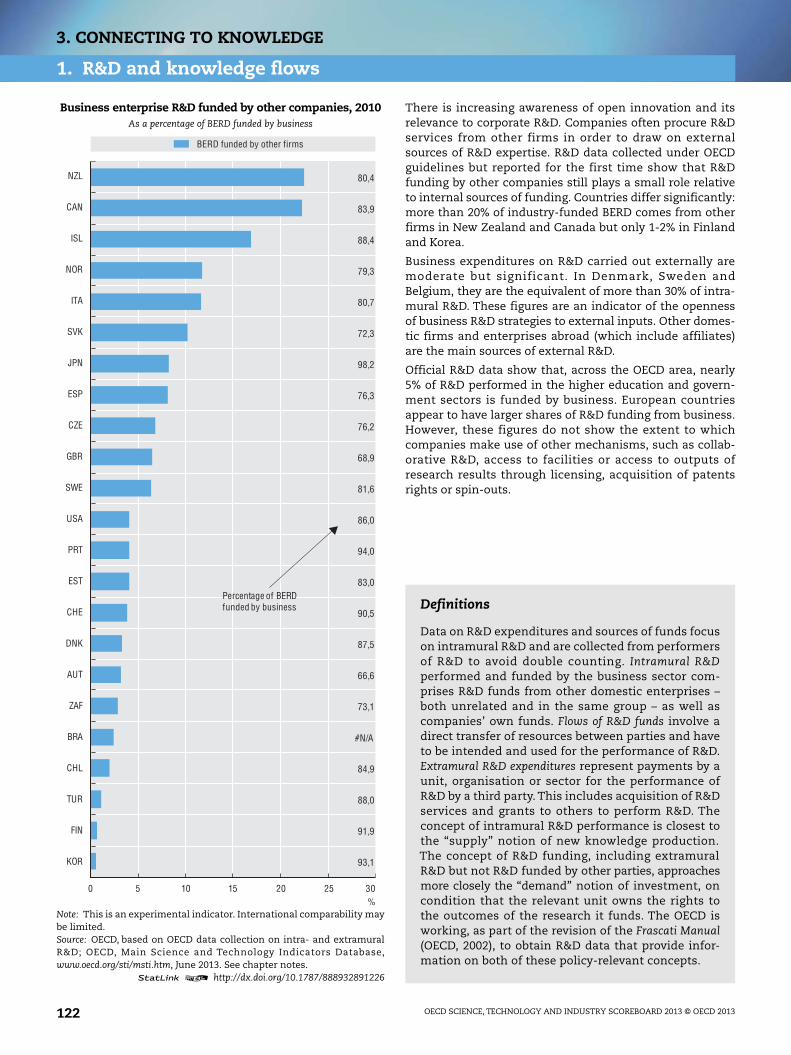
3. CONNECTING TO KNOWLEDGE
1. R&D and knowledge flows
There is increasing awareness of open innovation and itsrelevance to corporate R&D. Companies often procure R&Dservices from other firms in order to draw on externalsources of R&D expertise. R&D data collected under OECDguidelines but reported for the first time show that R&Dfunding by other companies still plays a small role relativeto internal sources of funding. Countries differ significantly:more than 20% of industry-funded BERD comes from otherfirms in New Zealand and Canada but only 1-2% in Finlandand Korea.
Business expenditures on R&D carried out externally aremoderate but significant. In Denmark, Sweden andBelgium, they are the equivalent of more than 30% of intra-mural R&D. These figures are an indicator of the opennessof business R&D strategies to external inputs. Other domes-tic firms and enterprises abroad (which include affiliates)are the main sources of external R&D.
Official R&D data show that, across the OECD area, nearly5% of R&D performed in the higher education and govern-ment sectors is funded by business. European countriesappear to have larger shares of R&D funding from business.However, these figures do not show the extent to whichcompanies make use of other mechanisms, such as collab-orative R&D, access to facilities or access to outputs ofresearch results through licensing, acquisition of patentsrights or spin-outs.
Business enterprise R&D funded by other companies, 2010As a percentage of BERD funded by business
Note: This is an experimental indicator. International comparability maybe limited.Source: OECD, based on OECD data collection on intra- and extramuralR&D; OECD, Main Science and Technology Indicators Database,www.oecd.org/sti/msti.htm, June 2013. See chapter notes.
1 2 http://dx.doi.org/10.1787/888932891226
0 105 15 20 25 30%
KOR
FIN
TUR
CHL
BRA
ZAF
AUT
DNK
CHE
EST
PRT
USA
SWE
GBR
CZE
ESP
JPN
SVK
ITA
NOR
ISL
CAN
NZL
93,1
91,9
88,0
84,9
73,1
66,6
87,5
90,5
83,0
94,0
86,0
81,6
68,9
76,2
76,3
98,2
72,3
80,7
79,3
88,4
83,9
80,4
#N/A
Percentage of BERD funded by business
BERD funded by other firms
Definitions
Data on R&D expenditures and sources of funds focuson intramural R&D and are collected from performersof R&D to avoid double counting. Intramural R&Dperformed and funded by the business sector com-prises R&D funds from other domestic enterprises –both unrelated and in the same group – as well ascompanies’ own funds. Flows of R&D funds involve adirect transfer of resources between parties and haveto be intended and used for the performance of R&D.Extramural R&D expenditures represent payments by aunit, organisation or sector for the performance ofR&D by a third party. This includes acquisition of R&Dservices and grants to others to perform R&D. Theconcept of intramural R&D performance is closest tothe “supply” notion of new knowledge production.The concept of R&D funding, including extramuralR&D but not R&D funded by other parties, approachesmore closely the “demand” notion of investment, oncondition that the relevant unit owns the rights tothe outcomes of the research it funds. The OECD isworking, as part of the revision of the Frascati Manual(OECD, 2002), to obtain R&D data that provide infor-mation on both of these policy-relevant concepts.
OECD SCIENCE, TECHNOLOGY AND INDUSTRY SCOREBOARD 2013 © OECD 2013122

3. CONNECTING TO KNOWLEDGE
1. R&D and knowledge flows
Business funding of extramural R&D, by type of performer, 2010As a percentage of extramural funding and total BERD
Note: This is an experimental indicator. International comparability may be limited. For Germany and Japan, “other” also includes funding toenterprises abroad.Source: OECD, based on OECD data collection on intra- and extramural R&D; OECD, Main Science and Technology Indicators Database,www.oecd.org/sti/msti.htm, June 2013. See chapter notes.
1 2 http://dx.doi.org/10.1787/888932891245
Business-funded R&D in the higher education and government sectors, 2001 and 2011As a percentage of R&D performed in these sectors
Source: OECD, Research and Development Statistics Database, www.oecd.org/sti/rds, June 2013. See chapter notes.1 2 http://dx.doi.org/10.1787/888932891264
Measurability
Flows of funds for R&D are an indicator of knowledge flows when they represent payments for the performance of newR&D and the output becomes available to the R&D funder. This measure excludes payments for rights to the output ofprevious R&D but may include unconditional payments, such as grants, which do not represent knowledge flows. Thecoverage of R&D surveys is sometimes limited to intramural R&D performers and thus results in underestimation ofextramural R&D. Funders’ and performers’ views of the nature and value of R&D-related activities may differ. Whenfinancing is provided by an intermediary it may be difficult for the performer to know the source of funds. In somecases, companies may fail to report R&D funded by third parties as intramural R&D. In the higher education andgovernment sectors, R&D funds from business may understate the extent to which firms benefit from the researchcarried out, as governments often fund these units directly to undertake collaborative R&D activities and companiessometimes pay for the R&D on a ex post basis, e.g. through licence agreements.
100
80
60
40
20
90
70
50
30
10
0
%
DNKSWE
BEL ESP
CHEDEU NOR
NZL CANJP
NPRT
AUTES
TKOR
CZE USASVK ITA TU
R
Funding to domestic enterprises Funding to enterprises abroad Funding to other performers
Funding to enterprises abroad and other performers Extramural R&D, as a % of BERD
%20
16
12
8
4
0
2011 2001
RUSCHN
NLD TUR
DEU HUNBEL NZL SVN
CHEISR ISL
ZAF
ESP
SVKAUS FIN
EU28 KOR
CANNOR
GBRAUT
CHLOEC
DPOL
FRA
SWEES
TDNK
USAJP
N ITA CZE IRLMEX LU
XPRT
OECD SCIENCE, TECHNOLOGY AND INDUSTRY SCOREBOARD 2013 © OECD 2013 123

3. CONNECTING TO KNOWLEDGE
2. Open innovation
Innovation is a complex process and often involves severalactors and linkages. One way to capture its systemic dimen-sion is to examine the information sources that firms usefor their innovation activities. Market sources predominatein all countries. Institutional sources play a much smallerrole; generally, less than 10% of product and/or processinnovating firms rank them as “highly important”.
The introduction of product innovations often involves anumber of external actors. Firms may co-develop theirinnovations with other companies, procure services such asR&D or design, license the rights to others’ inventions orsimply imitate innovations developed and adopted else-where. For service innovation, more than 35% of innovatingfirms drew on some form of external development during2008-10, compared to 30% for product innovation.
In terms of collaboration on innovation, large firms are farmore likely to collaborate than small and medium-sizedenterprises (SMEs). Among SMEs, the rate of collaboration isbetween 20% and 40% of innovative firms in two-thirds ofthe countries surveyed. For large innovative firms, collabora-tion rates range from more than 70% in the United Kingdom,Austria, Belgium, Finland, Denmark and Slovenia to lessthan a third in Brazil, Mexico and Chile.
External sources of knowledge for innovation,by type, 2008-10
Percentage of product and/or process innovative firms citing sourceas ''highly important''
Source: OECD, based on Eurostat (CIS-2010) and national data sources,June 2013. See chapter notes.
1 2 http://dx.doi.org/10.1787/888932891283
0 20 60 8040 100
CHL
POL
RUS
NLD
PRT
FRA
ESP
ITA
ISR
JPN
DNK
CZE
EST
BEL
FIN
TUR
ZAF
SVK
HUN
DEU
SVN
GBR
LUX
AUS
BRA
CHE
NZL
Market sources (suppliers, customers, competitors, etc.)
Institutional sources (higher education, government)
% of product and/or process innovative firms
Definitions
The guidelines on measurement of innovation, theOslo Manual (OECD/Eurostat, 2005), define innovationas “the implementation of a new or significantlyimproved product (good or service) or process, a newmarketing method, or a new organisational method inbusiness practices, workplace organisation or externalrelations”.
In line with the EU Community Innovation Survey(CIS), product and/or process innovative firms are definedas those having implemented product or process inno-vations, or with ongoing/abandoned innovation activ-ities relating to product/process innovation.
Market sources include suppliers of equipment, materials,components or software, clients or customers, com-petitors or other enterprises in the same sector andconsultants, commercial labs or private R&D institutes.Institutional sources include universities or other highereducation institutions and government or publicresearch institutes.
Collaboration involves “active participation in jointinnovation projects with other organisations” butexcludes pure contracting-out of work. It can involvethe joint implementation of innovations with custom-ers and suppliers, as well as partnerships with otherfirms or organisations.
OECD SCIENCE, TECHNOLOGY AND INDUSTRY SCOREBOARD 2013 © OECD 2013124

3. CONNECTING TO KNOWLEDGE
2. Open innovation
Externally developed goods and services innovation, 2008-10As a percentage of firms introducing each type of innovation
Source: OECD, based on Eurostat (CIS-2010) and national data sources, June 2013. See chapter notes.1 2 http://dx.doi.org/10.1787/888932891302
Firms collaborating on innovation activities, by size, 2008-10As a percentage of product and/or process innovative firms in each size category
Source: OECD, based on Eurostat (CIS-2010) and national data sources, June 2013. See chapter notes.1 2 http://dx.doi.org/10.1787/888932891321
Measurability
Despite a gradual process of harmonisation based on the Oslo Manual, national innovation surveys still have somesignificant differences in methodology and design. Indicators of external engagement in innovation are subjective andreflect the existence of knowledge flows but not their nature, frequency or intensity. Oslo-based surveys follow a “subject-based” approach, i.e. the unit of analysis is the firm, not the innovation, and therefore ask about the use of a particularknowledge sourcing strategy across one or more innovations.
Innovations can be developed mainly by the enterprise itself or in co-operation with others. They can also be mainlydeveloped outside and implemented by the innovating firm. The measure of externally developed innovation usedhere is based on firms that did not report that they mainly developed innovations themselves and thus excludes thosethat developed innovations both internally and externally.
Differences in the scope of the variables used to measure external engagement can limit comparability. For example,questions on collaboration in the CIS refer only to product and/or process innovations, while in other surveys theycover all types.
%70
60
40
20
50
30
10
0
ZAFJP
NHUN
CHLDNK
SWEPOL
AUTES
TSVN
NLD BEL CZE FIN TURPRT
NOR ITA SVKISR
Goods innovation Services innovation
%
80
70
60
40
20
50
30
10
0
GBRAUT
BEL FIN DNKSVN
EST
SWEHUN
PRTCZE
ISR IRL
JPN
POLFR
ADEU KOR
NLD SVKNOR
LUX
ZAFES
PCHE
NZL ITA RUS ISLTUR
AUSBRA
MEXCHL
Large firms SMEs
OECD SCIENCE, TECHNOLOGY AND INDUSTRY SCOREBOARD 2013 © OECD 2013 125

3. CONNECTING TO KNOWLEDGE
3. Collaboration on innovation
Collaboration is a key vector of innovation-related know-ledge flows both for firms that use R&D (either internallydeveloped or externally acquired) and for those that arenot R&D-active. In all countries for which data are available,R&D-active firms tend to collaborate more frequently oninnovation than non-R&D-active firms, although in Korea(manufacturing only) and Australia, both types of firmshave similar rates of collaboration.
Patterns of collaboration differ in terms of partners’ charac-teristics. Collaboration with higher education or publicresearch institutions is mainly an important source ofknowledge transfer for large firms. In most countries, thesefirms are usually two to three times more likely than smalland medium-sized enterprises (SMEs) to engage in this typeof collaboration. More than half of all innovating large firmsin Finland, Slovenia, Austria and Hungary collaborate withthese institutions but less than one in ten in Mexico andAustralia do so.
Collaboration is more frequent with other market actors, inparticular suppliers and clients. Among large firms, suppliersplay a key role as value chains become increasingly inte-grated, while in Finland, the United Kingdom, Korea, SouthAfrica and Iceland, collaboration with clients is equally ormore important, a potential indication of the growingimportance of user-driven innovation.
Firms engaging in collaboration on innovation,by R&D status, 2008-10
As a percentage of R&D-active and non R&D-active firms
Source: OECD, based on Eurostat (CIS-2010) and national data sources,June 2013. See chapter notes.
1 2 http://dx.doi.org/10.1787/888932891340
0 4020 60 70 803010 50
ITA
CHL
BRA
AUS
TUR
PRT
DEU
KOR
IRL
NOR
CHE
NZL
ZAF
ESP
LUX
SVK
NLD
CZE
FIN
SWE
POL
BEL
ISR
EST
SVN
HUN
JPN
FRA
RUS
DNK
AUT
GBR
R&D-active firms Firms without R&D
Definitions
R&D-active firms are those engaged in intramural orextramural R&D activities.
Collaboration involves “active participation in jointinnovation projects with other organisations” butexcludes pure contracting out of innovation-relatedwork. It can involve the joint implementation of inno-vations with customers and suppliers, as well as part-nerships with other firms or organisations.
The classification of firms by size follows the recom-mendations of the Oslo Manual. In a majority of coun-tries, it is calculated on the basis of the number ofemployees. SMEs are defined as firms with 10-250employees, with some exceptions: New Zealand 6+;the Russian Federation 15+, Mexico 20+. For SouthAfrica, firm size categories are based on turnover levels.
OECD SCIENCE, TECHNOLOGY AND INDUSTRY SCOREBOARD 2013 © OECD 2013126

3. CONNECTING TO KNOWLEDGE
3. Collaboration on innovation
Firms collaborating on innovation with higher education or public research institutions, by firm size, 2008-10As a percentage of product and/or process innovative firms in each size category
Source: OECD, based on Eurostat (CIS-2010) and national data sources, June 2013. See chapter notes.1 2 http://dx.doi.org/10.1787/888932891359
Firms collaborating with suppliers and clients, by firm size, 2008-10As a percentage of product and/or process innovative firms
Source: OECD, based on Eurostat (CIS-2010) and national data sources, June 2013. See chapter notes.1 2 http://dx.doi.org/10.1787/888932891378
Measurability
Because R&D and innovation are related phenomena, some countries collect information on innovation as part ofbusiness R&D surveys. In dedicated surveys that adopt the Community Innovation Survey (CIS) model, firms are typi-cally identified as being R&D-active when they report carrying out internal or external R&D as part of their productand/or process innovation activities. In other innovation surveys such as those in Australia and New Zealand, thisinformation is asked of all innovative firms (including firms with only organisational or marketing innovations). Indi-cators of collaboration on innovation reflect the existence of some sort of collaboration, but not the type, frequency orintensity. In the CIS, collaboration refers to product and/or process innovation, but in other innovation surveys it refersto all types of innovation (including organisational or marketing). For Switzerland it only includes collaboration onR&D. Survey design features such as question order, scope or combination with other types of surveys may influencerespondents’ answers to questions on innovation activity and collaboration with other parties.
%
80
90
70
60
40
20
50
30
10
0
FIN SVNAUT
HUNSWE
BEL DEU NORDNK
KORPRT
JPN
ZAFFR
ALU
XCZE
CHEES
PGBR
SVKNLD ES
TISR
POLIR
L ITA TURRUS
NZL BRACHL
MEXAUS
Large firms SMEs
20
20
40
40
60
60
80
80
0
%
FIN SWEDNK
GBRSVN
BEL PRTAUT
EST
JPN
CZEPOL
SVKFR
AHUN
KORNLD NOR IR
LISR
LUX
CHEZAF
TURES
PNZL DEU ITA ISL
BRARUS
CHLAUS
Suppliers Clients
Large firms
SMEs
OECD SCIENCE, TECHNOLOGY AND INDUSTRY SCOREBOARD 2013 © OECD 2013 127
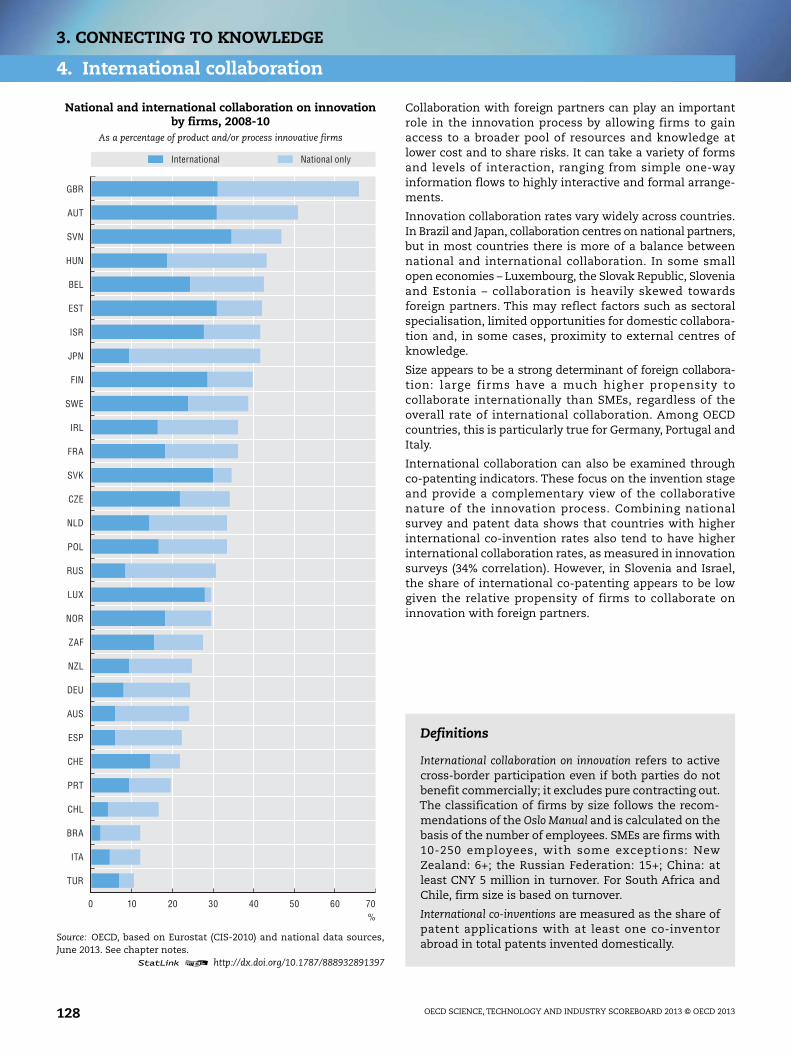
3. CONNECTING TO KNOWLEDGE
4. International collaboration
Collaboration with foreign partners can play an importantrole in the innovation process by allowing firms to gainaccess to a broader pool of resources and knowledge atlower cost and to share risks. It can take a variety of formsand levels of interaction, ranging from simple one-wayinformation flows to highly interactive and formal arrange-ments.
Innovation collaboration rates vary widely across countries.In Brazil and Japan, collaboration centres on national partners,but in most countries there is more of a balance betweennational and international collaboration. In some smallopen economies – Luxembourg, the Slovak Republic, Sloveniaand Estonia – collaboration is heavily skewed towardsforeign partners. This may reflect factors such as sectoralspecialisation, limited opportunities for domestic collabora-tion and, in some cases, proximity to external centres ofknowledge.
Size appears to be a strong determinant of foreign collabora-tion: large firms have a much higher propensity tocollaborate internationally than SMEs, regardless of theoverall rate of international collaboration. Among OECDcountries, this is particularly true for Germany, Portugal andItaly.
International collaboration can also be examined throughco-patenting indicators. These focus on the invention stageand provide a complementary view of the collaborativenature of the innovation process. Combining nationalsurvey and patent data shows that countries with higherinternational co-invention rates also tend to have higherinternational collaboration rates, as measured in innovationsurveys (34% correlation). However, in Slovenia and Israel,the share of international co-patenting appears to be lowgiven the relative propensity of firms to collaborate oninnovation with foreign partners.
National and international collaboration on innovationby firms, 2008-10
As a percentage of product and/or process innovative firms
Source: OECD, based on Eurostat (CIS-2010) and national data sources,June 2013. See chapter notes.
1 2 http://dx.doi.org/10.1787/888932891397
0 2010 30 40 6050 70%
TUR
ITA
BRA
CHL
PRT
CHE
ESP
AUS
DEU
NZL
ZAF
NOR
LUX
RUS
POL
NLD
CZE
SVK
FRA
IRL
SWE
FIN
JPN
ISR
EST
BEL
HUN
SVN
AUT
GBR
International National only
Definitions
International collaboration on innovation refers to activecross-border participation even if both parties do notbenefit commercially; it excludes pure contracting out.The classification of firms by size follows the recom-mendations of the Oslo Manual and is calculated on thebasis of the number of employees. SMEs are firms with10-250 employees, with some exceptions: NewZealand: 6+; the Russian Federation: 15+; China: atleast CNY 5 million in turnover. For South Africa andChile, firm size is based on turnover.
International co-inventions are measured as the share ofpatent applications with at least one co-inventorabroad in total patents invented domestically.
OECD SCIENCE, TECHNOLOGY AND INDUSTRY SCOREBOARD 2013 © OECD 2013128

3. CONNECTING TO KNOWLEDGE
4. International collaboration
Firms engaged in international collaboration by firm size, 2008-10As a percentage of product and/or process innovative firms in each size category
Source: OECD, based on Eurostat (CIS-2010) and national data sources, June 2013. See chapter notes.1 2 http://dx.doi.org/10.1787/888932891416
International collaboration on patents, 2007-11 and innovation, 2008-10As a percentage of PCT patent applications and of product and/or process innovative firms
Source: OECD, Patent Database, June 2013; OECD, based on Eurostat (CIS-2010) and national data sources, June 2013. See chapter notes.1 2 http://dx.doi.org/10.1787/888932891435
Measurability
Innovation surveys differ in the way they collect information about international collaboration. The Community Inno-vation Survey asks firms about the location of each type of partner in several regions; in other surveys they are onlyasked to report whether each type of partner was domestic or foreign.
The indicator on international collaboration on patents and innovation combines two related but distinct phenomena.Firms may collaborate internationally on innovation without being jointly involved in the inventive process that givesrise to patents (e.g. joint marketing/distribution). The two indicators are calculated for different units of analysis (firmlevel for collaboration and invention level for patents) and cover slightly different periods. The former measures theshare of patent applications with a least one foreign co-inventor (and may be driven by a small number of large firmswith many co-inventions), while the latter measures the relative propensity of innovative firms to collaborate withforeign partners. Future work linking patent and innovation data at firm level should provide further insights into thelinks between invention and other innovation activities.
%70
60
40
20
50
30
10
0
FIN BEL AUTSVN
EST
SWEGBR
CZESVK
PRTZAF
LUX
POLISR
FRA
NORDEU IR
LHUN
NLD CHEJP
NTUR
ESP
NZL ITA ISLBRA
AUSRUS
CHL
Large firms SMEs
0 10 20 30 355 15 25 40
50
45
30
40
25
35
20
15
10
5
0
AUS
AUT
BELCHE
CHL
CZE
DEU
DNK
ESP
EST
FINFRA GBR
HUNISL
ISR
ITA
JPN
NLD NORNZL
POLPRT
SVK
SVNSWE
TUR
BRA
RUS
ZAF
International co-inventions in patents (%)
Firms engaged in international collaboration for innovation (%)
OECD SCIENCE, TECHNOLOGY AND INDUSTRY SCOREBOARD 2013 © OECD 2013 129

3. CONNECTING TO KNOWLEDGE
5. Skills mobility
Students moving abroad to study are an important source ofknowledge flows between countries. High-quality tertiaryeducation attracts skilled individuals in search of trainingand career opportunities, some of whom later return totheir home countries. The United States is the main recipi-ent of international students, followed by the United Kingdom,Australia, France and Germany. The distribution of interna-tional students by subject reveals key strengths in a coun-try’s knowledge base. Science and engineering attract asizeable share of international students, particularly inSweden, Finland, the United States, and Germany. In mostOECD countries, the share of international students in thisfield exceeds that of domestic students.
Job mobility is an important driver of knowledge transferand spillovers. There are significant differences amongOECD countries in the share of employees who have been intheir jobs for less than one year. Mobility rates appear to behigher in non-European countries. In most cases, tertiary-educated individuals have longer job tenures than their lesseducated counterparts. The economic downturn may haveaccentuated this pattern.
Among countries for which data are available, there aremajor differences in mobility of doctorate holders; it is high-est in Germany, Denmark, Iceland and Poland. Those inresearch positions (a group that accounts for the majority ofdoctorate holders) are less likely to have moved jobs thanthose not working as researchers, partly because they aremore likely to have tenured academic positions.
International and foreign students enrolledin tertiary education, 2011
Totals and breakdown by field of education
Source: OECD calculations based on OECD (2013), Education at a Glance:OECD Indicators, OECD Publishing. See chapter notes.
1 2 http://dx.doi.org/10.1787/888932891454
0 4020 60 80 100%
SVK
POL
ISR
TUR
CZE
ITA
FRA
HUN
EST
NLD
NOR
JPN
LUX
BEL
CHL
AUS
ESP
AUT
PRT
NZL
GBR
SVN
ISL
DNK
CHE
CAN
DEU
USA
FIN
SWE
9
23
4
31
38
74
268
16
1
38
3
139
2
38
3
263
63
53
13
41
420
2
1
20
42
106
177
710
14
37
Sciences
Engineering, manufacturing and construction
Health and welfare
Humanities, arts and education
Social sciences, business and law
Services and agriculture
International students
Total, thousandsForeign students
Definitions
International students are students who have crossedborders expressly with the intention to study. TheUNESCO Institute for Statistics, the OECD and Eurostatdefine as international students those who are not res-idents of their country of study or those who receivedtheir prior education in another country. Foreign stu-dents are defined according to their citizenship. Thefields of education correspond to those defined in theInternational Standard Classification of Education(ISCED-97). Tertiary education comprises Levels 5 and 6of the ISCED classification.
Labour turnover or mobility is defined as the share of indi-viduals in employment who have been in their currentor main job or with their current employer for less thanone year.
Doctorate holders have received an advanced researchqualification at Level 6 of ISCED-97. In the context ofthe Careers of Doctorate Holders (CDH) data collection,they are considered to have moved jobs if they workedfor a different employer in the previous 10 years.
OECD SCIENCE, TECHNOLOGY AND INDUSTRY SCOREBOARD 2013 © OECD 2013130

3. CONNECTING TO KNOWLEDGE
5. Skills mobility
Labour turnover, by educational attainment, 2011Individuals less than one year in their current job, as a percentage of employment
Source: OECD, based on the OECD Job Tenure Database, ad hoc tabulation of the European Labour Force Survey, July 2013; and Bureau of Labor Statistics,Employee Tenure statistics, www.bls.gov/news.release/tenure.nr0.htm, September 2012. See chapter notes.
1 2 http://dx.doi.org/10.1787/888932891473
Doctorate holders who changed jobs in the last ten years, 2009As a percentage of employed doctorate holders
Source: OECD, based on OECD/UNESCO Institute for Statistics/Eurostat data collection on careers of doctorate holders 2010 www.oecd.org/sti/cdh andOECD Job Tenure Database, June 2013. See chapter notes.
1 2 http://dx.doi.org/10.1787/888932891492
Measurability
Data on international students are from the 2012 OECD-UNESCO data collection on education statistics, based on ter-tiary enrolment data from countries of destination. The concept of international students is more directly relevant forthe analysis of mobility. When data on international students are not available, data on foreign students are used toobtain a more complete picture. The European Labour Force Surveys (LFS) are among the few internationally harmon-ised data sources that can be used to identify job mobility with job and personal characteristics. Information onwhether job tenure of employees exceeds 12 months has been used as a proxy for job mobility. To ensure consistencywith data collected for the OECD Job Tenure Database, estimates by qualification level based on EU LFS include indi-viduals who were not in employment one year ago, thus combining job-to-job mobility and mobility into employment.Surveys carried out in the framework of the project on Careers of Doctorate Holders use a relatively broad ten-yearreference window for recording mobility, but follow-on questions provide more detailed information for analyticalpurposes.
%30
20
25
15
10
5
0
TURMEX
USADNK
AUS FIN SWEBRA
CANES
T ISLCHE
NORES
PAUT
NLD DEU GBRFR
AHUN
PRTBEL POL
IRL
SVNCZE
LUX ITA SVK
GRC
All employed individuals Tertiary education Low or no formal education
%100
80
60
40
20
0
DEU DNK ISLPOL
NLD ISRSVN
PRTTUR
LVA
HUNLT
UHRV
ESP
RUSBLG BEL ROU
All doctorate holders Researchers Non-researchers
EU15 total employment mobility
OECD SCIENCE, TECHNOLOGY AND INDUSTRY SCOREBOARD 2013 © OECD 2013 131

3. CONNECTING TO KNOWLEDGE
6. Researchers on the move
Scientific progress depends significantly on researchermobility. A new experimental indicator tracks changes inthe affiliation of scientists who publish in scholarly jour-nals. The top nine international bilateral flows involveexchanges with the United States. While the total inflowexceeds the outflow, more scientists who start by publish-ing in the United States move to affiliations in China andKorea than vice versa. The United Kingdom is the secondmost connected economy. German-based researchers mov-ing to Swiss affiliations account for the largest flow in non-English speaking countries. These statistics do not accountfor the mobility of individuals before their first publication,e.g. as students.
Swiss-based authors have the largest mobility rates; nearly20% have a previous affiliation abroad. In Japan, Brazil andChina, researcher mobility stands at less than 5%. Mobilitypatterns vary across economies. In Italy, a majority ofinflows are returnees (researchers who had an Italian affili-ation for their initial recorded publication(s)); in Switzerlandand Singapore the majority of researchers with an interna-tional mobility record are new inflows.
With few exceptions, stayers are more likely to publish injournals of lower quality. In economies with lower averageresearch quality, outflows tend to have the largest impactfactors. Returnees help to increase quality scores, as do newinflows. For many economies, raising the performance ofstayers to the level of returnees would allow them to catchup with leading research nations.
International flows of scientific authors, 1996-2011Largest bilateral flows, by first and last affiliation
Source: OECD calculations based on Scopus Custom Data, Elsevier,version 5.2012, May 2013. See chapter notes.
1 2 http://dx.doi.org/10.1787/888932891511
0 6 000 12 000 18 000 24 000
0 20 40 60 80%
GBR ↔ USA
CAN ↔ USA
USA ↔ CHN
DEU ↔ USA
IND ↔ USA
JPN ↔ USA
FRA ↔ USA
USA ↔ KOR
USA ↔ AUS
GBR ↔ AUS
DEU ↔ CHE
DEU ↔ GBR
ITA ↔ USA
HKG ↔ CHN
USA ↔ CHE
ESP ↔ USA
GBR ↔ CAN
FRA ↔ GBR
ISR ↔ USA
USA ↔ TWN
FRA ↔ DEU
BRA ↔ USA
JPN ↔ CHN
NLD ↔ USA
RUS ↔ USA
GBR ↔ IRL
DEU ↔ AUT
ITA ↔ GBR
FRA ↔ CAN
FRA ↔ CHE
DEU ↔ NLD
ITA ↔ FRA
SWE ↔ USA
USA ↔ TUR
USA ↔ MEX
NLD ↔ GBR
GBR ↔ ESP
IND ↔ GBR
TWN ↔ CHN
Total bilateral flows (lower axis)
For FRA↔CAN, the lozenge shows that CAN gains 31% of total bilateral flows.
Net flow, percentage of bilateral flows (upper axis)
Bilateral flows
Definitions
Scientific authors are listed in the Scopus database ofpeer-reviewed scientific publications and identified bythe unique author ID assigned by Elsevier. Interna-tional mobility is inferred from authors with at leasttwo publications over the reference period and isbased on changes in institutional affiliation andsequence of publications. Stayers maintain the samecountry of affiliation over their entire record. Returneesbegin in the final country but “move” before returning,while new inflows are not first affiliated to institutionsin their last recorded country. Outflows concern thosewho do not return to their first affiliation. A proxy ofscientific impact is estimated by calculating, for eachauthor and mobility profile, the median across jour-nals’ source-normalised impact per paper (SNIP). SNIPmeasures citation impact by calculating the ratio of ajournal’s citation count per paper and the citationpotential in its subject field.
OECD SCIENCE, TECHNOLOGY AND INDUSTRY SCOREBOARD 2013 © OECD 2013132
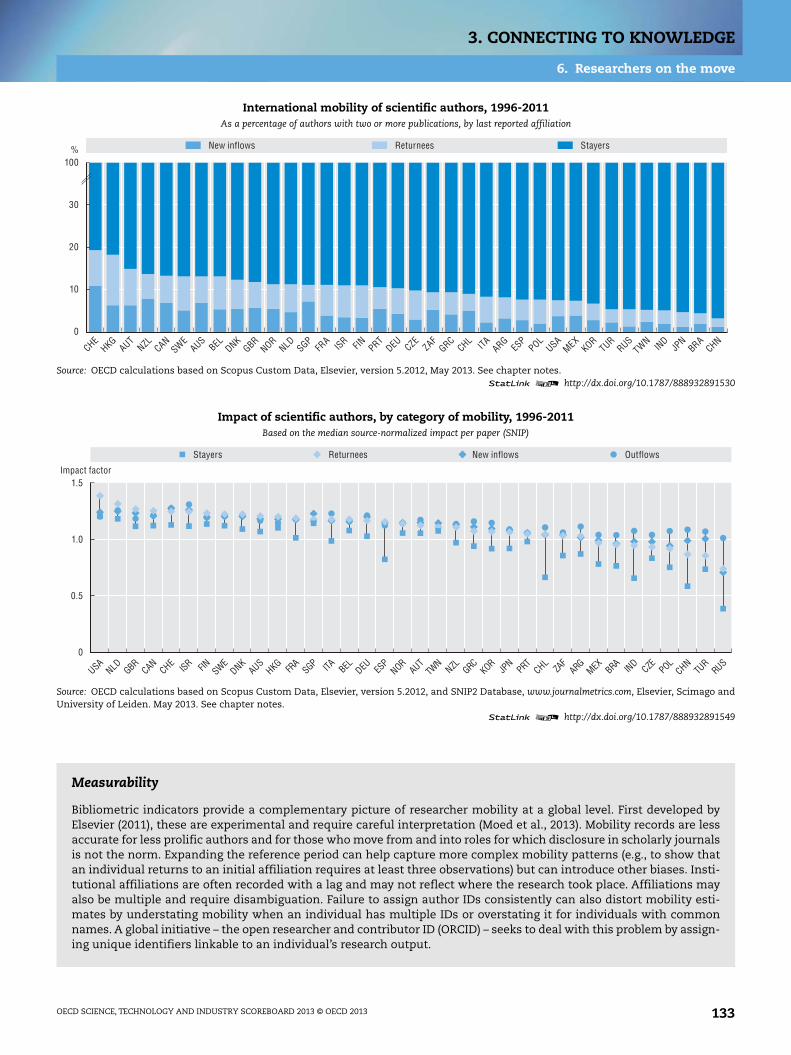
3. CONNECTING TO KNOWLEDGE
6. Researchers on the move
International mobility of scientific authors, 1996-2011As a percentage of authors with two or more publications, by last reported affiliation
Source: OECD calculations based on Scopus Custom Data, Elsevier, version 5.2012, May 2013. See chapter notes.1 2 http://dx.doi.org/10.1787/888932891530
Impact of scientific authors, by category of mobility, 1996-2011Based on the median source-normalized impact per paper (SNIP)
Source: OECD calculations based on Scopus Custom Data, Elsevier, version 5.2012, and SNIP2 Database, www.journalmetrics.com, Elsevier, Scimago andUniversity of Leiden. May 2013. See chapter notes.
1 2 http://dx.doi.org/10.1787/888932891549
Measurability
Bibliometric indicators provide a complementary picture of researcher mobility at a global level. First developed byElsevier (2011), these are experimental and require careful interpretation (Moed et al., 2013). Mobility records are lessaccurate for less prolific authors and for those who move from and into roles for which disclosure in scholarly journalsis not the norm. Expanding the reference period can help capture more complex mobility patterns (e.g., to show thatan individual returns to an initial affiliation requires at least three observations) but can introduce other biases. Insti-tutional affiliations are often recorded with a lag and may not reflect where the research took place. Affiliations mayalso be multiple and require disambiguation. Failure to assign author IDs consistently can also distort mobility esti-mates by understating mobility when an individual has multiple IDs or overstating it for individuals with commonnames. A global initiative – the open researcher and contributor ID (ORCID) – seeks to deal with this problem by assign-ing unique identifiers linkable to an individual’s research output.
%100
30
20
10
0
CHEHKG
AUTNZL CAN
SWEAUS
BEL DNKGBR
NORNLD SGP
FRA
ISR FIN PRTDEU CZE
ZAFGRC
CHL ITA ARGES
PPOL
USAMEX
KORTUR
RUSTWN
IND
JPN
BRACHN
New inflows Returnees Stayers
1.5
1.0
0.5
0
Impact factor
USANLD GBR
CANCHE
ISR FIN SWEDNK
AUSHKG
FRA
SGP ITA BEL DEU ESP
NORAUT
TWN
NZL GRCKOR
JPN
PRTCHL
ZAF
ARGMEX BRA
IND
CZE POLCHN
TUR
RUS
Returnees OutflowsStayers New inflows
OECD SCIENCE, TECHNOLOGY AND INDUSTRY SCOREBOARD 2013 © OECD 2013 133

3. CONNECTING TO KNOWLEDGE
7. Research excellence
Top-cited publications provide a measure of “quality-adjusted” research output. The United States led the pro-duction of scientific publications over 2003-11. AlthoughChina accounts for the second largest number of scientificdocuments, it lags the United Kingdom and Germany interms of numbers of highly cited documents. Switzerlandhas the largest share of documents with a high citationimpact among domestic publications, closely followed bythe Netherlands and Denmark.
Top-cited publications are more likely to involve scientificcollaboration across institutions (international and domes-tic) than “average” publications. The collaboration gap isparticularly large for the Russian Federation, Poland, theSlovak Republic and Estonia.
International collaboration rates and average impact arehighly correlated. Countries with high shares of top-citedpublications tend to have higher collaboration rates. Excep-tions include the United States (high impact but low collab-oration) and Indonesia (low impact but high collaboration).International collaboration appears to allow countries toattain higher citation impact rates than they would other-wise achieve. For many, this involves participating in proj-ects led by experts in centres of excellence located abroad.Adjusting counts of high-impact documents for documentswith a non-resident corresponding (i.e. leading) authorwould significantly reduce most economies’ share of top-cited publications. For example, in Switzerland, the sharewould drop from nearly 20% to 10%. However, for the UnitedStates, the adjustment is fairly minor, from 17% to 14% ofdomestic publications. It is therefore the economy with thelargest share of high-impact, domestically led documents,followed by the Netherlands and the United Kingdom. Thissuggests that authors from these countries are more likelyto feature as leading authors in international collaborations.
The quantity and quality of scientific production,2003-11
Number of documents and percentage of world's top-cited
Source: OECD and SCImago Research Group (CSIC), Compendium ofBibliometric Science Indicators 2014, based on Scopus Custom Data,Elsevier, May 2013. See chapter notes.
1 2 http://dx.doi.org/10.1787/888932891568
0 500 1 000 1 500 2 000
0 5 10 15 20%
USA
CHN
GBR
DEU
JPN
FRA
CAN
ITA
ESP
IND
AUS
KOR
NLD
BRA
RUS
CHE
POL
SWE
TUR
BEL
ISR
AUT
DNK
GRC
FIN
MEX
CZE
NOR
PRT
NZL
ZAF
IRL
HUN
CHL
SVK
SVN
IDN
EST
ISL
LUX
4 260
2 013
Number of publications (lower axis)
Percentage of top cited publications (upper axis)
Number of publications (thousands)
Definitions
Estimates of scientific production are based on wholecounts of documents by authors affiliated to institu-tions in each economy. The number of top-cited publica-tions is an indicator of research excellence and representsthe 10% most-cited papers in each scientific field. Col-laboration is defined at the institutional level. A scien-tific document is deemed to involve collaboration ifmultiple institutions are listed in the affiliations of theauthor(s). Top-cited publications attributed to a giveneconomy are defined as having a domestic leadingauthor when the document’s corresponding author isaffiliated to a domestic institution.
OECD SCIENCE, TECHNOLOGY AND INDUSTRY SCOREBOARD 2013 © OECD 2013134

3. CONNECTING TO KNOWLEDGE
7. Research excellence
Top-cited publications, by type of collaboration, 2003-11As a percentage of top-cited and all documents, whole counts
Source: OECD and SCImago Research Group (CSIC), Compendium of Bibliometric Science Indicators 2014, based on Scopus Custom Data, Elsevier, May 2013.See chapter notes.
1 2 http://dx.doi.org/10.1787/888932891587
The quality of scientific production and international collaboration, 2003-11As a percentage of scientific publications
Source: OECD and SCImago Research Group (CSIC), Compendium of Bibliometric Science Indicators 2014, based on Scopus Custom Data, Elsevier, May 2013.See chapter notes.
1 2 http://dx.doi.org/10.1787/888932891606
Measurability
Peer-reviewed scientific publications convey the research findings of scientists worldwide. Subsequent citations by otherauthors provide an indirect but objective source of information about the quality of research outputs. This does not how-ever take into account the use of the scientific information by inventors or practitioners who are less likely to publish inpeer-reviewed journals. Publications are attributed to countries on the basis of the authors’ institutional affiliations. Thisrequires a means of counting publications with co-authors from different units. One approach is to fractionalise publica-tions by contributing units, so that reported figures add up to the total number of publications (each document has thesame weight). An alternative is to report total counts per unit (the whole counts approach), which gives equal weight of oneto each of the document’s authoring units. Although the choice does not much affect country rankings, care should beexercised when interpreting either type of results. An alternative is to attribute the entire document to its leading author’saffiliation using information on the identity of the corresponding author (Moya-Onegón et al., 2013).
%100
60
80
40
20
0
IDN ISL
LUX
RUSCHL
SVKMEX
HUNCZE
PRTNOR
CHEES
TZAF
AUTBEL ES
PDNK ITA FIN SWE
BRAPOL
IRL
AUSNLD SVN
DEU NZL CAN ISRGBR
GRCKOR
FRA
JPN
USACHN
TURIN
D
International collaboration Domestic collaboration No collaboration
Collaboration (international and domestic) – all publications
% %20
15
10
5
0
80
60
40
20
0
CHENLD DNK ISL
USABEL SWE
GBRCAN
NOR FIN AUSLU
XAUT IRL
ISRDEU NZL FR
A ITA EST
PRTES
PGRC
ZAF
KORSVN
HUNCHL
IDN
JPN
CZE MEX TUR
IND
CHNBRA
SVKPOL
RUS
Top cited publications, domestic leading author Top cited publications, other leading author
International collaborations (right-hand scale)
OECD SCIENCE, TECHNOLOGY AND INDUSTRY SCOREBOARD 2013 © OECD 2013 135

3. CONNECTING TO KNOWLEDGE
8. Science for innovation
References to scientific literature in patents provide an indi-cator of knowledge flows between the science base and theinnovation system. Scientific authors affiliated to US-basedinstitutions account for more than a third of all scientificdocuments cited in patents in the areas of biotechnology,health, nanotechnology, ICT and environment. Available fig-ures reveal a degree of specialisation in the production ofpatent-relevant science across technology areas. China,Japan and Korea have relatively larger shares of science rel-evant to nanotechnology and the environment. The UnitedStates accounts for 41% of total patent citations in ICT, wellabove its share in other areas. Among the areas considered,environment technologies are an important focus of patent-relevant science in Germany, while biotechnology andhealth-relevant science play an important role in the UnitedKingdom.
Biotechnology patents draw on a wide range of life sciencesdisciplines, among which clinical science leads with 30% ofcitations. The distribution is similar in health-relatedtechnology. For nanotechnology, instead, just five scientificfields account for 90% of citations. ICT patents draw onmany of the life sciences, owing in part to the importance ofICT for new medical devices.
For each technology, differences in the shares accounted forby different geographical areas in the contributing sciencefields are not pronounced. The United States accounts for50% of all computer science relevant to ICT, a higher sharethan for other fields cited by ICT patents. Japan accounts fornearly 15% of physics documents cited in environment-related patents and the BRIICS specialise in chemistry andmaterials science for nanotechnology patents.
Main sources of scientific documents cited in patents,selected technology areas, 2001-11
As a percentage of scientific documents cited, by technology area
Source: OECD and Japan Science and Technology Agency (JST), based onThomson Reuters Web of Science, Derwent World Patents Index andDerwent Patents Citation Index data, June 2013. StatLink contains moredata. See chapter notes.
1 2 http://dx.doi.org/10.1787/888932891625
0 5 10
BRA
IND
FIN
AUT
DNK
ISR
BEL
KOR
ESP
SWE
CHN
CHE
AUS
NLD
ITA
CAN
FRA
GBR
DEU
JPN
USA
%
37.938.237.941.231.4
Biotechnology Health
Nanotechnology ICT
Environment
Definitions
A field of science is described as relevant to a giventechnology area if it accounts for a significant share ofthe peer-reviewed scientific literature in references tonon-patent literature in patent documents. Fields ofscience correspond to the Thomson Reuters EssentialScience Indicators 22-field classification of journals.International Patent Classification (IPC) codes providethe basis for defining the relevant technology areas.Patents in health-related technologies comprisemedical technologies and pharmaceuticals. The listof environment-related patent codes is available atwww.oecd.org/env/consumption-innovation/indicator.htm.The list of biotechnology and ICT-related patent codesis available at www.oecd.org/sti/inno/40807441.pdf.Nanotechnology-related patents are defined as thosewith IPC codes B82B and B82Y. The geographic distri-bution of scientific publications cited in different areasis based on the institutional affiliation of authors.
OECD SCIENCE, TECHNOLOGY AND INDUSTRY SCOREBOARD 2013 © OECD 2013136

3. CONNECTING TO KNOWLEDGE
8. Science for innovation
Main scientific sources of biotechnology, nanotechnology and ICT patents, 2001-11As a percentage of cited scientific publications, by technology area
Source: OECD and Japan Science and Technology Agency (JST), based on Thomson Reuters Web of Science, Derwent World Patents Index and DerwentPatents Citation Index data, June 2013. See chapter notes. 1 2 http://dx.doi.org/10.1787/888932891644
Main scientific sources of health and environment-related patents, 2001-11As a percentage of cited scientific publications, by technology area
Source: OECD and Japan Science and Technology Agency (JST), based on Thomson Reuters Web of Science, Derwent World Patents Index and DerwentPatents Citation Index data, June 2013. See chapter notes. 1 2 http://dx.doi.org/10.1787/888932891663
Measurability
Constructing indicators on the sources of scientific knowledge in patent documents, e.g. fields of science and authoraffiliation, requires linking references in the patent document to scholarly publications. The link is based on the non-patent literature (NPL) in commercial novelty-based patent families with priority dates 2001-11, using the ThomsonReuters Derwent World Patents Index and Derwent Patents Citation Index database of patent publications by majorpatent offices. It relies on an algorithm developed by Thomson Reuters and Japan’s Science and Technology Agency,and matches NPL references to the Thomson Reuters Web of Science database, an index of peer-reviewed scientificliterature. In order to focus on recent scientific literature, only publications from 2001 to 2011 are considered. The attri-bution of field of science and country of origin is based on unambiguously matched references. Estimates are on awhole counts basis and give full credit to each combination of reference and contributing country. Results may be sen-sitive to the choice of data sources, observation period, matching process and counting method used.
50
40
20
30
10
0
%
United States EU28 Japan BRIICS Rest of the world
Biotechnology ICTNanotechnology
Clinica
l med
icine
Biolog
y/bioc
hemist
ry
Molecu
lar bi
ology
/gene
tics
Chemist
ry
Immun
ology
Microb
iolog
y
Neuros
cienc
e/beh
avior
Plant/a
nimal s
cienc
e
Chemist
ry
Materia
ls scie
nce
Physic
s
Engin
eerin
g
Clinica
l med
icine
Clinica
l med
icine
Physic
s
Chemist
ry
Biolog
y/bioc
hemist
ry
Engin
eerin
g
Molecu
lar bi
ology
/gene
tics
Materia
ls scie
nce
Immun
ology
Compu
ter sc
ience
50
40
20
30
10
0
%
United States EU28 Japan BRIICS Rest of the world
Health Environment
Clinica
l med
icine
Biolog
y/bioc
hemist
ry
Chemist
ry
Molecu
lar bi
ology/g
eneti
cs
Pharm
acolo
gy/tox
icolog
y
Immun
ology
Neuro
scien
ce/be
havio
r
Microb
iolog
y
Chemist
ry
Materia
ls sc
ience
Engin
eerin
g
Physic
s
Biolog
y/bioc
hemist
ry
Envir
onmen
t/eco
logy
Microb
iolog
y
OECD SCIENCE, TECHNOLOGY AND INDUSTRY SCOREBOARD 2013 © OECD 2013 137

3. CONNECTING TO KNOWLEDGE
9. From knowledge to inventions
Inventions seeking patent protection must disclose theprior knowledge on which they rely: existing patents, scien-tific work and other sources of knowledge. These so-calledbackward citations are used to assess an invention’s patent-ability and to define the legitimacy of its claims. They canalso be used to uncover science-technology links, i.e. theextent to which technology developments, in the form ofpatented inventions, rely on science contained in non-patent literature (NPL): scientific publications, conferenceproceedings, databases and other relevant literature.
The share of inventions that build on NPL varies widelyacross technology fields and economies. Industrial struc-ture, level of development, technological specialisation andthe maturity of technology fields help to explain differencesin observed propensities to cite NPL. More than 50% ofIndian patents cite NPL, whereas the world and OECD aver-ages are below 30%. Reliance on NPL has generally increasedover time, in terms of the number of patents citing NPL andthe average share of NPL citations per patent in biotechnol-ogy, nanotechnology, ICT, health and environmentaltechnologies.
More than 20% of forward citations are to patents that citeNPL, with shares that exceed 50% in biotechnology and bio-materials, pharmaceuticals and digital communications.On average, around 4% of forward citations are to patentsthat do not cite any prior art, although for IT methods,engines and pumps, and thermal devices they are above 9%.The novelty of the fields and the lack of relevant prior artmay explain these patterns.
Patents citing non-patent literature by technology field,1997-2002 and 2007-12
As a percentage of total patents by economies
Source: OECD calculations based on the Worldwide Patent StatisticalDatabase, EPO, April 2013. See chapter notes.
1 2 http://dx.doi.org/10.1787/888932891682
0 60%
IND
RUS
SVN
SGP
HUN
IRL
CAN
BEL
CHN
ISR
AUS
FIN
DNK
NLD
ESP
GBR
NZL
SWE
FRA
USA
ZAF
NOR
POL
CHE
BRA
CZE
JPN
KOR
LUX
AUT
DEU
TWN
ITA
TUR
10 20 30 40 50
2 451
922
672
1 803
609
2 922
17 257
12 584
8 956
12 072
6 426
5 360
9 722
7 469
26 364
7 323
27 073
909
18 338
50 844
207 710
697
2 701
974
30 622
796 945
763 132
1 095
759
337 862
129 302
28 308
2 203
8 666
138 806
6 356
24 057
1 455
Chemistry Electrical eng.
Instruments Mechanical eng.
Other fields
Total EPO patents 2007-12
1997-2002
BRIICS
WLD
OECD
EU28
Definitions
Backward citations are references to prior art con-tained in patent documents. Forward citations arecitations received by a patent. Non-patent literaturerefers to backward citations to peer-reviewed scientificpapers, conference proceedings, databases (e.g. DNAstructures, gene sequences, chemical compounds,etc.) and other relevant literature, with the exceptionof patent abstracts and commercial patent databases.The share of NPL citations is calculated as the ratio ofthe number of NPL citations to the overall number ofcitations contained in a patent document. Technologyfields are defined according to Schmoch’s classifica-tion (WIPO, 2013) and rely on the International PatentClassification (IPC) codes of the patent document. Keydomains, here called selected technologies, were iden-tified by groups of experts on the basis of the IPCclasses and the ad hoc tagging systems of the EuropeanClassification System (ECLA) that highlight the area ofapplication of patented inventions.
OECD SCIENCE, TECHNOLOGY AND INDUSTRY SCOREBOARD 2013 © OECD 2013138

3. CONNECTING TO KNOWLEDGE
9. From knowledge to inventions
Patents citing non-patent literature, selected technologies, 1997-2002 and 2007-12Share of citations to NPL in backward citations, average
Source: OECD calculations based on the Worldwide Patent Statistical Database, EPO, April 2013. See chapter notes.1 2 http://dx.doi.org/10.1787/888932891701
Citations to patents that include non-patent literature, by technology fields, 2007-12Share of total forward citations
Source: OECD calculations based on the Worldwide Patent Statistical Database, EPO, April 2013. See chapter notes.1 2 http://dx.doi.org/10.1787/888932891720
Measurability
Only patents published by the European Patent Office (EPO) are considered. Forward citation counts are based on EPOpatents cited and take into account patent equivalents, that is, patent documents protecting the same invention atseveral patent offices. Only forward citations deemed particularly relevant for the examined patent – i.e. citations thatexaminers classify as I, X or Y (see Squicciarini, Dernis and Criscuolo, 2013) – are considered. Forward citations arecounted over a period of 5 years after the publication date (typically 18 months after the filing date of the application).This should allow time for observing the citation patterns that characterise the technology fields. Backward countsinstead concern all NPL cited in the patent document and are not restricted to I, X or Y classes. Fractional counts areused to assign patents to technology fields and to economies for both backward and forward citations. All citationcounts include self-citations. The results may be contingent upon the data source used, the citation and countingmethods followed and the observation period.
60
50
40
30
20
10
1997-2002 2007-12 1997-2002 2007-12 1997-2002 2007-12 1997-2002 2007-12 1997-2002 2007-120
% ICT Biotechnology Nanotechnologies Health Environment All technologies (average)
Japan EU28 United States BRIICS World
100
75
50
25
0
% Forward citations of patents with NPL Forward citations of patents without NPL
Biotec
hnolo
gy
Bio mate
rials
Pharm
aceu
ticals
Digital
commun
icatio
n
Micro- a
nd na
no-te
ch.
Food
chem
istry
Organ
ic ch
emist
ry
Compu
ter te
chno
logy
Basic
commun
icatio
n
IT meth
ods
Semico
nduc
tors
Telec
ommun
icatio
ns
Materia
ls, m
etallu
rgy
Basic
chem
istry
Optics
Measu
remen
t
Audio-vi
sual
tech.
All tec
hnolo
gy fiel
ds
Polymers
Surfac
e and
coati
ng
Chemica
l eng
.
Contro
l
Electr
ical m
achin
ery
Envir
onmen
tal te
ch.
Medica
l tech
nolog
y
Other s
pecia
l mac
hines
Texti
le an
d pap
er mac
hines
Engin
es, p
umps
, turb
ines
Machin
e too
ls
Therm
al de
vices
Other c
onsu
mer go
ods
Trans
port
Furn
iture,
games
Handli
ng an
d log
istics
Mecha
nical
elemen
ts
Civil e
ng.
OECD SCIENCE, TECHNOLOGY AND INDUSTRY SCOREBOARD 2013 © OECD 2013 139

3. CONNECTING TO KNOWLEDGE
10. Inventions across borders
The degree to which patented innovations result from col-laboration by inventors located in different economies canbe used as a measure of the internationalisation of research,of international R&D co-operation and of knowledgeexchange among innovators.
The general rise in international co-inventions of patentsshows that knowledge creation increasingly relies on externalcontacts, collaboration and exchanges that allow innovatorsto gain access to the competences and skills they need.Across economies, however, the share of patented inven-tions due to international teams ranges from 2% to 24%.Over time, economies such as India, Brazil and the RussianFederation have relied relatively more on their own sciencebase than on international co-invention. In contrast,Ireland, Hungary and the United Kingdom appear to relyincreasingly on international teams of inventors.
There are also marked differences in the extent to whichpatents in different technology fields involve internationalcollaboration of inventors. In polymers and organic or foodchemistry, international co-inventions account for morethan 12% of patented inventions, whereas in audio-visualtechnologies, transport, furniture and games, they generallyaccount for around 4%.
When comparing the share of patents owned by an economywith the proportion of these patents that were fullyinvented in another economy or economies, it appears thatmany economies owning a large share of patents inventedby foreign businesses have large multinational firms thatperform R&D abroad. The tax environment is also likely toplay a role in the location of the intellectual property.
International co-inventions in patents,1999-2001 and 2009-11
As a percentage of the economy’s total patents
Source: OECD, Patent Database, June 2013. See chapter notes.1 2 http://dx.doi.org/10.1787/888932891739
0 105 15 20 25%
BEL
CHE
TWN
IRL
POL
GRC
HUN
CAN
PRT
CZE
SGP
SAU
GBR
IND
AUT
UKR
DNK
RUS
MEX
SWE
NZL
FIN
FRA
NLD
NOR
MYS
DEU
AUS
CHL
BRA
ISR
SVN
ZAF
ESP
ITA
USA
CHN
TUR
KOR
JPN
2009-11 1999-2001
3.2
6.2
0.9
1.0
0.7
0.3
0.6
7.5
0.4
0.4
1.7
0.3
15.1
4.5
3.6
0.4
3.1
2.5
0.5
7.6
129.6
0.8
4.1
19.3
8.4
1.9
0.9
47.3
4.8
0.3
1.5
4.5
0.3
0.8
4.9
8.4
395.9
119.1
45.8
36.4
1.2
24.8
95.0
Number of patents, thousands,2009-11
EU28
OECD
BRIICS
Definitions
International co-inventions feature at least one foreignco-inventor in patents invented domestically. Patentsin different technology fields may have a differentpropensity to involve co-invention. The co-inventionindicator is calculated by dividing the percentage ofinternational co-inventions by the total number ofpatents invented domestically in the same field. Tech-nology fields are defined according to Schmoch’sclassification (WIPO, 2013) and rely on the Interna-tional Patent Classification (IPC) codes contained inthe patent document. Foreign inventions are patents forwhich all of the inventors reside in economies otherthan that of the owner(s). Data relate to publishedpatent applications filed through the PCT system.
OECD SCIENCE, TECHNOLOGY AND INDUSTRY SCOREBOARD 2013 © OECD 2013140

3. CONNECTING TO KNOWLEDGE
10. Inventions across borders
International co-inventions by technology fields, 1999-2001 and 2009-11As a percentage of PCT patent applications.
Source: OECD, Patent Database, June 2013. See chapter notes.1 2 http://dx.doi.org/10.1787/888932891758
Foreign inventions owned by economies, 2009-11Relative to their share in patent applications, percentages, axis in logarithmic scale
Source: OECD, Patent Database, June 2013. See chapter notes.1 2 http://dx.doi.org/10.1787/888932891777
Measurability
Inventors have differing specialisations and knowledge assets and often require competences or resources beyondtheir national borders. The resulting international collaboration may take the form of international co-inventions bya multinational corporation (with research and innovation facilities in other economies); joint research ventures byprivate and public entities (e.g. firms and universities or public research organisations); or formal and informalnetworks of scientists. In the case of multinational corporations, international collaboration often reflects companies’wish to obtain geographically dispersed knowledge and/or to develop complementarities with foreign inventors. Thelocation of patent ownership may reveal the importance of intellectual property (IP) tax regimes and indirectly pointsto the attractiveness of tax incentives for IP revenues and the importance of tax planning strategies. Using data fromdifferent patent offices may lead to different results.
15
10
5
0
% 1999-20012009-11
Polymers
Organ
ic ch
emist
ry
Food
chem
istry
Pharm
aceu
ticals
Basic
chem
istry
Biotec
hnolo
gy
Bio mate
rials
Chemica
l eng
.
Digital
commun
icatio
n
Materia
ls, m
etallu
rgy
Texti
le an
d pap
er mac
hines
All tec
hnolo
gies
Compu
ter te
chno
logy
Surfac
e and
coati
ng
Measu
remen
t
Envir
onmen
tal te
ch.
Civil e
ng.
Medica
l tech
nolog
y
Telec
ommun
icatio
ns
Other s
pecia
l mac
hines
Basic
commun
icatio
n
IT meth
ods
Handli
ng an
d log
istics
Engin
es, p
umps
, turb
ines
Semico
nduc
tors
Contro
l
Therm
al de
vices
Electr
ical m
achin
ery
Machin
e too
lsOpti
cs
Other c
onsu
mer go
ods
Mecha
nical
elemen
ts
Audio-vi
sual
tech.
Trans
port
Furn
iture,
games
Micro-an
d nan
o-tech
.
1 5 10 30 100
50
10
1
0
AUS
AUTBEL
CAN
CHE
CHNDEU
DNKESP FIN
FRAGBR
IRL
ISR
ITA
JPN
KOR
LUXMYS
NLD
NOR
NZLPOL
RUS SGP
SWE
TWN
USA
VGBZAF
Share in total patents (%)
Axes in logarithmic scale Foreign inventions owned by economies (%)
EU28
OECD SCIENCE, TECHNOLOGY AND INDUSTRY SCOREBOARD 2013 © OECD 2013 141
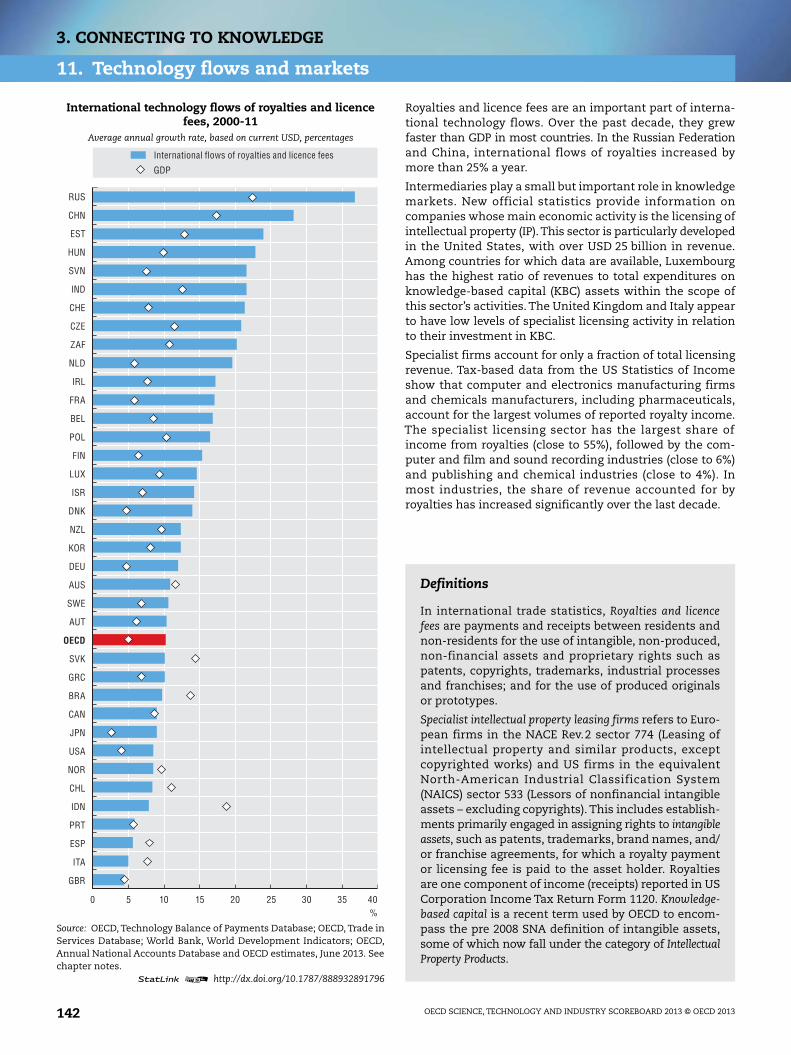
3. CONNECTING TO KNOWLEDGE
11. Technology flows and markets
Royalties and licence fees are an important part of interna-tional technology flows. Over the past decade, they grewfaster than GDP in most countries. In the Russian Federationand China, international flows of royalties increased bymore than 25% a year.
Intermediaries play a small but important role in knowledgemarkets. New official statistics provide information oncompanies whose main economic activity is the licensing ofintellectual property (IP). This sector is particularly developedin the United States, with over USD 25 billion in revenue.Among countries for which data are available, Luxembourghas the highest ratio of revenues to total expenditures onknowledge-based capital (KBC) assets within the scope ofthis sector’s activities. The United Kingdom and Italy appearto have low levels of specialist licensing activity in relationto their investment in KBC.
Specialist firms account for only a fraction of total licensingrevenue. Tax-based data from the US Statistics of Incomeshow that computer and electronics manufacturing firmsand chemicals manufacturers, including pharmaceuticals,account for the largest volumes of reported royalty income.The specialist licensing sector has the largest share ofincome from royalties (close to 55%), followed by the com-puter and film and sound recording industries (close to 6%)and publishing and chemical industries (close to 4%). Inmost industries, the share of revenue accounted for byroyalties has increased significantly over the last decade.
International technology flows of royalties and licencefees, 2000-11
Average annual growth rate, based on current USD, percentages
Source: OECD, Technology Balance of Payments Database; OECD, Trade inServices Database; World Bank, World Development Indicators; OECD,Annual National Accounts Database and OECD estimates, June 2013. Seechapter notes.
1 2 http://dx.doi.org/10.1787/888932891796
0 10 20 30 355 15 25 40%
RUS
CHN
EST
HUN
SVN
IND
CHE
CZE
ZAF
NLD
IRL
FRA
BEL
POL
FIN
LUX
ISR
DNK
NZL
KOR
DEU
AUS
SWE
AUT
OECD
SVK
GRC
BRA
CAN
JPN
USA
NOR
CHL
IDN
PRT
ESP
ITA
GBR
International flows of royalties and licence fees
GDP
Definitions
In international trade statistics, Royalties and licencefees are payments and receipts between residents andnon-residents for the use of intangible, non-produced,non-financial assets and proprietary rights such aspatents, copyrights, trademarks, industrial processesand franchises; and for the use of produced originalsor prototypes.
Specialist intellectual property leasing firms refers to Euro-pean firms in the NACE Rev.2 sector 774 (Leasing ofintellectual property and similar products, exceptcopyrighted works) and US firms in the equivalentNorth-American Industrial Classification System(NAICS) sector 533 (Lessors of nonfinancial intangibleassets – excluding copyrights). This includes establish-ments primarily engaged in assigning rights to intangibleassets, such as patents, trademarks, brand names, and/or franchise agreements, for which a royalty paymentor licensing fee is paid to the asset holder. Royaltiesare one component of income (receipts) reported in USCorporation Income Tax Return Form 1120. Knowledge-based capital is a recent term used by OECD to encom-pass the pre 2008 SNA definition of intangible assets,some of which now fall under the category of IntellectualProperty Products.
OECD SCIENCE, TECHNOLOGY AND INDUSTRY SCOREBOARD 2013 © OECD 2013142

3. CONNECTING TO KNOWLEDGE
11. Technology flows and markets
Revenues of specialist intellectual property leasing firms, 2010Total and as a percentage of business investment in R&D, other innovative property and economic competences
Source: OECD, based on data from Eurostat, Annual detailed enterprise statistics for services; United States Census Bureau, 2011 Annual ServicesReport; and INTAN-Invest Cross-country Intangible Investment Database, www.intan-invest.net, June 2013. See chapter notes.
1 2 http://dx.doi.org/10.1787/888932891815
Royalty income by industry, United States, 1999 and 2009As a percentage of revenues reported to the United States Internal Revenue Service
Source: OECD calculations based on United States Internal Revenue Service’s Statistics of Income, June 2013. See chapter notes.1 2 http://dx.doi.org/10.1787/888932891834
Measurability
The measurement of licensing flows is subject to various conceptual and practical difficulties. Licensing transactionsmay not involve the transfer of knowledge and may purely reflect tax planning strategies. Estimates may understateactual flows in the case of cross-licensing agreements if only net payments are reported. Companies may report someflows as property income, e.g. repatriated profits, rather than as payments for knowledge products. Many firms in theIP leasing sector are subsidiaries managing their parents’ IP portfolio without necessarily engaging in arms-lengthtransactions. As information on this sector has only become recently available, comparability may be limited whilebusiness registers and classification criteria adapt to the latest international classification of economic activities.Statistics of Income (SOI) data for active US-based corporations are estimated from a sample of corporate income taxreturns. They may include payments for the exploitation of natural resources. For more information on knowledgeflows, knowledge markets and their measurement, see www.oecd.org/sti/knowledge.
25 000
13 000
1 000250
150200
50100
0
16
13
102.5
1.52.0
0.51.0
0
USADEU FR
ALU
XAUT
GBR FIN ITA NORBEL ES
PDNK IR
LPRT
SWEPOL
EST
SVNHUN
CZE
%
Total revenues (left-hand scale) Revenues, as % of expenditures on intangibles (right-hand scale)
Million USD PPP
40 000
30 000
15 000
5 000
10 000
0
55
35
6
2
4
0
%
Royalty revenues, 2009 (left-hand scale) Percentage of revenue from royalties, 1999Percentage of revenue from royalties, 2009
Million USD
Compu
ter an
d
elec
tronic
prod
.man
.
Chemica
ls man
ufactu
ring
Broad
casti
ng an
d tele
coms
Publis
hing i
ndus
tries
Trans
porta
tion e
quipm
ent m
an.
Wholes
ale tr
ade,
nond
urab
le go
ods
Miscell
aneo
us m
anufa
cturin
g
Food
servi
ces a
nd dr
inking
plac
es
Motion
pictu
re an
d sou
nd re
c. ind
.
Profes
siona
l, scie
ntific
, and
tech
. ser.
Machin
ery m
anufa
cturin
g
Electr
ical e
q., ap
p., an
d com
p. man
.
Wholes
ale tr
ade,
durab
le go
ods
Less
ors o
f non
-fin.
intan
gible
asse
ts
Bevera
ge an
d tob
acco
prod
. man
.
Food
man
ufactu
ring
Paper
manufa
cturin
g
Mining
Genera
l merc
hand
ise st
ores
Accom
modati
on
Food
, bev
erage
and l
iquor
stores
Other t
ransp
ortat
ion an
d sup
port
act.
Infor
mation
and d
ata pr
oces
sing s
er.
OECD SCIENCE, TECHNOLOGY AND INDUSTRY SCOREBOARD 2013 © OECD 2013 143
3. CONNECTING TO KNOWLEDGE
Notes and References
3.1. R&D and knowledge flows
Business enterprise R&D funded by other companies, 2010
Data refer to 2010 except for Austria (2009), Brazil (2009), the Czech Republic (2011), Denmark (2009), Iceland (2009), NewZealand (2009), Norway (2011), South Africa (2009), Sweden (2009), Switzerland (2008) and the United States (2009).
Reported funding by other firms includes funding from other domestic enterprises that are part of the same group, exceptfor Finland and New Zealand.
For Brazil, data on the share of BERD funded by industry are not available.
Business funding of extramural R&D, by type of performer, 2010
Data refer to 2010 except for Austria (2009), Belgium (2009), the Czech Republic (2011), Germany (2009), New Zealand (2009),Norway (2011), Sweden (2009), Switzerland (2008) and the United States (2009).
“Other” includes funding to non-business institutions, both domestic and abroad. For Germany and Japan, it also includesfunding to enterprises abroad.
For the Czech Republic, Estonia, Italy, Korea, the Slovak Republic, Spain and Turkey, reported data exclude funding by non-R&D performers.
Business-funded R&D in the higher education and government sectors, 2001 and 2011
For Australia, data refer to 2000 and 2008 instead of 2001 and 2011.
For Austria, data refer to 2002 and 2009 instead of 2001 and 2011.
For Belgium, Iceland, Israel, the Netherlands and South Africa, data refer to 2009 instead of 2011.
For Chile, EU28, France, Germany, Italy, OECD, Portugal and Spain, data refer to 2010 instead of 2011.
For China, data refer to 2000 instead of 2001.
For Switzerland, data refer to 2000 and 2010 instead of 2001 and 2011.
3.2. Open innovation
General notes for all figures:
For Australia, data refer to financial year 2010/11 and include product, process, marketing and organisational innovatingfirms (including ongoing or abandoned innovation activities).
For Brazil, data refer to 2006-08. Only the following activities are included in the services sector: ISIC Rev.4 Divisions 58, 61,62 and 72.
Cyprus
The following note is included at the request of Turkey:
“The information in this document with reference to ‘Cyprus’ relates to the southern part of the Island. There is nosingle authority representing both Turkish and Greek Cypriot people on the Island. Turkey recognizes the TurkishRepublic of Northern Cyprus (TRNC). Until a lasting and equitable solution is found within the context of the UnitedNations, Turkey shall preserve its position concerning the ‘Cyprus issue’.”
The following note is included at the request of all the European Union Member States of the OECD and the EuropeanUnion:
“The Republic of Cyprus is recognised by all members of the United Nations with the exception of Turkey. The infor-mation in this document relates to the area under the effective control of the Government of the Republic of Cyprus.”
Israel
“The statistical data for Israel are supplied by and under the responsibility of the relevant Israeli authorities or thirdparty. The use of such data by the OECD is without prejudice to the status of the Golan Heights, East Jerusalem andIsraeli settlements in the West Bank under the terms of international law.
“It should be noted that statistical data on Israeli patents and trademarks are supplied by the patent and trademarkoffices of the relevant countries.”
OECD SCIENCE, TECHNOLOGY AND INDUSTRY SCOREBOARD 2013 © OECD 2013144

3. CONNECTING TO KNOWLEDGE
Notes and References
For Chile, data refer to 2009-10 and to firms with more than UF 2 400 in annual revenue. Data include product, process,organisational and marketing innovating firms. Ongoing or abandoned innovative activities are not identified. The indus-tries covered are based on ISIC Rev.3.1 and include a wider range of activities than the CIS, such as agriculture, forestry,fishing, construction and some services.
For Israel, data refer to 2006-08.
For Japan, data refer to financial years 2009/10 and 2010/11. Data are provisional estimates.
For Korea, data refer to 2005-07 and to firms with more than 10 employees in the manufacturing sector.
For Mexico, data refer to 2008-09 and to firms with 20 or more employees. The industries covered are based on ISIC Rev.3.1and include a wider range of activities, such as agriculture, construction and some services.
For New Zealand, data refer to financial years 2009/10 and 2010/11, and to firms with six or more employees with an annualgoods and services tax (GST) turnover figure greater than NZD 30 000. Data refer to product, process, organisational andmarketing innovating firms (including ongoing or abandoned innovation activities).
For the Russian Federation, data refer to 2009-11 and to firms with 15 or more employees. The industries covered are basedon NACE Rev.1.1 and include manufacturing (D), and services (64, 72, 73, 74).
For South Africa, data refer to 2005-07 and to firms with 20 or more employees, with a minimum turnover of between ZAR3 million and ZAR 6 million depending on the industry. Data also include the retail trade sector.
For Switzerland, data refer to 2009-11. Collaboration only refers to collaboration on R&D.
Additional notes:
External sources of knowledge for innovation, by type, 2008-10
In the Australian questionnaire it is only asked whether the relevant source was used, not the degree of importance of thesource.
For Germany, Israel, Luxembourg, the Netherlands and Switzerland, data refer to 2006-08.
In the New Zealand questionnaire, sources of information are defined as important, rather than highly important.
3.3. Collaboration on innovation
General notes for all figures:
See under 3.2.
Additional notes:
Firms engaging in collaboration on innovation, by R&D status, 2008-10
For Luxembourg, data refer to 2006-08.
For Spain, R&D status corresponds to 2010 only.
Firms collaborating on innovation with higher education or public research institutions, by firm size, 2008-10
For Ireland, Israel and Luxembourg, data refer to 2006-08.
For Mexico, data refer to collaboration with higher education institutions only.
3.4. International collaboration
General notes for all figures:
See under 3.2.
Additional notes:
National and international collaboration on innovation by firms, 2008-10 and Firms engaged in international co-operation, byfirm size, 2008-10
For Ireland and Luxembourg, data refer to 2006-08.
OECD SCIENCE, TECHNOLOGY AND INDUSTRY SCOREBOARD 2013 © OECD 2013 145

3. CONNECTING TO KNOWLEDGE
Notes and References
International collaboration on patents, 2007-11 and innovation, 2008-10
International co-inventions are measured as the share of patent applications filed under the Patent Cooperation Treaty(PCT) with at least one co-inventor located in a different country in total patents invented domestically. Patent counts arebased on the priority date, the inventor’s country of residence and whole counts.
3.5. Skills mobility
International and foreign students enrolled in tertiary education, 2011
Data refer to foreign students for the Czech Republic, France, Israel, Italy, Poland, the Slovak Republic and Turkey. Foreignstudents are defined on the basis of their country of citizenship; these data are not comparable with data on internationalstudents and are therefore presented separately in the table and chart.
Total enrolments include all international or foreign students. Distribution is based on the number of students with aknown field of education.
Data for Austria, Finland, Germany and Switzerland exclude tertiary-type B programmes.
Data for Canada and Luxembourg refer to 2010.
Data for the Netherlands exclude programmes in private education.
Labour turnover, by educational attainment, 2011
With the exception of the United States, the indicator for all employed individuals is computed on the basis of the OECD JobTenure Database as a share of declared figures for total employed (dependent employees and self-employed) of all agegroups. Estimates by level of educational attainment are based on an ad hoc tabulation of European Labour Force Survey dataand computed on a similar basis.
For the United States, data refer to the share of all wage and salary workers aged 16 and over with a year or less of tenurewith their current employer in January 2012.
Tertiary education refers to individuals who have graduated from tertiary education (ISCED 5 and 6 levels); low or no formaleducation refers to individuals with at most lower secondary education (ISCED 0, 1 and 2 levels).
For Australia and Canada, data refer to 2010.
For Brazil, data refer to 2009.
For Mexico, data refer to 2008.
Doctorate holders who changed jobs in the last ten years, 2009
For Belgium, Hungary, the Netherlands and Spain, data refer to graduates only from 1990 onwards.
For the Russian Federation, data refer only to those doctoral graduates employed as researchers and teachers.
For Spain, there is limited coverage of graduates who received their doctorate between 2007 and 2009.
EU15 total employment mobility is computed on the basis of the OECD Job Tenure Database and corresponds to the shareof 25-69 year-old employed individuals who have changed jobs in the last ten years.
3.6. Researchers on the move
International flows of scientific authors, 1996-2011
The minimum threshold for inclusion is over 2 000 bilateral flows.
General note:
International mobility of scientific authors, 1996-2011 and;
Impact of scientific authors, by category of mobility, 1996-2011
The minimum threshold per economy is over 25 000 scientific authors in the stayer category.
OECD SCIENCE, TECHNOLOGY AND INDUSTRY SCOREBOARD 2013 © OECD 2013146

3. CONNECTING TO KNOWLEDGE
Notes and References
Additional note:
Impact of scientific authors, by category of mobility, 1996-2011
International mobility of scientific researchers is inferred from authors listed in the Scopus Custom database of peer-reviewed scientific publications, with at least two documents over the reference period, based on changes in the location oftheir institutional affiliation. Stayers maintain an affiliation in a given reference country over the period. Outflows aredefined on the basis of the first affiliation. New inflows are defined on the basis of the final affiliation and exclude individ-uals who “return” to their original country of affiliation. The latter group are defined as “returnees”.
A proxy measure of scientific impact for researchers with different mobility patterns is estimated by calculating, for eachauthor and mobility profile, the median across the relevant journals’ source-normalised impact per paper (SNIP) over theentire period. A SNIP impact value that is higher than one means that the median attributed SNIP for authors of that country/category is above average.
3.7. Research excellence
General note for all figures:
Estimates are based on whole counts of documents by authors affiliated to institutions in each economy.
3.8. Science for innovation
General notes for all figures:
The link between patents and scientific literature is based on the non-patent literature (NPL) listed as relevant references in pat-ent documents in theThomson Reuters DerwentWorld Patents Index and Derwent Patents Citation Index databases. It is appliedto patents in selected technology areas, based on the International Patent Classification (IPC) codes in the patent document.
In order to identify whether NPL corresponds to a scientific document, NPL references were matched to the Thomson ReutersWeb of Science Database, an index of scientific literature. For matched references, scientific domains correspond to theThomsonReuters Essential Science Indicators 22-field classification (http://archive.sciencewatch.com/about/met/fielddef/). Geographical attri-bution of scientific documents is based on the document’s author’s affiliation, using a “whole counts” approach.
Only the main scientific domains accounting for 90% of total patent citations to the scientific literature are reported.
Additional notes:
Main sources of scientific documents cited in patents, selected technology areas, 2001-11
Patents in health-related technologies comprise medical technologies and pharmaceuticals. The list of environment-related patent codes is available at www.oecd.org/env/consumption-innovation/indicator.htm. The list of biotechnology and ICT-related patent codes is available at www.oecd.org/sti/inno/40807441.pdf. Nanotechnology-related patents are defined as thosewith IPC codes B82B and B82Y.
Main scientific sources of biotechnology, nanotechnology and ICT patents, 2001-11
The list of biotechnology and ICT-related patent codes is available at www.oecd.org/sti/inno/40807441.pdf. Nanotechnology-related patents are defined as those with IPC codes B82B and B82Y.
Main scientific sources of health and environment-related patents, 2001-11
The link between health-related patents and scientific literature is applied to patents in medical technologies and pharma-ceuticals following the classification presented in Schmoch (WIPO, 2008, revised in 2013).
The list of environment-related patent codes is available at www.oecd.org/env/consumption-innovation/indicator.htm.
OECD SCIENCE, TECHNOLOGY AND INDUSTRY SCOREBOARD 2013 © OECD 2013 147

3. CONNECTING TO KNOWLEDGE
Notes and References
3.9. From knowledge to inventions
General notes:
Patents citing non-patent literature by technology field, 1997-2002 and 2007-12 and;
Patents citing non-patent literature, selected technologies, 1997-2002 and 2007-12
Data refer to the citations made in patent applications filed at the European Patent Office (EPO), according to the publicationdate of the citing patent, the applicant’s residence and fractional counts.
Additional notes:
Patents citing non-patent literature by technology field, 1997-2002 and 2007-12
Only economies with more than 500 patents in 2007-12 are included in the figure. Patents are allocated to technology fields usingInternational Patent Classification (IPC) codes, following the classification presented in Schmoch (2008, revised in 2013).
Patents citing non-patent literature, selected technologies, 1997-2002 and 2007-12
Patents are allocated to technological fields using the International Patent Classification (IPC) or the European Patent Clas-sification (ECLA).
Citations to patents that include non-patent literature, by technology fields, 2007-12
Data refer to the citations made in patent applications filed at the European Patent Office (EPO), according to the publicationdate of the citing patent. Forward citations of patents refer to patents with NPL backward citations that are cited as partic-ularly relevant documents (I, X, Y) by EPO patents up to five years after the first publication. Patents are allocated to tech-nology fields using International Patent Classification (IPC) codes, following the classification presented in Schmoch (2008,revised in 2013).
3.10. Inventions across borders
International co-inventions in patents, 1999-2001 and 2009-11
International co-inventions are measured as the share of patent applications filed under the Patent Cooperation Treaty(PCT) with at least one co-inventor located in a different economy in the total patents invented domestically. Patent countsare based on the priority date, the inventor’s residence and fractional counts. Only economies with more than 250 patentsin 2009-11 are included.
International co-inventions by technology fields, 1999-2001 and 2009-11
International co-inventions are measured as the share of patent applications filed under the Patent Cooperation Treaty(PCT) with at least one co-inventor located in a different country in total patents. Patents are allocated to technology fieldsusing International Patent Classification (IPC) codes, following the classification presented in Schmoch (2008, revised in2013). Patent counts are based on the priority date and fractional counts by technology fields.
Foreign inventions owned by economies, 2009-11
Data refer to counts of patent applications filed under the Patent Cooperation Treaty, by priority date, applicant’s residenceand fractional counts. Foreign inventions owned by economies relate to the share of patents owned by a resident of an econ-omy for which no inventors reside in the given economy, as a share of total patents owned by that economy. Only econo-mies that applied for more than 250 patents over the period are included.
3.11. Technology flows and markets
International technology flows of royalties and licence fees, 2000-11
For Belgium and the Russian Federation, data refer to 2003-11.
For Denmark and Indonesia, data refer to 2005-11.
For the Netherlands, data refer to 2004-11.
For Norway, data refer to 2000-10.
OECD SCIENCE, TECHNOLOGY AND INDUSTRY SCOREBOARD 2013 © OECD 2013148
3. CONNECTING TO KNOWLEDGE
Notes and References
For Italy, data refer to 2000-07.
OECD excludes Iceland, Mexico and Turkey.
Revenues of specialist intellectual property leasing firms, 2010
For European countries, revenue estimates correspond to firms in NACE Rev.2 sector 774 (“Leasing of intellectual propertyand similar products, except copyrighted works”). For the United States, estimates correspond to NAICS sector 533 (“Lessorsof nonfinancial intangible assets – excluding copyrights”). Revenue estimates are divided by INTAN-Invest estimates ofbusiness sector investment in “new intangible assets” (R&D, design, new financial products, advertising, market research,training and organisational capital). This category approximately corresponds to the products within the scope of the IPleasing sector.
Royalty income by industry, United States, 1999 and 2009
Data on royalties and revenues (receipts) from the United States Internal Revenue Service’s Statistics of Income (SOI),Table 6 – Returns of Active Corporations, Form 1120, www.irs.gov/uac/SOI-Tax-Stats-Returns-of-Active-Corporations-Table-6,“Balance Sheet, Income Statement, Tax, and Selected Other Items, by Major Industry”. Figures are estimates based on sam-ples. Last accessed June 2013.
Only the 23 industries with the highest royalty income are reported. For 2009, Broadcasting and telecommunication is cal-culated as the sum of Broadcasting except Internet and Telecommunication (including paging, cellular, satellite, cable,internet, service providers, etc.). For 2009, Information and data processing services were calculated as the sum of Data pro-cessing services and Other information services.
References
Elsevier (2011), “International Comparative Performance of the UK Research Base: 2011”, Report commissioned by the UKDepartment for Business, Innovation and Skills.
Moed, H., M. Aisati and A. Plume (2013), “Studying Scientific Migration in Scopus”, Scientometrics, Vol. 94, No. 3, pp. 929-942.
Moya-Anegón, F. Guerrero-Bote, L. Bornmann and H. Moed (2013), “The research guarantors of scientific papers and the outputcounting: A promising new approach”, mimeo, accessed from www.lutz-bornmann.de/icons/guarantor.pdf, June 2013.
OECD and Eurostat (2005), Oslo Manual: Guidelines for Collecting and Interpreting Innovation Data, 3rd edition, OECD Publishing andStatistical Office of the European Communities, Luxembourg, www.oecd.org/sti/oslomanual.Doi: http://dx.doi.org/10.1787/9789264013100-en.
OECD (1990), “Proposed Standard Method of Compiling and Interpreting Technology Balance of Payments Data – TBP Manual 1990”, TheMeasurement of Scientific and Technological Activities Series, OECD Publishing. Doi: http://dx.doi.org/10.1787/9789264065567-en.
OECD (2002), Frascati Manual 2002. The Measurement of Scientific and Technological Activities. Proposed Standard Practice for Surveys onResearch and Experimental Development, 6th edition, OECD Publishing, www.oecd.org/sti/frascatimanual.Doi: http://dx.doi.org/10.1787/9789264199040-en.
OECD (2005), Measuring Globalisation: OECD Handbook on Economic Globalisation Indicators, OECD Publishing.Doi: http://dx.doi.org/10.1787/9789264108103-en.
OECD (2009), OECD Patent Statistics Manual, OECD Publishing. Doi: http://dx.doi.org/10.1787/9789264056442-en.
OECD (2011), Science, Technology and Industry Scoreboard 2011, OECD Publishing. Doi: http://dx.doi.org/10.1787/sti_scoreboard-2011-en.
OECD (2013), Education at a Glance 2013: OECD Indicators, OECD Publishing. Doi: http://dx.doi.org/10.1787/eag-2013-en.
OECD and SCImago Research Group-CSIC (forthcoming), Compendium of Bibliometric Science Indicators 2014.
Schmoch, U. (2008), “Concept of a Technology Classification for Country Comparisons, Final Report to the World IntellectualProperty Organisation (WIPO)”, revised in January 2013, www.wipo.int/export/sites/www/ipstats/en/statistics/patents/pdf/wipo_ipc_technology.pdf.
Squicciarini, M., H. Dernis and C. Criscuolo (2013), “Measuring Patent Quality: Indicators of Technological and Economic Value”, OECDScience, Technology and Industry Working Papers, No. 2013/03, OECD Publishing. Doi: http://dx.doi.org/10.1787/5k4522wkw1r8-en.
OECD SCIENCE, TECHNOLOGY AND INDUSTRY SCOREBOARD 2013 © OECD 2013 149


OECD SCIENCE, TECHNOLOGY AND INDU
4. TARGETING NEW GROWTH AREAS
1. R&D funding and specialisation2. Green innovation3. Health innovation4. Biotechnology R&D5. Nanotechnology R&D6. ICT innovation7. Broadband price and quality8. Fixed and wireless broadband9. Internet users10. Emerging technologiesNotes and References
The idea that innovation and technological change are important means of dealing withglobal and social challenges is well established. With this in mind, many countries havedeveloped research priorities and implemented funding programmes aimed at maximisingresearch quality and impact. This chapter monitors recent developments by presenting aselection of R&D and innovation indicators in new growth areas, including biotechnology,nanotechnology and health, environmental and information and communication technologies.The development of next-generation high-capacity broadband networks provides a platformfor developing and diffusing smart infrastructures for energy, health, transport and education,and indicators on broadband availability, quality and access compare developments acrosscountries. An experimental methodology reveals how the development of technologiesaccelerates over time and innovations emerge from the combination of different technologies.
STRY SCOREBOARD 2013 © OECD 2013 151

4. TARGETING NEW GROWTH AREAS
1. R&D funding and specialisation
The distribution of business R&D by economic activityreveals a pattern of specialisation that is influenced, but notentirely driven, by a country’s economic structure. In mostOECD countries, a limited number of activities account for alarge share of total business R&D. Chemicals, broadlydefined to encompass fuels, pharmaceuticals, other chemi-cals and minerals, is the major R&D activity in 8 out of the27 countries for which data are available. ICT equipmentmanufacturing is particularly important in Finland andKorea, while information services prevail in Ireland, Polandand Portugal. In the Czech Republic, France, Germany, Italyand Spain, transport equipment, including motor vehiclesand aerospace, ranks first.
Public policy plays an important role in influencing thedirection of innovation efforts. Government R&D budgets(GBAORD) provide an indication of policy priorities in therelative importance of various socio-economic objectives,such as defence, economic development or general fundingof the science and research base. In 2012, OECD govern-ments invested the equivalent of 0.8% of GDP in direct fund-ing of R&D at home or abroad. In relative terms, R&Dbudgets are largest in Finland and Korea at over 1% of GDP.The importance attributed to different objectives varieswidely across countries, reflecting national priorities anddifferences in their innovation systems. For example, theUnited States devotes a significant share of funds todefence, while Ireland and Korea place comparatively moreemphasis on economic development. Most countries, espe-cially Switzerland, dedicate the largest shares to support foradvancement of knowledge and general university funds.
R&D efforts by firms and governments may becomereflected in patented inventions. Medical technology is theleading patenting field in the United States and the UnitedKingdom, while electrical machinery dominates inGermany, Japan and the EU28. Digital communication tech-nologies feature as the top technology field for patenting inCanada, Korea and China. Patenting by technology area ismore concentrated in the BRIICS than in OECD economies.
R&D specialisation, top three performing industries, 2011Industry R&D expenditure as a percentage of total business enterprise R&D
Source: OECD, ANBERD Database, www.oecd.org/sti/anberd; Research andDevelopment Statistics Database, www.oecd.org/sti/rds; and nationalsources, June 2013. StatLink contains more data. See chapter notes.
1 2 http://dx.doi.org/10.1787/888932891853
0 20 40 60 80 100%
0.89
0.68
0.72
1.41
0.23
1.85
1.17
1.40
1.83
0.75
0.89
1.12
2.09
0.86
2.53
0.37
2.03
1.34
0.73
1.27
1.88
2.61
1.10
2.11
2.66
3.09
1.52
BERDas a percentage
of GDP
Agriculture, mining, utilities and constructionChemicals and mineralsICT equipmentInformation and comunication servicesElectrical equipment and machinery necTransport equipmentFinance and other business servicesR&D servicesWholesale, retail and transport services
CAN
ITA
ESP
FRA
POL
AUT
IRL
CHN
SVN
HUN
NLD
CZE
DNK
NOR
SWE
TUR
USA
BEL
PRT
AUS
DEU
JPN
GBR
CHE
FIN
KOR
EST
Definitions
GBAORD (government budget appropriations or out-lays for R&D) measures the funds committed by gov-ernments for R&D. These funder-reported estimatesallow for a breakdown by socio-economic objective, aclassification system intended to capture the primaryobjective of the research being funded (OECD, 2002).“Economic development” includes support for agricul-ture, industry and energy research; “Other” includesresearch on education and society and explorationand exploitation of space. Technology fields are based onInternational Patent Classification (IPC) codes in pat-ents, following Schmoch’s classification (2008, revisedin 2013).
OECD SCIENCE, TECHNOLOGY AND INDUSTRY SCOREBOARD 2013 © OECD 2013152
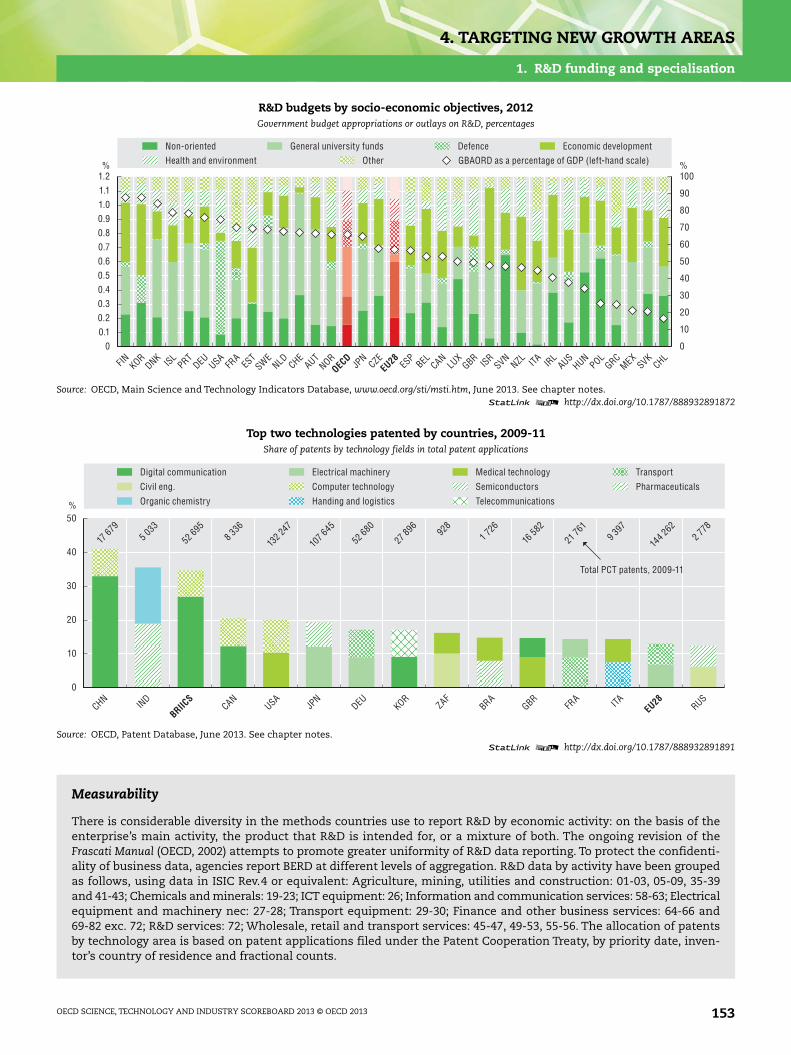
4. TARGETING NEW GROWTH AREAS
1. R&D funding and specialisation
R&D budgets by socio-economic objectives, 2012Government budget appropriations or outlays on R&D, percentages
Source: OECD, Main Science and Technology Indicators Database, www.oecd.org/sti/msti.htm, June 2013. See chapter notes.1 2 http://dx.doi.org/10.1787/888932891872
Top two technologies patented by countries, 2009-11Share of patents by technology fields in total patent applications
Source: OECD, Patent Database, June 2013. See chapter notes.1 2 http://dx.doi.org/10.1787/888932891891
Measurability
There is considerable diversity in the methods countries use to report R&D by economic activity: on the basis of theenterprise’s main activity, the product that R&D is intended for, or a mixture of both. The ongoing revision of theFrascati Manual (OECD, 2002) attempts to promote greater uniformity of R&D data reporting. To protect the confidenti-ality of business data, agencies report BERD at different levels of aggregation. R&D data by activity have been groupedas follows, using data in ISIC Rev.4 or equivalent: Agriculture, mining, utilities and construction: 01-03, 05-09, 35-39and 41-43; Chemicals and minerals: 19-23; ICT equipment: 26; Information and communication services: 58-63; Electricalequipment and machinery nec: 27-28; Transport equipment: 29-30; Finance and other business services: 64-66 and69-82 exc. 72; R&D services: 72; Wholesale, retail and transport services: 45-47, 49-53, 55-56. The allocation of patentsby technology area is based on patent applications filed under the Patent Cooperation Treaty, by priority date, inven-tor’s country of residence and fractional counts.
1.21.11.00.90.80.7
20
10
0.60.50.40.30.20.1
0 0
FIN KORDNK ISL
PRTDEU USA
FRA
EST
SWENLD CHE
AUTNOR
JPN
ESP
BEL CANLU
XGBR ISR
SVNNZL ITA IR
LAUS
HUNPOL
GRCMEX
SVKCHL
CZE
%100
90
80
70
60
50
40
30
%Health and environment Other GBAORD as a percentage of GDP (left-hand scale)Non-oriented General university funds Defence Economic development
OECD
EU28
%50
40
10
20
30
0
CHNEU28
BRIICS
BRAJP
NIN
DDEU ZAF
USACAN
GBRRUS
2 778
144 2
629 3
97
21 76
1
16 582
1 726928
27 89
6
52 680
107 6
45
132 2
478 3
36
52 69
55 0
33
17 67
9
ITAFRA
KOR
Telecommunications
Computer technology
Digital communication
Semiconductors
Electrical machinery
Pharmaceuticals
Medical technology
Organic chemistry
Transport
Handing and logistics
Civil eng.
Total PCT patents, 2009-11
OECD SCIENCE, TECHNOLOGY AND INDUSTRY SCOREBOARD 2013 © OECD 2013 153
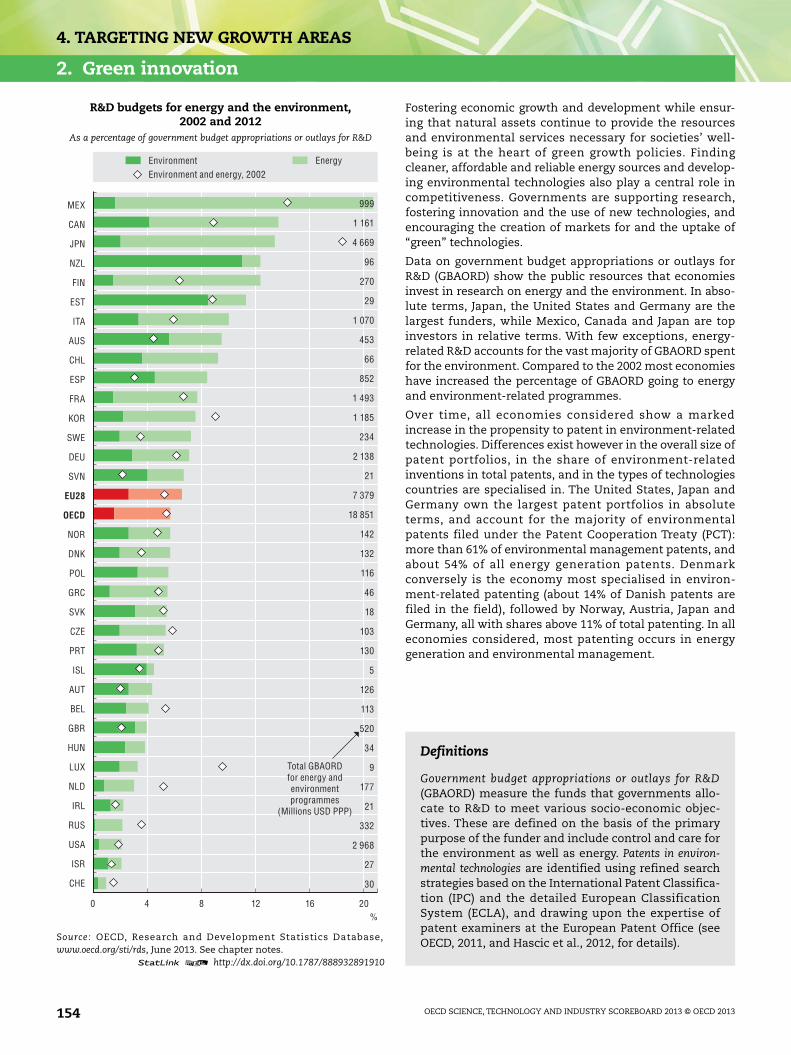
4. TARGETING NEW GROWTH AREAS
2. Green innovation
Fostering economic growth and development while ensur-ing that natural assets continue to provide the resourcesand environmental services necessary for societies’ well-being is at the heart of green growth policies. Findingcleaner, affordable and reliable energy sources and develop-ing environmental technologies also play a central role incompetitiveness. Governments are supporting research,fostering innovation and the use of new technologies, andencouraging the creation of markets for and the uptake of“green” technologies.
Data on government budget appropriations or outlays forR&D (GBAORD) show the public resources that economiesinvest in research on energy and the environment. In abso-lute terms, Japan, the United States and Germany are thelargest funders, while Mexico, Canada and Japan are topinvestors in relative terms. With few exceptions, energy-related R&D accounts for the vast majority of GBAORD spentfor the environment. Compared to the 2002 most economieshave increased the percentage of GBAORD going to energyand environment-related programmes.
Over time, all economies considered show a markedincrease in the propensity to patent in environment-relatedtechnologies. Differences exist however in the overall size ofpatent portfolios, in the share of environment-relatedinventions in total patents, and in the types of technologiescountries are specialised in. The United States, Japan andGermany own the largest patent portfolios in absoluteterms, and account for the majority of environmentalpatents filed under the Patent Cooperation Treaty (PCT):more than 61% of environmental management patents, andabout 54% of all energy generation patents. Denmarkconversely is the economy most specialised in environ-ment-related patenting (about 14% of Danish patents arefiled in the field), followed by Norway, Austria, Japan andGermany, all with shares above 11% of total patenting. In alleconomies considered, most patenting occurs in energygeneration and environmental management.
R&D budgets for energy and the environment,2002 and 2012
As a percentage of government budget appropriations or outlays for R&D
Source: OECD, Research and Development Statistics Database,www.oecd.org/sti/rds, June 2013. See chapter notes.
1 2 http://dx.doi.org/10.1787/888932891910
0 84 12 16 20%
MEX
CAN
JPN
NZL
FIN
EST
ITA
AUS
CHL
ESP
FRA
KOR
SWE
DEU
SVN
NOR
DNK
POL
GRC
SVK
CZE
PRT
ISL
AUT
BEL
GBR
HUN
LUX
NLD
IRL
RUS
USA
ISR
CHE
999
1 161
4 669
96
270
29
1 070
453
66
852
1 493
1 185
234
2 138
21
7 379
18 851
142
132
116
46
18
103
130
5
126
113
520
34
9
177
21
332
2 968
27
30
EnvironmentEnvironment and energy, 2002
Energy
EU28
OECD
Total GBAORDfor energy andenvironmentprogrammes
(Millions USD PPP)
Definitions
Government budget appropriations or outlays for R&D(GBAORD) measure the funds that governments allo-cate to R&D to meet various socio-economic objec-tives. These are defined on the basis of the primarypurpose of the funder and include control and care forthe environment as well as energy. Patents in environ-mental technologies are identified using refined searchstrategies based on the International Patent Classifica-tion (IPC) and the detailed European ClassificationSystem (ECLA), and drawing upon the expertise ofpatent examiners at the European Patent Office (seeOECD, 2011, and Hascic et al., 2012, for details).
OECD SCIENCE, TECHNOLOGY AND INDUSTRY SCOREBOARD 2013 © OECD 2013154

4. TARGETING NEW GROWTH AREAS
2. Green innovation
Patents in selected environmental technologies, 1998-2000 and 2008-10As a percentage of total Patent Cooperation Treaty patent applications
Source: OECD, Patent Database, June 2013. See chapter notes.1 2 http://dx.doi.org/10.1787/888932891929
Countries' share in selected environmental technologies, 2008-10Percentage of Patent Cooperation Treaty patent applications
Source: OECD, Patent Database, June 2013. See chapter notes.1 2 http://dx.doi.org/10.1787/888932891948
Measurability
R&D budgets for control and care for the environment include research on the control of pollution and on developingmonitoring facilities to measure, eliminate and prevent pollution. Energy R&D budgets include research on the produc-tion, storage, transport, distribution and rational use of all forms of energy, but exclude research on prospecting andon vehicle and engine propulsion. In addition to R&D, the International Energy Agency collects and publishes relateddata on government support for energy demonstration projects, typically referred to as RD&D. The notion of whichtechnologies are considered “environmental” evolves over time, as it tries to reflect the public consensus on the com-parative usefulness of different technologies in reducing environmental impact. Patent data allow for identifying more“integrated” technological innovations, even though patents do not cover all innovations. Using data from differentpatent authorities, especially national ones, and tracking priorities may provide useful information about where andwhen different environmental technologies are born and develop and how they spread (or not) across economies.
%15
5
10
0
DNKNOR
AUTJP
NDEU GRC
PRTCZE
POLCAN
TURCHN
TWNSVN
HUNFR
AAUS
ESP
SGPSWE
BRAKOR
NLD RUS ITA MEXNZL GBR
ZAFFIN BEL IR
LUSA
CHEISR
IND
447
231
410
9 52
7
5 30
9 31 38 51 64
12 3
71 671 60
1 73
3
465
443
159
33 4
51 623
36 5
44 127
1 87
3
717
185
655 41 63
1 11
9 68 279
211 70
7 52
8
383
287
246
2 02
1 20 35
1 39
0 56
EU28
BRIICS
OECD
WLD
Patents in environmentrelated technologies,
2008-10
Tech. specific to climate change mitigation
Energy generation from renewable and non-fossil sources
Combustion tech. with mitigation potential
General environmental management
Environment-related patents (1998-2000)
Energy efficiency in buildings and lighting Emissions abatement and fuel efficiency
Tech. with contribution to emissions mitigation
%35
20
25
30
5
10
15
0
CHNJP
NDEUUSA
GBRNLD CAN ITA SWE
AUSDNK
ESP
AUTCHE
ISR FIN IND
NORBEL RUS
FRA
KOR
General environmental management Energy generation from renewable and non-fossil sources All environment-related technologies
EU28
BRIICS
OECD SCIENCE, TECHNOLOGY AND INDUSTRY SCOREBOARD 2013 © OECD 2013 155

4. TARGETING NEW GROWTH AREAS
3. Health innovation
Economies worldwide face important social challenges.Health care for ageing populations, long-term chronicillnesses such as diabetes, drug-resistant diseases or globalpandemics are among governments’ most important policychallenges. Innovation can greatly improve the capacity ofhealth systems to address these problems and help containcosts. The public sector plays a significant role, alongsidebusinesses and non-profit organisations, by supportingR&D and innovation both directly and indirectly andthrough procurement of new treatments resulting fromR&D.
Data on government budget appropriations or outlays forR&D (GBAORD) show that direct government support ofhealth-related R&D in OECD countries was about 0.1% oftheir combined GDP in 2012. Health R&D funding is largestin the United States, in both absolute and relative terms, ataround 0.23% of GDP. Adjusting for institutional differencesin the funding, however, health R&D reaches some 0.26% ofGDP in Sweden and above 0.22% of GDP in Austria.
Economies also differ in the extent to which they appropri-ate the results of health-related innovative activities and inthe importance of health patents in overall patenting. InIsrael and India health patents account for more than 28%of total patents filed under the Patent Cooperation Treaty(PCT), whereas in Japan, China and Finland they representwell under 10%. Over time, the relative weight of healthpatents in overall patenting has generally decreased inOECD and BRIICS economies. The United States, Japan andGermany account for the majority of pharmaceuticalpatents filed under the PCT system.
Government funding of health-related R&D, 2012As a percentage of GDP
Source: OECD, based on OECD Research and Development StatisticsDatabase, www.oecd.org/sti/rds, and national data sources, June 2013. Seechapter notes.
1 2 http://dx.doi.org/10.1787/888932891967
0 0.20.1 0.3%
CHE
ISR
GRC
POL
BEL
SWE
RUS
SVK
MEX
CHL
IRL
AUT
HUN
JPN
NLD
SVN
CZE
DEU
NZL
FRA
ITA
FIN
AUS
ISL
KOR
LUX
PRT
ESP
DNK
CAN
EST
NOR
GBR
USA
Direct health GBAORD
Other health-related funds
Advancement of knowledge (medical sciences)
Data on indirect health funds not available
EU28
OECD
Definitions
Direct health GBAORD comprises government R&D bud-gets primarily committed to the socio-economicobjective of protecting and improving human health.Funds related to the advancement of knowledge are non-oriented research funds and general university funds,i.e. the estimated R&D content of government blockgrants to universities, for which it is possible to iden-tify the amount dedicated to R&D in the medicalsciences. Other health-related funds are ad hoc OECDestimates based on national sources that covergeneral support for R&D in hospitals and related areasthat are excluded from GBAORD estimates. Health-related patents are identified using Schmoch’s classifi-cation (2008, revised in 2013): pharmaceuticals arepatents filed in class A61K, excluding A61K8/* (cos-metics) of the International Patent Classification (IPC);medical technologies patents relate to IPC classes A61 [B,C, D, F, G, H, J, L, M, N] and H05G. Pharmaceuticals areconsidered an area of application rather than aspecific technology while medical technologies gener-ally refer to products and technologies such as operat-ing tables and massage devices.
OECD SCIENCE, TECHNOLOGY AND INDUSTRY SCOREBOARD 2013 © OECD 2013156

4. TARGETING NEW GROWTH AREAS
3. Health innovation
Health-related patents, 1999-2001 and 2009-11As a percentage of total Patent Cooperation Treaty patent applications
Source: OECD, Patent Database, June 2013. See chapter notes.1 2 http://dx.doi.org/10.1787/888932891986
Countries' share in pharmaceutical patents, 2009-11Patent Cooperation Treaty patent applications
Source: OECD, Patent Database, June 2013. See chapter notes.1 2 http://dx.doi.org/10.1787/888932892005
Measurability
Public funding of health R&D is difficult to measure owing to institutional complexity and diversity. It may be publiclyor privately funded and be carried out in firms, universities, hospitals and private not-for-profit institutions. TheGBAORD health category is used as a proxy for total central government funding of health-related R&D, even thoughit only covers programmes for which health is the primary objective. The classification of funds depends on how gov-ernments present R&D priorities and on the formal mandate of the institutions concerned. Arrangements for fundingR&D in hospitals also vary. To address some of these limitations and to provide a more complete picture of health-related R&D, funding of medical sciences via non-oriented research and general university funds is included whenavailable as are other relevant funds, notably general support for R&D in hospitals. Health patent data relate to patentapplications filed under the PCT and are based on the priority date, the inventor’s residence and fractional counts.Only economies that applied for more than 250 patents in 2009-11 are included. Different data sources might lead todifferent results.
%30
20
10
0
ISRIN
D IRL
TURCHE
SVNNZL DNK
USAES
PHUN
GRCAUS
CHLGBR
SGPCZE
NLD CANBRA
TWNMEX
PRT ITA BEL RUSSWE
ZAFPOL
FRA
KORAUT
DEU NORJP
NCHN FIN
36.1
OECD
WLDEU28
BRIICS
Pharmaceuticals Medical technologies Health-related patents (1999-2001)
%12
10
8
6
4
2
0
USAJP
NDEU CHN
KORFR
AGBR
IND
CANCHE ITA ES
PISR
NLD AUSSWE
BEL DNKTUR
RUSAUT
BRA
38.6 26.0
EU28
BRIICS
OECD SCIENCE, TECHNOLOGY AND INDUSTRY SCOREBOARD 2013 © OECD 2013 157

4. TARGETING NEW GROWTH AREAS
4. Biotechnology R&D
Biotechnology comprises a number of related technologieswith a wide range of current and potential applications inmany sectors and is of significant interest to policy makers.
Number of biotechnology firms is the most widely availableindicator but it is not the best measure of a country’s acti-vity in biotechnology, owing to large differences in firm sizeand R&D intensity. The United States has 7 970 biotechnol-ogy R&D firms, followed by Spain with 3 025 biotechnologyfirms, and France with 1 481 biotechnology R&D firms.
Data on business enterprise expenditures on research anddevelopment (BERD) for biotechnology provide a direct mea-sure of research effort. The United States devotes almost10% of total US BERD to biotechnology (USD 27 374 millionPPP) and accounts for about 66% of total biotechnology BERDexpenditures in the 28 countries for which data are avail-able.
On average, biotechnology accounted for 5.9% of total BERDin 2011. Denmark spends the most on biotechnology R&D asa percentage of BERD (19.4%) followed by Ireland (17.2%) andSwitzerland (12.6%).
The government and higher education sectors play a keyrole in supporting biotechnology R&D. Data on biotechnol-ogy R&D expenditures in the government and higher educa-tion sectors are available for 18 countries. In 11 countriesthe amount spent by the two sectors exceeds that of thebusiness sector. Reflecting this strong public support, thehighest levels are found in Germany (USD 5 972 million PPP),followed by Korea (USD 2 468 million PPP) and Spain(USD 1 346 million PPP). The biotechnology share of totalR&D expenditures is highest in Germany, at 21.2%, followedby Korea (19.8%) and Spain (14.3%).
Number of firms active in biotechnology, 2011
Source: OECD, Key Biotechnology Indicators, http://oe.cd/kbi, June 2013.See chapter notes.
1 2 http://dx.doi.org/10.1787/888932892024
0 2 0001 000 3 000 4 000Number of firms
SVK
ZAF
SVN
EST
POL
CZE
AUT
DNK
PRT
SWE
FIN
NOR
ISR
IRL
NLD
ITA
CHE
BEL
NZL
MEX
GBR
JPN
AUS
DEU
KOR
FRA
ESP
USA
0.7
2.3
2.1
0.7
0.4
0.7
7.6
0.3
4.1
0.7
0.9
1.7
1.6
1.6
3.2
1.9
2.4
1.9
3.4
7 970
Biotechnology R&D firms
Dedicated biotechnology R&D firms
Biotechnology firms Dedicated biotechnology firms
Average biotechnologyR&D spending per
biotechnology-active firm(Millions USD PPP)
Definitions
The OECD defines biotechnology as the application ofscience and technology to living organisms, as well asparts, products and models thereof, to alter living ornon-living materials for the production of knowledge,goods and services.
This definition is deliberately broad, covering modernbiotechnology but also many traditional or borderlineactivities. For this reason, the OECD recommends thatit should always be accompanied by a list-based defi-nition based on seven categories that serves as aninterpretative guideline. The categories are: DNA/RNA,Proteins and other molecules, Cell and tissue cultureand engineering, Process biotechnology techniques,Gene and RNA vectors, Bioinformatics, and Nanobio-technology. In addition, respondents are usually givenwrite-in option for new biotechnologies that do not fitany of the categories. A firm that reports activity inone or more of the categories is defined as a biotech-nology firm.
OECD SCIENCE, TECHNOLOGY AND INDUSTRY SCOREBOARD 2013 © OECD 2013158

4. TARGETING NEW GROWTH AREAS
4. Biotechnology R&D
Biotechnology R&D in the business sector, 2011
Source: OECD, Key Biotechnology Indicators, http://oe.cd/kbi, and OECD, Main Science and Technology Indicators Database, www.oecd.org/sti/msti.htm,June 2013. See chapter notes. 1 2 http://dx.doi.org/10.1787/888932892043
Biotechnology R&D in the government and higher education sectors, 2011
Source: OECD, Key Biotechnology Indicators, http://oe.cd/kbi; and OECD, Main Science and Technology Indicators Database, www.oecd.org/sti/msti.htm,June 2013. See chapter notes. 1 2 http://dx.doi.org/10.1787/888932892062
Measurability
Firms’ biotechnology activities can be measured by dedicated surveys of these firms, questions on biotechnology addedto national R&D surveys of firms and available secondary sources. Data comparability depends on how biotechnologystatistics are collected.
There are three types of biotechnology firms:
1. A biotechnology firm engages in biotechnology using at least one biotechnology technique (as defined in the OECDlist-based definition) to produce goods or services and/or to perform biotechnology R&D. These firms are capturedby biotechnology firm surveys.
Two subgroups of biotechnology firms are largely defined by the method of data collection.
2. A dedicated biotechnology firm devotes at least 75% of its production of goods and services, or R&D, to biotechnology.These firms are captured by biotechnology firm surveys.
3. A biotechnology R&D firm performs biotechnology R&D. Dedicated biotechnology R&D firms, a subset of this group,devote 75% or more of their total R&D to biotechnology. These firms are captured by R&D surveys.
The OECD 2009 guidelines provide a common basis for collecting and reporting biotechnology R&D statistics in the gov-ernment and higher education sectors.
3 000
2 500
2 000
1 500
1 000
500
0 0
USAFR
AJP
NDEU KOR
CANCHE
DNKES
PBEL
SWE ITA NLD ISR IRL
AUTNOR
RUSAUS FIN MEX
CZEZAF
SVNPOL
PRTES
TSVK
Millions USD PPP20
15
10
5
%
27 3
74Total biotechnology R&D expenditures, millions USD PPP (left-hand scale)
Biotechnology R&D as a percentage of total business expenditures on R&D (right-hand scale)
1 500
1 000
500
0 0
DEU KORES
PRUS
CANPOL
NORDNK ITA CZE
ZAFFIN IR
LNLD AUS
PRTSVK
SVN
Millions USD PPP25
20
15
10
5
%
2 46
8
5 97
2
Total biotechnology R&D expenditures in the government and higher education sectors, millions USD PPP (left-hand scale)
As a percentage of total expenditures on R&D in the government and higher education sectors (right-hand scale)
OECD SCIENCE, TECHNOLOGY AND INDUSTRY SCOREBOARD 2013 © OECD 2013 159

4. TARGETING NEW GROWTH AREAS
5. Nanotechnology R&D
Nanotechnology is commonly considered a very promisingtechnology domain in terms of business opportunities in vari-ous industries, especially in the context of pressing societalchallenges relating to energy, health care, clean water and cli-mate change. However, nanotechnology metrics are lacking.Better metrics are necessary to monitor and benchmark nano-technology for future policy needs.
In 2013, the OECD undertook an experimental data collectionon nanotechnology R&D. The United States has the largestnumber of nanotechnology-active firms (4 928), followed byGermany (960) and France (524). In 8 out of 17 countries firmscould report the same R&D in multiple research areas. In thisrespect, the overlap of nanotechnology and biotechnologyranges between 19% in Italy, where only about 19% of firms areactive both in nanotechnology and biotechnology, to 65% inthe United States.
Data on business enterprise expenditures on research anddevelopment (BERD) for nanotechnology provide a better mea-sure of the research effort. On average, nanotechnologyaccounted for almost 2% of total BERD in 2011. TheUnited States has the strongest focus on nanotechnology R&D(4.8% of total BERD), followed by Mexico (4.6%) and the RussianFederation (3.5%).The United States spends the most on nano-technology BERD (USD 13 500 million PPP), representingalmost 75% of total nanotechnology BERD expenditures in the17 countries for which data are available.
The share of nanotechnology in the government and highereducation sector’s total expenditures on R&D provides an indi-cator of the importance governments accord to nanotechno-logy R&D. The share is highest in the Russian Federation, at5.6%, followed by Korea (4.7%) and Portugal (3.5%).
These data are partly reflected in government and higher edu-cation sector expenditures on nanotechnology R&D that arelargest in the Russian Federation (USD 729 million PPP), fol-lowed by Japan (USD 542 million PPP) and Korea (USD 316 mil-lion PPP).
Number of firms active in nanotechnology, 2011
Note: This is an experimental indicator. International comparability maybe limited.Source: OECD, Key Nanotechnology Indicators, http://oe.cd/kni, June 2013.See chapter notes.
1 2 http://dx.doi.org/10.1787/888932892081
0 400200 600 800 1 000 1 200 1 400Number of firms
SVK
ZAF
SVN
PRT
DNK
NOR
CZE
IRL
BEL
ITA
MEX
JPN
CHE
FRA
DEU
USA
4 928
2.7
1.6
1.4
0.7
4.2
1.5
1.3
0.7
0.7
0.4
0.4
0.2
1.0
3.2
0.5
Nanotechnology R&D firms
Dedicated nanotechnology R&D firms
Nanotechnology firms Dedicated nanotechnology firms
Average nanotechnologyR&D spending per
nanotechnology-active firm(Millions USD PPP)
Definitions
There is no internationally agreed statistical definitionof nanotechnology. The development of a range ofcomparable nanotechnology indicators depends on auniform set of definitions.
The International Organization for Standardizationdefines nanotechnology as: “Understanding and con-trol of matter and processes at the nanoscale, typically,but not exclusively, below 100 nanometres in one ormore dimensions, where the onset of size-dependentphenomena usually enables novel applications, by utiliz-ing the properties of nanoscale materials that differ fromthe properties of individual atoms, molecules, and bulkmatter to create improved materials, devices and sys-tems that exploit these new properties.”
OECD SCIENCE, TECHNOLOGY AND INDUSTRY SCOREBOARD 2013 © OECD 2013160

4. TARGETING NEW GROWTH AREAS
5. Nanotechnology R&D
Nanotechnology R&D in the business sector, 2011
Note: This is an experimental indicator. International comparability may be limited.Source: OECD, Key Nanotechnology Indicators, http://oe.cd/kni; and OECD, Main Science and Technology Indicators Database, www.oecd.org/sti/msti.htm,June 2013. See chapter notes. 1 2 http://dx.doi.org/10.1787/888932892100
Nanotechnology R&D in the government and higher education sectors, 2011
Note: This is an experimental indicator. International comparability may be limited.Source: OECD, Key Nanotechnology Indicators, http://oe.cd/kni; and OECD, Main Science and Technology Indicators Database, www.oecd.org/sti/msti.htm,June 2013. See chapter notes. 1 2 http://dx.doi.org/10.1787/888932892119
Measurability
Firms’ nanotechnology activities can be measured by dedicated surveys of these firms, questions on nanotechnologyadded to national R&D surveys of firms and available secondary sources. Data comparability depends on how nano-technology statistics are collected.
There are three types of nanotechnology firms:
1. A nanotechnology firm uses nanotechnology to produce goods or services and/or to perform nanotechnology R&D.These firms are captured by nanotechnology firm surveys.
Two subgroups of nanotechnology firms are largely defined by the method of data collection.
2. A dedicated nanotechnology firm devotes at least 75% of its production of goods and services, or R&D, to nanotech-nology. These firms are captured by nanotechnology firm surveys.
3. A nanotechnology R&D firm performs nanotechnology R&D. Dedicated nanotechnology R&D firms, a subset of thegroup, devote 75% or more of their total R&D to nanotechnology. These firms are captured by R&D surveys.
1 800
1 200
600
0 0
USAFR
AJP
NDEU BEL CHE
DNKITA IRL
NORRUS
MEXZAF
CZESVN
PRTSVK
Millions USD PPP6
4
2
%
13 5
00Total nanotechnology R&D expenditures, millions USD PPP (left-hand scale)
Nanotechnology R&D as a percentage of total business expenditures on R&D (right-hand scale)
800
600
400
200
0 0
KORJP
NRUS
NORITA CZEZAF
PRTSVK
SVN
Millions USD PPP6
4
2
%
Total nanotechnology R&D expenditures in the government and higher education sectors, millions USD PPP (left-hand scale)
As a percentage of total expenditures on R&D in the government and higher education sectors (right-hand scale)
OECD SCIENCE, TECHNOLOGY AND INDUSTRY SCOREBOARD 2013 © OECD 2013 161

4. TARGETING NEW GROWTH AREAS
6. ICT innovation
Information and communication technologies (ICT) andrelated industries have been at the root of key changes inthe global economy in recent decades. In 2011, businessR&D expenditures (BERD) of information industries in manyOECD countries accounted for 20-25% of BERD and for 0.2-0.3% of GDP. In Korea, Finland, Japan, the United States andSweden, the share ranges from 30% to 50% or more of BERDand from 0.7% to 1.5% or more of GDP, owing to the highresearch intensity of these economies and of the sectoritself.
In general, ICT R&D expenditures tend to be concentrated inthe manufacturing sector, even when goods production isoffshored. Telecommunication services remain minor per-formers of R&D, while IT services have gained ground in Ire-land and Denmark, where R&D expenditure on publishingand audiovisuals (which includes some software develop-ment activities) is also substantial.
ICT BERD intensity is generally mirrored by the relativeshare of ICT-related patents. For the OECD as a whole, in2009-11, ICT patents represented more than one-third ofworld patents filed under the Patent Cooperation Treaty(PCT), although this is 5% less than in 1999-2001. In contrast,the importance of ICT patents in BRIICS economies doubled,largely because of China. Overall, the share of computerpatents is similar to that of other ICT-related technologies (athird each); telecommunication services remain slightlyabove 20% and are more important in economies with ahigher share of ICT-related patents.
The pervasive presence of ICT is apparent in the spread ofbroadband connectivity in businesses, which was universalfor larger enterprises in almost all OECD countries in 2012,and 90% or more even in smaller businesses with 10 to 49employees.
R&D expenditure in information industries, 2011As a percentage of GDP
Source: OECD, ANBERD Database, www.oecd.org/sti/anberd; Research andDevelopment Statistics Database, www.oecd.org/sti/rds; and nationalsources, June 2013. See chapter notes.
1 2 http://dx.doi.org/10.1787/888932892138
0 0.3 0.6 0.9 1.3 1.6%
POL
TUR
ESP
HUN
AUS
CZE
ITA
NLD
PRT
EST
BEL
CHN
NOR
AUT
GBR
SVN
CAN
FRA
DEU
CHE
IRL
DNK
USA
SWE
JPN
FIN
KOR
30
27
17
17
11
14
25
22
28
16
18
20
28
15
24
15
32
22
18
19
39
22
36
29
30
59
53
IT and other information services
ICT services not allocated
ICT equipment
Publishing, audiovisual and broadcasting activities
Telecommunications
Informationindustriesshare in
total BERD
Definitions
Information industries includes ISIC Rev.4 Division 26(Manufacture of computer, electronic and opticalproducts) and Section J (Information and communica-tion), consisting of Divisions 58-60 (Publishing andbroadcasting industries), 61 (Telecommunications)and 62-63 (Computer programming and informationservice activities). Hence, information industriesencompass ICT industries (under Divisions 26, 61 and62-63, plus a small component in 58), excluding tradeand repair activities, and media and content industries(included in Divisions 58-60 and in the Group 639).BERD includes all expenditures performed by enter-prises, irrespective of their funding. They are pre-sented by main sector of activity of the enterprise interms of turnover. The different types of ICT-relatedpatents are identified following Schmoch’s classifica-tion (2008, revised in 2013). Broadband connectivityrefers to the availability of Internet access by theenterprise at a speed higher than 256 Kbit/s, for firmswith 10 or more employees.
OECD SCIENCE, TECHNOLOGY AND INDUSTRY SCOREBOARD 2013 © OECD 2013162

4. TARGETING NEW GROWTH AREAS
6. ICT innovation
ICT-related patents, 1999-2001 and 2009-11As a percentage of total PCT patent applications
Source: OECD, Patent Database, June 2013. See chapter notes.1 2 http://dx.doi.org/10.1787/888932892157
Enterprises with broadband connection, by employment size, 2012Fixed and mobile connections, as a percentage of all enterprises
Source: OECD, ICT Database, June 2013, and Eurostat, May 2013. See chapter notes.1 2 http://dx.doi.org/10.1787/888932892176
Measurability
Countries’ statistics on BERD by industry are not always available at the same level of detail. The industry coding ofenterprises is a major concern, owing to possible shifts in the main sector of activity of large R&D performers (e.g.physical production is outsourced), and to different corrections for R&D performed by specialised subsidiaries. Also,R&D figures generally do not include ICT-related R&D performed outside the sector.
A higher share of patents in ICT-related classes with respect to industry’s R&D expenditure may also reflect differ-ences in the propensity to patent of different technological areas and economies.
Enterprises surveyed for ICT usage usually include small (10 to 49 employees), medium (50 to 249) and large (250 andmore) enterprises in the non-agricultural business sector. Financial services are not considered. Differences incoverage across economies may affect results, and definitions may also require further harmonisation to achieve fullcomparability of broadband metrics.
%60
20
30
40
50
10
0
SGPCHN
KOR FIN JPN ISR
CAN IRL
USASWE
TWNNLD GBR
IND
FRA
PRTAUS
RUSBEL ES
PHUN
NORCHE
POLDEU AUT
DNKZAF
GRCNZL ITA SVN
CZETUR
BRAMEX
CHL
64.1Computer, office machinery Telecommunications Consumer electronics Other ICT ICT-related patents (1999-2001)
EU28
BRIICS
OECD
WLD
%100
85
90
95
50
60
70
75
80
40
FIN ISLCHE
FRA
SVNNLD AUS
SWEES
PES
TLU
XCAN
BEL ITA GBRDNK
SVKCZE
PRTIR
LAUT
DEU NORHUN
JPN
POLGRC
MEX
All Large Medium Small
OECD SCIENCE, TECHNOLOGY AND INDUSTRY SCOREBOARD 2013 © OECD 2013 163

4. TARGETING NEW GROWTH AREAS
7. Broadband price and quality
With faster Internet connection speed (bandwidth) andlower Internet service prices, new applications are becom-ing available for individuals and businesses. Internet userscan now be “always-on”, perform a growing number of tasksremotely and move seamlessly between different devices.Fast and affordable connections are thus an importantdriver of societal development and economic competitive-ness alike.
OECD-area broadband speed levels, as measured by medianand (usually higher) average advertised connection speedsfor fixed line subscriptions, are relatively high overall butcross-country differences are still wide. Whereas OECD-wide median speeds in September 2012 stood at 12 Mbit/s(the average speed being above 20), leading countries wereabove 40 Mbit/s and lagging ones were at 4 Mbit/s or less.Despite lower income levels, some countries have been ableto leapfrog and adopt the latest broadband technologies.
Internationally comparable price baskets, expressed in pur-chasing power parities (PPP), also range widely from USD 60or more to less than USD 20 a month for a fixed-linesubscription of 15+Mbit/s and up to 33 GB. For this relatively“high-end” basket, subscription prices tend to be lower incountries that offer more bandwidth. Past experience showsthat in most countries monthly subscription prices tend tobe relatively sticky, with offers that propose significantimprovements in the quality of connections. Price setting isalso strongly affected by network regulation policies.
For mobile connectivity, all countries offer voice plus datapackages that include a given volume of traffic (mobilevoice traffic is still usually more costly than fixed-line). Fora representative array of such offers, prices also rangewidely. A typical mid-range basket (100 calls/500 Mbit) ispriced in most countries at USD 20 to USD 40 PPP a month;in a few it costs about USD 10 PPP and in others overUSD 50 PPP. Prices of low- and high-end baskets tend toshow a similar inter-country pattern. Mobile and fixedbroadband offers show a mild positive correlation.
Internet connection speed, September 2012Broadband median and average advertised download speeds, Mbits per second
Source: OECD (2013), OECD Communications Outlook 2013, OECDPublishing.
1 2 http://dx.doi.org/10.1787/888932892195
0 5010 20 30 70 90
DNK
KOR
GRC
CAN
POL
SVN
CZE
SWE
NOR
PRT
ITA
FRA
NLD
AUT
USA
SVK
FIN
DEU
JPN
ESP
HUN
TUR
IRL
NZL
CHE
LUX
ISL
GBR
AUS
CHL
ISR
EST
BEL
MEX
Average Median
Mbit/s
OECD
Definitions
The OECD methodology for measuring prices of com-munication services is based on consumption pat-terns or “baskets” of fixed, mobile and leased linecommunication services, collected from several opera-tors with the largest market shares in each country.USD PPP is used to facilitate international compari-sons. For the purpose of this data collection, speedsare those advertised by three operators and are notlikely to correspond to typical throughput. When notexplicitly stated, maximum speeds were imputedbased on the bandwidth typically associated with thetechnology considered.
OECD SCIENCE, TECHNOLOGY AND INDUSTRY SCOREBOARD 2013 © OECD 2013164
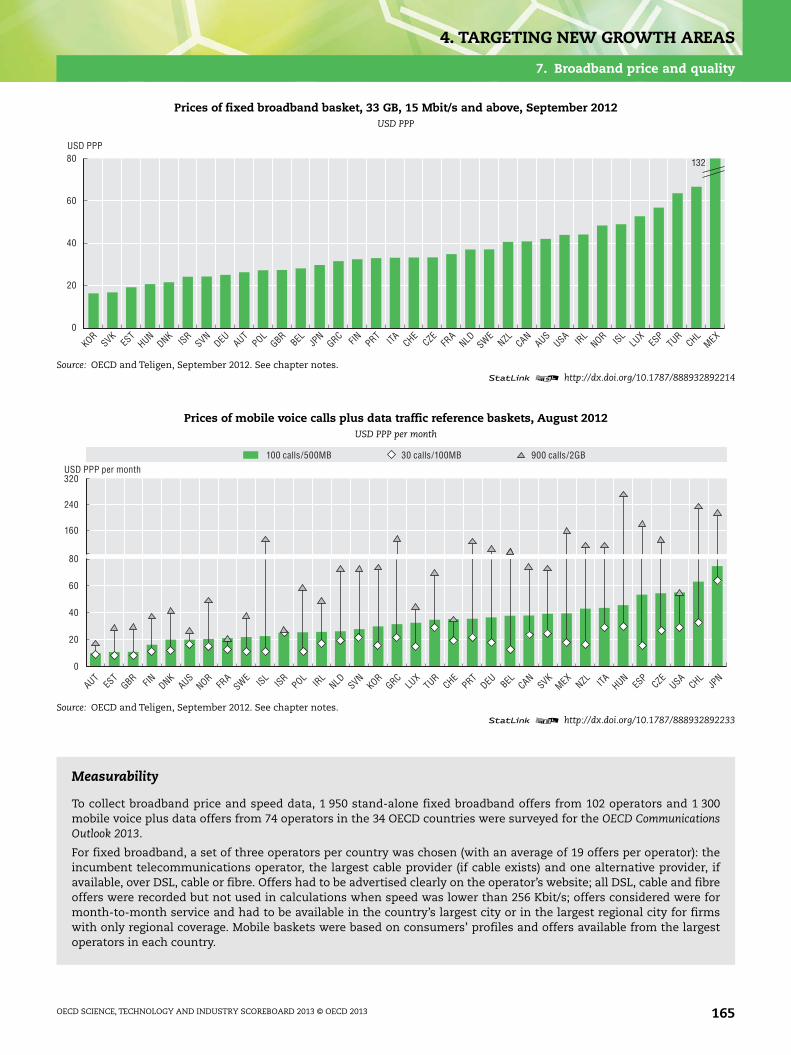
4. TARGETING NEW GROWTH AREAS
7. Broadband price and quality
Prices of fixed broadband basket, 33 GB, 15 Mbit/s and above, September 2012USD PPP
Source: OECD and Teligen, September 2012. See chapter notes.1 2 http://dx.doi.org/10.1787/888932892214
Prices of mobile voice calls plus data traffic reference baskets, August 2012USD PPP per month
Source: OECD and Teligen, September 2012. See chapter notes.1 2 http://dx.doi.org/10.1787/888932892233
Measurability
To collect broadband price and speed data, 1 950 stand-alone fixed broadband offers from 102 operators and 1 300mobile voice plus data offers from 74 operators in the 34 OECD countries were surveyed for the OECD CommunicationsOutlook 2013.
For fixed broadband, a set of three operators per country was chosen (with an average of 19 offers per operator): theincumbent telecommunications operator, the largest cable provider (if cable exists) and one alternative provider, ifavailable, over DSL, cable or fibre. Offers had to be advertised clearly on the operator’s website; all DSL, cable and fibreoffers were recorded but not used in calculations when speed was lower than 256 Kbit/s; offers considered were formonth-to-month service and had to be available in the country’s largest city or in the largest regional city for firmswith only regional coverage. Mobile baskets were based on consumers’ profiles and offers available from the largestoperators in each country.
80
60
40
20
0
132
KORSVK
EST
HUNDNK
ISRSVN
DEU AUTPOL
GBRBEL JP
NGRC FIN PRT ITA CHE
CZEFR
ANLD SWE
NZL CANAUS
USA IRL
NOR ISLLU
XES
PTUR
CHLMEX
USD PPP
USD PPP per month320
160
240
20
40
60
80
0
AUTES
TGBR FIN DNK
AUSNOR
FRA
SWE ISLISR
POLIR
LNLD SVN
KORGRC
LUX
TURCHE
PRTDEU BEL CAN
SVKMEX
NZL ITA HUNES
PCZE
USACHL
JPN
100 calls/500MB 30 calls/100MB 900 calls/2GB
OECD SCIENCE, TECHNOLOGY AND INDUSTRY SCOREBOARD 2013 © OECD 2013 165
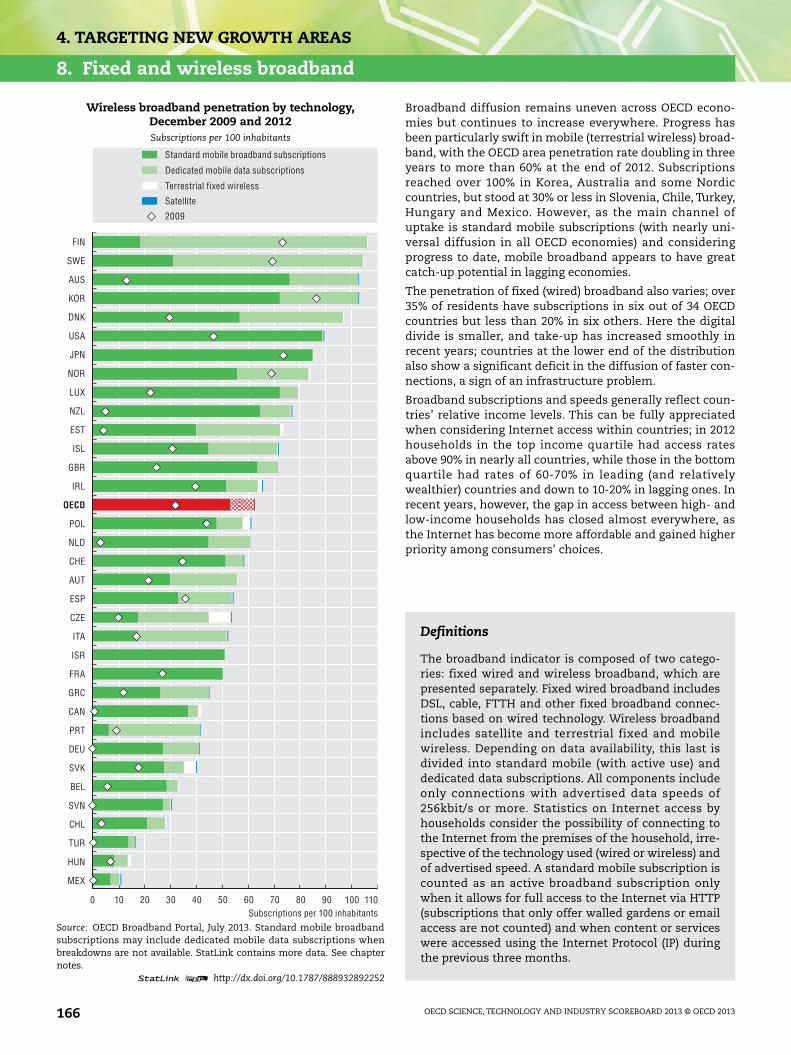
4. TARGETING NEW GROWTH AREAS
8. Fixed and wireless broadband
Broadband diffusion remains uneven across OECD econo-mies but continues to increase everywhere. Progress hasbeen particularly swift in mobile (terrestrial wireless) broad-band, with the OECD area penetration rate doubling in threeyears to more than 60% at the end of 2012. Subscriptionsreached over 100% in Korea, Australia and some Nordiccountries, but stood at 30% or less in Slovenia, Chile, Turkey,Hungary and Mexico. However, as the main channel ofuptake is standard mobile subscriptions (with nearly uni-versal diffusion in all OECD economies) and consideringprogress to date, mobile broadband appears to have greatcatch-up potential in lagging economies.
The penetration of fixed (wired) broadband also varies; over35% of residents have subscriptions in six out of 34 OECDcountries but less than 20% in six others. Here the digitaldivide is smaller, and take-up has increased smoothly inrecent years; countries at the lower end of the distributionalso show a significant deficit in the diffusion of faster con-nections, a sign of an infrastructure problem.
Broadband subscriptions and speeds generally reflect coun-tries’ relative income levels. This can be fully appreciatedwhen considering Internet access within countries; in 2012households in the top income quartile had access ratesabove 90% in nearly all countries, while those in the bottomquartile had rates of 60-70% in leading (and relativelywealthier) countries and down to 10-20% in lagging ones. Inrecent years, however, the gap in access between high- andlow-income households has closed almost everywhere, asthe Internet has become more affordable and gained higherpriority among consumers’ choices.
Wireless broadband penetration by technology,December 2009 and 2012Subscriptions per 100 inhabitants
Source: OECD Broadband Portal, July 2013. Standard mobile broadbandsubscriptions may include dedicated mobile data subscriptions whenbreakdowns are not available. StatLink contains more data. See chapternotes.
1 2 http://dx.doi.org/10.1787/888932892252
0 110Subscriptions per 100 inhabitants
10 20 30 40 50 60 70 80 90 100
FIN
SWE
AUS
KOR
DNK
USA
JPN
NOR
LUX
NZL
EST
ISL
GBR
IRL
POL
NLD
CHE
AUT
ESP
CZE
ITA
ISR
FRA
GRC
CAN
PRT
DEU
SVK
BEL
SVN
CHL
TUR
HUN
MEX
2009
Standard mobile broadband subscriptions
Dedicated mobile data subscriptions
Terrestrial fixed wireless
Satellite
OECD
Definitions
The broadband indicator is composed of two catego-ries: fixed wired and wireless broadband, which arepresented separately. Fixed wired broadband includesDSL, cable, FTTH and other fixed broadband connec-tions based on wired technology. Wireless broadbandincludes satellite and terrestrial fixed and mobilewireless. Depending on data availability, this last isdivided into standard mobile (with active use) anddedicated data subscriptions. All components includeonly connections with advertised data speeds of256kbit/s or more. Statistics on Internet access byhouseholds consider the possibility of connecting tothe Internet from the premises of the household, irre-spective of the technology used (wired or wireless) andof advertised speed. A standard mobile subscription iscounted as an active broadband subscription onlywhen it allows for full access to the Internet via HTTP(subscriptions that only offer walled gardens or emailaccess are not counted) and when content or serviceswere accessed using the Internet Protocol (IP) duringthe previous three months.
OECD SCIENCE, TECHNOLOGY AND INDUSTRY SCOREBOARD 2013 © OECD 2013166

4. TARGETING NEW GROWTH AREAS
8. Fixed and wireless broadband
Fixed wired broadband penetration by speed tiers, December 2009 and 2012Subscriptions per 100 inhabitants and actual speed in Mbits per second
Source: OECD and Akamai, June 2013. See chapter notes.1 2 http://dx.doi.org/10.1787/888932892271
Household Internet access by income quartile, 2008 and 2012As a percentage of all households
Source: OECD, ICT Database and Eurostat, June 2013. See chapter notes.1 2 http://dx.doi.org/10.1787/888932892290
Measurability
Information on residential vs. nomadic usage and real speed is difficult to ascertain from connectivity information.Besides some overlaps in definitions (with fixed wireless and satellite connections referring mainly to fixed usage),frontiers in the use of devices and connections are increasingly blurred. For instance, many people disposing of a wire-less subscription mostly use their domestic wi-fi for their smartphones and tablets at home. The relevance of free-of-charge hotspots (based on wired technology) is potentially huge; for example in France, some operators allow theirfixed-line subscribers to use mobile connections by relying on the network of other wired subscribers’ wi-fi enabledmodem-routers. Household access statistics are also far from homogeneous. For income, differences in definitionsand data quality may raise comparability issues. Income is usually assessed in terms of thresholds and then con-verted. Nearly all countries in the European Statistical System do not correct income data for the size of the house-hold, while Korea does not operate a conversion to quartiles.
45
25
30
35
40
15
20
10
5
0
CHENLD DNK
KORFR
ANOR ISL
GBRDEU BEL CAN
SWELU
X FIN USANZL JP
NAUS
AUTISR
ESP
EST
SVNGRC IR
LPRT ITA HUN
CZEPOL
SVKCHL
MEXTUR
2009< 4 Mbit/s > 4 Mbit/s / < 10 Mbit/s > 10 Mbit/s
Subscriptions per 100 inhabitants
%100
90
50
60
70
80
0
40
30
20
10
KOR ISLNLD LU
XNOR
SWEDNK FIN GBR
DEU IRL
CHECAN
FRA
NZL AUTAUS
BEL SVKES
TSVN
USAPOL
ISRHUN
ESP
CZE ITA PRTCHL
GRCTUR
MEX
20122008 Top and bottom quartile 2012 Top and bottom quartile 2008
OECD SCIENCE, TECHNOLOGY AND INDUSTRY SCOREBOARD 2013 © OECD 2013 167

4. TARGETING NEW GROWTH AREAS
9. Internet users
The diffusion of the Internet still differs widely amongOECD countries: 90% and more of the adult population inKorea and some northern European countries are regularusers (which is lower overall than all users by 5% to 10%),but this ratio is less than 60% in some southern and easternEuropean countries and in Mexico. The differences areprimarily linked to age, income and educational factors,which are often intertwined.
In most countries, uptake by young people is nearly univer-sal, but there are wide differences for older generations(notably seniors), and these shape the overall ranking ofcountries. The role of education appears to be much morerelevant for determining Internet usage by these groupsthan for young people. The share of regular users among 65-74 year-olds with tertiary education is in line with that ofthe overall population and, in leading countries, approachesthat of 16-24 year-olds. Older people, particularly those withless education, are thus a potential focus of strategies toreduce the digital divide.
Purchasing of goods and services over the Internet requiresfamiliarity and trust. The share of Internet users buyingproducts on line ranges from 20% to 70% of adults in report-ing countries: the country ranking is similar to that of regu-lar Internet usage, but with important changes over timeowing to swift progress in some countries. The impact ofincome on this activity is reflected in the leading role of25-44 year-olds compared to younger generations (every-where but Korea), as well as in the reduction of the gap for65-74 year-olds in many countries.
Regular Internet users, by age, 2012As a percentage of the population in each age group
Source: OECD, ICT Database, and Eurostat, June 2013; national sources,May 2013. See chapter notes.
1 2 http://dx.doi.org/10.1787/888932892309
0 4020 60 80 100%
MEX
TUR
RUS
GRC
ITA
PRT
POL
CZE
CHL
SVN
ESP
HUN
CHE
IRL
SVK
EST
AUT
BEL
FRA
DEU
GBR
DNK
FIN
NLD
LUX
SWE
NOR
ISL
KOR
All individuals (16-74 year-olds)16-24 year-olds 65-74 year-olds
Definitions
Regular users of the Internet are defined as individualshaving used the Internet at least once a week duringthe last three months.
The education gap corresponds to the percentage differ-ence between the proportions of regular users of theInternet with tertiary education (ISCED level 5 or 6)and with at most lower-secondary education (ISCEDlevels 0, 1 and 2). This can also take account of specificcharacteristics of individuals, such as their age.
Online purchases are a component of electronic com-merce (e-commerce). This includes transactions ofgoods and services “conducted over computer net-works by methods specifically designed for the pur-pose of receiving or placing orders” (OECD, Measuringthe Information Society, 2011). For individuals (whethersellers or purchasers), such transactions typicallyoccur over the Internet, while most business-to-busi-ness (B2B) e-commerce takes place using other means,such as electronic data interchange (EDI) systems.
OECD SCIENCE, TECHNOLOGY AND INDUSTRY SCOREBOARD 2013 © OECD 2013168
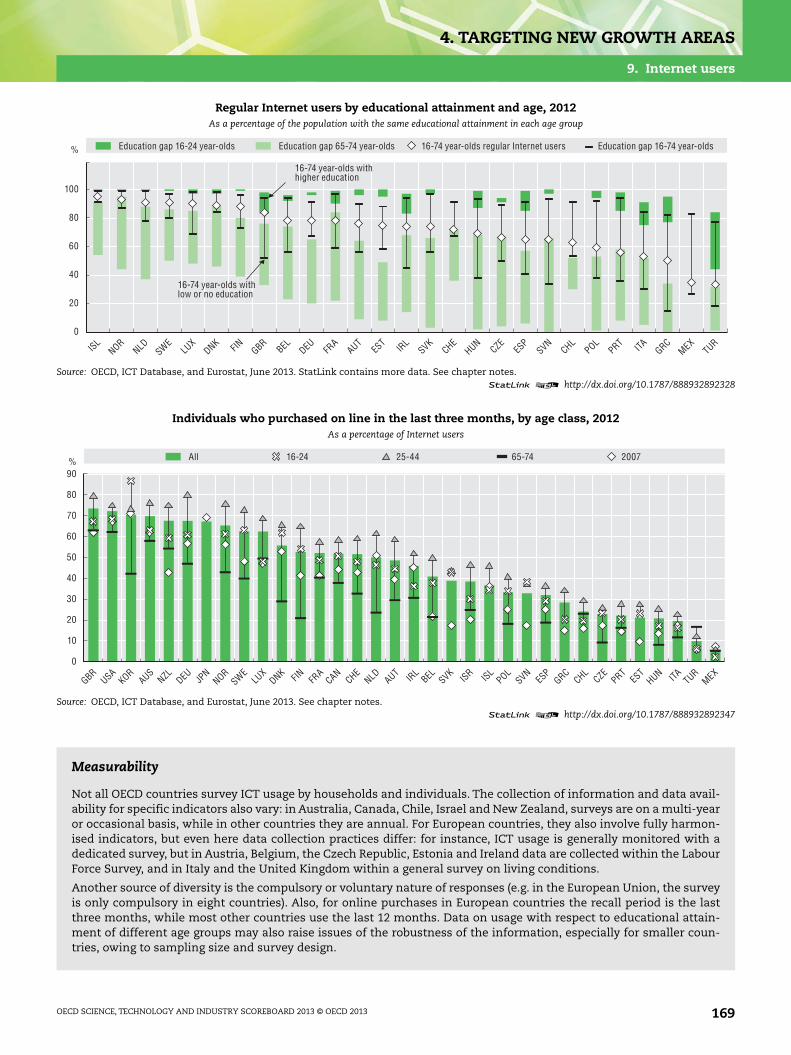
4. TARGETING NEW GROWTH AREAS
9. Internet users
Regular Internet users by educational attainment and age, 2012As a percentage of the population with the same educational attainment in each age group
Source: OECD, ICT Database, and Eurostat, June 2013. StatLink contains more data. See chapter notes.1 2 http://dx.doi.org/10.1787/888932892328
Individuals who purchased on line in the last three months, by age class, 2012As a percentage of Internet users
Source: OECD, ICT Database, and Eurostat, June 2013. See chapter notes.1 2 http://dx.doi.org/10.1787/888932892347
Measurability
Not all OECD countries survey ICT usage by households and individuals. The collection of information and data avail-ability for specific indicators also vary: in Australia, Canada, Chile, Israel and New Zealand, surveys are on a multi-yearor occasional basis, while in other countries they are annual. For European countries, they also involve fully harmon-ised indicators, but even here data collection practices differ: for instance, ICT usage is generally monitored with adedicated survey, but in Austria, Belgium, the Czech Republic, Estonia and Ireland data are collected within the LabourForce Survey, and in Italy and the United Kingdom within a general survey on living conditions.
Another source of diversity is the compulsory or voluntary nature of responses (e.g. in the European Union, the surveyis only compulsory in eight countries). Also, for online purchases in European countries the recall period is the lastthree months, while most other countries use the last 12 months. Data on usage with respect to educational attain-ment of different age groups may also raise issues of the robustness of the information, especially for smaller coun-tries, owing to sampling size and survey design.
%
100
20
40
60
80
0
ISLNOR
NLD SWELU
XDNK FIN GBR
BEL DEU FRA
AUTES
TIR
LSVK
CHEHUN
CZEES
PSVN
CHLPOL
PRT ITA GRCMEX
TUR
Education gap 16-24 year-olds Education gap 65-74 year-olds 16-74 year-olds regular Internet users Education gap 16-74 year-olds
16-74 year-olds withhigher education
16-74 year-olds withlow or no education
%90
50
60
70
80
0
40
30
20
10
GBRKOR
USAAUS
NZL DEU JPN
NORSWE
LUX
DNK FIN FRA
CANCHE
NLD AUTIR
LBEL SVK
ISR ISLPOL
SVNES
PGRC
CHLCZE
PRTES
THUN ITA TUR
MEX
All 65-74 200725-4416-24
OECD SCIENCE, TECHNOLOGY AND INDUSTRY SCOREBOARD 2013 © OECD 2013 169
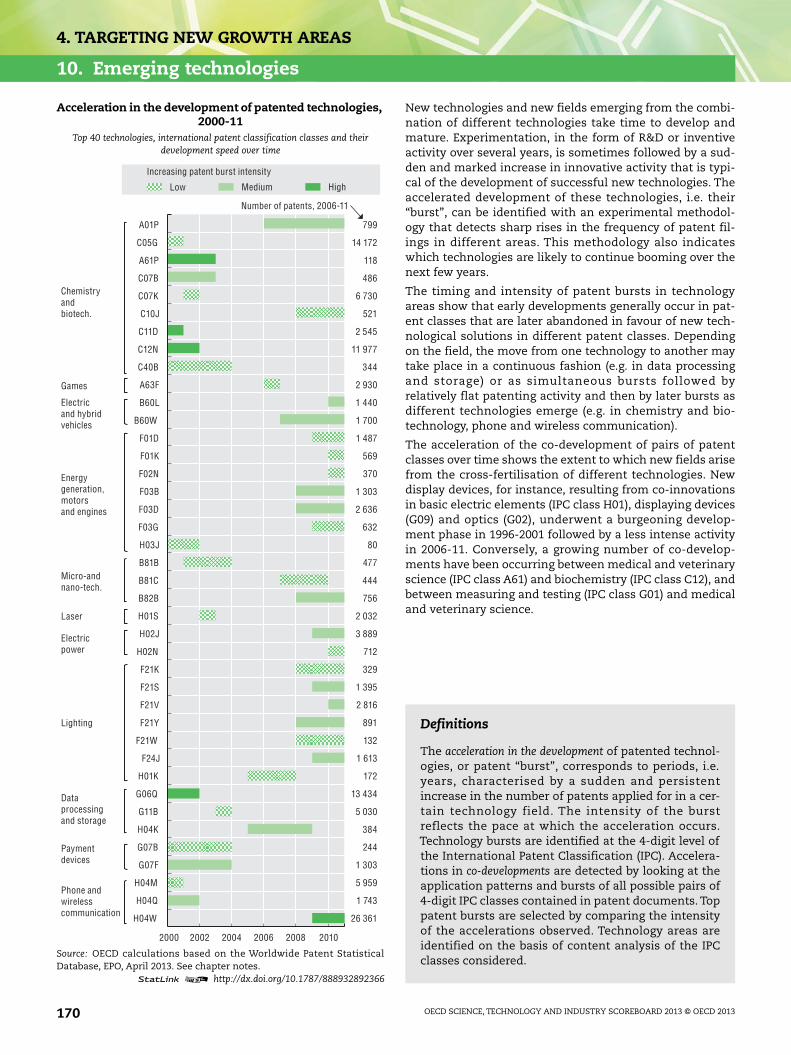
4. TARGETING NEW GROWTH AREAS
10. Emerging technologies
New technologies and new fields emerging from the combi-nation of different technologies take time to develop andmature. Experimentation, in the form of R&D or inventiveactivity over several years, is sometimes followed by a sud-den and marked increase in innovative activity that is typi-cal of the development of successful new technologies. Theaccelerated development of these technologies, i.e. their“burst”, can be identified with an experimental methodol-ogy that detects sharp rises in the frequency of patent fil-ings in different areas. This methodology also indicateswhich technologies are likely to continue booming over thenext few years.
The timing and intensity of patent bursts in technologyareas show that early developments generally occur in pat-ent classes that are later abandoned in favour of new tech-nological solutions in different patent classes. Dependingon the field, the move from one technology to another maytake place in a continuous fashion (e.g. in data processingand storage) or as simultaneous bursts followed byrelatively flat patenting activity and then by later bursts asdifferent technologies emerge (e.g. in chemistry and bio-technology, phone and wireless communication).
The acceleration of the co-development of pairs of patentclasses over time shows the extent to which new fields arisefrom the cross-fertilisation of different technologies. Newdisplay devices, for instance, resulting from co-innovationsin basic electric elements (IPC class H01), displaying devices(G09) and optics (G02), underwent a burgeoning develop-ment phase in 1996-2001 followed by a less intense activityin 2006-11. Conversely, a growing number of co-develop-ments have been occurring between medical and veterinaryscience (IPC class A61) and biochemistry (IPC class C12), andbetween measuring and testing (IPC class G01) and medicaland veterinary science.
Acceleration in the development of patented technologies,2000-11
Top 40 technologies, international patent classification classes and theirdevelopment speed over time
Source: OECD calculations based on the Worldwide Patent StatisticalDatabase, EPO, April 2013. See chapter notes.
1 2 http://dx.doi.org/10.1787/888932892366
2000 2002 2004 2006 2008 2010
A01P
C05G
A61P
C07B
C07K
C10J
C11D
C12N
C40B
A63F
B60L
B60W
F01D
F01K
F02N
F03B
F03D
F03G
H03J
B81B
B81C
B82B
H01S
H02J
H02N
F21K
F21S
F21V
F21Y
F21W
F24J
H01K
G06Q
G11B
H04K
G07B
G07F
H04M
H04Q
H04W
799
14 172
118
486
6 730
521
2 545
11 977
344
2 930
1 440
1 700
1 487
569
370
1 303
2 636
632
80
477
444
756
2 032
3 889
712
329
1 395
2 816
891
132
1 613
172
13 434
5 030
384
244
1 303
5 959
1 743
26 361
Increasing patent burst intensity
Number of patents, 2006-11
Low Medium High
Chemistryandbiotech.
Electricand hybridvehicles
Games
Energygeneration,motorsand engines
Micro-andnano-tech.
Electricpower
Laser
Lighting
Dataprocessingand storage
Paymentdevices
Phone andwirelesscommunication
Definitions
The acceleration in the development of patented technol-ogies, or patent “burst”, corresponds to periods, i.e.years, characterised by a sudden and persistentincrease in the number of patents applied for in a cer-tain technology field. The intensity of the burstreflects the pace at which the acceleration occurs.Technology bursts are identified at the 4-digit level ofthe International Patent Classification (IPC). Accelera-tions in co-developments are detected by looking at theapplication patterns and bursts of all possible pairs of4-digit IPC classes contained in patent documents. Toppatent bursts are selected by comparing the intensityof the accelerations observed. Technology areas areidentified on the basis of content analysis of the IPCclasses considered.
OECD SCIENCE, TECHNOLOGY AND INDUSTRY SCOREBOARD 2013 © OECD 2013170

4. TARGETING NEW GROWTH AREAS
10. Emerging technologies
Acceleration in the co-development of patented technologies, 1996-2001 and 2006-11Top 50 co-developments of IPC classes by development speed observed in the 2000s
Note: The technologies experiencing an acceleration in co-development can be identified at the intersection of the x and y axes (e.g. electronic gamesarise from the combination of A63F, sports, games etc., and G06F, computing). Co-developments that have increased in importance over time arecharacterised by dark bubbles that are bigger than light bubbles (e.g. biotechnologies arising from the combination of A61P, medical/veterinary science,and A01N, agriculture). Co-development for which the intensity has been fading is characterised by light bubbles that are bigger than dark bubbles (e.g.micro-molecular chemistry, at the intersection of C07K, organic chemistry, and C12N, biochemistry).Source: OECD calculations based on the Worldwide Patent Statistical Database, EPO, April 2013. See chapter notes.
1 2 http://dx.doi.org/10.1787/888932892385
Measurability
The patent burst experimental methodology is based on work done by Kleinberg (2003). Bursts are evaluated in rel-ative terms, i.e. in comparison with the patent application patterns typically observed in previous years in the tech-nology fields considered and with what occurs in other fields. This is done to distinguish technology- or field-specific increases from generalised increases in overall patenting activity. Only IPC combinations with positive burstintensities are included. Applying the burst methodology to detect sudden and persistent decreases in patentingactivity may provide insights into technologies and technology fields that are abandoned or become obsolete. Datarelate to patent applications filed through the Patent Cooperation Treaty (PCT) system. Using data from differentpatenting authorities, especially national offices, may shed light on the technology specialisation of economies andthe different development trajectories of technologies across countries and over time. Tracking patent bursts overtime, especially those characterised by an initially small number of patent applications, might help uncover newtechnological trajectories.
A01NA61
KA61
PA63F
B01JB60K
B60LC07
DC07
HC07
KC09K
C11DC40B
E21B
F21S
F21V
F21Y
F24J
G01NG02F
G03BG06F
G06QG09F
G11BH01
LH01
MH04B
H04JH04K
H04LH04M
H04QH04W
H04NH04LH02J
H01MH01LG09GG09FG07FG06FG02FG01VG01N
F21VD06L
F21Y
C12QC12PC12NC07KC07DC07B
B60LB60W
A61KA61P
H05B
2006-2011 1996-2001
IPC code
International Patent Classes (IPC)
A01 – AgricultureA61 – Medical/veterinary scienceA63 – Sports, games, etc.B01 – Physical or chemical devicesB60 – VehiclesC07 – Organic chemistryC09 – Dyes, paints, etc. C11 – Oils, fats and waxesC12 – BiochemistryC40 – Combinatorial technologyD06 – Treatment of TextilesE21 – Earth/rock drilling, miningF21 – LightingF24 – Heating, ventilating, etc.G01 – Measuring, testingG02 – OpticsG03 – Photography, etc.G06 – ComputingG07 – Checking-devicesG09 – Educating, display, etc.G11 – Information storageH01 – Basic electric elementsH02 – Electric powerH04 – Electric communicationH05 – Electric techniques n.e.c.
PCT patent applications
Micro-molecularchemistry
Lighting
Batteries
Displayingdevices
Digital data acquisition,processing andtransmission
Semiconductors
DetergentsChemistry andbiotechnology
Electronic games
Energy storage anddistribution for electricand hybrid vehicles
Wirelessand digitalcommunication
Electricand hybridvehicles
500 patents
1 000 patents
10 000 patents
OECD SCIENCE, TECHNOLOGY AND INDUSTRY SCOREBOARD 2013 © OECD 2013 171

4. TARGETING NEW GROWTH AREAS
Notes and References
4.1. R&D funding and specialisation
R&D specialisation, top three performing industries, 2011
For comparability reasons, estimates are only calculated for countries with data available by main economic activity basedon ISIC Rev.4 or an analogous classification.
ISIC Rev.4 Divisions as follows: Agriculture, mining, utilities and construction: 01-03, 05-09, 35-39 and 41-43; Chemicals andminerals: 19-23; ICT equipment: 26; Information and communication services: 58-63; Electrical equipment and machinerynec: 27-28; Transport equipment: 29-30; Finance and other business services: 64-66 and 69-82 excluding 72; R&D services:72; Wholesale, retail and transport services: 45-47, 49-53, 55-56.
For Australia, Denmark, France, Germany, Italy, the Netherlands, Portugal, Spain and the United Kingdom, data refer to 2010.
For Austria, Belgium, Sweden and the United States, data refer to 2009.
For Switzerland, data refer to 2008.
Data are drawn from national sources for Canada and Switzerland.
For Estonia, “Chemicals and minerals” includes a significant investment in new technology in the oil industry (ISIC Rev.4Division 19) in 2011.
R&D budgets by socio-economic objectives, 2012
“Other” includes support for research on education and society, exploration and exploitation of space, and budgets not else-where classified.
For Chile, EU28, France, Israel, Korea, Mexico, Spain, Sweden and the United Kingdom, data refer to 2011.
For Canada, OECD and Switzerland, data refer to 2010.
For Poland, data refer to 2008.
For Israel, a substantial part of defence R&D is not included in estimates reported to the OECD.
For Japan, military procurement contracts are excluded from defence in government budget appropriations or outlays forR&D (GBAORD).
For Korea, general university funds (GUF) cannot be identified separately from general advancement of knowledge; bothcategories are reported under non-oriented research.
For Mexico, GUF cannot be identified separately from general advancement of knowledge; both categories are reportedunder the former heading.
For the United States, GUF is not estimated and is therefore not included in total reported GBAORD. General support foruniversities is the responsibility of state governments.
Cyprus
The following note is included at the request of Turkey:
“The information in this document with reference to ‘Cyprus’ relates to the southern part of the Island. There is nosingle authority representing both Turkish and Greek Cypriot people on the Island. Turkey recognizes the TurkishRepublic of Northern Cyprus (TRNC). Until a lasting and equitable solution is found within the context of the UnitedNations, Turkey shall preserve its position concerning the ‘Cyprus issue’.”
The following note is included at the request of all the European Union Member States of the OECD and the EuropeanUnion:
“The Republic of Cyprus is recognised by all members of the United Nations with the exception of Turkey. The infor-mation in this document relates to the area under the effective control of the Government of the Republic of Cyprus.”
Israel
“The statistical data for Israel are supplied by and under the responsibility of the relevant Israeli authorities or thirdparty. The use of such data by the OECD is without prejudice to the status of the Golan Heights, East Jerusalem andIsraeli settlements in the West Bank under the terms of international law.”
“It should be noted that statistical data on Israeli patents and trademarks are supplied by the patent and trademarkoffices of the relevant countries.”
OECD SCIENCE, TECHNOLOGY AND INDUSTRY SCOREBOARD 2013 © OECD 2013172
4. TARGETING NEW GROWTH AREAS
Notes and References
Top two technologies patented by countries, 2009-11
Data relate to patent applications filed under the Patent Cooperation Treaty (PCT). Patent counts are based on the prioritydate, the inventor’s residence country and fractional counts. Patents are allocated to technology fields using InternationalPatent Classification (IPC) codes, following the classification presented in Schmoch (2008, revised in 2013).
4.2. Green innovation
R&D budgets for energy and the environment, 2002 and 2012
Data refer to 2002 and 2012 except for Canada (2010), Chile (2011), EU28 (2011), France (2011), Israel (2011), Italy (2001), Korea(2011), Mexico (2002), the OECD (2010), Poland (2008), the Russian Federation (2001, 2009), Spain (2011), Sweden (2011),Switzerland (2010) and the United Kingdom (2011).
General notes:
Patents in selected environmental technologies, 1998-2000 and 2008-10 and;Countries’ share in selected environmental technologies, 2008-10
Data relate to patent applications filed under the Patent Cooperation Treaty (PCT). Patent counts are based on the prioritydate, the inventor’s residence and fractional counts. Patents in environment-related technologies are defined using combi-nations of IPC classes and codes Y02 of the European Classification (ECLA), as detailed in www.oecd.org/env/consumption-inno-vation/indicator.htm.
Additional note:
Patents in selected environmental technologies, 1998-2000 and 2008-10
Only economies that applied for more than 250 patents in 2008-10 are included. For technology fields based on ECLA codes,data for 2008-10 are underestimated.
4.3. Health innovation
Government funding of health-related R&D, 2012
Direct health GBAORD includes government budget appropriations or outlays for R&D primarily committed to the socio-economic objective of protecting and improving human health.
Funds for the general objective of “Advancement of knowledge”, comprising non-oriented research funds and general uni-versity funds, the estimated R&D content of government block grants to universities, have been included as health-relatedon the basis of available data attributing a fraction of R&D funds in this category to the field of medical sciences. The “Other”category represents ad hoc OECD estimates based on available national sources covering general support for R&D in hospi-tals and related areas that is excluded from GBAORD estimates.
For Chile, Denmark, Estonia, Finland, Israel, Italy, Korea, Mexico, Slovenia, Spain, Sweden and the United Kingdom, datarefer to 2011.
For Canada and Switzerland, data refer to 2010.
For the Russian Federation, data refer to 2009.
For Poland, data refer to 2008.
General notes:
Health-related patents, 1999-2001 and 2009-11 and;Countries’share in pharmaceutical patents, 2009-11
Data relate to patent applications filed under the Patent Cooperation Treaty (PCT). Patent counts are based on the prioritydate, the inventor’s residence and fractional counts. Health-related patents are defined using International Patent Classifi-cation (IPC) codes, following the classification presented in Schmoch (2008, revised in 2013).
Additional note:
Health-related patents, 1999-2001 and 2009-11:
Only economies that applied for more than 250 patents in 2009-11 are included.
OECD SCIENCE, TECHNOLOGY AND INDUSTRY SCOREBOARD 2013 © OECD 2013 173

4. TARGETING NEW GROWTH AREAS
Notes and References
4.4. Biotechnology R&D
General notes:
Number of firms active in biotechnology, 2011 and;Biotechnology R&D in the business sector, 2011
Biotechnology firms use biotechnology to produce goods or services and/or to perform biotechnology R&D. These firms arecaptured by biotechnology firm surveys.
Biotechnology R&D firms perform biotechnology R&D. These firms are captured by R&D surveys.
Dedicated biotechnology firms devote at least 75% of their production of goods and services, or R&D, to biotechnology.These firms are captured by biotechnology firm surveys.
Dedicated biotechnology R&D firms devote at least 75% of their total R&D to biotechnology. These firms are captured by R&Dsurveys.
For Denmark and Slovenia data are preliminary.
For the Russian Federation, a proxy indicator is used: R&D expenditure by priority areas of S&T (Life sciences). Theseinclude: Bioengineering; Biocatalysis, biosynthesis and biosensor technologies; Biomedical and veterinary technologies;Genomics and pharmaco-genetics; Living cell technologies.
Additional notes:
Number of firms active in biotechnology, 2011
For Mexico, data include firms with some biotechnology activity over 2010-11.The data are overestimated as they cover two yearsand therefore exclude firm exit. Data are for firms with 20 or more employees only.
For the Netherlands and Sweden, firms with 10 or more employees only.
For the United Kingdom, an estimated 66% of biotechnology firms (for most of which biotechnology, as defined by the OECD,is the main activity) undertake R&D.
Biotechnology R&D in the business sector, 2011
For Germany, 2011 business expenditures on R&D (BERD) were used to calculate biotechnology R&D intensity, as 2012 BERD wasnot available.
For Mexico, with 20 or more employees only. 2010 BERD was used to calculate biotechnology R&D intensity, as 2011 BERDwas not available.
For the Netherlands and Sweden, firms with 10 or more employees only.
Biotechnology R&D in the government and higher education sectors, 2011
Government expenditure on R&D (GOVERD); higher education expenditure on R&D (HERD).
For Italy, the higher education sector is excluded.
For the Netherlands, provisional data; the higher education sector is excluded. Public-sector firms or institutes with 10 ormore employees only.
For the Russian Federation, a proxy indicator is used: R&D expenditure by priority areas of S&T (Life sciences). Theseinclude: Bioengineering; Biocatalysis, biosynthesis and biosensor technologies; Biomedical and veterinary technologies;Genomics and pharmaco-genetics; Living cell technologies.
For Slovenia, data are provisional.
4.5. Nanotechnology R&D
General notes:
Number of firms active in nanotechnology, 2011 and;Nanotechnology R&D in the business sector, 2011
Nanotechnology firms use nanotechnology to produce goods or services and/or to perform nanotechnology R&D. Thesefirms are captured by nanotechnology firm surveys.
Nanotechnology R&D firms perform nanotechnology R&D. These firms are captured by R&D surveys.
Dedicated nanotechnology firms devote at least 75% of their production of goods and services, or R&D, to nanotechnology.These firms are captured by nanotechnology firm surveys.
OECD SCIENCE, TECHNOLOGY AND INDUSTRY SCOREBOARD 2013 © OECD 2013174
4. TARGETING NEW GROWTH AREAS
Notes and References
Dedicated nanotechnology R&D firms devote at least 75% of their total R&D to nanotechnology. These firms are captured by R&Dsurveys.
For Japan, number of business enterprises with a paid-in capital of JPY 100 million or more.
Additional notes:
Number of firms active in nanotechnology, 2011
For Mexico, data include firms with some nanotechnology activity over 2010-11. The data are overestimated as they covertwo years and therefore exclude firm exit. Data are for firms with 20 or more employees only.
Nanotechnology R&D in the business sector, 2011
For Japan and Mexico, 2010 business expenditures on R&D (BERD) were used to calculate nanotechnology R&D intensity, as2011 BERD was not available.
For the Russian Federation, preliminary estimates based on data gathered in the R&D survey.
Nanotechnology R&D in the government and higher education sectors, 2011
Government expenditure on R&D (GOVERD); higher education expenditure on R&D (HERD).
For Italy and Korea, the higher education sector is excluded.
For Japan, 2010 GOVERD and 2010 HERD were used to calculate nanotechnology R&D intensity, as 2011 data were not available.
For Korea, 2011 GOVERD and 2011 HERD were used to calculate nanotechnology R&D intensity, as 2012 data were not available.
4.6. ICT innovation
R&D expenditure in information industries, 2011
The “information industries” aggregate comprises ISIC Rev.4 Divisions 26 and 58-63. The terms “ICT equipment”, “Publish-ing, audiovisual and broadcasting activities”, “Telecommunications” and “IT and other information services” refer to ISICRev.4 Divisions 26, 58-60, 61 and 62-63, respectively. “ICT services not allocated” refers to industries within Divisions 58-63that cannot be separated.
For Australia, Denmark, France, Germany, Italy, the Netherlands, Portugal, Spain and the United Kingdom, data refer to 2010.
For Austria, Belgium, China, Sweden and the United States, data refer to 2009.
For Switzerland data refer to 2008.
Data from national sources for Canada and Switzerland.
ICT-related patents, 1999-2001 and 2009-11
Data relate to patent applications filed under the Patent Cooperation Treaty (PCT). Patent counts are based on the prioritydate, the inventor’s residence and fractional counts. ICT-related patents are defined using International Patent Classifica-tion (IPC) codes, following the classification presented in Schmoch (2008, revised 2013). Only economies that applied formore than 250 patents in 2009-11 are included.
Enterprises with broadband connection, by employment size, 2012
For Australia, data refer to 2010/11 (fiscal year ending 30 June 2011) instead of 2012.
For Canada, medium-sized enterprises have 50-299 employees instead of 50-249 persons employed. Large enterprises have300 or more employees instead of 250 or more persons employed.
For Japan, all businesses with 100 or more persons employed instead of 10 or more, 100-299 instead of 50-249, and 300 ormore instead of 250 or more.
For Mexico, data refer to 2008 instead of 2012 and to businesses with 20 or more persons employed instead of 10 or more.
For Switzerland, data refer to 2011 instead of 2012.
4.7. Broadband price and quality
Prices of fixed broadband basket, 33 GB, 15 Mbit/s and above, September 2012
The OECD basket of fixed broadband services includes total charges for a subscription with a minimum speed of 15 Mbit/s and33 GB for 60 hours of usage a month. USD purchasing power parities (PPP) are used to facilitate international comparisons.
OECD SCIENCE, TECHNOLOGY AND INDUSTRY SCOREBOARD 2013 © OECD 2013 175

4. TARGETING NEW GROWTH AREAS
Notes and References
Prices of mobile voice calls plus data traffic reference baskets, August 2012
The OECD methodology for measuring prices for communication services is based on consumption patterns or “baskets” offixed, mobile and leased line communication services prices, collected from multiple operators with the largest marketshares in each country. The current presentation of the price benchmarking results for mobile broadband services coversservices provided over a handset or smartphone.
The 30 calls/100MB, 100calls/500MB and 900calls/2GB OECD baskets of mobile telephone charges include fixed and usagecharges for respectively 30, 100 and 900 voice calls, and a volume of 100 MB, 500 MB and 2GB of data traffic per month. Thesebaskets approximately portray small, average and large users of voice and mobile data. USD purchasing power parities (PPP)are used to facilitate international comparisons. Additional information on the computation methodology can be found inthe OECD Communications Outlook 2013.
4.8. Fixed and wireless broadband
Wireless broadband penetration by technology, December 2009 and 2012
Wireless terrestrial broadband includes standard (voice plus data) and dedicated mobile data subscriptions, as well as ter-restrial fixed wireless and satellite broadband. The latter two categories in the family of wireless technologies are wide-spread in only a few countries and, from the usage perspective, correspond to fixed broadband connections.
Standard mobile broadband subscriptions may include dedicated mobile data subscriptions when breakdowns are not available.
Data for Israel, Mexico, Switzerland and the United States are estimates.
Fixed wired broadband penetration by speed tiers, December 2009 and 2012
OECD subscription data (December 2012) merged with Akamai’s actual speed data (2nd quarter, 2012).
Figures on fixed wired broadband subscriptions exclude fixed terrestrial wireless and satellite broadband technologies,which are typically used in fixed locations. These are grouped with other wireless subscriptions, and are relevant for only afew countries, and in particular, the Czech Republic (with a penetration rate of 8.6%) and the Slovak Republic (4.8%).
Data for Mexico, Switzerland and the United States are OECD estimates.
Household Internet access by income quartile, 2008 and 2012
For Australia, data refer to 2010/11 (fiscal year ending 30 June 2011) instead of 2012.
For Canada, the Czech Republic, Denmark, Israel, the Netherlands and the United States, data refer to 2011 instead of 2012.
For Chile, data refer to 2009 instead of 2008.
For Korea, data are not available by income quartiles but by thresholds. The bottom quartile was made equivalent to anincome of less than KRW 100 million and the top quartile to an income of more than KRW 300 million.
For New Zealand, data refer to 2006 instead of 2008.
For Switzerland and Turkey, data refer to 2010 instead of 2012.
For the United States, data refer to 2007 instead of 2008.
For Australia, Canada, France, Ireland, Mexico, Turkey and the United Kingdom, data by quartile are not available.
4.9. Internet users
Regular Internet users by age, 2012
National source for the Russian Federation is the Institute for Statistical Studies and Economics of Knowledge, HigherSchool of Economics (HSE) of the National Research University, May 2013.
For the Czech Republic, Denmark and the Netherlands, data refer to 2011.
For Korea and Mexico, Internet users are defined for a recall period of 12 months.
For Switzerland, data refer to daily Internet users. Internet users are defined for a recall period of 6 months.
Regular Internet users by educational attainment and age, 2012
For EU countries and Turkey, data by educational attainment for 16-24 and 65-74 year-olds are OECD estimates based onEurostat; for 16-24 year-olds, they are a 2010-12 average.
For the Czech Republic, Denmark and the Netherlands, data by educational attainment for 65-74 year-olds refer to 2011.
For Turkey, data refer to 2010.
For Switzerland, Internet users are defined for a recall period of 6 months.
For Mexico data refer to all Internet users defined for a recall period of 12 months.
For Chile and Switzerland, data for the lower educational level include all individuals without tertiary education.
OECD SCIENCE, TECHNOLOGY AND INDUSTRY SCOREBOARD 2013 © OECD 2013176

4. TARGETING NEW GROWTH AREAS
Notes and References
Individuals who purchased on line in the last three months, by age class, 2012
For Australia, Canada, Chile, Mexico, New Zealand and Switzerland the reference period is the last 12 months.
For Australia, data refer to the financial year ending 30 June 2010 (2009/10) instead of 2012.
For Canada, the question refers to “ordering goods or services over the Internet from any location (for personal or householduse, not business use)”.
For the Czech Republic, Denmark and the Netherlands data refer to 2011 instead of 2012.
For Chile, data refer to 2009 instead of 2007. In 2009, no time period is specified, instead of last 12 months.
For Israel, data refer to all individuals aged 20 and over instead of individuals aged 16-74 and to 2006 instead of 2007.
For Japan, details by age are not available. Data refer to all individuals aged 6 and over instead of 16-74.
For New Zealand, data refer to 2006 instead of 2007 and relate to e-purchases for personal use only requiring an on line payment.
For Switzerland, data refer to 2005 instead of 2007.
For Turkey, data refer to 2010 instead of 2012.
For the United States, data are drawn from the PEW Research Center and cover all individuals aged 18 and over, instead of16-74, who ever purchased a product on line. Data refer to September 2007 and May 2011.
4.10. Emerging technologies
Acceleration in the development of patented technologies, 2000-11
Data relate to patent applications filed under the Patent Cooperation Treaty (PCT). Patent counts are based on the applicationdate, the International Patent Classification (IPC) codes and fractional counts. Patent “bursts” correspond to periods character-ised by the sudden and persistent increase in the number of patents filed at the 4-digit IPC class level.Top patent bursts are iden-tified by comparing the filing patterns of all 4-digit IPC classes. The intensity of a patent burst refers to the relative strength ofthe observed increase in filing patterns. Only IPC classes featuring a positive burst intensity in the 2000s are included.
Descriptions of IPC codes are available at: www.wipo.int/classifications/ipc/en.
Acceleration in the co-development of patented technologies, 1996-2001 and 2006-11
Data relate to patent applications filed under the Patent Cooperation Treaty (PCT). Patent counts are based on the applica-tion date and the co-occurrence of IPC codes in patents, using fractional counts. Patent “bursts” correspond to periods char-acterised by the sudden and persistent increase in the number of patents filed in the pairs of 4-digit IPC classes considered.Top patent bursts are identified by comparing the filing patterns of all possible pairs of 4-digit IPC classes. The intensity ofa patent burst refers to the relative strength of the observed increases in the filing patterns. Technology domains have beenidentified through text analysis of the combinations of IPC codes considered. Only IPC combinations with a positive burstintensity in the 2000s (either starting or ending burst) are included.
Descriptions of IPC codes are available at: www.wipo.int/classifications/ipc/en.
ReferencesKleinberg, J. (2003), “Bursty and Hierarchical Structure in Streams”, Data Mining and Knowledge Discovery, Vol. 7, No. 4, pp. 373-397.
Doi: http://dx.doi.org/10.1023/A:1024940629314.
OECD (2002), Frascati Manual 2002. The Measurement of Scientific and Technological Activities. Proposed Standard Practice for Surveys onResearch and Experimental Development, 6th edition, OECD Publishing, www.oecd.org/sti/frascatimanual.Doi: http://dx.doi.org/10.1787/9789264199040-en.
OECD (2005), “A Framework for Biotechnology Statistics”, OECD, Paris, www.oecd.org/dataoecd/5/48/34935605.pdf.
OECD (2009), “Guidelines for a Harmonised Statistical Approach to Biotechnology Research and Development in the Governmentand Higher Education Sectors”, Working Party of National Experts on Science and Technology Indicators, DSTI/EAS/STP/NESTI(2009)1/FINAL, OECD, Paris, www.oecd.org/dataoecd/33/9/44279076.pdf.
OECD (2009), “OECD Biotechnology Statistics 2009”, OECD, Paris, www.oecd.org/dataoecd/4/23/42833898.pdf.Doi: http://dx.doi.org/10.1787/9789264073937-en.
OECD (2009), OECD Patent Statistics Manual, OECD Publishing, Paris. Doi: http://dx.doi.org/10.1787/9789264056442-en.
OECD (2011), Science, Technology and Industry Scoreboard 2011, OECD Publishing. Doi: http://dx.doi.org/10.1787/sti_scoreboard-2011-en.
Schmoch, U. (2008), “Concept of a Technology Classification for Country Comparisons, Final Report to the World IntellectualProperty Organisation (WIPO)”, revised in January 2013, www.wipo.int/export/sites/www/ipstats/en/statistics/patents/pdf/wipo_ipc_technology.pdf.
OECD SCIENCE, TECHNOLOGY AND INDUSTRY SCOREBOARD 2013 © OECD 2013 177


OECD SCIENCE, TECHNOLOGY AND INDU
5. UNLEASHING INNOVATION IN FIRMS
1. Mixed modes of innovation2. Broader innovation3. Public support to innovation4. The IP bundle5. Trademarks6. Knowledge-asset-related trademarks7. Registered designs8. Trademarks and patents9. Entry, exit and survival10. Firm employment dynamics11. Access to capital12. Policy environmentNotes and References
A dynamic business sector and favourable framework conditions are crucial to innovationand entrepreneurship. In their innovation strategies, firms tend to combine the introduction ofnew products with the adoption of new production, organisational and marketing methods.Although much innovation is not R&D-based, the propensity to innovate among firms doingR&D is consistently higher. For their part, governments play an important role in promotinginvestment in innovation. Also critical for innovative firms is the ability to appropriate, exploitand protect the results of their creative activities. A new indicator on the intellectual property (IP)bundle points to the joint use of patents, trademarks and industrial designs by firms worldwide.For the first time patents and trademarks are matched to company data to describe the IP bundleof firms in different countries and sectors. A novel use of trademark data is also proposed to helptrack intermediaries in IP-related transactions. New data on registered designs provideinformation on how creativity is protected in countries. Indicators of firms’ birth and death ratesreflect the dynamism of the business sector. Evidence from a new project based on microdatashows the strong contribution of young firms to job creation. Policy areas for particular attentionare the financing of innovative efforts and fostering the start-up and growth of new firms.Selected indicators reflect the availability of debt financing and venture capital; regulatory andtaxation indicators are also important as these areas affect entrepreneurial activities.
STRY SCOREBOARD 2013 © OECD 2013 179

5. UNLEASHING INNOVATION IN FIRMS
1. Mixed modes of innovation
Firm-level data reveal innovation strategies that combinedifferent types (“mixed modes”) of innovation: most innova-tive firms introduce new marketing or organisational meth-ods alongside product or process innovations since theseare often complementary. In fact, new organisational meth-ods may facilitate the introduction of a new production pro-cess or the new process may even require them. This holdstrue for both large firms and SMEs in both manufacturingand services.
Brazil, Israel, Luxembourg and Germany have the largestshare of organisational and marketing innovators: morethan 80% of large firms and more than half of all SMEs intro-duced such innovations in 2008-10. In the Russian Federation,Chile and Poland, fewer than 20% of all SMEs introducedorganisational or marketing innovations. A significantlyhigher share of large firms than of SMEs introduced productand process innovations in all countries, and particularly inSlovenia, Spain and Estonia.
In most countries, the shares of organisational and market-ing innovating firms are relatively similar across broadsectors, although in Iceland and Portugal, the share issignificantly higher in services (by 19.2 and 13.4 percentagepoints, respectively). In Israel and Brazil, more than 20% ofall firms in manufacturing and 30% in services introducedorganisational or marketing innovations only.
Innovation types by firm size, 2008-10As a percentage of all SMEs and large firms
Source: OECD, based on Eurostat (CIS-2010) and national data sources,June 2013. See chapter notes.
1 2 http://dx.doi.org/10.1787/888932892404
100 025 2550 5075 75 100%
RUS
CHL
GBR
SVK
NOR
JPN
NZL
POL
HUN
TUR
AUS
CAN
CZE
ISL
ESP
FIN
DNK
ITA
FRA
SWE
KOR
NLD
IRL
SVN
BEL
AUT
PRT
ISR
BRA
LUX
EST
DEU
ZAF
Product or process innovation only
Product or process and marketing or organisational innovation
Marketing or organisational innovation only
SMEs Large firms
Definitions
The current edition of the Oslo Manual identifies fourtypes of innovation:
● Product innovation: the introduction of a good or ser-vice that is new or significantly improved withrespect to its characteristics or intended uses. Thisincludes significant improvements in technicalspecifications, components and materials, incorpo-rated software, user friendliness or other functionalcharacteristics.
● Process innovation: the implementation of a new orsignificantly improved production or deliverymethod. This includes significant changes in tech-niques, equipment and/or software.
● Marketing innovation: the implementation of a newmarketing method involving significant changes inproduct design or packaging, product placement,product promotion or pricing.
● Organisational innovation: the implementation of anew organisational method in the firm’s businesspractices, workplace organisation or external rela-tions.
Innovation statistics reported in this publication are,unless otherwise specified, based on a common sec-toral coverage, defined on the basis of the “core” list ofindustries included in the CIS-2008 (see chapternotes).
OECD SCIENCE, TECHNOLOGY AND INDUSTRY SCOREBOARD 2013 © OECD 2013180

5. UNLEASHING INNOVATION IN FIRMS
1. Mixed modes of innovation
Innovation in the manufacturing sector, 2008-10As a percentage of all manufacturing firms
Source: OECD, based on Eurostat (CIS-2010) and national data sources, June 2013. See chapter notes.1 2 http://dx.doi.org/10.1787/888932892423
Innovation in the services sector, 2008-10As a percentage of all services firms
Source: OECD, based on Eurostat (CIS-2010) and national data sources, June 2013. See chapter notes.1 2 http://dx.doi.org/10.1787/888932892442
Measurability
These indicators may be affected by differences in the sectoral coverage of innovation surveys across countries.Although an effort was made to align the data for non-European countries with the “core” coverage of the CommunityInnovation Survey (CIS), this is not always possible owing to survey and sample design. In Korea, these data only coverthe manufacturing sector. Similarly, differences in sectoral coverage in Brazil, Canada, Chile, New Zealand and SouthAfrica may affect the comparability of some indicators. Finally, some countries do not identify firms with ongoing/abandoned innovation activities, so that (contrary to the CIS data) these are not included in the figures for productand/or process innovative firms and may also affect comparability.
%
20
60
40
80
0
DEU CANZAF
BEL IRL
AUS FIN LUX
NLD ISRES
TSWE ISL
AUTDNK ITA PRT
FRA
NORCZE
GBRBRA
NZL KORTUR
ESP
JPN
SVKCHL
HUNPOL
RUS
Product or process innovation only Product or process and marketing or organisational innovation
Marketing or organisational innovation only
%
20
60
40
80
0
ISLZAF
DEU AUSCAN
PRTLU
XSWE
BEL BRANLD ISR FIN IR
LES
TDNK
AUTNZL NOR ITA CZE
FRA
GBRSVN
SVKES
PJP
NHUN
CHLPOL
RUS
Product or process innovation only Product or process and marketing or organisational innovation
Marketing or organisational innovation only
OECD SCIENCE, TECHNOLOGY AND INDUSTRY SCOREBOARD 2013 © OECD 2013 181
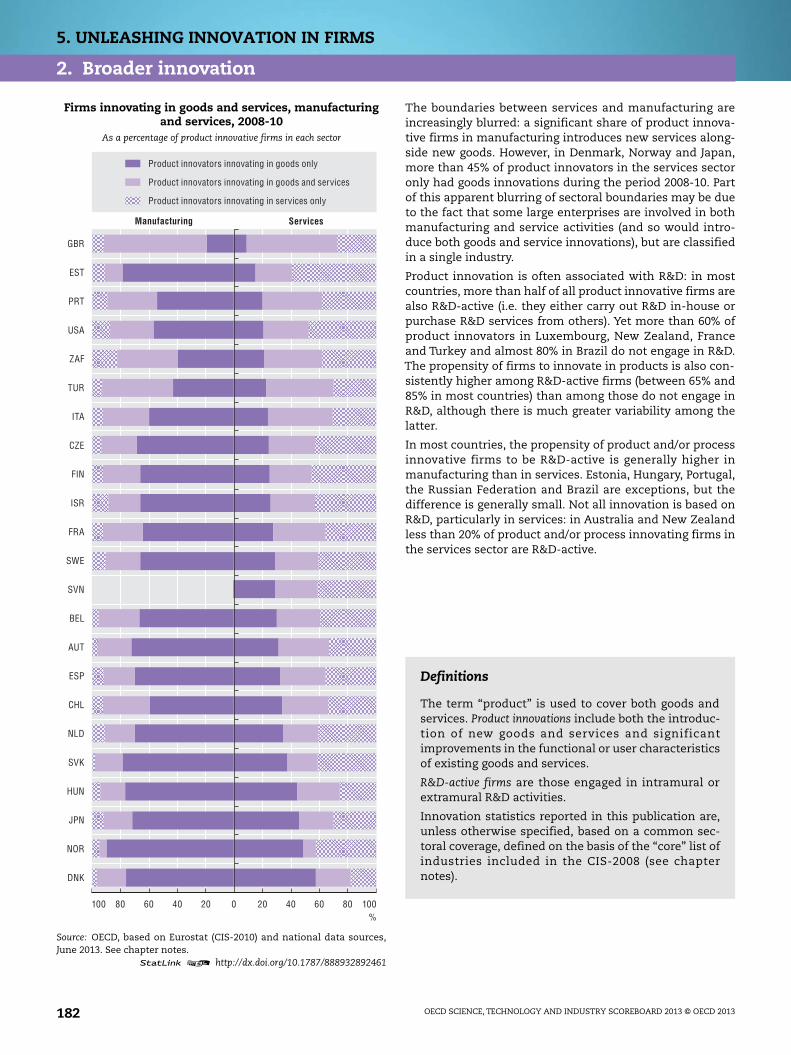
5. UNLEASHING INNOVATION IN FIRMS
2. Broader innovation
The boundaries between services and manufacturing areincreasingly blurred: a significant share of product innova-tive firms in manufacturing introduces new services along-side new goods. However, in Denmark, Norway and Japan,more than 45% of product innovators in the services sectoronly had goods innovations during the period 2008-10. Partof this apparent blurring of sectoral boundaries may be dueto the fact that some large enterprises are involved in bothmanufacturing and service activities (and so would intro-duce both goods and service innovations), but are classifiedin a single industry.
Product innovation is often associated with R&D: in mostcountries, more than half of all product innovative firms arealso R&D-active (i.e. they either carry out R&D in-house orpurchase R&D services from others). Yet more than 60% ofproduct innovators in Luxembourg, New Zealand, Franceand Turkey and almost 80% in Brazil do not engage in R&D.The propensity of firms to innovate in products is also con-sistently higher among R&D-active firms (between 65% and85% in most countries) than among those do not engage inR&D, although there is much greater variability among thelatter.
In most countries, the propensity of product and/or processinnovative firms to be R&D-active is generally higher inmanufacturing than in services. Estonia, Hungary, Portugal,the Russian Federation and Brazil are exceptions, but thedifference is generally small. Not all innovation is based onR&D, particularly in services: in Australia and New Zealandless than 20% of product and/or process innovating firms inthe services sector are R&D-active.
Firms innovating in goods and services, manufacturingand services, 2008-10
As a percentage of product innovative firms in each sector
Source: OECD, based on Eurostat (CIS-2010) and national data sources,June 2013. See chapter notes.
1 2 http://dx.doi.org/10.1787/888932892461
100 020 2040 40 6080 60 80 100%
DNK
NOR
JPN
HUN
SVK
NLD
CHL
ESP
AUT
BEL
SVN
SWE
FRA
ISR
FIN
CZE
ITA
TUR
ZAF
USA
PRT
EST
GBR
Product innovators innovating in goods only
Product innovators innovating in goods and services
Product innovators innovating in services only
Manufacturing Services
Definitions
The term “product” is used to cover both goods andservices. Product innovations include both the introduc-tion of new goods and services and significantimprovements in the functional or user characteristicsof existing goods and services.
R&D-active firms are those engaged in intramural orextramural R&D activities.
Innovation statistics reported in this publication are,unless otherwise specified, based on a common sec-toral coverage, defined on the basis of the “core” list ofindustries included in the CIS-2008 (see chapternotes).
OECD SCIENCE, TECHNOLOGY AND INDUSTRY SCOREBOARD 2013 © OECD 2013182

5. UNLEASHING INNOVATION IN FIRMS
2. Broader innovation
Product innovation, by R&D status, 2008-10
Source: OECD, based on Eurostat (CIS-2010) and national data sources, June 2013. See chapter notes.1 2 http://dx.doi.org/10.1787/888932892480
R&D-active firms, manufacturing and services, 2008-10As a percentage of product and/or process innovative firms in each sector
Source: OECD, based on Eurostat (CIS-2010) and national data sources, June 2013. See chapter notes.1 2 http://dx.doi.org/10.1787/888932892499
Measurability
Because R&D and innovation are related phenomena, some countries collect information on innovation as part ofbusiness R&D surveys. Given that R&D surveys target R&D performers while innovation surveys have a much widertarget population, these differences may affect the comparability of R&D-related data collected from different instru-ments.
In dedicated surveys that adopt the Community Innovation Survey (CIS) model, firms are typically identified as beingR&D-active when they report carrying out internal or external R&D as part of their product and/or process innovationactivities. The innovation surveys of Australia and New Zealand request this information of all innovative firms(including those with only organisational or marketing innovations).
Differences in surveys’ sectoral coverage affect the comparability of the data relating to R&D status since some non-CIS surveys cover less R&D-intensive industries much more extensively. Differences in the size thresholds used alsoaffect comparability since very small firms are on average less likely to carry out or purchase R&D.
%100
60
20
10
80
40
70
30
90
50
0
BRATUR
FRA
NZL LUX
CHLUSA
POLDNK
ESP
ZAFITA HUN
PRTJP
NDEU ISR
AUTGBR
CHEES
TSWE
SVKNLD RUS
CZEBEL NOR
SVN FIN KOR
Non R&D-active product innovators R&D-active product innovators
Product innovators (as % of all R&D-active firms) Product innovators (as % of all non R&D-active firms)
%90
50
70
0
60
80
40
30
20
10
SVN FIN CHENOR
BEL NLD SWECZE
AUTISR
SVKDEU GBR
JPN
EST
ZAFITA CHL
HUNPRT
DNKES
PPOL
TURFR
ARUS
NZL AUSBRA
Manufacturing Services
OECD SCIENCE, TECHNOLOGY AND INDUSTRY SCOREBOARD 2013 © OECD 2013 183

5. UNLEASHING INNOVATION IN FIRMS
3. Public support to innovation
Public support, both direct and indirect, can play a key rolein facilitating firms’ investment in R&D and innovation, par-ticularly by small and medium-sized enterprises (SMEs). Inmost countries, the share of government-financed businessenterprise expenditures on R&D (BERD) to SMEs hasincreased in the last decade to between 40% and 80% and toover 85% in the Slovak Republic, Estonia and Hungary in2011. However, in Japan, Luxembourg, the United States andSweden, more than 80% of public support goes to firms withover 250 employees.
Many countries offer various financial incentives to encour-age firms to engage in innovation activities (R&D and other),but uptake varies between 20% and 40% in most countries.In a large majority of countries, large firms tend to benefitmore from such schemes than SMEs. In several cases forwhich earlier data are available, the rate of uptake amonginnovative firms seems to have increased from 2006-08 to2008-10.
Public support for innovation is generally more prevalentin manufacturing than in services, although the differ-ence is quite small in most countries. In Luxembourg, theNetherlands, Finland and Switzerland the share of manu-facturing firms receiving public support for innovationexceeds that of services firms by 20 to 30 percentage points.Only in the Russian Federation is the uptake of public sup-port for innovation higher in service firms, although thismay include a significant number of firms whose mainactivity is R&D services for others.
Government-financed R&D in the business sector,by firm size, 2011
As a percentage of government-financed BERD
Source: OECD, Research and Development Statistics Database,www.oecd.org/sti/rds, June 2013. See chapter notes.
1 2 http://dx.doi.org/10.1787/888932892518
0 4020 8060 100%
JPN
LUX
USA
SWE
GBR
FRA
ITA
NLD
DEU
AUT
CHL
FIN
AUS
NOR
KOR
CAN
DNK
BEL
CZE
NZL
ESP
CHE
PRT
SVN
HUN
EST
SVK
Firms with fewer than 50 employees
Firms with 50 to 249 employees
Definitions
Government-financed BERD includes all forms ofdirect support such as grants, some types of loans andprocurement contracts. It does not include R&D taxcredits or other indirect support measures.
Public support for innovation includes financial sup-port via tax credits or deductions, grants, subsidisedloans, and loan guarantees. It excludes research andother innovation activities conducted entirely for thepublic sector under contract.
The classification of firms by size follows the recom-mendations of the Oslo Manual. In a majority of coun-tries, it is calculated on the basis of the number ofemployees. SMEs are defined as firms with 10-250employees, with some exceptions: New Zealand 6+;the Russian Federation 15+, Mexico 20+. For SouthAfrica, firm size is based on turnover.
Innovation statistics reported in this publication are,unless otherwise specified, based on a common sec-toral coverage, defined on the basis of the “core” list ofindustries included in the CIS-2008 (see chapternotes).
OECD SCIENCE, TECHNOLOGY AND INDUSTRY SCOREBOARD 2013 © OECD 2013184

5. UNLEASHING INNOVATION IN FIRMS
3. Public support to innovation
Firms receiving public support for innovation, by firm size, 2006-08 and 2008-10As a percentage of product and/or process innovative firms
Source: OECD, based on Eurostat (CIS-2010) and national data sources, June 2013. See chapter notes.1 2 http://dx.doi.org/10.1787/888932892537
Firms receiving public support for innovation, manufacturing and services, 2008-10As a percentage of product and/or process innovative firms in each sector
Source: OECD, based on Eurostat (CIS-2010) and national data sources, June 2013. See chapter notes.1 2 http://dx.doi.org/10.1787/888932892556
Measurability
BERD data only cover direct support (grants as well as contracts) and should be complemented with additional infor-mation on indirect support (such as foregone revenue from R&D tax credits) to obtain a broader picture of public sup-port to business R&D.
Data on public support by firm size do not distinguish between SMEs that are part of a group and those that are inde-pendent. The propensity of each of those types of firms to receive public support may differ significantly.
Data on public support for innovation refer to any kind of support scheme, but in the countries carrying out theCommunity Innovation Survey (CIS), this only includes support for product/process innovations. In other countries,public support can include support to other types of innovation, notably marketing and organisational. In the CanadianSurvey of Innovation and Business Strategy (SIBS), public support for innovation only includes grants and tax creditprogrammes across all levels of government.
%70
50
0
60
40
30
20
10
MEXCAN
FRA
AUT FIN HUNNLD SVN ITA TUR
ESP
JPN
EST
PRTCZE
BEL GBRDEU BRA
POLLU
XRUS
SVKCHL
ISRCHE
AUSZAF
Large firms All firms (2008-10) SMEs
Large firms
SMEs
All firms (2006-08)
%60
50
0
40
30
20
10
FRA
NLD FIN LUX
HUN ITA TURES
PES
TBEL JP
NCZE
DEU PRTPOL
BRASVK
CHLCHE
ISRAUS
RUS
Manufacturing Services
OECD SCIENCE, TECHNOLOGY AND INDUSTRY SCOREBOARD 2013 © OECD 2013 185

5. UNLEASHING INNOVATION IN FIRMS
4. The IP “bundle”
Patents, trademarks and industrial designs can be used toappropriate, exploit or protect the results of innovative andcreative activities. Evidence suggests that firms worldwideincreasingly rely on the joint use of these intellectual prop-erty (IP) rights. The overall size and composition of the IP“bundle” relate to a country’s industrial structure and to themain characteristics of its firms, their innovativeness, cre-ativity and competitiveness, and to framework conditionssuch as trade openness and IP regimes.
The size and composition of the IP bundle vary notablyacross countries in terms of the proportion of patents filedat the European Patent Office (EPO), of Community trademarks (CTM) and of registered Community designs (RCD). Inabsolute terms, the United States, Germany and Japan arethe countries that rely most on these knowledge-basedassets. IP bundles registered at European offices generallyhave a majority of patents, followed by CTM and RCD. ForSpain, Poland and the United Kingdom the IP bundles pre-dominantly contain trademarks. In Poland and Italy designsdominate (37% and 16% respectively).
In general, registered trademarks and designs relate to thesame categories of products at home and abroad, althoughthere are differences in the share of registrations accountedfor by the top two application fields. In the case of Korea,these account for almost 50% of CTM and for more than 60%of designs registered at home and abroad, with ICT andaudiovisual trademarks and designs responsible for the big-gest shares in both.
IP bundle of top 20 applicants, 2010-12
Source: OECD calculations based on OECD, Patent Database, OHIM,Community Trademark Database, CTM Download, May 2013, and OHIM,Registered Community Design Database, RCD Download, April 2013.StatLink contains more data. See chapter notes.
1 2 http://dx.doi.org/10.1787/888932892575
0 303060 9060 120
AUS
ISR
POL
FIN
DNK
CAN
BEL
AUT
CHN
SWE
KOR
ESP
CHE
NLD
ITA
GBR
FRA
JPN
DEU
USA
OHIM Designs
EPO Patents
OHIM Trademarks
Thousands of patent applicationsThousands of trademark/ design applications
Definitions
The IP bundle refers to the joint use of patents, trade-marks and industrial designs, each protecting a differ-ent type of knowledge-based asset. Patents areexclusive rights granted for inventions, i.e. products orprocesses providing new ways of doing something oroffering new technical solutions to problems. Patentsreward innovators but also require the disclosure ofthe relevant technical knowledge and may thus enablefurther technological developments. Trademarks aredistinctive signs – i.e. words, symbols, images, etc., ora combination thereof – used to identify goods or ser-vices. These aim to help customers choose products orservices that meet their needs and expectations, e.g.in terms of quality or price. Registered trademarks areoften part of brand strategies, as brands can be legallyprotected in so far as (some of) their parts are pro-tected by IP rights. Industrial designs protect new and/or original ornamental or aesthetic aspects of articlesrather than their technical features. Designs renderobjects more appealing to consumers and increasetheir marketability or commercial value.
OECD SCIENCE, TECHNOLOGY AND INDUSTRY SCOREBOARD 2013 © OECD 2013186

5. UNLEASHING INNOVATION IN FIRMS
4. The IP “bundle”
Top two trademark application fields, by country, 2009-11As a percentage of total trademark applications
Source: OECD calculations based on OHIM, Community Trademark Database, CTM Download, May 2013; WIPO Statistics Database, November 2012. Seechapter notes.
1 2 http://dx.doi.org/10.1787/888932892594
Top two design application fields, by country, 2009-11As a percentage of total design applications
Source: OECD calculations based on OHIM, Registered Community Design Database, RCD Download, April 2013; WIPO Statistics Database, November2012. See chapter notes.
1 2 http://dx.doi.org/10.1787/888932892613
Measurability
The initial focus on European IP offices is due to the extensive use that applicants worldwide make of them. TheWIPO-administered Madrid System for the International Registration of Marks and the Hague System for the Interna-tional Registration of Industrial Designs are relatively less exploited, with yearly trademark applications varyingbetween 35 000 and 44 000 in 2006-12 (versus 63 000 to 84 000 CTM filed per year at OHIM), and designs registeredunder the Hague System of up to 3 000 a year during the period considered (but up to 22 000 RCD a year).
There are differences in the territorial coverage of EPO patents and of CTM and RCD. EPO patents may be requested forone or more contracting states (38 since 2010), whereas CTM and RCD have a unitary character and their geographicscope cannot be restricted (see chapter notes). Territorial coverage also varies for trademarks and designs registeredthrough the WIPO-administered international system, depending on the contracting states.
In Germany and Spain, the proximity and accessibility of the EPO (Munich) and the OHIM (Alicante) may affect thestatistics.
50
40
20
30
10
0
%
AUSAUT
BEL BRACAN
CHECHN
CZEDEU DNK
ESP FIN FR
AGBR
GRCHUN IR
L ITA JPN
KORLU
XNLD POL
PRTSVK
SWEUSA
Advertising and business services Clothes, textiles and accessoriesAgricultural products
Leisure and educationHealth, pharma and cosmetics ICT and audiovisualFurniture and household goods
WIPO+nationalOHIM
80
60
20
40
0
%
AUSAUT
BEL CANCHE
CHNCZE
DEU DNKES
P FIN FRA
GBR ITA JPN
KORNLD POL
PRTSWE
USA
Clothes, textiles and accessories Electricity and lightning Furniture and household goodsConstruction
Tools and machinesLeisure and education PackagingICT and audiovisual
WIPO+nationalOHIM
OECD SCIENCE, TECHNOLOGY AND INDUSTRY SCOREBOARD 2013 © OECD 2013 187

5. UNLEASHING INNOVATION IN FIRMS
5. Trademarks
Trademarks (TM) are distinctive signs identifying goods andservices that are used by companies to distinguish theirofferings from those of competitors. By endowing productswith the unique characteristics associated with brandnames, they help make their owners more competitive andthus ensure future earning streams. As TM registrationoften accompanies the launch of new products and ser-vices, it can serve as an indicator of innovative and market-ing activity and can proxy non-technological innovationand innovation in services. TM registered by foreign firmsprovide information on market penetration by foreign com-panies and may help reveal firms’ strategies in differentmarkets.
Firms show different propensities to rely on TM and to pen-etrate foreign markets, as shown in TM applications at theUnited States Patent and Trademark Office (USPTO), theEuropean Office for the Harmonization in the InternalMarket (OHIM) and the Japan Patent Office (JPO). This maybe due to factors such as the size of the target market, thepresence and location of foreign affiliates, economies’industrial specialisation, trade agreements, and participa-tion in global value chains. While BRIICS economies show alower level of trademark activity abroad than OECD coun-tries, their presence, especially that of China, has increasedmarkedly in the United States, Japan and Europe over the pastdecade. BRIICS firms appear to target mainly the US market,followed by Europe. With the exception of the RussianFederation BRIICS’ foreign market penetration has been par-alleled by a marked rise in domestic TM registrations.
Most TM applications relate to goods in all markets consid-ered, although the proportion varies among TM offices. Theshare of service TM applications is generally largest in thehome market, i.e. at USPTO for US firms, at JPO for Japanesecompanies and at OHIM for European ones. A varying pro-portion of trademarks (up to 47% in the United Kingdom)covers both goods and services and is typically larger inEurope than in the United States and Japan. This may reflectthe growing sophistication of company strategies for offer-ing bundles of goods and services to clients.
Top 20 trademark applicants, 2009-11 averageTrademark applications at USPTO, OHIM, JPO and national trademark offices,
thousands
Source: US Patent and Trademark Office Bulk Downloads: TrademarkApplication Text hosted by Google; OHIM Community Trademark DatabaseCTM Download, May 2013; JPO Annual Reports 2001-12; WIPO statisticsDatabase, March 2013. StatLink contains more data. See chapter notes.
1 2 http://dx.doi.org/10.1787/888932892632
0 20 40 60 80 100
0 5 10 15 2520
USA
CAN
DEU
GBR
JPN
FRA
CHE
ITA
AUS
MEX
KOR
NLD
ESP
SWE
DNK
AUT
BEL
IRL
LUX
POL
241
109
58
USPTO OHIM JPO
National trademark office (lower axis)
Trademark applications at national offices, thousands
Total OECD: 277.3 (USPTO) 72.4 (OHIM) 107.6 (JPO)
Trademark applications at foreign offices, thousands
EU28
BRIICS
Definitions
Registered TM are a form of intellectual property pro-tection for goods and services that grant exclusiverights to their owners and help consumers chooseproducts that meet their needs and expectations interms of nature, quality and price. Protection isenforced by the courts, which in most systems canblock infringements. A trademark’s country of origin isdefined according to the address of the firm or eco-nomic agent listed in the trademark document.
OECD SCIENCE, TECHNOLOGY AND INDUSTRY SCOREBOARD 2013 © OECD 2013188

5. UNLEASHING INNOVATION IN FIRMS
5. Trademarks
Trademark applications by BRIICS countries, 2000-02 and 2009-11 averagesTrademark applications at USPTO, OHIM, JPO and national trademark offices, thousands
Source: US Patent and Trademark Office Bulk Downloads: Trademark Application Text hosted by Google; OHIM Community Trademark Database CTMDownload, May 2013; JPO Annual Reports 2001-12; WIPO statistics Database, March 2013. See chapter notes.
1 2 http://dx.doi.org/10.1787/888932892651
Share of goods and services trademark applications at USPTO, OHIM and JPO, 2010-12As a percentage of total trademark applications, selected OECD and non-OECD economies
Source: OECD calculations based on US Patent and Trademark Office Bulk Downloads: Trademark Application Text hosted by Google; OHIM CommunityTrademark Database CTM Download, May 2013; and JPO Trademark Data, September 2012. StatLink contains more data. See chapter notes.
1 2 http://dx.doi.org/10.1787/888932892670
Measurability
Applications to register trademarks are filed with the relevant national or regional trademark offices and contain thelist of goods or services (or both) to which the TM would apply. The current edition of the International Classification ofGoods and Services for the Purposes of the Registration of Marks, known as the “Nice Classification” (tenth edition, enteredinto force on 1 January 2013) contains 34 classes of goods and 11 of services. Goods trademarks relate to classes 1-34;service trademarks correspond to classes 35-45. Most countries allow for multi-class filings; a few (e.g. China) allowonly single-class applications. The period of TM protection may vary – it is typically ten years – and trademarks can berenewed indefinitely upon payment of fees. Registration and maintenance fees vary substantially. They are generallyproportional to the number of designated classes, although OHIM, for example, allows up to three classes for the sameinitial fee. This may affect overall statistics and the observed proportions of goods and services TM.
0.5
0.4
0.3
0.2
0.1
0
200
250
150
100
50
0
BRA CHN IDN IND RUS ZAF
2009-11 2000-02 2009-11 2000-02 2009-11 2000-02 2009-11 2000-02 2009-11 2000-02 2009-11 2000-02
USPTO OHIM JPO National trademark office (right-hand scale)
Trademark applications at foreign offices, thousands Trademark applications at national offices, thousands
2.3 (USPTO)0.8 (OHIM)1.3 (JPO)996 (national TM office)
100
90
80
70
60
50
40
30
20
10
0
%
BRA CAN CHN DEU FRA GBR IND ITA JPN KOR RUS USA
0.2
0.4
0.1
0.7
6.4
0.2
0.8
2.7
0.5
12.9
4.3
0.6
50.3
19.3
2.9
4.7
2.7
0.6
6.8
4.0
0.6
0.2
0.4
0.0
5.5
2.1
0.3
1.1
3.1
97.6
0.4
1.5
0.0
0.1
0.3
0.0
8.6
252.
45.
8
Goods Goods and services Services
EU28
OHIM JPOUSPTO Average number of trademark applications, thousands
OECD SCIENCE, TECHNOLOGY AND INDUSTRY SCOREBOARD 2013 © OECD 2013 189

5. UNLEASHING INNOVATION IN FIRMS
6. Knowledge-asset-related trademarks
Data on the registration of trademarks (TM) can help shedlight on the extent to which economic agents specialise inservices and activities related to the generation and accu-mulation of knowledge-based capital (KBC). They also pro-vide interesting information about market penetration byforeign firms in key markets and knowledge-related activi-ties. The focus here is on trademarks related to R&D, whichis essential for knowledge creation and long-term innova-tiveness, and on those related to intellectual property (IP)and to information and communication technologies (ICT),which have been increasing and are shaping the competi-tiveness of firms and economies alike.
The registration of IP transaction-related TM increased sub-stantially in both Europe and the United States from 2004-07to 2009-12: it more than doubled in all economies consid-ered. The increase in applications was less spectacular inR&D-related TM; they even decreased slightly in the UnitedStates, Denmark and Australia in some cases. R&D trade-marks related to ICT account for between 54% and 93% of allR&D-related trademarks, an indication of the complemen-tarity of R&D and ICT. Finally, ICT-related trademarks iden-tified on the basis of a content analysis of the goods andservices listed in the Nice Classification show that theUnited States and Japan have decreased the number of ICT-related trademarks applied for at OHIM in recent years,whereas almost all other economies have generallyincreased them. This may be due to the location of eco-nomic activities or to differences in branding strategies.
IP-transaction-related trademarks, 2004-07 and 2009-12Trademark applications at OHIM and USPTO, top 20 applicants
Source: US Patent and Trademark Office Bulk Downloads: TrademarkApplication Text hosted by Google; OHIM Community Trademark DatabaseCTM Download, May 2013. StatLink contains more data. See chapter notes.
1 2 http://dx.doi.org/10.1787/888932892689
0 200100 400300 500
1479
899
EU28
GBR
DEU
FRA
USA
ESP
POL
NLD
CHE
SWE
LUX
BEL
AUT
ITA
SVN
DNK
JPN
CHN
AUS
CAN
IND
ESP
POL
NLD
CHE
SWE
LUX
BEL
AUT
ITA
SVN
DNK
JPN
CHN
AUS
CAN
IND
0 20 40 60 80
OHIM 2009-12 USPTO 2009-12
Magnified
2004-07
Trademark applications
Definitions
Knowledge-asset-related TM correspond to TM registra-tions filed to protect services and activities related tothe generation and accumulation of KBC. Three mainKBC asset categories are considered: IP, R&D and ICT.IP transaction-related TM aim to capture activitiesexplicitly related to the protection, management andcommercialisation of IP rights, such as patent licens-ing services, IP consultation and legal mediation in thefield of IP. These TM are identified on the basis of key-word searches in class 45 of the Nice Classification oftrademarks. R&D-related trademarks correspond toclass 42 of the Nice Classification and protect: scien-tific and technological services and related researchand design services; industrial analysis and researchservices; and the design and development of computerhardware and software. This part of R&D TM overlapswith ICT-related TM, which are identified on the basisof keyword searches and concern both ICT goods andservices. ICT-related TM have been found in classes 9,28, 35, 38, 41 and 42 of the Nice Classification.
OECD SCIENCE, TECHNOLOGY AND INDUSTRY SCOREBOARD 2013 © OECD 2013190

5. UNLEASHING INNOVATION IN FIRMS
6. Knowledge-asset-related trademarks
R&D-related trademarks, 2004-07 and 2009-12Trademark applications at OHIM and USPTO, thousands, top 20 applicants
Source: US Patent and Trademark Office Bulk Downloads: Trademark Application Text hosted by Google; OHIM Community Trademark Database CTMDownload, May 2013. StatLink contains more data. See chapter notes.
1 2 http://dx.doi.org/10.1787/888932892708
ICT-related trademarks, 2004-07 and 2009-12Trademark applications at OHIM and USPTO, thousands, top 20 applicants
Source: US Patent and Trademark Office Bulk Downloads: Trademark Application Text hosted by Google; OHIM Community Trademark Database CTMDownload, May 2013. StatLink contains more data. See chapter notes.
1 2 http://dx.doi.org/10.1787/888932892727
Measurability
TM are classified according to the Nice Classification, which has 34 classes of goods and 11 of services. Applicationsmay be filed in one or more classes and must contain the list of goods and/or services for which TM protection issought (the so called “goods and services description”). TM offices generally recommend selecting the goods and/orservices from a list of terms previously validated by the office, as submitting non-validated terms may lead to delaysin registration. Application, registration and renewal fees increase with the number of classes designated in the appli-cation. The list of keywords used to identify knowledge asset-related TM and ICT TM are chosen on the basis of asemantic analysis of all terms and expressions listed in the subclasses of the Nice Classification. Future work will aimto refine the goods and services considered in the present experimental work and to address the extent to which ICT-related R&D TM overlap with ICT TM chosen on the basis of the semantic analysis. Using data from different offices orrelated to different periods may give different results.
45
25
5
10
35
15
30
40
20
0
DEU GBRUSA
ESP
FRA ITA NLD AUT
SWEBEL CHE
POL FIN DNKLU
XCAN IR
LJP
NCHN
AUS
0
1
2
3
4
ESP
FRA ITA NLD
AUTSWE
BEL CHEPOL FIN DNK
LUX
CAN IRL
JPN
CHNAUS
ICT-related R&D trademarks OHIM 2009-12 Other R&D trademarks OHIM 2009-12
Other R&D trademarks USPTO 2009-12ICT-related R&D trademarks USPTO 2009-12
Total R&D trademarks 2004-07
Trademark applications, thousands
Magnified
50 (ICT-related R&D TM 2009-12)69 (Total R&D TM 2009-12)52 (Total R&D TM 2004-07)
EU28
25
5
10
15
20
0
DEU USAGBR
ESP
FRA ITA NLD AUT
SWEJP
NBEL CHE
LUX
POL FIN CHNKOR
CANHKG
AUS
62 (2009-12)47 (2004-07)
181 (2009-12)150 (2004-07)
0
1
2
3
46.1 (2009-12)5.3 (2004-07)
NLDAUT
SWEJP
NBEL CHE
LUX
POL FIN CHNKOR
CANHKG
AUS
OHIM 2009-12 USPTO 2009-12 2004-07
Trademark applications, thousands
Magnified
EU28
OECD SCIENCE, TECHNOLOGY AND INDUSTRY SCOREBOARD 2013 © OECD 2013 191

5. UNLEASHING INNOVATION IN FIRMS
7. Registered designs
The appearance of a good, i.e. its design, results from a cre-ative process aimed at shaping one or more of its visual fea-tures to make the product appealing to consumers.Administrative data related to registered designs provideinformation on how creativity moulds the “look and feel” ofarticles, on the importance firms and customers attribute tothe aesthetic features of goods, on product differentiationand customisation and, more generally, on the role ofdesign in shaping competition on the marketplace.
The complexity of a product and the range of aesthetic fea-tures that may make it attractive to consumers can be betterunderstood by looking at the number of distinct designscontained in design applications. On average, an applicationcontains 3.5 individual designs, with the number of individ-ual designs in each application varying between eight (inclothing) and two (in accident prevention devices). Over2010-12, furnishing, clothing and ICT equipment accountfor 30% of all designs contained in design applications.
In transport-related registered Community designs (RCD),Germany and Japan play an important role in the field ofcars, and France and the United States in the design of air-craft and space vehicles. Italy and France are very active inthe design of ships and boats, and cycles and motorcyclesaccount for the vast majority of RCD in the Netherlands andDenmark.
The United States, Japan, Germany and Korea are the mostactive in the design of ICT and audiovisual products. TheUnited States is strong in data processing equipment andKorea in communication devices. France and Japan lead inthe design of audiovisual devices.
Number of designs by Locarno class, 2006-08 and 2010-12Registered Community designs, thousands
Source: OECD calculations based on OHIM, Registered Community DesignDatabase, RCD Download, April 2013. See chapter notes.
1 2 http://dx.doi.org/10.1787/888932892746
0 105 15 20 3025Number of designs, thousands
2010-12 2006-2008
5.4
3.1
4.8
3.5
5.1
3.3
3.5
2.5
3.4
2.4
3.5
2.2
1.5
2.1
2.0
1.7
1.4
1.7
1.6
1.0
0.9
0.9
0.4
0.5
0.5
0.4
0.4
0.3
0.2
0.1
0.2
0.1
Number of design applications in 2010-12,
thousands
6. Furnishing
2. Clothing
14. ICT
26. Lighting
9. Packaging
23. Sanitary equip.
7. Household goods
32. Graphics
8. Tools
25. Construction
12. Transport
21. Games and sports
11. Adornments
3. Travel goods
24. Medical equip.
15. Machines
19. Office equip.
13. Electricity equip.
10. Measurement
20. Advertising
16. Audiovisual
28. Pharma
5. Textile
1. Foodstuffs
30. Animal care
31. Food prep.
4. Brushware
22. Arms
29. Prevention
27. Tobacco
18. Office machines
17. Musical instr.
Definitions
Registered Community designs are intellectual prop-erty (IP) rights granted to protect the ornamental oraesthetic aspects of an article or of its parts againstcopying or the independent development of similardesigns. RCD are valid in the European Union as awhole, have an initial life of five years from filing, andcan be renewed for subsequent five-year periods up toa maximum of 25 years. Only products or parts thereofcan be legally protected, not functionalities or ser-vices. A single application can include several designs,e.g. for a whole range of similar products or differentparts of the same product. Industrial designs followthe Locarno Classification (established in 1968). Itsninth edition, entered into force in 2009, contains 32classes and 219 subclasses of goods. The classificationhas an administrative character and does not bindcontracting countries with respect to the nature andprotection afforded by the design. The owner of anRCD can act against infringement and request EU cus-toms authorities to retain suspected counterfeit goodswhile under their control.
OECD SCIENCE, TECHNOLOGY AND INDUSTRY SCOREBOARD 2013 © OECD 2013192

5. UNLEASHING INNOVATION IN FIRMS
7. Registered designs
Transport-related designs, 2010-12Registered Community designs, top 20 applicants
Source: OECD calculations based on OHIM, Registered Community Design Database, RCD Download, April 2013. See chapter notes.1 2 http://dx.doi.org/10.1787/888932892765
ICT and audiovisual-related designs, 2010-12Registered Community designs, top 20 applicants
Source: OECD calculations based on OHIM, Registered Community Design Database, RCD Download, April 2013. See chapter notes.1 2 http://dx.doi.org/10.1787/888932892784
Measurability
Registered design data are used here for the first time to proxy the “creativity” that countries seek to protect on theEuropean market. Such data are publicly available and provide a homogenous set of information related to e.g. own-ership and the specific goods concerned. Like all proxies, design data suffer from drawbacks, including selectivity andtruncation. Selectivity mainly stems from the fact that not all designs are registered – designers and owners maydecide not to seek IP protection – or cannot be registered, e.g. if the designs are not novel or original or are exclusivelydictated by the product’s technical function. Also, industrial designs cannot be registered everywhere in the world.The United States is a notable exception, as industrial design is protected through the concurrent use of design pat-ents, copyrights and trademarks. Finally, no information about the value of the asset is available in administrativedata. Truncation mainly arises because of delays in making administrative data public and, in the case of RCD, becauseapplicants have the right to keep the design confidential for up to 30 months from filing.
300
250
200
150
100
50
0
DEU JPN ITA FR
AGBR
USACHN
POLES
PSWE
AUTNLD CZE
KORCAN
SVKDNK
HUN FIN CHE
4272 088 736 851 469 517 709 216 450 213 260 152 139 99 85 67 51 103 36 90 199
Ships and boats Aircraft and space vehicles Cycles and motorcyclesCars
Number of designs
Total number of transport designs
3 500
3 000
2 500
2 000
1 500
1 000
500
0
USAJP
NDEU KOR
FRA ITA GBR
CANCHN
ESP
SWEAUT FIN NLD DNK
POLBEL CHE
LUX
AUS
3 295 2 358 2 269 2 014 1 268 993 782 577 464 391 380 284 282 259 187 145 131 129 72 68
Data processing and recording equipment Communication devices Audiovisual devices
Number of designs
Total ICT and audiovisual designs
OECD SCIENCE, TECHNOLOGY AND INDUSTRY SCOREBOARD 2013 © OECD 2013 193
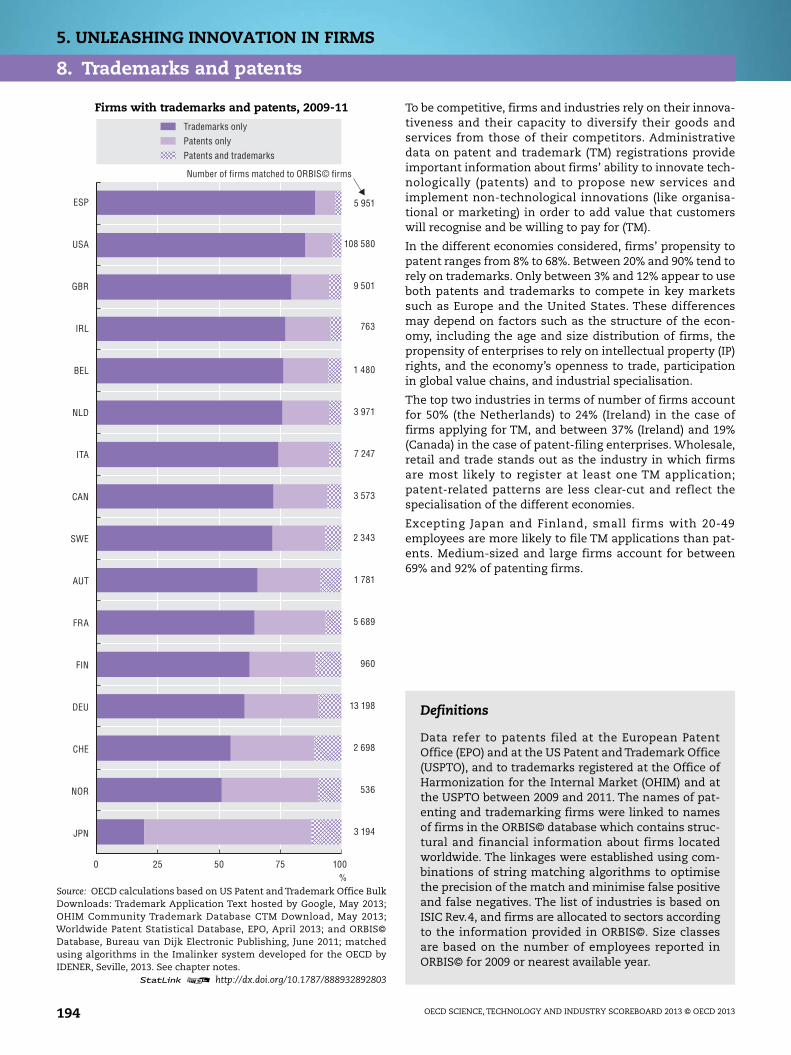
5. UNLEASHING INNOVATION IN FIRMS
8. Trademarks and patents
To be competitive, firms and industries rely on their innova-tiveness and their capacity to diversify their goods andservices from those of their competitors. Administrativedata on patent and trademark (TM) registrations provideimportant information about firms’ ability to innovate tech-nologically (patents) and to propose new services andimplement non-technological innovations (like organisa-tional or marketing) in order to add value that customerswill recognise and be willing to pay for (TM).
In the different economies considered, firms’ propensity topatent ranges from 8% to 68%. Between 20% and 90% tend torely on trademarks. Only between 3% and 12% appear to useboth patents and trademarks to compete in key marketssuch as Europe and the United States. These differencesmay depend on factors such as the structure of the econ-omy, including the age and size distribution of firms, thepropensity of enterprises to rely on intellectual property (IP)rights, and the economy’s openness to trade, participationin global value chains, and industrial specialisation.
The top two industries in terms of number of firms accountfor 50% (the Netherlands) to 24% (Ireland) in the case offirms applying for TM, and between 37% (Ireland) and 19%(Canada) in the case of patent-filing enterprises. Wholesale,retail and trade stands out as the industry in which firmsare most likely to register at least one TM application;patent-related patterns are less clear-cut and reflect thespecialisation of the different economies.
Excepting Japan and Finland, small firms with 20-49employees are more likely to file TM applications than pat-ents. Medium-sized and large firms account for between69% and 92% of patenting firms.
Firms with trademarks and patents, 2009-11
Source: OECD calculations based on US Patent and Trademark Office BulkDownloads: Trademark Application Text hosted by Google, May 2013;OHIM Community Trademark Database CTM Download, May 2013;Worldwide Patent Statistical Database, EPO, April 2013; and ORBIS©Database, Bureau van Dijk Electronic Publishing, June 2011; matchedusing algorithms in the Imalinker system developed for the OECD byIDENER, Seville, 2013. See chapter notes.
1 2 http://dx.doi.org/10.1787/888932892803
0 25 50 75 100%
JPN
NOR
CHE
DEU
FIN
FRA
AUT
SWE
CAN
ITA
NLD
BEL
IRL
GBR
USA
ESP
3 194
536
2 698
13 198
960
5 689
1 781
2 343
3 573
7 247
3 971
1 480
763
9 501
108 580
5 951
Trademarks only
Patents only
Patents and trademarks
Number of firms matched to ORBIS© firms
Definitions
Data refer to patents filed at the European PatentOffice (EPO) and at the US Patent and Trademark Office(USPTO), and to trademarks registered at the Office ofHarmonization for the Internal Market (OHIM) and atthe USPTO between 2009 and 2011. The names of pat-enting and trademarking firms were linked to namesof firms in the ORBIS© database which contains struc-tural and financial information about firms locatedworldwide. The linkages were established using com-binations of string matching algorithms to optimisethe precision of the match and minimise false positiveand false negatives. The list of industries is based onISIC Rev.4, and firms are allocated to sectors accordingto the information provided in ORBIS©. Size classesare based on the number of employees reported inORBIS© for 2009 or nearest available year.
OECD SCIENCE, TECHNOLOGY AND INDUSTRY SCOREBOARD 2013 © OECD 2013194
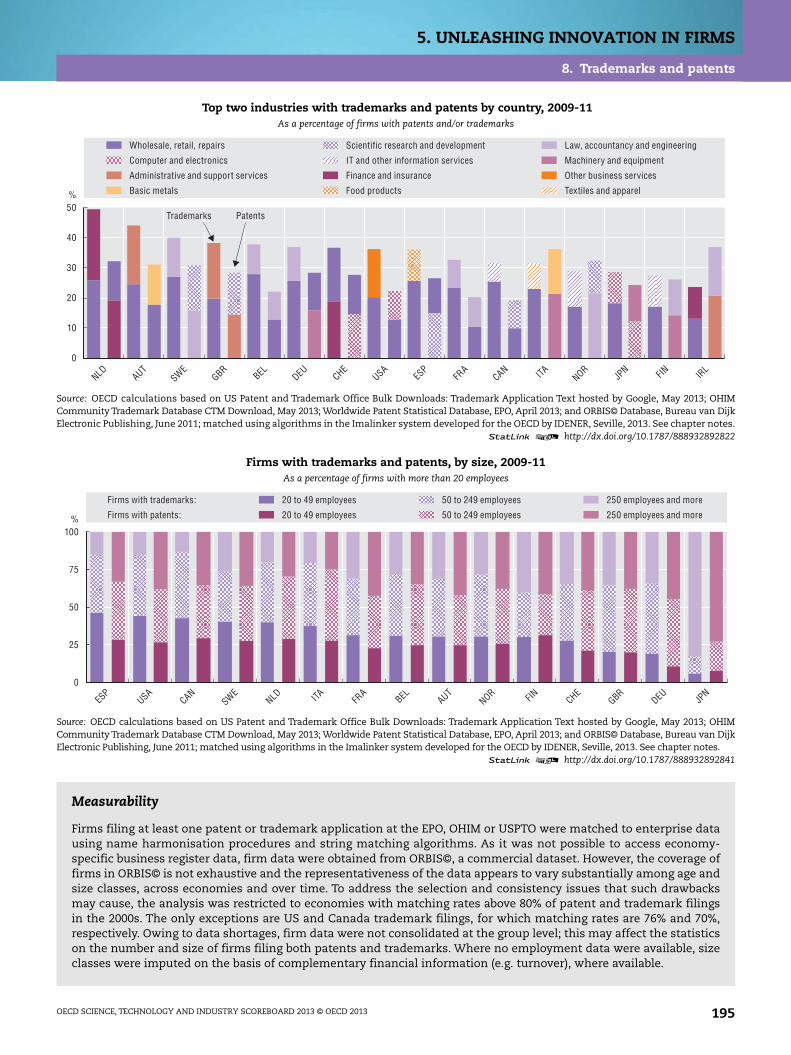
5. UNLEASHING INNOVATION IN FIRMS
8. Trademarks and patents
Top two industries with trademarks and patents by country, 2009-11As a percentage of firms with patents and/or trademarks
Source: OECD calculations based on US Patent and Trademark Office Bulk Downloads: Trademark Application Text hosted by Google, May 2013; OHIMCommunity Trademark Database CTM Download, May 2013; Worldwide Patent Statistical Database, EPO, April 2013; and ORBIS© Database, Bureau van DijkElectronic Publishing, June 2011; matched using algorithms in the Imalinker system developed for the OECD by IDENER, Seville, 2013. See chapter notes.
1 2 http://dx.doi.org/10.1787/888932892822
Firms with trademarks and patents, by size, 2009-11As a percentage of firms with more than 20 employees
Source: OECD calculations based on US Patent and Trademark Office Bulk Downloads: Trademark Application Text hosted by Google, May 2013; OHIMCommunity Trademark Database CTM Download, May 2013; Worldwide Patent Statistical Database, EPO, April 2013; and ORBIS© Database, Bureau van DijkElectronic Publishing, June 2011; matched using algorithms in the Imalinker system developed for the OECD by IDENER, Seville, 2013. See chapter notes.
1 2 http://dx.doi.org/10.1787/888932892841
Measurability
Firms filing at least one patent or trademark application at the EPO, OHIM or USPTO were matched to enterprise datausing name harmonisation procedures and string matching algorithms. As it was not possible to access economy-specific business register data, firm data were obtained from ORBIS©, a commercial dataset. However, the coverage offirms in ORBIS© is not exhaustive and the representativeness of the data appears to vary substantially among age andsize classes, across economies and over time. To address the selection and consistency issues that such drawbacksmay cause, the analysis was restricted to economies with matching rates above 80% of patent and trademark filingsin the 2000s. The only exceptions are US and Canada trademark filings, for which matching rates are 76% and 70%,respectively. Owing to data shortages, firm data were not consolidated at the group level; this may affect the statisticson the number and size of firms filing both patents and trademarks. Where no employment data were available, sizeclasses were imputed on the basis of complementary financial information (e.g. turnover), where available.
50
40
20
10
30
0
%
NLD AUTSWE
GBRBEL DEU CHE
USAES
PFR
ACAN ITA NOR
JPN FIN IR
L
Wholesale, retail, repairs Law, accountancy and engineering
Computer and electronics
Scientific research and development
Machinery and equipment
Administrative and support services
IT and other information services
Textiles and apparelBasic metals Food products
Other business services
PatentsTrademarks
Finance and insurance
100
75
25
50
0
%
ESP
USACAN
SWENLD ITA FR
ABEL AUT
NOR FIN CHEGBR
DEU JPN
20 to 49 employees 250 employees and more50 to 249 employees
20 to 49 employees 250 employees and more50 to 249 employees
Firms with trademarks:
Firms with patents:
OECD SCIENCE, TECHNOLOGY AND INDUSTRY SCOREBOARD 2013 © OECD 2013 195

5. UNLEASHING INNOVATION IN FIRMS
9. Entry, exit and survival
Entrepreneurship and entrepreneurial dynamics are at theheart of employment and productivity. The birth of newfirms and the death of non-viable ones are essential to aneconomy’s experimentation and creative destruction. Asnew, more productive firms appear on the market and grow,less productive ones are driven out of business. The rate atwhich firms are born reflects the ability of economies tocreate entirely new businesses and to experiment, whiledeath rates, i.e. the rates at which firms exit the market,reveal the extent to which less competitive enterprises dis-appear. Birth, survival and death rates are shaped by frame-work conditions such as access to credit, employmentprotection legislation, bankruptcy law and administrativered tape, as well as by the dynamics of economic cycles andglobal value chains.
Economies and industries differ in the proportion of newfirms that survive after one or more years of activity. Amongnew firms born in 2006, first-year survival rates in manufac-turing vary between 62% (in Korea) and 90% (in Slovenia andLuxembourg). The figures are very similar for both manu-facturers and service providers. After three years of activity,firms’ survival rates range between 41% (in Korea) and 68%(in Slovenia). While survival rates of employer enterprisesare generally higher in manufacturing than in services,manufacturing firms born in 2006 were equally hit by thecrisis and in 2009 exhibit only slightly higher survival ratesthan those in services.
A breakdown by industry shows that there is more entryand exit in services than in manufacturing, with a net exitof both manufacturing and services enterprises in 2010 inmost countries. In 2010 the percentage of active enterprisesaccounted for by new-born manufacturing firms variedbetween 2% and 16%, whereas the share of new-bornservices firms ranged between 3% and 22%. In the sameyear, the share of exiting firms varied between 2% and 14%in manufacturing, and between 3% and 19% in services.
Employer enterprise survival rates, 2007 and 2009As a percentage of all employer enterprises, 2006 reference cohort
Source: OECD (2013), Entrepreneurship at a Glance 2013, OECD Publishing.StatLink contains more data. See chapter notes.
1 2 http://dx.doi.org/10.1787/888932892860
0 80 904020 60 703010 50 100%
LUX
SVN
CAN
AUS
EST
ISR
ITA
USA
CZE
SVK
NLD
ESP
FIN
PRT
NZL
HUN
KOR
One-year survival Three-year survival
Definitions
Survival rates correspond to the percentage of enter-prises born in a certain year that survive for n years.Employer enterprise births consist of “new” enterprisesreporting at least one employee in the birth year andof existing enterprises reporting for the first time oneor more employees in the observation year. Births donot include entries due to e.g. mergers, break-ups orrestructuring. Birth rates correspond to the ratiosbetween the number of births and the population ofactive enterprises with at least one employee. Deathoccurs either when an enterprise closes down or whenit shrinks below the one employee threshold for atleast two years.
OECD SCIENCE, TECHNOLOGY AND INDUSTRY SCOREBOARD 2013 © OECD 2013196

5. UNLEASHING INNOVATION IN FIRMS
9. Entry, exit and survival
Employer enterprise birth and death rates in the manufacturing sector, 2010As a percentage of the population of active enterprises with at least one employee
Source: OECD (2013), Entrepreneurship at a Glance 2013, OECD Publishing. See chapter notes.1 2 http://dx.doi.org/10.1787/888932892879
Employer enterprise birth and death rates in the services sector, 2010As a percentage of the population of active enterprises with at least one employee
Source: OECD (2013), Entrepreneurship at a Glance 2013, OECD Publishing. See chapter notes.1 2 http://dx.doi.org/10.1787/888932892898
Measurability
Employer-related indicators are generally better for international comparisons than indicators covering all enter-prises, as the latter are sensitive to the coverage of business registers (BR). In many countries, the main sources of dataused in BR are administrative tax and employment registers, and capture only businesses above a certain turnoverand/or employment threshold. Moreover, thresholds often change over time. The concept of employer enterprise isnot without problems, however, as it excludes the self-employed. Compared to data on births of employer enterprises,information on enterprise deaths requires additional time because it needs ascertaining that the enterprise has notbeen reactivated (or had no employees) in the two years following its death.
%24
16
0
20
12
8
4
MEXBRA
AUSKOR
HUNCZE
FRA ITA PRT
NZL ISRLU
XES
TSWE
SVNAUT
ESP
CANUSA
CHEBEL
Birth Death
%24
16
0
20
12
8
4
MEXKOR
AUSHUN
CZEFR
ALU
XES
TPRT
SWE ITA ESP
NZL SVNAUT
ISRCAN
CHEUSA
BEL
Birth Death
OECD SCIENCE, TECHNOLOGY AND INDUSTRY SCOREBOARD 2013 © OECD 2013 197

5. UNLEASHING INNOVATION IN FIRMS
10. Firm employment dynamics
Firm employment dynamics are at the heart of the processof creative destruction, of the reallocation of resourcesacross firms, and of productivity growth. However, the datarequired for international comparative analysis over timeare scarce and often difficult to access. To fill this gap, theOECD DYNEMP project has developed a new cross-countrydatabase of micro-aggregated firm-level data from adminis-trative data sources, mainly national business registers.
Initial evidence shows that, on average, although youngfirms represent only 17% of total employment, they contrib-ute more than proportionally to job creation across theOECD economies considered, i.e. for 45% of the total. Fortheir part, mature businesses have approximately the sameweight in terms of employment share and gross job cre-ation, at 16% and 13%, respectively, while old businessesaccount on average for 60% of employment but only 35 % ofgross job creation.
Differences in the magnitude of this phenomenon point tothe importance of national policies and business environ-ments in fostering the birth and growth of new firms. Insome countries, young firms account for more than half ofthe economy’s total gross job creation.
This general pattern also holds for the main sectors of theeconomy. The dynamism of young firms in the market ser-vices sector is accentuated by the fact that these firms havea higher share of total employment than in manufacturing.However, in the non-financial market services sector, theratio of gross job creation to the share of employment foryoung firms is only 2.3 on average whereas in manufactur-ing it is almost 3.3.
Employment, job creation and job destruction in youngand mature firms, 2001-11
Percentage shares, non-financial business sector
Source: OECD calculations based on the OECD DYNEMP data collection,July 2013. See chapter notes.
1 2 http://dx.doi.org/10.1787/888932892917
0 804020 60 100%
FIN
USA
JPN
NOR
BEL
SWE
LUX
ITA
HUN
NZL
AUT
ESP
FRA
NLD
BRA
Young (5 years old or less) Mature (6-10 years old)
Job creation
Employment
Job destruction
Definitions
Employment refers to the total number of employees,typically headcounts. In each year, gross job creation isdefined as the sum of all positive unit-level job varia-tions relative to the previous year. Gross job destructionis defined as the sum of all negative unit-level jobvariations relative to the previous year. The figuresreport the shares of employment, gross job creationand gross job destruction in young firms averaged overthe period 2001-11 or nearest available years. Firm agecorresponds to the difference between the referenceyear and a firm’s year of birth. Young firms are fiveyears old or less. Mature businesses are between six andten years old. Old businesses are eleven years old ormore. Business registers are administrative data sourcesthat provide comprehensive coverage of firms’ entry,exit, employment and/or turnover from social securityrecords, tax records, censuses and/or other sources.
OECD SCIENCE, TECHNOLOGY AND INDUSTRY SCOREBOARD 2013 © OECD 2013198

5. UNLEASHING INNOVATION IN FIRMS
10. Firm employment dynamics
Employment, job creation and job destruction in young firms, manufacturing, 2001-11Percentage shares
Source: OECD calculations based on the OECD DYNEMP data collection, July 2013. See chapter notes.1 2 http://dx.doi.org/10.1787/888932892936
Employment, job creation and job destruction in young firms, non-financial services, 2001-11Percentage shares
Source: OECD calculations based on the OECD DYNEMP data collection, July 2013. See chapter notes.1 2 http://dx.doi.org/10.1787/888932892955
Measurability
Owing to the confidential nature of the information in business registers (BR), access is often restricted. Also, becausenational sources are generally not directly comparable, key concepts must be harmonised. To this end, the OECD hasdeveloped statistical routines for researchers to run on national-level data. The DYNEMP database currently containsnon-confidential comparable statistics for 15 OECD economies and Brazil on employment, gross job creation anddestruction by firm age, size and macro-sectors. The statistics are preliminary, e.g. mergers and acquisitions are notaccounted for. Also, differences exist in the minimum threshold above which a unit is captured, as when a BR buildson tax records and filing is compulsory only above a given level of turnover or of employment (or both). Owing tomethodological differences in constructing these indicators, DYNEMP statistics may deviate from official statisticspublished by national statistical offices. For instance, firms that enter and exit the data in the same year, and thosethat are never seen to employ more than one employee, are excluded from DYNEMP-based figures.
%80
40
0
60
20
BRANLD FR
ANZL AUT
HUN ITA ESP
JPN
NORBEL
SWELU
X FIN USA
Employment Job destruction Job creation
%80
40
0
60
20
BRANLD AUT
FRA
HUNNZL ES
PSWE
BEL ITA NORLU
XUSA FIN
Employment Job destruction Job creation
OECD SCIENCE, TECHNOLOGY AND INDUSTRY SCOREBOARD 2013 © OECD 2013 199

5. UNLEASHING INNOVATION IN FIRMS
11. Access to capital
Young innovative firms are essential to economic growthand job creation. However, they face many challenges whenseeking financing as they generally lack collateral or a trackrecord. While not all start-ups require (or deserve) externalcapital, they have difficulty accessing seed and early-stagefinancing. The seed and early-stage equity market hassuffered over the past five years. Banks have been unable orunwilling to provide loans to young innovative start-ups asa result of the financial crisis, and venture capital firmshave become more risk-adverse because of pressures on theindustry and have focused on later-stage investments.
The World Economic Forum’s Global Competitiveness Report,which collects data through executive opinion surveys, pro-vides information on individuals’ views on access to bankloans in different countries. The data show that bankfinancing became more difficult to obtain between 2007 and2012 in all countries but Indonesia and China.
Venture capital differs significantly among countries and isvery sensitive to market cycles in terms both of amountsinvested and stages of investment. In today’s financial envi-ronment, venture capital funds tend to invest in laterstages, leaving gaps at the pre-seed and seed stages whereprofit expectations are less clear and risks much higher.
Access to finance is particularly difficult for small andmedium-sized enterprises (SMEs). In 2011, SMEs’ access todebt and equity finance, and the conditions at which thesewere granted, varied across countries. SME lending condi-tions deteriorated in most countries, particularly as a resultof higher interest rates and greater demand for collateral.This was also generally accompanied by modest or nogrowth in credit volumes, except in a few countries. Thesediverging performances can be traced to the differentdegrees to which countries were hit by the crisis and subse-quently recovered in 2009 and 2010.
Ease of access to loans, 2007-08 and 2011-12Scale from 1 to 7 from hardest to easiest, weighted averages
Source: World Economic Forum (2012), The Global Competitiveness Report2012-2013 and World Economic Forum (2008), The Global CompetitivenessReport 2008-2009, World Economic Forum, Geneva.
1 2 http://dx.doi.org/10.1787/888932892974
1 32 4 5 6
SWE
FIN
NOR
NZL
LUX
IDN
BEL
CAN
USA
AUS
CHL
NLD
CHE
ZAF
ISR
IND
AUT
DEU
BRA
CHN
DNK
JPN
GBR
FRA
SVK
TUR
CZE
EST
ISL
MEX
RUS
POL
HUN
PRT
KOR
SVN
ESP
ITA
IRL
GRC
2007-08
Index
2011-12
Definitions
The ease of access to loans indicator measures how easyit is to obtain bank loans with only a good businessplan and no collateral on a scale of one to seven;higher values suggest easier access. Venture capital isprivate capital provided by specialised firms acting asintermediaries between primary sources of finance(insurance, pension funds, banks, etc.) and privatestart-up and high-growth companies whose sharesare not freely traded on any stock market. SME loansare based on bank data collected by firm size or theavailability of SME financial statements from taxauthorities. In the absence of such data, businessloans below a given threshold (EUR 1 million orUSD 1 million) serve as a proxy for SME loans.
OECD SCIENCE, TECHNOLOGY AND INDUSTRY SCOREBOARD 2013 © OECD 2013200

5. UNLEASHING INNOVATION IN FIRMS
11. Access to capital
Venture capital investment, 2012As a percentage of GDP
Source: OECD (2013), Entrepreneurship at a Glance 2013, OECD Publishing. See chapter notes.1 2 http://dx.doi.org/10.1787/888932892993
SME loans, 2007 and 2011As a percentage of total business loans
Note: Differences in national sources may affect international comparability.Source: OECD (2013), Financing SMEs and Entrepreneurs 2013: An OECD Scoreboard, OECD Publishing. See chapter notes.
1 2 http://dx.doi.org/10.1787/888932893012
Measurability
The access to loan index is based on the World Economic Forum’s Executive Opinion Survey of business executives’views of their operating environment. In collaboration with more than 150 partner institutes in 144 countries, 14 059surveys were conducted in 2012 with an average of 100 respondents per country. Data on venture capital are drawnmainly from national or regional venture capital associations, in some cases in collaboration with commercial dataproviders. There are no standard international definitions of venture capital or of the breakdown of venture capitalinvestments by stage of development. In the OECD Entrepreneurship Financing Database original data are aggregated tofit the OECD classification of venture capital by stages (OECD, Entrepreneurship at a Glance 2013).
In terms of measuring SMEs’ access to finance, countries’ differences in definition and coverage hinder internationalcomparability. The biggest challenge to comparability remains the lack of harmonisation in the statistical definitionof SMEs. This continues to prove difficult owing to the different economic, social and political concerns of individualcountries in their approach to SMEs.
0.40
0.10
0.20
0.30
0.35
0.05
0.15
0.25
0
%
ISRUSA
CANHUN
SWEIR
LKOR FIN GBR
CHEDNK
NLD NORZAF
FRA
JPN
LUX
BEL AUSDEU NZL RUS
ESP
AUTPRT
EST
SVNGRC ITA CZE
POL
00.005
0.015
0.025
0.035
0.010
0.020
0.030
NLD NORZAF
FRA
JPN
LUX
BEL AUSDEU NZL RUS
ESP
AUTPRT
EST
SVNGRC ITA CZE POL
Early stage Later stage Breakdown not available
Magnified
%100
60
0
80
90
50
70
40
30
20
10
2011 2007
SWESVK
CHEKOR
PRTIR
LHUN
SVNNOR
TURUSA
RUSFR
AGBR ITA CAN
CHLES
P FIN CZEDNK
Outstanding SME business loans (stocks) New SME business loans (flows)
OECD SCIENCE, TECHNOLOGY AND INDUSTRY SCOREBOARD 2013 © OECD 2013 201

5. UNLEASHING INNOVATION IN FIRMS
12. Policy environment
The policy environment plays an important role in keepingefficient firms in existence, encouraging the creation of newfirms and promoting healthy competition in the economy.The entry and growth of new firms are important for aneconomy, as is their adaptability to changes in the economyand their ability to exit when necessary. Less red tape facil-itates business creation and good insolvency regimesreduce the stigma of bankruptcy for firms and individualsand encourage entrepreneurs to take risks and innovate. Aproxy measure of such policy settings is the time required toopen and close a business. Days needed to open a businesshave decreased in most countries since 2003, while theyears required to close a business remained rather stable.
A high-quality regulatory framework allows businesses toenter the market and grow. During the last decade, mostOECD countries have lowered barriers to entrepreneurship.
Individuals’ decisions to start a business are also affected bytaxes and tax policy: general taxes (personal income, corpo-rate and capital gain tax rates, social security contributions)and targeted tax policies (tax incentives for start-ups, youngfirms, and small and medium-sized enterprises). OECDanalysis finds that reducing top marginal personal incometax rates raises productivity in industries with potentiallyhigh rates of enterprise creation.
Time needed to open and close a business, 2003 and 2012
Source: World Bank, Doing Business Database, June 2013. See chapternotes.
1 2 http://dx.doi.org/10.1787/888932893031
0 051015 100 200
2003
NZL
AUS
BEL
CAN
HUN
ISL
NLD
PRT
DNK
ITA
SVN
TUR
USA
EST
FRA
KOR
NOR
CHL
MEX
IRL
GRC
GBR
FIN
DEU
SVK
SWE
RUS
CHE
LUX
ZAF
CZE
ISR
JPN
AUT
IND
ESP
POL
CHN
IDN
BRA
Days to open a businessYears to close a business
DaysYears
OECD
EU28
Definitions
Time required to open a business is the number of calen-dar days needed to complete the procedures to oper-ate a business legally. If a procedure can be speeded upat additional cost, the fastest procedure is chosenindependent of cost. Time required to close a business isthe average number of years to close a business. Infor-mation is collected on the sequence of procedures andon whether any procedures can be carried out simul-taneously. The barriers to entrepreneurship indicatormeasures regulations affecting entrepreneurship on ascale of zero to six; lower values suggest lower barri-ers. The index is composed of barriers to competition(legal barriers, antitrust exemptions, barriers in net-work sectors and in retail and professional services);regulatory and administrative opacity (licences, per-mits, simplicity of procedures); and the administrativeburden for creating new firms. The marginal tax ratecovers employees’ and employers’ social security con-tributions and personal income tax. The corporateincome tax rate is the statutory tax rate applicable toincorporated businesses. It combines the central andsub-central (statutory) corporate income tax rate.
OECD SCIENCE, TECHNOLOGY AND INDUSTRY SCOREBOARD 2013 © OECD 2013202

5. UNLEASHING INNOVATION IN FIRMS
12. Policy environment
Barriers to entrepreneurship, 2008Scale of 0 to 6 from least to most restrictive
Source: OECD, Product Market Regulation Database, www.oecd.org/economy/pmr, June 2013.1 2 http://dx.doi.org/10.1787/888932893050
Taxation on corporate income and personal income, 2012
Source: OECD (2013), Taxing Wages 2011-2012, OECD Publishing. See chapter notes.1 2 http://dx.doi.org/10.1787/888932893069
Measurability
Product market regulations (PMR) indicators are quantitative indicators derived from qualitative information on lawsand regulations that can affect competition. The qualitative information mainly comes from a questionnaireaddressed to national administrations. Higher-level (composite) indicators, such as the barrier to entrepreneurshipindicator, are calculated as weighted averages of lower-level indicators using equal weights for aggregation. The nextupdate of the PMR indicators is expected by the end of 2013. Personal income taxes and the difference between thetreatment of self-employment income and wage income affect individuals’ decision to start a business. Corporatetaxes determine after-tax returns on investment and therefore drive firms’ investment decisions. Personal income taxrates on gross wage income are calculated in the OECD Taxing Wages framework, which allows for international com-parability across countries.
4.0
3.0
1.0
3.5
2.5
0.5
2.0
1.5
0
GBRNLD SWE ITA SVN
KORCAN
DNKAUS IR
LPRT
CHEAUT
NORES
PUSA
FRA
DEU FIN JPN
EST
BEL SVKCZE
CHLNZL LU
XHUN
RUSGRC
BRA ISLZAF
MEXPOL
TUR ISRIN
DCHN
Administrative burdens on start-ups Regulatory and administrative opacity Barriers to competition
Barriers to entrepreneurship in 1998Index
80
40
60
20
0
%
BELSWE ITA SVN
FRA
GRC FIN PRTIR
LDNK
LUX
NORHUN
NLD ISLGBR
CZETUR ISR
DEU SVKAUS
EST
AUTUSA
ESP
CANPOL
CHEJP
NNZL
MEXKOR
CHL
Marginal personal income tax and social security contribution rates on gross labour income
Statutory corporate income tax rates
OECD SCIENCE, TECHNOLOGY AND INDUSTRY SCOREBOARD 2013 © OECD 2013 203

5. UNLEASHING INNOVATION IN FIRMS
Notes and References
5.1. Mixed modes of innovation
General notes for all figures:
For Australia, data refer to financial year 2010/11 and include product, process, marketing and organisational innovatingfirms (including ongoing or abandoned innovation activities).
For Brazil, data refer to 2006-08. Only the following activities are included in the services sector: ISIC Rev.4 Divisions 58, 61,62 and 72.
For Canada, data refer to 2007-09 and to firms with 20 or more employees and with at least CAD 250 000 in annual revenuein 2009. Firms with ongoing or abandoned innovation activities are not identified. The industries covered are NAICS (2007)31-33, 41, 48, 49, 51, 52 and 54.
For Chile, data refer to 2009-10 and to firms with more than UF 2 400 in annual revenue. Data include product, process,organisational and marketing innovating firms. Ongoing or abandoned innovative activities are not identified. The indus-tries covered are based on ISIC Rev.3.1 and include a wider range of activities than the CIS, such as agriculture, forestry,fishing, construction and some services.
For Israel, data refer to 2006-08.
For Japan, data refer to financial years 2009/10 and 2010/11. Data are provisional estimates.
For New Zealand, data refer to financial years 2009/10 and 2010/11, and to firms with six or more employees with an annualgoods and services tax (GST) turnover figure greater than NZD 30 000. Data refer to product, process, organisational andmarketing innovating firms (including ongoing or abandoned innovation activities).
For the Russian Federation, data refer to 2009-11 and to firms with 15 or more employees. The industries covered are basedon NACE Rev.1.1 and include manufacturing (D), and services (64, 72, 73, 74).
For South Africa, data refer to 2005-07 and to firms with 20 or more employees, with a minimum turnover of betweenZAR 3 million and ZAR 6 million depending on the industry. Data also include the retail trade sector.
Additional notes:
Innovation types by firm size, 2008-10 and;
Types of innovation in the manufacturing sector, 2008-10
For Korea, data refer to 2005-07 and to firms with more than 10 employees in the manufacturing sector. Product innovationonly covers innovation for goods.
Cyprus
The following note is included at the request of Turkey:
“The information in this document with reference to ‘Cyprus’ relates to the southern part of the Island. There is nosingle authority representing both Turkish and Greek Cypriot people on the Island. Turkey recognizes the TurkishRepublic of Northern Cyprus (TRNC). Until a lasting and equitable solution is found within the context of the UnitedNations, Turkey shall preserve its position concerning the ‘Cyprus issue’.”
The following note is included at the request of all the European Union Member States of the OECD and the EuropeanUnion:
“The Republic of Cyprus is recognised by all members of the United Nations with the exception of Turkey. The infor-mation in this document relates to the area under the effective control of the Government of the Republic of Cyprus.”
Israel
“The statistical data for Israel are supplied by and under the responsibility of the relevant Israeli authorities or thirdparty. The use of such data by the OECD is without prejudice to the status of the Golan Heights, East Jerusalem andIsraeli settlements in the West Bank under the terms of international law.
“It should be noted that statistical data on Israeli patents and trademarks are supplied by the patent and trademarkoffices of the relevant countries.”
OECD SCIENCE, TECHNOLOGY AND INDUSTRY SCOREBOARD 2013 © OECD 2013204

5. UNLEASHING INNOVATION IN FIRMS
Notes and References
5.2. Broader innovation
General notes for all figures:
For Chile, data refer to 2009-10 and to firms with more than UF 2 400 in annual revenue. Data include product, process,organisational and marketing innovating firms. Ongoing or abandoned innovative activities are not identified. The indus-tries covered are based on ISIC Rev.3.1 and include a wider range of activities than the CIS, such as agriculture, forestry,fishing, construction and some services.
For Israel, data refer to 2006-08.
For Japan, data refer to financial years 2009/10 and 2010/11. Data are provisional estimates.
For South Africa, data refer to 2005-07 and to firms with 20 or more employees, with a minimum turnover of between ZAR3 million and ZAR 6 million depending on the industry. Data also include the retail trade sector.
Additional notes:Firms innovating in goods and services, manufacturing and services, 2008-10
For the United States, data refer to firms with more than five employees.
Product innovation, by R&D status, 2008-10 and;
R&D-active firms, manufacturing and services, 2008-10
For Brazil, data refer to 2006-08. Only the following activities are included in the services sector: ISIC Rev.4 Divisions 58, 61,62 and 72.
For New Zealand, data refer to financial years 2009/10 and 2010/11, and to firms with six or more employees with an annualgoods and services tax (GST) turnover figure greater than NZD 30 000. Data refer to product, process, organisational andmarketing innovating firms (including ongoing or abandoned innovation activities).
For the Russian Federation, data refer to 2009-11 and to firms with 15 or more employees. The industries covered are basedon NACE Rev.1.1 and include manufacturing (D), and services (64, 72, 73, 74).
For Switzerland, data refer to 2009-11.
Product innovation, by R&D status, 2008-10
For Korea, data refer to 2005-07 and to firms with more than 10 employees in the manufacturing sector. Product innovationonly covers innovation for goods.
For Spain, R&D status corresponds to 2010 only.
For the United States, data refer to firms with more than five employees.
R&D-active firms, manufacturing and services, 2008-10
For Australia, data refer to financial year 2010/11 and include product, process, marketing and organisational innovatingfirms (including ongoing or abandoned innovation activities).
5.3. Public support to innovation
Government-financed R&D in the business sector, by firm size, 2011
National statistical agencies use different minimum thresholds for inclusion in R&D surveys. For reporting estimates, thereare slight variations in the definition of small and medium-sized firms. Small firms (fewer than 50 employees): for Belgium,1-49 employees; for the United States, 5-49 employees; for Luxembourg, the Netherlands and Sweden, 10-49 employees. ForJapan, the survey excludes firms with capital of less than JPY 10 million.
For Australia, Chile, France, Italy, Portugal, Spain, the United Kingdom and the United States, data refer to 2010.
For Austria, Belgium, Canada, Denmark, Germany, Luxembourg, the Netherlands and Sweden, data refer to 2009.
For Switzerland, data refer to 2008.
General notes:
Firms receiving public support for innovation, by firm size, 2006-08 and 2008-10 and;
Firms receiving public support for innovation, manufacturing and services, 2008-10
For Australia, data refer to financial year 2010/11 and include product, process, marketing and organisational innovatingfirms (including ongoing or abandoned innovation activities).
OECD SCIENCE, TECHNOLOGY AND INDUSTRY SCOREBOARD 2013 © OECD 2013 205
5. UNLEASHING INNOVATION IN FIRMS
Notes and References
For Brazil, data refer to 2006-08. Only the following activities are included in the services sector: ISIC Rev.4 Divisions 58, 61,62 and 72.
For Chile, data refer to 2009-10 and to firms with more than UF 2 400 in annual revenue. Data include product, process,organisational and marketing innovating firms. Ongoing or abandoned innovative activities are not identified. The indus-tries covered are based on ISIC Rev.3.1 and include a wider range of activities than the CIS, such as agriculture, forestry,fishing, construction and some services.
For Israel, data refer to 2006-08 and to public support for R&D.
For Japan, data refer to financial years 2009/10 and 2010/11. Data are provisional estimates.
For the Russian Federation, data refer to 2009-11 and to firms with 15 or more employees. The industries covered are basedon NACE Rev.1.1 and include manufacturing (D), and services (64, 72, 73, 74).
Additional notes:
Firms receiving public support for innovation, by firm size, 2006-08 and 2008-10
For Austria and United Kingdom, data refer to 2006-08.
For Canada, data refer to 2002-04 and 2007-09 and to firms with 20 or more employees and with at least CAD 250 000 inannual revenue in 2009. Firms with ongoing/abandoned innovation activities are not identified. Data refer only to grantsand tax credit programmes across all levels of government. The industries covered are NAICS (2007) 31-33, 41, 48, 49, 51, 52and 54 for 2007-09 and manufacturing only for 2002-04.
For Mexico, data refer to 2008-09 and to firms with 20 or more employees. The industries covered are based on ISIC Rev.3.1and include a wider range of activities, such as agriculture, construction and some services.
For Slovenia, the periods are 2004-06 and 2008-10.
For South Africa, data refer to 2005-07 and to firms with 20 or more employees, with a minimum turnover of between ZAR3 million and ZAR 6 million depending on the industry. Data also include the retail trade sector.
For Switzerland, the periods are 2006-08 and 2009-11.
Firms receiving public support for innovation, manufacturing and services, 2008-10
For Switzerland, data refer to 2009-11.
5.4. The IP “bundle”
IP bundle of top 20 applicants, 2010-12
According to the European Patent Convention (EPC) “The grant of a European patent may be requested for one or more ofthe Contracting States” (Article 3). The 14th Edition of the EPC, published in August 2010, has 38 contracting states, i.e. theEU28 and AL, CH, IS, LI, MC, MK, NO, RS, SM, TR (see http://documents.epo.org/projects/babylon/eponet.nsf/0/7bacb229e032863dc12577ec004ada98/$FILE/EPC_14th_edition.pdf). European patents generally have a maximum duration of20 years from the date of filing of the application and cannot be renewed.
The Community trademark (CTM), administered by OHIM, has a unitary character and is valid throughout the EuropeanCommunity. After any enlargement of the European Union CTMs registered or applied for are automatically extended to thenew member states without formality or fee. The CTM system coexists with national systems (see http://oami.europa.eu/ows/rw/pages/CTM/legalReferences/regulations.en.do for more detail). CTMs are valid for 10 years and can be renewed indefinitelyfor periods of ten years. They must be put to genuine use in the European Community within a period of five years followingregistration. Otherwise, they are revoked.
Registered Community designs (RCD) also have a unitary character and are valid in the European Union as a whole. It is notpossible to limit the geographic scope of protection to certain member states. An RCD initially has a life of five years fromthe date of filing and can be renewed for periods of five years up to a maximum of 25 years (see http://oami.europa.eu/ows/rw/pages/RCD/legalReferences/regulations.en.do).
Top two trademark application fields, by country, 2009-11
Distribution of classes designated in design applications filed at OHIM, WIPO and national offices (direct applications andapplications via the Madrid system).
The following aggregated fields based on the Nice Classification are used: Chemicals: classes 1, 2 and 4; Construction:classes 6, 17, 19, 27 and 37; Tools and machines: classes 7 and 8; Agricultural products: classes 29, 30, 31, 32, 33 and 34; Fur-niture and household goods: classes 11, 20 and 21; Leisure and education: classes 13, 15, 16, 28 and 41; Health, pharma and
OECD SCIENCE, TECHNOLOGY AND INDUSTRY SCOREBOARD 2013 © OECD 2013206
5. UNLEASHING INNOVATION IN FIRMS
Notes and References
cosmetics: classes 3, 5, 10 and 44; Transport: classes 12 and 39; R&D: class 42; Clothes, textiles and accessories: classes 14,18, 22, 23, 24, 25 and 26; Advertising and business services: classes 35, 36 and 45; ICT and audiovisual: classes 9 and 38;Hotels, restaurants and other services: classes 40 and 43.
Top two design application fields, by country, 2009-11
Distribution of classes designated in design applications filed at OHIM, WIPO and national offices (direct applications andapplications via the Hague system).
The following aggregated fields based on the Locarno Classification are used: Furniture and household goods: classes 6, 7and 30; Clothes, textiles and accessories: classes 2, 3, 5 and 11; Tools and machines: classes 4, 8, 10 and 15; Health, pharmaand cosmetics: classes 24 and 28; Leisure and education: classes 17, 19, 21 and 22; Agricultural products and food prepara-tion: classes 1, 27 and 31; Construction: classes 23, 25 and 29; ICT and audiovisual: classes 14, 16 and 18; Electricity andlightning: classes 13 and 26; Advertising: classes 20 and 32; Transport: class 12; Packaging: class 9.
5.5. Trademarks
Top 20 trademark applicants, 2009-11 average
Counts are presented according to the application date and the address of the applicant. Economies are ordered accordingto USPTO figures.
Figures from national trademark offices are not fully comparable as some offices use single-class systems (Mexico, Brazil,China, South Africa), whereas most offices have a multi-class system. Some offices have recently been moving from a sin-gle-class to a multi-class system (e.g. the Israeli Patent Office adopted a multi-class trademark system in 2010).
Trademark applications by BRIICS countries, 2000-02 and 2009-11 averages
Counts are presented according to the application date and the residence of the applicant.
For Brazil, national trademark office figures refer to 2000-02 and 2009-10.
For Indonesia, national trademark office figures refer to 2001-02 and 2009-11.
Figures from national trademark offices are not fully comparable as some offices use single-class systems (Brazil, China,South Africa) whereas others have adopted a multi-class system (India, the Russian Federation). Some offices have recentlybeen moving from a single-class to a multi-class system (e.g. Indonesia, where multi-class applications have been acceptedsince 2007).
Share of goods and services trademark applications at USPTO, OHIM and JPO, 2010-12
The shares are calculated as the proportion of trademark applications designating only goods classes (classes 1 to 34 of theNice Classification), only service classes (classes 35 to 45 of the Nice Classification), or both goods and services classes.
Data from JPO are up to May 2012. The average number of trademark applications refers to 2010-11 for JPO.
5.6. Knowledge-asset-related trademarks
IP-transaction-related trademarks, 2004-07 and 2009-12
IP transactions-related trademarks refer to trademark applications designating class 45 of the Nice Classification and containingkeywords related to IP transactions in the goods and services description (complete list of keywords available on demand).
Counts are presented according to the filing date and applicant’s address. The top 20 applicants correspond to the econo-mies with the largest number of IP transactions-related trademark applications at OHIM and USPTO in 2009-12. Economiesare ordered according to OHIM 2009-12 figures.
R&D-related trademarks, 2004-07 and 2009-12
R&D-related trademarks refer to trademark applications designating class 42 of the Nice Classification. ICT-related R&Dtrademarks refer to trademark applications designating class 42 of the Nice Classification and containing ICT-related key-words in the goods and services description (complete list of keywords available on demand).
Counts are presented according to the filing date and applicant’s address. The top 20 applicants correspond to the econo-mies with the largest number of R&D-related trademark applications at OHIM and USPTO. Economies are ordered accordingto OHIM 2009-12 figures.
OECD SCIENCE, TECHNOLOGY AND INDUSTRY SCOREBOARD 2013 © OECD 2013 207
5. UNLEASHING INNOVATION IN FIRMS
Notes and References
ICT-related trademarks, 2004-07 and 2009-12
ICT-related trademarks refer to trademark applications designating classes 9, 28, 35, 38, 41 and/or 42 of the Nice Classificationand containing ICT-related keywords in the goods and services description (complete list of keywords available on demand).
Counts are presented according to the filing date and applicant’s address. The top 20 applicants correspond to the econo-mies with the largest number of ICT-related trademark applications at OHIM and USPTO. Economies are ordered accordingto OHIM 2009-12 figures.
5.7. Registered designs
Number of designs by Locarno class, 2006-08 and 2010-12
Number of individual designs contained in Community designs registered in each class of the Locarno Classification.
Class 32 (Graphic symbols and logos, surface patterns, ornamentation) has been included in the Locarno Classification sincethe ninth edition, which entered into force at OHIM in January 2009.
Transport-related designs, 2010-12
Figures are calculated using fractional counts of the Locarno classes mentioned in the design registration.
Transport designs correspond to class 12 of the Locarno Classification. Ships and boats correspond to subclass 12-06; Air-craft and space vehicles to subclass 12-07; Cars to subclass 12-08; and Cycles and motorcycles to subclass 12-11.
ICT and audiovisual-related designs, 2010-12
Figures are calculated using fractional counts of the Locarno classes mentioned in the design registrations.
Data processing and recording equipment correspond to the Locarno subclasses 14-01, 14-02 and 14-04; Communicationdevices correspond to subclass 14-03; Audiovisual devices correspond to class 16. Total ICT and audiovisual designs corre-spond to designs in classes 14, 16 and 18.
5.8. Trademarks and patents
General notes for all figures:
Firms with trademarks are firms that registered at least one trademark at the Office for Harmonization of the InternationalMarket (OHIM) or at the United States Patent and Trademark Office (USPTO) in 2009-11. Firms with patents are firms thatfiled at least one patent application at the European Patent Office (EPO) or at the USPTO in 2009-11.
Firms were linked to the ORBIS© database, using combinations of string matching algorithms that maximise the precisionof the match. Only countries with matching rates above 80% of trademark and patent filings over 2000-11 are included,except for trademark filings of Canada (70%) and the United States (76%).
Additional notes:
Top two industries with trademarks and patents by country, 2009-11
Countries are listed according to the share of firms with trademarks in the top two trademarking industries.
Firms with trademarks and patents, by size, 2009-11
Only countries for which ORBIS© employment data were available for at least 45% of firms with patents or trademarks areincluded.
Countries are listed according to the share of firms with 20 to 49 employees among firms with trademarks.
5.9. Entry, exit and survival
Employer enterprise birth and death rates in the manufacturing sector, 2010
Birth rates: For Mexico, Sweden and Switzerland, data refer to 2008; for Brazil, Canada, Estonia, France and Slovenia, data refer to2009 and for Israel, Korea, New Zealand and the United States, data refer to 2011.
Death rates: For Belgium, data refer to 2007; for Brazil and Canada data refer to 2008 and for the Czech Republic, Estonia, France,Israel and Slovenia, data refer to 2009.
OECD SCIENCE, TECHNOLOGY AND INDUSTRY SCOREBOARD 2013 © OECD 2013208
5. UNLEASHING INNOVATION IN FIRMS
Notes and References
Data are compiled according to ISIC Rev.4 except for Belgium, Israel, Mexico and the United States, which refer to ISIC Rev.3.
Employer enterprise birth and death rates in the services sector, 2010
Birth rates: For Mexico, Sweden and Switzerland, data refer to 2008; for Canada, Estonia, France and Slovenia, data refer to2009 and for Israel, Korea, New Zealand and the United States, data refer to 2011.
Death rates: For Belgium, data refer to 2007, for Canada, data refer to 2008 and for the Czech Republic, Estonia, France, Israeland Slovenia, data refer to 2009.
Data are compiled according to ISIC Rev.4 except for Belgium, Israel, Mexico and the United States, which refer to ISIC Rev.3.
5.10. Firm employment dynamics
General notes for all figures:
Calculations are based on preliminary results from the OECD DYNEMP project.
Owing to methodological differences, figures may differ from those officially published by national statistical offices.
Establishments and firms that appear only for one year are excluded.
Mergers and acquisitions are not taken into account in determining firm age and firm exit.
The shares are calculated as shares of total employment, job destruction and job creation.
For Austria, data are at the establishment level.
For Austria, Italy, Luxembourg and Sweden, data refer to 2001-10.
For Brazil, data refer to 2002-10
For France, data refer to 2002-07.
For New Zealand, data refer to 2001-09.
For Spain, data refer to 2003-09.
Additional notes:
Employment, job creation and job destruction in young and mature firms, 2001-11 and;
Employment, job creation and job destruction in young firms, manufacturing, 2001-11
For Japan, data are at the establishment level, refer to 2001-09 and cover the manufacturing sector only.
5.11. Access to capital
Venture capital investment, 2012
Data correspond to the aggregation of investment data according to the location of the portfolio companies (i.e. the investeecompanies), regardless of the location of the private equity firms. Exceptions are Australia, Korea and Japan for which datarefer to the location of the investing venture capital firms.
The early stage includes: for Australia, pre-seed and seed, and start-up stage; for Canada and European countries, seed andstart-up, and other early stage; for Israel, seed/start-up and early stage/expansion stage; for Japan, seed and early stage, andexpansion stage; for the United States, seed and early stage.
The later stage includes: for Australia, early expansion stage; for Canada, expansion stage; for the United States, expansion/laterstage.
Korea, New Zealand, the Russian Federation and South Africa do not provide breakdowns of venture capital by stage thatwould allow meaningful international comparisons.
Data providers are: EVCA (European countries), ABS (Australia), CVCA (Canada), KVCA (Korea), NVCA (United States), NZVCA(New Zealand), PwC MoneyTree (Israel), RVCA (Russian Federation), SVCA (South Africa) and VEC (Japan).
For Canada and New Zealand, data refer to 2010.
For Australia, Estonia, Greece, Israel, Japan, Korea, the Russian Federation, Slovenia, South Africa, Switzerland and theUnited States, data refer to 2011.
SME loans, 2007 and 2011
For Norway, the Slovak Republic and Sweden, data refer to 2010.
OECD SCIENCE, TECHNOLOGY AND INDUSTRY SCOREBOARD 2013 © OECD 2013 209

5. UNLEASHING INNOVATION IN FIRMS
Notes and References
5.12. Policy environment
Time needed to open and close a business, 2003 and 2012
For Iceland, data refer to 2004 and 2012.
For Luxembourg, data refer to 2006 and 2012.
Taxation on corporate income and personal income, 2012
Marginal tax rate, covers employees’ and employers’ social security contributions and personal income tax, with respect toa change in gross labour costs. It is given for a single person without dependent, at 167% of the average wage earner/averageproduction worker. It assumes a rise in gross earnings of the principal earner in the household. The outcome may differ ifthe wage of the spouse goes up, especially if partners are taxed individually.
The marginal rates are expressed as a percentage of gross labour costs.
Corporate income tax shows the basic combined central and sub-central (statutory) corporate income tax rate given by theadjusted central government rate plus the sub-central rate.
Notes on the statutory corporate income tax (CIT) rate:
For Australia, New Zealand and the United Kingdom, all with a non-calendar tax year, the rates shown are those in effect asof 1 July, 1 April and 5 April, respectively.
In Belgium, the effective CIT rate can be substantially reduced by a notional allowance for corporate equity (ACE).
In Chile, the Tax Reform Law (September 2012) permanently increased the Corporate Income Tax rate to 20%.
In Estonia, since 1 January 2000, the corporate income tax is levied on distributed profits.
For France, the rates include a surcharge (the turnover based solidarity tax, Contribution de solidarité), but exclude i) the localbusiness tax (Contribution économique territoriale, a new tax replacing the former Taxe professionnelle from 1 January 2011) andii) the 5% temporary surtax applied to the standard corporate income tax liability for large companies with a turnoverexceeding EUR 250 million.
For Germany, the rates include the regional trade tax (Gewerbesteuer) and the surcharge.
For Hungary, the rates do not include the turnover-based local business tax, the innovation tax, temporary sectoral taxes oncorporations in the financial sector, energy sector, telecommunication and retail sectors.
In Iceland in late 2011, the Icelandic Parliament passed Act No. 165/2011 on a new financial activities tax (FAT) as part of ageneral set of measures aimed at increasing tax revenues. The FAT, collected from financial institutions and insurance com-panies (excluding pension funds), has two components: i) a levy on total remuneration paid to employees at a rate of 5.45%and ii) a special income tax of 6% on institutions’ corporate income tax base in excess of ISK 1 billion.
In Israel, under the VAT law, financial institutions pay taxes on the combination of their wages and salaries and their profits.These amounts are deductible from profits in the assessment of corporate income tax.
For Italy, these rates do not include the regional business tax (Imposta Regionale sulle Attività Produttive; IRAP).
In Luxembourg, the contribution to the unemployment fund is 5%.
In the Netherlands, the CIT applies to taxable income over EUR 200 000.
In Poland, there is no sub-central government tax; however local authorities (at each level) participate in a given percentageof tax revenue.
Portugal has a state surtax since 2011. In 2012, the surtax was set at 3% for taxable profits above EUR 1.5 million and at 5%for taxable profits above EUR 10 million.
For Switzerland, church taxes, which enterprises cannot avoid, are included.
Note on the marginal personal income tax rate:
For Turkey, wage figures are based on the old definition of average worker (ISIC, Rev.3, D).
OECD SCIENCE, TECHNOLOGY AND INDUSTRY SCOREBOARD 2013 © OECD 2013210

5. UNLEASHING INNOVATION IN FIRMS
Notes and References
References
Ahmad, N. (2006), “A Proposed Framework For Business Demography Statistics”, OECD Statistics Working Papers, 2006/3.Doi: http://dx.doi.org/10.1787/145777872685.
Bravo-Biosca, A., C. Criscuolo and C. Menon (2013), “What Drives the Dynamics of Business Growth?”, OECD Science, Technology andIndustry Policy Papers, No. 1, OECD Publishing. Doi: http://dx.doi.org/10.1787/5k486qtttq46-en.
Eurostat/OECD (2007), Eurostat-OECD Manual on Business Demography Statistics, OECD Publishing.Doi: http://dx.doi.org/10.1787/9789264041882-en.
Graham, S., G. Hancock, A. Marco and A. Myers (2013), “The USPTO Trademark Case Files Dataset: Descriptions, Lessons, andInsights.”SSRN Working Paper, http://papers.ssrn.com/sol3/papers.cfm?abstract_id=2188621.
Japan Patent Office (JPO) (2001-12), Annual Reports, Japan Patent Office, Tokyo, www.jpo.go.jp.
OECD and Eurostat (2005), Oslo Manual: Guidelines for Collecting and Interpreting Innovation Data, The Measurement of Scientific andTechnological Activities, 3rd edition, OECD Publishing. Doi: http://dx.doi.org/10.1787/9789264013100-en.
OECD (2009), Innovation in Firms: A Microeconomic Perspective, OECD Publishing. Doi: http://dx.doi.org/10.1787/9789264056213-en.
OECD (2009), OECD Patent Statistics Manual, OECD Publishing. Doi: http://dx.doi.org/10.1787/9789264056442-en.
OECD (2010), Structural and Demographic Business Statistics, OECD Publishing. Doi: http://dx.doi.org/10.1787/sdbs-data-en.
OECD (2011), Science, Technology and Industry Scoreboard 2011, OECD Publishing. Doi: http://dx.doi.org/10.1787/sti_scoreboard-2011-en.
OECD (2013), Entrepreneurship at a Glance 2013, OECD Publishing. Doi: http://dx.doi.org/10.1787/entrepreneur_aag-2013-en.
OECD (2013), Financing SMEs and Entrepreneurs 2013 : An OECD Scoreboard, OECD Publishing.Doi: http://dx.doi.org/10.1787/9789264166769-en.
World Economic Forum (2008), The Global Competitiveness Report 2008-2009, World Economic Forum, Geneva.
World Economic Forum (2012), The Global Competitiveness Report 2012-2013, World Economic Forum, Geneva.
OECD SCIENCE, TECHNOLOGY AND INDUSTRY SCOREBOARD 2013 © OECD 2013 211


OECD SCIENCE, TECHNOLOGY AND INDU
6. COMPETING IN THE KNOWLEDGEECONOMY
1. Industry specialisation
2. ICT industry specialisation
3. Export structures
4. R&D specialisation
5. Technological advantage
6. Trade competitiveness
7. E-business uptake
8. Young innovative firms
9. Technological strengthsNotes and References
Today’s knowledge economies are increasingly service-oriented and rely on fewer sectorsto grow. Indicators of industry specialisation reveal which sectors contribute most to a giveneconomy in terms of output and employment. ICT industries are often among the mostdynamic sectors, and the new industrial classification makes it possible to take a closer look atthe dynamics in this broad aggregate. Indicators of trade specialisation show that countriesrely to different degrees on certain sectors to compete in export markets. The new Trade inValue Added (TiVA) Database can show how a country’s output satisfies foreign demand, notonly via exports of final goods and services, but indirectly via trade in intermediates. Also, forthe first time, indicators of trade specialisation can be calculated in terms of value addedrather than gross exports. Another set of indicators looks in depth at R&D specialisation andrevealed technological advantage in biotechnology, nanotechnology and ICT. Competing in theknowledge economy requires firms to adopt new information technologies in businessprocesses; indicators show less uptake by smaller businesses. The innovative capacity ofnations is also central to competitiveness. Here the focus is on patenting firms, includingyounger ones, and experimental indicators match patent filings with company data. Finally,new indicators use patent data to construct indexes of relative technological and economicstrengths and capture the impact of patented inventions.
STRY SCOREBOARD 2013 © OECD 2013 213

6. COMPETING IN THE KNOWLEDGE ECONOMY
1. Industry specialisation
An economy can be defined as “specialised” if a few sectorsaccount for a relatively large share of the country’s GDP,whereas it is “diversified” if each of a wide range of industriesaccounts for a relatively small share of it. Industry specialisa-tion or diversification is related to an economy’s investmentpatterns, employment, innovativeness, productivity and long-term performance.
The Hannah-Kay (HK) index captures a country’s sectoralcomposition and shows the influence of larger sectors. Thehigher the HK index, the less specialised the economy, i.e. thebroader the range of industrial activities it relies upon. Theindex is sensitive to the degree of industry disaggregation.
In 2010, most OECD economies could be considered diversi-fied. Poland, Switzerland and Norway were only moderatelydiversified, while Luxembourg was moderately specialised.Except for Estonia and Iceland, most economies have becomerelatively more specialised since 2000 or have maintainedtheir level of specialisation.
In 2010 economies’ employment appeared slightly more con-centrated than their value added. The share of value added ofthe top four industries ranged from 39% in Hungary to 67% inLuxembourg. The corresponding employment figures rangedfrom 46% in the Czech Republic to 67% in Mexico. In almost alleconomies considered, wholesale and retail trade was themost important sector on both indicators.
With that exception, the top four value added-generatingindustries generally differ from the top employment-generat-ing sectors. Information and communication services appearin the top four industries in eight of the economies considered,including Japan and United States, for value added, butnowhere in the top four employment industries. In Norway,the most important generator of value added in 2010 wasmining and quarrying, which was not among the top fouremployers.
Industrial specialisation, 2000 and 2010Hannah-Kay index, calculated for theta equal to 2
Source: OECD, Structural Analysis (STAN) Database, ISIC Rev.4, May 2013.See chapter notes.
1 2 http://dx.doi.org/10.1787/888932893088
0 0.1 0.2 0.3 0.4 0.5 0.6 0.80.7
2010 2000
HUN
CZE
DEU
FIN
EST
ITA
KOR
SVN
SWE
NZL
AUT
ISL
NLD
JPN
SVK
CAN
PRT
FRA
GBR
DNK
AUS
ESP
USA
BEL
MEX
GRC
IRL
POL
CHE
NOR
LUX
x > 0.5: Diversification0.3 < x < 0.5: Moderate diversification0.2 < x < 0.3: Moderate specialisationx < 0.2: Specialisation
Diversification index
Definitions
The Hannah-Kay (HK) index is calculated for a (theta)equal to 2, the value at which the HK corresponds tothe inverse of the Herfindahl index. measures theextent to which the index is influenced by large sec-tors. The HK(2) calculated on 20 ISIC Rev.4 industrialaggregates is normalised and takes values rangingbetween 0-1. In an analogy to the threshold valuessuggested by the concentration literature, countriescan be considered diversified if HK(2) is bigger than0.5; moderately diversified if it is between 0.3 and 0.5;moderately specialised if HK(2) is between 0.2 and 0.3;and specialised if it is smaller than 0.2. The concentra-tion ratio CR(4) is calculated on four sectors and isdefined as the cumulative share of an economy’s topfour industries in terms of share of value added oremployment.
OECD SCIENCE, TECHNOLOGY AND INDUSTRY SCOREBOARD 2013 © OECD 2013214

6. COMPETING IN THE KNOWLEDGE ECONOMY
1. Industry specialisation
Value added of the top four economic activities, 2008-10As a percentage of average total value added, excluding real estate and the public services
Source: OECD, Structural Analysis (STAN) Database, ISIC Rev.4, May 2013. See chapter notes.1 2 http://dx.doi.org/10.1787/888932893107
Employment of the top four economic activities, 2008-10As a percentage of average total employment, excluding real estate and the public services
Source: OECD, Structural Analysis (STAN) Database, ISIC Rev.4, May 2013. See chapter notes.1 2 http://dx.doi.org/10.1787/888932893126
Measurability
The HK(2) and CR(4) indicators shown rely on 20 main industry aggregates chosen according to data availability andcoverage, and to maximise comparability across economies and over time. The underlying National Accounts industrydata are classified according to ISIC Rev.4. Comparisons with previous indicators based on ISIC Rev.3 may not be suit-able, as the new classification, which reflects more recent economic structures, identifies and groups activities in avery different way. For example, under ISIC Rev.4, more attention can be paid to service sectors and indeed, the 20aggregates considered here include more services aggregates than previous ISIC Rev.3 calculations. Value added istaken at current prices and real estate (Division 68) and community, social and personal services (84-99) are excludedfrom the calculation. Different levels of sectoral aggregation, reference periods, value added measures and indicatorparameters would change the results. Greater sectoral disaggregation would improve the ability of the HK and CR indi-cators to identify key industries and trends.
%80
60
20
40
0
LUX
NORCHE
IRL
USAAUS
ESP
CANGBR
GRCMEX
BEL POLFR
APRT
DNKES
TNLD SVK
JPN
SVNNZL ISL FIN SWE
KOR ITA AUTDEU CZE
HUN
69-75: Professional, scientific and technical activities49-53: Transportation and storage41-43: Construction05-09: Mining and quarrying
64-66: Financial and insurance activities
77-82: Administrative and support service activities
45-47: Wholesale and retail trade, repair26-28: Machinery and equipment01-03: Agriculture
Sum 2000
%80
60
20
40
0
MEXGRC
AUSNLD PRT
LUX
GBRCAN
USAES
PBEL NOR
FRA
DNK IRL
SWEES
TSVK
CHEAUT
DEU HUN ITA FIN SVNCZE
69-75: Professional, scientific and technical activities
49-53: Transportation and storage
41-43: Construction
64-66: Financial and insurance activities
77-82: Administrative and support service activities
45-47: Wholesale and retail trade, repair
55-56: Accommodation and food service activities
01-03: Agriculture
Sum 2000
OECD SCIENCE, TECHNOLOGY AND INDUSTRY SCOREBOARD 2013 © OECD 2013 215

6. COMPETING IN THE KNOWLEDGE ECONOMY
2. ICT industry specialisation
While demand for the products of Information industriesincreased relentlessly from 2000, the share in value added ofthese activities fell in most OECD economies. There were alsochanges in their composition. Indeed, the manufacture ofcomputers and electronics and, to a lesser extent, telecommu-nication services saw their importance diminish as productionshifted to other (mostly non-OECD) economies and unit pricesfell as a result of productivity growth and increased competi-tion. Meanwhile, the share of information technology (IT) ser-vices in total value added rose across all reporting economies,largely offsetting losses in the other sectors.
These changes are reflected in the dynamics of internationaltrade. From 2000 to 2011, partly owing to the offshoring of pro-duction, the shares of the United States and Japan in worldexports of ICT goods halved, while China’s grew from less than5% to 28%, with a tenfold increase in dollar terms. Thesemoves accompanied a major shift in world trade (and con-sumption) patterns, with a fall in the share of computers andperipherals that was partly due to faster growth in trade ofcommunication equipment and consumer electronics.
Since 2000, international trade in ICT services has grownextremely fast. The Computer and Information servicescomponent doubled its share in total services trade from 3%to 6%. Meanwhile, exports of telecommunications serviceshave been particularly important for certain countries suchas France and Italy. As with goods, few countries alsoaccount for a significant share of ICT service exports. Fol-lowing some important shifts in recent years, India is nowthe leading exporter of IT services, having started from avery modest level. It is followed by Ireland, which, owing toa favourable tax environment, benefits from the presence ofsome large transnational IT corporations.
Information industries in OECD economies,2000 and 2011
As a percentages of total value added
Source: OECD, Structural Analysis (STAN) Database, ISIC Rev.4, June 2013.StatLink contains more data. See chapter notes.
1 2 http://dx.doi.org/10.1787/888932893145
0 8 1042 6 12%
IRL
KOR
JPN
CHE
GBR
HUN
USA
LUX
EST
SWE
FIN
SVK
CZE
DNK
FRA
DEU
NLD
ITA
GRC
SVN
ESP
BEL
ISL
CAN
POL
PRT
NOR
AUT
2000
2011
Information industries total share 2000
IT and other information services
Telecommunications
Publishing, audiovisual and broadcasting activities
Computer, electronic and optical products
Aver
age
Definitions
The aggregate of Information industries includes ISIC-Rev.4 Division 26 (Manufacture of computer, electronicand optical products) and Section J (Information andcommunication), consisting of Divisions 58-60 (Pub-lishing and broadcasting industries), 61 (Telecommu-nications) and 62-63 (Computer programming, andInformation service activities). Hence Informationindustries encompass ICT industries (Divisions 26, 61and 62-63, plus a small component in 58), with theexception of Trade and repair activities, as well asMedia and content industries (included in Divisions 58-60and in the Group 639).
ICT products are defined by the OECD with reference tothe Central Product Classification (CPC) Rev.2 andinclude 99 subclasses of products, of which 52 goodsand 47 services, grouped into four and six broad cate-gories, respectively. In international trade, computerand information services are defined according to theIMF Balance of Payments Manual.
OECD SCIENCE, TECHNOLOGY AND INDUSTRY SCOREBOARD 2013 © OECD 2013216

6. COMPETING IN THE KNOWLEDGE ECONOMY
2. ICT industry specialisation
Global trade in ICT goods and top ten exporters, 2000 and 2011Billions of USD and percentage shares
Source: OECD, STAN Bilateral Trade Database by industry and End-use (BTDIxE) May 2013. See chapter notes.1 2 http://dx.doi.org/10.1787/888932893164
OECD and major exporters of ICT services, 2000 and 2012Billions of USD and percentages of total world exports of ICT services
Source: UNCTAD, UNCTADstat, June 2013. StatLink contains more data. See chapter notes.1 2 http://dx.doi.org/10.1787/888932893183
Measurability
Statistics on value added by activity are not always directly comparable across countries, owing to the co-existence ofdifferent regional classifications of economic activities, the transition to a revised classification (e.g. from NACE Rev.1to NACE Rev.2), and the lack of sufficiently detailed information. In the case of Information industries, an importantissue is the presence of significant shares of value added embodied in the output of other industries.
The globalisation of value chains has led to an acceleration of the dynamics of international trade with respect to thatof economic activity, which increases the need to treat data (e.g. for transit trade, and/or for re-exports andre-imports). This is not always done consistently.
Statistics on international trade in services can also be prone to measurement and comparability issues. For example,increasingly tradable Information services, such as those provided by call centres, are difficult to measure as they arestill included in the broad aggregate “Other business services”.
USD billions500
300
100
400
200
0
%100
80
60
40
20112000(1 549)billions(936)
20
0
%
30
25
20
15
10
5
0
CHNUSA
SGPTWN
KORJP
NDEU MYS
NLD MEXROW
37.729.6
15.521.4
10.6 13.1
31.1 31.4
5.2 4.5
2000 2011 2000 share (right-hand scale)World exports shares by ICT product
category and values in USD2011 share (right-hand scale)
Computers andperipherals
Communicationsequipment
Consumerelectronics
Electroniccomponents
Miscellaneous
IND IR
LUSA
DEU GBRCHN
NLD CANFR
AISR
SWEBEL ES
P ITA FIN NORAUT
LUX
RUSPOL
AUSDNK
CZEJP
NHUN
KORPRT
GRCSVK
TURSVN
EST
NZL CHLMEX ISL
0
10
20
30
40
50
POLAUS
DNKCZE
JPN
HUNKOR
PRTGRC
SVKTUR
SVNES
TNZL CHL
MEX ISL0
1
2
3
13.5
12.7 8.0
7.3
7.0
4.4
3.1
2.8
2.8
2.7
2.7
2.5
2.4
2.3
1.9
1.3
1.2
1.0
1.0
0.8
0.8
0.7
0.7
0.6
0.4
0.4
0.3
0.2
0.2
0.2
0.1
0.1
0.1
0.1
0.1
0.0
Computer and information Communication Total value, 2000
USD billions
Percentage of world ICT services exportsMagnified
OECD SCIENCE, TECHNOLOGY AND INDUSTRY SCOREBOARD 2013 © OECD 2013 217

6. COMPETING IN THE KNOWLEDGE ECONOMY
3. Export structures
OECD statistics on bilateral trade by industry and end-usecategory show how much of a country’s exports are for for-eign final consumption and for production abroad as inter-mediate inputs or capital goods.
On average, between 1995 and 2011, the share of intermediategoods in total exports rose from 58% to 63%, while finalgoods fell from 18.5% to about 13%. The 2 percentage pointrise in the share of manufactured intermediates mainlyreflects further fragmentation of production, while the 3.1percentage point rise in primary intermediates to 12.7% ispartly due to increases in primary commodity prices. Thisdevelopment is particularly clear for natural-resource-intensive economies such as Saudi Arabia, the RussianFederation, Canada and, increasingly, Brazil. In 1995,China’s exports were valued at USD 148 billion, of which60% destined for final consumption. By 2011, the value ofChina’s exports had increased 12-fold to USD 1 890 billionand the structure of its exports had changed substantiallytowards high-end intermediates and capital goods.
The economies with the highest concentration of goodsexports are mostly natural-resource-based. Motor vehiclesis the top export industry in 12 countries and electronics infive others. This reflects the relative weight of these indus-tries in overall international merchandise trade.
In services, OECD and BRIICS countries account for about85% of world exports, and the three most important serviceitems (excluding transport) represent about 40% to 90% oftotal exports; they almost always include travel and otherbusiness services. Many of the top exporting economieshave an above-average trade specialisation in services.Those with the highest concentration of exports are rela-tively specialised in financial services and/or in ICT ser-vices, except for Spain. An important share of US andFrench service revenues comes from royalties.
Top 20 exporting economies of primary and manufacturedgoods by end-use category, 1995 and 2011
As a percentage of total exports of goods
Source: OECD, STAN Bilateral Trade Database by Industry and End-useCategory (BTDIxE), www.oecd.org/sti/btd, May 2013. StatLink containsmore data. See chapter notes.
1 2 http://dx.doi.org/10.1787/888932893202
0 40 50 60 70 80 902010 30 100%
CHN
DEU
FRA
ITA
MEX
ESP
GBR
IND
NLD
JPN
BEL
HKG
USA
KOR
CAN
TWN
BRA
SGP
RUS
SAU
2011 1995Primary intermediates
Manufactured intermediates
Final goods
Definitions
The OECD STAN Bilateral Trade Database by Industryand End-Use Category (BTDIxE) provides estimates ofcurrent price imports and exports of goods by end-use,i.e. of household and capital consumption and inter-mediate inputs into production, as well as of a fewmixed end-use categories such as passenger vehiclesand personal computers. Standard conversion keysare used to map merchandise trade data according tovarious HS product classifications to ISIC Rev.3 andISIC Rev.4 and to end-use categories based on broadeconomic categories. Where identifiable, waste andscrap, which increasingly flow between countries, areallocated to special categories in the industry list.Trade in services data are drawn from internationalbalance of payments statistics and they exclude trans-port services; the categories corresponding to thehigher level of the standard classification are used.
OECD SCIENCE, TECHNOLOGY AND INDUSTRY SCOREBOARD 2013 © OECD 2013218
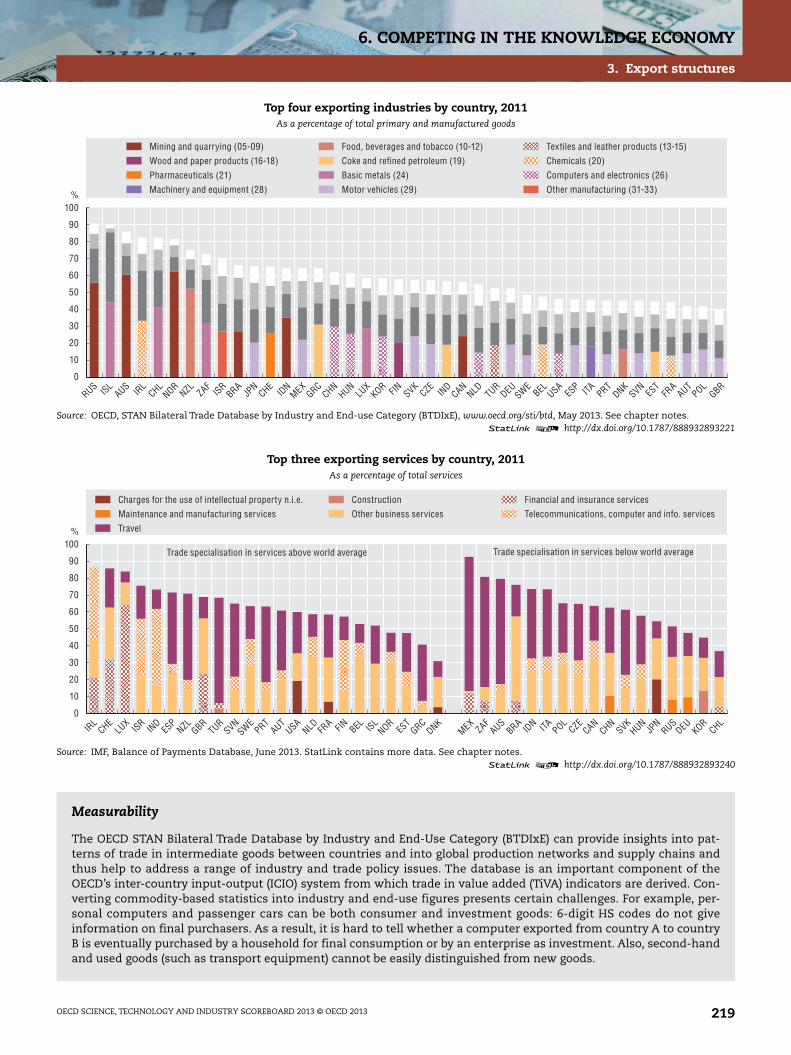
6. COMPETING IN THE KNOWLEDGE ECONOMY
3. Export structures
Top four exporting industries by country, 2011As a percentage of total primary and manufactured goods
Source: OECD, STAN Bilateral Trade Database by Industry and End-use Category (BTDIxE), www.oecd.org/sti/btd, May 2013. See chapter notes.1 2 http://dx.doi.org/10.1787/888932893221
Top three exporting services by country, 2011As a percentage of total services
Source: IMF, Balance of Payments Database, June 2013. StatLink contains more data. See chapter notes.1 2 http://dx.doi.org/10.1787/888932893240
Measurability
The OECD STAN Bilateral Trade Database by Industry and End-Use Category (BTDIxE) can provide insights into pat-terns of trade in intermediate goods between countries and into global production networks and supply chains andthus help to address a range of industry and trade policy issues. The database is an important component of theOECD’s inter-country input-output (ICIO) system from which trade in value added (TiVA) indicators are derived. Con-verting commodity-based statistics into industry and end-use figures presents certain challenges. For example, per-sonal computers and passenger cars can be both consumer and investment goods: 6-digit HS codes do not giveinformation on final purchasers. As a result, it is hard to tell whether a computer exported from country A to countryB is eventually purchased by a household for final consumption or by an enterprise as investment. Also, second-handand used goods (such as transport equipment) cannot be easily distinguished from new goods.
%100
60
70
20
10
30
80
90
40
50
0
RUS ISLAUS IR
LCHL
NORNZL ZAF
ISRBRA
JPN
CHEID
NMEX
GRCKOR
LUX
HUNCHN FIN SVK
IND
CZECAN
NLD TURDEU SWE
USABEL ES
P ITA PRTDNK
EST
SVNFR
AAUT
GBRPOL
Wood and paper products (16-18)Mining and quarrying (05-09)
Pharmaceuticals (21)Machinery and equipment (28)
Coke and refined petroleum (19)Food, beverages and tobacco (10-12)
Basic metals (24)Motor vehicles (29)
Chemicals (20)Textiles and leather products (13-15)
Computers and electronics (26)Other manufacturing (31-33)
%100
60
70
20
10
30
80
90
40
50
0
IRL
CHELU
XISR
IND
ESP
NZL GBRTUR
SVNSWE
PRTAUT
USANLD ISL
BELFINFRA
NORES
TDNK
GRCMEX
ZAFAUS
BRA ITAIDN
POLCZE
CANCHN
HUNSVK
JPN
RUSKOR
CHLDEU
Maintenance and manufacturing servicesCharges for the use of intellectual property n.i.e.
TravelOther business servicesConstruction
Telecommunications, computer and info. servicesFinancial and insurance services
Trade specialisation in services above world average Trade specialisation in services below world average
OECD SCIENCE, TECHNOLOGY AND INDUSTRY SCOREBOARD 2013 © OECD 2013 219

6. COMPETING IN THE KNOWLEDGE ECONOMY
4. R&D specialisation
When comparing countries’ business R&D intensity (R&Dexpenditure relative to value added or GDP), it is oftenimportant to take account of differences in their industrialstructure since R&D intensity varies considerably acrosssectors. An understanding of the extent to which structuraldifferences account for observed differences in overall busi-ness R&D intensity can be achieved by showing what acountry’s total R&D intensity in business would be if it hadthe same industrial structure as the average of OECD coun-tries.
If countries had an average OECD industrial structure,adjusted business R&D intensity for Germany and Koreawould be below the OECD average of 2.5% since these econ-omies are relatively specialised in high- and medium-high-technology industries. In Belgium, France and theNetherlands, business R&D intensity would be higher thanthe OECD average, while in countries in southern and east-ern Europe, an industry structure closer to the OECD aver-age would not significantly change their overall R&Dintensity.
High- and medium-high-technology industries account forthe largest share of business enterprise expenditure on R&D(BERD) in manufacturing in most countries. In the RussianFederation and Israel, they account for over 90% of manu-facturing BERD although manufacturing accounts for lessthan a third of total BERD. Among OECD countries, only inChile and Estonia does low- and medium-low-technologymanufacturing account for more than half of all manufac-turing BERD.
Many service industries are increasingly knowledge-inten-sive and R&D often plays a significant role. In most OECDcountries, services account for a third or more of BERD, ashare that has generally increased over the last decade.Cross-country comparisons of the sectoral distribution ofBERD should nonetheless be made with care owing to differ-ences in how countries allocate R&D to various industriesand whether they classify a sizable share of BERD underR&D services.
Business R&D intensity adjusted for industrialstructure, 2011
As a percentage of value added in industry
Source: OECD calculations based on the Structural Analysis (STAN),Research and Development Statistics (RDS) and ANBERD Databases, June2013; OECD, Main Science and Technology Indicators Database,www.oecd.org/sti/msti.htm, June 2013. See chapter notes.
1 2 http://dx.doi.org/10.1787/888932893259
0 421 3 5%
POL
SVK
ESP
ITA
HUN
PRT
NOR
CZE
IRL
GBR
NLD
AUS
SVN
BEL
EST
FRA
AUT
DEU
USA
DNK
JPN
SWE
KOR
FIN
Unadjusted business R&D intensity
Adjusted business R&D intensity
Business R&D intensity, OECD average
Definitions
R&D intensity adjusted for industry structure is aweighted average of the R&D intensities of a country’sindustrial sectors, using the OECD industrial struc-ture’s sector value added shares as weights instead ofthe actual shares used in the unadjusted measure ofR&D intensity. For the first time, the calculations arebased on the ISIC Rev.4 classification. Manufacturingindustries are classified by level of technology (high-and medium-high-; low- and medium-low-technologyactivities) on the basis of average OECD R&D intensitydefined as R&D relative to value added and gross out-put. R&D services correspond to ISIC Rev.4 Division 72.
OECD SCIENCE, TECHNOLOGY AND INDUSTRY SCOREBOARD 2013 © OECD 2013220

6. COMPETING IN THE KNOWLEDGE ECONOMY
4. R&D specialisation
Business R&D in manufacturing, by technology intensity, 2011As a percentage of R&D in manufacturing
Source: OECD, ANBERD Database, www.oecd.org/sti/anberd and OECD, Research and Development Statistics Database, www.oecd.org/sti/rds, June 2013.See chapter notes.
1 2 http://dx.doi.org/10.1787/888932893278
Share of services in business R&D, 2001 and 2011
Source: OECD, Research and Development Statistics Database, www.oecd.org/sti/rds and Main Science and Technology Indicators Database,www.oecd.org/sti/msti.htm, June 2013. See chapter notes.
1 2 http://dx.doi.org/10.1787/888932893297
Measurability
Allocating R&D by industry presents various challenges. In most countries, a firm’s R&D expenditure is assigned to itsprincipal industrial activity based on value added (“main activity” approach). In some, it is based on the main R&D activ-ity of the firm or the content of the R&D itself (“product field” approach). The Frascati Manual recommends following amain activity approach when classifying statistical units, but for firms carrying out significant R&D relating to severalactivities, it recommends subdividing by units or product fields. The methodology used to adjust R&D intensity forindustrial structure is sensitive to a number of factors, notably the industrial classification used: for Finland, usingISIC Rev.4 to calculate the adjusted R&D intensity results in a significantly smaller adjustment than what was previ-ously obtained using ISIC Rev.3 (see STI Scoreboard 2011). Other factors which have an impact are the level of aggrega-tion at which the sectoral weights are calculated and the countries included in the benchmark. For Estonia, a largeR&D investment in the oil industry resulted in a significant jump of BERD in low-technology manufacturing for 2011.
%100
60
20
80
40
0
RUSISR
KOR FIN DEU DNKUSA
JPN
HUNSVN
BEL CANCHE
FRA ISL
SWEAUT ITA CZE
GBRTUR
NLD ESP
SVKMEX
CHNPOL
AUSNOR
PRTIR
LCHL
EST
High-and medium-high technology sectors Low-and medium-low technology sectors
Manufacturing R&D as a percentage of BERD
%
60
20
80
40
0
RUSISR
PRTGBR IR
LNOR ISL
DNKPOL
FRA
TURNZL ZAF
CANAUS
MEXCHL
ESP
NLD SVKHUN
CZEBEL AUT
EST
USA ITA SVNSWE
CHE FIN DEU JPN
KORCHN
Services Of which R&D services Services, 2001
OECD SCIENCE, TECHNOLOGY AND INDUSTRY SCOREBOARD 2013 © OECD 2013 221

6. COMPETING IN THE KNOWLEDGE ECONOMY
5. Technological advantage
Patent documents contain a wealth of information, includ-ing the date on which intellectual property (IP) protectionwas sought, the technology classes to which the inventionbelongs, and the nationality of owners and inventors. Thesedata can be used to classify patents in particular fields andto investigate the emergence and growth of new technolo-gies. A revealed technological advantage (RTA) index, builtfrom information on the International Patent Classification(IPC) of inventions, provides an indication of a given econ-omy’s relative specialisation in various technology domains.
The extent to which economies have specialised in biotech-nology and nanotechnology can be inferred by looking atchanges in their RTA in these fields. While the overall num-ber of biotechnology patents remained fairly stable over thelast decade, nanotechnology patent applications grew at apace similar to the average of all technologies (about 5.2% ayear). Denmark became the most specialised in biotechnol-ogies, with an index of 2.2 in 2008-10, and Australia, Israel,the Netherlands, Singapore and Spain became relativelymore specialised in this field. For nanotechnologies, Singa-pore (3.8), the Russian Federation (1.7) and Korea (1.5) hadthe largest RTA in 2008-10, and Spain and the Netherlandssubstantially increased their specialisation.
In information and communication technology (ICT),China’s patenting increased the most of all economies toreach an RTA similar to that of Finland, Korea and Japan.Israel and the Netherlands, instead, appeared to becomeless specialised in ICT in the 2000s.
The level of technological specialisation changes substan-tially across economies and technologies. The RTA valuesfor 2008-10 suggest that most economies are generally rela-tively unspecialised in most technology fields, and thatmedian values are far from those of top performers. Thereare a few cases of very high specialisation, with RTA valuesof 5 or more: China in digital communication; India inorganic chemistry; Singapore in microtechnology and nano-technology; Turkey in other consumer goods; and Norway incivil engineering.
Change in revealed technological advantage inbiotechnology and nanotechnology, 1998-2000 and 2008-10
Index based on patent applications filed under the Patent Cooperation Treaty
Source: OECD, Patent Database, June 2013. StatLink contains more data.See chapter notes.
1 2 http://dx.doi.org/10.1787/888932893316
0 2.01.00.5 1.5 2.5
1998-2000 2008-10
DNK
BEL
SGP
ESP
CAN
AUS
USA
ISR
NLD
IND
GBR
FRA
CHE
RUS
AUT
ITA
KOR
SWE
FIN
DEU
JPN
CHN
3.8
47517
38127
20882
54085
78682
52043
12 3431 869
45454
721136326
521 160
1661 410
218453
5514748
2227
8 2791 260
49357
1 140420364
4317540
2 005397
1 565219
3 4181 171
91999
Nanotechnology
Biotechnology
Index
Number of biotechnology and nanotechnology patents, 2008-10
Biotechnology
NanotechnologyWorld average = 1
EU28
BRIICS
Definitions
The revealed technological advantage index is defined asthe share of an economy’s patents in a particular tech-nology field relative to the share of total patents inthat economy. The index is equal to zero when theeconomy has no patents in a given field; is equal to1 when the economy’s share in the sector equals itsshare in all fields (no specialisation); and above 1when a positive specialisation is observed. The indexis calculated on patent applications filed under thePatent Cooperation Treaty (PCT). Patent counts arebased on the priority date, the inventor’s residenceand fractional counts.
OECD SCIENCE, TECHNOLOGY AND INDUSTRY SCOREBOARD 2013 © OECD 2013222

6. COMPETING IN THE KNOWLEDGE ECONOMY
5. Technological advantage
Change in revealed technological advantage in ICT, 1998-2000 and 2008-10Index based on patent applications filed under the Patent Cooperation Treaty
Source: OECD, Patent Database, June 2013. See chapter notes.1 2 http://dx.doi.org/10.1787/888932893335
Countries’ range of revealed technological advantage by field, 2008-10Index by technology field, based on patent applications filed under the Patent Cooperation Treaty
Source: OECD, Patent Database, June 2013. StatLink contains more data. See chapter notes.1 2 http://dx.doi.org/10.1787/888932893354
Measurability
The IPC codes contained in patents identify the technological domains to which inventions belong. They are attributedby patent examiners during the examination process. The IPC classification is revised periodically to account for the emer-gence of new technologies and the evolution of existing ones. This may lead to the reclassification of patents into differentclasses and to the absence of specific classes. Key technological domains such as ICT, biotechnology and nanotechnologyare defined following ad hoc lists of IPC classes compiled by experts in the fields, using tagging systems of the EuropeanClassification System (ECLA), that highlight the area of application of patented inventions (www.oecd.org/sti/ipr-statistics). Acomprehensive classification of technology fields has been proposed by Schmoch (WIPO, 2008, revised in 2013), whogroups all existing IPC classes into 35 technology fields. These are identified on the basis of their content, and theclassification tries to account for the size of the field and to minimise possible overlaps between different fields. Usingdata from other patent offices may change the patterns observed.
1.0
2.0
0.5
1.5
0
SGP FIN CHNKOR
JPN
CAN ISR IRL
SWEUSA
TWNNLD GBR
AUSFR
AHUN
IND
NORRUS
POLDEU ES
PCHE
BEL ZAFDNK
AUTNZL CZE ITA TUR
MEXBRA
923
2 07
4
13 9
58
11 0
00
39 0
37
3 18
8
16 1
37
1 99
7
432
3 20
5
47 6
16 260
144
547
3 24
0
5 21
9
1 54
6
5 99
5
181
37 8
08
1 16
5
521
581
166
11 6
56
1 16
8
1 46
7
750
216
736
799
187 95
1 62
2
186 79 212
2008-101998-2000Index
World average =1
Number of ICT-related patents, 2008-10
BRIICS
OECD
EU28
3
5
1
6
2
4
0
JPN SG
P
KOR
CHN
IRL
ISR
ZAF
JPN JP
N
NO
R
IRL ZA
F ISR
IND
DN
K
IND
BEL DN
K
BEL
ZAF
JPN R
US
NO
R
ITA
AUT D
NK
FIN
ITA
TUR
DEU
FRA
TURSG
P (7
.4)
T UR
(9.0
)
NO
R (6
.4)
Countries’ range Countries’ medianIndex
Country with the maximum index
Electr
ical m
achin
ery
Audio-vi
sual
tech.
Telec
ommun
icatio
ns
Digital
commun
icatio
n
Basic
commun
icatio
n
Compu
ter te
chno
logy
IT meth
ods
Semico
nduc
torsOpti
cs
Measu
remen
t
Bio mate
rials
Contro
l
Medica
l tech
nolog
y
Organ
ic ch
emist
ry
Biotec
hnolo
gy
Pharm
aceu
ticals
Polymers
Food
chem
istry
Basic
chem
istry
Materia
ls, m
etallu
rgy
Surfac
e and
coati
ng
Micro- a
nd na
no-te
ch.
Chemica
l eng
.
Envir
onmen
tal te
ch.
Handli
ng an
d log
istics
Machin
e too
ls
Engin
es, p
umps
, turb
ines
Texti
le an
d pap
er mac
hines
Other s
pecia
l mac
hines
Therm
al de
vices
Mecha
nical
elemen
ts
Trans
port
Furn
iture,
games
Other c
onsu
mer go
ods
Civil e
ng.
OECD SCIENCE, TECHNOLOGY AND INDUSTRY SCOREBOARD 2013 © OECD 2013 223

6. COMPETING IN THE KNOWLEDGE ECONOMY
6. Trade competitiveness
The Trade in Value Added (TiVA) Database provides a newperspective on trade competitiveness. Indicators of valueadded in exports, particularly of domestic value addedgenerated by foreign final demand, may reveal more aboutthe performance of a country’s industries than an analysisof its gross exports of goods and services. Comparing acountry’s shares in gross world exports of different indus-tries with its shares of domestic value added in finaldemand reveals the greater weight of services in global mar-kets, and particularly of financial and business services inFrance, Germany, the United States and the United Kingdom.Shares of manufactured output are lower for most countriesin value added terms because the multiple counting ofmanufactured intermediates reported in “gross” trade sta-tistics is eliminated.
New indicators of revealed comparative advantage (RCA) invalue added terms throw new light on countries’ competi-tiveness. For example, they show the United States with acomparative advantage in exports of computers, electronicand optical products in 2009, whereas gross measure sug-gests otherwise. In contrast, Mexico’s comparative advan-tage shrank because its gross exports of computers,electronic and optical products contain much value addedfrom other countries, notably the United States. The patternis similar for Factory Asia, with a reduction in China’s com-parative advantage and increases in neighbouring countriessuch as Japan and Korea. In the case of machinery andequipment the relative advantage of several Europeancountries is larger in value added terms.
Top ten exporting economies in gross and value addedterms, 2009
As a percentage of total world exports in gross and value added terms
Source: OECD-WTO, Trade in Value Added (TiVA) Database, http://oe.cd/tiva,May 2013. StatLink contains more data. See chapter notes.
1 2 http://dx.doi.org/10.1787/888932893373
0 8 1042 6 12%
USA
CHN
DEU
JPN
FRA
GBR
ITA
KOR
CAN
NLD
1 458
1 199
1 284
838
1 159
815
618
515
584
429
559
454
499
393
401
234
367
291
363
229
Trade, transport and communicationsOther manufacturesMachinery and equipment / transport equipmentPrimary products
Finance and business servicesOther activities
Total exports (USD billions)
Domesticvalue addedin foreign
final demand
Gross exports
Definitions
The TiVA indicator of domestic value added generatedby foreign final demand (FDDVA) accounts for the factthat industries export value both directly, via exportsof final goods and services, and indirectly, via exportsof intermediates embodied in other countries’ exportsto meet foreign final demand. It reflects how indus-tries (upstream in a value chain) are connected to con-sumers in other countries, even when no direct traderelationship exists. It can contribute to a better under-standing of the impact on domestic output of changesin final demand in foreign markets.
Industry RCA is calculated as country industry sharesof country total exports of goods and services dividedby world industry shares of total world exports ofgoods and services. RCAs are “normalised” aroundzero by using the transformation (RCA-1)/(RCA+1) sothat a figure greater than 0 reveals a comparativeadvantage. The latest year covered by the 2013 versionof the OECD-WTO TiVA Database is 2009. It covers 18major activity groups defined according to ISIC Rev.3.For RCA calculations, finer industry breakdownswould be preferable and will be possible in future ver-sions of the TiVA database.
OECD SCIENCE, TECHNOLOGY AND INDUSTRY SCOREBOARD 2013 © OECD 2013224

6. COMPETING IN THE KNOWLEDGE ECONOMY
6. Trade competitiveness
Revealed comparative advantage in exports of computers, electronic and optical products, 2009Top 30 exporters
Source: OECD, Inter-Country Input-Output (ICIO) Database, May 2013. StatLink contains more data. See chapter notes.1 2 http://dx.doi.org/10.1787/888932893392
Revealed comparative advantage in exports of machinery and equipment, 2009Top 30 exporters
Source: OECD, Inter-Country Input-Output (ICIO) Database, May 2013. StatLink contains more data. See chapter notes.1 2 http://dx.doi.org/10.1787/888932893411
Measurability
The gross exports of goods and services used here are estimates from the underlying OECD inter-country input-output(ICIO) system used to produce the Trade in Value Added (TiVA) indicators. By necessity, the system requires consistentbilateral trade matrices in which exports of products X from country A to B are equal to imports of products X by Bfrom A. Efforts are made to ensure consistency with aggregate exports and imports of goods and services as reportedin countries’ National Accounts or Balance of Payments statistics. However, owing to the required balancing of globalbilateral trade matrices, certain results may not match countries’ perceptions of their trading patterns. Although theyare not without flaws, estimates of bilateral gross trade flows by industry from the ICIO provide a basis for construct-ing a range of indicators for a new understanding of international trade and global value chains, including domesticvalue added in foreign final demand.
0.2
0.6
-0.2
0.8
0
-0.6
-0.4
0.4
-0.8
PHLTWN
CHNTHA
KORHUN
MEXJP
NMYS FIN SGP
ISRSVK
CHECZE
USADEU IN
D IRL
POLSWE
DNK ITA IDN
GBRAUT
FRA
ESP
CANNLD
Gross exports Value added in foreign final demand
0.2
0.6
0
-0.4
-0.2
0.4
-0.6
DEU ITA CHEJP
NSWE
AUT FIN MYSDNK
FRA
CHNCZE
USAPOL
KORNLD TUR
SGPGBR
NORRUS
IDN
TWNBEL ES
PBRA
CANMEX
AUSIN
D
Gross exports Value added in foreign final demand
OECD SCIENCE, TECHNOLOGY AND INDUSTRY SCOREBOARD 2013 © OECD 2013 225
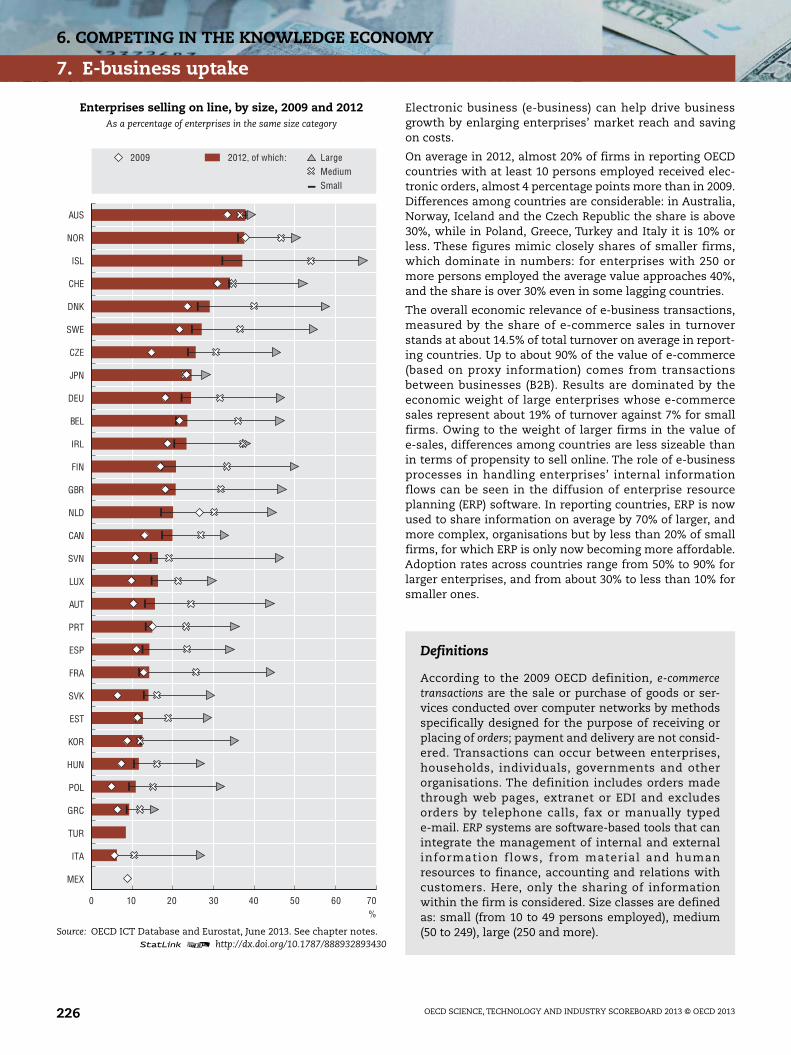
6. COMPETING IN THE KNOWLEDGE ECONOMY
7. E-business uptake
Electronic business (e-business) can help drive businessgrowth by enlarging enterprises’ market reach and savingon costs.
On average in 2012, almost 20% of firms in reporting OECDcountries with at least 10 persons employed received elec-tronic orders, almost 4 percentage points more than in 2009.Differences among countries are considerable: in Australia,Norway, Iceland and the Czech Republic the share is above30%, while in Poland, Greece, Turkey and Italy it is 10% orless. These figures mimic closely shares of smaller firms,which dominate in numbers: for enterprises with 250 ormore persons employed the average value approaches 40%,and the share is over 30% even in some lagging countries.
The overall economic relevance of e-business transactions,measured by the share of e-commerce sales in turnoverstands at about 14.5% of total turnover on average in report-ing countries. Up to about 90% of the value of e-commerce(based on proxy information) comes from transactionsbetween businesses (B2B). Results are dominated by theeconomic weight of large enterprises whose e-commercesales represent about 19% of turnover against 7% for smallfirms. Owing to the weight of larger firms in the value ofe-sales, differences among countries are less sizeable thanin terms of propensity to sell online. The role of e-businessprocesses in handling enterprises’ internal informationflows can be seen in the diffusion of enterprise resourceplanning (ERP) software. In reporting countries, ERP is nowused to share information on average by 70% of larger, andmore complex, organisations but by less than 20% of smallfirms, for which ERP is only now becoming more affordable.Adoption rates across countries range from 50% to 90% forlarger enterprises, and from about 30% to less than 10% forsmaller ones.
Enterprises selling on line, by size, 2009 and 2012As a percentage of enterprises in the same size category
Source: OECD ICT Database and Eurostat, June 2013. See chapter notes.1 2 http://dx.doi.org/10.1787/888932893430
0 40 50 602010 30 70%
AUS
NOR
ISL
CHE
DNK
SWE
CZE
JPN
DEU
BEL
IRL
FIN
GBR
NLD
CAN
SVN
LUX
AUT
PRT
ESP
FRA
SVK
EST
KOR
HUN
POL
GRC
TUR
ITA
MEX
2009 2012, of which: LargeMediumSmall
Definitions
According to the 2009 OECD definition, e-commercetransactions are the sale or purchase of goods or ser-vices conducted over computer networks by methodsspecifically designed for the purpose of receiving orplacing of orders; payment and delivery are not consid-ered. Transactions can occur between enterprises,households, individuals, governments and otherorganisations. The definition includes orders madethrough web pages, extranet or EDI and excludesorders by telephone calls, fax or manually typede-mail. ERP systems are software-based tools that canintegrate the management of internal and externalinformation flows, from material and humanresources to finance, accounting and relations withcustomers. Here, only the sharing of informationwithin the firm is considered. Size classes are definedas: small (from 10 to 49 persons employed), medium(50 to 249), large (250 and more).
OECD SCIENCE, TECHNOLOGY AND INDUSTRY SCOREBOARD 2013 © OECD 2013226

6. COMPETING IN THE KNOWLEDGE ECONOMY
7. E-business uptake
Turnover from e-commerce, by enterprise size, 2012As a percentage of total turnover
Source: OECD ICT Database and Eurostat, June 2013. See chapter notes.1 2 http://dx.doi.org/10.1787/888932893449
Enterprises using enterprise resource planning software for internal information sharing, by size, 2012As a percentage of enterprises with 10 or more persons employed
Source: OECD ICT Database and Eurostat, June 2013. See chapter notes.1 2 http://dx.doi.org/10.1787/888932893468
Measurability
The measurement of e-commerce presents many methodological challenges that can affect the comparability of esti-mates, such as the adoption of different practices for data collection and estimations, for treatment of outliers and ofe-commerce by multinationals, or for the imputation of values from ranges recorded in surveys. Other issues includedifferences in sectoral coverage of surveys, and a lack of measures concerning the actors involved (B2B, business-to-consumer [B2C], business to government [B2G], etc.). For this last aspect, Korea provides direct estimates, while theUnited States’ Census Bureau proxies B2C with transactions originating from the retail sector. For European countriesthe best available proxy consists of EDI (B2B+B2G) vs. web sales (B2C, etc.). Convergence of technologies bringsadditional challenges for the treatment (and surveying) of emerging transactions, notably over mobile phones, via SMSor using devices that enable near-field communication. Various software tools with different functionalities fall underthe ERP heading: taking account of the sophistication of ERP systems and their degree of implementation may lead tosubstantial changes in the picture of usage.
%
15
25
5
35
10
20
30
0
CZELU
X IRL
SWEGBR
HUN FIN NORDEU USA
DNKBEL ISL
FRA
ESP
SVNAUT
NLD EST
PRTSVK
POLAUS
MEX ITA GRC
All Large Medium Small
%
50
70
30
90
40
10
20
60
80
0
CHESWE
FRA
DNKBEL FIN PRT
SVNAUT
NLD CZEDEU LU
XES
P ITA SVKNOR IR
LCAN ISL
POLES
THUN
GBR
All Large Medium Small
OECD SCIENCE, TECHNOLOGY AND INDUSTRY SCOREBOARD 2013 © OECD 2013 227
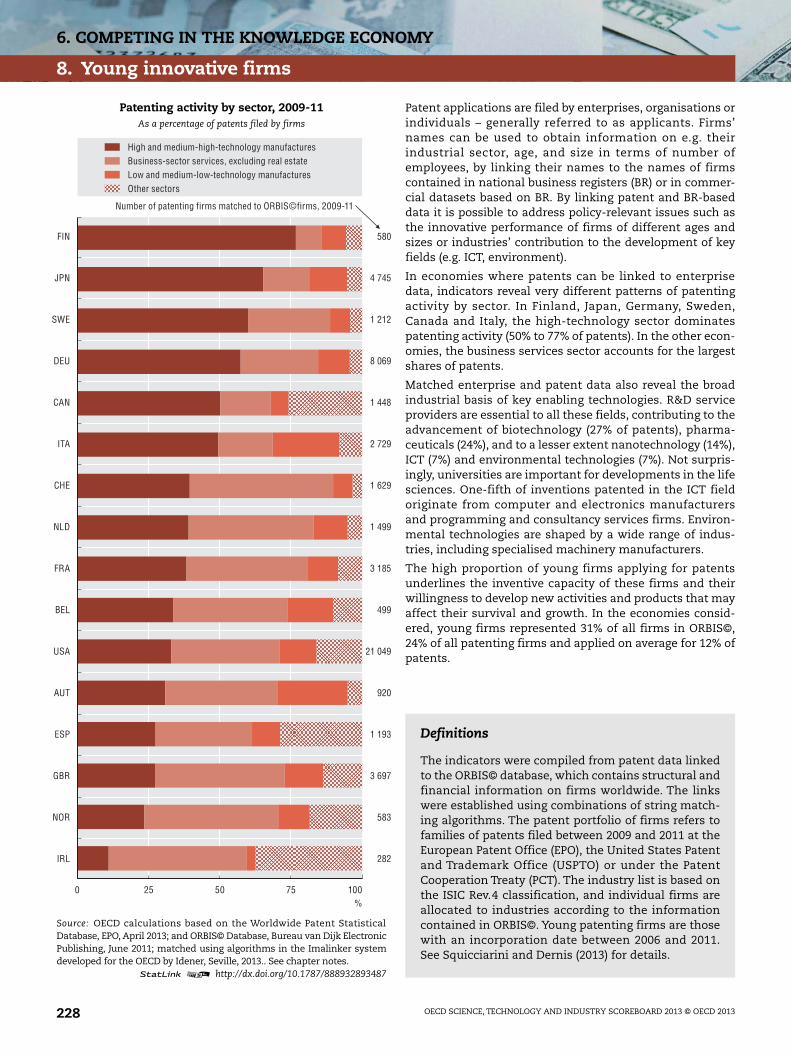
6. COMPETING IN THE KNOWLEDGE ECONOMY
8. Young innovative firms
Patent applications are filed by enterprises, organisations orindividuals – generally referred to as applicants. Firms’names can be used to obtain information on e.g. theirindustrial sector, age, and size in terms of number ofemployees, by linking their names to the names of firmscontained in national business registers (BR) or in commer-cial datasets based on BR. By linking patent and BR-baseddata it is possible to address policy-relevant issues such asthe innovative performance of firms of different ages andsizes or industries’ contribution to the development of keyfields (e.g. ICT, environment).
In economies where patents can be linked to enterprisedata, indicators reveal very different patterns of patentingactivity by sector. In Finland, Japan, Germany, Sweden,Canada and Italy, the high-technology sector dominatespatenting activity (50% to 77% of patents). In the other econ-omies, the business services sector accounts for the largestshares of patents.
Matched enterprise and patent data also reveal the broadindustrial basis of key enabling technologies. R&D serviceproviders are essential to all these fields, contributing to theadvancement of biotechnology (27% of patents), pharma-ceuticals (24%), and to a lesser extent nanotechnology (14%),ICT (7%) and environmental technologies (7%). Not surpris-ingly, universities are important for developments in the lifesciences. One-fifth of inventions patented in the ICT fieldoriginate from computer and electronics manufacturersand programming and consultancy services firms. Environ-mental technologies are shaped by a wide range of indus-tries, including specialised machinery manufacturers.
The high proportion of young firms applying for patentsunderlines the inventive capacity of these firms and theirwillingness to develop new activities and products that mayaffect their survival and growth. In the economies consid-ered, young firms represented 31% of all firms in ORBIS©,24% of all patenting firms and applied on average for 12% ofpatents.
Patenting activity by sector, 2009-11As a percentage of patents filed by firms
Source: OECD calculations based on the Worldwide Patent StatisticalDatabase, EPO, April 2013; and ORBIS© Database, Bureau van Dijk ElectronicPublishing, June 2011; matched using algorithms in the Imalinker systemdeveloped for the OECD by Idener, Seville, 2013.. See chapter notes.
1 2 http://dx.doi.org/10.1787/888932893487
0 5025 75 100%
282
583
3 697
1 193
920
21 049
499
3 185
1 499
1 629
2 729
1 448
8 069
1 212
4 745
580FIN
IRL
NOR
GBR
ESP
AUT
USA
BEL
FRA
NLD
CHE
ITA
CAN
DEU
SWE
JPN
Other sectorsLow and medium-low-technology manufacturesBusiness-sector services, excluding real estateHigh and medium-high-technology manufactures
Number of patenting firms matched to ORBIS©firms, 2009-11
Definitions
The indicators were compiled from patent data linkedto the ORBIS© database, which contains structural andfinancial information on firms worldwide. The linkswere established using combinations of string match-ing algorithms. The patent portfolio of firms refers tofamilies of patents filed between 2009 and 2011 at theEuropean Patent Office (EPO), the United States Patentand Trademark Office (USPTO) or under the PatentCooperation Treaty (PCT). The industry list is based onthe ISIC Rev.4 classification, and individual firms areallocated to industries according to the informationcontained in ORBIS©. Young patenting firms are thosewith an incorporation date between 2006 and 2011.See Squicciarini and Dernis (2013) for details.
OECD SCIENCE, TECHNOLOGY AND INDUSTRY SCOREBOARD 2013 © OECD 2013228

6. COMPETING IN THE KNOWLEDGE ECONOMY
8. Young innovative firms
Top three industries patenting in selected technology fields, 2009-11Share of industries’ contribution to patent applications in selected technology fields
Source: OECD calculations based on the Worldwide Patent Statistical Database, EPO, April 2013; and ORBIS© Database, Bureau van Dijk ElectronicPublishing, June 2011; matched using algorithms in the Imalinker system developed for the OECD by Idener, Seville, 2013.. See chapter notes.
1 2 http://dx.doi.org/10.1787/888932893506
Patenting activity of young firms by sector, 2009-11Share of young patenting firms and share of patents filed by young patenting firms
Source: OECD calculations based on the Worldwide Patent Statistical Database, EPO, April 2013; and ORBIS© Database, Bureau van Dijk ElectronicPublishing, June 2011; matched using algorithms in the Imalinker system developed for the OECD by Idener, Seville, 2013.. See chapter notes.
1 2 http://dx.doi.org/10.1787/888932893525
Measurability
Linking patent data to enterprise data requires harmonising firms’ names using country-specific “dictionaries” coveringlegal entities, common names and expressions, phonetic and linguistic rules that may affect how enterprise names arewritten. String matching algorithms – mainly token-based and string-metric-based – then compare the names in the dif-ferent datasets and provide a matching accuracy score. The matching exercise was performed on patent records in theEPO’s Worldwide Patent Statistical Database (PATSTAT) and the list of companies in Bureau van Dijk’s ORBIS© firm data,using software developed for the OECD by IDENER, Seville. Ideally, the matching should be performed on official data suchas national BR, as ORBIS’s coverage is not exhaustive and differs across countries. In particular small firms are underrepre-sented.To address selection and data consistency issues, the analysis is restricted to economies with matching rates above80% of patent filings in the 2000s. Firm-level data are not consolidated at the group level, and young patenting firms mayinclude affiliates of conglomerates featuring a recent date of incorporation in ORBIS©.
%
30
50
60
20
10
40
0
Wholesale tradeComputer programming, consultancy and related activitiesEducationScientific research and development
Machinery and equipmentComputer, electronic and opticalBasic pharmaceutical products and preparations
Biotechnologies Nanotechnologies ICT Pharmaceuticals Environment
%
30
50
40
10
20
0
IRL
NORNLD SWE
GBRES
P FIN USAFR
AAUT
BEL CANDEU ITA CHE
JPN
1 2 2 1 1 2 7 5 3 3 2 2 5 2 3 18
Share of patents filed by young firmsLow and medium-low-technology manufactures Other sectors
High and medium-high-technology manufactures Business sector services, excluding real estate
Average number of patents filedby firms under 5 years old,
2009-11
OECD SCIENCE, TECHNOLOGY AND INDUSTRY SCOREBOARD 2013 © OECD 2013 229

6. COMPETING IN THE KNOWLEDGE ECONOMY
9. Technological strengths
The technological and economic value of patented inven-tions is known to vary widely across patents, firms and sec-tors, and over time. Many indicators attempt to capture thedifferent meanings that patent value may have for stake-holders such as inventors, firms, attorneys and policy mak-ers.
The generality index uses information on the citationsreceived by a patent to assess the extent to which laterinventions in a variety of technology fields have benefitedfrom the patent. It gives an indication of how important apatent is for subsequent developments and in how wide anarray of technology fields.
The scope of a patent, i.e. the number of distinct Interna-tional Patent Classification (IPC) classes a patent is regis-tered in, is associated with an invention’s technological andeconomic value and relates positively to the valuation of thefirm and to a patent’s importance for later inventions.
Breakthrough inventions are high-impact innovations, i.e.highly cited patents. They are associated with entrepre-neurial strategies and further technological developments.
The differences observed in the value of patents filed at theUnited States Patent and Trademark Office (USPTO) and atthe European Patent Office (EPO) are likely to reflect differ-ences in the type, nature and number of patents applied forat the two offices, as well as differences in the practices andregulations of these patent authorities, and possible homebiases. The number and distribution of breakthrough inven-tions also differs between EPO and USPTO patents. Forinstance, the United States own 1% of breakthrough inven-tions filed at USPTO, and less than 0.2% of those filed at EPO.
The relevance of patents for later inventions, 2002-06Average generality index based on patent applications to the EPO and the USPTO
Source: OECD calculations based on the Worldwide Patent StatisticalDatabase, EPO, April 2013. See chapter notes.
1 2 http://dx.doi.org/10.1787/888932893544
0 0.2 0.4 0.6
TWN
KOR
SGP
ITA
AUT
IND
CHN
NLD
JPN
NOR
DEU
AUS
ESP
FRA
CHE
GBR
IRL
USA
DNK
CAN
BEL
ISR
SWE
FIN
0.6
4.4
0.2
4.5
1.1
0.2
1.2
0.9
2.5
35.8
0.2
22.3
0.2
1.1
7.5
47.2
116.3
4.7
113.5
2.4
0.2
19.3
0.6
1.3
1.5
0.4
1.7
1.2
27.7
26.0
1.7
4.6
1.3
1.0
5.3
3.2
7.8
123.9
1.0
32.1
4.8
1.0
11.2
83.3
633.9
5.7
594.4
10.5
0.7
332.0
1.7
12.7
1.6
4.3
5.6
4.1
Index
USPTO patents EPO patents
Number of cited
patents, thousands
BRIICS
EU28
WLD
OECD
Definitions
The generality index relies on information about thenumber and distribution of citations received (forwardcitations) and the IPC classes of the patents these cita-tions come from. All IPC classes in the citing patentsare considered. The indicator accounts for the distri-bution of both 4-digit and n-digit IPC classes in citingpatents, where n is the highest level of disaggregationpossible. See Squicciarini, Dernis and Criscuolo (2013)for a formal definition.
The scope indicator is based on Lerner (1994) andcorresponds to the number of IPC classes to which apatent is assigned. Breakthrough inventions aredefined following Ahuja and Lampert (2001) as the top1% of cited patents in each technology field and yearcohort. Technology fields are defined according to theclassification of Schmoch (WIPO, 2008, revised in 2013)and rely on the IPC codes of the patent document.Patent indexes are built by normalising patent-specificvalues over the maximum value of any patent in thesame cohort.
OECD SCIENCE, TECHNOLOGY AND INDUSTRY SCOREBOARD 2013 © OECD 2013230

6. COMPETING IN THE KNOWLEDGE ECONOMY
9. Technological strengths
Scope of patent applications, 2009-11Average number of IPC classes per patent application to the EPO and to the USPTO
Source: OECD calculations based on the Worldwide Patent Statistical Database, EPO, April 2013. See chapter notes.1 2 http://dx.doi.org/10.1787/888932893563
Highly cited patent applications, 2002-06Top 1% of cited patent applications, as a share of total EPO and USPTO patents
Source: OECD calculations based on the Worldwide Patent Statistical Database, EPO, April 2013. See chapter notes.1 2 http://dx.doi.org/10.1787/888932893582
Measurability
The generality measure is high when a patent is cited by subsequent patents belonging to a wide range of fields, i.e.the patented invention is relevant for a number of later inventions, not only in its own technology class. If mostcitations are concentrated in a few fields the generality index is low and close to zero (see Squicciarini, Dernis andCriscuolo, 2013). Citations are consolidated and take patent equivalents into account. Forward citations cover allcategories of citations and relate to a 5-year citation window after publication. The top 1% of cited patents is identifiedfor cohorts defined by filing date and technology field. Patents belonging to more than one technology field areassigned to the field accounting for the majority of its 4-digit IPC subclasses. Indicators based on data from differentpatent authorities are built and shown separately. As different intellectual property offices comply with differentlegislations and administrative regulations, their practices differ, e.g. in their propensity to cite prior art or to assignpatents to different technology fields. This hinders the comparability of the proposed measures.
1.0
2.0
2.0
3.0
1.0
3.0
0
AUSCAN
JPN
SGP FIN IND
CHEES
PFR
ADNK
BELSWE
GBRAUT
NLD NORDEU ITA USA IR
LCHN ISR
KORTWN
3.7
12.7
105.
2
1.7
2.3
2.3
5.7
1.5
10.5
2.1
1.9
497.
7
4.7
554.
5
75.5
10.1
1.8
5.4
1.0
28.2
4.3
257.
3
16.5
0.9
12.4
5.2
30.3
33.0
1.6
4.8
47.4 0.7
3.3
0.9
11.6 3.0
21.1 2.7
3.3
279.
4
6.1
294.
3
130.
8
9.6
3.9
9.2
1.1
55.5 9.0
67.5 8.2
1.1
6.3
2.2
11.5 3.3
EPO patents USPTO patentsIndex
OECD
WLDEU28
BRIICS
Number of patents, thousands
0.25
0.25
0.50
0.50
0.75
0.75
1.00
1.00
0
%
BEL KORCHE FIN JP
NBRA
ESP ITA DNK
AUTDEU NLD USA
CANFR
ATWN IR
LSWE
GBRIN
DCHN ISR
VGB
34 84 101 35 342 2 10
1 27
6
1 29
2 42 10 11 455
190 40 280 13 50 4 2 14 16 5 1 2 2 1
2 64 10 14 391
1 3 5 21
0
5 33
8
1 6 1 210
67 44 4 35
1
66 20 70 5 17 28 12 2 8 21 91.
7
EPO patents USPTO patents
Number of top 1% cited patents
OECD
WLDEU28
BRIICS
OECD SCIENCE, TECHNOLOGY AND INDUSTRY SCOREBOARD 2013 © OECD 2013 231

6. COMPETING IN THE KNOWLEDGE ECONOMY
Notes and References
6.1. Industry specialisation
General notes for all figures:
The sectors considered cover the following ISIC Rev.4 activities 01-03 (Agriculture, forestry and fishing), 05-09 (Mining andquarrying), 10-12 (Food products, beverages and tobacco), 13-15 (Textiles, wearing apparel, leather and related products),16-18 (Wood and paper products, and printing), 19-23 (Chemical, rubber, plastics, fuel products and other non-metallicmineral products), 24-25 (Basic metals and fabricated metal products, except machinery and equipment), 26-28 (Machineryand equipment), 29-30 (Transport equipment), 31-33 (Furniture; other manufacturing; repair and installation of machineryand equipment), 35 (Electricity, gas, steam and air conditioning supply), 36-39 (Water supply; sewerage, waste managementand remediation activities), 41-43 (Construction), 45-47 (Wholesale and retail trade, repair of motor vehicles and motorcy-cles), 49-53 (Transportation and storage), 55-56 (Accommodation and food service activities), 58-63 (Information andcommunication), 64-66 (Financial and insurance activities), 69-75 (Professional, scientific and technical activities), 77-82(Administrative and support service activities).
Industrial specialisation, 2000 and 2010
The HK index is specified as:
where si is the relative output of the ithsector, N the total number of sectors in an economy, and measures the extent towhich the index is influenced by large sectors. The HK(2) is calculated for a value of (theta) equal to 2, value for which itcorresponds to the inverse of the Herfindahl Index.
Information for Australia, Canada, Japan and New Zealand refer to 2009.
General notes:
Value added of the top four economic activities, 2008-10 and;
Employment of the top four economic activities, 2008-10
The sector concentration ratio index shown is analogous to the K-firm concentration ratio and is defined as the cumulativeshare of the Kth sector, where si is the relative output of the ith sector. CR(4) is calculated for a value of K equal to 4.
Cyprus
The following note is included at the request of Turkey:
“The information in this document with reference to ‘Cyprus’ relates to the southern part of the Island. There is nosingle authority representing both Turkish and Greek Cypriot people on the Island. Turkey recognizes the TurkishRepublic of Northern Cyprus (TRNC). Until a lasting and equitable solution is found within the context of the UnitedNations, Turkey shall preserve its position concerning the ‘Cyprus issue’.”
The following note is included at the request of all the European Union Member States of the OECD and the EuropeanUnion:
“The Republic of Cyprus is recognised by all members of the United Nations with the exception of Turkey. The infor-mation in this document relates to the area under the effective control of the Government of the Republic of Cyprus.”
Israel
“The statistical data for Israel are supplied by and under the responsibility of the relevant Israeli authorities or thirdparty. The use of such data by the OECD is without prejudice to the status of the Golan Heights, East Jerusalem andIsraeli settlements in the West Bank under the terms of international law.
“It should be noted that statistical data on Israeli patents and trademarks are supplied by the patent and trademarkoffices of the relevant countries.”
OECD SCIENCE, TECHNOLOGY AND INDUSTRY SCOREBOARD 2013 © OECD 2013232

6. COMPETING IN THE KNOWLEDGE ECONOMY
Notes and References
The denominator “total value added” excludes Real estate activities (ISIC Rev.4, Section L, Division 68) and Community,social and personal services (Divisions 84-99).
Information for Australia, Canada, Japan and New Zealand is based on the average value of 2008 and 2009 only.
Additional notes:
Value added of the top four economic activities, 2008-10
The colour palette on the figure is reduced to highlight the two industries with the largest value added shares in each coun-try. The shades of grey correspond to the shares (in descending intensity) of each country’s other two main industries, interms of value added.
6.2. ICT industry specialisation
Information industries in OECD economies, 2000 and 2011
For Germany, Poland, Portugal, Switzerland and the United Kingdom, data refer to 2010.
For Canada, data refer to 2009.
For Japan, data refer to 2008.
Unweighted means exclude Canada.
Global trade in ICT goods and top ten exporters, 2000 and 2011
China and World data are computed net of China’s re-imports and Hong Kong, China re-exports. Gross of these compo-nents, world exports of ICT products totalled USD 985 billion in 2000 and USD 1 813 billion in 2011, while China’s exportstotalled USD 44 billion in 2000 and USD 508 billion in 2011, with no substantial change in its shares. Netting for the flows ofgoods mediated by Hong Kong, China, and for Chinese re-imports removes two key intertwined elements of distortion inICT trade statistics. Indeed, re-exports sum up to 99% of Hong Kong, China, exports of ICT goods, while China extensivelyuses East Asian logistics hubs (including Hong Kong, China) for internal trade. Estimates do not consider similar flows forother countries owing to a lack of exhaustive data.
OECD and major exporters of ICT services, 2000 and 2012
For Canada, Finland, Iceland, Israel, Mexico, Norway, Slovenia, Turkey and the United States, data refer to 2011 instead of2012.
For Luxembourg and Kuwait, data refer to 2002 instead of 2000.
For Denmark, data refer to 2004 instead of 2000.
For Mexico and Kuwait, exports of computer and information services are not included.
6.3. Export structures
Top 20 exporting economies of primary and manufactured goods by end-use category, 1995 and 2011
Primary goods are defined as those coming from the following ISIC Rev.4 activities: Agriculture, hunting, forestry (01-03) andMining and quarrying (05-09); Manufactured goods come from the Manufacturing sector (10-33). Exports of Electricity, gasand water (35) and identifiable scrap metal and waste products are not included in this analysis. Products that cannot beallocated to an industry due to confidentiality, or other reasons, are excluded too. On average, in OECD and BRIICS countries,exports of primary and manufactured goods (01-33) represented about 96% of total reported trade in goods in 2011.
Total final goods include the following final demand end-use categories: consumption goods, capital goods and certainmixed end-use goods such as personal computers, personal telephones (including smart phones), passenger cars, preciousgoods (such as diamonds) and packed medicines. Reported exports that can be allocated to an industry but not to an end-use category are also included. Note that Packed medicines is considered a mixed end-use category as they can be finalgoods for households or intermediate goods for medical centres.
Exports include re-exports (i.e. imported goods which are subsequently exported with no further transformation). Manycountries re-export but few report these flows by commodities. Since, the share of re-exports may vary across countries andproducts and over time, care should be taken when interpreting this chart. For example, in 2011 about 96% of Hong Kong,China’s exports were re-exports to and originating from mainland China, up from 83% in 2005. If re-exports were excluded,Hong Kong, China would not feature in the top 20. Other countries with significant re-exports include Singapore, Belgium, the
OECD SCIENCE, TECHNOLOGY AND INDUSTRY SCOREBOARD 2013 © OECD 2013 233

6. COMPETING IN THE KNOWLEDGE ECONOMY
Notes and References
Netherlands and Germany, countries that are major regional hubs for goods transported by sea. Including re-exports showscountries with a significant role in international trade who may not necessarily be major producers of goods.
Top four exporting industries by country, 2011
The colour palette on the figure is reduced to highlight the sector with the largest export share in each country. The shadesof grey correspond to the shares (in descending intensity) of each country’s other three main exporting industries.
The top four industries are chosen from the following ISIC Rev.4 activities: 01-03 (Agriculture, forestry and fishing);05-09 (Mining and quarrying); 10-12 (Food products, beverages and tobacco); 13-15 (Textiles, wearing apparel, leather andrelated products); 16-18 (Wood, paper products and printing); 19 (Coke and refined petroleum products); 20 (Chemicals);21 (Pharmaceuticals); 22-23 (Rubber, plastics and other non-metallic mineral products); 24 (Basic metals); 25 (Fabricatedmetal products, except machinery and equipment); 26 (Computers, electronic and optical products); 27 (Electricalequipment); 28 (Machinery and equipment); 29 (Motor vehicles, trailers and semi-trailers); 30 (Transport equipment);31-33 (Furniture; other manufacturing).
Top three exporting services by country, 2011
Countries are divided into two groups, according to whether the share of services in goods and services exports is above orbelow the world average (about 19.1%). Within each group, they are ranked according to the sum of the percentage sharesof the three largest services export categories.
6.4. R&D specialisation
Business R&D intensity adjusted for industrial structure, 2011
A country’s industrial structure-adjusted indicator of R&D intensity is a weighted average of its sectoral R&D intensities(ratio of R&D to value added), using the OECD industrial structure – sectoral share in OECD value added for 2011 – as commonweights across all countries. The unadjusted measure of BERD intensity is by definition an average based on each country’sactual sector shares.
For Denmark, France, Germany, Italy, Poland, Portugal, Slovenia, Spain and the United Kingdom, data refer to 2010.
For Australia, Austria, Belgium, Sweden and the United States, data refer to 2009.
R&D series are presented as a percentage of value added in industry estimated as the value added in all activities except:Real estate activities (ISIC Rev.4 68); Public administration and defence; compulsory social security and education(ISIC Rev.4 84-85); Human health and social work activities (ISIC Rev.4 86-88); and Activities of households as employers(ISIC Rev.4 97-98). R&D performed in these sectors across the OECD is reported to be negligible.
Value added is measured at basic prices except for Japan and the United States (market prices).
Based on estimates of business R&D by sector reported on a main activity basis.
Business R&D in manufacturing, by technology intensity, 2011
High- and medium-high-technology manufacturing includes: Chemicals and chemical products (ISIC Rev.4 20 and 21);Electrical and optical equipment (ISIC Rev.4 26 and 27); Manufacture of machinery and equipment n.e.c. (ISIC Rev.4 28); andTransport equipment (ISIC Rev.4 29 and 30). Low- and medium-low-technology manufacturing includes all other manufac-turing industries.
Based on estimates of business R&D by sector reported on a main activity basis, with the exception of the Russian Federation(product basis).
For Australia, Denmark, France, Israel, Italy, Portugal, Spain, the United Kingdom and the United States, data refer to 2010.
For Austria, Belgium, Iceland, the Russian Federation and Sweden, data refer to 2009.
For Chile and Switzerland, data refer to 2008.
For Estonia, the high share of low- and medium-low-technology manufacturing in 2011 is due to an important investmentin new technology in the oil industry (ISIC Rev.4 19).
Share of services in business R&D, 2001 and 2011
Figure are based on estimates of business R&D by sector reported on a main activity basis, with the exception of the RussianFederation (product basis).
For Australia, Chile, Denmark, France, Italy, Portugal, Spain and the United Kingdom, data refer to 2010 instead of 2011.
For Austria, Belgium, Iceland, the Russian Federation, South Africa and Sweden, data refer to 2009 instead of 2011.
OECD SCIENCE, TECHNOLOGY AND INDUSTRY SCOREBOARD 2013 © OECD 2013234

6. COMPETING IN THE KNOWLEDGE ECONOMY
Notes and References
For China, data refer to 2000 instead of 2001.
For Slovenia, data refer to 2003 instead of 2001.
For Switzerland, data refer to 2000 and 2008 instead of 2001 and 2011.
For the United States, data refer to 2004 and 2010 instead of 2001 and 2011.
For Denmark, Norway and Poland, data for 2001 are not reported because of significant breaks in series.
6.5. Technological advantage
Change in revealed technological advantage in biotechnology and nanotechnology, 1998-2000 and 2008-10
Biotechnology and nanotechnology patents are defined on the basis of their International Patent Classification (IPC) codesor European Classification System (ECLA) codes.
Only the top 20 economies with more than 500 biotechnology or nanotechnology patents in 2008-10 are included.
Change in revealed technological advantage in ICT, 1998-2000 and 2008-10
ICT-related patents are defined on the basis of their International Patent Classification (IPC) codes.
Only economies with more than 500 ICT patents in 2008-10 are included.
Countries’ range of revealed technological advantage by field, 2008-10
Patents are allocated to technology fields on the basis of their International Patent Classification (IPC) codes, following theclassification presented in Schmoch (2008, revised in 2013).
Only countries with more than 1 000 patents in 2008-10 are included.
6.6. Trade competitiveness
Top ten exporting economies in gross and value added terms, 2009
The major activity groups are defined according to the 18 ISIC Rev.3 categories in the TiVA database: Primary products(Divisions 01-05, 10-14, i.e. agriculture and mining); Machinery and equipment and transport equipment (29, 30-33, 34-35: aproxy for high- and medium-high-technology manufactures); Other manufacturing (15-16, 17-19, 20-22, 23-26, 27-28, 36-37:a proxy for low- and medium-low-technology manufactures); Trade, transport and communications (50-55, 60-64); Financeand business services (65-67,70-74); and Other activities (40-41, 45 and 75-99, i.e. utilities, construction and public services).
Revealed comparative advantage in exports of computers, electronic and optical products, 2009
Computers, electronic and optical equipment refers to the ISIC Rev.3 Divisions 30-33.
Revealed comparative advantage in exports of machinery and equipment, 2009
Machinery and equipment corresponds to the ISIC Rev.3 Division 29.
6.7. E-business uptake
General notes for all figures:
Except otherwise stated, the sector coverage consists of all activities in manufacturing and non-financial market services.Only enterprises with 10 or more persons employed are considered. Size classes are defined as: small (from 10 to 49 personsemployed), medium (50 to 249), large (250 and more).
Additional notes:
Enterprises selling on line, by size, 2009 and 2012 and;
Turnover from e-commerce, by enterprise size, 2012
For Australia, data refer to the fiscal year ending 30 June 2011 (2010/11) instead of 2012. Total includes Agriculture, forestryand fishing.
For Mexico, data refer to 2008 instead of 2012 and to businesses with 20 or more persons employed.
OECD SCIENCE, TECHNOLOGY AND INDUSTRY SCOREBOARD 2013 © OECD 2013 235

6. COMPETING IN THE KNOWLEDGE ECONOMY
Notes and References
Enterprises selling on line, by size, 2009 and 2012
For Canada, data refer to 2007 instead of 2009. Medium-sized enterprises have 50-299 employees. Large enterprises have 300or more employees.
For Korea, Japan and Switzerland, data refer to 2011 instead of 2012.
For Japan, data refer to businesses with 100 or more employees. Medium-sized enterprises have 100-299 employees. Largeenterprises have 300 or more employees.
For Mexico, data refer to 2008 instead of 2009 and to businesses with 20 or more persons employed.
For Switzerland, data refer to 2008 instead of 2009. In 2008, data refer to businesses with five or more persons employed.
For Turkey, data refer to 2010 instead of 2012.
Turnover from e-commerce, by enterprise size, 2012
For Denmark and Germany, data refer to 2010.
For Finland, Luxembourg, Mexico, Poland, Slovenia and the United States, data are not available by firm size.
For the United States, data are drawn from the Bureau of the Census. Includes Manufacturing, Merchant wholesale, Retailand Selected services. Selected services includes NAICS 22 (Utilities), NAICS 48-49 (Transportation and warehousing),NAICS 51 (Information), NAICS 52 (Finance and insurance), NAICS 53 (Real estate and rental and leasing), NAICS 54 (Selectedprofessional, scientific and technical services), NAICS 56 (Administrative and support and waste management and remedi-ation services), NAICS 61 (Educational services), NAICS 62 (Health care and social assistance), NAICS 71 (Arts, entertainmentand recreation), NAICS 72 (Accommodation and food services), and NAICS 81 (Other services, except public administration).
Enterprises using enterprise resource planning software for internal information sharing, by size, 2012
For Canada, medium-sized enterprises have 50-299 employees. Large enterprises have 300 or more employees.
For Switzerland, data refer to 2011.
6.8. Young innovative firms
General notes for all figures:
Patenting firms were linked to the ORBIS© database, using combinations of string matching algorithms that maximise theprecision of the match. The patent portfolio of firms refers to families of patents applied for at the European Patent Office(EPO), at the United States Patent and Trademark Office (USPTO) or using the Patent Cooperation Treaty (PCT) between 2009and 2011. Only countries with matching rates above 80% of patent filings over 2000-11 are included.
Patenting activity by sector, 2009-11 and;
Patenting activity of young firms by sector, 2009-11
High and medium-high-technology manufactures cover sectors 20, 21, 26, 27, 28 and 29-30; low and medium-low-technol-ogy manufactures include 10-12, 13-15, 16-18, 19, 22-23, 24-25 and 31-33; business-sector services, excluding real estate,refer to 45-47, 49-53, 55-56, 58-63, 64-66, 69-82; other sectors comprise 01-03, 05-09, 35, 36-39, 41-43, 68, 84-88, 90-99.
Top three industries patenting in selected technology fields, 2009-11
Patents in biotechnologies, nanotechnologies, pharmaceuticals and ICT-related technologies are based on a selection ofInternational Patent Classification (IPC) classes.
Patents in environment-related technologies are defined using combinations of IPC classes and codes Y02 of the EuropeanClassification (ECLA).
Patenting activity of young firms by sector, 2009-11
For Japan, the average number of young patenting firms is overestimated as it includes affiliates of large conglomerates witha recent date of incorporation registered in the ORBIS© database.
OECD SCIENCE, TECHNOLOGY AND INDUSTRY SCOREBOARD 2013 © OECD 2013236

6. COMPETING IN THE KNOWLEDGE ECONOMY
Notes and References
6.9. Technological strengths
General note for all figures:
Data refer to patent applications filed at the European Patent Office (EPO) and the US Patent and Trademark Office (USPTO),by filing date and applicant’s residence. Only economies with more than 500 patents at the EPO and at the USPTO in 2009-11,or, in the case of the patent generality index, only economies with more than 100 EPO patents and 500 USPTO patents thatreceived forward citations up to five years after publication, are included.
Additional notes:
The relevance of patents for later inventions, 2002-06
The patent generality index is a modified version of a market concentration index, the Hirschman-Herfindahl Index (HHI),which relies on the number and distribution of citations received (forward citations) and the technology classes (Interna-tional Patent Classification, IPC) of the patents these citations come from.
Scope of patent applications, 2009-11
The scope of a patent application is calculated as the number of distinct International Patent Classification (IPC) subclasses(i.e. 4-digit IPC codes) the application is assigned to by the patent office.
References
Ahuja, G. and C.M. Lampert (2001), “Entrepreneurship in the Large Corporation: A Longitudinal Study of How Established FirmsCreate Breakthrough Inventions”, Strategic Management Journal, Vol. 22, No. 6-7, pp. 521-543. Doi: http://dx.doi.org/10.1002/smj.176.
Curry, B. and K.D. George (1983), “Industrial concentration: a survey”, The Journal of Industrial Economics, Vol. 31, No. 3, pp. 203-255.
Lerner, J. (1994), “The Importance of Patent Scope: An Empirical Analysis”, The RAND Journal of Economics, Vol. 25, No. 2, pp. 319-333.
Meng, B., Y. Fang and N. Yamano (2012), “Measuring Global Value Chains and Regional Economic Integration: An International Input-Output Approach”, IDE Discussion Papers, No. 362.
Miroudot, S. and N. Yamano (2013), “Trade in Value-Added: Concepts, Methodologies and Challenges”, in A. Mattoo, Z. Wang andS. Wei (eds.), Trade in Value-Added: Developing New Measures of Cross-Border Trade, The World Bank, Washington, DC.
OECD (2009), OECD Patent Statistics Manual, OECD Publishing. Doi: http://dx.doi.org/10.1787/9789264056442-en.
OECD (2011), Science, Technology and Industry Scoreboard 2011, OECD Publishing. Doi: http://dx.doi.org/10.1787/sti_scoreboard-2011-en.
OECD (2013), Interconnected Economies: Benefiting from Global Value Chains, OECD Publishing.Doi: http://dx.doi.org/10.1787/9789264189560-en.
OECD-WTO (2012), “Trade in Value Added: Concepts, Methodologies and Challenges” (OECD-WTO, online document), www.oecd.org/sti/ind/49894138.pdf.
Schmoch, U. (2008), “Concept of a Technology Classification for Country Comparisons, Final Report to the World IntellectualProperty Organisation (WIPO)”, revised in January 2013, WIPO, www.wipo.int/export/sites/www/ipstats/en/statistics/patents/pdf/wipo_ipc_technology.pdf.
Squicciarini, M. and H. Dernis (2013), “A Cross-Country Characterisation of the Patenting Behaviour of Firms based on Matched Firmand Patent Data”, OECD Science, Technology and Industry Working Papers, No. 2013/05, OECD Publishing.Doi: http://dx.doi.org/10.1787/5k40gxd4vh41-en.
Squicciarini, M., H. Dernis and C. Criscuolo (2013), “Measuring Patent Quality: Indicators of Technological and Economic Value”, OECDScience, Technology and Industry Working Papers, No. 2013/03, OECD Publishing. Doi: http://dx.doi.org/10.1787/5k4522wkw1r8-en.
The OECD Analytical BERD (ANBERD) Database (OECD, online document), www.oecd.org/sti/ind/ANBERD_full_documentation.pdf.
Zhu, S., N. Yamano and A. Cimper (2011), “Compilation of Bilateral Trade Database by Industry and End-Use Category”, OECD Science,Technology and Industry Working Papers, 2011/06, OECD Publishing. Doi: http://dx.doi.org/10.1787/5k9h6vx2z07f-en.
OECD SCIENCE, TECHNOLOGY AND INDUSTRY SCOREBOARD 2013 © OECD 2013 237


OECD SCIENCE, TECHNOLOGY AND INDU
7. PARTICIPATING IN THE GLOBALECONOMY
1. Employment
2. Services-manufacturing linkages
3. Firm size
4. Firm dynamics
5. Foreign affiliates
6. Trade and global value chains
7. Global demand
8. Trade and jobs
9. Trade and household consumption
Notes and References
The international fragmentation of production is driven by changes in the business andregulatory environment, new technologies, shifts in corporate thinking and firm strategies,and the systematic liberalisation of trade and investment over the past two decades. Theextent to which economies integrate and specialise in the world economy depends on a numberof structural factors. Employment patterns in key industries, the size and characteristics offirms, such as foreign ownership, the linkages between manufacturing and services, thedynamism of start-ups, and patterns of final demand, all help explain countries’ participationin global value chains. Novel indicators building on the OECD-WTO Trade in Value Added(TiVA) Database shed new light on economies’ participation in global trade and value chainsand the implications of this participation for jobs and consumers everywhere.
STRY SCOREBOARD 2013 © OECD 2013 239

7. PARTICIPATING IN THE GLOBAL ECONOMY
1. Employment
The share of employment in service activities has continuedto rise steadily. The recent crisis, which hit manufacturingand construction particularly hard, has reinforced this long-term trend. By 2011, the share of employment in services inOECD countries averaged about 74%, ranging from 48% inTurkey to 84% in the United States. Between 2000 and 2011,shares of employment in services increased by over 15% inIreland, Portugal, Slovenia and Spain. On average in 2011,public services accounted for about 40% of OECD-areaemployment in services, ranging from 29% in Luxembourgto 51% in Iceland.
Knowledge-intensive market services are significant usersof high technology (e.g. ICT capital) and/or have a relativelyhighly skilled workforce able to meet the demands of mod-ern, highly competitive business environments. Their shareof employment has increased in most OECD countries since2000; by 2011, they accounted on average for 12% of totalemployment. The increase was mainly driven by profes-sional, scientific and technical activities, which account forabout half of employment in these services. ICT servicesaccount for only about 3% of total employment in OECDcountries.
In contrast, the share of employment in high- and medium-high-technology manufacturing has continued to decline inmany OECD countries, partly as a result of increased inter-national sourcing of manufactured products, particularlyfrom non-OECD countries, and active offshoring by multi-nationals. Exceptions include countries such as the CzechRepublic, Estonia, Hungary, Poland and the Slovak Republicwhich have increased their presence in EU manufacturingvalue chains. Employment in high- and medium-high-technology manufacturing fell significantly over 2000-11 inthe United Kingdom (-42%), Spain (-39%) and the UnitedStates (-31%).
Employment in services, 2000 and 2011As a percentage of total employment
Source: OECD, National Accounts (SNA) Database, June 2013. See chapternotes.
1 2 http://dx.doi.org/10.1787/888932904070
0 4020 60 80 100%
USA
GBR
NLD
ISL
NZL
BEL
DNK
FRA
LUX
NOR
CAN
IRL
SWE
AUS
ESP
ISR
DEU
CHE
GRC
AUT
FIN
JPN
ITA
KOR
CHL
SVK
EST
PRT
HUN
SVN
CZE
POL
MEX
TUR
“Market sector” services2000
Public services
Definitions
Market sector services correspond to ISIC Rev.4 Divi-sions 45-82. Public sector services encompass ISIC Rev.4Divisions 84-98, i.e. Government (84), Education (85),Health (86-88), Other community, social and personalservices (90-96), and Private households (97-98).
Knowledge-intensive “market” services refer to ISIC Rev.4Section J: Information and communication (Divisions58-63); K: Finance and insurance (64-66); and M: Pro-fessional, scientific and technical activities (69-75).
High- and medium-high-technology manufacturing isdefined in ISIC Rev.4 as Chemicals and chemicalproducts (Division 20), Pharmaceutical products (21),Computer, electronic and optical products (26), Elec-trical equipment (27), Machinery and equipmentn.e.c. (28), Motor vehicles (29) and Other transportequipment (30).
OECD SCIENCE, TECHNOLOGY AND INDUSTRY SCOREBOARD 2013 © OECD 2013240

7. PARTICIPATING IN THE GLOBAL ECONOMY
1. Employment
Employment in knowledge-intensive “market” services, 2000 and 2011As a percentage of total employment
Source: OECD, Structural Analysis (STAN) Database, ISIC Rev.4, May 2013. See chapter notes.1 2 http://dx.doi.org/10.1787/888932904089
Employment in high- and medium-high-technology manufacturing, 2000 and 2011As a percentage of total employment
Source: OECD, Structural Analysis (STAN) Database, ISIC Rev.4, May 2013. See chapter notes.1 2 http://dx.doi.org/10.1787/888932904108
Measurability
On an industry-based definition, the distinction between market and public services is only approximate, as some ser-vices can be provided by public or private entities, or by a mix of the two. For example, in OECD countries, privateeducation and health services are available to varying degrees while in some countries, transport and postal servicesremain in the public realm.
Recent employment statistics compiled according to ISIC Rev.4 (NACE Rev.2) are used here. High- and medium-high-technology manufacturing is usually defined on the basis of industry R&D intensity, i.e. R&D expenditures relative tooutput. However, as ISIC Rev.4 data availability is currently insufficient, an approximate correspondence from the ISICRev.3 definition has been adopted.
For services, alternative measures, beyond R&D expenditure, have been used to determine the preliminary ISIC Rev.4definition of knowledge-intensive market services applied here. These include the skill composition of the workforceand, indicators of innovation intensity based on data coming from innovation surveys.
%
15
20
25
10
5
0
LUX
CHE ISLGBR
BEL IRL
CANUSA
AUSNLD SVN
DNKDEU SWE
FRA ITA AUT FIN NOR
CZEES
PSVK
GRCES
THUN
POLPRT
TUR
Information and communicationProfessional, scientific and technical activities Finance and insurance Total share in 2000
%
6
8
10
4
2
0
CZEHUN
DEU JPN
SVKSVN
SWE FIN ITA IRL
POLAUT
ISRES
TDNK
BELMEX
USAFR
AES
PCAN
NLD GBRPRT
LUX
GRC
20002011
OECD SCIENCE, TECHNOLOGY AND INDUSTRY SCOREBOARD 2013 © OECD 2013 241

7. PARTICIPATING IN THE GLOBAL ECONOMY
2. Services-manufacturing linkages
Manufacturing production in many OECD countries hasdeclined in recent decades so that, on average, services nowaccount for about 70% of OECD GDP. In France, the UnitedKingdom and the United States, manufacturing accountsfor only 10%, or lower, of total employment. In addition tothe general decline, the scope and nature of manufacturinghas changed in many OECD countries and now relies moreon service occupations and inputs. This is due to the greateruse of technology in production, the international sourcingof manufactured goods and a range of social factors (such asthe changing skills of populations). Two indicators pre-sented here provide insights into the interdependence ofservices and manufacturing industries.
Data on occupations show a steady increase over the lastdecade in the share of workers in manufacturing employedin occupations that can be considered services-related, suchas managers, accountants, lawyers and IT professionals. In2012, the share in Europe had reached about 41% (up from35% in 2002) and varied between 25% and 53% acrosscountries.
Estimates from the new OECD-WTO Trade in Value Added(TiVA) database reveal the amount of value added derivedfrom services embodied in the exports of manufacturedgoods. In 2009, the services content embodied in manufac-tured exports varied between 25% and 40% across OECDcountries, and between 1995 and 2009, it rose significantlyin most countries. For many this was mainly due toincreases in embodied foreign services. The sectors Wholesaleand retail trade, hotels and restaurants and Businessservices account for the bulk of services embodied in man-ufacturing; business services posted the greatest increasesbetween 1995 and 2009.
Services-related occupations in manufacturing,2002 and 2012
As a percentage of total employment in manufacturing
Source: OECD calculations based on EU Labour Force Survey and USCurrent Population Survey, May 2013. See chapter notes.
1 2 http://dx.doi.org/10.1787/888932904127
0 2010 30 40 50 60%
2012 2002
FRA
CHE
NLD
GBR
LUX
DEU
BEL
USA
DNK
AUT
FIN
NOR
IRL
SWE
ESP
ITA
SVN
ISL
CZE
GRC
POL
EST
SVK
PRT
HUN
TUR
EU28
Definitions
Services-related occupations correspond to ISCO-08(2002: ISCO-88) major groups 1, Legislators, Seniorofficials and Managers; 2, Professionals; 3, Techni-cians and Associate professionals, 4, Clerks; and 5,Service workers and shop and market sales workers.Manufacturing refers to ISIC Rev.4 (NACE Rev.2)Divisions 10 to 33 (2002: ISIC Rev.3/NACE Rev.1Divisions 15 to 37).
For services content of exports, sectors of economicactivity are defined according to ISIC Rev.3: Manufac-tures: Divisions 15-37; Construction: 45; Wholesaleand retail trade, hotels and restaurants: 50-55;Transport and storage, post and telecommunications:60-64; Financial intermediation: 65-67; Businessservices: 70-74; and Other services: 75-99.
OECD SCIENCE, TECHNOLOGY AND INDUSTRY SCOREBOARD 2013 © OECD 2013242

7. PARTICIPATING IN THE GLOBAL ECONOMY
2. Services-manufacturing linkages
Services content of manufactured exports, domestic and foreign, 1995 and 2009As a percentage of total manufactured exports
Source: OECD-WTO, Trade in Value Added (TiVA) Database, http://oe.cd/tiva, May 2013. StatLink contains more data.1 2 http://dx.doi.org/10.1787/888932904146
Services content of manufactured exports by type of service, 2009As a percentage of total manufactured exports
Source: OECD-WTO, Trade in Value Added (TiVA) Database, http://oe.cd/tiva, May 2013. StatLink contains more data.1 2 http://dx.doi.org/10.1787/888932904165
Measurability
The indicators of service content of manufacturing exports are based on the global input-output system developed bythe OECD, the Inter-Country Input-Output (ICIO) Database. This data set describes interactions between industries andconsumers for 58 economies, 37 industries and 95% of global output. ICIO is very useful for policy analysis and aimsat better reflecting: a) the significant contribution made by services in global value chains; b) the important role ofimports for export performance; c) the true nature of economic interdependencies as reflected in bilateral trade bal-ances in value added terms; d) the role of emerging economies in global value chains; and e) the impact of supply anddemand shocks on downstream and upstream production.
%
15
20
25
30
35
40
45
10
5
0
1995
2009
1995
2009
1995
2009
1995
2009
1995
2009
1995
2009
1995
2009
1995
2009
1995
2009
1995
2009
1995
2009
1995
2009
1995
2009
1995
2009
1995
2009
1995
2009
1995
2009
1995
2009
1995
2009
1995
2009
1995
2009
1995
2009
1995
2009
1995
2009
1995
2009
FRA ITA DEU BEL ESP IRL IND SWE POL CHE NLD AUT TUR AUS JPN GBR CZE CAN BRA RUS MEX KOR USA CHN IDN
Domestic service content Foreign service content
%
15
20
25
30
35
40
45
10
5
0
ISLFR
A ITA DEU BEL FIN ESP IR
LIN
DLU
XSWE
POLCHE
EST
NLD SVKAUT
TURAUS
GRCNZL ISR
PRTCHL
JPN
SVNNOR
GBRDNK
CZEZAF
CANBRA
RUSMEX
HUNKOR
USACHN
IDN
Business services Other services
Transport and storage, post and telecommunications Financial intermediation
Construction Wholesale and retail trade, hotels and restaurants
OECD SCIENCE, TECHNOLOGY AND INDUSTRY SCOREBOARD 2013 © OECD 2013 243
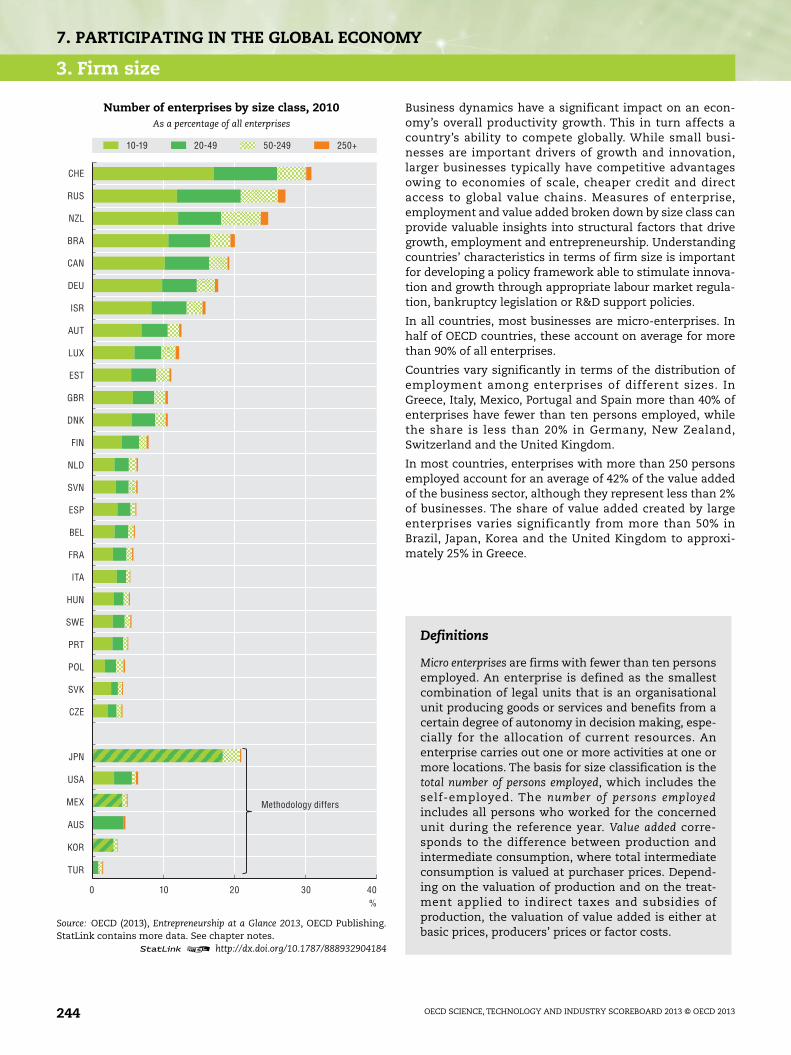
7. PARTICIPATING IN THE GLOBAL ECONOMY
3. Firm size
Business dynamics have a significant impact on an econ-omy’s overall productivity growth. This in turn affects acountry’s ability to compete globally. While small busi-nesses are important drivers of growth and innovation,larger businesses typically have competitive advantagesowing to economies of scale, cheaper credit and directaccess to global value chains. Measures of enterprise,employment and value added broken down by size class canprovide valuable insights into structural factors that drivegrowth, employment and entrepreneurship. Understandingcountries’ characteristics in terms of firm size is importantfor developing a policy framework able to stimulate innova-tion and growth through appropriate labour market regula-tion, bankruptcy legislation or R&D support policies.
In all countries, most businesses are micro-enterprises. Inhalf of OECD countries, these account on average for morethan 90% of all enterprises.
Countries vary significantly in terms of the distribution ofemployment among enterprises of different sizes. InGreece, Italy, Mexico, Portugal and Spain more than 40% ofenterprises have fewer than ten persons employed, whilethe share is less than 20% in Germany, New Zealand,Switzerland and the United Kingdom.
In most countries, enterprises with more than 250 personsemployed account for an average of 42% of the value addedof the business sector, although they represent less than 2%of businesses. The share of value added created by largeenterprises varies significantly from more than 50% inBrazil, Japan, Korea and the United Kingdom to approxi-mately 25% in Greece.
Number of enterprises by size class, 2010As a percentage of all enterprises
Source: OECD (2013), Entrepreneurship at a Glance 2013, OECD Publishing.StatLink contains more data. See chapter notes.
1 2 http://dx.doi.org/10.1787/888932904184
0 2010 30 40%
TUR
KOR
AUS
MEX
USA
JPN
CZE
SVK
POL
PRT
SWE
HUN
ITA
FRA
BEL
ESP
SVN
NLD
FIN
DNK
GBR
EST
LUX
AUT
ISR
DEU
CAN
BRA
NZL
RUS
CHE
10-19 20-49 50-249 250+
Methodology differs
Definitions
Micro enterprises are firms with fewer than ten personsemployed. An enterprise is defined as the smallestcombination of legal units that is an organisationalunit producing goods or services and benefits from acertain degree of autonomy in decision making, espe-cially for the allocation of current resources. Anenterprise carries out one or more activities at one ormore locations. The basis for size classification is thetotal number of persons employed, which includes theself-employed. The number of persons employedincludes all persons who worked for the concernedunit during the reference year. Value added corre-sponds to the difference between production andintermediate consumption, where total intermediateconsumption is valued at purchaser prices. Depend-ing on the valuation of production and on the treat-ment applied to indirect taxes and subsidies ofproduction, the valuation of value added is either atbasic prices, producers’ prices or factor costs.
OECD SCIENCE, TECHNOLOGY AND INDUSTRY SCOREBOARD 2013 © OECD 2013244

7. PARTICIPATING IN THE GLOBAL ECONOMY
3. Firm size
Employment by enterprise by size class, 2010As a percentage of total employment
Source: OECD (2013), Entrepreneurship at a Glance 2013, OECD Publishing. StatLink contains more data. See chapter notes.1 2 http://dx.doi.org/10.1787/888932904203
Value added by enterprise by size class, 2010As a percentage of total value added
Source: OECD (2013), Entrepreneurship at a Glance 2013, OECD Publishing. StatLink contains more data. See chapter notes.1 2 http://dx.doi.org/10.1787/888932904222
Measurability
For most countries, the main sources of information used to compile the OECD Structural and Business DemographyStatistics (SDBS) are economic censuses, business surveys and business registers. In spite of the goal of full coverageof existing businesses in a given country, countries differ in terms of coverage of business registers owing to nationalcircumstances and data availability.
The Business Size Class (BSC) Dataset is a part of SDBS and provides information by enterprise size class. To improvedata harmonisation and enable country comparisons, the BSC focuses on five size classes for which the data acrosscountries and variables can be most closely aligned. Countries with a different size class breakdown are shown sepa-rately in the figures.
The SDBS, in combination with the BSC, provides an input to the OECD Entrepreneurship Indicators Programme (EIP).
%
40
60
80
100
20
0
GRC ITA PRTES
PSVK
HUNPOL
BEL SVNCZE
SWEAUT FIN DNK
NZL DEU LUX
CHEGBR ISR
BRARUS
MEXAUS
TURJP
NUSA
1-9 10-19 20-49 50-249 250+ Methodology differs
%
40
60
80
100
20
0
GRCNOR ITA FR
AES
PSVK
PRTDNK
LUX
BELSWE
SVN FIN CZEHUN
AUTGBR IR
LPOL
DEU CHEBRA
MEXAUS
TUR ISRJP
NKOR
1-9 10-19 20-49 50-249 250+ Methodology differs
OECD SCIENCE, TECHNOLOGY AND INDUSTRY SCOREBOARD 2013 © OECD 2013 245

7. PARTICIPATING IN THE GLOBAL ECONOMY
4. Firm dynamics
Young firms are generally characterised by an up-or-outdynamics. A significant share of start-ups does not survivebeyond the first two years, but those that do contributemore than proportionally to job creation than old busi-nesses. On average across 12 countries over 2001-10, theprobability of micro start-up exit is 8 percentage pointshigher than for businesses more than 10 years old of thesame size; however, they contribute 10 points more to grossjob creation.
Throughout the periods and economies considered, at least60% of start-ups remain micro-firms after three years. Onaverage across countries and cohorts, some 5% of microstart-ups grow, but their contribution to net job creationamounts to 24% of initial employment of all micro start-ups.The data collected do not allow for quantifying how muchgrowth is due to mergers and acquisitions. Almost every-where, the 2008 crisis seemingly triggered an increase in theshare of start-ups that became inactive at the end of thethree-year period. This is not true for the share of start-upsthat grow: while growing start-ups account for 3-9% of thesefirms, the crisis years are not necessarily those in which theshare of growing firms is smaller, nor those in which theycontribute less to net job creation.
When comparing the average size of firms in different ageclasses across economies at a given point in time, it appearsthat while two year-old firms have on average no more than15 employees, the size of old businesses differs widely, withUS firms almost five times larger than those in Italy.
In all economies considered, the initial size of start-ups ison average larger in manufacturing than in services. How-ever, the difference in size between 11 year-old and 3 year-old businesses is much smaller in services than in manufac-turing. Economies in which manufacturing firms are bornrelatively large on average, e.g. Norway, Japan and Finland,are not those in which old firms are the largest. This mayreflect differences in industrial composition, market sizeand framework conditions.
Three-year survival and growth performance of microstart-ups, 2001-04, 2004-07, 2007-10
Firms with fewer than 10 employees and less than 3 years old, non-financialbusiness sector
Source: OECD calculations based on the OECD DYNEMP data collection,July 2013. See chapter notes.
1 2 http://dx.doi.org/10.1787/888932904241
40 20 0 4020 60 80 100%
AUT
BEL
BRA
FIN
ITA
LUX
NLD
NOR
NZL
SWE
USA
2001
2004
2007
2001
2004
2007
2001
2004
2007
2001
2004
2007
2001
2004
2007
2001
2004
2007
2001
2004
2007
2001
2004
2007
2001
2004
2006
2001
2004
2007
2001
2004
2007
Inactive Stable Growing
Definitions
Micro start-ups are less than three years old, withfewer than ten employees at the beginning of theobservation period. A firm’s survival refers to its exis-tence at the end of the period considered. Inactivefirms are those for which no employment informationis available at the end of the observation period. Stablefirms remain in the same size class at the end of threeyears. Micro-firms still have fewer than ten employees.Growing firms increase the number of their employeesduring the three-year period and are in size classeslarger than the initial one at the end of the period. Oldfirms are 11 years old or more.
OECD SCIENCE, TECHNOLOGY AND INDUSTRY SCOREBOARD 2013 © OECD 2013246

7. PARTICIPATING IN THE GLOBAL ECONOMY
4. Firm dynamics
Average size of firms less than 3 years old and 11 years old or more, 2001-10Non-financial business sector, reference cohorts 2001, 2004 and 2007
Source: OECD calculations based on the OECD DYNEMP data collection, July 2013. See chapter notes.1 2 http://dx.doi.org/10.1787/888932904260
Average size of firms less than 3 years old and 11 years old or more, by sector, 2001-10Reference cohorts 2001, 2004 and 2007
Source: OECD calculations based on the OECD DYNEMP data collection, July 2013. See chapter notes.1 2 http://dx.doi.org/10.1787/888932904279
Measurability
The DYNEMP project has collected micro-aggregated data for start-ups (firms less than 3 years old) to look at perfor-mance and survival rates in 2001-04, 2004-07 and 2007-10. As there are differences in how long inactive firms aremaintained in business registers before they are considered to have failed, the share of active firms in the last yearsmay be underestimated until corrections are made. Caution is needed when comparing business over long time peri-ods, especially across economies, since mergers, acquisitions and restructuring – which cannot be measured with thedata available – may affect the comparison. The concept of firm size stability also needs to be interpreted with care, asfirms may grow or shrink but remain in the same size class, particularly when the median size of firms is very closeto the lower bound of the size class. For instance, in the case of start-ups with ten or fewer employees, the median firmhas only two employees in all three macro sectors. Stable firms contribute to job creation: among jobs created by start-ups over the three-year periods considered, 25% came from stable start-ups in the period starting in 2001, 29% in 2004and 27% in 2007.
20
30
40
50
60
10
0
USALU
XBEL HUN
FRA
BRANOR
AUTSWE
NLD ESP FIN ITA
Less than 3 years old 11 years old or more
Employees
40
60
80
100
20
0
USALU
XBEL HUN
FRA
SWEAUT
NORJP
N FIN NLD BRAES
P ITA
11 years old or more Less than 3 years old
Employees
Manufacturing Services
OECD SCIENCE, TECHNOLOGY AND INDUSTRY SCOREBOARD 2013 © OECD 2013 247

7. PARTICIPATING IN THE GLOBAL ECONOMY
5. Foreign affiliates
Foreign affiliates contribute to a host country’s interna-tional competitiveness in several ways. They provide accessto new markets and new technologies for domestic suppli-ers and buyers, generate knowledge spillovers for domesticfirms and typically invest a higher share of revenues in R&D.They traditionally account for a larger share of host coun-tries’ employment than their numbers would suggest,owing to their larger average size. In 2010, foreign affiliatesrepresented less than 5% of enterprises in most countries,but foreign-controlled employment varied between 10% and40%. Their share in value added is even larger than inemployment, partly because multinational enterprises aretypically active in capital- and scale-intensive industries. Inaddition, foreign affiliates display on average higher labourproductivity, even at the industry level. This may be due toreasons such as more capital-intensive production pro-cesses, greater efficiency and larger size.
Smaller countries, such as Ireland, the Czech Republic, theSlovak Republic and Hungary, have a stronger presence offoreign-owned firms. In France, the United States, Spainand Italy, foreign affiliates account for a significantlysmaller share of total activity.
In most OECD countries, the importance of foreign affiliatesis larger in manufacturing than in services. This is espe-cially true for central European countries, in which manywestern European companies have relocated productionover the past decade because of lower labour costs and theavailability of a skilled workforce. Nevertheless, in absoluteterms, foreign employment and value added are larger inservices than in manufacturing in several OECD countries,owing to the importance of services in national economiesbut also to the growing internationalisation of servicesduring the past decade.
Share of foreign affiliates in total enterprises, 2010By manufacturing and services
Source: OECD, Activity of Multinational Enterprises Database,www.oecd.org/sti/ind/amne.htm; Eurostat, Inward FATS Database, June2013. See chapter notes.
1 2 http://dx.doi.org/10.1787/888932904298
0 842 6 10 12 14%
POL
HUN
AUT
CHE
NOR
CZE
IRL
SVN
SWE
DNK
DEU
GBR
FIN
NLD
SVK
FRA
PRT
ESP
ITA
ManufacturingTotal business economy, except finance and insurance
Total services, except finance and insurance
Definitions
The term “foreign affiliate” is restricted to affiliatesunder foreign control. The notion of control impliesthe ability to appoint a majority of administratorsempowered to direct an enterprise and determine itsstrategic choices. In most cases, this ability can beexercised by a single investor holding more than 50%of the shares with voting rights. The notion of controlallows all of a company’s activities to be attributed tothe controlling investor. An investor is considered theinvestor of ultimate control if it is at the head of achain of companies and controls directly or indirectlyall the enterprises in the chain without itself beingcontrolled by any other company or individual.
OECD SCIENCE, TECHNOLOGY AND INDUSTRY SCOREBOARD 2013 © OECD 2013248

7. PARTICIPATING IN THE GLOBAL ECONOMY
5. Foreign affiliates
Share of national value added under control of foreign affiliates, 2010By manufacturing and services
Source: OECD, Activity of Multinational Enterprises Database, www.oecd.org/sti/ind/amne.htm; Eurostat, Inward FATS Database, June 2013. See chapternotes.
1 2 http://dx.doi.org/10.1787/888932904317
Share of national employment under control of foreign affiliates, 2010By manufacturing and services
Source: OECD, Activity of Multinational Enterprises Database, www.oecd.org/sti/ind/amne.htm; Eurostat, Inward FATS Database, June 2013. See chapternotes.
1 2 http://dx.doi.org/10.1787/888932904336
Measurability
The share of foreign-controlled affiliates in total enterprises is generally small. However, it may be overestimated ifnational surveys do not include micro or small firms.
The share of affiliates under foreign control in host country employment may reflect the importance of foreign directinvestment in maintaining or creating employment in a country. However, this information does not allow for evalu-ating net job creation due to foreign investment in the host country.
Value added is the portion of an enterprise’s output that originates within the enterprise itself, so it provides a bettermeasure than turnover. However, the share of affiliates under foreign control in host country value added may bebiased because production processes have increasingly become geographically fragmented.
%
30
40
50
60
70
80
90
20
10
0
IRL
HUNES
TCZE
LUX
SVKPOL
GBRSWE
NLD DNKAUT
NORDEU FIN ES
PPRT
SVNFR
A ITA USA
Manufacturing Total services, except finance and insurance Total business economy, except finance and insurance
%
30
40
50
60
20
10
0
CZEHUN
LUX
EST
POLIR
LSVK
SWENOR
DNKAUT
GBR FIN NLD SVNFR
AES
PCHE
DEU PRTISR ITA USA
Manufacturing Total services, except finance and insurance Total business economy, except finance and insurance
OECD SCIENCE, TECHNOLOGY AND INDUSTRY SCOREBOARD 2013 © OECD 2013 249

7. PARTICIPATING IN THE GLOBAL ECONOMY
6. Trade and global value chains
A country’s integration in the global economy can be sum-marised in terms of the imports of value added required tomeet its domestic final demand and produce its exports andin terms of the extent to which its domestic value added issustained by foreign demand, both directly, via exports offinal goods, and indirectly, via exports of intermediatessubsequently embodied in its partners’ exports.
Countries with relatively open and liberal trade regimes andhigh levels of foreign investment will typically have moreforeign content in both their exports and their domesticconsumption. A number of other factors affect a country’sintegration, and its specialisation, in global value chains(GVCs). Economies that are large, have significant mineralresources, or are relatively far from foreign markets andsuppliers, tend to have higher domestic (and lower foreign)value added content in their exports than others. Similarly,countries that specialise in activities at the beginning of thevalue chain (upstream), such as mining and agriculture, orthat specialise in services will typically have higher domesticvalue added content in their exports.
The increasing interdependency of the global economy isreflected in the general increase in the foreign content ofexports since the mid-1990s, interrupted only by a wide-spread fall between 2008 and 2009 when the impact of theglobal financial crisis on trade peaked.
A country’s integration in GVCs can also be seen in theshare of imported intermediate inputs embodied in itsexports following their incorporation in the production ofgoods and services. The indicator can demonstrate theimportance of imported products for a country’s exportperformance and the potential counterproductive effect oftariffs.
Trade linkages in global value chains, 2009Decomposition of gross imports and exports as a percentage of GDP
Source: OECD-WTO, Trade in Value Added (TiVA) Database, http://oe.cd/tiva, May 2013. StatLink contains more data. See chapter notes.
1 2 http://dx.doi.org/10.1787/888932904355
0 050 2575100 50 7525 100% %
BRA
JPN
USA
CHN
AUS
IND
FRA
ESP
TUR
IDN
ITA
MEX
GRC
NZL
RUS
PRT
GBR
ISR
DEU
ZAF
CAN
FIN
NLD
KOR
DNK
SWE
CHL
AUT
POL
NOR
ISL
CHE
CZE
BEL
SVN
EST
SVK
HUN
IRL
Domestic value added embodied in foreign final demand
Foreign value added embodied in domestic final demand
Exports of imported value added
Imported value added used in exports
EU27
Gross imports Gross exports
Definitions
Indicators of the origin of value added embodied infinal demand are principal outputs of the new OECD-WTO Trade in Value Added (TiVA) collection of indica-tors. Domestic value added embodied in foreign finaldemand shows how industries export value bothdirectly through exports of final goods and servicesand indirectly via exports of intermediates to othercountries which are then embodied in further exportsto final consumers abroad. It reflects how industries(upstream in a value chain) are connected to consum-ers in other countries even if no direct trade relation-ship exists. Similarly, foreign value added embodied indomestic final demand ultimately shows how industriesabroad are connected to consumers at home. Themeasure of foreign value added content of exportsconsiders the foreign content of gross exports as mea-sured “conventionally” and thus includes intermedi-ate as well as final goods and services.
OECD SCIENCE, TECHNOLOGY AND INDUSTRY SCOREBOARD 2013 © OECD 2013250
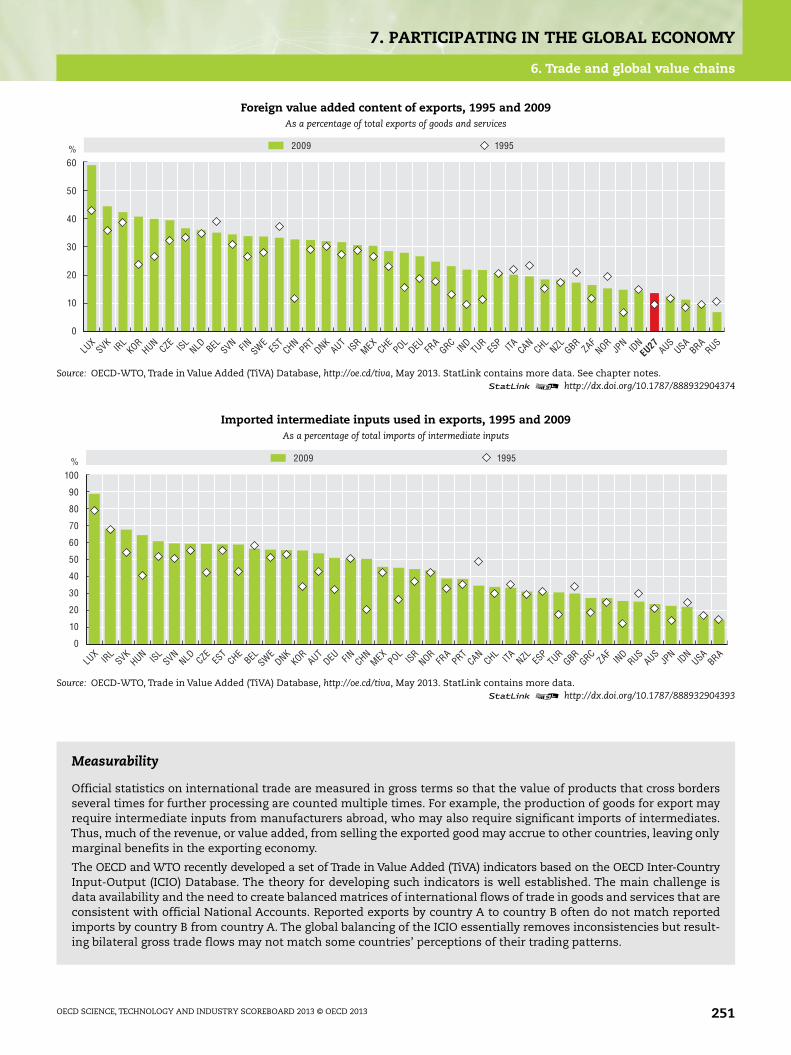
7. PARTICIPATING IN THE GLOBAL ECONOMY
6. Trade and global value chains
Foreign value added content of exports, 1995 and 2009As a percentage of total exports of goods and services
Source: OECD-WTO, Trade in Value Added (TiVA) Database, http://oe.cd/tiva, May 2013. StatLink contains more data. See chapter notes.1 2 http://dx.doi.org/10.1787/888932904374
Imported intermediate inputs used in exports, 1995 and 2009As a percentage of total imports of intermediate inputs
Source: OECD-WTO, Trade in Value Added (TiVA) Database, http://oe.cd/tiva, May 2013. StatLink contains more data.1 2 http://dx.doi.org/10.1787/888932904393
Measurability
Official statistics on international trade are measured in gross terms so that the value of products that cross bordersseveral times for further processing are counted multiple times. For example, the production of goods for export mayrequire intermediate inputs from manufacturers abroad, who may also require significant imports of intermediates.Thus, much of the revenue, or value added, from selling the exported good may accrue to other countries, leaving onlymarginal benefits in the exporting economy.
The OECD and WTO recently developed a set of Trade in Value Added (TiVA) indicators based on the OECD Inter-CountryInput-Output (ICIO) Database. The theory for developing such indicators is well established. The main challenge isdata availability and the need to create balanced matrices of international flows of trade in goods and services that areconsistent with official National Accounts. Reported exports by country A to country B often do not match reportedimports by country B from country A. The global balancing of the ICIO essentially removes inconsistencies but result-ing bilateral gross trade flows may not match some countries’ perceptions of their trading patterns.
%
30
40
50
60
20
10
0
2009 1995
LUX
SVK IRL
KORHUN
CZE ISLNLD BEL SVN FIN SWE
EST
CHNPRT
DNKAUT
ISRMEX
CHEPOL
DEU FRA
GRCIN
DTUR
ESP ITA CAN
CHLNZL GBR
ZAFNOR
JPN
IDN
EU27AUS
USABRA
RUS
%
40
60
30
50
80
70
90
100
20
10
0
2009 1995
LUX IR
LSVK
HUN ISLSVN
NLD CZEES
TCHE
BELSWE
DNKKOR
AUTDEU FIN CHN
MEXPOL
ISRNOR
FRA
PRTCAN
CHL ITA NZL ESP
TURGBR
GRCZAF
IND
RUSAUS
JPN
IDN
USABRA
OECD SCIENCE, TECHNOLOGY AND INDUSTRY SCOREBOARD 2013 © OECD 2013 251
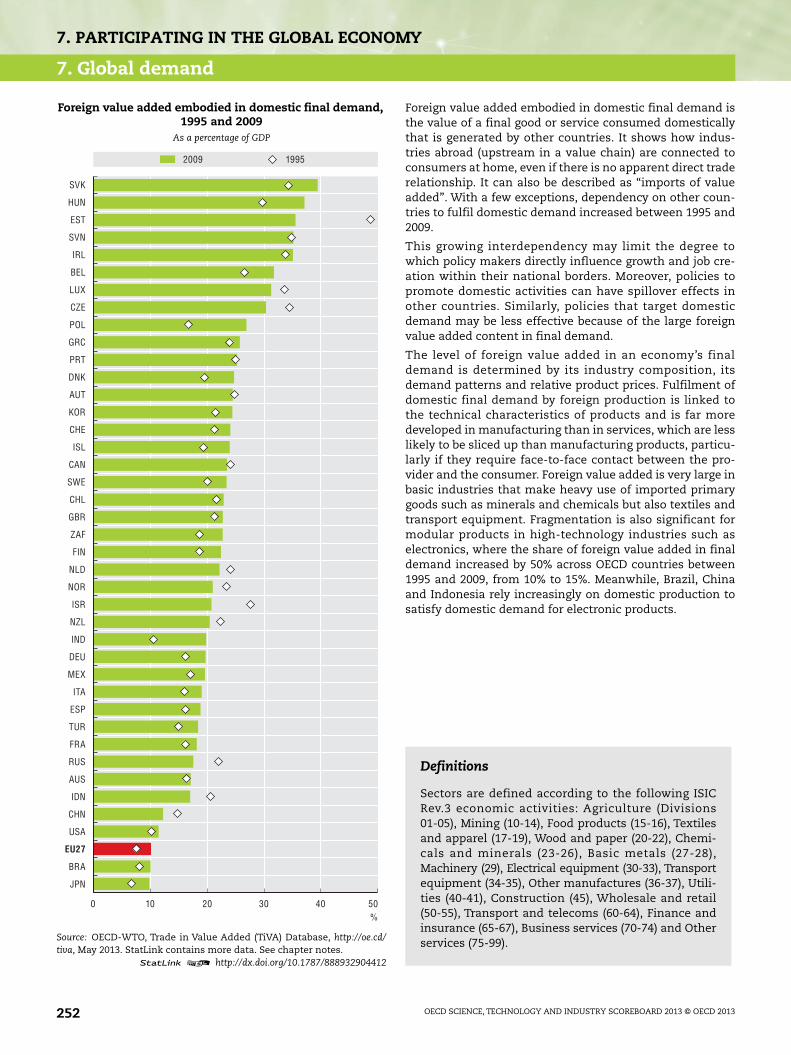
7. PARTICIPATING IN THE GLOBAL ECONOMY
7. Global demand
Foreign value added embodied in domestic final demand isthe value of a final good or service consumed domesticallythat is generated by other countries. It shows how indus-tries abroad (upstream in a value chain) are connected toconsumers at home, even if there is no apparent direct traderelationship. It can also be described as “imports of valueadded”. With a few exceptions, dependency on other coun-tries to fulfil domestic demand increased between 1995 and2009.
This growing interdependency may limit the degree towhich policy makers directly influence growth and job cre-ation within their national borders. Moreover, policies topromote domestic activities can have spillover effects inother countries. Similarly, policies that target domesticdemand may be less effective because of the large foreignvalue added content in final demand.
The level of foreign value added in an economy’s finaldemand is determined by its industry composition, itsdemand patterns and relative product prices. Fulfilment ofdomestic final demand by foreign production is linked tothe technical characteristics of products and is far moredeveloped in manufacturing than in services, which are lesslikely to be sliced up than manufacturing products, particu-larly if they require face-to-face contact between the pro-vider and the consumer. Foreign value added is very large inbasic industries that make heavy use of imported primarygoods such as minerals and chemicals but also textiles andtransport equipment. Fragmentation is also significant formodular products in high-technology industries such aselectronics, where the share of foreign value added in finaldemand increased by 50% across OECD countries between1995 and 2009, from 10% to 15%. Meanwhile, Brazil, Chinaand Indonesia rely increasingly on domestic production tosatisfy domestic demand for electronic products.
Foreign value added embodied in domestic final demand,1995 and 2009
As a percentage of GDP
Source: OECD-WTO, Trade in Value Added (TiVA) Database, http://oe.cd/tiva, May 2013. StatLink contains more data. See chapter notes.
1 2 http://dx.doi.org/10.1787/888932904412
0 2010 30 40 50%
2009 1995
SVK
HUN
EST
SVN
IRL
BEL
LUX
CZE
POL
GRC
PRT
DNK
AUT
KOR
CHE
ISL
CAN
SWE
CHL
GBR
ZAF
FIN
NLD
NOR
ISR
NZL
IND
DEU
MEX
ITA
ESP
TUR
FRA
RUS
AUS
IDN
CHN
USA
BRA
JPN
EU27
Definitions
Sectors are defined according to the following ISICRev.3 economic activities: Agriculture (Divisions01-05), Mining (10-14), Food products (15-16), Textilesand apparel (17-19), Wood and paper (20-22), Chemi-cals and minerals (23-26), Basic metals (27-28),Machinery (29), Electrical equipment (30-33), Transportequipment (34-35), Other manufactures (36-37), Utili-ties (40-41), Construction (45), Wholesale and retail(50-55), Transport and telecoms (60-64), Finance andinsurance (65-67), Business services (70-74) and Otherservices (75-99).
OECD SCIENCE, TECHNOLOGY AND INDUSTRY SCOREBOARD 2013 © OECD 2013252

7. PARTICIPATING IN THE GLOBAL ECONOMY
7. Global demand
Foreign value added embodied in domestic final demand, by sector, OECD average, 1995 and 2009As a percentage of final expenditure on sectors’ products
Source: OECD Inter-Country Input-Output (ICIO) Database, May 2013. StatLink contains more data.1 2 http://dx.doi.org/10.1787/888932904431
Foreign value added embodied in domestic final demand for electrical equipment, 1995 and 2009As a percentage of final expenditure on electrical equipment
Source: OECD Inter-Country Input-Output (ICIO) Database, May 2013. StatLink contains more data. See chapter notes.1 2 http://dx.doi.org/10.1787/888932904450
Measurability
In an input-output framework of n1 countries and n2 industries, value added from country a embodied in foreign finaldemand can be shown to be equal to
v (I-A)-1y
Where, if n = n1 × n2, v is a 1 × n vector with value added to output ratios in industry i of country a, zero otherwise; y isa 1 × n vector of final demand with zero entries for the final demand of country a; and A is an input-output coefficientmatrix with dimension n × n.
A matrix can be built showing the inputs from industry i of country a required to produce outputs from industry j incountry b for domestic consumption or export. Aggregating can yield indicators of domestic value added in foreignfinal demand and foreign value added embodied in domestic final demand as presented here.
A “proportionality” assumption is used when official data on imports by industry are unavailable. It assumes that fora given product, the proportion of intermediates purchased by an industry from abroad is equal to that of imports tototal domestic demand in that product. Where this assumption is used, refinements are introduced by using estimatesof bilateral trade that differentiate between imports of goods for intermediate use and for final demand.
%
15
20
10
5
0
2009 1995
Agricu
lture
Mining
Food
prod
ucts
Texti
les an
d app
arel
Wood a
nd pa
per
Chemica
ls an
d mine
rals
Basic
metals
Machin
ery
Electr
ical e
quipm
ent
Trans
port
equip
ment
Other m
anufa
ctures
Utilitie
s
Constr
uctio
n
Wholes
ale an
d reta
il
Trans
port
and t
eleco
ms
Finan
ce an
d ins
uran
ce
Busine
ss se
rvice
s
Other s
ervice
s
%
15
30
25
20
10
5
0
2009 1995
EST
HUNLU
X ISLSVN
SWENLD CHL
PRTCZE
BEL FIN FRA
CANSVK
AUTGBR
NORGRC
POLAUS
MEX IRL
DNKES
PCHE
ISRNZL TUR
ZAFDEU ITA RUS
KORIN
DUSA
IDN
BRACHN
JPN
OECD
OECD SCIENCE, TECHNOLOGY AND INDUSTRY SCOREBOARD 2013 © OECD 2013 253

7. PARTICIPATING IN THE GLOBAL ECONOMY
8. Trade and jobs
As global value chains have proliferated, firms have special-ised in stages of production. This has increased dependen-cies among economies, with job creation increasinglydetermined by a country’s ability to access foreign markets.Traditional statistics do not show the extent of these inter-dependencies. In particular, they do not reveal how con-sumers in one country drive and sustain jobs in countriesfurther up the value chain. Experimental and preliminaryindicators, based on the OECD’s Inter-Country Input-Output(ICIO) Database, show that these relationships are signifi-cant and growing.
Preliminary estimates suggest that in 2008, 20% to 45% ofbusiness sector jobs in most European economies were sus-tained by final consumers in foreign markets. Compared to1995, these shares increased in all countries; in Germany itrose more than 10%. Greece and Spain had the lowestshares in Europe. Shares are smaller in Japan and the UnitedStates owing to their relatively large size and lower depen-dency on exports/imports. Nonetheless, initial estimates for2008 suggest that over 10 million US business sector jobswere sustained by foreign consumers.
Brazil, China and India saw significant increases in thenumber of jobs sustained by foreign demand. By 2008, over25% of business sector jobs in China were sustained by for-eign demand. Preliminary indicators also reveal the impor-tance of emerging markets for OECD countries. In theUnited States for example, over a fifth of all jobs sustainedby foreign demand in 2008 can be attributed to final con-sumers in East and Southeast Asia.
In OECD countries, most jobs sustained by foreign demandare in manufacturing; services contribute from 20% to 40%.This is less than the contribution of the services sector tovalue added in exports, partly owing to higher labour pro-ductivity in services exposed to global markets.
Jobs in the business sector sustained by foreign finaldemand, 1995 and 2008
As a percentage of total business sector employment
Source: OECD, Inter-Country Input-Output (ICIO) Database, May 2013; EC,World Input-Output Database (WIOD), April 2012.
1 2 http://dx.doi.org/10.1787/888932904469
0 2010 40 6030 50 70%
2008 1995
LUX
EST
IRL
SVK
HUN
BEL
SVN
CZE
CHE
SWE
AUT
DNK
NLD
NOR
FIN
DEU
POL
KOR
ITA
CHN
PRT
CAN
FRA
GBR
RUS
TUR
ESP
GRC
IND
MEX
IDN
JPN
AUS
USA
BRA
Definitions
Jobs refer to the total number of persons employed.Final demand refers to the sum of final consumptionexpenditure by households, government and non-profitinstitutions serving households (NPISHs) and gross fixedcapital expenditures as defined in the 1993 System ofNational Accounts (SNA 93).
The aggregate sectors are based on ISIC Rev.3 activi-ties. The business sector is defined as Divisions 10 to74, i.e. total economy excluding Agriculture, forestryand fishing (Divisions 01-05), Public administration(75), Education (80), Health (85) and Other community,social and personal services (90-95). Primary goodsconsists of Divisions 01-05, 10-14; Material manufac-turing: 23-25, 26, 27-28; Machinery and equipment:29-33, 34-35; Other manufacturing: 15-16, 17-19, 20,21-22 and 36; Trade and transportation: 50-64; Finan-cial and business services: 65-74; Other services:40-41, 45 and 75-95.
OECD SCIENCE, TECHNOLOGY AND INDUSTRY SCOREBOARD 2013 © OECD 2013254

7. PARTICIPATING IN THE GLOBAL ECONOMY
8. Trade and jobs
Jobs sustained by foreign final demand, by sector, 2008As a percentage of total jobs embodied in foreign final demand
Source: OECD, Inter-Country Input-Output (ICIO) Database, May 2013. See chapter notes.1 2 http://dx.doi.org/10.1787/888932904488
Jobs sustained by foreign final demand, by region of demand, 2008As a percentage of total jobs embodied in foreign final demand
Source: OECD, Inter-Country Input-Output (ICIO) Database, May 2013. See chapter notes.1 2 http://dx.doi.org/10.1787/888932904507
Measurability
Calculations of jobs sustained by foreign final demand are similar to those used to estimate domestic value added inforeign final demand except that a vector, e, of jobs to output ratios is applied (rather than a vector, v, of value addedto output ratios): e (I-A)-1y.
Estimates derived using an input-output accounting framework are sensitive to certain assumptions, mainly thatexporting firms have the same labour productivity as firms producing goods and services for domestic markets andthe same share of imports, in relation to output, as domestic firms.
However, exporting firms appear to have higher labour productivity and a higher share of imports for a given output.The results presented may therefore be biased upwards. Efforts are under way to reduce the size of these biases.
Three other issues are worth mentioning. The jobs estimates are not full-time equivalent measures. They relate tojobs sustained rather than created as they may have previously served domestic consumers. The estimates do notreflect jobs sustained by distributors through sales of imported final goods or upstream jobs created (e.g. via transportand storage industries involved in distribution channels for these goods).
%
80
100
60
20
40
0
AUTBEL CHE
CZEDEU DNK
ESP
EST FIN FR
AGRC
HUN ITA JPN
LUX
NLD NORSVK
SVNSWE
USA
Trade and transportation
Primary goods
Financial and business services
Material manufacturing
Other services
Machinery and equipment Other manufacturing
%
80
100
60
20
40
0
AUTBEL CHE
CZEDEU DNK
ESP
EST FIN FR
AGRC
HUN ITA JPN
LUX
NLD NORSVK
SVNSWE
USA
ASEANNAFTA Rest of the WorldEU12 EU15 East Asia
OECD SCIENCE, TECHNOLOGY AND INDUSTRY SCOREBOARD 2013 © OECD 2013 255

7. PARTICIPATING IN THE GLOBAL ECONOMY
9. Trade and household consumption
A focus on household consumption reveals that in mostOECD countries shares of foreign value added are higherfor durable goods (such as machinery and equipment)than for non-durable goods (food, textiles, chemicals,etc.). For services consumed by households, foreign con-tent is relatively low, averaging below 10% in OECD coun-tries.
Services account for over three-quarters of householdspending in many OECD countries. Even in emergingcountries, where much household spending is for non-durable goods, over half is for services. As the share ofservices in household budgets is dominated by regularspending on domestic services, including housing, theforeign value added content in services is, overall, rela-tively low.
Although durable goods have high foreign value addedcontent, households consume many of these, such ascars, consumer electronics and kitchen appliances, onlyintermittently. They therefore represent a small share ofa country’s aggregate household expenditure. Most dura-ble goods are consumed by businesses and government asinvestment.
On average, about a sixth of OECD-area household con-sumption consists of foreign value added; in many coun-tries it represents between 20% and 30%. In large OECDeconomies, such as Japan and the United States, theshare may be as low as 10-12%. In some emerging econo-mies such as Brazil, China and India, household con-sumption is also dominated by locally sourced goods andservices. The origin of the foreign content is broadlyregional, with European households mainly consumingforeign value added from other European countries andNorth American households drawing on value addedfrom their neighbours. In 2009 China accounted for lessthat 2% of value added in household consumption inmajor OECD economies, including Japan and the UnitedStates.
Foreign value added in household consumption, byproduct category, 2009
As a percentage of total household consumption of the product category
Source: OECD, Inter-Country Input-Output (ICIO) Database, May 2013.StatLink contains more data.
1 2 http://dx.doi.org/10.1787/888932904526
0 50 100%
0 25 50%
BRA
IDN
JPN
CHN
IND
RUS
USA
KOR
ESP
DEU
AUS
ZAF
TUR
ITA
GBR
NZL
MEX
CAN
POL
CZE
GRC
IRL
FRA
BEL
CHL
NOR
ISR
DNK
SWE
FIN
HUN
SVK
PRT
NLD
CHE
SVN
EST
AUT
ISL
LUX
0 50 100%
Durable goods Non-durable goods
Services
OECD
Definitions
Household final consumption expenditure covers allpurchases made by resident households to meet theireveryday needs: food, clothing, housing services,energy, transport, durable goods (notably cars),health, leisure and other services. The concept usedhere covers direct household expenditure and doesnot include those (individual) expenditures of generalgovernment and non-profit institutions servinghouseholds (NPISHs) that directly benefit households,such as health care and education.
Product groups are defined according to ISIC Rev.3.Durable goods includes Divisions 20, 26, 27-28, 29-33and 34-35; Non-durable goods: 01-05, 10-14, 15-16,17-19, 21-22, 23-25 and 36; and Services: 45, 50-55,60-64, 65-67, 70-74, 75-95.
OECD SCIENCE, TECHNOLOGY AND INDUSTRY SCOREBOARD 2013 © OECD 2013256

7. PARTICIPATING IN THE GLOBAL ECONOMY
9. Trade and household consumption
Household consumption, by type of product, 2009As a percentage of total household consumption
Source: OECD, Inter-Country Input-Output (ICIO) Database, May 2013. StatLink contains more data.1 2 http://dx.doi.org/10.1787/888932904545
Foreign value added in household consumption, by source region, 2009As a percentage of total household consumption
Source: OECD, Inter-Country Input-Output (ICIO) Database, May 2013. StatLink contains more data. See chapter notes.1 2 http://dx.doi.org/10.1787/888932904564
Measurability
Timeliness is a major constraint when developing indicators based on an input-output framework. Given the heavydata requirements, national benchmarked input-output (I-O) tables are typically produced every 5 years, often with alag of 4 to 5 years. Many countries produce more timely annual Supply-Use tables (SUTs), especially in Europe, andthese can be used to produce estimated input-output tables. As countries use different benchmark years, someinterpolation and extrapolation may be required to develop a set of harmonised input-output tables covering commonyears for a maximum number of countries. A consequence is that the OECD Inter-Country Input-Output (ICIO) Data-base, used to derive the indicators in this and preceding sections, currently only covers the years 1995, 2000, 2005, 2008and 2009. Efforts are under way to improve the timeliness of estimates in OECD’s I-O framework, but in the meantime,as certain economic structures do not change rapidly, the figures for 2008 and 2009 can provide some insights into howcountries fit into the global economy today.
%
80
100
60
20
40
0
90
70
30
50
10
IRL
NLD USAJP
NNZL ISR
SWECHE
DNKGBR
FRA
AUS ISLAUT FIN NOR
KORPRT
ESP
DEU BEL CANGRC
CZE ITA SVNPOL
EST
SVKCHL
MEXZAF
BRALU
XHUN
TURRUS
CHNIN
DID
N
Durable goods Non-durable goods Services
OECD
%
50
40
60
30
10
20
0
LUX IR
LES
TSVK
HUNSVN
BEL CZEDNK
NORNLD ISL
AUTSWE
CHECHL
POLKOR FIN PRT
GBRCAN
GRCRUS
ZAFISR
DEU ITA FRA
ESP
NZL AUSMEX
TURID
NIN
DCHN
USAJP
NBRA
OtherEU27 NAFTA East and Southeast Asia China
OECD
OECD SCIENCE, TECHNOLOGY AND INDUSTRY SCOREBOARD 2013 © OECD 2013 257

7. PARTICIPATING IN THE GLOBAL ECONOMY
Notes and References
7.1 Employment
General notes:
Employment in services, 2000 and 2011 and;
Employment in knowledge-intensive “market” services, 2000 and 2011
Australia, Iceland and Turkey: Labour Force Survey (LFS) data by industry are used in the absence of employment by activitystatistics published in a National Accounts (SNA) context.
Additional notes:
On an industry-based definition, the distinction between market and public services is an approximate one. In OECD coun-tries private education and health services are available to varying degrees while some transport and postal services remainin the public realm.
For Japan, the division of total services employment into market-sector and public-sector employment is an OECD estimate.
For Chile and Israel, estimates are based on SNA employment data provided to the OECD according to ISIC Rev.3 Divisions50-74 and 75-99.
Employment in high- and medium-high-technology manufacturing, 2000 and 2011
For Germany, Poland, Portugal and Sweden, data refer to 2010.
For Israel, estimates based on SNA employment data provided to the OECD according to ISIC Rev.3, Divisions 24 and 29-35.
7.2 Services-manufacturing linkages
Services-related occupations in manufacturing, 2002 and 2012
For the United States, data refer to March 2012, based on the Current Population Survey (CPS). CPS data were converted fromUS 2010 census codes to 1-digit ISCO-08 major groups via published correspondences with US 2010 Standard OccupationalClassification (SOC) codes.
Cyprus
The following note is included at the request of Turkey:
“The information in this document with reference to ‘Cyprus’ relates to the southern part of the Island. There is nosingle authority representing both Turkish and Greek Cypriot people on the Island. Turkey recognizes the TurkishRepublic of Northern Cyprus (TRNC). Until a lasting and equitable solution is found within the context of the UnitedNations, Turkey shall preserve its position concerning the ‘Cyprus issue’.”
The following note is included at the request of all the European Union Member States of the OECD and the EuropeanUnion:
“The Republic of Cyprus is recognised by all members of the United Nations with the exception of Turkey. The infor-mation in this document relates to the area under the effective control of the Government of the Republic of Cyprus.”
Israel
“The statistical data for Israel are supplied by and under the responsibility of the relevant Israeli authorities or thirdparty. The use of such data by the OECD is without prejudice to the status of the Golan Heights, East Jerusalem andIsraeli settlements in the West Bank under the terms of international law.
“It should be noted that statistical data on Israeli patents and trademarks are supplied by the patent and trademarkoffices of the relevant countries.”
OECD SCIENCE, TECHNOLOGY AND INDUSTRY SCOREBOARD 2013 © OECD 2013258

7. PARTICIPATING IN THE GLOBAL ECONOMY
Notes and References
7.3 Firm size
General notes for all figures:
Data refer to ISIC Rev.4 Divisions 05-82, excluding 64-66 (Financial and insurance activities). For Israel, data refer to ISICRev.3 Divisions 10-74, excluding 65-67 (Financial intermediation).
For Australia, data refer to the fiscal year (1 July -30 June).
For Israel and Turkey, data refer to 2009.
For Japan, data refer to 2009. Establishments are the unit of measurement.
Additional notes:
Number of enterprises by size class, 2010
For Australia, the size class “20-49” refers to “20-199” and the size class “250+” refers to “200+”.
For Canada, data refer to 2009.
For Japan, data refer the following size classes: 10-49, 50-299 and 300+.
For Korea, data include financial services and refer to the following size classes: 10-49, 50-299, 300+. Establishments are theunit of measurement.
For Mexico, data refer to 2008 and to the following size classes: 11-50, 51-250 and 251+. Establishments are the unit of mea-surement.
For New Zealand and the Russian Federation, data refer to employees.
For the Russian Federation, data refer to ISIC Rev.3 Divisions 10-74, excluding 65-67 (Financial intermediation).
For Turkey, data for the size class 10-19 are not available.
For the United States, data include the self-employed and refer to the following size classes: 10-19, 20-99, 100-499 and 500+.
Employment by enterprise by size class, 2010 and;
Value added by enterprise by size class, 2010
For Australia, data refer to the following size classes: 0-19, 20-199 and 200+.
For Greece, data refer to 2007.
For Japan, data refer to the following size classes: 1-9, 10-49, 50-299 and 300+.
For Turkey, the size class 1-9 corresponds to 0-19.
Employment by enterprise by size class, 2010
Data refer to the number of persons employed, except for New Zealand, the Russian Federation and the United States,which use number of employees and therefore exclude working-proprietors without employees.
For Mexico, data refer to 2008 and to the following size classes: 0-10, 11-50, 51-250 and 251+. Establishments are the unit ofmeasurement.
For the United States, data include information from the Nonemployer Statistics of the Census Bureau and refer to the fol-lowing size classes: 1-9, 10-19, 20-99, 100-499 and 500+.
Value added by enterprise by size class, 2010
Data refer to value added at factor costs in EU countries and value added at basic prices for other countries.
For Denmark, Germany, Ireland and Norway, data refer to 2009.
For Israel, data refer to the following size classes: 1-9, 10-19, 20-49 and 50+.
For Korea, data include financial services and refer to 2006 and to the following size classes: 1-9, 10-49, 50-99, 100-299, 300+.Establishments are the unit of measurement.
For Mexico, data refer to 2003 and the size class 1-9 corresponds to 1-10.
OECD SCIENCE, TECHNOLOGY AND INDUSTRY SCOREBOARD 2013 © OECD 2013 259
7. PARTICIPATING IN THE GLOBAL ECONOMY
Notes and References
7.4 Firm dynamics
General notes for all figures:
Calculations are based on preliminary results from the OECD DYNEMP project.
Owing to methodological differences, figures may differ from those officially published by national statistical offices.
Establishments and firms that appear only for one year are excluded.
Mergers and acquisitions are not taken into account in determining firm age and firm exit.
For Austria, data are at the establishment level.
Additional notes:
Three-year survival and growth performance of micro start-ups, 2001-04, 2004-07, 2007-10
For New Zealand, data refer to 2006 instead of 2007.
Average size of firms less than 3 years old and 11 years old or more, 2001-10
For France, data refer to the 2001 and 2004 cohorts.
Average size of firms less than 3 years old and 11 years old or more, by sector, 2001-10
For France, data refer to the 2001 and 2004 cohorts.
For Japan, data are at the establishment level and refer to the 2001 and 2006 cohorts for the manufacturing sector only.
7.5 Foreign affiliates
General notes for all figures:
For Finland, total services excludes real estate.
For Denmark and the United Kingdom, data refer to 2009.
For Poland, data refer to enterprises with 9 or more persons employed.
Additional notes:
Share of foreign affiliates in total enterprises, 2010
For Switzerland, financial intermediation and community, social and personal services are included.
Share of national value added under control of foreign affiliates, 2010 and;
Share of national employment under control of foreign affiliates, 2010
For Estonia, data refer to enterprises with 20 or more persons employed.
Share of national value added under control of foreign affiliates, 2010
For the United States, financial intermediation and community, social and personal services are included.
Share of national employment under control of foreign affiliates, 2010
For Switzerland and the United States, financial intermediation and community, social and personal services are included.
For Israel, data refer to 2009.
For Switzerland, manufacturing includes mining and construction and part of the data refers to minority and majority for-eign-controlled affiliates.
OECD SCIENCE, TECHNOLOGY AND INDUSTRY SCOREBOARD 2013 © OECD 2013260

7. PARTICIPATING IN THE GLOBAL ECONOMY
Notes and References
7.6 Trade and global value chains
General note:
Trade linkages in global value chains, 2009 and;
Foreign value added content of exports, 1995 and 2009
EU27 represents the European Union prior to 1 July 2013 and the data cover non-EU content of EU exports.
7.7 Global demand
Foreign value added embodied in domestic final demand, 1995 and 2009
EU27 represents the European Union prior to 1 July 2013 and the data cover non-EU content of EU final demand.
Foreign value added embodied in domestic final demand for electrical equipment, 1995 and 2009
Electrical equipment is defined according to ISIC Rev.3 Divisions 30-33.
7.8 Trade and jobs
Jobs sustained by foreign final demand, by region of demand, 2008
ASEAN includes Brunei Darussalam, Cambodia, Indonesia, Malaysia, Philippines, Singapore, Thailand and Viet Nam.
East Asia includes Japan, Korea, China, Chinese Taipei and Hong Kong, China.
EU12 includes Bulgaria, the Czech Republic, Cyprus, Estonia, Hungary, Latvia, Lithuania, Malta, Poland, Romania, the SlovakRepublic and Slovenia.
EU15 includes Austria, Belgium, Denmark, Finland, France, Germany, Greece, Ireland, Italy, Luxembourg, the Netherlands,Portugal, Spain, Sweden and the United Kingdom.
NAFTA includes Canada, Mexico and the United States.
7.9 Trade and household consumption
Foreign value added in household consumption, by source region, 2009
The region East and Southeast Asia includes Brunei Darussalam; Cambodia; Chinese Taipei; Hong Kong, China; Indonesia;Japan; Korea; Malaysia; the Philippines; Singapore; Thailand; and Viet Nam.
References
Ahmad, N. (2006), “A Proposed Framework For Business Demography Statistics”, OECD Statistics Working Papers, 2006/3.Doi: http://dx.doi.org/10.1787/145777872685.
Meng, B., Y. Fang and N. Yamano (2012), “Measuring Global Value Chains and Regional Economic Integration: An International Input-Output Approach”, IDE Discussion Papers, No. 362.
Miller, R.E. and P.D. Blair (2009), Input-Output Analysis: Foundations and Extension, Cambridge University Press, United Kingdom.
Miroudot, S. and N. Yamano (2013), “Trade in Value-Added: Concepts, Methodologies and Challenges”, in A. Mattoo, Z. Wang andS. Wei (eds.), Trade in Value-Added: Developing New Measures of Cross-Border Trade, The World Bank, Washington, DC.
OECD (2010), Measuring Globalisation: OECD Economic Globalisation Indicators 2010, OECD Publishing.Doi: http://dx.doi.org/10.1787/9789264084360-en.
OECD (2010), Structural and Demographic Business Statistics, OECD Publishing. Doi: http://dx.doi.org/10.1787/9789264072886-en.
OECD (2011), Science, Technology and Industry Scoreboard 2011, OECD Publishing. Doi: http://dx.doi.org/10.1787/sti_scoreboard-2011-en.
OECD (2013), Entrepreneurship at a Glance 2013, OECD Publishing. Doi: http://dx.doi.org/10.1787/entrepreneur_aag-2013-en.
OECD (2013), Interconnected Economies: Benefiting from Global Value Chains, OECD Publishing.Doi: http://dx.doi.org/10.1787/9789264189560-en.
OECD (2013), National Accounts at a Glance, OECD Publishing. Doi: http://dx.doi.org/10.1787/na_glance-2013-en.
OECD-WTO (2012), “Trade in Value Added: Concepts, Methodologies and Challenges” (OECD-WTO, online document), www.oecd.org/sti/ind/49894138.pdf.
OECD SCIENCE, TECHNOLOGY AND INDUSTRY SCOREBOARD 2013 © OECD 2013 261

OECD Science, Technology and Industry Scoreboard 2013
© OECD 2013
Data sources
Akamai, www.akamai.com/html/technology/dataviz3.html.
Bureau van Dijk Electronic Publishing, ORBIS© Database.
CISCO, Visual Networking Index (VNI) , www.cisco.com/en/US/netso l /ns827/
networking_solutions_sub_solution.html.
Elsevier, Scopus Custom Data, www.scopus.com/home.url.
EU KLEMS Database, www.euklems.net/index.html.
European Patent Office, Worldwide Patent Statistical Database, www.epo.org/searching/
subscription/raw/product-14-24.html.
European Private Equity and Venture Capital Association (EVCA), PEREP_Analytics™.
Eurostat, Annual Detailed Enterprise statistics for services.
Eurostat, Community Innovation Survey (CIS) Database, http://epp.eurostat.ec.europa.eu/
portal/page/portal/science_technology_innovation/data/database.
Eurostat, European Union Labour Force Survey, http://epp.eurostat.ec.europa.eu/portal/page/
portal/labour_market/introduction.
Eurostat, European Statistics, http://epp.eurostat.ec.europa.eu/portal/page/portal/statistics/
search_database.
Eurostat, Inward FATS Database, http://epp.eurostat.ec.europa.eu/portal/page/portal/
european_business/data/database.
INTAN-Invest, Cross-Country Intangible Investment Database, www.intan-invest.net.
International Labour Organization, Laborsta Database, www.ilo.org/empelm/pubs/
WCMS_114060/lang--en/index.htm.
International Monetary Fund, Balance of Payments Database, www.imf.org/external/data.htm.
International Telecommunications Union (ITU), World Telecommunication/ICT indicators
Database, www.itu.int/pub/D-IND.
Japan Patent Office, Trademark Data.
O*NET OnLine, United States Occupational Information Network, www.onetonline.org.
OECD, Activity of Multinational Enterprises (AMNE) Database, www.oecd.org/sti/ind/amne.htm.
OECD, ANBERD Database, www.oecd.org/sti/anberd.
OECD, Annual National Accounts (SNA) Database, www.oecd.org/std/ana.
OECD, Broadband Portal, www.oecd.org/sti/ict/broadband.
OECD, DYNEMP data collection (internal use only).
OECD, Education Database, www.oecd.org/education/database.htm.
OECD, ICT Database.
263

DATA SOURCES
OECD, Key Biotechnology Indicators, http://oe.cd/kbi.
OECD, Key Nanotechnology Indicators, http://oe.cd/kni.
OECD, Main Science and Technology Indicators Database, www.oecd.org/sti/msti.
OECD, Patent Database, www.oecd.org/sti/ipr-statistics.
OECD, Product Market Regulation Database, www.oecd.org/economy/pmr.
OECD, Productivity Database, www.oecd.org/std/productivity-stats.
OECD, Quarterly National Accounts Database, www.oecd.org/std/qna.
OECD, REGPAT Database, www.oecd.org/sti/ipr-statistics.
OECD, Research and Development Database, www.oecd.org/sti/rds.
OECD, STAN Bilateral Trade Database by Industry and End Use (BTDIxE), www.oecd.org/sti/btd.
OECD, Inter-Country Input-Output Database, www.oecd.org/sti/inputoutput.
OECD, Short-Term Labour Market Statistics Database.
OECD, Structural Analysis (STAN) Database, www.oecd.org/sti/stan.
OECD, Survey of Adult Skills Database, Programme for the International Assessment of
Adult Competencies (PIAAC), www.oecd.org/site/piaac/.
OECD, Tax Database, Corporate and Capital Income Taxes, www.oecd.org/tax/tax-policy/
oecdtaxdatabase.htm.
OECD, Technology Balance of Payments Database (internal use only).
OECD-WTO, Trade in Value Added (TiVA) Database, www.oecd.org/trade/valueadded.
OECD, Trade in Services Database, www.oecd.org/std/trade-services.
OECD/UNESCO Institute for Statistics/Eurostat data collection on careers of doctorate
holders 2010 (internal use only), www.oecd.org/sti/cdh.
OHIM, Community Trademark Database, CTM Download.
OHIM, Registered Community Design Database, RCD Download.
PricewaterhouseCoopers (PCW), MoneyTreeTM report, www.pwcmoneytree.com.
Potaroo.net, Reports for OECD member Countries on Internet Addressing and Routing,
www.potaroo.net/reports/oecd.
SCImago Journal and Country Rank, www.scimagojr.com.
SCImago Institutions Rankings, www.scimagoir.com.
Source Normalized Impact per Paper (SNIP2) Database, www.journalmetrics.com.
Teligen, a division of Strategy Analytics Ltd, www.strategyanalytics.com.
Thomson Reuters, Derwent World Patents Index Database, http://thomsonreuters.com/
derwent-world-patents-index.
Thomson Reuters, National Venture Capital Association, www.nvca.org.
Thomson Reuters, Web of Science Database, thomsonreuters.com/web-of-science.
United Nations Conference on Trade and Development (UNCTAD), UNCTADstat Database,
unctadstat.unctad.org.
United Nations Conference on Trade and Development (UNCTAD), FDI/TNC Database,
www.unctad.org/fdistatistics.
OECD SCIENCE, TECHNOLOGY AND INDUSTRY SCOREBOARD 2013 © OECD 2013264

DATA SOURCES
United Nations Statistical Division (UNSD), National Accounts Main Aggregates Database,
unstats.un.org/unsd/snaama/Introduction.asp.
United States Bureau of Labour Statistics, Current Population Survey (CPS), www.bls.gov/cps.
United States Internal Revenue Service, Statistics of Income.
United States Patent and Trademark Office Bulk Downloads: Trademark Application Text
hosted by Google.
United States Patent and Trademark Office, Trademark Electronic Search System (TESS),
http://tess2.uspto.gov.
US Census Bureau, United States Current Population Survey.
WIPO Statistics Database, www.wipo.int/ipstats/en.
World Bank, Doing Business Database, doingbusiness.org.
World Bank, World Development Indicators Database, data.worldbank.org/data-catalog/
world-development-indicators.
World Input-Output Database (WIOD), www.wiod.org/database.
OECD SCIENCE, TECHNOLOGY AND INDUSTRY SCOREBOARD 2013 © OECD 2013 265


LIST OF FIGURES
List of figures
1. KNOWLEDGE ECONOMIES: TRENDS AND FEATURES . . . . . . . . . . . . . . . . . . . . . . . . . . 17
Sources of growth and the crisis. . . . . . . . . . . . . . . . . . . . . . . . . . . . . . . . . . . . . . . . . . . . . . 18
1. Labour productivity growth based on hours worked, total economy level, 2001-12 18
2. Growth in GDP per capita and GDP per person employed in the BRIICS
and the OECD, 2007-09 and 2009-12 . . . . . . . . . . . . . . . . . . . . . . . . . . . . . . . . . . . . . 18
3. Job recovery across socio-economic groups, 2008 Q1-2012 Q4 . . . . . . . . . . . . . . . 19
4. Harmonised unemployment rates, OECD, euro area, United States and Japan,
July 2008-April 2013 . . . . . . . . . . . . . . . . . . . . . . . . . . . . . . . . . . . . . . . . . . . . . . . . . . . 19
5. Net job growth, younger versus older firms, 2001-11 . . . . . . . . . . . . . . . . . . . . . . . 20
6. Employment, job creation and job destruction, by firm age and size, 2001-11 . 21
7. Employment, job creation and job destruction, manufacturing and services
2001-11 . . . . . . . . . . . . . . . . . . . . . . . . . . . . . . . . . . . . . . . . . . . . . . . . . . . . . . . . . . . . . 21
8. Where people lost their jobs, 2008-11 . . . . . . . . . . . . . . . . . . . . . . . . . . . . . . . . . . . 22
9. Where people lost their jobs in Europe, 2011-12 . . . . . . . . . . . . . . . . . . . . . . . . . . . 23
10. Job creation and destruction in the information industries, 2008-11. . . . . . . . . . 24
11. Change in the skill mix in Europe, services and manufacturing, 2011-12 . . . . . 25
12. R&D growth over the business cycle by source of financing, OECD area,
1982-2012 . . . . . . . . . . . . . . . . . . . . . . . . . . . . . . . . . . . . . . . . . . . . . . . . . . . . . . . . . . . 26
13. US GDP and trademark applications at the US Patent and Trademark Office,
2003-13 . . . . . . . . . . . . . . . . . . . . . . . . . . . . . . . . . . . . . . . . . . . . . . . . . . . . . . . . . . . . . 26
14. Recent R&D trends by sector of performance, 2007-11. . . . . . . . . . . . . . . . . . . . . . 27
15. New enterprise creations, selected OECD countries, 2007-13 . . . . . . . . . . . . . . . . 28
16. Trends in bankruptcies, 2007-11. . . . . . . . . . . . . . . . . . . . . . . . . . . . . . . . . . . . . . . . . 28
17. Venture capital investment in the United States, 1995-2012 and in Europe,
1995-2010. . . . . . . . . . . . . . . . . . . . . . . . . . . . . . . . . . . . . . . . . . . . . . . . . . . . . . . . . . . . 29
18. Venture capital exits in the United States and Europe, 2007-12 . . . . . . . . . . . . . . 29
19. Patents by technology fields, 1999-2011 . . . . . . . . . . . . . . . . . . . . . . . . . . . . . . . . . . 30
20. The dynamics of merchandise exports in OECD and non-OECD economies,
2000-11. . . . . . . . . . . . . . . . . . . . . . . . . . . . . . . . . . . . . . . . . . . . . . . . . . . . . . . . . . . . . . 31
21. The dynamics of trade in services in OECD and non-OECD economies, 2000-12. 31
22. Worldwide collapse in exports, in gross and value added terms between
2008 and 2009 . . . . . . . . . . . . . . . . . . . . . . . . . . . . . . . . . . . . . . . . . . . . . . . . . . . . . . . . 32
23. Trends in world foreign direct investment flows 1995-2011 . . . . . . . . . . . . . . . . . 33
24. Decomposition of growth in GDP per capita, 2001-07, 2007-09 and 2009-12 . . . . 34
25. Gap in GDP per capita and GDP per person employed in the BRIICS,
with respect to the United States, 1997-2012 . . . . . . . . . . . . . . . . . . . . . . . . . . . . . . 35
26. Labour productivity growth in non-agricultural business sector before
the crisis, 2001-07 . . . . . . . . . . . . . . . . . . . . . . . . . . . . . . . . . . . . . . . . . . . . . . . . . . . . 36
OECD SCIENCE, TECHNOLOGY AND INDUSTRY SCOREBOARD 2013 © OECD 2013 267

LIST OF FIGURES
27. Labour productivity growth in non-agricultural business sector after
the crisis, 2007-11 . . . . . . . . . . . . . . . . . . . . . . . . . . . . . . . . . . . . . . . . . . . . . . . . . . . . 37
28. Investment in physical and knowledge-based capital, 2010 . . . . . . . . . . . . . . . . . 38
29. Change in business investment intensity between 2008 and 2010. . . . . . . . . . . . 39
The new geography of growth. . . . . . . . . . . . . . . . . . . . . . . . . . . . . . . . . . . . . . . . . . . . . . . . 40
30. Foreign value added content of exports, 1995 . . . . . . . . . . . . . . . . . . . . . . . . . . . . . 40
31. Foreign value added content of exports, 2009 . . . . . . . . . . . . . . . . . . . . . . . . . . . . . 41
32. Foreign value added content of exports, non-OECD economies, 2009 . . . . . . . . . 42
33. Services value added in manufacturing exports by industry, 1995 and 2009 . . . 43
34. Foreign direct investment inflows, 1995-2000, 2001-06 and 2007-11 . . . . . . . . . . 44
35. Outward foreign direct investment flows from BRIICS, 2001-04, 2005-07
and 2008-11 . . . . . . . . . . . . . . . . . . . . . . . . . . . . . . . . . . . . . . . . . . . . . . . . . . . . . . . . . . 44
36. Outward foreign direct investment flows from China, yearly average 2007-11 . 45
37. Top 20 countries, total stock of foreign direct investment, 2012 . . . . . . . . . . . . . . 45
38. Composition of GDP in OECD and BRIICS countries, 2011 . . . . . . . . . . . . . . . . . . . 46
39. Top 20 OECD and BRIICS countries reliant on natural resources, 2011 . . . . . . . . 46
40. Top manufacturers, 1990, 2000 and 2011 . . . . . . . . . . . . . . . . . . . . . . . . . . . . . . . . . 47
41. Top 20 exporters of manufactured goods, in gross and value added terms,
1995 and 2009 . . . . . . . . . . . . . . . . . . . . . . . . . . . . . . . . . . . . . . . . . . . . . . . . . . . . . . . . 47
42. Exports from energy-intensive manufacturing industries, 2011. . . . . . . . . . . . . . 48
43. Biggest net CO2 importers and net CO2 exporters, 2009. . . . . . . . . . . . . . . . . . . . . 49
The changing landscape of innovation . . . . . . . . . . . . . . . . . . . . . . . . . . . . . . . . . . . . . . . . 50
44. R&D in OECD and key partner countries, 2011 . . . . . . . . . . . . . . . . . . . . . . . . . . . . 50
45. Business R&D intensity and government support to business R&D, 2011 . . . . . 51
46. Global Internet Protocol (IP) traffic, 2005-13. . . . . . . . . . . . . . . . . . . . . . . . . . . . . . . 52
47. IPv6 deployment by country, November 2012 . . . . . . . . . . . . . . . . . . . . . . . . . . . . . 52
48. Mobile cellular and broadband penetration worldwide, 2001-11 . . . . . . . . . . . . . 53
49. University hotspots, geographical distribution of highest impact institutions,
2007-11. . . . . . . . . . . . . . . . . . . . . . . . . . . . . . . . . . . . . . . . . . . . . . . . . . . . . . . . . . . . . . 54
50. Innovation hotspots in ICT, biotechnologies and nanotechnologies, 1998-2000
and 2008-10 . . . . . . . . . . . . . . . . . . . . . . . . . . . . . . . . . . . . . . . . . . . . . . . . . . . . . . . . . . 55
51. Service-related trademark applications at USPTO and OHIM, selected OECD
and non-OECD economies, 2000-02 and 2010-12. . . . . . . . . . . . . . . . . . . . . . . . . . . 56
52. Trademarks in knowledge-intensive services, selected OECD and non-OECD
economies, 2010-12 . . . . . . . . . . . . . . . . . . . . . . . . . . . . . . . . . . . . . . . . . . . . . . . . . . . 56
53. Patents and trademarks per capita, 2000-02 and 2009-11 . . . . . . . . . . . . . . . . . . . 57
Science and innovation today . . . . . . . . . . . . . . . . . . . . . . . . . . . . . . . . . . . . . . . . . . . . . . . . 57
54A. International collaboration networks in science, 1998 . . . . . . . . . . . . . . . . . . . . . . 58
54B. International collaboration networks in science, 2011 . . . . . . . . . . . . . . . . . . . . . 59
55. The impact of scientific production and the extent of international scientific
collaboration, 2003-11 . . . . . . . . . . . . . . . . . . . . . . . . . . . . . . . . . . . . . . . . . . . . . . . . . 60
56. The impact of internationally mobile scientists, inflows versus outflows,
1996-2011. . . . . . . . . . . . . . . . . . . . . . . . . . . . . . . . . . . . . . . . . . . . . . . . . . . . . . . . . . . . 61
57. International mobility network, 1996-2011 . . . . . . . . . . . . . . . . . . . . . . . . . . . . . . . 62
58. The innovation-science link by technology area, 2001-11 . . . . . . . . . . . . . . . . . . . 63
59. International collaboration in science and innovation, 2007-11 . . . . . . . . . . . . . . 64
60. Cross-border ownership of patents, 2009-11 . . . . . . . . . . . . . . . . . . . . . . . . . . . . . . 65
OECD SCIENCE, TECHNOLOGY AND INDUSTRY SCOREBOARD 2013 © OECD 2013268

LIST OF FIGURES
61. Scientific collaboration with BRIICS countries, 2001 and 2011 . . . . . . . . . . . . . . . 66
62. Co-inventions with the BRIICS countries, 1991-2011 . . . . . . . . . . . . . . . . . . . . . . . 66
63. Triadic patent families by blocs, 2001 and 2011 . . . . . . . . . . . . . . . . . . . . . . . . . . . . 67
64. Technology transfers to selected BRIICS, 2005-09 . . . . . . . . . . . . . . . . . . . . . . . . . . 67
65. Gender differences in seeking health-related information on the Internet, 2011 68
66. Age differences in seeking employment-related information on the
Internet, 2011 . . . . . . . . . . . . . . . . . . . . . . . . . . . . . . . . . . . . . . . . . . . . . . . . . . . . . . . . 68
67. Public perception of the impact of science and technology on personal
well-being, 2010 . . . . . . . . . . . . . . . . . . . . . . . . . . . . . . . . . . . . . . . . . . . . . . . . . . . . . . 69
68. Public perception of scientific research benefits, 2010 . . . . . . . . . . . . . . . . . . . . . . 69
2. BUILDING KNOWLEDGE . . . . . . . . . . . . . . . . . . . . . . . . . . . . . . . . . . . . . . . . . . . . . . . . . . . 85
2.1. Investment in knowledge . . . . . . . . . . . . . . . . . . . . . . . . . . . . . . . . . . . . . . . . . . . . . 86
Spending on higher education, 2000 and 2010 . . . . . . . . . . . . . . . . . . . . . . . . . . . . 86
Gross domestic expenditure on R&D, 2001 and 2011 . . . . . . . . . . . . . . . . . . . . . . . 87
ICT investment by asset, 2000 and 2011 . . . . . . . . . . . . . . . . . . . . . . . . . . . . . . . . . . 87
2.2 Human resources and knowledge-based capital . . . . . . . . . . . . . . . . . . . . . . . . . 88
Knowledge-based capital related workers, 2012 . . . . . . . . . . . . . . . . . . . . . . . . . . . 88
Workers contributing to more than one activity related to knowledge-based
capital, 2012 . . . . . . . . . . . . . . . . . . . . . . . . . . . . . . . . . . . . . . . . . . . . . . . . . . . . . . . . . 89
Employment contributing to knowledge-based capital by industry, 2012 . . . . . . 89
2.3. Learning for innovation . . . . . . . . . . . . . . . . . . . . . . . . . . . . . . . . . . . . . . . . . . . . . . . 90
Science, reading and mathematics proficiency at age 15, 2009. . . . . . . . . . . . . . . 90
Transition from upper secondary to graduation at university level, 2011 . . . . . . 91
Participation in job-related education and training by level of problem
solving in technology-rich environments, 2012. . . . . . . . . . . . . . . . . . . . . . . . . . . . 91
2.4. Skills for innovation . . . . . . . . . . . . . . . . . . . . . . . . . . . . . . . . . . . . . . . . . . . . . . . . . . 92
Professionals and technicians, 2012 . . . . . . . . . . . . . . . . . . . . . . . . . . . . . . . . . . . . . 92
Professionals and technicians in business sector services and
manufacturing, 2012 . . . . . . . . . . . . . . . . . . . . . . . . . . . . . . . . . . . . . . . . . . . . . . . . . . 93
Firms using innovation-relevant skills, 2008-10 . . . . . . . . . . . . . . . . . . . . . . . . . . . 93
2.5. New doctorates . . . . . . . . . . . . . . . . . . . . . . . . . . . . . . . . . . . . . . . . . . . . . . . . . . . . . . 94
Graduation rates at doctoral level, 2000 and 2011 . . . . . . . . . . . . . . . . . . . . . . . . . . 94
Graduates at doctorate level, 2011 . . . . . . . . . . . . . . . . . . . . . . . . . . . . . . . . . . . . . . . 94
New doctorates in science and engineering, 2007-11 . . . . . . . . . . . . . . . . . . . . . . . 95
2.6. Doctorate holders . . . . . . . . . . . . . . . . . . . . . . . . . . . . . . . . . . . . . . . . . . . . . . . . . . . . 96
Doctorate holders in the working age population, 2009. . . . . . . . . . . . . . . . . . . . . 96
Doctorate holders working as researchers, 2009 . . . . . . . . . . . . . . . . . . . . . . . . . . . 97
Doctorate holders by sector of employment, 2009 . . . . . . . . . . . . . . . . . . . . . . . . . 98
2.7. Researchers. . . . . . . . . . . . . . . . . . . . . . . . . . . . . . . . . . . . . . . . . . . . . . . . . . . . . . . . . . 98
R&D personnel, 2001 and 2011 . . . . . . . . . . . . . . . . . . . . . . . . . . . . . . . . . . . . . . . . . . 98
Researchers by sector of employment, 2011 . . . . . . . . . . . . . . . . . . . . . . . . . . . . . . 99
Female researchers by sector of employment, 2011 . . . . . . . . . . . . . . . . . . . . . . . . 99
2.8. R&D . . . . . . . . . . . . . . . . . . . . . . . . . . . . . . . . . . . . . . . . . . . . . . . . . . . . . . . . . . . . . . . . 100
R&D expenditure, by performing sectors, 2011 . . . . . . . . . . . . . . . . . . . . . . . . . . . . 100
Direct government funding of business R&D, 2001 and 2011 . . . . . . . . . . . . . . . . 101
OECD SCIENCE, TECHNOLOGY AND INDUSTRY SCOREBOARD 2013 © OECD 2013 269
LIST OF FIGURES
Gross expenditures on research and development, by type of R&D, 2001
and 2011. . . . . . . . . . . . . . . . . . . . . . . . . . . . . . . . . . . . . . . . . . . . . . . . . . . . . . . . . . . . . 101
2.9. Higher education and basic research. . . . . . . . . . . . . . . . . . . . . . . . . . . . . . . . . . . . 102
Higher education expenditure on R&D, 2001 and 2011. . . . . . . . . . . . . . . . . . . . . . 102
Government funding of R&D in higher education, by type of funding, 2010 . . . 103
Basic research performed in the higher education and government sectors, 2011 . 103
2.10. Business R&D . . . . . . . . . . . . . . . . . . . . . . . . . . . . . . . . . . . . . . . . . . . . . . . . . . . . . . . . 104
Business enterprise expenditure on R&D, 2001 and 2011 . . . . . . . . . . . . . . . . . . . 104
Business R&D by size class of firms, 2011. . . . . . . . . . . . . . . . . . . . . . . . . . . . . . . . . 105
R&D expenditures incurred by foreign-controlled affiliates, 2009 . . . . . . . . . . . . 105
2.11. R&D tax incentives . . . . . . . . . . . . . . . . . . . . . . . . . . . . . . . . . . . . . . . . . . . . . . . . . . . 106
Direct government funding of business R&D and tax incentives for R&D, 2011. 106
Change in government support for business R&D through direct funding
and tax incentives, 2006-11 . . . . . . . . . . . . . . . . . . . . . . . . . . . . . . . . . . . . . . . . . . . . 107
Tax subsidy rates on R&D expenditures, 2013 . . . . . . . . . . . . . . . . . . . . . . . . . . . . . 107
2.12. International funding of R&D . . . . . . . . . . . . . . . . . . . . . . . . . . . . . . . . . . . . . . . . . . 108
Business enterprise R&D funded from abroad, 2011. . . . . . . . . . . . . . . . . . . . . . . . 108
Business enterprise R&D funded from abroad, by source of funds, 2011 . . . . . . 109
Funding of business R&D by foreign enterprises, 2011. . . . . . . . . . . . . . . . . . . . . . 109
3. CONNECTING TO KNOWLEDGE. . . . . . . . . . . . . . . . . . . . . . . . . . . . . . . . . . . . . . . . . . . . . 121
3.1. R&D and knowledge flows . . . . . . . . . . . . . . . . . . . . . . . . . . . . . . . . . . . . . . . . . . . . 122
Business enterprise R&D funded by other companies, 2010 . . . . . . . . . . . . . . . . . 122
Business funding of extramural R&D, by type of performer, 2010 . . . . . . . . . . . . 123
Business-funded R&D in the higher education and government sectors,
2001 and 2011 . . . . . . . . . . . . . . . . . . . . . . . . . . . . . . . . . . . . . . . . . . . . . . . . . . . . . . . . 123
3.2. Open innovation . . . . . . . . . . . . . . . . . . . . . . . . . . . . . . . . . . . . . . . . . . . . . . . . . . . . . 124
External sources of knowledge for innovation, by type, 2008-10 . . . . . . . . . . . . . 124
Externally developed goods and services innovation, 2008-10 . . . . . . . . . . . . . . . 125
Firms collaborating on innovation activities, by size, 2008-10 . . . . . . . . . . . . . . . 125
3.3. Collaboration on innovation . . . . . . . . . . . . . . . . . . . . . . . . . . . . . . . . . . . . . . . . . . . 126
Firms engaging in collaboration on innovation, by R&D status, 2008-10 . . . . . . 126
Firms collaborating on innovation with higher education or public research
institutions, by firm size, 2008-10 . . . . . . . . . . . . . . . . . . . . . . . . . . . . . . . . . . . . . . . 127
Firms collaborating with suppliers and clients, by firm size, 2008-10 . . . . . . . . . 127
3.4. International collaboration . . . . . . . . . . . . . . . . . . . . . . . . . . . . . . . . . . . . . . . . . . . . 128
National and international collaboration on innovation by firms, 2008-10. . . . . 128
Firms engaged in international collaboration by firm size, 2008-10. . . . . . . . . . . 129
International collaboration on patents, 2007-11 and innovation, 2008-10 . . . . . 129
3.5. Skills mobility . . . . . . . . . . . . . . . . . . . . . . . . . . . . . . . . . . . . . . . . . . . . . . . . . . . . . . . 130
International and foreign students enrolled in tertiary education, 2011. . . . . . . 130
Labour turnover, by educational attainment, 2011 . . . . . . . . . . . . . . . . . . . . . . . . . 131
Doctorate holders who changed jobs in the last ten years, 2009 . . . . . . . . . . . . . 131
3.6. Researchers on the move . . . . . . . . . . . . . . . . . . . . . . . . . . . . . . . . . . . . . . . . . . . . . . 132
International flows of scientific authors, 1996-2011 . . . . . . . . . . . . . . . . . . . . . . . . 132
International mobility of scientific authors, 1996-2011 . . . . . . . . . . . . . . . . . . . . . 133
Impact of scientific authors, by category of mobility, 1996-2011 . . . . . . . . . . . . . 133
OECD SCIENCE, TECHNOLOGY AND INDUSTRY SCOREBOARD 2013 © OECD 2013270

LIST OF FIGURES
3.7. Research excellence . . . . . . . . . . . . . . . . . . . . . . . . . . . . . . . . . . . . . . . . . . . . . . . . . . 134
The quantity and quality of scientific production, 2003-11 . . . . . . . . . . . . . . . . . . 134
Top-cited publications, by type of collaboration, 2003-11 . . . . . . . . . . . . . . . . . . . 135
The quality of scientific production and international collaboration, 2003-11 . . 135
3.8. Science for innovation . . . . . . . . . . . . . . . . . . . . . . . . . . . . . . . . . . . . . . . . . . . . . . . . 136
Main sources of scientific documents cited in patents, selected technology
areas, 2001-11 . . . . . . . . . . . . . . . . . . . . . . . . . . . . . . . . . . . . . . . . . . . . . . . . . . . . . . . . 136
Main scientific sources of biotechnology, nanotechnology and ICT patents,
2001-11. . . . . . . . . . . . . . . . . . . . . . . . . . . . . . . . . . . . . . . . . . . . . . . . . . . . . . . . . . . . . . 137
Main scientific sources of health and environment-related patents, 2001-11 . . 137
3.9. From knowledge to inventions . . . . . . . . . . . . . . . . . . . . . . . . . . . . . . . . . . . . . . . . . 138
Patents citing non-patent literature by technology field, 1997-2002 and
2007-12. . . . . . . . . . . . . . . . . . . . . . . . . . . . . . . . . . . . . . . . . . . . . . . . . . . . . . . . . . . . . . 138
Patents citing non-patent literature, selected technologies, 1997-2002 and
2007-12. . . . . . . . . . . . . . . . . . . . . . . . . . . . . . . . . . . . . . . . . . . . . . . . . . . . . . . . . . . . . . 139
Citations to patents that include non-patent literature, by technology
fields, 2007-12 . . . . . . . . . . . . . . . . . . . . . . . . . . . . . . . . . . . . . . . . . . . . . . . . . . . . . . . . 139
3.10. Inventions across borders . . . . . . . . . . . . . . . . . . . . . . . . . . . . . . . . . . . . . . . . . . . . . 140
International co-inventions in patents, 1999-2001 and 2009-11 . . . . . . . . . . . . . . 140
International co-inventions by technology fields, 1999-2001 and 2009-11 . . . . . 141
Foreign inventions owned by economies, 2009-11 . . . . . . . . . . . . . . . . . . . . . . . . . 141
3.11. Technology flows and markets . . . . . . . . . . . . . . . . . . . . . . . . . . . . . . . . . . . . . . . . 142
International technology flows of royalties and licence fees, 2000-11 . . . . . . . . . 142
Revenues of specialist intellectual property leasing firms, 2010. . . . . . . . . . . . . . 143
Royalty income by industry, United States, 1999 and 2009 . . . . . . . . . . . . . . . . . . 143
4. TARGETING NEW GROWTH AREAS . . . . . . . . . . . . . . . . . . . . . . . . . . . . . . . . . . . . . . . . . 151
4.1. R&D funding and specialisation . . . . . . . . . . . . . . . . . . . . . . . . . . . . . . . . . . . . . . . 152
R&D specialisation, top three performing industries, 2011 . . . . . . . . . . . . . . . . . . 152
R&D budgets by socio-economic objectives, 2012 . . . . . . . . . . . . . . . . . . . . . . . . . . 153
Top two technologies patented by countries, 2009-11 . . . . . . . . . . . . . . . . . . . . . . 153
4.2. Green innovation . . . . . . . . . . . . . . . . . . . . . . . . . . . . . . . . . . . . . . . . . . . . . . . . . . . . . 154
R&D budgets for energy and the environment, 2002 and 2012 . . . . . . . . . . . . . . 154
Patents in selected environmental technologies, 1998-2000 and 2008-10 . . . . . . 155
Countries’ share in selected environmental technologies, 2008-10 . . . . . . . . . . . 155
4.3. Health innovation . . . . . . . . . . . . . . . . . . . . . . . . . . . . . . . . . . . . . . . . . . . . . . . . . . . . 156
Government funding of health-related R&D, 2012 . . . . . . . . . . . . . . . . . . . . . . . . . 156
Health-related patents, 1999-2001 and 2009-11. . . . . . . . . . . . . . . . . . . . . . . . . . . . 157
Countries’ share in pharmaceutical patents, 2009-11 . . . . . . . . . . . . . . . . . . . . . . . . 157
4.4. Biotechnology R&D . . . . . . . . . . . . . . . . . . . . . . . . . . . . . . . . . . . . . . . . . . . . . . . . . . . 158
Number of firms active in biotechnology, 2011 . . . . . . . . . . . . . . . . . . . . . . . . . . . . . 158
Biotechnology R&D in the business sector, 2011 . . . . . . . . . . . . . . . . . . . . . . . . . . . . 159
Biotechnology R&D in the government and higher education sectors, 2011 . . . . . . 159
4.5. Nanotechnology R&D . . . . . . . . . . . . . . . . . . . . . . . . . . . . . . . . . . . . . . . . . . . . . . . . . 160
Number of firms active in nanotechnology, 2011 . . . . . . . . . . . . . . . . . . . . . . . . . . . . 160
Nanotechnology R&D in the business sector, 2011. . . . . . . . . . . . . . . . . . . . . . . . . . . 161
Nanotechnology R&D in the government and higher education sectors, 2011 . . . . 161
OECD SCIENCE, TECHNOLOGY AND INDUSTRY SCOREBOARD 2013 © OECD 2013 271

LIST OF FIGURES
4.6. ICT innovation . . . . . . . . . . . . . . . . . . . . . . . . . . . . . . . . . . . . . . . . . . . . . . . . . . . . . . . 162
R&D expenditure in information industries, 2011. . . . . . . . . . . . . . . . . . . . . . . . . . 162
ICT-related patents, 1999-2001 and 2009-11. . . . . . . . . . . . . . . . . . . . . . . . . . . . . . . 163
Enterprises with broadband connection, by employment size, 2012 . . . . . . . . . . 163
4.7. Broadband price and quality . . . . . . . . . . . . . . . . . . . . . . . . . . . . . . . . . . . . . . . . . . . 164
Internet connection speed, September 2012 . . . . . . . . . . . . . . . . . . . . . . . . . . . . . . 164
Prices of fixed broadband basket, 33 GB, 15 Mbit/s and above, September 2012 . . . 165
Prices of mobile voice calls plus data traffic reference baskets, August 2012 . . . . . 165
4.8. Fixed and wireless broadband . . . . . . . . . . . . . . . . . . . . . . . . . . . . . . . . . . . . . . . . . 166
Wireless broadband penetration by technology, December 2009 and 2012 . . . . . . . 166
Fixed wired broadband penetration by speed tiers, December 2009 and 2012 . . . . 167
Household Internet access by income quartile, 2008 and 2012 . . . . . . . . . . . . . . 167
4.9. Internet users . . . . . . . . . . . . . . . . . . . . . . . . . . . . . . . . . . . . . . . . . . . . . . . . . . . . . . . . 168
Regular Internet users, by age, 2012 . . . . . . . . . . . . . . . . . . . . . . . . . . . . . . . . . . . . . 168
Regular Internet users by educational attainment and age, 2012. . . . . . . . . . . . . 169
Individuals who purchased on line in the last three months,
by age class, 2012 . . . . . . . . . . . . . . . . . . . . . . . . . . . . . . . . . . . . . . . . . . . . . . . . . . . . . 169
4.10. Emerging technologies . . . . . . . . . . . . . . . . . . . . . . . . . . . . . . . . . . . . . . . . . . . . . . . . 170
Acceleration in the development of patented technologies, 2000-11. . . . . . . . . . 170
Acceleration in the co-development of patented technologies, 1996-2001 and
2006-11. . . . . . . . . . . . . . . . . . . . . . . . . . . . . . . . . . . . . . . . . . . . . . . . . . . . . . . . . . . . . . 171
5. UNLEASHING INNOVATION IN FIRMS . . . . . . . . . . . . . . . . . . . . . . . . . . . . . . . . . . . . . . . 179
5.1. Mixed modes of innovation. . . . . . . . . . . . . . . . . . . . . . . . . . . . . . . . . . . . . . . . . . . . 180
Innovation types by firm size, 2008-10 . . . . . . . . . . . . . . . . . . . . . . . . . . . . . . . . . . . 180
Innovation in the manufacturing sector, 2008-10 . . . . . . . . . . . . . . . . . . . . . . . . . . 181
Innovation in the services sector, 2008-10 . . . . . . . . . . . . . . . . . . . . . . . . . . . . . . . . 181
5.2. Broader innovation . . . . . . . . . . . . . . . . . . . . . . . . . . . . . . . . . . . . . . . . . . . . . . . . . . . 182
Firms innovating in goods and services, manufacturing and services, 2008-10. . 182
Product innovation, by R&D status, 2008-10. . . . . . . . . . . . . . . . . . . . . . . . . . . . . . . 183
R&D-active firms, manufacturing and services, 2008-10 . . . . . . . . . . . . . . . . . . . . 183
5.3. Public support to innovation . . . . . . . . . . . . . . . . . . . . . . . . . . . . . . . . . . . . . . . . . . . 184
Government-financed R&D in the business sector, by firm size, 2011. . . . . . . . . 184
Firms receiving public support for innovation, by firm size, 2006-08
and 2008-10 . . . . . . . . . . . . . . . . . . . . . . . . . . . . . . . . . . . . . . . . . . . . . . . . . . . . . . . . . . 185
Firms receiving public support for innovation, manufacturing and services,
2008-10. . . . . . . . . . . . . . . . . . . . . . . . . . . . . . . . . . . . . . . . . . . . . . . . . . . . . . . . . . . . . . 185
5.4. The IP “bundle” . . . . . . . . . . . . . . . . . . . . . . . . . . . . . . . . . . . . . . . . . . . . . . . . . . . . . . 186
IP bundle of top 20 applicants, 2010-12. . . . . . . . . . . . . . . . . . . . . . . . . . . . . . . . . . . 186
Top two trademark application fields, by country, 2009-11 . . . . . . . . . . . . . . . . . . 187
Top two design application fields, by country, 2009-11. . . . . . . . . . . . . . . . . . . . . . 187
5.5. Trademarks . . . . . . . . . . . . . . . . . . . . . . . . . . . . . . . . . . . . . . . . . . . . . . . . . . . . . . . . . . 188
Top 20 trademark applicants, 2009-11 average . . . . . . . . . . . . . . . . . . . . . . . . . . . . 188
Trademark applications by BRIICS countries, 2000-02 and 2009-11 averages . . . 189
Share of goods and services trademark applications at USPTO, OHIM and
JPO, 2010-12 . . . . . . . . . . . . . . . . . . . . . . . . . . . . . . . . . . . . . . . . . . . . . . . . . . . . . . . . . . 189
OECD SCIENCE, TECHNOLOGY AND INDUSTRY SCOREBOARD 2013 © OECD 2013272

LIST OF FIGURES
5.6. Knowledge-asset-related trademarks . . . . . . . . . . . . . . . . . . . . . . . . . . . . . . . . . . . 190
IP-transaction-related trademarks, 2004-07 and 2009-12. . . . . . . . . . . . . . . . . . . . 190
R&D-related trademarks, 2004-07 and 2009-12 . . . . . . . . . . . . . . . . . . . . . . . . . . . . 191
ICT-related trademarks, 2004-07 and 2009-12 . . . . . . . . . . . . . . . . . . . . . . . . . . . . . 191
5.7. Registered designs . . . . . . . . . . . . . . . . . . . . . . . . . . . . . . . . . . . . . . . . . . . . . . . . . . . 192
Number of designs by Locarno class, 2006-08 and 2010-12 . . . . . . . . . . . . . . . . . . 192
Transport-related designs, 2010-12 . . . . . . . . . . . . . . . . . . . . . . . . . . . . . . . . . . . . . . 193
ICT and audiovisual-related designs, 2010-12 . . . . . . . . . . . . . . . . . . . . . . . . . . . . . 193
5.8. Trademarks and patents . . . . . . . . . . . . . . . . . . . . . . . . . . . . . . . . . . . . . . . . . . . . . . 194
Firms with trademarks and patents, 2009-11 . . . . . . . . . . . . . . . . . . . . . . . . . . . . . 194
Top two industries with trademarks and patents by country, 2009-11. . . . . . . . . 195
Firms with trademarks and patents, by size, 2009-11. . . . . . . . . . . . . . . . . . . . . . . 195
5.9. Entry, exit and survival . . . . . . . . . . . . . . . . . . . . . . . . . . . . . . . . . . . . . . . . . . . . . . . 196
Employer enterprise survival rates, 2007 and 2009 . . . . . . . . . . . . . . . . . . . . . . . . . 197
Employer enterprise birth and death rates in the manufacturing sector, 2010 . 196
Employer enterprise birth and death rates in the services sector, 2010 . . . . . . . 197
5.10. Firm employment dynamics . . . . . . . . . . . . . . . . . . . . . . . . . . . . . . . . . . . . . . . . . . 198
Employment, job creation and job destruction in young and mature firms,
2001-11. . . . . . . . . . . . . . . . . . . . . . . . . . . . . . . . . . . . . . . . . . . . . . . . . . . . . . . . . . . . . . 198
Employment, job creation and job destruction in young firms, manufacturing,
2001-11. . . . . . . . . . . . . . . . . . . . . . . . . . . . . . . . . . . . . . . . . . . . . . . . . . . . . . . . . . . . . . 199
Employment, job creation and job destruction in young firms, non-financial
services, 2001-11. . . . . . . . . . . . . . . . . . . . . . . . . . . . . . . . . . . . . . . . . . . . . . . . . . . . . . 199
5.11. Access to capital . . . . . . . . . . . . . . . . . . . . . . . . . . . . . . . . . . . . . . . . . . . . . . . . . . . . . 200
Ease of access to loans, 2007-08 and 2011-12. . . . . . . . . . . . . . . . . . . . . . . . . . . . . . 200
Venture capital investment, 2012. . . . . . . . . . . . . . . . . . . . . . . . . . . . . . . . . . . . . . . . 201
SME loans, 2007 and 2011 . . . . . . . . . . . . . . . . . . . . . . . . . . . . . . . . . . . . . . . . . . . . . . 201
5.12. Policy environment . . . . . . . . . . . . . . . . . . . . . . . . . . . . . . . . . . . . . . . . . . . . . . . . . . . 202
Time needed to open and close a business, 2003 and 2012 . . . . . . . . . . . . . . . . . . 202
Barriers to entrepreneurship, 2008 . . . . . . . . . . . . . . . . . . . . . . . . . . . . . . . . . . . . . . 203
Taxation on corporate income and personal income, 2012 . . . . . . . . . . . . . . . . . . 203
6. Competing in the knowledge economy. . . . . . . . . . . . . . . . . . . . . . . . . . . . . . . . . . . . . . 213
6.1. Industry specialisation . . . . . . . . . . . . . . . . . . . . . . . . . . . . . . . . . . . . . . . . . . . . . . . . 214
Industrial specialisation, 2000 and 2010 . . . . . . . . . . . . . . . . . . . . . . . . . . . . . . . . . . 214
Value added of the top four economic activities, 2008-10 . . . . . . . . . . . . . . . . . . . 215
Employment of the top four economic activities, 2008-10. . . . . . . . . . . . . . . . . . . 215
6.2. ICT industry specialisation . . . . . . . . . . . . . . . . . . . . . . . . . . . . . . . . . . . . . . . . . . . . 216
Information industries in OECD economies, 2000 and 2011 . . . . . . . . . . . . . . . . . 216
Global trade in ICT goods and top ten exporters, 2000 and 2011 . . . . . . . . . . . . . 217
OECD and major exporters of ICT services, 2000 and 2012 . . . . . . . . . . . . . . . . . . 217
6.3. Export structures . . . . . . . . . . . . . . . . . . . . . . . . . . . . . . . . . . . . . . . . . . . . . . . . . . . . . 218
Top 20 exporting economies of primary and manufactured goods by end-use
category, 1995 and 2011 . . . . . . . . . . . . . . . . . . . . . . . . . . . . . . . . . . . . . . . . . . . . . . . . 218
Top four exporting industries by country, 2011 . . . . . . . . . . . . . . . . . . . . . . . . . . . . 219
Top three exporting services by country, 2011 . . . . . . . . . . . . . . . . . . . . . . . . . . . . . 219
OECD SCIENCE, TECHNOLOGY AND INDUSTRY SCOREBOARD 2013 © OECD 2013 273

LIST OF FIGURES
6.4. R&D specialisation. . . . . . . . . . . . . . . . . . . . . . . . . . . . . . . . . . . . . . . . . . . . . . . . . . . . 220
Business R&D intensity adjusted for industrial structure, 2011 . . . . . . . . . . . . . . 220
Business R&D in manufacturing, by technology intensity, 2011 . . . . . . . . . . . . . . 221
Share of services in business R&D, 2001 and 2011 . . . . . . . . . . . . . . . . . . . . . . . . . 221
6.5. Technological advantage . . . . . . . . . . . . . . . . . . . . . . . . . . . . . . . . . . . . . . . . . . . . . . 222
Change in revealed technological advantage in biotechnology and
nanotechnology, 1998-2000 and 2008-10. . . . . . . . . . . . . . . . . . . . . . . . . . . . . . . . . . 222
Change in revealed technological advantage in ICT, 1998-2000 and 2008-10 . . . 223
Countries’ range of revealed technological advantage by field, 2008-10 . . . . . . . 223
6.6. Trade competitiveness . . . . . . . . . . . . . . . . . . . . . . . . . . . . . . . . . . . . . . . . . . . . . . . . 224
Top ten exporting economies in gross and value added terms, 2009 . . . . . . . . . 224
Revealed comparative advantage in exports of computers, electronic and
optical products, 2009 . . . . . . . . . . . . . . . . . . . . . . . . . . . . . . . . . . . . . . . . . . . . . . . . . 225
Revealed comparative advantage in exports of machinery and equipment, 2009 . 225
6.7. E-business uptake . . . . . . . . . . . . . . . . . . . . . . . . . . . . . . . . . . . . . . . . . . . . . . . . . . . . 226
Enterprises selling on line, by size, 2009 and 2012 . . . . . . . . . . . . . . . . . . . . . . . . . 226
Turnover from e-commerce, by enterprise size, 2012 . . . . . . . . . . . . . . . . . . . . . . . 227
Enterprises using enterprise resource planning software for internal
information sharing, by size, 2012. . . . . . . . . . . . . . . . . . . . . . . . . . . . . . . . . . . . . . . 227
6.8. Young innovative firms. . . . . . . . . . . . . . . . . . . . . . . . . . . . . . . . . . . . . . . . . . . . . . . . 228
Patenting activity by sector, 2009-11 . . . . . . . . . . . . . . . . . . . . . . . . . . . . . . . . . . . . . 228
Top three industries patenting in selected technology fields, 2009-11. . . . . . . . . 229
Patenting activity of young firms by sector, 2009-11. . . . . . . . . . . . . . . . . . . . . . . . 229
6.9. Technological strengths . . . . . . . . . . . . . . . . . . . . . . . . . . . . . . . . . . . . . . . . . . . . . . . 230
The relevance of patents for later inventions, 2002-06. . . . . . . . . . . . . . . . . . . . . . 230
Scope of patent applications, 2009-11. . . . . . . . . . . . . . . . . . . . . . . . . . . . . . . . . . . . 231
Highly cited patent applications, 2002-06. . . . . . . . . . . . . . . . . . . . . . . . . . . . . . . . . 231
7. Participating in the global economy. . . . . . . . . . . . . . . . . . . . . . . . . . . . . . . . . . . . . . . . . 239
7.1. Employment . . . . . . . . . . . . . . . . . . . . . . . . . . . . . . . . . . . . . . . . . . . . . . . . . . . . . . . . 240
Employment in services, 2000 and 2011 . . . . . . . . . . . . . . . . . . . . . . . . . . . . . . . . . . 240
Employment in knowledge-intensive market services, 2000 and 2011 . . . . . . . . 241
Employment in high- and medium-high-technology manufacturing,
2000 and 2011 . . . . . . . . . . . . . . . . . . . . . . . . . . . . . . . . . . . . . . . . . . . . . . . . . . . . . . . . 241
7.2. Services-manufacturing linkages . . . . . . . . . . . . . . . . . . . . . . . . . . . . . . . . . . . . . . 242
Services-related occupations in manufacturing, 2002 and 2012 . . . . . . . . . . . . . . 242
Services content of manufactured exports, domestic and foreign, 1995
and 2009. . . . . . . . . . . . . . . . . . . . . . . . . . . . . . . . . . . . . . . . . . . . . . . . . . . . . . . . . . . . . 243
Services content of manufactured exports by type of service, 2009. . . . . . . . . . . 243
7.3. Firm size . . . . . . . . . . . . . . . . . . . . . . . . . . . . . . . . . . . . . . . . . . . . . . . . . . . . . . . . . . . . 244
Number of enterprises by size class, 2010 . . . . . . . . . . . . . . . . . . . . . . . . . . . . . . . . 244
Employment by enterprise by size class, 2010 . . . . . . . . . . . . . . . . . . . . . . . . . . . . . 245
Value added by enterprise by size class, 2010 . . . . . . . . . . . . . . . . . . . . . . . . . . . . . 245
7.4. Firm dynamics . . . . . . . . . . . . . . . . . . . . . . . . . . . . . . . . . . . . . . . . . . . . . . . . . . . . . . 246
Three-year survival and growth performance of micro start-ups, 2001-04,
2004-07, 2007-10 . . . . . . . . . . . . . . . . . . . . . . . . . . . . . . . . . . . . . . . . . . . . . . . . . . . . . 246
Average size of firms less than 3 years old and 11 years old or more, 2001-10 . . 247
OECD SCIENCE, TECHNOLOGY AND INDUSTRY SCOREBOARD 2013 © OECD 2013274
LIST OF FIGURES
Average size of firms less than 3 years old and 11 years old or more, by sector,
2001-10. . . . . . . . . . . . . . . . . . . . . . . . . . . . . . . . . . . . . . . . . . . . . . . . . . . . . . . . . . . . . . 247
7.5. Foreign affiliates . . . . . . . . . . . . . . . . . . . . . . . . . . . . . . . . . . . . . . . . . . . . . . . . . . . . . 248
Share of foreign affiliates in total enterprises, 2010 . . . . . . . . . . . . . . . . . . . . . . . . 248
Share of national value added under control of foreign affiliates, 2010 . . . . . . . 249
Share of national employment under control of foreign affiliates, 2010 . . . . . . . 249
7.6. Trade and global value chains . . . . . . . . . . . . . . . . . . . . . . . . . . . . . . . . . . . . . . . . . 250
Trade linkages in global value chains, 2009 . . . . . . . . . . . . . . . . . . . . . . . . . . . . . . . 250
Foreign value added content of exports, 1995 and 2009. . . . . . . . . . . . . . . . . . . . . 251
Imported intermediate inputs used in exports, 1995 and 2009. . . . . . . . . . . . . . . 251
7.7. Global demand . . . . . . . . . . . . . . . . . . . . . . . . . . . . . . . . . . . . . . . . . . . . . . . . . . . . . . 252
Foreign value added embodied in domestic final demand, 1995 and 2009 . . . . . 252
Foreign value added embodied in domestic final demand, by sector,
OECD average, 1995 and 2009 . . . . . . . . . . . . . . . . . . . . . . . . . . . . . . . . . . . . . . . . . . . 253
Foreign value added embodied in domestic final demand for electrical
equipment, 1995 and 2009 . . . . . . . . . . . . . . . . . . . . . . . . . . . . . . . . . . . . . . . . . . . . . 253
7.8. Trade and jobs . . . . . . . . . . . . . . . . . . . . . . . . . . . . . . . . . . . . . . . . . . . . . . . . . . . . . . . 254
Jobs in the business sector sustained by foreign final demand, 1995 and 2008 . 254
Jobs sustained by foreign final demand, by sector, 2008 . . . . . . . . . . . . . . . . . . . . 255
Jobs sustained by foreign final demand, by region of demand, 2008 . . . . . . . . . . 255
7.9. Trade and household consumption . . . . . . . . . . . . . . . . . . . . . . . . . . . . . . . . . . . . . 256
Foreign value added in household consumption, by product category, 2009 . . . 256
Household consumption, by type of product, 2009. . . . . . . . . . . . . . . . . . . . . . . . . 257
Foreign value added in household consumption, by source region, 2009 . . . . . . 257
OECD SCIENCE, TECHNOLOGY AND INDUSTRY SCOREBOARD 2013 © OECD 2013 275

ORGANISATION FOR ECONOMIC CO-OPERATIONAND DEVELOPMENT
The OECD is a unique forum where governments work together to address the economic, social and
environmental challenges of globalisation. The OECD is also at the forefront of efforts to understand and
to help governments respond to new developments and concerns, such as corporate governance, the
information economy and the challenges of an ageing population. The Organisation provides a setting
where governments can compare policy experiences, seek answers to common problems, identify good
practice and work to co-ordinate domestic and international policies.
The OECD member countries are: Australia, Austria, Belgium, Canada, Chile, the Czech Republic,
Denmark, Estonia, Finland, France, Germany, Greece, Hungary, Iceland, Ireland, Israel, Italy, Japan, Korea,
Luxembourg, Mexico, the Netherlands, New Zealand, Norway, Poland, Portugal, the Slovak Republic, Slovenia,
Spain, Sweden, Switzerland, Turkey, the United Kingdom and the United States. The European Union takes
part in the work of the OECD.
OECD Publishing disseminates widely the results of the Organisation’s statistics gathering and
research on economic, social and environmental issues, as well as the conventions, guidelines and
standards agreed by its members.
OECD PUBLISHING, 2, rue André-Pascal, 75775 PARIS CEDEX 16
(92 2013 05 1 P) ISBN 978-92-64-20073-9 – No. 60847 2013
Flash to read and share!
Consult this publication on line at http://dx.doi.org/10.1787/sti_scoreboard-2013-en.
This work is published on the OECD iLibrary, which gathers all OECD books, periodicals and statistical databases.Visit www.oecd-ilibrary.org for more information.
OECD Science, Technology and Industry Scoreboard 2013INNOVATION FOR GROWTH
Science, technology, innovation and entrepreneurship – which foster competitiveness, productivity, and job creation – are important mechanisms for encouraging sustainable growth. Over 250 indicators in the OECD Science, Technology and Industry (STI) Scoreboard show how OECD and major non-OECD economies are performing in a wide range of areas to help governments design more effective and effi cient policies and monitor progress towards their desired goals.
The charts and underlying data in the STI Scoreboard 2013 are available for download and for the fi rst time, selected indicators contain additional data expanding the time and country coverage of the print edition.
Contents
• Knowledge economies: Trends and features
• Building knowledge
• Connecting to knowledge
• Targeting new growth areas
• Unleashing innovation in fi rms
• Competing in the knowledge economy
• Participating in the global economy
For more information about the OECD STI Scoreboard, see www.oecd.org/sti/scoreboard.htm
OE
CD
Science, Tech
nolo
gy an
d In
du
stry Sco
rebo
ard 2013 IN
NO
VA
TIO
N FO
R G
RO
WT
H
OECD Science, Technology and Industry Scoreboard 2013INNOVATION FOR GROWTH
ISBN 978-92-64-20073-992 2013 05 1 P 9HSTCQE*caahdj+


![[DE] PROJECT CONSULT Newsletter 2014 | PROJECT CONSULT Unternehmensberatung](https://img.pdfslide.us/doc/110x75/579078681a28ab6874c25190/de-project-consult-newsletter-2014-project-consult-unternehmensberatung.jpg)
