Embed Size (px)
Citation preview

Contents
1
2
3
4
5
4 Corporate Profile5 2013 Highlights7 Chief Executive O�cer’s Letter 9 Board of Directors10 Senior Executive Team and Advisors
12 Retail & Business Banking14 Wholesale Banking15 Wealth Management
17 Our Employees19 Our Communities
23 Management’s Discussion and Analysis 31 Audited Consolidated Financial Statements 2013 & Accompanying Notes
87 Notice of Meeting88 Directors’ Report89 Management Proxy Circular90 Proxy Form91 Ownership Structure92 Main Branches and Centres
Corporate Profile
4 CIBC FirstCaribbean Annual Report 2013
CIBC FirstCaribbean International Bank is a relationship bank offering a full range of market-leading financial services through our Wholesale Banking, Retail & Business Banking and Wealth Management segments. We are located in seventeen (17) countries around the Caribbean, providing the banking services that matter to our customers through approximately 3,400 employees, in one hundred and two (102) branches, banking centres and offices. We are one of the largest regionally-listed financial services institutions in the English and Dutch speaking Caribbean, with over US$11.4 billion in assets and market capitalization of US$1.8 billion. The face of banking is changing throughout the world and CIBC FirstCaribbean intends to lead these changes with the expertise, integrity and knowledge of banking that almost 250 years of combined experience in the Caribbean brings.
VisionTo be the leading financial services provider in the region, building enduring client relationships through trusted advice and superior service. MissionWe live our values of Trust, Teamwork and Accountability, deliver superior performance and service, and generate sustainable benefits for all our stakeholders.
Achieving our Vision means delivering on the things that matter to our key stakeholders. To do this, we have commitments to each of our stakeholder audiences:
• Clients -Tohelpourclientsachievewhatmatterstothem• Employees -Tocreateanenvironmentwhereallemployeescanexcel• Communities -Tomakearealdifferenceinourcommunities• Shareholders -Togeneratestrongtotalreturnsforourshareholders
Succeeding will mean living by our values – Trust, Teamwork, Accountability – and creating value for all who invest in CIBC FirstCaribbean.
Values - Trust, Teamwork, AccountabilityValues define the character of both individuals and organizations. At CIBC FirstCaribbean, they shape our everyday decisions.
• Trust - Actingwithintegrity,honestyandtransparencyinourrelationshipswithothers• Teamwork - Working collaboratively with others within our Strategic Business Unit (SBU) and across
SBUstoachieveCIBCFirstCaribbean’s commongoals• Accountability - Accepting overall responsibility for our behaviour, decisions and outcomes in all relationships
with colleagues,withclients,withthecommunityandwithshareholders
Strategic Priorities• Cultivatingdeeperrelationshipswithourclientsacrossourbusiness• Focusingonvalueforourclientsthroughunderstandingtheirneeds• Competinginbusinesseswherewecanleverageourexpertisetoadddifferentiatedvalue• Pursuingrisk-controlledgrowthinthe region• Continuouslyinvestinginourclientbase,people,andinfrastructure
We are one of the largest regionally-listed financial services institution in the English and Dutch speaking Caribbean, with over US$11.4 billion in assets and market capitalization of US$1.8 billion.
5
First for ClientsEver mindful that a key contributor to our business success rests in the advocacy of our clients, in 2013 the Retail & Business Banking segment was steadfast in its mission to deepen customer relationships in order to be the leading financial services provider in the region.
Responding to our customers’ needs by:• Adoptingarenewedcrosssellapproachtoplacemoreproducts
and services in the hands of our customers• Enhancingthecustomerexperience–buildingtheengagement
of our customers and making an indelible mark through continued improvements to our service delivery
• Updating and refreshing our network branches and InstantTeller® machines.
Offeringviablesolutionsinsupportofregionalenterprise:• Cateringtotheachievementoftheirpersonalandprofessional
financial goals by offering businesses new products such asMedical Professional’s Edge
• Strengthening business partnerships by providing exclusivefinancial solutions for employees in the Corporate sector through Bank@Work
Delivering cutting edge products & services:• Introduction of the Home Equity Line of Credit – helping our
customers achieve their personal goals• Introduction of the Biz Line Credit Card to boost business
capability
Reaching new markets and clients:• MarketpenetrationofourInternationalVisaDebitCard• Implementingregion-wideconsumerloancampaignstosecure
greater market share
First for Employees We continued our focus on training, development and retention to improve our delivery of customer service excellence.
Employee Initiatives:• Completed the alignment of CIBC FirstCaribbean policies and
launched the first regional Employee Appreciation Day• Continued our focus on product-centric training for improved
sales capacity across the workforce• Aspart of a strategic initiative to improve servicequality and
business success, launched a customized cross-sell programfor the Retail business designed to embed the sales culture and trained 769 employees in customer service excellence – further positiveoutcomesexpectedinfiscal2014asroll-outcontinues
2013 Highlights
The2013E-Voicesurvey:• Employeecommitmentfiguresremainedsteadyoverlastyear’s
with improvements in areas of communication, colleagues, tools and resources continuing to be high
Increasing visibility of senior leaders:• Countries across the region continue to convene town-hall
meetings to improve access to and communication with senior leaders
First for CommunitiesThe social programmes undertaken by the CIBC FirstCaribbean International Comtrust Foundation have proven that the Bank continuestomakeadifferenceinthelivesofthepeopleitserves.In2013, this continued to be evident from the support the communities receivedwhetherfinancialorthroughthevolunteerismofstaff.
Our Corporate Social Responsibility partnerships have been maintained through:• Continuedfocusonsupportingeducationatalllevelsacrossthe
region• Recognitionthatthegoodhealthofourcitizensmatterstous
and the viability of our communities lies in finding a cure for diseases that threaten their livelihoods – giving rise to the Bank’s Walk for the Cure initiative to champion the fight against cancer-thewalkraisedoverUS$100,000tosupportthefightagainst cancer
Charting the way forward for this region’s young entrepreneurs:• Continuedendorsementofyouthentrepreneurshipwithfunding
to the Caribbean Association of Youth Business Programmes and Junior Achievement organizations
Protecting the environment and securing our future:• PartneringwithenvironmentalgroupSeacologytoprotectthe
mangrove coastline that provides critical habitat for marine life in Grenada and other initiatives
• Supportof“green”initiativesacrosstheregion
Actively participating in worthwhile causes to develop our communities:• Maintaining our community relations initiatives including the
Adopt-a-Causeprogrammeandotherworthwhileventures
First for Shareholders• Maintainedourcapitalstrength,withTotalCapitalratioat24%
wellaboveregulatoryminimumrequirements• Maintained our dividend payment level throughout this
protracted economic downturn.

6 CIBC FirstCaribbean Annual Report 20136 CIBC FirstCaribbean Annual Report 2013
US$millions,exceptpershareamounts,asatorfortheyearendedOctober31 2013 2012 2011 2010 2009
Common share information Pershare(UScents) -basic(loss)/earnings (1.7) 4.4 4.6 10.1 11.2 -dividends 3.0 3.0 4.5 6.0 6.0 Shareprice(UScents) -closing 114 135 142 138 134 Sharesoutstanding(thousands) -endoftheperiod 1,577,095 1,577,095 1,577,095 1,525,177 1,525,177 Market capitalisation 1,798 2,129 2,239 2,105 2,044
Value measures Dividendyield(dividendspershare/shareprice) 2.6% 2.2% 3.2% 4.3% 4.5%Dividendpayoutratio(dividends/netincome) n/m 68.4% 97.8% 58.3% 53.6%
Financial results Total revenue 530 543 507 563 568 Loan loss impairment 151 120 87 73 43 Operating expenses 403 348 338 317 320 Net(loss)/income (27) 72 74 157 175
Financial measures Efficiencyratio(operatingexpenses/totalrevenue) 76.0% 64.1% 66.7% 56.3% 56.3%Returnonequity(netincome/averageequity) (1.7%) 4.4% 4.6% 10.2% 12.3%Netinterestmargin(netinterestincome/averagetotalassets) 3.3% 3.5% 3.6% 3.9% 4.0%
Statement of Financial Position information Loans and advances to customers 6,329 6,832 6,616 6,576 6,905 Total assets 11,439 11,500 11,228 9,766 10,503 Deposits & other borrowed funds 9,623 9,641 9,415 7,988 8,696 Debt securities in issue 30 31 31 31 125 Totalequity 1,554 1,651 1,619 1,573 1,519
Statement of Financial Position quality measures Commonequitytoriskweightedassets 27% 27% 27% 27% 25%Risk weighted assets 5,668 5,845 6,097 5,856 6,124 Tier I capital ratio 23% 23% 21% 21% 19%Tier I and II capital ratio 24% 24% 22% 22% 22%
Other information Employees(#) 3,427 3,439 3,410 3,465 3,479
*n/m-NotMeaningful
Financial Highlights
2013 Highlights

7
For the fiscal year ended October 31, 2013 the Bank generated $529.9millioninrevenueandmaintainedstrongcapitallevelswithaTotalCapitalRatioof24%,which iswell inexcessof regulatoryrequirements. Our capital levels provide us with the strength toendure challenging times as well as to invest in the future.
Resultswereaffectedbyseveralitemsofnoteincluding$37.6million ($35.5million after-tax) of restructuring related expensesandanincreaseinthecollectiveallowanceforloanlossesof$25.0million ($21.6 million after-tax). This resulted in a reported netloss for the yearof$27.5million. Excluding these items, theBankgenerated$29.6millionofnet incomefortheyearcomparedwith$71.9millionintheprioryear.
Many of the economies in which we operate rely heavily on tourism and foreign direct investments. The overhang from the economic crisis continues to impede growth and by extension has negatively affected our results. Loan loss provisions this quarterwere higher than normal and include an increase in the collective allowance.TheBank is focusedonpursuingrisk-controlledgrowthand has taken considerable steps during the year toward the goal of becoming a lower risk bank.
Revenue for theyeardeclinedby2%to$529.9million,whilecore operating expenses increased 5% to $365.4 million. Loanloss impairment expenses rose 26% to $151.4 million. With thepersistent year-over-year increases in operating expenses amiddeclining revenues, exacerbated by many governments in markets we serve increasing taxes to address fiscal imbalances, the Bank took the difficult decision to restructure the organization to align it withthemarketrealitiesofthisnewera.Therestructuringrequiredachargeof$37.6millionandbroughttotaloperatingexpensesfortheyearto$402.9million.ThisactionisintendedtoputtheBankona trajectory path to return to profitability.
The Bank remains committed to our strategic priorities: cultivating deeper relationships with our clients across our business, focusing on value for our clients through understanding their needs, competing in businesses where we can leverage our expertise to
add differentiated value, pursuing risk-controlled growth in theregion, and continuously investing in our client base, people, and infrastructure.
This year we made significant extensions to our product portfolio that have been well received. Customer response to our Rewards for Credit Cards has been tremendous, and we continue to expand the benefits of the program. To allow clients to conveniently leverage value in their homeswe launched theHome Equity Lineof Credit (HELOC). For our Business Clients we launched the BizLine credit card, the first revolving credit card for businesses in the region.And,we developed a tailor-madepackage formedicalprofessionals—Medical Professional’s Edge
In addition, the credit adjudication systems and process improvements we embarked on last year are almost completed. Pilots are underway and full deployment promises to further improve service quality.We firmly believe that service excellenceis the hallmark of cultivating deeper client relationships. Account opening times have been reduced substantially with the introduction of simpler forms and streamlined processes. These enhancements should translate into an overall improved customer experience.
To grow, countries must have a strong infrastructure, and the countries we serve have ongoing infrastructure needs. CIBC has deep industry expertise in infrastructure arranging and financing. That’s why this year the Bank leveraged the strength of its parent to host a regional infrastructure conference in Nassau, Bahamas. The conference was well attended by key players and stakeholders and we plan to make it a fixture.
Investments in products, systems and processes cannot deliver return without commensurate investment in our people. Accordingly, the Bank invested heavily in staff training in branch, online andin classroom settings. Focus areas were customer service, risk management, credit systems, credit management and leadership. Of particular note, this year we partnered with the Canadian Securities Institute (CSI) to deliver Small Business Accreditation for ourBusiness Bankers.
Rik ParkhillChief Executive Officer
Chief ExecutiveOfficer’s
Letter
8 CIBC FirstCaribbean Annual Report 20138 CIBC FirstCaribbean Annual Report 2013
Chief ExecutiveOfficer’s Letter
CIBC FirstCaribbean takes its corporate social responsibility seriously, and despite the challenging economic climate we maintained our community giving. This year we retired UnsungHeroes and embarked on a new partnership with the Sickkids-Caribbean Initiative under the auspices of the University of theWest Indies (UWI) by contributingUS$1million.As theNursingTraining Partner, the Bank will support training of specialist nurses to care for children with cancer and blood diseases.
Adopt-a-cause, our employee driven program, continues tohave broad impact in our communities. I am particularly proud of the support for Walk for the Cure. This year employee participation across the region generated in excess of US$100,000 for breastcancer support – more than 3 times the US$30,000 raised lastyear. The Bank also renewed commitment to the development of youth business in the Caribbean by continuing support for the Caribbean Group of Youth Business Trusts in the firm belief that entrepreneurship is the foundation of economic growth.
We announced a final dividend for the year of $0.015 pershare, bringing the total dividend to $0.030 for the year. Ourdividend remains unchanged and reinforces our view that the future
continues to be promising for our franchise and our commitment to the Caribbean region is resolute.
For the second consecutive year our parent and majority shareholder, CIBC, has been ranked as the strongest bank in Canada andNorthAmericaandthird-strongestintheworldbyBloombergMarkets. We are proud to be part of the CIBC group of companies.
I want to take this opportunity to express sincere gratitude to Michael Mansoor who retired as the Bank’s Executive Chairman and Chairman of the Bank’s charitable foundation at the end of this Fiscal Year. Mike made a tremendous contribution to the growth and development of the CIBC FirstCaribbean, and in the process, earned the respect of all the Bank’s stakeholders. I would also like to place on record our appreciation to our regulators, our customers andstafffortheirsupportandloyaltyduringtheyear.
Rik ParkhillChief Executive Officer

9
Sitting left – right:Paula Rajkumarsingh, Michael Mansoor, Douglas ‘Rik’ Parkhill, G. Diane Stewart, Sir Fred Gollop
Standing left – right: BrianClarke(CorporateSecretary), Sir Allan Fields, David Ritch, Kevin GlassRichard Nesbitt
Missing: Christina Kramer and Brian O’Donnell
Regional Audit & Governance CommitteeKevin Glass – ChairmanLincoln EatmonSir Allan FieldsSir Fred GollopMichael MansoorRichard NesbittPaula RajkumarsinghDavid RitchG. Diane Stewart
Board ofDirectors
The mandate of the Audit Committee is to approve governance and internal policies. The committee is also required to review the effectiveness of internal controls, the annual audit plan, interim and audited financial statements and oversees the Internal Audit. The Committee is also mandated to approve the external and internal auditors, their annual plan and report as well as manage all aspects of the relationship with the External Auditors. The Committee acts as the nominating committee. The committee reviews legal, compliance and regulatory risk. The committee’s composition meets the independence and skill requirements of the Group’s Governance Manual.
Our corporate governance guidelines are available on our website at www.cibcfcib.com.

10 CIBC FirstCaribbean Annual Report 2013
Senior Executive Teamand Advisors
Front – sitting (left to right):Ella Hoyos, Managing Director, Human Resources; Michael Mansoor, LLD, Retired Chairman; Douglas“Rik”Parkhill,ChiefExecutiveOfficer;DonnaGraham,ManagingDirector, Governance&Controls;PatriciaRowe-Seale,ChiefAuditor(Ag).
Second Row (left to right): BenGillooly,ChiefExecutiveOfficer,CIBCBankandTrustCompany(Cayman)Ltd;Mark St. Hill, Managing Director, Retail and Business Banking; Mark Young, Managing Director, WealthManagement;DavidWhitcroft,GroupTreasurer;GeoffScott,ChiefRiskOfficer;Jude Pinto, Managing Director, Technology, Operations & Corporate Services.
Back Row (left to right): Daniel Farmer, Managing Director, Wholesale Banking; Trevor Torzsas, Managing Director, Customer Relationship Management and Strategy; Brian Clarke, General Counsel & Corporate Secretary; Donna Wellington, Managing Director, Barbados; Brian Lee, Chief Financial Officer.
Missing:ColetteDelaney,ChiefAdministrativeOfficer;DebbieKellett,ExecutiveConsultant-SpecialInitiatives;DuaneHinkson,ManagingDirector,Trinidad;MarieRodland-Allen,ManagingDirector,Bahamas;Mark McIntyre, Managing Director & Country Head, Cayman Islands; Nigel Holness, Managing Director & Senior Coverage Officer, Jamaica and Pim Van Der Burg, Managing Director, Curacao.
ADVISORS
Legal Advisors: Carrington & Sealy Chancery Chambers Fitzwilliam, Stone & Alcazar
Registrar and Transfer Agent: Barbados Central Securities
Depository Inc.
Auditors: Ernst & Young
Bankers: FirstCaribbean International
Bank(Barbados)Limited

2Section
12 Retail & Business Banking14 Wholesale Banking15 Wealth Management
12 CIBC FirstCaribbean Annual Report 2013
Innovative Products & Services
During the year, the Bank delivered to our customers and the market in general, a range of cutting edge products and services. At the core of the development of these products and services is meeting the needs of our customers by providing access, convenience, strong client experience and value. The products and services included:
International Visa Debit Card
This allows customers to use local and International Automated BusinessMachines (ABMs)with theVisa logo,makepoint-of-salepurchases and shop online just as with an International VISA credit card.Thekeydifference is thatthecustomer’ssavingsorchequingaccount is debited. The card is available in Classic and Platinum.
Biz Line Credit Card
This specifically caters to our Business Banking and Wholesale Banking Clients and serves a dual purpose – the option for clients to settletheirbalanceinfullorpay10%oftheoutstandingbalanceonamonthlybasiswhilegivingthemRewardsforqualifyingpurchases.
Other features include travel accident insurance, auto rental insurance, worldwide travel assistance, emergency cash and card replacement, access to the Visa International Service Centre and the ability to view card activity online as well as pay on line.
HomeEquityLineofCredit(HELOC)
HELOC provides our residential mortgage and land loan clients, who are eligible for equity financing, with a safety net in caseof emergencies - a form of revolving credit where they provideresidential property as collateral. These clients may utilize this product to expand their homes or simply fund large personal or ad hoc expenses more cheaply than an overdraft or credit card, through
a secured credit facility.One of the more outstanding features of this product is that as
the outstanding balance is paid down, more of the limit becomes available for further use without repeat credit assessments.
HELOC allows customers to have flexible draw and repayment schedules and the account can be accessed via Internet Banking to track the balance and transfer funds.
Medical Professional’s Edge
Earlier this year, we successfully completed a regional launch of the MedicalProfessional’sEdgecampaigntosalariedandself-employedmedical professionals to offer them financial wellness with a fullplatinum suite to meet both their personal and professional needs. This group of clients includes dentists, physicians, optometrists, podiatrists, pharmacists and psychiatrists. Feedback on this product continues to be heartening.
Pre-approved US$10,000 Lending Campaign
During theyearweofferedexisting landandmortgagecustomers,withgoodpaymenthistory,apre-approvedUS$10,000loan.Thetakeup has been overwhelming and meeting the needs of our clients.
Rewards Program - Credit Cards
At the beginning of Fiscal 2013, we revamped the Rewards Program originallypilotedin2007,andofferedittoallofourVisaClassicandGold cardholders in 15 markets. Clients who registered for Rewards cards before December 31, 2012 earned 500 bonus points. Also, as aspecialintroductoryincentiveweofferedtwopointsforeachUS$1spent(orthelocalequivalent)–untilDecember31,2012.
From January 1, 2013, rewards cardholders earn one point for every US $1 spent (or the local equivalent). Cardholders can also earnbonus points at local participating merchants.
Retail &Business Banking
The economic contraction across the Caribbean economies continued to be a main feature of the financial landscape in 2013. Against this backdrop and during these difficult times when our customers need a bank to be a true financial partner, the Bank’s strategic priorities during the year focused on the delivery of innovative products and services, improved client experience, convenience, access and cultivating deeper “value added” relationships to meet the needs of our clients.
Our 1,500 Retail & Business Banking employees have played a critical role in the delivery of our strategic priorities and we continue to make significant investments in our employees to serve our customers better and provided a strong foundation to further grow our business across the Region.
13
Clients are able to redeem their accumulated points: • Forcashbacktowardtheircreditcardbalance• Topurchaseawiderangeofmerchandiseatchoice international
online retailers •Comingvery soonVisaGoldcardholderswill beable to redeem
their rewards for travel benefits, such as flights, hotel bookings and vacations
Rewards clients may sign up on the rewards website, www.cibcfcibrewards.com, in order to track and redeem their points.
Investing in Client Experience and Deepening Client Relationships
The Bank continues to articulate a clear client focus across all bankingchannels-BranchNetwork,ABMs,Internet,TelephoneandMobile Banking. This thrust has extended to alternative banking solutions that also provide long term economic value. These include our Bank@Work and Pound the Pavement activities, which continue to bring banking products and services directly to our clients.
Committed to our mission to be the leading financial services provider in the region, building enduring client relationships through trusted advice and superior service we have undertaken some Branch improvements to better serve our customers.
In Barbados, we are making headway to open our new model flagship branch at Warrens in December 2013 which will be designed with customer needs as our first priority. At Sunset Crest, we listened to our customers and improved the layout of the banking hall based on much appreciated customer feedback. Regionally, we sought to “Pound The Pavement” and got into
the community to share knowledge of the products and services and their benefits with our customers and potential customers. This outreach was also conducted with Bank@Work where our RelationshipManagers stepped-up their client relationshipoffer tomore conveniently cater to our existing Corporate Clients and their
employees by heading to their organizations to offer additionalbenefits.
Finally, we have also optimized the branch complement of Customer Service Representatives to reduce waiting times in branch lines and arecompletingworkonreducingthenumberofformsrequiredtobecompleted by customers during the account Opening Process to one (1)formallowingclientstoaccessallmajorproductsandservices.
Our PeopleEmployee engagement and training remain critical components of our plans to improve our overall customer experience. CIBC FirstCaribbean’s investment in developing our talent pool continues toreaprewards.Duringtheyearnine(9)retail leaders fromseven(7)countriesweresecondedtoheadofficerotationstobroadentheirunderstanding of the business. These have paid good dividends in the short term and reinforced our commitment to promoting diversity in the work environment. This diversity has seen the appointment of three(3)femalesintopretailpositionsthroughouttheregion.
Mrs. Stephanie Burke – Country Head, Northern EC IslandsMrs. Giselle Farrington – Retail Director, BahamasMrs. Michelle Whitelaw – Retail Director, Barbados
In 2013, we introduced a new coaching framework for our branch management teams along with essential branch product knowledge class room training which was piloted in Barbados. These modules are building blocks to ensure we deliver on our Bank’s vision.
During the year we worked closely with the Canadian Securities Institute (CSI) to be first to market in the Region with the SmallBusiness Accreditation – a programme specifically tailored for our ownBusinessBankers-anothersteptowardssettingusfurtherapartfrom our industry peers to give us a competitive advantage.
Finally, we again salute our 1500 retail employees on the frontlines who continue to drive the pride in the brand and touching the communitiesweserve.Youreffortsareappreciated!
Retail &Business Banking
14 CIBC FirstCaribbean Annual Report 2013
WholesaleBanking
Segment Renamed
During the year we incorporated the Client Solutions Group headed by Martin Peichl and the Structuring & Distribution Group led by Irene Markus into the Corporate and Investment Banking Segment. To consolidate these positions, we changed the name of the segment to Wholesale Banking. The renaming of our segment now more closely aligns us with the naming architecture in use at our parent company, CIBC.
The Client Solutions Group assists our clients with their hedging and now foreign exchange needs and the team has been strengthened during this past year. The Structuring & Distribution Group assists our Corporate & Investment Banking team with the structuring, syndication and execution of our transactions allowing our front line teams to focus more on our Clients’ needs. To further bolster ourefforts inpursuitofourstrategicobjectives,wealsoappointedBerisford Grey to head our Corporate & Investment Banking Group.
Economic Outlook
The economic challenges in the region continued during fiscal 2013 with some green shoots emerging in Trinidad, Dutch Caribbean and parts of the Northern Caribbean. Several governments have pursued debt restructuring initiatives in order to put their fiscal house in order and many are implementing fiscal measures which will impact growth in the near term. Against this backdrop which has resulted in a weak business climate, credit demand remains soft. In Wholesale Banking we have aligned our strategic initiatives recognizing some of the market vulnerabilities but with a focus on the areas or countries that provide opportunities for growth. Additionally, and most importantly, we are ensuring that at the very core of each initiative the customer is top of mind and this must continue to be our number one focus.
Client Relationships and ProductsAs we continue to deepen our client relationships, focus continues
tobeonoursuiteofnon-creditproductsincludingtransactionbankingservices,E-channelsandInternetandourdepositproducts.Wewishto ensure that we are always delivering a full suite of products to meet our customers’ needs.
MarketawarenessformorePrivatePublicPartnerships(P3)giventhe fiscal constraints of many of the Governments in the region is allowing us to leverage our global expertise in this area. We recently held a conference in Nassau to discuss the various opportunities as well as some areas that need to be addressed in this space. This will continue to be one of our main areas of focus along with Energy includingRenewable,Utility,InformationTechnology/Communicationand Manufacturing. We are confident that we are best positioned to execute transactions successfully in these industries based on historic deal activity, a strong client base and best in class expertise. We will continue to work with our International Banking Partners and our parent bank, CIBC, to bring focus to these key target industries, especially infrastructure. We expect that these sectors will be critical to helping the region return to sustainable growth.
Client Experience
Another key component in providing excellent value to our client is our focus on client experience. During 2013, we have significantly removed operational and administrative activities away from the front-line personnel to ensure Corporate Managers and ClientService Officers allocate more time to work with, interact and provide solutions to clients. We have streamlined, strengthened and overall improved our credit adjudication processes which should further positivelyaffectourcustomerexperienceespeciallywiththecreationof the Structuring & Distribution Group and further integration of the Corporate and Investment Banking units.
Outlook
Our financial results in fiscal 2013 reflect the realities of the economic environment previously highlighted. As we approach 2014, we are more positive in Wholesale Banking given our various growth initiatives, strong and experienced team now fully in place and that we have completed the majority of our internal credit initiatives to strengthen our control and governance framework.
We take this opportunity to thank our clients and key stakeholders for their support and trust over the year and look forward to serving you in 2014.
15
WealthManagement
In Wealth Management we are in business to help customers achieve what matters to them.
The economic environment during the last year has continued to provide challenges and opportunities for our Wealth Management business during 2013. With market volatility, the move toward full disclosure, fully transparent information exchange agreements and ethical debates around what is the fiduciary role of directors to navigate between what is morally right and legally possible – 2013 has been an interesting year. Throughout, we have maintained our stance of being available for clients with what matters to them.
In Wealth Management at CIBC FirstCaribbean we are proud of our long history of serving wealth clients. We have a tradition of focus on the component sectors. CIBC FirstCaribbean has a strong InternationalBankingbusinessbasedinsix(6)keycentresrenownedglobally for their excellence in providing international products and services.
Our business is built around a platform of core relationships with Key Business Introducers (KBI) in each market, who is aninternational business services provider in their own right whether it being in providing accounting, legal, trust administration, insurance management, fund management or corporate formation and administration services to name just a few. Our approach has been to gain an intimate understanding of the needs of these firms to ensure we directly address these needs.
These relationships are complemented by direct relationships with wealthy individuals and families particularly those who had real estate(typically2ndorvacationhomesintheCaribbean)whichleadto the development of our market leading International Mortgage product. We also support these families with their banking and investmentneedswheretheyhaveotherwealthheldoffshore.Theoffertobothsegmentsisbolsteredwithanextremelystrong
internet banking platform which was complemented with a suite of money transmission and cash management products and services all of which can be delivered in multiple currencies.Weofferastrongdiscretionaryassetmanagementproductbased
on research and models from CIBC Global Asset Management (CGAM)whichcanbe tailored tofit the investment riskprofileofmostHighNetWorthIndividuals(HNWI).
We have linkages to key Latin American Markets where a network of strong relationships with KBI and major corporations who trade internationally and direct relationships with wealthy families provides new area of capability and growth to the CIBC FirstCaribbean group.
From our parent, CIBC, we have brought greater product capability in the Wealth Segment with one example being the leveraging of the
strong Axiom Mutual Funds capability in Canada to manufacture a Caribbean based version of these funds suitable for international investors who have funds and wealth managed throughout the Caribbean.
We have strengthened our capability to service Wealth Management clients with the integration of the CIBC Bank & Trust business located in the Cayman Islands and the Bahamas. This added an award winning capability to service international trust business and a fund administration further widening the scope of clients we can assist and the range of services we can provide.
Despite the significant increase in global compliance such as ForeignAccountTaxComplianceAct(FATCA)andtheincreasinguseof Family Offices, the trust business in Bahamas has particularly had a strong financial year and the funds and trust businesses in Cayman have also grown. Continued leverage of KBI has fostered deeper relations and referrals and continuity of staff providing bespokeservice to all generations of clients whilst understanding their needs allows us to differentiate us from our peers. Introducing PrivateWealth Management through the Caribbean will only enhance our overallserviceoffering.
During 2012, we made the decision to combine all parts of the group that handle international and domestic HNWI clients under the Wealth Management group. This brings International Banking (includingInternationalCorporateandInternationalPersonalBanking),Investment Management, Private Wealth Management and CIBC Bank & Trust capabilities together to give focus and management attention in one place and to enable us to service all clients in one business unit.
We have enhanced our risk and control framework which was a key enabler for the development of our strategy and our plans to work with key stakeholders to grow our business.
We continue to invest for growth in the Wealth Management sector as an area for renewed growth for CIBC FirstCaribbean. We have many exciting developments to come including:• An enhanced Private Wealth Management service via
investment in people, products and services• A renewed Investment Management business via significant
investment in the platform, infrastructure, products and people to support not just Wealth Management clients but also those in Retail & Business Banking and Wholesale Banking
• AgrowingInternationalBankingbusinesswitharenewedfocuson international trading and investors utilising Double Taxation Agreement benefits, Latin American growth and a rejuvenated expatriate banking capability.

10 CIBC FirstCaribbean Annual Report 2013
3Section
17 Our Employees19 Our Communities

17
In support of the Bank’s vision to be the leading financial services provider in the region, building enduring client relationships through trusted advice and superior service; we continue to strive to attract, develop and retain high quality talent across the region. Thiscontinues to be a challenge in an environment where all financial institutions are competing for the same talent and where Caribbean nationals continue to aspire to careers overseas. CIBC FirstCaribbean continues to employ approaches and that will build a talent pool that distinguishes us from the competition in quality, output andefficiency as we seek to support the Bank’s strategy and business initiatives. In 2013, this was evident in the areas of Recruitment, Training, Industrial Relations, Executive Development, Graduate Recruitment and Tuition assistance.
Recruitment
The Bank has a rigorous Recruitment Policy that spans the seventeen (17)territoriesandisgearedatattractingandrecruitingatthehighestlevel in the market. This is supported by a structured job evaluation and role creation process that ensures that the right candidates are placed in the right jobs. In 2013, HR personnel participated in a Recruitment and Selection program to refresh skills and embed recruiting standards across the business.
Training
The Learning and Development Unit continues to support thebusiness through the development and delivery of technical training programs to embed technical skills and roll out new systems and processes in all areas across the business. 2013 focus areas were Loans Maintenance, Credit Cards, Banking Operations, Wealth Managementandentryleveltrainingforfrontlinestaff.
In 2013, we continued to cement the delivery of leadership andpeoplemanagement trainingthroughtheCIBCdriven“PeopleManager Essentials” Programme. This is a leadership skillsdevelopment program which covers managing performance, managing communication and managing for success. To date, we have trainedover four hundred (400)managers andwe continueto receive very positive feedback from participants. To support this endeavor, we launched an online People Manager Resource Center, which provides learning material from the program and both participants and their managers can access and utilize the material.
Back in 2011, we launched a Customer Service Training program designed for all employees to reinforce service standards and behaviours. To date we have trained seventeen hundred (1700)employees, seven hundred and sixty-nine (769) in 2013 andthis will continue as we work assiduously to support the Banks
CIBC FirstCaribbean continues to employ approaches and that will build a talent pool that distinguishes us from the competition in quality, output and efficiency as we seek to support the bank’s strategy and business initiatives.
OurEmployees
2012 Players of the Series, chosen as the Bank’s top achievers, visit the Bank’s regional headquarters.
18 CIBC FirstCaribbean Annual Report 2013
service strategy. As the Bank moves towards building an active and productive sales culture, 2013 saw the launch of a Selling Skills program designed for Retail and Corporate employees. The programmecoversa5-stepcrosssellprocessandwillcontinuetobe rolled out in 2014.
Industrial Relations: Partnership Principles
The original FirstPartnership Principles Agreement between CIBC FirstCaribbean and theCaribbeanTradeUnions representing ouremployees was established in May 2005.It brought togetherCIBC FirstCaribbean and the TradeUnions
across ten (10) Caribbean countries into a single PartnershipFramework, while allowing each union the flexibility to support local conditions.
The Partnership Agreement is still to this day regarded as a huge milestone in the landscape of Caribbean trade unions and employeerelations.Two(2)otherTradeunionshavesincejoinedthePartnershipbringingtotwelve(12)thenumberofactiveunionpartners.Over the last ten (10) years, our Partnership Principleshave remained a guiding force in the relationships we enjoy with our union partners as we continue to engage each other and to work together in the interest of our key stakeholder, our employees.
Executive Leadership Training
The Bank is committed to developing its leaders to meet the regional and global challenges of the business. To this end, our parent company CIBC has entered a partnership with Robert Ulrich,authorofthegroundbreakingbook,LeadershipCode,whichdetails five rules to lead by. A programme has been developed and the Senior Executive Team in CIBC FirstCaribbean all participated in thisprogram in2013 .Thecourse isnowa requirement forallexecutives. This training programme is further supported by regional and overseas assignments.
The Bank also has a structured career and succession planning programme at the executive level to ensure that business leaders are being identified and developed to manage existing roles and to fill future roles.
OurEmployees
Graduate Recruitment Programme
The purpose of this programme is to attract high potential graduates from the region’s top universities to CIBC FirstCaribbean’s business in order to create a pool of future leaders and invest in the skills, knowledge and experience of our people. In doing so, we seek to strengthen our overall capability and develop a competitive edge in the banking sector.
This Graduate Recruitment Programme which forms part of CIBC FirstCaribbean’s overall recruitment strategy is an intensive programmespanningaperiodofthirty(30)months.Itisdesignedto provide candidates with the opportunity to acquire technicalknowledge while developing critical business skills. It is open to both internal and external candidates. Over the years we have had several successful graduates enter the programme, who are now employed in various positions in the Bank.
Tuition Assistance Programme (TAP)
CIBC FirstCaribbean has always been committed to the continuous education of its employees. The Bank has supported educational and professional development programmes over the years, in order to buildthecapabilitiesrequiredtoachieveourbusinessstrategy. Inaddition toongoing learningopportunitieswhichareoffered toallour employees, TAP provides financial assistance for employees to pursue educational advancement through the completion of tertiary programmes (i.e. degree/diploma) as well as the completion ofprofessionalqualifications.Overthelastten(10)years,manyofouremployeeshavetaken
advantage of this programme and successfully completed courses, in order to prepare themselves for advancement in their chosen fields.
The programmes highlighted above along with our reward and recognition programmes and a professional, supportive, and fair working environment, together all explain why the Bank continues to maintain high employee satisfaction results, good retention ratios and a high performing talent pool. We will continue to innovate and engagewithouremployeesinourquesttoremainanemployerofchoice.

19
OurCommunities
Our Communities
In 2013, the charitable work of the CIBC FirstCaribbean Community Trust continued in recognition of the growing need among regional communities for private sector partnership and funding. Our work across the Caribbean focused on renewed support for existing programmes through our Memoranda of Understanding(MOU) and community outreachprogrammes, where need for further tangible support continued to be expressed. Again, with the collective support of 3400 employees, the Bank solidified its commitment to rally behind its communities, helping them firmly along the path of growth.
University of the West Indies (UWI) MOU
Having signed its firstMOUwith theUWIat theBank’s inception,CIBCFirstCaribbeanandtheUWIcontinuetoshareanenduringbondwhich has, at its centre, the desire to unlock the region’s future through the nurturing of academic excellence. 2013 continued to witness the forging of a steady relationship to the benefit of this region’s young academics. There is little doubt that, as a result, a healthy research environment exists along with a commitment to pursue academic excellence and the fostering of an entrepreneurial culture among the Caribbean’s brightest minds.
Research Grants
Theyear-long researchoffiveacademicsacrossdisciplines ineachoftheUWI’sthreecampuseswasmadepublicin2013.TheresearchwasmadepossibleafteraninjectionofUS$75,540tofundacademicinquiry for this period. The findings of the research will also beaccessible to faculties and students.
Topics included: Monetary Policy to Promote Economic Diversification in a Small Petroleum Dependent Economy; Joining the SecondRevolution:FromMicro-credittoMicro-financialServices inthe Caribbean; Modeling the Potential Macro-Economic Impact ofMobile Financial Services in Delivering Path/ Pension Payments inJamaica, among others.
Scholarships
CIBC FirstCaribbean offers fifteen (15) scholarships annually toundergraduate and graduate students. The Bank is keen to assist the UWIinensuringthatitsgraduatesinbanking,financialservicesandrelatedareasarewell-roundedindividualswhoarecapableoftakingtheir places as leaders in the Caribbean community.
Anitra George, who is pursuing a double major French and Spanish atCaveHill, isoneoffifteen(15)scholarshipwinnerswhoreceived US$2,500 each to assist with expenses toward their studies. The
Anitra George from the twin island of Antigua and Barbuda receiving her scholarship award from Mr. Mark St. Hill, Managing Director, Retail & Business Banking, CIBC FirstCaribbean.
20 CIBC FirstCaribbean Annual Report 2013
OurCommunities
awardees were congratulated on their impressive academic achievements during the annual awards ceremony held in their honour in April.
Supporting Student Entrepreneurial Empowerment Development (SEED)
Support and investment in entrepreneurship among young people throughout the region, continues to be a central focus. CIBC FirstCaribbean and theUWI annually host a business plan
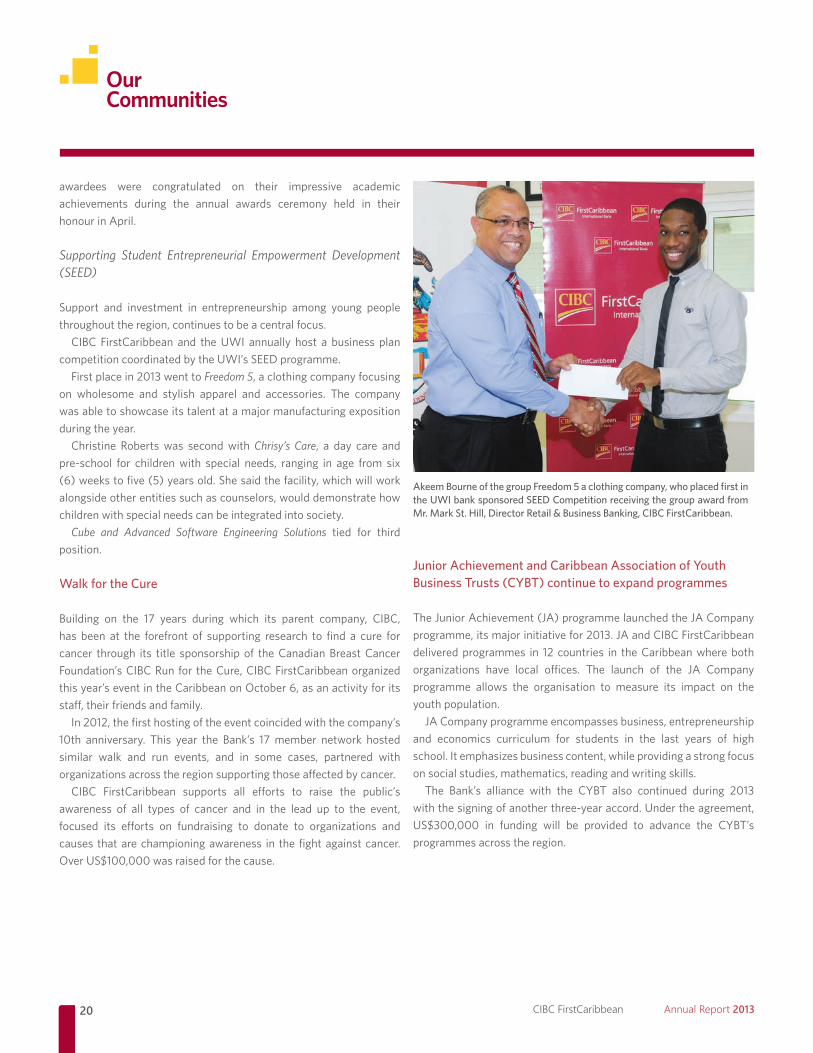
competitioncoordinatedbytheUWI’sSEEDprogramme.First place in 2013 went to Freedom 5, a clothing company focusing
on wholesome and stylish apparel and accessories. The company was able to showcase its talent at a major manufacturing exposition during the year.
Christine Roberts was second with Chrisy’s Care, a day care and pre-school for childrenwith special needs, ranging in age from six(6)weekstofive(5)yearsold.Shesaidthefacility,whichwillworkalongside other entities such as counselors, would demonstrate how children with special needs can be integrated into society.
Cube and Advanced Software Engineering Solutions tied for third position.
Walk for the Cure
Building on the 17 years during which its parent company, CIBC, has been at the forefront of supporting research to find a cure for cancer through its title sponsorship of the Canadian Breast Cancer Foundation’s CIBC Run for the Cure, CIBC FirstCaribbean organized this year’s event in the Caribbean on October 6, as an activity for its staff,theirfriendsandfamily.
In 2012, the first hosting of the event coincided with the company’s 10th anniversary. This year the Bank’s 17 member network hosted similar walk and run events, and in some cases, partnered with organizationsacrosstheregionsupportingthoseaffectedbycancer.CIBC FirstCaribbean supports all efforts to raise the public’s
awareness of all types of cancer and in the lead up to the event, focused its efforts on fundraising to donate to organizations andcauses that are championing awareness in the fight against cancer. OverUS$100,000wasraisedforthecause.
Junior Achievement and Caribbean Association of Youth Business Trusts (CYBT) continue to expand programmes
TheJuniorAchievement(JA)programmelaunchedtheJACompanyprogramme, its major initiative for 2013. JA and CIBC FirstCaribbean delivered programmes in 12 countries in the Caribbean where both organizations have local offices. The launch of the JA Company programme allows the organisation to measure its impact on the youth population.
JA Company programme encompasses business, entrepreneurship and economics curriculum for students in the last years of high school. It emphasizes business content, while providing a strong focus on social studies, mathematics, reading and writing skills.
The Bank’s alliance with the CYBT also continued during 2013 withthesigningofanotherthree-yearaccord.Undertheagreement,US$300,000 in funding will be provided to advance the CYBT’sprogrammes across the region.
Akeem Bourne of the group Freedom 5 a clothing company, who placed first in the UWI bank sponsored SEED Competition receiving the group award from Mr. Mark St. Hill, Director Retail & Business Banking, CIBC FirstCaribbean.

21
OurCommunities
Unsung Heroes
Seventy-year-old Gerda Gosepa topped the list of 17 regionalfinalists after a panel of judges met in October to make the final selections. This is the second consecutive year that Curacao has producedtheregion’stopUnsungHero.
Gosepa is a volunteer and leader at Funashon Mangusá, a foundation for the advancement of the residents of Flip, a low-income village in Banda Bou, located in the rural western area of Curacao. She is also a long time women’s activist, social worker and peer educator.Also chosen for special honour were 83 year-old Edward
WilliamsfromSt.Vincent,acommunityworkerandcare-giverandBonti Liverpool, 60, from Dominica, a reformed drug addict who throughhisowneffortsrehabilitatedhimselfandhasdedicatedhislife to saving others.
Dawn Smith (left) collects Regional Unsung Hero Awardee 2012 Edward Williams’ award on his behalf from Ella Hoyos, Managing Director, HR, CIBC FirstCaribbean.
Regional Unsung Hero Awardee 2012, Bonti Liverpool of Dominica (left) happily accepts his award from Ella Hoyos, Managing Director, HR, CIBC FirstCaribbean.
Regional Unsung Hero 2012 Gerda Gosepa of Curacao receives her award from Ella Hoyos, Managing Director, HR, CIBC FirstCaribbean.

10 CIBC FirstCaribbean Annual Report 2013
4Section
23 Management’s Discussion and Analysis31 Audited Consolidated Financial Statements 2013 and Accompanying Notes
23
Management’s Discussion and Analysis
Management’s discussion and analysis (MD&A) should be read in conjunction with the audited consolidated financial statements included in this Annual Report. The consolidated financial statements have been prepared in accordance with International Financial Reporting Standards and are expressed in United States dollars. Certain comparative amounts have been reclassified to conform with the presentation adopted in the current year.
Overview
CIBC FirstCaribbean International Bank is a leading Caribbean financial institution providing individual and business clients with a full range of products and services through our three (3) businesssegments – Retail & Business Banking, Wholesale Banking and Wealth Management. Our business segments service clients in seventeen (17)countriesthroughoureight(8)operatingcompanieslocatedin Bahamas, Barbados, Cayman, Jamaica and Trinidad.
The business segments and geographic operating companies are supported by the Administration segment which includes Finance, Human Resources, Risk, Technology, Operations & Corporate Services, Treasury, and other support units. Highlights and commentary on business segments can be found in the 2013 Highlights Section of this Annual Report.
The following discussion and analysis is based on the Group’s overall results and financial position with commentary referring to segments and geographic operations when deemed relevant.
Nature of the business
TheGroupofferstraditionalbankingsolutionsforwhatmatterstoitsclients in the markets in which it operates. It maintains capital well in excess of the regulatory minimums and deploys this capital together with other deposits in interest earning assets within its managed risk appetite. The main geographic markets in which the Group operates and is regarded as one of the largest banks are Barbados, The Bahamas, The Cayman Islands and The Eastern Caribbean Islands. The macroeconomic environments in these territories influence theGroupand its results.TheGroup isalsoaffectedby theglobalmacroeconomicenvironmenttotheextenttheyaffectthedriversoffinancialriskstowhichtheBankisexposedsuchascredit, liquidityrisk and other market risks including currency risk, interest rate risk and other price risk.
Objectives and strategies
The Group continues to focus on five stategic priorities to address market trends: Cultivating deeper relationships with its clients across its business; Focusing on value for its clients through understanding their need; Competing in businesses where the Group can leverage its
expertisetoadddifferentiatedvalue;Pursuingrisk-controlledgrowthin the region; and Continuously investing in its client base, people and infrastructure.
Resources, risks and relationships
The most important resources and relationships available to the Grouparedrivenby itsclients,employees,communities (includingits regulators)and its shareholders.Over theyears, theGrouphasdeveloped these resources and relationships to synergistically deliver what matters.
Using thecapitalprovidedand reinvestedby theshareholdersand other funding from clients, the Group, through the work of its employees is able to provide a stable affordable source of fundingto its clients, contributing to building the communities in which the Group resides.
The risks faced by the Group (including credit, market,compliance, operational, and liquidity) and approach to managingtheserisksarediscussedfurtherundertheheading“RiskManagementApproach”inthisdiscussionandanalysis.
Review of results, performance measures and indicators
Review of the Consolidated Statement of (Loss)/IncomeHighlights$millionsexceptpershareamounts,asator for the year ended October 31 2013 2012Total revenue 530 543Net(loss)/income (27) 72Net(loss)/incomeattributabletothe
equityholdersoftheparent (27) 69Total assets 11,439 11,500Basic(loss)earningspershare(cents) (1.7) 4.4Dividend per share 3.0 3.0Closingsharepricepershare(cents) 114 135Returnonequity (1.7)% 4.4%E�ciency ratio 76.0% 64.1%Tier I capital ratio 23% 23%Total capital ratio 24% 24%
24 CIBC FirstCaribbean Annual Report 2013
During 2013 the Group approved and announced a plan to restructure its operations with the aim of enhancing its long term competitiveness through reductions in costs, duplication and complexity in the years ahead. The plan will achieve operational efficienciesandannualsavings.Theplanisestimatedtocost$37.6million before taxes and has been included in operating expenses for this year.
Further contributing to the loss this year was the increase in loan loss impairment, declining net interest income and increased other operating expenses, the collective impact of which was partially offsetby increasedoperating income.Theregioncontinues to facesignificant economic challenges and this is reflected in the protracted slowdowninbusinessactivityandincreasedratesofloandelinquency.
Theresultsforbothperiodswereaffectedbycertainsignificantitems as follows:
2013 • $55millionincreaseinoperatingexpenseswhichincludes$37.6
million related to restructuring expenses• $31million increase in loan loss impairment reflecting further
deterioration of collateral and updates to key assumptions• $24 million decrease in net interest income largely due to
sustained downward pressure on loan volumes and margins in key markets
• $11 million increase in operating income driven by foreignexchange and securities gains
2012 • $33millionincreaseinloanlossimpairmentduetodeterioration
incollateralvalues,newnon-performing loansandupdates tokeyassumptions/inputinarrivingattheallowance.
• $11millionincreaseinnetincomefromtheacquisitionofCIBCBank and Trust entities in Cayman and Bahamas.
• $19milliondecreaseininterestexpensesrelatedtolowercostoffunds and interest rate swap volumes
Totalrevenueisdownyearonyearby$13million,duetolowernetinterestincomeof$24millionpartiallyoffsetbyincreasedoperatingincomeof$11million.
Totalexpenses increasedyearoveryearby$86millionduetoincreasedoperatingexpensesof$55millionand increase loan lossimpairmentof$31million.
Net interest income and margin
$millionsfortheyearendedOctober31 2013 2012Average total assets 11,470 11,364Net interest income 373 397Net interest margin 3.3% 3.5%
Net interest income decreased year on year by $24million (6%)largelycausedbylowerloanvolumesandmarginspartiallyoffsetbylower deposit funding costs.
Operating income
$millionsfortheyearendedOctober31 2013 2012Net fee & commission income 102 99Foreign exchange earnings 44 41Net gains 5 2Other 6 4 157 146
Operatingincomeincreasedyearonyearby$11million(7%)primarilyduetohighergainsfromsaleofavailable-for-salesecurities,higherincome from Fiduciary & Investment Management fees and Foreign exchange gains.
Operating expenses
$millionsfortheyearendedOctober31 2013 2012Remuneration and benefits
Wages and Salaries 181 153Benefits 50 44
231 197Property&equipmentexpenses 47 44Depreciation 23 20Business taxes 32 23Professional fees 12 10Communications 10 10Other 48 44 403 348
Management’s Discussion and Analysis
25
Management’s Discussion and Analysis
Review of the Consolidated Statement of Total Comprehensive (Loss)/Income
$millionsfortheyearendedOctober31 2013 2012Net(loss)/incomefortheyear (28) 72Othercomprehensive(losses)/income Net(losses)/gainsonavailable-for-saleinvestment securities (6) 14Exchangedifferencesontranslationof foreign operations (14) (5)
OtherComprehensive(loss)/income (20) 9Totalcomprehensive(loss)/income (48) 81
Other comprehensive income declined year on year as a result of net losses from investment securities compared with gains in the prior year, due primarily to sales in the current year.
The Group conducts business in two jurisdictions (Jamaica andTrinidad)thathavefunctionalcurrenciesthatfloatagainsttheUnitedStates(US)dollar.TheJamaicadollarcontinuedtoweakenby15%year on year, while the Trinidad dollar remained relatively stable. This hascontinuedtoresultinhigherexchangedifferencesof$14millioninthecurrentyearcomparedwithlossesof$5millionintheprioryear.
Review of the Consolidated Statement of Financial Position
$millionsfortheyearendedOctober31 2013 2012
Assets Cash & balances with banks 2,312 2,381Investment securities 2,214 1,704FinancialassetsatFVthroughprofitorloss - 15Loans and advances:
Mortgages 2,356 2,476Personal 584 590Business & Sovereign 3,658 3,979Other 25 31Provision for impairment (netofrecoveriesandwriteoffs) (294) (244) 6,329 6,832
Other assets 584 568 11,439 11,500
Operating expenses increased year on year by $55 million (16%)primarilyduetorestructuringexpensesof$37.6millionandincreasedbusiness taxes of $9 million. The costs of restructuring includeseverance benefits, curtailment gains and losses on retirement benefit and obligations and accelerated depreciation. The restructuring costs were the main driver of the increase to remuneration and benefits, property& equipment expenses and depreciation. The increase toBusiness tax is caused by tax assessments and increased value added taxesonservicestonon-residents.OtherexpensesincreasedlargelyduetoanincreaseinNon-creditlosses.
Loan loss impairment
$millionsfortheyearendedOctober31 2013 2012Individual impairment
Mortgages 58 28Personal 12 18Business & Sovereign 60 68
130 114Collective impairment charge 21 6
151 120
Loan loss impairment increasedby$31million(26%)yearonyear.The specific allowances increased by $16 million as a result ofdecliningcollateralvalues,newnon-performingloansandassumptionupdates. The collective allowance increased by $15million due toassumption updates reflecting the continued strained economic conditions in the region.
The ratio of loan loss impairment to gross loans was 2.3%comparedwith 1.7% at the end of 2012.However non-performingloanstogrossloansdeclinedto12.1%attheendof2013comparedto12.4%attheendof2012.
Income tax expense
$millionsfortheyearendedOctober31 2013 2012Income tax expense 3 2Net(loss)/incomebeforetaxes (25) 74Effectivetaxrate (12.2)% 3.2%
Income tax expense increased slightly year on year despite losses in thecurrentyear.Theincreaseintaxesislargelyduetothewriteoffofdeferred tax assets and expenses incurred which are not deductible for tax purposes. Additionally a higher portion of the expenses incurred in the current year was incurred in low tax jurisdictions. The combinedimpactoftheabovehasbeenamoveintheeffectivetaxratefrom3.2%to(12.2)%.
26 CIBC FirstCaribbean Annual Report 2013
Management’s Discussion and Analysis
Transactions between the business segments are on normal commercial terms and conditions.
Retail & Business Banking
Retail Banking includes Retail, Business Banking and Cards businesses. This segment provides a full range of financial products and services to individuals which can be accessed through our network of branches and ABMs, as well as through internet, mobile and telephone banking channels. Business Banking clients are provided with products and services to satisfy their day to day operational and working capital business needs. Cards offeringincludesboththeissuingandacquiringbusiness.
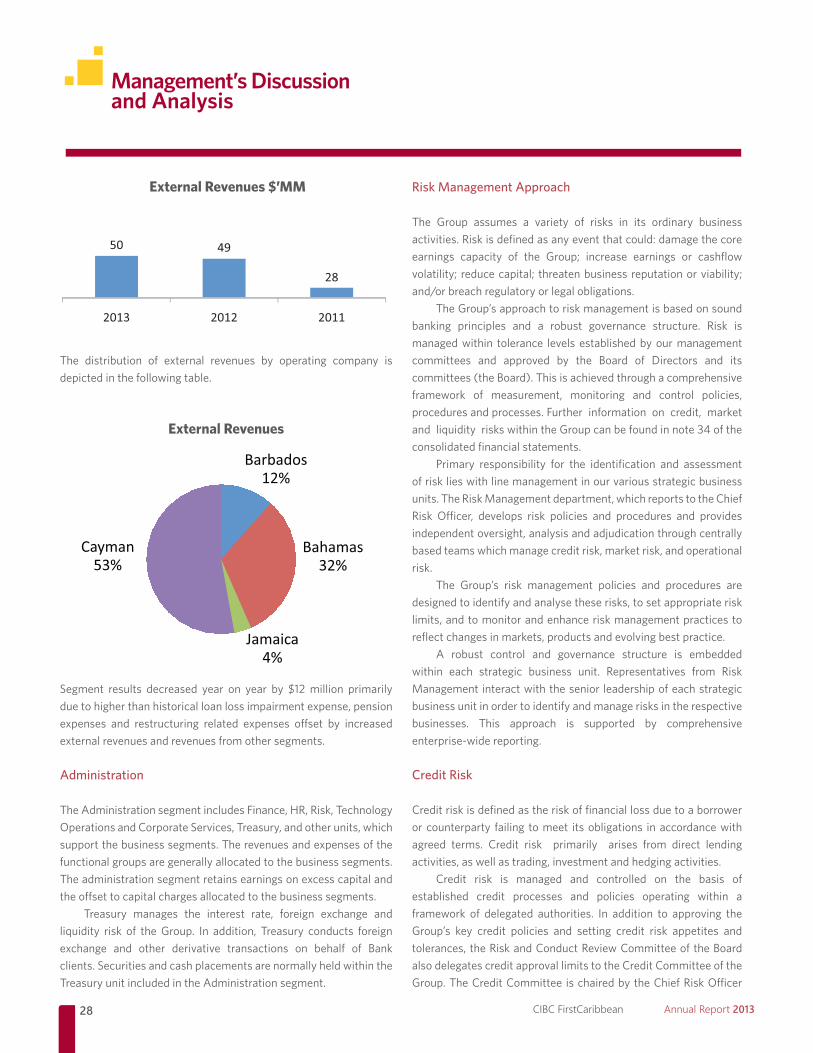
External revenues declined year on year by $7million or 4%due to lower lending volumes and rates affected by high levels ofnewnon-performingloans,aswecontinuetofeeltheimpactofthesluggish regional economies along with interest income adjustments onimpairedloans.Thesewerepartiallyoffsetbyincreasedrevenuefrom our Cards and Insurance products driven by higher volumes and improved claims experience respectively.
External Revenues $’MM
The distribution of external revenues by operating company is depicted in the following table.
External Revenues
Liabilities & shareholders’ equity Customer deposits
Individuals 5,005 5,022Business & Sovereign 4,568 4,487Banks 16 100Interest Payable 18 16
9,607 9,625Other borrowed funds 16 16Debt securities in issue 30 31Financial liabilities at FV through
profit or loss - 15Other liabilities 232 162Non-controllinginterest 27 30Equityattributabletoequity
holders of the parent 1,527 1,62111,439 11,500
Total assets decreased by $61 million (1%) primarily due todecreased loans and advances mitigated by increased Investment securities. Loans and advances decreased by $503 million (7%),whileInvestmentsecuritiesincreasedby$510million(30%).
Total liabilities remained flat increasing marginally by $35million (0.3%).Customerdeposits remainedflatdespite the fall inloans and advances.
Equityattributabletoequityholdersoftheparenthasdecreasedyearonyearby$94million(6%)duemainlytonetlossfortheyearof$27million,othercomprehensivelossesof$20millionanddividendsof$47million.
Our capital strength protects our depositors and creditors from risks inherent in our business, allows us to absorb unexpected losses and enables us to take advantage of attractive business opportunities. The Group continues to maintain strong capital ratios of Tier I and Tier I& IIof23%and24%respectivelyattheendof2013,well inexcessofregulatoryrequirements.
Business Segment Overview
Management monitors the operating results of its business segments separately for the purpose of making decisions about resource allocation and performance assessments. Segment performance is evaluated based on economic profits, which for the total of all segments is equal to net income before taxes reflected on theconsolidated financial statements. Economic profits include funds transfer pricing, management allocations, and charges for the segments’ use of capital.
Income taxes are managed on a group basis and are not allocated to operating segments.
27
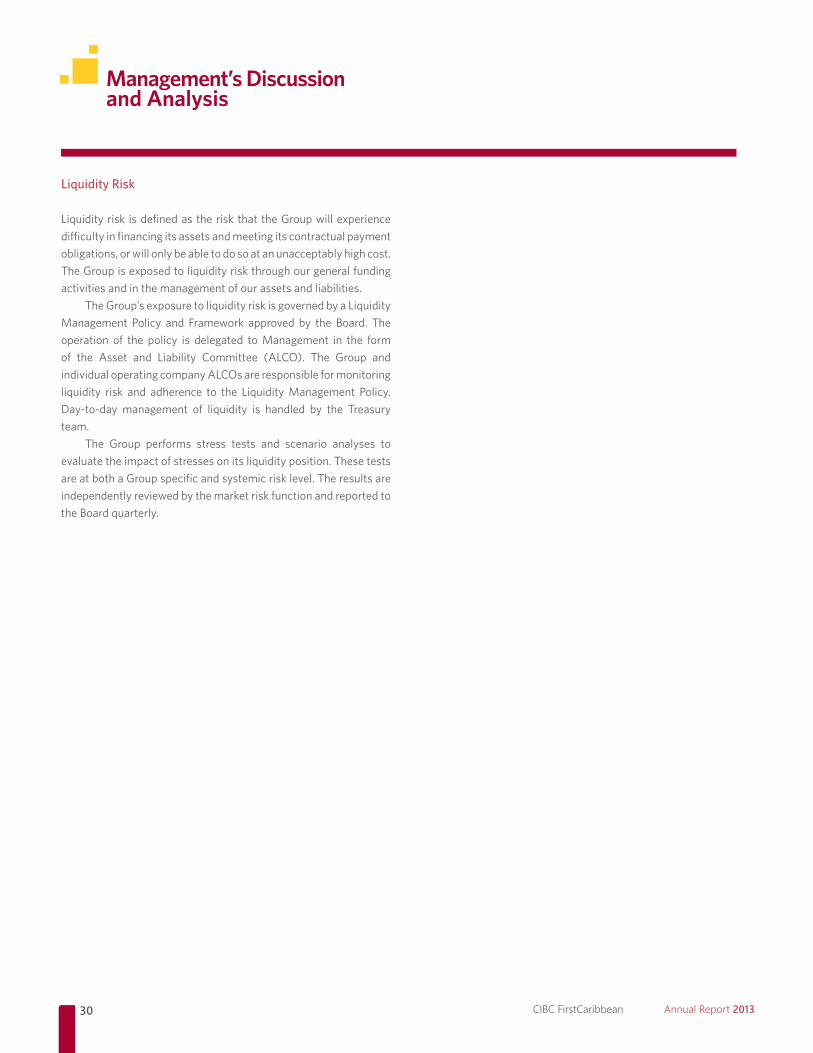
External Revenues
Segment resultsdecreasedyearonyearby$22millionas a resultof reduced external revenues and restructuring related expenses partially offset by increased revenue from other segments drivenmainly by securities gains.
Wealth Management
This segment comprises International Banking (includingInternational Corporate and International Personal Banking),Investment Management, Private Wealth Management and CIBC Bank & Trust.
Wealth Management clients are provided investment advice and traditionalbankingservicesthrougharelationshipmanagementoffer.
International Banking is a specialised business that facilitates leveraging of legislation and incentives in the international financial services jurisdictions to offer international clients a wide range ofproducts, services and financial solutions.
External revenues increased by $1million year on year or 2%due to higher service revenues driven by income from Fiduciary & Investment Management Fees along with reduced cost of deposit funding. These were partially offset by reduced loan earnings asvolumes remain depressed given the low demand in the second-home market – a key driver for this segment’s International Mortgage product.
Management’s Discussion and Analysis
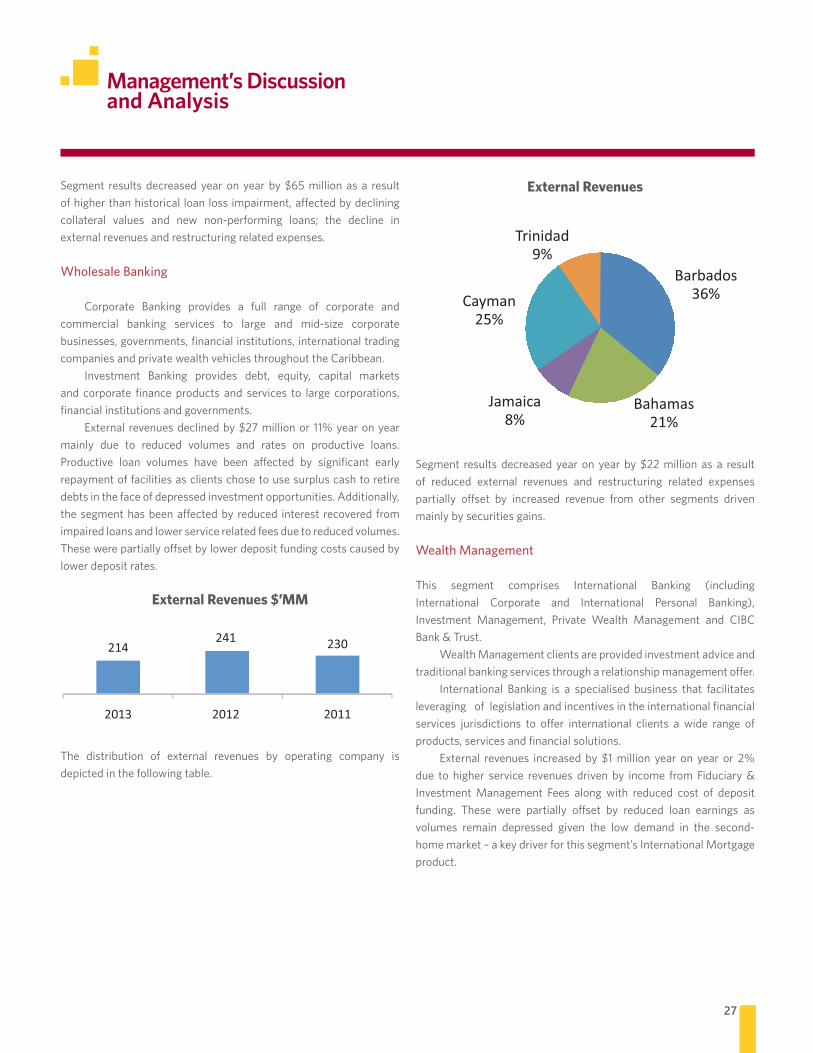
Segment resultsdecreasedyearonyearby$65millionasa resultofhigherthanhistoricalloanlossimpairment,affectedbydecliningcollateral values and new non-performing loans; the decline inexternal revenues and restructuring related expenses.
Wholesale Banking
Corporate Banking provides a full range of corporate and commercial banking services to large and mid-size corporatebusinesses, governments, financial institutions, international trading companies and private wealth vehicles throughout the Caribbean.
Investment Banking provides debt, equity, capital marketsand corporate finance products and services to large corporations, financial institutions and governments.
External revenuesdeclinedby$27millionor11%yearonyearmainly due to reduced volumes and rates on productive loans. Productive loan volumes have been affected by significant earlyrepayment of facilities as clients chose to use surplus cash to retire debts in the face of depressed investment opportunities. Additionally, thesegmenthasbeenaffectedby reduced interest recovered fromimpaired loans and lower service related fees due to reduced volumes. Thesewerepartiallyoffsetbylowerdepositfundingcostscausedbylower deposit rates.
External Revenues $’MM
The distribution of external revenues by operating company is depicted in the following table.
28 CIBC FirstCaribbean Annual Report 2013
Management’s Discussion and Analysis
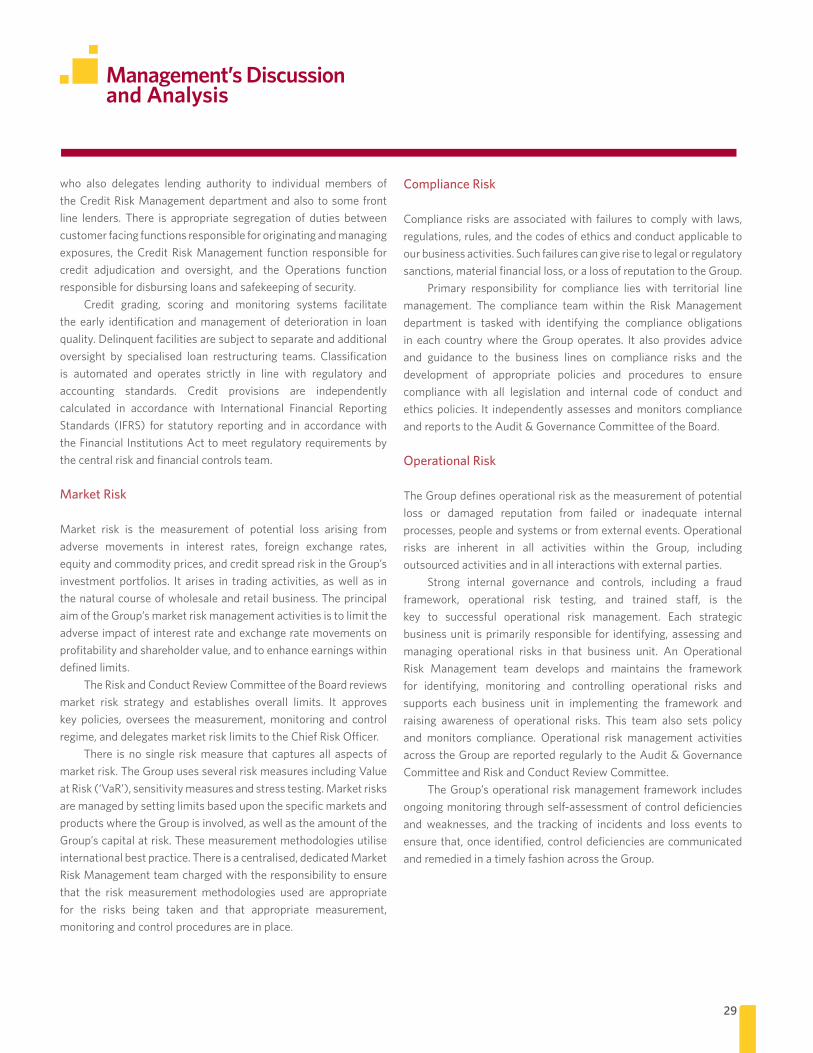
External Revenues $’MM
The distribution of external revenues by operating company is depicted in the following table.
External Revenues
Segment results decreased year on year by $12million primarilydue to higher than historical loan loss impairment expense, pension expenses and restructuring related expenses offset by increasedexternal revenues and revenues from other segments.
Administration
The Administration segment includes Finance, HR, Risk, Technology Operations and Corporate Services, Treasury, and other units, which support the business segments. The revenues and expenses of the functional groups are generally allocated to the business segments. The administration segment retains earnings on excess capital and theoffsettocapitalchargesallocatedtothebusinesssegments.
Treasury manages the interest rate, foreign exchange and liquidity risk of theGroup. In addition, Treasury conducts foreignexchange and other derivative transactions on behalf of Bank clients. Securities and cash placements are normally held within the Treasury unit included in the Administration segment.
Risk Management Approach
The Group assumes a variety of risks in its ordinary business activities. Risk is defined as any event that could: damage the core earnings capacity of the Group; increase earnings or cashflow volatility; reduce capital; threaten business reputation or viability; and/orbreachregulatoryorlegalobligations.
The Group’s approach to risk management is based on sound banking principles and a robust governance structure. Risk is managed within tolerance levels established by our management committees and approved by the Board of Directors and its committees(theBoard).Thisisachievedthroughacomprehensiveframework of measurement, monitoring and control policies, procedures and processes. Further information on credit, market andliquidityriskswithintheGroupcanbefoundinnote34oftheconsolidated financial statements.
Primary responsibility for the identification and assessment of risk lies with line management in our various strategic business units. The Risk Management department, which reports to the Chief Risk Officer, develops risk policies and procedures and provides independent oversight, analysis and adjudication through centrally based teams which manage credit risk, market risk, and operational risk.
The Group’s risk management policies and procedures are designed to identify and analyse these risks, to set appropriate risk limits, and to monitor and enhance risk management practices to reflect changes in markets, products and evolving best practice.
A robust control and governance structure is embedded within each strategic business unit. Representatives from Risk Management interact with the senior leadership of each strategic business unit in order to identify and manage risks in the respective businesses. This approach is supported by comprehensive enterprise-widereporting.
Credit Risk
Credit risk is defined as the risk of financial loss due to a borrower or counterparty failing to meet its obligations in accordance with agreed terms. Credit risk primarily arises from direct lending activities, as well as trading, investment and hedging activities.
Credit risk is managed and controlled on the basis of established credit processes and policies operating within a framework of delegated authorities. In addition to approving the Group’s key credit policies and setting credit risk appetites and tolerances, the Risk and Conduct Review Committee of the Board also delegates credit approval limits to the Credit Committee of the Group. The Credit Committee is chaired by the Chief Risk Officer
29
Management’s Discussion and Analysis
who also delegates lending authority to individual members of the Credit Risk Management department and also to some front line lenders. There is appropriate segregation of duties between customer facing functions responsible for originating and managing exposures, the Credit Risk Management function responsible for credit adjudication and oversight, and the Operations function responsible for disbursing loans and safekeeping of security.
Credit grading, scoring and monitoring systems facilitate the early identification and management of deterioration in loan quality.Delinquentfacilitiesaresubjecttoseparateandadditionaloversight by specialised loan restructuring teams. Classification is automated and operates strictly in line with regulatory and accounting standards. Credit provisions are independently calculated in accordance with International Financial Reporting Standards (IFRS) for statutory reporting and in accordancewiththeFinancialInstitutionsActtomeetregulatoryrequirementsbythe central risk and financial controls team.
Market Risk
Market risk is the measurement of potential loss arising from adverse movements in interest rates, foreign exchange rates, equityandcommodityprices,andcreditspreadriskintheGroup’sinvestment portfolios. It arises in trading activities, as well as in the natural course of wholesale and retail business. The principal aim of the Group’s market risk management activities is to limit the adverse impact of interest rate and exchange rate movements on profitability and shareholder value, and to enhance earnings within defined limits.
The Risk and Conduct Review Committee of the Board reviews market risk strategy and establishes overall limits. It approves key policies, oversees the measurement, monitoring and control regime, and delegates market risk limits to the Chief Risk Officer.
There is no single risk measure that captures all aspects of market risk. The Group uses several risk measures including Value atRisk(‘VaR’),sensitivitymeasuresandstresstesting.Marketrisksare managed by setting limits based upon the specific markets and products where the Group is involved, as well as the amount of the Group’s capital at risk. These measurement methodologies utilise international best practice. There is a centralised, dedicated Market Risk Management team charged with the responsibility to ensure that the risk measurement methodologies used are appropriate for the risks being taken and that appropriate measurement, monitoring and control procedures are in place.
Compliance Risk
Compliance risks are associated with failures to comply with laws, regulations, rules, and the codes of ethics and conduct applicable to our business activities. Such failures can give rise to legal or regulatory sanctions, material financial loss, or a loss of reputation to the Group.
Primary responsibility for compliance lies with territorial line management. The compliance team within the Risk Management department is tasked with identifying the compliance obligations in each country where the Group operates. It also provides advice and guidance to the business lines on compliance risks and the development of appropriate policies and procedures to ensure compliance with all legislation and internal code of conduct and ethics policies. It independently assesses and monitors compliance and reports to the Audit & Governance Committee of the Board.
Operational Risk
The Group defines operational risk as the measurement of potential loss or damaged reputation from failed or inadequate internalprocesses, people and systems or from external events. Operational risks are inherent in all activities within the Group, including outsourced activities and in all interactions with external parties.
Strong internal governance and controls, including a fraud framework, operational risk testing, and trained staff, is thekey to successful operational risk management. Each strategic business unit is primarily responsible for identifying, assessing and managing operational risks in that business unit. An Operational Risk Management team develops and maintains the framework for identifying, monitoring and controlling operational risks and supports each business unit in implementing the framework and raising awareness of operational risks. This team also sets policy and monitors compliance. Operational risk management activities across the Group are reported regularly to the Audit & Governance Committee and Risk and Conduct Review Committee.
The Group’s operational risk management framework includes ongoingmonitoringthroughself-assessmentofcontroldeficienciesand weaknesses, and the tracking of incidents and loss events to ensure that, once identified, control deficiencies are communicated and remedied in a timely fashion across the Group.
30 CIBC FirstCaribbean Annual Report 2013
Management’s Discussion and Analysis
Liquidity Risk
Liquidityrisk isdefinedastheriskthattheGroupwillexperiencedifficulty in financing its assets and meeting its contractual payment obligations, or will only be able to do so at an unacceptably high cost. TheGroupisexposedtoliquidityriskthroughourgeneralfundingactivities and in the management of our assets and liabilities.
TheGroup’sexposuretoliquidityriskisgovernedbyaLiquidityManagement Policy and Framework approved by the Board. The operation of the policy is delegated to Management in the form of the Asset and Liability Committee (ALCO). The Group andindividual operating company ALCOs are responsible for monitoring liquidity risk and adherence to the LiquidityManagement Policy. Day-to-day management of liquidity is handled by the Treasuryteam.
The Group performs stress tests and scenario analyses to evaluatetheimpactofstressesonitsliquidityposition.Thesetestsare at both a Group specific and systemic risk level. The results are independently reviewed by the market risk function and reported to theBoardquarterly.

Independent Auditors’ Report .......................................................... 32
ConsolidatedStatementof(Loss)/Income ................................. 33
ConsolidatedStatementofComprehensive(Loss)/Income . 33
Consolidated Statement of Financial Position .............................34
ConsolidatedStatementofChangesinEquity ............................ 35
Consolidated Statement of Cash Flows .........................................36
Notes to Consolidated Financial Statements ............................... 37
Audited Consolidated Financial StatementsYear ended October 31, 2013with Independent Auditors’ Report
FIRSTCARIBBEAN INTERNATIONAL BANKLIMITED
Audited Consolidated Financial Statements
32 CIBC FirstCaribbean Annual Report 2013
Local EY Firm NameAddress line 1Address line 2Address line 3
Tel: +00 (0)00 0000 0000Fax: +00 (0)00 0000 0000www.ey.com
INDEPENDENT AUDITORS' REPORT
To the Shareholders of FirstCaribbean International Bank Limited
We have audited the accompanying consolidated financial statements of FirstCaribbean International BankLimited and its subsidiaries (“the Group”) which comprise the consolidated statement of financial position asof October 31, 2013 and the consolidated statement of loss, consolidated statement of comprehensive loss,consolidated statement of changes in equity and consolidated statement of cash flows for the year thenended and a summary of significant accounting policies and other explanatory information.
Management's Responsibility for the Financial Statements
Management is responsible for the preparation and fair presentation of these consolidated financialstatements in accordance with International Financial Reporting Standards and for internal control asmanagement determines is necessary to enable the preparation of financial statements that are free frommaterial misstatement, whether due to fraud or error.
Auditors' Responsibility
Our responsibility is to express an opinion on these consolidated financial statements based on our audit.We conducted our audit in accordance with International Standards on Auditing. Those standards requirethat we comply with ethical requirements and plan and perform the audit to obtain reasonable assuranceabout whether the consolidated financial statements are free from material misstatement.
An audit involves performing procedures to obtain audit evidence about the amounts and disclosures in theconsolidated financial statements. The procedures selected depend on the auditors’ judgement, includingthe assessment of the risks of material misstatement of the financial statements, whether due to fraud orerror. In making those risk assessments, the auditor considers internal control relevant to the entity'spreparation and fair presentation of the financial statements in order to design audit procedures that areappropriate in the circumstances, but not for the purpose of expressing an opinion on the effectiveness ofthe entity's internal control. An audit also includes evaluating the appropriateness of accounting policiesused and the reasonableness of accounting estimates made by management, as well as evaluating theoverall presentation of the financial statements.
We believe that the audit evidence we have obtained is sufficient and appropriate to provide a basis for ouraudit opinion.
Opinion
In our opinion, the consolidated financial statements present fairly, in all material respects, the financialposition of the Group as of October 31, 2013 and its financial performance and its cash flows for the yearthen ended in accordance with International Financial Reporting Standards.
CHARTERED ACCOUNTANTSBarbadosDecember 13, 2013
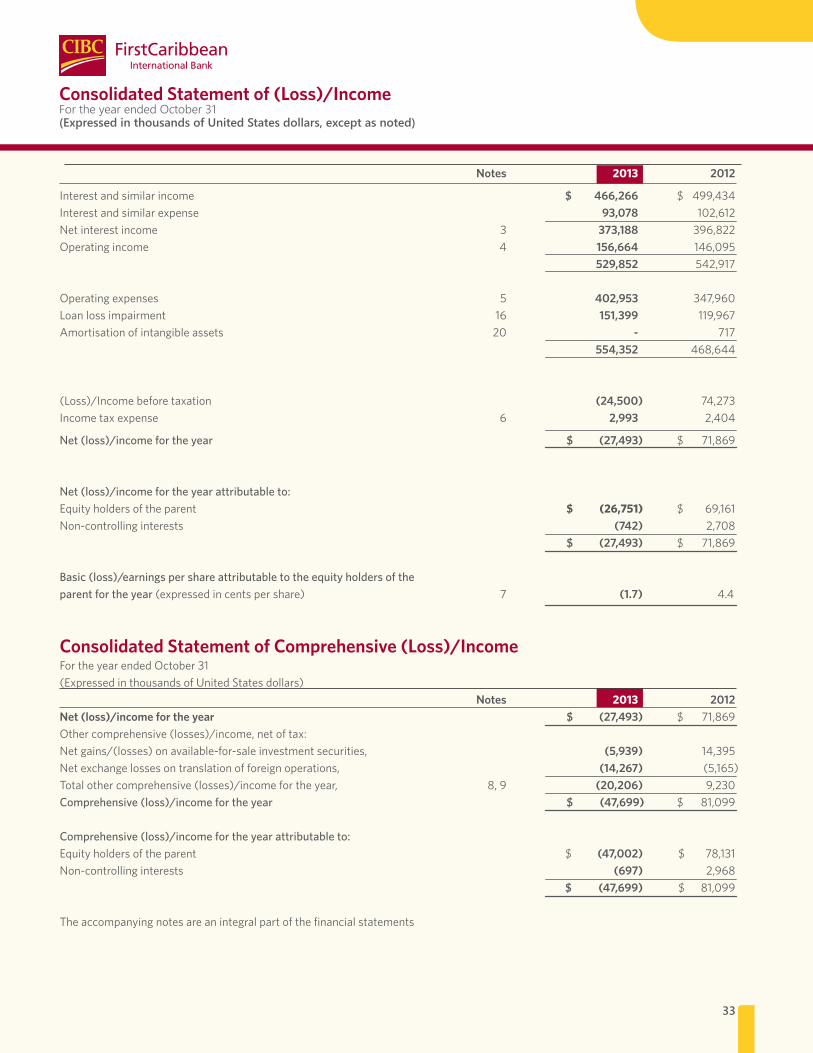
33
Consolidated Statement of (Loss)/Income For the year ended October 31(Expressed in thousands of United States dollars, except as noted)
Notes 2013 2012
Interest and similar income $ 466,266 $ 499,434Interest and similar expense 93,078 102,612Net interest income 3 373,188 396,822Operating income 4 156,664 146,095 529,852 542,917 Operating expenses 5 402,953 347,960Loan loss impairment 16 151,399 119,967Amortisation of intangible assets 20 - 717 554,352 468,644 (Loss)/Incomebeforetaxation (24,500) 74,273Income tax expense 6 2,993 2,404
Net (loss)/income for the year $ (27,493) $ 71,869 Net (loss)/income for the year attributable to: Equityholdersoftheparent $ (26,751) $ 69,161Non-controllinginterests (742) 2,708 $ (27,493) $ 71,869 Basic (loss)/earnings per share attributable to the equity holders of theparent for the year(expressedincentspershare) 7 (1.7) 4.4
Consolidated Statement of Comprehensive (Loss)/IncomeFor the year ended October 31(ExpressedinthousandsofUnitedStatesdollars) Notes 2013 2012Net (loss)/income for the year $ (27,493) $ 71,869Othercomprehensive(losses)/income,netoftax:Netgains/(losses)onavailable-for-saleinvestmentsecurities, (5,939) 14,395Net exchange losses on translation of foreign operations, (14,267) (5,165)Totalothercomprehensive(losses)/incomefortheyear, 8,9 (20,206) 9,230Comprehensive (loss)/income for the year $ (47,699) $ 81,099
Comprehensive (loss)/income for the year attributable to: Equityholdersoftheparent $ (47,002) $ 78,131Non-controllinginterests (697) 2,968 $ (47,699) $ 81,099
The accompanying notes are an integral part of the financial statements

34 CIBC FirstCaribbean Annual Report 2013
Consolidated Statement of Financial PositionAs at October 31(Expressed in thousands of United States dollars)
Notes 2013 2012Assets Cash and balances with Central Banks 10 $ 727,059 $ 720,933Due from banks 11 1,584,479 1,660,115Derivative financial instruments 12 3,239 2,708Financialassetsatfairvaluethroughprofitorloss 13 - 14,855Other assets 14 33,876 17,884Taxation recoverable 26,294 22,429Investment securities 15 2,214,085 1,703,598Loans and advances to customers 16 6,329,247 6,831,697Propertyandequipment 17 127,040 133,597Deferred tax assets 18 14,819 13,922Retirement benefit assets 19 44,069 43,355Intangible assets 20 334,907 334,907Total assets $ 11,439,114 $11,500,000
Liabilities Derivative financial instruments 12 $ 50,061 $ 73,936Customer deposits 21 9,606,533 9,624,605Financial liabilities at fair value through profit or loss 13 - 14,855Other borrowed funds 22 16,388 16,419Other liabilities 23 148,381 69,610Taxation payable 1,956 1,089Deferred tax liabilities 18 1,771 957Debt securities in issue 24 30,461 30,610Retirement benefit obligations 19 28,983 17,404Total liabilities 9,884,534 9,849,485
Equity attributable to equity holders of the parent Issued capital 25 1,193,149 1,193,149Reserves 26 (229,606) (210,621)Retained earnings 563,871 638,343 1,527,414 1,620,871Non-controlling interests 27,166 29,644Total equity 1,554,580 1,650,515Total liabilities and equity $ 11,439,114 $11,500,000The accompanying notes are an integral part of the financial statements
Approved by the Board of Directors on December 13, 2013
Rik ParkhillChief Executive O�cer
Sir Fred GollopDirector
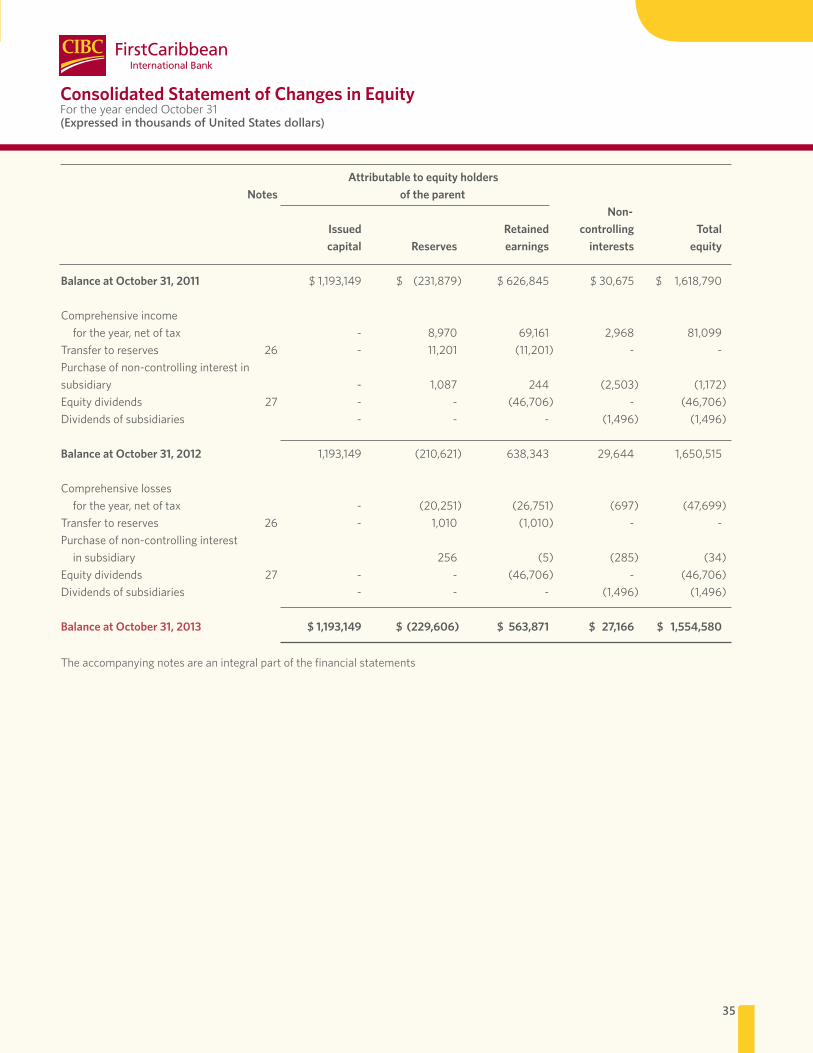
35
Consolidated Statement of Changes in Equity For the year ended October 31(Expressed in thousands of United States dollars)
Attributable to equity holders Notes of the parent Non- Issued Retained controlling Total capital Reserves earnings interests equity Balance at October 31, 2011 $1,193,149 $ (231,879) $626,845 $30,675 $ 1,618,790
Comprehensive income fortheyear,netoftax - 8,970 69,161 2,968 81,099
Transfertoreserves 26 - 11,201 (11,201) - -Purchaseofnon-controllinginterestinsubsidiary - 1,087 244 (2,503) (1,172)Equitydividends 27 - - (46,706) - (46,706)Dividendsofsubsidiaries - - - (1,496) (1,496)
Balance at October 31, 2012 1,193,149 (210,621) 638,343 29,644 1,650,515
Comprehensive losses fortheyear,netoftax - (20,251) (26,751) (697) (47,699)
Transfertoreserves 26 - 1,010 (1,010) - -Purchaseofnon-controllinginterestinsubsidiary 256 (5) (285) (34)
Equitydividends 27 - - (46,706) - (46,706)Dividendsofsubsidiaries - - - (1,496) (1,496)
Balance at October 31, 2013 $ 1,193,149 $ (229,606) $ 563,871 $ 27,166 $ 1,554,580
The accompanying notes are an integral part of the financial statements
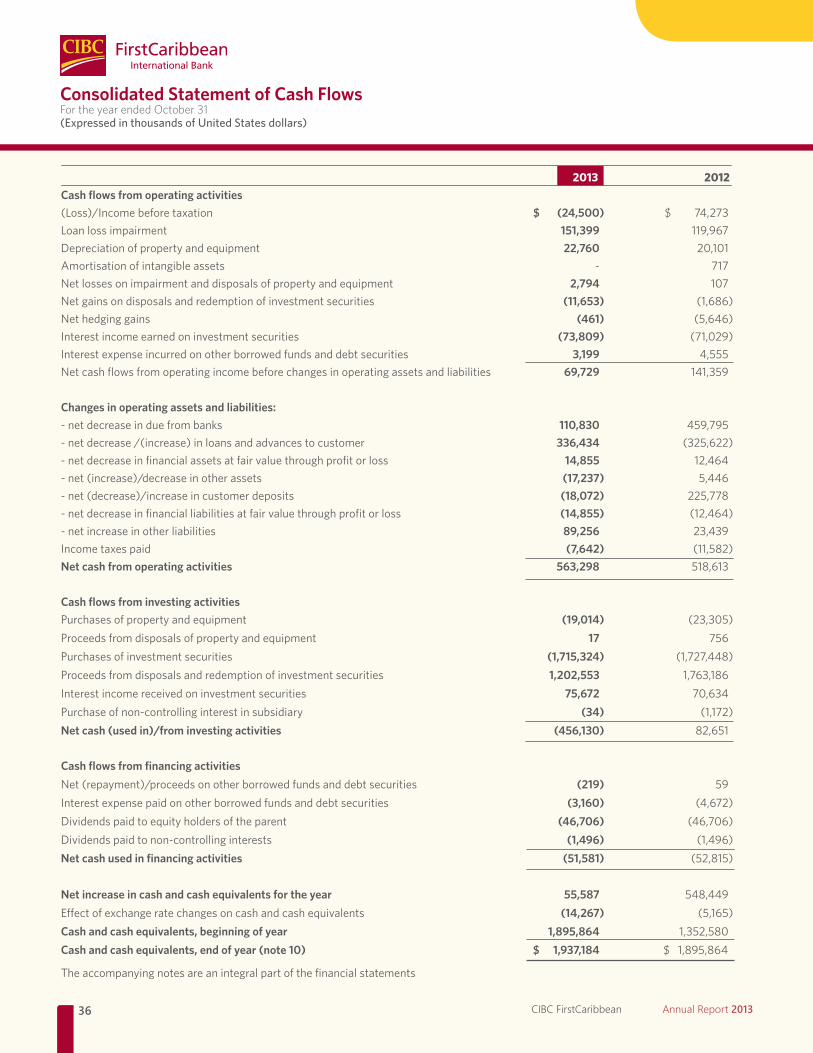
36 CIBC FirstCaribbean Annual Report 2013
Consolidated Statement of Cash FlowsFor the year ended October 31(Expressed in thousands of United States dollars)
2013 2012Cash flows from operating activities (Loss)/Incomebeforetaxation $ (24,500) $ 74,273Loan loss impairment 151,399 119,967Depreciationofpropertyandequipment 22,760 20,101Amortisationofintangibleassets - 717Netlossesonimpairmentanddisposalsofpropertyandequipment 2,794 107Net gains on disposals and redemption of investment securities (11,653) (1,686)Net hedging gains (461) (5,646)Interest income earned on investment securities (73,809) (71,029)Interest expense incurred on other borrowed funds and debt securities 3,199 4,555Net cash flows from operating income before changes in operating assets and liabilities 69,729 141,359
Changes in operating assets and liabilities: -netdecreaseinduefrombanks 110,830 459,795-netdecrease/(increase)inloansandadvancestocustomer 336,434 (325,622)-netdecreaseinfinancialassetsatfairvaluethroughprofitorloss 14,855 12,464-net(increase)/decreaseinotherassets (17,237) 5,446-net(decrease)/increaseincustomerdeposits (18,072) 225,778-netdecreaseinfinancialliabilitiesatfairvaluethroughprofitorloss (14,855) (12,464)-netincreaseinotherliabilities 89,256 23,439Income taxes paid (7,642) (11,582)Net cash from operating activities 563,298 518,613
Cash flows from investing activities Purchasesofpropertyandequipment (19,014) (23,305)Proceedsfromdisposalsofpropertyandequipment 17 756Purchases of investment securities (1,715,324) (1,727,448)Proceeds from disposals and redemption of investment securities 1,202,553 1,763,186Interest income received on investment securities 75,672 70,634Purchaseofnon-controllinginterestinsubsidiary (34) (1,172)Net cash (used in)/from investing activities (456,130) 82,651
Cash flows from financing activities Net(repayment)/proceedsonotherborrowedfundsanddebtsecurities (219) 59Interest expense paid on other borrowed funds and debt securities (3,160) (4,672)Dividendspaidtoequityholdersoftheparent (46,706) (46,706)Dividendspaidtonon-controllinginterests (1,496) (1,496)Net cash used in financing activities (51,581) (52,815)
Net increase in cash and cash equivalents for the year 55,587 548,449Effectofexchangeratechangesoncashandcashequivalents (14,267) (5,165)Cash and cash equivalents, beginning of year 1,895,864 1,352,580Cash and cash equivalents, end of year (note 10) $ 1,937,184 $1,895,864
The accompanying notes are an integral part of the financial statements
37
Notes to the Consolidated Financial Statements For the year ended October 31, 2013(Expressed in thousands of United States dollars)
2.1 Basis of presentation
These consolidated financial statements have been prepared on a historical cost basis, except for available-for-sale investmentsecurities, financial assets and liabilities at fair value through profit or loss and derivative financial instruments, which have all been measured at fair value. The carrying value of recognised assets that are hedged items in fair value hedges, and otherwise carried at amortised cost, are adjusted to record changes in fair value attributable to the risks that are being hedged. The consolidated financial statements arepresentedinUnitedStatesdollars,andallvaluesareroundedtothe nearest thousand except where otherwise indicated.
Statement of complianceThe consolidated financial statements of the Bank have been prepared inaccordancewithInternationalFinancialReportingStandards(IFRS)asissuedbytheInternationalAccountingStandardsBoard(IASB).
Basis of consolidationThe consolidated financial statements comprise the financial statements of the Bank and its subsidiaries as at October 31, 2013 (the“reportingdate”).Thefinancialstatementsof thesubsidiariesare prepared for the same reporting year as the Bank, using consistent accounting policies.
SubsidiariesAll subsidiaries, which are those companies in which the Bank directly or indirectly holds the majority of the voting rights and where it determines their financial and business policies and is able to exercise control over them in order to benefit from their activities, have been fully consolidated. The principal subsidiaries of the Bank are disclosed in note 35.Allinter-companytransactions,balancesandunrealisedsurpluses
and deficits on transactions and balances have been eliminated.Subsidiariesareconsolidated from thedateonwhich theeffective
control is transferred to the Bank. Control is achieved where the Bank has the power to govern the financial and operating policies of an entity so as to obtain benefits from its activities. The results of subsidiariesacquiredordisposedofduringtheyearareincludedintheconsolidatedstatementofincomefromthedateofacquisitionorup to the date of disposal.
Non-controllinginterestsrepresenttheportionofcomprehensiveprofit or loss and net assets not owned, directly or indirectly, by the Bank and are presented separately in the consolidated statement of incomeandwithinequityintheconsolidatedstatementoffinancialposition,separatelyfromequityattributabletoequityholdersoftheparent.
Prior to November 1, 2009, losses incurred by the Group were attributed to the non-controlling interests until the balance wasreduced to nil. Any further excess losses were attributable to the parent,unlessthenon-controllinginterestshadabindingobligationto cover these.
WitheffectfromNovember1,2009,lossesareattributedtothenon-controllinginterestsevenifthatresultsinadeficitbalance.
Transactions with non-controlling interestsThe Group applies a policy of treating transactions with non-controllinginterestsastransactionswithequityownersoftheGroup.Forpurchasesfromnon-controllinginterests,thedifferencebetweenanyconsiderationpaidandtherelevantshareacquiredofthecarryingvalueofnetassetsofthesubsidiary isrecordedinequity.Gainsorlossesondisposalstonon-controllinginterestsarealsorecordedinequity.Interestsintheequityofsubsidiariesnotattributabletotheparent
are reported in consolidated equity as non-controlling interests.Profitsorlossesattributabletonon-controllinginterestsarereportedin the consolidated statement of comprehensive income.
Transactions with jointly controlled entitiesIFRS 3 Business Combinations does not apply to a business
2. Accounting Policies
1. General Information
FirstCaribbeanInternationalBankLimitedanditssubsidiaries(“theGroup”) are registered under the relevant financial and corporatelegislations of 17 countries in the Caribbean to carry on banking and other related activities. The Group’s parent company, FirstCaribbean InternationalBankLimited(“theBank”),isacompanyincorporatedand domiciled in Barbados at Warrens, St. Michael. The ultimate
parent company and controlling party of the Bank is Canadian Imperial Bank of Commerce (“CIBC”) which holds 91.7% of theBank’s issued shares and is a company incorporated in Canada.
The Bank has a primary listing on the Barbados Stock Exchange, with further listings in Trinidad, Jamaica and the Eastern Caribbean.
38 CIBC FirstCaribbean Annual Report 2013
Notes to the Consolidated Financial Statements For the year ended October 31, 2013(Expressed in thousands of United States dollars)
combination of entities or businesses under common control. A business combination involving entities or businesses under common control is a business combination in which all of the combining entities or businesses are ultimately controlled by the same party or parties both before and after the business combination, and that control is not transitory.
TheGroupaccountsfortheacquisitionofcommonlycontrolledentities as follows:• Theassets,liabilities,incomeandexpensesofasubsidiaryare
included in the consolidated financial statements prospectively fromtheacquisitiondate.
• Theassetsandliabilitiesofthesubsidiariesarereflectedintheconsolidated financial statements at their carrying amounts and are not revalued to fair value.
• Nonewgoodwill is recognisedasa resultof thecombination.Instead,anydifferencebetweenthefairvalueofconsiderationand the carrying value of the net assets is reflected as an adjustment to retained earnings.
2.2 Significant accounting judgements and estimates
The preparation of financial statements in conformity with IFRS requires management to make certain significant estimates andjudgementsthataffectamountsreportedinthefinancialstatementsand accompanying notes. Actual results could differ from theseestimates.
Estimates and judgements are continually evaluated and are based on historical experience and other factors, including expectations of future events that are believed to be reasonable under the circumstances. The estimates and judgements that have a significant risk of causing material adjustments to the carrying amounts of assets and liabilities within the next financial year are discussed below.
Fair value of financial instrumentsCertain financial instruments are recorded at fair value using valuation techniques in which current market transactions or observablemarket data are not available. Their fair value is determined using a valuation model that has been tested against prices of or inputs to actual market transactions and using the Group’s best estimates of the most appropriate model assumptions. Models are adjusted to reflect the spread for bid and ask prices to reflect costs to close out positions,counterpartycreditandliquidityspreadandlimitationsinthe model.
Impairment losses on loans and advancesThe Group reviews its individually significant loans and advances at each reporting date to assess whether an impairment loss should be recorded in the statement of income. In particular, judgement by management is required in the estimation of the amount andtiming of future cash flows when determining the impairment loss. In
estimating these cash flows, the Bank makes judgements about the borrower’s financial situation and the net realisable value of collateral. These estimates are based on assumptions about a number of factors and actual results may differ, resulting in future changes to theallowance for impairment losses.
Loans and advances that have been assessed individually and found not to be impaired and all individually insignificant loans and advances are then assessed collectively, in groups of assets with similar risk characteristics, to determine whether provisions should be made due to incurred loss events for which there is objective evidencebutwhoseeffectsarenotyetevident.
The collective assessment takes account of data from the loan portfolio such as credit quality, levels of arrears, credit utilisation,loan to collateral ratios, concentrations of risks and economic data, countryriskandtheperformanceofdifferentindividualgroups.
Retirement benefit obligationsAccountingforsomeretirementbenefitobligationsrequirestheuseof actuarial techniques tomake a reliable estimate of the amountof benefit that employees have earned in return for their service in the current and prior periods. These actuarial assumptions are based on management’s best estimates of the variables that will determine the ultimate cost of providing post-employmentbenefits and comprise both demographic and financial assumptions. This includes assumptions about discount rates, expected rates of return on assets, future salary increases, mortality rates and future pension increases. Variations in the financial assumptions can cause material adjustments in future years, if it is determinedthattheactualexperiencedifferedfromtheestimate.
Income taxesThe Group is subject to taxation in various jurisdictions and significant estimates are required in determining the provision forincome taxes. Where the final tax outcome is different from theamountsthatwereinitiallyrecorded,suchdifferenceswillaffecttheincome tax and deferred tax provisions in the period in which such determination is made.
Deferred tax assets are recognised for all unused tax losses to the extent that it is probable that taxable profits will be available against which the losses can be utilised. Management’s judgement is requiredtodeterminetheamountofthedeferredtaxassetthatcanbe recognised, based upon the likely timing and level of future taxable profits together with future tax planning strategies.
Impairment of available-for-sale investments Management makes judgements at each reporting date to determine whether available-for-sale investments are impaired. Theseinvestments are impaired when the carrying value is greater than the recoverable amount and there is objective evidence of impairment.
39
Notes to the Consolidated Financial Statements For the year ended October 31, 2013(Expressed in thousands of United States dollars)
Intangible assetsTheGroup’sfinancialstatementsincludegoodwillandcustomer-related intangible assets arising from acquisitions. In accordancewith IAS 36, goodwill is reviewed for impairment annually using the “value in use”method. This requires the use of estimates fordeterminationoffuturecashflowsexpectedtoarisefromeachcash-generating unit and an appropriate discount rate to calculate present value. Management also makes judgements at each reporting date to determine whether intangible assets are impaired or not.
2.3 Adoption of new accounting policies
The accounting policies adopted are consistent with those of the previous financial year.
The Bank has adopted IAS 1 Presentation of items of other comprehensive income–amendmentstoIAS1whichwasrequired for annual periods beginning after July 1, 2012. Adoption of this revisedstandarddidnothaveanyeffectonthefinancialperformanceor position of the Group.
2.4 Summary of significant accounting policies
The principal accounting policies applied in the preparation of these consolidated financial statements are set out below.
Foreign currency translationEach entity in the Group determines its own functional currency, and items included in the financial statements of each entity are measured using that currency.
The functional currency of the Bank is Barbados dollars, however, these consolidated financial statements are presented in UnitedStates dollars as this currency is universally accepted and recognised in all the territories in which the Group operates. Transactions and balancesTransactions in foreign currencies are initially recorded by the Group entities at their respective functional currency rates prevailing at the date of the transaction. Monetary assets and liabilities denominated in foreign currencies are translated into the functional currency at ratesprevailingatthereportingdateandnon-monetaryassetsandliabilities are translated at historic rates. Revenue and expenses denominated in foreign currencies are translated into the Bank’s functional currency and then converted to the Group’s presentation currency using prevailing average monthly exchange rates. Realised and unrealised gains and losses on foreign currency positions are reported in incomeof the current year. Translation differences on
non-monetaryitems,suchasequitiesclassifiedasavailable-for-salefinancial assets, are included in the available-for-sale revaluationreserveinequity.
Group companiesThe results and financial position of all the Group entities that have a functional currency different from the presentation currency aretranslated into the presentation currency as follows:• Assets and liabilities for each statement of financial position
presented are translated at the closing rate at the reporting date.• Income and expenses for each statement of comprehensive
income or statement of income presented are translated at averageexchangerates(unlessthisaverageisnotareasonableapproximationofthecumulativeeffectoftheratesprevailingonthe transaction dates, in which case income and expenses are translatedatthedatesofthetransactions);and
• Allresultingexchangedifferencesarerecognisedin other comprehensive income.
Onconsolidation,exchangedifferencesarisingfromthetranslationofthe net investment in foreign operations, and of borrowings and other currency instruments designated as hedges of such investments, are taken to other comprehensive income. When a foreign operation is sold, the component of other comprehensive income relating to that particular foreign operation is recognised in the statement of income as part of the gain or loss on sale.
Derivative financial instruments and hedge accountingThe Group uses derivative financial instruments such as forward currency contracts and interest rate swaps to manage its foreign currency risks and interest rate risks, respectively. Such derivative financial instruments are initially recognised at fair value on the date onwhichaderivativecontractisenteredintoandaresubsequentlyremeasured at fair value. Derivatives are carried as financial assets when the fair value is positive and as financial liabilities when the fair value is negative.
Any gains or losses arising from changes in fair value on derivatives are taken directly to the statement of income, except for the effectiveportionof cashflowhedges,which is recognised inothercomprehensive income.
For the purpose of hedge accounting, hedges are classified as:• Fairvaluehedgeswhenhedgingtheexposuretochangesinthe
fair value of a recognised asset or liability or an unrecognised firmcommitment(exceptforforeigncurrencyrisk)
• Cashflowhedgeswhenhedgingexposuretovariabilityincashflows that is either attributable to a particular risk associated
40 CIBC FirstCaribbean Annual Report 2013
Notes to the Consolidated Financial Statements For the year ended October 31, 2013(Expressed in thousands of United States dollars)
with a recognised asset or liability or a highly probable forecast transaction or the foreign currency risk in an unrecognised firm commitment.
At the inception of a hedge relationship, the Group formally designates and documents the hedge relationship to which the Group wishes to apply hedge accounting and the risk management objective and strategy for undertaking the hedge. The documentation includes identification of the hedging instrument, the hedged item or transaction, the nature of the risk being hedged and how the entity willassesstheeffectivenessofchangesinthehedginginstrument’sfairvalueinoffsettingtheexposuretochangesinthehedgeditem’sfair value or cash flows attributable to the hedged risk. Such hedges are expected to be highly effective in achieving offsetting changesin fair value or cash flows and are assessed at inception and on a monthly basis to determine that they actually have been highly effective throughout the financial reporting periods forwhich theywere designated. Hedges which meet the Group’s strict criteria for hedge accounting are accounted for as follows: • Fair value hedgeFor hedging relationshipswhich are designated and qualify as fairvaluehedgesandthatprovetobehighlyeffectiveinrelationtothehedged risk, changes in the fair value of the derivatives are recorded in the statement of income, along with the corresponding change in fair value of the hedged asset or liability that is attributable to that specific hedged risk.
If the hedge no longer meets the criteria for hedge accounting, an adjustment to the carrying amountofahedged interest-bearingfinancial instrument is amortised to net profit or loss over the remaining period to maturity.
• Cash flow hedgeTheeffectiveportionofchangesinthefairvalueofderivativesthataredesignatedandqualifyascashflowhedgesarerecognisedinothercomprehensive income. The gain or loss relating to the ineffectiveportion is recognised immediately in the statement of income.
Amounts accumulated in other comprehensive income are recycled to the statement of income in the periods in which the hedged item willaffectprofitorloss(forexample,whentheforecastsalethatishedgedtakesplace).
When a hedging instrument expires or is sold, or when a hedge no longer meets the criteria for hedge accounting, any cumulative gain or loss existing in other comprehensive income at that time remains in other comprehensive income and is recognised when
the forecast transaction is ultimately recognised in the statement of income. When a forecast transaction is no longer expected to occur, the cumulative gain or loss that was reported in other comprehensive income is immediately transferred to the statement of income.Certainderivativeinstrumentsdonotqualifyforhedgeaccounting
or are not so designated, and changes in the fair value of these derivatives are included in net trading gains or losses within operating income.
Interest income and expenseInterest income and expense are recognised in the statement of income for all interest-bearing instruments on an accrual basisusing the effective interest method based on the actual purchaseprice or estimated recoverable amount. Interest income includes coupons earned on fixed income investment and trading securities and accrued discounts and premiums on treasury bills and other discounted instruments.
Once a financial asset or a group of similar financial assets has been written down as a result of an impairment loss, interest income isrecognisedusingtheoriginaleffectiveinterestrateforthepurposeof measuring impairment loss.
Fee and commission incomeFees and commissions are generally recognised on an accrual basis when the service has been provided. Loan origination fees, which haveahighprobabilityofbeingdrawndown,aredeferred(togetherwith related direct costs) and recognised as an adjustment to theeffective interest yield on the loan. Commission and fees arisingfrom negotiating, or participating in the negotiation of a transaction for a third party, such as the acquisition of loans, shares or othersecurities or the purchase or sale of businesses, are recognised on completion of the underlying transaction. Portfolio and other management advisory and service fees are recognised based on the applicable service contracts. Asset management fees related to investment funds are recognised proportionately over the period the service is provided. The same principle is applied for wealth management, financial planning and custody services that are continuously provided over an extended period of time.
Customer loyalty programmesThe Group offers customer points programmes through its CreditCard products. A portion of the net fee revenues are deferred in relation to award credits under customer loyalty programmes as a separately identifiable revenue component. The amount deferred represents the fair value of the award credits and is recognised when the awards are utilised or are expired.

41
Notes to the Consolidated Financial Statements For the year ended October 31, 2013(Expressed in thousands of United States dollars)
Financial instrumentsThe Group recognises financial instruments on its consolidated Statement of Financial Position when it becomes a party to the contractual provisions of the instrument and classifies its financial assets into the following categories:
•Financialassetsatfairvaluethroughprofitorloss;•Loansandreceivables;or•Available-for-salefinancialassets.
Management determines the classification of its investments at initial recognition.
Financial liabilities, other than derivatives and financial liabilities at fair value through the profit or loss, are measured at amortised cost. Derivatives and financial liabilities at fair value through the profit or loss are measured at fair value. Interest expense is recognisedonanaccrualbasisusingtheeffectiveinterestmethod.
Financial assets and liabilities at fair value through profit or lossThis category comprises financial assets or liabilities held for trading. A financial asset or liability is classified in this category if acquiredprincipallyforthepurposeofsellingintheshorttermorifso designated by management.
Management may designate a financial asset or liability at fair value through profit or loss upon initial recognition when the following criteria are met, and designation is determined on an instrument by instrument basis:• The designation eliminates or significantly reduces the
inconsistent treatment that would otherwise arise from measuring the assets or liabilities or recognising gains or losses onthemonadifferentbasis;or
• Theassetsandliabilitiesarepartofagroupoffinancialassets,financial liabilities or both which are managed and their performance evaluated on a fair value basis, in accordance with a documented risk management or investment strategy; or
• Thefinancialinstrumentcontainsoneormoreembeddedderivatives which significantly modify the cash flows that otherwisewouldberequiredbythecontract.
Loans and receivablesLoansandreceivablesarenon-derivativefinancialassetswithfixedordeterminablepaymentsthatarenotquotedinanactivemarket.
Available-for-sale financial assetsAvailable-for-salefinancialassetsarethoseintendedtobeheldforan indefinite period of time, which may be sold in response to needs for liquidityor changes in interest rates, exchange ratesorequityprices.
All purchases and sales of financial assets at fair value through profitor loss andavailable-for-sale that requiredeliverywithin thetimeframeestablishedbyregulationormarketconvention(“regularway”purchasesandsales)arerecognisedatsettlementdate,whichisthe date that an asset is delivered to or by the Group. Otherwise such transactions are treated as derivatives until settlement occurs. Loans and receivables are recognised when cash is advanced to borrowers.
Financial assets, not carried at fair value through profit or loss, are initially recognised at fair value plus transaction costs. Financial assets are derecognised when the rights to receive the cash flows from the financial assets have expired or where the Group has transferred substantially all risks and rewards of ownership.Available-for-salefinancialassetsandfinancialassetsorliabilities
at fair value through profit or loss are subsequently re-measuredat fair value based on quoted bid prices or amounts derived fromcash flow models. Loans and receivables are carried at amortised cost using the effective interest method, less any provisions forimpairment.Unrealisedgainsandlossesarisingfromchangesinthefairvalueofsecuritiesclassifiedasavailable-for-salearerecognisedin other comprehensive income. When the securities are disposed of or impaired, the related accumulated fair value adjustments are included in the statement of income as gains and losses from investment securities.
Unquoted equity instruments for which fair values cannot bemeasured reliably are recognised at cost less impairment.
Allgainsand losses fromdisposalsand/orchanges in the fairvalue of financial assets and liabilities at fair value through profit or loss and derivatives held for trading are included in operating income as net trading gains or losses. All gains and losses from disposalsof investmentsecuritiesavailable-for-saleare included inoperating income as net investment securities gains or losses. Where certain financial assets are hedged and there is ineffectiveness,this is included in operating income as net hedging gains or losses. Dividends are recorded on the accrual basis when declared and are included in investment securities interest and similar income.
During the normal course of business, financial assets carried at amortised cost may be restructured with the mutual agreement of the Group and the counterparty. When this occurs for reasons other thanthosewhichcouldbeconsideredindicatorsofimpairment(see‘Impairmentofassets’)thegroupassesseswhethertherestructuredor renegotiated financial asset is significantly different from theoriginal one by comparing the present value of the restructured cash flows discounted at the original instruments interest rate. If the restructuredtermsaresignificantlydifferent,thegroupderecognisesthe original financial asset and recognises a new one at fair value, withanydifferencerecognisedinthestatementofincome.
42 CIBC FirstCaribbean Annual Report 2013
Notes to the Consolidated Financial Statements For the year ended October 31, 2013(Expressed in thousands of United States dollars)
Offsetting financial instrumentsFinancial assets and liabilities are offset and the net amountreported in the statement of financial position when there is a legally enforceable right to offset the recognised amounts andthere is an intention to settle on a net basis, or realise the asset and settle the liability simultaneously.
Sale and repurchase agreementsSecuritiessoldsubjecttolinkedrepurchaseagreements(“repos”)are retained in the financial statements as investment securities and the counterparty liability is included in other borrowed funds. Securities purchased under agreements to resell are recorded as loans and advances to other banks or customers as appropriate. The difference between sale and repurchase price is treated asinterest and accrued over the life of repurchase agreements using theeffectiveinterestmethod.
Impairment of financial assetsThe Group assesses at each reporting date whether there is objective evidence that a financial asset or group of financial assets is impaired. A financial asset or a group of financial assets is impaired and impairment losses are incurred if, and only if, there is objective evidence of impairment as a result of one or more events that occurred after the initial recognition of the asset (a“lossevent”)andthatlossevent(orevents)hasanimpactonthefuture cash flows of the financial asset or group of financial assets that can be reliably estimated. Objective evidence that a financial asset or group of financial assets is impaired includes observable data that comes to the attention of the Group about the following loss events:• significantfinancialdifficultyoftheissuerorobligor;• a breach of contract, such as a default or delinquency in
interest or principal payments;• theGroupgrantingtoaborrower,foreconomicorlegalreasons
relating to the borrower’s financial difficulty, a concession that the lender would not otherwise consider;
• it becoming probable that the borrower will enterbankruptcy or other financial reorganisation;
• thedisappearance of an active market for thatfinancialasset because of financial difficulties; or
• observabledataindicatingthatthereisameasurabledecreasein the estimated future cash flows from a group of financial assets since the initial recognition of those assets, although the decrease cannot yet be identified with the individual financial assets in the group, including:
– adverse changes in the payment status of borrowers in the group; or
– national or local economic conditions that correlate with default on the assets in the group.
If there is objective evidence that an impairment loss on loans and advances carried at amortised cost has been incurred, the amount of the loss is measured as the difference betweenthe carrying amount and the recoverable amount, being the estimated present value of expected cash flows, including amounts recoverable from guarantees and collateral, discounted based on theoriginaleffectiveinterestrate.
In certain instances, the terms of advances to customers are restructured or renegotiated. These facilities are subject to the impairment review noted above, and where there is objective evidence of impairment, the amount of any impairment loss is measured as the difference between the carrying value of thefacility and the present value of estimated future cash flows based on the renegotiated terms and conditions discounted at the original effectiveinterestratebeforerestructuring.
Loansarewrittenoff, inwholeor inpart,againsttherelatedallowance for credit losses upon settlement (realisation) ofcollateral or in advance of settlement (no realisation)where thedetermination of the recoverable value is completed and there is no realistic prospect of recovery above the recoverable value. Any subsequentrecoveriesarecreditedtothestatementofincome.Iftheamountof the impairmentsubsequentlydecreasesdue toaneventoccurringafterthewrite-down,thereleaseoftheprovisionis credited to the statement of income. In circumstances where CentralBankguidelinesandregulatory rules requireprovisions inexcessof thosecalculatedunder IFRS, thedifference isdisclosedasanappropriationofretainedearningsandisincludedinanon-distributable general banking reserve.
Intangible assetsIntangible assets acquired separately are measured on initialrecognition at cost. Following initial recognition, intangible assets are carried at cost less any accumulated amortisation and any accumulated impairment losses. An intangible asset is only recognised when its cost can be reliably measured and it is probable that the expected future economic benefits attributable to it will flow to the Group.
Intangible assets acquired inbusiness combinationsprior toNovember 1, 2009 are accounted for as follows:
43
Notes to the Consolidated Financial Statements For the year ended October 31, 2013(Expressed in thousands of United States dollars)
GoodwillGoodwillrepresentstheexcessofthecostofanacquisitionoverthefairvalueofthenetidentifiableassetsoftheacquiredsubsidiaryundertaking at the date of acquisition and is reported in thestatement of financial position as an intangible asset. Goodwill is testedannually for impairmentat the thirdquarterandcarriedatcost less accumulated impairment losses. Goodwill is allocated to the lowest levels for which there are separately identifiable cashflows(cash-generatingunits) for thepurposeof impairmenttesting. An impairment loss is recognised for the amount by which the asset’s carrying value exceeds its recoverable amount. The recoverable amount is the higher of an asset’s fair value less costs to sell and value in use.
Customer-related intangible assetsCustomer-relatedintangibleassetsrepresentthefairvalueofeachcustomerrelationshipacquiredinabusinesscombination,asoftheacquisitiondate,whichmet thecontractual legal criterion foridentification as an intangible asset in the statement of financial position separated from goodwill. The fair value of the customer relationshipsisamortisedonastraight-linebasisoveritsexpecteduseful life of six years. At each reporting date, an assessment is made to determine whether there are any indications of impairment, and if such an indication exists, then the recoverable amount shall be estimated.
Property and equipmentAll property and equipment are stated at historical cost lessaccumulated depreciation, with the exception of land which is not depreciated. Historical cost includes expenditures that are directly attributable to the acquisition of the items. Land andbuildingscomprisemainlybranchesandoffices.Subsequentcostsare included in the asset’s carrying amount or are recognised as a separate asset, as appropriate, only when it is probable that future economic benefits associated with the item will flow to the Group and the cost of the item can be measured reliably. All other repairs and maintenance are charged to the statement of income during the financial period in which they are incurred.
Depreciation on all property and equipment is computed onthestraight-linemethodatratesconsideredadequatetowrite-offthe cost of depreciable assets, less salvage, over their useful lives.
The annual rates used are:–Buildings 2½%–Leaseholdimprovements 10%oroverthelife of the lease–Equipment,furnitureandvehicles 20–50%
Assets that are subject to depreciation are reviewed for impairment whenever events or changes in circumstances indicate that the carrying amount may not be recoverable. Where the carrying amount of an asset is greater than its estimated recoverable amount, it is written down immediately to its recoverable amount. The asset’s recoverable amount is the higher of the asset’s fair value less costs to sell and the value in use.
Gainsandlossesondisposalofpropertyandequipmentaredetermined by reference to its carrying amount and are taken into account in determining net income
LeasesWhen assets are held subject to a finance lease, the present value of the lease payments is recognised as a receivable. The differencebetweenthegrossreceivableandthepresentvalueofthe receivable is recognised as unearned finance income. Lease incomeisrecognisedoverthetermoftheleaseusingtheeffectiveinterest method, which reflects a constant periodic rate of return.
Financial guaranteesFinancialguaranteesarefinancialcontractsthatrequiretheissuerto make specified payments to reimburse the holder for a loss it incurs because a specified debtor fails to make payment when due in accordance with the original or modified terms of a debt instrument.
Financial guarantee contracts issued by the Group are treated as contingent liabilities and not recognised in the statement of financial position until a payment under the guarantee has been made, at which time the payment is treated as a loan and advance to customers.
Cash and cash equivalentsFor the purposes of the statement of cash flows, cash and cash equivalents comprise balances with less than 90 daysmaturity from the date of acquisition including cash balances, non-restricteddepositswithCentralBanks(excludingmandatoryreserve deposits), treasury bills and other money marketplacements.
ProvisionsProvisions are recognised when the Group has a present legal or constructive obligation as a result of past events, it is more than likely that an outflow of resources embodying economic benefits willberequiredtosettletheobligation,andareliableestimateofthe amount of the obligation can be made.
44 CIBC FirstCaribbean Annual Report 2013
Notes to the Consolidated Financial Statements For the year ended October 31, 2013(Expressed in thousands of United States dollars)
Retirement benefit obligations
Pension obligations The Group operates a number of pension plans, the assets of whicharegenerallyheld in separate trustee-administered funds.The pension plans are generally funded by payments from the relevant Group companies, taking account of the recommendationsof independentqualifiedactuaries.TheGrouphas both defined benefit plans and defined contribution plans. A defined benefit plan is a pension plan that defines an amount of pension benefit to be provided, usually as a function of one or more factors such as age, years of service or compensation. A defined contribution plan is a pension plan under which the Group pays fixedcontributionsintoaseparateentity(afund)andwillhavenolegal or constructive obligation to pay further contributions if the fund does not hold sufficient assets to pay all employee benefits relating to employee service in the current and prior periods. The asset or liability recognised in the statement of financial position in respect of defined benefit pension plans is the present value of the defined benefit obligation at the reporting date minus the fair value of plan assets, together with adjustments for unrecognised actuarialgains/lossesandpast servicecost.Thedefinedbenefitobligation is calculated annually by independent actuaries using the projected unit credit method. The present value of the defined benefit obligation is determined by the estimated future cash outflows using interest rates of government securities, which have terms to maturity approximating the terms of the related liability. Most of the pension plans are final salary plans and the charge for such pension plans, representing the net periodic pensioncostlessemployeecontributions,isincludedinstaffcosts.
Actuarial gains and losses arising from experience adjustments and changes in actuarial assumptions are charged or credited to income over the expected average remaining service lives of the related employees.
Past service costs are recognised immediately in income, unless the changes to the pension plan are conditional on the employeesremaininginserviceforaspecifiedperiodoftime(thevestingperiod).Inthiscase,pastservicecostsareamortisedonastraight-linebasisoverthevestingperiod.
For defined contribution plans, the Group makes contributions to publicly or privately administered pension insurance plans on a mandatory, contractual or voluntary basis. Once the contributions have been paid, the Group has no further payment obligations. The regular contributions constitute net periodic costs for the year inwhichtheyaredueandassuchareincludedinstaffcosts.The
Group’s contributions to the defined contribution pension plans are charged to the statement of income in the year to which they relate.
Other post-retirement obligations SomeGroupcompaniesprovidepost-retirementhealthcarebenefitsto their retirees. The entitlement to these benefits is usually based on the employee remaining in service up to retirement age and the completion of a minimum service period. The expected costs of these benefits are accrued over the period of employment, using a methodology similar to that for defined benefit pension plans. Actuarial gains and losses arising from experience adjustments and changes in actuarial assumptions are charged or credited to income over the expected average remaining service lives of the related employees. These obligations are valued annually by independent qualifiedactuaries.
Deferred taxDeferred tax is provided in full, using the liability method, on temporarydifferencesarisingbetweenthetaxbasesofassetsandliabilities and their carrying amounts in the financial statements.
The principal temporary differences arise from depreciationonpropertyandequipment,revaluationofcertainfinancialassetsand liabilities, provisions for pensions and tax losses carried forward; and, inrelationtoacquisitions,onthedifferencebetweenthefairvalues of the net assets acquired and their tax base. Currentlyenacted tax rates are used to determine deferred taxes.
Tax payable on profits, based on the applicable tax law in each jurisdiction, is recognised as an expense in the period in which profitsarise. Deferred taxassets relating to thecarry-forwardofunused tax losses are recognised to the extent that it is probable that future taxable profit will be available against which the tax losses can be utilised.
Deferredtaxrelatedtofairvaluere-measurementofavailable-for-saleinvestments,whichischargedorcrediteddirectlytoothercomprehensive income, is also credited or charged directly to other comprehensive income and is subsequently recognised in thestatement of income together with the realised gain or loss. BorrowingsBorrowings are recognised initially at fair value less transaction costs andaresubsequentlystatedatamortisedcostandanydifferencebetween net proceeds and the redemption value is recognised in the statement of income over the period of the borrowings, using theeffectiveinterestmethod.
45
Notes to the Consolidated Financial Statements For the year ended October 31, 2013(Expressed in thousands of United States dollars)
Share capital
Share issue costsShares issued for cash are accounted for at the issue price less any transaction costs associated with the issue. Shares issued as consideration for the purchase of assets, or a business, are recorded at the market price on the date of issue.
Dividends on common sharesDividends on common shares are recognised in equity in theperiod in which they are declared. Dividends for the year that are declared after the reporting date are not reflected in these financial statements.
Earnings per shareBasic earnings per share is calculated by dividing the net profit attributabletoequityholdersoftheparentbytheweightedaveragenumberofcommonshares(excludingtreasuryshares)outstandingduring the year.
Fiduciary activities The Group commonly acts as trustees and in other fiduciary capacities that result in the holding or placing of assets on behalf of individuals, trusts, retirement benefit plans and other institutions. These assets and income arising thereon are excluded from these financial statements, as they are not assets of the Group.
Segment reportingBusiness segments are reported in a manner consistent with the internal reporting provided to the chief operating decision-maker.The chief operating decision-maker is the person or group thatallocates resources to and assesses the performance of the business segments of an entity. The Group has determined the Group’s Senior ExecutiveTeamasitschiefoperatingdecision-maker.
Interest income is reported net within revenue as management primarily relies on net interest income as a performance measure and not the gross income and expense.
All transactions between business segments are conducted on an arm´s length basis, with intra-segment revenue and costsbeing eliminated on consolidation. Income and expenses directly associated with each segment are included in determining business segment performance.
ComparativesWhere necessary, comparative figures have been adjusted to comply with changes in presentation in the current year.
2.5 Future changes in accounting policies
Certain new standards, and amendments to existing standards have been published that are mandatory for the Group’s accounting periods beginning on or after November 1, 2013. Of these, the following are relevant to the Group but have not been early adopted:• IAS19 Employeebenefits(revised)• IFRS7 Financial instruments: disclosures (amendment) Offsetting Financial Assets and Financial Liabilities• IFRS9 Financial instruments part 1: classification and measurement• IFRS10 Consolidatedfinancialstatements• IFRS11 Jointarrangements• IFRS12 Disclosureofinterestsinotherentities• IFRS13 Fairvaluemeasurement
IAS19“EmployeeBenefits”–InJune2011,theIASBpublishedan amended version of IAS 19. The amendments require thefollowing: (i) recognition of actuarial gains and losses inOCI intheperiodinwhichtheyarise,(ii)recognitionof interest incomeon plan assets in net income, which is to be calculated using the same rate as that used to discount the defined benefit obligation, and(iii)recognitionofallpastservicecosts(gains)innetincomein the period in which they arise. Retrospective application of the amendments will result in a pre-tax decrease of approximately$26.2million in shareholder’s equity (a combinationofOCI andretained earnings) as at November 1, 2011 (after-tax decreaseof $25.8 million) due to the recognition in equity of pre-taxunamortizedactuariallossesandpre-taxunamortizedpastservicegains as at October 31, 2011. Retrospective application will also result in a decrease in our defined benefit and post-retirementmedicalbenefitsexpenseofapproximately$5.1millionfortheyearendedOctober31,2012(after-taxdecreaseofapproximately$5.0million)andadecreaseofapproximately$5.8millionfortheyearendedOctober31,2013(after-taxdecreaseofapproximately$5.6million). In addition, the remeasurementof the funded statusof
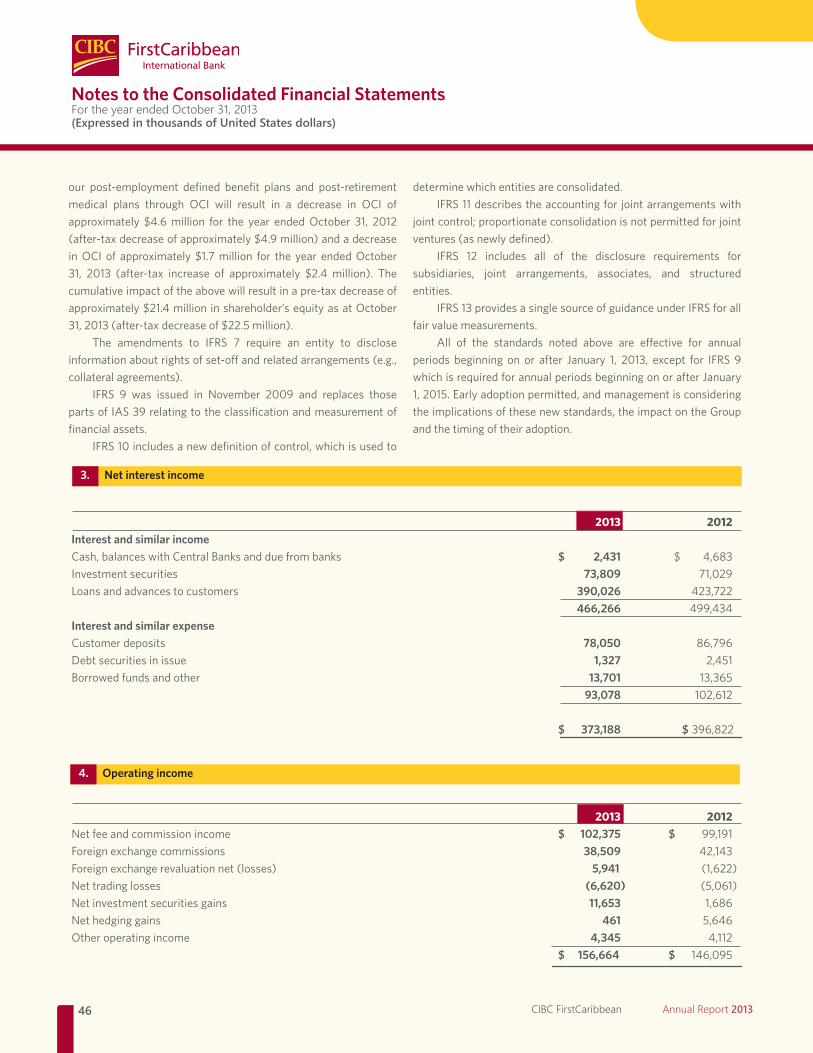
46 CIBC FirstCaribbean Annual Report 2013
our post-employment defined benefit plans and post-retirementmedical plans through OCI will result in a decrease in OCI of approximately $4.6million for the year endedOctober 31, 2012(after-taxdecreaseofapproximately$4.9million)andadecreaseinOCI of approximately $1.7million for the year endedOctober31, 2013 (after-tax increase of approximately $2.4 million). Thecumulativeimpactoftheabovewillresultinapre-taxdecreaseofapproximately$21.4millioninshareholder’sequityasatOctober31,2013(after-taxdecreaseof$22.5million).
The amendments to IFRS 7 require an entity to discloseinformationaboutrightsofset-offandrelatedarrangements(e.g.,collateralagreements).
IFRS 9 was issued in November 2009 and replaces those parts of IAS 39 relating to the classification and measurement of financial assets.
IFRS 10 includes a new definition of control, which is used to
determine which entities are consolidated.IFRS 11 describes the accounting for joint arrangements with
joint control; proportionate consolidation is not permitted for joint ventures(asnewlydefined).
IFRS 12 includes all of the disclosure requirements forsubsidiaries, joint arrangements, associates, and structured entities.
IFRS 13 provides a single source of guidance under IFRS for all fair value measurements.
All of the standards noted above are effective for annualperiods beginning on or after January 1, 2013, except for IFRS 9 whichisrequiredforannualperiodsbeginningonorafterJanuary1, 2015. Early adoption permitted, and management is considering the implications of these new standards, the impact on the Group and the timing of their adoption.
Notes to the Consolidated Financial Statements For the year ended October 31, 2013(Expressed in thousands of United States dollars)
2013 2012Interest and similar incomeCash, balances with Central Banks and due from banks $ 2,431 $ 4,683Investment securities 73,809 71,029 Loans and advances to customers 390,026 423,722 466,266 499,434 Interest and similar expenseCustomer deposits 78,050 86,796Debt securities in issue 1,327 2,451Borrowed funds and other 13,701 13,365 93,078 102,612 $ 373,188 $ 396,822
3. Net interest income
2013 2012Net fee and commission income $ 102,375 $ 99,191Foreign exchange commissions 38,509 42,143Foreignexchangerevaluationnet(losses) 5,941 (1,622)Net trading losses (6,620) (5,061)Net investment securities gains 11,653 1,686 Net hedging gains 461 5,646 Other operating income 4,345 4,112 $ 156,664 $ 146,095
4. Operating income
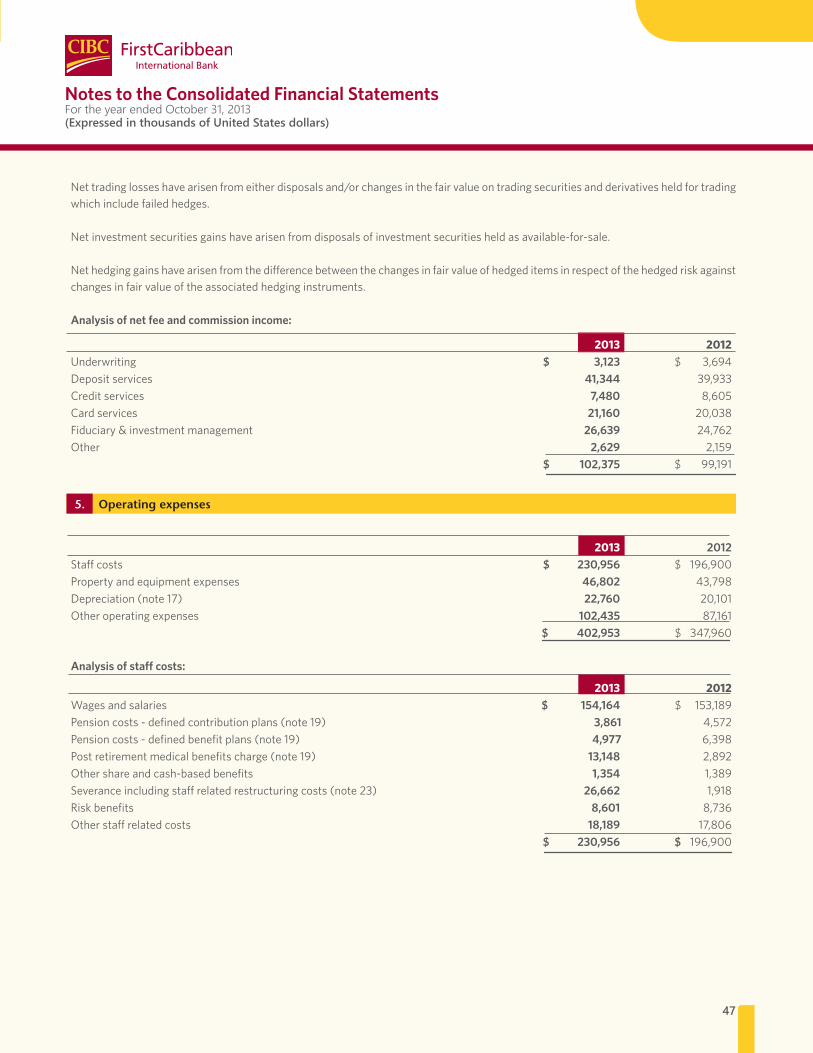
47
Notes to the Consolidated Financial Statements For the year ended October 31, 2013(Expressed in thousands of United States dollars)
5. Operating expenses
Nettradinglosseshavearisenfromeitherdisposalsand/orchangesinthefairvalueontradingsecuritiesandderivativesheldfortradingwhich include failed hedges.
Netinvestmentsecuritiesgainshavearisenfromdisposalsofinvestmentsecuritiesheldasavailable-for-sale.
Nethedginggainshavearisenfromthedifferencebetweenthechangesinfairvalueofhedgeditemsinrespectofthehedgedriskagainstchanges in fair value of the associated hedging instruments.
Analysis of net fee and commission income:
2013 2012Underwriting $ 3,123 $ 3,694Deposit services 41,344 39,933Credit services 7,480 8,605Card services 21,160 20,038Fiduciary & investment management 26,639 24,762Other 2,629 2,159 $ 102,375 $ 99,191
2013 2012Staffcosts $ 230,956 $ 196,900Propertyandequipmentexpenses 46,802 43,798Depreciation(note17) 22,760 20,101Other operating expenses 102,435 87,161 $ 402,953 $ 347,960
Analysis of sta� costs:
2013 2012Wages and salaries $ 154,164 $ 153,189Pensioncosts-definedcontributionplans(note19) 3,861 4,572Pensioncosts-definedbenefitplans(note19) 4,977 6,398Postretirementmedicalbenefitscharge(note19) 13,148 2,892Othershareandcash-basedbenefits 1,354 1,389Severanceincludingstaffrelatedrestructuringcosts(note23) 26,662 1,918Risk benefits 8,601 8,736Otherstaffrelatedcosts 18,189 17,806 $ 230,956 $ 196,900
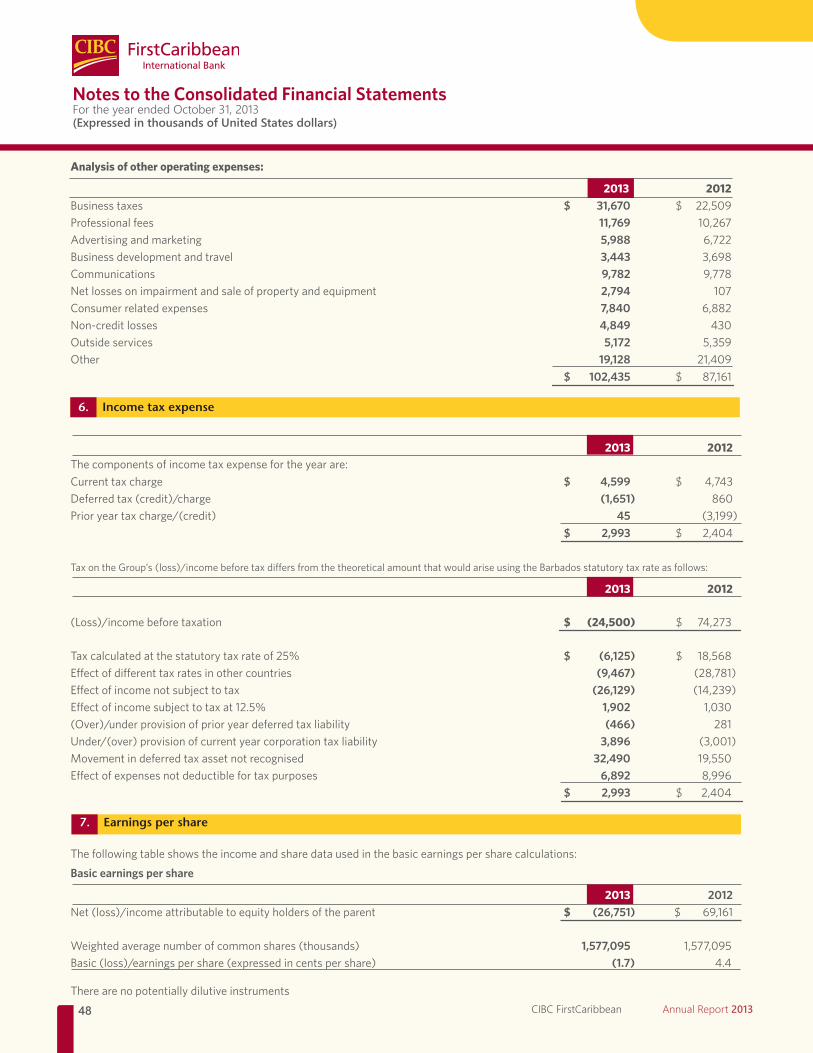
48 CIBC FirstCaribbean Annual Report 2013
Notes to the Consolidated Financial Statements For the year ended October 31, 2013(Expressed in thousands of United States dollars)
6. Income tax expense
7. Earnings per share
2013 2012The components of income tax expense for the year are: Current tax charge $ 4,599 $ 4,743Deferredtax(credit)/charge (1,651) 860 Prioryeartaxcharge/(credit) 45 (3,199) $ 2,993 $ 2,404
TaxontheGroup’s(loss)/incomebeforetaxdiffersfromthetheoreticalamountthatwouldariseusingtheBarbadosstatutorytaxrateasfollows:
2013 2012 (Loss)/incomebeforetaxation $ (24,500) $ 74,273
Taxcalculatedatthestatutorytaxrateof25% $ (6,125) $ 18,568Effectofdifferenttaxratesinothercountries (9,467) (28,781)Effectofincomenotsubjecttotax (26,129) (14,239)Effectofincomesubjecttotaxat12.5% 1,902 1,030 (Over)/underprovisionofprioryeardeferredtaxliability (466) 281 Under/(over)provisionofcurrentyearcorporationtaxliability 3,896 (3,001)Movement in deferred tax asset not recognised 32,490 19,550 Effectofexpensesnotdeductiblefortaxpurposes 6,892 8,996 $ 2,993 $ 2,404
The following table shows the income and share data used in the basic earnings per share calculations:
Basic earnings per share
2013 2012Net(loss)/incomeattributabletoequityholdersoftheparent $ (26,751) $ 69,161
Weightedaveragenumberofcommonshares(thousands) 1,577,095 1,577,095Basic(loss)/earningspershare(expressedincentspershare) (1.7) 4.4
There are no potentially dilutive instruments
Analysis of other operating expenses:
2013 2012Business taxes $ 31,670 $ 22,509Professional fees 11,769 10,267Advertising and marketing 5,988 6,722Business development and travel 3,443 3,698Communications 9,782 9,778 Netlossesonimpairmentandsaleofpropertyandequipment 2,794 107Consumer related expenses 7,840 6,882Non-creditlosses 4,849 430Outside services 5,172 5,359Other 19,128 21,409 $ 102,435 $ 87,161
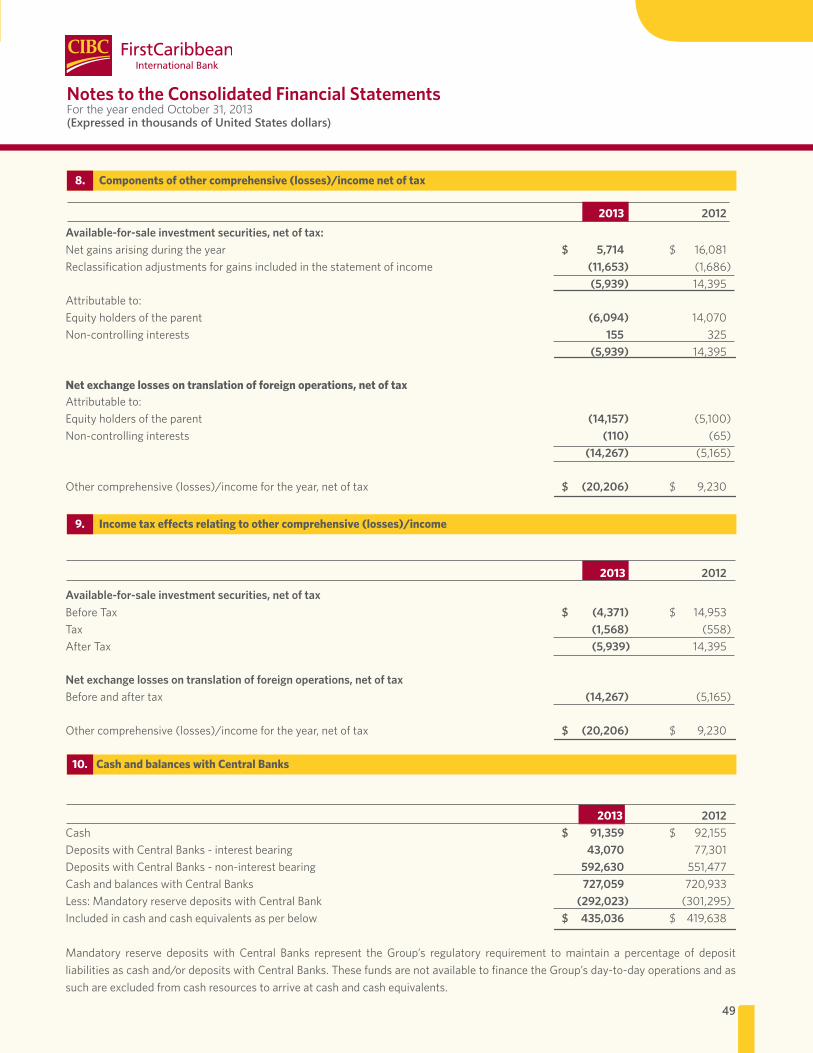
49
Notes to the Consolidated Financial Statements For the year ended October 31, 2013(Expressed in thousands of United States dollars)
2013 2012Available-for-sale investment securities, net of tax:Net gains arising during the year $ 5,714 $ 16,081Reclassification adjustments for gains included in the statement of income (11,653) (1,686) (5,939) 14,395Attributable to: Equityholdersoftheparent (6,094) 14,070Non-controllinginterests 155 325 (5,939) 14,395
Net exchange losses on translation of foreign operations, net of tax Attributable to: Equityholdersoftheparent (14,157) (5,100)Non-controllinginterests (110) (65) (14,267) (5,165)
Othercomprehensive(losses)/incomefortheyear,netoftax $ (20,206) $ 9,230
2013 2012
Available-for-sale investment securities, net of taxBefore Tax $ (4,371) $ 14,953Tax (1,568) (558)After Tax (5,939) 14,395
Net exchange losses on translation of foreign operations, net of taxBefore and after tax (14,267) (5,165)
Othercomprehensive(losses)/incomefortheyear,netoftax $ (20,206) $ 9,230
2013 2012Cash $ 91,359 $ 92,155DepositswithCentralBanks-interestbearing 43,070 77,301DepositswithCentralBanks-non-interestbearing 592,630 551,477Cash and balances with Central Banks 727,059 720,933Less: Mandatory reserve deposits with Central Bank (292,023) (301,295)Includedincashandcashequivalentsasperbelow $ 435,036 $ 419,638
Mandatory reserve deposits with Central Banks represent the Group’s regulatory requirement tomaintain a percentage of depositliabilitiesascashand/ordepositswithCentralBanks.ThesefundsarenotavailabletofinancetheGroup’sday-to-dayoperationsandassuchareexcludedfromcashresourcestoarriveatcashandcashequivalents.
9. Income tax e�ects relating to other comprehensive (losses)/income
8. Components of other comprehensive (losses)/income net of tax
10. Cash and balances with Central Banks
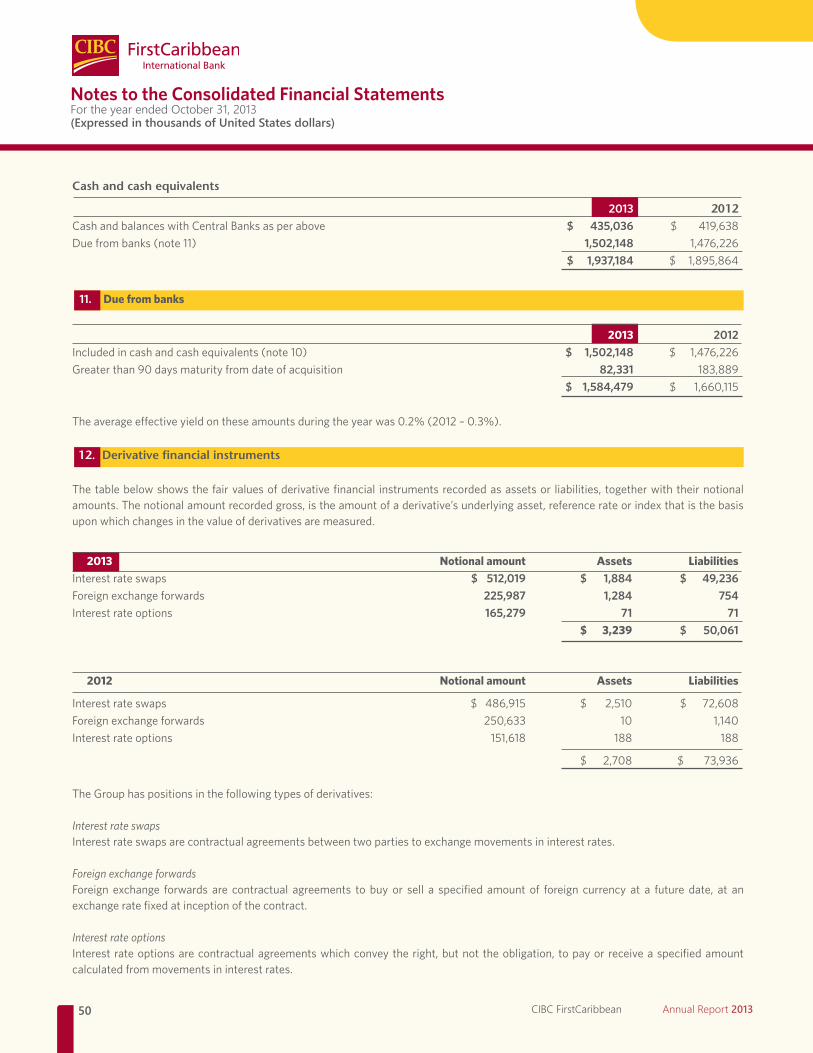
50 CIBC FirstCaribbean Annual Report 2013
Notes to the Consolidated Financial Statements For the year ended October 31, 2013(Expressed in thousands of United States dollars)
Cash and cash equivalents
2013 2012Cash and balances with Central Banks as per above $ 435,036 $419,638 Duefrombanks(note11) 1,502,148 1,476,226 $ 1,937,184 $ 1,895,864
2013 2012Includedincashandcashequivalents(note10) $ 1,502,148 $ 1,476,226Greaterthan90daysmaturityfromdateofacquisition 82,331 183,889 $ 1,584,479 $ 1,660,115
Theaverageeffectiveyieldontheseamountsduringtheyearwas0.2%(2012–0.3%).
The table below shows the fair values of derivative financial instruments recorded as assets or liabilities, together with their notional amounts. The notional amount recorded gross, is the amount of a derivative’s underlying asset, reference rate or index that is the basis upon which changes in the value of derivatives are measured.
2013 Notional amount Assets LiabilitiesInterest rate swaps $ 512,019 $ 1,884 $ 49,236 Foreign exchange forwards 225,987 1,284 754Interest rate options 165,279 71 71 $ 3,239 $ 50,061
2012 Notional amount Assets Liabilities
Interestrateswaps $486,915 $ 2,510 $ 72,608Foreign exchange forwards 250,633 10 1,140Interest rate options 151,618 188 188
$ 2,708 $ 73,936
The Group has positions in the following types of derivatives:
Interest rate swapsInterest rate swaps are contractual agreements between two parties to exchange movements in interest rates.
Foreign exchange forwardsForeign exchange forwards are contractual agreements to buy or sell a specified amount of foreign currency at a future date, at an exchange rate fixed at inception of the contract.
Interest rate optionsInterest rate options are contractual agreements which convey the right, but not the obligation, to pay or receive a specified amount calculated from movements in interest rates.
11. Due from banks
12. Derivative financial instruments
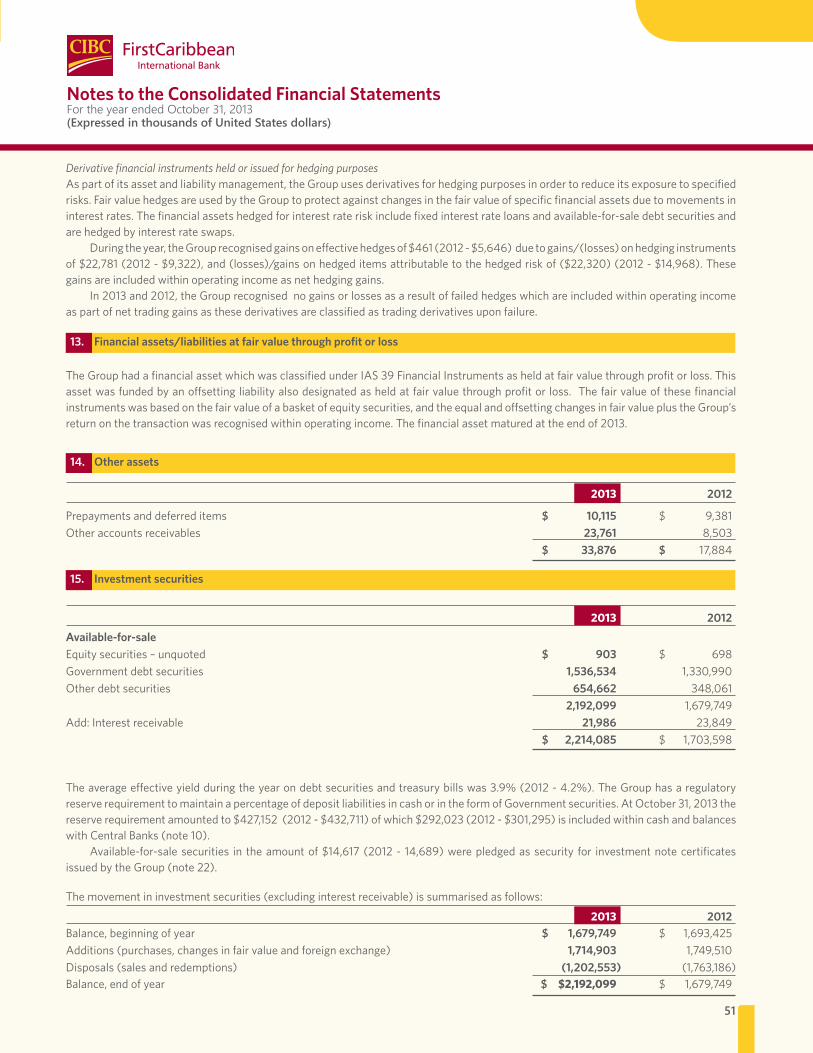
51
Notes to the Consolidated Financial Statements For the year ended October 31, 2013(Expressed in thousands of United States dollars)
13. Financial assets/liabilities at fair value through profit or loss
14. Other assets
15. Investment securities
Derivative financial instruments held or issued for hedging purposesAs part of its asset and liability management, the Group uses derivatives for hedging purposes in order to reduce its exposure to specified risks. Fair value hedges are used by the Group to protect against changes in the fair value of specific financial assets due to movements in interestrates.Thefinancialassetshedgedforinterestrateriskincludefixedinterestrateloansandavailable-for-saledebtsecuritiesandare hedged by interest rate swaps.
Duringtheyear,theGrouprecognisedgainsoneffectivehedgesof$461(2012-$5,646)duetogains/(losses)onhedginginstrumentsof$22,781(2012-$9,322),and(losses)/gainsonhedgeditemsattributabletothehedgedriskof($22,320)(2012-$14,968).Thesegains are included within operating income as net hedging gains.
In 2013 and 2012, the Group recognised no gains or losses as a result of failed hedges which are included within operating income as part of net trading gains as these derivatives are classified as trading derivatives upon failure.
The Group had a financial asset which was classified under IAS 39 Financial Instruments as held at fair value through profit or loss. This assetwasfundedbyanoffsettingliabilityalsodesignatedasheldatfairvaluethroughprofitorloss.Thefairvalueofthesefinancialinstrumentswasbasedonthefairvalueofabasketofequitysecurities,andtheequalandoffsettingchangesinfairvalueplustheGroup’sreturn on the transaction was recognised within operating income. The financial asset matured at the end of 2013.
2013 2012
Prepayments and deferred items $ 10,115 $ 9,381Other accounts receivables 23,761 8,503 $ 33,876 $ 17,884
2013 2012Available-for-saleEquitysecurities–unquoted $ 903 $ 698Government debt securities 1,536,534 1,330,990 Other debt securities 654,662 348,061 2,192,099 1,679,749Add: Interest receivable 21,986 23,849 $ 2,214,085 $ 1,703,598
Theaverageeffectiveyieldduringtheyearondebtsecuritiesandtreasurybillswas3.9%(2012-4.2%).TheGrouphasaregulatoryreserverequirementtomaintainapercentageofdepositliabilitiesincashorintheformofGovernmentsecurities.AtOctober31,2013thereserverequirementamountedto$427,152(2012-$432,711)ofwhich$292,023(2012-$301,295)isincludedwithincashandbalanceswithCentralBanks(note10).
Available-for-salesecurities in theamountof$14,617(2012- 14,689)werepledgedassecurity for investmentnotecertificatesissuedbytheGroup(note22).
Themovementininvestmentsecurities(excludinginterestreceivable)issummarisedasfollows:
2013 2012Balance, beginning of year $ 1,679,749 $ 1,693,425Additions(purchases,changesinfairvalueandforeignexchange) 1,714,903 1,749,510Disposals(salesandredemptions) (1,202,553) (1,763,186)Balance, end of year $ $2,192,099 $ 1,679,749
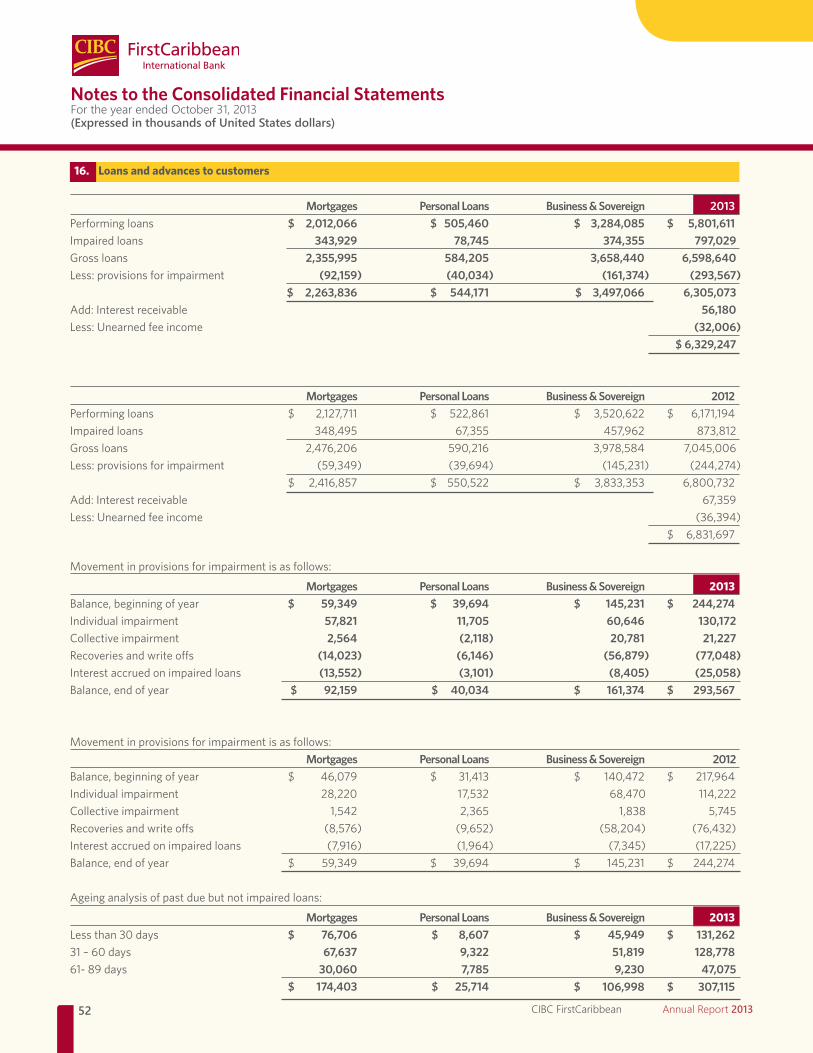
52 CIBC FirstCaribbean Annual Report 2013
Notes to the Consolidated Financial Statements For the year ended October 31, 2013(Expressed in thousands of United States dollars)
Mortgages Personal Loans Business & Sovereign 2013Performing loans $ 2,012,066 $ 505,460 $ 3,284,085 $ 5,801,611Impaired loans 343,929 78,745 374,355 797,029Gross loans 2,355,995 584,205 3,658,440 6,598,640Less: provisions for impairment (92,159) (40,034) (161,374) (293,567) $ 2,263,836 $ 544,171 $ 3,497,066 6,305,073 Add: Interest receivable 56,180Less:Unearnedfeeincome (32,006) $ 6,329,247
Mortgages Personal Loans Business & Sovereign 2012Performingloans $ 2,127,711 $ 522,861 $ 3,520,622 $ 6,171,194Impaired loans 348,495 67,355 457,962 873,812Gross loans 2,476,206 590,216 3,978,584 7,045,006Less:provisionsforimpairment (59,349) (39,694) (145,231) (244,274) $ 2,416,857 $ 550,522 $ 3,833,353 6,800,732Add: Interest receivable 67,359Less:Unearnedfeeincome (36,394) $ 6,831,697
Movement in provisions for impairment is as follows:
Mortgages Personal Loans Business & Sovereign 2013Balance, beginning of year $ 59,349 $ 39,694 $ 145,231 $ 244,274 Individual impairment 57,821 11,705 60,646 130,172Collective impairment 2,564 (2,118) 20,781 21,227Recoveriesandwriteoffs (14,023) (6,146) (56,879) (77,048) Interest accrued on impaired loans (13,552) (3,101) (8,405) (25,058)Balance, end of year $ 92,159 $ 40,034 $ 161,374 $ 293,567
Movement in provisions for impairment is as follows: Mortgages Personal Loans Business & Sovereign 2012Balance,beginningofyear $ 46,079 $ 31,413 $ 140,472 $ 217,964Individual impairment 28,220 17,532 68,470 114,222Collective impairment 1,542 2,365 1,838 5,745Recoveriesandwriteoffs (8,576) (9,652) (58,204) (76,432)Interestaccruedonimpairedloans (7,916) (1,964) (7,345) (17,225)Balance,endofyear $ 59,349 $ 39,694 $ 145,231 $ 244,274
Ageing analysis of past due but not impaired loans:
Mortgages Personal Loans Business & Sovereign 2013Less than 30 days $ 76,706 $ 8,607 $ 45,949 $ 131,262 31 – 60 days 67,637 9,322 51,819 128,77861-89days 30,060 7,785 9,230 47,075 $ 174,403 $ 25,714 $ 106,998 $ 307,115
16. Loans and advances to customers
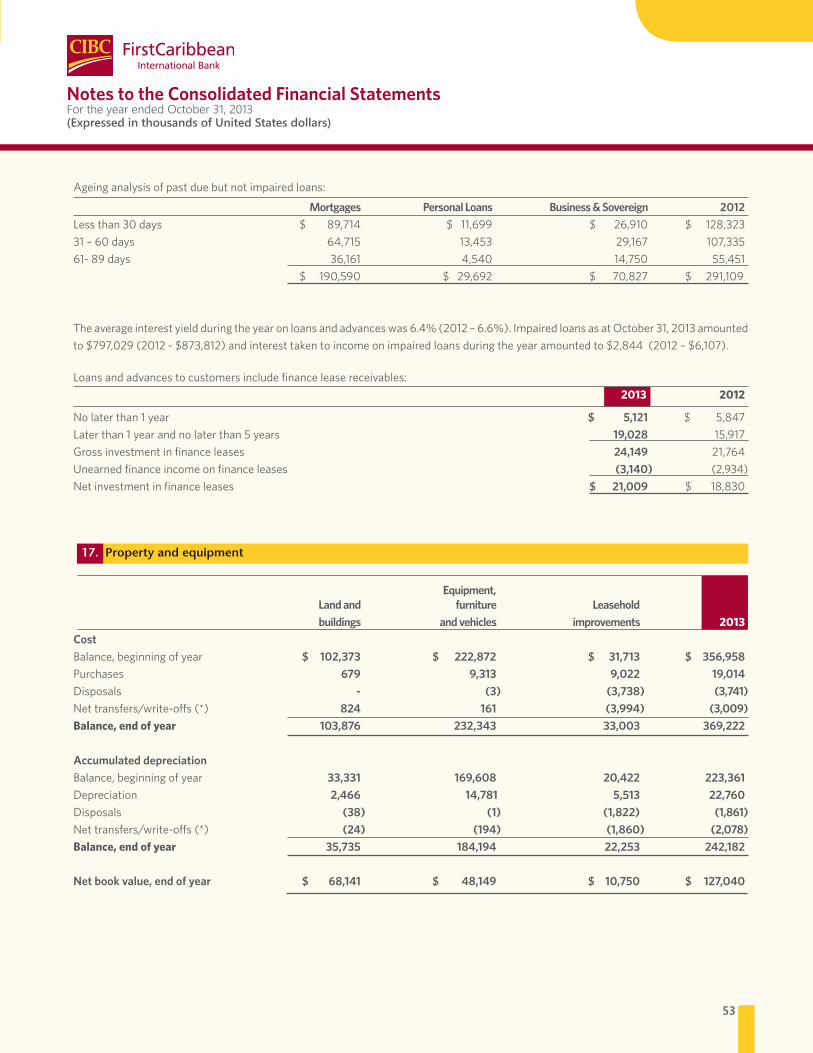
53
Notes to the Consolidated Financial Statements For the year ended October 31, 2013(Expressed in thousands of United States dollars)
Ageing analysis of past due but not impaired loans:
Mortgages Personal Loans Business & Sovereign 2012Lessthan30days $ 89,714 $11,699 $ 26,910 $ 128,32331 – 60 days 64,715 13,453 29,167 107,33561-89days 36,161 4,540 14,750 55,451 $ 190,590 $29,692 $ 70,827 $ 291,109
Theaverageinterestyieldduringtheyearonloansandadvanceswas6.4%(2012–6.6%).ImpairedloansasatOctober31,2013amountedto$797,029(2012-$873,812)andinteresttakentoincomeonimpairedloansduringtheyearamountedto$2,844(2012–$6,107).
Loans and advances to customers include finance lease receivables: 2013 2012
No later than 1 year $ 5,121 $ 5,847Later than 1 year and no later than 5 years 19,028 15,917Gross investment in finance leases 24,149 21,764Unearnedfinanceincomeonfinanceleases (3,140) (2,934)Net investment in finance leases $ 21,009 $ 18,830
Equipment, Land and furniture Leasehold buildings and vehicles improvements 2013Cost Balance, beginning of year $ 102,373 $ 222,872 $ 31,713 $ 356,958Purchases 679 9,313 9,022 19,014Disposals - (3) (3,738) (3,741)Nettransfers/write-offs(*) 824 161 (3,994) (3,009)Balance, end of year 103,876 232,343 33,003 369,222
Accumulated depreciation Balance, beginning of year 33,331 169,608 20,422 223,361Depreciation 2,466 14,781 5,513 22,760Disposals (38) (1) (1,822) (1,861)Nettransfers/write-offs(*) (24) (194) (1,860) (2,078)Balance, end of year 35,735 184,194 22,253 242,182
Net book value, end of year $ 68,141 $ 48,149 $ 10,750 $ 127,040
17. Property and equipment

54 CIBC FirstCaribbean Annual Report 2013
Notes to the Consolidated Financial Statements For the year ended October 31, 2013(Expressed in thousands of United States dollars)
Land and Equipment, furniture Leasehold buildings and vehicles improvements 2012
Cost Balance,beginningofyear $ 99,861 $209,319 $ 29,737 $ 338,917Purchases 1,811 19,099 2,395 23,305Disposals (280) (123) (701) (1,104)Nettransfers/write-offs(*) 981 (5,423) 282 (4,160)Balance, end of year 102,373 222,872 31,713 356,958
Accumulated depreciation Balance, beginning of year 31,084 158,467 18,110 207,661Depreciation 2,316 14,901 2,884 20,101Disposals (131) (110) - (241)Nettransfers/write-offs(*) 62 (3,650) (572) (4,160)Balance, end of year 33,331 169,608 20,422 223,361
Net book value, end of year $69,042 $ 53,264 $ 11,291 $ 133,597
Includedaspartofequipment,furnitureandvehiclesisanamountfor$16,594(2012-$15,130)relatingtosystemsdevelopmentcostsand work in progress which is incomplete, not yet in operation and on which no depreciation has been charged.
*Thisreferstotransfersandnetwrite-offsoffullydepreciatedassetswhicharenolongerinusebytheBank.
Themovementonthenetdeferredtaxassets/(liabilities)wasasfollows: 2013 2012Net deferred tax position, beginning of year $ 12,965 $ 14,383Deferredtaxcredit/(charge)tostatementof(loss)/incomefortheyear 1,651 (860)Deferredtaxchargetoothercomprehensive(losses)/incomefortheyear (1,568) (558)Net deferred tax position, end of year $ 13,048 $ 12,965
Represented by: 2013 2012
Deferred tax assets $ 14,819 $ 13,922Deferred tax liabilities (1,771) (957)Net deferred tax position, end of year $ 13,048 $ 12,965
The components of the net deferred tax position are: 2013 2012
Accelerated tax depreciation $ 870 $ 431Loan loss provisions 5,812 2,151Other provisions 1,940 2,533Tax losses carried forward 11,322 13,632Pensionandotherpost-retirementbenefitassets (6,282) (6,736)Changesinfairvalueofavailable-for-saleinvestmentsecuritiesinothercomprehensive(losses)/income (614) 954
$ 13,048 $ 12,965
18. Deferred tax assets/(liabilities)
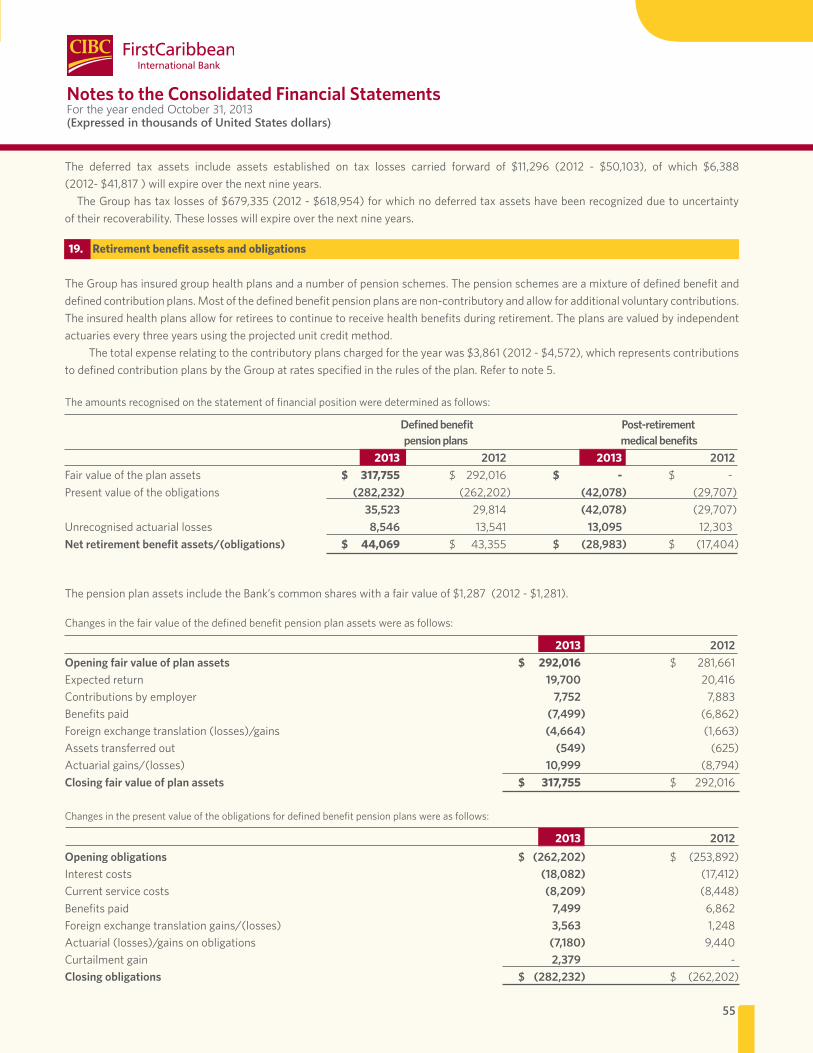
55
Notes to the Consolidated Financial Statements For the year ended October 31, 2013(Expressed in thousands of United States dollars)
The deferred tax assets include assets established on tax losses carried forward of $11,296 (2012 - $50,103), of which $6,388 (2012-$41,817)willexpireoverthenextnineyears.TheGrouphastaxlossesof$679,335(2012-$618,954)forwhichnodeferredtaxassetshavebeenrecognizedduetouncertainty
of their recoverability. These losses will expire over the next nine years.
The Group has insured group health plans and a number of pension schemes. The pension schemes are a mixture of defined benefit and definedcontributionplans.Mostofthedefinedbenefitpensionplansarenon-contributoryandallowforadditionalvoluntarycontributions.The insured health plans allow for retirees to continue to receive health benefits during retirement. The plans are valued by independent actuaries every three years using the projected unit credit method.
Thetotalexpenserelatingtothecontributoryplanschargedfortheyearwas$3,861(2012-$4,572),whichrepresentscontributionsto defined contribution plans by the Group at rates specified in the rules of the plan. Refer to note 5.
The amounts recognised on the statement of financial position were determined as follows:
Defined benefit Post-retirement pension plans medical benefits 2013 2012 2013 2012Fair value of the plan assets $ 317,755 $ 292,016 $ - $ -Present value of the obligations (282,232) (262,202) (42,078) (29,707) 35,523 29,814 (42,078) (29,707)Unrecognisedactuariallosses 8,546 13,541 13,095 12,303Net retirement benefit assets/(obligations) $ 44,069 $ 43,355 $ (28,983) $ (17,404)
ThepensionplanassetsincludetheBank’scommonshareswithafairvalueof$1,287(2012-$1,281).
Changes in the fair value of the defined benefit pension plan assets were as follows:
2013 2012Opening fair value of plan assets $ 292,016 $ 281,661Expected return 19,700 20,416Contributions by employer 7,752 7,883Benefits paid (7,499) (6,862)Foreignexchangetranslation(losses)/gains (4,664) (1,663)Assets transferred out (549) (625)Actuarialgains/(losses) 10,999 (8,794)Closing fair value of plan assets $ 317,755 $ 292,016
Changes in the present value of the obligations for defined benefit pension plans were as follows:
2013 2012Opening obligations $ (262,202) $ (253,892)Interest costs (18,082) (17,412)Current service costs (8,209) (8,448)Benefits paid 7,499 6,862Foreignexchangetranslationgains/(losses) 3,563 1,248 Actuarial(losses)/gainsonobligations (7,180) 9,440Curtailment gain 2,379 -Closing obligations $ (282,232) $ (262,202)
19. Retirement benefit assets and obligations
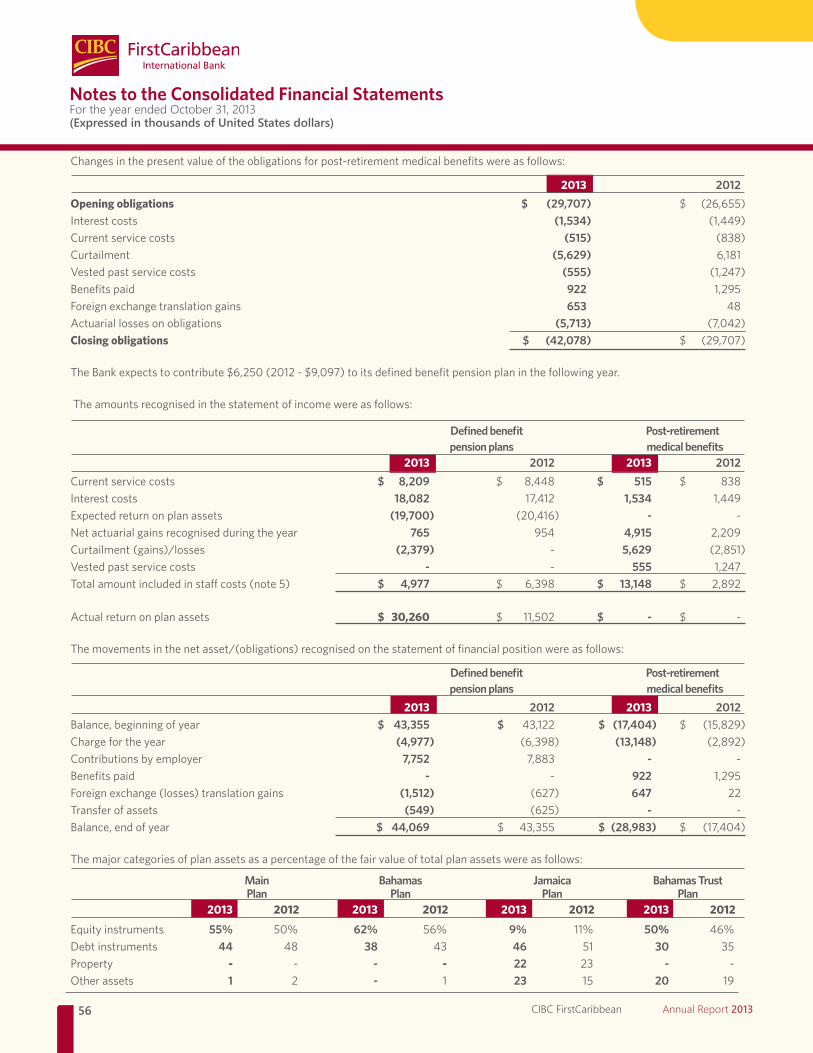
56 CIBC FirstCaribbean Annual Report 2013
Notes to the Consolidated Financial Statements For the year ended October 31, 2013(Expressed in thousands of United States dollars)
Changesinthepresentvalueoftheobligationsforpost-retirementmedicalbenefitswereasfollows:
2013 2012Opening obligations $ (29,707) $ (26,655)Interest costs (1,534) (1,449)Current service costs (515) (838)Curtailment (5,629) 6,181Vested past service costs (555) (1,247)Benefits paid 922 1,295Foreign exchange translation gains 653 48Actuarial losses on obligations (5,713) (7,042)Closing obligations $ (42,078) $ (29,707)
TheBankexpectstocontribute$6,250(2012-$9,097)toitsdefinedbenefitpensionplaninthefollowingyear.
The amounts recognised in the statement of income were as follows: Defined benefit Post-retirement pension plans medical benefits 2013 2012 2013 2012Current service costs $ 8,209 $ 8,448 $ 515 $ 838Interest costs 18,082 17,412 1,534 1,449Expected return on plan assets (19,700) (20,416) - -Net actuarial gains recognised during the year 765 954 4,915 2,209Curtailment(gains)/losses (2,379) - 5,629 (2,851)Vested past service costs - - 555 1,247Totalamountincludedinstaffcosts(note5) $ 4,977 $ 6,398 $ 13,148 $ 2,892
Actual return on plan assets $ 30,260 $ 11,502 $ - $ -
Themovementsinthenetasset/(obligations)recognisedonthestatementoffinancialpositionwereasfollows: Defined benefit Post-retirement pension plans medical benefits 2013 2012 2013 2012Balance, beginning of year $ 43,355 $ 43,122 $ (17,404) $(15,829)Charge for the year (4,977) (6,398) (13,148) (2,892)Contributions by employer 7,752 7,883 - -Benefits paid - - 922 1,295Foreignexchange(losses)translationgains (1,512) (627) 647 22Transfer of assets (549) (625) - -Balance, end of year $ 44,069 $ 43,355 $ (28,983) $ (17,404)
The major categories of plan assets as a percentage of the fair value of total plan assets were as follows:
Main Bahamas Jamaica Bahamas Trust Plan Plan Plan Plan 2013 2012 2013 2012 2013 2012 2013 2012
Equityinstruments 55% 50% 62% 56% 9% 11% 50% 46%Debt instruments 44 48 38 43 46 51 30 35Property - - - - 22 23 - -Other assets 1 2 - 1 23 15 20 19
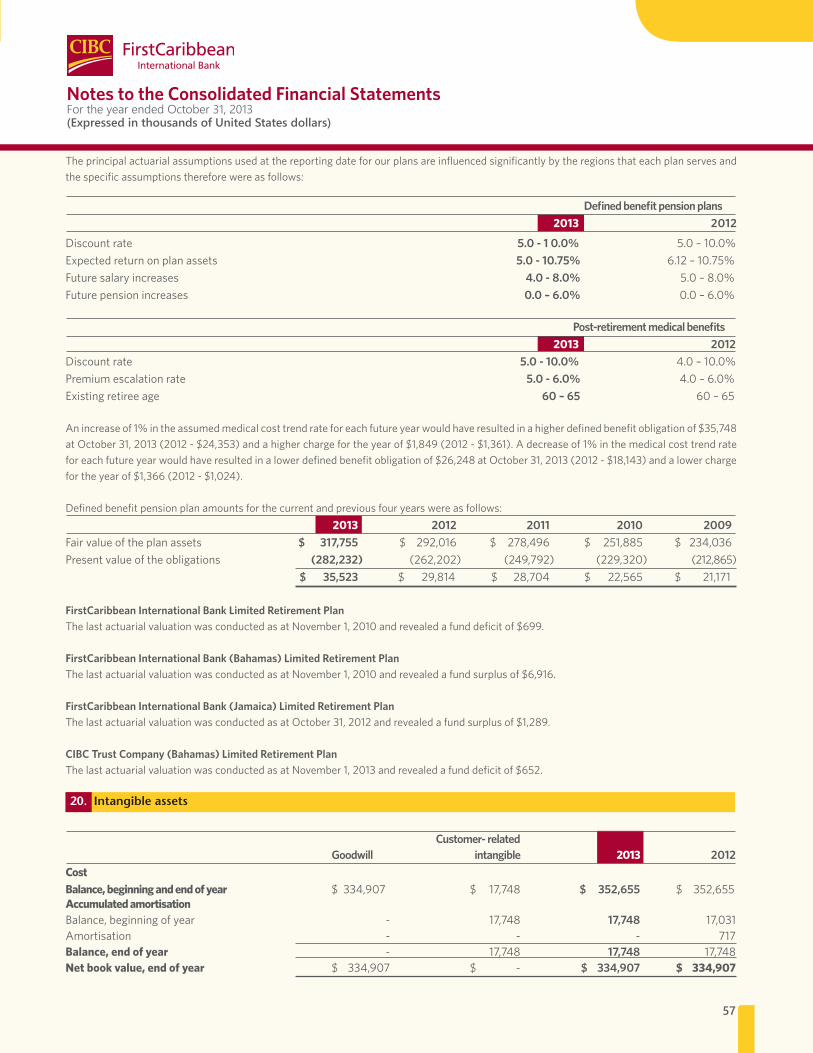
57
Notes to the Consolidated Financial Statements For the year ended October 31, 2013(Expressed in thousands of United States dollars)
The principal actuarial assumptions used at the reporting date for our plans are influenced significantly by the regions that each plan serves and the specific assumptions therefore were as follows: Defined benefit pension plans 2013 2012
Discount rate 5.0 - 1 0.0% 5.0–10.0%Expected return on plan assets 5.0 - 10.75% 6.12–10.75%Future salary increases 4.0 - 8.0% 5.0–8.0%Future pension increases 0.0 – 6.0% 0.0–6.0%
Post-retirement medical benefits 2013 2012Discount rate 5.0 - 10.0% 4.0–10.0%Premium escalation rate 5.0 - 6.0% 4.0–6.0%Existing retiree age 60 – 65 60 – 65
Anincreaseof1%intheassumedmedicalcosttrendrateforeachfutureyearwouldhaveresultedinahigherdefinedbenefitobligationof$35,748atOctober31,2013(2012-$24,353)andahigherchargefortheyearof$1,849(2012-$1,361).Adecreaseof1%inthemedicalcosttrendrateforeachfutureyearwouldhaveresultedinalowerdefinedbenefitobligationof$26,248atOctober31,2013(2012-$18,143)andalowerchargefortheyearof$1,366(2012-$1,024).
Defined benefit pension plan amounts for the current and previous four years were as follows: 2013 2012 2011 2010 2009Fair value of the plan assets $ 317,755 $ 292,016 $ 278,496 $ 251,885 $234,036Present value of the obligations (282,232) (262,202) (249,792) (229,320) (212,865) $ 35,523 $ 29,814 $ 28,704 $ 22,565 $ 21,171
FirstCaribbean International Bank Limited Retirement PlanThelastactuarialvaluationwasconductedasatNovember1,2010andrevealedafunddeficitof$699.
FirstCaribbean International Bank (Bahamas) Limited Retirement PlanThelastactuarialvaluationwasconductedasatNovember1,2010andrevealedafundsurplusof$6,916.
FirstCaribbean International Bank (Jamaica) Limited Retirement PlanThelastactuarialvaluationwasconductedasatOctober31,2012andrevealedafundsurplusof$1,289.
CIBC Trust Company (Bahamas) Limited Retirement PlanThelastactuarialvaluationwasconductedasatNovember1,2013andrevealedafunddeficitof$652.
Customer- related Goodwill intangible 2013 2012Cost Balance, beginning and end of year $334,907 $ 17,748 $ 352,655 $ 352,655Accumulated amortisationBalance,beginningofyear - 17,748 17,748 17,031Amortisation - - - 717Balance, end of year - 17,748 17,748 17,748 Net book value, end of year $ 334,907 $ - $ 334,907 $ 334,907
20. Intangible assets

58 CIBC FirstCaribbean Annual Report 2013
Notes to the Consolidated Financial Statements For the year ended October 31, 2013(Expressed in thousands of United States dollars)
Goodwill
Impairment tests for goodwillGoodwillisallocatedtotheGroup’scash-generatingunits(CGUs)identifiedaccordingtocountryofoperation.This allocation is presented below:
2013 2012St. Vincent $ 946 $ 946Barbados(WealthManagementOperations) 17,040 17,040Bahamas 177,920 177,920Cayman 105,369 105,369Trinidad 4,260 4,260Curaçao 29,372 29,372 $ 334,907 $334,907
Therecoverableamountforeachgroupofcash-generatingunitshasbeendeterminedusingvalue-in-usecalculations.Thesecalculationsusecashflow projections based on financial budgets approved by management covering a three year period. Cash flows beyond the three year period are extrapolatedusingtheestimatedgrowthratesstatedbelow.Thegrowthratedoesnotexceedthelong-termaveragegrowthrateforthecountryinwhichtheCGUoperates.
Key assumptions used for value-in-use calculationsAdescriptionofeachassumptiononwhichmanagementhasbaseditscashflowprojectionsfortheperiodcoveredbythemostrecentbudgets/forecastsisnotedbelow.KeyassumptionsarethosetowhichtheCGU’srecoverableamountismostsensitive.
Discount Rate Growth Rate 2013 2012 2013 2012St. Vincent 13% 13% 3% 3%Barbados(WealthManagementOperations) 14 7 2 2Bahamas 12 10 3 3Cayman 10 8 3 3Trinidad 10 11 2 2Curaçao 12 7 2 2
Customer-related intangible assetsCustomer-relatedintangibleassetsrepresentthefairvalueofeachcustomerrelationshipacquiredinabusinesscombination,asoftheacquisitiondate,whichmetthecontractual-legalcriterionforidentificationasanintangibleassetinthestatementoffinancialpositionseparatedfromgoodwill.Thefairvalueofthecustomerrelationshipswasamortisedonastraight-linebasisoveritsexpectedusefullifeofsixyearswhichconcludedin2012.
Payable on Payable Payable at a demand after notice fixed date 2013 2012Individuals $ 964,536 $ 1,833,665 $ 2,206,962 $ 5,005,163 $ 5,021,788Business & Sovereign 1,999,109 608,715 1,959,849 4,567,673 4,487,439Banks 9,530 - 6,356 15,886 99,634 2,973,175 2,442,380 4,173,167 9,588,722 9,608,861Add: Interest payable 900 949 15,962 17,811 15,744 $ 2,974,075 $ 2,443,329 $ 4,189,129 $ 9,606,533 $ 9,624,605
Theaverageeffectiverateofinterestoncustomerdepositsduringtheyearwas0.8%(2012-0.9%).
21. Customer deposits
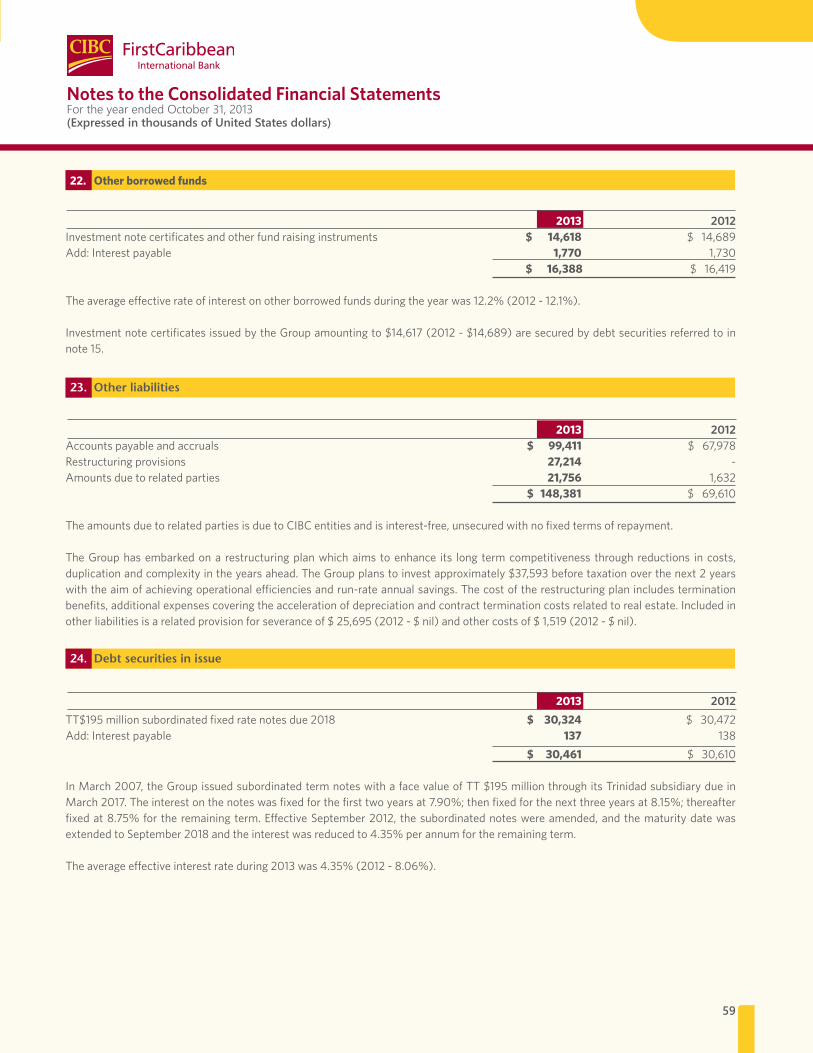
59
Notes to the Consolidated Financial Statements For the year ended October 31, 2013(Expressed in thousands of United States dollars)
22. Other borrowed funds
23. Other liabilities
24. Debt securities in issue
2013 2012Investment note certificates and other fund raising instruments $ 14,618 $14,689Add: Interest payable 1,770 1,730 $ 16,388 $16,419
Theaverageeffectiverateofinterestonotherborrowedfundsduringtheyearwas12.2%(2012-12.1%).
InvestmentnotecertificatesissuedbytheGroupamountingto$14,617(2012-$14,689)aresecuredbydebtsecuritiesreferredtoin note 15.
2013 2012Accounts payable and accruals $ 99,411 $67,978Restructuring provisions 27,214 -Amounts due to related parties 21,756 1,632 $ 148,381 $69,610
TheamountsduetorelatedpartiesisduetoCIBCentitiesandisinterest-free,unsecuredwithnofixedtermsofrepayment.
The Group has embarked on a restructuring plan which aims to enhance its long term competitiveness through reductions in costs, duplicationandcomplexityintheyearsahead.TheGroupplanstoinvestapproximately$37,593beforetaxationoverthenext2yearswiththeaimofachievingoperationalefficienciesandrun-rateannualsavings.Thecostoftherestructuringplanincludesterminationbenefits, additional expenses covering the acceleration of depreciation and contract termination costs related to real estate. Included in otherliabilitiesisarelatedprovisionforseveranceof$25,695(2012-$nil)andothercostsof$1,519(2012-$nil).
2013 2012TT$195millionsubordinatedfixedratenotesdue2018 $ 30,324 $30,472Add: Interest payable 137 138 $ 30,461 $30,610
InMarch2007,theGroupissuedsubordinatedtermnoteswithafacevalueofTT$195millionthroughitsTrinidadsubsidiarydueinMarch2017.Theinterestonthenoteswasfixedforthefirsttwoyearsat7.90%;thenfixedforthenextthreeyearsat8.15%;thereafterfixedat8.75%for theremainingterm.EffectiveSeptember2012, thesubordinatednoteswereamended,andthematuritydatewasextendedtoSeptember2018andtheinterestwasreducedto4.35%perannumfortheremainingterm.
Theaverageeffectiveinterestrateduring2013was4.35%(2012-8.06%).
60 CIBC FirstCaribbean Annual Report 2013
Notes to the Consolidated Financial Statements For the year ended October 31, 2013(Expressed in thousands of United States dollars)
2013 2012
Balance, beginning and end of year $ 1,193,149 $ 1,193,149
Notes to the Consolidated Financial Statements For the year ended October 31, 2013(Expressed in thousands of United States dollars)
25. Issued capital
The Bank is entitled to issue an unlimited number of common shares with no par value. Common shareholders are entitled to attend and vote at all meetings of shareholders. Common shareholders have one vote for each share owned.
The Bank has 1,577,094,570 common shares issued and outstanding at the end of both years.
Capital
Objectives, policies and proceduresCapital strength provides protection for depositors and creditors and allows the Group to undertake profitable business opportunities as they arise. Our objective is to employ a strong and e�cient capital base.
Regulatory requirementsOurregulatorycapitalrequirementsaredeterminedinaccordancewith guidelines issued by our banking regulators across the region and in the case of Barbados, by the Central Bank of Barbados. These guidelines evolved from the framework of risk based capital
standards developed by the Basel Committee, Bank of International Settlement(BIS).BISstandardsrequirethatbanksmaintainminimumTier Iand
TierI&TierIIratiosof4%and8%respectively.TheCentralBankof Barbados has established that FirstCaribbean International Bank Limitedmaintainsminimum ratios of 7% and 14% respectively.During the year, we have complied in full with all of our regulatory capitalrequirements.
Regulatory capitalRegulatory capital consists of Tier I and Tier II capital, less certain deductions. Tier I capital comprises common stock, retained earnings,andnon-controlling interests inconsolidatedsubsidiaries, less goodwill and other deductions. Tier II capital principally comprises hybrid capital instruments such as subordinated debt, general provisions and 45% of revaluationreservesonavailable-for-salesecurities.
As at October 31, 2013, Tier I and Tier I & Tier II capital ratios were 23%and24%respectively(2012-23%and24%respectively).
61
Notes to the Consolidated Financial Statements For the year ended October 31, 2013(Expressed in thousands of United States dollars)
Notes to the Consolidated Financial Statements For the year ended October 31, 2013(Expressed in thousands of United States dollars)
2013 2012Statutory and general banking reserves $ 266,469 $ 265,459Revaluationreserve–available-for-saleinvestmentsecurities 1,121 7,210Translation reserve (36,687) (22,781)Contributed surplus reserve 3,119 3,119Reverseacquisitionreserve (463,628) (463,628)Total reserves $ (229,606) $ (210,621)
Statutory and general banking reserves 2013 2012Balance, beginning of year $ 265,459 $ 254,258Transfers from retained earnings 1,010 11,201 Balance, end of year $ 266,469 $ 265,459
Statutory reserves represent accumulated transfers from retained earnings in accordance with local legislation and general banking reserves represent transfers from retained earnings to meet qualifying capital requirements under local legislation which are notdistributable.
Revaluation reserve – available-for-sale investment securities 2013 2012Balance, beginning of year $ 7,210 $ (6,901)Net(losses)/gainsfromchangesinfairvalueofavailable-for-saleinvestment (6,094) 14,070Purchaseofnon-controllinginterestinsubsidiary 5 41Balance, end of year $ 1,121 $ 7,210
Unrealisedgainsandlossesarisingfromchanges inthefairvalueofsecuritiesclassifiedasavailable-for-salearerecognisedinothercomprehensive income and are reflected in the revaluation reserve.
Translation reserve 2013 2012Balance, beginning of year $ (22,781) $ (18,727)Foreigncurrencytranslationdifferencearisingduringtheyear (14,157) (5,100)Purchaseofnon-controllinginterestinsubsidiary 251 1,046Balance, end of year $ (36,687) $ (22,781)
Onconsolidation,exchangedifferencesarisingfromthetranslationofthenetinvestmentinforeignoperationsarerecognizedinothercomprehensive income and are reflected in the translation reserve.
Contributed surplus reserve 2013 2012Balance, beginning and end of year $ 3,119 $ 3,119
This reserve represents the settlement of certain obligations on behalf of the Bank by the parent.
26. Reserves
62 CIBC FirstCaribbean Annual Report 2013
Notes to the Consolidated Financial Statements For the year ended October 31, 2013(Expressed in thousands of United States dollars)
2013 2012Balance, beginning and end of year $ (463,628) $(463,628)
UnderthecombinationonOctober11,2002,CIBCWestIndiesbecamethelegalparentcompanywithBarclaystransferringitsoperationstosubsidiariesofCIBCWestIndiesinexchange,ultimately,forcommonsharesandnewlycreatedclassesofnon-votingandpreferenceshares of CIBCWest Indies. Barclayswas identified as the acquirer as the fair value of its business prior to the combinationwassignificantly greater than the fair value of CIBC West Indies’ business and as a result Barclays had the greater economic interest. This situationisdescribedbyIFRSasareverseacquisition.InaccordancewithIFRS,theequityoftheBankatOctober11,2002(thedateofthecombination)comprisedtheequityofBarclays
($135,290)togetherwiththefairvalueoftheconsiderationgiventoacquireCIBCWestIndies($848,149).However,legallythesharecapital and statutory reserves of the Bank comprise the issued share capital and statutory reserves of CIBC West Indies plus the shares issuedtoeffectthecombination,recordedatfairvalue.ThereverseacquisitionreserveisthereforethedifferencebetweenthelegallyrequiredsharecapitalandstatutoryreservestogetherwiththeretainedearningsofBarclays,andtheequityoftheBankpresentedinaccordance with IFRS.
Reverse acquisition reserve
27. Dividends
28. Other employee benefits
As at October 31, 2013, the Directors recommended for approval a final common share dividend, which is not reflected in these financial statements,ofonepointfivecents($0.015)percommonshare(2012-$0.015),bringingthetotaldividendpayoutfor2013tothreecents($0.030)percommonshare(2012-$0.030).
Long-term incentive planTheGroupoperatesalong-termincentiveplanwherebyundertherulesoftheplancashbasedawardsaregrantedtoemployeesonadiscretionary basis and vest over varying periods. The award granted in 2013 amounted to $3,653(2012-$3,148).Theamountsexpensedduringtheyearrelatedtothesecashawardswere$2,481(2012-$4,408).
Employee share purchase planUnderouremployeesharepurchaseplan,qualifyingemployeescanchooseeachyeartohaveupto10%oftheireligibleearningswithheldtopurchasecommonsharesintheBank.TheBankmatches50%oftheemployeecontributionamount,uptoamaximumcontributionof6%ofeligibleearnings,dependinguponlengthofserviceandjoblevel.TheBank’scontributionsvestafteremployeeshavetwoyearsofcontinuousparticipationintheplan,andallsubsequentcontributionsvestimmediately.Allcontributionsarepaidintoatrustandusedbytheplantrusteestopurchasecommonsharesintheopenmarket.TheBank’scontributionsareexpensedasincurredandtotalled$1,354in2013(2012-$1,389).
63
29. Related party transactions and balances
The Group’s major shareholder is CIBC.
A number of banking transactions are entered into with related parties in the normal course of business. The key related party balances andtransactionsincludedintheGroup’sfinancialsaredisclosedbelow.During2012,theGrouploanedawholly-ownedUSsubsidiaryofthemajorshareholder$500millioninordertodeployexcessliquidity.TheloanmaturesonApril16,2017andyieldsonemonthliborplus3.15%.
Directors and key Major management personnel shareholder 2013 2012 2013 2012 Asset balances: Cash and due from banks $ - $ - $ 1,035,853 $1,233,720Loans and advances to customers 5,241 3,091 500,740 500,750Derivativefinancialinstruments - - 1,223 322Liability balances: Customer deposits 17,205 16,899 18,325 11,087Derivativefinancialinstruments - - 29,625 44,113Financialliabilitiesatfairvaluethroughprofitorloss - - - 14,855Duetobanks - - 5,119 1,582Revenue transactions: Interest income earned 238 166 17,878 10,359Other revenue 3 4 755 5,665Expense transactions: Interest expense incurred 118 106 1,662 8,063Otherexpensesforbankingandsupportservices - - 6,409 2,746
Key management compensation 2013 2012Salariesandothershort-termbenefits $ 6,911 $ 6,575Post-employmentbenefits 618 585Long-termincentivebenefits 875 1,384 $ 8,404 $ 8,544
Non-executive directors’ remunerationA listing of the members of the Board of Directors is included within the Group’s Annual Report. In 2013, the total remuneration for the non-executivedirectorswas$180(2012-$180).Theexecutivedirectors’remunerationisincludedunderkeymanagementcompensation.
Notes to the Consolidated Financial Statements For the year ended October 31, 2013(Expressed in thousands of United States dollars)
64 CIBC FirstCaribbean Annual Report 2013
Notes to the Consolidated Financial Statements For the year ended October 31, 2013(Expressed in thousands of United States dollars)
Notes to the Consolidated Financial Statements For the year ended October 31, 2013(Expressed in thousands of United States dollars)
30. Commitments, guarantees and contingent liabilities
As at October 31, the Group held leases on buildings for extended periods. The future rental commitments under these leases were as follows:
2013 2012Not later than 1 year $ 10,080 $ 9,151Later than 1 year and less than 5 years 21,145 17,215Later than 5 years 8,426 2,895 $ 39,651 $ 29,261
DuringtheyearendedOctober31,2013$651(2012-$652)ofleasepaymentswaschargedtonetincome.
The Bank conducts business involving letters of credit, guarantees, performance bonds and indemnities, which are not reflected in the statement of financial position.
2013 2012Letters of credit $ 105,478 $132,499Loan commitments 713,386 655,849Guarantees and indemnities 107,163 128,290 $ 926,027 $ 916,638
The Group is the subject of legal actions arising in the normal course of business. Management considers that the liability, if any, of these actions would not be material beyond what is already provided for in these financial statements.
31. Future rental commitments under operating leases
32. Fiduciary activities
33. Business segments
The Group provides custody and trustee discretionary investment management services to third parties. Those assets that are held in a fiduciary capacity are not included in these financial statements. At the reporting date, the Group had investment assets under administrationonbehalfofthirdpartiesamountingto$56,643,159(2012-$63,151,814).
In August 2013, the Group renamed Corporate and Investment Banking to Wholesale Banking to align with the naming architecture in useatitsparent,CIBC.TheGroup’soperationsareorganizedintothreebusinesssegments,Retail&BusinessBanking(“RB”),WholesaleBanking(“WB”) formerlyknownasCorporateLending& InvestmentBanking(“CLIB”)andWealthManagement(“WM”),whicharesupported by the functional unitswithin theAdministration (“Admin”) segment (which includes Treasury, Finance,HR, Technology&Operations,RiskandOther).TheAdministrationsegmentresults includetheearningsoneconomiccapitalandcapitalchargesforTreasuryandtheoffsetofthesameforRB,WB,andWM.
Concurrently, the assumptions underpinning the segment allocation methodologies were updated resulting in changes to segment performance. Prior period disclosures were amended to conform to this current presentation basis.
Management monitors the operating results of its business segments separately for the purpose of making decisions about resource allocation and performance assessment. Segment performance is evaluated based on economic profits, which for the total of all segments isequaltonetincomebeforetaxesreflectedontheconsolidatedfinancialstatements.Economicprofitsincludefundstransferpricing,managementallocations,andearnings/chargesforthesegments’useofcapital.
Income taxes are managed on a group basis and are not allocated to business segments. Transactions between the business segments are on normal commercial terms and conditions.
65
Notes to the Consolidated Financial Statements For the year ended October 31, 2013(Expressed in thousands of United States dollars)
Segment results include the following items of income or expense: RB WB WM Admin 2013Interestincome $ 172,536 $ 192,145 $ 66,417 $ 35,168 $ 466,266 Interest expense 46,778 20,791 6,811 18,698 93,078 Loanlossimpairment 47,466 94,131 9,802 - 151,399Nethedginggains - - - 461 461Depreciation 5,520 1,231 614 15,395 22,760 TotalRestructuringcosts - - 457 37,136 37,593Amortisation - - - - - Total assets and liabilities by segment are as follows: RB WB WM Admin 2013Segmentassets $ 2,357,462 $3,269,123 $ 291,433 $ 5,145,076 $ 11,063,094 Unallocatedassets 376,020Total assets $ 11,439,114
Segmentliabilities $ 2,864,359 2,187,421 4,218,374 610,653 9,880,807 Unallocatedliabilities 3,727Total liabilities $ 9,884,534
RB WB WM Admin 2013Externalrevenues $ 175,649 $ 213,684 $ 50,287 $ 90,232 $ 529,852 Revenuesfromothersegments 19,827 11,513 47,839 (79,179) -Total revenues $ 195,476 $ 225,197 $ 98,126 $ 11,053 $ 529,852
Segment results $ (80,362) $ (33,315) $ 32,089 $ 57,088 $ (24,500)Income tax expense 2,993 2,993 Net loss for the year $ (27,493)
2013 Segment Reporting
Segment assets and liabilities comprise of operating assets and liabilities, being the majority of the statement of financial position, but exclude items such as taxation and intangible assets. Securities and cash placements are normally held within the Treasury unit within the Administration segment.TheAdministrationsegmentresultsincludetheearningsoneconomiccapitalandthecapitalchargesforTreasuryandtheoffsetofthe
same for Retail Banking, Wholesale Banking and Wealth Management.

66 CIBC FirstCaribbean Annual Report 2013
Notes to the Consolidated Financial Statements For the year ended October 31, 2013(Expressed in thousands of United States dollars)
2012 Segment Reporting
RB WB WM Admin 2012Externalrevenues $ 182,728 $ 241,281 $ 49,362 $ 69,546 $ 542,917Revenuesfromothersegments 17,745 (6,365) 47,344 (58,724) -Total revenues $ 200,473 $ 234,916 $ 96,706 $ 10,822 $ 542,917
Segment results $ (15,158) $ (10,964) $ 44,241 $ 56,154 $ 74,273Incometaxexpense - - - 2,404 2,404Net income for the year $ 71,869
Segment results include the following items of income or expense: RB WB WM Admin 2012Interestincome $ 184,809 $219,535 $ 66,398 $ 28,692 $ 499,434Interest expense 49,418 38,744 8,139 6,311 102,612Loanlossimpairment 20,110 94,507 5,350 - 119,967Nethedginggains - - - 5,646 5,646Depreciation 5,311 1,231 804 12,755 20,101Amortisation - - - 717 717
Total assets and liabilities by segment are as follows: RB WB WM Admin 2012
Segmentassets $ 2,418,709 $4,012,888 $ 328,533 $ 4,368,612 $ 11,128,742Unallocatedassets 371,258Total assets $ 11,500,000
Segmentliabilities $ 2,812,808 $ 2,212,739 $4,271,920 $ 549,972 $ 9,847,439Unallocatedliabilities 2,046Total liabilities $ 9,849,485
67
Notes to the Consolidated Financial Statements For the year ended October 31, 2013(Expressed in thousands of United States dollars)
34. Financial risk management
IntroductionRisk is inherent in the Group’s activities but is managed through a process of ongoing identification, measurement and monitoring, subject to risk limits and other controls. This process of risk management is critical to the Group’s continuing profitability and each individual within the Group is accountable for the risk exposures relating to his or her responsibilities. The Group is exposedtocreditrisk,liquidityrisk,marketrisk,andoperatingrisk.
By its nature the Group’s activities are principally related to the use of financial instruments. The Group accepts deposits from customers at both fixed and floating rates and for various periods and seeks to earn above average interest margins by investing these funds in high quality assets. TheGroup seeks to increasethesemarginsby consolidating short-term funds and lending forlongerperiodsathigherrateswhilstmaintainingsufficientliquidityto meet all claims that might fall due.
The Group also seeks to raise its interest margins by obtaining above average margins, net of provisions, through lending to commercial and retail borrowers with a range of credit standings. The Group also enters into guarantees and other commitments such as letters of credit, performance and other bonds.
Credit riskCredit risk primarily arises from direct lending activities, as well as trading, investment and hedging activities. Credit risk is defined as the risk of financial loss due to a borrower or counterparty failing to meet its obligations in accordance with agreed terms.
Process and controlThe Risk Management Team is responsible for the provision of the Group’s adjudication, oversight and management of credit risk withinitsportfolios.TheCreditExecutiveCommittee(CrExCo)has responsibility for monitoring credit metrics, providing direction on credit issues and making recommendations on credit policy.
The Risk Management Team is guided by the Group’s Delegation of Authority policy which is based on the levels of exposure and risk. Credits above the discretion delegated to certain front line employees are approved by Risk Management and where applicable by the Credit Committee and the Risk & Conduct Review Committee of the Board (R&CRC). The R&CRC also hasthe responsibility for approving credit policies and key risk limits including portfolio limits which are reviewed annually.
Credit risk limitsCreditrisklimitsareestablishedforallloans(mortgages,personal,business & sovereign) for the purposes of diversification andmanaging concentration. Limits are also established for individual borrowers, groups of related borrowers, industry sectors, individual countries, geographic regions and also for products and portfolios. Such risks are monitored on a revolving basis and the limits are subjecttoanannualormorefrequentreview. The exposure to any one counterparty including banks and brokersisfurtherrestrictedbysub-limitswhichincludeexposuresnot recognised in the statement of financial position, and daily delivery risk limits in relation to trading items such as forward foreign exchange contracts. Actual exposures against limits are monitored daily. Exposure to credit risk is managed through regular analysis of the ability of borrowers, potential borrowers to meet interest and capital repayment obligations and by changing these lending limits where appropriate. Exposure to credit risk is also managed in part by obtaining collateral including corporate and personal guarantees.
CollateralThe Group employs a range of policies and practices to mitigate credit risk. The most traditional of these is the taking of security for funds advanced, which is common practice. The Group implements guidelines on the acceptability of specific classes of collateral or credit risk mitigation. The principal collateral types for loans and advances to customers are:• Mortgagesoverresidentialproperties• Charges over business assets such as premises, inventory,
accountsreceivableandequipment.• Chargesoverfinancialinstrumentssuchasdebtsecuritiesand
equities
TheGroup’screditriskmanagementpoliciesincluderequirementsrelating to collateral valuation and management, including verification requirements and legal certainty. Valuations areupdated periodically depending upon the nature of the collateral Managementmonitorsthemarketvalueofcollateralandrequestsadditional collateral in accordance with the underlying agreement during its periodic review of loan accounts in arrears. Policies are in place to monitor the existence of undesirable concentration in the collateral supporting the Group’s credit exposure.

68 CIBC FirstCaribbean Annual Report 2013
Notes to the Consolidated Financial Statements For the year ended October 31, 2013(Expressed in thousands of United States dollars)
Geographic distributionThe following table provides a geographic distribution of gross drawn and undrawn loans and advances to customers which therefore excludes provisions for impairment, interest receivable and unearned fee income.
Gross maximum Gross maximum exposure exposure Drawn Undrawn 2013 Drawn Undrawn 2012 Barbados $ 1,356,047 $ 181,512 $ 1,537,559 $ 1,395,668 $ 165,556 $ 1,561,224 Bahamas 1,902,926 160,130 2,063,056 1,957,775 148,983 2,106,758 Cayman 1,120,194 101,745 1,221,939 1,284,716 93,937 1,378,653 Eastern Caribbean 799,209 124,728 923,937 772,083 78,045 850,128 Jamaica 318,745 52,621 371,366 337,425 68,162 405,587 BVI 111,563 19,817 131,380 131,003 19,122 150,125 Belize 49,036 20,189 69,225 58,482 12,578 71,060 Curaçao 150,990 10,046 161,036 154,332 7,100 161,432 Trinidad 303,284 13,383 316,667 410,041 31,019 441,060 Other 486,646 29,215 515,861 543,481 31,347 574,828 $ 6,598,640 $ 713,386 $ 7,312,026 $ 7,045,006 $ 655,849 $7,700,855
Exposures by industry groupsThefollowingtableprovidesanindustry-widebreakdownofgrossdrawnandundrawnloansandadvancestocustomerswhichthereforeexcludes provisions for impairment, interest receivable and unearned fee income.
Gross maximum Gross maximum exposure exposure Drawn Undrawn 2013 Drawn Undrawn 2012 Agriculture $ 43,722 $ 2,133 $ 45,855 $ 48,148 $ 1,540 $ 49,688Sovereign 851,237 31,701 882,938 1,040,904 51,841 1,092,745 Construction 470,132 15,665 485,797 580,168 30,237 610,405 Distribution 371,932 90,391 462,323 368,871 74,127 442,998 Education 482 - 482 - - -Electricity, gas & water 87,542 12,424 99,966 57,735 11,450 69,185 Fishing 9,089 3,484 12,573 10,032 2,869 12,901 Health & social work 23,767 - 23,767 23,379 - 23,379Hotels & restaurants 372,245 22,659 394,904 376,223 20,779 397,002Individuals &
individual trusts 2,150,755 386,828 2,537,583 2,136,487 354,742 2,491,229 Manufacturing 113,904 41,406 155,310 163,414 29,010 192,424 Mining&quarrying 12,361 352 12,713 56,086 3,108 59,194 Miscellaneous 678,723 78,058 756,781 933,445 55,661 989,106 Other financial
corporations 556,512 6,695 563,207 541,936 4,712 546,648 Real estate, renting &
other activities 736,735 14,051 750,786 614,205 10,416 624,621 Transport, storage & communications 119,502 7,539 127,041 93,973 5,357 99,330 $ 6,598,640 $ 713,386 $ 7,312,026 $7,045,006 $655,849 $7,700,855
69
Notes to the Consolidated Financial Statements For the year ended October 31, 2013(Expressed in thousands of United States dollars)
DerivativesThe Group maintains strict control limits on net open derivative positions, that is, the difference between purchase and salecontracts, by both amount and term. At any one time the amount subject to credit risk is limited to the current fair value of instruments that are favourable to theGroup (i.e. assets),whichin relation to derivatives is only a small fraction of the contract or notional values used to express the volume of instruments outstanding. This credit risk exposure is managed as part of the overall lending limits with customers, together with potential exposures from market movements. Collateral or other security is usually obtained for credit risk exposures on these instruments.
Master netting arrangements The Group restricts its exposure to credit losses by entering into master netting arrangements with counter parties with whom it undertakes a significant volume of transactions. Master netting arrangements do not generally result in an offset of statement of financial position assets and liabilities as transactions are usually settled on a gross basis. However, the credit risk associated with favourable contracts is reduced by a master netting arrangement to the extent that if an event of default occurs, all amounts with the counterparty are terminated and settled on a net basis. The Group’s overall exposure to credit risk on derivative instruments subject to master netting arrangements can change substantially within a short period since it is affected by eachtransaction subject to the arrangement.
Credit related instrumentsThe primary purpose of these instruments is to ensure that funds areavailabletoacustomerasrequired.
Guarantees and standby letters of credit, which represent irrevocable assurances that the Group will make payments in the event that a customer cannot meet its obligations to third parties, carry the same credit risk as loans. Documentary and commercial letters of credit, which are written undertakings by the Group on behalf of a customer authorising a third party to draw drafts on the Group up to a stipulated amount under specific terms and conditions, are collateralised by the underlying shipments of goods or appropriate assets to which they relate and therefore carry less risk than a direct borrowing.
Commitments to extend credit represent the unused portions of authorisations to extend credit in the form of loans, guarantees or letters of credit. With respect to credit risk on commitments to extend credit, the Group is potentially exposed to loss in an amountequaltothetotalunusedcommitments.However,thelikelyamount of loss is less than the total unused commitments since most commitments to extend credit are contingent upon customers maintaining specific credit standards. The Group monitors the term of maturity of credit commitments because longer-termcommitments generally have a greater degree of credit risk than shorter-termcommitments.
Maximum exposure to credit riskThe following table shows the maximum exposure to credit risk for the components of the statement of financial position. The maximumexposureisshowngross,beforetheeffectofmitigationthrough the use of master netting and collateral arrangements. Where financial instruments are recorded at fair value, the amounts shown represent the current credit risk exposure but not the maximum risk exposure that could arise in the future as a result of changes in values.
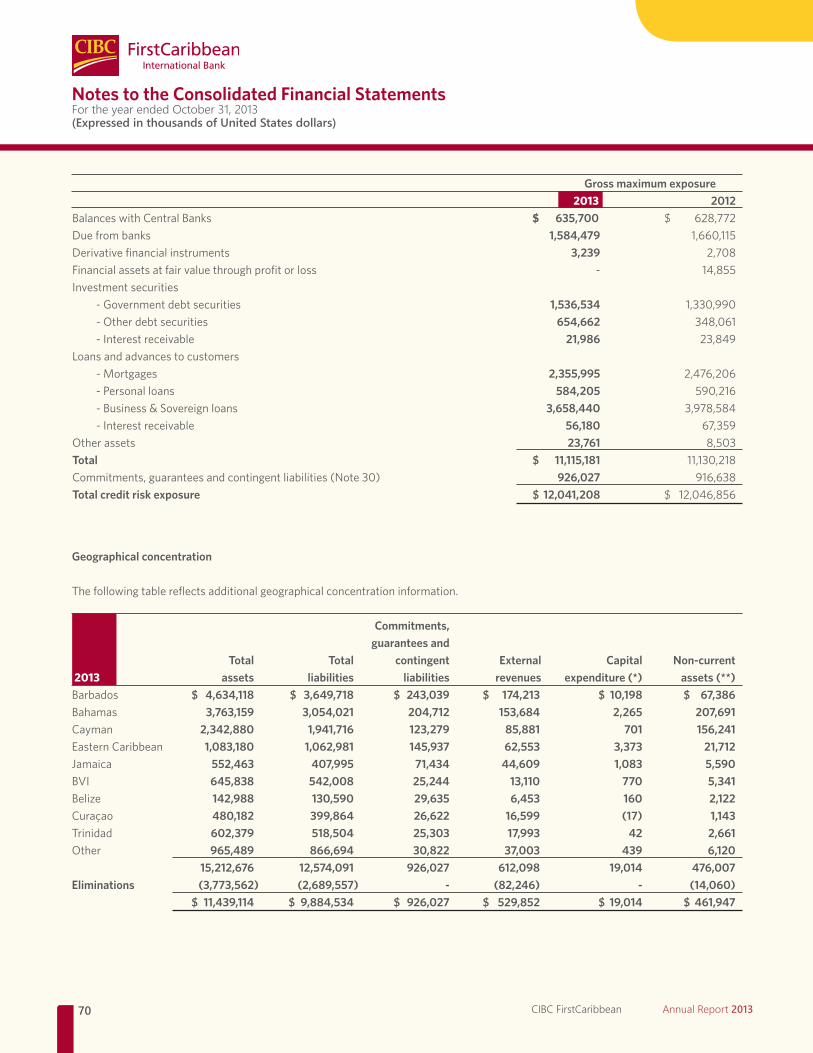
70 CIBC FirstCaribbean Annual Report 2013
Notes to the Consolidated Financial Statements For the year ended October 31, 2013(Expressed in thousands of United States dollars)
Gross maximum exposure 2013 2012Balances with Central Banks $ 635,700 $ 628,772Due from banks 1,584,479 1,660,115 Derivative financial instruments 3,239 2,708 Financialassetsatfairvaluethroughprofitorloss - 14,855Investment securities
-Governmentdebtsecurities 1,536,534 1,330,990 -Otherdebtsecurities 654,662 348,061 -Interestreceivable 21,986 23,849
Loans and advances to customers -Mortgages 2,355,995 2,476,206 -Personalloans 584,205 590,216 -Business&Sovereignloans 3,658,440 3,978,584 -Interestreceivable 56,180 67,359
Other assets 23,761 8,503 Total $ 11,115,181 11,130,218 Commitments,guaranteesandcontingentliabilities(Note30) 926,027 916,638 Total credit risk exposure $ 12,041,208 $ 12,046,856
Geographical concentration
The following table reflects additional geographical concentration information.
Commitments, guarantees and
Total Total contingent External Capital Non-current 2013 assets liabilities liabilities revenues expenditure (*) assets (**)Barbados $ 4,634,118 $ 3,649,718 $ 243,039 $ 174,213 $ 10,198 $ 67,386 Bahamas 3,763,159 3,054,021 204,712 153,684 2,265 207,691 Cayman 2,342,880 1,941,716 123,279 85,881 701 156,241 Eastern Caribbean 1,083,180 1,062,981 145,937 62,553 3,373 21,712 Jamaica 552,463 407,995 71,434 44,609 1,083 5,590 BVI 645,838 542,008 25,244 13,110 770 5,341 Belize 142,988 130,590 29,635 6,453 160 2,122 Curaçao 480,182 399,864 26,622 16,599 (17) 1,143 Trinidad 602,379 518,504 25,303 17,993 42 2,661 Other 965,489 866,694 30,822 37,003 439 6,120
15,212,676 12,574,091 926,027 612,098 19,014 476,007Eliminations (3,773,562) (2,689,557) - (82,246) - (14,060)
$ 11,439,114 $ 9,884,534 $ 926,027 $ 529,852 $ 19,014 $ 461,947
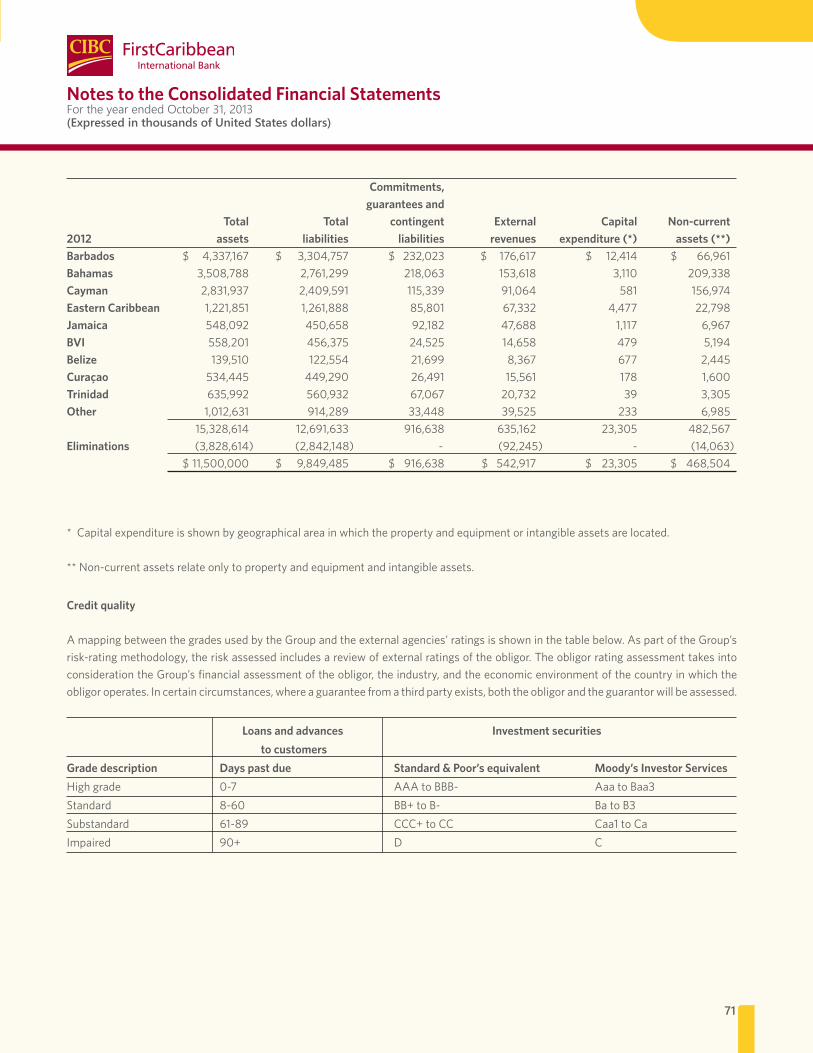
71
Notes to the Consolidated Financial Statements For the year ended October 31, 2013(Expressed in thousands of United States dollars)
Loans and advances Investment securities to customers Grade description Days past due Standard & Poor’s equivalent Moody’s Investor ServicesHighgrade 0-7 AAAtoBBB- AaatoBaa3Standard 8-60 BB+toB- BatoB3Substandard 61-89 CCC+toCC Caa1toCaImpaired 90+ D C
Credit quality
A mapping between the grades used by the Group and the external agencies’ ratings is shown in the table below. As part of the Group’s risk-ratingmethodology,theriskassessedincludesareviewofexternalratingsoftheobligor.Theobligorratingassessmenttakesintoconsideration the Group’s financial assessment of the obligor, the industry, and the economic environment of the country in which the obligor operates. In certain circumstances, where a guarantee from a third party exists, both the obligor and the guarantor will be assessed.
Commitments, guarantees and Total Total contingent External Capital Non-current 2012 assets liabilities liabilities revenues expenditure (*) assets (**) Barbados $ 4,337,167 $ 3,304,757 $ 232,023 $ 176,617 $ 12,414 $ 66,961Bahamas 3,508,788 2,761,299 218,063 153,618 3,110 209,338Cayman 2,831,937 2,409,591 115,339 91,064 581 156,974Eastern Caribbean 1,221,851 1,261,888 85,801 67,332 4,477 22,798Jamaica 548,092 450,658 92,182 47,688 1,117 6,967BVI 558,201 456,375 24,525 14,658 479 5,194Belize 139,510 122,554 21,699 8,367 677 2,445Curaçao 534,445 449,290 26,491 15,561 178 1,600Trinidad 635,992 560,932 67,067 20,732 39 3,305Other 1,012,631 914,289 33,448 39,525 233 6,985 15,328,614 12,691,633 916,638 635,162 23,305 482,567Eliminations (3,828,614) (2,842,148) - (92,245) - (14,063) $11,500,000 $ 9,849,485 $ 916,638 $ 542,917 $ 23,305 $ 468,504
*Capitalexpenditureisshownbygeographicalareainwhichthepropertyandequipmentorintangibleassetsarelocated.
**Non-currentassetsrelateonlytopropertyandequipmentandintangibleassets.

72 CIBC FirstCaribbean Annual Report 2013
Notes to the Consolidated Financial Statements For the year ended October 31, 2013(Expressed in thousands of United States dollars)
A credit scoring methodology is used to assess Personal customers and a risk grading model is used for Commercial and Corporate customers. This risk rating system is used for portfolio management, risk limit setting, product pricing, and in the determination of economic capital.
The effectiveness of the risk-rating system and theparameters associated with the risk ratings are monitored within Risk Management and are subject to an annual review.
At the reporting date, investment securities were all rated
standard or high grade, except for classified as ‘sub-standard’ $2,778 (2012 – $2,762). Cash balances and amounts due frombanks are held with counterparties that are high grade including CIBC group entities.
The table below shows the credit quality by class of assetfor gross loans and advances to customers, based on an ageing analysis of the portfolio. Amounts provided are before allowance for credit losses, after credit risk mitigation, valuation adjustments related to the financial guarantors, and collateral on agreements.
Notes High grade Standard Substandard Impaired 2013
Loans and advances to customers -Mortgages $ 1,860,653 $ 122,591 $ 28,822 $ 343,929 $ 2,355,995 -Personalloans 482,257 15,267 7,936 78,745 584,205 -Business&Sovereignloans 3,222,222 51,546 10,317 374,355 3,658,440Total 16 $ 5,565,132 $ 189,404 $ 47,075 $ 797,029 $6,598,640
Loans and advances to customers-Mortgages $ 1,963,247 $ 128,303 $ 36,161 $348,495 $2,476,206-Personalloans 496,948 21,373 4,540 67,355 590,216-Business&Sovereignloans 3,460,150 45,722 14,750 457,962 3,978,584Total 16
For our Business & Sovereign loans, we employ risk ratings in managing our credit portfolio. Business and Sovereign borrowers with elevated default risk are monitored on our Early Warning List. Early Warning List characteristics include borrowers exhibiting a significant decline in revenue, income, or cash flow or where we have doubts as to the continuing viability of the business. Early Warning List customersareoften,butnotalways,delinquent.AsofOctober31,2013,EarlyWarningListcustomersinthemediumtohighriskcategoryamountedto$481,077(2012-$211,782).
Notes High grade Standard Substandard Impaired 2012
$5,920,345$195,398$55,451$873,812$7,045,006

73
Notes to the Consolidated Financial Statements For the year ended October 31, 2013(Expressed in thousands of United States dollars)
Market riskMarket risk is the risk that the fair value of future cash flows of financial instruments will fluctuate due to the change in market variables. Market risk arises from positions in securities and derivatives as well as from our core Retail, Wealth and Corporate businesses. The key risks to the Group are foreign exchange, interest rate and credit spread. Market Risk, within FirstCaribbean International Bank, is a centralized group that is independent from the front line. The following sections give a comprehensive review of the Group’s entire consolidated exposures.
Policies and StandardsThe Group has a comprehensive policy for market risk management related to the identification, measurement, monitoring and control of those risks. This policy is reviewed and approved annually by the Finance, Risk and Conduct Review Committee. The policy includes the annual approval of the Board limits which are used by the Bank to establish explicit risk tolerances expressed in term of the four main risk measures mentioned below. There is a three tiered approach to limits at the Bank. The highest level is set at the Board, below these, which are inclusive of a “haircut” from the Boardlimits and are at a more granular level delegated to the Chief Risk Officer limits. The third tier is for the Treasury Sales and Trading Group which limits traders to specific products and size of deals. These limits are documented through a formal delegation letter and monitored using the Group’s treasury system.
Process & ControlMarket risk measures are monitored with differing degrees offrequencydependentuponthenatureoftherisk.FXpositions,VaR,and certain Profit& Loss (P&L)measures are allmeasureddailywhereas others such as stress tests and credit spread sensitivity are performed on a weekly or monthly basis. Detailed market risk compliance reports are produced and circulated to senior management on a monthly basis and a summary version supplied totheBoardquarterly.
Risk MeasurementThe Group has four main measures of market risk: • Outrightposition,usedpredominantlyforspotFX• Sensitivity to a 1 basis pointmove in a curve, used for both
interest rate risk and credit spread risk • ValueatRisk(VaR)measuresforbothinterestrateriskandfor
foreign exchange risk• Stress scenarios based upon a combination of theoretical
situations and historical events.
PositionThis risk measure is used predominantly for the Group’s foreign exchange business. The measure monitored daily focuses upon the outright long or short position in each currency from both a spot or trading position and on a structural basis. Any forward contracts orFXswapsarealsoincorporated.Therearealsonotionalpositionlimits on the size of the bond portfolios.
SensitivityThemaintwomeasuresutilizedbytheGrouparetheDV01(deltavalue of a 1 basis point move, also known as the PV01 or present valueofa1basispointmove)andtheCSDV01(creditspreaddeltaofa 1basispointmove).TheDV01measure is calculated fora 1basis point move down in the yield curve. This generates the change in economic value by individual currency of a parallel shift down in the related yield curve. As curves rarely move in a parallel fashion it ismeasured across different tenors to ensure that there is nofurther curve risk of having; for example, a long position in the short endofthecurveoffsetbyashortpositioninthelongertenors.Thisis then utilised within the scenario analysis. The sensitivities are calculatedonbothapre-structuralbasisthatincludescontractualmaturitypositions;andonapost-structuralbasisthatalsoincludesstructural assumptions for core balances of non-contractualmaturity positions.
The CSDV01 sensitivity is a way to measure the risk of the interestratespreadbetweenUSDTreasurysecutitiesandthenon-Treasury securities in the bond portfolio widening or narrowing.
Value at RiskThe Group’s VaR methodology utilizes vetted CIBC parent models. It is a statistical, probability based approach that uses volatilities andcorrelationstoquantifyriskintodollarterms.VaRmeasuresthepotential 1 day loss from adverse market movements that can occur witha lessthan1%probabilityofoccurringundernormalmarketconditions,basedonequallyweightedhistoricaldata. VaR uses numerous risk factors as inputs and is computed through the use of historical volatility of each risk factor and the associated correlations among them, evaluated over a 1 year period and updated on a regular basis. The use of these historical measures cause a degree of limitation to its accuracy as it assumes that future price movements will follow a statistical distribution and thus may not accurately predict the future impact. A further weakness of theVaRmeasureisthatitdoesnotestimatetheeffectsofmarketvariableifitmovesoutsideofthe99%parameterandhencemayunderestimate losses. To counter this, the Group has various stress measures to calculate potential tail event losses.
74 CIBC FirstCaribbean Annual Report 2013
Notes to the Consolidated Financial Statements For the year ended October 31, 2013(Expressed in thousands of United States dollars)
Stress testing & scenario analysisStress testing and scenario analysis are designed to add insight to possibleoutcomesofabnormal(ortailevent)marketconditionsandto highlight where risk concentrations could be a concern. The Group has two distinct approaches to this which are as follows:• Forthehardcurrencytestingitsendsitspositionsensitivityto
CIBC and utilizes the suite of measures that the parent company has developed. The stress testingmeasures the effect on thehard currency portfolio values over a wide range of extreme moves in market prices. The stress testing methodology assumes no actions are taken or are able to be taken during the eventtomitigatetherisk,reflectingthedecreasedliquiditythatfrequently accompaniesmarket shocks. The scenario analysisapproach for the Group’s hard currency exposures simulate an impact on earnings of extreme market events up to a period ofonequarter.Scenariosaredevelopedusingactualhistoricaldata during periods of market disruption, or are based upon hypothetical occurrence of economic or political events or natural disasters and are designed by our parent company’s economists, business leaders and risk managers. Examples of thesewould includethe1998Russian ledcrisis,USFederalReservetighteningof1994andpotentialeffectsofrevaluationof the Chinese currency. These tests are run on our behalf on a daily basis.
• The local currency stress tests are designed on a similarbut smaller scale. For interest rate stresses, Market Risk in conjunction with Treasury consider the market data over approximatelythe lastten(10)yearsand identifythegreatestcurveordatapointmovesoverbothsixty(60)andsingledays.Thesearethenappliedtotheexistingpositions/sensitivitiesofthe Group. This is performed and reported on a monthly basis as they do not tend to change rapidly. For foreign exchange
stresses, theGroup considerswhat the effect of a currencycoming off a peg would have on the earnings of thebank. This is largely judgmental, as it has happened so infrequently in the region and it is supplemented by somehistorical reviews both within the region and in other areas where pegged currency regimes have or do exist.
Summary of key market risksOf market risks arising from the various currencies, yield curves and spreads throughout the regional and broader international markets, the following risks are considered by management the most significant for the Group. The risk of credit spreads widening in a similar fashion to the Credit Crisis of 2008 on bonds held within the investment portfolios, and the magnitude of the risk, but low probabilityofapegbreakingbetweentheUSDandalocalcurrency,particularly the BDS, impacting the structural long position of the bank. The largest interest rate risk run through multiple scenarios is thatoftheUSDyieldcurvewhichmovesinasimilarfashiontoa60day period during the Fed Reserve interest rate tightening of 1994. The following section highlights these key risks as well as some of the lesser ones that arise from the Group’s ongoing banking operations
Foreign exchange risk Foreignexchange(orcurrency)riskisdefinedastheriskthatthevalue of a financial instrument will fluctuate as a result of changes in foreign exchange rates. A significant number of the regional currenciesarepeggedtotheUSDandhencetheVaRmeasureisnotappropriate and that is why more emphasis is put upon the overall position limit and related stress tests. The Board has set limits on positions by currency. Positions are monitored on a daily basis and Treasury Sales & Trading are solely responsible for the hedging of the exposure of the Group.
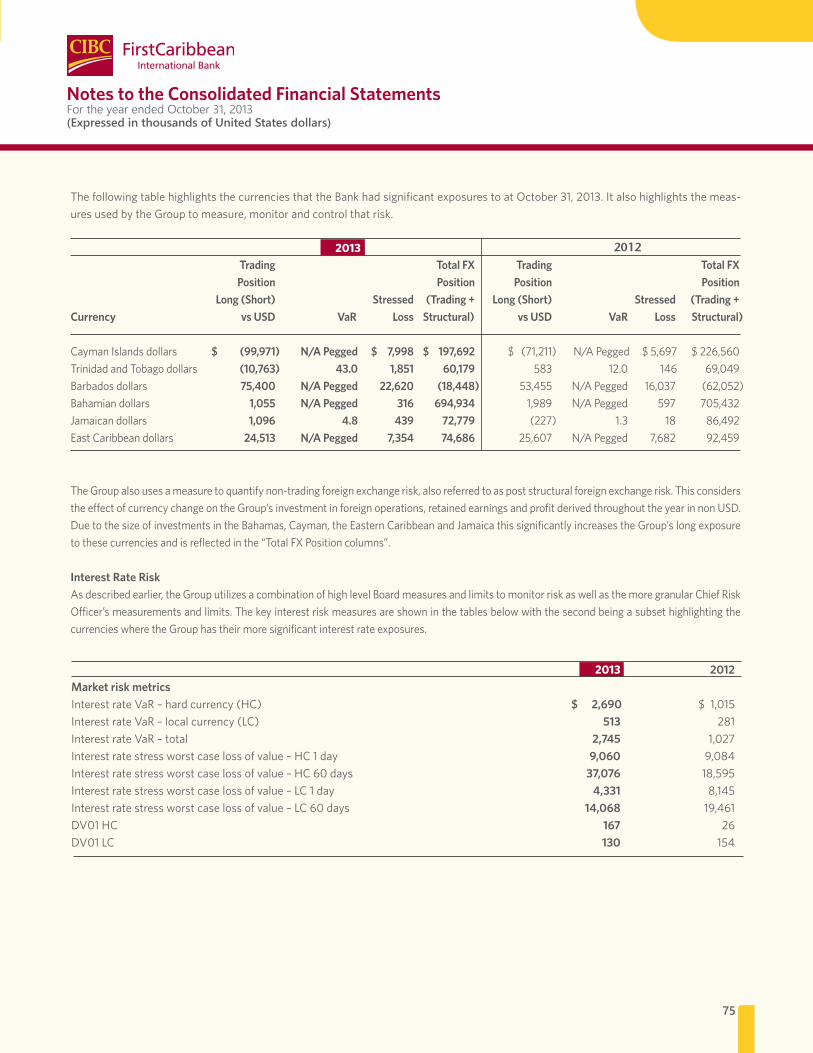
75
The following table highlights the currencies that the Bank had significant exposures to at October 31, 2013. It also highlights the meas-ures used by the Group to measure, monitor and control that risk.
TheGroupalsousesameasuretoquantifynon-tradingforeignexchangerisk,alsoreferredtoaspoststructuralforeignexchangerisk.ThisconsiderstheeffectofcurrencychangeontheGroup’sinvestmentinforeignoperations,retainedearningsandprofitderivedthroughouttheyearinnonUSD.Due to the size of investments in the Bahamas, Cayman, the Eastern Caribbean and Jamaica this significantly increases the Group’s long exposure tothesecurrenciesandisreflectedinthe“TotalFXPositioncolumns”.
Interest Rate RiskAs described earlier, the Group utilizes a combination of high level Board measures and limits to monitor risk as well as the more granular Chief Risk O�cer’s measurements and limits. The key interest risk measures are shown in the tables below with the second being a subset highlighting the currencies where the Group has their more significant interest rate exposures.
Trading Total FX Trading Total FX Position Position Position Position Long (Short) Stressed (Trading + Long (Short) Stressed (Trading +Currency vs USD VaR Loss Structural) vs USD VaR Loss Structural)
Cayman Islands dollars $ (99,971) N/A Pegged $ 7,998 $ 197,692 $(71,211)N/APegged $5,697 $226,560Trinidad and Tobago dollars (10,763) 43.0 1,851 60,179 583 12.0 146 69,049 Barbados dollars 75,400 N/A Pegged 22,620 (18,448) 53,455N/APegged 16,037 (62,052)Bahamian dollars 1,055 N/A Pegged 316 694,934 1,989 N/APegged 597 705,432Jamaican dollars 1,096 4.8 439 72,779 (227) 1.3 18 86,492East Caribbean dollars 24,513 N/A Pegged 7,354 74,686 25,607 N/APegged 7,682 92,459
20122013
Notes to the Consolidated Financial Statements For the year ended October 31, 2013(Expressed in thousands of United States dollars)
2013 2012Market risk metrics InterestrateVaR–hardcurrency(HC) $ 2,690 $1,015InterestrateVaR–localcurrency(LC) 513 281 Interest rate VaR – total 2,745 1,027 Interest rate stress worst case loss of value – HC 1 day 9,060 9,084 Interest rate stress worst case loss of value – HC 60 days 37,076 18,595 Interest rate stress worst case loss of value – LC 1 day 4,331 8,145 Interest rate stress worst case loss of value – LC 60 days 14,068 19,461 DV01 HC 167 26 DV01 LC 130 154
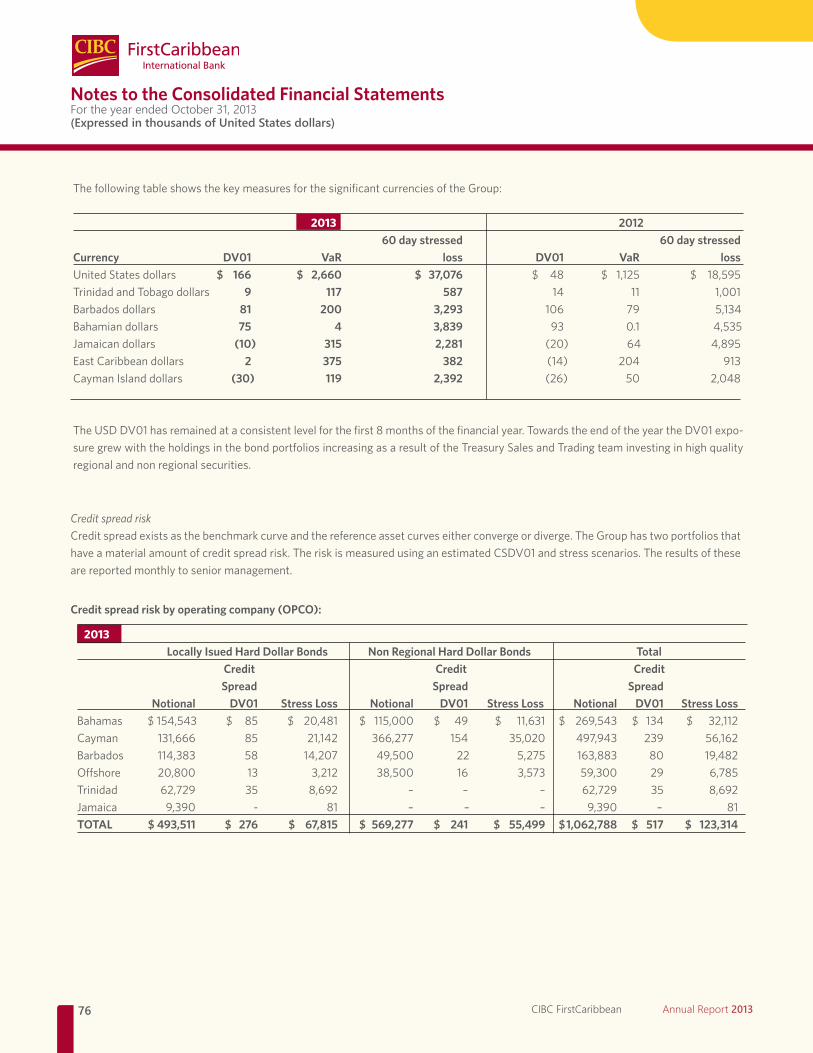
76 CIBC FirstCaribbean Annual Report 2013
Notes to the Consolidated Financial Statements For the year ended October 31, 2013(Expressed in thousands of United States dollars)
Credit spread riskCredit spread exists as the benchmark curve and the reference asset curves either converge or diverge. The Group has two portfolios that have a material amount of credit spread risk. The risk is measured using an estimated CSDV01 and stress scenarios. The results of these are reported monthly to senior management.
The following table shows the key measures for the significant currencies of the Group:
2013 2012 60 day stressed 60 day stressedCurrency DV01 VaR loss DV01 VaR lossUnitedStatesdollars $ 166 $ 2,660 $ 37,076 $ 48 $ 1,125 $ 18,595Trinidad and Tobago dollars 9 117 587 14 11 1,001Barbados dollars 81 200 3,293 106 79 5,134Bahamian dollars 75 4 3,839 93 0.1 4,535Jamaican dollars (10) 315 2,281 (20) 64 4,895East Caribbean dollars 2 375 382 (14) 204 913Cayman Island dollars (30) 119 2,392 (26) 50 2,048
TheUSDDV01hasremainedataconsistentlevelforthefirst8monthsofthefinancialyear.TowardstheendoftheyeartheDV01expo-suregrewwiththeholdingsinthebondportfoliosincreasingasaresultoftheTreasurySalesandTradingteaminvestinginhighqualityregional and non regional securities.
Credit spread risk by operating company (OPCO):
2013 Locally Isued Hard Dollar Bonds Non Regional Hard Dollar Bonds Total Credit Credit Credit Spread Spread Spread Notional DV01 Stress Loss Notional DV01 Stress Loss Notional DV01 Stress LossBahamas $154,543 $ 85 $ 20,481 $ 115,000 $ 49$ 11,631 $ 269,543 $ 134 $ 32,112Cayman 131,666 85 21,142 366,277 154 35,020 497,943 239 56,162 Barbados 114,383 58 14,207 49,500 22 5,275 163,883 80 19,482Offshore 20,800 13 3,212 38,500 16 3,573 59,300 29 6,785Trinidad 62,729 35 8,692 – – – 62,729 35 8,692Jamaica 9,390 - 81 – – – 9,390 – 81TOTAL $ 493,511 $ 276 $ 67,815 $ 569,277 $ 241 $ 55,499 $ 1,062,788 $ 517 $ 123,314
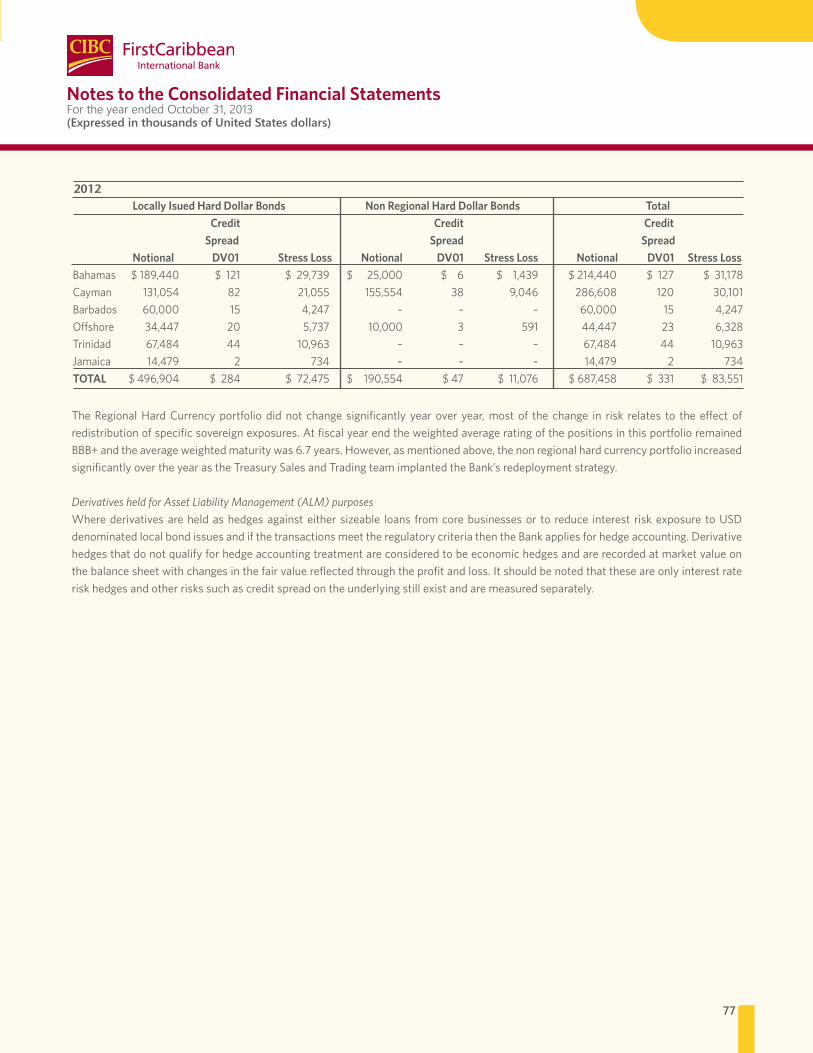
77
Notes to the Consolidated Financial Statements For the year ended October 31, 2013(Expressed in thousands of United States dollars)
TheRegionalHardCurrencyportfoliodidnot change significantly yearover year,mostof the change in risk relates to theeffectofredistribution of specific sovereign exposures. At fiscal year end the weighted average rating of the positions in this portfolio remained BBB+andtheaverageweightedmaturitywas6.7years.However,asmentionedabove,thenonregionalhardcurrencyportfolioincreasedsignificantly over the year as the Treasury Sales and Trading team implanted the Bank’s redeployment strategy.
Derivatives held for Asset Liability Management (ALM) purposesWherederivativesareheldashedgesagainsteithersizeable loans fromcorebusinessesor to reduce interest riskexposure toUSDdenominated local bond issues and if the transactions meet the regulatory criteria then the Bank applies for hedge accounting. Derivative hedgesthatdonotqualifyforhedgeaccountingtreatmentareconsideredtobeeconomichedgesandarerecordedatmarketvalueonthe balance sheet with changes in the fair value reflected through the profit and loss. It should be noted that these are only interest rate risk hedges and other risks such as credit spread on the underlying still exist and are measured separately.
Locally Isued Hard Dollar Bonds Non Regional Hard Dollar Bonds Total Credit Credit Credit Spread Spread Spread Notional DV01 Stress Loss Notional DV01 Stress Loss Notional DV01 Stress LossBahamas $189,440 $121 $29,739 $ 25,000 $6 $1,439 $214,440 $127 $31,178Cayman 131,054 82 21,055 155,554 38 9,046 286,608 120 30,101 Barbados 60,000 15 4,247 – – – 60,000 15 4,247 Offshore 34,447 20 5,737 10,000 3 591 44,447 23 6,328Trinidad 67,484 44 10,963 – – – 67,484 44 10,963 Jamaica 14,479 2 734 – – – 14,479 2 734 TOTAL $496,904 $284 $72,475 $ 190,554 $47 $11,076 $687,458 $331 $83,551
2012
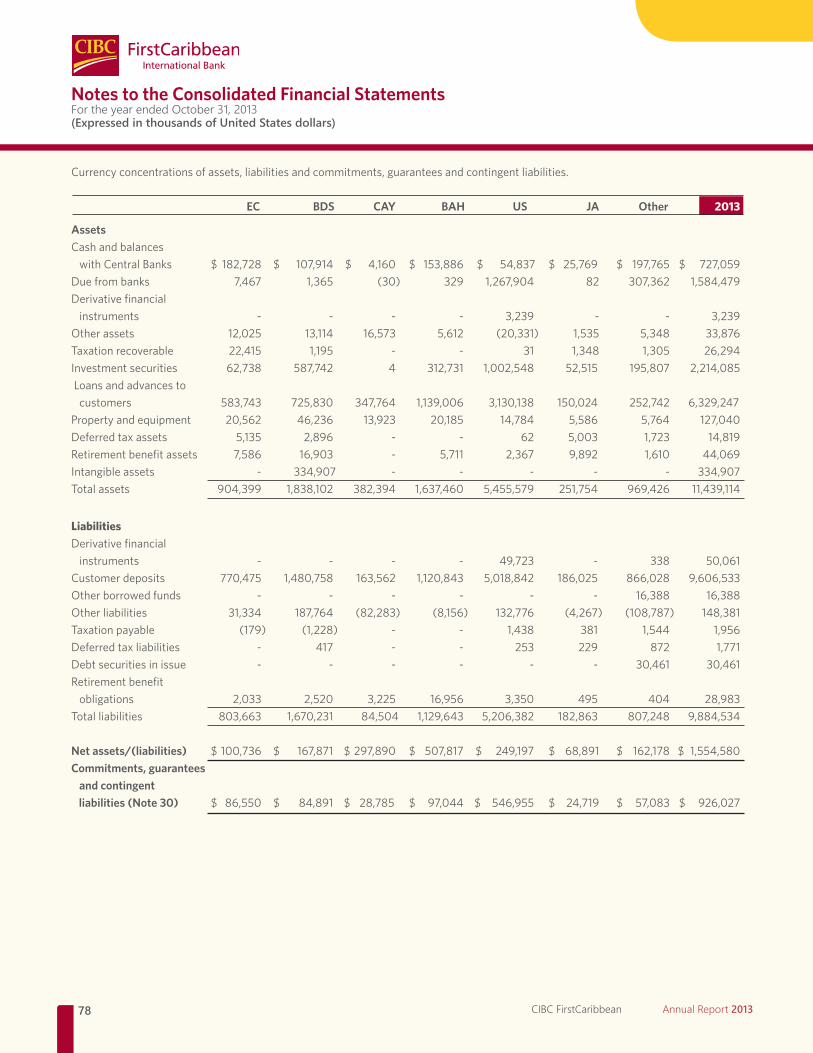
78 CIBC FirstCaribbean Annual Report 2013
Assets Cash and balances withCentralBanks $182,728 $ 107,914 $ 4,160 $ 153,886 $ 54,837 $25,769 $ 197,765 $ 727,059Duefrombanks 7,467 1,365 (30) 329 1,267,904 82 307,362 1,584,479Derivative financialinstruments - - - - 3,239 - - 3,239Otherassets 12,025 13,114 16,573 5,612 (20,331) 1,535 5,348 33,876Taxationrecoverable 22,415 1,195 - - 31 1,348 1,305 26,294Investment securities 62,738 587,742 4 312,731 1,002,548 52,515 195,807 2,214,085 Loans and advances to customers 583,743 725,830 347,764 1,139,006 3,130,138 150,024 252,742 6,329,247Propertyandequipment 20,562 46,236 13,923 20,185 14,784 5,586 5,764 127,040Deferredtaxassets 5,135 2,896 - - 62 5,003 1,723 14,819Retirementbenefitassets 7,586 16,903 - 5,711 2,367 9,892 1,610 44,069Intangibleassets -334,907 - - - - - 334,907Total assets 904,399 1,838,102 382,394 1,637,460 5,455,579 251,754 969,426 11,439,114
Liabilities Derivative financialinstruments - - - - 49,723 - 338 50,061Customer deposits 770,475 1,480,758 163,562 1,120,843 5,018,842 186,025 866,028 9,606,533 Otherborrowedfunds - - - - - - 16,388 16,388Otherliabilities 31,334 187,764 (82,283) (8,156) 132,776 (4,267) (108,787) 148,381Taxationpayable (179) (1,228) - - 1,438 381 1,544 1,956Deferredtaxliabilities - 417 - - 253 229 872 1,771Debtsecuritiesinissue - - - - - - 30,461 30,461 Retirement benefit obligations 2,033 2,520 3,225 16,956 3,350 495 404 28,983Total liabilities 803,663 1,670,231 84,504 1,129,643 5,206,382 182,863 807,248 9,884,534 Net assets/(liabilities) $100,736 $ 167,871 $297,890 $ 507,817$ 249,197$ 68,891 $ 162,178$ 1,554,580Commitments, guarantees and contingent liabilities (Note 30) $ 86,550 $ 84,891 $28,785 $ 97,044$ 546,955 $ 24,719 $ 57,083 $ 926,027
Notes to the Consolidated Financial Statements For the year ended October 31, 2013(Expressed in thousands of United States dollars)
Currency concentrations of assets, liabilities and commitments, guarantees and contingent liabilities.
EC BDS CAY BAH US JA Other 2013
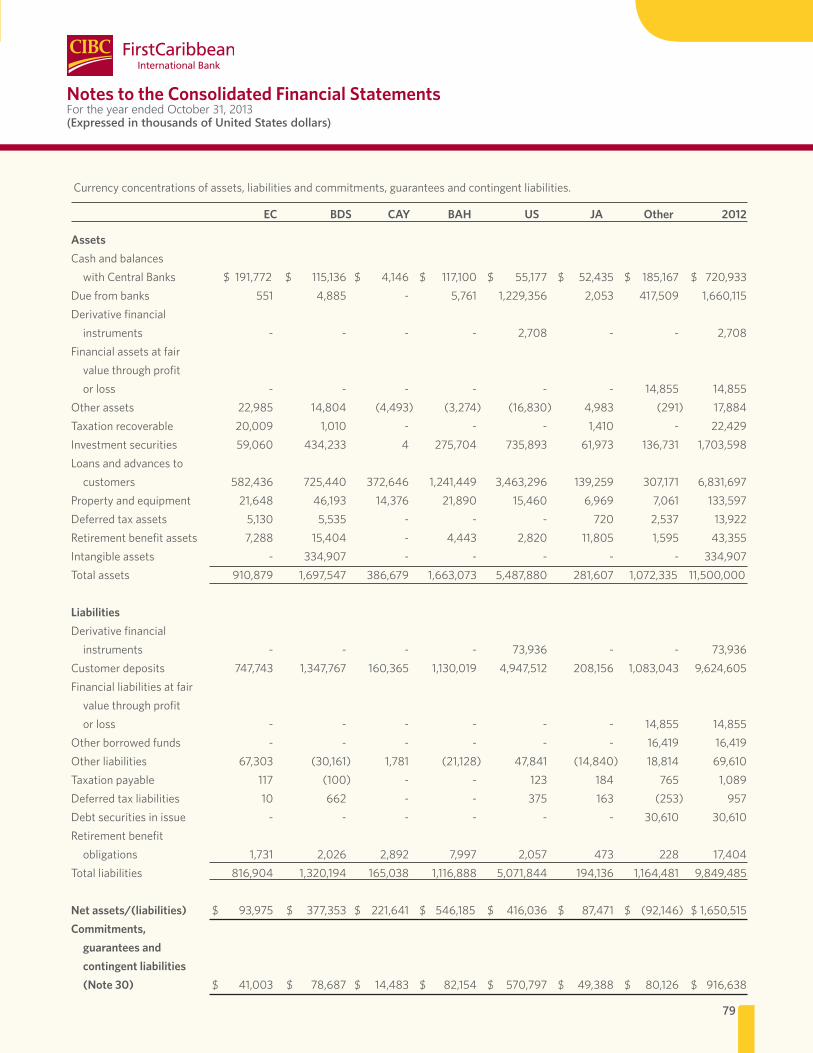
79
EC BDS CAY BAH US JA Other 2013
Notes to the Consolidated Financial Statements For the year ended October 31, 2013(Expressed in thousands of United States dollars)
Currency concentrations of assets, liabilities and commitments, guarantees and contingent liabilities.
EC BDS CAY BAH US JA Other 2012
Assets Cash and balanceswithCentralBanks $191,772 $ 115,136 $ 4,146 $ 117,100 $ 55,177 $ 52,435 $ 185,167 $ 720,933
Duefrombanks 551 4,885 - 5,761 1,229,356 2,053 417,509 1,660,115Derivative financialinstruments - - - - 2,708 - - 2,708
Financial assets at fairvalue through profit orloss - - - - - - 14,855 14,855
Otherassets 22,985 14,804 (4,493) (3,274) (16,830) 4,983 (291) 17,884Taxationrecoverable 20,009 1,010 - - - 1,410 - 22,429Investment securities 59,060 434,233 4 275,704 735,893 61,973 136,731 1,703,598Loans and advances to
customers 582,436 725,440 372,646 1,241,449 3,463,296 139,259 307,171 6,831,697Propertyandequipment 21,648 46,193 14,376 21,890 15,460 6,969 7,061 133,597Deferredtaxassets 5,130 5,535 - - - 720 2,537 13,922Retirementbenefitassets 7,288 15,404 - 4,443 2,820 11,805 1,595 43,355Intangibleassets - 334,907 - - - - - 334,907Total assets 910,879 1,697,547 386,679 1,663,073 5,487,880 281,607 1,072,335 11,500,000
Liabilities Derivative financial instruments - - - - 73,936 - - 73,936
Customer deposits 747,743 1,347,767 160,365 1,130,019 4,947,512 208,156 1,083,043 9,624,605 Financial liabilities at fair
value through profitorloss - - - - - - 14,855 14,855
Other borrowed funds - - - - - - 16,419 16,419Otherliabilities 67,303 (30,161) 1,781 (21,128) 47,841 (14,840) 18,814 69,610Taxationpayable 117 (100) - - 123 184 765 1,089Deferredtaxliabilities 10 662 - - 375 163 (253) 957Debtsecuritiesinissue - - - - - - 30,610 30,610Retirement benefit
obligations 1,731 2,026 2,892 7,997 2,057 473 228 17,404Total liabilities 816,904 1,320,194 165,038 1,116,888 5,071,844 194,136 1,164,481 9,849,485
Net assets/(liabilities) $ 93,975 $ 377,353 $ 221,641 $546,185 $ 416,036 $ 87,471 $ (92,146) $1,650,515Commitments,
guarantees and contingent liabilities (Note 30) $ 41,003 $ 78,687 $ 14,483 $ 82,154 $ 570,797$ 49,388 $ 80,126$ 916,638
80 CIBC FirstCaribbean Annual Report 2013
Notes to the Consolidated Financial Statements For the year ended October 31, 2013(Expressed in thousands of United States dollars)
Cash flow and fair value interest rate riskCash flow interest rate risk is the risk that the future cash flows of a financial instrument will fluctuate because of changes in market interest rates. Fair value interest rate risk is the risk that the value of a financial instrument will fluctuate because of changes in market interest rates. The Group takes on exposure to the effects offluctuations in the prevailing levels of market interest rates on both its fair value and cash flow risks. Interest margins may increase as a result of such changes but may reduce or create losses in the event that unexpected movements arise. Limits are set on the level of mismatch of interest rate repricing that may be undertaken, which are monitored on an ongoing basis.Expectedrepricingandmaturitydatesdonotdiffersignificantly
from the contract dates, except for the maturity of deposits up to one month, which represent balances on current accounts considered by the Group as a relatively stable core source of funding for its operations.
Liquidity riskLiquidityriskarisesfromtheGroup’sgeneralfundingactivitiesinthe course of managing assets and liabilities. It is the risk of having insufficient cash resources to meet current financial obligations without raising funds at unfavourable rates or selling assets on a forced basis.The Group’s liquidity management strategies seek to
maintain sufficient liquid financial resources to continually fundthe statement of financial position under both normal and stressed market environments.
Process and controlActual and anticipated inflows and outflows of funds generated from exposures including those not recognised in the statement of financial position are managed on a daily basis within specificshort-termasset/liabilitymismatchlimitsbyoperationalentity.
Potential cash flows under various stress scenarios are modelled using carrying amounts recognised in the statement of financial position. On a consolidated basis, prescribed liquiditylevels under a selected benchmark stress scenario are maintained for a minimum time horizon.
Risk measurementTheGroup’sliquiditymeasurementsystemprovidesdailyliquidityrisk exposure reports for monitoring and review by the Treasury department.TheGroup’sAssetsandLiabilitiesCommittee(ALCO)is responsible for recommendingthe liquidityratiotargets,thestress scenarios and the contingency funding plans. The Group’s Board of Directors is ultimately responsible for the Group’s liquidity.TheGroupmanages liquidity risk bymaintaining a significant
base of core customer deposits, liquid assets and access tocontingent funding as part of its management of risk. Each operational entity has internally established specific liquidityrequirementsthatareapprovedbytheGroup’sALCOandreviewedannually.
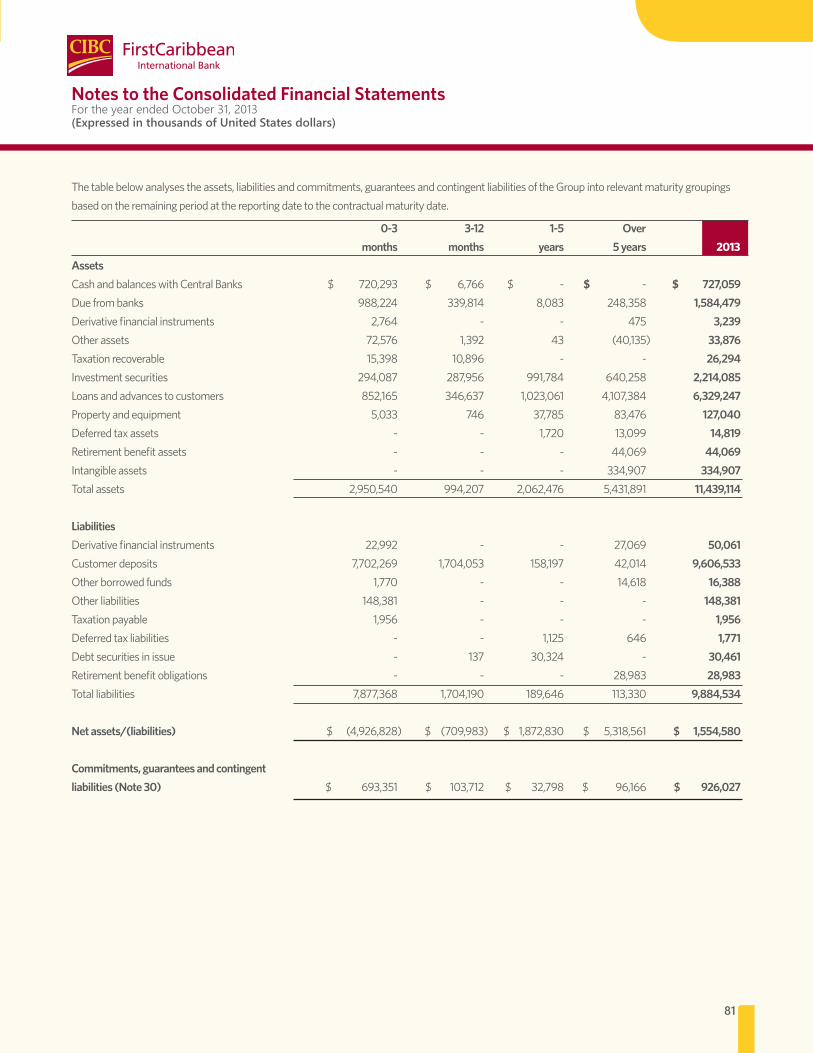
81
0-3 3-12 1-5 Over months months years 5 years 2013Assets CashandbalanceswithCentralBanks $ 720,293 $ 6,766 $ - $ - $ 727,059Due from banks 988,224 339,814 8,083 248,358 1,584,479Derivative financial instruments 2,764 - - 475 3,239Otherassets 72,576 1,392 43 (40,135) 33,876Taxation recoverable 15,398 10,896 - - 26,294 Investment securities 294,087 287,956 991,784 640,258 2,214,085 Loans and advances to customers 852,165 346,637 1,023,061 4,107,384 6,329,247Propertyandequipment 5,033 746 37,785 83,476 127,040Deferredtaxassets - - 1,720 13,099 14,819Retirementbenefitassets - - - 44,069 44,069Intangibleassets - - - 334,907 334,907Total assets 2,950,540 994,207 2,062,476 5,431,891 11,439,114 Liabilities Derivativefinancialinstruments 22,992 - - 27,069 50,061Customer deposits 7,702,269 1,704,053 158,197 42,014 9,606,533Otherborrowedfunds 1,770 - - 14,618 16,388Otherliabilities 148,381 - - - 148,381 Taxationpayable 1,956 - - - 1,956 Deferredtaxliabilities - - 1,125 646 1,771Debtsecuritiesinissue - 137 30,324 - 30,461 Retirementbenefitobligations - - - 28,983 28,983Total liabilities 7,877,368 1,704,190 189,646 113,330 9,884,534 Net assets/(liabilities) $ (4,926,828) $ (709,983) $ 1,872,830 $ 5,318,561 $ 1,554,580
Commitments, guarantees and contingent liabilities (Note 30) $ 693,351 $ 103,712 $ 32,798 $ 96,166 $ 926,027
The table below analyses the assets, liabilities and commitments, guarantees and contingent liabilities of the Group into relevant maturity groupings based on the remaining period at the reporting date to the contractual maturity date.
Notes to the Consolidated Financial Statements For the year ended October 31, 2013(Expressed in thousands of United States dollars)
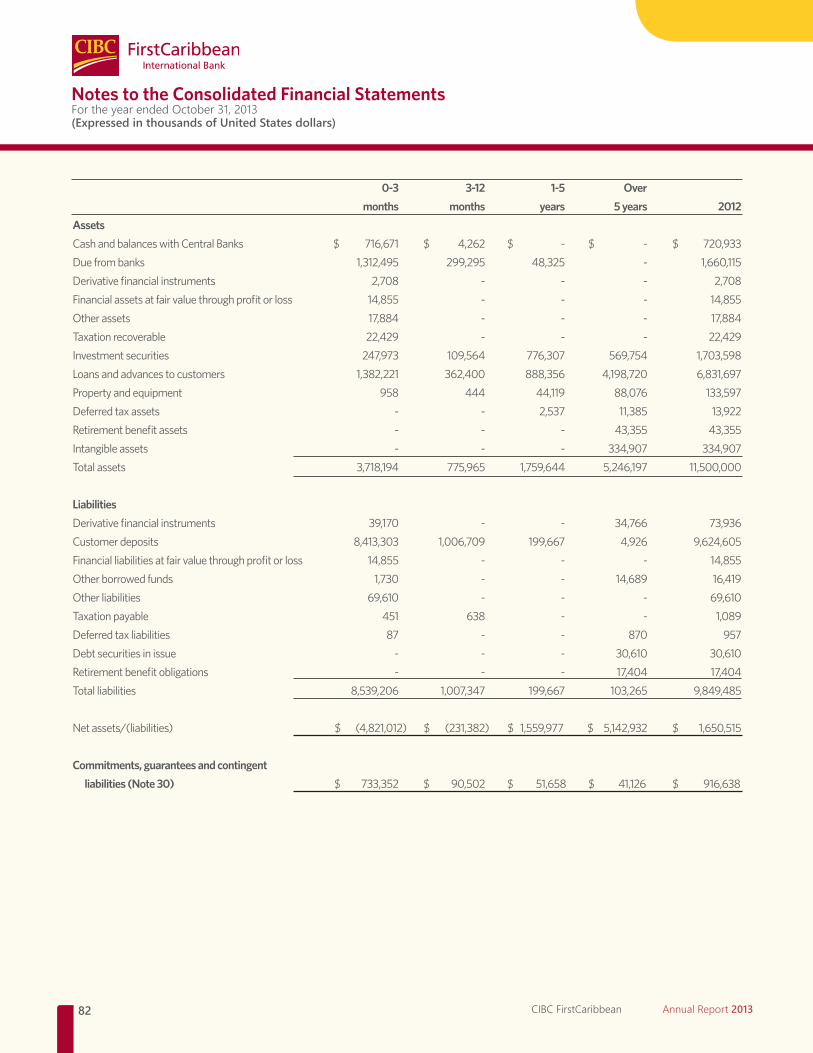
82 CIBC FirstCaribbean Annual Report 2013
Notes to the Consolidated Financial Statements For the year ended October 31, 2013(Expressed in thousands of United States dollars)
0-3 3-12 1-5 Over months months years 5 years 2012Assets CashandbalanceswithCentralBanks $ 716,671 $ 4,262 $ - $ - $ 720,933Duefrombanks 1,312,495 299,295 48,325 - 1,660,115Derivativefinancialinstruments 2,708 - - - 2,708Financialassetsatfairvaluethroughprofitorloss 14,855 - - - 14,855Otherassets 17,884 - - - 17,884Taxationrecoverable 22,429 - - - 22,429Investment securities 247,973 109,564 776,307 569,754 1,703,598Loans and advances to customers 1,382,221 362,400 888,356 4,198,720 6,831,697Propertyandequipment 958 444 44,119 88,076 133,597Deferredtaxassets - - 2,537 11,385 13,922Retirementbenefitassets - - - 43,355 43,355Intangibleassets - - - 334,907 334,907Total assets 3,718,194 775,965 1,759,644 5,246,197 11,500,000
Liabilities Derivativefinancialinstruments 39,170 - - 34,766 73,936Customer deposits 8,413,303 1,006,709 199,667 4,926 9,624,605Financialliabilitiesatfairvaluethroughprofitorloss 14,855 - - - 14,855Otherborrowedfunds 1,730 - - 14,689 16,419Otherliabilities 69,610 - - - 69,610Taxationpayable 451 638 - - 1,089Deferredtaxliabilities 87 - - 870 957Debtsecuritiesinissue - - - 30,610 30,610Retirementbenefitobligations - - - 17,404 17,404Total liabilities 8,539,206 1,007,347 199,667 103,265 9,849,485
Netassets/(liabilities) $ (4,821,012) $ (231,382) $ 1,559,977 $ 5,142,932 $ 1,650,515
Commitments, guarantees and contingent liabilities (Note 30) $ 733,352 $ 90,502 $ 51,658 $ 41,126 $ 916,638
83
Notes to the Consolidated Financial Statements For the year ended October 31, 2013(Expressed in thousands of United States dollars)
Fair values of financial assets and liabilities
Determination of fair value and the fair value hierarchyThe Group uses the following hierarchy for determining and disclosing the fair value of financial instruments by valuation technique:• Level 1: quoted (unadjusted) prices in active markets for
identical assets or liabilities.• Level 2: other techniques for which all inputs which have a
significant effect on the recorded fair value are observable,either directly or indirectly.
• Level3:techniqueswhichuseinputswhichhaveasignificanteffect on the recorded fair value that are not based onobservable market data.
All of the Group’s financial instruments recorded at fair value usetheLevel2valuationtechnique inthehierarchytodetermineand disclose the fair value.
Financial instruments recorded at fair valueThe following is a description of the determination of fair value for financial instruments which are recorded at fair value using valuation techniques. These incorporate the Group’s estimate ofassumptions that a market participant would make when valuing the instruments:
• Derivativefinancialinstruments Derivative products valued using a valuation techniquewith
market observable inputs are interest rate swaps and foreign exchange forward contracts. The most frequently appliedvaluationtechniquesincludeforwardpricingandswapmodels,using present value calculations. The models incorporate various inputs including the credit quality of counterparties,foreign exchange spot and forward rates and interest rate curves.
• Available-for-saleinvestmentsecurities Available-for-sale investment securities valued using a
valuationtechniqueorpricingmodelsprimarilyconsistofdebtsecurities.
These assets are valued using models which sometimes only incorporate data observable in the market and at other
timesusebothobservableandnon-observabledata.Thenon-observable inputs to the models include assumptionsabout liquidity and price disclosure, counterparty creditspreads and sector specific risks.
Fair value of financial instruments not carried at fair valueThe following describes the methodologies and assumptions used to determine fair values for those financial instruments which are not already recorded at fair value in the financial statements:
• Loansandadvancestocustomers Loans and advances to customers are stated net of specific
and other provisions for impairment. The estimated fair values of loans and advances to customers represents the discounted amount of estimated future cash flows expected to be received.
• Customerdepositsandotherborrowedfunds The estimated fair value of customer deposits and other
borrowed funds is based on discounted cash flows using prevailingmoney-market interestratesfordebtswithsimilarcredit risk and maturity.
• Debtsecuritiesinissue The fair value is calculated using a discounted cash flow model
based on a current interest rate yield curve appropriate for the remaining term to maturity.
• Financial assets and liabilities with carrying values thatapproximate fair value
For financial assets and liabilities that are liquid or have ashort-termmaturity,itisassumedthatthecarryingamountsapproximate to their fair value. This assumption is also applied to demand deposits savings accounts without a specific maturity and variable rate financial instruments.
Set out below is a comparison by class of the carrying amounts and fair values of the Group’s financial instruments that are not carried in the financial statements at fair value. Itthereforeexcludesbalancesrelatedtonon-financialassetsand liabilities, as well as other assets and other liabilities.
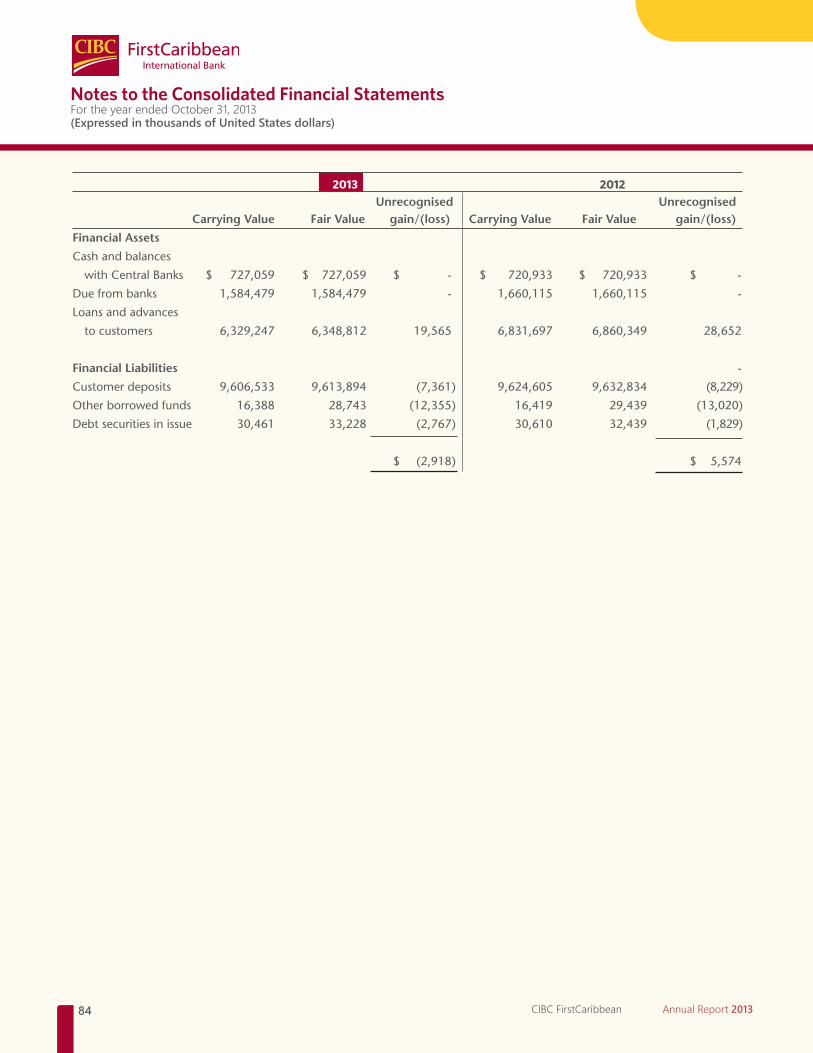
84 CIBC FirstCaribbean Annual Report 2013
Notes to the Consolidated Financial Statements For the year ended October 31, 2013(Expressed in thousands of United States dollars)
2013 2012 Unrecognised Unrecognised Carrying Value Fair Value gain/(loss) Carrying Value Fair Value gain/(loss)
Financial Assets
Cash and balances
with Central Banks $ 727,059 $ 727,059 $ - $ 720,933 $ 720,933 $ -
Due from banks 1,584,479 1,584,479 - 1,660,115 1,660,115 -
Loans and advances
to customers 6,329,247 6,348,812 19,565 6,831,697 6,860,349 28,652
Financial Liabilities -
Customer deposits 9,606,533 9,613,894 (7,361) 9,624,605 9,632,834 (8,229)
Other borrowed funds 16,388 28,743 (12,355) 16,419 29,439 (13,020)
Debt securities in issue 30,461 33,228 (2,767) 30,610 32,439 (1,829)
$ (2,918) $ 5,574
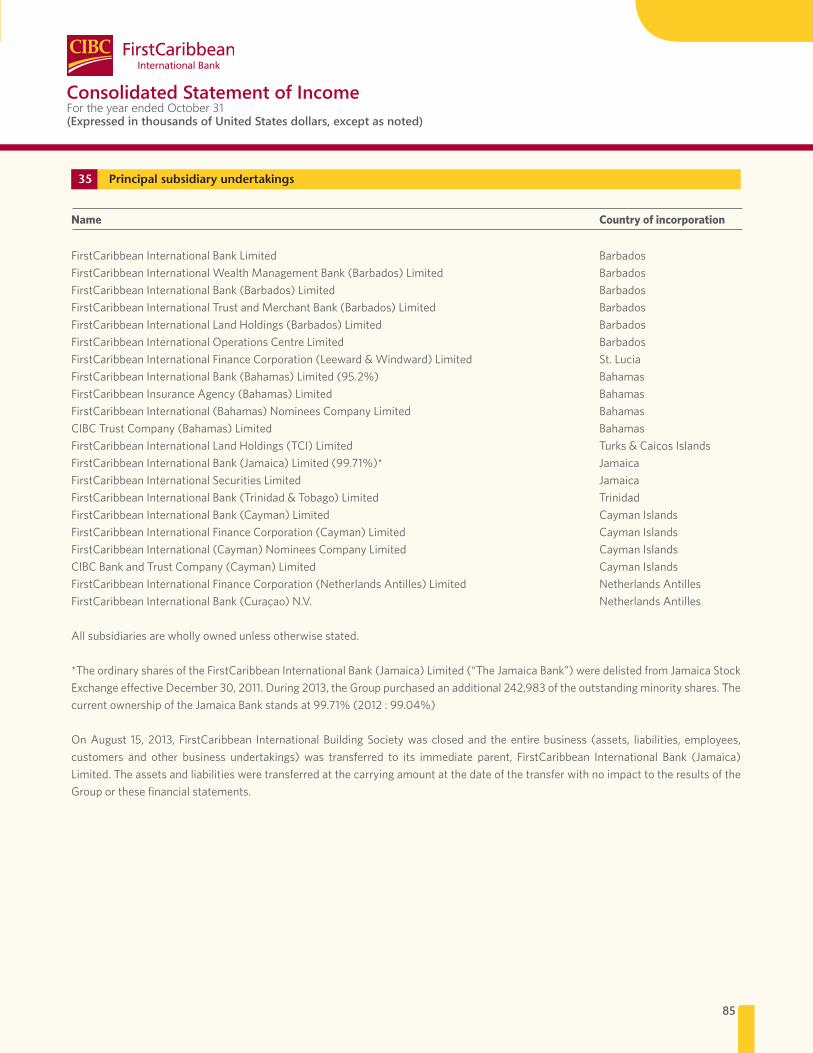
85
Consolidated Statement of Income For the year ended October 31(Expressed in thousands of United States dollars, except as noted)
Name Country of incorporation
FirstCaribbean International Bank Limited BarbadosFirstCaribbeanInternationalWealthManagementBank(Barbados)Limited BarbadosFirstCaribbeanInternationalBank(Barbados)Limited BarbadosFirstCaribbeanInternationalTrustandMerchantBank(Barbados)Limited BarbadosFirstCaribbeanInternationalLandHoldings(Barbados)Limited BarbadosFirstCaribbean International Operations Centre Limited Barbados FirstCaribbeanInternationalFinanceCorporation(Leeward&Windward)Limited St.LuciaFirstCaribbeanInternationalBank(Bahamas)Limited(95.2%) BahamasFirstCaribbeanInsuranceAgency(Bahamas)Limited BahamasFirstCaribbeanInternational(Bahamas)NomineesCompanyLimited BahamasCIBCTrustCompany(Bahamas)Limited BahamasFirstCaribbeanInternationalLandHoldings(TCI)Limited Turks&CaicosIslandsFirstCaribbeanInternationalBank(Jamaica)Limited(99.71%)* JamaicaFirstCaribbean International Securities Limited Jamaica FirstCaribbeanInternationalBank(Trinidad&Tobago)Limited TrinidadFirstCaribbeanInternationalBank(Cayman)Limited CaymanIslandsFirstCaribbeanInternationalFinanceCorporation(Cayman)Limited CaymanIslandsFirstCaribbeanInternational(Cayman)NomineesCompanyLimited CaymanIslandsCIBCBankandTrustCompany(Cayman)Limited CaymanIslandsFirstCaribbeanInternationalFinanceCorporation(NetherlandsAntilles)Limited NetherlandsAntillesFirstCaribbeanInternationalBank(Curaçao)N.V. NetherlandsAntilles
All subsidiaries are wholly owned unless otherwise stated.
*TheordinarysharesoftheFirstCaribbeanInternationalBank(Jamaica)Limited(“TheJamaicaBank”)weredelistedfromJamaicaStockExchangeeffectiveDecember30,2011.During2013,theGrouppurchasedanadditional242,983oftheoutstandingminorityshares.ThecurrentownershipoftheJamaicaBankstandsat99.71%(2012:99.04%)
OnAugust 15, 2013, FirstCaribbean InternationalBuildingSocietywasclosedand theentirebusiness (assets, liabilities, employees,customers and other business undertakings) was transferred to its immediate parent, FirstCaribbean International Bank (Jamaica)Limited. The assets and liabilities were transferred at the carrying amount at the date of the transfer with no impact to the results of the Group or these financial statements.
35 Principal subsidiary undertakings

5Section
87 Notice of Meeting88 Directors’ Report89 Management Proxy Circular90 Proxy Form91 Ownership Structure92 Main Branches and Centres

87
Notice of Meeting
Annual General MeetingNotice is hereby given that the Twentieth Annual General Meeting of the shareholders of FirstCaribbean International Bank Limited will be held at the Flamboyant Room North, Lloyd Erskine Sandiford Centre, Two Mile Hill, St. Michael, Barbados, on Thursday, March 20, 2014 at 5 p.m. for the following purposes:
1. To receive audited accounts for the year ended October 31, 2013 and the Report of the Directors and Auditors thereon.
2. To elect the following directors:(i) Mr.BrianMcDonoughforaperiodofoneyear;(ii) Mr.MichaelMansoorforaperiodofoneyear;(iii) Mr.ChristopherDehringforaperiodofoneyear;
3. Tore-electthefollowingdirectorswhoretirebyrotationandbeingeligibleseekre-election:(i) Ms.G.DianeStewartforaperiodofthreeyears;(ii) Ms.ChristinaKramerforaperiodofthreeyears;
4. To appoint the Auditors and to authorise the directors to fix their remuneration.
5. To discuss any other business which may be properly considered at the Annual General Meeting.
By Order of the board of directors
Brian H. ClarkeCorporate SecretaryJanuary 31, 2014
ProxiesShareholders of the Company entitled to attend and vote at the meeting are entitled to appoint one or more proxies to attend and, in a poll, vote instead of them. A proxy need not also be a shareholder. Any instrument appointing a proxy must be received at the office of the Registrar & Transfer Agent, Barbados Central Securities Depository Inc., 8th Avenue, Belleville, St. Michael, Barbados, not less than 48 hours before the meeting. Members whoreturncompletedproxyformsarenotprecluded,subsequentlyif they so wish, from attending the meeting instead of their proxies and voting in person. In the event of a poll, their proxies’ votes lodged with the Registrar & Transfer Agent will be excluded.
DividendAfinaldividendofUS$0.015persharewasapprovedfortheyearended October 31, 2013 and was paid on January 30, 2014, to the holders of common shares whose names were registered in the books of the Company at the close of business on December 19, 2013.
An interim dividend of US$0.015 per share was paid onJune 28, 2013 to holders of common shares whose names were registered in the books of the Company at the close of business on June 13, 2013.
Total dividend for the 2013 financial year amounted to US$0.030pershare.
Documents Available for inspection:There are no service contracts granted by the Company, or our subsidiary companies, to any director.
Registered Office:Warrens, St. Michael, Barbados, West Indies.

88 CIBC FirstCaribbean Annual Report 2013
Directors’Report
10. Mark McIntyre nil nil11. Jude Pinto nil nil12. MarieRodland-Allen nil nil13. PatriciaRowe-Seale 13,127 nil14. GeoffScott nil nil15. Mark St. Hill 2,830 nil16. Trevor Torzsas nil nil17. Willem M Van der Burg 12,465 nil18. Donna Wellington nil nil19. David Whitcroft nil nil20. Derek Wilson 27,820 nil21. Mark Young 25,677 nil
Financial Results and DividendsThe Company’s consolidated net loss for the period ending October 31,2013amountedtoUS$27million.Allstatutoryrequirementsforthe period have been fulfilled.
The Company declared a final dividend of US$0.015 percommon share for the period ending October 31, 2013. An interim dividendofS$0.015percommonsharewasalsopaidinthe2013fiscal period. Total dividend for the period was US$0.03 percommon share.
Share CapitalCIBC Investments (Cayman)Limited is themajority shareholderoftheCompanynowholding91.67%oftheCompany’sissuedandoutstanding shares. Substantial Interest as at October 31, 2013*
Common Shares of No Par Value CIBCInvestments(Cayman)Limited 1,445,725,257(91.67%)
* Substantial Interestmeans a holding of 5% ormore of the Company’s issued share capital.
AuditorsMessrs. Ernst & Young, Chartered Accountants served as external auditors of the Company for the 2012-2013 financial year. Aresolution relating to the re-appointment of Ernst & Young asauditorsforthe2013-2014financialyearwillbeproposedattheAnnual Meeting of the shareholders of the Company.
By Order of the Board
Brian H. ClarkeCorporate Secretary
DirectorsMr. Michael Mansoor retired as Executive Chairman on October 31, 2013. Mr. Brian O’Donnell resigned his directorship on December 12,2013.TheBoardre-appointedMrMansooradirectortofillthecasual vacancy created by his retirement. Mr Brian McDonough was appointed a director to fill the casual vacancy created by Mr O’Donnell’s resignation. Both appointments were made on December 12, 2013.
An independent shareholder nominated Mr. Christopher Dehring as a director. The Audit & Governance Committee recommended Mr. Dehring’s nomination to the Board at their December 2013 meeting. The Board appointed Mr Dehring at their March 2014 meeting.
Shareholders are requested to elect Mr. Michael Mansoor,Mr. Brian McDonough, and Mr. Christopher Dehring to serve as directorsforaperiodofoneyear.Shareholdersarealsorequestedto re-appoint for a period of three years directorsMs.ChristinaKramer and Ms. G. Diane Stewart, who retire by rotation, and being eligible,offerthemselvesforre-election.
Directors’ InterestAs of October 31, 2013, particulars of directors’ shareholdings in the issued capital of the Company are as follows:
Common Shares of No Par Value
Beneficial Non Beneficial Interest InterestDirectors1. Michael Mansoor 295,334 nil2. Douglas ‘Rik’ Parkhill nil nil3. Richard Nesbitt nil nil4. David Ritch nil nil5. Sir Fred Gollop 1,416 nil6. Sir Allan Fields 1,000 nil7. G. Diane Stewart nil nil8. Paula Rajkumarsingh nil nil9. Christina Kramer nil nil10. Kevin Glass nil nil
Senior Management1. Brian Clarke nil nil2. Daniel Farmer nil nil3. Ben Gillooly nil nil4. Donna Graham nil nil5. Duane Hinkson nil nil6. Nigel Holness nil nil7. Ella Hoyos nil nil8. Debbie Kellett nil nil9. Brian Lee nil nil
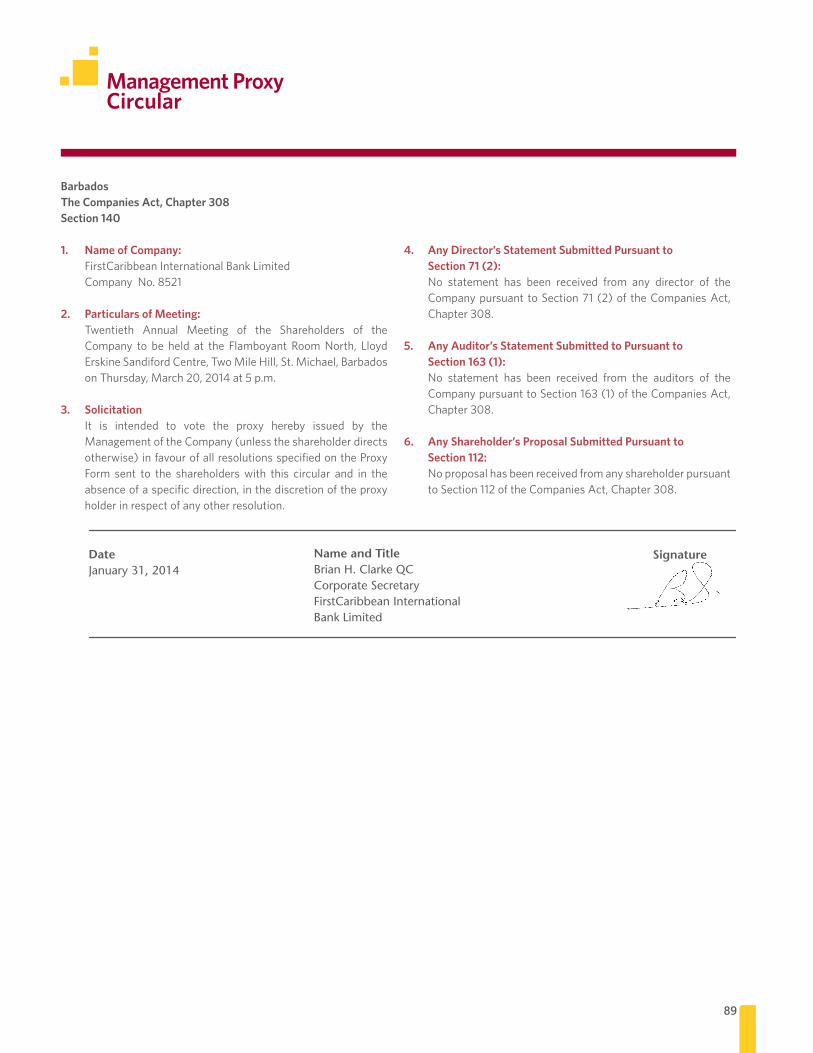
89
Management ProxyCircular
BarbadosThe Companies Act, Chapter 308 Section 140
1. Name of Company: FirstCaribbean International Bank Limited Company No. 8521
2. Particulars of Meeting: Twentieth Annual Meeting of the Shareholders of the
Company to be held at the Flamboyant Room North, Lloyd Erskine Sandiford Centre, Two Mile Hill, St. Michael, Barbados on Thursday, March 20, 2014 at 5 p.m.
3. Solicitation It is intended to vote the proxy hereby issued by the
ManagementoftheCompany(unlesstheshareholderdirectsotherwise)infavourofallresolutionsspecifiedontheProxyForm sent to the shareholders with this circular and in the absence of a specific direction, in the discretion of the proxy holder in respect of any other resolution.
4. Any Director’s Statement Submitted Pursuant to Section 71 (2):
No statement has been received from any director of the Companypursuant toSection71(2)of theCompaniesAct,Chapter 308.
5. Any Auditor’s Statement Submitted to Pursuant to Section 163 (1):
No statement has been received from the auditors of the CompanypursuanttoSection163(1)oftheCompaniesAct,Chapter 308.
6. Any Shareholder’s Proposal Submitted Pursuant to Section 112:
No proposal has been received from any shareholder pursuant to Section 112 of the Companies Act, Chapter 308.
DateJanuary 31, 2014
SignatureName and TitleBrian H. Clarke QCCorporate SecretaryFirstCaribbean International Bank Limited

90 CIBC FirstCaribbean Annual Report 2013
ProxyForm
I/Wetheundersignedshareholder/shareholdersofFirstCaribbeanInternationalBankLimitedherebyappointMr.Douglas‘Rik’Parkhill,oranydirectoroftheCompanyor_______________________________asmy/ourproxytovoteforme/usonmy/ourbehalfasindicatedbelowon the resolutions to be proposed at the Annual Meeting of the shareholders of the Company to be held on Thursday, March 20, 2014.
Dated this _________________________day of _______________________________, 2014.
Nameofshareholder(s)oftheCompany_________________________________________
Signature_____________________________________________________________________
Name(s)ofsignatory(ies)inblockcapitals_______________________________________
Pleaseindicatewithan“X”inthespacesbelowhowyouwishyourproxytovoteontheresolutionsreferredto.Ifnoindicationisgiventheproxy will exercise his or her discretion as to how he or she votes or whether he or she abstains from voting.
FOR AGAINSTResolution 1To approve the adoption of the audited consolidated financial statements of the Company for the year November 1, 2012 to October 31, 2013.
Resolution 2To approve the election of the following person as a director for the term hereinafter set forth:
(i)Mr. Brian McDonough for a period of one year
(ii) Mr. Michael Mansoor for a period of one year
(iii) Mr.ChristopherDehringforaperiodofoneyear
Andtore-electthefollowingpersonsasDirectors:
(iv) Ms. Christina Kramer for a period of three years.
(iv) Ms. G. Diane Stewart for a period of three years. Resolution 3To approve the appointment of the auditors, and to authorise the directors to fix their remuneration.
Notes:1. If it is desired to appoint a proxy other than the named directors, the necessary deletion must be made and initialled and the name inserted in the
space provided.2. In the case of joint holders, the signature of any holder is sufficient, but the name of all joint holders should be stated.3. If the appointer is a corporation, this form must be under its common seal or under the name of an officer of the corporation duly authorised on their
behalf.4. To be valid, this form must be completed and deposited with the Registrar and Transfer Agent, Barbados Central Securities Depository Inc.
8th Avenue Belleville, St. Michael, Barbados at least 48 hours before the time appointed for holding the Meeting or adjourned Meeting.
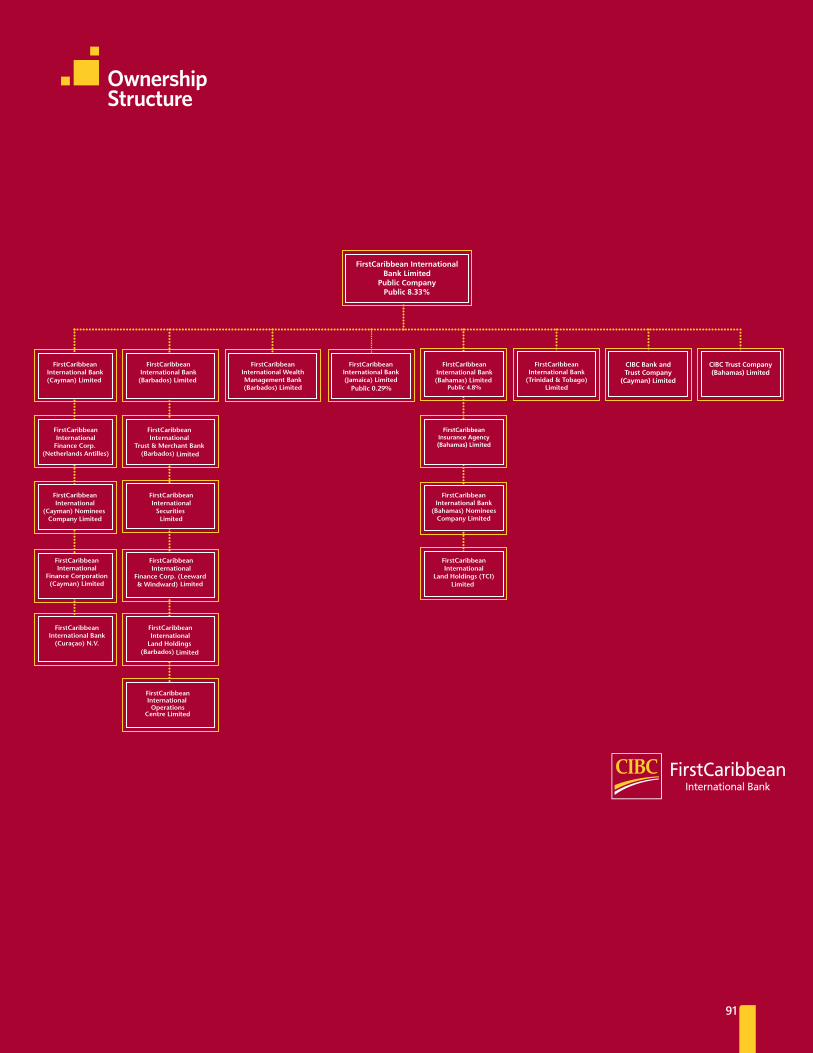
Public 0.29%
91
Ownership Structure
92 CIBC FirstCaribbean Annual Report 2013
Main Branches& Centres
St. VincentP.O. Box 604Halifax Street,KingstownTel:(784)456-1706
CORPORATE BANKING CENTRES
Corporate Banking CentreP.O.BoxN-7125Shirley StreetNassau, The BahamasTel:(242)322-8455
Finance CorporationP.O.BoxN-8350Shirley StreetNassau, The BahamasTel:(242)322-7466
Corporate Banking CentreP.O. Box 503RendezvousChrist Church, BarbadosTel:(246)467-8768
Corporate Banking Centre23-27KnutsfordBlvdKingston 5, JamaicaTel:(876)929-9310
CIBC FirstCaribbean Bank Financial CentreCorporate & Investment BankingUnitsGround Floor74 Long Circular RoadMaraval, Trinidad, W.I.Tel:(868)628-4685
Finance CorporationP O Box 335Castries St. LuciaTel:(758)456-1110
Corporate Banking CentreP.O. Box 28Old Parham RoadSt John’s, AntiguaTel:(268)480-5000
Head OfficeP.O. Box 503Warrens, St. MichaelBarbadosTel:(246)367-2300
AnguillaP.O. Box 140The ValleyTel:(264)497-2301
AntiguaP.O. Box 225High StreetSt. John’sTel:(268)480-5000
The BahamasP.O.BoxN-8350Shirley Street, NassauTel:(242)322-8455
BarbadosP.O. Box 405Broad StreetSt. MichaelBridgetownTel:(246)367-2300
BelizeP.O. Box 36321 Albert StreetBelize CityTel:011+(501)227-7212
British Virgin IslandsP.O. Box 70Road TownTortola, VG1110Tel:(284)852-9900
Cayman IslandsP.O. Box 68Grand Cayman KY1-110225 Main StreetGeorge TownGrand CaymanTel:(345)949-7300
CuraçaoP.O. Box 3144De Ruyterkade 61WillemstadCuraçaoTel:(+5999)4338000
DominicaP.O. Box 4Old Street, RoseauTel:(767)255-7900
GrenadaP.O. Box 37Church StreetSt. George’sTel:(473)440-3232
JamaicaP.O. Box 40323-27KnutsfordBlvdKingston 5Tel:(876)929-9310
St. KittsP.O. Box 42Bank Street, BasseterreTel:(869)465-2449
St. KittsP.O. Box 42The Circus, BasseterreTel:(869)465-2449
St. LuciaP.O. Box 335Bridge Street, CastriesTel:(758)456-1000
St. MaartenP.O. Box 94138 Back StreetPhilipsburgTel:(721)542-3511
NevisP.O. Box 502CharlestownTel:(869)469-5309
Trinidad & Tobago CIBC FirstCaribbean Bank Financial Centre74 Long Circular RoadMaraval, Trinidad, W.I.Tel:(868)628-4685
Turks and Caicos IslandsP.O. Box 23662 Salt Mills PlazaGrace Bay BranchProvidencialesTurks & Caicos IslandsTel:(649)941-4558
Corporate Banking Centre St. KittsP.O. Box 42The Circus, BasseterreTel:(869)465-2449
WEALTH MANAGEMENT CENTRES
Wealth Management CentreP.O.BoxN-8350Shirley StreetNassau, The BahamasTel:(242)302-6000
Wealth Management CentreP.O. Box 180Ground Floor, Head OfficeWarrens, St. MichaelBarbadosTel:(246)367-2012
Wealth Management Centre23-27KnutsfordBlvdKingston 5, JamaicaTel:(876)935-4619
Wealth Management CentreLiguanea1291/2OldHopeRoadKingston 6Tel:(876)656-9240
Wealth Management CentreMontego Bay59 St. James Street,Montego Bay Tel:(876952-0801or952-4045/6
Wealth Management CentreDe Ruyterkade 61P.O. Box 3144Willemstad, CuraçaoNetherlands AntillesTel:(+599)9433-8000
93
Main Branches& Centres
CIBC FirstCaribbean Bank Financial CentreWealth Management Centre1st Floor74 Long Circular RoadMaraval, Trinidad, W.I.Tel:(868)628-4685
Wealth Management Centre is on: 1st Floor.Corporate & Investment BankingUnits:GroundFloor.
Wealth Management CentreP.O. Box 68Grand Cayman KY1-110225 Main Street, GeorgeTownGrand CaymanCayman IslandsTel:(345)949-7300
Wealth Management CentreP.O. Box 70Road Town, TortolaBritish Virgin IslandsTel:(284)494-2171
Wealth Management CentreP.O. Box 698Leeward HighwayProvidencialesTurks and Caicos IslandsTel:(649)946-5303
Wealth ManagementCentreP O Box 335Castries St. LuciaTel:(758)456-1508
St LuciaWealth Management CentreP O Box 335Rodney RayGros Islet
Wealth Management Centre Curacao P.O. Box 3144De Ruyterkade 61WillemstadCuraçaoTel:(+5999)4338000
OTHER SUBSIDIARIES
Trust and Merchant BankP.O. Box 5032nd Floor, RendezvousChrist Church, BarbadosTel:(246)467-8700
SecuritiesP.O. Box 162Kingston 1023-27KnutsfordBlvdKingston 5, JamaicaTel:(876)929-4606
Investment Banking74 Long Circular RoadMaraval, TrinidadTel:(868)628-4685
CIBC Bank and Trust Company (Cayman) LimitedCIBC Financial Centre11 Dr. Roy’s DriveP.O. Box 694GrandCaymanKYI-1107Cayman Islands
CIBC Trust Company(Bahamas) LimitedGoodman’s Bay Corporate CentreWest Bay StreetP.O. Box N. 3933Nassau, Bahamas

94 CIBC FirstCaribbean Annual Report 2013
Notes