Embed Size (px)
Citation preview


Half Year June 30, 2017 1
Registered Office
Faysal House, ST-2, Sharah-e-Faisal, Karachi
Tel: 021-32795200 Fax: 021-32795234
CONTENTS
Condensed Interim Statement of Financial Position
Condensed Interim Profit and Loss Account
Condensed Interim Statement of Comprehensive Income
Condensed Interim Cash Flow Statement
Condensed Interim Statement of Changes in Equity
Notes to and Forming part of the Condensed Interim Financial Information
Corporate Information
Directors' Review
2
4
10
11
12
13
14
15
Auditors' Review Report 9

Half Year June 30, 20172
Board of Directors
Mr. Farooq Rahmatullah Khan Chairman/Non-Executive Director
Mr. Ahmed Abdulrahim Mohamed Abdulla Bucheery Vice Chairman/Non-Executive Director
Mr. Yousaf Hussain President & CEO (confirmed July 27, 2017)
Mian Muhammad Younis Independent Director
Mr. Imtiaz Ahmad Pervez Non-Executive Director
Mr. Juma Hasan Ali Abul Non-Executive Director
Mr. Abdulelah Ebrahim Mohamed AlQasimi Non-Executive Director
Mr. Abdulla Abdulaziz Ali Taleb Non-Executive Director
Mr. Fuad Azim Hashimi Independent Director
Mr. Ali Munir Independent Director
Board Audit & Corporate Governance Committee
Mian Muhammad Younis Chairman
Mr. Juma Hasan Ali Abul Member
Mr. Ali Munir Member
Board Risk Management Committee
Mr. Imtiaz Ahmad Pervez Chairman
Mr. Abdulelah Ebrahim Mohamed AlQasimi Member
Mr. Abdulla Abdulaziz Ali Taleb Member
Recruitment Nomination and Remuneration Committee
Mr. Ahmed Abdulrahim Mohamed Abdulla Bucheery Chairman
Mr. Juma Hasan Ali Abul Member
Mian Muhammad Younis Member
Mr. Fuad Azim Hashimi Member
Mr. Ali Munir Member
CORPORATE INFORMATION

Half Year June 30, 2017 3
Board Strategy Committee
Mr. Farooq Rahmatullah Khan Chairman
Mr. Ahmed Abdulrahim Mohamed Abdulla Bucheery Member
Mr. Juma Hasan Ali Abul Member
Mr. Fuad Azim Hashimi Member
Syed Majid Ali Chief Financial Officer
Mr. Aurangzeb Amin Company Secretary & Head of Legal
M/s. A.F. Ferguson & Co, Chartered Accountants Auditors
M/s. Mohsin Tayebaly & Co, Advocate Legal Advisors
Registered Office Share Registrar
Faysal Bank Limited M/s. Central Depository Company of
Pakistan LimitedFaysal House, St-02, Commercial Lain,
(Share Registrar Department)Main Shahrah-e-Faisal,
CDC House, 99-B, Block-B,Karachi-Pakistan
SMCHS, Main Shahra-e-Faisal,
Karachi-74400
UAN : (92-21) 111-747-747 Tel: (92-21) 111-111-500
Tel : (92-21) 3279-5200 Fax: (92-21) 34326053
Fax : (92-21) 3279-5226 Email: [email protected]
Website: www.faysalbank.com
CORPORATE INFORMATION

Half Year June 30, 20174
DIRECTORS’ REVIEW
On behalf of the Board of Directors, I am pleased to present the Directors’ Report of Faysal
Bank Limited along with financial statements for the half year ended June 30, 2017.
Economic Update:
Real GDP growth maintained upward trajectory as it grew to 5.3% in FY 17 vis-à-vis 4.7% in the
preceding year. Private sector credit off-take registered growth of 67.7%, resulting in expansion
of the real sector. However, the country needs to do better on the external front. Forex reserves
declined by 7.5% to USD 21.37 billion due to sliding exports & remittances, mushrooming
imports and subsequent debt servicing payments.
Average headline inflation stood at 4.16%, which is higher than the last year but is still below the
6% target set at the beginning of the year. CPI inflation in FY’17 largely remained in the comfort
zone whereas core inflation was resilient at 5.5%, indicating persistent aggregate demand. Since
both these rates are below the policy rate, the GoP was able to maintain interest rates level
throughout FY’17.
The significant economic development in FY’17 was the surge in private sector credit growth,
primarily spurred by low interest rates & improved domestic demand. Private sector credit off-
take reached a decade high of PKR 748 billion in FY’17 from PKR 446 billion in FY’16. On the
fiscal front, deficit was recorded at 4.2%, missing the target of 3.7%, primarily owing to relatively
slow growth in tax collection in FY’17 (8.6% in FY’17 as compared to 20.3% in the previous
year). The most noticeable economic situation in FY’17 was the widening of the current account
deficit by 149% to USD 12.09 billion from USD 4.86 billion in the previous year, second only to
the record-high deficit of USD 13.87 billion in FY’08. This is primarily attributable to rise in
imports by 17.7% from USD 41.26 billion in FY’16 to USD 48.55 billion in FY’17 (excluding
import of services of USD 9.12 billion), food, machinery, transport & petroleum are major
components that have contributed to the surge in imports. At the same time, exports have largely
remained subdued due to overvalued rupee and increasing cost of doing business viz-a-viz
regional competitors. In FY’17, exports declined by 1.4% to USD 21.66 billion (excluding export
of services of USD 5.56 billion). Remittances have also registered a YoY decline of 3.08% from
USD 19.92 billion in FY’16 to USD 19.30 billion in FY’17. If the widening current account deficit
is not curtailed, it will complicate the balance of payments’ situation, adversely affecting overall
economic performance of the country.
Economic Outlook:
Going forward, we foresee a challenging road ahead for the economy in FY’18. With inflation
slowly resurging due to growing aggregate demand, we see upward trajectory of interest rates in
the country. The USD/PKR parity will remain under significant pressure due to a persistent
current account deficit. Efforts to achieve the 6% GDP growth target set in the federal budget for
FY’18 will be challenged by multiple factors such as political uncertainty, pre-election fiscal
slippages and challenges on the balance of payments side. The main positive factor that may
boost Pakistan’s economy is the CPEC. The government expects significant financial flows from
the project to shore up forex reserves and provide cushion to the current account. However, the
cost of CPEC may become a bane for the economy in the medium term. Meanwhile, relatively
low oil prices have greatly benefited the economy, and the stable price trend looks set to
continue in future as well.

Half Year June 30, 2017 5
Bank’s Performance:
The Bank is following a well-defined strategy with a focus on network expansion, mobilization of
CASA deposits, selective growth in lending portfolio, cost efficiency, technology and gradual
conversion to Islamic banking.
Some of the notable milestones achieved during the period under review are as follows:
Project Financing & Syndication
Ÿ The Bank participated in syndicated long term loan of PKR 13,000 Million with an amount of
PKR 1,500 Million for a renowned cement plant arranged under Islamic mode of financing.
The proceeds will be utilized for setting up a third production line of 6,700 tons of clinker per
day at the existing plant location.
Ÿ We acted as co-arranger in syndicated long term financing facility of PKR 26,750 Million,
with participation of PKR 2,950 Million, arranged for a leading telecom operator under a
combination of both conventional and Islamic modes of financing.
Infrastructure Development
Ÿ The Bank expanded its network to 365 branches as 10 new branches were opened during
the period under review. Currently the Bank has 207 conventional branches, 157 Islamic
branches and 01 sub branch in 107 cities.
Ÿ ATM network has been increased from 344 machines to 359 machines, offering 24/7
services to the customers.
Product Development & New Initiatives
Ÿ Branches have been provided with mobile bio-metric solutions to enable onsite account
opening.
Ÿ The Solitaire Preferred Banking service was revitalized to provide personalized services to
high net worth customers.
Ÿ The first Solitaire Preferred Islamic Banking Centre was launched in the second quarter of
2017, making for a total network of 11 dedicated Solitaire Centres in Karachi, Lahore,
Islamabad and Faisalabad.
Ÿ Bank launched four new insurance plans with EFU and Adamjee Insurance, designed to suit
customer requirements.
Ÿ Bank launched new Islamic Takaful Plans with Adamjee and EFU Life as business partners,
offering multiple Coverage and Premium Options.
Ÿ Implemented new version of Al Qist pool management system enhancing the pool
management features. (Al Qist is a system based solution which distributes profit based on
Shariah priciples to Islamic banking customer from the income pool).
DIRECTORS’ REVIEW

Half Year June 30, 20176
Training & Development:
Ÿ Islamic Banking Certificate Course conducted by SBP’s traning centre (NIBAF) has been
completed by additional 12% of identified staff, bringing the completion rate to 70% of the
targeted staff.
Ÿ More than 6,400 participants were trained through various training programs and clocked in
a total of 47,776 training hours in the second quarter.
Ÿ 218 participants have been trained under the Islamic Branch Expansion Plan.
Ÿ A special Program Islamic Banking Level-1 was conducted for Corporate, CBSME and Trade
teams to align them better with Islamic banking business practices.
Ÿ To re-enforce organizational values, Ethics and Values workshop was conducted for
additional 136 employees during quarter 2.
Ÿ 70 Trainee Branch Service Officers (BSOs)-2017 successfully completed classroom training
and are currently undergoing job rotations.
Corporate Social Responsibility:
Ÿ During the period under review, Bank gifted a van to a charity organization, engaged in free
rehabilitation services for disabled persons.
Ÿ 10 staff members were sent for Hajj through balloting.
Change of President & CEO:
Mr. Nauman Ansari, ex-President & CEO, decided to leave the Bank upon completion of his
term. The Board of Directors has appointed Mr. Yousaf Hussain, formerly Chief Risk Officer, as
the new President & CEO of Faysal Bank Ltd. Mr. Yousaf is a seasoned banker with over 22
years of experience primarily with ABN AMRO and last 9 years with Faysal Bank.
Future Outlook:
In line with the Bank’s strategic decision of gradual conversion of Faysal Bank into an Islamic
Bank, 50 new Islamic branches are scheduled to be opened in 2017. In the first half of the year,
10 branches were opened and 01 conventional branch was converted into an Islamic branch.
Bank is in the process of developing a seamless end-to-end branch conversion solution for swift
yet efficient branch conversions.
New branches are generating low-cost core deposits and will also cater to banking requirements
of individuals and corporate entities. Alongside deposit mobilization, the emphasis is also on
developing Shariah-compliant financing products that meet the needs of a large and diversified
customer base.
DIRECTORS’ REVIEW

Half Year June 30, 2017 7
DIRECTORS’ REVIEW
Operating Profit 4,317 4,805
June
2017
June
2016
PKR in Million
provision for non-performing advances 519 (454)
Reversal for diminution in value of
investments 6 9
Provision against off balance sheet
obligations -
525 (441)
Profit before tax 4,842 4,364
Provision for taxation (1,983) (1,546)
Profit after tax 2,859 2,818
Earnings per share – Rupees 2.17 2.14
Financial Highlights:
Reversal /
Banking industry is experiencing low interest rate scenario since many years. In order to
maintain margins, Bank shifted its focus to generation of low cost CASA deposits and vigorous
recovery efforts from delinquent clients. For the first half of 2017, Bank’s margin is PKR 7.010 bln
against PKR 6.061 bln of last year. Last year income includes substantial capital gain realized
through sale of government securities. Bank has earned Profit after Tax (PAT) of PKR 2.859 bln
during 1st half of the year against PKR 2.818 bln earned during corresponding period despite
imposition of super tax amounting to PKR 259 mln. As a result, EPS of the Bank increased to
PKR 2.17 from PKR 2.14 as compared to corresponding period.
The Bank’s deposit composition was further improved as CASA deposits grew from 67.1% to
70.3%. This had a positive impact on cost of deposits which reduced by 22 bps. The planned
expansion in branch network is supplementing these efforts. Additionally, intensified recovery
efforts from delinquent clients & strict monitoring of administrative expenses were continued to
supplement bottom-line. NPLs recoveries contributed PKR 509.9 mln (net of NPL charge) to the
profitability. Administrative expenses increased marginally by 6% and are being managed
through strict surveillance despite inflationary impact and new branch openings.
Bank is also making renewed efforts to increase non-funded income through increase in trade &
consumer products volumes.
In terms of the balance sheet, the Bank increased its capital base through profit retention which
now stands at PKR 31.97 billion, while Capital Adequacy Ratio (CAR) of 16.14% is comfortably
above SBP’s minimum requirement. Deposits increased by PKR 14.19 billion in the first half of
the year to reach PKR 354.5 billion. Total assets of the Bank are now in excess of PKR 475
billion. NPL coverage has shown consistent improvement in recent past and now stands at
85.8% as of June 30, 2017 against 81.7% on December 31, 2016. This ratio reflects that the
4

Half Year June 30, 20178
DIRECTORS’ REVIEW
Bank has adequate provision against non-performing loans and there is low likelihood of further
major provisioning in near future.
Credit Rating:
JCR-VIS Credit Rating Company Limited (JCR) and Pakistan Credit Rating Agency Limited
(PACRA) have re-affirmed the following entity ratings based on financial statements for the year
ended December 31, 2016:
Long-Term AA
Short-Term A1+
Stable outlook has been assigned to the ratings by both the rating agencies. Definitions of JCR-
VIS for the assigned ratings are reproduced below:
“AA: High credit quality. Protection factors are strong. Risk is modest but may vary slightly from
time to time because of economic conditions.
A1+: High certainty of timely payment. Short term liquidity including internal operating factors
and/or access to alternative sources of funds is outstanding and safety is just below risk free
Government of Pakistan short-term obligations.”
Definitions of PACRA for the assigned ratings are reproduced below:
“AA: Very high credit quality. AA rating denotes a very low expectation of credit risk. It indicates
very strong capacity for timely payment of financial commitments. This capacity is not
significantly vulnerable to foreseeable events.
A1+: Obligations supported by the highest capacity for timely repayment.”
Acknowledgement:
I, along with members of the board of directors’ and staff acknowledge Mr. Nauman Ansari’s
services and contribution towards development of the bank and wish him all the best in his future
endeavors.
I would also like to take this opportunity to thank the shareholders on behalf of the Board and
Management for their trust in the Bank. I am also grateful to the State Bank of Pakistan and the
Securities and Exchange Commission of Pakistan for their continued support and guidance, and
to the customers for their patronage. I would also like to express sincere appreciation for the
employees of the Bank for their dedication and hard work.
On behalf of the Board of Directors
President & CEO
Karachi
Dated: August 23, 2017

Half Year June 30, 2017 9
INDEPENDENT AUDITORS’ REPORT ON REVIEW OF CONDENSED INTERIM FINANCIAL INFORMATION TO THE MEMBERS
Introduction
We have reviewed the accompanying condensed interim statement of financial position of
Faysal Bank Limited as at June 30, 2017 and the related condensed interim profit and loss
account, condensed interim statement of comprehensive income, condensed interim statement
of changes in equity, condensed interim cash flow statement together with the notes forming part
thereof (here-in-after referred to as the “condensed interim financial information”) for the half
year then ended. Management is responsible for the preparation and presentation of this
condensed interim financial information in accordance with approved accounting standards as
applicable in Pakistan for interim financial reporting. Our responsibility is to express a conclusion
on this condensed interim financial information based on our review. The figures of the
condensed interim profit and loss account and condensed interim statement of comprehensive
income for the quarters ended June 30, 2017 and June 30, 2016 have not been reviewed, as we
are required to review only the cumulative figures for the half year ended June 30, 2017.
Scope of Review
We conducted our review in accordance with International Standard on Review Engagements
2410, ‘Review of Interim Financial Information Performed by the Independent Auditor of the
Entity.’ A review of interim financial information consists of making inquiries, primarily of persons
responsible for financial and accounting matters, and applying analytical and other review
procedures. A review is substantially less in scope than an audit conducted in accordance with
International Standards on Auditing and consequently does not enable us to obtain assurance
that we would become aware of all significant matters that might be identified in an audit.
Accordingly, we do not express an audit opinion.
Conclusion
Based on our review, nothing has come to our attention that causes us to believe that the
accompanying condensed interim financial information as of and for the half year ended June
30, 2017 is not prepared, in all material respects, in accordance with approved accounting
standards as applicable in Pakistan for interim financial reporting.
Chartered Accountants
Engagement Partner: Shahbaz Akbar
Dated: August 25, 2017
Karachi

Half Year June 30, 201710
CONDENSED INTERIM STATEMENT OF FINANCIAL POSITIONAS AT JUNE 30, 2017
Un-audited Audited
Note June 30, December 31,
2017 2016
ASSETS
Cash and balances with treasury banks 37,239,302
Balances with other banks 9 1,139,375
Lendings to financial institutions 10 5,000,000
Investments 11 170,210,137
Advances 12 204,830,997
Operating fixed assets 13 12,111,881
Deferred tax assets - net 2,264,212
Other assets 11,668,757
444,464,661
LIABILITIES
Bills payable 5,982,285
Borrowings 52,806,084
Deposits and other accounts 14 340,306,404
Sub-ordinated loans 1,497,000
Liabilities against assets subject to finance lease -
Deferred tax liabilities - net -
Other liabilities 8,864,563
409,456,336
NET ASSETS 35,008,325
REPRESENTED BY
Share capital 11,997,601
Reserves 7,158,248
Unappropriated profit 9,985,870
29,141,719
Surplus on revaluation of assets - net of tax 5,866,606
35,008,325
CONTINGENCIES AND COMMITMENTS 15
The annexed notes 1 to 22 form an integral part of this condensed interim financial information.
PRESIDENT & CEO CHIEF FINANCIAL OFFICER DIRECTOR DIRECTOR DIRECTOR
------------------- Rupees '000 ------------------
36,408,1692,019,1114,598,303
195,233,058213,808,943
12,150,6642,017,699
12,345,543478,581,490
7,382,72269,889,653
354,499,391748,500
--
8,844,723441,364,989
37,216,501
13,197,3617,095,815
11,680,61831,973,7945,242,707
37,216,501

Half Year June 30, 2017 11
CONDENSED INTERIM PROFIT AND LOSS ACCOUNT (UN-AUDITED)FOR THE QUARTER AND HALF YEAR ENDED JUNE 30, 2017
Note June 30, June 30, June 30, June 30,
2017 2016 2017 2016
Mark-up / return / interest earned
Mark-up / return / interest expensed
Net mark-up / interest income
(Reversal of provision) / provision against
non-performing loans and advances - net 12.2
Provision for consumer and small enterprise
loans - general 12.3
Reversal against off balance sheet obligations
(Reversal of provision) / provision for diminution
in value of investments - net 11.4
Recoveries against written-off debts - net
Net mark-up / interest income after provisions
Non mark-up / interest incomeFee, commission and brokerage income
Dividend income
Income from dealing in foreign currencies
Gain on sale of securities - net
Unrealised gain / (loss) on revaluation of investments
classified as held for trading - net
Other income
Total non mark-up / interest income
Non mark-up / interest expensesAdministrative expenses
Other provisions - net
Other charges
Total non mark-up / interest expenses
Share of loss of associate 11.3.1
Extraordinary / unusual items
Profit before taxation
Taxation - Current
Taxation - Prior years
Taxation - Deferred
Profit after taxation
Basic earnings per share 16
Quarter ended
------------------------------- Rupees '000 -----------------------------
Half year ended
The annexed notes 1 to 22 form an integral part of this condensed interim financial information.
PRESIDENT & CEO CHIEF FINANCIAL OFFICER DIRECTOR DIRECTOR DIRECTOR
7,271,862 6,512,752 14,180,734 13,280,6053,774,833 3,596,571 7,170,683 7,219,2673,497,029 2,916,181 7,010,051 6,061,338
(287,618) 376,634 (509,924) 503,268
25,970 5,713 44,513 1,220- (4,285) - (4,086)
37,929 (2,610) (5,846) (8,865)(23,948) (25,660) (53,508) (50,664)
(247,667) 349,792 (524,765) 440,8733,744,696 2,566,389 7,534,816 5,620,465
719,432 767,988 1,382,749 1,342,27166,734 127,542 80,319 180,366
295,863 279,916 585,118 522,20365,364 1,396,033 1,030,616 2,110,773
5,427 (7,998) 3,342 6,19285,073 72,322 151,328 155,452
1,237,893 2,635,803 3,233,472 4,317,2574,982,589 5,202,192 10,768,288 9,937,722
3,021,076 2,876,213 5,808,043 5,466,770- 10,020 - 10,020
40,417 36,699 100,226 86,8703,061,493 2,922,932 5,908,269 5,563,6601,921,096 2,279,260 4,860,019 4,374,062
(9,346) (2,545) (17,954) (9,797)- - - -
1,911,750 2,276,715 4,842,065 4,364,265
692,176 752,057 1,716,055 1,597,875(367,134) (393,128) (330,599) (393,128)595,048 457,036 597,183 341,402920,090 815,965 1,982,639 1,546,149991,660 1,460,750 2,859,426 2,818,116
0.75 1.11 2.17 2.14
--------------------------------------- Rupees ---------------------------------------

Half Year June 30, 201712
CONDENSED INTERIM STATEMENT OF COMPREHENSIVE INCOME (UN-AUDITED)FOR THE QUARTER AND HALF YEAR ENDED JUNE 30, 2017
PRESIDENT & CEO CHIEF FINANCIAL OFFICER DIRECTOR DIRECTOR DIRECTOR
June 30, June 30, June 30, June 30,
2017 2016 2017 2016
Profit after taxation for the period 991,660 1,460,750 2,859,426 2,818,116
Other comprehensive income:
Items that will not be reclassified to profit and loss account - - - -
Comprehensive income transferred to equity 991,660 1,460,750 2,859,426 2,818,116
Items that may be reclassified subsequently to
profit and loss account
Components of comprehensive income not reflected in equity
- Net change in value of available for sale securities (126,129) (917,405) (905,868) (781,931)
- Deferred tax asset on change in value of
available for sale securities 44,145 319,093 317,053 273,676
(81,984) (598,312) (588,815) (508,255)
Total comprehensive income 909,676 862,438 2,270,611 2,309,861
Quarter ended Half year ended
--------------------------------------- Rupees '000 ---------------------------------------

Half Year June 30, 2017 13
CONDENSED INTERIM STATEMENT OF CHANGES IN EQUITY FOR THE HALF YEAR ENDED JUNE 30, 2017
The annexed notes 1 to 22 form an integral part of this condensed interim financial information.
PRESIDENT & CEO CHIEF FINANCIAL OFFICER DIRECTOR DIRECTOR DIRECTOR
Balance as at January 1, 2016 (audited) 11,997,601 - 10,131 1,006,607 23,952 5,382,071 6,422,761 7,638,330 26,058,692
Total comprehensive income for the period fromJanuary 1, 2016 to June 30, 2016
Profit after taxation for the half year ended June 30, 2016 - - - - - - - 2,818,116 2,818,116Other comprehensive income for the period - - - - - - - - -Total comprehensive income for the period - - - - - - - 2,818,116 2,818,116
Amortisation of intangible assets - customer relationship - net of tax - - - (62,433) - - (62,433) - (62,433)
Transfer from surplus on revaluation of fixed assets - net of tax - - - - - - - 62,084 62,084
Transactions with owners directly recognised in equity
Final cash dividend - December 31, 2015 declaredsubsequent to the year end at Rs. 1 per share - - - - - - - (1,199,760) (1,199,760)
Balance as at June 30, 2016 (un-audited) 11,997,601 - 10,131 944,174 23,952 5,382,071 6,360,328 9,318,770 27,676,699
Total comprehensive income for the period from July 1, 2016to December 31, 2016
Profit after taxation for the half year ended December 31, 2016 - - - - - - - 1,483,656 1,483,656Other comprehensive income for the period - - - - - - - 16,719 16,719Total comprehensive income for the period - - - - - - - 1,500,375 1,500,375
Amortisation of intangible assets - customer relationship - net of tax - - - (62,434) - - (62,434) - (62,434)
Transfer to statutory reserve - - - - - 860,354 860,354 (860,354) -
Transfer from surplus on revaluation of fixed assets - net of tax - - - - - - - 27,079 27,079
Balance as at December 31, 2016 (audited) 11,997,601 - 10,131 881,740 23,952 6,242,425 7,158,248 9,985,870 29,141,719
Profit after taxation for the half year ended June 30, 2017 - - - - - - - 2,859,426 2,859,426Other comprehensive income for the period - - - - - - - - -Total comprehensive income for the period - - - - - - - 2,859,426 2,859,426
Amortisation of intangible assets - customer relationship - net of tax - - - (62,433) - - (62,433) - (62,433)
Transfer from surplus on revaluation of fixed assets - net of tax - - - - - - - 35,082 35,082
Transactions with owners recognised directly in equity- Transfer to reserve for issue of bonus shares - 1,199,760 - - - - 1,199,760 (1,199,760) -- Bonus shares issued 1,199,760 (1,199,760) (1,199,760) - -
1,199,760 - - - - - - (1,199,760) -
Balance as at June 30, 2017 (un-audited) 13,197,361 - 10,131 819,307 23,952 6,242,425 7,095,815 11,680,618 31,973,794
Non-distributable
capital reserve
(NCR) - gain
on bargain purchase
Reserve
arising on
amalgama-
tion
------------------------------------------------------------------------------ Rupees '000 ---------------------------------------------------------------------------------------
ParticularsShare
capital
Reserves
Unappro-
priated
profit
Total
Capital
Statutory
reserveSub Total
Reserve
for issue
of bonus
shares
Share
premium
note 3.7

Half Year June 30, 201714
CONDENSED INTERIM CASH FLOW STATEMENT (UN-AUDITED)FOR THE HALF YEAR ENDED JUNE 30, 2017
June 30, June 30,
2017 2016
CASH FLOWS FROM OPERATING ACTIVITIES
Profit before taxation 4,364,265
Less: Dividend income (180,366)
4,183,899
Adjustments for non-cash and other items:
Depreciation 334,401
Amortisation 106,852
Depriciation on non-banking assets -
Workers' Welfare Fund 93,171
(Reversal of provision) / provision against non-performing loans and advances - net 503,268
Provision for consumer and small enterprise loans - general 1,220
Reversal of provision for diminution in value of investments - net (8,865)
Charge of other provisions - net 10,020
Reversal of provision against off balance sheet obligations (4,086)
Unrealised gain on revaluation of investments classified as held for trading (6,192)
Net profit on disposal of property and equipment (53,490)
Charge for defined benefit plan 44,702
Amortisation of prepaid employee benefits 19,118
Recoveries against written-off debts (50,664)
Share of loss of associate 9,797
999,252
5,183,151
(Increase) / decrease in operating assets
Lendings to financial institutions (146,981)
Held for trading securities (4,884,110)
Advances (14,659,188)
Other assets (950,838)
(20,641,117)
Increase / (decrease) in operating liabilities
Bills payable 859,653
Borrowings 522,499
Deposits and other accounts 22,952,338
Other liabilities 543,928
24,878,418
9,420,452
Income tax paid (243,587)
Net cash (used in) / generated from operating activities 9,176,865
CASH FLOWS FROM INVESTING ACTIVITIES
Net divestment / (investment) in available for sale securities (3,386,129)
Net investment in held to maturity securities (2,636,667)
Dividend income received 99,748
Investment in operating fixed assets (330,001)
Proceeds realised on disposal of operating fixed assets 537,450
Net cash generated from / (used in) investing activities (5,715,599)
CASH FLOWS FROM FINANCING ACTIVITIES
Payments of sub-ordinated loan (748,500)
Dividends paid (1,190,733)
Net cash used in financing activities (1,939,233)
Increase in cash and cash equivalents 1,522,033
Cash and cash equivalents at the beginning of the period 26,335,872
Cash and cash equivalents at the end of the period 27,857,905
-----------------------Rupees '000------------------------
The annexed notes 1 to 22 form an integral part of this condensed interim financial information.
PRESIDENT & CEO CHIEF FINANCIAL OFFICER DIRECTOR DIRECTOR DIRECTOR
4,842,065(80,319)
4,761,746
388,46890,635
6,791100,061
(509,924)44,513(5,846)
--
(3,342)(11,142)
57,307
6,977(53,508)
17,954
128,944
4,890,690
401,697(37,281,999)
(8,481,241)(202,141)
(45,563,684)
1,400,43717,568,05014,192,987
(2,478)33,158,996(7,513,998)(1,984,064)(9,498,062)
13,480,123(2,135,679)
38,179(614,953)
12,15910,779,829
(748,500)(183)
(748,683)
533,08437,855,935
38,389,019

Half Year June 30, 2017 15
NOTES TO AND FORMING PART OF THE CONDENSED INTERIM FINANCIAL INFORMATION (UN-AUDITED)
1 STATUS AND NATURE OF BUSINESS
1.1 Faysal Bank Limited (the Bank) was incorporated in Pakistan on October 3, 1994 as a public limited company under the provisions of the Companies Ordinance, 1984. Its shares are listed on the Pakistan Stock Exchange Limited. The Bank is mainly engaged in Corporate, Commercial and Consumer banking activities. The Bank has a network of 365 branches (December 31, 2016: 355); including 157 Islamic banking branches (December 31, 2016: 146) and 1 Islamic sub-branch (December 31, 2016: 1) in Pakistan.
The Registered Office of the Bank is located at Faysal House, ST-02, Shahra-e-Faisal, Karachi.
IB Bank B.S.C (closed)- a wholly owned subsidiary of Ithmaar Holding Company B.S.C, is the parent company of the Bank, holding directly and indirectly 66.78% (December 31, 2016: 66.78%) of the shareholding of the Bank. Dar Al-Maal Al-Islami Trust (DMIT), (ultimate parent of the Bank) is the holding company of Ithmaar Holding Company B.S.C.
1.2 Based on the financial statements of the Bank for the year ended December 31, 2016, the Pakistan Credit Rating Agency Limited (PACRA) and JCR-VIS Credit Rating Company Limited have determined the Bank's long-term rating as 'AA' (December 31, 2015: 'AA') and the short term rating as 'A1+' (December 31, 2015: 'A1+').
2 BASIS OF PRESENTATION
2.1 In accordance with the directives of the Federal Government regarding the shifting of the banking system to Islamic modes, the State Bank of Pakistan (SBP) has issued various circulars from time to time. Permissible forms of trade related modes of financing include purchase of goods by banks from their customers and immediate resale to them at appropriate mark-up in price on deferred payment basis. The purchases and sales arising under these arrangements are not reflected in this condensed interim financial information as such but are restricted to the amount of facility actually utilised and the appropriate portion of mark-up thereon.
2.2 The results of the Islamic banking branches have been consolidated in this condensed interim financial information for reporting purposes only. Inter branch transactions and balances have been eliminated. In accordance with the directives issued by the SBP, the key financial figures of Islamic banking branches are disclosed in note 20 to this condensed interim financial information.
3 STATEMENT OF COMPLIANCE
3.1 This condensed interim financial information has been prepared in accordance with the approved accounting standards as applicable in Pakistan. The approved accounting standards comprise of such International Financial Reporting Standards (IFRSs) issued by the International Accounting Standards Board (IASB) and Islamic Financial Accounting Standards (IFASs) issued by the Institute of Chartered Accountants of Pakistan, as are notified under the Companies Ordinance, 1984, the requirements of the Companies Ordinance, 1984, the requirements of the Banking Companies Ordinance, 1962, or the directives issued by the Securities & Exchange Commission of Pakistan (SECP) and the SBP. Wherever the requirements of the Companies Ordinance, 1984, the Banking Companies Ordinance, 1962, the IFASs notified under the Companies Ordinance, 1984 or the directives issued by the SECP and the SBP differ with the requirements of IFRSs, the requirements of the Companies Ordinance, 1984, the Banking Companies Ordinance, 1962, IFASs notified under the Companies Ordinance, 1984 or the requirements of the said directives issued by the SECP and the SBP prevail. The Companies Ordinance, 1984 has been repealed after the enactment of the Companies Act, 2017. However, as allowed by the SECP vide its circular no 17 dated July 20, 2017, this condensed interim financial information has been prepared in accordance with the provisions of the repealed Companies Ordinance, 1984.
3.2 The SBP has deferred the applicability of International Accounting Standard (IAS) 39, 'Financial Instruments: Recognition and Measurement' and International Accounting Standard (IAS) 40, 'Investment Property' for Banking Companies through BSD Circular Letter No. 10 dated August 26, 2002 till further instructions. Further, the SECP has also deferred the applicability of International Financial Reporting Standard (IFRS) 7, 'Financial Instruments: Disclosures' through its S.R.O. 633(I)/2014 dated July 10, 2014. Accordingly, the requirements of these standards have not been considered in the preparation of this condensed interim financial information. However, investments have been classified and valued in accordance with the requirements prescribed by the SBP through various circulars.
3.3 IFRS 8, 'Operating Segments' is effective for the Bank's accounting period beginning on or after January 1, 2009. All banking companies in Pakistan are required to prepare their condensed interim financial information in line with the format prescribed by the SBP. The management of the Bank believes that as the SBP has defined the segment categorisation in the above mentioned format, the SBP's requirements prevail over the requirements specified in IFRS 8. Accordingly, segment information disclosed in this condensed interim financial information is based on the requirements laid down by the SBP.
FOR THE HALF YEAR ENDED JUNE 30, 2017

Half Year June 30, 201716
NOTES TO AND FORMING PART OF THE CONDENSED INTERIM FINANCIAL INFORMATION (UN-AUDITED)
3.4 The SBP vide its BSD Circular No. 07 dated April 20, 2010 has clarified that for the purpose of preparation of financial statements in accordance with International Accounting Standard - 1 (Revised), 'Presentation of Financial Statements', two statement approach shall be adopted i.e. separate 'Profit and Loss Account' and 'Statement of Comprehensive Income' shall be presented, and Balance Sheet shall be renamed as 'Statement of Financial Position'. Furthermore, only the surplus / (deficit) on revaluation of available for sale (AFS) securities, may be included in the 'Statement of Comprehensive Income'. However, it should continue to be shown separately in the statement of financial position below equity. Accordingly, the above requirements have been adopted in the preparation of this condensed interim financial information.
3.5 The SECP has directed that the requirements of IFRS 10, 'Consolidated Financial Statements' are not applicable in case of investments by Companies in mutual funds established under Trust Deed structure. Accordingly, implications of IFRS 10 in respect of mutual funds are not considered in the preparation of this condensed interim financial information.
3.6 The disclosures made in this condensed interim financial information have been limited based on the format prescribed by the State Bank of Pakistan through BSD Circular Letter No. 2 dated May 12, 2004 and the requirements of International Accounting Standard 34, "Interim Financial Reporting". They do not include all of the information required for the full annual financial statements and this condensed interim financial information should be read in conjunction with the financial statements of the Bank for the year ended December 31, 2016.
3.7 As per the directive of the SBP through its letter BPRD (R&P-02)/625-99/2011/3744 dated March 28, 2011, gain arising on bargain purchase of Pakistan operations of Royal Bank of Scotland (ex-RBS Pakistan) was credited directly into equity as Non-Distributable Capital Reserve (NCR). The SBP allowed the Bank to adjust the amortisation of intangible assets against the portion of reserve which arose on account of such assets. Accordingly, during the period ended June 30, 2017 the Bank has adjusted amortisation of intangible assets amounting to Rs. 62.433 million (net of tax) from the Non-distributable Capital Reserve.
3.8 The SBP vide its BPRD Circular No. 04 dated February 25, 2015 has clarified that the reporting requirements of IFAS-3 for Institutions offering Islamic Financial Services (IIFS) relating to annual, half yearly and quarterly financial statements would be notified by SBP through issuance of specific instructions and uniform disclosure formats in consultation with (IIFS). These reporting requirements have not been ratified to date. Accordingly, the disclosure requirements under IFAS 3 have not been considered in this condensed interim financial information.
4 BASIS OF MEASUREMENT
This condensed interim financial information has been prepared under the historical cost convention, except that certain fixed assets and non-banking assets acquired in satisfaction of claims are carried at revalued amounts and certain investments and derivative contracts have been marked to market and are carried at fair value. In addition, obligation in respect of staff retirement benefit is carried at present value.
5 FUNCTIONAL AND PRESENTATION CURRENCY
Items included in this condensed interim financial information are measured using the currency of the primary economic environment in which the Bank operates. This condensed interim financial information is presented in Pakistani Rupees, which is the Bank's functional and presentation currency.
6 SUMMARY OF SIGNIFICANT ACCOUNTING POLICIES
The accounting policies applied in the preparation of this condensed interim financial information are the same as those applied in the preparation of the annual financial statements of the Bank for the year ended December 31, 2016.
7 CRITICAL ACCOUNTING ESTIMATES AND JUDGMENTS
The basis and the methods used for critical accounting estimates and judgments adopted in this condensed interim financial information are the same as those applied in the preparation of the annual financial statements of the Bank for the year ended December 31, 2016.
8 FINANCIAL RISK MANAGEMENT
The Bank's Financial Risk Management objectives and policies are consistent with those disclosed in the annual financial statements for the year ended December 31, 2016.
FOR THE HALF YEAR ENDED JUNE 30, 2017

Half Year June 30, 2017 17
NOTES TO AND FORMING PART OF THE CONDENSED INTERIM FINANCIAL INFORMATION (UN-AUDITED)FOR THE HALF YEAR ENDED JUNE 30, 2017
Note
9 BALANCES WITH OTHER BANKS
In Pakistan
- Current accounts 1,369,898 699,488
Outside Pakistan
- Current accounts 649,213 439,887
2,019,111 1,139,375
10 LENDINGS TO FINANCIAL INSTITUTIONS
Call money lending 300,000 -
Repurchase agreement lendings 221,647 5,000,000
Bai Muajjal with State Bank of Pakistan 10.1 4,076,656 -
4,598,303 5,000,000
10.1 Bai Muajjal placements - gross 4,188,664 -
Less: deferred income (105,887) -
Less: profit receivable shown in other assets (6,121) -
Bai Muajjal placements - net 4,076,656 -
11 INVESTMENTS
11.1 Investments by type Note
Held for trading securities
Market Treasury Bills 34,884,957 - 34,884,957 533,530 - 533,530
Pakistan Investment Bonds 4,100,610 - 4,100,610 1,170,038 - 1,170,038
38,985,567 - 38,985,567 1,703,568 - 1,703,568
Available for sale securities
Market Treasury Bills 33,631,750 53,634,348 87,266,098 59,502,461 29,646,237 89,148,698
Pakistan Investment Bonds 29,732,126 - 29,732,126 41,351,395 2,074,936 43,426,331
Ijara Sukuk Bonds 6,313,130 - 6,313,130 4,474,967 - 4,474,967
Sukuk Bonds 5,128,395 - 5,128,395 2,900,000 - 2,900,000
Units of open end mutual funds
- Faysal Balanced Growth Fund * 37,480 - 37,480 37,480 - 37,480
- Faysal Income Growth Fund * 257,544 - 257,544 257,544 - 257,544
- Faysal Savings Growth Fund * 680,606 - 680,606 680,606 - 680,606
- Faysal Islamic Savings Growth Fund * 189,432 - 189,432 189,432 - 189,432
- Faysal Financial Sector Opportunity Fund * 15,000 - 15,000 - - -
Fully paid up ordinary shares / modaraba certificates /
certificates of closed end mutual funds 11.2 2,460,083 - 2,460,083 4,370,242 - 4,370,242
Fully paid up preference shares 22,490 - 22,490 22,490 - 22,490
Term finance certificates 687,432 - 687,432 762,149 - 762,149
79,155,468 53,634,348 132,789,816 114,548,766 31,721,173 146,269,939
Held to maturity securities
Pakistan Investment Bonds 9,991,406 - 9,991,406 9,931,757 - 9,931,757
Term finance certificates 2,393,303 - 2,393,303 2,455,213 - 2,455,213
Sukuk Bonds 13,999,557 - 13,999,557 11,861,617 - 11,861,617
26,384,266 - 26,384,266 24,248,587 - 24,248,587
Associate *
Fully paid up ordinary shares of
Faysal Asset Management Limited 11.3 28,078 - 28,078 46,032 - 46,032
Investments at cost 144,553,379 53,634,348 198,187,727 140,546,953 31,721,173 172,268,126
Less: Provision for diminution in the value of investments 11.4 &12.2.1 (3,259,987) - (3,259,987) (3,265,833) - (3,265,833)
Investments (net of provisions) 141,293,392 53,634,348 194,927,740 137,281,120 31,721,173 169,002,293
Surplus on revaluation of investments
classified as held for trading - net 3,803 - 3,803 461 - 461
Surplus / (deficit) on revaluation of investments
classified as available for sale - net 301,818 (303) 301,515 1,227,520 (20,137) 1,207,383
Total investments - net 141,599,013 53,634,045 195,233,058 138,509,101 31,701,036 170,210,137
* related parties
---------------------------------------------- Rupees '000 ----------------------------------------------------
TotalHeld by
Bank
Given as
collateralTotal
June 30, 2017 December 31, 2016
Held by
Bank
Given as
collateral
AuditedUn-audited
Un-audited Audited
June 30, December 31,
20162017----------------------Rupees '000--------------------
11.2 These include an investment of the Bank in unlisted shares of DHA Cogen Limited (DHA) (a related party of the Bank)
representing 19.1% (December 31, 2016: 19.1%) equity holding of DHA.

Half Year June 30, 201718
NOTES TO AND FORMING PART OF THE CONDENSED INTERIM FINANCIAL INFORMATION (UN-AUDITED)FOR THE HALF YEAR ENDED JUNE 30, 2017
11.3 Investment of the Bank in Faysal Asset Management Limited (FAML) has been accounted for under the equity
method of accounting as per the requirement of IAS 28 - Investment in associates and joint ventures. The Bank's
share of post acquisition profit or loss is recognised using the latest available un-audited financial statements of
FAML which relate to the year ended June 30, 2017 with a corresponding adjustment to the carrying amount of
investment. The details of the Bank's investment, post acquisition changes and certain other details relating to FAML
are as under:
11.3.1 Faysal Asset Management Limited -percentage holding 30% (December 31, 2016: 30%)
At January 1 46,032 68,082
Post acquisition changes during the period / year- recognised in the profit and loss account (17,954) (22,050)
Closing Balance 28,078 46,032
Cost of investment 45,000 45,000
11.3.2 Summary of the financial information of the associate
Revenue for the period / year 63,035 139,032
Net Loss for the period / year (59,845) (73,499)
Assets 131,642 166,896
Liabilities 38,046 13,456
Net Assets 93,596 153,440
Percentage (%) holding of the Bank 30% 30%
Share of net assets of the Bank 28,078 46,032
11.4 Particulars of provision for diminution in the value of investments
Opening balance 3,265,833 3,282,763
Charge for the period / year 51,482 75,478Reversals during the period / year (57,328) (92,408)
(5,846) (16,930)
Closing balance 3,259,987 3,265,833
12 ADVANCES
Loans, cash credits, running finances, etc. – in Pakistan 186,779,630 180,518,663Net investment in finance lease – in Pakistan 9,867,630 10,431,613
196,647,260 190,950,276Bills discounted and purchased (excluding government treasury bills)
- Payable in Pakistan 4,892,073 5,289,466 - Payable outside Pakistan 954,497 909,279
5,846,570 6,198,745
Islamic financing and related assets 35,651,299 32,588,297
Margin financing / reverse repo transactions 88,200 88,200Gross advances 238,233,329 229,825,518
Provision against non-performing advances 12.1 & 12.2 (23,915,616) (24,530,264)Provision against consumer and small enterprise loans - general 12.3 (508,770) (464,257)
(24,424,386) (24,994,521)
Advances - net of provision 213,808,943 204,830,997
Un-audited AuditedJune 30, December 31,
20162017-------------Rupees '000---------------
Note

Half Year June 30, 2017 19
NOTES TO AND FORMING PART OF THE CONDENSED INTERIM FINANCIAL INFORMATION (UN-AUDITED)FOR THE HALF YEAR ENDED JUNE 30, 2017
12.1 Advances includes Rs. 27,888 million (December 31, 2016: Rs. 30,036 million) which have been placed under non-
performing status as detailed below:
Domestic Overseas Total Domestic Overseas Total Domestic Overseas Total
Category of classification
Other Assets Especially
Mentioned (OAEM) 12.1.1 491,821 - 491,821 1,938 - 1,938 1,938 - 1,938
Substandard 829,678 - 829,678 118,805 - 118,805 118,805 - 118,805
Doubtful 1,467,765 - 1,467,765 528,876 - 528,876 528,876 - 528,876
Loss 25,099,028 - 25,099,028 23,265,997 - 23,265,997 23,265,997 - 23,265,997
27,888,292 - 27,888,292 23,915,616 - 23,915,616 23,915,616 - 23,915,616
Domestic Overseas Total Domestic Overseas Total Domestic Overseas Total
Category of classification
Other Assets Especially
Mentioned (OAEM) 12.1.1 351,337 - 351,337 - - - - - -
Substandard 2,201,772 - 2,201,772 403,413 - 403,413 403,413 - 403,413
Doubtful 1,822,574 - 1,822,574 552,258 - 552,258 552,258 - 552,258
Loss 25,660,377 - 25,660,377 23,574,593 - 23,574,593 23,574,593 - 23,574,593
30,036,060 - 30,036,060 24,530,264 - 24,530,264 24,530,264 - 24,530,264
12.2 Particulars of provision against non-performing advances
Opening balance 24,530,264 24,101,547
Recognised in the profit & loss account
Charge for the period / year 567,148 1,991,115
Reversals during the period / year (1,077,072) (1,365,302)
Net charge (509,924) 625,813
Transfer of provision 22,214 -
Amounts written off (126,938) (197,096)
Closing balance 23,915,616 24,530,264
12.3 Particulars of provision against consumer loans and
small enterprise - general
Opening balance 464,257 432,672
Charge during the period / year 44,513 31,585
Closing balance 508,770 464,257
------------------------------------------------------------- Rupees '000 -------------------------------------------------------------
Provision held
Classified Advances Provision requiredParticulars Note
Provision held
Particulars Note
December 31, 2016 (Audited)
June 30, 2017 (Un-audited)
Classified Advances Provision required
------------------------------------------------------------- Rupees '000 -------------------------------------------------------------
Un-audited Audited
June 30, December 31,
20162017----------------------Rupees '000--------------------
Un-audited Audited
June 30, December 31,
20162017----------------------Rupees '000--------------------
12.1.1 This represents non-performing portfolio of agricultural, housing and small enterprise financing classified as OAEM
as per the requirements of the Prudential Regulations for agricultural, housing and small enterprise financing issued
by the SBP.
12.2.1 As allowed by the SBP the Bank has availed benefit of Forced Sale Value (FSV) of collaterals held as security of Rs
2,025.323 million (December 31, 2016: Rs 2,193.458 million) relating to advances and Rs 5.768 million (December
31, 2016: Rs 2.884 million) relating to investments while determining the provisioning requirement against non-
performing financing (including investments) as at June 30, 2017. The additional profit arising from availing the FSV
benefit - net of tax as at June 30, 2017 which is not available for distribution as either cash or stock dividend to
shareholders and bonus to employees amounted to approximately Rs 1,320.209 million (December 31, 2016:
Rs 1,427.622 million).

Half Year June 30, 201720
NOTES TO AND FORMING PART OF THE CONDENSED INTERIM FINANCIAL INFORMATION (UN-AUDITED)FOR THE HALF YEAR ENDED JUNE 30, 2017
12.3.1 The Bank maintains a general provision against consumer financing in accordance with the applicable requirements
of the Prudential Regulations for Consumer Financing issued by the SBP. The prudential regulations specify that
general provision should be maintained at varying percentages based on the non-performing loan ratio present in the
portfolio ranging from 1% to 2.5% for secured and 4% to 7% for unsecured portfolio.
The Bank also maintains general provision in accordance with the applicable requirements of the Prudential
Regulations for Housing Finance and Small and Medium Enterprise Financing issued by the SBP. The provision
ranges between the 1.0% to 1.5% for secured and 2% for unsecured.
12.4 Although the Bank has made provision against its non-performing portfolio as per the category of classification of the
loans, however, the Bank still holds enforceable collateral against certain non-performing loans in the event of
recovery through litigation. These securities comprise of charge against various tangible assets of the borrower
including land, building and machinery, stock in trade, etc.
13
502,063 513,696
10,185,039 9,991,126
1,463,562 1,607,059
12,150,664 12,111,881
Un-auditedHalf year ended
June 30, June 30,
2017 2016
13.1 Additions to operating fixed assets - cost
Leasehold property and improvements 208,176 63,499
Office furniture, fixtures, equipment and computers 370,779 415,919
Vehicles 4,443 5,698
Capital work-in-progress 614,951 330,460
Additions to Intangibles
Software 43,188 -
13.2 Disposals of operating fixed assets - cost
Freehold land - 455,000
Leasehold property and improvements 16,212 -
Office furniture, fixtures, equipment and computers 126,169 12,343
Vehicles 7,006 51,695
Capital work-in-progress
Tangible fixed assets
Intangible assets
OPERATING FIXED ASSETS
Un-audited Audited
June 30, December 31,
20162017----------------------Rupees '000--------------------
----------------------Rupees '000--------------------

Half Year June 30, 2017 21
NOTES TO AND FORMING PART OF THE CONDENSED INTERIM FINANCIAL INFORMATION (UN-AUDITED)FOR THE HALF YEAR ENDED JUNE 30, 2017
15 CONTINGENCIES AND COMMITMENTS
15.1 Direct credit substitutes
Contingent liability in respect of guarantees favouring:
- Banking companies and other financial institutions 924,381 483,766
Acceptances
- Others 5,741,329 7,558,310
15.2 Transaction-related contingent liabilities
Contingent liability in respect of performance bonds, bid bonds,
shipping guarantees and standby letters of credit etc. favouring:
- Government 11,832,256 10,688,334
- Banking companies and other financial institutions 76,485 225,272
- Others 2,312,700 2,369,202
14,221,441 13,282,808
15.3 Trade-related contingent liabilities
Letters of credit
- Government 3,676,629 8,078,616
- Others 20,450,322 9,057,727
24,126,951 17,136,343
15.4 Other contingencies
i) Indemnity issued favouring the High Court in one of the cases 457,543 457,543
There are certain claims against the Bank not acknowledged as debt amounting to Rs 34,117 million (December 31,
2016: Rs 34,086 million). These mainly represent counter claims filed by the borrowers for restricting the Bank from
disposal of assets (such as mortgaged / pledged assets kept as security), cases where the Bank was proforma
defendant for defending its interest in the underlying collateral kept by it at the time of financing, certain cases filed by
ex- employees of the Bank for damages sustained by them consequent to the termination from the Bank's
employment and cases for damages towards opportunity losses sufferred by customers due to non disbursements of
running finance facility as per the agreed terms. The above also includes an amount of Rs 25,299 million in respect of
a suit filed against the Bank for declaration, recovery of monies, release of securities, rendition of account and
damages.
Based on legal advice and / or internal assessments, management is confident that the matters will be decided in the
Bank's favour and the possibility of any outcome against the Bank is remote and accordingly no provision has been
made in this condensed interim financial information.
(ii) Income tax assessments of the Bank have been finalised upto the tax year 2016 (accounting year 2015).
14 DEPOSITS AND OTHER ACCOUNTS
CustomersFixed deposits 95,955,806 101,774,589
Savings deposits 112,604,845 107,940,436
Current accounts – Remunerative 4,184,324 3,076,212
Current accounts – Non-remunerative 119,606,487 108,820,931
Margin accounts 2,974,959 2,970,671
335,326,421 324,582,839
Financial institutionsRemunerative deposits 18,823,983 15,537,363
Non-remunerative deposits 348,987 186,202
19,172,970 15,723,565
354,499,391 340,306,404
Un-audited Audited
June 30, December 31,
20162017----------------------Rupees '000--------------------

Half Year June 30, 201722
NOTES TO AND FORMING PART OF THE CONDENSED INTERIM FINANCIAL INFORMATION (UN-AUDITED)FOR THE HALF YEAR ENDED JUNE 30, 2017
15.5 Commitments to extend credits
The Bank makes commitments to extend credit (including to related parties) in the normal course of its business but
these being revocable commitments do not attract any significant penalty or expense if the facility is unilaterally
withdrawn except for Rs 34,897 million (December 31, 2016: Rs 22,799 million) which are irrevocable in nature.
15.6 Commitments in respect of forward exchange contracts
Purchase
- Customers 594,675 627,720
- Banks 35,915,731 25,971,518
36,510,406 26,599,238
Sale
- Customers 56,955 87,256
- Banks 17,937,585 9,325,891
17,994,540 9,413,147
15.7 Commitments for the acquisition of operating fixed assets 129,637 156,240
15.8 Commitments in respect of repo transactions
Repurchase 53,683,890 31,743,703
Resale 539,378 5,312,485
15.9 Others
Cross currency swaps (notional principal) 1,928,374 877,690
16 EARNINGS PER SHARE
June 30, June 30, June 30, June 30,
2017 2016 2017 2016
Profit after tax for the period 1,460,750 2,818,116
Weighted average number of ordinary shares 1,319,736 1,319,736 1,319,736 1,319,736
Earnings per share - basic 1.11 2.14
Quarter ended
------------------------------------ Rupees '000 ------------------------------------
------------------------ Number of shares in thousands --------------------
--------------------------------------- Rupees ---------------------------------------
Half year ended----------------------------------- Un-audited -------------------------------------
Un-audited Audited
June 30, December 31,
20162017----------------------Rupees '000--------------------
16.1 Diluted earnings per share has not been presented as the Bank does not have any convertible instruments in issue at
June 30, 2017 and June 30, 2016 which would have any effect on the earning per share if the option to convert is
exercised.
17 SEGMENT DETAILS WITH RESPECT TO BUSINESS ACTIVITIES
Primary segment information
The Bank is organised into four major business segments:
- Corporate Finance
- Trading and Sales
- Retail Banking
- Corporate & Commercial Banking
991,660
0.75
2,859,426
2.17

Half Year June 30, 2017 23
NOTES TO AND FORMING PART OF THE CONDENSED INTERIM FINANCIAL INFORMATION (UN-AUDITED)FOR THE HALF YEAR ENDED JUNE 30, 2017
All assets, liabilities, off balance sheet items and items of income and expense are distributed in primary segments in
accordance with the core functions performed by the business groups.
December 31, 2016 - Audited
Total income *** 404,743 7,317,911 22,217,289 3,006,711 32,946,654
Total expenses (168,689) (4,577,603) (21,330,614) (2,567,976) (28,644,882)
Net income 236,054 2,740,308 886,675 438,735 4,301,772
Segment assets (Gross) - 182,933,264 87,843,586 202,234,019 473,010,869
Segment non performing loans - - 5,721,586 24,314,474 30,036,060
Segment provision required against loans ** - - (3,702,010) (21,292,511) (24,994,521)
Segment liabilities - (38,102,146) (334,741,785) (36,612,405) (409,456,336)
Segment return on assets (ROA) (%) * - 1.58% 1.10% 0.26%
Segment cost of funds (%) * - 4.77% 3.75% 5.55%
* These percentages have been computed based on average balances.** Includes general provision
*** Net of share of loss of associate
Corporate
Finance
Trading &
Sales
Retail
Banking
Corporate &
Commercial
Banking
Total
------------------------------------------------ Rupees '000 ------------------------------------------------
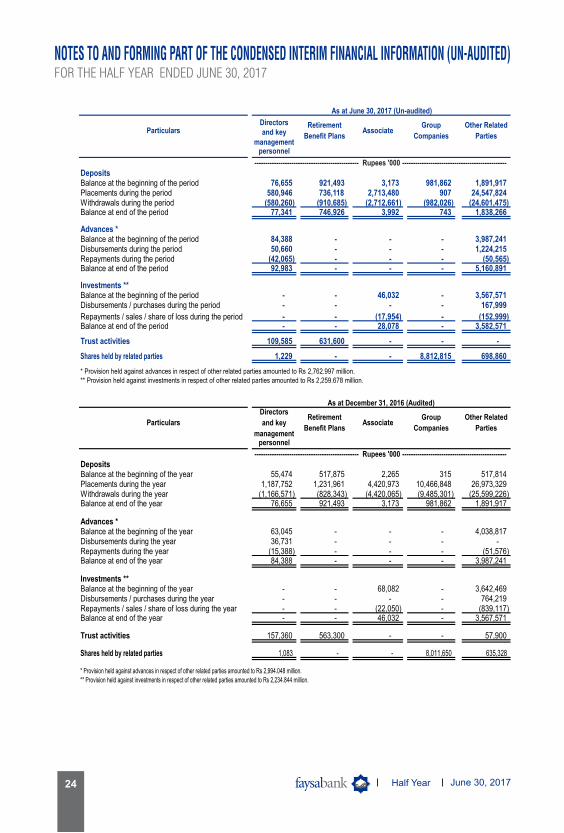
18 RELATED PARTY TRANSACTIONS
The Bank has related party relationship with its holding company, associated undertaking, associated company,
group companies, retirement benefit plans, directors, key management personnel and entities over which the
directors or key management personnel are able to exercise significant influence.
Banking transactions with the related parties are executed substantially on the same terms, except transactions with
directors and key management personnel that are as per their terms of employment, including mark-up rates and
collateral, as those prevailing at the time of comparable transactions with unrelated parties and do not involve more
than a normal risk.
Details of transaction with related parties during the period, other than those which have been disclosed elsewhere in
these condensed interim financial information are as follows:
June 30, 2017 - Un-audited
Total income *** 102,712 3,750,636 11,655,912 1,886,992 17,396,252
Total expenses (60,032) (2,409,182) (10,976,901) (1,090,711) (14,536,826)
Net income 42,680 1,341,454 679,011 796,281 2,859,426
Segment assets (Gross) - 198,362,514 95,176,918 212,975,145 506,514,577
Segment non performing loans - - 6,072,252 21,816,040 27,888,292
Segment provision required against loans ** - - (3,818,851) (20,605,535) (24,424,386)
Segment liabilities - (55,700,427) (354,538,423) (31,126,139) (441,364,989)
Segment return on assets (ROA) (%) * - 1.45% 1.83% 0.70%
Segment cost of funds (%) * - 4.53% 3.62% 5.92%
June 30, 2016 - Un-audited
Total income *** 337,606 5,299,979 10,591,244 1,359,236 17,588,065
Total expenses (135,139) (2,942,959) (10,233,629) (1,458,222) (14,769,949)
Net income 202,467 2,357,020 357,615 (98,986) 2,818,116
------------------------------------------------------------- Rupees '000 -------------------------------------------------------------
Corporate
Finance
Trading &
Sales
Retail
Banking
Corporate &
Commercial
Banking
Total
Half Year June 30, 201724
NOTES TO AND FORMING PART OF THE CONDENSED INTERIM FINANCIAL INFORMATION (UN-AUDITED)FOR THE HALF YEAR ENDED JUNE 30, 2017
DepositsBalance at the beginning of the period 76,655 921,493 3,173 981,862 1,891,917Placements during the period 580,946 736,118 2,713,480 907 24,547,824Withdrawals during the period (580,260) (910,685) (2,712,661) (982,026) (24,601,475)Balance at end of the period 77,341 746,926 3,992 743 1,838,266
Advances *Balance at the beginning of the period 84,388 - - - 3,987,241Disbursements during the period 50,660 - - - 1,224,215Repayments during the period (42,065) - - - (50,565)Balance at end of the period 92,983 - - - 5,160,891
Investments **Balance at the beginning of the period - - 46,032 - 3,567,571Disbursements / purchases during the period - - - - 167,999
Repayments / sales / share of loss during the period - - (17,954) - (152,999)Balance at end of the period - - 28,078 - 3,582,571
Trust activities 109,585 631,600 - - -
Shares held by related parties 1,229 - - 8,812,815 698,860
* Provision held against advances in respect of other related parties amounted to Rs 2,762.997 million.** Provision held against investments in respect of other related parties amounted to Rs 2,259.678 million.
------------------------------------------------ Rupees '000 ------------------------------------------------
Particulars
As at June 30, 2017 (Un-audited)
Directors and key
management
Other Related
Parties
Retirement
Benefit PlansAssociate
Group
Companies
DepositsBalance at the beginning of the year 55,474 517,875 2,265 315 517,814Placements during the year 1,187,752 1,231,961 4,420,973 10,466,848 26,973,329Withdrawals during the year (1,166,571) (828,343) (4,420,065) (9,485,301) (25,599,226)Balance at end of the year 76,655 921,493 3,173 981,862 1,891,917
Advances *Balance at the beginning of the year 63,045 - - - 4,038,817Disbursements during the year 36,731 - - - -Repayments during the year (15,388) - - - (51,576)Balance at end of the year 84,388 - - - 3,987,241
Investments **Balance at the beginning of the year - - 68,082 - 3,642,469Disbursements / purchases during the year - - - - 764,219Repayments / sales / share of loss during the year - - (22,050) - (839,117)Balance at end of the year - - 46,032 - 3,567,571
Trust activities 157,360 563,300 - - 57,900
Shares held by related parties 1,083 - - 8,011,650 635,328
* Provision held against advances in respect of other related parties amounted to Rs 2,994.048 million.** Provision held against investments in respect of other related parties amounted to Rs 2,234.844 million.
Group
Companies
Other Related
PartiesParticulars
Directors
and key
management
As at December 31, 2016 (Audited)
------------------------------------------------ Rupees '000 ------------------------------------------------
Retirement
Benefit PlansAssociate
personnel
personnel
Half Year June 30, 2017 25
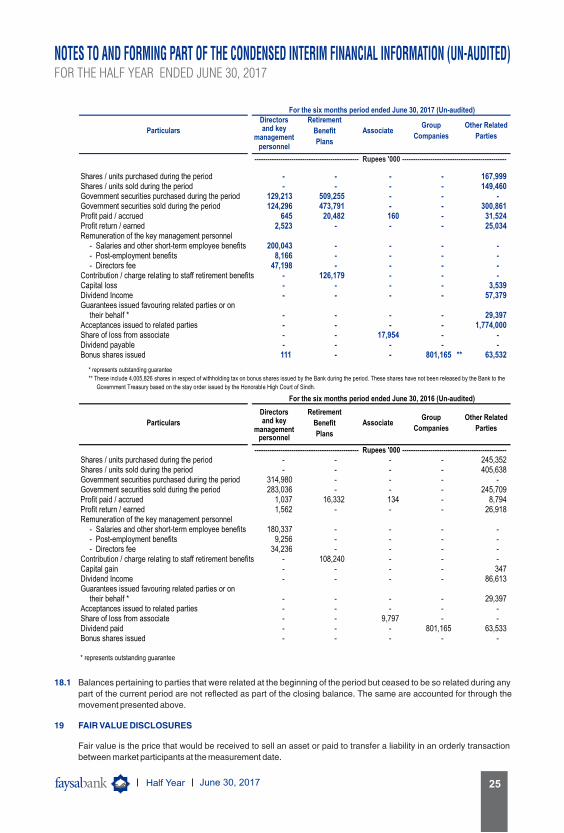
NOTES TO AND FORMING PART OF THE CONDENSED INTERIM FINANCIAL INFORMATION (UN-AUDITED)FOR THE HALF YEAR ENDED JUNE 30, 2017
Shares / units purchased during the period - - - - 167,999Shares / units sold during the period - - - - 149,460Government securities purchased during the period 129,213 509,255 - - -Government securities sold during the period 124,296 473,791 - - 300,861Profit paid / accrued 645 20,482 160 - 31,524Profit return / earned 2,523 - - - 25,034Remuneration of the key management personnel
- Salaries and other short-term employee benefits 200,043 - - - -- Post-employment benefits 8,166 - - - -- Directors fee 47,198 - - - -
Contribution / charge relating to staff retirement benefits - 126,179 - - -Capital loss - - - - 3,539Dividend Income - - - - 57,379Guarantees issued favouring related parties or on
their behalf * - - - - 29,397Acceptances issued to related parties - - - - 1,774,000Share of loss from associate - - 17,954 - -Dividend payable - - - - -Bonus shares issued 111 - - 801,165 ** 63,532
Shares / units purchased during the period - - - - 245,352Shares / units sold during the period - - - - 405,638Government securities purchased during the period 314,980 - - - -Government securities sold during the period 283,036 - - - 245,709Profit paid / accrued 1,037 16,332 134 - 8,794Profit return / earned 1,562 - - - 26,918Remuneration of the key management personnel
- Salaries and other short-term employee benefits 180,337 - - - -- Post-employment benefits 9,256 - - - -- Directors fee 34,236 - - - -
Contribution / charge relating to staff retirement benefits - 108,240 - - -Capital gain - - - - 347Dividend Income - - - - 86,613Guarantees issued favouring related parties or on
their behalf * - - - - 29,397Acceptances issued to related parties - - - - -Share of loss from associate - - 9,797 - -Dividend paid - - - 801,165 63,533Bonus shares issued - - - - -
* represents outstanding guarantee
------------------------------------------------ Rupees '000 ------------------------------------------------
Group
Companies
Other Related
Parties
For the six months period ended June 30, 2017 (Un-audited)
Particulars
For the six months period ended June 30, 2016 (Un-audited)
Retirement
Benefit
Plans
Associate
AssociateGroup
Companies
Other Related
Parties
Retirement
Benefit
Plans
Particulars
------------------------------------------------ Rupees '000 ------------------------------------------------
* represents outstanding guarantee
** These include 4,005,826 shares in respect of withholding tax on bonus shares issued by the Bank during the period. These shares have not been released by the Bank to the
Government Treasury based on the stay order issued by the Honorable High Court of Sindh.
18.1 Balances pertaining to parties that were related at the beginning of the period but ceased to be so related during any
part of the current period are not reflected as part of the closing balance. The same are accounted for through the
movement presented above.
19 FAIR VALUE DISCLOSURES
Fair value is the price that would be received to sell an asset or paid to transfer a liability in an orderly transaction
between market participants at the measurement date.
Directors and key
management personnel
Directors and key
management personnel

Half Year June 30, 201726
NOTES TO AND FORMING PART OF THE CONDENSED INTERIM FINANCIAL INFORMATION (UN-AUDITED)FOR THE HALF YEAR ENDED JUNE 30, 2017
19.1 Fair value hierarchy
The table below analyses financial instruments carried at fair value. The different levels have been defined as
follows:
- Quoted prices (unadjusted) in active markets for identical assets or liabilities (Level 1).
- Inputs other than quoted prices included within level 1 that are observable for the asset or liability, either
directly (that is, as prices) or indirectly (that is, derived from prices) (Level 2).
- Inputs for the assets or liabilities that are not based on observable market data (i.e. unobservable inputs e.g.
estimated future cash flows) (Level 3).
Recurring fair value measurements
Level 1 Level 2 Level 3 Total
Investments - net
Market Treasury Bills - 122,151,006 - 122,151,006
Pakistan Investment Bonds - 34,055,447 - 34,055,447
Ijara Sukuk Bonds - 6,356,369 - 6,356,369
Fully Paid up Ordinary Shares 1,305,894 - - 1,305,894
Term Finance Certificates - 129,702 - 129,702
Units of Open end Mutual Funds 1,158,491 - - 1,158,491
Sukuk Bonds - 5,216,210 - 5,216,210
Commitments in respect of forward exchange contracts
Forward purchase of foreign exchange - 36,584,503 - 36,584,503
Forward sale of foreign exchange - 18,037,938 - 18,037,938
Derivative instruments - 1,928,374 - 1,928,374
Other Liabilities
Pakistan Investment Bonds - 221,966 - 221,966
Recurring fair value measurements
Level 1 Level 2 Level 3 Total
Investments - net
Market Treasury Bills - 89,672,481 - 89,672,481
Pakistan Investment Bonds - 44,903,414 - 44,903,414
Ijara Sukuk Bonds - 4,477,685 - 4,477,685
Fully Paid up Ordinary Shares 4,132,522 - - 4,132,522
Term Finance Certificates - 197,156 - 197,156
Units of Open end Mutual Funds 1,158,017 - - 1,158,017
Sukuk Bonds - 2,900,000 - 2,900,000
Commitments in respect of forward
exchange contracts
Forward purchase of foreign exchange - 26,508,068 - 26,508,068
Forward sale of foreign exchange - 9,422,329 - 9,422,329
Derivative instruments - 877,690 - 877,690
June 30, 2017 (Un-audited)
December 31, 2016 (Audited)
----------------------------------------- Rupees '000 -----------------------------------------
----------------------------------------- Rupees '000 -----------------------------------------
The Bank's policy is to recognise transfers into and out of the different fair value hierarchy levels at the date when the
event or change in circumstances require Bank to exercise such transfers.
There were no transfers between levels 1 and 2 during the period.

Half Year June 30, 2017 27
NOTES TO AND FORMING PART OF THE CONDENSED INTERIM FINANCIAL INFORMATION (UN-AUDITED)FOR THE HALF YEAR ENDED JUNE 30, 2017
Valuation techniques used in determination of fair values within level 2
Item Valuation approach and input used
Pakistan Investment Bonds / Market Treasury Bills
Fair values of Pakistan Investment Bonds and Treasury Bills are derived using the PKRV rates.
Ijara Sukuk Fair values of GoP Ijarah Sukuk are derived using the PKISRV rates announced by the Financial Market Association (FMA) through Reuters. These rates denote an average of quotes received from eight different pre-defined / approved dealers / brokers.
Term Finance Certificates (TFCs) and Sukuk Certificates
Fair values of TFCs and Sukuk Certificates are determined using the MUFAP rates.
Forward foreign exchange The valuation has been determined by interpolating the mid rates announced by the State Bank of Pakistan.
Derivative instruments The bank enters into derivative contracts with various counterparties. Derivatives that are valued using valuation techniques with market observable inputs are mainly interest rate swaps, cross currency swaps and forward foreign exchange contracts. The most frequently applied valuation techniques include forward pricing and swap models, using present value calculations.
20 ISLAMIC BANKING BUSINESS
The Bank is operating 157 Islamic banking branches (December 31, 2016: 146) and 1 Islamic sub-branch
(December 31, 2016: 1).
20.1 The statement of financial position of these branches as at June 30, 2017 is as follows:
Note
ASSETSCash and balances with treasury banks 6,807,381 5,601,380Balances with other banks 155,567 83,370Due from financial institutions 300,000 -Investments 27,611,268 16,246,917Islamic financing and related assets 20.3.1 35,372,993 32,316,678Operating fixed assets 1,360,279 1,175,046Deferred tax assets - -Other assets 1,562,588 954,377
73,170,076 56,377,768LIABILITIESBills payable 1,237,962 896,669Due to financial institutions 469,542 200,000Deposits and other accounts
- Current accounts 30,669,855 18,424,972- Saving accounts 14,235,471 12,548,303- Term deposits 7,165,849 7,077,218- Others 36,573 34,955- Deposits from financial institutions - remunerative 7,881,339 9,618,020- Deposits from financial institutions - non-remunerative 90,019 5,500
Due to head office 5,896,885 1,007,797Deferred tax liabilities 46,282 24,645Other liabilities 632,338 2,131,144
68,362,115 51,969,223NET ASSETS 4,807,961 4,408,545
Un-audited AuditedJune 30, December 31,
20162017----------------------Rupees '000--------------------
4,807,961 4,408,545
REPRESENTED BYIslamic banking fund 2,880,000 2,880,000Reserves - -Unappropriated profit 1,716,879 1,357,645
4,596,879 4,237,645Surplus on revaluation of assets - net of tax 211,082 170,900

Half Year June 30, 201728
NOTES TO AND FORMING PART OF THE CONDENSED INTERIM FINANCIAL INFORMATION (UN-AUDITED)FOR THE HALF YEAR ENDED JUNE 30, 2017
20.2 The profit and loss account of the Bank's Islamic Banking branches for the half year ended June 30, 2017 is as
follows:
Half year ended
June 30, June 30,
2017 2016
Profit / return earned on financing and investments 2,028,275 1,426,197
Profit / return expensed 781,311 862,717
Net spread earned 1,246,964 563,480
(Reversal of provision) / provision against non-performing
financings - net (3,216) 12,448
Provision against consumer financings - general 9,903 7,420
Recoveries against written off debts - (220)
6,687 19,648
1,240,277 543,832
Other Income
Fee, commission and brokerage income 107,741 67,361
Income from dealing in foreign currencies - net 24,159 (5,797)
Loss on sale of securities - net (712) -
Other income 2,598 595
Total other income 133,786 62,159
1,374,063 605,991
Other expenses
Administrative expenses 1,014,810 603,748
Other provision / write-offs - 31,336
Other charges 19 18
Total other expenses 1,014,829 635,102
359,234 (29,111)
Extraordinary items / unusual items - -
Profit / (loss) for the period 359,234 (29,111)
Unappropriated profit brought forward 1,357,645 1,436,604
Unappropriated profit carried forward 1,716,879 1,407,493
Remuneration to shariah board 5,716 5,574
Un-audited
--------------- Rupees '000 ---------------
Un-audited Audited
June 30, December 31,
2017 2016
CHARITY FUND
Opening balance 4,844 1,034
Additions during the period / year 3,905 5,610
Payments / utilisation during the period / year (4,800) (1,800)
Closing balance 3,949 4,844
Sector wise details of charity disbursement
Health 4,300 1,300
Education 200 200
Social Work 300 300
4,800 1,800
--------------- Rupees '000 ---------------
The charity has been paid by the Bank on account of non-shariah compliant income and late payment amount
received from customers and profit earned thereon.

Half Year June 30, 2017 29
NOTES TO AND FORMING PART OF THE CONDENSED INTERIM FINANCIAL INFORMATION (UN-AUDITED)FOR THE HALF YEAR ENDED JUNE 30, 2017
20.3 Islamic Financing and Related Assets 20.3.1 35,372,993 32,316,678
20.3.1 Islamic Mode of Financing
Financing
Murabaha 741,423 861,049
Musharika cum Ijara 11,269 11,269
Diminishing Musharika 26,360,018 23,602,710
Fixed Assets Ijara Financing (net) 123,154 493,559
Commercial Istisna Export Financing 108,501 -
27,344,365 24,968,587
Advance against Financing
Advance against Murabaha Financing 92,696 251,821
Advance against Diminishing Musharika 5,107,750 6,332,472
Advance against Ijara 2,575,857 635,417
Advance against Istisna 493,759 400,000
Istisna Inventory 36,872 -
8,306,934 7,619,710
Gross Islamic financing and related assets 35,651,299 32,588,297
Provision against Islamic financing and related assets (278,306) (271,619)
35,372,993 32,316,678
PRESIDENT & CEO CHIEF FINANCIAL OFFICER DIRECTOR DIRECTOR DIRECTOR
21 GENERAL
21.1 Comparative information has been re-classified, re-arranged or additionally incorporated in this condensed interim
financial information, wherever necessary, to facilitate comparison and to conform with changes in presentation in
the current period.
22 DATE OF AUTHORISATION FOR ISSUE
This condensed interim financial information was authorised for issue on August 23, 2017 by the Board of Directors of
the Bank.
Un-audited Audited
June 30, December 31,
2017 2016
--------------- Rupees '000 ---------------
Note

Half Year June 30, 201730٧

Half Year June 30, 2017 31٦

Half Year June 30, 201732٥
٤،٣١٧
٥١٩
٦
٥٢٥
٤،٨٤٢
(١،٩٨٣)
٢،٨٥٩
١٧ء٢
٤،٨٠٥
(٤٥٤)
٩
(٤٤١)
٤،٣٦٤
(١،٥٤٦)
٢،٨١٨
١٤ء٢
-
آ�� ���� � �
� �و��ن ��ا� ��ن ��ر� ���������� �رى � �ر � � � � �و��ن� � ����� � ��� �� � � �� �� ���� � �� � � او �و��ن ��ا� آف
� از �ل ���
� �و��ن ��ا� �ل �
� از �ل ��
� � آ�ن (رو�)
�ن۲۰۱۷
�ن۲۰۱۶
٤

Half Year June 30, 2017 33٤

Half Year June 30, 201734٣

Half Year June 30, 2017 35٢
Half Year June 30, 201736١