Embed Size (px)
Citation preview

i
Contents
Preface...................................................................................................................................... vi
U.S. Dairy Forage Research Center Scientists........................................................................ vii
FORAGE PRODUCTION
Evidence of Mycoleptodiscus Root Rot of Forages in WisconsinC.R. Grau, D.K. Sharpee and R.R. Smith ............................................................................1
A Two Stage Selection Procedure for Resistance to Sclerotinia in Red CloverR.R. Smith............................................................................................................................4
Bromide as a Tracer for Nitrate Uptake in AlfalfaD.M. Magarian, J.F.S. Lamb, M.P. Russelle and J.M. Blumenthal.....................................6
Nutrient Management of Perennial Forages on Minnesota Dairy FarmsM.P. Russelle .......................................................................................................................8
Nitrate Uptake Kinetics of Ineffectively and Effectively Nodulated AlfalfaJ.M. Blumenthal, M.P. Russelle and C. Bernasconi ..........................................................11
Nitrate Losses Through Subsurface Tile Drainage in CRP, Alfalfa,and Row Crop Systems
G.W. Randall, D.R. Huggins, M.P. Russelle, D.J. Fuchs,W.W. Nelson and J.L. Anderson .......................................................................................13
Forage Quality Characteristics of Inbred Corn Lines and Their Derived HybridsD.D. Redfearn, D.R. Buxton, A.R. Hallauer and J.R. George...........................................15
Economic Feasibility of Growing Forage Biomass Crops in IowaA. Hallam, I.C. Anderson and D.R. Buxton ......................................................................17
Residual Cropping Effects on Corn Grain YieldI.C. Anderson, D.R. Buxton, D.L. Karlen and C. Cambardella.........................................19
Performance of Sweet and Forage Sorghum Grown in Monoculture,Double Cropped with Winter Rye, or in Rotation with Soybean and Corn
D.R. Buxton, I.C. Anderson and A. Hallam ......................................................................21
Management of Mixed Species Pastures Under Rotational Grazing: Forage Availability,Nutritional Quality and Species Composition
V.R. Kanneganti, R.P. Walgenbach and L.J. Massingill ...................................................23
ii
Nitrogen Recovery by Orchardgrass From Dairy ManureV.R. Kanneganti, S.D. Klausner and S.R. Kaffka .............................................................26
Impact of High and Low Forage Diets on Dairy FarmsC.A. Rotz.................................................................................................................................29
Costs of Forage ProductionC.A. Rotz and T.M. Harrigan .................................................................................................31
Corn Silage Following First-Cut Alfalfa: A Forage Production Alternative?J.C. Durling, Q.B. Hesterman and C.A. Rotz ....................................................................33
FORAGE HANDLING, PRESERVATION AND STORAGE
Comparison of Respiration Losses in Intensively Conditioned and Unconditioned AlfalfaT.J. Kraus, R.E. Muck and R.G. Koegel............................................................................35
Maceration of Alfalfa Hay and Silage Improves Milk ProductionD.R. Mertens and R.G. Koegel ..........................................................................................37
The Potential for Ethanol Production From Alfalfa Fiber Derived From Wet FractionationR.G. Koegel and R.J. Straub ..............................................................................................39
Phytase From Transgenic Alfalfa for Supplementation of Poultry and Swine RationsR.G. Koegel, S. Austin-Phillips, M.E. Cook and R.J. Straub............................................43
A Lactic Acid Bacterial Strain to Improve Aerobic Stability of SilagesR.E. Muck ..........................................................................................................................46
Ensiling of Potato VinesR.E. Muck, Z.G. Weinberg, D.I. Rouse and B.R. Igl.........................................................48
Proteolysis in Different Forage SilagesR.E. Muck, D.R. Mertens and R.P. Walgenbach...............................................................50
Round Bale Silage Storage Losses of Ryegrass and Legume-Grass ForagesR.L. Huhnke, R.E. Muck and M.E. Payton........................................................................52
Economics of Alternative Silage SystemsC.A. Rotz.................................................................................................................................54
PLANT CHEMISTRY
Using Molecular Modeling to Predict Spectral Characteristics of Peroxidase ProductsR.D. Hatfield......................................................................................................................56

iii
Formation of Intramolecular Ferulate Dehydrodimers: A Molecular Modeling ApproachR.D. Hatfield and J. Ralph .................................................................................................59
Use of Calorimetry to Verify Lignin Concentration EstimatesH.G. Jung and V.H. Varel..................................................................................................61
Revising the Acetyl Bromide Assay to Optimize Lignin Determinations in Forage PlantsR.D. Hatfield, K. Brei and J.H. Grabber............................................................................63
The “DFRC” Method: a New Method for Structural Characterization of LigninsF. Lu and J. Ralph ..............................................................................................................66
New Discoveries Relating to DiferulatesJ. Ralph, J.H. Grabber, R.D. Hatfield and G. Wende ........................................................70
Diferulate Cross-Links Limit the Degradation Rate of Nonlignified MaizeWalls by Fungal Hydrolases
J.H. Grabber, R.D. Hatfield and J. Ralph ..........................................................................72
Preparation of Three Coniferaldehyde Dimers and a TrimerF.H. Ludley and J. Ralph ...................................................................................................74
Synthesis of 13C-labeled Coniferaldehyde and Its Incorporation into Synthetic LigninsF.H. Ludley and J. Ralph ...................................................................................................75
Corn Cell Wall Peroxidases: Potential Role in the Lignification ProcessR.D. Hatfield, C. Neumeier, J.H. Grabber and J. Ralph ....................................................77
Dibenzodioxocins in Forage Plant LigninsJ. Ralph ..............................................................................................................................79
Chemical Composition and Degradability of Xylem and NonxylemWalls Isolated From Alfalfa
J.H. Grabber, R.D. Hatfield, M. Panciera and P. Weinberg ..............................................81
Degradability of Cell-Wall Constituents in Corn Internodes DuringStalk Development
T.A. Morrison, H.G. Jung and D.R. Buxton......................................................................83
Nonstructural Carbohydrates in Cool- and Warm-Season Perennial Grasses Adapted toShaded Conditions
K.D. Kephart and D.R. Buxton..........................................................................................85
Alfalfa Cultivar Variation for Minerals ConcentrationJ. Guan, D.R. Buxton, J.P. Goff and R.L. Horst................................................................87
RUMEN MICROBIOLOGY
iv
The Effect of pH on Ruminal MethanogenesisJ.S. Van Kessel and J.B. Russell........................................................................................90
Effect of Forage Quality and Monensin on the Ruminal Fermentation ofFistulated Cows Fed Continuously at a Constant Intake
R.P. Lana and J.B. Russell.................................................................................................93
The Lysis of Fibrobacter SuccinogenesJ.E. Wells and J.B. Russell ................................................................................................96
Variation in Ruminal and Milk Parameters Among Cow-Diet Combinations:Results From a Baseline Study to Relate Digestion Kinetics and MicrobialPopulation Data
P.J. Weimer, G.M. Waghorn and D.R. Mertens ................................................................98
Time-Dependent Shifts in Fermentation Endproduct Ratios: A Source ofBias in Estimation of Digestion Kinetics Via In Vitro Measurementof Gas Production
P.J. Weimer......................................................................................................................100
Inocula Differences Affect In Vitro Fiber Digestion KineticsD.R. Mertens, P.J. Weimer and G.M. Waghorn ..............................................................102
FEED UTILIZATION BY CATTLE
Comparing Systems of Ration Formulation for Dairy CowsD.R. Mertens....................................................................................................................104
Alfalfa Silage Versus Red Clover Silage or a Mixture of Alfalfa and RedClover Silage as the Sole Forage for Lactating Dairy Cows
G.A. Broderick and S. Maignan.......................................................................................106
A Statistical Evaluation of Animal and Nutritional Factors InfluencingConcentrations of Milk Urea Nitrogen
G.A. Broderick and M.K. Clayton ...................................................................................109
Effect of Replacing Alfalfa Silage with Red Clover Silage in the Diets ofLactating Dairy Cows
G.A. Broderick and E. Sterrenburg..................................................................................113
Production Response to Feed Supplementation of Dairy Cows in a SeasonalCalving and Grazing System T.R. Dhiman, V.R. Kanneganti, R.P. Walgenbach, L.J. Massingill,
M.C. Wiltbank, M.P. Russelle and L.D. Satter................................................................116Energy Supplementation Sources for Lush Pasture
v
A. Bach, I.K. Yoon, M.D. Stern, H.G. Jung, and H. Chester-Jones ................................118
Effects of Acidified Fermentation By-Products and Anionic Salts onAcid-Base Status of Non-Lactating Dairy Cows
D.B. Vagnoni and G.R. Oetzel.........................................................................................120
FARM/HERD REPORT - WISCONSIN
Annual Field Operations Report, January 1997R.P. Walgenbach..............................................................................................................122
Annual Dairy Operations Report, January 1997L.L. Strozinski..................................................................................................................124
PUBLICATIONS..................................................................................................... 126

vi
Preface
It is a pleasure to update our progress by bringing you these summaries of recent research. The U.S. DairyForage Research Center is a unique part of the national research program of the Agricultural Research Service,U.S. Department of Agriculture. The Center’s mission is to build a knowledge and technology base for the dairyindustry to fully exploit the use of forages in the production of milk. The Center has agricultural engineers,plant and soil scientists, microbiologists, ruminant nutritionists and a chemist working together to increase theefficiency of forage production and utilization by dairy farmers. We function in close cooperation with theAgricultural Experiment Stations of several states. The Center is located on the campus of the University ofWisconsin, Madison, and has “Cluster” locations in St. Paul, MN, Ames, IA, East Lansing, MI, and Ithaca, NY.The Center's research farm with facilities for 300 milking cows is located on 63 acres of USDA land on thebanks of the Wisconsin River in Prairie du Sac, WI. An additional 1200 acres of adjacent land is utilized by theCenter by agreement with the U.S. Department of the Army. The Center was established in 1980 and has madesteady growth since. At present there are fifteen scientists: ten at Madison, and one at each of three Clusterlocations, and two at the St. Paul, Minnesota Cluster location. Scientists hold faculty appointments in universitydepartments and provide supervision for approximately 15-20 graduate students and 5-10 post doctoral fellows.
We are losing one of our colleagues this year, as Dr. Buxton in Ames, IA is taking a position on the NationalProgram Staff of ARS in Beltsville, MD. Dwayne has been a very productive scientist and we will miss himvery much. His research on questions of forage quality, forage production, and his more recent work with cornsilage has always been very relevant to the needs of producers. We are uncertain about the future for the clusterposition in Ames. From the U.S. Dairy Forage point of view, we would like to fill Dwayne’s position with anew recruit. This, however, is being weighed against considerable pressure within ARS to consolidate outlyingprograms.
Another of our colleagues has also moved. Dr. Tilak Dhiman, having spent the last eleven years at the U.S.Dairy Forage Center, first as a post-doc and then as an assistant and associate scientist, has accepted anassistant professor position at Utah State University in Logan.
While we are saying farewell to two long time associates, we welcome Dr. Mark Powell. Mark is anagroecologist, and has been hired through a joint program supported by the University of Wisconsin College ofAgricultural and Life Sciences and the U.S. Dairy Forage Research Center. Mark will be working with bothARS and college scientists to help develop and integrate research efforts in the area of nutrient management.
We received additional funding for our research efforts on questions relevant to low input, sustainableagriculture. Some of these funds will be provided to the University of Wisconsin via a specific cooperativeagreement to help support an integrated cropping systems project. We will be developing research protocols inthe next few months that address issues of sustainability, nutrient management, grazing, and cost of forage andmilk production.
We are pleased and very proud of the way Center scientists from diverse disciplines interact and bring theircollective insights to bear on the problems of forage production and utilization. This collection of researchsummaries illustrates the progress they are making in developing information to help dairy farmers utilize theirresources more effectively. The research is intended to benefit producers of forage crops, dairy farmers and theconsumers of dairy products.
Sincerely,
Larry D. Satter, DirectorU.S. Dairy Forage Research Center
vii
U.S. Dairy Forage Research Center Scientists
G.A. Broderick*Research Dairy Scientist(608)264-5356Internet: [email protected]
D.R. BuxtonSupervisory Plant PhysiologistUSDA/ARS/USDFRCDepartment of AgronomyIowa State UniversityAmes, IA 50011(515)294-9654FAX: (515)294-9359Internet: [email protected]
T.R. Dhiman* ‡Associate ScientistUSDFRC, Dept. of Dairy ScienceUniversity of Wisconsin - Madison(608)264-5353Internet: [email protected]
R.D. Hatfield*Research Plant Physiologist(608)264-5358Internet: [email protected]
H.G. JungResearch Dairy ScientistUSDA/ARS/USDFRCDept. of Agronomy and Plant Genetics411 Borlaug HallUniversity of MinnesotaSt. Paul, MN 55108(612)625-8291FAX: (612)649-5058Internet: [email protected]
V.R. Kanneganti* ‡Associate ScientistUSDFRC, Dept. of AgronomyUniversity of Wisconsin-Madison(608)264-5372Internet: [email protected]
R.G. Koegel*Research Agricultural Engineer(608)264-5149Internet: [email protected]
D.R. Mertens*Research Dairy Scientist(608)264-5228Internet: [email protected]
R.E. Muck*Research Agricultural Engineer(608)264-5245Internet: [email protected]
J.M. Powell*Associate Scientist/AgroecologistUSDFRC, Dept. of Soil ScienceUniversity of Wisconsin - Madison(608)264-5044Internet: [email protected]
J. Ralph*Research Chemist(608)264-5407Internet: [email protected]
C.A. RotzResearch Agricultural EngineerUSDA/ARS/USDFRCRm 206 Farrall HallMichigan State UniversityEast Lansing, MI 48824(517)353-1758FAX: (517)353-8982Internet: [email protected]
J.B. RussellResearch MicrobiologistWing HallSection of MicrobiologyCornell UniversityIthaca, NY 14853(607)255-4508FAX: (607)255-3904Internet: [email protected]
M.P. Russelle

viii
Soil ScientistUSDA/ARS/USDFRCDept. of Soil, Water and ClimateUniversity of Minnesota439 Borlaug HallSt. Paul, MN 55108-6028(612)625-8145FAX: (612)625-2208/649-5058Internet: [email protected]
L.D. Satter*Director and Research Dairy Scientist(608)263-2030/264-5240Internet: [email protected]
R.R. Smith*Research Plant Geneticist(608)264-5279Internet: [email protected]
L.L. Strozinski†Herd ManagerUSDA/ARS/USDFRCS 8822 Highway 78Prairie du Sac, WI 53578(608)643-2438/264-5138FAX: (608)264-5138Internet: [email protected]
R.P. WalgenbachManagement Agronomist/Farm ManagerUSDA/ARS/USDFRCS 8822 Highway 78Prairie du Sac, WI 53578(608)643-2438/264-5138FAX: (608)264-5138Internet: [email protected]
P.J. Weimer*Research Microbiologist(608)264-5408Internet: [email protected]
*Madison location is: USDA/ARS/USDFRC, 1925 Linden Drive West, University of Wisconsin,Madison, WI 53706, (608)263-2030/264-5240, FAX: (608)264-5275.
‡Associate Scientist, University of Wisconsin, and supported by the U.S. Dairy Forage ResearchCenter.
†Member of Agricultural Research Stations Department in the College of Agricultural and LifeSciences, and supported by the U.S. Dairy Forage Research Center.

1996 Research Summaries 1
Evidence of Mycoleptodiscus Root Rot of Forages in WisconsinC.R. Grau, D.K. Sharpee and R.R. Smith
IntroductionSoilborne plant pathogens are regarded asimportant causes of failures of newly establishedand mature stands of forage legumes in the NorthCentral Region of the U.S. A Mycoleptodiscus-like fungus was recovered from decaying rootsand stems of birdsfoot trefoil plants sampledfrom two-year-old yield trials in 1994 andestablishment year stands in 1995 at theArlington Agricultural Research Station,Arlington, WI. Although recognized in statessouth of Wisconsin, Mycoleptodiscus terrestrishas not been implicated in poor health of foragelegumes in Wisconsin. M. terrestris has beenpreviously reported to be pathogenic on alfalfa,red clover and birdsfoot trefoil in Illinois(Gerdemann, 1954). The fungus has beenreported to be pathogenic on birdsfoot trefoil inMissouri (Pettit, et al., 1969) and eastern U.S.(Carroll and Whittington,1991). Only the trefoilcultivar Dawn (Beuselinck, 1994) and thegermplasm CAD (Beuselinck and Steiner, 1994)have been reported to have some degree ofresistance (tolerance) to M. terrestris. However,no resistance has been identified in trefoilgermplasm adapted to the northern area of themidwest. Forage legume germplasm has notbeen characterized extensively for reaction to M.terrestris. Our goal is to characterize the isolatesfor phenotypic and genotypic traits in relation toisolates from other geographic regions and hostorigins. This information will be used in aprogram to improve forage legumes forresistance to M. terrestris. Forage legumegermplasm improved for resistance to M.terrestris can be used to assess the importance ofthis fungal pathogen in the upper Midwest.
Materials and MethodsPathogen identification. A fungus resemblingMycoleptodiscus terrestris was recovered fromroot and stem tissue excised from birdsfoottrefoil plants. Excised tissue was placed onacidified potato dextrose agar (APDA) andincubated for 5-7 days. Isolates were grown onAPDA, corn meal agar (CMA), microwavedsoybean leaflets and irradiated carnation leavesfor 7 days under fluorescent lights (12 hr light:12 hr dark).
Isolates and germplasm evaluation. Thevirulence of eight isolates, four derived fromfield grown birdsfoot trefoil plants; one eachfrom greenhouse grown red clover and alfalfaplants; and three from alfalfa-derived isolatesprovided by L.H. Rhodes, Ohio State University,Columbus, OH, was evaluated on eight foragelegumes: alsike, berseem, kura, red and whiteclovers, alfalfa, birdsfoot trefoil and sweetclover.Three-week-old seedlings were inoculated with amycelium/sclerotium suspension (one 100 mmstandard plate/ l water) as a drench at a rate of 20ml per 10 seedlings and incubated for threeweeks at 25°C. Six-week-old seedlings wereevaluated for reaction to the respective isolateson a scale of 1 to 5; 1 = no symptoms and 5 = adead plant.
Results and ConclusionsPathogen identification. All isolates recoveredfrom birdsfoot trefoil produced sclerotia andconidia that were morphologically similar toMycoleptodiscus terrestris isolates recoveredfrom alfalfa. All birdsfoot trefoil isolates and twoof the three alfalfa-derived isolates produced
Forage Production

2 U.S. Dairy Forage Research Center
conidia on carnation leaves but did not sporulateon PDA. One isolate from birdsfoot trefoil wastested on CMA but did not sporulate. Light wasrequired for sporulation. All isolates producedsclerotia on carnation leaves, PDA and CMA.
Isolate-species evaluation. All forage specieswere susceptible to the M. terrestris isolates usedin this study (Table 1), but alsike and kuraclovers and alfalfa were less susceptible to thisset of isolates compared to the other foragelegumes evaluated. Symptoms varied from blackdecay of root tissues to severe wilting of thestem tissue resulting from root decay or blackwater-soaked lesions at the base of stems whichcompletely girdled the stem.
Future Research/Plans1. Isolates of Mycoleptodiscus recovered from
forage legumes in Wisconsin will becompared to isolates from other regions ofthe United States and other species ofMycoleptodiscus. Isolates will be comparedfor differences in phenotypic traits such asspore and sclerotium morphology andvirulence to specific forage legumes andcompared to genotypic traits related tomolecular markers.
2. A standardized method will be developed toselect and characterize forage legumegermplasm for resistance to M. terrestris.
3. An attempt will be made to improve foragelegume germplasm for resistance to M.terrestris. This germplasm will be used todetermine the role of M. terrestris on foragelegume performance in the upper Midwest.
ReferencesBeuselinck, P.R. 1994. Registration of Dawn birdsfoottrefoil. Crop Sci. 34:540.
Beuselinck, P.R., and J.J. Steiner. 1994. Registration ofCAD birdsfoot trefoil germplasm selected for droughtresistance. Crop Sci. 34:543.
Carroll, R.B., and D.P. Whittington. 1991. Crown and rootrot of bird�s-foot trefoil in Delaware caused byMycoleptodiscus terrestris. Plant Dis. 75:1074.
Gerdemann, J.W. 1954. Pathogenicity of Leptodiscusterrestris on red clover and other Leguminosae. Phytopath.44:451-455.
Pettit, R.E., O.H. Calvert, and J.D. Baldridge. 1969.Pathogenicity and virulence of Mycoleptodiscus terrestristo birdsfoot trefoil. Phytopath. 59:1203-1208.

1996 Research Sum
maries
3
Table 1. Response of eight legume species to nine isolates of Mycoleptodiscus terrestris.Btw. Isolates
ISOLATE SPECIES within spp.SPECIES* Tre 94.1 Tre 95.1 Tre 95.2 Tre 95.3 Red 94.1 Alf 94.1 Rodalf 1 Rodalf 2 Rodalf 3 MEAN LSD(5%)
Disease Severity Index**Alsike Clover 3.50 2.54 2.57 2.02 2.57 2.66 2.95 3.14 3.01 2.77 0.51Alfalfa 2.86 2.92 2.97 2.28 2.40 2.57 3.11 2.92 2.65 2.74 0.44Berseem Clover 4.04 3.19 3.38 2.50 3.43 3.37 3.50 3.81 3.61 3.42 0.42
Kura Clover 3.44 2.67 2.91 2.47 2.91 2.89 3.32 3.00 3.17 2.97 0.40Red Clover 3.95 3.09 3.20 2.72 3.39 2.88 3.83 3.88 2.96 3.32 0.33Sweetclover 3.08 3.75 3.40 2.62 3.79 3.50 3.50 3.68 3.21 3.40 0.67
Trefoil 3.73 3.37 3.10 2.55 3.14 2.96 3.63 3.62 3.42 3.27 0.65White Clover 3.67 3.19 3.30 2.36 3.25 2.79 3.58 3.24 3.01 3.16 0.59
MEAN 3.53 3.09 3.10 2.43 3.11 2.95 3.41 3.41 3.13 3.13LSD (5%) 0.76 0.58 0.24 0.39 0.42 0.42 0.4 .45 0.48 0.22 0.20CV (%) 15.30 13.30 4.00 3.30 10.80 10.10 9.80 9.30 11.00 11.20**Disease Severity Index: 1 = healthy plant, 5 = dead plant.ISOLATES: Tre 94.1 = Original trefoil isolate from 1994 field nursery Alf 94.1 = Isolated from alflafa inoculated with Tre 94.1
Tre 95.1 = Isolate obtained from field in Sept 95 Rodalf 1 = Alfalfa isolate #1 from RhodesTre 95.2 = Isolate obtained from field in Sept 95 Rodalf 2 = Alfalfa isolate #2 from RhodesTre 95.3 = Isolate obtained from field in Sept 95 Rodalf 3 = Alfalfa isolate #3 from RhodesRed 94.1 = Isolate from red clover inoculated with Tre 94.1
*Alsike cv. common, Alfalfa cv.Vernal, Berseem cv. Bigbee, Kura cv. Rhizo, Red cv. Marathon, Sweetclover cv. Denta, Trefoil cv. Norcen,White cv. Ladino.

4 U.S. Dairy Forage Research Center
A Two Stage Selection Procedure for Resistance to Sclerotinia in Red CloverR.R. Smith
IntroductionSclerotinia crown and stem rot, caused bySclerotinia trifoliorum Eriks., is one of the mostdestructive diseases on forage legumes in theeastern and north central U.S. and in Europe.Development of resistant germplasm in redclover (Trifolium pratense L.) has been difficultand slow. Until recently, the primary source ofinoculum used in laboratory or greenhousescreening procedures was mycelium. However,the natural inoculum in the field is the ascospore.Recently, we developed a procedure forproducing and storing ascospores in thelaboratory which has allowed us to useascospores as the source of inoculum ingreenhouse screening tests (Smith et al., 1993;Marum et al., 1994). Selection for resistance inred clover using ascospores as inoculum hasbeen slow but effective. It has been mostdifficult to generate uniform inoculationconditions whether using mycelium orascospores, resulting in susceptible plantsescaping infection and contributing tosusceptibility in the subsequent generations. Toovercome some of this procedural variability, asingle leaf inoculation procedure has beenproposed (Mouset-Declas et al., 1994). Thisbecomes a very labor intensive procedure whenscreening thousands of plants for resistance.Therefore, a more efficient procedure is neededand this paper describes a two stage processwhich employs both a mass and a leafletinoculation phase in the procedure.
ProceduresThe two stage procedure involves a massinoculation of two-week-old seedlings withascospores followed by a replicated single leafletinoculation of surviving seedlings.
Inoculum preparation and application. Anisolate of Sclerotina trifoliorum, M1-B, collectedfrom the Agricultural Research Station atMarshfield, WI was used for all procedures.
Inoculum concentration for both stages was10,000 spores ml-1 in a solution containing 10 gglucose l-1 and 3 drops of Tween 80 100 ml-1.
Stage one. Mass Inoculation: Red clover seedsare sown in either sectioned or open plastic trayscontaining standard sterilized greenhouse soil.The trays are inserted in non-draining plasticflats such that the trays could be watered fromthe bottom with Hoagland�s solution. Two-week-old plants were spray-inoculated with 80ml of ascospore inoculum per pan. Pans werecovered with clear plastic tops and sealed toretain 100% relative humidity. Plants areincubated at 15°C at 100% relative humidity in12 hr day-length for 14 da. Plants are evaluatedon a Disease Severity Index (DSI): 1 = healthyplant with no damage to cotyledons, 2 = slightnecrosis with slight necrosis to cotyledons, 3 =moderate necrosis with death of cotyledons, 4 =severe necrosis, and 5 = dead plant.
Stage two. Leaflet Inoculation: Twenty-eightdays after the mass inoculation, one leaflet fromone leaf of each surviving plant is placed onmoist, sterile filter paper in each of threeseparate 15 cm petri dishes sectioned to contain10 to 16 leaflets per dish. One drop of ascosporeinoculum at previously described sporeconcentration is placed in the center of eachleaflet. The petri dishes are covered and sealedwith parafilm and the leaflets incubated asprescribed for the seedlings in the massinoculation. Fourteen days after inoculationleaflets are scored on a scale of 1 to 5 (1 = nonecrosis, green leaflet; 5 = leaflet completelyinfected, light to dark brown). Plants with leafletscores of DSI 1 or 2 are subsequentlyintercrossed to produce the next generation.
ResultsSlight progress from selection for resistance to S.trifoliorum was realized in the first cycle ofselection using the mass inoculation procedure

1996 Research Summaries 5
and standard phenotypic selection (Table 1).However, the process did not prove to beeffective in the two subsequent cycles (C2 andC3) of selection. At this point we introduced thetwo stage inoculation procedure. Theeffectiveness of this procedure is reported inTable 2. Population R-C4 derived from plantsdeclared as resistant by the leaflet inoculationstep has significantly greater number of resistantplants than present in the MR-C4, S-C4 and C4Mass populations. The mean DSI of populationR-C4 (3.55) is significantly less than that for theother three populations and from the previouscycle of selection (C3). The response over allfour cycles of selection is depicted in Figure 1.
ConclusionsThe two stage ascospore inoculation procedurefor identifying red clover seedlings with theresistant reaction to S. trifoliorum is effectiveand efficient. The initial mass inoculation stepallows a breeder the opportunity to evaluatethousands of plants in a short period of time andthe second step of leaflet inoculation effectivelyeliminates seedlings that have escaped infectionin the earlier inoculation. Substantial progressshould be realized with minimal effort using thisprocedure.
Mass inoc.and leaflet inoc.
Mass inoculation
C0 C1 C2 C3 C43.2
3.4
3.6
3.8
4
4.2
Cycle of Selection
Dis
ea
se S
eve
rity
Ind
ex
Figure 1. Response of four cycles of selection forresistance to Sclerotinia.
ReferencesMarum, P., R.R. Smith, and C.R. Grau. 1994. Develop-ment of procedures to identify red clover resistant toSclerotinia trifoliorum. Euphytica 77:257-261.
Mousset-Declas, C., G. Delclos, and G. Raynal. 1994.Production of Sclerotinia trifoliorum ascospores inlaboratory and resistance test. In Proc. XIII TrifoliumConf. , R. Narasimhalu, ed. Charlottetown, Prince EdwardIsland, Canada. July 12-14, 1994, p. 68.
Smith, R. R., P. Marum, C.R. Grau, and D.K. Sharpee.1993. Reaction of red clover to ascospore inoculum ofSclerotinia trifoliorum. Agron. Abst. 1993. p. 102.
Table 1. Response to three cycles ofselection for resistance to S. trifoliorum inred clover using ascospores for inoculum.
Percent plants with DSI ofPopn. 1/2(R) 3(MR) 4/5(S) Mean*C0 10 10 80 4.16b
C1 12 12 76 3.96a
C2 14 13 73 3.95a
C3 12 18 70 3.87a
Arlington 8 22 70 4.14b
*Means followed by the same letter notsignificantly different at the 5% level.
Table 2. Response of populations derivedfrom leaflet inoculation for resistance to S.trifoliorum in red clover.
Percent plants with DSI ofPopn.** 1/2(R) 3(MR) 4/5(S) Mean*R-C4 35 5 60 3.55a
MR-C4 12 10 78 4.30c
S-C4 8 3 89 4.55d
C4 24 6 70 4.00b
C3 19 5 76 4.11b
C0 10 5 85 4.41d
*Means followed by the same letter notsignificantly different at the 5% level.**Popn. R, MR, and S are C4 popn. Derivedfrom C3 plants determined to be resistant,moderately resistant, or susceptible by theleaflet inoculation test, respectively.

6 U.S. Dairy Forage Research Center
Bromide as a Tracer for Nitrate Uptake in AlfalfaD.M. Magarian, J.F.S. Lamb, M.P. Russelle and J.M. Blumenthal
IntroductionNew alfalfa germplasms that reduce nitrate(NO3) losses to ground water and decreasefertilizer N requirements in crop rotations wouldbe environmentally and economically beneficialto sustainable cropping systems. Although it hasbeen demonstrated that alfalfa can absorb NO3
from deep in the soil profile, there has been noeconomically feasible way to select alfalfa plantsfor differences in NO3 uptake. Selection ofalfalfa with high NO3 absorption capacity undergreenhouse conditions has failed to produce linesthat differ under field conditions. The stabletracer, 15N, is too expensive to use in the field,where thousands of individual plants must bemeasured individually.
Bromide (Br) has been used to trace nitratemovement in soil-water systems and is absorbedby many plant species. Our hypothesis was thatBr could serve as an inexpensive tracer for NO3-N uptake in N2-fixing crops like alfalfa. We firstdeveloped a rapid means of extracting andanalyzing Br from alfalfa tissue and thenconducted three experiments in the greenhouseto test the hypothesis.
MethodsWe tested several methods of Br extraction fromalfalfa tissue, using flow injection analysis and acolorimetric detection technique for quantifica-tion. Results were compared to X-ray fluores-cence spectroscopy analysis of finely groundtissue samples. We found that a 1 min. extractionin 25 mL deionized water with 0.25 g groundalfalfa tissue and 2 g activated charcoal producedBr analyses that correlated well with XRFS (r2 =0.97). This rapid extraction procedure removedonly part of the total Br, so it is useful only inidentifying differences among plants, not indetermining total Br uptake.
Three experiments were conducted in thegreenhouse with established alfalfa plants grown
in soil/sand mixtures or sand only, and specifictreatments within each experiment were repeatedwith other plants the following year. Experiment1 was designed to test the hypothesis that theuptake of Br and N derived from NO3 (using 15Nto monitor actual uptake of NO3 ) would berelated to the concentration supplied, and that themolar ratio of the tracer in the plant wouldreflect the ratio in solution. Four tracerconcentrations at a constant molar ratio of 200NO3:Br were applied for one regrowth period.Experiment 2 was designed to test the hypothesisthat Br uptake would be related to Brconcentration in solution applied, regardless of ahigh concentration of NO3 in solution. Weapplied four (yr 1) or 6 (yr 2) concentrations ofBr with 5 mM NO3 for one regrowth period. Thethird experiment was designed to test thehypothesis that plant-to-plant differences in NO3uptake are present in alfalfa populations.Solutions containing 5 mM NO3 and 0.025 mMBr were applied for one regrowth period to 92plants of Webfoot alfalfa in yr 1 and to 26, 29,and 34 plants of Webfoot, Agate, and IneffectiveAgate alfalfa, respectively, in yr 2. Standardanalysis of variance or regression analysistechniques were used to evaluate treatmenteffects.
Results and DiscussionBoth Br and NO3-N uptake increased duringregrowth, as expected, due to dry mass increasesin the shoot. Nitrate uptake responded in asigmoidal fashion to increases in NO3concentration in the root zone, but Br uptakeshowed a linear response in the range of Brconcentrations tested. These differences inuptake pattern and the disparity in physiologicalrole of N and Br in the plant prevent the use ofBr to trace NO3-N uptake in crop management orphysiology experiments.
The molar ratio of NO3:Br in the shoot tissueclosely reflected the changing ratio in nutrient

1996 Research Summaries 7
solution, regardless of the amount of timeallowed for regrowth (Fig. 1). The one exceptionto this occurred when 5 microM Br was suppliedwith 5 mM NO3 (yr 2), and these data were notincluded in the regressions. Because these dataapparently fit power functions, the interceptdifferences in Figure 1 indicate that germplasmsresponded differently to low ratios of NO3:Br;the higher the apparent intercept in this log-logplot, the higher the initial slope of the responsefunction. When three alfalfa germplasms weretested in yr 2, both of the N2-fixing types,Webfoot and Agate, had similar intercepts, but
Figure 1. Molar ratio of NO3-N:Br response to
increasing Br concentrations and constant NO3-N
concentrations in solution treatments in two years,plotted on a log-log scale. Regression equations had theform y = axb, with b = 0.94 for all cases except 25 dregrowth in 1994, where b = 0.82 (in all cases R2 > 0.85).
ConclusionResults of these experiments suggest that Br haspromise as a tracer for NO3-N uptake in analfalfa plant breeding program. Selection shouldbe made with plants of uniform maturity afterseveral weeks of regrowth to allow differences tobe expressed. In addition, a relatively constantsupply of Br is necessary because Br uptake isdirectly related to Br concentration in the rootzone. Our technique provides the first affordablemeans to select alfalfa for NO3-N uptake in thefield.
these were lower than the non-N2-fixing Ineffective Agate, indicatingthat Ineffective Agate accumulatedmore NO3 than Br as the NO3:Br ratioincreased. Differences in apparentintercept among harvest dates in yr 1suggest that relatively lowerpreference is shown for NO3 uptakethan Br as alfalfa regrows. In only oneharvest (25 d of regrowth in yr 1) wasthe slope of the relationship differentfrom the others.
Plant-to-plant variability for both NO3-N and Bruptake was evident within each entry in bothyears. Plants that were high in NO3-N uptakealso had high Br uptake (Fig. 2). A hypotheticalselection pressure of 5% for the population of 92plants in yr 1 is shown in Fig. 2. These resultsshow that individual plant selection for NO3-Nuptake using Br uptake as the selection criterionwould result in minimal error.
Figure 2. Scatter plot of NO3-N uptake vs. Br uptake in yr1. Selection for 5% of the population using Br uptakecompared to NO3-N uptake is shown in the outlined boxes.Regression equation was y = 1.17(log x)-6.77, r2 = 0.79.

8 U.S. Dairy Forage Research Center
Nutrient Management of Perennial Forages on Minnesota Dairy FarmsM.P. Russelle
IntroductionThere is relatively little information available ona state-wide basis regarding fertility managementof perennial forages by dairy farmers. Informa-tion available on manure and fertilizer usegenerally relates to corn acres. It is critical toknow what fertility practices dairy farmers useon their perennial forages and what influencesand constrains them in choosing those practices.
MethodMinnesota dairy farmers were surveyed by mailduring August and September 1996. Thequestionnaire was mailed to 1007 dairiesselected randomly by the Minnesota AgriculturalStatistics Service from farms that had reportedmilking 30 or more dairy cows. A total of 354surveys were found suitable for statisticalanalysis, representing 3.6% of all farms with lessthan 200 milking cows and 11.5% of farms with200 or more milking cows. Because samplingintensity varied between these two categories,distributions of specific farm characteristics donot accurately reflect overall conditions inMinnesota. I divided the state into three areas,based on climate and general soil characteristics(Fig. 1).
Distributions of many individual farmcharacteristics were skewed, so both the medianand mean are presented. Stepwise logisticregression was used to discern relationshipsamong variables.
ResultsMilk cow numbers ranged from 20 to 400 (P
50 =51, x = 69) and farmers reported having from 0to 300 (P50 = 24, x = 34) replacement heifers.Rolling herd average ranged from 4000 to 11,800kg milk (P50 = 8200 kg, x = 8400 kg) and is morelikely to be high in larger herds, on farms wherefeed is tested for quality frequently, and as thearea of permanent grass forages increases. Ittends to be lower on farms that spread manure on
grass forages. This latter characteristic may berelated to other limitations on management(time, land area in corn, etc.), or it may be somedirect effect, such as reduced feed intake due topalatability problems.
The percentage of forage land fertilized is greaterin the cold Alfisol region, and when soil tests areused for information regarding fertilizerrecommendations. In contrast, less forage land isfertilized where manure is topdressed onestablished alfalfa fields and on farms withpermanent grass-legume mixtures.
Reported rates of preplant P and K fertilizerrange from 5 to 70 kg P/ha (P
50 = 18 kg P/ha, x =23 kg P/ha) and 25 to 225 kg K/ha (P50 = 112 kgK/ha, x = 116 kg K/ha). More K is incorporatedbefore seeding when farmers get informationfrom fertilizer dealers and from the ExtensionService and as the proportion of fertilized forage
Figure 1. Three generalized soil areas of Minnesota: thecold Alfisol region (no shading); the warm Alfisol region(darkest shading); and the Mollisol region (mediumshading).

1996 Research Summaries 9
land increases. The rate is smaller in the Mollisolregion, which has high native soil K availability.
On established alfalfa, farmers reported usingfrom about 5 to 70 kg N/ha (P50 = 20 kg N/ha, x= 24 kg N/ha), 5 to 80 kg P/ha (P50 = 21 kg P/ha,x = 27 kg P/ha), and 15 to 390 kg K/ha (P50 =128 kg K/ha, x = 139 kg K/ha). Phosphorus ratesare higher in the calcareous Mollisol region, onfarms where a large percentage of forage land isfertilized, and when information on fertilizerrates is obtained from the Extension Service.Little variation in applied K could be explainedby farm characteristics, presumably becausenearly one half of all farms use K on establishedalfalfa. P and K fertilizer is applied almostentirely during the growing season and is spreadall at once or in a simple split, mostly inSeptember and October.
Nearly 80% of the reported soil tests exceeded20 mg P/kg, at which point no additional nutrientis recommended by the University of Minnesota,and several exceeded 120 mg P/kg. Higher soil Plevels were associated with manure storage in apack and with higher percentages of fertilizedforage land. Lower soil P is characteristic offarms in the Mollisol region and occurred onfarms with daily or frequent haul manuresystems. About one-half of the reported soil Ktests were greater than 160 mg K/kg, the level atwhich no fertilizer is recommended. Soil K isrelated positively to pack and lagoon manurestorage systems, with increasing proportion offorage land fertilized, and with increasingacreage of permanent grass forages.
The two manure handling systems ranked asmost typical were daily or frequent hauling andlagoon storage of liquid manure (Fig. 2). Dairyfarmers apparently rely more on daily or frequentmanure hauling in the warm Alfisol area, asmore forage land is fertilized, and as fertilizerdealers serve as more important sources ofnutrient information. This also might beinterpreted that farmers who rely on daily orfrequent hauling are less likely to employ
independent consultants than the personnel at thefertilizer distributor. Daily hauling is less likelyas alfalfa land area increases.
Reliance on lagoon storage of liquid manure ismore likely as herd size and rolling herd averageincrease, and is less likely in the warm Alfisolregion and when information is obtained fromfarming magazine articles. Other manurehandling systems rarely were listed as mosttypical, but were employed on many farms.Overall, manure storage facilities need to beemptied an average of twice a year, with a rangeof 1 to 26 times per year.
Minnesota dairy farmers are more likely tospread manure before seeding perennial forageswhen the typical manure source is manure packin livestock facilities. Manure application bothbefore seeding and as a topdressing onestablished forage stands is more likely withlarger herds and on farms in the cold Alfisolarea. Farmers are less likely to apply manure toperennial forages when a larger percentage oftheir forages received commercial fertilizer.Topdressing manure is less likely the morefarmers rely on independent consultants forinformation on recommended fertilizer rates.
Figurs 2. Primary, or most typical (dark bars), andsecondary (gray bars) types of manure management usedon Minnesota dairy farms. Results of a survey done in1996.
0
10
20
30
40
50
Manure management
Primary Secondary

10 U.S. Dairy Forage Research Center
Topdressing manure on established grasses isless likely at higher rolling herd averages. About10% of the respondents indicated that theytopdressed at least a portion of their manure onforages during winter, but at least twice as manyspread manure only during the growing season.The most frequently given reasons fortopdressing manure on established perennialforages included the opportunity to spreadmanure in summer and to make good use ofnutrients. In contrast, at least 20% of therespondents said that lack of time, lack ofuniformity in spreading manure, increased weedproblems, and lack of manure (due to use onother crops) were reasons for not topdressingmanure on all perennial forage fields.
Although most dairy farmers reported using soiltest results for information on fertilizer rates, thefertilizer dealers most frequently helped interpretthat information. Farmers rely more on fertilizerdealers when they have more grass pasture,typically use a daily or frequent haul system formanure, and fertilize a higher proportion of theirforage land. However, those who said pasturingtheir livestock is a typical way of managingmanure are less likely to depend on employees ofa fertilizer dealership for fertilizerrecommendations. Similarly, farmers are morelikely to use information from independent cropconsultants when they fertilize a larger
proportion of their forage land but also whenthey have larger herds. Those dairy farmers whospread manure on established forage stands areless likely to use an independent crop consultantfor fertilizer recommendations. Extension, farmmagazines, and experience were listedinfrequently as the most important sources ofinformation on forage fertilization.
ConclusionBetter knowledge of on-farm forage fertilizationpractices is needed to direct our future researchand education efforts. As with all research,results of this survey should be verified byfollow-up work in Minnesota and other states,and other areas where temperate forages aregrown. This survey confirms earlier reports thatmany dairy farms have high soil test levels for Pand K. Very high soil P concentrations may bereason to limit application of manure on thesefields in order to preserve or improve surfacewater quality. Improved awareness of nutrientneeds should increase the yield, persistence, andquality of perennial forages and improve theviability of livestock farming. Because fertilizerdealers are the most important source of nutrientrecommendations to dairy producers inMinnesota, providing them with the latestinformation on nutrient management likely willresult in the most rapid transfer of thisinformation to farmers.

1996 Research Summaries 11
Nitrate Uptake Kinetics of Ineffectively and Effectively Nodulated AlfalfaJ.M. Blumenthal, M.P. Russelle and C. Bernasconi
IntroductionAlfalfa is one of the most important legumecrops in temperate climates. It has high herbageyield and symbiotic N2 fixation potential, isdeeply rooted and provides high economicreturns per unit land area. Efforts are under wayto develop alfalfa for specific environmentalquality goals, such as improved uptake of subsoilNO3. Alfalfa forms a symbiosis with Rhizobiumbacteria, which fix N2 from the atmosphere, butalfalfa also absorbs inorganic N from the soilsolution.
Because symbiotic N2 fixation requires moreenergy than absorption and reduction of NO3, thegeneral understanding has been that legumesabsorb inorganic N in preference to fixing N2
gas. Research by our group has shown thatalfalfa continues to fix atmospheric N2, evenwith high rates of N fertilizer. Moreover, fieldexperiments have demonstrated that ineffectivelynodulated alfalfa, which cannot fix N2 gas,absorbs NO3 more efficiently than alfalfa witheffective nodules. Greater NO3 absorptionoccurred even when herbage yields of theineffectively nodulated alfalfa were smaller thanthose of the effective types. The objective of thisstudy was to determine whether NO3 uptakekinetics could explain the disparity betweenthese alfalfa types.
Materials and MethodsPlants of two effectively nodulated alfalfagermplasms, Saranac and Agate, and twoineffectively nodulated alfalfa germplasms,Ineffective Saranac and Ineffective Agate, weregrown from seed for seven weeks in sand culturein the greenhouse, shoots were harvested about 5cm above the crown, and plants selected foruniformity were transplanted individually intopots (PVC; 7.5 cm diam. by 30 cm long) filledwith approx. 1200 mL nutrient solutioncontaining 2 mg NO3-N L-1. The nutrient solutionwas aerated constantly and exchanged every 3 d.
The plants were inoculated with Rhizobiummeliloti strain 102F51. The plants weretransferred to a growth chamber one week beforeNO3 uptake kinetics were measured with day/night cycles of 14h/10h at constant 25° C and arelative humidity of ~ 90%. Photosyntheticphoton flux during the day cycle was 550 µmolphotons m-2 s-1 measured at the top of the canopy.
Two experiments were conducted. In the first,measurements were made on plants that received2 mg NO3-N L-1 every 3 d. Under suchconditions the ineffective alfalfa germplasmswere severely N deficient. To assay plantssubjected to less N stress, a second experimentwas conducted with plants receiving 2 mg NO3-N L-1 daily for 2 wk before the assay period. Twohours after onset of the light period, the nutrientsolution in the pots was exchanged with solutioncontaining 0.6 mg NO3-N L-1, the weight of thepots was recorded, and starting 1 h later thesolution was sampled (2 mL) every 10 min forthe next 7 h, after which the weight of the potwas determined. Net decline in pot weightprovided an estimate of H2O transpiration. Thefollowing morning the nutrient solution wassampled again and the plant was harvested.Nitrate in the nutrient solution samples wasmeasured spectrophotometrically, and total plantdry mass, Kjeldahl N concentration, and potweight were determined. The time course of NO3
disappearance from the nutrient solution was fitto a Lineweaver-Burke plot to determine theparameters of apparent Michaelis-Menten nitrateuptake kinetics.
Results and DiscussionIn both experiment 1 and experiment 2 (Table 1),Saranac had the highest shoot yield and Ncontent. Shoot yield and N content of Agate wereintermediate. Shoot yield and N content of thetwo ineffectively nodulated, non-N2-fixinggermplasms were lowest and not different fromone another. The ineffective germplasms were N

12 U.S. Dairy Forage Research Center
limited in both cases, resulting in 70% less shootyield and 85% less shoot N content inexperiment 1 and 67% less shoot yield and 82%less shoot N content in experiment 2,respectively, as compared to Saranac. However,the ineffective germplasms showed higheraffinity for uptake of NO3. In experiment 1, Cmin,the minimal concentration of NO3 below whichthere was no net uptake of NO3, of theineffective germplasms was one half that ofSaranac and in experiment 2 Cmin remained 22%lower than that of the N2-fixing germplasms. Theterm Imax is the maximal uptake of NO3 fromnutrient solution by the plant when NO3concentration is nonlimiting (approx.concentration of NO3 in the nutrient solution > 2Km). The ineffective germplasms had 126%higher Imax in experiment 1 and 171% higher Imax
in experiment 2, respectively, than the effectivegermplasms. Additionally, we found differences
in the water use efficiency between the effectiveand ineffective germplasms. The ineffectivegermplasms transpired 37% more water per unitshoot weight than the effective germplasms (2.60vs. 1.95 g H2O g shoot DM-1 h-1).
ConclusionResults of this study clarify the underlyingphysiological differences that lead to higher NO3uptake efficiency of ineffective alfalfa than N2-fixing alfalfa we observed in the field.Ineffective alfalfa can deplete the nutrientsolution to a lower NO3 concentration and has ahigher maximal NO3 uptake capacity thaneffective alfalfa. Moreover, ineffective alfalfatranspired more water per unit shoot weight thaneffective alfalfa regardless of N nutrition. Higherwater use in the field will cause more NO3 tomove to the roots, thereby increasing NO3availability for uptake.
Table 1. Shoot yield, shoot N content, and NO3 uptake parameters of effectively and ineffectivelynodulated alfalfa germplasms. Plants received 2 mg NO3-N L-1 in nutrient solution every 3 d (Exp.1) or every d (Exp. 2), respectively, before the uptake measurements. (n = 6).Germplasm Shoot dry weight Shoot N content Cmin Km Imax
g shoot-1 mg N shoot-1 µM µM µg N min-1 plant-1
Exp Exp Exp Exp Exp1 2 1 2 1 2 1 2 1 2
Saranac 5.6 7.3 120 240 19 19 22 24 1.5 2.0Agate 4.9 5.4 100 160 16 20 19 24 2.2 2.1Ineffective Saranac 1.8 2.7 20 50 11 15 15 21 4.2 5.8Ineffective Agate 1.6 2.1 20 40 9 16 13 21 4.2 5.2
LSD0.05 0.7 1.4 30 30 4 2 3 2 1 2

1996 Research Summaries 13
Nitrate Losses Through Subsurface Tile Drainage in CRP, Alfalfa, and RowCrop SystemsG.W. Randall, D.R. Huggins, M.P. Russelle, D.J. Fuchs, W.W. Nelson and J.L. Anderson
IntroductionDrainage of excess water from the soil profilethrough subsurface tiles commonly is used toimprove crop production on poorly-drained soils,particularly in the Upper Midwest. This drainagewater can carry dissolved nutrients, suspendedsediment, and pesticides from the field, andsubsequently impact surface and ground water.Although nitrate-N (NO3-N) losses have beenmonitored under fertilized crops in many areas,there is little information about the impact ofperennial species, such as alfalfa and mixturesplanted for the Conservation Reserve Program(CRP). Because perennial crops typically usemore water than annual crops, and becauseneither CRP nor alfalfa receive fertilizer Ninputs, we hypothesized that NO3-N losseswould be lower than when more typical annualrow crop rotations were grown.
MethodsThe experiment was conducted on a moderatelywell drained Normania clay loam (AquicHaplustoll) at the University of MinnesotaSouthwest Experiment Farm at Lamberton, MN,from 1988-1993. Subsurface tiles had beeninstalled in 1972 to allow monitoring of drainagein 15 individual 14- by 15-m plots, which wereisolated to a depth of 1.8 m by 12-mil plasticsheeting. Five cropping treatments [continuouscorn (C-C), corn after soybean (Sb-C), soybeanafter corn (C-Sb), alfalfa (Alf), and CRP] wereestablished in the spring of 1988 in threereplicates as a randomized, complete blockdesign. Recommended hybrids, rates of seeding,fertilizer, and pesticides, tillage practices, andharvest schedules were used for grain (C-C, C-Sb, Sb-C) and hay (Alf) production.
No supplemental irrigation was provided. Tileflow rates and NO
3-N concentrations weremeasured and flow-weighted NO3-Nconcentration was calculated. Total above
ground dry matter and total N were measured,with estimates from 1-m2 subplots in theotherwise undisturbed CRP plots. Standardanalysis of variance was used to comparetreatments.
ResultsGrowing season rainfall during the first twoyears was only 64 and 73% of the normal 530mm, which limited crop yields, prevented tiledrainage, and reduced stored soil water reserves.Tile flow did not resume until late May 1990.Above normal precipitation (by 13 to 66%) inthe last three years resulted in higher yields(except in the cool 1993 season) and plentifultile flow.
Above ground dry matter yields ranged up tonearly 15 Mg/ha in the corn plots (Fig. 1), ofwhich about 58% was grain. Soybean yieldsranged up to 10 Mg/ha, with an average of onethird as bean dry matter. Alfalfa herbage yieldspeaked at 11.9 Mg/ha, whereas CRP standingabove ground biomass attained only 5.3 Mg/ha.There was a close relationship between drymatter and N in the above ground crop (Fig. 1),but the slope for corn was only one third as steepas for alfalfa and soybean. These results supportearlier conclusions that greatest potential Nremoval can be achieved with high yieldingperennial forage species, like alfalfa. Bothlegumes likely fixed some atmospheric N
2, whileabsorbing some of the available soil N, but wecannot determine how much fixation or uptakeoccurred in this experiment. Alfalfa and CRPhad about 65% less residual soil NO3-N to adepth of 1.5 m in autumn than C-C, and corn/soybean rotations had about 17% less than C-C.In both cases, lower fertilizer N inputs may havecontributed to lower residual soil Nconcentrations. Less water also was present inthe soil profile in autumn under perennial cropsthan annual crops in all years but the wettest

14 U.S. Dairy Forage Research Center
(1993). Soil water reserves were reduced todepths of 3 m under alfalfa and 2.4 m underCRP.
As a result of increased water use and lower soilNO3-N concentrations, NO3-N loss in tiledrainage was insignificant under both alfalfa andCRP, regardless of drainage flow (Fig. 2). Incontrast, there was a close relationship betweenNO3-N loss and water drained in the annualcrops up to about 250 mm annual drainage. TotalNO3-N losses through tile drainage over the 6 yrperiod were 218 kg N/ha in C-C, 203 kg N/ha forcorn/soybean rotations, 7 kg N/ha for alfalfa, and4 kg N/ha for CRP. These losses represent about25% of the fertilizer N rate applied to the annualrow crop systems.
Flow-weighted NO3-N concentration in tiledrainage water during this study averaged 32 mgNO3-N/L in C-C, 24 mg NO3-N/L in the corn/soybean rotation, 3 mg NO3-N/L in alfalfa, and 2mg NO3-N/L in CRP. In nearly all monthly time
periods measured, the perennial cropsmaintained drainage water quality toconcentrations below the public health limit of10 mg NO3-N/L.
ConclusionsIn this experiment, we used the best practicesavailable to optimize crop production andprofitability, but NO3-N concentrations in tiledrainage water exceeded the public health limitin most instances under annual row cropping.Therefore, a production system of annual rowcrops on highly productive soils where biologicalinfluences can be significant will have difficultyattaining drainage water quality goals, evenwhen prudent N fertilization is followed. Addingperennial species to the crop rotation will helpreduce NO3-N losses in tile drainage. In addition,perennial crop species will reduce the volume ofwater delivered to surface water through thesedrainage systems, thereby helping reduce floodpotential in these areas.
Figure 2. Relationship between annual flux of water andNO
3-N through subsurface drainage tiles in five cropping
treatments at Lamberton, MN, 1988-1993. In the corn/soybean rotation, data were obtained from the soybeanphase in C-Sb, and from the corn phase in Sb-C.
Figure 1. Relationships between above ground biomassyields and N content in five cropping treatments atLamberton, MN, 1988-1993. In the corn/soybean rotation,data were obtained from the soybean phase in C-Sb, andfrom the corn phase in Sb-C. Regression lines were fit toalfalfa and soybean data or to corn data; CRP wasomitted from both equations. Each regression had an R2 >0.87.

1996 Research Summaries 15
Forage Quality Characteristics of Inbred Corn Lines and Their Derived HybridsD.D. Redfearn, D.R. Buxton, A.R. Hallauer and J.R. George
of agronomically elite inbreds and their derivedhybrids.
Materials and MethodsTwelve elite inbreds from the ARS/Iowa StateUniversity corn breeding program were used todevelop twelve single-cross hybrids. Theseinbreds were B57, R227, NC258, Mo17, N28,B94, NC272, B52, B64, NC262, B79, andLAN496. Each inbred was used twice as a hybridparent. Then, a replicated field study wasconducted during 1994 and 1995 at Iowa StateUniversity Agronomy and AgriculturalEngineering Research Center near Ames toevaluate both the inbreds and hybrids. Foragequality traits were measured by standardmethods on both stover and whole-plant forage.Additionally, samples were fermented for 24 and96 h to estimate the rapidly degraded neutraldetergent fiber (NDF) and potentially degradableNDF fractions, respectively. The residual NDFratio at 24 to 96 h was used as an estimate forrate of fiber digestion.
Results and DiscussionGenotypic variation for in vitro dry matterdisappearance (IVDMD), NDF, and lignin/NDFwere greater in stover and whole plant forage ofthe inbreds than in the hybrids. Additionally,whole-plant forage had larger genotypic rangesthan stover. Generally, single-crosses of highforage quality inbreds resulted in high foragequality hybrids for whole plants (Fig. 1) with apoorer relationship in the stover (Fig. 2). Therewas a poor relationship between the estimate ofrate of fiber digestion in the inbreds and hybrids.Significant genotype x year interactions occurredfor several traits. NDF concentration explainedless than 40% of the variation in stover IVDMDof both inbreds and hybrids. However, NDFconcentration explained 62% of the variation forinbred whole-plant and 78% for hybrid whole-plant IVDMD.
IntroductionCorn is becoming more important as a foragecrop in the United States. Up to 10% of the cornacreage is harvested as whole-plant silage. Thedecision regarding whether corn will beharvested for silage, however, is usually notmade at the time of planting. This decision isoften based on availability of forage fromperennial forage crops such as alfalfa. This, inturn, depends on how well perennial foragessurvived the previous winter and how favorablegrowing conditions were during the current year.Corn stover (aboveground vegetation less ears)following grain harvest can also be an importantfeed resource for beef animals and sheep eitheras grazed forage or as conserved baled forage.Breeding programs emphasizing thedevelopment of corn hybrids specifically forforage have generally had low priority in theUSA. Some companies have initiated breedingprograms for improved corn forage in the USAand other companies evaluate forage quality oftheir hybrids and report this information topotential customers. Historically, those hybridswith high grain yields and high grain-to-stoverratios have been recommended as most suitablefor forage. Nearly one-half of the abovegrounddry matter of corn is stover. Thus, it should notbe surprising that stover digestibility also greatlyinfluences overall corn forage quality.Additionally, animals fed corn stover wouldbenefit from plants developed for higher stoverdigestibility.
Information is needed on the relationshipbetween forage quality characteristics of corninbreds and their derived hybrids to increase theefficiency in developing corn hybrids for highforage quality. Decreasing fiber concentration orincreasing fiber digestibility are the two moststraightforward methods for increasing foragedigestibility. This study was conducted todetermine the relationship among forage quality

16 U.S. Dairy Forage Research Center
DiscussionGiven greater variation in forage quality amonginbreds than hybrids and the positive relationshipbetween whole-plant inbred and hybriddigestibilities, evaluating differences inagronomically elite inbreds should be animportant criterion for selecting inbreds todevelop hybrids with improved forage quality.Because of year x genotype variation, hybridswill need to be evaluated in severalenvironments. The consistently negativerelationship between fiber concentration anddigestibility suggests that reduction of NDF maybe an effective means of initially improvingdigestibility of forage corn. The lack ofrelationship between inbred rate of fiberdigestion and hybrid rate of fiber digestionsuggests that rate of digestion should bedetermined on hybrids. Additional research isneeded to determine the stability of theserelationships with other elite inbreds andenvironments. Because of the uncertainty ofwhether a hybrid will be used for forage at thetime of planting, most forage hybrids will needto have high grain yield as well as high foragequality.
Figure 1. Relationship of stover digestibility of inbredparental average (mid parent) to that of the derivedhybrid.
Figure 2. Relationship of whole plant digestibility ofinbred parental average (mid parent) to that of the derivedhybrid.

1996 Research Summaries 17
Economic Feasibility of Growing Forage Biomass Crops in IowaA. Hallam, I.C. Anderson and D.R. Buxton
IntroductionToday�s primary energy resources of oil, coal,and natural gas are non-renewable. Besides beingexhaustible, there is growing consensus thatenvironmental concerns about global warming,air pollution, and acid rain are caused bycombusting these fossil fuels. Much research isnow focused on developing alternative energyresources that are renewable, dependable, safe,and environmentally sound. One such alternativeis energy from biomass crops. Biomass can beused to generate electricity either by directburning or co-firing with coal. It also can befermented to a liquid fuel such as ethanol.Several forage crops are leading candidates asbiomass crops. Development of such energycrops would result in alternative uses for landand forage crops. Despite its renewability andenvironmental sustainability compared withfossil fuels, biomass has not been widelyaccepted as a primary energy source because ofits relative high price. One of the most expensiveaspects of biomass energy is the cost ofproducing the biomass crop. This studyevaluated the cost of producing several biomasscrops in Iowa to identify those that can be grownat the lowest price per ton of biomass.
Materials and MethodsEnterprise budgets were calculated for severalcrops and cropping systems based on yields fromexperimental plots grown for five years at twosites in Iowa. The first site is in central Iowa on alow erosive, highly productive soil having aLand Use Capability Classification of I. Thesecond is in southern Iowa on a lower productivesoil with a Land Use Capability Classification of
III. Machinery costs were based on average Iowaequipment use. Alfalfa was assumed to receiveadequate phosphorus and potash duringestablishment for the life of the stand. Othercrops received annual applications of fertilizer.
Results and DiscussionResults for four of the crops studied arepresented in Tables 1 and 2. For this comparison,alfalfa was harvested three times per year, reedcanarygrass twice, and switchgrass and foragesorghum were harvested once per year. Sorghumhad the lowest break-even price in both centraland southern Iowa followed closely byswitchgrass. Land cost is an important factor inproduction cost estimation. It accounted for morethan 30% of all production costs. Land costswere higher in central Iowa than in southernIowa because of the higher capability of the soil.Because of the lower land price in southernIowa, the break-even price was generally lowerin southern Iowa. The soils in southern Iowawere sloping and would result in serious soilerosion when an annual crop such as sorghum isgrown.
ConclusionsForage sorghum is the most suited crop forbiomass production in central Iowa. Even thoughit was the cheapest to produce in southern Iowa,potential for soil erosion on these sloping soilswould limit production there. In southern Iowa,switchgrass may be the most suitable forgrowing low cost biomass and still protect thesoil from erosion because of its perennial natureand sod forming root system.

18 U.S. Dairy Forage Research Center
Table 2. Estimated annual production cost ($/acre) in southern Iowa.Item Alfalfa Reed canarygrass Switchgrass Forage sorghumYield (t/ac) 3.99 4.34 4.61 7.41Direct expense
Phosphorus 8.00 8.00 14.50Potash 15.98 15.98 7.99Nitrogen 15.00 15.00 15.00Herbicide 3.62 15.76Seed 2.45Operator labor 14.97 11.45 6.07 13.18Fuel 7.42 5.82 3.10 8.45Implements 14.24 10.71 5.52 10.59Tractors 8.97 7.08 3.77 10.19Interest 1.10 2.60 2.36 2.61Transportation 16.56 18.01 19.13 30.75 Total 66.89 94.65 78.93 131.47
Fixed expensesImplements 15.38 12.21 6.38 19.97Tractors 15.92 12.57 6.69 18.09Land 80.00 80.00 80.00 80.00 Total 111.30 104.78 93.07 118.06
Establishment cost (prorated) 62.07 12.34 8.04Total expenses 240.26 211.77 180.04 249.53Break-even price ($/ton) 60.22 48.79 39.05 33.67
Table 1. Estimated annual production cost ($/acre) in central Iowa.Item Alfalfa Reed canarygrass Switchgrass Forage sorghumYield (t/ac) 4.85 3.67 4.97 7.01Direct expenses
Phosphorus 8.00 8.00 14.50Potash 15.98 15.98 7.99Nitrogen 15.00 15.00 15.00Herbicide 3.62 15.76Seed 2.45Operator labor 14.97 11.45 6.07 13.18Fuel 7.42 5.82 3.10 8.45Implements 14.24 10.71 5.52 10.59Tractors 8.97 7.08 3.77 10.19Interest 1.14 2.58 2.36 2.60Transportation 20.13 15.23 20.63 29.09 Total 70.50 91.85 80.43 129.81
Fixed expensesImplements 15.38 12.21 6.38 19.97Tractors 15.92 12.57 6.69 18.09Land 115.00 115.00 115.00 115.00 Total 146.30 139.78 128.07 153.06
Establishment cost (prorated) 65.89 15.92 5.63Total expenses 282.69 247.55 214.13 282.87Break-even price ($/ton) 58.29 67.45 43.08 40.35
1996 Research Summaries 19
Residual Cropping Effects on Corn Grain YieldI.C. Anderson, D.R. Buxton, D.L. Karlen and C. Cambardella
IntroductionCropping systems are known to have residualeffects on soil quality and the productivity offollowing crops. Many of these effects have notbeen quantified for a range of cropping systems.This study was conducted to evaluate the effectof growing several annual and perennial crops onsubsequent corn production.
Materials and MethodsCorn was grown on plots following 6 yearsduring which one of 13 cropping systems wasgrown. The cropping systems were:
1. ‘Arrow’ alfalfa with subplots managed foreither two or three cuts per yearcommencing the year followingestablishment.
2. ‘Venture’ reed canarygrass harvested twiceper year, with subplots fertilized annuallywith 0, 70, 140, or 280 kg N ha-1 beginningthe year after establishment.
3. ‘Cave-in-Rock’ switchgrass harvested onceper year, with subplots fertilized annuallywith 0, 70, 140, or 280 kg N ha-1 beginningthe year after establishment.
4. ‘Sunny View’ big bluestem harvested andfertilized as described for Cropping System3.
5. ‘M-81E’ sweet sorghum harvested once peryear, with subplots fertilized with 0, 70,140, or 280 kg N ha-1.
6. ‘FFR 201’ forage sorghum (sorghum xsudangrass) planted, harvested, andfertilized as described for Cropping System5.
7. ‘Aroostock’ winter rye planted near midOctober and harvested at anthesis duringthe succeeding mid May, followed by M-81E sweet sorghum planted in late May orearly June. Subplots were fertilized with 0,70, 140, or 280 kg N ha-1. Half the N wasapplied in late March and the remainderbefore sorghum planting. The sweetsorghum was harvested in late September.
8. As described for Cropping System 7 butFFR 201 forage sorghum was plantedinstead of sweet sorghum.
9. ‘Pioneer 3377’ corn harvested for grain(with stover also removed). Subplots werefertilized with 0, 70, 140, or 280 kg N ha-1.This cropping system was in a 3-yr rotationwith soybean (Cropping System 10) andwinter rye/sweet sorghum (CroppingSystem 11). Corn followed rye/sorghum inthe rotation.
10. ‘Hack’ soybean grown in a 3-yr rotationwith corn and winter rye/sweet sorghum.Soybean followed corn in the rotation andwas harvested for grain with the stover alsobeing removed.
11. Winter rye/sweet sorghum or winter rye/forage sorghum grown in a 3-yr rotationwith soybean and corn. Subplots eithercontained or did not contain winter rye incombination with two N fertilization rates,70 or 140 kg ha-1. This cropping systemfollowed soybean in the rotation.
12. M-81E sweet sorghum or FFR 201 foragesorghum intercropped into Arrow alfalfabeginning the year after alfalfa wasestablished. Two subplots were planted tosweet sorghum and two to forage sorghum.Each sorghum was fertilized with 70 or140 kg N ha-1.
13. As described for Cropping System 12 butsweet and forage sorghum wereinterplanted into Venture reed canarygrassinstead of alfalfa.
Cropping Systems 9, 10, and 11 were in rotationas described. All other cropping systems were onthe same plots each year. In the fall of 1993,perennial grasses and alfalfa were sprayed with aherbicide and the entire site was moldboardplowed. In late April 1994, Pioneer 3377 cornwas planted. After the plants were established,224 kg N ha-1 from urea ammonium nitrate wereapplied to half of each plot.

20 U.S. Dairy Forage Research Center
Results and DiscussionExcept corn following switchgrass, 224 kgcurrent N ha-1 (N applied in 1994) resulted innear maximal grain yields regardless of theprevious cropping system and previous Napplication rate. Highest corn yields occurredfollowing alfalfa. There were marked carryovereffects of previous N. Averaged for the eightcropping systems that received four rates of Nyearly (Cropping Systems 2-9), corn grainaveraged 7.6 t ha-1 when the previous croppingsystems received no N and no current N wasapplied. When no current N was applied, corngrain yields increased 12, 29, and 41% when theprevious cropping systems received 70, 140, and280 kg N ha-1, respectively. Application of 224kg N ha-1 to plots that had not received N for 6years increased corn yields by 71%. Thecarryover effect of previous N was particularlystrong for corn following the three perennialgrasses (Cropping Systems 2-4). Corn yieldsincreased 44, 77, and 97% over the unfertilizedchecks when the three previous perennial grasseswere fertilized with 70, 140, and 280 kg N ha-1
per year, respectively. This response is illustratedfor reed canarygrass in Fig. 1. The four croppingsystems that contained sorghum (5-8) hadsmaller carryover effects. Average corn yieldswere increased -2, 5, and 11% over theunfertilized checks when the previous crops werefertilized with 70, 140, and 280 kg N ha-1,respectively. This type of response is illustratedin Fig. 2 for corn following forage sorghum. Wewere unable to document any consistent effectsof the cropping systems on soil aggregatestability or nitrate N in the soil profile before thecorn was planted.
Alfalfa has strong positive carryover effects onsubsequent corn production. Much of this can beaccounted for by the fixed N, but there appearedto be an effect beyond the N effect. Theperennial grasses had marked N carryovereffects. N was probably tied up by the rootsystem of these crops and was released to thecorn as the root systems decomposed. Ncarryover effects from sorghum were muchsmaller.
Figure 1. Corn grain yield following 6 years of reedcanarygrass fertilized at four rates of nitrogen. The corncrop received 0 or 224 kg N ha-1.
Figure 2. Corn grain yield following 6 years of foragesorghum fertilized at four rates of nitrogen. The corn cropreceived 0 or 224 kg N ha-1.

1996 Research Summaries 21
Performance of Sweet and Forage Sorghum Grown in Monoculture, DoubleCropped with Winter Rye, or in Rotation with Soybean and CornD.R. Buxton, I.C. Anderson and A. Hallam
IntroductionPotential for soil erosion restricts sorghumgrown for forage or biomass to soils with littleslope. Furthermore, because most of theaboveground crop is removed, soils may be atrisk for water and wind erosion, and leaching ofsoil nitrate from the time sorghum is harvesteduntil the next crop is planted and established;more than 6 months in the North Central Regionof the United States. Double cropping withwinter annuals after sorghum harvest can providesoil protection during the winter and followingspring, tie up excess soil N, increase waterinfiltration, and may increase total biomass yieldper year. Early spring growth of winter annuals,however, depletes soil moisture and may limitsubsequent crop production. Winter rye is apotentially complementary double crop tosorghum. It is the most winter-hardy of the smallgrains and can provide high-quality forage.Winter rye can be seeded in fall after sorghumand become established before late-fall andwinter temperatures prevent growth anddevelopment. It initiates new growth in latewinter and early spring so that considerablebiomass is produced before soil temperatures arewarm enough to plant sorghum. This study wasconducted to determine yield potential andcomposition of sweet and forage sorghum grownalone and when these sorghums are doublecropped with winter rye and to determine theeffect of growing sorghum in successivemonoculture in relation to sorghum grown in a3-year rotation with corn and soybean.
Materials and MethodsThe experiment was conducted for fiveconsecutive years on a Harps soil in central Iowanear Ames with a slope of less than 1% and onmixed Clarinda, Clearfield, and Grundy soils insouthern Iowa near Chariton with 2 to 7% slope.‘M-81E’ sweet sorghum and ‘FFR 201’ foragesorghum (sorghum x sudangrass) were grown in
monoculture or double cropped with ‘Aroostock’winter rye at four levels of N fertilization.Additionally, sweet sorghum, in a 3-year rotationwith corn and soybean, was grown alone ordouble cropped with winter rye.
Results and DiscussionSole forage and sweet sorghums were onlymoderately affected by N fertilization withaverage yields of 13.5, 16.1, 16.9, and 15.9 t ha-1
when fertilized with 0, 70, 140, and 280 kg Nha-1, respectively. Conversely, rye/sorghum wasextremely responsive to N, with highest yields at280 kg N ha-1. Winter rye yields averaged 3.0,4.1, 4.6, and 5.0 t ha-1 and rye/sorghum yieldswere 72, 84, 95, and 110% of sole sorghumfertilized annually with 0, 70, 140, and 280 kg Nha-1. Rye/sorghum yields were particularlysensitive to droughts. The low yield of rye/sweetsorghum relative to sole sweet sorghum during adrought year is illustrated in Fig. 1. Conversely,the high yield of rye/sweet sorghum during a wetyear is shown in Fig. 2. Sweet sorghum grown inmonoculture had yields similar to sweet sorghumgrown in the 3-year rotation. Estimated annualsoil erosion for sole sorghum determined byusing the Universal Soil Loss Equation was 5 tha-1 in central Iowa and 35 t ha-1 in southernIowa. Planting rye before sorghum reduced theestimated loss to 3 t ha-1 in central Iowa and 22 tha-1 in southern Iowa. Fiber concentration washigher in winter rye than in sorghum.Composition of sorghum was stronglyinfluenced by environmental conditions of thestudy.
ConclusionsWinter rye can reduce potential soil erosion, butrye/sorghum yields are much more dependent onN fertilization and soil moisture than is solesorghum. Though reduced, erosion was still toohigh to allow rye/sorghum production on thesloping soils of southern Iowa. Below normal

22 U.S. Dairy Forage Research Center
rainfall resulted in rye/winter yields that wereconsistently lower than those of sole sorghum.Including sweet sorghum in a 3-year rotationwith corn and soybean had only limited impact
on sole sweet sorghum production comparedwith sorghum grown repeatedly on the sameplots for 5 years.
Figure 1. Yield of winter rye, winter rye plus doublecropped sweet sorghum, and sole sweet sorghum at twolocations in Iowa during a drought year.
Figure 2. Yield of winter rye, winter rye plus doublecropped sweet sorghum, and sole sweet sorghum at twolocations in Iowa during a wet year.

1996 Research Summaries 23
Management of Mixed Species Pastures Under Rotational Grazing: ForageAvailability, Nutritional Quality and Species CompositionV.R. Kanneganti, R.P. Walgenbach and L.J. Massingill
IntroductionIncreasing numbers of livestock producers areconsidering grazing as a low-cost, profitablealternative to conventional dairying. Thisawareness has increased the demand forinformation on integrating pasture as asignificant component of on-farm feedproduction. Mixed species pastures constitute alarge and under-utilized resource on manylivestock farms in the northeastern and northcentral U.S. These pastures are dominated bycool season species and are often termed as�natural� (i.e., not planted or tilled in a longtime) or �permanent� pastures. Under goodgrazing management, these pastures have thepotential to persist indefinitely while producingforage profitably.
In New Zealand and Europe, information onforage available for daily intake under grazing isprovided to livestock producers for feedbudgeting or enterprise planning. Thisinformation enables producers to match animalfeed requirements with forage availability, whichminimizes wasteful overfeeding of supplementswhile reducing feed costs and nutrientoverloading on farms. Such information is scantfor managing pastures profitably in the region.
The objective of this study was to providelivestock producers practicing intensiverotational grazing with quantitative estimates offorage available for daily intake by cattle grazinga mixed-species pasture.
Materials and MethodsGrazing management. A 50-acre pasture,located in Prairie du Sac, WI, was managedunder a typical system of rotational grazing withlactating cows during May to October in 1994and 1995. Rotation length was about 17 dayseach for grazing cycles 1 and 2, and about 30days each for the other cycles. A new paddock
was grazed each day. Forage allocation andanimal movement were managed based onpasture height. Pasture height just before grazingaveraged 7.1 inches while the stubble left behindafter grazing measured 3.7 inches. Thecorresponding biomass amounts were 3373 and2115 lb/acre. The pasture height was measuredwith a �rising� plate meter 12 in. x 12 in. whichexerted a pressure of 0.51 lb per square foot onthe canopy. To promote legume growth, fertilizerN was limited to 60 lb N/acre/yr, which wasapplied in two equal splits during the third andfifth grazing cycles.
Forage sampling. Forage availability, foragenutritional quality and species composition weremeasured across the grazing season on two 1-acre paddocks. Forage availability wascalculated as: G
i=(Ws-Wo)/Tr , where, Gi is theforage availability during cycle, i (lb/acre/d), Wo
(lb/acre) is the post-grazing biomass and Ws (lb/acre) is the pre-grazing biomass measured after aregrowth duration of Tr (d). Forage availabilitydata presented in Fig. 1 and Table 1 representdaily amount of forage dry matter available forintake during a grazing cycle.
Nutritional quality of forage consumed wasestimated as: Qint = (Qs×Ws - Qe×We)/(Ws-We),where Qs and Qe stand for crude protein (CP),neutral detergent fiber (NDF) or acid detergentfiber (ADF) as % dry matter in forage harvestedbefore or after grazing, respectively. We (lb/acre)represents post-grazing biomass, and isequivalent to Wo for cycle, i+1. Qint representsquality of forage consumed (CP, NDF or ADF,% dm).
Results and DiscussionApplied questions. What is the daily amountand quality of forage available for intake from arotationally grazed mixed species pasture?

24 U.S. Dairy Forage Research Center
Quantitative estimates of forage available fordaily animal intake measured across the grazingseason are shown in Fig. 1 and Table 1. In mostyears, soil moisture may not be limiting pasturegrowth until late June, because soils arerecharged with water from snow and early springrains. Consequently, forage availability may beexpected to be fairly uniform during this period.For the period of June-September, forageavailability varies depending upon the durationand severity of moisture stress. Due to betterdistribution of rainfall during much of thegrazing season in 1994, estimates of forageavailability for 1994 may be representative of a�normal� year or a year with adequate rainfallwhile the data obtained in 1995 may reflectforage availability under extended periods of dryweather during summer. During September andOctober, temperature and light may be morelimiting than soil moisture, and forageavailability seems to drop steadily to about 10 lb/acre/d by the end of October.
Under adequate moisture conditions, thesepastures have the potential to provide 3.8 t/acreof forage dry matter for intake under rotationalgrazing in a year (Table 1). Nutritional quality offorage consumed during the grazing season isshown in Table 2. Averaged over the years,forage consumed contained 22% CP, 45% NDFand 24% ADF.
What is the effect of intensive rotational grazingon species composition of the pasture?
Averaged over the two years, pasture dry matterwas composed of 22% Kentucky bluegrass, 33%all other grasses combined (mostly smoothbromegrass and quackgrass), 13% legumes(mostly white clover), 27% dead matter and 5%all other species combined (Fig. 2). While moreyears of data are required to accurately assess theimpact of rotational grazing on speciescomposition, our data indicated little change inpasture composition during the grazing season,except under extended periods of drought. Underintense and long periods of dry weather whichwere observed in late August and September of1995, dead matter fraction in the pastureincreased to more than 50% while grass
0
20
40
60
80
100 1994Pdk: APdk: B
90 120 150 180 210 240 270 300
Day of Year
0
20
40
60
80
100
Fora
ge A
vaila
bilit
y (l
b/ac
re/d
)
1995 Pdk: APdk: B
APR MAY JUN JUL AUG OCTSEP
Figure 1. Forage available daily for animal intake underrotational grazing in 1994 and 1995. (Vertical barsrepresent standard error of mean.)
and legume fractions declined (Fig. 2). Bluegrassand white clover suffered the most underdrought, but they recovered quickly to theiroriginal percentages upon return of favorablemoisture conditions. Consequently, the pasturecomposition may remain fairly stable from yearto year under the system of grazing managementimposed even though significant but transientchanges were observed within a grazing season.
However, under extended drought conditions,grazing low into the stubble may risk intake ofpoor quality forage because of the excessiveamount of dead material in the forage.

1996 Research Summaries 25
Table 1. Daily and seasonal forage availability under rotational grazing in1994 and 1995.
Forage availability1994 1995
Grazing Grazingperiod cycles1 Daily Period Total2 Daily Period Total
# lb/ac/d lb/acre lb/acre lb/ac/d lb/acre lb/acre
05/01-06/01 2.0 68.3 1981 1981 70.5 2044 204406/01-08/15 2.5 59.0 4282 6263 40.7 2949 499308/15-09/15 1.0 34.3 1028 7291 25.2 755 574809/15-10/15 1.0 12.1 364 7655 nd3 nd 57481Number of grazing cycles during the specified grazing period.2Total represents cumulative yield from start of the grazing season.3No data; extended period of drought ended the grazing season.
Table 2. Concentration of crude protein(CP), neutral detergent fiber (NDF) and aciddetergent fiber (ADF) in the forage consumedunder rotational grazing in 1994 and 1995.Samplingperiod1 CP NDF ADF
- - - - % dry matter - - -1994
5/22 - 6/1 17.5 54.9 26.46/23 - 7/7 20.4 44.5 26.77/24 - 8/7 23.0 48.5 28.98/20 - 9/6 23.5 46.1 24.99/20 22.7 37.1 19.6
mean 21.3 47.2 25.9SE .94 2.06 1.40
19954/21 - 4/26 23.2 42.8 16.45/13 - 5/23 23.2 32.8 17.36/1 - 6/25 22.7 43.8 20.47/14 - 7/28 22.8 48.9 30.25/17 - 9/3 24.1 49.1 26.29/17 20.2 39.5 19.9
mean 23.0 43.1 21.9SE 0.76 1.91 1.88
1Data from 2 paddocks averaged forgrazing cycle.
152 182 212 242 272
Day of Year
0
20
40
60
80
100
Co
mp
on
ent
(% o
f to
tal)
KBG
OTG
LEG
DEAD
REM
1994
152 182 212 242 272
Day of Year
1995
Figure 2. Changes in pasture species composition underrotational grazing in 1994 and 1995. [KBG = KentuckyBluegrass; OTG = Other grasses (mostly smoothbromegrass and/or quackgrass); LEG=Legumes (mostlywhite clover); DEAD = dead matter; and REM = all otherspecies (mostly dandelion or thistles)]

26 U.S. Dairy Forage Research Center
Nitrogen Recovery by Orchardgrass From Dairy ManureV.R. Kanneganti, S.D. Klausner and S.R. Kaffka
IntroductionWith increasing manure production per unitcropland available for its disposal, greaterrecovery and recycling of manure N through cropuptake is needed on dairy farms to minimizeenvironmental problems. On a 100-cow dairyfarm, approximately 7 metric tons of N per yearis not accounted for in mass balance equations.A substantial but unknown amount of thisunaccounted N is being leached into thegroundwater as nitrate.
Livestock producers need information onperennial grass forage crops which can utilizelarge quantities of manure N, yield good qualityforage and fit into traditional crop rotationswhile allowing flexible and higher rates ofmanure application. Orchardgrass (Dactylisglomerata L.) is a well-adapted perennial cropwith high yield potential. To develop effectivemanure management guidelines for this crop, itsN recovery potential needs to be quantified. Thisstudy was initiated with the objective ofquantifying N recovery potential of orchardgrassin response to liquid or solid dairy manureapplied in spring with or without fertilizer N.
Materials and MethodsDairy manure was surface applied at a rate tosupply 150 kg total N/ha/yr to an establishedorchardgrass, either as liquid or as solid withbedding material, in April of each year in anexperiment conducted for 2 years on a sandyloam soil in New Milford, Connecticut. Averagecomposition of the manure is shown in Table 1.Manure treatments were superimposed withammonium nitrate fertilizer applied at 0, 75, 150and 300 kg N/ha in 1990, and 0, 150, 300 and600 kg N/ha in 1991. The 3 x 4 factorial (nomanure, liquid and solid manure, eachsuperimposed with 4 rates of fertilizer N) wasarranged in a randomized complete block designand replicated 3 times. Fertilizer P and K were
applied according to soil test recommendation.Forage was cut in each plot from a 1m by 5marea to measure forage yield and N uptake (= Nconcentration in forage x forage yield). The cropwas managed under a 4-cut system. N recoveryby the crop was calculated by comparing Nuptake on plots receiving manure or fertilizerwith that of the check plot (no manure, nofertilizer), as follows:
ANR = ((NTRT-NCHK)/NTOT)*100where ANR is the apparent N recovery, NTRT isN uptake from manure or fertilizer treatmentplot, NCHK is N uptake from check plot, andNTOT is the total N applied, all measured in kgN/ha/yr.
Results and DiscussionForage yield. Effects of liquid and solid manurewith or without fertilizer N on annual forageyield are shown in Fig. 1. In both years, yieldincreased significantly up to 300 kg fertilizer N/ha. In neither year was the interaction between Nsource and fertilizer rate significant, suggestingthat the effects of solid or liquid manure on yieldwere similar at all rates of fertilizer N. Averagedover fertilizer N rates, liquid manure N increaseddry matter yields over no-manure by 43% (2450kg/ha) in 1990 and 23% (1684 kg/ha) in 1991(Fig. 1). The corresponding values for solidmanure N were 21% (1204 kg/ha) in 1990 and24% (1812 kg/ha) in 1991.
N recovery. ANR represents the apparentamount of N recovered by the crop fromfertilizer or manure. Averaged over the years,40% of the 150 kg N/ha/yr of liquid manure Nwas recovered in forage in each year (Table 2). Nrecovery from liquid manure was 6% greater in1990 than in 1991 (Table 2), suggesting that Nlosses were lower in 1990 than in 1991. In 1990,manure application was followed by a 33 mmrainfall over a 7 day period, which may havereduced volatilization losses of ammonia.

1996 Research Summaries 27
With solid manure N applied at 150 kg N/ha/yrwithout fertilizer N, 13 and 39% of manure N(19 and 59 kg N/ha, respectively) were recoveredby the crop in 1990 and 1991, respectively(Table 2). In addition to N available from solidmanure applied in 1991, more N was probablyavailable from residues of the 1990 application,resulting in greater ANR in 1991. In contrast, noresidual effects of liquid manure on forage yieldor N uptake were observed (Fig. 1, Table 2).
SummaryAveraged over the years, orchardgrass recovered40% of the liquid manure N and 26% of the solidmanure N applied each year. On an annual basis,the crop recovered 430 kg soil N/ha from plotsreceiving liquid manure in combination with 600kg fertilizer N/ha. This study demonstrates thatintensively managed orchardgrass has thepotential to absorb large quantities of manure N,suggesting that orchardgrass may be planted infields that receive large quantities of manure on aregular basis.
Har
vest
ed f
orag
e, M
g/h
a
No-manure Solid Liquid
1990
1991
Fertilizer N, kg/ha0 150 300 450 600
2
4
6
8
10
12
LSD
LSD
2
4
6
8
10
12
Figure 1. Annual forage dry matter yield in response to fertilizer N with or without dairy manure.(Symbols represent average yields. Curves are best-fit functions (linear in 1990 and Mitscherlich in1991):1990: No-manure: Y = 3172 + 19.7 X; R2 = 0.90; RMSE = 777
Solid manure: Y = 4354 + 19.9 X; R2 = 0.77; RMSE = 1230Liquid manure: Y = 5685 + 19.3 X; R2 = 0.75; RMSE = 1267
1991: No-manure: Y = 10175 - 7356 e-.0068 X; R2 = 0.95; RMSE = 666Solid manure: Y = 11573 - 6314 e-.0069 X; R2 = 0.83; RMSE = 1129Liquid manure: Y = 11812 - 6764 e-.0059 X; R2 = 0.88; RMSE = 947
where Y = forage yield, kg/ha; X = Fert N, kg N/ha; RMSE = Root of mean square error, kg/ha)
Table 1. Composition of liquid and solid dairy manures.Dry matter
Manure content Total-N NH4-N Total-P Total-K- - % - - - - - - - - - - - % dry wt. Basis - - - - - - - - -
1990Liquid 11.2 5.75 2.20 0.76 2.87Solid 28.1 1.99 0.57 0.78 2.31
1991Liquid 6.9 4.30 1.45 0.97 4.40Solid 13.9 4.00 0.74 0.84 3.86

28 U.S. Dairy Forage Research Center
- - - - - - - - - - - - - - - - - - - - - - - - - - - - - - - - - - - - - - - - -Manure Fert. Total1 ANR Fert. Total ANR Fert. Total ANR type N N N N N N
- - kg N/ha - - % - - kg N/ha - - % - - kg N/ha - - %None 0 0 - 0 0 - 0 0 -
75 75 55 150 150 95 225 225 82150 150 71 300 300 87 450 450 82300 300 64 600 600 59 900 900 60
Liquid 0 150 43 0 150 37 0 300 4075 225 59 150 300 66 225 525 63
150 300 63 300 450 72 450 750 68300 450 62 600 750 49 900 1200 54
Solid 0 150 13 0 150 39 0 300 2675 225 40 150 300 65 225 525 54
150 300 42 300 450 69 450 750 58300 450 52 600 750 49 900 1200 50
1Total N = fertilizer N + 150 kg manure N (for manure treatments), or = fertilizer N only (for no-manure treatments)
Table 2. Apparent nitrogen recovery (ANR) by orchardgrass from fertilizerand from liquid and solid manures applied with or without fertilizer N.
1990 1991 2 yr combined

1996 Research Summaries 29
Impact of High and Low Forage Diets on Dairy FarmsC.A. Rotz
IntroductionDairy farms are complex systems with manycomponents to manage. These componentsinclude crop production, harvest, storage,feeding, milk production and handling, manuremanagement, tillage, and planting. Many of thesecomponents interact with weather and eachother, so a change in one part of the farm maycause changes throughout other farmcomponents. For example, a change in rationswill affect the nutrient content of manure whichcan affect the fertilizer requirement and theproductivity of future crops. In recent years withrelatively low grain prices, dairy farmers havefed more grain than necessary with just enoughforage to maintain proper rumen function. Withthe recent increase in grain prices, there is anopportunity to improve profitability by utilizingmore forage and less grain in the dairy diet.
Materials and MethodsThe long term performance and benefits ofalternative dairy forage systems are bestcompared using DAFOSYM. DAFOSYM is asimulation model which integrates the manybiological and mechanical processes on a dairyfarm. Crop production, feed use, and the returnof manure nutrients to the land are simulatedover many years of weather. Simulatedperformance is used to predict the costs, income,and net returns or profit for typical dairy farms.By modeling several alternatives for the samebase farm, those that provide maximum farmproduction or profit with good labor utilizationand minimal effect on the environment aredetermined. All production and economicinformation is determined for each simulatedyear of weather. The distribution of annualvalues obtained can then be used to assess therisk involved in alternative technologies orstrategies as weather conditions vary. The modelwas used to compare the whole-farm impacts ofusing high grain or high forage diets.
The modeled farm represented a typical 100-cowdairy farm in southern Michigan with 250 acresof owned land. The soil was a loam of mediumdepth. Essentially all forage and grain feedsrequired by the herd were produced on the farm
using various portions of alfalfa and corn.Alfalfa was harvested using a four cuttingharvest strategy with the first two cuttingsharvested at a bud stage of development and thelast two harvested in early bloom. Harvestsbegan within 5 days of May 30, July 6, andAugust 20 for the first three cuttings and onOctober 15 for the fourth cutting. All cuttingswere harvested as wilted silage.
Alfalfa was grown in a four year rotation withcorn. Corn was harvested as silage and highmoisture grain to fill the available silos, andadditional corn was harvested as dried grain.Over the 25-year simulation, post harvest cropyields ranged from 4.0 to 5.7 ton DM/acre foralfalfa with a mean of 5.0 ton DM/acre. For cornsilage, the range was 4.6 to 8.6 ton DM/acre witha mean of 6.1 ton DM/acre, and for corn grainthe range was 75 to 155 bushel/acre for anaverage of 108 bushel/acre.
The herd included 100 Holstein animals (milkingand dry) plus 85 replacement stock. Analyseswere done with annual milk production set at20,000 lb/cow. Feed rations were determined fortwo groups of heifers, a dry cow group, and threegroups of lactating animals. A mobile mixingwagon was used to prepare total mixed rations(TMR) for each animal group. Cows werehoused in a free stall barn and milked in a doublesix parlor. The culling rate of the herd was 35%which set the number of first-lactation animals at35.
Simulations were conducted for two amounts offorage in lactating animal diets. First, a highforage diet was used where about 60% of the drymatter in lactating cow rations came from forage.Next, a high grain diet was assumed whereforage was about 45% of the ration dry matter.The alfalfa area was reduced and the corn areawas increased according to the feed needs.Simulations were done for 25 weather yearsusing East Lansing, Michigan weather data.Prices were set to reflect long-term relativevalues of farm inputs and outputs in currentdollars.

30 U.S. Dairy Forage Research Center
Results and DiscussionSimulated measures of farm performanceincluded the feeds produced, those bought andsold to meet the needs of the herd, the milkproduction of the herd, and the manure producedand handled. The economic results included allmajor costs incurred and income from milk,excess feed, and animal sales. The net return tomanagement was the difference between incomeand costs and thus provided an indication offarm profit.
With a shift from high grain to high forage diets,the need for forage increased. Alfalfa land wasincreased from 145 acres to 190 acres, and cornland was decreased from 105 acres to 60 acres.Alfalfa silage production increased from 600 tonDM to 800 ton DM while corn grain productiondropped from 250 ton DM to 140 ton DM. Withthe use of more alfalfa, the soybean mealrequired to meet protein requirements droppedby about 10 ton DM per year. Due to the lowerdigestibility of high forage diets, manureproduction increased about 13%. With morealfalfa and less corn on the farm, the ratio ofnitrogen available to that required to produce thecorn increased from 2.7 to 5.6 while the farmmaintained a good balance of phosphorus andpotassium. This meant that much of the manurehad to be applied to alfalfa to absorb the excessnitrogen.
Use of a high forage diet caused a slight decreasein purchased feed costs. This was due primarilyto a need for less protein supplement when morealfalfa was fed. Because corn grain was customharvested, the use of less grain reduced harvestcosts. Fertilizer, chemical and drying costs alsodecreased with less corn on the farm. With allfactors considered, the net return for the farmincreased about $3,900 per year through the useof the high forage diet compared with the highgrain scenario.
ConclusionWith rising grain prices, an obviousconsideration is to use more forage and less grainin dairy rations. For farms where much of thegrain is purchased from off-farm sources, there isa clear economic advantage for buying less corn.On farms where most of the feeds are producedon the farm, the advantage still exists, but it isnot as great. When feeds are produced and usedon the farm, the cost of production is much moreimportant than the market price or value of thosefeeds. Use of more alfalfa forage can lead toconsiderable excess nitrogen on the farm whichrequires much of the manure to be applied toalfalfa to avoid loss of nitrogen to theenvironment.

1996 Research Summaries 31
Costs of Forage ProductionC.A. Rotz and T.M. Harrigan
A third farm was simulated which was avariation of the 100-cow farm that includedgrazing. All parameters of the farm were thesame except that land use was changed to 150acres of alfalfa and 100 acres of corn. Of thetotal alfalfa, 50 acres were grazed in the spring,85 acres in the summer, and 150 acres in the fallafter the third harvest. The remaining alfalfa washarvested with a three cutting harvest strategyusing the same harvest methods and dates asused for the original 100-cow farm. Equipmentcosts included fence, watering equipment, andpasture clipping. Because field machinery wasused less, cost was depreciated over 50% moretime or 15 years.
Results and DiscussionAverage costs of forage production on the threefarms are illustrated in Figure 1. On the 100-cowfarm, alfalfa silage was produced at an annualcost that varied over the 22-year simulation from$76 to $120/ton dry matter (DM) with a mean of$85/ton DM. The predominant cost was that ofmachinery and the next largest cost was storage.Corn silage production was a little less costly,ranging from $60 to $124/ton DM with a meanof $74/ton DM. Machinery, energy, and laborcosts were less because mowing and rakingoperations were not required, and because thegreater yield at harvest allowed equipment to beused more efficiently. Storage costs were a littlelower for alfalfa because multiple cuttingsallowed refilling of the silos, and thus moreforage was stored in a structure.
IntroductionForage production costs form a major portion ofthe total cost of milk production on dairy farms.There are many methods available to produceforage, but most can be categorized as silage, dryhay, or grazing systems. For most dairies today,the primary forage is silage. Being a primaryfeed and a major cost, the economics of forageproduction can have a large influence on farmprofit. Because of the many factors that influenceproduction costs, a comprehensive analysis isneeded to determine those costs. Such ananalysis is best performed using DAFOSYM, asimulation model which integrates the manybiological and mechanical processes on a dairyfarm.
Materials and MethodsLong-term simulations with DAFOSYM wereused to quantify the costs of forage productionon Pennsylvania dairy farms. The modelsimulates crop production, feed use, and thereturn of manure nutrients to the land. Foragelosses and nutritive changes, the timing of fieldoperations, and the use of machinery, fuel, andlabor are among the many factors tracked by themodel to predict performance and resource usefor typical dairy farms. Simulations were donefor 22 weather years using Harrisburg,Pennsylvania weather data. Silage productioncosts were compared to those of alfalfa harvestedin large round bales or grazed in a well managedrotational grazing system.
Two farms were modeled. The smaller farmincluded 100 cows plus 85 replacement heiferson 250 acres of owned land. Alfalfa was grownon 90 acres along with 160 acres of corn. Thelarger farm included 500 cows and 425replacements on 450 acres of alfalfa and 750acres of corn. Milk production was set at 22,000lb/cow. Facilities included bunker silos forstoring alfalfa and corn silages and a tower silofor high moisture corn. All alfalfa cuttingsexcept the second cutting on the small farm wereharvested as wilted silage. The second cutting onthis farm was harvested as dry hay in large roundbales. Corn was harvested as silage and highmoisture grain to fill the available silos, andadditional corn was harvested as dry grain.
0
20
40
60
80
100
Pro
duct
ion
cost
s ($
/ton
DM
) Crop
Storage
Labor
Energy
Machinery
Land
Alfalfasilage
Cornsilage
Alfalfahay
Cornsilage
Alfalfasilage
Grazedalfalfa
100 cow farm 500 cow farm
Figure 1. Production costs for different types of forageproduced on two sizes of farms.

32 U.S. Dairy Forage Research Center
Hay production costs on the 100-cow farm werenear $100/ton DM with a range in annual valuesfrom $83 to $167/ton DM. Machinery costs werehigher because the baler and bale handlingequipment were used relatively little. Hay can beproduced more cost effectively when machineryis used for three or more cuttings per year.
Grazing was by far the lowest cost method ofproducing forage with a production cost near$30/ton DM. Annual values over the 22-yearsimulation ranged from $26 to $42/ton DM.Although grazing costs were quite low, theywere only a portion of the total economic picture.Dairy farms in the northern U.S. cannot relysolely on grazed forage, so a substantial amountof hay or silage must be produced or purchasedfor the winter months. Despite the lowproduction cost, grazing can reduce the profit ofa high producing dairy farm by increasing otherfeed costs and reducing milk production.
On the 500-cow farm, where all four cuttings ofalfalfa were harvested as silage using a self-propelled chopper and dump trucks for transport,alfalfa silage production costs dropped to $60/ton DM. The range in annual values was $55 to$82/ton DM. Machinery, labor, and storage costswere all reduced by producing forage moreefficiently in greater amounts. Corn silageproduction costs were only a little less rangingfrom $48 to $95/ton DM with a mean of $57/tonDM. Again, compared to alfalfa silage,machinery, energy, and labor costs were less andstorage and cropping costs were greater.
ConclusionSilage production costs dropped as farm sizeincreased with alfalfa silage costing a little moreto produce than corn silage. The major cost insilage production was that of machinery whichincluded depreciation, repairs and maintenance,and the next major cost was that of the storagestructure.

1996 Research Summaries 33
Corn Silage Following First-Cut Alfalfa: A Forage Production Alternative?J.C. Durling, Q.B. Hesterman and C.A. Rotz
IntroductionCorn silage is occasionally double cropped withfirst-cut alfalfa in the north central region of theUS. With this system, corn is planted after first-cut alfalfa is harvested. This practice is of greaterinterest to growers with old or winter-injuredalfalfa stands and limited alfalfa supplies.However, little information is available onforage yield and economic return of corn silagefollowing first-cut alfalfa. This study wasdesigned to: (1) evaluate forage yield andeconomic return of the corn silage followingfirst-cut alfalfa system, (2) compare economicreturn from the alfalfa/corn silage double-cropsystem with returns from single-crop corn silageand four-cut alfalfa systems, and (3) determinethe economic sensitivity of these systems tochanges in soybean meal (SBM) and corn prices.
Materials and MethodsField studies were conducted in Michigan in1987 and 1988 to provide validation data for alonger-term computer simulation study. Theexperimental design was a randomized completeblock with four replications. The forageproduction systems evaluated were: single-cropcorn harvested as silage (Treatment C), alfalfaharvested four times at early to mid-bloom(Treatment A), and corn silage following first-cut alfalfa (Treatment AC).
Field studies were established in existing alfalfafields following recommended productionpractices. Field operation, fertilizer, herbicide,and corn seed costs were summed for eachsystem (Treatments C and AC). Land and alfalfaestablishment costs were not included as variablecosts since the crop was already available.Forage quality was determined with near-infrared reflectance spectroscopy. Market values($/ton) of alfalfa and corn silage weredetermined as the cost of purchasing the sameamount of crude protein (CP) and total digestiblenutrients (TDN) in the form of SBM and corn
grain. Prices of $240/ton for SBM and $2.53/bufor corn grain were used to reflect the long-termSBM dry matter (DM) to corn grain DM priceratio of 2:1. Gross margin ($/acre) for eachtreatment was calculated as market value timesyield minus the selected variable costs ofproduction.
Field data were used to validate the crop modelsusing DAFOSYM (The Dairy Forage SystemModel) in predicting yields for this type ofdouble crop application. DAFOSYM submodelswere used to simulate crop growth using 1987and 1988 East Lansing, Michigan weather data.Yields were simulated for Treatment C with theDAFOSYM corn growth submodel which usedthe CERES-Maize model, version 2.1. Yield andquality in Treatment A were simulated using theDAFOSYM alfalfa growth submodel which wasbased on the ALSIM 1, level 2 model fromCornell University. Alfalfa yield and quality andcorn yield in Treatment AC were simulated usingthe respective alfalfa and corn models. Alfalfagrowth was simulated as in Treatment A for thefirst cut. Available soil moisture predicted by thealfalfa model following the first cutting wascarried into the corn submodel as the availablesoil moisture at corn planting. Market values andgross margin were determined as for the fieldstudy.
The DAFOSYM submodels were validated bycomparing measured gross margins withpredicted values. Studies in 1987 and 1988provided six data pairs. A correlation (r) of .84gave good support for the validity of theDAFOSYM submodels. Based on the accuracyof these predictions, a simulation was undertakento evaluate these forage production systems over26 years of East Lansing, Michigan weather.
Results and DiscussionSimulated forage yield and gross margin for thethree forage production systems were determined

34 U.S. Dairy Forage Research Center
for the 26 weather years. Treatment C was theforage production system with the highest grossmargin in 16 of the 26 years and with the highestaverage gross margin ($433/acre). Treatment Ahad the highest gross margin in 6 of the 26 yearsand Treatment AC had the highest in only 4 ofthe years. The 26-year average gross margin was$387/acre for Treatment A and $320/acre forTreatment AC.
Corn silage yield in Treatment AC averaged lessthan half of that in Treatment C. Economicalyields from the corn silage following first cutalfalfa system were only attained during long,warm and wet summers. This type of weatherpattern does not frequently occur in Michigan.The poor performance of corn in Treatment ACwas consistent with other observations of theyield depressing effects of a forage legumepreceding corn in a double-crop system. Reducedyields of corn following perennial legumes inmost years is attributed to low early seasonprecipitation and to the legume�s use of soilmoisture. High yielding legume crops grown inthe spring decrease soil moisture content at cornplanting time which often causes severe droughtstress for the corn crop.
A sensitivity analysis was performed todetermine how the forage system comparisons
were affected by SBM and corn prices. Historicextreme SBM:corn price ratios of 3:1 and 1:1.5were used. Within this range of price ratios, thenumber of years in which the doublecrop systemhad the greatest gross margin of the threesystems ranged from 2 to 4 years out of 26.Therefore, the economic benefit of doublecropping corn silage after first cutting alfalfa wasnot sensitive to feed prices, and this system waseconomically beneficial in very few weatheryears. Comparison of Treatment C andTreatment A was highly sensitive to SBM:cornprice ratios. A low SBM:corn price ratio favoredTreatment C in 22 of the 26 years, while a highSBM:corn price ratio favored Treatment A in 23of the 26 years.
ConclusionProducer interest in double cropping corn silageafter first-cut alfalfa increases when foragesupplies are limited and alfalfa stands have beeninjured by winter weather. The alfalfa/corn silagedouble-crop system was less profitable thansingle-crop corn silage and/or four-cut alfalfa inat least 22 of 26 weather years. Although thealfalfa/corn silage double-crop system has beensuccessful in other areas, it cannot be generallyrecommended as an economic alternative forforage production in Michigan.

1996 Research Summaries 35
Comparison of Respiration Losses in Intensively Conditioned andUnconditioned AlfalfaT.J. Kraus, R.E. Muck and R.G. Koegel
IntroductionIntensive conditioning of forage crops hasseveral advantages: (1) accelerated drying rates,(2) increased fiber digestibility, (3) improvedprotein utilization, and (4) improvedfermentation characteristics. Under good dryingconditions, macerated alfalfa dried to 20%moisture (w.b.) in 6 h or less. Reaching goodmoisture contents (45 to 65%) for ensilingrequires only 1 to 3 h of drying. With such shortwilting periods, respiration losses are not aconcern. However, when the wilting period isextended, due to unfavorable weather conditionsor by mowing late in the evening, the forage willremain in a moist, aerobic environment for anextended period of time. Several studies indicatethat a direct correlation exists betweenrespiration rate and conditioning level of forage.Therefore, the question arises as to whetherseverely conditioning the forage leads toexcessive respiration losses.
Under aerobic conditions, plant respirationcauses the oxidation of hexose sugar to carbondioxide and water. The stoichiometricrelationship is: C
6H12O6 + 6O2 → 6H2O + 6CO2
+ 2870 kJ/Mole. Therefore, measurement of CO2
output will enable the estimation of dry matterconsumed during aerobic respiration.
ProcedureFigure 1 is a schematic of the apparatus used tomeasure the rate of CO2 production from foragesamples. The apparatus consisted of 6components: a tank of compressed dry-air, an airflow regulator, a respiration chamber, adesiccant, an air mass-flow meter, and a massspectrometer. Four respiration chambers were
fabricated allowing multiple runs to beperformed simultaneously.
Severely conditioned and unconditioned freshalfalfa samples, approximately 1000 g each,were placed into the respiration chambers andallowed to respire for 48 h. Dry air was meteredthrough the chambers to maintain an aerobicenvironment inside each chamber. The massflow rate of the air and the concentration of CO2
entering and exiting each chamber was measuredat 15 min. intervals. This allowed the rate of CO2
production to be determined.
ResultsProduction rates of CO2 of severely conditionedand unconditioned fresh alfalfa at 31 °C areshown in Figure 2. The respiration of CO2 fromthe unconditioned sample steadily decreasedthroughout the respiration period. However, therespiration of CO2 from the severely conditionedmaterial was different. During the first 8 h, therespiration rate of CO2 of the severely
Mass SpectrometerAir-Flow Regulator
Compressed Dry Air
Respiration ChamberDesiccant
Mass-Flow Meter
Figure 1. Respiration Apparatus.
Forage Handling, Preservation and Storage

36 U.S. Dairy Forage Research Center
conditioned forage was lower than that of theunconditioned forage. However, after this initiallag phase, the production of CO2 increasedrapidly to approximately 2 times that of themaximum rate of the control.
Respiration losses of the stored carbohydratesand plant sugars occur for two reasons. First,undamaged cells continue to respire even thoughthe upper portion of the plant has been severedfrom the roots. As the cells respire, they usecarbohydrates as a source of energy. Second,microorganisms consume readily availablesugars and carbohydrates that are in the solublecell contents.
When forage is severely conditioned, many cellwalls are broken, killing those cells. Therefore,one would expect initial plant respiration rates tobe relatively low. It is believed the increasedrespiration rate of the intensely conditioned
0
0.0002
0.0004
0.0006
0.0008
0.001
0.0012
0.0014
0.0016
0.00 5.00 10.00 15.00 20.00 25.00 30.00 35.00 40.00 45.00 50.00
Time (h)
Car
bon
dio
xid
e (m
ole
s/m
in.)
macerated
control
material after 8 h was due to acceleratedmicrobial growth. The sudden decline in CO2
production after 12 h and the rise after 30 hsuggest shifts in dominant microbial populationsas one group exhausts one substrate and thendies while another group rises using anothersubstrate in the plant sap.
ConclusionInitial respiration rates of severely conditionedforage were less than those of unconditionedforage. However, 8 to 10 h after conditioning,the rate of respiration of the severely treatedforage increased rapidly to approximately 2times that of the initial rate of unconditionedforage. This increase may have been due toaccelerated microbial growth. If this rate ofrespiration continued over an extended period oftime, there may be a significant increase incarbohydrate loss due to respiration inintensively conditioned forage.
Figure 2. Carbon dioxide production from severely conditioned and unconditioned alfalfa at 31°C.

1996 Research Summaries 37
Maceration of Alfalfa Hay and Silage Improves Milk ProductionD.R. Mertens and R.G. Koegel
IntroductionPrevious experiments have shown thatmaceration of alfalfa improved digestibility insheep, increased weight gain in late lactationdairy cows, and altered fermentation in therumen. Maceration of forage increases theproportion of propionic acid produced duringruminal digestion which is similar to the resultwhen additional grain is added to ruminant diets.This suggests that maceration of forage wouldprovide the greatest benefit to animals with highenergy demands such as cows in early lactation.The objective of this study was to obtainquantities of macerated and control alfalfa hayand silage that could be evaluated using highproducing, peak lactation cows in a trial withadequate length and numbers of animals todetect differences due to maceration.
MethodsThird cutting alfalfa was harvested over a 28-dayperiod to obtain 10 tons of dry matter as nonrain-damaged hay and silage. Alternate rowswere macerated or cut and conditioned, thenharvested as hay or silage. Hay was harvested assmall rectangular bales, and silage was stored insmall plastic bags containing about 1000 kgwilted forage. To obtain consistent forage qualityduring the feeding trial, the least and mostmature lots of forage were blended. Averageforage composition was between 18 to 20%crude protein and 43 to 46% aNDF, and silageswere 37 to 40% dry matter. Forages were mixedwith high moisture corn, soybean meal, roastedsoybeans (5% of ration dry matter) and mineralsto obtain rations that contained 30% amylase-treated NDF and a minimum of 16% crudeprotein. Hays were chopped, and both hays andsilages were fed as total mixed rations.
Forty-eight cows that averaged 80 days inlactation were divided into 12 groups based onparity and milk production within parity during acovariate period (covariate ration contained both
hay and silage). One cow of each group wasassigned to a ration containing control alfalfahay, macerated alfalfa hay, control alfalfa silage,or macerated alfalfa silage. Cows were fed therations for seven weeks.
DiscussionStatistical analysis of the data indicated thattreatment differences were significant by thethird week the cows were on their respectivediets; thus, data for the last five weeks wereaveraged and used to determine the effects ofmaceration on animal response (Table 1). Therewere no differences in dry matter or NDF intakeof cows fed macerated or control alfalfa forage.However, these early lactation cows respondedto maceration of alfalfa with a significantincrease in milk production. Although the cowsfed macerated silage had lower milk fatpercentages than control cows during thecovariate period, there was a significant decreasein milk fat percentage for the macerated foragewhen least-squared means were compared. Thishas been a consistent response to maceration ofalfalfa and may reflect the shift to lower acetateto propionate ratios in ruminal volatile fattyacids that was observed in previous experiments.
Although treatment differences were notsignificant, there was a trend toward greaterpositive body weight and condition score changefor cows fed macerated forage compared tocontrols. This result agrees with previousstudies. The combination of slightly lower drymatter intake with increased milk production andbody weight change suggests that the energyutilization of macerated forages is greater thanthat of controls.
ConclusionMaceration of alfalfa can result in greater milkproduction with slightly decreased milk fatpercentages and a more positive energy balance.Not only does maceration appear to improve

38 U.S. Dairy Forage Research Center
energy utilization of alfalfa, but it also changesfermentation in the rumen in a way that results ingreater propionate production similar to that
which occurs when grains are fed. Thus,maceration may allow the substitution of someforage for grain in dairy rations.
Table 1. Least-squared means for animal responsesduring the last five weeks of the experiment when fedcontrol and macerated alfalfa (averaged across hay andsilage preservation methods (n = 24).
Control MaceratedVariable Treatment TreatmentChemical composition of total mixed rations (% of DM):Crude protein 16.9 17.7amylase-treated NDF 30.8 29.7
Animal responses:Dry matter intake (kg/d) 23.4 23.2aNDF intake (%BW/d) 1.18 1.19
Milk (kg/d) 34.5a 37.1b
4%FCM (kg/d) 32.6 33.5Milk fat (%) 3.66a 3.37b
Milk protein (%) 3.12 3.05Milk lactose (%) 4.85 4.83Somatic cell count (1000) 161 181
Body weight (kg) 597 578Body weight gain (kg/d) -0.06 0.09Condition score change (/mo) 0.12 0.15a,bValues with different superscripts are different atP < .05.
1996 Research Summaries 39
The Potential for Ethanol Production From Alfalfa Fiber Derived From WetFractionationR.G. Koegel and R.J. Straub
IntroductionWet fractionation of forage crops allows biomassto be produced at very competitive prices due tothe high values of the coproducts. Thefractionation process consists of expressing juicefrom fresh herbage. The resulting fibrousfraction is high in cell wall constituents(cellulose, hemicellulose and lignin). It can beimmediately field-dried and baled or pelleted ifdesired to minimize handling, transportation andstorage costs. It is suitable for combustion,gasification, or enzymatic hydrolysis andfermentation to ethanol.
The juice fraction typically contains 25 to 30%of the dry matter in the original herbagedepending on the severity of processing. It ishigh in protein and solubles and is almost fiberfree. It can be used to produce both food-gradeand feed-grade protein concentrates as well asother high-value products. The anticipatedmarket value of the juice products, based oncurrent prices of analogous products, greatlymitigates the production costs of the biomassfraction.
Wet fractionation of green herbage, theseparation of fiber and juice, to produce proteinconcentrates has been researched and developedfor more than a half century (Telek and Graham,1983; Pirie, 1987). The technology and productsare well known. For most of this period,however, emphasis was on making a crude,green protein concentrate either for livestockfeeding or for supplementing the diets of humanssuffering from protein deficiency. While thenutritional value of this product was undisputed,the economics of the process were, at best,marginal. Therefore, it was not, in general,commercialized.
Subsequent developments, however, appear tohave greatly improved the potential for profit-ability:
1. Researchers have identified high-value juiceproducts including soluble protein with goodfunctional properties for human food(Knuckles and Kohler, 1982; Kohler et al.,1983), xanthophyll concentrates for use inthe poultry industry (Crombie, 1995) andother products such as plant and animalgrowth stimulants, cosmetic substances, andpharmaceuticals (Koganov, 1992; Koganovet al., 1988).
2. Biotechnologists at the University ofWisconsin have demonstrated the possibilityof adding genes to alfalfa which cause thetransgenic alfalfa to produce industriallyvaluable substances, especially enzymes.Fields of alfalfa could thus become�bioreactors� or �enzyme factories� with thetarget enzymes recovered from the juice.
To date, transgenic alfalfa cultivars containingmanganese dependent lignin peroxidase forbiopulping, α-amylase for converting starch tosugar, cellulases for saccharification of ligno-cellulosics, and phytase to allow poultry andswine to utilize otherwise insoluble phosphorusin their grain-based rations, respectively, havebeen produced.
The use of forage crops, especially perenniallegumes as a source of biomass, has a number ofother advantages:1. The need for nitrogen fertilizer, a high
energy non-renewable input, is eliminated.Infrequent reestablishment of the cropminimizes the energy requirement for tillageand seed bed preparation.
2. Biomass can be field-dried and pelleted orcubed to minimize transportation, handling,and storage costs.
3. Forage varieties adapted to a wide range ofenvironmental conditions exist, andproduction practices are established.
4. Machinery and methods for production andharvesting are available.

40 U.S. Dairy Forage Research Center
5. The excellent soil and water conservationcharacteristics of perennial forage crops arewell recognized. This makes their productionnot only sustainable, but also desirable.
The economics of biomass production via wetfractionation is dependent on both unit pricesand per hectare production of the variousfractions.
MethodsIn the spring of 1995 at Madison Wisconsin, fourplots of approximately 42m2 each wereestablished in an alfalfa field which had beenseeded the previous year. The first plot wasmowed on May 22 and May 21 in 1995 and1996, respectively, with successive plots mowedat 8-9 day intervals. This was done to �stage� thearea as would be necessary in a large scaleoperation where it is required to keep harvestingand processing equipment working steadily atnear capacity during the entire growing season.Each plot was then harvested at approximately35-day intervals after its initial harvest for a totalof four harvests per plot. The herbage from eachplot was weighed and immediately maceratedusing a double rotor, rotary impact macerator(Koegel and Straub, 1994). Juice was thenexpressed by running the macerated herbagetwice through a 15 cm diameter Rietz screwpress. Herbage, juice, and fibrous fractionsamples were oven-dried at 105 oC for 24 hoursto determine dry matter content.
The following analyses were carried out on thefibrous fraction: (1) neutral detergent fiber(NDF), (2) acid detergent fiber (ADF), (3) aciddetergent lignin (ADL), (4) nitrogen, and (5) ash.
The following definitions were used: (1)hemicellulose = NDF - ADF, (2) cellulose =ADF - ADL, (3) lignin = ADL, and (4) protein =6.25 x nitrogen. Solubles were determined bydifference.
ResultsPer hectare dry matter yields of herbage andjuice for 1995 are 13.5 t/ha and 4.2 t/ha,
respectively, for an overall juice:herbage DMratio of 0.31. In 1996, herbage dry matter yieldwas 12.9 t/ha and juice DM yield was notmeasured.
Table 1 gives the composition of the biomass orligno-cellulosic fraction resulting from wetfractionation of the four harvests of each of thefour plots in terms of cellulose, hemicellulose,lignin, protein, ash, and solubles (by difference).These are also converted to per hectare yieldsbased on 9.45 t/ha of fibrous fraction.
Table 2 shows the potential per hectareproduction of ethanol based on yields of 85% ofthe stoichiometric. The soluble dry matter, whichhas not been characterized, was assumed to yieldat the same rate as cellulose.
Wyman et al. (1993) give ethanol yields (l/t) ofcellulosic biomass as 338 for �reference case�and 497 for �improved technology.� Multiplyingthese yields times the 9.45 t/ha of alfalfa fibrousfraction gives 3194 l/ha and 4697 l/ha,respectively, which bracket the 4200 l/ha shownin Table 2.
Wyman et al. (1993) give approximatecompositions of three classes of lignocellulosics:�agricultural residue,� �hardwoods� and�herbaceous plants.� The ratios of hemicelluloseto cellulose for these three groups areapproximately 1:1.2, 1:2.2, and 1:1.5,respectively, and the sums of hemicellulose pluscellulose are 70%, 73% and 75% of the totalweight, respectively. In the case of the fibrousfraction of alfalfa, the ratio of hemicellulose tocellulose is 1:1.9 and the sum of hemicellulose,cellulose, and solubles is approximately 72% ofthe total weight. The lignin concentration of thealfalfa, at 7.8% is half or less than that listed forthe three groups of cellulosics. Protein at 10-11%is high relative to other cellulosics. It isconjectured that the protein may form highlyinsoluble complexes during the high temperaturepretreatment to hydrolyze the hemicellulose.There may, therefore, be some incentive toremove more of it with the juice by means of

1996 Research Summaries 41
rewetting during the pressing process. The ashcontent at 8.6% is also relatively high. The valueof this ash as agricultural fertilizer remains to bedetermined. The exact content of the solubleslikewise has not yet been determined.
Alternately, the fibrous fraction could be field-dried and combusted for production of electricalpower. Bomb calorimeter tests have given ahigher heating value of approximately 19,000 kJ/kg. At a yield of 9.45 t/ha, this would beapproximately 50,000 kWh/ha, or if converted toelectricity at an efficiency of 0.3, electricalenergy of approximately 15 MWh/ha.
Conclusions�Staging� of the area to be cut by starting earlyand spreading the first cutting overapproximately 35-days, with repeat cuttings ofany area at 35 day intervals, appeared to workwell in 1995 and 1996. This strategy could allowharvesting and processing equipment to be usedquite steadily, at near capacity, during the entiregrowing season. On the other hand, it should berecognized that the data presented is for only oneset of unreplicated plots for two harvestingseasons. The measured yields are 125%-150% ofthose frequently reported. Less favorableweather, for example, could reduce yields anddelay regrowth.
The high unit values and yields of certain juiceproducts � e.g., soluble food-grade proteinconcentrates: ≅ 0.6 t/ha, particulate protein-xanthophyll concentrates ≅ 1.6 t/ha, industriallyvaluable enzymes ≅ 5-25 kg/ha � can make theeconomics of wet fractionation attractive. Thepotential high value of the juice products can, ina sense, �subsidize� the ligno-cellulosic fractionmaking it possible to market it in theneighborhood of $40/t dry matter.
The yield and composition of the fibrous fractionwould allow over 4000 liters/ha of ethanol to beproduced annually at 0.85 of the stoichiometricconversion. If converted to electrical energy at anefficiency of 0.3, the result would approximate15 MWh/ha annually.
ReferencesCrombie, L. 1995. Personal communication. Crombie andAssoc., St. Paul, MN.
Knuckles, B. E. and G. O. Kohler. 1982. Functionalproperties of edible protein concentrates from alfalfa. J.Agric. Food Chem. 30. pp. 748-752.Koegel, R. G. and R. J. Straub. 1994. Fractionation ofalfalfa for food, feed, biomass, and enzymes. ASAE PaperNo. 946010. St. Joseph, MI.
Koganov, M. M. 1992. Comprehensive processing ofvegetative organs of green plants. MT International, Inc.Dublin, Ohio.
Koganov, M. M., L. V. Shvaiko, N.I. Kuznetzov, L.V.Shaparenko and G. A. Lobach. 1988. The influence ofalternating current on alfalfa chloroplast coagulation.Physiology and Biochemistry of Cultural Plants.20(2):195-200.
Kohler, G. O., R. H. Edwards, and D. de Fremery. 1983.LPC for feeds and foods: The pro-xan process. pp. 508-524. Telek and Graham, eds. Leaf Protein Concentrates.AVI Publ. Co.
Pirie, N. W. 1987. Leaf protein and its byproducts inhuman and animal nutrition. Cambridge University Press.
Telek, L. and H. D. Graham (ed.). 1983. Leaf ProteinConcentrates. AVI Publ. Co., 844 pp.
Wyman, C. E., R. L. Bain, N. D. Hinman, and D. J.Sevens. 1993. Ethanol and Methanol from CellulosicBiomass. Chapter 21 in Renewable Energy. Johansson etal., ed. Island Press. Washington D.C.
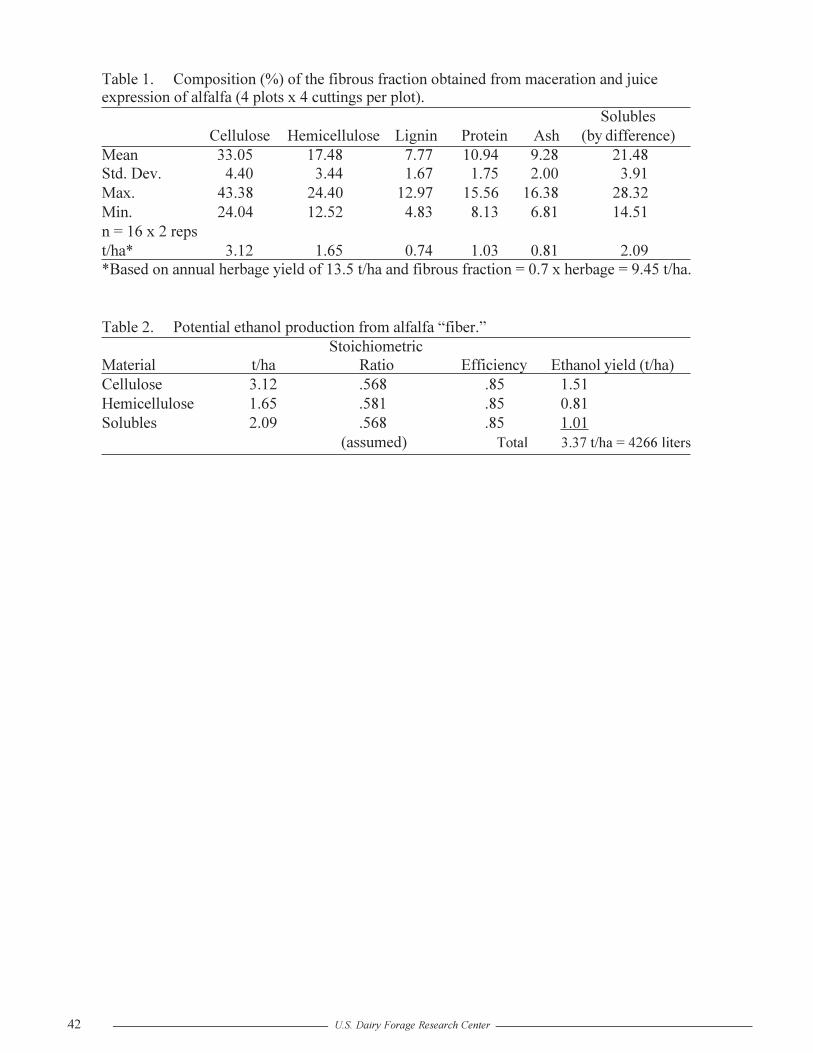
42 U.S. Dairy Forage Research Center
expression of alfalfa (4 plots x 4 cuttings per plot). Solubles
Cellulose Hemicellulose Lignin Protein Ash (by difference)Mean 33.05 17.48 7.77 10.94 9.28 21.48Std. Dev. 4.40 3.44 1.67 1.75 2.00 3.91Max. 43.38 24.40 12.97 15.56 16.38 28.32Min. 24.04 12.52 4.83 8.13 6.81 14.51n = 16 x 2 repst/ha* 3.12 1.65 0.74 1.03 0.81 2.09*Based on annual herbage yield of 13.5 t/ha and fibrous fraction = 0.7 x herbage = 9.45 t/ha.
Table 2. Potential ethanol production from alfalfa �fiber.�Stoichiometric
Material t/ha Ratio Efficiency Ethanol yield (t/ha)Cellulose 3.12 .568 .85 1.51Hemicellulose 1.65 .581 .85 0.81Solubles 2.09 .568 .85 1.01
(assumed) Total 3.37 t/ha = 4266 liters
Table 1. Composition (%) of the fibrous fraction obtained from maceration and juice

1996 Research Summaries 43
Phytase From Transgenic Alfalfa for Supplementation of Poultry and SwineRationsR.G. Koegel, S. Austin-Phillips, M.E. Cook and R.J. Straub
IntroductionBuildup of phosphorus in the environment andthe resulting degradation of water resources is ofmounting concern. Much of this buildup istraceable to human activities. Important amongthese is livestock production. Monogastricanimals, such as poultry and swine, which cansolubilize only a small fraction of thephosphorus in their grain-based rations whileexcreting the remainder, have come underincreased scrutiny. Supplementation of inorganicphosphorus into rations to meet animalnutritional requirements exacerbates theproblem.
Much of the phosphorus in grain is in the formof insoluble phytates. Researchers have shownthat supplementing poultry and swine rationswith the enzyme phytase can lead tosolubilization of the phosphorus, thuseliminating the need for phosphorussupplementation and concurrently reducing thelevel of phosphorus in the excrement toapproximately one-half of that normallyexperienced.
Because of relatively higher population andanimal densities in western Europe, concern overphosphorus buildup has preceded that in the U.S.Accordingly, certain areas, like the Netherlands,have mandated limits on animal numbers and/orrequired the use of phytase in animal rations.
The enzyme phytase derived from Aspergillusniger has, to date, generally been produced infermentation vats using genetically engineeredmicroorganisms. It has been estimated that thecost of phytase supplementation with thismaterial would be about three times the cost ofconventional supplementation with dicalciumphosphate.
As an approach to reducing the cost of phytaseproduction, a multi-disciplinary ARS-UW team
at Madison, Wisconsin has produced transgenicalfalfa with the capability of expressing phytase.This phytase can be recovered with juiceextracted from the herbage. Other constituents ofthe juice including xanthophyll, used to pigmentegg yolks and broiler skin; high levels of dietaryprotein and various vitamins and minerals add toits value in rations. The use of whole alfalfaherbage, however, would not be desirable due toits high fiber content. Since phytase wouldpotentially be needed in great quantities, but notin very pure or concentrated form, it is believedthat the economic advantage of production in�plant bioreactors� such as alfalfa would begreat. The advantage in capital costs isparticularly great. Ideally, the cost of phytasesupplementation should be competitive with thetraditional dicalcium phosphate supplement, withthe environmental benefits as an added incentive.
MethodsThrough collaborative efforts with Dr. DavidRussell (Agracetus), we obtained Agrobacteriumtumifaciens strains containing a derivative of thepBI binary vector in which the Aspergillus nigerphytase gene had been placed under the controlof either the CaMV 35S promoter or theArabidopsis thaliana Rubisco small subunit(SSU) promoter. Both constructs alsoincorporated a signal peptide for targeting of thephytase enzyme to the apoplast. We alsoconstructed an additional expression cassetteutilizing the hybrid �MAC� promoter, whichcontains elements of both the CaMV 35S andAgrobacterium nopaline synthase promoters.This promoter was fused to the A. niger phytasegene (provided by Dr. Edward J. Mullaney,USDA), again incorporating a signal peptide forapoplast localization. This expression cassettewas cloned into a pCGN binary vector andmobilized into Agrobacterium.
Transgenic plants were propagated by cuttings togenerate a sufficient number of plants for juice
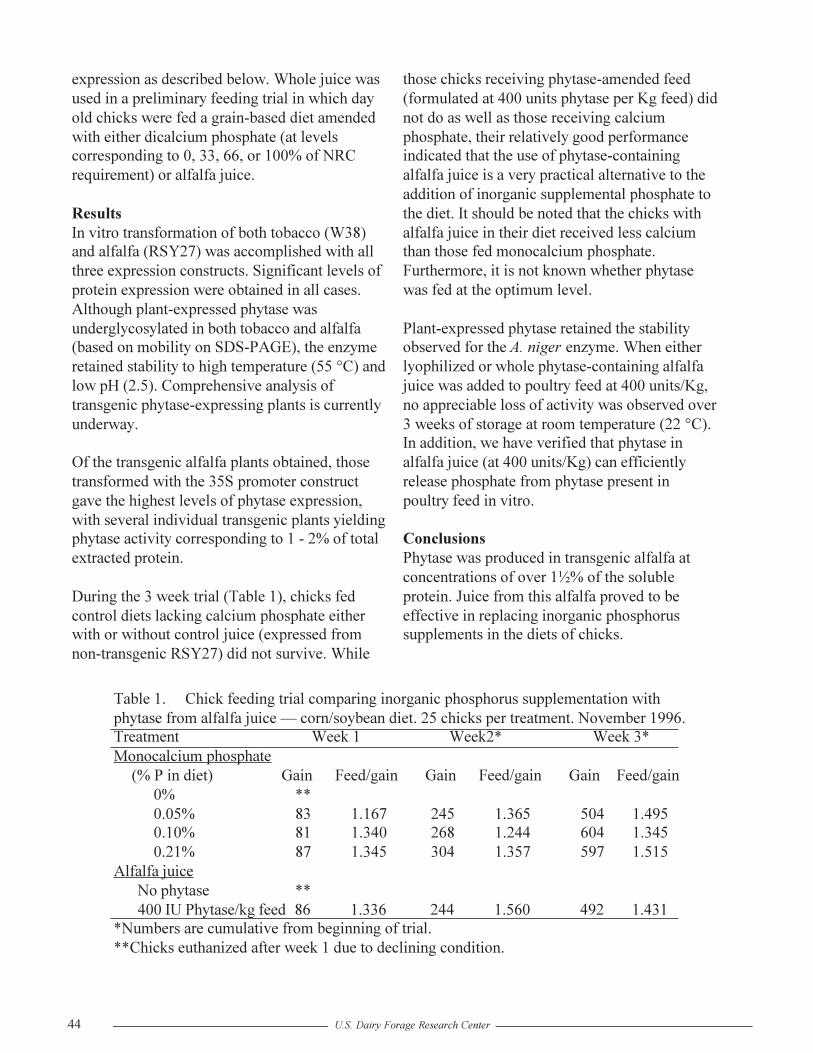
44 U.S. Dairy Forage Research Center
expression as described below. Whole juice wasused in a preliminary feeding trial in which dayold chicks were fed a grain-based diet amendedwith either dicalcium phosphate (at levelscorresponding to 0, 33, 66, or 100% of NRCrequirement) or alfalfa juice.
ResultsIn vitro transformation of both tobacco (W38)and alfalfa (RSY27) was accomplished with allthree expression constructs. Significant levels ofprotein expression were obtained in all cases.Although plant-expressed phytase wasunderglycosylated in both tobacco and alfalfa(based on mobility on SDS-PAGE), the enzymeretained stability to high temperature (55 °C) andlow pH (2.5). Comprehensive analysis oftransgenic phytase-expressing plants is currentlyunderway.
Of the transgenic alfalfa plants obtained, thosetransformed with the 35S promoter constructgave the highest levels of phytase expression,with several individual transgenic plants yieldingphytase activity corresponding to 1 - 2% of totalextracted protein.
During the 3 week trial (Table 1), chicks fedcontrol diets lacking calcium phosphate eitherwith or without control juice (expressed fromnon-transgenic RSY27) did not survive. While
those chicks receiving phytase-amended feed(formulated at 400 units phytase per Kg feed) didnot do as well as those receiving calciumphosphate, their relatively good performanceindicated that the use of phytase-containingalfalfa juice is a very practical alternative to theaddition of inorganic supplemental phosphate tothe diet. It should be noted that the chicks withalfalfa juice in their diet received less calciumthan those fed monocalcium phosphate.Furthermore, it is not known whether phytasewas fed at the optimum level.
Plant-expressed phytase retained the stabilityobserved for the A. niger enzyme. When eitherlyophilized or whole phytase-containing alfalfajuice was added to poultry feed at 400 units/Kg,no appreciable loss of activity was observed over3 weeks of storage at room temperature (22 °C).In addition, we have verified that phytase inalfalfa juice (at 400 units/Kg) can efficientlyrelease phosphate from phytase present inpoultry feed in vitro.
ConclusionsPhytase was produced in transgenic alfalfa atconcentrations of over 1½% of the solubleprotein. Juice from this alfalfa proved to beeffective in replacing inorganic phosphorussupplements in the diets of chicks.
Table 1. Chick feeding trial comparing inorganic phosphorus supplementation withphytase from alfalfa juice � corn/soybean diet. 25 chicks per treatment. November 1996.Treatment Week 1 Week2* Week 3*Monocalcium phosphate
(% P in diet) Gain Feed/gain Gain Feed/gain Gain Feed/gain0% **0.05% 83 1.167 245 1.365 504 1.4950.10% 81 1.340 268 1.244 604 1.3450.21% 87 1.345 304 1.357 597 1.515
Alfalfa juiceNo phytase **400 IU Phytase/kg feed 86 1.336 244 1.560 492 1.431
*Numbers are cumulative from beginning of trial.**Chicks euthanized after week 1 due to declining condition.

1996 Research Summaries 45
Research will continue in four areas:1. Propagation of high-producing transformants
to yield enough herbage for additional feedingtrials.
2. Plant breeding to produce cultivars with goodphytase yield, persistence, and highproduction characteristics.
3. Evaluation of alternative processes totransform juice into stable form(s) acceptableto the feed industry.
4. Additional feeding trials with both poultryand swine to determine optimum levels ofphytase, stability over time, and reduction ofphosphorus in feces.

46 U.S. Dairy Forage Research Center
A Lactic Acid Bacterial Strain to Improve Aerobic Stability of SilagesR.E. Muck
IntroductionInoculants containing lactic acid bacteria arecommon additives used by farmers in the U.S.and other parts of the world in making silage.These products help guarantee a rapid andefficient fermentation of a crop in the silo. Wheninoculant bacteria dominate fermentation, lacticacid relative to other fermentation productsincreases, dry matter recovery is improved, andanimal performance may be enhanced. However,these products have been found in many cases tomake silages more susceptible to heating andspoilage by yeasts and molds once the silage isexposed to air. This has been particularly true incorn and small grain silages. The goal of thisstudy was to determine if several strains ofmicroorganisms found in aerobically stablesilages might improve a silage�s resistance toheating.
MethodsSimilar trials were performed in two succeedingyears. Whole plant corn was chopped with aforage harvester and ensiled in 15 cm ID by 60cm long PVC pipe silos. One end of the pipe wassealed with a rubber cap � the other with blackpolyethylene sheeting secured by duct tape.There were two replicate silos for each of fivetreatments: control and four inoculant strainsapplied at approximately 105 microorganisms/gcrop. Two strains were lactic acid bacteria, andtwo were yeasts, all of which were isolated fromaerobically stable silages. The microorganismswere grown individually in batch culture anddiluted so that application rates were 1 mlinoculant solution/50 g crop. The control wassprayed with distilled water at the same rate.
After a minimum of 90 days of storage, the siloswere opened. Depth of the moldy layerunderneath the plastic was measured anddiscarded. The remaining silage was removed by15 cm units of depth so that there were four
blocks of silage per silo. Each block wasanalyzed for pH, dry matter, fermentationproducts, and aerobic stability. Aerobic stabilitywas assessed by the time required for the silageto heat 1 °C above ambient temperature whenstored aerobically in styrofoam buckets.
Results and DiscussionIn general, the top layer or layer closest to theblack polyethylene sheeting was the least stable,and the lower three layers were of similaraerobic stability. Of the various treatments, onlyone provided substantial and consistentimprovements in aerobic stability over thecontrol. As shown in Table 1, thismicroorganism, Lactobacillus buchneri TY16,more than doubled the time until heating withthe exception of the top layer in the first year.The TY16 silages in the second year did not heatover the course of the aerobic stability test (37 dof aerobic exposure). In both years, acetic acidwas higher in the TY16 silages, and in thesecond year, significant levels of propionic acidwere measured in the TY16 silages. This lacticacid bacteria is a heterofermentativemicroorganism and would be expected to boostacetic acid content, improving aerobic stability.Propionic acid is a stronger inhibitor of yeastsand molds than acetic acid. The mechanism ofpropionic acid production is not known at thistime, and it is unclear if this is directly from theactivity of TY16.
ConclusionsThese results suggest that Lactobacillus buchneriTY16 is a very promising microorganism forimproving the aerobic stability of silage. Currentstudies are in progress investigating variousaspects important to the commercialization ofthis microorganism. These studies areinvestigating the appropriate rate of applicationrelative to other strains in a potential product,stability of the microorganism, and effects of the

1996 Research Summaries 47
Table 1. Comparison of the characteristics of corn silages madewith and without inoculation with Lactobacillus buchneri TY16.
Year 1 Year 2Control TY16 Control TY16
Moldy layer, cm 5.3 5.5 7.0 0.0Time to heat, h Top layer 35 57 144 > 900 Lower layers 84 231 212 > 900pH 3.84 3.86 3.85 4.36Dry matter, % 33.1 32.8 31.3 29.7Fermentation products Lactic acid* 5.68 5.57 6.50 1.35 Acetic scid* 1.59 2.81 1.64 5.87 Propionic acid* 0.00 0.00 0.01 0.46 Butyric scid* 0.00 0.00 0.00 0.00 Ethanol* 1.12 1.06 0.32 0.76Aerobic microorganisms Yeasts+ 2.4 3.6 < 2.0 < 2.0 Molds+ < 2.0 < 2.0 2.5 < 2.0 Acetic acid bacteria+ 6.6 7.4 < 2.0 < 2.0*% Dry matter; average of the lower three layers.+Log
10(microorganisms/g silage); average of the lower three layers.
microorganism on animal performance. Suchstudies are being carried out in collaboration
with Cargill, Inc. under a cooperative researchand development agreement.

48 U.S. Dairy Forage Research Center
IntroductionPotato vines are currently killed with herbicidesbefore potatoes are harvested. However, thevines could be used as cattle feed if they couldbe properly stored. Furthermore, the harvestingof the vines would not only reduce herbicide usebut also minimize the carryover of potatodiseases and vectors in the field to the nextpotato crop. The most likely means of storing thevines is ensiling. The vines have a high moisturecontent, and the hills or ridges in the field onwhich potatoes are grown would makeharvesting wilted vines difficult. The purpose ofthe current work was to find the best methods topreserve the potato vines by ensiling.
MethodsExperiment 1. Vines of 4 potato varieties wereharvested with a flail forage harvester set at threedifferent heights to obtain high, medium and lowsoil contamination levels. The chopped vineswere ensiled in pint (~ 0.5 l) canning jars, aloneor in combination with chopped alfalfa hay orbarley grain at a ratio of 3 vines:1 amendment(w/w). Four replicates per treatment wereensiled. The silages were stored at roomtemperature for three months and then subjectedto an aerobic stability test.
Experiment 2. A single variety (RussetNorkotah) of vines was hand harvested. Half ofthe vines were chopped fresh with a stationarychopper and ensiled in pint canning jars alone orin various combinations with chopped whole-plant corn (0:1, 1:1, 1:2 and 1:4 vines to corn, w/w). The other half of the vines were wilted in agreenhouse for 24 h and ensiled alone,inoculated with 105 lactic acid bacteria/g crop,and in mixtures with whole-plant corn at ratiosof 0:1, 3:1, 1:1, 1:3 vines to corn. Three silos pertreatment were opened after 1, 2, 6, 14 and 90 dof ensiling and analyzed. The 90 d silages weretested for aerobic stability.
Ensiling of Potato VinesR.E. Muck, Z.G. Weinberg, D.I. Rouse and B.R. Igl
Results and DiscussionExperiment 1. Analysis of the fresh vines (lowsoil) is given in Table 1. The pH values of thefinal silages were 5.6-6.2, 4.5-5.2 and 3.8-4.0 forvines alone and amended with hay and barley,respectively. The major microbial populations inthe final silages were lactic acid bacteria, bacilliand acetic acid bacteria (108, 105 and 104-107 pergram, respectively). Yeast and mold populationswere generally below detectable level. Soil levelhad no discernible effects on fermentationdespite increasing ash contents to approximately50% dry matter (DM) in the high soilcontamination treatments. The silages with hayand barley had DM contents of 29.3 ± 0.7% and28.8 ± 1.3%, respectively, and had pleasantaromas. In contrast, many of the vine-alonesilages were noticeably clostridial. Over fivedays of aerobic exposure, the silages comprisingvines only were the least stable with mostreplicates heating within that period. Severalbarley-amended replicates heated whereas thealfalfa hay-amended treatments were stable.
Experiment 2. Wilting the potato vines for 24 hin a greenhouse under good drying conditionsincreased DM contents only from 11.7% to16.1%. Figures 1and 2 shows the changes in pHthroughout the ensiling period. Silage pHincreased after 1 to 2 weeks of fermentation inall of the vine-only treatments. In the unwiltedvines, this was caused by clostridialfermentation. In the wilted vines, alone orinoculated, pH increased because of thefermentation of lactic acid to acetic acid, mostlikely by lactic acid bacteria. The mixtures ofvines and corn resulted in high quality silageswith pHs less than 4.5 except for the 3:1 mixtureof wilted vines to corn. The silages comprisingonly vines or corn were the least stable uponaerobic exposure whereas none of the mixedsilages heated over five days of aerobicexposure.

1996 Research Summaries 49
ConclusionsPotato vines have a potential to be used as feedbecause the high crude protein contents and lowNDFs compensate for high ash contents.However, the harvested vines alone wereconsistently too low in DM and sugar contents toachieve a sufficiently low pH to preventsecondary fermentation. Also, silage effluentwould be a significant concern in suchunamended silages. Wilting the vines for 24 hunder good drying conditions in a greenhousemade only modest increases in DM content andstill did not permit adequate preservation.
High quality silages of potato vines wereobtained only in mixtures with drier crops, which
0 1 2 6 14 90 5 d Air
4
5
6
7
Days after Ensiling
pH
V C 1V:1C 1V:2C 1V:4C
0 1 2 6 14 90 5 d Air
4
5
6
7
Days after Ensiling
pH
V IV C 3V:1C 1V:1C 1V:3C
Figure 1. Changes in pH of fresh potato vine silages,alone or amended with whole-plant corn, duringensiling and after 5 d of aerobic exposure. V - vines,C - corn.
Figure 2. Changes in pH of wilted potato vine silages,alone or amended with whole-plant corn, during ensilingand after 5 d of aerobic exposure. V - vines, C - corn, I -inoculated.
also dilute ash levels. All three amendments(alfalfa hay, barley grain and whole-plant corn)produced good silages. Of the three amendments,barley grain produced the lowest pH, but thesesilages were the least aerobically stable of theamended silages. The best option would be toco-ensile the potato vines along with a cropwhich is harvested at the same time, such asearly maturing corn varieties. This wouldminimize the labor for harvesting and storage.Mixing with corn would also have twoadvantages: increasing the low crude proteincontent of the corn silage and improving itsaerobic stability.
Table 1. Analysis (% DM except as noted) of the fresh potato vines (low soillevel) in Experiment 1.Variety DM1 Ash NDF ADF ADL CP WSC2 BC3
LAB4
Norkotah 13.2 26.2 34.8 29.4 5.1 19.4 5.8 376 4.1Norland 12.6 29.3 31.9 23.5 4.8 22.1 5.2 565 3.7WI 1005 10.7 22.0 35.9 27.5 4.4 26.0 7.0 380 3.9WI 1099 12.2 33.0 28.6 24.5 3.5 22.4 4.5 415 3.31%2Water soluble carbohydrates3Buffering capacity, meq/kg DM4Lactic acid bacteria, log10 CFU/g vines

50 U.S. Dairy Forage Research Center
0 5 10 15 20 25 30 350
5
10
15
20
25
Crude Protein, % DM
Soluble NPN, % DM
Alfalfa
Red Clover
Orchardgrass
Wheat, Barley
Sorghum-Sudan
Corn
Proteolysis in Different Forage SilagesR.E. Muck, D.R. Mertens and R.P. Walgenbach
Pediococcus cerevisiae to guarantee a minimumlevel of lactic acid bacteria for fermentation.Silos were stored at room temperature for 30days. Unensiled forages and silages wereanalyzed for DM, pH, crude protein, and solubleNPN. Silages were analyzed for fermentationproducts.
Results and DiscussionIn the first year, much of the growing season wascool and very wet, whereas in the second yearthe first half of the growing season was warmwith generally below normal precipitation. Thisvariation in weather conditions produceddifferences in fermentation. Most silages werewell preserved, but out of 600 silages, 12 hadsignificant levels of butyric acid in the wet yearand only 2 in the dry year. Also silage pHs,particularly in the legume silages, were higherand had a greater range in the wet year comparedwith the dry year. Most likely, the wet yearproduced forages of lower sugar content andhigher buffering capacity.
In spite of fermentation differences, proteolysisdid not appear to be affected by year. SolubleNPN (% DM) for all crops is shown in Figure 1.What was surprising was the continuum among
Figure 1. Soluble NPN as a function of crudeprotein content for all silages in both years.
Introduction
One of the most significant processes occurringduring ensiling is proteolysis or the enzymaticbreakdown of proteins to soluble nonproteinnitrogen (NPN) forms such as peptides, freeamino acids and ammonia. This process occurs inthe first few days of ensiling and may result in upto 85% of the crude protein in alfalfa silage beingsoluble NPN. This loss of true protein,particularly in silages fed to high-producing dairycows, may significantly reduce the efficiency ofnitrogen utilization by ruminants. Althoughconsiderable information is available concerningproteolysis in alfalfa and red clover, much less isknown about other forage silages. The objectivesof this study were to: 1) investigate the effects ofmaturity and dry matter (DM) content onproteolysis during ensiling in seven crops (alfalfa,red clover, orchardgrass, wheat, barley, sorghum-sudan grass and corn), and 2) determine ifproteolysis can be reasonably predicted by simplemeans available to commercial laboratories.
MethodsSilages of different forages were made over twoyears. Each forage was harvested in primarygrowth and at least one regrowth period per yearexcept for small grains and corn (only primarygrowth). Harvesting began when a forage reacheda late vegetative stage and continued through atleast late flower development. This was done ona weekly basis the first year and biweekly basisthe second year. One portion of mowed foragewas chopped in a stationary chopper and ensiledimmediately. Except for corn, four other portionswere weighed onto screens and dried in thegreenhouse to 35, 45, 55 and 85% DM. The 35 to55% DM portions were chopped and ensiledupon reaching the desired DM content. The 85%DM forage was stored dry to represent hay.Ensiling was done in pint (473 ml) canning jars.Prior to ensiling, all crops were inoculated at arate of 104 bacteria/g crop with a commercialinoculant containing Lactobacillus plantarum and

1996 Research Summaries 51
crops with the exception of red clover andpossibly sorghum-sudan grass. The lower NPNlevels in red clover were anticipated based onearlier work at the Center, implicating the actionof polyphenol oxidases. It is not known whatmay be affecting proteolytic activity in sorghum-sudan grass.
Stepwise regression was used to determinewhich factors would be useful in predictingsoluble NPN (% DM basis). For all crops, crudeprotein and DM contents were the mostimportant factors (Table 1). In some cases, silagepH significantly improved the prediction ofsoluble NPN. Excluding red clover andsorghum-sudan grass, a single regression usingcrude protein and DM contents as independentvariables could explain 87% of the variation in
soluble NPN across the other crops. Theequations are currently being used to predictsoluble NPN from silages (both laboratory andfield-scale silages) reported in published studies.Preliminary results indicate that the equations arereasonably predicting soluble NPN in these otherstudies.
ConclusionsOverall, these results suggest that soluble NPNcan be estimated from parameters that areroutinely provided by forage testing laboratories.This should help forage testing laboratories tomore accurately estimate the feeding value ofsilages for farmers. Further validation work isneeded to prove that this concept in estimatingsoluble NPN is sound and to establish the levelof error associated with the prediction equations.
Table 1. Regression equations for soluble NPN (% DM basis) in forage silages.Number of
Crop parameters Equation+ R2, %Alfalfa 2 -0.840 - 0.0629 DM + 0.722 CP 77.1
3 -0.952 - 0.0633 DM + 0.0364 PH + 0.720 CP 77.1Red Clover 2 -3.185 - 0.0590 DM + 0.640 CP 77.3
3 -8.242 - 0.0823 DM + 1.590 PH + 0.568 CP 80.0Orchardgrass 2 -0.336 - 0.0326 DM + 0.553 CP 78.8
3 2.065 - 0.0235 DM - 0.605 PH + 0.553 CP 79.2Wheat, Barley 2 1.000 - 0.0570 DM + 0.684 CP 89.5
3 -3.827 - 0.0895 DM + 1.596 PH + 0.609 CP 90.3Sorghum-sudan 2 1.670 - 0.0547 DM + 0.432 CP 89.3
3 -2.520 - 0.718 DM + 1.229 PH + 0.399 CP 90.2Corn 2 1.250 - 0.0365 DM + 0.299 CP 59.6
3 -0.564 - 0.0450 DM + 0.532 PH + 0.300 CP 61.2Combined* 2 -0.947 - 0.0506 DM + 0.699 CP 86.6
3 -1.824 - 0.0548 DM + 0.267 PH + 0.686 CP 86.7+DM - dry matter content, %; PH - pH; CP - crude protein, % DM*Combined - all crop data except red clover, sorghum-sudan grass

52 U.S. Dairy Forage Research Center
Round Bale Silage Storage Losses of Ryegrass and Legume-Grass ForagesR.L. Huhnke, R.E. Muck and M.E. Payton
IntroductionRound bale silage offers producers anotheroption for harvesting and storing high qualityforage. Even though the factors influencingsilage quality are well documented, producersoften harvest and wrap forages outside the limitsconsidered acceptable for adequate fermentationand stable storage. This is especially true formoisture content, where the recommended rangefor successful ensiling is approximately 50 to70% on a wet basis. Moisture contents below50% are discouraged because of the increasedlikelihood of heating and respiration losses. Theobjective of this research was to measure silagequality and dry matter (DM) losses in round balesilages wrapped at moisture contents at andbelow recommended levels.
MethodsThe study was carried out at four farms ineastern Oklahoma. First cutting forages (ryegrassor grass-clover mixtures) were harvested andensiled. Grass ranged from late bloom to doughstage while clovers ranged from mid to latebloom. Bales were formed using a VermeerModel 504I baler and were approximately 1.2 min diameter and 1.2 m in width. At least 5 baleswere made during three to four baling periodsover two days at each location, giving a range ofmoisture contents. Bales were cored for analysisof moisture content and quality prior towrapping. Bales were wrapped within two hoursof being formed with white stretch film. At leastsix layers of film were used on each bale. Baleswere weighed before being placed into storageon an exposed site at each location. Each balewas spaced at least 0.5 m apart from adjacentbales. After a minimum of six months storage,bales were weighed and cored at mid-height oneach side. Samples were taken from the outer 10cm and from 10 to 23 cm, representingapproximately one third of bale volume. Sampleswere analyzed for moisture, pH, crude protein
(CP), acid detergent fiber (ADF), neutraldetergent fiber (NDF), total digestible nutrientsand fermentation products.
Results and DiscussionAcross the four locations, moisture content atensiling varied from 25.3% to 69.1%, wet basis,and dry densities ranged from 101 to 203 kg/m3.After at least six months of storage, averageweight losses were small. For moisture contentsabove 50%, average weight losses for the fourlocations ranged from 0.8 to 2.0%. Lower weightlosses were measured in the drier bales, 0.0 to0.7%. Significant increases in CP and ADFoccurred between the initial forage samples andfinal silages whereas NDF was unchangedexcept at the McAlester farm (Table 1). Therelatively constant NDFs most likely werecaused by the enzymatic breakdown ofhemicellulose during ensiling offsetting theincrease in concentration from DM losses.Changes in these quality parameters were notsignificantly affected by moisture content at anyof the locations except for NDF at the McAlesterfarm. Assuming no loss or formation of CP andADF in the bales, estimated DM losses acrossthe four locations ranged from 5.6 to 9.1% and2.4 to 11.7% based on CP and ADF contents,respectively. These estimated losses are lowrelative to those expected in traditional uprightand bunker silos. However, our results are inagreement with those reported by other wrappedbale studies with various forages in other parts ofthe world.
Bale moisture content did affect fermentation. Ingeneral, silage pHs increased and lactic andacetic acid contents decreased with decreasingmoisture content. Silage pHs tended to be higherand fermentation product levels lower thantypically observed in silages from upright orbunker silos. Nevertheless, good preservationwas observed in most bales. Only four bales

1996 Research Summaries 53
across the four locations had detectable levels ofbutyric acid, an indicator of poor fermentation,and none of these bales had butyric acid contentshigh enough to affect intake. Of the 312 samplesanalyzed, 18% had pH values above 6.5,indicating spoilage. Most of these samples werein the outer core samples. The proportion abovepH 6.5 was relatively constant across sampleshaving moisture contents less than 65%. Thusbales ensiled at moisture contents that wouldnormally be considered too dry (< 50%) wereapparently preserved as well as bales ensiled atrecommended moistures (50 to 70%).
ConclusionsGrass and grass-legume silages made at lowmoisture content (< 50%) in wrapped round
bales had similar changes in quality (CP, NDF,ADF) as silage made at higher, recommendedmoisture contents. Fermentation was reduced inlow moisture bale silages, but spoilage andestimated DM losses were low and similar over awide range of moisture contents. Consequently,the results of this study show that forages atmoisture contents above that considered safe fordry storage (> 20%) but less than that acceptablefor well-preserved silage (< 50%) can bepreserved well in wrapped round bales providedthat the integrity of the plastic film ismaintained.
Table 1. Average bale quality at the four sites.CP (% DM) ADF (% DM) NDF (% DM)
Outer Layer, cm Outer Layer, cm Outer Layer, cmLocation Initial 0-10 10-23 Initial 0-10 10-23 Initial 0-10 10-23McAlester 11.4 11.9 12.1* 39.6 41.3* 40.2 69.4 67.1* 65.7*Hugo 13.5 14.8* 14.7* 36.7 42.6* 40.2* 60.9 62.1 59.1Stillwater 11.8 13.3* 12.6* 37.5 40.1* 40.1* 55.5 55.2 55.1Haskell 13.0 14.0* 13.6* 35.2 37.3* 37.3* 57.8 58.7 58.1*Silage characteristic is significantly different (P < 0.05) from that in the initial forage.

54 U.S. Dairy Forage Research Center
Economics of Alternative Silage SystemsC.A. Rotz
cows plus 85 replacement heifers. Feed rationswere determined for two groups of heifers, a drycow group, and three groups of lactatinganimals. A mobile mixing wagon was used toprepare total mixed rations for each animalgroup. Round bales of hay were self-fed andavailable as needed.
Essentially all forage and grain feeds required bythe herd were produced from 120 acres of alfalfaand 150 acres of corn. Alfalfa was harvestedusing a four cutting harvest strategy with the firsttwo cuttings harvested at a bud stage ofdevelopment and the last two harvested in earlybloom. Harvests began within 5 days of May 30,July 6, and August 20 for the first three cuttingsand on October 15 for the fourth cutting. First,third, and fourth cuttings were harvested aswilted silage, and second cutting was baled inlarge round bales. Corn was harvested as silageand high moisture grain to fill the available silos,and additional corn was harvested as dry grain.
Results and DiscussionThe type of storage affects harvest rates, foragelosses, the nutritive value of feeds produced, andanimal performance (Table 1). Greater loss inbunker silos reduces the alfalfa and corn silagesavailable as feed. Nutritive changes affect thecorn and protein supplements required to meetthe herd energy and protein requirements.Nutritive loss in bunker silos causes a small dropin milk production, and the lower digestibility ofthis silage leads to slightly more manure tohandle. Nutritive changes in bale silageinfluenced the nutritive content in manure whichcaused a slight increase in fertilizer use.
The silage system selected affects machineryuse, production costs, and farm profitability.With bunker silos, harvest and feeding rates are alittle higher which reduces machinery operatingcosts and the use of fuel and electricity. Storagecosts are lowest for silage bags priced at $5/ton
IntroductionConcrete tower silos have been used on dairyfarms for many years. Bunker silos are becomingmore popular, particularly on larger farms,because they offer more rapid filling andemptying. Many bunkers are not covered though,which causes greater feed losses. Another optionis bagged silage where silage is pressed andsealed in large bags. Most recently, baled silagehas gained some popularity. Large round bales ofwet hay are wrapped in plastic where theyferment. Quantifying the costs and benefits ofalternative storage methods is not easy.Technology that performs well under one set ofcrop and weather conditions may not performwell at other times. Long term studies are neededover a wide range of conditions. Models such asDAFOSYM, developed and validated withlimited experimental work, can be used to studysystem performance over many years of weather.Many alternative dairy systems have beenmodeled with DAFOSYM to determine theirvalue to producers.
Materials and MethodsDAFOSYM is a simulation model of cropproduction and feed use on dairy farms and thereturn of manure nutrients to the land. This dairyforage system is simulated over many years ofweather to determine long term performance andeconomics of alternative technologies and/ormanagement strategies. By modeling severaloptions on the same representative farms, thosethat provide maximum farm production or profitare determined. As an example of the use of theprogram, silage systems using either stave silos,uncovered bunkers, silage bags, or bale silagewere compared. This was not intended to be anextensive comparison of these systems, butsimply an example of how these storage systemscompare on a typical farm.
The farm represented a typical farm in southernMichigan with 100 high-producing Holstein

1996 Research Summaries 55
DM of silage and highest for bales wrapped withplastic costing $20/ton DM of silage. The twobunker silos (40 ft. x 140 ft., $45,000 each) had ahigher initial cost than the four stave silos (18 ft.x 70 ft., $19,500 each) which led to slightlyhigher storage costs. Labor cost was a littlehigher for the bunker silo due to an extra personneeded to operate the packing tractor. Overall,the annual net return or profit of the farm was$13,500 greater using the bag silage systemcompared to stave silos. Use of uncoveredbunker silos reduced net return by $14,500 per
year. The bale silage system reduced farm netreturn $2,000 per year below that of the stavesilo system.
ConclusionThe most economical silage system for the 100cow dairy farm was a bagged silage method. Useof either stave silos or wrapped bale silageprovided similar farm profits which weresubstantially less than those of bagged silage.The least profitable storage method was anuncovered bunker silo.
Table 1. Effects of silage storage method on feed use, annual costs, and annual net returnof a 100 cow (270 acre) dairy farm producing corn and alfalfa silages.
Stave Uncovered Silage SilageProduction or cost parameter Units silos bunkers bags balesAlfalfa hay production ton DM 143 144 143 144Alfalfa silage production ton DM 345 302 362 341Corn silage production ton DM 291 277 308 290High moisture corn production ton DM 160 160 160 160Corn grain production ton DM 54 55 55 54Alfalfa purchased (sold) ton DM (14) 31 (43) (13)Corn grain purchased (sold) ton DM 29 47 8 36Protein supplements purchased ton DM 47 42 58 42Average milk production lb/cow 20,973 19,912 21,355 20,882Manure production ton 6,966 7,249 6,786 6,999
Field and feeding machinery cost $ 49,134 44,939 47,317 46,596Fuel and electric cost $ 6,330 5,912 5,966 5,975Feed and machinery storage cost $ 22,164 23,527 18,660 26,295Labor cost $ 35,288 36,602 35,178 35,077Seed, fertilizer, and chemical cost $ 13,935 13,991 13,873 14,260Corn drying cost $ 1,019 1,021 1,021 1,019Purchased feed and bedding cost $ 26,992 29,521 27,278 26,485Animal and milking facilities cost $ 35,261 35,261 35,261 35,261Livestock expenses $ 23,800 23,800 23,800 23,800Milk hauling and marketing fees $ 18,501 17,565 18,838 18,421Property tax $ 4,924 4,994 4,554 4,739Total production cost $ 237,348 237,133 231,746 237,926Milk, feed, and animal sale income $ 294,906 279,554 302,328 293,434Net return to management $ 57,558 42,421 70,582 55,508

56 U.S. Dairy Forage Research Center
Plant Chemistry
Using Molecular Modeling to Predict Spectral Characteristics ofPeroxidase ProductsR.D. Hatfield
IntroductionDetermining spectral changes when reactants areconverted to products is a convenient andsensitive method of monitoring the progress ofreactions. It is useful to know ahead of time thespectral characteristics of the anticipatedproducts. This is not always possible as theproducts may not be commercially available and/or spectral information is unknown. Molecularmodeling provides a potential means ofpredicting the spectral characteristics ofcompounds that may be formed during a reaction(in some cases multiple products might actuallybe formed). To test this hypothesis, CAChe, amolecular modeling program, was used topredict the spectral characteristics of ethylferulate, typical ferulate dehydrodimers, sinapylalcohol, and potential cross reaction products ofsinapyl alcohol. Authentic samples of ethyl
ferulate and sinapyl alcohol were available forverification of the predicted electronic spectra.
Materials and MethodsThe CAChe system from Oxford MolecularGroup was used to build models of predictedstructures of dimers formed from sinapyl alcoholand ethyl ferulate. Molecular structures wereoptimized using MM2 molecular mechanicparameters, and ZINDO (Zerner�s IntermediateNeglect of Differential Overlap) program wasused to compute spectroscopic properties(electronic spectra) of the molecules.
Results and DiscussionEthyl ferulate dehydrodimers, 8-5 (1), 8-O-4 (2),5-5 (3), and 8-8 (4) (Fig. 1), were built using theCAChe molecular modeling program and allstructures optimized for lowest energy using the
Wavelength (nm)
Mol
ar A
bsor
ptiv
ity (
l/mol
-cm
)
190 210 230 250 270 290 310 330 350 370 3900
100000
200000
Ferulate dimer 5-5
Ethyl Ferulate
Ferulate dimer 8-8
Electronic Spectra
Wavelength (nm)
190 210 230 250 270 290 310 330 350 370 3900
100000
200000
Ferulate dimer 8-5Ferulate dimer 8-O-4
Ethyl Ferulate
Figure 1. Ferulate dehydrodimers analyzed for spectral characteristics using theCAChe Molecular Modeling Program. Coupling products of sinapyl alcoholmodeled with CAChe.

1996 Research Summaries 57
MM2 parameters. Predicted electronic spectrafor the compounds are given in Fig 2. Althoughthese predictions were based on molecules in anull environment having no other chemicalinteractions, the predicted maximum at 300 nm(Fig. 2) was similar to that observed for ethylferulate in an organic solvent such as methanol(maximum at 310 nm). The predicted spectra forthe ferulate dimers show slight changes in themaximum around 300 nm except for the 8-8dimer that has a significant shift to a longerwavelength (345 nm). These predicted values areconsistent with observed spectra of ethyl ferulatedimers. Although the spectral region from 190 to240 would be much more diagnostic for theferulate dimers, this region is of little practicaluse in monitoring cross coupling reactionsmediated by peroxidases due to the strongabsorbance displayed by most buffering systemsin this region.
Electronic spectral predictions for sinapylalcohol and two potential cross-couplingproducts are shown in Fig. 3. In both cases thedimers have significantly different spectralproperties from the sinapyl alcohol. We have notbeen able to obtain actual spectra for the twodimer products, but the predicted spectra forsinapyl alcohol is close to the observed spectra(maximum at 270 nm). From monitoringperoxidase mediated coupling reactions ofsinapyl alcohol, there is a significant loss of themolar absorptivity maximum at 270 nm. Againthe region from 190 to 230 nm would bediagnostic but is unavailable due to interferencefrom buffers and solvents used to obtain theelectronic spectra.
O
OH
OCH3
HO
OH
OCH3H3CO
O
OCH3
OH
OCH3CH2O
O
OCH3
O
OH
OCH3
O
OOCH3
O
OH
H3COOCH3
OH
OO
OH
OCH3
H3CO
OH
OCH2 CH3O
HO
OH
OCH3
OCH3
O
H3CO OCH3
HO
HO
O
OH
OCH3
H3CO OCH3
OH
O
H3CO
Ethyl Ferulate (8-5) (8-O-4) (5-5) (8-8)
OCH2CH3CH3CH2O
CH3CH2OCH3CH2O
CH3CH2OCH3CH2OOCH2CH3
Sinapyl Alcohol (8-8) (8-O-4)
Figure 2. Electronic spectra predicted for ferulate dimers.
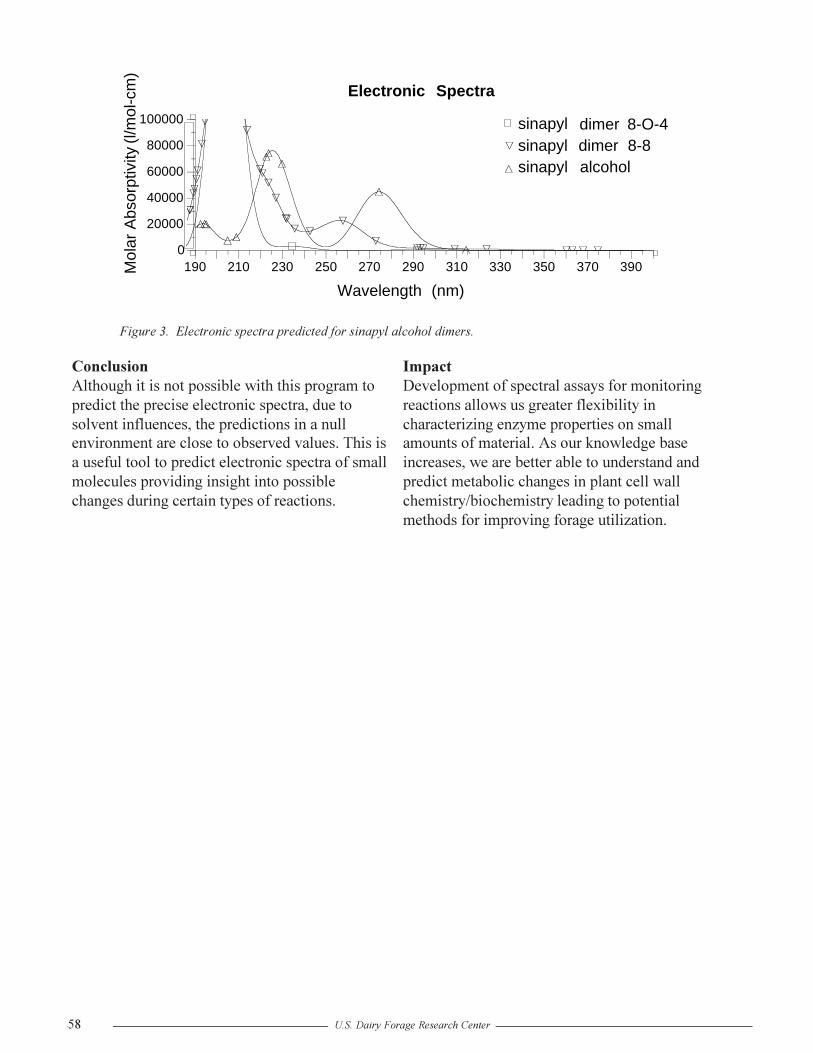
58 U.S. Dairy Forage Research Center
ConclusionAlthough it is not possible with this program topredict the precise electronic spectra, due tosolvent influences, the predictions in a nullenvironment are close to observed values. This isa useful tool to predict electronic spectra of smallmolecules providing insight into possiblechanges during certain types of reactions.
Figure 3. Electronic spectra predicted for sinapyl alcohol dimers.
ImpactDevelopment of spectral assays for monitoringreactions allows us greater flexibility incharacterizing enzyme properties on smallamounts of material. As our knowledge baseincreases, we are better able to understand andpredict metabolic changes in plant cell wallchemistry/biochemistry leading to potentialmethods for improving forage utilization.
Electronic Spectra
Wavelength (nm)
Mol
ar A
bsor
ptiv
ity (l
/mol
-cm
)
190 210 230 250 270 290 310 330 350 370 3900
20000
40000
60000
80000
100000
sinapyl alcohol sinapyl dimer 8-8
sinapyl dimer 8-O-4

1996 Research Summaries 59
Formation of Intramolecular Ferulate Dehydrodimers: A MolecularModeling ApproachR.D. Hatfield and J. Ralph
IntroductionIt is becoming clear that the formation of ferulatedimers plays a crucial role in the structure andfunction of grass cell walls. With improvedtechniques for the detection of all thedehydrodimers, researchers are findingsignificantly higher amounts of wall cross-linking than previously assumed. If all of theferulate dimers are intermolecular (between twopolysaccharide chains) in nature, then therewould be a significant impact on wall structure.If, on the other hand, intramolecular dimers(between two ferulates on the samepolysaccharide chain) were formed, the impacton wall structure would be diminished. Thenature of ferulate dimers attachment cannot beelucidated by normal solvolysis techniques usedto analyze ferulates in walls. Release of theferulate dimers by alkaline hydrolysis eliminatesall structural information about how they wereonce attached within the wall. One approach is todigest cross-linked walls with hydrolyticenzymes and look for xylose oligosaccharidesthat have both ends of a ferulate dimer attached.This would be a tedious process. Furthermore,one may well be seeking something that does notexist. As an alternative, we have used molecularmodeling to predict the likelihood ofintramolecular formation of ferulate dimers.
Materials and MethodsThe CAChe system from Oxford MolecularGroup was used to build carbohydrate modelscontaining two side chains of ferulatedarabinose. Molecular structures were optimizedto the lowest energy using MM2 molecularmechanic parameters. The initial structurecontained 15 xylan residues with the ferulatedarabinose residues on xylose 3 and 12 (see Fig.1); this was considered the base structure.Experimental structures consisted of moving theside chain from xylose 12 to 4, minimizing thisstructure and coupling the two ferulates by 8-O-4, 8-5, 5-5 or 8-8 linkages and repeating theminimization. This cycle was repeated with thesecond side chain on xylose 5, 6, 7, then 8. Thexylan backbone was either locked in its initialenergy configuration or allowed to relax duringthe minimization procedures. If any structuregave a higher energy than the base molecule, theresulting minimized structure was tweeked byaltering the structure and repeating theminimization. This prevented the molecule frombecoming stuck in a local minimum that wouldnot reflect the true minimized optimum structure.For some structures which appeared to producelow energy optimum structures with anintramolecular diferulate linkage, energy mapswere constructed of major dihedral angles todetermine if the molecule would naturally reachthis configuration.
12987
65
4321
Figure 1. Schematic representation of a xylan fragment used in molecular modeling experiments. The left xyloseresidue is the non-reducing end of the molecule. Specific structural details have been left off to simplify the diagram.Numbers at the bottom of the diagram represent the numerical order of xylose residues used in the modelingexperiments.

60 U.S. Dairy Forage Research Center
For ferulate monomers in positions 3-4, 3-5 and3-6, there is the potential for formation of dimersas long as the individual molecules can freelyrotate around the axis of the xylan backbone. Tocheck this possibility we have generated energymaps of the major dihedral angle changes thatmust occur to allow dimer formation. In mostcases, it appears that sufficient energy barriersexist to prevent them from achieving the properorientation necessary for coupling to form any ofthe dimers. The only configuration that appearsfeasible would be the 8-O-4 or 8-5 dimers whichare in position 3-4. Ferulates in this positionoverlap sufficiently to allow coupling withminimum rotation along the xylan backboneaxis.
ConclusionsBased on the modeling predictions combinedwith experimental evidence, intramolecularformation of ferulate dimers would appear to berestricted to positions 3-4 (dimers 8-O-4 and 8-5)or positions 3-7 (5-5 dimer). The latter isespecially interesting since it may explain theunexpected preponderance of the 5-5 dimers ingrasses.
ImpactIncreased understanding of cell wall cross-linking chemistry affected by dimerization offerulates will aid in the development of strategiesfor improving forage plants. These strategiesmay include genetic selection for or againstspecific traits, molecular modification of enzymeactivity, or development of post-harvesttreatments (specialized hydrolytic enzymes) toincrease wall degradation.
Results and DiscussionAll structural configurations in which the xylanwas allowed to fully relax produced energyminimizations nearly the same as the startingconfiguration before coupling the ferulates (anyenergy difference less than 20 Kcal wasconsidered not to be an unfavorable energyconfiguration). However, with this set ofparameters, formation of dehydrodimers atposition 3-7 and 3-8 resulted in a buckling of thexylan backbone in order to achieve a low energystructure. Even the 8-8 dimer at position 3-6resulted in some distortion of the backbone (Fig.2). As might be expected, when the xylanbackbone was held rigid, no ferulate dimerscould produce a low energy configuration atpositions 3-7 or 3-8, except for the 5-5 dimer atposition 3-7. Our interpretation of these results isthat, if ferulate monomers are attached to a xylanbackbone with more than 3 xylose residuesbetween them, it would not be possible to formintramolecular dimers. This is based onexperimental evidence which suggests xylansprefer to stay in rigid rod type configuration witha three fold screw axis (no abnormal flexing toachieve coupling).
The one exception was the formation of the 5-5dimer at position 3-7. This particulararrangement of ferulate monomers positionsthem in a configuration that is conducive to 5-5coupling. This is of interest in that we cannotproduce 5-5 coupled dimers using modelcompounds such as ethyl ferulate and wallperoxidases in free solution. Perhaps theformation of 5-5 dimers within wall matricesrequires an exact positioning of the ferulatemonomers.
Figure 2. Schematic representation of a distorted xylan backbone when ferulate coupling is attempted with 4 (3-7) ormore xylose residues between the ferulates.
121 2 3 4 5 6 7 8 9

1996 Research Summaries 61
Use of Calorimetry to Verify Lignin Concentration EstimatesH.G. Jung and V.H. Varel
IntroductionLignin is a cell-wall polymer derived from free-radical reactions of hydroxycinnamyl alcoholsand other cell-wall constituents. Lignin has beenimplicated as the primary component of cellwalls that limits forage cell-wall digestibility byruminants. A major difficulty in studying the roleof lignin in cell-wall digestibility has been that adefinitive molecular structure cannot be drawnfor lignin, and all lignin concentration estimatesare purely empirical, based on the particularmethod of analysis chosen. As a result, ligninconcentration estimates vary widely amongmethods. Acid detergent lignin (ADL)employing 12 M H
2SO4 is the most commonlyused method in animal science and agronomy.We have previously shown that Klason lignin,which gives lignin concentration estimates twoto five times higher than ADL, is notsignificantly contaminated with protein orcarbohydrate and is similar to ADL in molecularcomposition. We believe the ADL methodunderestimates lignin concentration due to lossof acid-soluble lignin in the acid detergent stepof the procedure. Calorimetry data are presentedwhich verify that ADL does not account for allof the plant lignin and Klason lignin does notover-estimate lignin concentration.
Materials and MethodsA diverse group of 10 forage samples was usedin this study. All forages had been dried andground to pass a 1-mm screen in a cyclone mill.These forages were analyzed for totalcarbohydrate by a two-stage acid hydrolysis withneutral sugars quantified by GLC and uronicacids with colorimetry. Protein was determinedas total N x 6.25. Lipids were analyzed byextraction with ether. Ash content of all sampleswas determined by combustion at 450 oC. Klasonlignin was determined as the ash-free residuefrom the two-stage acid hydrolysis. Aciddetergent lignin was determined by sequentialdetergent analysis. Bomb calorimetry was used
to determine the gross energy (GE) of all foragesamples. A calculated GE value was derived byapplying published GE values for the foragechemical components to the measuredconcentrations of those components:
calculated GE = (protein x 5700 kcal/kg) +(carbohydrate x 4000 kcal/kg) + (lipid x 9500kcal/kg) + (lignin x 8000 kcal/kg).
These calculations were done for ADL andKlason lignin concentration estimates. Thecalculated GE values were then compared to thecorresponding measured GE of the forages.
Results and DiscussionThe forages varied widely in chemicalcomposition and Klason lignin values were, asexpected, much greater than corresponding ADLvalues (Table 1). Measured concentrations ofprotein, lipid, and ash were similar to publishedvalues for these types of forages. Gross energyvalues of these forages determined by bombcalorimetry (Table 2) were also similar toexpected levels. When GE was calculated fromthe analyzed composition of the forages, use ofKlason lignin resulted in GE recoveries (as apercent of the measured GE) averaging 93.1%whereas a similar calculation of GE based onADL resulted in an average recovery of only75.8% (Table 2).
Because lignin concentration estimates were theonly element of the calculation that changed, thisdifference in recovery between lignin methodswas expected. However, if Klason lignin indeedoverestimates lignin concentration, then thecalculated GE should have been greater than100% of measured GE. The facts that Klasonlignin allowed a better accounting for measuredGE than ADL and that this GE recovery was lessthan 100%, indicate Klason lignin is a moreaccurate quantitative measure of ligninconcentration. The lack of complete recovery of

62 U.S. Dairy Forage Research Center
the measured GE in the calculation can beattributed to the incomplete recovery of sampledry matter by the component analyses. UsingKlason lignin, dry matter recoveries ranged from84 to 93%. If we assume all non-recovered GEby the component calculation is carbohydrate(the least energy dense forage component), then
Table 1. Chemical composition of the forage samples.Lignin
Sample Protein Carbohydrate Lipid Ash ADL Klason- - - - - - - - - - - - - % DM - - - - - - - - - - - - -
Alfalfa 21.3 44.5 1.8 8.8 5.8 15.0Alfalfa 16.2 46.1 2.3 10.6 5.9 13.6Kura clover 21.1 41.2 4.0 8.9 2.1 8.4Annual Medic 25.9 38.5 2.9 14.3 2.6 9.3Corn silage 7.1 63.3 3.6 5.0 1.4 12.2Corn silage 11.1 59.6 4.2 7.5 1.4 10.0Orchardgrass 14.2 42.9 4.4 11.4 2.5 12.6Bromegrass 11.6 52.9 1.6 9.0 3.8 15.5Switchgrass 9.3 51.2 1.3 8.3 2.4 14.2Oat straw 4.2 60.4 0.6 10.7 4.7 16.6
Table 2. Percent of measured forage gross energy accounted for bycalculated gross energy using ADL and Klason lignin.
Calculated Gross EnergySample Measured Gross Energy ADL Klason lignin
kcal/kg ---------- % ----------Alfalfa 4493 80.8 97.1Alfalfa 4371 79.1 93.1Kura clover 4460 76.2 87.6Annual Medic 4308 81.3 93.7Corn silage 4392 77.2 96.9Corn silage 4497 78.4 93.7Orchardgrass 4485 70.1 88.1Bromegrass 4323 74.8 96.5Switchgrass 4377 66.1 87.8Oat straw 4182 73.8 96.7
dry matter recoveries using Klason ligninincrease (94 to 100%). We have reason tobelieve carbohydrate recoveries were incompletebecause there were unidentified peaks on theneutral sugar chromatograms. We areinvestigating the source of these peaks.

1996 Research Summaries 63
Revising the Acetyl Bromide Assay to Optimize Lignin Determinations inForage PlantsR.D. Hatfield, K. Brei and J.H. Grabber
IntroductionThe acetyl bromide method was originallydeveloped to provide a rapid, yet sensitive,spectrophotometric method to determine ligninconcentrations in small wood samples (Johnsonet al.). It has since been modified a number oftimes mostly to adapt the procedure toherbaceous plants. Most recent modificationshave utilized perchloric acid as a catalyst to aidin the total solubilization of plant cell walls(Iiyama and Wallis). We were interested in usingthis method for small forage samples and ligninfractions which are not amenable to forminginsoluble residues (i.e., Lignin-carbohydratecomplexes, etc.). However, difficulties whicharose during routine sample analysis promptedus to re-evaluate the standard procedure toimprove the reliability of lignin determinations.
Materials and MethodsFor all experiments, the acetyl bromide reagentwas 25% (v/v) acetyl bromide in glacial aceticacid. All samples were dried overnight at 50 °Cbefore weighing into glass culture tubes (16 x150 mm) fitted with Teflon lined screw caps.Weighed samples were placed in a vacuumdesiccator over P
2O5 with the caps off for at least18h before analyzing. The standard procedureinvolved removing the samples from thedesiccator, adding 2.5 mL of acetyl bromidereagent (prepared fresh), capping immediately,and heating at either 50, 60 or 70 °C. Somesamples also contained 100 µL of perchloricacid. Heating times varied from 15 minutes to 4hdepending upon the nature of the experiment.After heating, the samples were quantitativelytransferred, with the aid of acetic acid, to 50 mLvolumetric flasks that contained 10 mL of 2 MNaOH and 12 mL of acetic acid. Hydroxylamine(350 µL of 0.5 M) was added to each flask andsamples were diluted to 50 mL with acetic acid.Absorption spectra (250 to 350 nm) weredetermined for each sample and used to
determine the absorption maxima at 280 nm.Samples included corn rind walls, alfalfa stemwalls, corn cell culture walls (lignified to varyingdegrees), and polysaccharides (polygalacturonan,arabinoxylan, and cellulose). All experimentswere run in triplicate with duplicates for eachtreatment.
Results and DiscussionInitially, several parameters were tested todetermine their impact upon the lignin valuesobtained from standard samples (corn rind andalfalfa stem cell walls). These experimentalparameters included concentration of acetylbromide, heating time, heating temperature,perchloric acid, and use of hydroxylamine. Ofthese parameters, acetyl bromide concentrationappeared to have the least impact as long as theconcentration was maintained at 15 to 30% (v/v).It was also determined that addition ofhydroxylamine, as described in the originalmethod, gave the most consistent results (i.e.,removal of polybromide anion that forms duringthe reaction). As expected, decreasing thereaction temperature decreased the rate ofreaction that could be compensated for byincreasing the reaction time.
The impact of varying the reaction temperature isshown in Figure 1. Samples were heated at 50 °Cfor 2 h, 60 °C for 1 h and 70 °C for 0.5 h with orwithout the addition of perchloric acid.Theoretically the increased reaction time shouldcompensate for the decrease in reactiontemperature. This would appear to be the casefor samples without the inclusion of perchloricacid (Fig. 1 dashed lines). The inclusion ofperchloric acid resulted in significantly higherabsorption values as the temperature increased(Fig. 1 solid lines). This could be interpreted tomean that increased temperature and the additionof perchloric acid are required to solubilize all ofthe wall bound lignin. Alternatively the increase

64 U.S. Dairy Forage Research Center
0
50
100
150
200
250
300
350
400
50 60 70
280
nm a
bsor
ptan
ce/ g
sam
ple
Reaction Temperature ( °C)
DHP W/O DHP
0
10
20
30
40
50
60
70
80
90
50 60
280
nm A
bsor
ptan
ce/ g
sam
ple
Reaction Temperature
Xylan
Cellulose
PGA
Xylan W/O
Cellulose W/O
PGA W/O
70
Figure 2. Reaction of wall polysaccharides with acetylbromide at increasing temperatures. Solid lines representsamples with perchloric acid added and dashed lines werewithout perchloric acid. Heating times were 2 h at 50 °C,1 h at 60 °C and 0.5 h at 70 °C.
Figure 3. Comparison of DHP lignins treated with acetylbromide reagent (heating times as in Fig. 1). Solid lines =perchloric acid added. Dashed lines = without perchloricacid.
in absorbance could be due to increasedpolysaccharide degradation.
Treatment of selected structural polysaccharideswith acetyl bromide, following the same regimeas above, revealed that xylans were particularlysusceptible to degradation in the acetyl bromidereagent (Fig 2). Increased temperatureaccelerated this degradation and was furtherenhanced by the addition of perchloric acid.Although the absorption spectra for degradedxylans were different from lignin, there was astrong absorbance at 280 nm, the absorptionmaximum used for lignin. It is likely that a gooddeal of this increased absorbance at highertemperatures, and especially in the presence ofperchloric acid, was due to xylan degradation.Dehydrogenation polymers of coniferyl alcohol(DHP, artificial lignins) formed in the absence ofcell wall polysaccharides did not show the sametemperature dependent reaction. Alltemperatures gave the same absorbance values(Fig. 3). There was only a slight increase whenperchloric acid was added to the reaction. Thesefindings indicate that higher absorbance values,especially with added perchloric acid, may bedue to xylan degradation.
0
20
40
60
80
100
50 60 70
280
nm A
bsor
ptan
ce /
g sa
mpl
e
Reaction Temperature ( °C)
alfalfa
corn
alfalfa W/O
corn W/O
Figure 1. Changes in the total absorbance at 280 nm aftertreatment of cell walls with acetyl bromide reagent for 2 hat 50 °C, 1 h at 60 °C and 0.5 h at 70 °C. Solid linesrepresent samples with perchloric acid added and dashedlines were without perchloric acid.
1996 Research Summaries 65
ConclusionsThe acetyl bromide assay for lignin is aconvenient procedure for small samples whichmay not be suitable for Klason or acid detergentlignin methods. However, xylan degradationshould be considered as a possible interferencethat would overestimate total ligninconcentrations. This can be minimized by usinga lower temperature such as 50 °C even thoughthe reaction time is increased to 2 to 4 hoursdepending on the difficulty in wallsolubilization.
ImpactImproved methods for determining ligninconcentrations, especially on small samples,allow a better understanding of lignin�s influenceon wall digestibility. Detailed in informationconcerning the interactions of wall componentsleads to development of genetic approaches(traditional and molecular) to improve foragecell wall digestibility.
ReferencesJohnson, D.P., Moore, W.E., and Zank, L.C. 1961. Thespectrophotometric determination of lignin in small woodsamples. Tappi 44: 793-798.
Iiyama, K., Wallis, A.F.A. 1990. Determination of ligninin herbaceous plants by an improved acetyl bromideprocedure. J. Sci. Food Agric. 51:145-161.
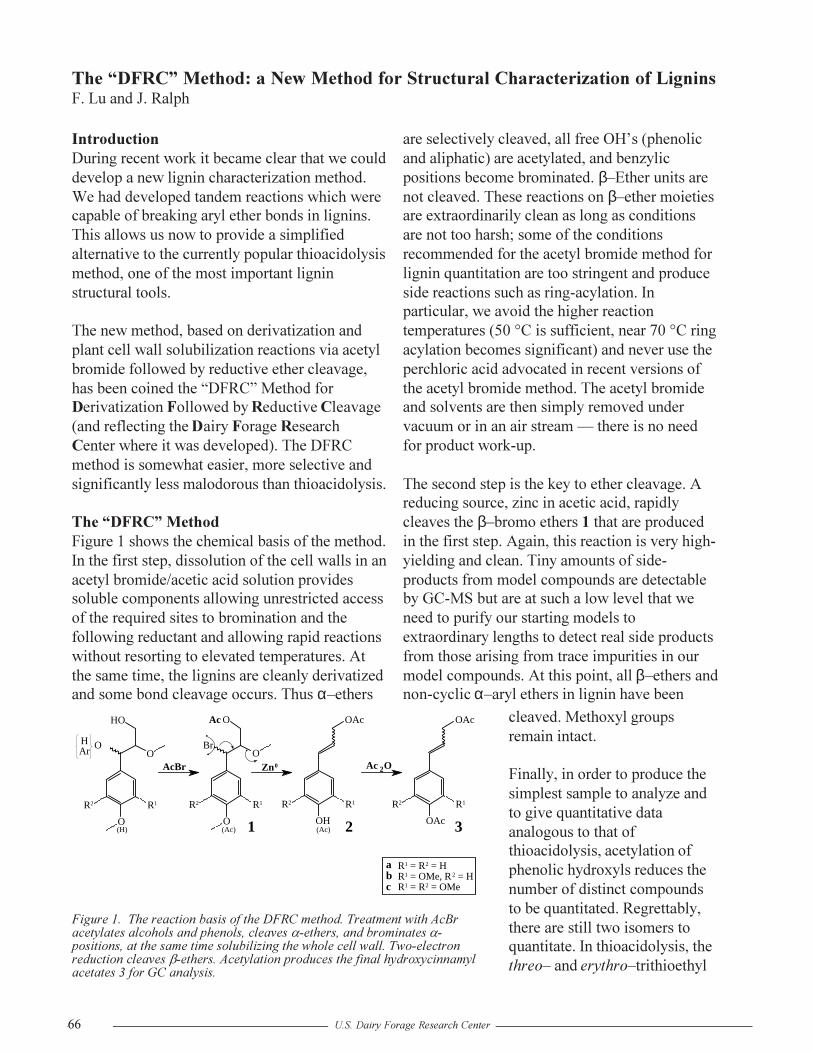
66 U.S. Dairy Forage Research Center
The �DFRC� Method: a New Method for Structural Characterization of LigninsF. Lu and J. Ralph
IntroductionDuring recent work it became clear that we coulddevelop a new lignin characterization method.We had developed tandem reactions which werecapable of breaking aryl ether bonds in lignins.This allows us now to provide a simplifiedalternative to the currently popular thioacidolysismethod, one of the most important ligninstructural tools.
The new method, based on derivatization andplant cell wall solubilization reactions via acetylbromide followed by reductive ether cleavage,has been coined the �DFRC� Method forDerivatization Followed by Reductive Cleavage(and reflecting the Dairy Forage ResearchCenter where it was developed). The DFRCmethod is somewhat easier, more selective andsignificantly less malodorous than thioacidolysis.
The �DFRC� MethodFigure 1 shows the chemical basis of the method.In the first step, dissolution of the cell walls in anacetyl bromide/acetic acid solution providessoluble components allowing unrestricted accessof the required sites to bromination and thefollowing reductant and allowing rapid reactionswithout resorting to elevated temperatures. Atthe same time, the lignins are cleanly derivatizedand some bond cleavage occurs. Thus α�ethers
are selectively cleaved, all free OH�s (phenolicand aliphatic) are acetylated, and benzylicpositions become brominated. β�Ether units arenot cleaved. These reactions on β�ether moietiesare extraordinarily clean as long as conditionsare not too harsh; some of the conditionsrecommended for the acetyl bromide method forlignin quantitation are too stringent and produceside reactions such as ring-acylation. Inparticular, we avoid the higher reactiontemperatures (50 °C is sufficient, near 70 °C ringacylation becomes significant) and never use theperchloric acid advocated in recent versions ofthe acetyl bromide method. The acetyl bromideand solvents are then simply removed undervacuum or in an air stream � there is no needfor product work-up.
The second step is the key to ether cleavage. Areducing source, zinc in acetic acid, rapidlycleaves the β�bromo ethers 1 that are producedin the first step. Again, this reaction is very high-yielding and clean. Tiny amounts of side-products from model compounds are detectableby GC-MS but are at such a low level that weneed to purify our starting models toextraordinary lengths to detect real side productsfrom those arising from trace impurities in ourmodel compounds. At this point, all β�ethers andnon-cyclic α�aryl ethers in lignin have been
Ac 2OZn0
O
O
HO
O
R2 R1
HAr
(H)O
Br
Ac O
O
R1R2
(Ac)OH
R2 R1
OAc
(Ac)OAc
R2 R1
OAc
AcBr
2 31
abc
R1 = R2 = HR1 = OMe, R2 = HR1 = R2 = OMe
cleaved. Methoxyl groupsremain intact.
Finally, in order to produce thesimplest sample to analyze andto give quantitative dataanalogous to that ofthioacidolysis, acetylation ofphenolic hydroxyls reduces thenumber of distinct compoundsto be quantitated. Regrettably,there are still two isomers toquantitate. In thioacidolysis, thethreo� and erythro�trithioethyl
Figure 1. The reaction basis of the DFRC method. Treatment with AcBracetylates alcohols and phenols, cleaves a-ethers, and brominates a-positions, at the same time solubilizing the whole cell wall. Two-electronreduction cleaves b-ethers. Acetylation produces the final hydroxycinnamylacetates 3 for GC analysis.

1996 Research Summaries 67
compounds result in approximately equalamounts. Here we obtain trans- and cis-hydroxycinnamyl acetates 2, with the trans-isomer predominating (> 90%). When moreextensive data are at hand, it might be possible toquantitate only the trans-isomer and calculate thetotal contribution from a known fixed ratio, butthe trans:cis ratio is subtly dependent on exactreaction conditions. For crude analyses, the cis-isomer can simply be ignored. Attempts atremoving the isomer complication, e.g. viahydrogenation, provided more complications andhave now been abandoned. For now, eachisomer�s GC peak is largely free fromcontamination by other products and is readilyquantitated. Figure 2 shows the results usingvarious p-hydroxyphenyl/guaiacyl/syringyl
model compounds; Figure 3 shows DFRCproducts from four lignin samples. To illustratethe cleanliness even when whole cell wallmaterial is used, Figure 4 shows the resultantproducts from pine (a softwood) and bass (ahardwood).
98 10 11 12 13 14 15
time (min)
IS
IS
IS
3at
Pt
3ac
Pc
3ct
St
3cc
Sc
3ct
St
3cc
Sc
3bt
Gt
3bc
Gc
P-(G)
S-(S)
G-S-(S)
Figure 2. GCs of DFRC products from three modelcompounds showing the cleanliness of the productsfollowing the three reaction steps. P, G, and S represent p-hydroxyphenyl, guaiacyl, and sinapyl units 3a-c (Fig. 1).The final unit (in brackets) has no sidechain and is notpresent as such in real lignins; products from this unitappear early in the chromatogram (not shown). t = trans,c = cis .
4 6 8 10 12 14
time (min)
ISSt
Sc
Kenaf Lignin
Gt
Gc *
IS
St
Sc
Bamboo Lignin
Pt
Gt
Gc
*
ISSt
Sc
Willow Lignin
Pt
Gt
Gc
*
ISPine Lignin
Pt
Gt
Gc
Figure 3. GCs of DFRC products from isolated milledlignins showing the readily quantifiable P, G, and Sproducts 3a-c (Fig. 1). The asterisked (*) peak is from 5-hydroxyconiferyl units, detected in every S/G lignin withthe DFRC method.

68 U.S. Dairy Forage Research Center
Advantages of the DFRC method. In ourtotally biased opinions, the following advantagesare seen in this method.1. Reactions are more selective and more
quantitative. As noted above, the AcBr andthe Zn0 reactions are extremely clean.Reactions of model compounds through theentire process produces ~95% yields of thetargeted products. Thioacidolysis yields aretypically 75%. Thioacidolysis produces somechain-shortened products (aryl ethylderivatives rather than aryl propyl) from sidereactions.
2. The reactions are simpler and occur undermilder conditions. Solvolytic reactions at100+ °C under acidic conditions are nottypically used in organic syntheses becausethey are more difficult to predict and control.The reactions described here are carried outat room temperature to 50 °C. They aresufficiently high yielding and clean to besynthetically as well as analytically useful.
3. Analyses are less sensitive to experimentalconditions. Any optimization isrecommended in each lab before beginning
6 7 8 9 10 11 12 13 (min)
ISPine Cell Walls
Bass Cell Walls
Pt
Gt
Gc
Gt
Gc
St
Sc
9 *
Figure 4. Mass spec. total ion chromatograms of DFRCproducts from whole cell wall samples, pine (softwood)and bass (hardwood). The normal P, G and S peaks 3a-c(Fig. 1) are shown as well as the 5-hydroxy-product. Earlypeaks in the chromatogram are largely polysaccharide-derived.
analytical determinations by thioacidolysis.Indeed in our own lab we frequently founddimeric β�ethers indicating that we are notefficiently cleaving all β�ethers. It appearsthat an optimization is also required whenreagents are changed. The DFRC method isfar less sensitive to sample and operatingconditions. Although it is envisaged thatsome sample types may prove less amenableto AcBr reactions, the general proceduredeveloped can be applied to a wide variety ofsample types without requiring furtheroptimization.
4. The DFRC products are stable for longperiods (unlike thioacidolysis products). GCanalysis can be performed and/or repeated atleisure.
5. Malodorous chemicals are not required. Nodiscussion of thioacidolysis is completewithout mention of the foul stench of therequired reagent (ethane thiol). Although thiscan be minimized by careful work, utilizingbleach for trapping, etc., building staff aregenerally not supportive of thioacidolysisexperiments. In some labs, it is simply notpossible to run thioacidolysis because ofrestrictions on odor.
6. Esters are not cleaved. In thioacidolysis,esters are partially cleaved and this causesproblems with grasses (for example) wherep�coumarate esters (at the lignin γ�position)can be quite prevalent. γ�Esters remaincompletely intact after DFRC reactions andthis can be used to tremendous advantage inidentifying and characterizing esterifiedlignin components.
7. The scheme is amenable to targetingproducts and to a rather wide variety offuture applications. Many are now underactive investigation and will hopefully bereported in the future.
8. A lignin determination can be made at thesame time as the DFRC method; the firstAcBr step is similar to AcBr methodsdeveloped for lignin determination. We arecurrently working on integrating thesemethods.
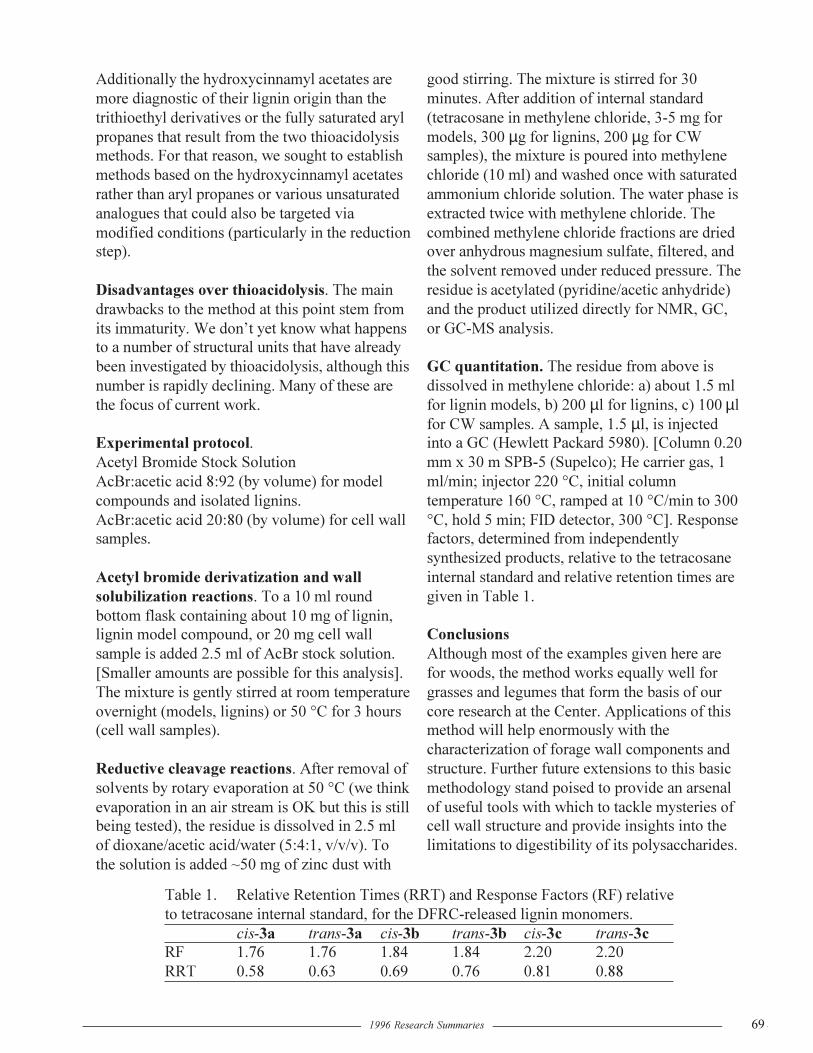
1996 Research Summaries 69
Additionally the hydroxycinnamyl acetates aremore diagnostic of their lignin origin than thetrithioethyl derivatives or the fully saturated arylpropanes that result from the two thioacidolysismethods. For that reason, we sought to establishmethods based on the hydroxycinnamyl acetatesrather than aryl propanes or various unsaturatedanalogues that could also be targeted viamodified conditions (particularly in the reductionstep).
Disadvantages over thioacidolysis. The maindrawbacks to the method at this point stem fromits immaturity. We don�t yet know what happensto a number of structural units that have alreadybeen investigated by thioacidolysis, although thisnumber is rapidly declining. Many of these arethe focus of current work.
Experimental protocol.Acetyl Bromide Stock SolutionAcBr:acetic acid 8:92 (by volume) for modelcompounds and isolated lignins.AcBr:acetic acid 20:80 (by volume) for cell wallsamples.
Acetyl bromide derivatization and wallsolubilization reactions. To a 10 ml roundbottom flask containing about 10 mg of lignin,lignin model compound, or 20 mg cell wallsample is added 2.5 ml of AcBr stock solution.[Smaller amounts are possible for this analysis].The mixture is gently stirred at room temperatureovernight (models, lignins) or 50 °C for 3 hours(cell wall samples).
Reductive cleavage reactions. After removal ofsolvents by rotary evaporation at 50 °C (we thinkevaporation in an air stream is OK but this is stillbeing tested), the residue is dissolved in 2.5 mlof dioxane/acetic acid/water (5:4:1, v/v/v). Tothe solution is added ~50 mg of zinc dust with
good stirring. The mixture is stirred for 30minutes. After addition of internal standard(tetracosane in methylene chloride, 3-5 mg formodels, 300 µg for lignins, 200 µg for CWsamples), the mixture is poured into methylenechloride (10 ml) and washed once with saturatedammonium chloride solution. The water phase isextracted twice with methylene chloride. Thecombined methylene chloride fractions are driedover anhydrous magnesium sulfate, filtered, andthe solvent removed under reduced pressure. Theresidue is acetylated (pyridine/acetic anhydride)and the product utilized directly for NMR, GC,or GC-MS analysis.
GC quantitation. The residue from above isdissolved in methylene chloride: a) about 1.5 mlfor lignin models, b) 200 µl for lignins, c) 100 µlfor CW samples. A sample, 1.5 µl, is injectedinto a GC (Hewlett Packard 5980). [Column 0.20mm x 30 m SPB-5 (Supelco); He carrier gas, 1ml/min; injector 220 °C, initial columntemperature 160 °C, ramped at 10 °C/min to 300°C, hold 5 min; FID detector, 300 °C]. Responsefactors, determined from independentlysynthesized products, relative to the tetracosaneinternal standard and relative retention times aregiven in Table 1.
ConclusionsAlthough most of the examples given here arefor woods, the method works equally well forgrasses and legumes that form the basis of ourcore research at the Center. Applications of thismethod will help enormously with thecharacterization of forage wall components andstructure. Further future extensions to this basicmethodology stand poised to provide an arsenalof useful tools with which to tackle mysteries ofcell wall structure and provide insights into thelimitations to digestibility of its polysaccharides.
Table 1. Relative Retention Times (RRT) and Response Factors (RF) relativeto tetracosane internal standard, for the DFRC-released lignin monomers.
cis-3a trans-3a cis-3b trans-3b cis-3c trans-3cRF 1.76 1.76 1.84 1.84 2.20 2.20RRT 0.58 0.63 0.69 0.76 0.81 0.88

70 U.S. Dairy Forage Research Center
New Discoveries Relating to DiferulatesJ. Ralph, J.H. Grabber, R.D. Hatfield and G. Wende
IntroductionA couple of years ago, we reported on thediscovery of a whole class of dehydrodimers offerulic acid in grasses (Ralph et al. 1994). Priorto that time, only one dehydrodimer (the 5�5-coupled dimer) was recognized and diferulates asa whole were under-quantitated by factors of upto 20. Since this time, collaborations with otherlabs have led to discoveries of diferulates in awide variety of plant materials. Some of therecent findings are quite novel; others suggestenormous potential for utilization of ferulatedimerization in producing new food products.The importance of diferulates in cross-linkingthe plant cell wall is becoming recognized.
Implication of diferulates in hypocotylgrowth-cessation. Researchers in Spain(Sánchez et al. 1996) have been studying themechanism by which pine hypocotyl growthcessation occurs once the top of a germinatingseedling encounters light. Such a light-responsemight be expected to be photochemical in naturebut the plant halts extension of the cell walls(that would continue to occur in the dark) byinfusing the cells with peroxidases and effectingferulate dimerization. Cross-linking of the wallsby diferulate bridges effectively prevents furtherexpansion of these cells and allows the plant tomove on to the next phase of its growth �producing shoots and leaves. What is intriguingin this case is that a range of diferulates wasfound (when pine cell wall development has notnormally been considered to involve ferulates)and that none of the 5�5-coupled diferulatescould be detected. Such an absence is more inline with the free-solution coupling of modelferulates which produces other dimers but notthe 5�5-coupled isomer. Presumably thismechanism for growth-cessation could havebeen overlooked if researchers sought only the5�5-coupled dimer as has been done for the past20 years. The only other study of this type usedrice coleoptiles. The 5�5-coupled dimer was
observed to accompany growth cessation there.Recent studies in this lab show that theproduction of the full range of dimers (not justthe 5�5) accompanies the growth cessation.
Diferulates in sugar beets. Sugar beets providethe food industry with many useful products inaddition to the sugar that is produced in somecountries. The beet pulp is a valuable source ofpectins and has many uses in the food industry.
Collaborations with two groups in France(Micard et al. 1996) and Holland (Oosterveld etal. 1996) have revealed considerable amounts ofall of the diferulates in sugar beet pulp. What isparticularly important in this case is that thepropensity for further ferulates in the pulp todimerize (effecting polysaccharide cross-linkingagain) can be utilized to change the pulpproperties. Thus a simple treatment of the pulpwith peroxidase and hydrogen peroxide producesmore dimers (more cross-linking) andconsequently alters the pulp viscosity. Such aproduct then becomes amenable to further usesin the food industry, opening up further marketsfor its utilization.
Diferulates in Chinese water chestnuts, and anew method for determining diferulates. A labin the UK (Waldron et al. 1996) has discoveredthat there are substantial levels of the range ofdiferulates in water chestnuts and is nowattributing the crunchy texture, even aftercooking, to these intriguing little molecules.Another collaboration (Parr et al. 1996) hasresulted in an alternate HPLC method forquantitation of diferulates with compoundidentification via diode array spectroscopicdetection; our established method utilizes GC forcompound separation and quantitation, GC-MSfor product identification. The availability of analternate method opens up the analysis of theseimportant wall components to more laboratories.

1996 Research Summaries 71
ReferencesMicard, V., J.H. Grabber, J. Ralph, C.M.G.C. Renard andJ.-F. Thibault. 1996. Diferulic acids from sugar-beet pulp.Phytochemistry, in press.
Oosterveld, A., J.H. Grabber, G. Beldman, J. Ralph andA.G.J. Voragen. 1996. Formation of ferulic aciddehydrodimers through oxidative cross-linking of sugarbeet pectin. Carbohydrate Research, in press.
Parr, A.J., K.W. Waldron, A. Ng and M.L. Parker. 1996.The wall-bound phenolics of Chinese water chestnut. J.Sci. Food Agric., in press.
Ralph, J., S. Quideau, J.H. Grabber and R.D. Hatfield.1994. Identification and synthesis of new ferulic aciddehydrodimers present in grass cell walls. J. Chem. Soc.,Perkin. Trans 1, 3485-3498.
Sánchez, M., M.J. Peña, G. Revilla and I. Zarra. 1996.Changes in dehydrodiferulic acids and peroxidase activityagainst ferulic acid associated with cell walls duringgrowth of Pinus pinaster Hypocotyl. Plant Physiol.111:941-946.
Waldron, K.W., A.J. Parr, A. Ng and J. Ralph. 1996. Cell-wall-esterified phenolic monomers and dimers: identifica-tion and quantification by reverse-phase HPLC and diode-array detection. Phytochemical Analysis, in press.

72 U.S. Dairy Forage Research Center
IntroductionFerulic acid is esterified to the C5-hydroxyl of a-L-arabinose moieties of grass xylans. Xylans arecross-linked by oxidative coupling of ferulatemonomers into dehydrodimers. The substitutionand cross-linking of xylans by ferulates isthought to limit the enzymatic degradation ofgrass walls, but unambiguous evidence for sucha role is lacking. We specifically manipulatedferulate substitution and diferulate cross-linkingin nonlignified walls to elucidate how ferulatesrestrict fiber degradation by fungal hydrolases.
MethodsMaize cell suspensions (Zea mays cv. BlackMexican) were grown with 0 to 50 µM 2-aminoindan-2-phosphonic acid (AIP) tomanipulate the deposition of ferulate esters intononlignified walls. In a separate study,nonlignified walls from cell suspensions grownwith 0 or 40 µM AIP were incubated withmercaptoethanol to inhibit diferulate formationor with dilute hydrogen peroxide to stimulatediferulate formation by wall-bound peroxidases.Cell walls were analyzed for neutral sugars,uronic acids, hydroxycinnamic acids, and lignin.Cell walls were degraded with hydrolases fromTrichoderma reesei (Celluclast, NOVO) andAspergillus niger (Viscozyme L, NOVO).Periodically during enzymatic hydrolysis, wallresidues were pelleted by centrifugation and analiquot of the supernatant was analyzed for totalcarbohydrate, uronic acids, and for neutral sugarsafter hydrolysis with 2 N trifluroacetic acid. Thekinetics of sugar release were described using afirst order model.
Results and DiscussionCell walls from maize cell suspensions contained197 mg g-1 of arabinose, 180 mg g-1 of xylose,75 mg g-1 of galactose, 320 mg g-1 of glucose,110 mg g-1 of uronic acids, 17 mg g-1 of ferulateesters, trace amounts of ferulate ethers, 0.5 mgg-1 of p-coumaric acid, and 3 mg g-1 of guaiacyllignin. Overall, the chemical composition of cell
walls was representative of nonlignified primarywalls of grasses. Ferulate ester deposition intocell walls was reduced up to 75% by growingcell suspensions in the presence of AIP, aspecific inhibitor of phenylalanine ammonialyase. Hydrogen peroxide treatment of walls withnormal or low feruloylation increased theproportion of diferulates to total ferulates fromca 18% to 44% (Table 1). Other wallcomponents were not modified significantly byAIP and H2O2 treatments.
Concurrent reductions in ferulate substitutionand cross-linking caused by AIP treatmentincreased the release of carbohydrate from wallsby fungal enzymes. When walls with normal orlow feruloylation were treated with hydrogenperoxide, peroxidase-mediated coupling offerulate monomers into dehydrodimers reducedcarbohydrate release by 122 mg g-1 after 3 h andby 48 mg g-1 after 54 h of enzymatic hydrolysis(Table 1). These results provide compellingevidence that the enzymatic hydrolysis of wallswas controlled by diferulate cross-linking andnot by ferulate substitution of xylans. Averagedover all treatments, release rate was greatest forgalactose and uronic acid (ca 0.265 h-1),intermediate for arabinose and glucose (ca 0.160h-1), and lowest for xylose (0.093 h-1). Hydrogenperoxide treatment reduced the rate of sugarrelease by an average of 42% (Table 2),indicating that diferulate cross-linking of xylansrestricted the rate at which all polysaccharideswere released from walls. Averaged over alltreatments, the extent of sugar release from wallswas slightly greater for glucose and galactose (ca0.884) than arabinose, xylose and uronic acids(ca 0.858). Alteration of ferulate substitution andcross-linking generally had little effect on theextent of sugar release from walls. However,hydrogen peroxide treatment of walls withnormal feruloylation reduced arabinose releaseby 8% and xylose release by 21%, suggestingthat the degradation of xylans was reduced byhigh levels of diferulate cross-linking.
Diferulate Cross-Links Limit the Degradation Rate of Nonlignified Maize Wallsby Fungal HydrolasesJ.H. Grabber, R.D. Hatfield and J. Ralph

1996 Research Summaries 73
Table 1. Ferulate composition and fungal hydrolase degradability of nonlignified maize walls (n =2). Feruloylation of cell walls was manipulated by growing maize cell suspensions with and withoutAIP, a specific inhibitor of phenylalanine ammonia lyase. Peroxidase-mediated coupling of ferulatemonomers into dimers was limited by isolating and incubating cell walls with mercapoethanol orstimulated by incubating cell walls with hydrogen peroxide.
Total carbohydrateFerulate esters released
AIP H2O2 monomers dimers total 3 h 54 hµM mmol - - - - - - - - - mg g-1 cell wall - - - - - - - - - -mg g-1 wall carbohydrate-
Normal feruloylation0 0 14.53 2.62 17.15 357 8560 0.4 8.96 6.65 15.61 243 794
Low feruloylation40 0 3.75 1.31 5.06 460 89840 0.4 2.27 2.25 4.52 329 865
Analysis of VarianceAIP * * * * *H2O2 * * NS * *AIP X H2O2 * * NS NS NS* = Significant at the 0.05 level of probability.NS = Not significant.
ConclusionsDiferulate cross-linking of arabinoxylansimpedes the release of all polysaccharides fromnonlignified walls by fungal enzymes. Except forxylans, the extent of polysaccharide degradationwas not affected by diferulate cross-linking.Simple substitution of xylans with ferulates didnot affect wall hydrolysis.
Impact StatementResearch with this cell-wall model systemprovides a unique means of elucidating factorswhich limit efficient utilization of cell walls fornutritional and industrial purposes. Ultimately,these studies should allow rational approaches tomaximizing plant utilization and farmsustainability while minimizing adverse impactson the environment.
Table 2. Rate of sugar release during fungal hydrolase degradation of nonlignified maize wallsas affected by hydrogen peroxide treatment of nonlignified walls (averaged over AIP treatments).H202 Diferulate Total ferulate Arabinose Xylose Galactose Glucose Uronic acidsmmol - - mg g-1 of cell wall - - - - - - - - - - - - -Rate constant (h-1, LSD� = 0.025) - - - - - - - - -0 1.97 11.11 0.186 0.127 0.323 0.229 0.3370.4 4.45 10.07 0.099 0.059 0.175 0.132 0.230
�LSD to compare means within columns (P = 0.05).

74 U.S. Dairy Forage Research Center
Preparation of Three Coniferaldehyde Dimers and a TrimerF.H. Ludley and J. Ralph
IntroductionStructural elucidation of lignin by NMR reliesstrongly on comparison with synthetic modelcompounds. As described in the previous article,coniferaldehyde-containing lignins are of currentinterest because of the discovery of naturallyCAD-deficient mutants and the current interestin antisense technology for down-regulatingCAD activity in various plants. The preparationof three coniferaldehyde dimers and one trimer isdescribed.
MethodConiferaldehyde 1 was dissolved in acetone, andsilver(I) oxide was added to the solution. Theresulting suspension was stirred at roomtemperature for 2.5 h. The solids were filteredoff, washed thoroughly with acetone and thecombined solvent fractions evaporated. Theresulting orange oil was separated into itscomponents by SiO2 thick layer chromatography.To achieve optimal separation, the plate was runseveral times in different solvent combinationswith increasing polarity. The fractions arescraped off the plate and extracted with acetone.
Three dimers 2, 3 and 4 and one trimer 5 wereisolated and have been characterized.
Conclusion and DiscussionA method has been described to prepareconiferaldehyde dimers 2, 3 and 4 as well as thetrimer 5 as a mixture, by radical reactions. It isbased on radical coupling reactions effected bysilver(I) oxide that have been previously utilizedto prepare more conventional lignin dimers(Research Summaries 1992). NMR-spectroscopic characterization of thesecompounds has been completed and data aredeposited in the �NMR Database of ModelCompounds for Lignin and Related Cell WallComponents,� available over the Internet fromour sites at http://www.dfrc.wisc.edu or http://www-cwg.dfrc.wisc.edu. These compounds andtheir data will be used to more fully elucidatehow coniferaldehyde is incorporated into plantlignins. The presence or absence of these modelcompounds in the polymers provides an insightinto biosynthetic processes in plants and willfacilitate methods for producing plants withimproved digestibility.
Figure 1. Syntheticscheme used to prepareconiferaldehyde dimers2-4 and trimer 5.
OCH3
OH
OH
Ag2O
r.t.
OH
OCH3
O
OCH3
OH
O
H
OH
OCH3
OCH3
OH
OH
O H+
OH
OCH3
OCH3
OH
O
H
O
H+ +
O
OCH3
OOCH3
OCH3
OH
H
OH
O
H
O
H
1 2 3
4 5
Acetone

1996 Research Summaries 75
Synthesis of 13C-labeled Coniferaldehyde and Its Incorporation intoSynthetic LigninsF.H. Ludley and J. Ralph
IntroductionLignins are formed in plants by peroxidase/H2O2-induced polymerization of p-coumaryl,coniferyl and sinapyl alcohols. In plants whereCAD (cinnamyl alcohol dehydrogenase) activityis low, p-hydroxycinnamaldehydes presumablybuild up and could become a major componentof the lignin produced. Cinnamaldehyde-containing lignins have been shown to severelyinhibit fiber degradation in forages. To
determine lignification pathways and to explainthe degradation behavior, it is necessary todetermine the structure of CAD deficient lignins.Comparison of synthetic lignins(dehydrogenation polymers, DHPs) with plantlignins should identify structural features andprovide an understanding of the differences inforage digestibility. A synthetic pathway toDHPs is presented using [γ-13C]coniferaldehyde8.
Figure 1. Synthetic scheme usedto prepare [g-13C]coniferaldehyde 8 andsynthetic lignins (DHPs).
CHO
OCH3
OH
CHO
OCH3
OAc
CO2C2H5
OCH3
OAc
13 13COOH
OCH3
OH
COOH
OCH3
OAc
13COCl
OCH3
OAc
13CHO
OCH3
OAc
13
13CHO
OCH3
OH
DHPs
1 2 3 4
5 6 7
8
Ac2O/DMAP
CH2Cl2
13
NaOH
Ac2O SOCl2
95 deg
LiAlH(OtBu)3
Diglyme
NaOH Peroxidase/H2O2
H2O/CH2Cl2
K2CO3/MEEA
TEPA
-50 deg
TEPA:
OP
O O O
O
MEEA:
O OO
ON
O
O
Pyridine Toluene
pH 6.5

76 U.S. Dairy Forage Research Center
MethodReaction of vanillin 1 with acetic anhydride/4-N,N-dimethylaminopyridine (DMAP) inmethylene chloride gives 4-O-acetylvanillin 2.The 13C-label is introduced via a Wittig-Horner-Emmons reaction of 2 with [1-13C]triethyl-phosphonoacetate in a two-phase reaction systemof water/methylenechloride using potassiumcarbonate as base and tris[(methoxye-thoxy)ethyl]amine as a phase-transfer-catalyst.Saponification of the ester 3 under stronglyalkaline conditions yields [γ-13C]ferulic acid 4which has to be reacetylated to give [γ-13C]4-O-acetylferulic acid 5. Reaction of 5 with thionylchloride in toluene at 95° C yields the acidchloride 6 which is not isolated but reducedimmediately to [γ-13C]4-O-acetylconiferaldehyde7 using lithium-tri-t-butoxyaluminum-hydride indiglyme at -50° C under inert conditions.Deacetylation of 7 with aqueous sodiumhydroxide leads to the target molecule 8.Two different dehydrogenation polymers (DHPs)were prepared using [γ-13C]coniferaldehyde 8.The first was made by using 10% 8 and 90 %unlabeled coniferyl alcohol to elucidate crossreactions between the normal lignin monomer(coniferyl alcohol) and the aldehyde component.The second was made by reacting pure [γ-13C]coniferaldehyde 8 under lignification
conditions to elucidate homo-coupling reactionsin cases where the aldehydes are in highconcentration. Preparation of the DHPs was doneusing the �Zutropf-Method� where a solution of8, or 8 and coniferyl alcohol, was addeddropwise to a mixture of peroxidase and H2O2 ina buffer solution.
Discussion and ConclusionA method has been developed to prepare [γ-13C]coniferaldehyde 8. The pathway utilized thepreviously described (Research Summaries1991) way of easily introducing the 13C label byusing commercially available [1-13C]triethyl-phosphonoacetate in the Wittig-Horner-Emmons-reaction to produce ferulate. Thealdehyde has now been used to prepare syntheticlignins (DHPs). NMR spectroscopy of theseDHPs should elucidate radical couplingpathways that are accessible to coniferaldehydeand, along with the model data (see followingarticle), provide the necessary data required tomore carefully characterize lignins from CAD-deficient plants. Knowledge of which pathwaysand products can be selected for in plantbreeding, or can be genetically altered, shouldultimately result in plants that are moredigestible and therefore provide greatersustainability to the farm system.

1996 Research Summaries 77
Corn Cell Wall Peroxidases: Potential Role in the Lignification ProcessR.D. Hatfield, C. Neumeier, J.H. Grabber and J. Ralph
IntroductionIn general, plants produce several isozymes ofperoxidase. Corn cell walls contain at least 12 to15 different isozymes with peroxidase activity.The role of these isozymes in plant developmentis not clear. We have investigated three majorgroups of peroxidases isolated and partiallypurified from the walls of corn suspensionculture cells. Previous work suggested that allperoxidases were equally adept at formingdehydrodimers of ferulate model compounds andthat there was no difference in the types ofdimers formed. We have now extended this workto investigate the potential role in the formationof lignin polymers.
Materials and MethodsPeroxidases were isolated from the walls of cornsuspension cultures and partially purified usingDEAE anion exchange and chromatofocusingchromatography. Three major groups, differingin their isoelectric points, were used in thesestudies (group I pI 9-10, group II pI 7-8, andgroup III pI 3-5). For comparison, peroxidaseswere also extracted from the apoplastic space ofcorn stem segments using gentle centrifugation(700 Xg) and a 20 mM acetate buffer (pH 5.0200 mM CaCl
2). After removing apoplasticmaterials, stem segments were homogenized incold (4 °C) 50 mM acetate buffers and the wallscollected after washing with cold buffer, coldacetone (-20 °C), and again with cold buffer.Walls were suspended in 200 mM CaCl2
overnight to extract wall bound peroxidases.Peroxidase activity was evaluated using ethylferulate (Et-FA), methyl p-coumarate (Me-pCA),coniferyl alcohol (CA), and sinapyl alcohol (SA).All activity reactions (total volume 1 mL) wererun in acetate or MES buffers (pH 5.0)containing the appropriate substrate (0.14 to 0.16µmoles) with hydrogen peroxide (10 µL of 7.5mM solution) added to initiate the reaction.Rates of reactions were determined bycontinuously monitoring (total of 5 min) the
change in absorbance at the appropriatewavelength for each substrate (ethyl ferualte, 320nm; methyl p-coumarate, 308 nm; coniferylalcohol, 261 nm; and sinapyl alcohol, 270 nm).
Results and DiscussionPeroxidase (POD) activity extracted from cornsuspension cells varied with the type of substrateand the pI group (Table 1). Generally for allPOD groups, the order of substrate reactivitieswas Et-FA > Me-pCA > CA >> SA. Only GroupI POD had a reasonable activity against sinapylalcohol; all others were 20 to 40 times lessactive.
A comparison of POD activity extracted fromcorn stem walls was different from thesuspension cultures in substrate preference suchthat Et-FA > CA > Me-pCA >> SA (Table 2).We evaluated different regions (upper and lower)within stem internodes and progressively moremature internodes (Int 2 = second fully expandedinternode above the soil line, Int 5 = fifthinternode, Int 7 = seventh internode, leastmature). For grasses, like corn, the upper portionof the internode is the most mature part and thelower less mature. Substrates Et-FA and CAshowed clear trends of increased activity withmaturity while Me-pCA and SA did not revealconsistent trends with maturity. The CaCl
2
extracts of stem walls after homogenizationshowed the same activity trends as thecentrifugation method (data not shown).
We had thought that perhaps the more matureportions of the stem might produce PODenzymes having higher specificity for sinapylalcohol since, as the stem matures, there is anincrease in the sinapyl monomers incorporatedinto lignin. This was clearly not the case (Table2). We tested a hypothesis proposed byTakahama et al. (1996) that hydroxycinnamicacids may aid in the incorporation of sinapylalcohol monomers into lignin. The addition of as

78 U.S. Dairy Forage Research Center
Table 2. Comparison of POD acitivities isolatedfrom different corn stem internodes and internoderegions. Different substrates included ethyl ferulate,Et-FA; methyl p-coumarate, Me-pCA; coniferylalcohol, CA; and sinapyl alcohol, SA.Corn Stem Activity (µmoles/min)internode ET-FA Me-pCA CA SA7U 45.89 6.18 29.00 1.307L 37.06 4.67 27.48 2.445U 71.76 8.96 44.53 1.465L 57.75 6.88 36.86 1.222U 77.84 12.94 49.02 1.872L 79.32 9.21 47.24 1.38
little as 0.045 µmoles of either Et-FA or Me-pCA to a reaction mixture containing 0.15µmoles of SA increased the rate of reaction by30 to 50 times (Fig 1).
ConclusionThe cell walls of corn contain a wide range ofPOD isozymes that can vary in their substratespecificity to some extent. It would not appear,however, that there is a specific POD for theincorporation of sinapyl alcohol monomers intothe latter stages of lignification. It does seemplausible that incorporation of hydroxycinnamicacids into the wall may serve a role intransferring radicals to SA allowing theirincorporation into lignin.
ImpactA complete understanding of wall enzymes, suchas the peroxidases, provides a clear picture of themetabolic role they play in determining thestructure and function of plant cell walls. Thisprovides a larger knowledge base from which wecan develop appropriate strategies for improvingthe digestiblity of grasses (such as corn) withoutlosing hardiness, pest resistance, or yield.
ReferenceTakahama, U, Oniki T, and Shimokawa, H. 1996 Apossible mechanism for the oxidation of sinapyl alcohol byperoxidase-dependent reactions in the apoplast:Enhancement of the oxidation by hydroxycinnamic acidsand components of the apoplast.
0
0.5
1
1.5
2
225 245 265 285 305 325 345 365
Abs
orba
nce
Wavelength nm
0 min
2 min
4 min
6 min
8 min
10 min
0
0.5
1
1.5
2
225 245 265 285 305 325 345 365
0 min
2 min
4 min
6 min
Sinapyl Alcohol
Sinapyl alcohol + Et-FA
Abs
orba
nce
Figure 1. Spectral changes of sinapyl alcohol duringcoupling reactions mediated by cell wall peroxidases. A.Sinapyl alcohol with POD Group I and H
2O
2. B. Same as A
except 0.045 mmoles of ethyl ferulate was included in thereaction mixture.
Table 1. Comparison of POD isozymesisolated from corn suspension culture walls.Specific acitivity towards different substrates(ethyl ferulate, Et-FA; methyl p-coumarate,Me-pCA; coniferyl alcohol, CA; and sinapylalcohol, SA).
Specific activity (µmoles/mg/sec)Isozyme Group Et-FA Me-pCA CA SAGroup I 12.85 8.33 5.12 1.55Group II 2.88 0.87 1.40 0.04Group III 3.77 2.03 2.57 0.07

1996 Research Summaries 79
Dibenzodioxocins in Forage Plant LigninsJ. Ralph
IntroductionDibenzodioxocins were discovered in plantlignins by a Finnish group. They are excitingfirstly because they represent a new structure inlignin that had not been discovered in manydecades of research. Furthermore, they explainwhy analytical methods to quantify non-cyclic α-aryl ether units in lignins claim significantamounts (6-9%) of such structures whendiagnostic NMR experiments have shown thereto be typically less than 0.3%! As it turns out, thewet chemical analytical methods drewcontributions for such cyclic structures. Theimportance lies in the fact that non-cyclic α-arylethers have been ascribed as important branchingpoints in the lignin polymer formed by non-radical reactions; dibenzodioxocins do not fillthat role in the same manner.
Utilizing NMR it is possible to identifydibenzodioxocins in a wide variety of lignifiedmaterials. They can be difficult to detect in un-acetylated samples due to the smearing of thesepeaks caused by subtle shifts in both dimensions,but are readily detected in acetylated samples.
The most important aspect impacting ourunderstanding of forage cell walls is the findingthat 5�5-coupled diferulates will also form thesestructures. As noted in an earlier article,diferulates are enormously important in cross-linking cell walls in grasses and reduce thedigestibility of those cell walls.
ExperimentalA synthetic lignin was prepared incorporating 5�
5-coupled diferulate as described in last year�sResearch Summaries (http://www.dfrc.wisc.edu/contents.html). NMR conditions for the HSQCspectrum: 750 MHz; Bruker pulse program�invietgs� � a 2D 1H-13C correlation via doubleINEPT transfer using trim pulses, phase sensitiveusing echo/antiecho TPPI, gradient selection,decoupling during the acquisition; 4K by 256increments of 16 scans collected; SW�s 11 ppm,150 ppm giving acquisition FID resolutions of 2and 110.5 Hz/pt. Processing used Gausianmultiplication (GB 0.01, LB -0.3 Hz) in F2 andcosine-squared bell apodization in F1.
Results and DiscussionUtilizing the exceptional power of 750 MHzNMR with pulsed-field gradients, the diferulatedibenzodioxocins of structure 2 are readilyidentified in HSQC spectra (13C�1H correlationspectra). HMBC and HMQC-TOCSY spectra(not shown) provided further confirmatoryevidence by correctly correlating other diagnosticresonances. Unfortunately, due to spectralcongestion in this diagnostic area of the NMRspectra, we are currently having troubleauthenticating these structures in real foragelignin samples.
O
CH3O
O
OCH3
OCH3
O OH
β
α
55
OO
O
CH3O
O
O
O
OCH3
OCH3
O OH
XylAra
AraXyl
β
α
55
1 2
Figure 1. Dibenzodioxocin structures from 5,5-units innormal lignin 1, and from 5�5-coupled diferulates in grasslignins 2.
60
50
70
80
90
3.03.54.04.55.05.5
✳
✳
δC
δH
2α
2β
Figure 2. Partial (sidechain region) 750 MHz gradient-selected HSQC spectrum showing clear evidence for thedibenzodioxocin structures 2, circled. Correlations from aparent model compound of 2 are shown as *�s.

80 U.S. Dairy Forage Research Center
The appearance of 5�5-coupled diferulates inthese structures helps explain why theirreleasability is similar to that of monomericferulates that are incorporated into lignins.Basically, when one of the ferulate moietiesradically couples to Cβ of coniferyl or sinapylalcohol during the early stages of lignification,the phenol on the second moiety becomes tied upby reacting at the α-position of the same lignin
monomer. These α,β-di-ethers should be readilyreleased by high-temperature base, or by our new�DFRC� method (see accompanying article).
Identifying these powerful cell wall cross-linkingmechanisms helps in our understanding oflimitations to plant polysaccharide degradibilityby ruminants, and hopefully will eventually leadto rational solutions to the problem.

1996 Research Summaries 81
Chemical Composition and Degradability of Xylem and Nonxylem WallsIsolated From AlfalfaJ.H. Grabber, R.D. Hatfield, M. Panciera and P. Weinberg
IntroductionThe digestibility of forage legumes declinessignificantly with plant maturation due todecreasing digestibility of stems and theirincreasing contribution to plant dry matter.Microscopic studies indicate that, as stemsmature, xylem and interfascicular parenchymaform a ring of tissue that is highly resistant todigestion. Other tissues, including pithparenchyma, mesophyll, phloem, phloem fibers,collenchyma, and epidermis appear to have highdegradability even in mature stems. These twotypes of tissues were isolated from alfalfainternodes and analyzed for cell wallcomposition and carbohydrate degradability asan initial step to elucidate factors limiting fiberdegradability in legumes.
MethodsXylem (xylem and interfascicular parenchyma)and nonxylem tissues (pith parenchyma,mesophyll, phloem, phloem fibers, collenchyma,and epidermis) were isolated by dissection frominternode 1 (basal) to internode 6 of Vernalalfalfa plants harvested at the late bud to earlyflower stage of development. Crude cell wallswere prepared by sequentially treating milledtissues with 50 mM NaCl, 80% ethanol,amylase, water, and acetone. Cell walls wereanalyzed for neutral sugars, uronic acids,hydroxycinnamic acids, and acetyl bromidelignin. Cell walls were degraded with hydrolasesfrom Trichoderma reesei (Celluclast, NOVO)and Aspergillus niger (Viscozyme L, NOVO).After 3 and 48 h of enzymatic hydrolysis, wallresidues were pelleted by centrifugation and analiquot of the supernatant was analyzed foruronic acids and for neutral sugars afterhydrolysis with 2 N trifluroacetic acid.
Results and DiscussionThe cell wall content of alfalfa tissues (estimatedby summing neutral sugars, uronates, and lignin)was 604 mg g-1 for whole internodes, 727 mgg-1 for xylem and 497 mg g-1 for nonxylem.
These values slightly underestimate the cell wallcontent of tissues because they do not includestructural proteins and small quantities of pecticsugars removed during preparation of crude cellwalls. The carbohydrate fraction of all tissueswas composed primarily of glucose (ca 60%).The proportions of other sugars differedconsiderably between tissue types (Table 1). Ona cell wall basis, the lignin content of xylem (288mg g-1) was about two-fold greater than that ofnonxylem (168 mg g-1). Both tissue typescontained only trace amounts of ester- and ester/ether-linked hydroxycinnamic acids.
The loss of sugars from alfalfa internodesincubated with fungal enzymes was similar tothat reported for alfalfa stems degraded withrumen microorganisms (Table 1). The release oftotal sugars from xylem walls was extremelylow, due in part to their high lignin content.Nonxylem walls, with 42% less lignin, had a340% greater release of total sugars than xylem,indicating that the effects of lignification on walldegradability differed between tissue groups.The release of all sugars from xylem walls waslow, especially for xylose and uronates (probablyglucuronic acid). In nonxylem tissues, the releaseof most sugars was relatively high except forxylose. These results suggest that thedegradability of glucuronoxylans in both xylemand nonxylem tissues is limited, possibly due tointeractions with lignin. Unlike grasses,interactions between xylans and lignin in alfalfado not appear to involve ferulic acid. Furtherwork is needed to identify how lignins restrictthe degradation of xylans and other associatedpolysaccharides in legumes.
ConclusionsThe degradability of xylem was much lower thannonxylem walls, but in both types of walls thedegradation glucuroxylans was extremely low.Elucidation of lignin-glucuronoxylan interactionsis required for developing alfalfa germplasmwith improved fiber degradability.

82 U.S. Dairy Forage Research Center
Impact StatementStudies of cell wall composition, structure, anddegradability provide basic information neededfor elucidating and rectifying factors which
limit fiber digestion of alfalfa. Improved fiberdegradability of alfalfa would reduce both feedcosts and manure output for livestockoperations.
Table 1. Chemical composition and fungal hydrolase degradability of alfalfa tissues averagedacross internodes.
TotalRhamnose Arabinose Galactose Uronates Mannose Glucose Xylose Sugars Lignin
- - - - - - - - - - - - mg g-1 total sugars - - - - - - - - - - - - - - - - - - - - mg g-1 dry matter
Chemical compositionInternode 12 32 25 106 29 611 184 460 144Xylem 8 9 14 77 23 616 253 517 209Nonxylem 18 59 36 150 32 593 113 413 83
Proportion of sugars released after 3 hInternode 0.625 0.668 0.548 0.377 0.348 0.260 0.106 0.274Xylem 0.272 0.421 0.404 0.043 0.208 0.154 0.048 0.127Nonxylem 0.840 0.708 0.677 0.770 0.478 0.430 0.280 0.499
Proportion of sugars released after 48 hInternode 0.701 0.844 0.649 0.497 0.591 0.471 0.126 0.435Xylem 0.371 0.638 0.413 0.108 0.324 0.249 0.066 0.200Nonxylem 0.847 0.855 0.758 0.773 0.781 0.709 0.279 0.687

1996 Research Summaries 83
Degradability of Cell-Wall Constituents in Corn Internodes During StalkDevelopmentT.A. Morrison, H.G. Jung and D.R. Buxton
IntroductionCell-wall concentration in forage dry matter andits degradability greatly influence availability offorages to livestock that consume it. Becauseforage crops represent the major feed resourcefor cattle, improvement in dry matterdigestibility and wall degradability are primarygoals of many research programs. Polymerizedcell-wall lignin and associated hydroxycinnamicacids [primarily ferulic acid (FA) and p-coumaric acid (PCA) in grass species], laiddown during plant development, are thought tobe the primary limiters to microbial degradationof wall polysaccharides by ruminants. Themanner in which lignin and hydroxycinnamicacids limit degradability of walls is not fullyunderstood. In some studies lignin compositionand presence of hydroxycinnamic acids in thewall were more closely related to walldegradability than was lignin concentration.Cross linkage of lignin with feruloylarabinoxylanpolysaccharides in the wall by FA may play amajor role in explaining how lignification limitswall degradability in grasses.
During corn stalk growth, individual internodesdevelop sequentially at different rates. Within agrowing internode the younger, undifferentiatedtissues are near the intercalary meristem at thebase of the internode and become progressivelymore developed higher up the internode.Progressive incorporation of hydroxycinnamicesters, especially FA during primary wallformation, is thought to be a key activityallowing lignin to limit wall degradability.During internode cell-wall development,polysaccharides, uronic acids, andhydroxycinnamic acids are deposited in asequential fashion through the middle lamella,primary, and secondary walls. As lignification isinitiated, beginning in the middle lamella andthreading through the primary and secondarywalls, the earlier-formed cell-wall constituents
are bound by randomly invading lignin polymersthat cross-link via existing FA and PCA esterand ether bonds. This study was conducted todetermine the progressive resistance todegradation by differentiating tissues in walls ofcorn internodes.
Materials and MethodsGrowth chamber grown corn at the 15th leafstage was harvested and Internodes 7 (I7)through 13 (I13) were excised. Internode 6 wasthe first aboveground internode. Each internodewas divided into lower and upper halves, and theouter rind (including cuticle and vascularstrands) was separated from the central pithtissue. The pith tissue was comprised mostly ofparenchymatous cell types and randomlydistributed vascular strands. Ground internodesamples were fermented in vitro for 24 and 96 hto provide estimates of the rapidly degradableand potentially degradable fractions,respectively. Neutral sugar residues before andafter fermentations were determined by LC afteracid hydrolysis of the starch-free, alcohol-insoluble residue. Total uronic acids wereestimated colorimetrically using galacturonicacid as the calibration standard. The experimentwas in a randomized complete block design withtwo replicates. Data are presented averaged overlocation (lower vs. upper) within internode.
Results and DiscussionWhen harvested I12 and I13 were undergoingrapid cellular elongation in the lower sections,and differentiation and initiation of lignificationin upper sections; I11 was still elongating in thelower third of the internode, but had ceasedelongation and begun differentiation andlignification in the upper two-thirds of theinternode; and I7 through I10 were fullyelongated and actively engaged in secondarycell-wall thickening. Degradability of wallpolysaccharides declined markedly from the

84 U.S. Dairy Forage Research Center
youngest internode (I13) through I11 and thenleveled off or declined more slowly through theremaining internodes, especially in the pithtissue (Fig.1). During both fermentation times,pith of the younger internodes (I13 to I11)degraded more quickly and extensively than rind;differences in degradability between pith andrind widened with increasing internode maturity.Potentially degradable (96 h) polysaccharide inboth pith and rind of I13 was near 90% andremained above 75% in the pith of olderinternodes, whereas the rind tissue of olderinternodes degraded only 67%.
Figure 1. Polysaccharide degradability of pith and rind tissue from internodes ofcorn after 24- and 96-h incubation in rumen fluid.
Examining the digestibility ofthe neutral sugars and uronicacids which are the buildingblocks of wall polysaccaridesimproves understanding ofthe manner in whichstructural carbohydratesinteract to limit theirdigestibility. A substantialincrease in degradabilityoccurred between 24 and 96 hfor glucose and xylose, withsmaller increases indegradability for arabinose,uronic acids and galactose(Table 1). Most of the man-nose was degraded by 24 h.
ConclusionsResistance to digestion increases as soon aslignin polymerization is initiated. It is likely thatcondensed phenolics in the middle lamella andprimary wall of even I13 increase resistance todegradability early in the lignification process.This early resistance is thought to occur fromferuloyl-ester cross links between arabinoxylanand the lignin. Degradability remained high infully differentiated cells of corn pith parenchymaand collenchyma that have secondary wallthickening.

1996 Research Summaries 85
Nonstructural Carbohydrates in Cool- and Warm-Season PerennialGrasses Adapted to Shaded ConditionsK.D. Kephart and D.R. Buxton
IntroductionForages frequently experience shaded conditions.Shading may occur during periods of cloudiness;from neighboring plants, especially when grownin swards with mixtures differing in height; fromcompanion crops commonly used duringseedling establishment; or lower plant parts maybe shaded by upper plant parts. Additionally,there is increased interest in incorporating foragesystems within agroforestry programs whereforages may be shaded by associated trees.Shading has both direct and indirect effects onforage quality in that it can alter morphologicaldevelopment and yield. Cool-season (C
3) species
are usually better adapted to shading than warm-season (C
4) species. Generally, growth rates and
herbage yield of forages decrease with increasingshade. Morphological plasticity allows plants tomaximize growth and to increase persistenceunder shaded conditions. Exposure to prolongedperiods of shade causes most forages to modifyproportioning of biomass among plant parts sothat the potential for photosynthetic activeradiation interception is maintained or increasedand root growth is decreased. Shading oftenreduces tillering; however, stem length is oftengreater for plants adapted to shade. Shaded grassleaves typically are longer and thinner than whengrown in full sunlight.
Shading usually has a smaller effect on foragequality than on morphology or yield. Nitrogenconcentration is much more responsive thanother quality characteristics. Shading usuallyincreases N concentration substantially,especially in leaves. Most studies have alsoreported that shading decreases cell-wallconcentration of forages. The hemicellulosefraction may be less sensitive to shading than arecellulose and lignin fractions. There is limitedinformation about the effect of prolongedshading on nonstructural carbohydrates offorages. This study was conducted to compare
the response of perennial C3 and C
4 grass species
to prolonged shading.
Materials and MethodsFour grass species, differing in photosynthetictype, were grown under three levels of solarradiation. The C
3 species were �Kentucky 31� tall
fescue and �Vantage� reed canarygrass and the C4
species were �Cave-in-Rock� switchgrass and�Kaw� big bluestem. Polypropylene fabric shadeswere suspended about 1 m above the soil surfaceto impose shade treatments of 37 and 70%sunlight beginning in early May during the 2years of study. A nonshaded control received100% sunlight. In late May or early June the firstof three samplings was taken. Subsequentsampling occurred at 3-week intervals. Freeze-dried samples were solubilized and hydrolyzedfor determination of nonstructural carbohydrates.Fractions were collected of water-solublecarbohydrates (monosaccharides), acid-extractable carbohydrates (sucrose plus short-chain fructosans), and α-amylase solublecarbohydrates (starch and other long-chainpolymers). Sugar concentrations as glucose/fructose equivalents were determined by usingan autoanalyzer. The three fractions were totaledand identified as total nonstructuralcarbohydrates (TNC).
Results and DiscussionPlants adapted to shade had lower TNCconcentrations than those adapted to fullsunlight, although differences were notstatistically significant for nonlaminar herbage(stems and sheaths) of big bluestem andswitchgrass (Fig. 1). The response was muchgreater in the two C
3 grasses (reed canarygrass
and tall fescue) than in the C4 grasses (big
bluestem and switchgrass). Approximately one-third of the TNC was water soluble. Water-soluble carbohydrate concentration was lesssensitive to shading than total nonstructural

86 U.S. Dairy Forage Research Center
carbohydrates. In fact, the response inswitchgrass, and nonlaminar herbage of reedcanarygrass and tall fescue was nonsignificant.Acid-extractable carbohydrates also comprisedabout one-third of the TNC. Here the responsewas not significant for switchgrass or big blue-stem but was significant for reed canarygrass andtall fescue. Shading reduced the α-amylasesoluble carbohydrates only in the nonlaminarherbage of reed canarygrass and tall fescue.
ConclusionsNonstructural-carbohydrate concentration wasmuch more sensitive to shading in the two C
3
species than in the C4 species. The greater
plasticity in TNC concentration of cool-seasonspecies to shading than in warm-season speciesmay be part of the mechanism that allows cool-season species to be better adapted to prolongedshading.
.
Figure 1. Total nonstructural carbohydrates in C3 and C4perennial grass species adapted to different levels ofsunlight
1996 Research Summaries 87
Alfalfa Cultivar Variation for Minerals ConcentrationJ. Guan, D.R. Buxton, J.P. Goff and R.L. Horst
IntroductionMilk fever (parturient paresis) is a complexmetabolic disorder that occurs at the beginning oflactation in many high-producing dairy cattle.The disease is characterized by a rapid decline inplasma Ca because of the demand for Ca to formcolostrum in the milk. Severe hypocalcemia isthought to account for most of the clinicalsymptoms. If left untreated, most animals die. Itis a greater problem in older cows than in heifers.Of the various methods used to control thedisease, the most promising is dietarymanagement of dry cows before parturition. Untilrecently, most attention has centered onmanipulating dietary Ca. Recent work hasfocused on the cation-anion difference (CAD) inthe diet as the factor determining thesusceptibility of cows to milk fever. The CAD isthought to influence milk fever by affectingblood pH. A reduction in blood pH can beachieved by adding anions or by reducing theconcentration of cations in the diet.
Horst et al. recently proposed that CAD becalculated as follows:
CAD (meq kg-1) = (0.38 meq Ca++ kg-1 + 0.25 meqMg++ kg-1 + meq Na+ kg-1 + meq K+ kg-1) - (meq Cl-
kg-1 + 0.6 meq SO4-- kg-1 + 0.5 meq PO4--- kg-1)
This equation assumes that Na, K, and Cl areabsorbed with 100% efficiency and that theremaining cations and anions are absorbed atlower efficiencies as shown by their coefficients.Addition of anions to the diet to reduce dietaryCAD is a limited option because of reducedpalatability associated with anionic salt sourcescommonly used. A more practical solution maybe to reduce cations in the diet. Because of thehigh efficiency of absorption, recent work hasfocused on reducing K and Na. This study wasconducted to determine if variation exists amongalfalfa cultivars for cation mineral concentration
and to determine the relationship betweenconcentrations in leaves and stems.
Materials and MethodsTwenty alfalfa cultivars, representing five of thenine original germplasm introductions to theUSA, were evaluated for mineral concentrations.Samples for this study were collected in 1993and 1994. The alfalfa was harvested three timeseach year, but samples from only the first twoharvests were studied. Maturity effects werecontrolled by selecting stems with only oneraceme that had blooming florets. Leaves wereseparated from stems. Minerals concentrationwas determined by an atomic absorptionspectrophotometer.
Results and DiscussionSignificant cultivar variation for all mineralsoccurred in leaves, stems, and total forage(Tables 1 and 2) with the greatest variation forNa concentration. Results are shown here foronly K and Na (Tables 1 and 2). There weresome compensating effects so that cultivars lowin one mineral were sometimes high in another.When milliequivalents of the cations weretotaled according to the equation by Horst et al.,the range was 724 meq kg-1 for �Ramsey� to 794meq kg-1 for �ICI 645.� Often variation fromenvironmental factors was larger than that forcultivars. For example, K concentrations weremarkedly higher in 1993 (20.2 g kg-1) than in1994 (17.6 g kg-1) and higher in Harvest 2 (21.2g kg-1) than in Harvest 1 (16.6 g kg-1). Caconcentrations were higher in Harvest 1 (12.7 gkg-1) than in Harvest 2 (10.0 g kg-1).
ConclusionsWhile variation exists among these diversecultivars for minerals concentration, the rangemay not be great enough to have a meaningfuleffect on milk fever of cattle. We have yet todetermine the anions of these samples. Other

88 U.S. Dairy Forage Research Center
factors such as soil mineral concentration, cropmaturity, and environmental conditions during
crop growth may be more important in loweringcation concentration in alfalfa.
Table 1. Potassium concentration in leaves andstems of alfalfa cultivars. Data are averaged over twoyears and two harvests.Cultivar Stems Leaves Total forage
- - - - - - - g kg-1 - - - - - - - -ABI 9144 18.2 20.9 19.7Archer 17.3 20.5 18.9Caliverde 16.5 20.9 18.7Cherokee 16.7 18.3 17.5Deseret 16.7 21.2 19.1Gladiator 17.5 19.1 18.4ICI 645 19.0 21.7 20.4Iroquois 17.7 20.1 19.0Norseman 17.5 18.9 18.3Pioneer 5246 17.4 20.5 19.0Pioneer 5364 17.8 20.0 19.0Pioneer 5683 16.3 18.4 17.4Quantum 18.9 20.8 19.9Ramsey 18.2 19.3 18.8Sarnac 17.8 21.2 19.5Sarnac AR 18.0 21.0 19.5Valor 17.8 19.0 18.4WL 222 18.0 20.1 19.1WL 322 HQ 17.6 20.7 19.2Washoe 17.1 19.9 18.6
LSD(0.05) 0.91 1.11Mean 17.6 20.0 18.9Minimum value 16.3 18.3 17.4Maximum value 19.0 21.7 20.4

1996 Research Summaries 89
Table 2. Sodium concentration in leaves and stems ofalfalfa cultivars. Data are averaged over two years andtwo harvests.Cultivar Leaves Stems Total forage
- - - - - - - - - g kg-1 - - - - - - - -ABI 9144 0.397 0.375 0.385Archer 0.363 0.547 0.459Caliverde 0.382 0.607 0.497Cherokee 0.733 0.843 0.790Deseret 0.169 0.256 0.238Gladiator 0.360 0.456 0.413ICI 645 0.388 0.398 0.393Iroquois 0.230 0.328 0.283Norseman 0.134 0.362 0.254Pioneer 5246 0.348 0.396 0.373Pioneer 5364 0.351 0.493 0.430Pioneer 5683 0.316 0.612 0.461Quantum 0.254 0.323 0.290Ramsey 0.294 0.331 0.315Sarnac 0.334 0.432 0.385Sarnac AR 0.461 0.501 0.482Valor 0.236 0.418 0.331WL 222 0.224 0.422 0.329WL 322 HQ 0.258 0.451 0.356Washoe 0.220 0.460 0.348 LSD(0.05) 0.063 0.048Mean 0.323 0.451 0.391Minimum value 0.134 0.256 0.238Maximum value 0.733 0.843 0.790

90 U.S. Dairy Forage Research Center
Rumen Microbiology
were collected 3 h post-feeding and pH wasdetermined immediately. The ruminal contentswere incubated anaerobically at 39 °C for 30min. Bacteria were collected from the middlesection of the flask. Ruminal fluid wasanaerobically diluted 10-fold in a basal mediumcontaining salts, cysteine hydrochloride, Na2S,vitamins, microminerals,mercaptoethanesulfonic acid, a volatile fattymixture, Trypticase, and yeast extract. Whenacetate concentrations were reduced from 100mM to as low as 0 mM, sodium acetate wasreplaced with sodium chloride. The mediumcontaining ruminal microorganisms wasanaerobically transferred to serum bottles. Oneatmosphere of hydrogen gas was added with ahypodermic syringe. The bottles were incubatedat 39 °C. Head space samples were removed, andmethane was measured with a gaschromatograph. Volatile fatty acids in cell andparticle-free ruminal fluid were analyzed byhigh-pressure liquid chromatography.
ResultsWhen a fistulated cow was fed an all forage diet,ruminal pH remained more or less constant (6.7to 6.9). The ruminal pH of a concentrate-fed cowdecreased dramatically in the period soon afterfeeding, and the pH was as low as 5.45. Mixedruminal bacteria from the forage-fed cowconverted CO
2 and H
2 to methane, but the
ruminal fluid from the concentrate-fed cow didnot produce methane. When the pH of theruminal fluid from the concentrate-fed cow wasadjusted to pH 7.0, methane was eventuallydetected, and the absolute rate constant ofmethane production was as high as the oneobserved with ruminal fluid from the forage fed
The Effect of pH on Ruminal MethanogenesisJ.S. Van Kessel and J.B. Russell
IntroductionMethane is a major end product of ruminalfermentation and, in cattle, methane losses canrepresent as much as 10% of the dietary energy.Ruminal methanogenesis represents analternative mechanism of reducing equivalentdisposal for carbohydrate-fermenting bacteria,but interspecies hydrogen transfer is onlyexergonic at very low partial pressures ofhydrogen. If the methanogens are inhibited,hydrogen accumulates, the hydrogenases areinhibited, and the carbohydrate-fermentingbacteria utilize other mechanisms of reducingequivalent disposal (e.g., the dehydrogenases ofpropionate production). It has long beenrecognized that the addition of cereal grains toruminant diets causes a decrease in methane andan increase in propionate production, but thecause of this fermentation shift was not clear.Some starch-fermenting ruminal bacteriaproduce propionate, but starch feeding can alsocause a decrease in ruminal pH and a markedshift in the numbers of other ruminal bacteria.Despite the fact that ruminal methanogenesis is akey determinant of fermentation stoichiometry,the effect of pH on ruminal methanogens had notbeen examined previously.
Materials and MethodsRumen contents were obtained from tworuminally cannulated, mature Holstein cows. Thecows were housed in a tie-stall barn, fed twicedaily and provided with water ad libitum. Thecows were fed either a forage diet (timothy hay)to provide a high ruminal pH or a concentratediet (corn and soybean meal) to induce a low pHruminal environment. Ruminal pH wasmonitored at 2 hour intervals. Ruminal contents

1996 Research Summaries 91
cow (0.32 h-1). Based on the zero-time interceptsof methane production, it appeared that theconcentrate-fed cow had fewer methanogensthan the forage-fed cow. When the mixedruminal bacteria were incubated in a basalmedium containing 100 mM acetate,methanogenesis was pH-dependent, and nomethane was detected at pH values less than 6.0.Because the removal of acetic acid completelyreversed the inhibition of methanogenesis, itappeared that volatile fatty acids were causingthe pH-dependent inhibition.
DiscussionPure cultures of ruminal bacteria often produceend products, such as ethanol, that are notdetected in the rumen; and methanogens, byconsuming hydrogen, can alter the profile offermentation end products in mixed cultureenvironments like the rumen. When reducingequivalents are transferred from carbohydrate-fermenting ruminal bacteria to methanogens,acetate increases and propionate generallydeclines. Hydrogen and carbon dioxide are theprimary sources of methane in the rumen, andacetate is not a significant precursor for ruminalmethane.
The methane production of cattle is relativelydifficult to measure, but methane can beestimated from the stoichiometry of thefermentation acids. Based on fermentation acidsalone, the methane production of the forage-fedcow would have been 1.5-fold greater than theconcentrate-fed cow:
100 glucose → 134.5 acetate + 31.9propionate + 16.8 butyrate + 31.9 H2O + 100.8CO2 + 67.2 CH4,
versus
100 glucose → 9.9 lactate + 93.2 acetate +52.2 propionate + 22.4 butyrate + 48.4 H2O +93.2 CO2 + 44.7 CH4.
These balances, however, do not consider thefact that bacterial cells are also end products ofruminal fermentation. Because microbial cellshave a negative oxidation-reduction state, cellproduction can have a significant impact on theestimate of methane production. Based on anempirical formula of C1.00H1.58O0.77 and anoxidation-reduction state of -1.69, and a yield of30 g cells per 100 g carbohydrate fermented, themethane estimate was considerably lower andthe difference between forage-fed andconcentrate-fed cows was greater:
100 glucose → 94.1 acetate + 22.4propionate + 11.8 butyrate + cells [C180H284O85] +94.1 H2O + 82.4 CO2 + 35.3 CH4
versus
100 glucose → 7.0 lactate + 65.2 acetate +36.5 propionate + 15.7 butyrate + cells[C180H284O84] + 86.0 H2O+ 87.0 CO2 + 9.6 CH4 +29.1 H2
Based on these latter stoichiometries, theconcentrate-fed cow was producing somemethane, but ruminal fluid obtained 3 h afterfeeding had a pH of 5.4 and did not producemethane, even if hydrogen was added. Theinhibitory effect of low pH was supported by avariety of observations: 1) the addition of base tothe ruminal fluid from the concentrate-fed cowallowed methane production, 2) the zero-timeintercept of methane production indicated thatthe concentrate-fed cow had fewer (or lessactive) methanogens than the forage-fed cow,and 3) bacteria from the forage-fed cow couldnot produce methane if the pH was less than 6.0.
The toxicity of acetate at low pH has beenexplained by the influx of acid and metabolicuncoupling, but this theory does not explain whysome bacteria are inhibited and others are notaffected. When the internal pH is more alkalinethan the external pH (∆pH), volatile fatty acids

92 U.S. Dairy Forage Research Center
will cross the cell membrane, dissociate andaccumulate intracellularly. Because the volatilefatty acid concentration of ruminal fluid isrelatively high, an even modest increase in ∆pHcan lead to a dramatic increase in intracellularvolatile fatty acid anions. The intracellular pHregulation of methanogenic bacteria has not beenexamined in a systematic fashion, but somemethanogens have large pH gradients acrosstheir cell membranes at acidic pH values.
Methane is a �greenhouse gas,� and methaneaccumulation in the atmosphere has been cited asa factor in global warming. Methane appears to
have as much as a 60-fold higher global warmingpotential than carbon dioxide. Ruminants havealways been included as significant producers ofatmospheric methane, but their overall contribu-tion has been a lively subject for debate. The pH-dependence of ruminal methanogens provides abasis for predicting methane production. Becausepoor quality forage diets never cause a signifi-cant decrease in ruminal pH, these diets shouldalways produce large amounts of methane. Highquality, concentrate diets have the potential todecrease methane production, but only if theintake is high enough to cause a reduction inruminal pH.

1996 Research Summaries 93
Effect of Forage Quality and Monensin on the Ruminal Fermentation ofFistulated Cows Fed Continuously at a Constant IntakeR.P. Lana and J.B. Russell
IntroductionMonensin improves the feed efficiency ofruminants, but decreases in methane andincreases in propionate cannot explain all of thisbenefit. Early research indicated that monensindecreased ruminal ammonia in vivo, and thisfinding was corroborated by mixed culture andpure culture studies. The amino acid-sparingeffect of monensin has not been welldocumented. Monensin increased passage offeed protein, but this increase was offset bydecreases in bacterial protein. In some cases,monensin had no effect on ruminal ammonia,and it appeared that monensin-dependentimprovements in nitrogen retention were a resultof energy utilization rather than the proteinsparing per se. Previous work indicated thatcattle fed timothy hay and soybean meal 12 timesper day had steady-state ruminal fermentationpatterns; and, under these conditions, monensindecreased ammonia concentration, specificactivity of deamination and most probably thenumber of obligate amino acid-fermentingbacteria. Preliminary experiments indicated thatcattle fed alfalfa hay did not respond in a similarfashion, and the present research was designed toexamine the relationship between forage qualityand monensin-dependent amino acid sparing.
Materials and MethodsTwo nonlactating cows (685 ± 59 kg) fitted withruminal cannulas were fed forage 12 times perday. Dietary treatments consisted of threecombinations of timothy and alfalfa hays (100:0,50:50, and 0:100) and two levels of monensin (0and 350 mg cow-1 d-1). Monensin (350 mg) wasdissolved in 36 mL of ethanol, and 3 mL of thesolution were added on the top of each meal.Water was offered free choice. No salt or otherminerals were provided.
Ruminal fluid (500 ml) was squeezed throughfour layers of cheesecloth and analyzed for pHwith a combination electrode. Volatile fatty acids
in cell-free samples were measured by high-performance liquid chromatography. Ammoniain cell-free supernatant fluid was measured bycolorimetry. Ruminal K and Na concentrationsin cell-free supernatant fluid were determined byflame photometry. Bacterial protein was assayedby the method of Lowry. Bacterial pellets weredigested with 3 N HNO3 (room temperature, 24h) before analyzing for K by flame photometry.
Separate samples of ruminal fluid were collectedfrom the rumen and allowed to incubateanaerobically in a 39 °C water bath for 60 min.Feed particles were buoyed to the top of the flaskby gas production and protozoa sedimented tothe bottom of the flask. Mixed ruminal bacteria(10 mL) from the center of the flask weretransferred in triplicate to 15 mm x 180 mmtubes. At time zero, an anaerobic solution ofTrypticase was added to the tubes (15 g/L finalconcentration). The tubes were incubated at39 °C for 6 h. The incubation was terminated bya centrifugation step (10,000 x g, 20 min, 0 °C)that removed the bacteria. The bacterial pelletwas washed with .9% NaCl (wt/vol) and storedat -15 °C. The cell-free supernatant fluid wasstored separately at -15 °C. Ammonia andbacterial protein were measured as describedpreviously. Preliminary experiments indicatedthat ammonia production was first order withrespect to time and cell concentration so long asthe incubation period was less than 10 h.
Cows (n = 2) were the experimental units for thestatistical analysis. Each experimental unit wasthe mean of pooled data from four sample units(4 d of collection). All statistical analyses wereperformed with the GLM procedures of Minitab.Data were analyzed as a randomized completeblock design. Sources of variations includedanimals (blocks), alfalfa (0% vs. otherwise),alfalfa level (50 vs. 100% alfalfa), monensin,alfalfa x monensin, and alfalfa level x monensin.The residual error term (block x treatment

94 U.S. Dairy Forage Research Center
effects) was used for testing treatment effectsand interactions at a = .05. If the F test indicatedthat a model interaction was significant (P <.05), interactive treatment means were analyzedby the method of Tukey.
ResultsThe alfalfa hay had 1.4 times less NDF than thetimothy hay, and the concentration of VFA in theruminal fluid was greater (P < .05) when alfalfawas substituted for timothy. The substitution ofalfalfa for timothy did not affect ruminal pH orthe acetate:propionate ratio (P > .05). Alfalfadecreased bacterial protein in the fluid phase (P< .05). The alfalfa had 1.5 times as much K asthe timothy hay. Alfalfa increased (P < .001) theK concentration (K / [K + Na]) of the ruminalfluid and decreased the K content of the bacteria(P < .05). The alfalfa had 1.4 times as much CPas the timothy hay, and total ruminal ammoniaincreased (P < .05) when alfalfa was substitutedfor timothy (Table 2). Dissociated ammonia, aspredicted from pH and the Henderson-Hasselbalch equation (pH = pK
a + log [NH3]/[NH4
+]), was unaffected by alfalfa substitution(P > .05). Substitution of timothy with alfalfahay increased (P < .001) the specific activity ofdeamination (deamination rate).
At all combinations of timothy and alfalfa hays,monensin caused an increase (P < .001) in totalVFA and a decrease (P < .05) in ruminal pH.Acetate increased to a smaller extent thanpropionate, but the decrease inacetate:propionate ratio was only significant (P <.05) when alfalfa was 50% or less of the forage.Monensin caused a small but significant (P <.001) increase in the K concentration of theruminal fluid, but it did not have an effect on theK content of bacteria in ruminal fluid (P > .05).Monensin did not decrease total ammonia whenalfalfa was 0 or 50% of the diet and evenincreased it in 100% alfalfa. The total ammonia,however, was not corrected for changes inruminal pH. Monensin decreased (P < .05) thedissociated ammonia concentration when onlytimothy hay was fed, but monensin had noimpact (P > .05) on dissociated ammonia if
alfalfa was 50 or 100% of the diet. Monensinalleviated alfalfa-dependent decreases inbacterial protein (P < .05) and decreased (P <.001) the specific activity of deamination(deamination rate) at all combinations of alfalfaand timothy.
DiscussionBecause monensin did not decrease totalammonia accumulation when animals were fed100% alfalfa, it seemed that some component inalfalfa was counteracting potential decreases indeamination. Because monensin catalyzes theefflux of K from monensin-sensitive ruminalbacteria, high ruminal potassium may inhibitmonensin action. Our animals were not givensupplemental Na, and the K ÷ (K + Na) valueswere high (.56 to .68), and animals fed alfalfahad a greater K intake and higher ruminal K (K ÷[K + Na]) than animals fed only timothy.
Animals fed monensin had lower ruminal pHvalues than untreated controls, and thesedifferences could have influenced the absorptionrate of ammonia from the rumen. Dissociatedammonia is a much more lipophilic substancethan ammonium ion, and it would be morerapidly absorbed. Based on ruminal pH and thepK
a of ammonia, it was possible to estimate theruminal concentration of dissociated ammonia.Because monensin decreased steady-statedissociated ammonia when timothy was 100% ofthe diet, it seemed that monensin had thepotential to spare amino acids from deamination.Monensin did not decrease dissociated ammoniawhen alfalfa was fed, but it was able to alleviatealfalfa-dependent decreases in bacterial protein.
The observation that monensin decreased thespecific activity of deamination at allcombinations of alfalfa and timothy furthersupports the idea that monensin had the potentialto spare amino acids. The effect of monensin ondeamination is consistent with its ability toinhibit Gram-positive, highly active, obligateamino acid-fermenting ruminal bacteria in vitroand in vivo. Monensin is clearly an antimicrobialsubstance, but ruminal VFA concentrations were

1996 Research Summaries 95
always greater when monensin was added to thediet. Increases in ruminal VFA were correlatedwith the increases in bacterial protein. Monensin(across all three diets) caused a 20% increase intotal VFA and a 20% increase in bacterialprotein in the fluid phase. This comparisonindicated that: 1) monensin enhanced VFAproduction, 2) the bacteria had more ATP forgrowth, and 3) the animal would have morebacterial protein.
The rumen often has a dense population ofprotozoa, but protozoal counting procedures are
confounded by the propensity of protozoa toassociate with feed particles and by the difficultyin obtaining representative samples. In vitroresults indicated that protozoa were sensitive tomonensin, but this effect has been difficult todocument in vivo. Because ruminal protozoastore large amounts of carbohydrate asintracellular glycogen, appear to recycle bacterialnitrogen, and decrease microbial flow from therumen, it is conceivable that a monensin-dependent decrease in protozoa caused theincrease in bacterial protein and VFA that weobserved.

96 U.S. Dairy Forage Research Center
orchestrated, the cells can lyse. BecauseFibrobacter succinogenes is a ruminal bacteriumthat lyses easily, it makes a good model forstudying rumen bacterial turnover.
Materials and MethodsFibrobacter succinogenes S85 was grownanaerobically in a minimal medium thatcontained cellobiose. Cultures were grown(39 °C) in 80 ml serum bottles, 18 x 150 mmtubes or a continuous culture device. Growth andlysis were monitored by the changes in opticaldensity as well as changes in cell protein. Proteinwas determined by the Lowry method. RNA andDNA were determined using orcinol anddiphenylamine methods, respectively. Cell Nwas calculated from protein, RNA and DNAwith the N content of protein and nucleic acidsbeing 16 and 12%, respectively. The membranepotential (∆Ψ) was calculated from the uptake of[3H] TPP+ using the Nernst equation (62 mV xlog [in]/[out]), and the non-specific binding of[3H] TPP+ was estimated from cells which hadbeen treated with nigericin plus valinomycin (10mM each) or toluene (1% of a 1:9 [v/v] tolueneto ethanol). ATP was assayed with aluminometer. Cellobiose and cellularpolysaccharide were assayed by an anthroneprocedure. Soluble protein was measured by theBradford dye method. Ammonia was assayed bya calorimetric method. Free amino acids were
measured by high pressure liquidchromatography. Peptides were hydrolyzed withHCl prior to derivatization and amino acidanalysis.
ResultsGrowing cultures of F. succinogenes assimilatedmore ammonia than could be accounted bycellular protein, RNA or DNA, and releasedlarge amounts of non-ammonia nitrogen. Thedifference between net and true growth was mostdramatic at low dilution rates, but mathematicalderivations indicated that the lysis rate was agrowth rate-independent function. The lysis ratewas 7-fold greater than the true maintenance rate(0.07 h-1 versus 0.01 h-1). Because slow-growingcells had as much protonmotive force and ATPas fast-growing cells, lysis was not a starvationresponse per se. Stationary cells had a lysis ratethat was 10-fold less than growing cells.Rapidly-growing cells were not susceptible tothe proteinase inhibitor, PMSF, but PMSFincreased the lysis rate of the cultures when theyreached stationary phase. This latter resultindicated that autolysins of stationary cells werebeing inactivated by a serine proteinase. Whengrowing cells were treated with the glycolyticinhibitor, iodoacetate, the proteinase-dependenttransition to stationary phase was circumvented,and the rate of lysis could be increased by asmuch as 50-fold.
DiscussionLysis is usually considered to be a property ofstationary phase bacteria that have depleted theirnutrients, but F. succinogenes had a much fasterrate of lysis when it was growing. In the surfacestress model of bacterial growth, peptidoglycanis first deposited at the inner surface, and theolder, outer layers are then cut by autolyticenzymes. This continual process of synthesis anddegradation allows the stress to be graduallytransferred to more recently synthesized portions
The Lysis of Fibrobacter SuccinogenesJ.E. Wells and J.B. Russell
IntroductionIn ruminant animals, microbial protein is theprimary source of protein for the animal, andmicrobial protein turnover is a wasteful processthat decreases amino acid availability. Protozoalpredation has often been cited as the prime causeof bacterial protein turnover in the rumen, buthigh rates of bacterial turnover have been notedin defaunated sheep. Bacteria need autolyticenzymes to expand their cell wall and grow, butthe cells have a very high turgor pressure. If theaction of autolytic enzymes is not carefully

1996 Research Summaries 97
of the peptidoglycan. Since each new layer of thepeptidoglycan is slightly longer than thepreceding one, the wall is continually expanded.
Some workers hypothesized that the autolysinsmight be regulated by protonmotive force. In thismodel of autolytic regulation, protonmotiveforce decreases pH near the cell membrane, andacidic pH prevents the autolysins fromcompletely degrading the peptidoglycan.Uncouplers that decreased protonmotive forcepromoted the lysis of F. succinogenes, but lysisand protonmotive force could not always becorrelated. Growing cells with a highprotonmotive force lysed, and stationary-phasecells that had a low protonmotive force did notlyse very rapidly.
Stationary cells of F. succinogenes had amechanism of preventing lysis, and theexperiments that included PMSF indicated that aproteinase was involved in autolysis. BecausePMSF had no effect on exponentially growing F.
succinogenes cultures but promoted lysis whenthe cells reached stationary phase, it appearedthat a serine proteinase was inactivating theautolysins when growth was no longer possible.One might view the lysis of growing F.succinogenes cells as a detrimental phenomenonthat would decrease its niche in the rumen, butthis assumption does not address the aspect ofmaximum growth rate and cell division. Ifautolytic activity is too low, growth rate wouldbe sacrificed.
If the autolysis and growth of F. succinogenesare indeed highly integrated processes, lysis maybe a very difficult phenomenon to alter. Lysis is,however, a dynamic process that must competewith the fluid dilution rate. Mineral salts have nodirect effect on growth or lysis per se, but theyincrease the ruminal fluid dilution rate. Whenfluid dilution rate is increased, fluid phasebacteria have less time to lyse and turn over.

98 U.S. Dairy Forage Research Center
Variation in Ruminal and Milk Parameters Among Cow-Diet Combinations:Results From a Baseline Study to Relate Digestion Kinetics and MicrobialPopulation DataP.J. Weimer, G.M. Waghorn and D.R. Mertens
IntroductionDespite the central importance of the ruminalmicroflora in the digestion of feedstuffs byruminants, there have been no systematic studiesof the quantitative relationship betweenparticular ruminal microbial species and ruminalchemistry (e.g., pH, VFA concentrations),digestion kinetics (e.g., lag, rate, and extent ofdigestion) and animal performance (e.g., milkproduction and milk composition). As part of alarger study aimed at relating microbialpopulations to these parameters, we examinedthe variation in VFA patterns among diets in fourcows that were used in an experiment fordetermining digestion kinetics (using both invitro and in situ methods) and for assessingmicrobial populations (using oligonucleotideprobes directed toward species-specificribosomal RNA molecules).
MethodsFour multiparous mid-lactation Holstein cowswere fed, in a Latin-square design, diets differingin source (corn silage or alfalfa silage) andamount (24% or 32% NDF) of fiber. Diets wereoffered at 12 h intervals as isonitrogenous totalmixed rations in amounts that assured ad libitumintake. After adaptation to diet for 19 days, 13samples were collected from each rumen over a4-day period; Dacron bags containing variousfeedstuffs were also removed from each rumenover the 4-day period to determine in situdigestion kinetics. Samples were analyzed forpH and VFAs and were stored at -80 oC forsubsequent analysis of microbial populations.VFAs were determined by HPLC. Rumen fluidwas also collected at the beginning and end ofthe four day period and were used as inocula fordetermination of in vitro digestion kinetics.
ResultsCows displayed marked differences in ruminalpH determined just prior to feeding (range ofmeans [n = 3], 5.36 to 6.49) or 3h post-feeding(range of means [n = 5], 5.04 to 5.94), but therewas no significant relationship between the pre-and post-feed pH values (r2 = .136). Despite thelow pH of many of the ruminal samples, none ofthe 208 samples examined in this studycontained significant concentrations of lactate orsuccinate.
Molar concentrations of ruminal VFAs (acetate,propionate, butyrate, and the sum of these acids)were remarkably constant over the 12-h feedingcycle. Individual cows displayed markedvariation in the amounts and proportions ofVFAs, and marked variations were observedamong diets within cows as well (Fig. 1).Ruminal acetate/propionate (A/P) ratios (Fig. 2)and milkfat (Fig. 3) varied markedly among cow-diet combinations. The positive correlation (r2 =.73) between milkfat and A/P ratio was evenstronger (r2 = .88) at high (> 100 mM) acetateconcentrations. Milkfat was not correlated withconcentration of acetate (r2 =.002) or butyrate(r2 = .07) but was negatively correlated withpropionate concentrations (r2 = .50). In general,diets based on alfalfa silage yielded higher A/Pvalues and higher milkfat compositions than didcorn silage-based diets at equivalent NDFconcentrations.
ConclusionsLarge, statistically-significant differences inruminal pH, VFA profiles, and milk parameterswere observed among the four cows and amongdiets within cows. These data will provide avaluable set for relating ruminal and milk

1996 Research Summaries 99
parameters to digestion kinetics and to specificpopulations of ruminal microorganisms,permitting a systematic determination of therelationships among ruminal chemistry, ruminalmicrobial populations, digestion kinetics, andanimal performance.
Figure 1. Mean values of the sum of the ruminalconcentrations of acetate, propionate, and butyrate in fourcows fed four different diets.
Figure 3. Mean values of fat content of milk. M indicateslack of data for cow 749 on the AS24 diet due todevelopment of mastitis at the end of experimentalperiod 4.
Figure 2. Mean values of ruminal acetate/propionateratio.
749 2661 3691 38070
100
200
300
AS24AS32
CS24
CS32
Cow
mM A+P+B
749 2661 3691 38070
1
2
3
4
5
AS24AS32
CS24
CS32
Cow
A/P ratio
749 2661 3691 38070
1
2
3
4
5
AS24AS32
CS24
CS32
Cow
milk fat (%)
M

100 U.S. Dairy Forage Research Center
Time-Dependent Shifts in Fermentation Endproduct Ratios: A Source of Bias inEstimation of Digestion Kinetics Via In Vitro Measurement of Gas ProductionP.J. Weimer
IntroductionContinuous online measurement of gasproduction in sealed vials has the potential todetermine, with greater ease than conventionalmethods, the kinetics of fermentation of foragematerials by ruminal microorganisms. As aresult, gas production has been used to comparein vitro kinetics of digestion of variousfeedstuffs. However, direct calculation ofsubstrate consumption from gas production datais not feasible for a number of reasons. Forexample, differences in the composition amongfeeds result in different ratios of fermentationendproducts, which, in turn, affects gasproduction. A relationship between gas yieldsand fermentation endproducts has been describedby Beuvink and Spoelstra:
mL gas production = Vm [acetate] + 2(Vm)[butyrate] + 0.87 Vm [total VFA], [1]
where Vm is the molar gas volume; theseworkers routinely measure gas production at theend of the fermentation to provide qualitativeinformation on the deviation of observed gasproduction from theoretical values.
Digestion kinetics based on gas production canbe biased by changes in the proportions offermentation endproducts that may accompanydigestion in batch culture. The purpose of thisstudy was to determine the extent of change inthe formation of endproducts duringfermentation of three substrates and to quantifythe extent to which these changes can bias thetheoretical gas yields from a fixed amount ofsubstrate over the course of an in vitro digestionexperiment.
MethodsConcentrations of VFAs were determined overtime during the fermentation of three substrates:
corn silage, alfalfa hay, and microcrystallinecellulose; the last substrate, while not a directfeedstuff for ruminants, is often used as astandard substrate in in vitro gas productionexperiments. Fermentations were conductedunder a CO2 atmosphere in 60 ml serum vialsthat contained 80 mg of substrate and 6 ml of apre-reduced, modified Goering and Van Soestbuffer. After warming of vials to 39 oC, vialswere inoculated with 4 ml of ruminal inoculumfrom a cow fed alfalfa hay; the inoculum wasprepared by squeezing rumen fluid through fourlayers of cheesecloth followed by wetting of thesolids with an equal volume of Goering/VanSoest buffer and squeezing this through thecheesecloth. Vials were sealed with butylstoppers and aluminum crimp seals, thenincubated at 39 oC. Pairs of vials containing eachsubstrate were removed at intervals, and VFAconcentrations determined by HPLC.
ResultsThe shift in the molar ratios of acetate andbutyrate during the fermentations are shown inFig.1. Shifts in the molar ratios of propionatewere also observed but were excluded from thefigure because propionate production does notcontribute to net production of gas. The molarratios of products for alfalfa fermentation were
504030201000.0
0.2
0.4
0.6
0.8
Ac-Cellulose
Ac-Corn
Ac-Alfalfa
But-Cellulose
But-Corn
But-Alfalfa
Time (h)
Mol
ar P
rop
ortio
n
Figure 1. Shifts in the molar proportion of acetate andbutyrate during the in vitro fermentation of alfalfa hay,corn, and microcrystalline cellulose.

1996 Research Summaries 101
essentially constant throughout the incubationperiod. However, both corn silage andmicrocrystalline cellulose showed markedincreases in the molar proportions of acetate andbutyrate during the course of the fermentations.
To determine the potential bias in gas productionresulting from these time-dependent changes ingas production, the fermentation product data atdifferent times were normalized on a molar basisusing a modification of equation [1]:
Yt = Xacetate + 2 Xbutyrate + 0.87 [2]
where Yt is the relative gas production per unitsubstrate at time t (estimated from equation [1]),and Xacetate and Xbutyrate are molar proportions ofacetate and butyrate, respectively.
Bias in gas production estimated at differenttimes using fixed, endpoint (48 h) values of VFAproportions were then calculated as:
Bias = (Yt -Y48h) / Y48h [3]
where Y48h is estimated gas production per unitsubstrate based on the proportions of VFAs at 48h. A positive value indicates an underestimate ofsubstrate consumption (i.e., an overestimate ofgas production relative to that expected forfermentation endproduct ratios determined at theend of the incubation) . Results from thesecalculations are shown in Fig. 2. Bias introducedby changes in fermentation endproduct ratioswas greatest at early time points and reachedvalues of 20% or more. Because measurementsduring the first 24 h have the greatest effect on
determining digestion rate and lag time, changesin VFA patterns during the fermentation must beaccounted for to prevent biased estimates ofdigestion kinetics.
ConclusionsChanges in the ratios of fermentationendproducts over time complicate determinationof substrate consumption from gas productiondata. In this experiment, bias in gas productionintroduced by assuming fixed endproduct ratiosis small for alfalfa but may result in anunderestimation of 20% or more for corn andcellulose early in their fermentations. Furtherexperiments are needed to determine if the shiftsin fermentation products observed for corn andcellulose were due to characteristics of the feedor to the use of inocula from an alfalfa-fed cow.Nevertheless, proper corrections of gasproduction data to more accurately reflectsubstrate consumption will require separatedeterminations of VFA profiles over time foreach substrate of interest.
50403020100-5
0
5
10
15
20
25
Cellulose
Corn
Alfalfa
Time (h)
Un
der
esti
mat
e (%
)
Figure 2. Time-dependent bias in the estimation ofdigestion of three substrates from gas productionmeasurements. Bias was calculated on the basis ofdifferences in the endproduct ratios at the indicated timesrelative to the ratios at the 48 h endpoint.
102 U.S. Dairy Forage Research Center
Inocula Differences Affect In Vitro Fiber Digestion KineticsD.R. Mertens, P.J. Weimer and G.M. Waghorn
IntroductionUsing digestion kinetics to estimate ruminalresponses may provide information useful informulating dairy rations. However,measurement of kinetic parameters, especiallyfor fiber, may be sensitive to experimentalconditions because differences during earlyfermentation (< 24 h) have a great impact onfractional digestion rates. Thus, factors whichcause little difference in 48 h digestion of drymatter may have much greater impact onmeasurement of kinetic parameters. If digestionkinetics are to be used for feed evaluation andration formulation, techniques must beestablished that give accurate and preciseparameters. The objective of this project was toevaluate the effects of the animal donor and itsdiet on the measurement of digestion kinetics.This project was a part of a larger experiment toinvestigate the effects of fiber source and levelon digestion and microbial ecology in the rumen.
MethodsFour cows in midlactation were used in abalanced 4 x 4 Latin square design with afactorial arrangement of treatments (2 fibersources x 2 fiber levels). Diets containing alfalfaor corn silage, each mixed with corn, soybeanmeal, and minerals to obtain rations with 24 or32% amylase-treated NDF (aNDF), were fedtwice daily during the four-week periods. Afterthree weeks, ruminal contents were collectedfrom each cow, blended with chilled buffer todetach bacteria, and used to inoculate flaskscontaining either alfalfa or corn silage. The invitro method of Goering and Van Soest (1970)was modified so fermentations were terminatedafter 0, 3, 5, 9, 15, 24, 30, 36, 48, 72, or 96 h.During the last week of each period, the averagepH at 3 h post-feeding was also determined foreach cow. At the end of the fourth week, asecond in vitro trial was conducted with the pHof the in vitro system adjusted to reflect the pH
of the donor animal. Kinetic parameters weredetermined for a single first-order model withdiscrete lag time using nonlinear regression.
DiscussionRuminal pH differed among donors and diets.Cow 2661 had an exceptionally low pHthroughout the experiment with an averageprefeeding pH of only 5.8. Averaged across allcows, the lowest prefeeding pH of 5.78 and 6.14were associated with alfalfa (AS24) and cornsilage (CS24) diets, respectively, containing 24%aNDF. Alfalfa (AS32) and corn silage (CS32)rations containing 32% aNDF resulted inprefeeding pH of 6.07 and 6.30, respectively.Post-feeding ruminal pH was lowest for CS24and highest for AS32 (Table 1). Average pH forthe standard in vitro method was between 6.46and 6.56. Average pH of the in vitro trials inwhich pH was adjusted to match that of theinocula donor was 5.89, 5.76, 5.61, and 5.54 fordiets AS32, AS24, CS32, and CS24,respectively, which were within about 0.1 of thepost-feeding pH associated with these diets(Table 1).
Digestion kinetics differed between foragesources and between in vitro system pH. Inaddition, both cow donor and its diet affecteddigestion kinetics. In general, potentiallydigestible aNDF decreased, fractional rate offiber digestion decreased, and indigestible aNDFincreased as the ruminal pH of the donor cow ordiet decreased (Table 1). The observation thatindigestible fiber is not constant across inoculaindicates that this kinetic parameter is not simplyan intrinsic property of the fiber, but is the resultof the interaction between cell wall propertiesand the microbial population available forfermentation. Associated research in the largerexperiment will attempt to define the microbialpopulations associated with each inocula.

1996 Research Summaries 103
ConclusionsDigestion kinetics are a function of the intrinsicproperties of feeds and the microbial populationthat ferments them. Differences between cowsand their diets affected the digestion kinetics ofalfalfa and corn silage, and the differencesseemed to be associated with ruminal pH. Ourresults suggest that ruminal pH may play acentral role in microbial ecology of the rumenand indicate that accurate modeling of ruminalpH must be a component of any dynamic modelof ruminal fermentation using digestion kineticparameters.
ReferenceGoering, H.K. and P.J. Van Soest. 1970. Forage fiberanalyses. USDA Handbook No 379. pp 20.
Table 1. Differences in ruminal pH anddigestion kinetics associated with donor anddiet of the inocula. Data are averaged acrossforage source, in vitro pH, and period (n = 16).
Effects of Effects ofinocula donor inocula diet
Post-feeding ruminal pH749 5.69a AS32 5.78a
3691 5.67a AS24 5.52b
3807 5.60a CS32 5.53b
2661 5.23b CS24 5.37c
Potentially digestible aNDF (% of DM)749 20.1a AS32 21.3a
3691 18.9ab AS24 19.2b
3807 18.5ab CS32 17.8bc
2661 18.0b CS24 17.2c
Fractional rate of digestion (/h)3691 0.059a AS32 0.060749 0.056ab AS24 0.052
3807 0.054ab CS32 0.0522661 0.044b CS24 0.048
Indigestible aNDF (% of DM)749 19.4a AS32 18.5a
3691 20.4ab AS24 20.3b
3807 20.7ab CS32 21.2bc
2661 21.7b CS24 22.2c
Discrete lag time (h)749 3.21 AS32 3.55
3691 3.60 AS24 2.993807 3.40 CS32 4.212661 3.31 CS24 2.76a,b,cValues with different subscripts within agroup are different at P <.05.

104 U.S. Dairy Forage Research Center
Feed Utilization by Cattle
Comparing Systems of Ration Formulation for Dairy CowsD.R. Mertens
IntroductionSeveral systems are being used to estimaterequirements, describe feed nutritive value, andformulate rations for dairy cows. Although thesesystems have a common objective, the approach,complexity, and relative importance of feed andanimal attributes differ. Some aspects of thesesystems have been compared, such as method ofdefining energy requirements and feed values orspecific aspects of protein utilization (microbialyield, fraction of microbes resulting in absorbedamino acids, digestibility of feed and microbialprotein, etc.). However, no attempt has beenmade to compare systems in total to determine ifthey obtain similar rations when using the samefeed ingredients for cows with the samecharacteristics.
MethodsFour systems were compared: National ResearchCouncil using absorbed protein (NRC, 1989);Net Carbohydrate-Protein System (NCPS,Sniffen et al., 1992); Institut National de laRecherche Agronomique (INRA, Jarrige, 1989);and NDF-Energy Intake/Absorbed Protein (NDF/AP, Mertens, 1992, Mertens and Dado, 1993).Using each system, rations were formulated fortwo multiparous cows (66 months of age), butonly the data for the cow in the 10th week oflactation with a body condition score of 3.0,weighing 630 kg, losing .02 kg of weight perday, and producing 43 kg of milk per daycontaining 3.48% fat and 2.97% protein arepresented.
For each cow and system, four rations wereformulated using grass hay or alfalfa, corn, orgrass silages as the sole forage. Forages wereselected for each system that had similar
chemical composition. Ground corn, soybeanmeal (44%CP), and minerals (salt, calciumcarbonate, and monosodium phosphate) were theprimary concentrates, but fish meal (lowdegradable protein source), urea (high solubilitynitrogen source), animal fat (energy source), andcottonseed hulls (fiber source) were included aspotential supplements to meet the requirementsof some systems.
Solutions to the NRC and NDF/AP systems wereobtained using linear programming withminimum ration cost as the objective function.Forages were given a cost of zero so that theamount of forage in the ration would bemaximized. The INRAtion program, which alsomaximizes forage in the ration, was used toformulate rations using the INRA system. TheNCPS is a ration evaluator, not a formulator. Aniterative process was used to formulate rationsusing version 2.12D (06JUL95) software fromthe University of Pennsylvania with the feedlibrary that was provided. First, each forage wasincluded in the ration as the sole ingredient; thencorn and soybean meal were substituted forforage until energy and metabolizable proteinrequirements were met and intake matchedNCPS recommended amounts. Finally, minimalamounts of supplements were substituted forcorn or soybean meal to meet the ammonia andpeptide requirements of ruminalmicroorganisms.
DiscussionThe NRC system predicted the lowest intakeand, although net energy of lactation (NE
L)requirements were lower than other systems, theaverage energy density of the rationrecommended by this system was high and
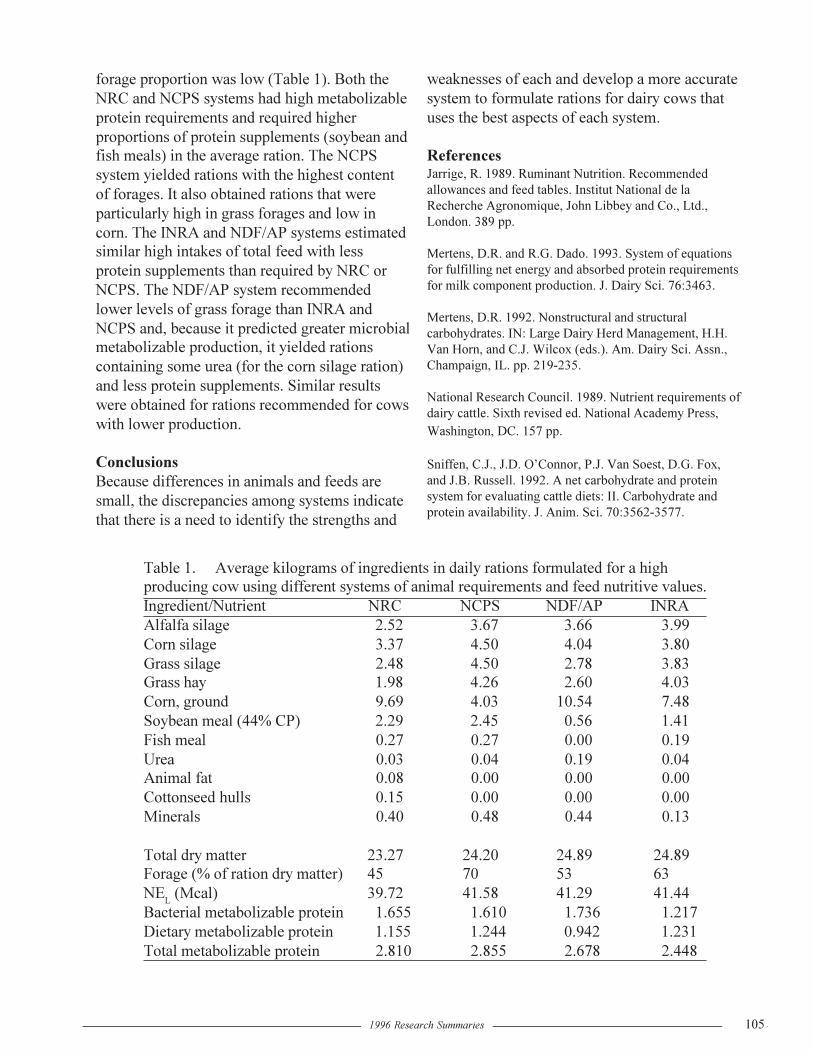
1996 Research Summaries 105
forage proportion was low (Table 1). Both theNRC and NCPS systems had high metabolizableprotein requirements and required higherproportions of protein supplements (soybean andfish meals) in the average ration. The NCPSsystem yielded rations with the highest contentof forages. It also obtained rations that wereparticularly high in grass forages and low incorn. The INRA and NDF/AP systems estimatedsimilar high intakes of total feed with lessprotein supplements than required by NRC orNCPS. The NDF/AP system recommendedlower levels of grass forage than INRA andNCPS and, because it predicted greater microbialmetabolizable production, it yielded rationscontaining some urea (for the corn silage ration)and less protein supplements. Similar resultswere obtained for rations recommended for cowswith lower production.
ConclusionsBecause differences in animals and feeds aresmall, the discrepancies among systems indicatethat there is a need to identify the strengths and
weaknesses of each and develop a more accuratesystem to formulate rations for dairy cows thatuses the best aspects of each system.
ReferencesJarrige, R. 1989. Ruminant Nutrition. Recommendedallowances and feed tables. Institut National de laRecherche Agronomique, John Libbey and Co., Ltd.,London. 389 pp.
Mertens, D.R. and R.G. Dado. 1993. System of equationsfor fulfilling net energy and absorbed protein requirementsfor milk component production. J. Dairy Sci. 76:3463.
Mertens, D.R. 1992. Nonstructural and structuralcarbohydrates. IN: Large Dairy Herd Management, H.H.Van Horn, and C.J. Wilcox (eds.). Am. Dairy Sci. Assn.,Champaign, IL. pp. 219-235.
National Research Council. 1989. Nutrient requirements ofdairy cattle. Sixth revised ed. National Academy Press,Washington, DC. 157 pp.
Sniffen, C.J., J.D. O�Connor, P.J. Van Soest, D.G. Fox,and J.B. Russell. 1992. A net carbohydrate and proteinsystem for evaluating cattle diets: II. Carbohydrate andprotein availability. J. Anim. Sci. 70:3562-3577.
Table 1. Average kilograms of ingredients in daily rations formulated for a highproducing cow using different systems of animal requirements and feed nutritive values.Ingredient/Nutrient NRC NCPS NDF/AP INRAAlfalfa silage 2.52 3.67 3.66 3.99Corn silage 3.37 4.50 4.04 3.80Grass silage 2.48 4.50 2.78 3.83Grass hay 1.98 4.26 2.60 4.03Corn, ground 9.69 4.03 10.54 7.48Soybean meal (44% CP) 2.29 2.45 0.56 1.41Fish meal 0.27 0.27 0.00 0.19Urea 0.03 0.04 0.19 0.04Animal fat 0.08 0.00 0.00 0.00Cottonseed hulls 0.15 0.00 0.00 0.00Minerals 0.40 0.48 0.44 0.13
Total dry matter 23.27 24.20 24.89 24.89Forage (% of ration dry matter) 45 70 53 63NEL (Mcal) 39.72 41.58 41.29 41.44Bacterial metabolizable protein 1.655 1.610 1.736 1.217Dietary metabolizable protein 1.155 1.244 0.942 1.231Total metabolizable protein 2.810 2.855 2.678 2.448

106 U.S. Dairy Forage Research Center
Alfalfa Silage Versus Red Clover Silage or a Mixture of Alfalfa and Red CloverSilage as the Sole Forage for Lactating Dairy CowsG.A. Broderick and S. Maignan
IntroductionThe large proportion of CP in alfalfa silage (AS)that is present as NPN substantially reduces theefficiency of protein utilization by lactating dairycows (Nagel and Broderick, 1992). Red cloversilage (RCS) typically has a much lower contentof NPN than AS (Albrecht and Muck, 1991). Ina previous feeding study (Broderick andSterrenburg, 1996 USDFRC Res. Sum.), wefound that DMI and milk yield were greater onAS than on RCS, but this result was confoundedby the fact that the CP content of the AS wasseven percentage units greater than that of theRCS. Therefore, we repeated the comparison ofAS versus RCS as the only forage for lactatingcows, but with added solvent soybean meal(SBM) to equalize dietary CP content. Also, athird diet containing silage harvested from a co-culture of alfalfa and red clover (AS + RCS) wasincluded in this trial. No supplemental bypassprotein was used in this study. Our objective wasto compare the lactational performance of cowsfed AS, RCS or AS + RCS as their sole source ofdietary forage.
Materials and MethodsA replicated 3 x 3 Latin square lactation trial wasconducted. First cutting red clover was wilted toabout 40% DM, chopped and ensiled in aconcrete stave silo. Second cutting alfalfa waswilted to about 50% DM, chopped and ensiled inan upright tower silo. A mixture of alfalfa andred clover planted together, also from firstcutting, was wilted to about 50% DM, thenchopped and ensiled in a concrete stave silo.Based on the CP contents of initial samples ofeach silage obtained when the silos were opened,three diets were formulated with equal NEL
containing 60% DM from one of the forages, 32or 36% DM from (unground) high moisture corn,plus sufficient SBM to give about 16.5% CP(Table 1). Twenty-one multiparous cows(including three with ruminal cannulae),
averaging 65 DIM, were blocked into sevengroups of three cows by DIM and randomlyassigned to diets in replicated 3 x 3 Latinsquares. Diets were fed for 4-wk periods beforeswitching to the next diet (total 12 wk);production and intake data were analyzed fromthe third and fourth wk of each period. Apparentdigestibility of DM and NDF was estimated fromfecal grab samples using indigestible ADF as aninternal marker. Ruminal sampling was done onthe last day of each period.
Results and DiscussionThe CP contents of the silages changed throughthe course of the trial � the AS declined and theRCS increased from the CP levels used toformulate the diets. Thus, the AS diet is slightlylower, and the RCS diet slightly higher, than thetarget of 16.5% CP; the AS + RCS dietcontained very nearly the desired level of CP(Table 1). The relative CP levels of the AS andthe RCS were similar to what was observedpreviously, when we found that RCS was about1 to 2 percentage units lower in CP than AS. Asexpected, RCS had lower NPN: RCS was 19%and AS + RCS was 23% lower in NPN than theAS. The RCS and AS + RCS were, respectively,2.3 and 4.2 percentage units lower in NDF thanthe AS (Table 1). Based on its chemicalcomposition, AS + RCS was more like RCS thanAS. Intake of DM was lower on the RCS and AS+ RCS diets than on the AS diet, but apparentdigestibilities of DM and NDF (estimated usingindigestible ADF as internal marker) were higher(Table 2). Using these data, intakes of digestibleDM were computed to be 14.4, 14.8 and 16.4 kg/d on the diets containing, respectively, AS, RCSand AS + RCS. There were no differences inmilk composition or in production of milk andmilk components among the three diets (Table2). However, the similar milk yields at lowerDMI resulted in significantly higher efficiencies(milk : DMI) on the RCS and AS + RCS diets.

1996 Research Summaries 107
Although milk urea and ruminal ammonia werenot different among the three diets,concentrations of blood urea tended to be loweron the RCS and AS + RCS diets (Table 2),despite their higher levels of CP. This suggestedthat efficiency of utilization of CP was greater onthe two diets containing RCS.
Summary and ConclusionResults from this trial indicated that, althoughDMI was lower on diets containing RCS or AS +RCS as the sole forage, DM and fiberdigestibility were greater and yield of milk andmilk components was similar in cows producingabout 33 kg of milk/d. Milk production per unit
DMI was higher, and blood urea was depressed,suggesting that energy and CP utilization weremore efficient on diets containing RCS or AS +RCS than on diets containing AS. These resultssuggest that the energy and protein in RCS maybe used more efficiently than in AS.
ReferencesAlbrecht, K. A. and R. E. Muck. 1991. Proteolysis inensiled forage legumes that vary in tannin concentration.Crop Sci. 31: 464-469.
Nagel, S. A. and G. A. Broderick. 1992. Effect of formicacid or formaldehyde treatment of alfalfa silage on nutrientutilization by dairy cows. J. Dairy Sci. 75:140-154.
Table 1. Composition of forages and diets1. Forage
Item AS RCS AS + RCSDM, % 52.0 35.8 49.0CP, % of DM 19.1 17.9 17.4NPN, % of total N 50.0 40.3 38.7NDF, % of DM 46.2 43.9 42.0ADF, % of DM 36.2 33.6 31.9
DietItem AS RCS AS + RCS
- - - - - - - - - % of DM - - - - - - - - -Alfalfa silage 60.0 . . . . . .Red clover silage . . . 60.0 . . .Alfalfa + red clover silage. . . . . . 60.0HMC 36.2 32.3 32.3Soybean meal 2.7 6.6 6.6Minerals & vitamins 1.1 1.1 1.1Chemical composition
CP 16.0 16.8 16.4NDF 33 32 31NEL , Mcal/kg DM 1.59 1.59 1.59
1AS = alfalfa silage, RCS = red clover silage, AS + RCS =alfalfa plus red clover silage (grown together), HMC = highmoisture corn (unground).

108 U.S. Dairy Forage Research Center
Table 2. Effect of feeding forage as alfalfa silage (AS), red clover silage (RCS) or a mixture ofAS and RCS (grown together) on DMI, BW gain, apparent DM and NDF digestibility, productionof milk and milk components, and concentrations of blood glucose, blood and milk urea, andruminal pH and ammonia.Item AS RCS AS + RCS SEM1 P > F2
DMI, kg/d 25.5a 23.0b 24.2b 0.4 0.011BW change, kg/d 0.38 0.03 0.29 0.15 0.294DM digestibility, % 56.3c 64.1b 67.6a 0.9 < 0.001NDF digestibility, % 42.7b 49.9a 51.3a 0.5 < 0.001
Milk yield, kg/d 32.0 32.7 33.6 0.6 0.742Fat, % 3.36 3.42 3.59 0.13 0.648Fat, kg/d 1.08 1.12 1.21 0.04 0.817Protein, % 3.04 3.02 3.03 0.02 0.284Protein, kg/d 0.98 0.99 1.02 0.02 0.729Lactose, % 4.77 4.81 4.81 0.03 0.859Lactose, kg/d 1.54 1.58 1.63 0.03 0.820SNF, % 8.52 8.55 8.56 0.03 0.514SNF, kg/d 2.75 2.81 2.90 0.06 0.753Efficiency3 1.27b 1.43a 1.40a 0.04 0.049
Blood glucose, mg/dL 55.0 55.9 54.5 0.5 0.086Blood urea, mg N/dL 13.13a 12.89ab 12.40a 0.39 0.052Milk urea, mg N/dL 9.92 10.46 9.60 0.40 0.292
Ruminal pH 6.15 6.05 6.15 0.05 0.232Ruminal ammonia, mM 9.30 8.56 6.94 0.95 0.218a,b,cMeans within the same row without a common superscript differ (P < 0.05).1SEM = Standard error of the mean.2Probability of a significant effect of diet.3Milk yield : DMI.

1996 Research Summaries 109
A Statistical Evaluation of Animal and Nutritional Factors InfluencingConcentrations of Milk Urea NitrogenG.A. Broderick and M.K. Clayton
IntroductionUrea is the primary form in which N is excretedin mammals, and elevated concentrations ofblood urea N (BUN) are known to reflectinefficient utilization of dietary CP. Ureaequilibrates rapidly throughout body fluids,including milk, and concentrations of milk ureaN (MUN) are closely related to BUN(Gustafsson and Palmquist, 1993). Therefore,MUN can serve as an easily sampled indicator ofBUN. Last year, we reported on relationships,obtained by analyzing mean data from 22feeding trials, of a number of dietary and milkyield factors to MUN concentration. Since thatreport, we have performed a more completeanalysis using observations for individual cowsrather than mean data. Also, data were addedfrom 28 more diets fed in 13 additional trials.Our objective was to conduct a statisticalevaluation on this data set to quantify: 1) theeffect of various animal and dietary factors onthe relationship between MUN and BUN, and 2)the value of MUN for assessing protein status ofthe lactating cow.
Materials and MethodsData were collected in 35 conventional lactationtrials conducted with 482 Holstein cows ofknown parity, BW and DIM and fed 106different diets; intakes of DM, CP and estimatedNE
L, change of BW, BUN concentrations, andproduction of milk, fat, protein and lactose wasdetermined. A total of 2231 measurements ofMUN and BUN was made during these studies.In 20 trials, ruminal NH3 was measured in 50cannulated cows fed 69 diets. In one trial, totalurinary urea N concentration and excretion weredetermined and compared to MUN in AM andPM milk. Concentrations of MUN and BUNwere determined in these trials using a diacetylmonoxime colorimetric assay adapted to theTechnicon AutoAnalyzer. Linear and mixed
effects regression models in SAS were used tostudy the relationship of: 1) BUN to plasma ureaN (PUN); 2) MUN to BUN; and 3) MUN tovarious quantities. The number of samplesnecessary to determine mean MUNconcentration within 95% confidence intervals of1.0 and 2.0 mg N/dL also was estimated. Datafrom 27 trials already are published in ninepapers, two manuscripts in press, one abstract,and one thesis; data from eight trials areunpublished.
Results and DiscussionRegression of data from two trials yielded astrong relationship of BUN to PUN (r2 = 0.952)with slope not different from 1.0 and interceptnot different from 0. Thus, BUN and PUN arevirtually the same, and the term BUN can beused to describe urea concentration in both totalblood and deproteinized blood plasma. Theoverall, mixed effects model for regression ofMUN on BUN using all the data (Fig.1)indicated a strong correlation (R2 = 0.842).Although the magnitude of slopes (0.62 versus0.60) and intercepts (4.8 versus 5.1) was similarfor the mixed effects model and a simple linearregression model, linear regression of MUN onBUN was not as well correlated (R2 = 0.588).This is because the mixed effects modelaccounted for a significant cow-by-BUNinteraction, whereby each cow had its own slopefor MUN on BUN. It was expected that MUNand BUN would be highly correlated (Rook andThomas, 1985). In our trials, only a single bloodsample was taken from each cow 4 h afterfeeding. Gustafsson and Palmquist (1993)observed that urea in blood serum peaked about3 h after feeding; therefore, BUN concentrationslikely were near maximum at blood samplingtime in our trials. This may explain the slope of0.62 from our regression of MUN on BUN(Fig.1).

110 U.S. Dairy Forage Research Center
Single factors that yielded significant regressionson MUN concentrations using the mixed effectsmodels were: dietary CP concentration[expressed either per unit DM (R2 = 0.839) orper unit NEL (R2 = 0.833)], excess N intake (R2 =0.772), N-efficiency (R2 = 0.626), and ruminalNH3 (R
2 = 0.574). Urea in body fluids includingmilk probably reflects N inefficiency due to bothexcess protein degradation in the rumen andexcess amino acid supply to the tissues. Thismay explain why MUN was better correlated todietary CP content than to ruminal NH3. Whenall factors were analyzed at once with the mixedeffects model, 12 made significant (P < 0.10)contributions (Table 1): BUN, BW, FCM yield,dietary CP content, excess N intake, DMI, andDIM were positively related to MUN; parity,milk and fat yield, dietary CP/NEL content, andNEL intake were negatively related to MUN.Protein and SNF yield, dietary NDF and NEL
content, DM- and N-efficiency, and CP intakewere not significant in the model. Thus, MUNconcentrations will be influenced by multipleanimal and dietary characteristics.
On the farm, milk often is sampled for DHIanalysis at only one of the daily milkings. In twotrials, we determined MUN in both AM and PMmilk samples. Over both trials, BUN was
associated more strongly to MUN in AM milk(R2 = 0.686) than to MUN in PM milk (R2 =0.526); the two regressions had different slopes(P <0.02) and intercepts (P <0.0001). Asexpected, regression of mean MUNconcentration on BUN explained more of thevariation (R2 = 0.737) in BUN than did MUN ineither AM or PM milk. In one of these two trials,total urine collection and urinary urea N analyseswere made for the 12-h periods corresponding toMUN in AM and PM milk (Table 2). Urinevolume excreted during the 12-h preceding theAM milking was greater than that for the 12-hpreceding the PM milking; the reverse was truefor milk yield. Urinary urea N and MUNfollowed similar patterns in that concentrationsof both were higher in PM than in AMsecretions. As expected, urinary ureaconcentration greatly exceeded MUN: urea Nwas 38 and 32 times more concentrated in AMand PM urine than in AM and PM milk. Gondaand Lindberg (1994) found that urinary ureaconcentration averaged 39 times greater thanMUN. Lower MUN concentrations in AM thanPM milk resulted in lower amounts andproportions of total urea excretion in AM (1.8%)than in PM (3.3%) milk (Table 2). These dataclearly indicated that MUN concentrationpatterns were not symmetrical over the two
7
14
21
28
7 14 21 28 35
BUN Concentration, mg N/dL
2.5
5.0
7.5
10.0
MUN = 0.620 x BUN + 4.75 2 = 0.842)
Figure 1. Regression of milk urea N (MUN) concentration on blood urea N (BUN) concentrationsusing all 2231 observations in the mixed effects model.

1996 Research Summaries 111
halves of the day and imply that switching milksampling back and forth between AM to PMmilkings is not appropriate. Composite milksamples representing the 24-h day will improveMUN reliability.
The numbers of cows fed a specific diet thatmust be sampled to determine the mean MUNconcentration on that diet, within 95%confidence intervals of 1.0 or 2.0 mg N/dL, wereestimated to be 16.5 and 4.1, respectively. Thisinformation may be used to developrecommendations for sampling milk for MUNanalysis. Although the added precision gained bysampling 16 cows may not be necessary, ourwithin-diet variation in MUN indicated thatsampling milk from at least four cows would bethe minimum needed to estimate MUN on agiven diet. Milk samples representing the 24-hday will substantially improve reliability ofMUN data. Switching sampling among AM toPM milkings, and presumably among morefrequent 3X or 4X milkings, will confoundinterpretation of MUN data. Generally, samplingbulk tank milk probably would have little valueunless used in conjunction with a dietary changethat affected all the cows contributing milk to thetank. For example, if a lower protein alfalfasilage were replaced with one higher in proteinsuch that dietary CP increased from 17 to 18%CP, the increase in MUN should be predictable.Rearranging the equation relating dietary CP% toMUN yields: MUN = (%CP - 13.7) / 0.269,increasing dietary CP by 1 percentage unit, willincrease MUN by 3.7 mg N/dL in bulk tankmilk.
SummaryStatistical analyses using both linear regressionand mixed effects models were conducted on alarge set of MUN data obtained in feedingstudies with lactating dairy cows. Concentrationsof BUN and MUN were found to be highlycorrelated. Level of MUN was more closelyrelated to dietary CP concentration, expressedeither on a DM or energy basis, than to Nefficiency or ruminal NH
3. When all factors were
analyzed at once with a mixed effects model,BUN, BW, FCM yield, dietary CP content,excess N intake, DMI, and DIM were positivelyrelated to MUN in the model; parity, milk and fatyield, dietary CP/NEL content, and NEL intakewere negatively related to MUN in the model;protein and SNF yield, dietary NDF and NEL
content, DM and N efficiency, and CP intakewere not significant in the model. In two trials,different relationships were found between BUNand MUN when assessed from MUN in eitherAM or PM milk collected in our twice dailymilking scheme; BUN was more highlycorrelated to mean daily MUN concentration.Daily composite milk samples from 4 cowsshould be analyzed to estimate mean MUNconcentration within a 95% confidence intervalof +/- 2 mg N/dL.
ReferencesGonda, H. L. and J.-E. Lindberg. 1994. Evaluation ofdietary nitrogen utilization in dairy cows based on ureaconcentrations in blood, urine and milk, and on urinaryconcentration of purine derivatives. Acta Agric. Scand.,Sect. A 44:236-245.
Gustafsson, A. H. and D. L. Palmquist. 1993. Diurnalvariation of rumen ammonia, serum urea, and milk urea indairy cows at high and low yields. J. Dairy Sci. 76:475-484.
National Research Council. 1989. Nutrient Requirementsof Dairy Cattle. 6th rev. ed. Update. Natl. Acad. Press,Washington, DC.
Rook, J.A.F. and P. C. Thomas. 1985. Milk secretion andits nutritional regulation. Ch. 8 in Nutritional Physiology ofFarm Animals (J.A.F. Rook and P. C. Thomas, eds.).Longman Group, Limited, London.

112 U.S. Dairy Forage Research Center
Table 1. Parameters making significant contributions to the regression of milk urea N(MUN) on using the multiple factor, mixed effects model.1 Denominator df = 1249; R2 =0.875.4
Parameter or factor2 Estimated coefficient SE t P3
MUN (mg N/dL) =Intercept - 4.713 1.897 - 2.48 0.013BUN (mg N/dL) 0.484 0.013 37.05 < 0.001Parity - 0.175 0.045 - 3.90 < 0.001Body weight (kg) 0.003 0.001 2.55 0.011Milk yield (kg/d) - 0.101 0.028 - 3.63 < 0.0013.5% FCM yield (kg/d) 0.187 0.053 3.52 < 0.001Fat yield (kg/d) - 1.802 0.940 - 1.92 0.056CP (% of DM) 0.843 0.089 9.51 < 0.001CP/NEL (g/Mcal) - 0.059 0.019 - 3.18 < 0.001Excess N intake (g N/d) 0.007 0.003 2.59 0.010DMI (kg/d) 0.103 0.055 1.88 0.061NEL intake (kg/d) - 0.133 0.053 - 2.48 0.013DIM 0.003 0.001 1.93 0.054
1BUN = Blood urea N; CP/NEL = dietary CP/NEL, where NEL was computed from NRC(1989) tables; NEL = NEL intake computed from NRC (1989) tables; excess N intake =total N intake - milk N secretion.2There were 2226 observations for each factor used in this model. Ruminal NH3 wasomitted from this model because of too few observations.3Student�s t and its associated P-value.4Coefficient of determination determined for the mixed effects model.
Table 2. Concentration and excretion of urea N in urine and milk over 12-hperiods ending at 4:00 AM and 4:00 PM.1
12-h Period ending atItem 4:00 AM 4:00 PM SEM2
Urine volume, L/12 h 20.4 14.7 0.4UUN, mg N/dL 460.1 510.5 15.0Urinary urea, g N/12 h 92.5 73.4 2.6Milk volume, L/12 h 13.5 15.1 0.3MUN, mg N/dL 12.0 16.0 0.37Milk urea, g N/12 h 1.60 2.41 0.07Total urea, g N/12 h 94.1 75.8 2.6Milk urea/total urea, % 1.78 3.29 0.171UUN = Urinary urea N; MUN = milk urea N; SEM = standard error of the mean.2Each AM versus PM comparison was significantly different (P < 0.001).

1996 Research Summaries 113
Effect of Replacing Alfalfa Silage with Red Clover Silage in the Diets ofLactating Dairy CowsG.A. Broderick and E. Sterrenburg
IntroductionAlfalfa silage (AS) is the forage most commonlyfed to dairy cows in the Midwest U.S. However,during ensiling as much as 60% of its CP can beconverted to NPN. This formation of NPN in thesilo substantially reduces efficiency of utilizationof the CP in alfalfa silage (Nagel and Broderick,1992). Red clover silage has been found tocontain significantly less NPN (Albrecht andMuck, 1991). An enzyme system in red clover,polyphenol oxidase, converts several phenolsthat are also present in red clover into quinones(Jones et al., 1995); these quinones react rapidlywith proteases, the enzymes that break downproteins in the silo. Thus, red clover silage(RCS) contains substantially less NPN than AS.The objective of this trial was to compare theprotein value of AS and RCS when fed as thesole source of dietary forage to lactating dairycows. Yields of milk and milk components wereused as the indicator of the dietary protein status.Also, the forage serving as the better proteinsource should give rise to a smaller response inyield of milk and milk components withsupplementation of bypass protein (from fishmeal).
Materials and MethodsA replicated 4 x 4 Latin square lactation trial wasconducted to compare the production of lactatingcows fed either AS or RCS. Red clover silagewas wilted to about 40% DM from two cuttingstaken on 6/16/94 (first cutting) and 7/29/94(second cutting) and ensiled in a concrete stavesilo. Alfalfa silage was harvested from twocuttings taken on 8/30/94 (fourth cutting) and on9/1/94 (third cutting) and ensiled in anotherconcrete stave silo. Samples of both forages werecollected as fed during the trial and analyzed forcomposition (Table 1). Four diets were fed(Table 1): two that contained 60% DM fromeither AS or RCS plus 36% DM from ground (3/
8″ screen) high moisture corn (HMC), and twothat contained the same basic ingredients except3% ruminant grade fish meal (Sea-Lac) wassubstituted for some of the HMC. The only otherdifference in these diets was the source offorage; no attempt was made to equalize CP ofthe diets fed in this trial. Twenty-four cows (16multiparous and 8 primiparous cows) averaging59 DIM were blocked into six groups of fourcows each by parity and DIM and randomlyassigned to diets in balanced 4 x 4 Latin squares.Diets were fed for 3-wk periods (total 12 wk)before switching; production and intake datawere analyzed from the second and third wk ofeach period. Four additional cows that were laterin lactation and equipped with permanentruminal cannulae were also used in a single 4 x 4Latin square for ruminal sampling on the last dayof each period.
Results and DiscussionThe CP content of the two AS fed in this trialaveraged 7.1 percentage units more CP than thetwo RCS; as a result, the RCS diets contained4.2 percentage units less CP (Table 1). The twoforages contained similar levels of NDF andADF. In two previous trials, RCS was only 1.5percentage units lower in CP than AS judged tobe of �equal� maturity (i.e., about equal NDFcontent). As expected, RCS had substantiallyless NPN�only about 60% of that of AS (Table1). Intake of DM was 1.5 kg/d lower on the twoRCS diets and was not influenced by fish mealfeeding (Table 2). Without fish mealsupplementation, milk production was 1.5 kg/dgreater on AS than on RCS, but there were nodifferences between these two diets inproduction of fat, protein, lactose and SNF(Table 2). Fish meal feeding resulted in similarincreases in yield of milk, protein, lactose andSNF on both the AS and RCS diets; protein yieldwas increased on both diets by 70 g/day (Table

114 U.S. Dairy Forage Research Center
2). Previously, fish meal supplementation of ASwas observed to increase protein yield by 100 g/d(Broderick, 1995). Interestingly, efficiency (milk: DMI) was greater on RCS than on AS; addingfish meal to the diet removed this difference inefficiency between RCS and AS. This suggeststhat, although diets were formulated to be equalin NEL, the availability of energy in RCS wasgreater than that in AS. Reduced blood and milkurea and ruminal ammonia on RCS wereconfounded by the much lower CP on the RCSdiets (Table 2). A surprising finding was theelevated blood glucose on RCS which may berelated to the significantly lower levels of milkfat on that forage (Table 2).
Summary and ConclusionResults from this trial indicated that both DMIand milk yield were lower on RCS than on AS,but there were no differences in yield of milkcomponents on these two forages. Themagnitude of the response in milk andcomponent yields to supplemental bypass protein
(from fish meal) were similar for both AS andRCS, suggesting that protein status of the cowswas similarly limiting on both forages. Greaterproduction efficiency and slightly elevated bloodglucose suggest availability of energy in RCSmay be greater than that in AS. Dietary proteinlevels should be more nearly equal in futureexperiments designed to compare the nutritionalvalue of these two forages.
ReferencesAlbrecht, K. A. and R. E. Muck. 1991. Proteolysis inensiled forage legumes that vary in tannin concentration.Crop Sci. 31: 464-469.
Broderick, G. A. 1995. Performance of lactating dairycows fed either alfalfa silage or alfalfa hay as the soleforage. J. Dairy Sci. 78:320-329.
Jones, B. A., R. E. Muck and R. D. Hatfield. 1995. Redclover extracts inhibit legume proteolysis. J. Sci. FoodAgric. 67:329-333.
Nagel, S. A. and G. A. Broderick. 1992. Effect of formicacid or formaldehyde treatment of alfalfa silage on nutrientutilization by dairy cows. J. Dairy Sci. 75:140-154.C = high moisture corn.
Table 1. Composition of forages and diets1.Forage
Item AS RCSDM, % 36.1 42.0CP, % of DM 23.1 16.0NPN, % of total N 49.2 30.6NDF, % of DM 43.3 44.7ADF, % of DM 33.2 31.0
DietsItem AS RCS AS + FM RCS + FM
% of DMAlfalfa silage 60.3 . . . 60.3 . . .Red clover silage . . . 59.9 . . . 59.9Ground HMC 36.2 36.6 33.2 33.6Soybean meal 2.4 2.5 2.4 2.5Fish meal . . . . . . 3.0 3.0Minerals & vitamins 1.1 1.1 1.1 1.1Chemical composition
CP 18.4 14.1 20.2 16.0NDF 32 32 32 32NEL , Mcal/kg DM 1.59 1.57 1.58 1.57
1AS = alfalfa silage, RCS = red clover silage, FM = fish meal, HMC = high moisture corn.
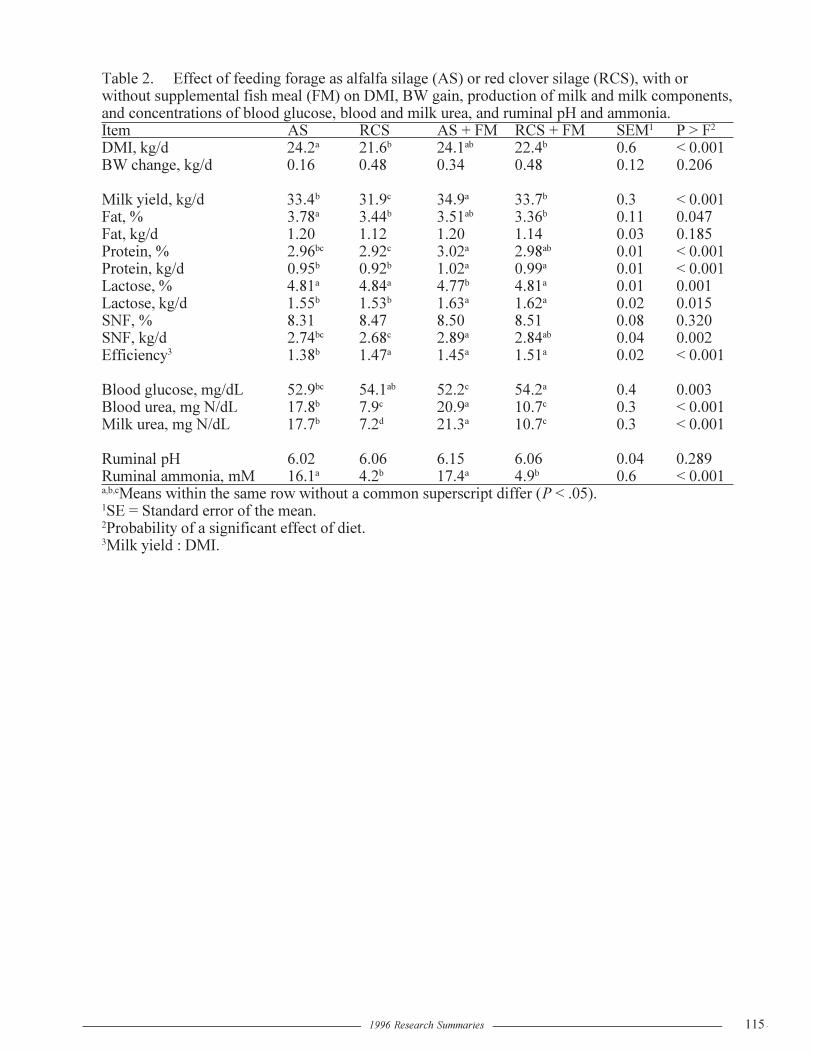
1996 Research Summaries 115
Table 2. Effect of feeding forage as alfalfa silage (AS) or red clover silage (RCS), with orwithout supplemental fish meal (FM) on DMI, BW gain, production of milk and milk components,and concentrations of blood glucose, blood and milk urea, and ruminal pH and ammonia.Item AS RCS AS + FM RCS + FM SEM1 P > F2
DMI, kg/d 24.2a 21.6b 24.1ab 22.4b 0.6 < 0.001BW change, kg/d 0.16 0.48 0.34 0.48 0.12 0.206
Milk yield, kg/d 33.4b 31.9c 34.9a 33.7b 0.3 < 0.001Fat, % 3.78a 3.44b 3.51ab 3.36b 0.11 0.047Fat, kg/d 1.20 1.12 1.20 1.14 0.03 0.185Protein, % 2.96bc 2.92c 3.02a 2.98ab 0.01 < 0.001Protein, kg/d 0.95b 0.92b 1.02a 0.99a 0.01 < 0.001Lactose, % 4.81a 4.84a 4.77b 4.81a 0.01 0.001Lactose, kg/d 1.55b 1.53b 1.63a 1.62a 0.02 0.015SNF, % 8.31 8.47 8.50 8.51 0.08 0.320SNF, kg/d 2.74bc 2.68c 2.89a 2.84ab 0.04 0.002Efficiency3 1.38b 1.47a 1.45a 1.51a 0.02 < 0.001
Blood glucose, mg/dL 52.9bc 54.1ab 52.2c 54.2a 0.4 0.003Blood urea, mg N/dL 17.8b 7.9c 20.9a 10.7c 0.3 < 0.001Milk urea, mg N/dL 17.7b 7.2d 21.3a 10.7c 0.3 < 0.001
Ruminal pH 6.02 6.06 6.15 6.06 0.04 0.289Ruminal ammonia, mM 16.1a 4.2b 17.4a 4.9b 0.6 < 0.001a,b,cMeans within the same row without a common superscript differ (P < .05).1SE = Standard error of the mean.2Probability of a significant effect of diet.3Milk yield : DMI.

116 U.S. Dairy Forage Research Center
Production Response to Feed Supplementation of Dairy Cows in a SeasonalCalving and Grazing SystemT.R. Dhiman, V.R. Kanneganti, R.P. Walgenbach, L.J. Massingill, M.C. Wiltbank, M.P. Russelleand L.D. Satter
IntroductionProviding supplemental feed under grazingconditions usually supports higher milkproduction. The objective of this study was tomeasure the impact of feed supplementation onmilk yield, milk composition and reproductiveperformance of Holstein dairy cows in a springcalving and grazing system.
Materials and MethodsA two-year grazing study was conducted withHolstein dairy cows at the U.S. Dairy ForageResearch Center, Prairie du Sac, WI. In 1994 and1995, 50 to 54 cows were randomly assignedbefore calving to one of three treatment groups.The three treatment groups were all pasture (P),2/3 pasture (2/3P), and 1/3 pasture (1/3P). Cowscalved between March and June each year. Cowsin P, 2/3P and 1/3P groups were fed dietscontaining forage and grain in a ratio of about100:0, 75:25 and 50:50 (% DM basis) untilpasture was ready. In 1994, alfalfa silage was thesole forage source during the pre-grazing period,whereas in 1995 alfalfa silage and corn silagewere used in a 2:1 ratio. During the grazingseason, cows were slowly changed (over a periodof 5 days) from the indoor diets to pasture. Mostof the cows (90%) were on pasture by May 16.During the grazing season, cows in P, 2/3P and1/3P groups consumed all, 2/3 and 1/3 of theirdaily feed from the pasture, respectively. Thebalance of feed for the 2/3P and 1/3P groups wassupplied by a supplement.
Ingredient composition of the supplements is inTable 1. Cows grazed permanent pasturecontaining primarily a mixture of Poa pratensisL. (Kentucky bluegrass), Elytrigia repens (L.)Nevski (quackgrass), Bromus inermis Leyss(smooth bromegrass), and Trifolium repens L.(white clover). Cows in the three treatment
groups were grazed as a single group. Pasturewas managed under an intensive rotationalgrazing system. Cows were offered a newpaddock daily after the morning milking. Theamounts of supplement fed to the 2/3P and 1/3Pgroups during 1994 were adjusted weeklyaccording to milk yield of the previous week andaveraged 5.6 and 10.5 kg/cow/d, respectively. In1995, cows were fed a constant amount ofsupplement (6.0 and 11.6 kg/cow/d for the 2/3Pand 1/3P groups, respectively) throughout thegrazing season. Supplement was fed after eachmilking. Cows grazed from May 16 to October21, 1994 and from May 16 to September 30,1995. Total grazing area varied between 30 to 50acres over the grazing season. During eachgrazing cycle, forage samples were collectedfrom three paddocks before grazing to monitorquality. Forage samples were dried and analyzedfor crude protein (CP) and fiber. After thegrazing season was over, cows were housed in afreestall barn and were fed diets containingforage to grain in ratios similar to those usedbefore grazing. Cows were synchronized forbreeding using GnRH and PGF2a. Cows weredried off on January 30, 1994 and on January 15,1995. Some cows were dried off before thesedates to give 53 days before the expected calvingdate. Daily milk yield was recorded. Milksamples were analyzed weekly for composition.
Results and DiscussionBotanical composition of the pasture clipped towithin 3 cm above the ground was (DM basis):grasses, 55%; white clover, 12%; weeds, 8%;and dead matter, 25%. Forage from the pasturecontained an average CP, 14.7% ± 3.7 SD; NDF,58.7% ± 4.0 SD and ADF, 36.8% ± 4.7 SD in1994, and CP, 19.0% ± 3.9 SD; NDF, 50.6% ±7.5 SD and ADF, 25.8% ± 4.6 SD in 1995. Thenumber of cows used in each treatment and

1996 Research Summaries 117
experimental results are summarized in Table 2.Average days in milk were 275. Total milk yieldincreased with increasing amounts ofsupplement. Cows in P, 2/3P and 1/3P treatmentgroups produced an average 17.3, 21.2 and 26.3kg of milk/d, respectively. Milk fat content wasreduced in the 1/3P treatment during 1994. Thisdecrease probably was due to the presence ofcorn silage and fine ground corn in thesupplement. During 1995, alfalfa hay was usedinstead of corn silage, and milk fat content wasnot different among treatments. Milk proteincontents were similar among treatments. Cows in
the P group had lower body condition score andmore reproductive failure than cows fedsupplement.
ConclusionProviding supplemental feed in a seasonalcalving and intensive rotational grazing systemincreased milk yield and improved thereproductive performance of dairy cows. Thehighest level of supplementation in thisexperiment would be justified with NorthAmerican feed and milk prices.
Table 2. Influence of grain supplementation on lactation performance of dairy cows in aseasonal calving/grazing system.
Treatment groups1
P 2/3P 1/3P P 2/3P 1/3PItem 1994 1995Number of cows 17 18 15 17 17 20Supplement intake, kg/d - 5.6 10.5 - 6.0 11.6Average days in milk 265 272 265 286 282 281Total milk yield, kg 4437c 5649b 6884a 5075c 6023b 7344a
Milk yield, kg/d 16.8c 20.8b 26.0a 17.7c 21.5b 26.5a
Milk fat, % 3.80a 3.63a 3.30b 3.60 3.50 3.40Milk protein, % 3.00 3.02 3.06 3.01 2.92 3.01Cows pregnant by 100d, % 41 56 53 18 41 45Cows pregnant with first two services 8 11 9 5 7 12Means in the same row with different superscripts within year differ (P < .01).1Cows consumed all (P), 2/3 (2/3P) and 1/3 (1/3P) of their daily feed from pasture. Balanceof feed for 2/3P and 1/3P groups was supplied by a supplement containing grain.
Table 1. Ingredient and chemical composition of the supplements (% DM basis).Treatment groups
2/3P 1/3P 2/3P 1/3PIngredient 1994 1995Alfalfa hay - - 50.0 25.0Corn silage 33.3 25.0 - -High moisture ear corn 30.11 42.01 28.42 48.32
Soybean meal - 3.0 - 6.0Roasted soybean 24.0 18.0 18.0 18.0Linted cottonseed 8.0 9.0 - -Sodium bicarbonate - .45 - -Minerals and vitamins 4.6 2.5 3.6 2.7Crude protein, % of DM 15.7 15.2 19.5 19.61Fine ground2Coarse ground

118 U.S. Dairy Forage Research Center
Energy Supplementation Sources for Lush PastureA. Bach, I.K. Yoon, M.D. Stern, H.G. Jung, and H. Chester-Jones
IntroductionLush, vegetative forage as found in well-managed pastures is generally high in proteincontent. The high protein concentration in lushpasture can pose a ration formulation problembecause of the high degradability of most forageproteins. Excess ammonia production fromforage protein degradation in the rumen canresult in insufficient non-ammonia nitrogen flowto the small intestine to support genetic potentialfor milk production by dairy cows. One methodto overcome this problem is to supplementgrazing cows with ruminal undegradable proteinsources. However, this solution results in wasteof forage protein, additional cost forsupplemental feed, and increased nitrogen loadon the farm. A more preferable solution wouldbe to supplement cows on lush pasture withenergy sources that maximize microbial proteinsynthesis and capture of nitrogen from rumendegraded forage protein. This experimentexamined three different supplemental energysources for microbial protein synthesis in acontinuous culture system.
Materials and MethodsForage was collected from a rotationally grazedpasture and freeze-dried. The pasture consistedof a complex mixture (approximately 50:50) oflegume and grass species. As shown in Table 1,the forage was high in protein and had moderatelevels of fiber and energy. Based on preliminaryin situ experiments, three energy supplements(corn grain, beet pulp, and soybean hulls) wereselected because they were isocaloric butdiffered in type and rate of carbohydratefermentation. Protein levels in the energysupplemented diets were similar, but lower thanfor the all forage diet. Continuous culturefermenters were fed either forage alone or forageplus energy supplement in a 55:45 forage tosupplement ratio. Fermenters were fed forageevery two hours. Energy supplements were fedtwo times per day, at 12-h intervals, to mimic a
twice-a-day milking situation wheresupplemental feed is provided after milking.Fermenter pH was allowed to fluctuate, butNaOH was used to prevent the pH from droppingbelow 6.0. The fermenters were operated in asingle-flow mode with flow rate maintained at0.07/h. Effluent was collected for determinationof feed digestibility, bacterial protein flow, andVFA and ammonia concentrations.
Results and DiscussionThe three energy supplemented diets resulted inlower average fermenter pH levels than the allforage diets (Table 2), but even the all foragediets resulted in large amounts of volatile fattyacid (VFA) production that required addition ofNaOH to maintain fermenter pH above 6.0. Cornsupplementation required the largest amount ofNaOH addition to maintain pH. The acetate topropionate (A:P) ratio of VFAs was greatest forthe all forage diet and least for the cornsupplementation, and the soybean hull dietresulted in similar A:P ratios as the all foragediet. As expected, addition of energysupplements to the forage resulted in reducedammonia concentrations in the fermenters, withthe corn and beet pulp diets causing the greatestreductions (Table 2). Because the forage basaldiet supplied most of the protein in the diets, nodifferences were detected among diets in proteindigestion. Neutral detergent fiber and cell-wallpolysaccharide digestibilities were highest forthe soybean hull diet and lowest on the corngrain diet. Non-structural carbohydratesdigestibility was greatest for the corn diet. Whileefficiency of bacterial protein synthesis based onamount of organic matter digested was the sameacross all diets, the corn and soybean hull dietsimproved the utilization efficiency of degradedfeed protein (Table 2).
Addition of energy supplements to lush pasturediets may reduce nitrogen losses from readilydegradable forage proteins by allowing more

1996 Research Summaries 119
efficient capture of degraded protein as bacterialnitrogen. A readily fermentable fibrous energysupplement such as soybean hulls may be
preferable to starch supplements such as cornbecause of less acid production and a higher A:Pratio of fermentation products.
Table 1. Chemical composition of dietary treatments.Diets
Componenta Pasture Alone Corn Grain Beet Pulp Soybean HullsCP 18.2 14.7 15.2 15.3NDF 47.2 32.5 46.6 54.6CWP 32.6 23.0 37.1 41.2NFC 20.1 42.6 25.9 19.0NSC 10.6 36.6 12.7 9.7NEL, Mcal/kg 1.54 1.68 1.65 1.65aComponents are in percent of DM unless indicated otherwise; CP (crudeprotein), NDF (neutral detergent fiber), CWP (cell-wall polysaccharides),NFC (non-fibrous carbohydrates), NSC (non-structural carbohydrates), andNEL (net energy for lactation).
Table 2. Digestibility, fermentation characteristics, and efficiency of bacterial-nitrogen synthesis of dietary treatments.
DietsComponenta Pasture Alone Corn Grain Beet Pulp Soybean HullsFermentation CharacteristicspH 6.10b 6.02c 6.04c 6.03c
VFA, mM 126b 142c 124b 152c
A:P Ratio 4.01b 2.46c 3.05cd 3.38bd
NH3, mg 100 ml-1 10.3b 2.1c 2.6c 4.4d
Digestibility, %OM 37.8b 54.8c 45.8d 46.2d
CP 46.0 41.7 45.2 43.5NDF 28.1b 21.9c 29.7b 44.1d
CWP 43.8b 41.5c 51.9d 56.1e
NFC 53.1b 80.1c 71.8c 60.8bc
NSC 64.9bc 79.0b 61.0c 65.5bc
Bacterial-N Synthesis Efficiencyg N/kg OM digested 27.7b 21.2c 20.6c 24.1c
g N/kg N degraded 64.2b 79.7c 69.1d 77.7c
aVFA (volatile fatty acids), A:P (acetate:propionate), other abbreviations asdefined in Table 1.

120 U.S. Dairy Forage Research Center
Effects of Acidified Fermentation By-Products and Anionic Salts on Acid-BaseStatus of Non-Lactating Dairy CowsD.B. Vagnoni and G.R. Oetzel
IntroductionMilk fever (parturient paresis or parturienthypocalcemia) is an economically importantdisease of dairy cattle. Risk for developing milkfever is strongly influenced by pre-calving diet.Feeding acidogenic diets prior to calving hasrepeatedly been shown to significantly reduce therisk of milk fever. Diets can be made acidogeniceither by addition of mineral acids or bysupplementing with anionic salts. Such dietscreate a metabolic acidosis which is reflected indecreased urinary pH, increased urinary acidexcretion, decreased blood bicarbonateconcentrations, and decreased blood base excess.Changes in blood pH are minor because theacidosis is compensated. Acidosis improvescalcium metabolism in parturient dairy cattle viabone buffering and improved vitamin Dmetabolism.
Dried condensed extracted glutamic acidfermentation product and dried cornfermentation solubles have been combinedrecently to create an acidified fermentation by-product feed (AFBP) commercially marketed asBio-Chlor. The AFBP is acidic because theglutamic acid and corn fermentation processesare stopped with strong acids (hydrochloric andsulfuric acids, respectively). No publishedstudies in dairy cattle have evaluated thepotential of an AFBP to influence acid-basebalance and potentially reduce the risk of milkfever.
Materials and MethodsEight pregnant, non-lactating, ruminallycannulated Holstein cows were assigned to tworeplicated 4 x 4 Latin squares with 14 dayperiods. Square 1 consisted of cows that hadcompleted one lactation and square 2 consistedof cows that had completed either two or fourlactations. Cows within squares were randomlyassigned to treatment sequences. During week 1of each period, cows received the control diet;
and during week 2, they received one of fourtreatment diets - AFBP; MgSO
4 and NH4Clcombination; MgSO4, CaCl2, and CaSO4
combination; or the control diet. All diets exceptthe control diet were approximately equal inacidogenic potential measured as dietary cation-anion difference (DCAD). These diets were allanionic, as evidenced by their negative DCADvalues. Both the anionic diets and the controldiet were formulated to provide similar amountsof energy (NEL), crude protein, neutral detergentfiber, acid detergent fiber, Ca, P, and Mg. Dietswere fed as a total mixed ration for ad libitumfeed intake. Dry matter intake was measureddaily.
Total urine collections were made usingindwelling Foley catheters which were insertedon the next to last day of each experimentalperiod. All urine produced during a 24 hourperiod was collected into 60 L plastic containersplaced in ice baths. Urinary pH, volume, strongion content, and net acid excretion (calculatedfrom urinary bicarbonate, NH4, and titratableacidity determinations) were measured. Bloodsamples for blood gas analysis (blood pH, pCO2,bicarbonate, and base excess) were also collectedon the last day of each experimental period.
Samples of whole ruminal contents wereobtained at 0, 1, 3, 6, and 9 hours post-feedingon the last day of each experimental period.Ruminal pH, NH4, and VFA concentrations weremeasured.
Results and DiscussionDry matter intakes were very high for all diets(Table 1) compared to expected intakes for non-lactating Holstein cows. Intakes for the anionicdiets were significantly lower compared to thecontrol diet. All of the anionic diets tended tolower blood pH and pCO2, but the differenceswere not significant. The anionic dietssignificantly decreased blood bicarbonate and

1996 Research Summaries 121
base excess values. Anionic diets alsosignificantly increased urinary volume, reducedurinary pH, increased urinary net acid excretion,increased urinary Ca excretion, and decreasedurinary strong ion difference. The AFBPtreatment significantly reduced urinarymagnesium excretion. Although significantdifferences between anionic diets wereinconsistent, the numerical ranking of treatmentmeans for measures of acid-base statusconsistently indicated that the magnitude ofacidosis was greatest for AFBP; intermediate forMgSO
4 and NH4Cl; and lowest for the MgSO4,CaCl2, and CaSO4.
All of the anionic diets significantly loweredruminal pH and increased ruminal NH4
concentrations; however, the magnitude of theeffects was small relative to the normal range forruminal pH and NH4. Increased NPN found inthe anionic diets may explain the increase inruminal NH4. Individual concentrations of VFAwere not affected by dietary treatment.
ConclusionsAcidified fermentation by-products were at leastas effective as, if not slightly better than,conventional anionic salts in producing an acidicresponse in non-lactating dairy cattle. Therefore,these products have the potential to reduce therisk of milk fever if fed prior to calving. Allanionic diets reduced dry matter intake, whichmay have been a response to the systemicacidosis they induced. Anionic diets exerted onlymodest effects on ruminal fermentation.
ReferencesDelaquis, A.M., and E. Block. 1995. Acid-base status,renal function, water, and macromineral metabolism of drycows fed diets differing in cation-anion difference. J. DairySci. 78:604.
Goff, J.P., R.L. Horst, F.J. Mueller, J.K. Miller, G.A.Kiess, and H.H. Dowlen. 1991. Addition of chloride to aprepartal diet high in cations increases 1,25dihydroxyvitamin D response to hypocalcemia preventingmilk fever. J. Dairy Sci. 74:3863.
Oetzel, G.R., M.J. Fettman, D.W. Hamar, and J.D. Olson.1991. Screening of anionic salts for palatability, effects onacid-base status, and urinary calcium excretion in dairycows. J. Dairy Sci. 74:965.
Table 1. Effect of acidified fermentation by-products and anionic salts on whole blood, urine, andruminal fluid parameters.
Dietary treatment ProbabilityMgSO4 + MgSO4 + Control vs.
Item Control AFBP1 NH4Cl Ca salts SEM Diet anionicFeed intake:DMI, kg/day 16.0a 14.4c 15.4ab 14.9bc 0.26 .004 .002Whole blood:pH 7.42 7.41 7.41 7.39 0.01 .449 .232pCO2, mm Hg 40.7 37.7 39.1 40.7 1.7 .590 .460HCO3
-, mM 26.0 23.7 24.2 24.6 0.6 .105 .021Base excess, mM 1.69 -0.56 -0.18 -0.04 0.57 .065 .010Urinary output:Liters/day 14.6b 15.3b 17.1a 15.0b 0.4 .002 .020pH 8.33a 6.37c 6.89bc 7.20b 0.20 <.001 <.001NAE2, meq/day -2843b 185a -28a -202a 123 <.001 <.001Ca, g/day 0.92b 6.70a 7.87a 6.87a 0.78 <.001 <.001Mg, g/day 6.94a 4.51b 7.56a 7.03a 0.42 .001 .257SID3, meq/day 4243a 1181b 1777b 1129b 218 <.001 <.001Ruminal fluid:pH 6.23a 6.07b 6.14b 6.12b 0.03 .008 .002NH4, mM 11.7b 14.0a 14.0a 13.6a 0.68 .103 .016Total VFA, mM 131a 121b 124b 135a 2.1 .001 .106abc Means with different superscripts within row differ (P < .05)1AFBP = acidified fermentation by-products feed.2NAE (net acid excretion) equals ammonium plus titratable acidity minus bicarbonate.3SID (strong ion difference) equals (Na + K) - (Cl + S).
122 U.S. Dairy Forage Research Center
Farm/Herd Report - Wisconsin
U.S. Dairy Forage Research Center - Annual Field Operations ReportJanuary 1997R.P. Walgenbach
As in 1995, the 1996 growing season began withvery cold temperatures. But in contrast to the hot1995 season, cool temperatures prevailedthrough most of the 1996 growing season. On 15May only 5 growing degree days hadaccumulated and no corn had emerged. Airtemperature seldom exceeded 80 degrees F.Rainfall in April was below normal. Rainfall inMay was above normal and its pattern causeddelayed corn and soybean planting. Rainfallrecorded at the farm entrance rain gauge ininches was 1.64 in April, 4.1 in May, 7.83 inJune, 3.44 in July, 1.97 in August, 0.88 inSeptember and 3.29 in October. Between 16 and18 June, 4.35 inches of rain fell at the farm. InBaraboo, just to the north of the farm, rainfallamounts of 7 to 10 inches were recorded. Thisrain flooded many fields in our area resulting inloss of crops. At the research farm we werefortunate to lose only about 10 acres of soybeansand 4 acres of corn. Soils in most fieldssustained nitrogen (N) leaching and anaerobic Nlosses. The 1995/96 winter was extremely cold,and it also produced some January/February icesheeting that killed or injured alfalfa in severalareas of Minnesota and Wisconsin; however,alfalfa at the research farm tolerated the winterfairly well. The cold April and May temperaturesslowed growth of alfalfa and delayed the start offirst crop harvest into early June. We planted 66acres of barley, 233 acres of soybeans, 369 acresof corn, 77 acres of spring and 66 acres ofsummer seeded alfalfa. The prior year�s seedingsof alfalfa totaled 293 acres. Barley plantingstarted on 18 April and was completed on 23April. All barley was no-till planted at 110pounds per acre into soybean stubble with a JohnDeere 750 no-till drill. Prior to seeding, parts ofsome fields were rotary hoed to facilitate dryingof soil surface insulated by soybean residue andmanure. We spread about 8,000 gallons per acre
of liquid manure on all barley fields. We no-tillseeded alfalfa from 11 April to 7 May into fieldsthat had corn harvested for silage in 1995. Thesefields also had 10,000 gallons of manure appliedper acre. On 9 and 10 August we no-till seededabout 13 pounds per acre of alfalfa intoharvested barley fields. We planted corn at about33,500 to 43,000 seeds per acre from 23 April to22 May. About 10 acres of grass sod wereplanted following conventional tillage, 85 acresof heavily manured corn residue were plantedfollowing one pass with a disk and 274 acreswere planted no-till. We applied from 9,000 to13,000 gallons of liquid manure per acre to mostcorn ground. All corn received 90 pounds peracre of 5-14-42 starter fertilizer and 160 poundsper acre of nitrogen from a combination ofsoybean, alfalfa and manure nitrogen (N) creditsand surface applied 28% N. We no-till seededsoybeans in 7.5 inch rows at about 225,000 seedsper acre from 6 to 11 May.
Timely planting and nearly ideal growingtemperatures produced barley yields thataveraged 81.7 bushels per acre and ranged from72.5 to 83.9 bushels per acre. We harvestedbarley from 23 to 27 July and stored it as a highmoisture grain. Soybeans produced an averageyield of 47.1 bushels per acre with a range of32.7 to 63.2 bushels per acre. Soybean harvestoccurred from 1 to 14 October. Excessive rainearly in the growing season and very little rainduring pod fill dramatically reduced soybeanyields this season compared to those of 1994 and1995 which were near 60 bushels per acre.Toward the end of the growing season, soybeanplants on most knolls in all fields diedprematurely due to lack of moisture. In additionto moisture stress, soybean plants in oneparticular field and in large areas of severalfields exhibited severe symptoms of white mold.

1996 Research Summaries 123
Currently no soybean cultivars are resistant towhite mold. This disease has many hosts and isaffected very little by crop rotations.
About 2,779 wet tons of corn silage wereharvested from 130 acres between 9 Septemberand 10 October. Yields ranged from 6.7 to 8.3tons of dry matter (DM) per acre and averaged7.5 tons of DM per acre. We harvested about onethird of our corn silage with a chopper equippedwith a kernel processor that was loaned to theDFRC farm by John Deere to facilitate researchwith processed corn silage. We harvestedapproximately 165 acres of high moisture groundear corn (HMGEC), 25 acres of HMG shelled(SC), and 49 acres of SC from 8 October to 8November. The shelled corn (85% DM)equivalent yields averaged 166.5 bushels peracre and ranged from 132 to 183 bushels peracre. The total amount of HMGEC harvestedwas 1,488 tons adjusted to 29% moisturecontent. The total amount of HMGSC harvestedwas 151 tons adjusted to 29% moisture content.All non Bt corn was sprayed for corn borers thisseason. Corn on knolls in all fields exhibitedsymptoms of moisture stress and produced verysmall ears. But in general corn was able to obtainmoisture in amounts sufficient to produceexcellent yields this season. I also think that cornin this season benefited from availability of lateseason organic N provided by manure andlegumes. The harvested alfalfa from establishedfields yielded an average of 4.1 tons DM per acrethat ranged from 3.3 to 4.9 tons DM per acre.The cold spring delayed regrowth initiation andslowed subsequent growth which reduced firstharvest yields. Most first crop yields were lessthan 1.8 tons DM per acre. Typically first cropyields ranged from 2 to 2.5 tons DM per acre.
Gene Dyar, Cluster Environmental ProtectionSpecialist, continues to work on our fuelcontamination located behind the milkhouse.Gene is optimistic that this site will be closed outwith no need of major remediation. We hope tohave final approvals early in 1997. I think thatwe have corrected the problems caused bylightening and electrical surges at both gatelocations. Dan Mann of Wisconsin Power andLight discovered that the two gate housescontaining our communication equipment were
improperly grounded. Since these buildings wereproperly grounded, we have not had anymalfunctions of modems.
Projects completed this past season include theblacktopping of the road around our expandedbunkers and the drive pad areas in front of thesebunker silos. We also removed about threequarters of a mile of overgrown tree linesbetween fields. These tree lines will be replantedwith tall prairie grasses to improve habitat forgame birds, such as pheasants. This project willreduce the labor needed to limb trees and toremove fallen trees from fields. It also willgreatly enhance the crops� use of sunlight andmoisture along these areas. The Centerpurchased a John Deere 750 no-till grain drill, aBrent GT 440 gravity box with running gear anda used Ford truck with a grain/forage box. Withthese purchases, the research farm now owns allof the equipment used in field operations.Equipment purchased to replace existingequipment consisted of two Model E Huskeymanure tanks, a White Model 6106 corn planter,a Model 6200 forage harvester and Model 6221feeder housing for our Uni harvesting system,and a Model 773 Bobcat skidsteer loader.
In April, Dave Sprecher, the Ag. ProjectSupervisor at the research farm, resigned hisposition to pursue new challenges. Dave hascontributed invaluable service to the facilityoperation and to many research projectsconducted over the years. Dave approachedprojects with enthusiasm and energy that wentbeyond normal expectations. His ingenuity andcreativity in solving problems and hisorganizational skills are assets that benefited theResearch Center in countless ways. We thankDave for his many contributions and wish himthe best in his future endeavors.
This past season, corn and soybeans wereplanted past midnight and haylage was hauledand packed in the bunker at 10:30 P.M. morethan once. It was that kind of year, and ouremployees responded to these challenges asusual. I thank all of them for their past andcontinued efforts and flexibility as we work tomeet our objectives.

124 U.S. Dairy Forage Research Center
U.S. Dairy Forage Research Center - Annual Dairy Operations ReportJanuary 1997L.L. Strozinski - Herd Manager
Change fromHerd Statistics previous year
Herd InventoryMilking cows 300 0Dry cows 50 +15
average cow age 45 months 0percent first lactation 41% - 5percent second lactation 29% + 8percent third lactation 15% + 1percent greater than third 15% - 2
Herd replacements 315 - 5Total 665 + 10Rumen fistulated cows 32
Herd PerformanceCows calved 368 + 2Heifer calves born 160 live + 17dead (+ 5)Bull calves born 179 live + 18 dead (- 5)Heifer calves died < 1 year old 3 (1.87%)
DHIA rolling herd averagemilk 20,337 lbs. + 429protein 651 lbs. + 30fat 747 lbs. + 19
Milk sold in 1996 6,298,921 lbs. + 84,909Heifer calves sold 9 - 5Bull calves sold 179 - 9Cows sold 131 - 12
Cows culled for:reproduction problems 43 + 1poor production 14 - 7poor udder 20 + 1poor feet and legs 9 - 9mastitis 23 + 11injury 5 0other 17 + 4
Cattle sales revenue $54,958.93 - 14,241.07
Herd ReproductionAverage days open 123 + 9Average calving interval 13.02 months +.27Average services per conception 2.1 - .4Average age at first calving 24 months - 1
The 1996 USDFRC dairy herd activities can bestbe described as �business as usual.� Numbers ofmature cows in the herd increased by 15 whilethe present number of herd replacements on handis down by five. Overall animal numbers are up
slightly from a year ago. Milk production hasincreased in 1996. Our DHIA rolling herdaverage for milk is at an all time high of 20,337pounds. Current average production per cow perday is 73 pounds. The farm �mailbox� net price

1996 Research Summaries 125
received per hundred weight of milk ranged from$13.811 to $16.907 in 1996. Higher productioncoupled with favorable prices during most of theyear resulted in increased milk revenues. Cattleprices, however, have remained very weak in1996. It was not uncommon to net less than$5.00 for an 80 pound bull calf after associatedsale and trucking costs at conventional cattlemarkets. Consequently, some bull calves weresold directly from the farm to area individuals toavoid sales costs and increase net cattle salesrevenues.
Research activities with the herd continued at ahigh level in 1996 with 370 milking animalsinvolved in 14 different trials. With increasedcattle numbers and research activities, the dairyoperation felt the effects of last year�s reductionin staff. Although modifications and eliminationof some work tasks have helped to streamline thework flow and allow us to meet the basic needsof the operation, there is a certain attention todetails that has declined somewhat. This declineis haunting us in the form of poorer overallfacility cleanliness, animal cleanliness andassociated animal health issues. Time to giveattention to all research trial details is alsolimited, and I feel that the overall support we areable to give to the research mission is less than ithas been in the past. These developments haveinitiated action to add one full time employeeback into the dairy operation.
Improvement and expansion projects for 1996were also somewhat limited by the laborshortage. The new feed pad and manure handlingsystem which were added at the hay storage shedin 1995 are working well for winter housing of75 heifers and dry cows. Plans have been drawnand bids are in place to construct a free stallfacility for 48 animals adjacent to the hay shed.These animals will be bedded with sand and willutilize the same feed pad area. The cattle moundhas been relocated to make space for the newfacility. The modification of the free stalls in theexisting facility to improve cow comfort whichwas started in 1995 has not yet been completed
due to lack of labor. This project remains on theplans for 1996.
Two changes are taking place in the milkingoperations. An order has been written to upgradeour milk meters, samplers and associatedsoftware. The new system will reducemaintenance cost, improve clean-in-placewashing, improve sampling procedures, andincrease accuracy. The other change in thesystem is a cooperative project with DairyEquipment Company, the University ofWisconsin milking lab and Wisconsin Power andLight. This project involves the installation andevaluation of a variable speed vacuum pumpsystem.
A significant management change made in 1996was to divide and feed the dry cows in twoseparate groups. One group is for recently drycows while the other is for cows due to calve inthree to four weeks. This practice hassignificantly decreased incidence of milk feverand displaced abomasums in our herd.
The farm continues to be a popular place to visitand we continue to host many local, national andinternational guests each year. In 1996 an extraoutreach effort was made to increase thevisibility of the farm and make better use of thenew conference room. Some of the activitieshosted were: Professional Dairy Producers ofWisconsin Dairy Skills Workshop; Monsanto-Protiva Dairy Improvement Tour; GromarkDairy Feed Salespeople Workshop; Sauk CountyHolstein Association Twilight Meeting.
The state of the dairy operation in 1996 hasmeant that many of the employees have had toput in extra time and effort not to mention altertheir personal plans for time off to �get the jobdone.� Many of these efforts are beyond the callof duty. I encourage the USDA-ARS, USDFRCand the University of Wisconsin to join me inrecognition and appreciation of their efforts. Ialso extend my appreciation to the USDFRCfield operation�s crew for their assistance withchores and special projects throughout the year.

126 U.S. Dairy Forage Research Center
Publications
ABODEELY, E.F., II, BUXTON, D.R. AND CARLSON, I.T. 1996. Near infrared reflectancespectroscopy (NIRS) predictions of forage quality in orchardgrass. Agron. Abstracts. p. 6. (Abstract)
BACH, A., YOON, I.K., STERN, M.D., JUNG, H.G. AND CHESTER-JONES, H. 1996. Effects oftype of energy supplementation for lush pasture on microbial fermentation in continuous cultures.ASAS, Midwest Sect. p. 88. (Abstract)
BLAND, W.L., KANNEGANTI, V.R. AND UNDERSANDER, D.J. 1996. Weather and alfalfaquality in Wisconsin. Agron. Abstr., Am. Soc. of Agronomy, Madison, WI. p. 156. (Abstract)
BLUMENTHAL, J.M. 1996. Nitrogen economy of alfalfa. Ph.D. dissertation. Univ of Minnesota, St.Paul. (with M.P. RUSSELLE). 106 pp. (Thesis)
BLUMENTHAL, J.M. AND RUSSELLE, M.P. 1996. Subsoil nitrate uptake and symbioticdinitrogen fixation by alfalfa. Agron. J. 88:909-915.
BLUMENTHAL, J.M., VANCE, C.P. AND RUSSELLE, M.P. 1996. Nitrogenase activity andnodule amino acid pools are independent of the amount of N2 fixed. Plant Physiol. Suppl. 111(2):37.
BOND, D.R. AND RUSSELL, J.B. 1996. A role of fructose 1,6 diphosphate in the ATPase-mediated energy-spilling reaction of Streptococcus bovis. Appl. Environ. Microbiol. 62:2095-2099.
BOND, D.R. AND RUSSELL, J.B. 1996. Effect of potassium on futile proton flux inStreptococcus bovis. #K31 Ann. Mtg. Amer. Soc. for Microbiol., New Orleans, LA, (May 19-23).(Abstract)
BRODERICK, G.A. 1996. Conference Introduction: Altering ruminal nitrogen metabolism toimprove protein utilization. J. Nutr. 126:1234S-1325S.
BRODERICK, G.A. AND CLAYTON, M.K. 1996. Effect of animal nutritional factors on therelationship between milk urea N and blood urea N in lactating cows. J. Dairy Sci. 79(Suppl.1):210.(Abstract)
BUXTON, D.R. 1996. Quality-related characteristics of forages as influenced by plant environmentand agronomic factors. Anim. Feed Sci. Tech. 59:37-49.
BUXTON, D.R., MERTENS, D.R. AND FISHER, D.S. 1996. Forage quality and ruminantutilization. pp. 229-266. IN: L.E. Moser, D.R. Buxton, and M.D. Casler (eds.) Cool-season foragegrasses, Agron. Monogr. 34, ASA, CSSA, and SSSA, Madison, WI. (Book Chapter)
BUXTON, D.R., REDFEARN, D.D., JUNG, H.G. AND MERTENS, D.R. 1996. Improving foragequality-related characteristics of maize. pp. 23-28. IN: Proc. With Dairy and Forage Industries. U.S.Dairy Forage Research Center, Madison, WI., (Proc.)

1996 Research Summaries 127
DARMOSARKORO, W., BUXTON, D.R., MOORE, K.J., DEVINE, T.E. AND REDFEARN, D.D.1996. Quality of soybean lines developed for forage. Agron. Abstracts. p. 159. (Abstract)
DEETZ, D.A. 1996. Cell wall lignification: constraints to bacterial fermentation and enzymatichydrolysis of forage fiber. Ph.D. Dissertation (with H.G. JUNG). 179 pp. (Thesis)
DEETZ, D.A., JUNG, H.G. AND BUXTON, D.R. 1996. Water-deficit effects on cell-wallcomposition and in vitro degradability of structural polysaccharides from alfalfa stems. Crop Sci.36(2):383-388.
DHIMAN, T.R., ANAND, G.R., SATTER, L.D. AND PARIZA, M. 1996. Conjugated linoleic acidcontent of milk from cows fed different diets. J. Dairy Sci. 79(Suppl.1):137. (Abstract)
DHIMAN, T.R., ANAND, G.R., SATTER, L.D. AND PARIZA, M. 1996. Dietary effects onconjugated linoleic acid content of cow�s milk. 87th AOCS Annual Meeting and Expo. Indianapolis,IN, April 28-May 1. P. 29-30. (Abstract)
DHIMAN, T.R., HOOGENDIJK, B., WALGENBACH, R.P. AND SATTER, L.D. 1996. Feedinghigh oil corn to lactating dairy cows. J. Dairy Sci. 79(Suppl.1):136. (Abstract)
DHIMAN, T.R., KOREVAAR, A.C. AND SATTER, L.D. 1996. Particle size of heated soybeansand its effect on milk production of dairy cows. J. Animal Sci. 74(Suppl.1):76. (Abstract)
DIEZ-GONZALEZ, F. AND RUSSELL, J.B. 1996. The regulation of thiometylgalctoside transportin Clostridium acetobutylicum P262 by inducer exclusion and inducer expulsion mechanisms. FEMSMicrobiol. Lett. 136:123-127.
DIEZ-GONZALEZ, F., RUSSELL, J.B. AND HUNTER, J.B. 1996. Potassium-dependent transportof lactate across the cell membrane of Clostridium acetobutylicuum P262. #K33 Ann. Mtg. Amer.Soc. for Microbiol., New Orleans, LA, (May 19-23). (Abstract)
DURLING, J.C., HESTERMAN, O.B. AND ROTZ, C.A. 1996. Corn silage following first-cutalfalfa: a forage production alternative? pp. 193-196. IN: 1996 American Forage and GrasslandCouncil Proceedings, Am. Forage Grassl. Council, Georgetown, TX, (Proc.)
EDE, R.M. AND RALPH, J. 1996. Assignment of 2D TOCSY spectra of lignins: the role of ligninmodel compounds. Magnetic Resonance in Chem. 34:261-268.
EDE, R.M., RALPH, J., TORR, K.M. AND DAWSON, B.S. 1996. An NMR investigation of thehetereogeneity of distribution of dairylpropane structures in extracted Pinus radiata lignins.Holzforschung 50(2):161-164.
GARDNER, R.G., RUSSELL, J.B., WILSON, D.B., WANG, G-R. AND SHOEMAKER, N.B.1996. Use of modified Bacteroides-Prevotella shuttle vector to transfer a reconstucted β-1,4-D-endoglucanase gene into Bacteroides uniformis and Prevotella ruminicola B14. Appl. Environ.Microbiol. 62:196-202.

128 U.S. Dairy Forage Research Center
GEORGE, J.R., HINTZ, R.L., BUXTON, D.R., BARNHART, S.K. AND MOORE, K.J. 1996.Warm-season grazing management research. p. 85. IN: E. Morical (ed.) Management of IntensiveGrazing Symposium. Feb. 7-8, Iowa State Univ., Des Moines, IA, (Abstract)
GEORGE, J.R., HINTZ, R.L., MOORE, K.J., BARNHART, S.K. AND BUXTON, D.R. 1996. Steerresponse to rotational or continuous grazing on switchgrass and big bluestem pastures. pp. 150-154.IN: Proc. Amer. Forage Grassland Conf., June 13-15, Vancouver B.C., Canada, American Forageand Grassland Council, Georgetown, TX. (Proc.)
GETTLE, R.M., GEORGE, J.R., BLANCHET, K.M., BUXTON, D.R. AND MOORE, K.J. 1996.Frost-seeding legumes into established switchgrass: establishment, density, persistence, and swardcomposition. Agron. J. 88(1):98-103.
GETTLE, R.M., GEORGE, J.R., BLANCHET, K.M., BUXTON, D.R. AND MOORE, K.J. 1996.Frost-seeding legumes into switchgrass; yield and botanical composition in the stratified canopy.Agron. J. 88:555-560.
GOINS, G.D. AND RUSSELLE, M.P. 1996. Fine root demography in alfalfa (Medicago sativa L.).Plant Soil. 185:281-291.
GRABBER, J.H., HATFIELD, R.D. AND RALPH, J. 1996. Altering lignin composition, structure,and cross-linking: potential impact on cell wall degradation. National Amer. Chem Soc., Paper Cell-54, New Orleans, LA, March 24-28. (Abstract)
GRABBER, J.H., RALPH, J., HATFIELD, R.D., QUIDEAU, S. AND KUSTER, T.A. 1996.Dehydrogenation polymer-cell wall complexes as a model for lignified grass cell walls. NationalAmer. Chem Soc., Paper Cell-20, New Orleans, LA, March 24-28. (Abstract)
GRABBER, J.H., RALPH, J., HATFIELD, R.D., QUIDEAU, S., KUSTER, T. AND PELL, A.N.1996. Dehydrogenation polymer-cell wall complexes as a model for lignified cell walls. J. Agric.Food Chem. 44(6):1453-1459.
GRABBER, J.H., QUIDEAU, S. AND RALPH, J. 1996. p-Courmaroylated syringyl units in maizelignin; implications for β-ether cleavage by thioacidolysis. Phytochemistry. 43(6):1189-1194.
GRAU, C.R., SHARPEE, D.K. AND SMITH, R.R. 1996. Evidence of Mycoleptodiscus root rot offorages in Wisconsin. Proc. XIV Trifolium Conf. May 21-23, Lexington, KY. p. 24. (Proc.)
HARRIGAN, T.M., BICKERT, W.G. AND ROTZ, C.A. 1996. Simulation of dairy manuremanagement and cropping systems. Appl. Engr. Agric. 12(5):563-574.
HATFIELD, R.D., ANDREWARTHA, K. AND STONE, B.A. 1996. SDS solubilized lignincomplexes from alfalfa stems. Plant Physiology Suppl. 111(2):667.
HATFIELD, R.D. AND RALPH, J. 1996. Molecular modeling of dehydrodiferulates: Areintramolecular dimers feasible within grass walls? National Amer. Chem Soc., Paper Cell-55, NewOrleans, LA, March 24-28. (Abstract)
1996 Research Summaries 129
HATFIELD, R.D., GRABBER, J.H. AND RALPH, J. 1996. Modeling cross-links within wallmatrices: impact upon polysaccharide degradation. Keystone Symp. on the Extracellular Matrix ofPlants, Poster 110, Tamarron, CO. (Proc.)
HEINTZMAN, A.K. AND RUSSELLE, M.P. 1996. Multi-site field test of CERES-Maize in theUpper Midwest. Agron. Abstracts. p. 244. (Abstract)
HINTZ, R.W., MERTENS, D.R. AND ALBRECHT, K.A. 1996. Effects of sodium sulfite onrecovery and composition of detergent fiber and lignin. J.A.O.A.C. Inter. 79:16-22.
HRISTOV, A. AND BRODERICK, G.A. 1996. Synthesis of microbial protein in ruminallycannulated cows fed alfalfa silage, alfalfa hay or corn silage. J. Dairy Sci. 9:1627-1637.
HUHNKE, R.L., MUCK, R.E. AND PAYTON, M.E. 1996. Round bale silage storage losses ofryegrass and legume-grass forages. ASAE paper # 96-1030. (Proc.)
HURD, C.M., MOORE, K.J., BRUMMER, E.C., BARNHART, S.K., BUXTON, D.R. ANDGEORGE, J.R. 1996. Establishing alfalfa following alfalfa with fungicides. pp. 51-54. IN: Proc.Amer. Forage Grassland Conf., June 13-15, Vancouver B.C., Canada, American Forage andGrassland Council, Georgetown, TX. (Proc.)
JUNG, H.G. 1996. Breeding for improved forage quality in alfalfa: an animal nutritionist�s view.Report of the 35th North American Alfalfa Imporvement Conf., Oklahoma City, OK. p. 70. (Report)
JUNG, H.G. AND CHAPPLE, C.C.S. 1996. Does lignin composition impact forage cell-walldegradability? J. Dairy Sci. 79(Suppl.1):151. (Abstract)
KAFFKA, S.R. AND KANNEGANTI, V.R. 1996. Orchardgrass response to different types, rates,and application patterns of dairy manure. Field Crops Research. 47:43-52.
KANNEGANTI, V.R., DHIMAN, T.R., WALGENBACH, R.P., MASSINGILL, L. AND SATTER,L.D. 1996. Productivity of mixed-species �natural� pastures under intensive rotational grazing.Agron. Abstr., Am. Soc. of Agron., Madison, WI. p. 157. (Abstract)
KEARNS, D.B. AND RUSSELL, J.B. 1996. Catabolite repression in a diauxic and non diauxicstrain of Streptococcus bovis. Curr. Microbiol. 32:216-219.
KEARNS, D.B., COOK, G.M. AND RUSSELL, J.B. 1996. Inducer expulsion is not a determinantof diauxic growth in Streptococcus bovis. Curr. Microbiol. 32:1-5.
KOEGEL, R.G. AND STRAUB, R.J. 1996. Fractionation of alfalfa for food, feed,biomass, andenzymes. Trans. ASAE. 39(3):769-774.
KOEGEL, R.G., KRAUS, T.J. AND STRAUB, R.J. 1996. Intensive forage conditioning: Past -Present - Future? Proc. Washington State Hay Growers 10th Annual Conf., Pasco, Jan. 23 - 24.(Proc.)

130 U.S. Dairy Forage Research Center
KRAUSE, D.O. AND RUSSELL, J.B. 1996. An rRNA approach for assessing the role of obligateamino acid-fermenting bacteria in ruminal amino acid degradation. Appl. Environ. Microbiol.62:815-821.
KRAUSE, D.O. AND RUSSELL, J.B. 1996. How many ruminal bacteria are there? J. Dairy Sci.79:1467-1475.
KRAUSE, D.O., WELLS, J.E. AND RUSSELL, J.B. 1996. Effect of starch supplementation on therelative numbers of Streptococcus bovis and rapidly growing lactobacilli in the rumen. #K130 Ann.Mtg. Amer. Soc. for Microbiol., New Orleans, LA (May 19-23). (Abstract)
KUEHN, C.S., LINN, J.G., HALLAND, S.K. AND JUNG, H.G. 1996. Quality measures in cornsilage samples taken from two growing seasons. J. Dairy Sci. 79(Suppl.1):150. (Abstract)
LANA, R.P. AND RUSSELL, J.B. 1996. Use of potassium depletion to assess adaptation of ruminalbacteria to ionophores. Appl. Environ. Microbiol. 62:4499-4503.
LU, F. AND RALPH, J. 1996. A new lignin characterization method: derivatization/reductivecleavage as an alternative to analytical thioacidolysis. National Amer. Chem Soc., Paper Cell-110,New Orleans, LA, March 24-28. (Abstract)
LU, F. AND RALPH, J. 1996. NMR studies on a new model for selective degradation of lignins.National Amer. Chem Soc., Paper Cell-160, New Orleans, LA, March 24-28. (Abstract)
LU, F. AND RALPH, J. 1996. Reactions of lignin model β-aryl ethers with acetyl bromide.Holzforschung. 50(4):360-364.
LUCHINI, N.D., BRODERICK, G.A. AND COMBS, D.K. 1996. Characterization of the proteolyticactivity of commercial proteases and strained ruminal fluid. J. Anim.Sci. 74:685-692.
LUCHINI, N.D., BRODERICK, G.A. AND COMBS, D.K. 1996. In vitro determination of ruminalprotein degradation using freeze-stored ruminal microorganisms. J. Anim. Sci. 74:2488-2499.
LUCHINI, N.D., BRODERICK, G.A. AND COMBS, D.K. 1996. Preservation of ruminalmicroorganisms for in vitro determination of ruminal protein degradation. J.Anim. Sci. 74:1134-1143.
LUDLEY, F.H. AND RALPH, J. 1996. Improved preparations of coniferyl and sinapyl alcohols. J.Ag. Food Chem. 44(10):2942-2943.
LUDLEY, F.H. AND RALPH, J. 1996. Preparation of the glucosides of coniferyl and sinapyl p-coumarate. National Amer. Chem Soc., Paper Cell-156, New Orleans, LA, March 24-28. (Abstract)
MAGARIAN, D.M., LAMB, J.F.S., RUSSELLE, M.P. AND BLUMENTHAL, J.M. 1996. A newmethod for selecting individual alfalfa plants for N uptake. Agron. Abstracts. p. 76. (Abstract)
MERTENS, D.R. 1996. Methods in modeling feeding behavior and intake in herbivores. Ann.Zootech. 45(Suppl.1):153-164.

1996 Research Summaries 131
MERTENS, D.R. 1996. Using fiber and carbohydrate analyses to formulate dairy rations. Proc. ofthe Dairy Forage Research Center Conference with Dairy and Forage Industries, Sept. 16-19,Madison, WI. pp. 81-92. (Proc.)
MEYERS, L.L., RUSSELLE, M.P. AND LAMB, J.F.S. 1996. Fluridone reveals root elongationdifferences in alfalfa germplasms. Agron. J. 88:67-72.
MOSER, L.E., BUXTON, D.R., AND M.D. CASLER (EDS). 1996. Cool-season forage grasses.Agron. Monogr. 34. ASA, CSSA, and SSSA, Madison, WI. 841 pp. (Book Editor)
MUCK, R.E. 1996. Inoculation of silage and its effects on silage quality. pp. 43-51. IN: Proc. of theDairy Forage Research Center Conference with Dairy and Forage Industries, US Dairy Forage Res.Ctr, Madison, WI, (Proc.)
MUCK, R.E. AND HINTZ, R.W. 1996. Effects of quality on lucerne ensilability. pp. 168-169. IN:D.I.H. Jones, R. Jones, R. Dewhurst, R. Merry and P.M. Haigh (eds.) Proc. of the XIth InternationalSilage Conf., Univ. of Wales, Aberystwyth, Wales, UK, (Proc.)
MUCK, R.E., MERTENS, D.R. AND WALGENBACH, R.P. 1996. Proteolysis in different foragesilages. ASAE paper # 96-1031. (Proc.)
MUCK, R.E. AND ROTZ, C.A. 1996. Bunker silo unloaders: an economic comparison. Appl. Engr.Agric. 12(3):273-280.
MUCK, R.E., WEINBERG, Z.G., ROUSE, D.I. AND IGL, B.R. 1996. Ensiling of potato vines. pp.170-171. IN: D.I.H. Jones, R. Jones, R. Dewhurst, R. Merry and P.M. Haigh (eds.) Proc. of the XIthInternational Silage Conf., Univ. of Wales, Aberystwyth, Wales, UK, (Proc.)
NADEAU, E.M.G., BUXTON, D.R., LINDGREN, E. AND LINGVALL, P. 1996. Kinetics of cell-wall digestion of orchardgrass and alfalfa silages treated with cellulase and formic acid. J. Dairy Sci.79:2207-2216.
PELTEKOVA, V.D. AND BRODERICK, G.A. 1996. In vitro ruminal degradation and synthesis ofprotein on fractions extracted from alfalfa hay and silage. J. Dairy Sci. 9:612-619.
RALPH, J. 1996. An unusual lignin from Kenaf. J. Natural Products. 59(4):341-342.
RALPH, J. 1996. Cell wall cross-linking in grasses: the importance of understanding plant chemistryand biochemistry. Proc. of the Dairy Forage Research Center Conference with Dairy and ForageIndustries. pp. 1-8. (Proc.)
RALPH, J. 1996. NMR of synthetic lignins with NMR-invisible methoxyl groups. The NMRNewsletter. 452:13-14. (Newletter)
RALPH, J. 1996. The advantage of fully digital NMR and pulsed field gradients. The NMRNewsletter. 452:11-12. (Newsletter)

132 U.S. Dairy Forage Research Center
RALPH, J. AND GRABBER, J.H. 1996. Dimeric β-ether thioacidolysis products resulting fromincomplete ether cleavage. Holzforschung. 50(5):425-428.
RALPH, J., HATFIELD, R.D., GRABBER, J.H., QUIDEAU, S. AND HELM, R.F. 1996.Mechanisms of polysaccharide-polysaccharide and polysaccharide-lignin cross-linking in grasses.National Amer. Chem Soc., Paper Cell-51, New Orleans, LA, March 24-28. (Absrtact)
RALPH, J., HATFIELD, R.D., QUIDEAU, S., HELM, R.F. AND GRABBER, J.H. 1996. Cell-wallcross-linking in grasses by ferulates and dehydrodiferulates. Keystone Symp. on the ExtracellularMatrix of Plants, Paper 012, Tamarron, CO. (Abstract)
RALPH, J., HATFIELD, R.D., QUIDEAU, S., HELM, R.F. AND GRABBER, J.H. 1996. Cell-wallcross-linking in grasses by ferulates and dehydrodiferulates. Keystone Symp. on the ExtracellularMatrix of Plants, Poster 124, Tamarron, CO. (Abstract)
RALPH, J., LU, F. AND GRABBER, J. 1996. Structural characterization of lignins: analyticalthioacidolysis and a new alternative. National Amer. Chem Soc., Paper Cell-21, New Orleans, LA,March 24-28. pp. 24-28. (Abstract)
RALPH, S.A., RALPH, J., LANDUCCI, W.L. AND LANDUCCI, L.L. 1996. NMR database oflignin and cell wall model compounds. Available over Internet at http://www.dfrc.wisc.edu/software.html, or send E-mail to [email protected]. (Database)
RALPH, J., ZHANG, Y. AND EDE, R.M. 1996. Preparation of synthetic lignins with superior NMRcharacteristics. National Amer. Chem Soc., Paper Cell-157, New Orleans, LA, March 24-28. pp. 24-28. (Abstract)
REDFEARN, D.D., BUXTON, D.R., HALLAUER, A.R. AND GEORGE, J.R. 1996. Performanceof maize hybrids developed from inbred lines selected for high or low forage quality. Agron.Abstracts. p. 155. (Abstract)
ROTZ, C.A. 1996. A comparison of forages, harvesting and storage systems. pp. 32-43. IN: Proc.Midwest Dairy Management Conf., Aug. 28-29, Minneapolis, MN. (Proc.)
ROTZ, C.A. 1996. Economics of grazing alfalfa on Michigan dairy farms. pp. 72-81. IN: Proc. 26thNational Alfalfa Sym. Certified Alfalfa Seed Council, Inc., Davis, CA 95617-1017. (Proc.)
ROTZ, C.A. AND GUPTA, U.S. 1996. DAFOSYM for Windows, a teaching aid in biosystemsengineering. Paper #96-3058. ASAE, St. Joseph, MI. (Proc.)
ROTZ, C.A. AND GUPTA, U.S. 1996. DAFOSYM for Windows, version 1. [http://www.dfrc.wisc.edu]. (Software)
ROTZ, C.A. AND GUPTA, U.S. 1996. DAFOSYM for Windows: a teaching aid in forage systemmanagement. pp. 182-186. IN: 1996 American Forage and Grassland Council Proceedings, Am.Forage Grassl. Council, Georgetown, TX. (Proc.)

1996 Research Summaries 133
RUSSELL, J.B. 1996. Inhibition of hyperactive amino acid-degrading ruminal bacteria and thepotential for decreasing wasteful ammonia production. Proc. of the Conf. with Dairy and ForageIndustries. U.S. Dairy Forage Res. Cte., Madison, WI. pp. 61-62. (Proc.)
RUSSELL, J.B., BOND, D.R. AND COOK, G.M. 1996. The fructose diphosphate/phosphateregulation of carbohydrate metabolism in low G + C gram-positive anaerobes. Res. Microbiol. pp.528-535.
RUSSELL, J.B. AND WILSON, D.B. 1996. Why are ruminal cellulolytic bacteria unable to digestcellulose at low pH? J. Dairy Sci. 79:1503-1509.
RUSSELLE, M.P. 1996. Nitrogen cycling in pasture systems. pp. 125-166. IN: R.E. Joost and C.A.Roberts (eds.). Nutrient cycling in forage systems, PPI-FAR, Manhattan, KS. (Book Chapter)
SATTER, L.D. AND DHIMAN, T.R. 1996. Formulating dairy diets: Enhancing profitability andreducing environmental impact. Proc. of the Dairy Forage Research Center Conf. with Dairy andForage Industries. pp. 93-101. (Proc.)
SATTER, L.D. and DHIMAN, T.R. 1996. Use of heat processed soybeans in dairy rations. Proc. ofthe Second International Fullfat Soya Conference. August 21-24. Budapest, Hungary. pp. 369-381.(Proc.)
SAULNIER, L., CHANLIAUD, E., CREPEAU, M.-J., THIBAULT, J.-F., GRABBER, J.H. ANDRALPH, J. 1996. Structure of cell wall polysaccharides in maize bran. Plant Polysaccharides Symp.,Nantes, France. (Abstract)
SHI, Y. 1996. Competition for energy sources among three predominant ruminal cellulolyticbacteria. Ph.D. Thesis, University of Wisconsin - Madison (with P.J. WEIMER). (Thesis)
SHI, Y. AND WEIMER, P.J. 1996. Utilization of cellodextrins by three predominant ruminalcellulolytic bacteria. Appl. Environ. Microbiol. 62:1084-1088.
SMITH, R.R. 1996. A two stage procedure to Sclerotinia in red clover. Agron. Abst. p. 74.(Abstract)
SMITH, R.R. 1996. Inter-regional study on establishment and production of kura clover. Proc. XIVTrifolium Conf. May 21-23, Lexington, KY. p. 7. (Proc.)
SMITH, R.R. 1996. Selecting high quality legumes: Improving pest resistance and quality whilemaintaining yield and persistence. Proc. of the Dairy Forage Research Center Conference with Dairyand Forage Industries, Sept. 16-19, Madison, WI. pp. 16-19. (Proc.)
THIEX, N., MERTENS, D.R. AND EVENSON, P.D. 1996. A summary of the responses to the 1995NFTA questionnaire and discussion of factors contributing to laboratory error. Proc. 1995 NFTAWorkshop, Nat. Forage Testing Assoc. pp. H1-H18. (Proc.)

134 U.S. Dairy Forage Research Center
TREMBLAY, G.F., BRODERICK, G.A. AND ABRAMS, S.M. 1996. Estimating ruminal proteindegradation of roasted soybeans using near infrared reflectance spectroscopy. J. Dairy Sci. 79:276-282.
VAGNONI, D.B. AND BRODERICK, G.A. 1996. N utilization in alfalfa hay versus alfalfa silageby Holstein cows: milk protein secretion and microbial N flow estimated from purine derivativeexcretion. J. Dairy Sci. 79(Suppl.1):209. (Abstract)
VAN KESSEL, J.A.S. AND RUSSELL, J.B. 1996. The effect of pH on ruminal methanogenesis.FEMS Microbiol. Ecol. 20:205-210.
VAN KESSEL, J.S. AND RUSSELL, J.B. 1996. The effect of amino nitrogen on the energetics ofruminal bacteria and its impact on energy spilling. J. Dairy Sci. 79:1237-1243.
VENUTO, B.C., SMITH, R.R. AND GRAU, G.R. 1996. Temperature dependent reaction andselection response to red clover populations to Fusarium wilt. Crop Sci. 36:1477-1481.
WEBB, D.H., NUTTER, F.W., JR., F.W. AND BUXTON, D.R. 1996. Effect of acid detergent ligninconcentration in alfalfa leaves on three components of resistance to alfalfa rust. Plant Disease.80:1184-1187.
WEINBERG, Z.G. AND MUCK, R.E. 1996. New trends and opportunities in the development anduse of inoculants for silage. FEMS Microbiology Reviews. 19(1):53-68.
WELLS, J.E. AND RUSSELL, J.B. 1996. The effect of growth and starvation on the lysis of theruminal cellulolytic bacterium Fibrobacter succinogenes. Appl. Environ. Microbiol. 62:1342-1346.
WELLS, J.E. AND RUSSELL, J.B. 1996. Why do many ruminal bacteria die and lyse so quickly? J.Dairy Sci. 79:1487-1495.
WELLS, J.E., GARDNER, R.G., WILSON, D.B. AND RUSSELL, J.B. 1996. Identification of aPrevotella ruminicola operon that encodes polysaccharide-degrading enzymes. #K166 Ann. Mtg.Amer. Soc. for Microbiol., New Orleans, LA, (May 19-23). (Abstract)
WEIMER, P.J. 1996. Ruminal cellulolytic bacteria: physiology, ecology, and beyond. Proc. of theDairy Forage Research Center Conference with Dairy and Forage Industries, US Dairy Forage Res.Ctr., Madison, WI. (Proc.)
WEIMER, P.J. 1996. Why don�t ruminal bacteria digest cellulose faster? J. Dairy Sci. 79:1496-1502.
ZHU, Y., SHEAFFER, C.C., RUSSELLE, M.P. AND VANCE, C.P. 1996. Dinitrogen fixation ofannual Medicago species. Proc. 35th North American Alfalfa Improvement Conf. p. 75. (Abstract)