Embed Size (px)
Citation preview
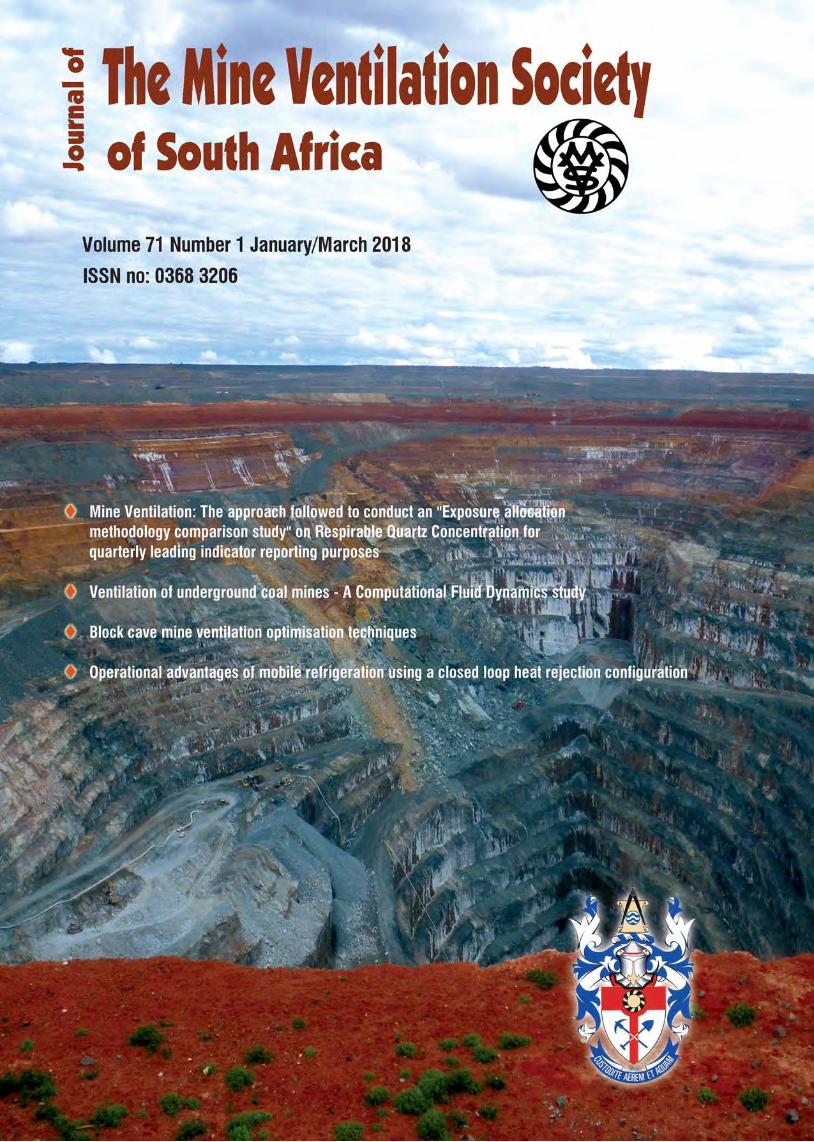
Volume 71 • Number 1 • January/March 2018
Published quarterly by the Mine Ventilation Society of South AfricaCSIR Property Cnr Rustenburg and Carlow RoadEmmarentiaP O Box 291521 Melville 2109Tel: +27 11 482-7957 Fax: +27 11 482-7959 / 086 660 7171E-mail: [email protected]
[email protected]: http://www.mvssa.co.za
Advertising and Production: Delinds Publications12 Delta Road Blairgowrie RandburgPO Box 72366 Parkview 2122Tel: +27 11 886-5985Fax: +27 11 886-1332Cell No: +27 83 266 6662 E-mail: [email protected]: Debbie MyerProduction: Lindsay Myer
The opinions expressed by contributors donot necessarily represent the official view ofthe Society.
Products and services advertised in theJournal are not necessarily endorsed by theSociety.
Material in this publication may not bereproduced in any form whatsoever withoutwritten permission from the Editor.
Copyright © 2018 of the Mine VentilationSociety of South Africa
Contents
Cover Picture:
Journal of theMine Ventilation Society
of South Africa
Editorial: The Science and Practice of Mine Ventilation . . . . . . . . . . . . . . . . . . .2
The approach followed to conduct an "Exposure allocationmethodology comparison study" on Respirable QuartzConcentration for quarterly leading indicator reporting purposes . . . . . . . . . . . .4
Block cave mine ventilation optimisation techniques . . . . . . . . . . . . . . . . . . . . . .10
Operational advantages of mobile refrigeration using aclosed loop heat rejection configuration . . . . . . . . . . . . . . . . . . . . . . . . . . . . . . .16
Ventilation of underground coal mines - A ComputationalFluid Dynamics study . . . . . . . . . . . . . . . . . . . . . . . . . . . . . . . . . . . . . . . . . . . . .22
Obituary: Jim Guthrie . . . . . . . . . . . . . . . . . . . . . . . . . . . . . . . . . . . . . . . . . . . . .27
1 Journal of the Mine Ventilation Society of South Africa, January/March 2018
The Constitution of the MVSSA wants to "... promote and advance the science and practiceof [mine]ventilation engineering...". This phrase,that has survived several constitutional amendments over the years, was written in theinfancy of this profession at a time when it was wellunderstood, wisely so, that mine ventilation is a specialised branch of engineering.
This technical expertise is essential to enable underground mining in conditions that would beotherwise prohibitively unbearable to workers. Itwas written at a time when extensive manuallabour was literally the back-bone of mining,particularly in this part of the world, displayinguncanny understanding of mining realities on thepart of the MVSSA's founding members.
At the same time, the Chamber of Mines of SouthArica instituted several specialised qualificationsamongst which were the suite of Certificates inMine Environmental [ventilation] Control which,to this day, has been globally acknowledged as pioneering in defining specialised education andtraining material for this discipline.
Over the years, the status of these qualifications hasbeen surpassed and ignored by the academic worldwhich failed to recognise the need to formalise therole of mine ventilation beyond that of an adjunctsuite of extra-curricular courses leading to a postgraduate certificate or a master degree.
The news that the University of the Witwatersrandwill be partnering the MVSSA in providing a Level6 qualification registered with the HigherEducation Qualifications Council in South Africasignifies a huge step in the right direction. It recognises and pegs the old Certificate in MineEnvironmental Control and professional roles associated therewith at a validated level within thenational education and training qualification frame-works. However, this qualification is still not anengineering degree: close, but no cigar!
The issue is not necessarily a question of status.Motivation for this discussion are the underlyingprinciple and implications of this situation.
Incidentally, during recent weeks, correspondencewithin the North American Society for MiningMetallurgy and Exploration's UndergroundVentilation (SME UVC) digest featuring someprominent North American and Australian
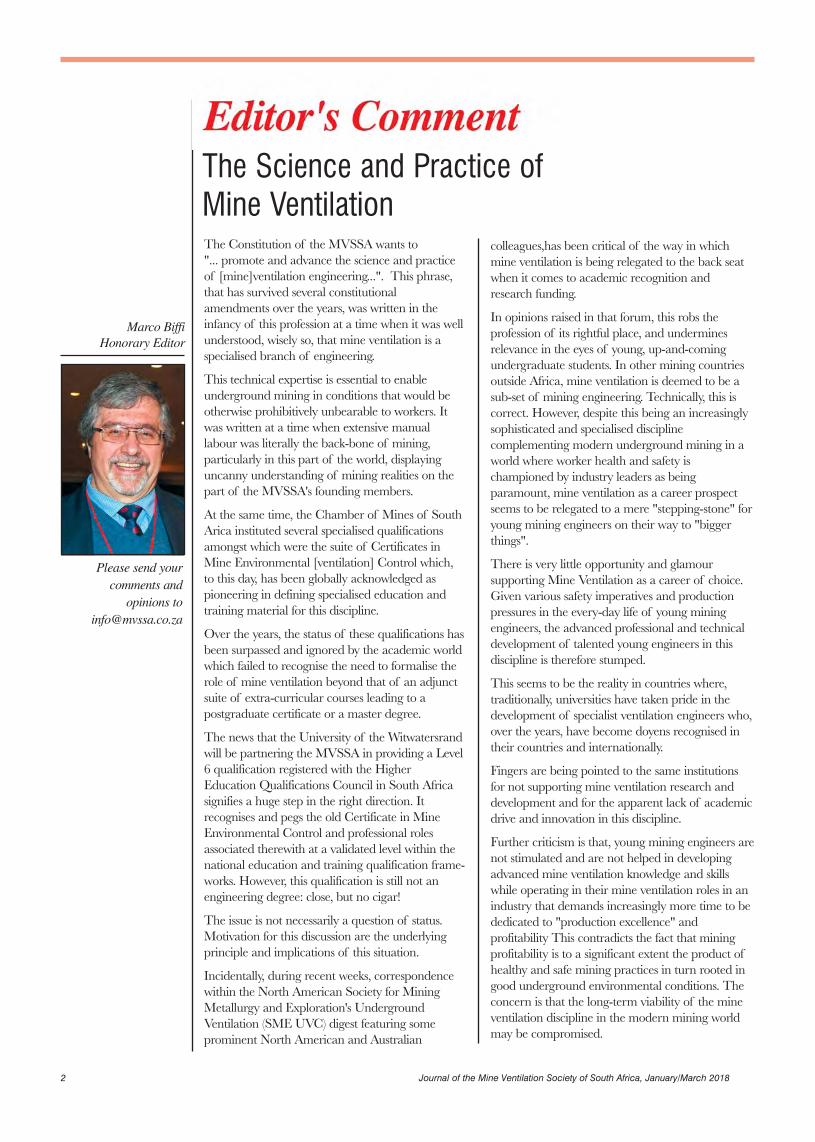
Marco BiffiHonorary Editor
Please send your comments and
opinions to [email protected]
colleagues,has been critical of the way in whichmine ventilation is being relegated to the back seatwhen it comes to academic recognition andresearch funding.
In opinions raised in that forum, this robs the profession of its rightful place, and undermines relevance in the eyes of young, up-and-comingundergraduate students. In other mining countriesoutside Africa, mine ventilation is deemed to be asub-set of mining engineering. Technically, this iscorrect. However, despite this being an increasinglysophisticated and specialised discipline complementing modern underground mining in aworld where worker health and safety is championed by industry leaders as beingparamount, mine ventilation as a career prospectseems to be relegated to a mere "stepping-stone" foryoung mining engineers on their way to "biggerthings".
There is very little opportunity and glamour supporting Mine Ventilation as a career of choice.Given various safety imperatives and productionpressures in the every-day life of young miningengineers, the advanced professional and technicaldevelopment of talented young engineers in this discipline is therefore stumped.
This seems to be the reality in countries where,traditionally, universities have taken pride in thedevelopment of specialist ventilation engineers who,over the years, have become doyens recognised intheir countries and internationally.
Fingers are being pointed to the same institutionsfor not supporting mine ventilation research anddevelopment and for the apparent lack of academicdrive and innovation in this discipline.
Further criticism is that, young mining engineers arenot stimulated and are not helped in developingadvanced mine ventilation knowledge and skillswhile operating in their mine ventilation roles in anindustry that demands increasingly more time to bededicated to "production excellence" and profitability This contradicts the fact that miningprofitability is to a significant extent the product ofhealthy and safe mining practices in turn rooted ingood underground environmental conditions. Theconcern is that the long-term viability of the mineventilation discipline in the modern mining worldmay be compromised.
The Science and Practice of Mine Ventilation
2 Journal of the Mine Ventilation Society of South Africa, January/March 2018
THE MINE VENTILATION SOCIETYOF SOUTH AFRICA OFFICE BEARERS
President:Mr Kobus Dekker
Senior Vice President:Mr Marthinus van der Bank
Junior Vice President:Mr Ronald Motlhamme
Honorary Editor:Mr Marco Biffi
Honorary Treasurer:Mr André van der Linde
Honorary Chairman of Education:Mr Morné Beukes
Immediate Past President:Mr Neil Roman
COUNCIL MEMBERSMr Frans Cloete, Mr Johan Maass, Mr WynandMarx, Mr Barry Nel, Mrs Cecilia Pretorius ,Mr Selvin Subban, Ms Julize van Niekerk
PAST PRESIDENTSMr Marco Biffi, Mr Mike de Koker, Mr Len deVilliers, Mr Bruce Doyle, Mr James J van Rensburg,Mr Dries Labuschagne, Mr Henry Moorcroft,Mr Vijay Nundlall, Mr Andrew Thomson,Mr Frank Von Glehn
BRANCH REPRESENTATIVES
The Collieries BranchMr Neil McPherson
The Free State BranchMr Johan Pienaar
The Northern BranchMr Billy Letlape
The Western BranchMr Brian Yates
The Eastern BranchMr Tsietsi Letanta
The International BranchMr Frank von Glehn
EDITORIAL COMMITTEE MEMBERSMr Marco Biffi (Hon. Editor), Mr Bruce Doyle,Mr Frank von Glehn, Mrs Cecelia Pretorius,Mrs Debbie Myer
SECRETARIALCSIR Property, Cnr Rustenburg and Carlow Road,EmmarentiaP O Box 291521 Melville 2109Tel: +27 11 482-7957 Fax: +27 11 482-7959 / 086 660 7171E-mail: [email protected]
[email protected]: http://www.mvssa.co.za
In South Africa, developments in the last eighteen months or so have seen againsome significant cuts in staff complements, affecting the discipline, driven by thesame monotonic drive to cut "costs" - quite literally at all costs. The irony is thatthe value of good ventilation practice is realised only once it is no longer availableand particularly in the aftermath of tragic incidents - that are sadly starting to beon the increase.
It is noted that initiatives from the recently established Wits Mining Institute have asmall ventilation component as part of the institute's mission to promote innovation and sustainability through the development of skills and technology.Furthermore, the recent launching of the CSIR's Mining Precinct, aimed at developing new people-centred technologies to empower mines and prepare themfor new mining methods, holds equally interesting promises for modern mining inthis part of the world. The question remains as to what role mine ventilation canplay, if any, in this "brave new world". The promotional material from both institutions speaks to mechanised mining, innovating techniques such as non-explosive rock breaking, rock mass behaviour, real-time information management,digital mining, communications systems, positioning, mapping and navigation,visual, environmental and rock monitoring. Ventilation possibly finds a home in thedigital environmental monitoring chapter and the ubiquitous health and safetytopics but is not mentioned much beyond that. Being provocative, ventilation doesnot seem to have (yet again?) a seat at this party and if there is one it is not obviousat this stage. The silver lining is that even machinery in a highly mechanised oreven automated mine, is not likely to enjoy high (or low) temperatures, highhumidity (or ice), dusty or even gassy environments. Therefore, a degree ofenvironmental control will be required for those new technologies as well.
Irrespective of these wishful considerations, until this new world becomes a reality,humans will be employed in hostile underground environments. Until the adventof automation, mining leadership must realise that a strong and competent mineventilation discipline is still needed. It is a fact that a good ventilation officer maynot add one ounce of mineral product to the bottom line directly. However, toproduce safely and efficiently, while realising that aspiration for zero harm,someone must provide and competently drive the thinking, the planning, andimplementation of environmental control systems so fundamental in achieving those goals.
Journal of the Mine Ventilation Society of South Africa,January/March 2018 3
ERRATA: BARENBRUG CHARTS, 4th EDITIONFollowing notification last year relating to printing errors and quality issues ofsome psychrometric charts published in the 4th Edition of "Psychrometry andPsychrometric Charts" By A. W. T. Barenbrug produced by the MVSSA, theSociety is in a position to replace the following:
Chart 3; 82.5kPa
Chart 4; 85.0kPa
Chart 5; 87.5 kPa
Chart 14; 110.0kPa
Chart 17; 117.5kPa
The above list includes all charts identified to be inaccurate.
Kindly contact the Secretary of the Society by email at [email protected] telephonically at 011 482 7957 with your contact details so that arrangements may be made to get replacement charts posted to you.
We apologise sincerely to affected students, members and clients who mayhave been inconvenienced by this error.
Marco Biffi Hon. Editor
Chart 18; 120.0kPa
Chart 19; 122.5kPa
Chart 20; 125.0kPa
Chart 21; 127.0kPa
The approach followed to conduct an "Exposure allocation methodology comparison study" on Respirable Quartz Concentration for quarterly leading indicator reporting purposes
ABSTRACT This paper discusses the approach that was followed to evaluateand compare the results from 5 different dose calculation methodologies to calculate and allocate employees' RespirableQuartz Concentration (RQC) exposure, when reporting"Quarterly Leading Indicators" to the Department of MineralResources (DMR).
The need for this project originated as it seemed that there is currently more than one method to calculate (and subsequentlyallocate) employees' RQC exposure when reporting "QuarterlyLeading Indicators" to the DMR.
1. INTRODUCTION1.1. Purpose
The purpose of the study is to conduct an "Exposureallocation/calculation methodology comparison study" forRespirable Quartz Concentration (RQC).
The need for this project originates as it seems that there is currently more than one method to calculate (and subsequentlyallocate) employees' RQC exposure when reporting "QuarterlyLeading Indicators" to the Department of Mineral Resources(DMR).
The aim of this project will be to compare the results obtainedfrom different exposure calculation and allocation methods.
2. PROJECT METHODOLOGY2.1. Project Site
One of the deep underground gold mines situated in theWitwatersrand (South Africa) area was selected as the projectmine.
The personal exposure to RQC data collected during 2014 wasutilised for this study.
Exactly the same personal dust exposure data was utilised in eachof the methods discussed in this report.
2.2. Method 1 (Method Currently Utilised by the Mine)
2.2.1. Exposure data
The exposure data of the current quarter was utilised to calculatethe exposure category (as per the method specified in the SouthAfrican Mines Occupational Hygiene Programme (SAMOHP)Code Book) for each Homogeneous Exposure Group (HEG) forthe specific quarter.
2.2.2. Statistical indicator
The exposure category for the HEG calculated by means of the90th percentile value of all samples collected during the quarterwithin the HEG.
2.2.3. Quartz analysis utilised
Allocate the average silica content, of all samples analysed duringthe previous year, as the only average silica content for the currentquarter.
2.2.4. RQC exposure allocation
All employees within the HEG are allocated the same exposurecategory as an indication of the exposure dose received for thespecific quarter.
2.3. Method 2
2.3.1. Exposure data
The exposure data of the current quarter was utilised to calculatethe exposure category (as per the method specified in the SouthAfrican Mines Occupational Hygiene Programme (SAMOHP)Code Book) for each Homogeneous Exposure Group (HEG) forthe specific quarter.
2.3.2. Statistical indicator
The exposure category for the HEG calculated by means of the90th percentile value of all samples collected during the quarterwithin the HEG.
2.3.3. Quartz analysis utilised
Allocate the actual analysis results for each sample submitted foranalysis during the quarter.
Samples analysed and found to be "Below Detection Limit" (BDL)are allocated a silica content equal to the average of all other samples analysed during the quarter for the specific HEG, as indicated in the table below:
2.3.4. RQC exposure allocation
All employees within the HEG are allocated the same exposurecategory as an indication of the RQC exposure received for thespecific quarter.
S. Wheeler1, K. Dekker2
1Sibanye Gold. 2KDOHC cc
Original paper presented at the 2016 MVSSA Conference
HEG Average Silica Content (%) of all Samples
Analysed during the Quarter
Q1 Q2 Q3 Q4 2014
Stoping 28.8 26.9 23.4 33.9 28.7
Development 24.7 20.3 23.3 23.7 23.2
Tramming 19.3 25.8 21.1 24.2 22.3
Shaft & Services 19.8 26.0 21.5 24.4 22.7
Roving UG 23.0 20.8 22.9 26.3 23.0
Roving Surface 16.3 25.9 28.7 14.3 20.3
4 Journal of the Mine Ventilation Society of South Africa, January/March 2018

2.4. Method 3
2.4.1. Exposure data
The exposure data of the current quarter was utilised to calculatethe exposure category (as per the method specified in the SouthAfrican Mines Occupational Hygiene Programme (SAMOHP)Code Book) for each Homogeneous Exposure Group (HEG) forthe specific quarter.
2.4.2. Statistical indicator
The exposure category for the HEG calculated by means of theaverage/mean value of all samples collected during the quarterwithin the HEG.
2.4.3. Quartz analysis utilised
Allocate the average silica content, of all samples analysed duringthe previous year, as the only average silica content for the currentquarter.
2.4.4. RQC exposure allocation
All employees within the HEG are allocated the same exposurecategory as an indication of the exposure received for the specificquarter.
2.5. Method 4
2.5.1. Exposure data
The exposure data of the current quarter was utilised to calculatethe exposure category (as per the method specified in the SouthAfrican Mines Occupational Hygiene Programme (SAMOHP)Code Book) for each Homogeneous Exposure Group (HEG) forthe specific quarter.
2.5.2. Statistical indicator
The exposure category for the HEG calculated by means of theaverage/mean value of all samples collected during the quarterwithin the HEG.
2.5.3. Quartz analysis utilised
Allocate the actual analysis results for each sample submitted foranalysis during the quarter.
Samples analysed and found to be "Below Detection Limit" (BDL)are allocated a silica content equal to the average of all other samples analysed during the quarter for the specific HEG, as indicated in the previous table.
2.5.4. RQC exposure allocation
All employees within the HEG are allocated the same exposurecategory as an indication of the exposure received for the specificquarter.
2.6. Method 5
2.6.1. Exposure data
The exposure data of the current quarter was utilised to calculatethe exposure category (as per the method specified in the SouthAfrican Mines Occupational Hygiene Programme (SAMOHP)Code Book) for each Occupation for the specific quarter.
2.6.2. Statistical indicator
The exposure category for the occupation calculated by means ofthe average/mean value of all samples collected during the quarter within the occupation group.
2.6.3. Quartz analysis utilised
Allocate the actual analysis results for each sample submitted foranalysis during the quarter.
2.6.4. RQC exposure allocation
All employees subjected to personal sampling, within the occupation and within the quarter, are allocated the precise sampled RQC for that quarter.
All employees NOT subjected to personal sampling, within theoccupation and within the quarter, are allocated theaverage/mean RQC of all employees sampled within that occupation group during the quarter.
Please note that due to the manual calculation process required totest this method, this method was only tested for the Stoping HEG.
3. RESULTS3.1. Method 1 (Method currently utilised by the mine)
The calculated statistical indicators which resulted from employing the calculation methodology described in Section 2.2 ofthis paper, are summarised as Table 1.
3.2. Method 2
The calculated statistical indicators, which resulted from employing the calculation methodology described in Section 2.3 ofthis paper, are summarised as Table 2.
RQC for 2014STOPING
Q1 Q2 Q3 Q4Value 0.1061 0.1331 0.1007 0.0925
90th Percentile Category A A A BNo. of Employees 832 832 832 832
RQC for 2014DEV
Q1 Q2 Q3 Q4Value 0.1509 0.0811 0.0589 0.0523
90th Percentile Category A B B BNo. of Employees 267 267 267 267
RQC for 2014TRAMMING
Q1 Q2 Q3 Q4Value 0.0737 0.0538 0.0426 0.0635
90th Percentile Category B B C BNo. of Employees 197 197 197 197
RQC for 2014SHAFT & SERV
Q1 Q2 Q3 Q4Value 0.0456 0.0481 0.0445 0.0567
90th Percentile Category C C C BNo. of Employees 279 279 279 279
RQC for 2014ROVING UG
Q1 Q2 Q3 Q4Value 0.0680 0.0570 0.0489 0.0726
90th Percentile Category B B C BNo. of Employees 590 590 590 590
RQC for 2014ROVING SURFACE
Q1 Q2 Q3 Q4Value 0.0292 0.0468 0.0292 0.0321
90th Percentile Category C C C CNo. of Employees 56 56 56 56
Total Employees 2221
Table 1. Calculated Statistical Indicators per HEG for Method 1
Journal of the Mine Ventilation Society of South Africa,January/March 2018 5
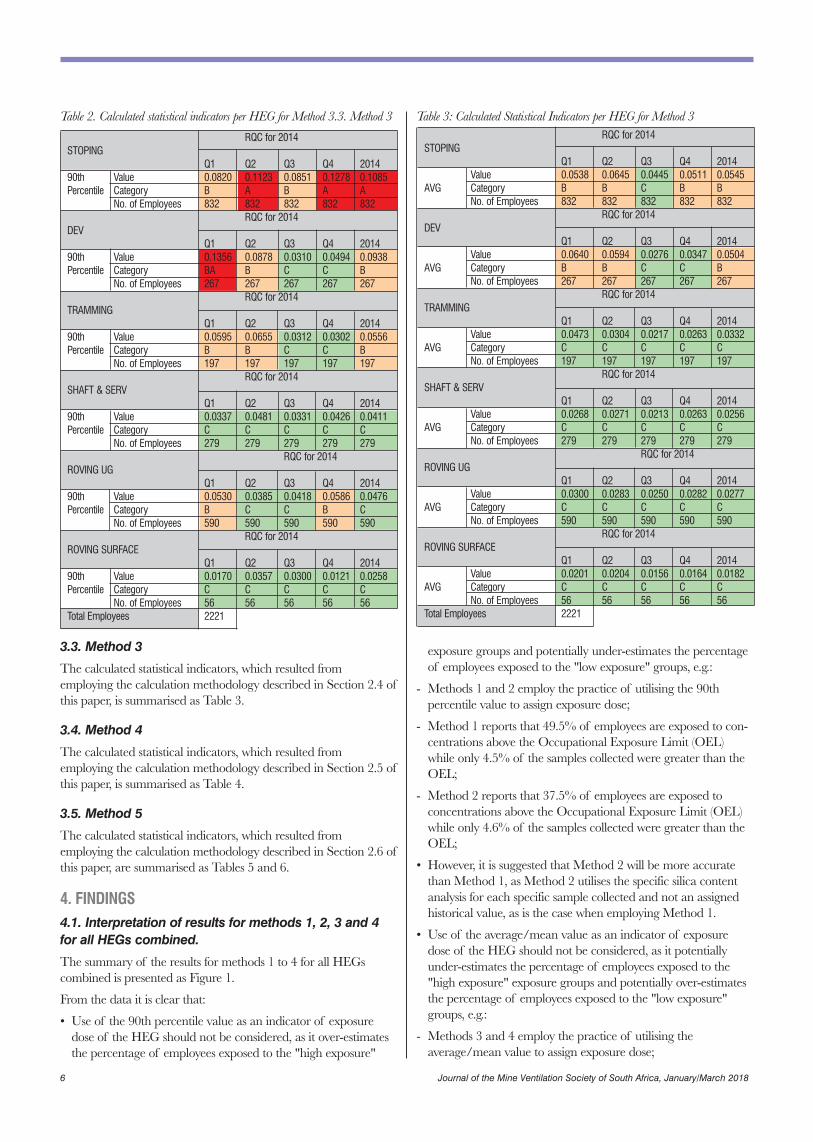
Table 2. Calculated statistical indicators per HEG for Method 3.3. Method 3
3.3. Method 3
The calculated statistical indicators, which resulted from employing the calculation methodology described in Section 2.4 ofthis paper, is summarised as Table 3.
3.4. Method 4
The calculated statistical indicators, which resulted from employing the calculation methodology described in Section 2.5 ofthis paper, is summarised as Table 4.
3.5. Method 5
The calculated statistical indicators, which resulted from employing the calculation methodology described in Section 2.6 ofthis paper, are summarised as Tables 5 and 6.
4. FINDINGS4.1. Interpretation of results for methods 1, 2, 3 and 4for all HEGs combined.
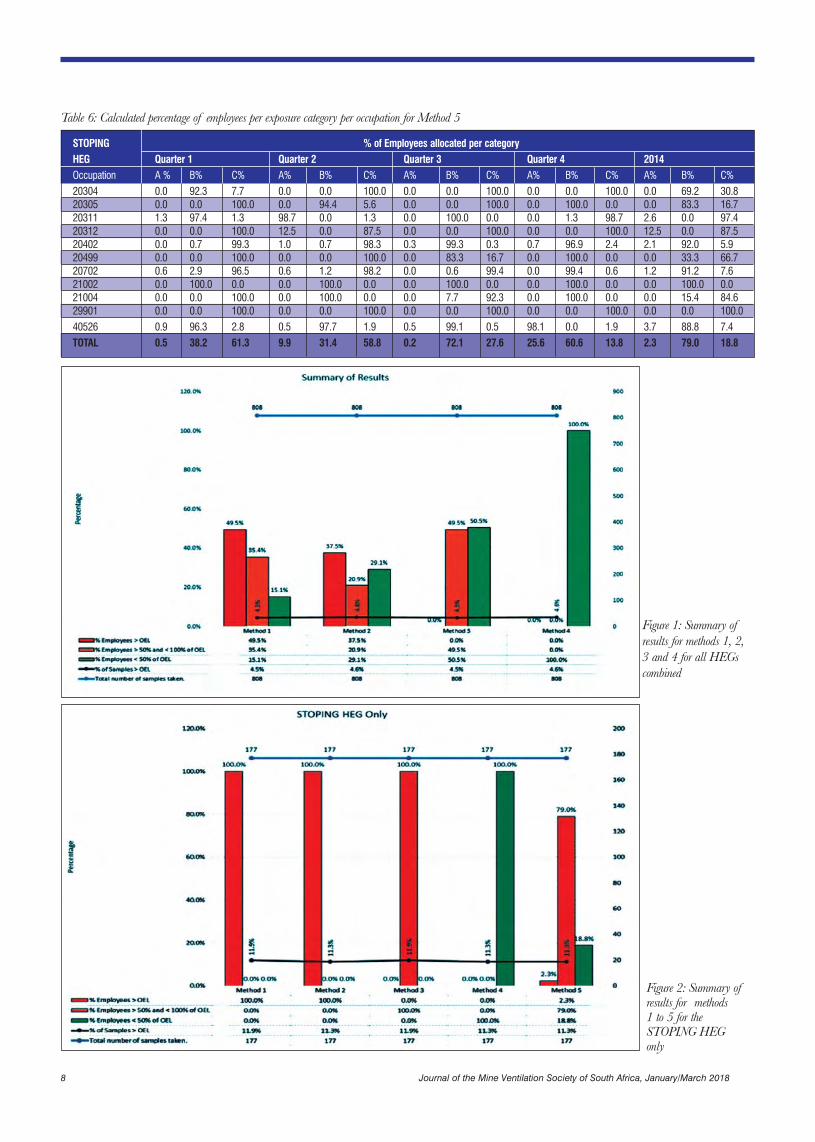
The summary of the results for methods 1 to 4 for all HEGs combined is presented as Figure 1.
From the data it is clear that:
• Use of the 90th percentile value as an indicator of exposuredose of the HEG should not be considered, as it over-estimatesthe percentage of employees exposed to the "high exposure"
exposure groups and potentially under-estimates the percentageof employees exposed to the "low exposure" groups, e.g.:
- Methods 1 and 2 employ the practice of utilising the 90th percentile value to assign exposure dose;
- Method 1 reports that 49.5% of employees are exposed to con-centrations above the Occupational Exposure Limit (OEL)while only 4.5% of the samples collected were greater than theOEL;
- Method 2 reports that 37.5% of employees are exposed to concentrations above the Occupational Exposure Limit (OEL)while only 4.6% of the samples collected were greater than theOEL;
• However, it is suggested that Method 2 will be more accuratethan Method 1, as Method 2 utilises the specific silica contentanalysis for each specific sample collected and not an assignedhistorical value, as is the case when employing Method 1.
• Use of the average/mean value as an indicator of exposuredose of the HEG should not be considered, as it potentiallyunder-estimates the percentage of employees exposed to the"high exposure" exposure groups and potentially over-estimatesthe percentage of employees exposed to the "low exposure"groups, e.g.:
- Methods 3 and 4 employ the practice of utilising theaverage/mean value to assign exposure dose;
Table 3: Calculated Statistical Indicators per HEG for Method 3RQC for 2014
STOPINGQ1 Q2 Q3 Q4 2014
Value 0.0538 0.0645 0.0445 0.0511 0.0545AVG Category B B C B B
No. of Employees 832 832 832 832 832RQC for 2014
DEVQ1 Q2 Q3 Q4 2014
Value 0.0640 0.0594 0.0276 0.0347 0.0504AVG Category B B C C B
No. of Employees 267 267 267 267 267RQC for 2014
TRAMMINGQ1 Q2 Q3 Q4 2014
Value 0.0473 0.0304 0.0217 0.0263 0.0332AVG Category C C C C C
No. of Employees 197 197 197 197 197RQC for 2014
SHAFT & SERVQ1 Q2 Q3 Q4 2014
Value 0.0268 0.0271 0.0213 0.0263 0.0256AVG Category C C C C C
No. of Employees 279 279 279 279 279RQC for 2014
ROVING UGQ1 Q2 Q3 Q4 2014
Value 0.0300 0.0283 0.0250 0.0282 0.0277AVG Category C C C C C
No. of Employees 590 590 590 590 590RQC for 2014
ROVING SURFACEQ1 Q2 Q3 Q4 2014
Value 0.0201 0.0204 0.0156 0.0164 0.0182AVG Category C C C C C
No. of Employees 56 56 56 56 56Total Employees 2221
RQC for 2014STOPING
Q1 Q2 Q3 Q4 201490th Value 0.0820 0.1123 0.0851 0.1278 0.1085Percentile Category B A B A A
No. of Employees 832 832 832 832 832RQC for 2014
DEVQ1 Q2 Q3 Q4 2014
90th Value 0.1356 0.0878 0.0310 0.0494 0.0938Percentile Category BA B C C B
No. of Employees 267 267 267 267 267RQC for 2014
TRAMMINGQ1 Q2 Q3 Q4 2014
90th Value 0.0595 0.0655 0.0312 0.0302 0.0556Percentile Category B B C C B
No. of Employees 197 197 197 197 197RQC for 2014
SHAFT & SERVQ1 Q2 Q3 Q4 2014
90th Value 0.0337 0.0481 0.0331 0.0426 0.0411Percentile Category C C C C C
No. of Employees 279 279 279 279 279RQC for 2014
ROVING UGQ1 Q2 Q3 Q4 2014
90th Value 0.0530 0.0385 0.0418 0.0586 0.0476Percentile Category B C C B C
No. of Employees 590 590 590 590 590RQC for 2014
ROVING SURFACEQ1 Q2 Q3 Q4 2014
90th Value 0.0170 0.0357 0.0300 0.0121 0.0258Percentile Category C C C C C
No. of Employees 56 56 56 56 56Total Employees 2221
6 Journal of the Mine Ventilation Society of South Africa, January/March 2018
analysis for each specific sample collected and not an assignedhistorical value, as is the case when employing Method 3.
4.2. Interpretation of results for methods 1 to 5 for theSTOPING HEG only.
The summary of the results for Methods 1to 5 for the StopingHEG only, is presented as Figure 2. From the data above it is clearthat:
• Use of the 90th percentile value as an indicator of exposuredose of the HEG should not be considered, as it over-estimatesthe percentage of employees exposed to the "high exposure"exposure groups and potentially under-estimates the percentageof employees exposed to the "low exposure" groups, e.g.:
- Methods 1 and 2 employ the practice of utilising the 90th percentile value to assign exposure dose;
- Method 1 reports that 100% of employees are exposed to concentrations above the Occupational Exposure Limit (OEL)while only 11.9% of the samples collected were greater than theOEL;
- Method 2 also reports that 100% of employees are exposed toconcentrations above the Occupational Exposure Limit (OEL)while only 11.3% of the samples collected were greater than theOEL;
- However, it is suggested that Method 2 will be more accuratethan Method 1, as Method 2 utilises the specific silica contentanalysis for each specific sample collected and not an assignedhistorical value, as is the case when employing Method 1.
• Use of the average/mean value as an indicator of exposuredose of the HEG should not be considered, as it potentiallyunder-estimates the percentage of employees exposed to the"high exposure" exposure groups and potentially over-estimatesthe percentage of employees exposed to the "low exposure"groups, e.g.:
- Methods 3 and 4 employ the practice of utilising the average /mean value to assign exposure dose;
- Method 3 reports that 100% of the employees are exposed toconcentrations between 50% and 100% of the OEL. However,11.9% of the samples collected were greater than the OEL,resulting in "over-exposures" being "masked" from the reporteddata;
Table 4: Calculated Statistical Indicators per HEG for Method 43.5. Method 5RQC for 2014
STOPINGQ1 Q2 Q3 Q4 2014
Value 0.0449 0.0551 0.0349 0.0568 0.0493AVG Category C B C B C
No. of Employees 832 832 832 832 832RQC for 2014
DEVQ1 Q2 Q3 Q4 2014
Value 0.0513 0.0514 0.0190 0.0299 0.0411AVG Category B B C C C
No. of Employees 267 267 267 267 267RQC for 2014
TRAMMINGQ1 Q2 Q3 Q4 2014
Value 0.0276 0.0305 0.0166 0.0234 0.0247AVG Category C C C C C
No. of Employees 197 197 197 197 197RQC for 2014
SHAFT & SERVQ1 Q2 Q3 Q4 2014
Value 0.0210 0.0251 0.0167 0.0221 0.0214AVG Category C C C C C
No. of Employees 279 279 279 279 279RQC for 2014
ROVING UGQ1 Q2 Q3 Q4 2014
Value 0.0239 0.0186 0.0216 0.0245 0.0221AVG Category C C C C C
No. of Employees 590 590 590 590 590RQC for 2014
ROVING SURFACEQ1 Q2 Q3 Q4 2014
Value 0.0118 0.0186 0.0160 0.0082 0.0133AVG Category C C C C C
No. of Employees 56 56 56 56 56Total Employees 2221
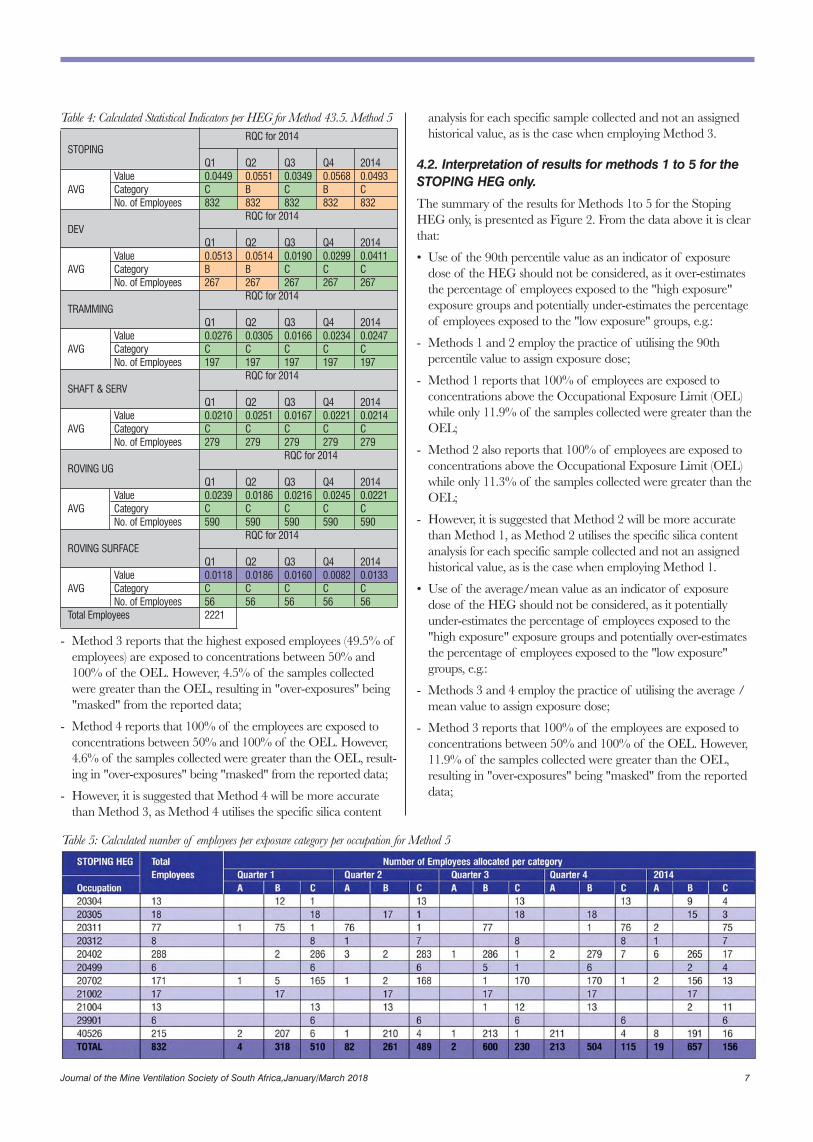
Table 5: Calculated number of employees per exposure category per occupation for Method 5
- Method 3 reports that the highest exposed employees (49.5% ofemployees) are exposed to concentrations between 50% and100% of the OEL. However, 4.5% of the samples collectedwere greater than the OEL, resulting in "over-exposures" being"masked" from the reported data;
- Method 4 reports that 100% of the employees are exposed toconcentrations between 50% and 100% of the OEL. However,4.6% of the samples collected were greater than the OEL, result-ing in "over-exposures" being "masked" from the reported data;
- However, it is suggested that Method 4 will be more accuratethan Method 3, as Method 4 utilises the specific silica content
Journal of the Mine Ventilation Society of South Africa,January/March 2018 7
STOPING % of Employees allocated per categoryHEG Quarter 1 Quarter 2 Quarter 3 Quarter 4 2014Occupation A % B% C% A% B% C% A% B% C% A% B% C% A% B% C%
20304 0.0 92.3 7.7 0.0 0.0 100.0 0.0 0.0 100.0 0.0 0.0 100.0 0.0 69.2 30.820305 0.0 0.0 100.0 0.0 94.4 5.6 0.0 0.0 100.0 0.0 100.0 0.0 0.0 83.3 16.720311 1.3 97.4 1.3 98.7 0.0 1.3 0.0 100.0 0.0 0.0 1.3 98.7 2.6 0.0 97.420312 0.0 0.0 100.0 12.5 0.0 87.5 0.0 0.0 100.0 0.0 0.0 100.0 12.5 0.0 87.520402 0.0 0.7 99.3 1.0 0.7 98.3 0.3 99.3 0.3 0.7 96.9 2.4 2.1 92.0 5.920499 0.0 0.0 100.0 0.0 0.0 100.0 0.0 83.3 16.7 0.0 100.0 0.0 0.0 33.3 66.720702 0.6 2.9 96.5 0.6 1.2 98.2 0.0 0.6 99.4 0.0 99.4 0.6 1.2 91.2 7.621002 0.0 100.0 0.0 0.0 100.0 0.0 0.0 100.0 0.0 0.0 100.0 0.0 0.0 100.0 0.021004 0.0 0.0 100.0 0.0 100.0 0.0 0.0 7.7 92.3 0.0 100.0 0.0 0.0 15.4 84.629901 0.0 0.0 100.0 0.0 0.0 100.0 0.0 0.0 100.0 0.0 0.0 100.0 0.0 0.0 100.0
40526 0.9 96.3 2.8 0.5 97.7 1.9 0.5 99.1 0.5 98.1 0.0 1.9 3.7 88.8 7.4
TOTAL 0.5 38.2 61.3 9.9 31.4 58.8 0.2 72.1 27.6 25.6 60.6 13.8 2.3 79.0 18.8
Table 6: Calculated percentage of employees per exposure category per occupation for Method 5
Figure 1: Summary ofresults for methods 1, 2,3 and 4 for all HEGs combined
Figure 2: Summary ofresults for methods 1 to 5 for the STOPING HEG only
8 Journal of the Mine Ventilation Society of South Africa, January/March 2018
- Method 4 reports that 100% of the employees are exposed toconcentrations between 10% and 50% of the OEL. However,11.3% of the samples collected were greater than the OEL,resulting in "over-exposures" being "masked" from the reporteddata;
- However, it is suggested that Method 4 will be more accuratethan Method 3, as Method 4 utilises the specific silica contentanalysis for each specific sample collected and not an assignedhistorical value, as is the case when employing Method 3.
• Use of the average/mean value as an indicator of exposuredose of the occupation could potentially be considered as anindicator of exposure dose, e.g.:
- Method 5 employs the practice of utilising the average/meanvalue to assign exposure dose per occupation to those employeesthat were not subjected to sampling during the quarter;
- Method 5 reports that:
* 2.3% of the employees are exposed to concentrations greaterthan the OEL;
* 79.0% of the employees are exposed to concentrationsbetween 50% and 100% of the OEL; and
* 18.8% of the employees are exposed to concentrationsbetween 10% and 50% of the OEL
- However, 11.3% of the samples collected were greater than theOEL. This can occur when a specific occupation are exposed tohigh concentrations, but the total number of employees in the
occupation represent a small number of employees when compared to the total number of employees in the HEG.
5. RECOMMENDATIONSIt is suspected that a number of different calculation methods(different from those discussed in this report) can still be explored.
It is the opinion of the authors of this paper that:
- The current method employed by the mine for "MilestoneReporting" purposes (Method 1) over-estimates employees exposure and therefore the exposure categories of such employees;
- The current practice of utilising historical silica quartz analysisresults for dose allocation purposes (e.g. utilising 2013 silica analysis results for 2014 dose allocation purposes) should be discontinued with;
- The method, described as Method 5 in this re-port, would represent a more accurate method for "Milestone Reporting"purposes.
It is recommended that the content and finding of this reportshould be discussed on a national level to assist all stakeholders indeveloping a uniform method of results calculation for LeadingIndicator reporting purposes.
6. ACKNOWLEDGEMENT The authors would like to thank the Management of SibanyeGold for permission to present this paper
Journal of the Mine Ventilation Society of South Africa,January/March 2018 9
M. Hooman, W. Marx and F.H. von GlehnBBE Consulting, Johannesburg, South Africa
ABSTRACT Block cave mining operations are widely used for the extraction ofsteep to vertical orebodies typically found in diamond and basemetal deposits. Block caving permits large volumes of ore to be extracted relatively cheaply, increasing production and makinglower grade ore bodies economical to mine. These mines are constructed in two main phases, i.e. capital development phaseand full production phase.
When considering ventilation engineering planning, it is essentialthat the mine layout and plan are correctly understood for bothphases. Depending on mining schedule and design, ventilationengineering challenges include airflow profiles that typically havepeaks during capital development when the apex and/or under-cut, extraction, haulage and ore transport levels require manydevelopment ends to be ventilated simultaneously.
Various mines were investigated for similarities and differences inmining layout, ore handling and ventilation engineering. Thepaper summarises ventilation and cooling techniques that wereidentified that can be employed to optimise block cave mines toensure fit-for-purpose mine ventilation designs.
1. INTRODUCTIONBlock caving is generally considered when open pit mines becomeexhausted and extension of the mining operations is required.Block caving is a well-established underground hard rock miningmethod that can be utilised for near-vertical orebodies.
A block cave is established a few hundred meters below the openpit operation and progressively collapses under its own weight andgravity (Figure 1).
Block caving ensures extraction of large volumes of ore at a
Block cave mine ventilation optimisation techniques
reasonable cost and with the increased production rates; low-gradeorebodies can now be more economical to mine.
This mining method is more efficient than any other undergroundmining method and is being considered more frequently world-wide.
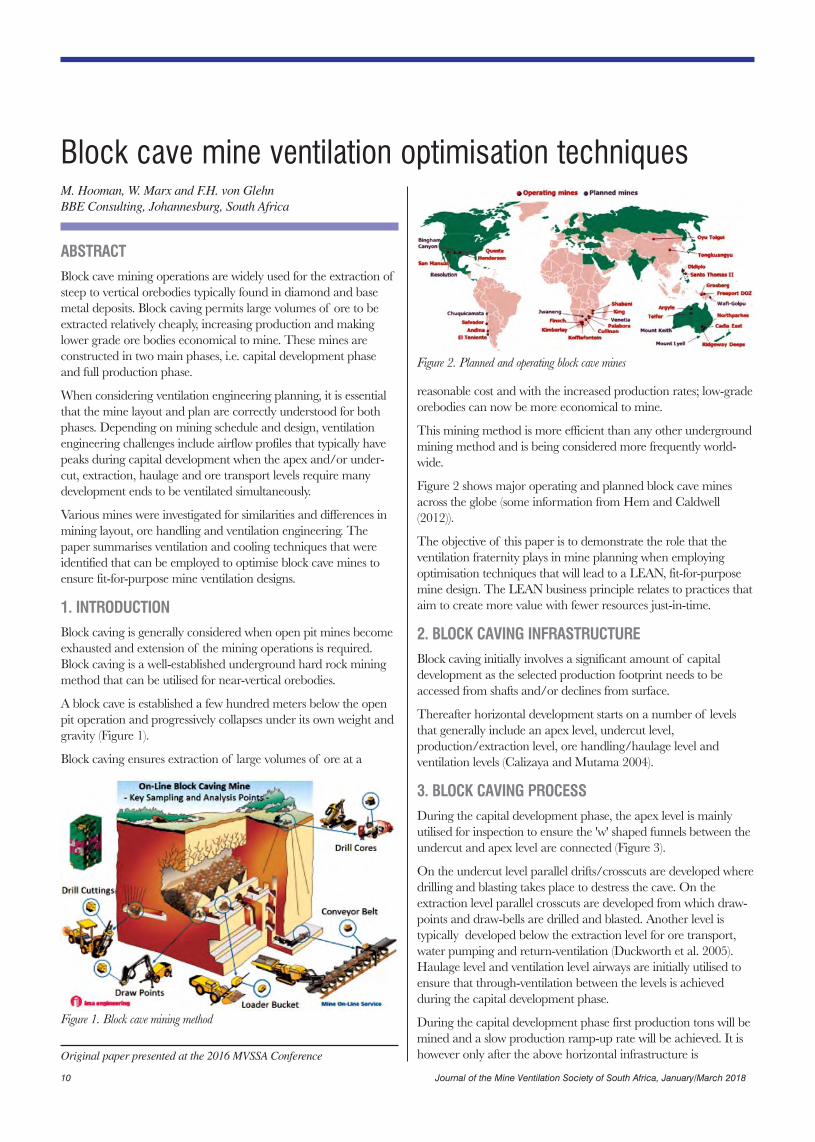
Figure 2 shows major operating and planned block cave minesacross the globe (some information from Hem and Caldwell(2012)).
The objective of this paper is to demonstrate the role that the ventilation fraternity plays in mine planning when employing optimisation techniques that will lead to a LEAN, fit-for-purposemine design. The LEAN business principle relates to practices thataim to create more value with fewer resources just-in-time.
2. BLOCK CAVING INFRASTRUCTUREBlock caving initially involves a significant amount of capital development as the selected production footprint needs to beaccessed from shafts and/or declines from surface.
Thereafter horizontal development starts on a number of levelsthat generally include an apex level, undercut level,production/extraction level, ore handling/haulage level and ventilation levels (Calizaya and Mutama 2004).
3. BLOCK CAVING PROCESSDuring the capital development phase, the apex level is mainlyutilised for inspection to ensure the 'w' shaped funnels between theundercut and apex level are connected (Figure 3).
On the undercut level parallel drifts/crosscuts are developed wheredrilling and blasting takes place to destress the cave. On the extraction level parallel crosscuts are developed from which draw-points and draw-bells are drilled and blasted. Another level is typically developed below the extraction level for ore transport,water pumping and return-ventilation (Duckworth et al. 2005).Haulage level and ventilation level airways are initially utilised toensure that through-ventilation between the levels is achieved during the capital development phase.
During the capital development phase first production tons will bemined and a slow production ramp-up rate will be achieved. It ishowever only after the above horizontal infrastructure is Original paper presented at the 2016 MVSSA Conference
Figure 2. Planned and operating block cave mines
Figure 1. Block cave mining method
10 Journal of the Mine Ventilation Society of South Africa, January/March 2018
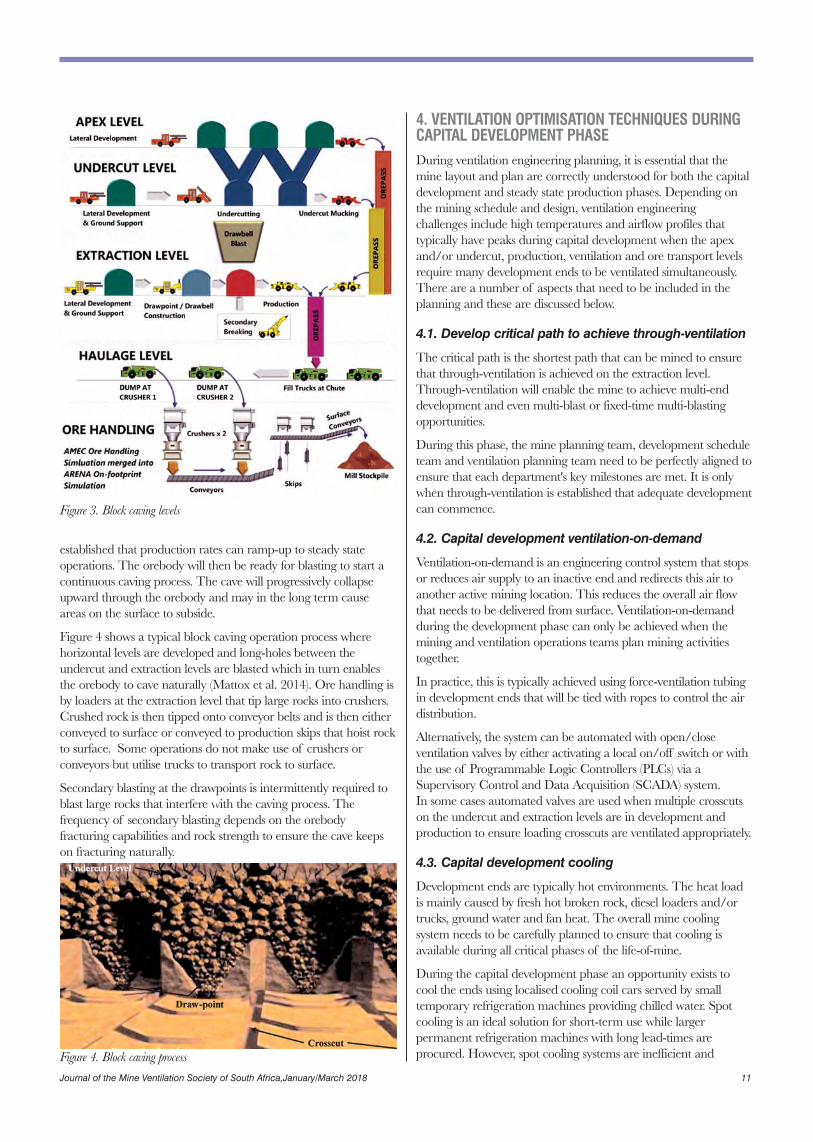
established that production rates can ramp-up to steady state operations. The orebody will then be ready for blasting to start acontinuous caving process. The cave will progressively collapseupward through the orebody and may in the long term causeareas on the surface to subside.
Figure 4 shows a typical block caving operation process where horizontal levels are developed and long-holes between the undercut and extraction levels are blasted which in turn enablesthe orebody to cave naturally (Mattox et al. 2014). Ore handling isby loaders at the extraction level that tip large rocks into crushers.Crushed rock is then tipped onto conveyor belts and is then eitherconveyed to surface or conveyed to production skips that hoist rockto surface. Some operations do not make use of crushers or conveyors but utilise trucks to transport rock to surface.
Secondary blasting at the drawpoints is intermittently required toblast large rocks that interfere with the caving process. Thefrequency of secondary blasting depends on the orebody fracturing capabilities and rock strength to ensure the cave keepson fracturing naturally.
Figure 4. Block caving process
4. VENTILATION OPTIMISATION TECHNIQUES DURINGCAPITAL DEVELOPMENT PHASEDuring ventilation engineering planning, it is essential that themine layout and plan are correctly understood for both the capitaldevelopment and steady state production phases. Depending onthe mining schedule and design, ventilation engineering challenges include high temperatures and airflow profiles that typically have peaks during capital development when the apexand/or undercut, production, ventilation and ore transport levelsrequire many development ends to be ventilated simultaneously.There are a number of aspects that need to be included in theplanning and these are discussed below.
4.1. Develop critical path to achieve through-ventilation
The critical path is the shortest path that can be mined to ensurethat through-ventilation is achieved on the extraction level.Through-ventilation will enable the mine to achieve multi-enddevelopment and even multi-blast or fixed-time multi-blastingopportunities.
During this phase, the mine planning team, development scheduleteam and ventilation planning team need to be perfectly aligned toensure that each department's key milestones are met. It is onlywhen through-ventilation is established that adequate developmentcan commence.
4.2. Capital development ventilation-on-demand
Ventilation-on-demand is an engineering control system that stopsor reduces air supply to an inactive end and redirects this air toanother active mining location. This reduces the overall air flowthat needs to be delivered from surface. Ventilation-on-demandduring the development phase can only be achieved when themining and ventilation operations teams plan mining activitiestogether.
In practice, this is typically achieved using force-ventilation tubingin development ends that will be tied with ropes to control the airdistribution.
Alternatively, the system can be automated with open/close ventilation valves by either activating a local on/off switch or withthe use of Programmable Logic Controllers (PLCs) via aSupervisory Control and Data Acquisition (SCADA) system.In some cases automated valves are used when multiple crosscutson the undercut and extraction levels are in development and production to ensure loading crosscuts are ventilated appropriately.
4.3. Capital development cooling
Development ends are typically hot environments. The heat loadis mainly caused by fresh hot broken rock, diesel loaders and/ortrucks, ground water and fan heat. The overall mine cooling system needs to be carefully planned to ensure that cooling is available during all critical phases of the life-of-mine.
During the capital development phase an opportunity exists tocool the ends using localised cooling coil cars served by small temporary refrigeration machines providing chilled water. Spotcooling is an ideal solution for short-term use while larger permanent refrigeration machines with long lead-times are procured. However, spot cooling systems are inefficient and
Figure 3. Block caving levels
Journal of the Mine Ventilation Society of South Africa,January/March 2018 11
difficult to maintain over prolonged periods, and if the temporaryrefrigeration machines are located underground, they require access to return airways to enable heat from the refrigerationmachine to be rejected.
Figure 5. Bank of cooling coils
4.4. Thermal design criteria
Thermal design criteria are specified to ensure acceptable workingconditions and efficient operation during the life-of-mine. Capitaldevelopment is the worst period in a block cave mine's life in termsof pressures on the thermal environment. During this periodextensive development and production ramp-up take place but therequired infrastructure (such as refrigeration equipment and mainfans) has not yet been fully established.
To assist with the setting up of the mine's infrastructure and toenable steady state production to be established sooner,owners/operators can consider a temporary relaxation of under-ground reject temperature criteria. Application and risk management procedures have to be drafted and presented to theregulatory authorities for approval. The risks associated with anytemporary relaxation need to be acknowledged and can includeheat stress and heat stroke incidents. These risks need to be included in a heat stress management plan.
4.5. Heat stress management
HSM involves heat tolerance screening, work-rest cycles, nutritionand hydration regimes, medical surveillance, acclimatisation, etc.Heat stress management (HSM) is generally a feature in hot deepmines where auto-compression, high rock geothermal properties,high production rates, etc. are encountered.
HSM enables the mining operation to operate in high reject temperatures (typically above 27.5°Cwb) and needs to be carefullymonitored, measured and recorded. As part of a HSM plan, shiftcycles should also be assessed to ensure that safe and healthy practices are employed for both short and long-term operations(Kielblock 1992). Functional work assessment could be implemented in addition to the above to ensure overall physicalwork fitness.
4.6. Economic airway and vertical hole design
Capital development includes the development of vertical fresh airand return air passes between surface and the mining footprint.These vertical holes are then connected to the block cave bymeans of horizontal airways.
Economic velocities of the vertical holes and the horizontal air-ways need be determined to ensure that capital/development costsand operating cost provide a positive net present value.
5. VENTILATION OPTIMISATION TECHNIQUES DURINGSTEADY STATE PRODUCTIONDuring steady state production all capital development activitiesare completed and the cave naturally yields under gravity.
In some instances secondary breaking is required to blast largerocks to enhance the natural caving process.
This section investigates various approaches that can be followedin ventilation engineering, ore handling and mining layout.
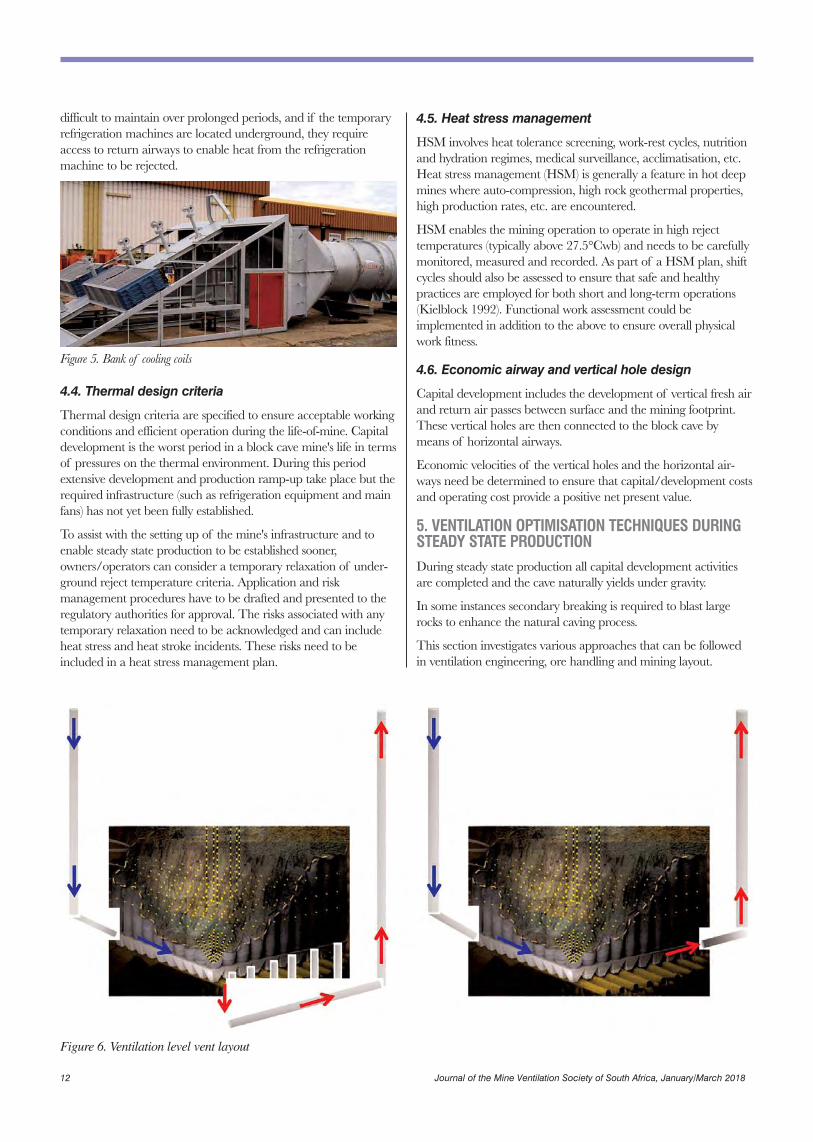
Figure 6. Ventilation level vent layout
12 Journal of the Mine Ventilation Society of South Africa, January/March 2018
5.1. Vent distribution
Figure indicated that a block cave mine typically consists of fivelevels; apex, undercut, extraction, haulage and ore handling levels.Apex and undercut levels are caved during steady state productionand thus three main levels remain that need to be ventilated continuously. In some instances the apex and undercut levels willbe ventilated for longer with some air to ensure that mining personnel can inspect holings from the extraction level.
The main ventilated levels are complimented with a ventilationlevel that is dedicated to warm dusty exhaust air. The haulage levelis sometimes constructed adjacent to the extraction level and boththese levels are generally in fresh air.
Ventilation of the cave is generally from one side of the miningfootprint to the other side of the mine through parallel crosscutairways. Air can either be directed to a ventilation level below theextraction level (Figure 6A) or the ventilation level can be situatedon the same level if the mining footprint allows (Figure 6B). Thelatter will result in reduced development and no vertical return airpasses will be constructed.
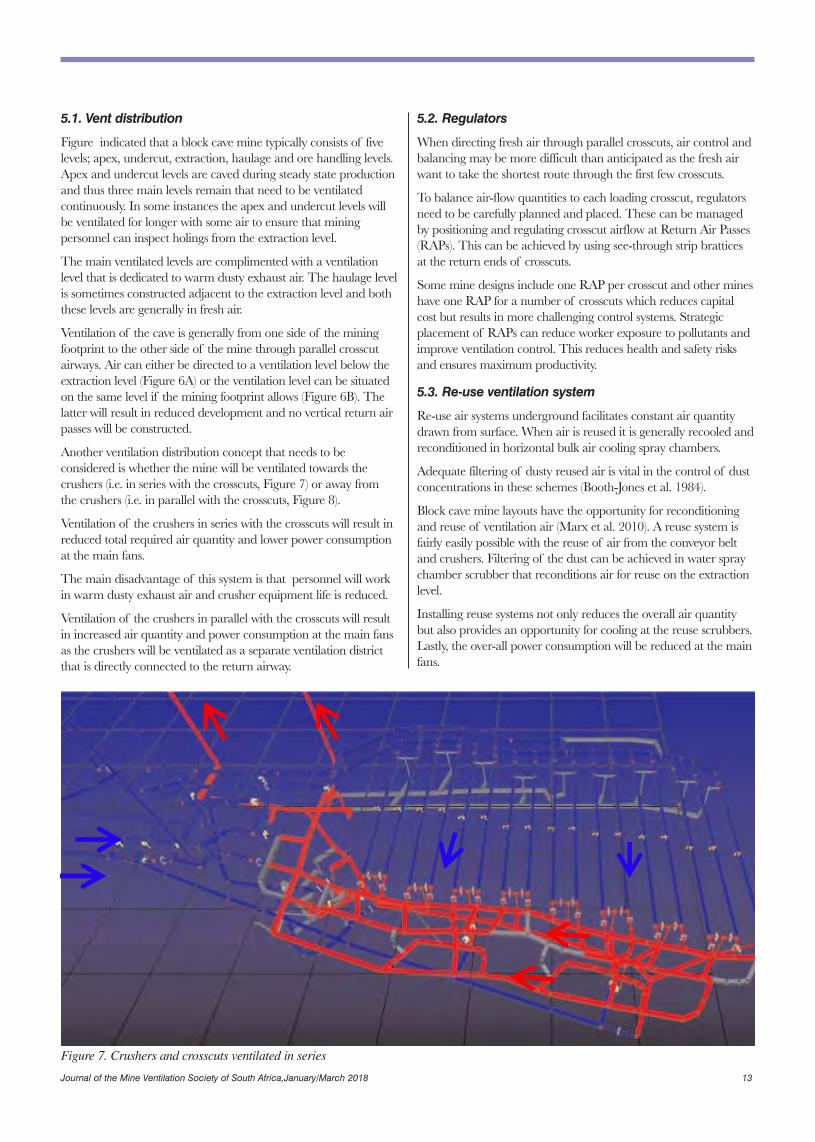
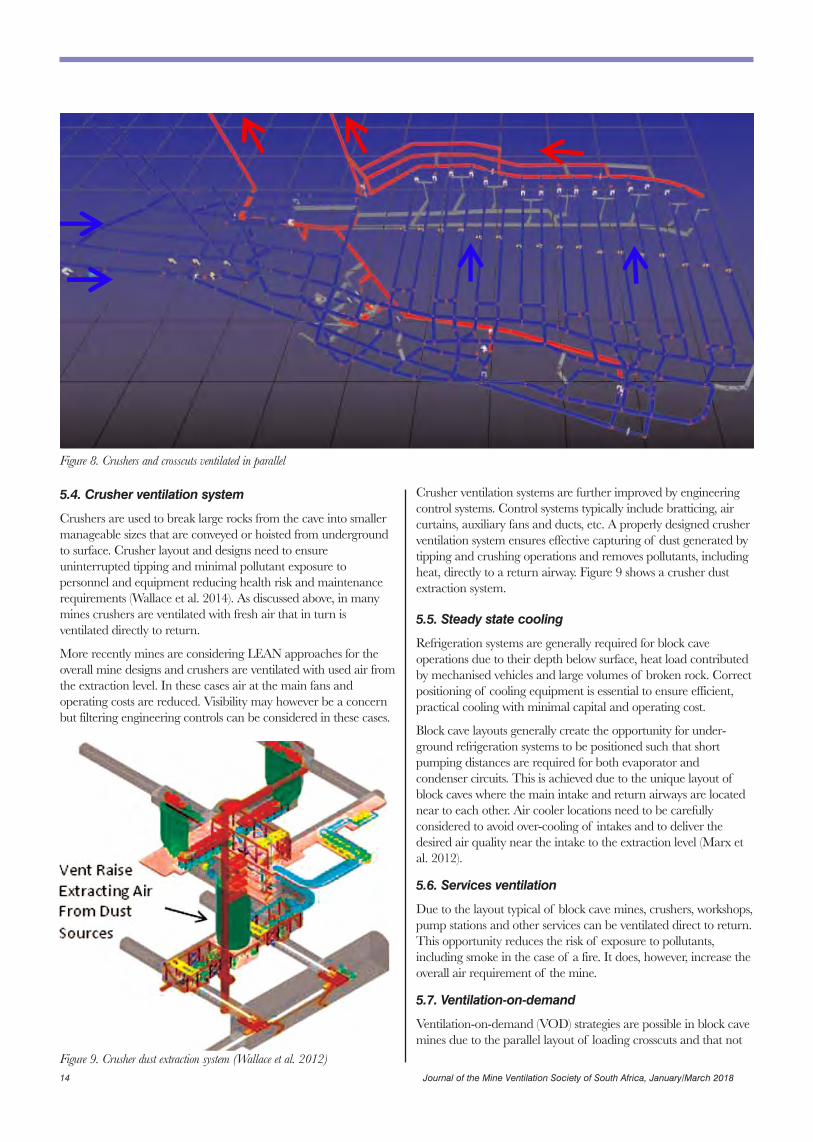
Another ventilation distribution concept that needs to be considered is whether the mine will be ventilated towards thecrushers (i.e. in series with the crosscuts, Figure 7) or away fromthe crushers (i.e. in parallel with the crosscuts, Figure 8).
Ventilation of the crushers in series with the crosscuts will result inreduced total required air quantity and lower power consumptionat the main fans.
The main disadvantage of this system is that personnel will workin warm dusty exhaust air and crusher equipment life is reduced.
Ventilation of the crushers in parallel with the crosscuts will resultin increased air quantity and power consumption at the main fansas the crushers will be ventilated as a separate ventilation districtthat is directly connected to the return airway.
5.2. Regulators
When directing fresh air through parallel crosscuts, air control andbalancing may be more difficult than anticipated as the fresh airwant to take the shortest route through the first few crosscuts.
To balance air-flow quantities to each loading crosscut, regulatorsneed to be carefully planned and placed. These can be managedby positioning and regulating crosscut airflow at Return Air Passes(RAPs). This can be achieved by using see-through strip bratticesat the return ends of crosscuts.
Some mine designs include one RAP per crosscut and other mineshave one RAP for a number of crosscuts which reduces capitalcost but results in more challenging control systems. Strategicplacement of RAPs can reduce worker exposure to pollutants andimprove ventilation control. This reduces health and safety risksand ensures maximum productivity.
5.3. Re-use ventilation system
Re-use air systems underground facilitates constant air quantitydrawn from surface. When air is reused it is generally recooled andreconditioned in horizontal bulk air cooling spray chambers.
Adequate filtering of dusty reused air is vital in the control of dustconcentrations in these schemes (Booth-Jones et al. 1984).
Block cave mine layouts have the opportunity for reconditioningand reuse of ventilation air (Marx et al. 2010). A reuse system isfairly easily possible with the reuse of air from the conveyor beltand crushers. Filtering of the dust can be achieved in water spraychamber scrubber that reconditions air for reuse on the extractionlevel.
Installing reuse systems not only reduces the overall air quantitybut also provides an opportunity for cooling at the reuse scrubbers.Lastly, the over-all power consumption will be reduced at the mainfans.
Figure 7. Crushers and crosscuts ventilated in series
Journal of the Mine Ventilation Society of South Africa,January/March 2018 13
5.4. Crusher ventilation system
Crushers are used to break large rocks from the cave into smallermanageable sizes that are conveyed or hoisted from undergroundto surface. Crusher layout and designs need to ensure uninterrupted tipping and minimal pollutant exposure to personnel and equipment reducing health risk and maintenancerequirements (Wallace et al. 2014). As discussed above, in manymines crushers are ventilated with fresh air that in turn is ventilated directly to return.
More recently mines are considering LEAN approaches for theoverall mine designs and crushers are ventilated with used air fromthe extraction level. In these cases air at the main fans and operating costs are reduced. Visibility may however be a concernbut filtering engineering controls can be considered in these cases.
Crusher ventilation systems are further improved by engineeringcontrol systems. Control systems typically include bratticing, aircurtains, auxiliary fans and ducts, etc. A properly designed crusherventilation system ensures effective capturing of dust generated bytipping and crushing operations and removes pollutants, includingheat, directly to a return airway. Figure 9 shows a crusher dustextraction system.
5.5. Steady state cooling
Refrigeration systems are generally required for block cave operations due to their depth below surface, heat load contributedby mechanised vehicles and large volumes of broken rock. Correctpositioning of cooling equipment is essential to ensure efficient,practical cooling with minimal capital and operating cost.
Block cave layouts generally create the opportunity for under-ground refrigeration systems to be positioned such that shortpumping distances are required for both evaporator and condenser circuits. This is achieved due to the unique layout ofblock caves where the main intake and return airways are locatednear to each other. Air cooler locations need to be carefully considered to avoid over-cooling of intakes and to deliver thedesired air quality near the intake to the extraction level (Marx etal. 2012).
5.6. Services ventilation
Due to the layout typical of block cave mines, crushers, workshops,pump stations and other services can be ventilated direct to return.This opportunity reduces the risk of exposure to pollutants,including smoke in the case of a fire. It does, however, increase theoverall air requirement of the mine.
5.7. Ventilation-on-demand
Ventilation-on-demand (VOD) strategies are possible in block cavemines due to the parallel layout of loading crosscuts and that not
Figure 8. Crushers and crosscuts ventilated in parallel
Figure 9. Crusher dust extraction system (Wallace et al. 2012)14 Journal of the Mine Ventilation Society of South Africa, January/March 2018
The paper has summarised ventilation techniques that were identified to optimise block cave mines for fit-for-purpose LEANdesigns when an already economical mining method is selected.
The ventilation techniques are safe, use state-of-the-art technologies and result in favourable economies of scale. It cantherefore be concluded that the ventilation fraternity is and willcontinue to play a relevant part in mine design planning.
7. REFERENCES
Booth-Jones, P.A., Annegarn, H.J. & Bluhm, S.J. 1984, 'Filtrationof underground ventilation air by wet dust-scrubbing', TheInstitution of Mining and Metallurgy/ The Institution of MiningEngineers, Third International Mine Ventilation Congress,Horrogate, England, 1984.
Calizaya, F., and Mutama, K.R., 2004.Comparative evaluation ofblock-cave ventilation systems.Proceedings of the 10th US/NorthAmerican Mine Ventilation Symposium, Anchor-age, Alaska,USA, 16-19 May 2004. Bandopadhyay, S. Ganguli, R. (eds)Taylor & Francis Group, London.
Duckworth, I.J., Karmawan,K., and Chmura, C. 2005.Expan-sion of the DOZ Mine Ventilation System, Proceedings ofthe SME Annual Meeting, 28 February to 2 March 2005, SaltLake City, UT.
Hem, P. and Caldwell, J. 2012. Block Caving. TechnoMine Mining Technology. Date revised: April 2012.
Kielblock, J. 1992. Heat stress management: An Industrial perspective. Proceedings of the fifth international conference onenvironmental ergonomics.
Mattox, A., Coil, D., Hoagland, N. and Higman, B. 2012. BlockCaving. Groundtruthtrekking. Date revised: October 2014.
Marx, W., Hooman, M., Botha, P., and Meredith, G., 2010.Cooling system design for a block-cave mine. Proceedings of the2010 Mine Ventilation Society of South Africa Conference,Emperors Palace, Kempton Park, Gau-teng, South Africa, 13-14May 2010.
Marx, W., Bezuidenhout, M., van den Berg, L., Botha, P., andMeredith, G., 2012. Block-cave refrigeration and coolingsystem.ACG's 6th International Seminar on Deep and High StressMining, Perth, Australia, 28-30 March 2012.
Wallace, K.G., Prosser, B.S., Donoso, J.R., Guerrero, A.F. &Acevedo, J.C. 2012. Ventilation system design for the CODEL-CO New Level Project. 14th United States/North AmericanMine Ventilation Symposium, 2012 - Cali-zaya and Nelson ,University of Utah, Dept. of Mining Engi-neering, 2012.
Wallace, K.G., Prosser, B.S., Jr., Sani, R., Semestario, T., 2014.Ventilation planning at the P.T. Freeport Indonesia's GBCmine.Proceedings of the 10th International Mine VentilationCongress, IMVC, South Africa, 2014.
all crosscuts are operational all the time. VOD systems consist ofcrosscut regulators (typically doors), variable speed fans, vehicletracking, etc. coupled with monitoring and control equipment.The equipment ensures that the minimum required airflow forheat and pollutant dilution is achieved in 'closed' cross-cuts and therequired high flow is achieved for diesel and heat pollution in'open' cross-cuts. VOD can reduce the overall air requirement ofthe mine and with well-managed systems could be of great value.
Some mines install VOD regulators on the fresh air side of thecave and others on the return air side or both. The location ofthese regulators depends on which side loaders access the cave andthen tip into crushers.
When VOD regulators are installed on the return airway side,frequent maintenance of the control system will be required due topollutants such as dust, diesel exhaust, heat and blast fumes fromsecondary blasting.
Well-managed VOD systems are beneficial in that they reduce thetotal air quantity required from surface since only the loading andserviced crosscuts are ventilated and the rest remain closed. Theconsequence of less air is reduced power consumption at the mainfans.
However, these systems can only work when underground dailyplanning and cave draw control is effective and the work forceapplies the operational procedures to VOD regulators (i.e. open forloaders and closed for other work).
5.8. Loader equipment selection
Diesel LHDs not only generate exhaust gas but produce up tothree times the amount of heat generated by electrical LHDs forthe same work output. Although electrical LHDs have the challenge of trailing cables to be considered, there is a saving inoverall air quantity and cooling required. Battery operated LHDscould also be considered.
6. CONCLUSIONThe ventilation department can be very valuable during mineplanning when the mining method, sequence of mining and mining process is understood. The ventilation planners need toidentify critical phases over the life-of-mine to ensure that shortand long-term ventilation requirements are met.
Optimisation techniques that can be employed at block cave minesinclude optimal appropriate selection of design criteria and accurate application of ventilation-on-demand and heat stressmanagement plans. The ventilation distribution and ventilationlayout are key in determining the direction in which air will flowand to determine the total air quantity. The best optimised selection can have a major impact on the business case.
Reuse ventilation is an important ventilation technique thatreduces the total air requirement at the main fans. Reuse systemsare often combined with horizontal bulk air spray chambers thatprovide scrubbing and cooling capabilities.
When refrigeration is mandatory to achieve thermal design condi-tions, careful consideration is required when deciding on a surfaceand/or underground refrigeration system. Constructing air coolersnear the localised source of heat i.e. the block cave will ensure bestpositional efficiency.
Journal of the Mine Ventilation Society of South Africa,January/March 2018 15
associated with the installation of infrastructure to enable miningin remote areas also make it less attractive to mine in these areas.
2. COOLING METHODSInfrastructure for the cooling of remote underground workingareas usually consists of a cooling source (usually a fridge plant orice plant), a chilled water reticulation system (consisting of storagedams, pipes, pumps, etc.), bulk air coolers (BACs) and localisedcooling units.
2.1. Localised cooling units
Localised cooling units, as the name indicates, are used to cool airnear the working areas. These units usually have a lower coolingcapacity than larger BACs and can be moved when cooling isrequired elsewhere as the mining progresses.
2.1.1. Conventional cooling cars
Cooling cars (CC) are air-to-water heat exchangers mounted in achassis on rolling stock, which enables them to be moved andinstalled in different areas of the mine. These units are installednear the working areas and are small in size to ensure that theunits can be moved with relative ease. CCs have an inlet and outletwater connection to which the chilled water supply and return piping can be connected. A fan is mounted onto the CC to forceair over the finned tube cooling coil (see Figure 2-1).
Figure 2-1. Illustration of a cooling car layout indicating water and air flowpaths
The cooling capacity of these units are directly dependent on fourinputs namely the air mass flow rate, the water mass flow rate, airtemperature (dry-bulb and wet-bulb) and the water temperature.
2.1.2. Mobile refrigeration units
The Air Cooling Unit (ACU) is a mobile refrigeration unit, whichconsists of a vapour compression system in a chassis mounted onrolling stock, which means that the cooling source can be movedcloser to the working areas. The feasibility and energy efficiency ofthese cooling units was first investigated by van Eldik (2007).
The ACU MKI was developed capable of producing approxi-mately 100 kW of cooling.
The unit was deemed a more energy efficient alternative to usingCCs because the unit could utilise less water, which greatly reducesthe total electrical power consumption to cool deep level mines.
Operational advantages of mobile refrigeration using a closed loop heat rejection configuration
R. Potgieter1, Prof. M. van Eldik2
1M-Tech Industrial (Pty) Ltd, 2North-West University
ABSTRACTThe operational advantages of localised cooling, in particularmoving the cooling source as close as possible to the area wherecooling is required, has been investigated by different authors overa number of years. A notable advantage is the energy efficiencypotential associated with cooling locally, mainly due to the savingsobtained from a reduction in cooling water and the reduced dewatering pumping power of water back to surface. The challenges with supplying water from the cooling source to theremote areas where the cooling is required led to the developmentof mobile refrigeration units capable of providing localised cooling. The developed mobile refrigeration air cooling unit (ACU)alleviates some of these problems by increasing the amount ofcooling that can be done per litre of water available. These resultin more effective and energy efficient cooling, but these units dohowever still require cooling water to operate. This paper looksinto the possible operational advantages, including energy efficiency and reliability, when the condenser circuit of the ACU isnot connected to the main cooling water supply, but rather connected in a closed loop heat rejection configuration with thereturn airway (RAW).
1. INTRODUCTIONEngineers working in the mining industry in South Africa are continuously looking for ways to improve the mining operationswith regards to energy usage, reliability, safety and cost. In labourintensive mining operations it is impossible to improve the overallmine performance without looking at the performance of the ventilation and cooling systems. Special emphasis is placed on theenergy efficiency of the ventilation and cooling systems as themargins of profitability of mines are under pressure as the miningdistance increases both vertically and horizontally.
Ramsden et al. (2001) states that several South African gold minesare examining the feasibility of extending workings to below4000m. “Since 2010, the AngloGold Ashanti Technology &Innovation Consortium (ATIC), established by AngloGoldAshanti, has been looking for ways to leverage established technology in new ways, in an effort to not only extract additionalgold from current depths of around 4000m, but also to realise itslong-term vision to reach depths of 5000m and beyond.”(AngloGold Ashanti, 2013). The increased travel distance for air toget from the shaft inlet to the working areas means larger heatgains and therefore more cooling required. This in turn meansthat the cost to mine in remote areas increases due to the increasein cooling demand and the increase in energy usage to supplycooling water to the areas and return it back to surface. The costs
Original paper presented at the 2017 MVSSA Conference
16 Journal of the Mine Ventilation Society of South Africa, January/March 2018
This saving is obtained because the ACU can utilise water as heatsink with a supply temperature of up to 40°C and still delivereffective cooling. Because of the vapour compression cycle usedthe ACU can heat water to much higher temperatures than with aconventional cooling car.
The larger temperature difference (∆T) obtained by the unitreduces the amount of water required and therefore reduces thepumping costs. The ACU MKI was followed by the developmentof the ACU MKII capable of producing 250 kW of cooling.
Greyling (2008) investigated the energy efficiency potential of theACU MKII for the use in the planned deepening of AngloGold
Ashanti’s Mponeng gold mine in the Carbon Leader and Below120L VCR projects.
3. CLOSED LOOP ACU CONCEPTThe energy efficiency potential of the ACU has been investigatedon a number of occasions and it has been found that the ACUcan reduce the energy consumption of localised cooling applications when compared to conventional cooling cars. Theunit does however still require the same infrastructure as the cooling cars to deliver water to it and then the infrastructure topump water back to surface. The potential therefore exists toreduce the energy consumption by eliminating the need for a constant supply of cooling water for air cooling purposes altogether.
The closed loop ACU concept consists of the following:
• One ACU MKII cooling unit.
• Three 500 kW nominal cooling cars.
• Three 22 kW axial flow auxiliary mine fans mounted on thecooling cars.
• A circulation water pump.
• Piping for closed loop circulation of the water.
The philosophy is to transfer the heat in the water from the ACUcondenser to the reject air in the mine 37 return airway (RAW).For this, the condenser circuit of the ACU is connected in a closedloop configuration with three conventional 500 kW cooling carswhich is used to reject the heat to the air in the RAW. The water isthen circulated back to the ACU condenser circuit using the waterpump to complete the cycle (Figure 3-1). The system is dependenton an accessible return airway to be feasible, where the rejected
Figure 2-2. Typical vapour compression cycle energy balance
Figure 2-3. Illustration of the ACU MKII component layout
Journal of the Mine Ventilation Society of South Africa,January/March 2018 17
heat will not negatively affect any workings, or increase temperatures above legal limits for persons in the areas.
4. ENERGY EFFICIENCY INVESTIGATIONTo investigate the energy efficiency potential of the closed loopACU configuration, a simulation model was created to simulatethe following:
• Cooling at different vertical depths using a conventional 500 kWcooling car.
• Cooling at different vertical depths using a conventional ACUMKII cooling configuration.
• Cooling at different vertical depths using an ACU MKII connected in a closed loop heat rejection configuration asdescribed above.
Flownex SE® was used to create the models for the individualcomponents (cooling equipment, water reticulation, airflow paths,etc.) as well as the total integrate mine model.
The energy efficiency of the three cooling strategies was evaluatedbased on the total cooling per kW electrical power required to dothe cooling.
4.1. Simulation model
A model mine was simulated using real mine data, but a hypothetical level was added to simulate at a depth of 4000m. Thethree different cooling applications were then plugged into themine model at different depths to evaluate the different coolingperformances.
The first cooling application simulation was the localised cooling atdifferent depths using CCs connected to the chilled water reticulation network as illustrated in Figure 4-1. The conventionalACU configuration is modeled similar to the CC with the ACUbeing connected to the chilled water network.
The water is heated in the ACU condenser circuit and rejectedthrough the mine water reticulation system back to surface whereit is recooled first by a precooling tower and then the surface fridgeplants.
Figure 4-3. ACU with closed loop condenser heat rejection diagram
Figure 3-1. Closed loop ACU configuration
Figure 4-1. Cooling car connected to chilled water diagram
Figure 4-2. ACU connected to chilled water diagram
18 Journal of the Mine Ventilation Society of South Africa, January/March 2018
The closed loop ACU configuration is modeled with the ACU inthe supply air stream and the three CCs in the RAW to reject theheat from the ACU condenser coil with a water pump for circulation.
The closed loop ACU system component configuration is designedtaking into account possible fouling on the air side when sizing thecapacity of the heat rejection coils.
Flownex® heat exchanger components were used to model theperformance of a Manos Zeus cooling coil based on the manufacturer’s performance charts.
The total electrical power consumption of each cooling strategywas calculated based on the following:
• Fridge plant power input required to chill water for use in thecooling equipment.
• Fans mounted on the cooling cars and ACUs.
• Pumps used to return water to surface or to circulate the closedloop water.
• Compressor power of the ACU.
4.2. Energy efficiency investigation results
Results were generated from the simulations at different depthsincluding the expected temperatures of the air, watertemperatures, cooling duties, etc.
To ensure that the different cooling strategies can be comparedwith one another special focus is placed on the electrical powerconsumption of the strategies per unit cooling delivered.
This was done for different depths below surface and a summary
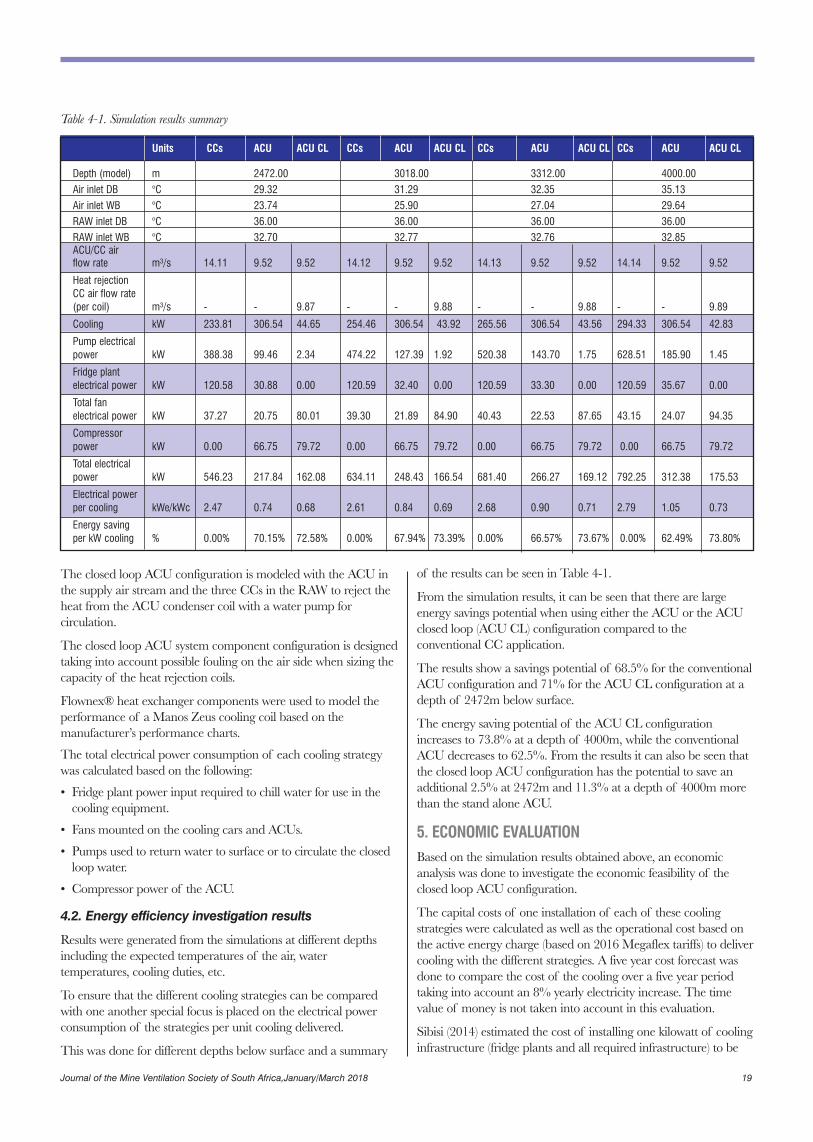
of the results can be seen in Table 4-1.
From the simulation results, it can be seen that there are largeenergy savings potential when using either the ACU or the ACUclosed loop (ACU CL) configuration compared to the conventional CC application.
The results show a savings potential of 68.5% for the conventionalACU configuration and 71% for the ACU CL configuration at adepth of 2472m below surface.
The energy saving potential of the ACU CL configurationincreases to 73.8% at a depth of 4000m, while the conventionalACU decreases to 62.5%. From the results it can also be seen thatthe closed loop ACU configuration has the potential to save anadditional 2.5% at 2472m and 11.3% at a depth of 4000m morethan the stand alone ACU.
5. ECONOMIC EVALUATIONBased on the simulation results obtained above, an economic analysis was done to investigate the economic feasibility of theclosed loop ACU configuration.
The capital costs of one installation of each of these coolingstrategies were calculated as well as the operational cost based onthe active energy charge (based on 2016 Megaflex tariffs) to delivercooling with the different strategies. A five year cost forecast wasdone to compare the cost of the cooling over a five year periodtaking into account an 8% yearly electricity increase. The timevalue of money is not taken into account in this evaluation.
Sibisi (2014) estimated the cost of installing one kilowatt of coolinginfrastructure (fridge plants and all required infrastructure) to be
Units CCs ACU ACU CL CCs ACU ACU CL CCs ACU ACU CL CCs ACU ACU CL
Depth (model) m 2472.00 3018.00 3312.00 4000.00
Air inlet DB °C 29.32 31.29 32.35 35.13
Air inlet WB °C 23.74 25.90 27.04 29.64
RAW inlet DB °C 36.00 36.00 36.00 36.00
RAW inlet WB °C 32.70 32.77 32.76 32.85ACU/CC airflow rate m³/s 14.11 9.52 9.52 14.12 9.52 9.52 14.13 9.52 9.52 14.14 9.52 9.52
Heat rejectionCC air flow rate(per coil) m³/s - - 9.87 - - 9.88 - - 9.88 - - 9.89
Cooling kW 233.81 306.54 44.65 254.46 306.54 43.92 265.56 306.54 43.56 294.33 306.54 42.83
Pump electricalpower kW 388.38 99.46 2.34 474.22 127.39 1.92 520.38 143.70 1.75 628.51 185.90 1.45
Fridge plantelectrical power kW 120.58 30.88 0.00 120.59 32.40 0.00 120.59 33.30 0.00 120.59 35.67 0.00
Total fanelectrical power kW 37.27 20.75 80.01 39.30 21.89 84.90 40.43 22.53 87.65 43.15 24.07 94.35
Compressorpower kW 0.00 66.75 79.72 0.00 66.75 79.72 0.00 66.75 79.72 0.00 66.75 79.72
Total electricalpower kW 546.23 217.84 162.08 634.11 248.43 166.54 681.40 266.27 169.12 792.25 312.38 175.53
Electrical powerper cooling kWe/kWc 2.47 0.74 0.68 2.61 0.84 0.69 2.68 0.90 0.71 2.79 1.05 0.73
Energy savingper kW cooling % 0.00% 70.15% 72.58% 0.00% 67.94% 73.39% 0.00% 66.57% 73.67% 0.00% 62.49% 73.80%
Table 4-1. Simulation results summary
Journal of the Mine Ventilation Society of South Africa,January/March 2018 19
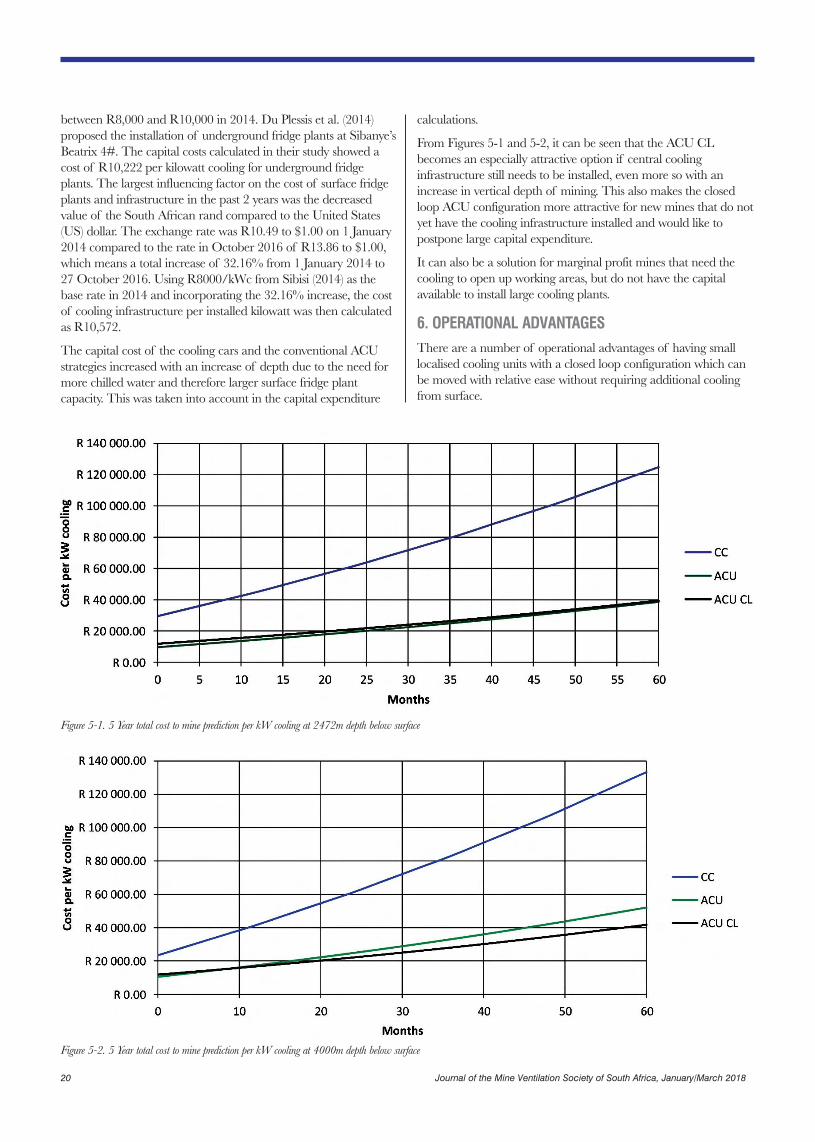
Figure 5-1. 5 Year total cost to mine prediction per kW cooling at 2472m depth below surface
Figure 5-2. 5 Year total cost to mine prediction per kW cooling at 4000m depth below surface
between R8,000 and R10,000 in 2014. Du Plessis et al. (2014)proposed the installation of underground fridge plants at Sibanye’sBeatrix 4#. The capital costs calculated in their study showed acost of R10,222 per kilowatt cooling for underground fridgeplants. The largest influencing factor on the cost of surface fridgeplants and infrastructure in the past 2 years was the decreasedvalue of the South African rand compared to the United States(US) dollar. The exchange rate was R10.49 to $1.00 on 1 January2014 compared to the rate in October 2016 of R13.86 to $1.00,which means a total increase of 32.16% from 1 January 2014 to27 October 2016. Using R8000/kWc from Sibisi (2014) as thebase rate in 2014 and incorporating the 32.16% increase, the costof cooling infrastructure per installed kilowatt was then calculatedas R10,572.
The capital cost of the cooling cars and the conventional ACUstrategies increased with an increase of depth due to the need formore chilled water and therefore larger surface fridge plant capacity. This was taken into account in the capital expenditure
calculations.
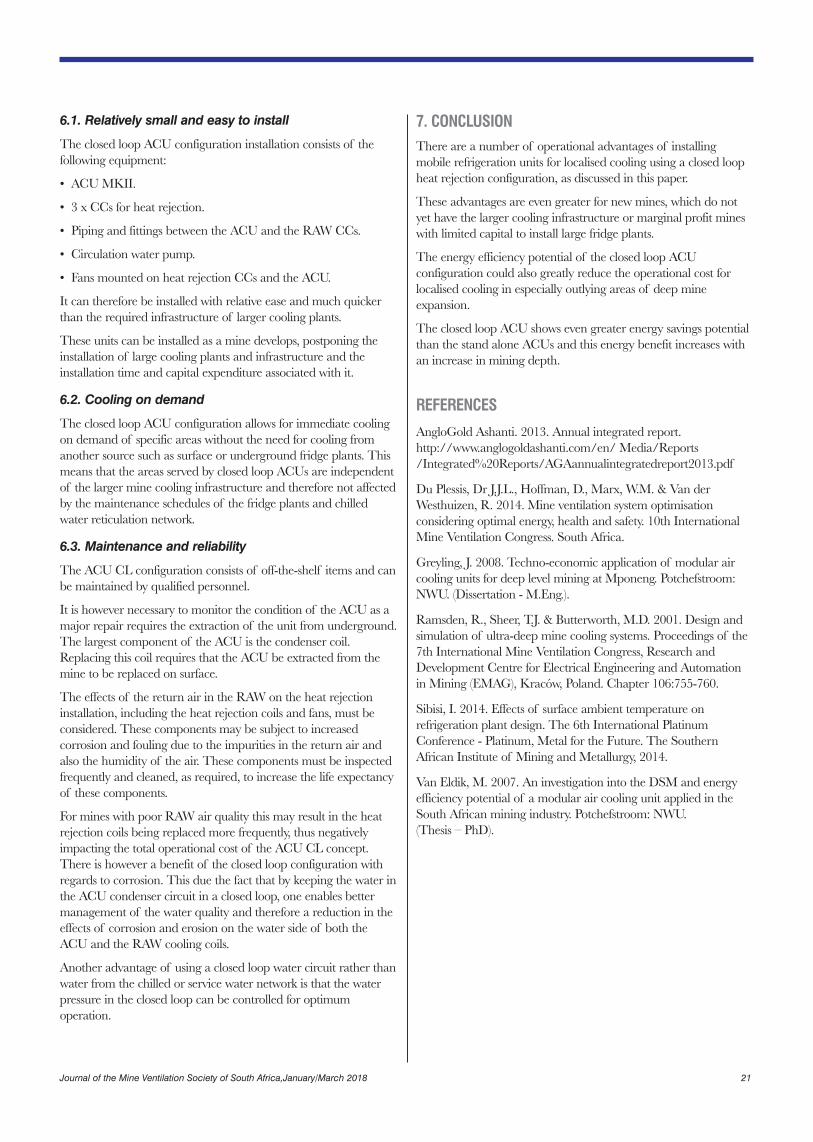
From Figures 5-1 and 5-2, it can be seen that the ACU CLbecomes an especially attractive option if central cooling infrastructure still needs to be installed, even more so with anincrease in vertical depth of mining. This also makes the closedloop ACU configuration more attractive for new mines that do notyet have the cooling infrastructure installed and would like to postpone large capital expenditure.
It can also be a solution for marginal profit mines that need thecooling to open up working areas, but do not have the capitalavailable to install large cooling plants.
6. OPERATIONAL ADVANTAGESThere are a number of operational advantages of having smalllocalised cooling units with a closed loop configuration which canbe moved with relative ease without requiring additional coolingfrom surface.
20 Journal of the Mine Ventilation Society of South Africa, January/March 2018
6.1. Relatively small and easy to install
The closed loop ACU configuration installation consists of the following equipment:
• ACU MKII.
• 3 x CCs for heat rejection.
• Piping and fittings between the ACU and the RAW CCs.
• Circulation water pump.
• Fans mounted on heat rejection CCs and the ACU.
It can therefore be installed with relative ease and much quickerthan the required infrastructure of larger cooling plants.
These units can be installed as a mine develops, postponing theinstallation of large cooling plants and infrastructure and theinstallation time and capital expenditure associated with it.
6.2. Cooling on demand
The closed loop ACU configuration allows for immediate coolingon demand of specific areas without the need for cooling fromanother source such as surface or underground fridge plants. Thismeans that the areas served by closed loop ACUs are independentof the larger mine cooling infrastructure and therefore not affectedby the maintenance schedules of the fridge plants and chilledwater reticulation network.
6.3. Maintenance and reliability
The ACU CL configuration consists of off-the-shelf items and canbe maintained by qualified personnel.
It is however necessary to monitor the condition of the ACU as amajor repair requires the extraction of the unit from underground.The largest component of the ACU is the condenser coil.Replacing this coil requires that the ACU be extracted from themine to be replaced on surface.
The effects of the return air in the RAW on the heat rejectioninstallation, including the heat rejection coils and fans, must beconsidered. These components may be subject to increased corrosion and fouling due to the impurities in the return air andalso the humidity of the air. These components must be inspectedfrequently and cleaned, as required, to increase the life expectancyof these components.
For mines with poor RAW air quality this may result in the heatrejection coils being replaced more frequently, thus negativelyimpacting the total operational cost of the ACU CL concept.There is however a benefit of the closed loop configuration withregards to corrosion. This due the fact that by keeping the water inthe ACU condenser circuit in a closed loop, one enables bettermanagement of the water quality and therefore a reduction in theeffects of corrosion and erosion on the water side of both theACU and the RAW cooling coils.
Another advantage of using a closed loop water circuit rather thanwater from the chilled or service water network is that the waterpressure in the closed loop can be controlled for optimum operation.
7. CONCLUSIONThere are a number of operational advantages of installingmobile refrigeration units for localised cooling using a closed loopheat rejection configuration, as discussed in this paper.
These advantages are even greater for new mines, which do notyet have the larger cooling infrastructure or marginal profit mineswith limited capital to install large fridge plants.
The energy efficiency potential of the closed loop ACU configuration could also greatly reduce the operational cost forlocalised cooling in especially outlying areas of deep mine expansion.
The closed loop ACU shows even greater energy savings potentialthan the stand alone ACUs and this energy benefit increases withan increase in mining depth.
REFERENCES
AngloGold Ashanti. 2013. Annual integrated report.http://www.anglogoldashanti.com/en/ Media/Reports/Integrated%20Reports/AGAannualintegratedreport2013.pdf
Du Plessis, Dr J.J.L., Hoffman, D., Marx, W.M. & Van derWesthuizen, R. 2014. Mine ventilation system optimisation considering optimal energy, health and safety. 10th InternationalMine Ventilation Congress. South Africa.
Greyling, J. 2008. Techno-economic application of modular aircooling units for deep level mining at Mponeng. Potchefstroom:NWU. (Dissertation - M.Eng.).
Ramsden, R., Sheer, T.J. & Butterworth, M.D. 2001. Design andsimulation of ultra-deep mine cooling systems. Proceedings of the7th International Mine Ventilation Congress, Research andDevelopment Centre for Electrical Engineering and Automationin Mining (EMAG), Kraców, Poland. Chapter 106:755-760.
Sibisi, I. 2014. Effects of surface ambient temperature on refrigeration plant design. The 6th International PlatinumConference - Platinum, Metal for the Future. The SouthernAfrican Institute of Mining and Metallurgy, 2014.
Van Eldik, M. 2007. An investigation into the DSM and energyefficiency potential of a modular air cooling unit applied in theSouth African mining industry. Potchefstroom: NWU.(Thesis – PhD).
Journal of the Mine Ventilation Society of South Africa,January/March 2018 21
ABSTRACTThe auxiliary ventilation systems used to ventilate the developmentheadings has conventionally been studied by conducting experiments. Since the efficiency of any auxiliary ventilation system is dependent on a number of system variables, conductingsuch experiments on a large scale become a challenging exercise.With the advancement in computer systems and numerical codes,an alternate solution becoming popular in the mining industry isthe use of Computational Fluid Dynamics (CFD). Although anumber of researchers are using such software in the miningindustry, the accuracy of the results is still questioned by the conservatives. This paper outlines not only the steps to be followedfor conducting a CFD study in general, but also provides theresults of three validation studies relating to auxiliary ventilation.This was done to emphasise how CFD can be used with confidence to study ventilation in underground mines. The workpresented in this paper is part of a Ph.D. research study in theSchool of Mining Engineering at the University of theWitwatersrand.
1. INTRODUCTIONMine ventilation systems have been designed and installed almostsince the beginning of mining, and ventilation is a well-studiedsubject. A number of computerised mine ventilation network analysis software packages are available to design the main ventilation circuit. However, the ventilation of the blind headings,which is carried out using auxiliary ventilation equipment is studied and planned using experiments/experience and CFDanalysis.
The efficiency of an auxiliary ventilation system is largely affectedby the associated system variables (Suglo and Frimpong, 2002).The study of these system variables such as the dimensions of theheadings, orientation and capacity of the auxiliary equipment, andvelocity of air in the last through road (LTR) requires a large number of experiments. However, to carry out a large number ofexperiments in a mine has always been an expensive exercise.With the advancement in the field of computer science andnumerical modelling, powerful computers and numerical softwareare available which can be used to study auxiliary ventilation andachieve extensive solutions. Due to these reasons, the need to useCFD is an important step forward.
The relationship between the experimental studies and numericalmodels has always been dependent on the validation of thenumerical results with experiments. Therefore, a primary requirement/limitation of a CFD study is the validation of thenumerical model. Once validated these CFD models can be used
to examine the different auxiliary ventilation configurations andenable the practitioner to predict, visualise and optimise the ventilation in headings.
This paper aims to highlight the key steps involved to solve a ventilation problem in an empty heading using the ANSYS FluentCFD package. Furthermore, the suitability of ANSYS Fluent k-e realisable CFD model for studying ventilation of an emptyheading has been shown by conducting a comparison of threeexperimental and numerical studies.
2. KEY STEPS OF CFDCFD is one of the branches of fluid mechanics. It started in theearly 1970s and employed physics, numerical mathematics andcomputer sciences to simulate fluid flows. It has become a powerful tool in almost every branch of fluid dynamics and engineering (Ren and Balusu, 2010). CFD has been described(Anderson, 1995) as "the art of replacing the partial derivatives inthe fluid motion equations with discretised algebraic form". TheCFD solvers are designed to solve a set of Partial DifferentialEquations (PDEs) defining the flow fields of the problem. ThesePDEs (governing equations) as shown in Figure 1 are derived fromthe following three fundamental principles of physics which ruleall the aspects of fluid flows (Anderson, 1995).
• Conservation of Mass
• Newton's Second Law of Motion
• Conservation of Energy
The governing equations are coupled equations, which are non-linear and are therefore, very difficult to solve analytically,necessitating the use of numerical methods. The system ofequations is converted into algebraic equations which are subsequently solved numerically at discrete points in the time andor space, using different explicit and implicit numerical techniques.CFD can be used to solve fluid dynamics problems in both twoand three dimensions, producing illustrative results, which helpsthe user to have an increased understanding of the problem.
The three steps to solve any fluid dynamics problem are(Anderson, 1995):
• Visualising the problem and defining the quantities that arerequired to be measured.
• Designing a mathematical model includes the selection of thegoverning equation/equations, and the initial and boundaryconditions.
• Use numerical techniques to solve the fluid problems, whichinvolve discretisation of the governing equations into algebraicforms to be solved at discrete locations.
3. CONCEPTUAL FRAMEWORK OF CFD STUDY3.1 Pre-processing
It involves the creation and discretisation of the solution domain,
Ventilation of underground coal mines - A Computational Fluid Dynamics study
T. Feroze and B. Genc
University of the Witwatersrand, Johannesburg, South Africa
Original paper presented at the 2016 MVSSA Conference
22 Journal of the Mine Ventilation Society of South Africa, January/March 2018
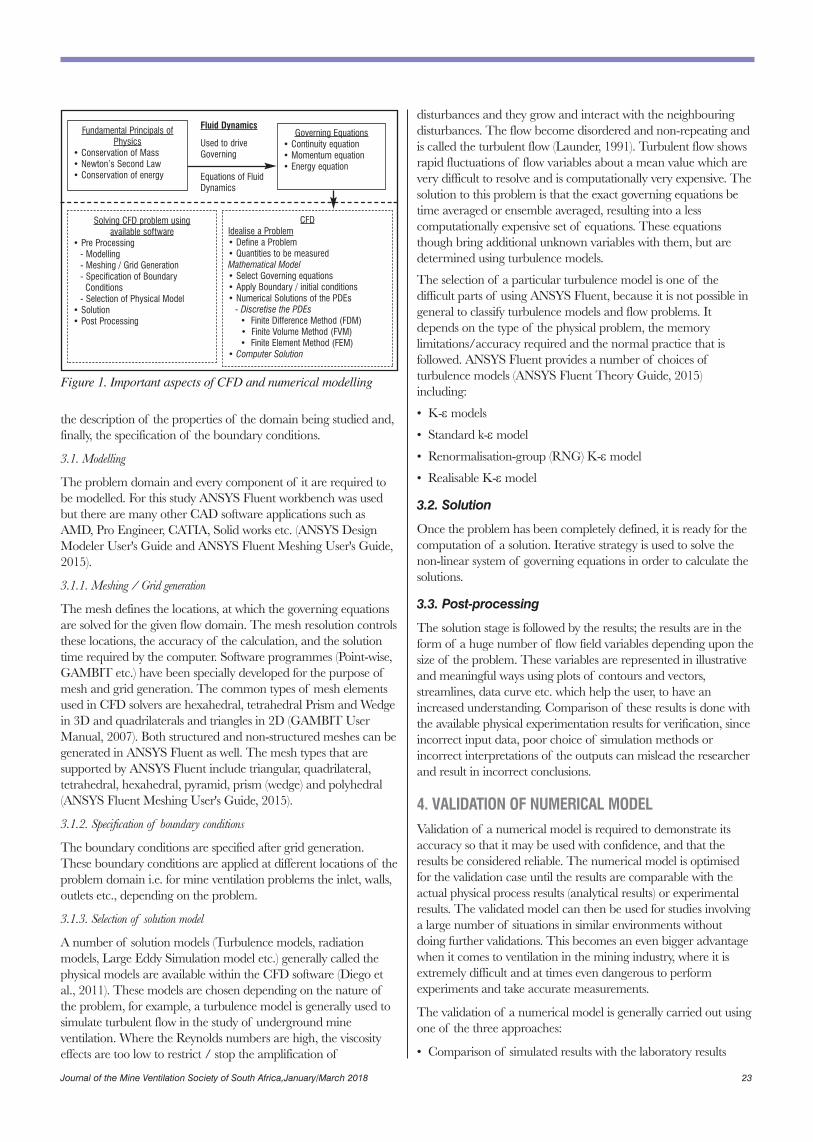
disturbances and they grow and interact with the neighbouringdisturbances. The flow become disordered and non-repeating andis called the turbulent flow (Launder, 1991). Turbulent flow showsrapid fluctuations of flow variables about a mean value which arevery difficult to resolve and is computationally very expensive. Thesolution to this problem is that the exact governing equations betime averaged or ensemble averaged, resulting into a less computationally expensive set of equations. These equationsthough bring additional unknown variables with them, but aredetermined using turbulence models.
The selection of a particular turbulence model is one of the difficult parts of using ANSYS Fluent, because it is not possible ingeneral to classify turbulence models and flow problems. Itdepends on the type of the physical problem, the memory limitations/accuracy required and the normal practice that isfollowed. ANSYS Fluent provides a number of choices ofturbulence models (ANSYS Fluent Theory Guide, 2015) including:
• K-ε models
• Standard k-ε model
• Renormalisation-group (RNG) K-ε model
• Realisable K-ε model
3.2. Solution
Once the problem has been completely defined, it is ready for thecomputation of a solution. Iterative strategy is used to solve thenon-linear system of governing equations in order to calculate thesolutions.
3.3. Post-processing
The solution stage is followed by the results; the results are in theform of a huge number of flow field variables depending upon thesize of the problem. These variables are represented in illustrativeand meaningful ways using plots of contours and vectors,streamlines, data curve etc. which help the user, to have anincreased understanding. Comparison of these results is done withthe available physical experimentation results for verification, sinceincorrect input data, poor choice of simulation methods or incorrect interpretations of the outputs can mislead the researcherand result in incorrect conclusions.
4. VALIDATION OF NUMERICAL MODELValidation of a numerical model is required to demonstrate itsaccuracy so that it may be used with confidence, and that theresults be considered reliable. The numerical model is optimisedfor the validation case until the results are comparable with theactual physical process results (analytical results) or experimentalresults. The validated model can then be used for studies involvinga large number of situations in similar environments withoutdoing further validations. This becomes an even bigger advantagewhen it comes to ventilation in the mining industry, where it isextremely difficult and at times even dangerous to perform experiments and take accurate measurements.
The validation of a numerical model is generally carried out usingone of the three approaches:
• Comparison of simulated results with the laboratory results
the description of the properties of the domain being studied and,finally, the specification of the boundary conditions.
3.1. Modelling
The problem domain and every component of it are required tobe modelled. For this study ANSYS Fluent workbench was usedbut there are many other CAD software applications such asAMD, Pro Engineer, CATIA, Solid works etc. (ANSYS DesignModeler User's Guide and ANSYS Fluent Meshing User's Guide,2015).
3.1.1. Meshing / Grid generation
The mesh defines the locations, at which the governing equationsare solved for the given flow domain. The mesh resolution controlsthese locations, the accuracy of the calculation, and the solutiontime required by the computer. Software programmes (Point-wise,GAMBIT etc.) have been specially developed for the purpose ofmesh and grid generation. The common types of mesh elementsused in CFD solvers are hexahedral, tetrahedral Prism and Wedgein 3D and quadrilaterals and triangles in 2D (GAMBIT UserManual, 2007). Both structured and non-structured meshes can begenerated in ANSYS Fluent as well. The mesh types that are supported by ANSYS Fluent include triangular, quadrilateral,tetrahedral, hexahedral, pyramid, prism (wedge) and polyhedral(ANSYS Fluent Meshing User's Guide, 2015).
3.1.2. Specification of boundary conditions
The boundary conditions are specified after grid generation.These boundary conditions are applied at different locations of theproblem domain i.e. for mine ventilation problems the inlet, walls,outlets etc., depending on the problem.
3.1.3. Selection of solution model
A number of solution models (Turbulence models, radiation models, Large Eddy Simulation model etc.) generally called thephysical models are available within the CFD software (Diego etal., 2011). These models are chosen depending on the nature ofthe problem, for example, a turbulence model is generally used tosimulate turbulent flow in the study of underground mine ventilation. Where the Reynolds numbers are high, the viscosityeffects are too low to restrict / stop the amplification of
Figure 1. Important aspects of CFD and numerical modelling
Fundamental Principals ofPhysics
• Conservation of Mass• Newton’s Second Law• Conservation of energy
Governing Equations• Continuity equation• Momentum equation• Energy equation
Solving CFD problem usingavailable software
• Pre Processing- Modelling- Meshing / Grid Generation- Specification of Boundary
Conditions- Selection of Physical Model
• Solution• Post Processing
CFDIdealise a Problem• Define a Problem• Quantities to be measuredMathematical Model• Select Governing equations• Apply Boundary / initial conditions• Numerical Solutions of the PDEs
- Discretise the PDEs• Finite Difference Method (FDM)• Finite Volume Method (FVM)• Finite Element Method (FEM)
• Computer Solution
Fluid Dynamics
Used to driveGoverning
Equations of FluidDynamics
Journal of the Mine Ventilation Society of South Africa,January/March 2018 23
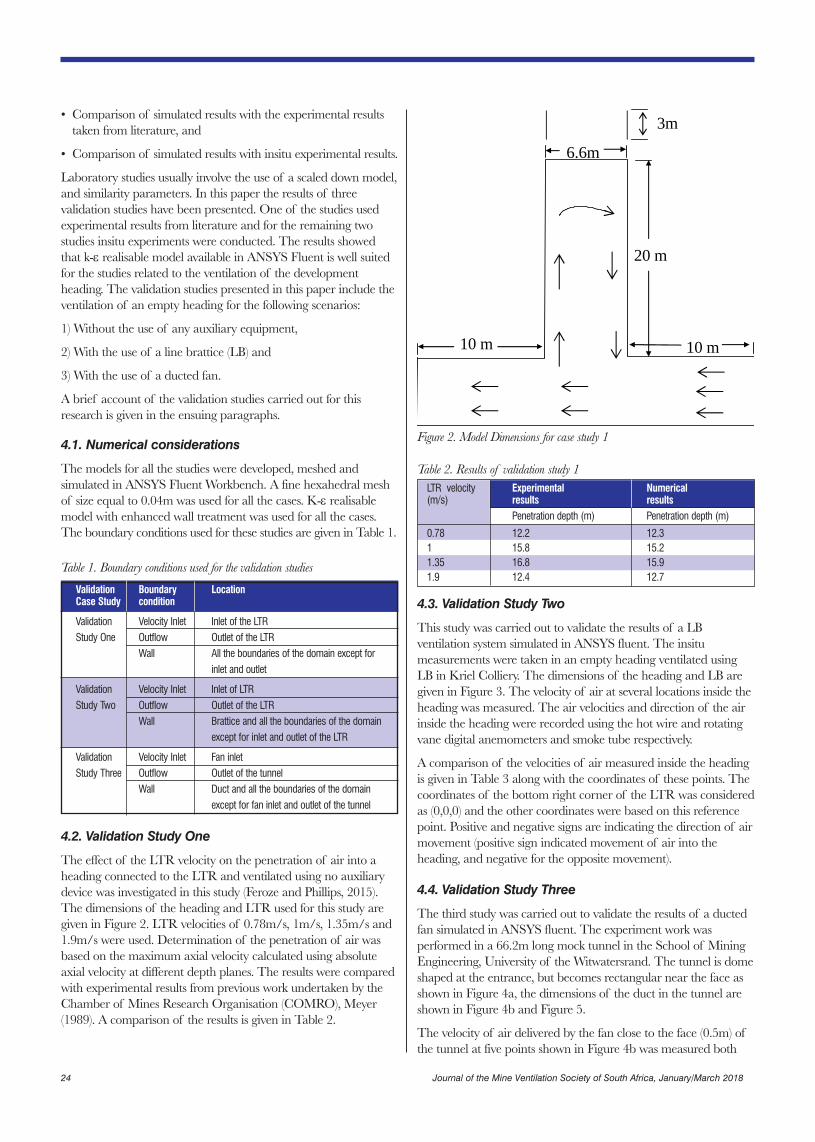
• Comparison of simulated results with the experimental resultstaken from literature, and
• Comparison of simulated results with insitu experimental results.
Laboratory studies usually involve the use of a scaled down model,and similarity parameters. In this paper the results of threevalidation studies have been presented. One of the studies usedexperimental results from literature and for the remaining twostudies insitu experiments were conducted. The results showedthat k-ε realisable model available in ANSYS Fluent is well suitedfor the studies related to the ventilation of the development heading. The validation studies presented in this paper include theventilation of an empty heading for the following scenarios:
1) Without the use of any auxiliary equipment,
2) With the use of a line brattice (LB) and
3) With the use of a ducted fan.
A brief account of the validation studies carried out for thisresearch is given in the ensuing paragraphs.
4.1. Numerical considerations
The models for all the studies were developed, meshed and simulated in ANSYS Fluent Workbench. A fine hexahedral meshof size equal to 0.04m was used for all the cases. K-ε realisablemodel with enhanced wall treatment was used for all the cases.The boundary conditions used for these studies are given in Table 1.
Table 1. Boundary conditions used for the validation studies
4.2. Validation Study One
The effect of the LTR velocity on the penetration of air into aheading connected to the LTR and ventilated using no auxiliarydevice was investigated in this study (Feroze and Phillips, 2015).The dimensions of the heading and LTR used for this study aregiven in Figure 2. LTR velocities of 0.78m/s, 1m/s, 1.35m/s and1.9m/s were used. Determination of the penetration of air wasbased on the maximum axial velocity calculated using absoluteaxial velocity at different depth planes. The results were comparedwith experimental results from previous work undertaken by theChamber of Mines Research Organisation (COMRO), Meyer(1989). A comparison of the results is given in Table 2.
Figure 2. Model Dimensions for case study 1
Table 2. Results of validation study 1
4.3. Validation Study Two
This study was carried out to validate the results of a LB ventilation system simulated in ANSYS fluent. The insitu measurements were taken in an empty heading ventilated usingLB in Kriel Colliery. The dimensions of the heading and LB aregiven in Figure 3. The velocity of air at several locations inside theheading was measured. The air velocities and direction of the airinside the heading were recorded using the hot wire and rotatingvane digital anemometers and smoke tube respectively.
A comparison of the velocities of air measured inside the headingis given in Table 3 along with the coordinates of these points. Thecoordinates of the bottom right corner of the LTR was consideredas (0,0,0) and the other coordinates were based on this referencepoint. Positive and negative signs are indicating the direction of airmovement (positive sign indicated movement of air into the heading, and negative for the opposite movement).
4.4. Validation Study Three
The third study was carried out to validate the results of a ductedfan simulated in ANSYS fluent. The experiment work was performed in a 66.2m long mock tunnel in the School of MiningEngineering, University of the Witwatersrand. The tunnel is domeshaped at the entrance, but becomes rectangular near the face asshown in Figure 4a, the dimensions of the duct in the tunnel areshown in Figure 4b and Figure 5.
The velocity of air delivered by the fan close to the face (0.5m) ofthe tunnel at five points shown in Figure 4b was measured both
Validation Boundary LocationCase Study condition
Validation Velocity Inlet Inlet of the LTR
Study One Outflow Outlet of the LTR
Wall All the boundaries of the domain except for
inlet and outlet
Validation Velocity Inlet Inlet of LTR
Study Two Outflow Outlet of the LTR
Wall Brattice and all the boundaries of the domain
except for inlet and outlet of the LTR
Validation Velocity Inlet Fan inlet
Study Three Outflow Outlet of the tunnel
Wall Duct and all the boundaries of the domain
except for fan inlet and outlet of the tunnel
10 m 10 m
6.6m
20 m
3m
LTR velocity Experimental Numerical(m/s) results results
Penetration depth (m) Penetration depth (m)
0.78 12.2 12.31 15.8 15.21.35 16.8 15.91.9 12.4 12.7
24 Journal of the Mine Ventilation Society of South Africa, January/March 2018
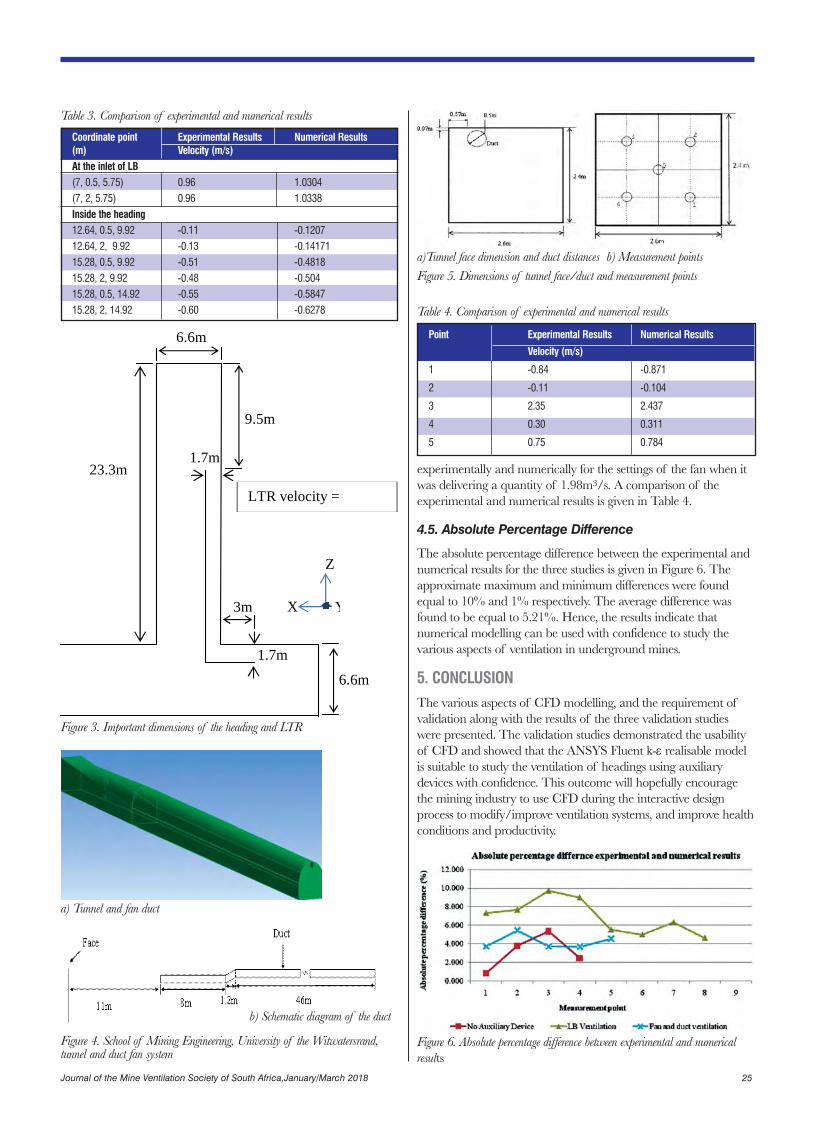
experimentally and numerically for the settings of the fan when itwas delivering a quantity of 1.98m3/s. A comparison of theexperimental and numerical results is given in Table 4.
4.5. Absolute Percentage Difference
The absolute percentage difference between the experimental andnumerical results for the three studies is given in Figure 6. Theapproximate maximum and minimum differences were foundequal to 10% and 1% respectively. The average difference wasfound to be equal to 5.21%. Hence, the results indicate thatnumerical modelling can be used with confidence to study the various aspects of ventilation in underground mines.
5. CONCLUSIONThe various aspects of CFD modelling, and the requirement ofvalidation along with the results of the three validation studieswere presented. The validation studies demonstrated the usabilityof CFD and showed that the ANSYS Fluent k-ε realisable modelis suitable to study the ventilation of headings using auxiliarydevices with confidence. This outcome will hopefully encouragethe mining industry to use CFD during the interactive design process to modify/improve ventilation systems, and improve healthconditions and productivity.
Coordinate point Experimental Results Numerical Results(m) Velocity (m/s)At the inlet of LB(7, 0.5, 5.75) 0.96 1.0304
(7, 2, 5.75) 0.96 1.0338
Inside the heading12.64, 0.5, 9.92 -0.11 -0.1207
12.64, 2, 9.92 -0.13 -0.14171
15.28, 0.5, 9.92 -0.51 -0.4818
15.28, 2, 9.92 -0.48 -0.504
15.28, 0.5, 14.92 -0.55 -0.5847
15.28, 2, 14.92 -0.60 -0.6278
Table 3. Comparison of experimental and numerical results
Figure 3. Important dimensions of the heading and LTR
23.3m
9.5m
6.6m
6.6m
1.7m
LTR velocity =
3m
1.7m
X
Z
Y
Figure 4. School of Mining Engineering, University of the Witwatersrand,tunnel and duct fan system
a) Tunnel and fan duct
b) Schematic diagram of the duct
a)Tunnel face dimension and duct distances b) Measurement pointsFigure 5. Dimensions of tunnel face/duct and measurement points
Point Experimental Results Numerical Results
Velocity (m/s)
1 -0.84 -0.871
2 -0.11 -0.104
3 2.35 2.437
4 0.30 0.311
5 0.75 0.784
Figure 6. Absolute percentage difference between experimental and numericalresults
Table 4. Comparison of experimental and numerical results
Journal of the Mine Ventilation Society of South Africa,January/March 2018 25
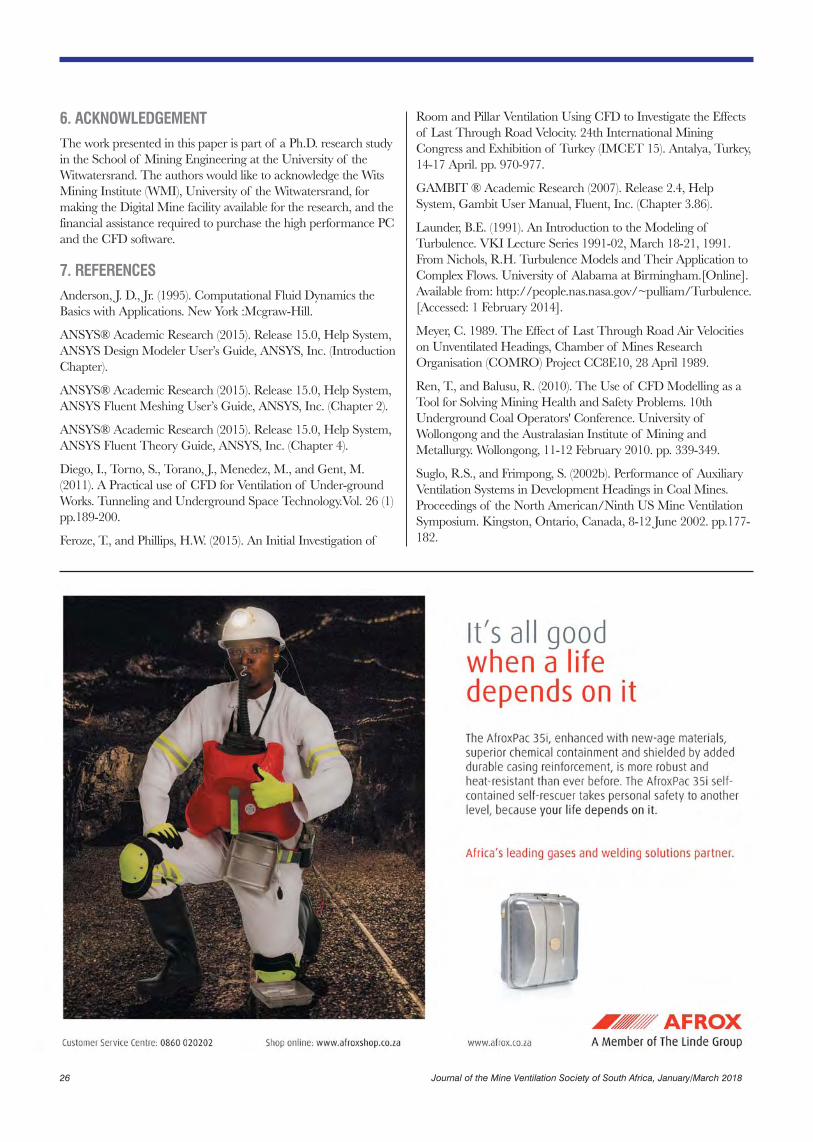
6. ACKNOWLEDGEMENTThe work presented in this paper is part of a Ph.D. research studyin the School of Mining Engineering at the University of theWitwatersrand. The authors would like to acknowledge the WitsMining Institute (WMI), University of the Witwatersrand, formaking the Digital Mine facility available for the research, and thefinancial assistance required to purchase the high performance PCand the CFD software.
7. REFERENCESAnderson, J. D., Jr. (1995). Computational Fluid Dynamics theBasics with Applications. New York :Mcgraw-Hill.
ANSYS® Academic Research (2015). Release 15.0, Help System,ANSYS Design Modeler User’s Guide, ANSYS, Inc. (IntroductionChapter).
ANSYS® Academic Research (2015). Release 15.0, Help System,ANSYS Fluent Meshing User’s Guide, ANSYS, Inc. (Chapter 2).
ANSYS® Academic Research (2015). Release 15.0, Help System,ANSYS Fluent Theory Guide, ANSYS, Inc. (Chapter 4).
Diego, I., Torno, S., Torano, J., Menedez, M., and Gent, M.(2011). A Practical use of CFD for Ventilation of Under-groundWorks. Tunneling and Underground Space Technology.Vol. 26 (1)pp.189-200.
Feroze, T., and Phillips, H.W. (2015). An Initial Investigation of
Room and Pillar Ventilation Using CFD to Investigate the Effectsof Last Through Road Velocity. 24th International MiningCongress and Exhibition of Turkey (IMCET 15). Antalya, Turkey,14-17 April. pp. 970-977.
GAMBIT ® Academic Research (2007). Release 2.4, HelpSystem, Gambit User Manual, Fluent, Inc. (Chapter 3.86).
Launder, B.E. (1991). An Introduction to the Modeling ofTurbulence. VKI Lecture Series 1991-02, March 18-21, 1991.From Nichols, R.H. Turbulence Models and Their Application toComplex Flows. University of Alabama at Birmingham.[Online].Available from: http://people.nas.nasa.gov/~pulliam/Turbulence.[Accessed: 1 February 2014].
Meyer, C. 1989. The Effect of Last Through Road Air Velocitieson Unventilated Headings, Chamber of Mines ResearchOrganisation (COMRO) Project CC8E10, 28 April 1989.
Ren, T., and Balusu, R. (2010). The Use of CFD Modelling as aTool for Solving Mining Health and Safety Problems. 10thUnderground Coal Operators' Conference. University ofWollongong and the Australasian Institute of Mining andMetallurgy. Wollongong, 11-12 February 2010. pp. 339-349.
Suglo, R.S., and Frimpong, S. (2002b). Performance of AuxiliaryVentilation Systems in Development Headings in Coal Mines.Proceedings of the North American/Ninth US Mine VentilationSymposium. Kingston, Ontario, Canada, 8-12 June 2002. pp.177-182.
26 Journal of the Mine Ventilation Society of South Africa, January/March 2018
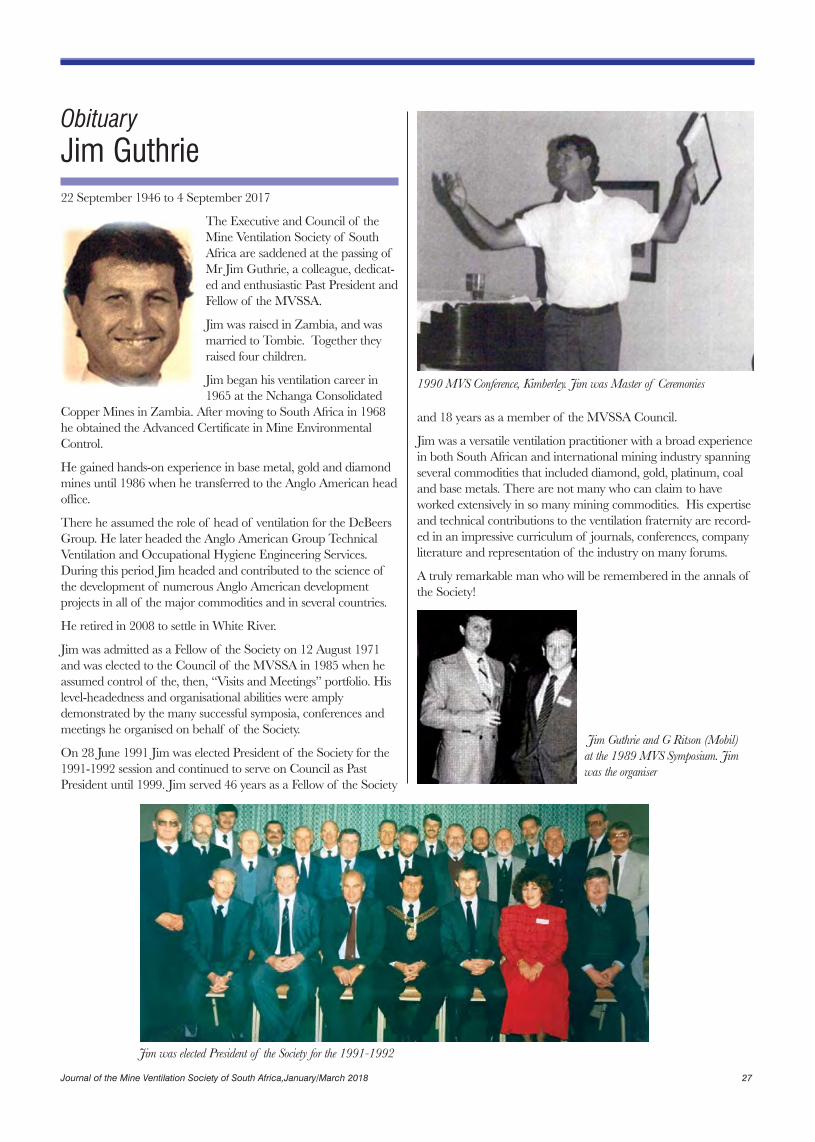
ObituaryJim Guthrie22 September 1946 to 4 September 2017
The Executive and Council of theMine Ventilation Society of SouthAfrica are saddened at the passing ofMr Jim Guthrie, a colleague, dedicat-ed and enthusiastic Past President andFellow of the MVSSA.
Jim was raised in Zambia, and wasmarried to Tombie. Together theyraised four children.
Jim began his ventilation career in1965 at the Nchanga Consolidated
Copper Mines in Zambia. After moving to South Africa in 1968he obtained the Advanced Certificate in Mine EnvironmentalControl.
He gained hands-on experience in base metal, gold and diamondmines until 1986 when he transferred to the Anglo American headoffice.
There he assumed the role of head of ventilation for the DeBeersGroup. He later headed the Anglo American Group TechnicalVentilation and Occupational Hygiene Engineering Services.During this period Jim headed and contributed to the science ofthe development of numerous Anglo American development projects in all of the major commodities and in several countries.
He retired in 2008 to settle in White River.
Jim was admitted as a Fellow of the Society on 12 August 1971and was elected to the Council of the MVSSA in 1985 when heassumed control of the, then, “Visits and Meetings” portfolio. Hislevel-headedness and organisational abilities were amply demonstrated by the many successful symposia, conferences andmeetings he organised on behalf of the Society.
On 28 June 1991 Jim was elected President of the Society for the1991-1992 session and continued to serve on Council as PastPresident until 1999. Jim served 46 years as a Fellow of the Society
and 18 years as a member of the MVSSA Council.
Jim was a versatile ventilation practitioner with a broad experiencein both South African and international mining industry spanningseveral commodities that included diamond, gold, platinum, coaland base metals. There are not many who can claim to haveworked extensively in so many mining commodities. His expertiseand technical contributions to the ventilation fraternity are record-ed in an impressive curriculum of journals, conferences, companyliterature and representation of the industry on many forums.
A truly remarkable man who will be remembered in the annals ofthe Society!
Jim was elected President of the Society for the 1991-1992
Jim Guthrie and G Ritson (Mobil)at the 1989 MVS Symposium. Jimwas the organiser
1990 MVS Conference, Kimberley. Jim was Master of Ceremonies
Journal of the Mine Ventilation Society of South Africa,January/March 2018 27
Delegate Registration Form
PERSONAL DETAILS OF DELEGATE (Please complete in block letters)
Title
Name in full
Company name
VAT registration number
Work phone number
Cell phone number
Email address
Membership number
Order number
Postal address
Date Signature
Terms & Conditions:
1. Payment is required 30 days from date of invoice. All payments must be made to the Mine Ventilation Society of South Africa.2. No seat will be reserved unless the Mine Ventilation Society of South Africa has received a signed registration form.3. The Mine Ventilation Society of South Africa reserves the right, due to circumstances beyond our control, to change the speakers.4. Payment is required 30 days.5. The signed registration form is legal and binding.6. Delegates must inform The Mine Ventilation Society of South Africa in writing of any substitutions. There is no charge for substitutions.7. The Mine Ventilation Society of South Africa is not liable for travel & accommodation of delegates. The cost only includes material, lunches
and refreshments.8. There is a 10% cancellation fee.
Non-Members √ Members √
Full registration 31 - May - 01 June R 6 750.00 R 5 150.00
Single day registration 31 May R 3 700.00 R 2 900.00
01 June R 3 700.00 R 2 900.00
Cocktail party 31 May
All the above prices are exclusive of VAT
Includes cocktail party
Please Note:The MVSSA AGM will be held on 31 May 2018
Thursday 31 MaySession theme: Fire And Emergency Preparedness
07:00 - 08:00 Registration08:00 - 08:15 Welcome by MVSSA Senior Vice President M. van der Bank08:15 - 08:45 Key Note Speaker: Manager Mining & Mineral Resources Natural Resources
and Environment Director Mining Hub Mining Precinct @ Carlow Rd N. Singh08:45 - 09:10 Fire engineering fit for the mining industry W.M. Marx09:10 - 09:35 Self-contained self-rescuer training for new challenges M. Biffi09:35 - 10:00 Education and training: The current status M. Beukes10:00 - 10:25 “Junior presentation:” 10:25 - 11:00 Tea
Session theme: Energy and Occupational Hygiene11:00 - 11:25 Energy recovery from a fluidized-bed ventilation air methane abatement unit:
A thermodynamic assessment B. Moghtsderi11:25 - 11:50 Challenges around reporting and taxation for coal mining fugitive greenhouse
gas emissions A. Cook11:50 - 12:15 Good practice guidance on occupational health risk assessment C. Badenhorst12:15 - 12:40 Considerations in the development of the “new” ventilation professional H. Moorcroft12:40 - 13:05 “Junior presentation:” 13:05 - 14:00 Lunch14:00 - 17:15 AGM18:00 Cocktail party
Friday 1 JuneSession theme: Ventilation & Refrigeration
07:00 - 08:00 Registration08:00 - 08:25 Review of mine ventilation and cooling strategies in different countries R. Wilson08:25 - 08:50 Advantages of monitoring the infield operational conditions of localised
cooling in remote underground areas M.N. Ras08:50 - 09:15 The importance of accurate rock property and virgin rock temperature
data in ventilation and cooling planning requirements K. van Zyl09:15 - 09:40 A comparative study of different cooling strategies for underground mining R. Potgieter09:40 - 10:05 “Junior presentation:” 10:05 - 10:35 Tea10:35 - 11:00 Remote maintenance management as part of a ventilation control system C. Visagie11:00 - 11:25 Two Rivers Platinum Mine: Doing more with less C. Bisschoff11:25 - 11:50 Underground velocity lights: Principle of operation and an effective method to
test their functionality F.S. Bergh11:50 - 12:15 Development of a virgin rock temperature measurement instrument A. Labuschagne12:15 - 12:40 “Junior presentation:” 12:40 - 13:00 Closure MVSSA President M. van der Bank13:00 - 14:00 Lunch
Preliminary Programme